Evaluation of diagnostic tests for influenza in a pediatric practice
21
Pediatr Infect Dis J, 2002;21:193–6 Vol. 21, No. 3 Copyright © 2002 by Lippincott Williams & Wilkins, Inc. Printed in U.S.A. Evaluation of diagnostic tests for influenza in a pediatric practice WILLIAM J. RODRIGUEZ, MD, PHD, RICHARD H. SCHWARTZ, MD AND MARY MARGARET THORNE, BS Introduction. Recent advances in the diagnosis and treatment of influenza virus infections in- clude: (1) rapid bedside diagnosis methods with simple commercially available tests; and (2) Food and Drug Administration approval of treatment for children 1 year of age and older with neur- aminidase inhibitor drugs. For proven benefit antivirals should be used within 2 days of onset of symptoms. Objectives. We conducted a performance im- provement exercise comparing the sensitivity and specificity of four rapid tests for influenza viruses: (1) Flu OIA (Biostar); (2) Quickvue Influ- enza Test (Quidel); (3) Z Stat Flu (ZymeTx); and (4) Directigen Flu A (Becton Dickinson). Methods. During the 1999 to 2000 epidemic, symptomatic patients seen at the private prac- tice of one of the authors provided specimens collected and processed according to the manu- facturer’s directions. Throat swabs only were used to collect the specimens for the Z Stat Flu Kit. Directigen was performed immediately, and the others were run in parallel within 12 to 24 h. Specimens were frozen first at 20°C for up to 3 days and shipped in transport medium to the Virology Research Laboratory of the Virginia State Health Department for culture where they were stored at 60°C until cultured. Some of the samples were processed by a commercial labora- tory. Results. Specimens from 116 patients were available for influenza culture; for 88 of these culture was performed at the State Health De- partment Laboratory, and for 28 culture was performed at a local commercial medical labora- tory. Influenza virus (A) was detected in 58 of 116 (50%) specimens, 10 (17%) of these only by direct fluorescent antigen samples. Viral culture-direct fluorescent antigen results were used as the stan- dard. Of the 4 tests Biostar and Z Stat Flu re- quired more technician time (by an average of 2-fold). The 4 tests had sensitivities ranging from 72 to 95%. Z Stat differed significantly in sensi- tivity from the other three (P 0.001). The spec- ificities of Directigen, Quickvue, Flu OIA and Z Stat Flu were similar (76 to 86%). The positive predictive value of Directigen, Quickvue and FluOIA and Z Stat ranged from 80 to 86%. The negative predictive value of all 4 tests ranged from 75 to 94%. Z Stat Flu had a lower negative predictive value than the other 3 tests (75%; P 0.001. Conclusion. In this first head-to-head compar- ison of four rapid diagnostic tests for influenza, Directigen Flu A, Quickvue and Flu OIA appear equivalent in sensitivity, specificity, positive predictive value and negative predictive value. Z Stat Flu was not as sensitive or as efficient as the other three tests. INTRODUCTION Although recent influenza seasons have been associ- ated predominantly with influenza A virus (H3N2), in some communities about-one third of cases have been caused by influenza B. 1 Until 1999 two antiinfluenza drugs (amantadine and rimantadine) were Food and Drug Administration-approved for treatment and/or prophylaxis of influenza A. Neither drug was effective for the treatment or prophylaxis of influenza B. 1 In 1999 the Food and Drug Administration approved two new antiinfluenza drugs, zanamivir and oseltamivir. Both are inhibitors of neuraminidase, and both are effective against influenza A and B. 2 Based on studies in the United States and elsewhere, these neuramini- dase inhibitors appear to have fewer adverse effects than amantadine. Zanamivir in healthy hosts appears to have the lower reactogenicity. Zanamivir (Relenza), manufactured by Glaxo-Wellcome, is administered by inhalation by means of a rotodisk inhaler. 3, 4 Oseltami- vir (Tamiflu) is manufactured by Roche Holdings and Accepted for publication Sept. 26, 2001. From the Department of Health and Human Services/Food and Drug Administration/Center for Drug Evaluation and Research/ Office of Review Management/Office for Drug Evaluation IV, Rockville, MD (WJR); INOVA-Fairfax Hospital, Falls Church, VA (RHS); and Advanced Pediatrics, Vienna, VA (MMT). Presented in part at the 38th Annual Meeting of the Infectious Disease Society, New Orleans, LA, 2000. 11 The views expressed represent those of the authors. No official support or endorsement by the Food and Drug Administration is provided or should be inferred. Key words: Influenza, rapid diagnostic test. Reprints not available. 193
Transcript of Evaluation of diagnostic tests for influenza in a pediatric practice
Pediatr Infect Dis J, 2002;21:193–6 Vol. 21, No. 3Copyright © 2002 by Lippincott Williams & Wilkins, Inc. Printed in U.S.A.
Evaluation of diagnostic tests for influenza in apediatric practiceWILLIAM J. RODRIGUEZ, MD, PHD, RICHARD H. SCHWARTZ, MD AND MARY MARGARET THORNE, BS
Introduction. Recent advances in the diagnosisand treatment of influenza virus infections in-clude: (1) rapid bedside diagnosis methods withsimple commercially available tests; and (2) Foodand Drug Administration approval of treatmentfor children 1 year of age and older with neur-aminidase inhibitor drugs. For proven benefitantivirals should be used within 2 days of onsetof symptoms.
Objectives. We conducted a performance im-provement exercise comparing the sensitivityand specificity of four rapid tests for influenzaviruses: (1) Flu OIA (Biostar); (2) Quickvue Influ-enza Test (Quidel); (3) Z Stat Flu (ZymeTx); and(4) Directigen Flu A (Becton Dickinson).
Methods. During the 1999 to 2000 epidemic,symptomatic patients seen at the private prac-tice of one of the authors provided specimenscollected and processed according to the manu-facturer’s directions. Throat swabs only wereused to collect the specimens for the Z Stat FluKit. Directigen was performed immediately, andthe others were run in parallel within 12 to 24 h.Specimens were frozen first at �20°C for up to 3days and shipped in transport medium to theVirology Research Laboratory of the VirginiaState Health Department for culture where theywere stored at �60°C until cultured. Some of thesamples were processed by a commercial labora-tory.
Results. Specimens from 116 patients wereavailable for influenza culture; for 88 of theseculture was performed at the State Health De-partment Laboratory, and for 28 culture was
performed at a local commercial medical labora-tory. Influenza virus (A) was detected in 58 of 116(50%) specimens, 10 (17%) of these only by directfluorescent antigen samples. Viral culture-directfluorescent antigen results were used as the stan-dard. Of the 4 tests Biostar and Z Stat Flu re-quired more technician time (by an average of2-fold). The 4 tests had sensitivities ranging from72 to 95%. Z Stat differed significantly in sensi-tivity from the other three (P � 0.001). The spec-ificities of Directigen, Quickvue, Flu OIA and ZStat Flu were similar (76 to 86%). The positivepredictive value of Directigen, Quickvue andFluOIA and Z Stat ranged from 80 to 86%. Thenegative predictive value of all 4 tests rangedfrom 75 to 94%. Z Stat Flu had a lower negativepredictive value than the other 3 tests (75%; P �0.001.
Conclusion. In this first head-to-head compar-ison of four rapid diagnostic tests for influenza,Directigen Flu A, Quickvue and Flu OIA appearequivalent in sensitivity, specificity, positivepredictive value and negative predictive value. ZStat Flu was not as sensitive or as efficient as theother three tests.
INTRODUCTIONAlthough recent influenza seasons have been associ-
ated predominantly with influenza A virus (H3N2), insome communities about-one third of cases have beencaused by influenza B.1 Until 1999 two antiinfluenzadrugs (amantadine and rimantadine) were Food andDrug Administration-approved for treatment and/orprophylaxis of influenza A. Neither drug was effectivefor the treatment or prophylaxis of influenza B.1 In1999 the Food and Drug Administration approved twonew antiinfluenza drugs, zanamivir and oseltamivir.Both are inhibitors of neuraminidase, and both areeffective against influenza A and B.2 Based on studiesin the United States and elsewhere, these neuramini-dase inhibitors appear to have fewer adverse effectsthan amantadine. Zanamivir in healthy hosts appearsto have the lower reactogenicity. Zanamivir (Relenza),manufactured by Glaxo-Wellcome, is administered byinhalation by means of a rotodisk inhaler.3, 4 Oseltami-vir (Tamiflu) is manufactured by Roche Holdings and
Accepted for publication Sept. 26, 2001.From the Department of Health and Human Services/Food and
Drug Administration/Center for Drug Evaluation and Research/Office of Review Management/Office for Drug Evaluation IV,Rockville, MD (WJR); INOVA-Fairfax Hospital, Falls Church, VA(RHS); and Advanced Pediatrics, Vienna, VA (MMT).
Presented in part at the 38th Annual Meeting of the InfectiousDisease Society, New Orleans, LA, 2000.11 The views expressedrepresent those of the authors. No official support or endorsementby the Food and Drug Administration is provided or should beinferred.
Key words: Influenza, rapid diagnostic test.Reprints not available.
193
administered orally once or twice a day.5 By earlyNovember, 1999, sporadic cases of influenza A hadbeen reported in Alaska, Oregon and Maryland, and onNovember 18 our office laboratory reported the firstpositive test for the 1999 to 2000 influenza season.
To achieve maximum efficacy all antiinfluenza drugsmust be started within 48 h of the development ofinfluenza symptoms. The rapid antigen tests weredeveloped for early detection of influenza viruses.There have been major advances in the past severalyears in the approval of rapid, simple, in-office kits forthe detection of influenza viruses, including both A andB. However, there had been no head-to-head compari-son studies of the four approved rapid detection tests.Thus in a performance (quality assurance) exercise, weprocessed all samples from patients with suspectedinfluenza using the four approved diagnostic methods:(1) Z Stat Flu (ZymeTx, Inc., Oklahoma City, OK); (2)Directigen Flu (Becton Dickinson, Cockeysville, MD);(3) Quickvue Influenza Test (Quidel, San Diego, CA);and (4) Biostar OIA test for influenza (Biostar, Inc.,Boulder, CO).
PATIENTS AND METHODSDuring the 1999 to 2000 epidemic symptomatic pa-
tients seen at the private practice of one of the authorsprovided specimens as described below which werecollected according to manufacturer’s directions.Throat swabs only were used to collect the specimensfor the Z Stat Flu Kit. Tests were conducted accordingto manufacturer’s recommendations. With the excep-tion of the test using Directigen, which was run imme-diately, specimens were tested within 12 to 24 h (testswere run in parallel). Specimens were frozen first at�20°C for up to 3 days and shipped in transportmedium to the Virology Research Laboratory of theVirginia State Health Department for culture wherethey were stored at �60°C until cultured. After wewere notified by the Virginia State Health Departmentof their inability to process additional specimens, acommercial laboratory cultured a fraction of the sam-ples. Only those samples from which a culture resultwas available were used in the analysis. The results ofthe various tests were compared with results of the
viral cultures including the direct immunofluorescencetest (DFA) (Chemicon International, Temecula, CA)results. Fisher’s exact test and the chi square testswere used for statistical comparison.
Because the patients were managed according to theresults, each specimen was run as quickly as possibleto detect influenza, for influenza A using the Directigenand the Quickvue alongside to help in the diagnosticprocess if influenza B was present. If time permitted(we had only one laboratory technologist on duty at anytime), the Flu OIA was often run at the same time asthe Directigen and the Quickvue. If the workload didnot permit running the Flu OIA in conjunction with theDirectigen and Quickvue, then it was batched alongwith the Z Stat Flu and run as soon as possible (within24 h).
Twenty-five of the specimens were collected as nasalwashings along with a throat culture for the Z Stat Flu.Previously (in an unpublished experience) one of us(RS) had noticed that specimens collected by nasalswabs performed comparably with those in which nasalwashes were used as sources for testing for influenzaviruses. The remaining specimens were collected astwo nasal swabs and a throat swab. One nasal swabwas used undiluted to run the Flu OIA, whereas theother nasal swab was mixed in 2 to 3 ml of saline tomake an emulsate; 125 �l were used to run the Direc-tigen Flu A, and 250 �l were used to run the Quickvuetest. The remainder of the emulsate was transferred totransport medium to be cultured by either the State ofVirginia Epidemiology Laboratory or the AmericanMedical Laboratory Virology Laboratory. Thc throatswab was used to run the Z Stat Flu test. The testswere performed according to manufacturer’s direc-tions.
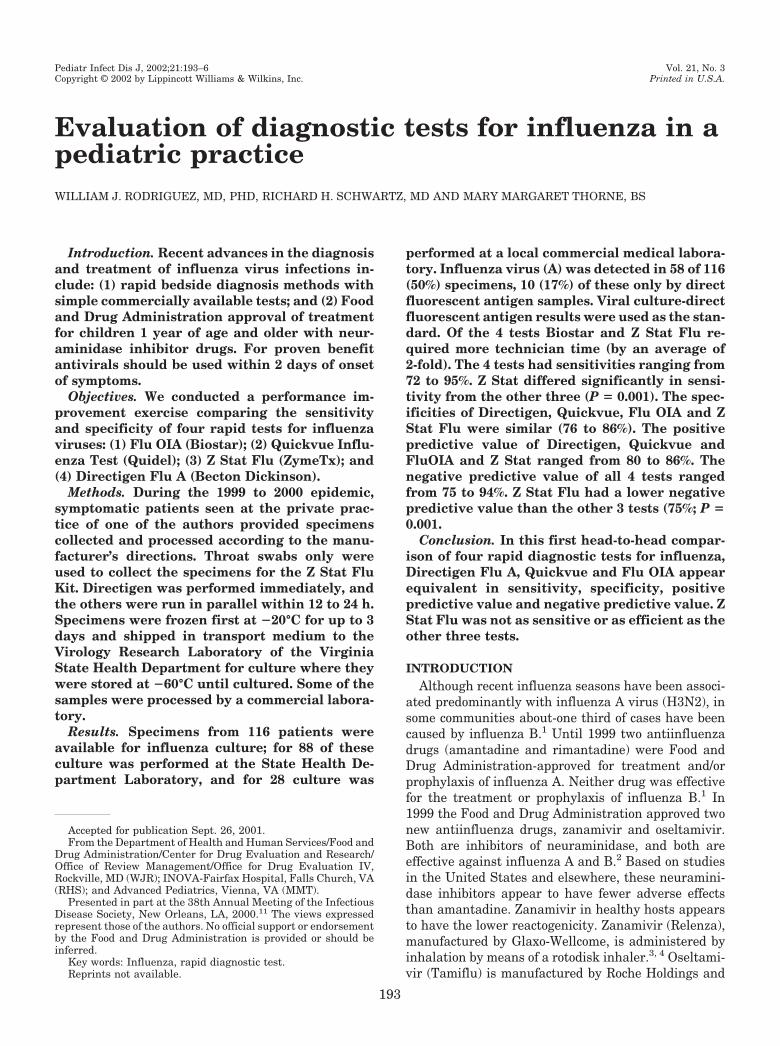
Table 1 shows previously published informationabout the four tests compared side by side in terms oftechnology and cost, as well as reported sensitivity andspecificity6 of each test.
RESULTS
Epidemiology. Our study began on December 13,1999, and ran until January 13, 2000. A total of 152patients were tested: 64 were 3 years of age or less; 42
TABLE 1. Rapid diagnostic tests for influenza
Test Directigen Flu A Z Stat Flu Quickvue Influenza Test Flu OIA
Manufacturer Becton Dickinson Zyme Tx, Inc. Quidel Biostar/BiotaDetects Influenza A Influenza A and B Influenza A and B Influenza A and BTechnology Nonspecific capture on
membrane with antibodydetection
Ligand conjugated tocolored precipitatingsubstrate (colorimetricneuraminidase enzymeassay)
Extraction of influenzaantigens (reaction ofantigens with reagentsin test strip with visualcolor change)
Antigen binds toantibody-coated wafer(optical immunoassay)
Cost/test to author $20.50 $14.50 $13.80 $16.50Reported literature6
Sensitivity 67% (throat) 62% (throat) 73% (nasal) 62% (throat)Specificity 92% (throat) 99% (throat) 95–99% (nasal) 79.5% (throat)
194 Vol. 21, No. 3, March, 2002THE PEDIATRIC INFECTIOUS DISEASE JOURNAL
were between 3 and 10 years of age; 21 were between10 and 15 years of age; 14 were between 15 and 20years of age; and 11 were older than 21 years.
Laboratory results. Specimens from 116 of 152(76%) patients and some of their parents (see above)were available for influenza culture; for 88 of theseculture was performed at the State Health Departmentlaboratory, and for 28 culture was performed at a localcommercial medical laboratory. Influenza virus A wasdetected in 58 of 118 (49%) specimens, in 10 (17%) ofthese only by DFA (Chemicon) of the samples. Otherviruses were recovered from 10 of the 116 patients(8.6%). Nine had adenoviruses (one of them also hadinfluenza A) and the other one had respiratory syncy-tial virus.
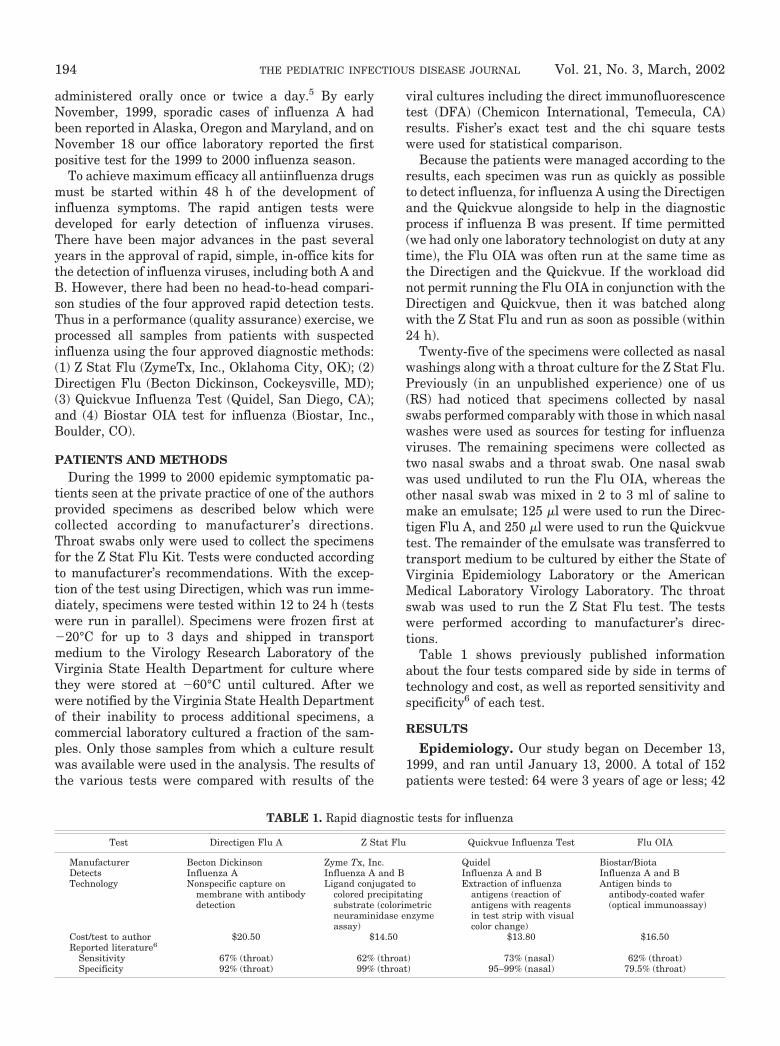
With viral culture-DFA results as the standard, theresults of the comparison are shown in Table 2. Thesensitivities of the four tests ranged from 72% in thecase of Z Stat Flu to 95% for Directigen Flu A andQuickvue. Specificity ranged between 76 and 84%.Positive tests had positive predictive values of 80 to86%. Although the negative predictive values rangedfrom 75% in the case of Z Stat Flu to 94% for DirectigenFlu A, Z Stat Flu differed significantly in negativepredictive values from the other three tests.
DISCUSSIONIn this study, conducted in a pediatric outpatient
population where rapid tests were compared withDFA-tissue culture, Directigen Flu A, Quickvue andBiostar appeared equivalent in sensitivity, specificityand positive and negative predictive values, but Z StatFlu was not as sensitive as the others and its negativepredictive value and efficacy were lower than the otherthree tests. The high sensitivity of Directigen Flu Areflects the fact that our isolates were predominantlyinfluenza A. The high sensitivity reported in our expe-rience, when compared with those reported in theliterature, could reflect the possibility of a higherantigenic load present in the source, i.e. a populationmade of primarily pediatric patients as compared withan adult population.7 We conducted the tests on rela-tively noninvasive samples collected from nasal wash-ing and/or swab of nares or throat. They are touted as
the best clinical samples.8 Covalciuc et al.9 foundsputum and nasal aspirates to be superior to throatswabs in detecting the influenza virus. Because thecomparison applied to only those samples where influ-enza presence was tested by culture and/or immuno-fluorescence, there could have been instances in whichthe rapid test was truly more sensitive than the cultureand was thus penalized in the analysis. Thus it seemslikely that the high sensitivity for these tests that wenoted and specificities that are good but less thandesirable could be explained by a reduced sensitivity ofthe culture. We also recognize that storing samples for3 days at �20°C and delaying the testing by culturewas less than optimal. Such concern may be reinforcedby detecting the virus in some samples through DFAonly with an accompanying negative culture. In ourhands all methods were relatively easy to perform.Directigen proved relatively simple and expeditious, itsshortcoming being its detection of Flu A only; Flu OIAwas similarly easy to perform in 15 min but requiredmore counter space. Quickvue was simple to performwith results available within 15 min. Z Stat Flu wasthe most cumbersome to handle, difficult to evaluate inweakly positive situations and took �30 min for ananswer. Although this test appeared less sensitive thanthe other three tests, there is the possibility thatspecimen storage at 4°C until tested could have led toloss of enzyme activity for those specimens tested �24h from collection. We do not have sample material leftwith which to confirm or deny this possibility.
Because of the lower sensitivity noted in the adultpopulation (�80%), the tests may have usefulness in alimited number of settings.10 Awareness of those pop-ulations which could benefit from rapid diagnosis isimportant. Within the recognized limitations rapiddiagnostic tests offer us the possibility of early diagno-sis as well as the opportunity to institute effectiveantiviral therapy early in the illness.
REFERENCES1. Couch RB. Prevention and treatment of influenza. N Engl
J Med 2000;343:1778–87.2. Monto A, Gravenstein S, Elliot M, Colopy M, Schweinle
J. Clinical signs and symptoms predicting influenza infection.Arch Intern Med 2000;160:3243–7.
TABLE 2. Rapid diagnostic tests for influenza virus: head-to-head comparison
Evaluation Directigen Flu A(Becton Dickinson)
Z Stat Flu(ZymeTx. Inc.)
QuickvueInfluenza Test
(Quidel)
Flu OIA(Biostar/Biota)
Sensitivity* 55/58 (95)*† 41/57 (72)* 54/57 (95)* 54/58 (93)*Specificity‡ 49/58 (84)‡ 48/58 (83%)‡ 42/55 (76%)‡ 47/57 (82)‡Positive predictive value‡ 55/64 (86)‡ 41/51 (80)‡ 54/57 (81)‡ 54/64 (84)‡Negative predictive value§ 49/52 (94%)§ 48/64 (75)§ 42/45 (93)§ 47/51 (92)§Efficiency 104/116 (90) 89/115 (77) 96/112 (86%) 101/115 (88%)
* P � 0001.† Numbers in parentheses, percent.‡ No significance.§ P � 0.003.
Vol. 21, No. 3, March, 2002 195THE PEDIATRIC INFECTIOUS DISEASE JOURNAL
3. Hayden FG, Gubareva LU, Monto AS, et al. Inhaled zanami-vir for the prevention of influenza in families. N Engl J Med2000;343:1282–9.
4. Murphy KR, Eivindson A, Pauksens K, et al. Efficacy andsafety of inhaled zanamivir for the treatment of influenza inpatients with asthma or chronic obstructive pulmonary dis-ease: a double blind, randomized, placebo controlled, multi-center study. Clin Drug Invest 2000;20:337–49.
5. Treanor JJ, Hayden FG, Vrooman PS, et al. Efficacy andsafety of the oral neuraminidase inhibitor oseltamavir intreating acute influenza. a randomized controlled trial.JAMA 2000;283:1016–24.
6. Benjamin J. Getting a jump on flu: new options in diagnosisand treatment. Contemp Pediatr 2000;17:75–81.
7. Sperber SJ, Munk GB, Gross PA. Rapid influenza diagnosis
using Flu OIA compared with viral culture on a singlespecimen submitted to the diagnostic virology lab [Abstract605]. In: 38th Annual Meeting of the Infectious DiseasesSociety of America, New Orleans, September 7 to 9, 2000:145.
8. Cox NJ, Subbarao K. Influenza. Lancet 1999;354:1277–82.9. Covalcuic KA, Webb K, Carlson C. Comparison of four clinical
specimen types for detection for influenza A and B viruses byoptical immunoassays (FLU OIA test) and cell culture meth-ods. J Clin Microbiol 1999;37:3971–4.
10. Cifu A, Levinson W. Influenza. JAMA 2000;284:2847–9.11. Rodriguez WJ, Schwartz RH. Rapid diagnostic tests for
influenza (RDT for Flu): a prospective study [Abstract 604].In: 38th Annual Meeting of the Infectious Diseases Society ofAmerica, New Orleans, September 7 to 9, 2000:145.
Pediatr Infect Dis J, 2002;21:196–200 Vol. 21, No. 3Copyright © 2002 by Lippincott Williams & Wilkins, Inc. Printed in U.S.A.
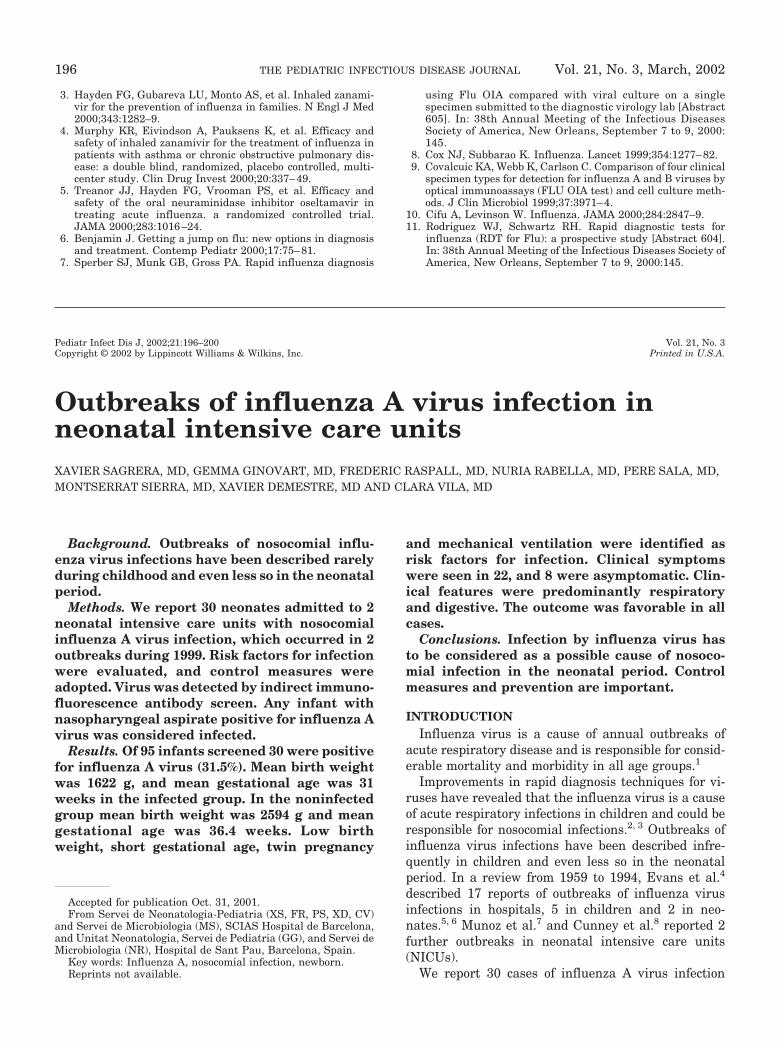
Outbreaks of influenza A virus infection inneonatal intensive care unitsXAVIER SAGRERA, MD, GEMMA GINOVART, MD, FREDERIC RASPALL, MD, NURIA RABELLA, MD, PERE SALA, MD,MONTSERRAT SIERRA, MD, XAVIER DEMESTRE, MD AND CLARA VILA, MD
Background. Outbreaks of nosocomial influ-enza virus infections have been described rarelyduring childhood and even less so in the neonatalperiod.
Methods. We report 30 neonates admitted to 2neonatal intensive care units with nosocomialinfluenza A virus infection, which occurred in 2outbreaks during 1999. Risk factors for infectionwere evaluated, and control measures wereadopted. Virus was detected by indirect immuno-fluorescence antibody screen. Any infant withnasopharyngeal aspirate positive for influenza Avirus was considered infected.
Results. Of 95 infants screened 30 were positivefor influenza A virus (31.5%). Mean birth weightwas 1622 g, and mean gestational age was 31weeks in the infected group. In the noninfectedgroup mean birth weight was 2594 g and meangestational age was 36.4 weeks. Low birthweight, short gestational age, twin pregnancy
and mechanical ventilation were identified asrisk factors for infection. Clinical symptomswere seen in 22, and 8 were asymptomatic. Clin-ical features were predominantly respiratoryand digestive. The outcome was favorable in allcases.
Conclusions. Infection by influenza virus hasto be considered as a possible cause of nosoco-mial infection in the neonatal period. Controlmeasures and prevention are important.
INTRODUCTIONInfluenza virus is a cause of annual outbreaks of
acute respiratory disease and is responsible for consid-erable mortality and morbidity in all age groups.1
Improvements in rapid diagnosis techniques for vi-ruses have revealed that the influenza virus is a causeof acute respiratory infections in children and could beresponsible for nosocomial infections.2, 3 Outbreaks ofinfluenza virus infections have been described infre-quently in children and even less so in the neonatalperiod. In a review from 1959 to 1994, Evans et al.4
described 17 reports of outbreaks of influenza virusinfections in hospitals, 5 in children and 2 in neo-nates.5, 6 Munoz et al.7 and Cunney et al.8 reported 2further outbreaks in neonatal intensive care units(NICUs).
We report 30 cases of influenza A virus infection
Accepted for publication Oct. 31, 2001.From Servei de Neonatologia-Pediatria (XS, FR, PS, XD, CV)
and Servei de Microbiologia (MS), SCIAS Hospital de Barcelona,and Unitat Neonatologia, Servei de Pediatria (GG), and Servei deMicrobiologia (NR), Hospital de Sant Pau, Barcelona, Spain.
Key words: Influenza A, nosocomial infection, newborn.Reprints not available.
196 Vol. 21, No. 3, March, 2002THE PEDIATRIC INFECTIOUS DISEASE JOURNAL
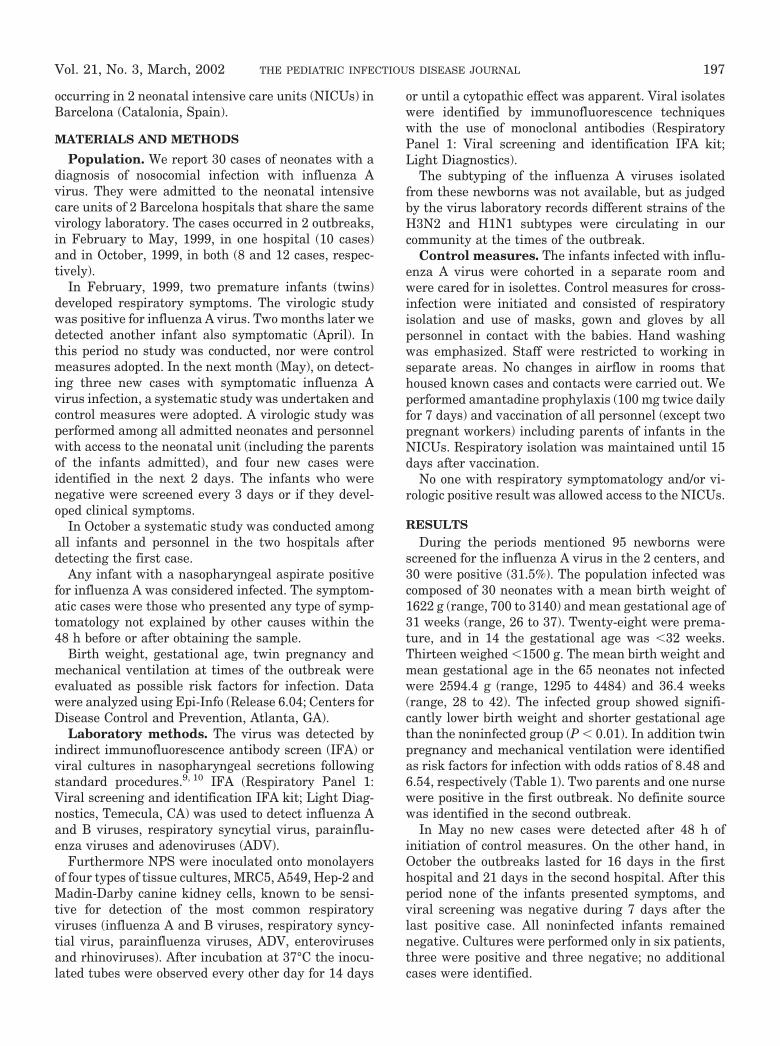
occurring in 2 neonatal intensive care units (NICUs) inBarcelona (Catalonia, Spain).
MATERIALS AND METHODS
Population. We report 30 cases of neonates with adiagnosis of nosocomial infection with influenza Avirus. They were admitted to the neonatal intensivecare units of 2 Barcelona hospitals that share the samevirology laboratory. The cases occurred in 2 outbreaks,in February to May, 1999, in one hospital (10 cases)and in October, 1999, in both (8 and 12 cases, respec-tively).
In February, 1999, two premature infants (twins)developed respiratory symptoms. The virologic studywas positive for influenza A virus. Two months later wedetected another infant also symptomatic (April). Inthis period no study was conducted, nor were controlmeasures adopted. In the next month (May), on detect-ing three new cases with symptomatic influenza Avirus infection, a systematic study was undertaken andcontrol measures were adopted. A virologic study wasperformed among all admitted neonates and personnelwith access to the neonatal unit (including the parentsof the infants admitted), and four new cases wereidentified in the next 2 days. The infants who werenegative were screened every 3 days or if they devel-oped clinical symptoms.
In October a systematic study was conducted amongall infants and personnel in the two hospitals afterdetecting the first case.
Any infant with a nasopharyngeal aspirate positivefor influenza A was considered infected. The symptom-atic cases were those who presented any type of symp-tomatology not explained by other causes within the48 h before or after obtaining the sample.
Birth weight, gestational age, twin pregnancy andmechanical ventilation at times of the outbreak wereevaluated as possible risk factors for infection. Datawere analyzed using Epi-Info (Release 6.04; Centers forDisease Control and Prevention, Atlanta, GA).
Laboratory methods. The virus was detected byindirect immunofluorescence antibody screen (IFA) orviral cultures in nasopharyngeal secretions followingstandard procedures.9, 10 IFA (Respiratory Panel 1:Viral screening and identification IFA kit; Light Diag-nostics, Temecula, CA) was used to detect influenza Aand B viruses, respiratory syncytial virus, parainflu-enza viruses and adenoviruses (ADV).
Furthermore NPS were inoculated onto monolayersof four types of tissue cultures, MRC5, A549, Hep-2 andMadin-Darby canine kidney cells, known to be sensi-tive for detection of the most common respiratoryviruses (influenza A and B viruses, respiratory syncy-tial virus, parainfluenza viruses, ADV, enterovirusesand rhinoviruses). After incubation at 37°C the inocu-lated tubes were observed every other day for 14 days
or until a cytopathic effect was apparent. Viral isolateswere identified by immunofluorescence techniqueswith the use of monoclonal antibodies (RespiratoryPanel 1: Viral screening and identification IFA kit;Light Diagnostics).
The subtyping of the influenza A viruses isolatedfrom these newborns was not available, but as judgedby the virus laboratory records different strains of theH3N2 and H1N1 subtypes were circulating in ourcommunity at the times of the outbreak.
Control measures. The infants infected with influ-enza A virus were cohorted in a separate room andwere cared for in isolettes. Control measures for cross-infection were initiated and consisted of respiratoryisolation and use of masks, gown and gloves by allpersonnel in contact with the babies. Hand washingwas emphasized. Staff were restricted to working inseparate areas. No changes in airflow in rooms thathoused known cases and contacts were carried out. Weperformed amantadine prophylaxis (100 mg twice dailyfor 7 days) and vaccination of all personnel (except twopregnant workers) including parents of infants in theNICUs. Respiratory isolation was maintained until 15days after vaccination.
No one with respiratory symptomatology and/or vi-rologic positive result was allowed access to the NICUs.
RESULTSDuring the periods mentioned 95 newborns were
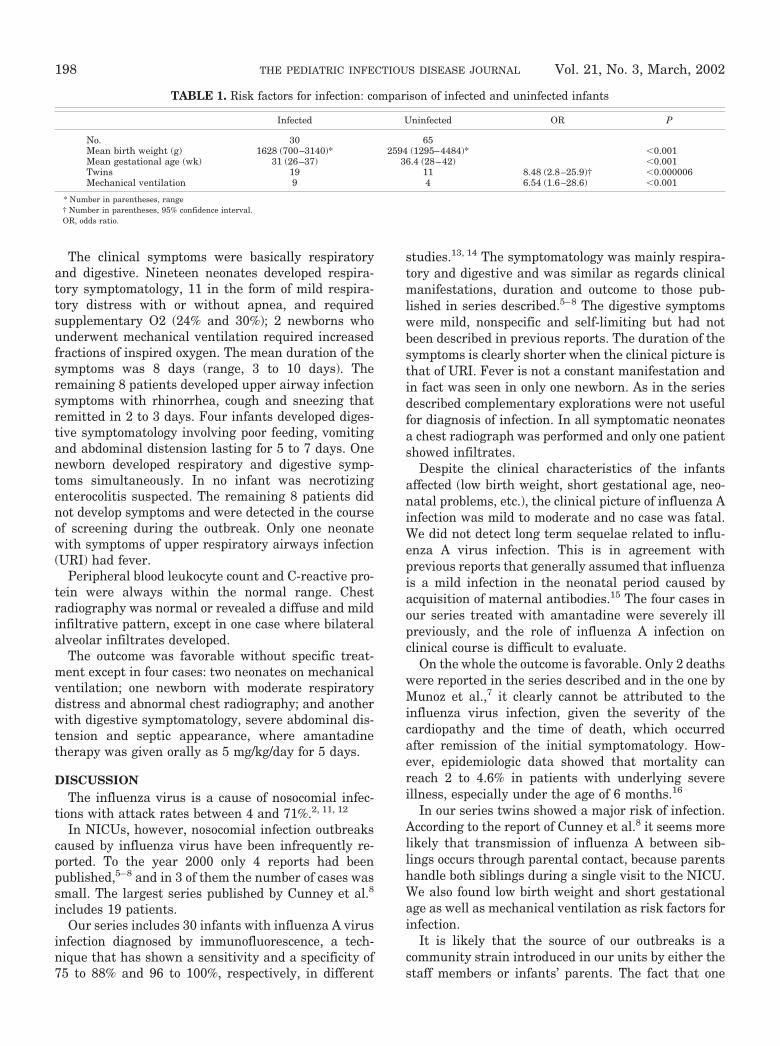
screened for the influenza A virus in the 2 centers, and30 were positive (31.5%). The population infected wascomposed of 30 neonates with a mean birth weight of1622 g (range, 700 to 3140) and mean gestational age of31 weeks (range, 26 to 37). Twenty-eight were prema-ture, and in 14 the gestational age was �32 weeks.Thirteen weighed �1500 g. The mean birth weight andmean gestational age in the 65 neonates not infectedwere 2594.4 g (range, 1295 to 4484) and 36.4 weeks(range, 28 to 42). The infected group showed signifi-cantly lower birth weight and shorter gestational agethan the noninfected group (P � 0.01). In addition twinpregnancy and mechanical ventilation were identifiedas risk factors for infection with odds ratios of 8.48 and6.54, respectively (Table 1). Two parents and one nursewere positive in the first outbreak. No definite sourcewas identified in the second outbreak.
In May no new cases were detected after 48 h ofinitiation of control measures. On the other hand, inOctober the outbreaks lasted for 16 days in the firsthospital and 21 days in the second hospital. After thisperiod none of the infants presented symptoms, andviral screening was negative during 7 days after thelast positive case. All noninfected infants remainednegative. Cultures were performed only in six patients,three were positive and three negative; no additionalcases were identified.
Vol. 21, No. 3, March, 2002 197THE PEDIATRIC INFECTIOUS DISEASE JOURNAL
The clinical symptoms were basically respiratoryand digestive. Nineteen neonates developed respira-tory symptomatology, 11 in the form of mild respira-tory distress with or without apnea, and requiredsupplementary O2 (24% and 30%); 2 newborns whounderwent mechanical ventilation required increasedfractions of inspired oxygen. The mean duration of thesymptoms was 8 days (range, 3 to 10 days). Theremaining 8 patients developed upper airway infectionsymptoms with rhinorrhea, cough and sneezing thatremitted in 2 to 3 days. Four infants developed diges-tive symptomatology involving poor feeding, vomitingand abdominal distension lasting for 5 to 7 days. Onenewborn developed respiratory and digestive symp-toms simultaneously. In no infant was necrotizingenterocolitis suspected. The remaining 8 patients didnot develop symptoms and were detected in the courseof screening during the outbreak. Only one neonatewith symptoms of upper respiratory airways infection(URI) had fever.
Peripheral blood leukocyte count and C-reactive pro-tein were always within the normal range. Chestradiography was normal or revealed a diffuse and mildinfiltrative pattern, except in one case where bilateralalveolar infiltrates developed.
The outcome was favorable without specific treat-ment except in four cases: two neonates on mechanicalventilation; one newborn with moderate respiratorydistress and abnormal chest radiography; and anotherwith digestive symptomatology, severe abdominal dis-tension and septic appearance, where amantadinetherapy was given orally as 5 mg/kg/day for 5 days.
DISCUSSIONThe influenza virus is a cause of nosocomial infec-
tions with attack rates between 4 and 71%.2, 11, 12
In NICUs, however, nosocomial infection outbreakscaused by influenza virus have been infrequently re-ported. To the year 2000 only 4 reports had beenpublished,5–8 and in 3 of them the number of cases wassmall. The largest series published by Cunney et al.8
includes 19 patients.Our series includes 30 infants with influenza A virus
infection diagnosed by immunofluorescence, a tech-nique that has shown a sensitivity and a specificity of75 to 88% and 96 to 100%, respectively, in different
studies.13, 14 The symptomatology was mainly respira-tory and digestive and was similar as regards clinicalmanifestations, duration and outcome to those pub-lished in series described.5–8 The digestive symptomswere mild, nonspecific and self-limiting but had notbeen described in previous reports. The duration of thesymptoms is clearly shorter when the clinical picture isthat of URI. Fever is not a constant manifestation andin fact was seen in only one newborn. As in the seriesdescribed complementary explorations were not usefulfor diagnosis of infection. In all symptomatic neonatesa chest radiograph was performed and only one patientshowed infiltrates.
Despite the clinical characteristics of the infantsaffected (low birth weight, short gestational age, neo-natal problems, etc.), the clinical picture of influenza Ainfection was mild to moderate and no case was fatal.We did not detect long term sequelae related to influ-enza A virus infection. This is in agreement withprevious reports that generally assumed that influenzais a mild infection in the neonatal period caused byacquisition of maternal antibodies.15 The four cases inour series treated with amantadine were severely illpreviously, and the role of influenza A infection onclinical course is difficult to evaluate.
On the whole the outcome is favorable. Only 2 deathswere reported in the series described and in the one byMunoz et al.,7 it clearly cannot be attributed to theinfluenza virus infection, given the severity of thecardiopathy and the time of death, which occurredafter remission of the initial symptomatology. How-ever, epidemiologic data showed that mortality canreach 2 to 4.6% in patients with underlying severeillness, especially under the age of 6 months.16
In our series twins showed a major risk of infection.According to the report of Cunney et al.8 it seems morelikely that transmission of influenza A between sib-lings occurs through parental contact, because parentshandle both siblings during a single visit to the NICU.We also found low birth weight and short gestationalage as well as mechanical ventilation as risk factors forinfection.
It is likely that the source of our outbreaks is acommunity strain introduced in our units by either thestaff members or infants’ parents. The fact that one
TABLE 1. Risk factors for infection: comparison of infected and uninfected infants
Infected Uninfected OR P
No. 30 65Mean birth weight (g) 1628 (700–3140)* 2594 (1295–4484)* �0.001Mean gestational age (wk) 31 (26–37) 36.4 (28–42) �0.001Twins 19 11 8.48 (2.8–25.9)† �0.000006Mechanical ventilation 9 4 6.54 (1.6–28.6) �0.001
* Number in parentheses, range† Number in parentheses, 95% confidence interval.OR, odds ratio.
198 Vol. 21, No. 3, March, 2002THE PEDIATRIC INFECTIOUS DISEASE JOURNAL
outbreak began during times of low viral activity in ourcommunity is very surprising. Knowledge of peaks ofviral activity in the community should alert the neona-tologist to consider influenza A infection in the diagno-sis of respiratory distress, digestive symptoms or sep-sis-like appearance in premature or term newborns,especially when twins are affected simultaneously. Thesymptoms can begin early (age 3 days) or late (age 2months or more).
The available space in our units is smaller than thedesign standards recommended for Level III NICUs. Itis likely that overcrowding facilitates the spread of theoutbreaks. Overcrowding and understaffing are recog-nized factors for spread of bacterial and viral patho-gens, but this has not been demonstrated for influenzainfections.17, 18
In view of the great potential of the influenza virus tospread because of its short incubation period (1 to 3days) and airborne transmission, it is fundamental toset up control measures as soon as possible. Clinicalsuspicion and rapid diagnostic techniques allow confir-mation within hours. It is necessary to tighten controlmeasures for cross-infection by using gloves andmasks, hand washing and, if possible, isolation ofinfected infants. In May the control measures werehighly effective in aborting the outbreak because nonew cases were detected 2 days after implementation;on the other hand the October outbreaks lasted for 16and 21 days in the two hospitals after initiation of thesame control strategy. It is possible that this fact can beexplained by differences in the viral activity in ourcountry in these two periods, because it is unusual tohave influenza infection in the spring-summer period.
The fundamental strategy of prevention is vaccina-tion of all personnel in contact with newborns, includ-ing parents, and preventing nonvaccinated personnelor those with compatible symptomatology from accessto the unit. Regrettably the vaccination rate of healthworkers is extremely low in our setting (vaccinationrate of 2% in our unit before the outbreaks) in accor-dance with rates reported of 4 an 17%.8, 19, 20 In addi-tion the first outbreak began 6 months after the periodrecommended for vaccination and the second at thebeginning of it, when in theory the immunity of careworkers was lower.
Adverse drug effects had been reported with aman-tadine administration in the newborn, but we did notdetect adverse reactions in our four treated patients.Resistance to amantadine can develop rapidly,7 render-ing treatment useless. This could account for the pooroutcome of the neonate that died in Cunney’s series8
with persistently positive nasopharyngeal aspiratesdespite therapy.
Chemoprophylaxis with amantadine among healthworkers is not free from side effects; hence the use of
new neuraminidase inhibitors such as zanamivir andoseltamivir could play a role in the control of futureepidemics. They appear to have fewer adverse reac-tions21, 22 and have proved effective in the prevention ofinfection by influenza virus.23, 24
In conclusion infection by influenza virus should beconsidered as a possible cause of nosocomial infectionin neonatal units. Morbidity is far from negligible,although the outcome is generally favorable withoutspecific treatment. Control measures and especiallyprevention by vaccination of all personnel in directcontact with neonates are fundamental.
REFERENCES1. Glezen WP. Emerging infections: pandemic influenza. Epide-
miol Rev 1996;18:1–13.2. Serwint JR, Miller RM. Why diagnose influenza infections in
hospitalized pediatric patients. Pediatr Infect Dis J 1993;12:200–4.
3. Hall CB. Nosocomial viral respiratory infections: perennialweeds on pediatric wards. Am J Med 1981;70:670–6.
4. Evans ME, Hall Kl, Berry SE. Influenza control in acute carehospitals. Am J Infect Control 1997;25:357–62.
5. Bauer CR, Elie K, Spence L, Stern L. Hong Kong influenza ina neonatal unit. JAMA 1973;223:1233–5.
6. Meibalane R, Sedmak GV, Sasidharan P, Garg P, Grausz JP.Outbreak of influenza in a neonatal intensive care unit.Pediatrics 1977;91:974–6.
7. Munoz FR, Campbell JR, Atmar RL, et al. Influenza A virusoutbreak in a neonatal intensive care unit. Pediatr Infect DisJ 1999;18:811–15.
8. Cunney RJ, Bialachowski A, Thornley D, Smaill FM, PennieRA. An outbreak of influenza A in a neonatal intensive careunit. Infect Control Hosp Epidemiol 2000;21:449–54.
9. Gardner PS, McQuillin J. Rapid virus diagnosis. 2nd ed.London: Butterworth,1980.
10. Grenberg SB, Krilov LR. Laboratory diagnosis of viral respi-ratory disease. In: Drew WL, Rubin SJ, coordinating eds.Cumitech 21. Washington, DC: American Society for Micro-biology, 1986.
11. Hall CB, Douglas RG Jr. Nosocomial influenza infection as acause of intercurrent fevers in infants. Pediatrics 1975;55:673–7.
12. Brocklebank JT, Court SDM, McQuillin J, Gardner PS.Influenza A infection in children. Lancet 1972;2:497–500.
13. Hornsleth A, Jankowski M. Sensitive immunoassay for therapid diagnosis of influenza A virus infections in clinicalspecimens. Res Virol 1990;141:373–84.
14. Chomel JJ, Remilleux MF, Marchand P, Aymard M. Rapiddiagnosis of influenza A: comparison with ELISA immuno-capture and culture. J Virol Methods 1992;37:337–44.
15. Puck JM, Glezen WP, Frank AL, Six HR. Protection ofinfants from infection with influenza A virus by transplacen-tally acquired antibody. J Infect Dis 1980;142:844–9.
16. Serwint JR, Miller RM, Korsch BM. Influenza type A and Binfections in hospitalized pediatric patients: who should beimmunized? Am J Dis Child 1991;145:623–6.
17. Haley RW, Cushion NB, Tenover FC, et al. Eradication ofendemic methicillin-resistant Staphylococcus aureus infec-tions from a neonatal care unit. J Infect Dis 1995;171:6:14–24.
18. Haley RW, Bregman DA. The role of understaffing andovercrowding in recurrent outbreaks of staphylococcal infec-tion in a neonatal special-care unit. J Infect Dis 1982;145:875–85.
19. Adal KA, Flowers RH, Anglim AM, et al. Prevention ofnosocomial influenza. Infect Control Hosp Epidemiol 1996;17:641–8.
20. Eisenfeld L, Perl L, Burke G, et al. Lack of compliance withinfluenza immunization for caretakers of neonatal intensive
Vol. 21, No. 3, March, 2002 199THE PEDIATRIC INFECTIOUS DISEASE JOURNAL
care units patients. Am J Infect Control 1994;22:307–11.21. Hayden FG, Osterhaus ADME, Treanor JJ, et al. Efficacy
and safety of the neuraminidase inhibitor zanamivir in thetreatment of influenza virus infections. N Engl J Med 1997;337:874–80.
22. Hayden FG, Treanor JJ, Fritz RS, et al. Use of the oralneuraminidase inhibitor oseltamivir in experimental humaninfluenza: randomized controlled trials for prevention and
treatment. JAMA 1999;282:1240–6.23. Monto AS, Robinson DP, Herlocher ML, Hinson JM Jr, Elliott
MJ, Crisp A. Zanamivir in the prevention of influenza amonghealthy adults: a randomized controlled trial. JAMA 1999;282:31–5.
24. Hayden FG, Atmar RL, Schilling M, et al. Use of the selectiveoral neuraminidase inhibitor oseltamivir to prevent influ-enza. N Engl J Med 1999;341:1336–43.
Pediatr Infect Dis J, 2002;21:200–3 Vol. 21, No. 3Copyright © 2002 by Lippincott Williams & Wilkins, Inc. Printed in U.S.A.
Interpretation of the tuberculin skin testreaction by pediatric providersEDWARD R. CARTER, MD AND CHARLOTTE M. LEE, MD
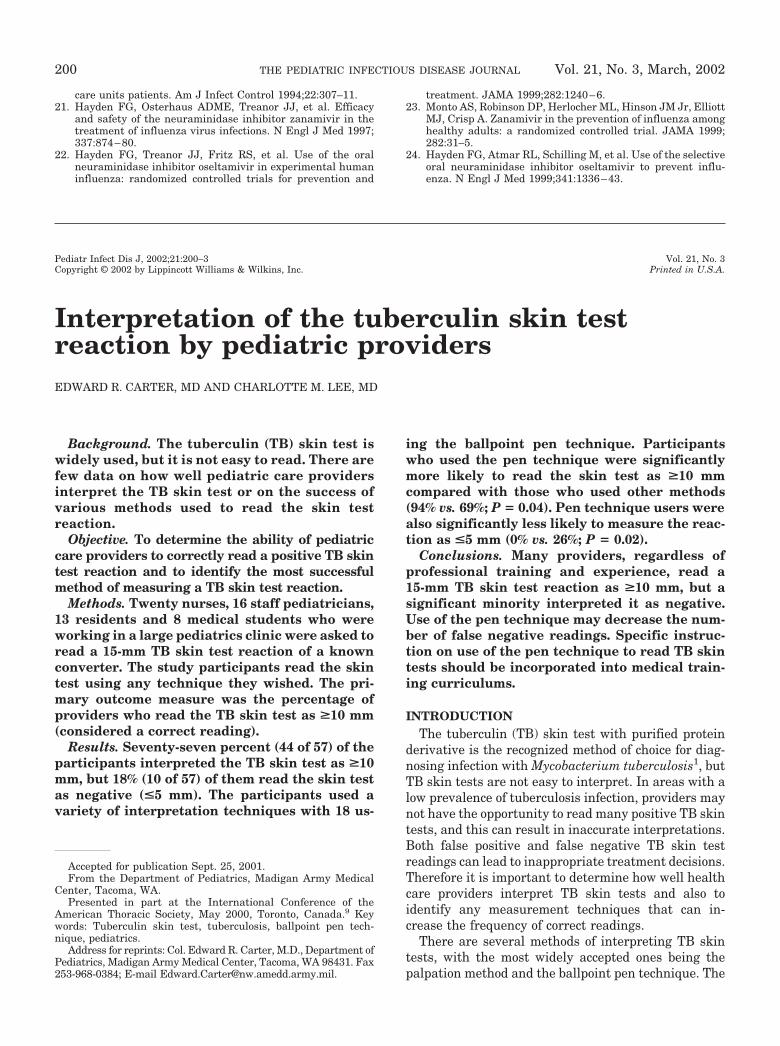
Background. The tuberculin (TB) skin test iswidely used, but it is not easy to read. There arefew data on how well pediatric care providersinterpret the TB skin test or on the success ofvarious methods used to read the skin testreaction.
Objective. To determine the ability of pediatriccare providers to correctly read a positive TB skintest reaction and to identify the most successfulmethod of measuring a TB skin test reaction.
Methods. Twenty nurses, 16 staff pediatricians,13 residents and 8 medical students who wereworking in a large pediatrics clinic were asked toread a 15-mm TB skin test reaction of a knownconverter. The study participants read the skintest using any technique they wished. The pri-mary outcome measure was the percentage ofproviders who read the TB skin test as >10 mm(considered a correct reading).
Results. Seventy-seven percent (44 of 57) of theparticipants interpreted the TB skin test as >10mm, but 18% (10 of 57) of them read the skin testas negative (<5 mm). The participants used avariety of interpretation techniques with 18 us-
ing the ballpoint pen technique. Participantswho used the pen technique were significantlymore likely to read the skin test as >10 mmcompared with those who used other methods(94% vs. 69%; P � 0.04). Pen technique users werealso significantly less likely to measure the reac-tion as <5 mm (0% vs. 26%; P � 0.02).
Conclusions. Many providers, regardless ofprofessional training and experience, read a15-mm TB skin test reaction as >10 mm, but asignificant minority interpreted it as negative.Use of the pen technique may decrease the num-ber of false negative readings. Specific instruc-tion on use of the pen technique to read TB skintests should be incorporated into medical train-ing curriculums.
INTRODUCTIONThe tuberculin (TB) skin test with purified protein
derivative is the recognized method of choice for diag-nosing infection with Mycobacterium tuberculosis1, butTB skin tests are not easy to interpret. In areas with alow prevalence of tuberculosis infection, providers maynot have the opportunity to read many positive TB skintests, and this can result in inaccurate interpretations.Both false positive and false negative TB skin testreadings can lead to inappropriate treatment decisions.Therefore it is important to determine how well healthcare providers interpret TB skin tests and also toidentify any measurement techniques that can in-crease the frequency of correct readings.
There are several methods of interpreting TB skintests, with the most widely accepted ones being thepalpation method and the ballpoint pen technique. The
Accepted for publication Sept. 25, 2001.From the Department of Pediatrics, Madigan Army Medical
Center, Tacoma, WA.Presented in part at the International Conference of the
American Thoracic Society, May 2000, Toronto, Canada.9 Keywords: Tuberculin skin test, tuberculosis, ballpoint pen tech-nique, pediatrics.
Address for reprints: Col. Edward R. Carter, M.D., Department ofPediatrics, Madigan Army Medical Center, Tacoma, WA 98431. Fax253-968-0384; E-mail [email protected].
200 Vol. 21, No. 3, March, 2002THE PEDIATRIC INFECTIOUS DISEASE JOURNAL

American Thoracic Society recommends using palpa-tion to assess induration but also states that theballpoint pen technique might decrease interobservervariability.1 The 2000 Red Book suggests using theballpoint pen technique and does not mention thepalpation technique.2 Kendig et al.3 reported that 30%of pediatricians, nurses and residents attending a pe-diatric conference read a 15-mm TB skin test reactionas �10 mm, but only 2 of the 107 participants used thepen technique. Several investigators have reportedthat use of the pen technique results in less inter- andintraobserver variability compared with using palpa-tion alone.4, 5 Others who compared the pen techniquedirectly to the palpation method found them compara-ble.6–8 In these studies a small number of providersread the TB skin tests, and the majority of the skin testreactions were �10 mm. The pen technique has notbeen evaluated in a setting of a large number ofproviders inexperienced in reading TB skin tests. Wewished to determine how well a group of pediatric careproviders with a wide spectrum of training and expe-rience interpreted a positive TB skin test. In additionwe wanted to identify any particular method that coulddecrease misreadings.
SUBJECTS AND METHODS
Participants and procedures. We asked healthcare providers, nurses, staff pediatricians, residentsand medical students who were working in the pediat-rics clinic to participate in the study. We obtainedverbal but not written informed consent, and the in-vestigators made it clear that participation in the studywas purely voluntary. Fifty-seven care workers agreedto participate, and none refused. The participants weredivided into 4 groups: 16 staff pediatricians; 13 pediat-ric and family practice residents; 20 nurses [5 RNs and15 licensed practical nurses (LPNs)]; and 8 medicalstudents (4 third year and 4 fourth year). We includedLPNs because at our institution LPNs interpret TBskin test reactions. One of the investigators, a whiteman and a known purified protein derivative con-verter, had a standard 5-unit tuberculin dose placedsubcutaneously on the volar aspect of his left arm.Approximately 48 h later, both the Chief of PediatricInfectious Diseases and the Chief of Allergy and Im-munology independently measured the reaction. Theyused the ballpoint pen technique (their choice); thisconsisted of running the tip of the ballpoint pen to theedge of induration to demarcate the site of induration.The widest diameter of induration provided the valuefor the skin test reaction. One of the “official readers”measured the reaction to be 15 mm and the other14–16 mm, so we chose 15 mm as the valid measure-ment. On that same day, during a 6-h period, we askedthe study participants to interpret the skin test reac-tion. We told each provider to use any method they
desired, and we provided a ruler, tape measure andpen, but only on request. After each measurement wecarefully cleansed the skin test site with alcohol beforemoving on to the next interpreter. At the end of the study,the skin test site was remeasured to determine whetherthe size of the induration had changed from the begin-ning to the end of the study, and it was still 15 mm.
Outcome measures and statistical analysis. Theprimary outcome measure was the percentage of pro-viders who read the TB skin test reaction as �10 mm.We considered this a correct interpretation and anyvalue �10 mm as a misreading. We chose this cutoffbecause we felt that anyone who read a 15-mm skintest as �10 mm had definitely misread it. Secondarymeasures included the number of providers who inter-preted the reaction as negative (defined as �5 mm) andthe number of providers who used the ballpoint pentechnique. Only providers who used the ballpoint pento appropriately mark and then measure the diameterof the induration were included in the ballpoint pentechnique group. We also analyzed differences in theseoutcome measures between those participants whoused the pen technique and those who did not. We usedthe Fisher’s exact and chi square tests to assess inter-group differences among the four groups (nurses, med-ical students, residents and staff physicians).
RESULTSFifty-seven care workers participated in the study,
and all but two of them knew to measure the size of theinduration rather than the erythema. Measurementtechniques ranged from palpation to simple visualinspection, and 32% of the participants used the pentechnique. All but one participant used a ruler or tapemeasure to determine the actual size of the reaction.Less than one-half of the participants rememberedreceiving formal training on how to read a TB skin testor having actually seen a positive TB skin test reaction.
There were no significant differences between the 4groups of providers with respect to how well theyinterpreted the skin test reaction (Table 1). Seventy-seven percent (44 of 57) of the participants interpretedthe reaction as �10 mm, but this meant that 23% failedto correctly interpret the skin test reaction. In addition10 participants (18%) read the reaction as �5 mm(Table 1). Ninety-four percent of the participants whoused the pen technique measured the skin test reactionas �10 mm compared with 69% of those who used othermethods (P � 0.04; Table 2). In addition no one whoused the pen technique read the skin test reaction as�5 mm compared with 26% of those who used othermethods (P � 0.02; Table 2).
DISCUSSIONIn this study we identified several problems with the
interpretation of a positive TB skin test reaction. First
Vol. 21, No. 3, March, 2002 201THE PEDIATRIC INFECTIOUS DISEASE JOURNAL
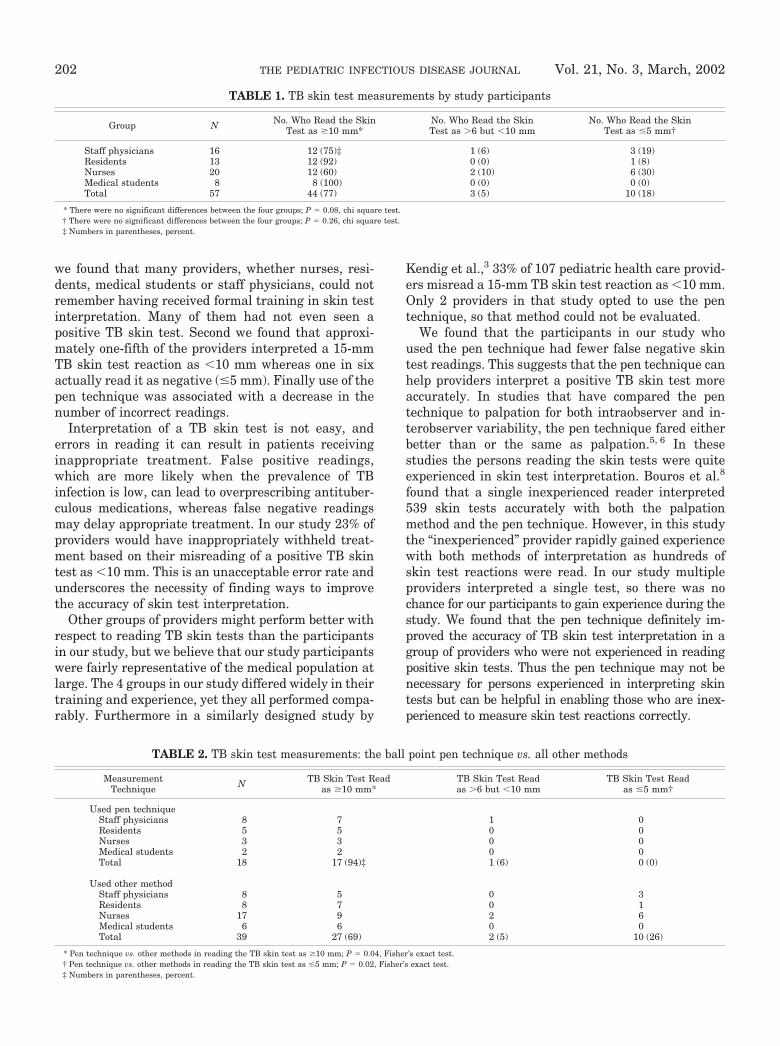
we found that many providers, whether nurses, resi-dents, medical students or staff physicians, could notremember having received formal training in skin testinterpretation. Many of them had not even seen apositive TB skin test. Second we found that approxi-mately one-fifth of the providers interpreted a 15-mmTB skin test reaction as �10 mm whereas one in sixactually read it as negative (�5 mm). Finally use of thepen technique was associated with a decrease in thenumber of incorrect readings.
Interpretation of a TB skin test is not easy, anderrors in reading it can result in patients receivinginappropriate treatment. False positive readings,which are more likely when the prevalence of TBinfection is low, can lead to overprescribing antituber-culous medications, whereas false negative readingsmay delay appropriate treatment. In our study 23% ofproviders would have inappropriately withheld treat-ment based on their misreading of a positive TB skintest as �10 mm. This is an unacceptable error rate andunderscores the necessity of finding ways to improvethe accuracy of skin test interpretation.
Other groups of providers might perform better withrespect to reading TB skin tests than the participantsin our study, but we believe that our study participantswere fairly representative of the medical population atlarge. The 4 groups in our study differed widely in theirtraining and experience, yet they all performed compa-rably. Furthermore in a similarly designed study by
Kendig et al.,3 33% of 107 pediatric health care provid-ers misread a 15-mm TB skin test reaction as �10 mm.Only 2 providers in that study opted to use the pentechnique, so that method could not be evaluated.
We found that the participants in our study whoused the pen technique had fewer false negative skintest readings. This suggests that the pen technique canhelp providers interpret a positive TB skin test moreaccurately. In studies that have compared the pentechnique to palpation for both intraobserver and in-terobserver variability, the pen technique fared eitherbetter than or the same as palpation.5, 6 In thesestudies the persons reading the skin tests were quiteexperienced in skin test interpretation. Bouros et al.8
found that a single inexperienced reader interpreted539 skin tests accurately with both the palpationmethod and the pen technique. However, in this studythe “inexperienced” provider rapidly gained experiencewith both methods of interpretation as hundreds ofskin test reactions were read. In our study multipleproviders interpreted a single test, so there was nochance for our participants to gain experience during thestudy. We found that the pen technique definitely im-proved the accuracy of TB skin test interpretation in agroup of providers who were not experienced in readingpositive skin tests. Thus the pen technique may not benecessary for persons experienced in interpreting skintests but can be helpful in enabling those who are inex-perienced to measure skin test reactions correctly.
TABLE 1. TB skin test measurements by study participants
Group N No. Who Read the SkinTest as �10 mm*
No. Who Read the SkinTest as �6 but �10 mm
No. Who Read the SkinTest as �5 mm†
Staff physicians 16 12 (75)‡ 1 (6) 3 (19)Residents 13 12 (92) 0 (0) 1 (8)Nurses 20 12 (60) 2 (10) 6 (30)Medical students 8 8 (100) 0 (0) 0 (0)Total 57 44 (77) 3 (5) 10 (18)
* There were no significant differences between the four groups; P � 0.08, chi square test.† There were no significant differences between the four groups; P � 0.26, chi square test.‡ Numbers in parentheses, percent.
TABLE 2. TB skin test measurements: the ball point pen technique vs. all other methods
MeasurementTechnique N TB Skin Test Read
as �10 mm*TB Skin Test Readas �6 but �10 mm
TB Skin Test Readas �5 mm†
Used pen techniqueStaff physicians 8 7 1 0Residents 5 5 0 0Nurses 3 3 0 0Medical students 2 2 0 0Total 18 17 (94)‡ 1 (6) 0 (0)
Used other methodStaff physicians 8 5 0 3Residents 8 7 0 1Nurses 17 9 2 6Medical students 6 6 0 0Total 39 27 (69) 2 (5) 10 (26)
* Pen technique vs. other methods in reading the TB skin test as �10 mm; P � 0.04, Fisher’s exact test.† Pen technique vs. other methods in reading the TB skin test as �5 mm; P � 0.02, Fisher’s exact test.‡ Numbers in parentheses, percent.
202 Vol. 21, No. 3, March, 2002THE PEDIATRIC INFECTIOUS DISEASE JOURNAL
Our study had several limitations. We had only oneskin test reaction for participants to read, and this waspositive at 15 mm. Thus we were not able to evaluatefalse positive rates. It would have been useful to havehad a truly negative skin test reaction with someerythema and no induration to be able to assess for theaccuracy of negative readings. In addition we had only10 to 15 participants in each of our subgroups. Withmore participants we might have been able to moreclearly identify intergroup differences as well as tomore precisely determine the benefit of using the pentechnique. Also we did not prospectively assess theutility of the pen technique or compare it directly withthe palpation method. We were only able to evaluatethe pen technique because enough of the participantsopted to use it.
In conclusion we found that �20% of medical healthcare providers in a pediatric clinic misread a 15-mm TBskin test reaction as �10 mm, a false negative ratesimilar to that reported by other investigators. Provid-ers who used the pen technique had fewer incorrectreadings. Thus the ballpoint pen technique may helpreduce incorrect readings. We suggest that medical andnursing schools as well as residency programs institute
formal training in TB skin test interpretation andconsider teaching the ballpoint pen technique.
REFERENCES1. American Thoracic Society. Diagnostic standards and classi-
fication of tuberculosis in adults and children: official ATSstatement. Am J Respir Crit Care Med 2000;161:1374–95.
2. American Academy of Pediatrics. In: Pickering LK, ed. 2000Red Book: Report of the Committee on Infectious Diseases.25th ed. Elk Grove Village, IL: American Academy of Pediat-rics, 2000:596–8.
3. Kendig EL, Kirkpatrick BV, Carter WH, Hill FA, Caldwell K,Entwistle M. Underreading of the tuberculin skin test reac-tion. Chest 1998;113:1175–7.
4. Sokal JE. Measurement of delayed skin-test responses.N Engl J Med 1975;293:501–2.
5. Bouros D, Zeros G, Panaretos C, Vassilatos C, Siafakas N.Palpation vs. pen method for the measurement of skin tuber-culin reaction (Mantoux test). Chest 1991;99:416–9.
6. Longfield JN, Margileth AM, Golden SM, Lazoritz D, BohanJS, Cruess DF. Interobserver and method variability intuberculin skin testing. Pediatr Infect Dis 1984;3:323–6.
7. Jordan TJ, Sunderam G, Thomas L, Reichman LB. Tubercu-lin reaction size measurement by the pen method comparedto traditional palpation. Chest 1987;92:234–6.
8. Bouros D, Maltezakis G, Tzanakis N, Tzortzaki E, SiafakasN. The role of inexperience in measuring tuberculin skinreaction (Mantoux test) by the pen or palpation technique.Respir Med 1992;86:219–23.
9. Presented at the International Conference of the AmericanThoracic Society, Toronto, Canada, May, 2000.
Pediatr Infect Dis J, 2002;21:203–9 Vol. 21, No. 3Copyright © 2002 by Lippincott Williams & Wilkins, Inc. Printed in U.S.A.
Cefepime versus ceftazidime as empiricmonotherapy for fever and neutropeniain children with cancerYU-YU CHUANG, MD, IOU-JIH HUNG, MD, CHAO-PING YANG, MD, TANG-HER JAING, MD, TZOU-YIEN LIN, MD ANDYHU-CHERING HUANG, MD, PHD
Background. Monotherapy with cefepime orceftazidime is an effective alternative to combi-nation therapy for the treatment of febrile neu-
tropenic adult cancer patients. We compared theefficacy and safety of cefepime and ceftazidimeas empiric monotherapy of febrile neutropeniain children with cancer.
Materials and methods. A prospective, openlabel, randomized, comparative study in pediat-ric cancer patients was conducted at ChangGung Children’s Hospital from January 1, 2000,to April 15, 2001. Patients with fever and neutro-penia (absolute neutrophil count of <500/mm3)were randomized to receive either intravenouscefepime or ceftazidime (50 mg/kg/dose as two orthree doses daily). Febrile episodes were classi-
Accepted for publication Sept. 25, 2001.From the Department of Pediatrics, St. Mary’s Hospital (YYC),
and Lotong, I-lan Divisions of Pediatric Infectious Diseases (YYC,TYL, YCH) and Hematology/Oncology (IJH, CPY, THJ), ChangGung Children’s Hospital, Taoyuan, Taiwan.
Key words: Febrile neutropenia, cefepime, ceftazidime, child-hood cancer.
Address for reprints: Dr. Yhu-Chering Huang, Division ofPediatric Infectious Diseases, Chang Gung Children’s Hospital, 5Fu-Shin St., Kweishan, Taoyuan, Taiwan. Fax 886-3-3288957;E-mail [email protected].
Vol. 21, No. 3, March, 2002 203THE PEDIATRIC INFECTIOUS DISEASE JOURNAL
fied as microbiologically documented infection,clinically documented infection or unexplainedfever. Clinical response to therapy was classifiedas success and failure.
Results. Ninety-five pediatric cancer patientswith 120 febrile neutropenic episodes were ran-domized to receive empiric treatment withcefepime or ceftazidime. After 72 h of treatment,82.8% (48 of 58) of the eligible patients in thecefepime group continued with unmodified ther-apy, compared with 87.9% (51 of 58) in the cefta-zidime group. The neutrophil count was <100/mm3 at randomization for 76% of the patients inthe cefepime group and 83% of those in the cefta-zidime group; the median durations of neutrope-nia (<500/mm3) were 8.5 and 6.5 days, respec-tively. Of the 96 evaluable episodes the overallsuccess rate with unmodified empiric therapyuntil the end of the treatment course in thecefepime group was comparable with that in theceftazidime group (69% vs. 71%, P � 0.95). Theresponse rate after glycopeptides were added tothe regimens was 79.2% for the cefepime groupand 77.1% for the ceftazidime group. The bacte-rial eradication rate was 33% for the cefepimegroup and 20% for the ceftazidime group (P �0.85), and the rates of new infections were 10.4%vs. 4.2% (P � 0.67), respectively. Both study drugswere well-tolerated. Three (6.4%) patients in thecefepime group and 2 (4.3%) patients in the cefta-zidime group died.
Conclusion. Cefepime appeared to be as effec-tive and safe as ceftazidime for empiric treat-ment of febrile episodes in neutropenic pediatriccancer patients.
INTRODUCTIONCombination therapy with a beta-lactam and an
aminoglycoside has been traditionally recommendedfor febrile episodes in neutropenic patients, but there isnow evidence that monotherapy with a broad spectrumcephalosporin such as ceftazidime, cefepime or a car-bapenem is as effective as combination therapy.1–4
Cefepime is an extended spectrum fourth generationcephalosporin with good activity against Gram-positiveorganisms, including methicillin-susceptible Staphylo-coccus aureus, alpha-hemolytic streptococci and someStaphylococcus epidermidis. It also has good activityagainst Gram-negative organisms, including Pseudo-monas aeruginosa, and it resists degradation by BushGroup 1 beta-lactamases produced by Enterobacterspp.5, 6 and Klebsiella spp.7
The effectiveness and safety of cefepime for treat-ment of febrile episode in adult neutropenic cancerpatients have been confirmed in several studies.8–14
Recent reports showed that cefepime is as effective and
safe as ceftazidime for empiric treatment of febrileepisodes in neutropenic pediatric patients with can-cer.15, 16
We have extended these studies with an open, ran-domized study comparing the efficacy and safety ofcefepime and ceftazidime as empiric monotherapy offebrile neutropenia in children with cancer.
MATERIALS AND METHODS
Study design and patients. A prospective, openlabel, randomized, comparative study in pediatric can-cer patients was conducted at Chang Gung Children’sHospital from January 1, 2000, to April 15, 2001.Hospitalized cancer patients age 2 months to 15 yearswere eligible for study if they became febrile during aperiod of neutropenia. Neutropenia was defined as anabsolute neutrophil count �500/mm3. Fever was de-fined as a temperature of �38°C occurring at leasttwice in a 24-h period or as a single oral temperature of�38.5°C that was not related to administration of bloodproducts.17, 18 Patients were excluded if they had ahistory of allergy to penicillins or cephalosporins, hadreceived any intravenous antibiotic during the preced-ing 96 h or treatment with any study drug within 30days preceding randomization or had hepatic or renaldiseases. Patients could enter more than once if theyhad new distinct episodes of febrile neutropenia sepa-rated by at least 30 days or recovery of neutropeniafrom prior episode by at least 2 weeks.
Antibiotic regimens. Patients were randomized ina 1:1 ratio and stratified by type of underlying malig-nancy (hematologic or solid tumor). Cefepime or cefta-zidime was administered intravenously at a dose of 50mg/kg/dose as two or three doses daily, at a maximumdaily dose of 6 g. Modification of the initial treatmentwas permitted and included persistence or progressiveworsening of clinical symptoms and signs of infection,resistant pathogen from culture results, emergence ofnew infections or at the discretion of the attendingphysician. Treatment was continued until the comple-tion of an appropriate course of therapy for a definedclinical or microbiologic infection, or until resolution offever and clinical signs and symptoms or at least 3days, regardless of whether the neutrophil count hadreturned to normal or not.
Clinical and laboratory assessment. A completemedical history and physical examination were con-ducted for all patients on entry to the study. Labora-tory examinations included a hematologic profile, liverfunction tests, renal function tests and chest radio-graph when clinically indicated. Microbiologic evalua-tion included at least two sets of blood cultures (oneperipheral and one from a central venous catheter ifpresent), a urine culture when clinically indicated andcultures of any potential sites of infection.
All the patients were examined daily during therapy.
204 Vol. 21, No. 3, March, 2002THE PEDIATRIC INFECTIOUS DISEASE JOURNAL

Additional evaluations and laboratory tests when ap-propriate were repeated during and at the end of thetherapy. Side effects, adverse events or abnormal lab-oratory values that occurred during the study relatedto antibiotics were recorded and classified as not re-lated, possibly related or definitely related to the studydrug.
Classification and evaluation of response. Fe-brile episodes were classified as microbiologically doc-umented infection (both the site of infection and theorganism were identified), clinically documented infec-tion (the site of infection was identified, but no organ-ism was isolated) or unexplained fever (infection wasmost likely in a febrile patient, but no site or organismwas identified).
The clinical efficacy was evaluated at 72 h, at thecompletion of antibiotic therapy, and an overall re-sponse 7 and 30 days after treatment ended. Responseto therapy was classified as success and failure. Suc-cess was defined as disappearance of fever, overallclinical improvement and eradication of any infectingorganism without modification of antibiotic therapyand maintenance of response for at least 7 days afterdiscontinuation of therapy. Failure was defined aspersistence of fever or of the infecting organisms, anymodification of antibiotic therapy, new infections orany death during treatment with the study drug.
New infection was defined as a new clinically ormicrobiologically documented infection that occurredeither during therapy or after the discontinuation ofantibiotic therapy.
An episode was classified as unevaluable for re-sponse to the study drug when there was a majorprotocol violation, nonbacterial infections, or early dis-
continuation or modification of the study drug before72 h without adequate reason.
Analysis. An intent-to-treat analysis was performedfor all eligible and evaluable patients. A second analy-sis for clinical response was done after excluding thoseunevaluable patients (failure in the intent-to-treatanalysis).
Continuous variables in each study regimen wereanalyzed by Student’s t test. Categoric variables ineach group were compared by means of chi square orFisher exact tests. Statistical significance was deter-mined at P � 0.05.
RESULTSNinety-five patients who had 120 episodes of febrile
neutropenia were randomized for treatment as 60febrile episodes with cefepime and 60 episodes withceftazidime. One hundred sixteen episodes in 93 neu-tropenic patients were eligible for study: 58 episodeswith cefepime and 58 episodes with ceftazidime. Eigh-teen patients were enrolled more than once with dis-tinct febrile neutropenic episodes. In the cefepimegroup 7 patients had 2 episodes and 2 patients had 3episodes. In the ceftazidime group 6 patients had 2episodes and 3 patients had 3 episodes. Six patientswere randomized to receive a different study drugduring distinct episodes of febrile neutropenia. Fourepisodes were ineligible for the following reasons: nocancer (1 in cefepime); skin rash (1 in cefepime); nofever (1 in ceftazidime); and receiving parenteral anti-biotics within 96 h preceding randomization (1 inceftazidime).
Characteristics of the patients during febrileepisodes. Demographic data and clinical characteris-
TABLE 1. Characteristics of the eligible episodes
Characteristics Cefepime(N � 58)
Ceftazidime(N � 58) P
Male/female 38/20 35/23 0.70Median age (yr) 5.4 (0.5–15.2)* 5.9 (0.3–15.5) 0.24
Underlying disease 0.52Leukemia/lymphoma 40 (69) 35 (60.3)Solid tumors 18 (31) 23 (39.7)
Status of cancerInduction 3 (5.2) 4 (6.9)Relapse 9 (15.5) 7 (12.1)
Implanted central venous catheter 16 (27.6) 14 (24.1) 0.83Trimethoprim-sulfamethoxazole prophylaxis 23 (39.7) 21 (36.2)Granulocyte-colony-stimulating factor 30 (51.7) 38 (65.5) 0.19ANC at randomization/mm3
Median 20 (0–426) 24 (0–475) 0.97�100/mm3 44 (75.9) 48 (82.8) 0.49
Duration of neutropeniaANC �500/mm3
Median 8.5 (3–35) 6.5 (3–51) 0.81�10 days 25 (43) 20 (34.5)
ANC �100/mm3
Median 3 (1–24) 2 (1–24) 0.94�10 days 6 (10.3) 9 (15.5)
* Single numbers in parentheses, percent; two numbers in parentheses, range.ANC, absolute neutrophil count.
Vol. 21, No. 3, March, 2002 205THE PEDIATRIC INFECTIOUS DISEASE JOURNAL

tics by episodes are shown in Table 1. There were noimportant differences between the treatment groupsfor the characteristics described. Causes of neutropenicfever are shown in Table 2.
Clinical response. After 72 h of treatment 48 of 58(82.8%) of the patients continued with unmodifiedtherapy in the cefepime group, compared with 51 of 58(87.9%) in the ceftazidime group (P � 0.94). Theclinical responses of the evaluable episodes are shownin Table 3.
Among the evaluable episodes with treatment mod-ification, vancomycin was added to the regimen in 11 ofthe 15 episodes in the cefepime group and was theinitial modification in 6 episodes. Nine episodes receiv-ing cefepime were modified to ceftazidime (5 during theprimary infection and 4 during a recurrent fever or anew infection). In the ceftazidime group vancomycinwas added to the empiric regimen in only 5 of the 14episodes. Amphotericin B was added in 3 episodes eachwith cefepime and ceftazidime. Although vancomycinwas added most frequently in the cefepime group, theoverall success rate after the addition of glycopeptidesincreased to 79.2% (38 of 48) with cefepime and 77.1%(37of 48) with ceftazidime.
Reasons for treatment failure are shown in Table 4.Additional analyses stratifying the clinical response bycancer diagnosis, duration and severity of neutropeniaare shown in Table 5.
Bacteriologic efficacy. The six Gram-negativeblood isolates from the cefepime group, Klebsiella oxy-toca extended spectrum beta-lactamase (ESBL), Kleb-siella pneumoniae, Salmonella choleraesuis, Salmo-nella enteritidis B, Moraxella catarrhalis andEscherichia coli, were susceptible to cefepime.Cefepime eradicated all of the isolated pathogens, butnew infection occurred in one patient; there was per-sistent fever and recurrent fever in 2 and 1 episodes,respectively. Among the three blood isolates from theceftazidime group, methicillin-resistant Staphylococ-cus aureus and Acinetobacter baumanii were resistant
and E. coli was susceptible to ceftazidime in vitro.Campylobacter jejuni was isolated from the stool in onepatient and E. coli, Enterococcus and methicillin-resistant S. aureus were isolated from a wound inanother patient in the ceftazidime group.
New infections. New infections occurred in fivepatients in the cefepime group and two patients in theceftazidime group (P � 0.67). The organisms causingnew infections in the cefepime group were viridansStreptococcus, Neisseria sp., Stenotrophomonas malto-philia, A. baumanii, methicillin-susceptible S. aureusand K. pneumoniae ESBL. In the cefepime group onepatient had recurrent fever and clinical sepsis but noevidence of bacteremia; two patients had a polymicro-bial infection. The organisms causing new infections inthe ceftazidime group were viridans Streptococcus andEnterobacter cloacae. Overall six of seven (85.6%) newinfections were microbiologically documented.
Intent-to-treat analysis. The response rates werecompared in an intent-to-treat analysis of 96 eligibleepisodes (Table 4). A high success rate was obtainedwith both study drugs in patients with unexplainedfever, 89% (25 of 28) and 82% (28 of 34) in the cefepimeand ceftazidime groups, respectively. The success ratesfor microbiologically documented infections were 28.6%(2 of 7) and 14.3% (1 of 7) in the cefepime and ceftazi-dime groups, respectively. For the clinically docu-mented infections, 26% (6 of 23) of the cefepime and29% (5 of 17) of the ceftazidime group had a successfulresponse.
Tolerability. There were no reports of nausea, vom-iting, diarrhea related to either cefepime or ceftazi-dime. Cefepime was discontinued in one patient with askin rash considered probably related to the drug.
Deaths. Three patients in the cefepime group died.One patient with leukemia died of causes directlyrelated to a new infection with S. maltophilia and A.baumanii sepsis after eradication of K. oxytoca ESBLin the blood. Two patients, one with lymphoma and onewith leukemia, died of progressive sepsis syndrome
TABLE 2. Causes of neutropenic fever
Type of Infection Cefepime(N � 58)
Ceftazidime(N � 58) P
Microbiologically documented infections 7 (12.1)* 7 (12.1) 0.78Bacteremia 7 (12.1) 3 (5.2)Gastroenteritis 0 1Skin and soft tissue infections 0 1Urinary tract infection 0 1EBV infection 0 1
Clinically documented infections 23 (39.7) 17 (29.3) 0.33Lower respiratory tract 9 3Skin/soft tissue infections 4 3Bone/joint infections 1 0Head, eyes, ears, throat infections 7 6Gastrointestinal infections 2 5
Unexplained fever 28 (48.3) 34 (58.6) 0.35
EBV, Epstein-Barr virus.* Numbers in parentheses, percent.
206 Vol. 21, No. 3, March, 2002THE PEDIATRIC INFECTIOUS DISEASE JOURNAL

without documented bacteremia. Two patients in theceftazidime group died. One patient with leukemiadied from worsening of E. coli sepsis, susceptible toceftazidime. Another patient with leukemia died ofnew infection related to Enterobacter cloacae, suscep-tible to and treated with ceftazidime.
DISCUSSIONSeveral studies have demonstrated that mono-
therapy with new extended spectrum cephalosporins
(ceftazidime or cefepime) or carbapenems is an effec-tive alternative to traditional combination therapy infebrile neutropenic patients.2, 4 The Food and DrugAdministration of the United States has approvedcefepime for the empiric monotherapy of febrile neu-tropenia in adults.
This study has included a large group of profoundlyneutropenic patients (neutrophil counts of �100/mm3
at entry). Most patients in the cefepime group hadleukemia, whereas more patients in the ceftazidimegroup had solid tumors.
In an analysis comparing febrile episodes in childrenand adults, bacteremia occurred in 22%, clinicallydocumented infection in 19% and fever of unknownorigin in 49% in febrile neutropenic episodes in chil-dren.20 The incidence of bacteremia (8.7%) in our studywas low compared with that report. However, theincidence of documented infections and unexplainedfever was comparable with that reported in a recentcomparative trial of ceftazidime and cefepime in pedi-atric patients.15
Studies comparing cefepime and ceftazidime mono-therapy in children with febrile neutropenic episodesare summarized in Tables 6 and 7. Our study achieveda success rate of 69% with cefepime compared with 71%with ceftazidime. However, the numbers of evaluablepatients are too small to make any statistical conclu-sion. Data from previous studies in children15, 16 and inthis study showed overall success rates of 68.7% forcefepime and 67.9% for ceftazidime. These resultsindicate that cefepime appears to be as efficacious asceftazidime in this setting.
Our study was conducted at a single institution. Thenumber of patients with microbiologically documentedinfections was small, and the pathogens reflected themicrobiology in the cancer patients of our institution.In contrast to the current trend in the western coun-tries,21, 22 we did not observed a complete shift towardGram-positive organisms. This could be the result of
TABLE 3. Clinical responses of the evaluable episodes to the antibiotic regimen
Category
Response/Total Evaluable Episodes
Cefepime(N � 48)
Ceftazidime(N � 48) P
Median duration of treatment (days) 5 (3–12)* 6 (3–20)Median time to defervescence (days) 3 (1–12) 2 (1–10)Success 33/48 (68.8) 34/48 (70.8) 0.95
Microbiologically documented infections 2/6 (33.3) 1/5 (20) 0.85Bacteremia 2/6 (33.3) 0/3 (0)
Clinically documented infections 6/14 (42.9) 5/14 (35.7)Unexplained fever 25/28 (89.3) 28/29 (96.6)
Success with modification (including new infections)With vancomycin 5/48 (10.4) 3/48 (6.3)
Microbiologically documented infections 1/6 0/5Clinically documented infections 2/14 2/14Unexplained fever 2/28 1/29
New infections 5/48 (10.4) 2/48 (4.2) 0.67Survived (�30 days after therapy) 45/48 (93.8) 46/48 (95.8) 1.0
* Single numbers in parentheses, percent; two numbers in parentheses, range.
TABLE 4. Efficacy analysis
Episodes or Outcome Cefepime(N)
Ceftazidime(N)
Episodes in intent-to-treat analysis 58 58Success 33 (56.9)* 34 (58.6)Failure 25 (43.1) 24 (41.4)
Episodes not evaluable 10 10Early modification �72 h 5 5Treatment changed 0 3Viral or fungal infections 5 2
Evaluable episodes 48 48Outcome
Success 33 (68.8) 34 (70.8)Failure 15 (31.2) 14 (29.2)
Reasons for failureResistant pathogens 0 3Persistent fever(�72 h) 9 8Progression 2 1New infections 6 (12.5) 2 (4.2)
Mortality 3/47 (6.4) 2/46 (4.3)
* Numbers in parentheses, percent.
TABLE 5. Clinical responses by prognostic factors
Factors
Success/Total
Cefepime(N � 48)
Ceftazidime(N � 48)
Underlying diseaseLeukemia/lymphoma 20/33 (60.6)* 17/28 (60.7)Solid tumor 13/15 (86.7) 17/20 (85)
Neutrophil count at inclusion/mm3
�100/mm3 25/36 (69.4) 26/40 (65)�100/mm3 8/12 (66.7) 8/8 (100)
Duration of neutropenia�10 days 22/28 (78.5) 22/30 (73.3)�10 days 11/20 (55) 12/18 (66.7)
* Numbers in parentheses, percent.
Vol. 21, No. 3, March, 2002 207THE PEDIATRIC INFECTIOUS DISEASE JOURNAL

the relatively low frequency of central venous catheterimplantation in our patients.
Thirty percent of the febrile episodes in both treat-ment groups required a modification. Modification ofantimicrobial therapy is a reality in clinical practice inthe treatment of febrile neutropenia.1, 2 In our studyantibiotics were added more often in patients treatedwith cefepime than with ceftazidime. In particularglycopeptides were added as modification in 23% (11 of48) of the evaluable episodes treated with cefepimecompared with 10.4% (5 of 48) of those in whichceftazidime was received empirically. This finding can-not be explained by the higher incidence of documentedGram-positive infections observed in the cefepime group;indeed most patients received glycopeptide addition with-out documentation of a resistant microorganism. Despitethe increased activity of cefepime against Gram-positiveorganisms,5 it did not lessen the need for glycopeptideaddition in our study. One of the reasons why morepatients on cefepime received glycopeptides in thepresent study could have been the open study design. Itwas noted that one-half of the modifications in thecefepime group were modified to ceftazidime during aprimary or a new infection. Clinicians seemed to be moreconfident with a familiar drug (ceftazidime) and temptedto modify on the new drug (cefepime) regimen.
Another reason for the increased frequency of modi-fication during our study was financial constraintsunder the national health insurance policy. In theUnited States and Europe monotherapy offers advan-
tages of decreased toxicity and less cost compared withmultidrug regimen.4 However, monotherapy withcefepime or ceftazidime offers no economic advantageto the traditional combination therapy in our institu-tion. The cost is 4 to 7 times that of the traditionalcombination therapy. Several febrile episodes respond-ing to the study drugs were changed to traditionaltherapy after 3 days due to financial considerations.
The results of this study suggest that cefepime andceftazidime are equally effective and safe for empirictreatment of febrile episodes in neutropenic patients.However, both drugs are more expensive than tradi-tional combination antibiotic therapy.
REFERENCES1. Pizzo PA. Management of fever in patients with cancer and
treatment-induced neutropenia. N Engl J Med 1993;328:1323–32.
2. Hughes WT, Armstrong D, Bodey GP, et al. 1997 Guidelinesfor the use of antimicrobial agents in neutropenic patientswith unexplained fever. Clin Infect Dis 1997;25:551–73.
3. Eggimann P, Glauser MP, Aoun M, et al. Cefepime mono-therapy for the empiric treatment of fever in granulocytope-nic cancer patients. J Antimicrob Chemother 1993;32(SupplB):151–63.
4. Ramphal R. Is monoherapy for febrile neutropenia still aviable alternative? Clin Infect Dis 1999;29:508–14.
5. Sanders CC. Cefepime the next generation? Clin Infect Dis1993;17:369–79.
6. Segreti J, Levin S. Bacteriologic and clinical applications of anew extended-spectrum parenteral cephalosporin. Am J Med1996;100(Suppl 6A):45S–51S.
7. Jones RN, Pfaller MA, Doern GV, Erwin ME, Hollis RJ.Antimicrobial activity and spectrum investigation of eightbroad-spectrum beta-lactam drugs: a 1997 surveillance trial
TABLE 6. Summary of studies of efficacy of cefepime monotherapy for treatment of febrile neutropenia
Study/Year of Publication Country No. of Episodesor Patients Age Group
Success Rate (%)
Cefepime Comparator
Present study, 2002 Taiwan 96 2 mo–16 yr 69 71Mustafa et al.,15 2001 US 68 2 mo–18 yr 74 70Kebudi et al.,16 2001 Turkey 63 (solid tumors) 1 mo–14 yr 62.5 61.3Ramphal et al.,8 1996 US 201 �16 yr 74 76Breen et al.,9 1997 US
Europe477 �18 yr 53 55
Yamamura et al.,10 1997 US 99 �18 yr 78 78Wang et al.,12 1999 Taiwan 41 �16 yr 53 50Chandrasekar et al.,13 2000 US 188 �18 yr 57 60
TABLE 7. Efficacy of cefepime and ceftazidime in febrile neutropenic children
Studies EvaluableEpisodes MDI (%) CDI (%) UF (%) Overall
SuccessRate(%)
CefepimeOur study 48 2 6 25 33 68.8Mustafa et al.15 35 1 8 17 26 74Kebudi et al.16 32 20 62.5Total 115 3 (3.6)* 14 (16.9)* 42 (50.6)* 79 68.7
CeftazidimeOur study 48 1 5 28 34 70.8Mustafa et al.15 33 0 2 21 23 70Kebudi et al.16 31 19 61.3Total 112 1 (1.2)* 7 (8.6)* 49 (60.5)* 76 67.9
* Data based on two studies (our study and Mustafa et al)MDI, microbiologically documented infections; CDI, clinically documented infections; UF, unexplained fever.
208 Vol. 21, No. 3, March, 2002THE PEDIATRIC INFECTIOUS DISEASE JOURNAL
in 102 medical centers in the United States. Cefepime StudyGroup. Diagn Microbiol Infect Dis 1998;30:215–28.
8. Ramphal R, Gucalp R, Rotstein C, et al. Clinical experiencewith single agent and combination regimens in the manage-ment of infection in the febrile neutropenic patient. Am J Med1996;100(Suppl 6A):83S–89S.
9. Breen J, Ramphal R, Cometta A, et al. Cefepime vs. ceftazi-dime as empiric therapy of febrile neutropenic patients. In:Klastersky J, ed. Febrile neutropenia. Berlin: Springer-Verlag, 1997:63–74.
10. Yamamura D, Gucalp R, Carlisle P, et al. Open randomizedstudy of cefepime vs. piperacillin-gentamicin for treatment offebrile neutropenic cancer patients. Antimicrob Agents Che-mother 1997;41:1704–8.
11. Biron P, Fuhrmann C, Cure H, et al. Cefepime vs. imipenem-cilastatin as empiric monotherapy in 400 febrile patientswith short duration neutropenia. J Antimicrob Chemother1998;42:511–18.
12. Wang FD, Liu CY, Hsu HC, et al. A comparative study ofcefepime vs. ceftazidime as empiric therapy of febrile epi-sodes in neutropenic patients. Chemotherapy 1999;45:370–9.
13. Chandrasekar PH, Arnow PM. Cefepime vs. ceftazidime asempiric therapy for fever in neutropenic patients with cancer.Ann Pharmacother 2000;34:989–95.
14. Cordonnier C, Herbrecht R, Pico JL, et al. Cefepime/amikacinvs. ceftazidime/amikacin as empiric therapy for febrile epi-sodes in neutropenic patients: a comparative study. ClinInfect Dis 1997;24:41–51.
15. Mustafa MM, Carlson L, Tkaczewski I, McCracken GH Jr.,Buchanan GR. Comparative study of cefepime vs. ceftazidime
in the empiric treatment of pediatric cancer patients withfever and neutropenia. Pediatr Infect Dis J 2001;20:362–9.
16. Kebudi R, Gorgun O, Ayan I, Gurler N, Akici F, Toreci K.Randomized comparison of cefepime vs. ceftazidime mono-therapy for fever and neutropenia in children with solidtumors. Med Pediatr Oncol 2001;36:434–41.
17. Hughes WT, Pizzo PA, Wade JC, Armstrong D, Webb DC,Young LS. Evaluation of new anti-infective drugs for thetreatment of febrile episodes in neutropenic patients. ClinInfect Dis 1992;15(Suppl 1):S206–15.
18. Pizzo PA, Armstromg D, Bodey G, et al. The design, analysis,and reporting of clinical trials on empiric antibiotic manage-ment of neutropenic patient: report of consensus panel fromthe Immunocompromised Host Society. J Infect Dis 1990;161:397–401.
19. National Committee for Clinical Laboratory Standards. Per-formance standards for antimicrobial susceptibility testing.80th Informational Supplement. NCCLS Document M-100-S58. Wayne, PA: National Committee for Clinical LaboratoryStandards, 1998.
20. Hann I, Viscoli C, Paesmans M, Gaya H, Glauser M and theIATCG of EORTC. A comparison of outcome from febrile neu-tropenic episodes in children compared with adults: results fromfour EORTC studies. Br J Hematol 1997;99:580–8.
21. Zinner SH. Changing epidemiology of infections in patientswith neutropenia and cancer: Emphasis on Gram-positiveand resistant bacteria. Clin Infect Dis 1999;29:490–4.
22. Jones RN. Contemporary antimicrobial susceptibility pat-terns of bacterial pathogens commonly associated with febrilepatients with neutropenia. Clin Infect Dis 1999;29:495–502.
Pediatr Infect Dis J, 2002;21:209–13 Vol. 21, No. 3Copyright © 2002 by Lippincott Williams & Wilkins, Inc. Printed in U.S.A.
Mucosal immune responses to meningococcalconjugate polysaccharide vaccines in infantsQIBO ZHANG, PHD, EMILY PETTITT, BSC, ROGER BURKINSHAW, BSC, GILLIAN RACE, BSC, LYNNE SHAW, BA ANDADAM FINN, PHD, FRCP
Background. Serogroup C meningococcal con-jugate polysaccharide vaccines have been re-ported to induce significant serum IgG antibod-ies and immunologic memory in infants. Becausemeningococcus is a mucosal pathogen colonizingthe nasopharynx, local mucosal immune re-sponses may play an important role in host de-
fense against infection and carriage. We haveinvestigated the mucosal IgA and IgG antibodyresponses to two meningococcal C conjugate vac-cines in the saliva of healthy infants.
Methods. Specific salivary IgA and IgG antibod-ies to two meningococcal C polysaccharide conju-gate vaccines (Menjugate from Chiron Corp., n �46; and Meningitec from Wyeth Lederle, n � 54)were investigated by immunoassay in infants afterparenteral vaccinations at the ages of 2, 3 and 4months. Unstimulated saliva samples were col-lected immediately before the first immunizationand 1 month after the third immunizations. Fortyhealthy infants receiving the same routine vac-cines but no meningococcal C vaccine were re-cruited as controls.
Accepted for publication Oct. 8, 2001.From the Division of Child Health, University of Sheffield,
Sheffield (EP, RB, GR, LS); and the Institute of Child Health,University of Bristol, Bristol (QZ, AF), United Kingdom.
Key words: Mucosal antibodies, meningococcal vaccines.Address for reprints: Dr Qibo Zhang, Institute of Child Health,
Education Centre, Level 6, c/o Royal Hospital for Children, UpperMaudlin Street, Bristol BS2 8BJ, United Kingdom. Fax 44-117-9285389; E-mail [email protected].
Vol. 21, No. 3, March, 2002 209THE PEDIATRIC INFECTIOUS DISEASE JOURNAL
Results. There were significant increases inmeningococcal C polysaccharide-specific IgG an-tibody concentrations postvaccination com-pared with prevaccination concentrations inboth vaccinated groups (both P < 0.001), but nochange in the control group. There were no sig-nificant increases in specific IgA postvaccinationgeometric mean concentrations in either the vac-cine or the control groups. The number of IgApositives postvaccination increased slightly inthe Wyeth vaccine group vs. controls (P < 0.05).
Conclusions. Significant salivary IgG antibod-ies to meningococcal C polysaccharide were ob-served after parenteral immunization with twomeningococcal C conjugate vaccines, whereasthere was no significant increase in specific IgAantibody levels for these two vaccines.
INTRODUCTION
Meningococcus is the most common cause of bacte-rial meningitis and septicemia in children in theUnited Kingdom. The proportion of cases caused byserogroup C Neisseria meningitidis increased in theUK during the late 1990s. Children younger than 2years have the highest attack rates.1 Polysaccharide(PS) vaccines have been used against several encapsu-lated bacterial infections including Haemophilus influ-enzae, Streptococcus pneumoniae and N. meningitidis.Anti-capsular PS antibodies are bactericidal and areassociated with protection. Meningococcal polysaccha-ride vaccines to several serogroups including C havebeen available for many years and are proved to beprotective in adults.2 However, like other PS antigensthey are poorly immunogenic in young children. Hypo-responsiveness has also been reported after repeateddoses of meningococcal C polysaccharide in children aswell as in adults.3–5 Serogroup C meningococcal conju-gate polysaccharide vaccines have been developed andrecently licensed in the UK. It has been reported thatthese vaccines induce significant serum IgG antibodyresponses and immunologic memory in infants.6–9 Be-cause meningococcus is a mucosal pathogen colonizingthe nasopharynx, local mucosal immune responsescould play an important role in host defense againstinfection and carriage. We and others have reportedmucosal IgG and IgA responses to such vaccines inadults and older children.10, 11 Such responses couldreduce nasopharyngeal carriage of meningococci andthus induce herd immunity, as has been seen withprotein-conjugated polysaccharide vaccines againstHaemophilus influenzae type b (Hib), widely used sincethe early 1990s.12, 13
In this study we report mucosal IgA and IgG anti-body responses to two meningococcal C conjugate vac-cines in the saliva of healthy infants.
MATERIALS AND METHODS
Study subjects, vaccines and immunizations.Group 1 [vaccine: Chiron meningococcal C (MenC)conjugate vaccine]. Forty-six healthy infants (24 male)age 7 to 10 weeks were studied who were recruited to alarger safety study (which involved 2500 healthy in-fants to assess the incidence of rare adverse eventsafter Chiron MenC vaccine).14 All subjects were immu-nized at 2, 3 and 4 months of age with Chiron MenCconjugate vaccine (Menjugate) injected intramuscu-larly into the anterolateral aspect of the right thigh.Each 0.5-ml dose of the vaccine contains 10 �g of MenCPS conjugated to diphtheria toxoid (CRM197) proteincarrier (12.5 to 33.3 �g) and 1 mg of aluminum hydrox-ide (adjuvant) per dose. Subjects also received routinedoses of diphtheria, tetanus and whole cell pertussis-Hib conjugate (Aventis Pasteur or Evans/SmithKlineBeecham or Behring/Cynamid) and oral polio vaccine(SmithKline Beecham). At the same time 40 healthyinfants (21 male) receiving the same routine vaccinesbut no MenC vaccine were recruited as controls.
Group 2 (vaccine: Wyeth Lederle MenC conjugatevaccine). Fifty-four healthy infants (29 male) ages 7 to10 weeks were studied who were recruited to a multi-center double blind Phase 2 immunogenicity trial.15 Allsubjects were immunized at 2, 3 and 4 months witheither a pilot lot or manufacturing lot (allocated ran-domly) of Wyeth Lederle meningococcal C conjugatevaccine (Meningitec) injected intramuscularly into theanterolateral aspect of the right thigh. The immunoge-nicity of the 2 lots was equivalent.15 Each 0.5-ml doseof the vaccine contains 10 �g of MenC oligosaccharideconjugated to diphtheria toxoid (CRM197) protein car-rier (15 �g) and 0.5 mg of aluminum phosphate (adju-vant) per dose. Subjects also received routine doses ofdiphtheria, tetanus and whole cell pertussis-Hib con-jugate vaccine [either Trivax (Evans/Wellcome) mixedwith Hiberix (polyribosylribitol phosphate-tetanus tox-oid; SmithKline Beecham) or ACTHIB diphtheria, tet-anus and pertussis vaccine, Aventis Pasteur (APpolyribosylribitol phosphate-tetanus toxoid)] and oralpolio vaccine.
Saliva samples. Unstimulated saliva samples werecollected immediately before the first immunizationand 1 month (4 to 6 weeks) after the third immuniza-tions using a sponge swab, transported in dry ice andstored at �80°C until assay. The period of salivastorage was 3 to 6 calendar months.
Each study was approved by the South Sheffieldlocal research ethics committee, and written informedconsent was obtained from all parents before enroll-ment.
Immunoassay for salivary anti-MenC PS-specific IgG and IgA antibodies. Specific salivaryantibodies against serogroup C meningococcal polysac-
210 Vol. 21, No. 3, March, 2002THE PEDIATRIC INFECTIOUS DISEASE JOURNAL

charides were determined with an enzyme-linked im-munosorbent assay as described previously.10 In briefImmulon 1 microtiter plates (Dynex, Chantilly, VA)were coated overnight at 4°C with meningococcal C PS(gift of Dr. George Carlone, CDC) 5 �g/ml diluted inphosphate-buffered saline (PBS), containing methyl-ated human serum albumin 5 �g/ml (gift of MikeBybel, Aventis Pasteur). After washes, 10% fetal bo-vine serum in PBS was added to block nonspecificbinding. Diluted saliva samples (1/10 in PBS contain-ing 10% fetal bovine serum) or standard serum (CDC1992 reference, gift of Dr. George Carlone) were addedto each well and incubated. Subsequently alkalinephosphatase-conjugated anti-human IgG (Sigma) wasadded for the IgG assay. Substrate (p-nitrophenylphosphate) was added, and the plates were incubatedfurther. Optical density (OD) at 405 nm was measuredusing a plate reader (Dynex), and concentrations of IgGwere calculated by interpolation on the standard curvederived from serial dilutions of the reference serum(CDC 1992). For anti-meningococcal C PS-specific IgAmeasurements, the plates were incubated at roomtemperature (RT) on a horizontal rotator for 2 h afteraddition of samples. Murine monoclonal antibodies tohuman IgA (1/5000) was then added to the plates andincubated at RT for 2 h. Alkaline phosphatase-conjugated goat anti-mouse antibodies (Stratech, Lu-ton, UK) were added, and the plates were incubatedovernight at RT. Subsequent procedures were as forthe IgG assay. We do not use IgG background platebecause the background OD is generally very low. Foranti-meningococcal C PS-specific IgA, a plate coatedwith PBS only was used to control background for eachassay; the OD values of samples and references on thePBS plate were subtracted from those coated withmeningococcal C PS antigen. The mean [95% confi-dence interval (CI) in parentheses] background ODvalues on the PBS plate for IgA were 0.069 (0.054,0.079) for salivary samples and 0.064 (0.052, 0.077) forreference serum.
For each assay a sample was considered positive ifthe mean of the 3 sample ODs was higher than themean � 2 SD of the 10 preimmunization samples whichwere pretested by immunoassay with no detectableantibodies (OD values not significantly different fromPBS background).
Statistical analysis. Antibody concentrations werelogarithmically transformed, and geometric mean con-centrations (GMC) with 95% CI were calculated foreach study group. Antibody titers below the limit ofdetection were arbitrarily assigned to one-half thelower limit of detection for each assay. The lower limitsof detection for MenC IgG and IgA were 8 and 4 ng/mlrespectively. Comparisons between pre- and postvacci-nation GMC within groups were made with paired two
tailed Student t tests. The chi square test or Fisher’sexact test where appropriate was used to compare theproportion of positive samples between pre- and post-vaccination. Statistical analysis was done using SPSSfor Windows (Version 9.0, SPSS Inc., Chicago, IL). P �0.05 was considered to be statistically significant.
RESULTSPre- and postvaccination meningococcal C PS-
specific IgG and IgA salivary antibody concentrationsand the number of antibody-positive samples are sum-marized in Table 1. There were significant increases inspecific IgG antibody concentrations postvaccinationcompared with prevaccination concentrations in bothvaccinated groups (both P � 0.001), but no change inthe control group. There were no significant increasesin specific IgA postvaccination geometric mean concen-trations in either the vaccine or the control groups. Thenumber of IgA positives postvaccination increasedslightly in the Wyeth vaccine group vs. controls (P �0.05; Table 1).
The specific IgG and IgA antibody concentrations didnot differ between those receiving the pilot and manu-facturing lots of the Wyeth vaccine (data not shown).
DISCUSSIONThe development of MenC conjugate vaccines has
used the same technology as the highly successfulprotein-polysaccharide Hib conjugate vaccines. Conju-gation of the polysaccharide to a protein carrierswitches the immune responses to the polysaccharideantigen from T cell-independent to T cell-dependent,16
which results in an effective primary immune responsein all age groups, including infants. Hib infection isnow rarely seen in the UK and its disappearance afterthe introduction of universal primary immunization in1992 was more rapid than expected. This appears tohave been a result of the induction of significantmucosal immunity and thus herd immunity throughreduction in upper respiratory carriage rates.17, 18
There is evidence that this mucosal immunity mayhave resulted from induction of significant antibodyresponses and that salivary IgG may be important aswell as IgA.18
It has been suggested that antibody responses to im-munization with polysaccharide vaccines depend on anumber of factors including age, vaccine dose and doseregimen and the degree of preexisting natural immuni-ty.19, 20 Different polysaccharide vaccines including me-ningococcal A and C and pneumococcal polysaccharidehave resulted in dramatic reductions in disease incidenceand, it is suggested, in herd immunity.21, 22 Reduction innasopharyngeal carriage after polysaccharide vaccina-tion has also been reported.2, 23–25 Mucosal IgA and IgGcould be important in these effects, but the mechanismsby which these mucosal antibodies reduce carriage are
Vol. 21, No. 3, March, 2002 211THE PEDIATRIC INFECTIOUS DISEASE JOURNAL
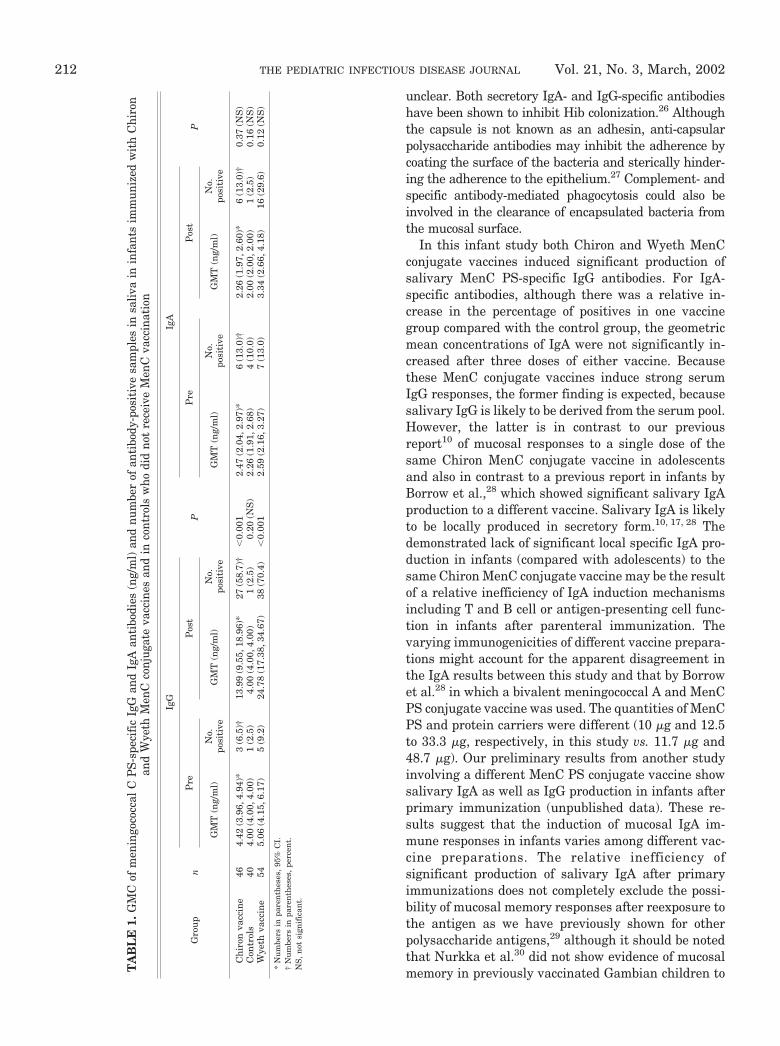
unclear. Both secretory IgA- and IgG-specific antibodieshave been shown to inhibit Hib colonization.26 Althoughthe capsule is not known as an adhesin, anti-capsularpolysaccharide antibodies may inhibit the adherence bycoating the surface of the bacteria and sterically hinder-ing the adherence to the epithelium.27 Complement- andspecific antibody-mediated phagocytosis could also beinvolved in the clearance of encapsulated bacteria fromthe mucosal surface.
In this infant study both Chiron and Wyeth MenCconjugate vaccines induced significant production ofsalivary MenC PS-specific IgG antibodies. For IgA-specific antibodies, although there was a relative in-crease in the percentage of positives in one vaccinegroup compared with the control group, the geometricmean concentrations of IgA were not significantly in-creased after three doses of either vaccine. Becausethese MenC conjugate vaccines induce strong serumIgG responses, the former finding is expected, becausesalivary IgG is likely to be derived from the serum pool.However, the latter is in contrast to our previousreport10 of mucosal responses to a single dose of thesame Chiron MenC conjugate vaccine in adolescentsand also in contrast to a previous report in infants byBorrow et al.,28 which showed significant salivary IgAproduction to a different vaccine. Salivary IgA is likelyto be locally produced in secretory form.10, 17, 28 Thedemonstrated lack of significant local specific IgA pro-duction in infants (compared with adolescents) to thesame Chiron MenC conjugate vaccine may be the resultof a relative inefficiency of IgA induction mechanismsincluding T and B cell or antigen-presenting cell func-tion in infants after parenteral immunization. Thevarying immunogenicities of different vaccine prepara-tions might account for the apparent disagreement inthe IgA results between this study and that by Borrowet al.28 in which a bivalent meningococcal A and MenCPS conjugate vaccine was used. The quantities of MenCPS and protein carriers were different (10 �g and 12.5to 33.3 �g, respectively, in this study vs. 11.7 �g and48.7 �g). Our preliminary results from another studyinvolving a different MenC PS conjugate vaccine showsalivary IgA as well as IgG production in infants afterprimary immunization (unpublished data). These re-sults suggest that the induction of mucosal IgA im-mune responses in infants varies among different vac-cine preparations. The relative inefficiency ofsignificant production of salivary IgA after primaryimmunizations does not completely exclude the possi-bility of mucosal memory responses after reexposure tothe antigen as we have previously shown for otherpolysaccharide antigens,29 although it should be notedthat Nurkka et al.30 did not show evidence of mucosalmemory in previously vaccinated Gambian children toT
AB
LE
1.G
MC
ofm
enin
goco
ccal
CP
S-sp
ecif
icIg
Gan
dIg
Aan
tibo
dies
(ng/
ml)
and
num
ber
ofan
tibo
dy-p
osit
ive
sam
ples
insa
liva
inin
fant
sim
mun
ized
wit
hC
hiro
nan
dW
yeth
Men
Cco
njug
ate
vacc
ines
and
inco
ntro
lsw
hodi
dno
tre
ceiv
eM
enC
vacc
inat
ion
Gro
up
n
IgG
P
IgA
PP
reP
ost
Pre
Pos
t
GM
T(n
g/m
l)N
o.po
siti
veG
MT
(ng/
ml)
No.
posi
tive
GM
T(n
g/m
l)N
o.po
siti
veG
MT
(ng/
ml)
No.
posi
tive
Ch
iron
vacc
ine
464.
42(3
.96,
4.94
)*3
(6.5
)†13
.99
(9.5
5,18
.96)
*27
(58.
7)†
�0.
001
2.47
(2.0
4,2.
97)*
6(1
3.0)
†2.
26(1
.97,
2.60
)*6
(13.
0)†
0.37
(NS
)C
ontr
ols
404.
00(4
.00,
4.00
)1
(2.5
)4.
00(4
.00,
4.00
)1
(2.5
)0.
20(N
S)
2.26
(1.9
1,2.
68)
4(1
0.0)
2.00
(2.0
0,2.
00)
1(2
.5)
0.16
(NS
)W
yeth
vacc
ine
545.
06(4
.15,
6.17
)5
(9.2
)24
.78
(17.
38,3
4.67
)38
(70.
4)�
0.00
12.
59(2
.16,
3.27
)7
(13.
0)3.
34(2
.66,
4.18
)16
(29.
6)0.
12(N
S)
*N
um
bers
inpa
ren
thes
es,
95%
CI.
†N
um
bers
inpa
ren
thes
es,
perc
ent.
NS
,n
otsi
gnif
ican
t.
212 Vol. 21, No. 3, March, 2002THE PEDIATRIC INFECTIOUS DISEASE JOURNAL

vaccination with an meningococcal A/C conjugate vac-cine.
The relative importance of mucosal IgA and IgGantibodies in modulating nasopharyngeal carriage ofmeningococcus remains uncertain. The immunologicfunctions of these mucosal antibodies are currentlyunder study.
REFERENCES1. Kaczmarski EB. Meningococcal disease in England and
Wales: 1995. Commun Dis Rep CDR Rev 1997;4:R55–9.2. Gotschlich EC, Goldschneider I, Artenstein MS. Human im-
munity to the meningococcus: V. The effect of immunizationwith meningococcal group C polysaccharide on the carrierstate. J Exp Med 1969;129:1385–95.
3. Granoff DM, Gupta RK, Belshe RB, Anderson EL. Inductionof immunologic refractoriness in adults by meningococcal Cpolysaccharide vaccination. J Infect Dis 1998;178:870–4.
4. MacLennan J, Obaro S, Deeks J, et al. Immune response torevaccination with meningococcal A and C polysaccharides inGambian children following repeated immunisation duringearly childhood. Vaccine 1999;17:3086–93.
5. Richmond P, Kaczmarski E, Borrow R, et al. Meningococcal Cpolysaccharide vaccine induces immunologic hyporesponsive-ness in adults that is overcome by meningococcal C conjugatevaccine. J Infect Dis 2000;181:761–4.
6. Leach A, Twumasi PA, Kumah S, et al. Induction of immu-nologic memory in Gambian children by vaccination in in-fancy with a group A plus group C meningococcal polysaccha-ride-protein conjugate vaccine. J Infect Dis 1997;175:200–4.
7. MacDonald NE, Halperin SA, Law BJ, Forrest B, Danzig LE,Granoff DM. Induction of immunologic memory by conju-gated vs. plain meningococcal C polysaccharide vaccine intoddlers: a randomized controlled trial. JAMA 1998;280:1685–9.
8. Richmond P, Borrow R, Miller E, et al. Meningococcal sero-group C conjugate vaccine is immunogenic in infancy andprimes for memory. J Infect Dis 1999;179:1569–72.
9. MacLennan JM, Shackley F, Heath PT, et al. Safety, immu-nogenicity, and induction of immunologic memory by a sero-group C meningococcal conjugate vaccine in infants: a ran-domized controlled trial. JAMA 2000;283:2795–801.
10. Zhang Q, Choo S, Everard J, Jennings R, Finn A. Mucosalimmune responses to meningococcal group C conjugate andgroup A and C polysaccharide vaccines in adolescents. InfectImmun 2000;68:2692–7.
11. Zhang Q, Lakshman R, Burkinshaw R, et al. Primary andbooster mucosal immune responses to meningococcal group Aand C conjugate and polysaccharide vaccines administered touniversity students in the United Kingdom. Infect Immun2001;69:4337–41.
12. Murphy TV, Pastor P, Medley F, Osterholm MT, Granoff DM.Decreased Haemophilus colonization in children vaccinatedwith Haemophilus influenzae type b conjugate vaccine. J Pe-diatr 1993;122:517–23.
13. Takala AK, Eskola J, Leinonen M, et al. Reduction of oropha-ryngeal carriage of Haemophilus influenzae type b (Hib) inchildren immunized with an Hib conjugate vaccine. J InfectDis 1991;164:982–6.
14. Lakshman R, Jones I, Walker D, et al. Study of safety of anew conjugate meningococcal C vaccine in infants. Arch Dis
Child 2001;85:391–7.15. Bramley JC, Hall T, Finn A, et al. Safety and immunogenicity
of three lots of meningococcal serogroup C conjugate vaccineadministered at two, three and four months of age. Vaccine2001;19:2924–31.
16. Siber GR. Pneumococcal disease: prospects for a new gener-ation of vaccines. Science 1994;265:1385–7.
17. Kauppi M, Eskola J, Kayhty H. Anti-capsular polysaccharideantibody concentrations in saliva after immunization withHaemophilus influenzae type b conjugate vaccines. PediatrInfect Dis J 1995;14:286–94.
18. Kauppi M, Saarinen L, Kayhty H. Anti-capsular polysaccha-ride antibodies reduce nasopharyngeal colonization by Hae-mophilus influenzae type b in infant rats. J Infect Dis1993;167:365–71.
19. Gotschlich EC, Rey M, Triau R, Sparks KJ. Quantitativedetermination of the human immune response to immuniza-tion with meningococcal vaccines. J Clin Invest 1972;51:89–96.
20. Gold R, Lepow ML, Goldschneider I, Draper TL, GotschlichEC. Clinical evaluation of group A and group C meningococ-cal polysaccharide vaccines in infants. J Clin Invest 1975;56:1536–47.
21. Peltola H, Makela PH, Elo O, Pettay O, Renkonen OV,Sivonen A. Vaccination against meningococcal group A dis-ease in Finland 1974–75. Scand J Infect Dis 1976;8:169–74.
22. Salleras L, Dominguez A, Prats G, Parron I, Munoz P.Dramatic decline of serogroup C meningococcal disease inci-dence in Catalonia (Spain) 24 months after a mass vaccina-tion programme of children and young people. J EpidemiolCommun Health 2001;55:283–7.
23. Sivonen A. Effect of Neisseria meningitidis group A polysac-charide vaccine on nasopharyngeal carrier rates. J Infect1981;3:266–72.
24. Devine LF, Pierce WE, Floyd TM, et al. Evaluation of groupC meningococcal polysaccharide vaccine in marine recruits,San Diego, California. Am J Epidemiol 1970;92:25–32.
25. Stroffolini T, Angelini L, Galanti I, Occhionero M, CongiuME, Mastrantonio P. The effect of meningococcal group A andC polysaccharide vaccine on nasopharyngeal carrier state.Microbiologica 1990;13:225–9.
26. Kauppi-Korkeila M, van Alphen L, Madore D, Saarinen L,Kayhty H. Mechanism of antibody-mediated reduction ofnasopharyngeal colonization by Haemophilus influenzae typeb studied in an infant rat model. J Infect Dis 1996;174:1337–40.
27. van Alphen L, Eijk P, Kayhty H, van Marle J, Dankert J.Antibodies to Haemophilus influenzae type b polysaccharideaffect bacterial adherence and multiplication. Infect Immun1996;64:995–1001.
28. Borrow R, Fox AJ, Cartwright K, Begg NT, Jones DM.Salivary antibodies following parenteral immunization ofinfants with a meningococcal serogroup A and C conjugatedvaccine. Epidemiol Infect 1999;123:201–8.
29. Choo S, Zhang Q, Seymour L, Akhtar S, Finn A. Primary andbooster salivary antibody responses to a 7-valent pneumococ-cal conjugate vaccine in infants. J Infect Dis 2000;182:1260–3.
30. Nurkka A, MacLennan J, Jantti V, Obaro S, Greenwood B,Kayhty H. Salivary antibody response to vaccination withmeningococcal A/C polysaccharide vaccine in previously vac-cinated and unvaccinated Gambian children. Vaccine 2000;19:547–56.
Vol. 21, No. 3, March, 2002 213THE PEDIATRIC INFECTIOUS DISEASE JOURNAL


![[Session: Detection and Diagnostics] Improved Diagnostic Tests for Avian Influenza Surveillance](https://static.fdokumen.com/doc/165x107/631244f28f84754bd30a49f3/session-detection-and-diagnostics-improved-diagnostic-tests-for-avian-influenza.jpg)