Evaluation of Computed Tomography Scan Resolution Power in Detecting Chest Nodules Using Tissue...
9
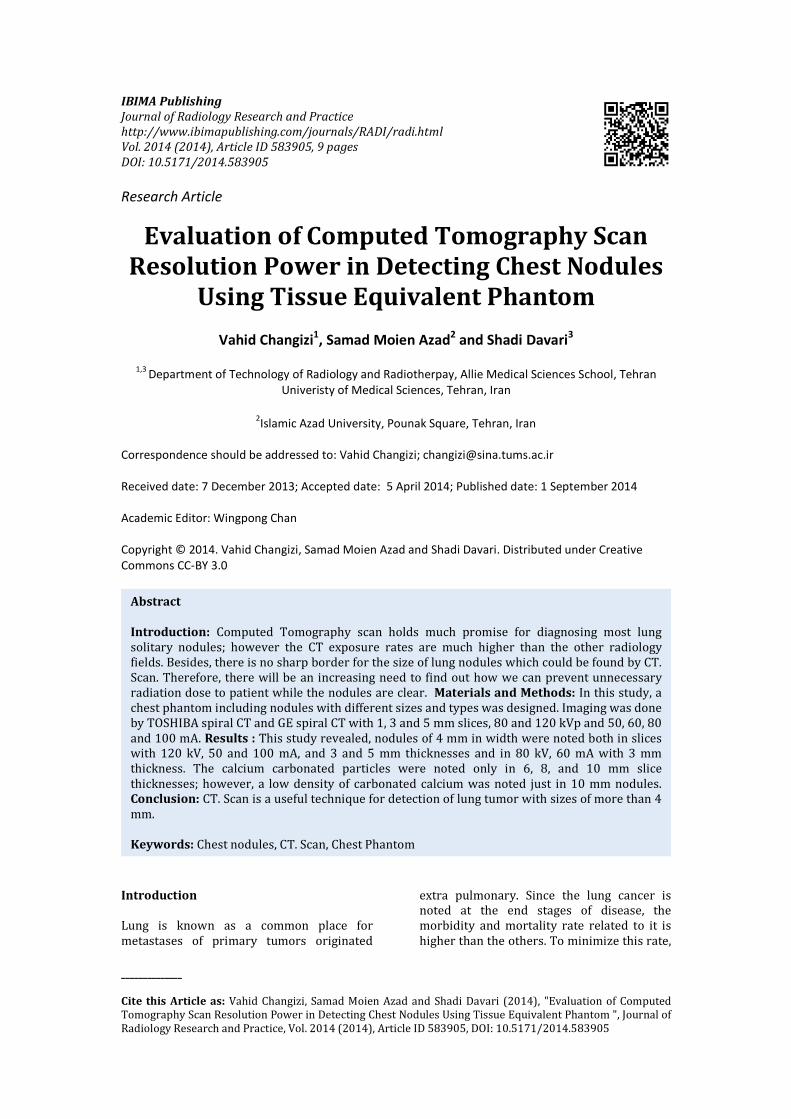
IBIMA Publishing Journal of Radiology Research and Practice http://www.ibimapublishing.com/journals/RADI/radi.html Vol. 2014 (2014), Article ID 583905, 9 pages DOI: 10.5171/2014.583905 ______________ Cite this Article as: Vahid Changizi, Samad Moien Azad and Shadi Davari (2014), "Evaluation of Computed Tomography Scan Resolution Power in Detecting Chest Nodules Using Tissue Equivalent Phantom ", Journal of Radiology Research and Practice, Vol. 2014 (2014), Article ID 583905, DOI: 10.5171/2014.583905 Research Article Evaluation of Computed Tomography Scan Resolution Power in Detecting Chest Nodules Using Tissue Equivalent Phantom Vahid Changizi 1 , Samad Moien Azad 2 and Shadi Davari 3 1,3 Department of Technology of Radiology and Radiotherpay, Allie Medical Sciences School, Tehran Univeristy of Medical Sciences, Tehran, Iran 2 Islamic Azad University, Pounak Square, Tehran, Iran Correspondence should be addressed to: Vahid Changizi; [email protected] Received date: 7 December 2013; Accepted date: 5 April 2014; Published date: 1 September 2014 Academic Editor: Wingpong Chan Copyright © 2014. Vahid Changizi, Samad Moien Azad and Shadi Davari. Distributed under Creative Commons CC-BY 3.0 Introduction Lung is known as a common place for metastases of primary tumors originated extra pulmonary. Since the lung cancer is noted at the end stages of disease, the morbidity and mortality rate related to it is higher than the others. To minimize this rate, Abstract Introduction: Computed Tomography scan holds much promise for diagnosing most lung solitary nodules; however the CT exposure rates are much higher than the other radiology fields. Besides, there is no sharp border for the size of lung nodules which could be found by CT. Scan. Therefore, there will be an increasing need to find out how we can prevent unnecessary radiation dose to patient while the nodules are clear. Materials and Methods: In this study, a chest phantom including nodules with different sizes and types was designed. Imaging was done by TOSHIBA spiral CT and GE spiral CT with 1, 3 and 5 mm slices, 80 and 120 kVp and 50, 60, 80 and 100 mA. Results : This study revealed, nodules of 4 mm in width were noted both in slices with 120 kV, 50 and 100 mA, and 3 and 5 mm thicknesses and in 80 kV, 60 mA with 3 mm thickness. The calcium carbonated particles were noted only in 6, 8, and 10 mm slice thicknesses; however, a low density of carbonated calcium was noted just in 10 mm nodules. Conclusion: CT. Scan is a useful technique for detection of lung tumor with sizes of more than 4 mm. Keywords: Chest nodules, CT. Scan, Chest Phantom
Transcript of Evaluation of Computed Tomography Scan Resolution Power in Detecting Chest Nodules Using Tissue...
IBIMA Publishing
Journal of Radiology Research and Practice
http://www.ibimapublishing.com/journals/RADI/radi.html
Vol. 2014 (2014), Article ID 583905, 9 pages
DOI: 10.5171/2014.583905
______________
Cite this Article as: Vahid Changizi, Samad Moien Azad and Shadi Davari (2014), "Evaluation of Computed
Tomography Scan Resolution Power in Detecting Chest Nodules Using Tissue Equivalent Phantom ", Journal of
Radiology Research and Practice, Vol. 2014 (2014), Article ID 583905, DOI: 10.5171/2014.583905
Research Article
Evaluation of Computed Tomography Scan
Resolution Power in Detecting Chest Nodules
Using Tissue Equivalent Phantom
Vahid Changizi1, Samad Moien Azad
2 and Shadi Davari
3
1,3
Department of Technology of Radiology and Radiotherpay, Allie Medical Sciences School, Tehran
Univeristy of Medical Sciences, Tehran, Iran
2Islamic Azad University, Pounak Square, Tehran, Iran
Correspondence should be addressed to: Vahid Changizi; [email protected]
Received date: 7 December 2013; Accepted date: 5 April 2014; Published date: 1 September 2014
Academic Editor: Wingpong Chan
Copyright © 2014. Vahid Changizi, Samad Moien Azad and Shadi Davari. Distributed under Creative
Commons CC-BY 3.0
Introduction
Lung is known as a common place for
metastases of primary tumors originated
extra pulmonary. Since the lung cancer is
noted at the end stages of disease, the
morbidity and mortality rate related to it is
higher than the others. To minimize this rate,
Abstract
Introduction: Computed Tomography scan holds much promise for diagnosing most lung
solitary nodules; however the CT exposure rates are much higher than the other radiology
fields. Besides, there is no sharp border for the size of lung nodules which could be found by CT.
Scan. Therefore, there will be an increasing need to find out how we can prevent unnecessary
radiation dose to patient while the nodules are clear. Materials and Methods: In this study, a
chest phantom including nodules with different sizes and types was designed. Imaging was done
by TOSHIBA spiral CT and GE spiral CT with 1, 3 and 5 mm slices, 80 and 120 kVp and 50, 60, 80
and 100 mA. Results : This study revealed, nodules of 4 mm in width were noted both in slices
with 120 kV, 50 and 100 mA, and 3 and 5 mm thicknesses and in 80 kV, 60 mA with 3 mm
thickness. The calcium carbonated particles were noted only in 6, 8, and 10 mm slice
thicknesses; however, a low density of carbonated calcium was noted just in 10 mm nodules.
Conclusion: CT. Scan is a useful technique for detection of lung tumor with sizes of more than 4
mm.
Keywords: Chest nodules, CT. Scan, Chest Phantom
Journal of Radiology Research and Practice 2
__________________________________________________________________________________________________________________
______________
Vahid Changizi, Samad Moien Azad and Shadi Davari (2014), Journal of Radiology Research and Practice,
DOI: 10.5171/2014.583905
early diagnosis of lung solitary nodules
before spreading metastases to lymph nodes
and other organs is of importance. Although
chest x-ray makes these solitary nodules be
detected, the noise based pitfalls play the
barrier role [1].
The lung nodule is a small round mass which
enlarges intrapulmonary and can be noted by
the physician on a chest x-ray or CT. Scan
images. These nodules are smaller than a
green pea or as big as a golf ball or even
bigger. Mostly they are detected while the
patient is being examined for other reasons
(e.g. chest x-ray for pneumonia). Using the
chest x-ray and lung CT.Scan images, the
physician observes the lung solitary nodules,
then follows the enlargement through the
sequential imaging in 3, 6 or 12 months later
and diagnoses the probability of malignancy.
About 500 CT. Scan cases of 60000 for the
children less than 15 years old caused cancer
in USA (2). Since benign nodules with
diameter of less than 5 mm could change to
malignant ones, diagnosis of lung nodules is
of importance through chest x-ray. Based on
the BEIR health ministry report (2005), even
low radiation exposure can increase cancer
or other genetic disorders risk especially in
children. Therefore, minimizing exposure has
been recommended. However, dose rate has
inverse relationship on image noise. The
increment of image noise could degrade
nodules diagnosis [2]. CT. Scan has a
reasonable contrast resolution for referring
patients with lung nodules indication.
However, it delivers high radiation exposure
to patient. Dose reduction along with
obtaining an acceptable CT image quality
could be done by applying:
Shortening the total exposure time
mA and kV parameters compensation [3].
In recent years some studies have been done
using low doses of exposure which lead to
the low image qualities (4). However, there is
no definite information about how sizes of
nodules could be revealed with CT. Scan. It is
important to study since exposures with no
diagnosis information could cause cancer in
patients.
According to the above concerns, we decided
to make a lung equivalent tissue including
nodules with different sizes and types to
evaluate CT. Scan method for detecting chest
nodules and to prevent useless exposures
and repetitious observations.
Materials and Methods
In this study, a phantom was designed on the
basis of chest phantoms recommended by
Capintec, INC including 4, 2.54*25*25 cm3
transparent acrylic planes and one 0.2*25*25
mm3 pure aluminum 110 plane and a
0.1*25*25 mm3 pure aluminum 1100 plane.
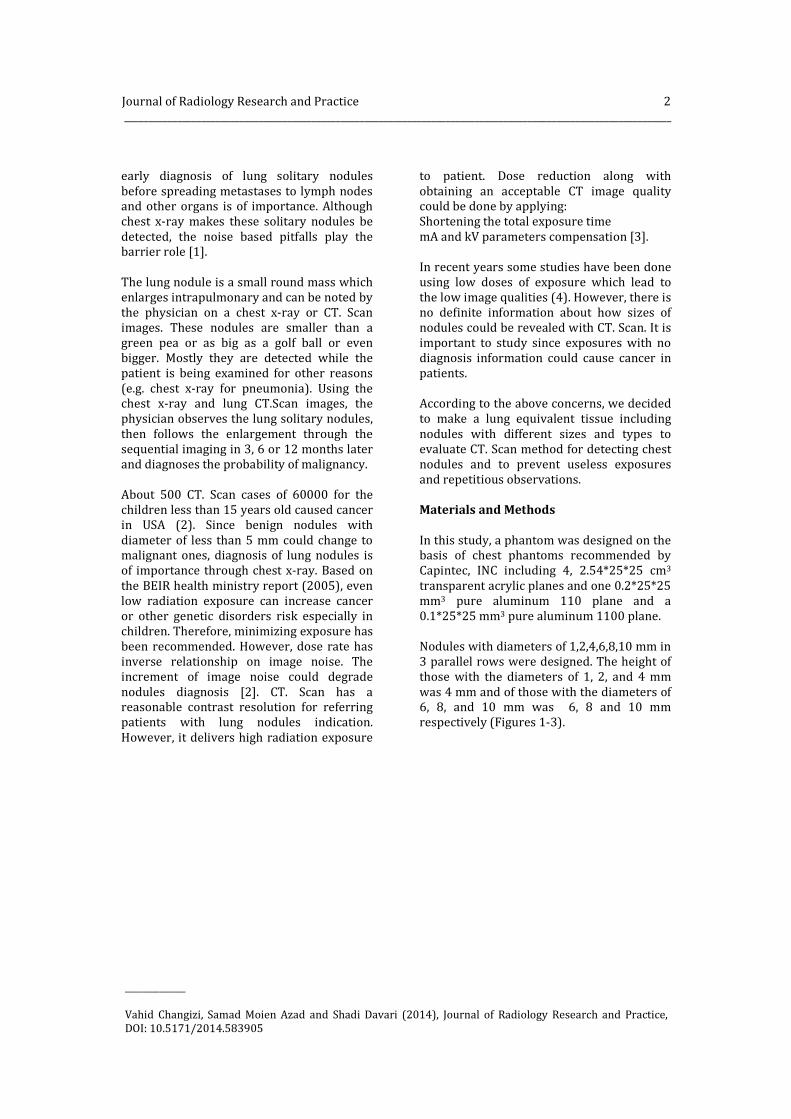
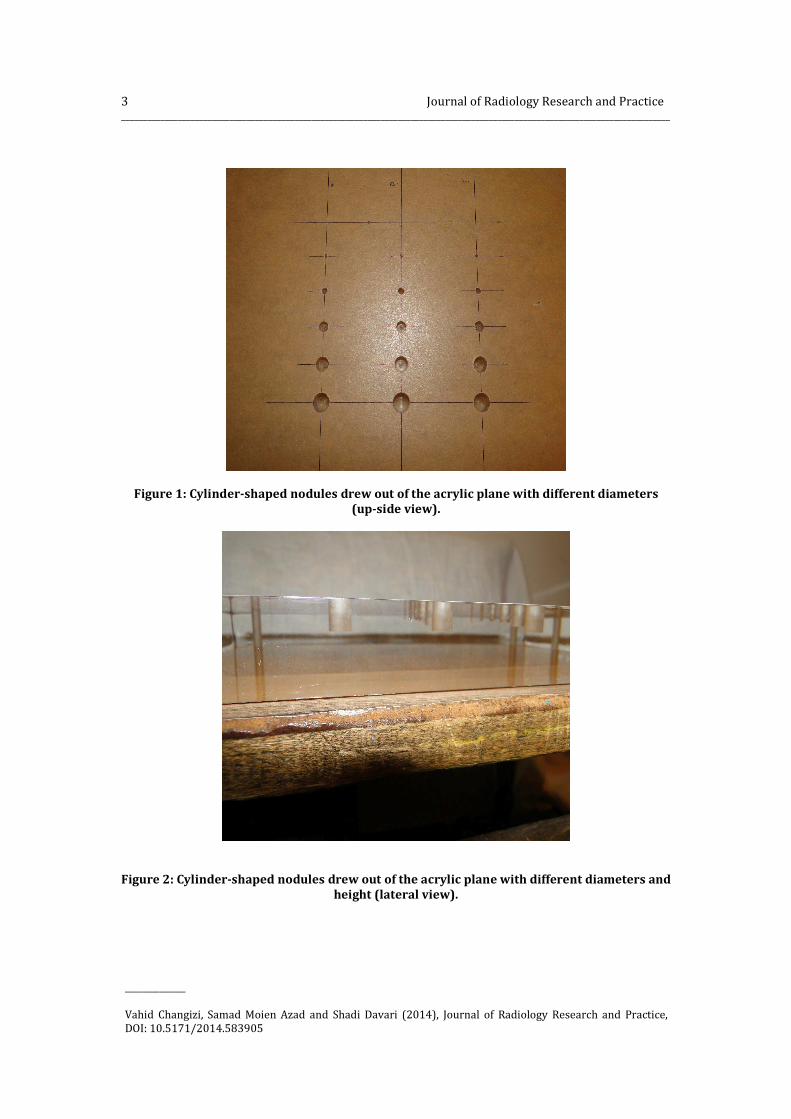
Nodules with diameters of 1,2,4,6,8,10 mm in
3 parallel rows were designed. The height of
those with the diameters of 1, 2, and 4 mm
was 4 mm and of those with the diameters of
6, 8, and 10 mm was 6, 8 and 10 mm
respectively (Figures 1-3).
3 Journal of Radiology Research and Practice _______________________________________________________________________________________________________________________________
______________
Vahid Changizi, Samad Moien Azad and Shadi Davari (2014), Journal of Radiology Research and Practice,
DOI: 10.5171/2014.583905
Figure 1: Cylinder-shaped nodules drew out of the acrylic plane with different diameters
(up-side view).
Figure 2: Cylinder-shaped nodules drew out of the acrylic plane with different diameters and
height (lateral view).
Journal of Radiology Research and Practice 4
__________________________________________________________________________________________________________________
______________
Vahid Changizi, Samad Moien Azad and Shadi Davari (2014), Journal of Radiology Research and Practice,
DOI: 10.5171/2014.583905
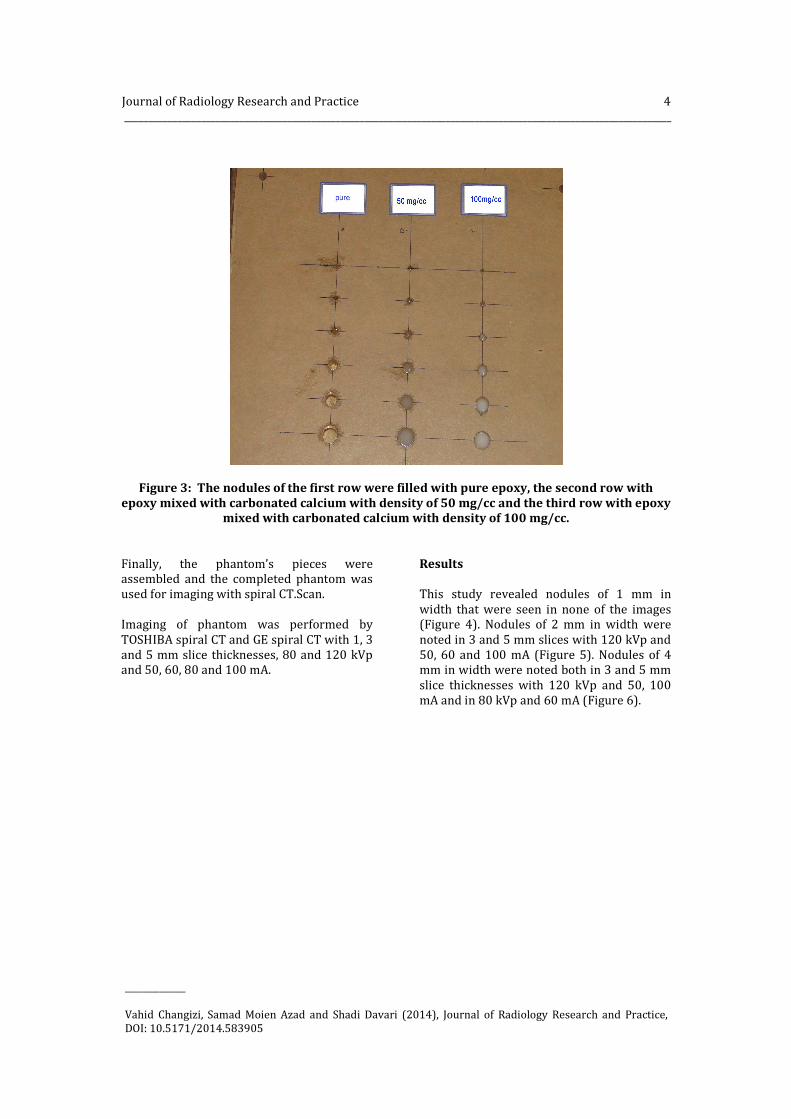
Figure 3: The nodules of the first row were filled with pure epoxy, the second row with
epoxy mixed with carbonated calcium with density of 50 mg/cc and the third row with epoxy
mixed with carbonated calcium with density of 100 mg/cc.
Finally, the phantom’s pieces were
assembled and the completed phantom was
used for imaging with spiral CT.Scan.
Imaging of phantom was performed by
TOSHIBA spiral CT and GE spiral CT with 1, 3
and 5 mm slice thicknesses, 80 and 120 kVp
and 50, 60, 80 and 100 mA.
Results
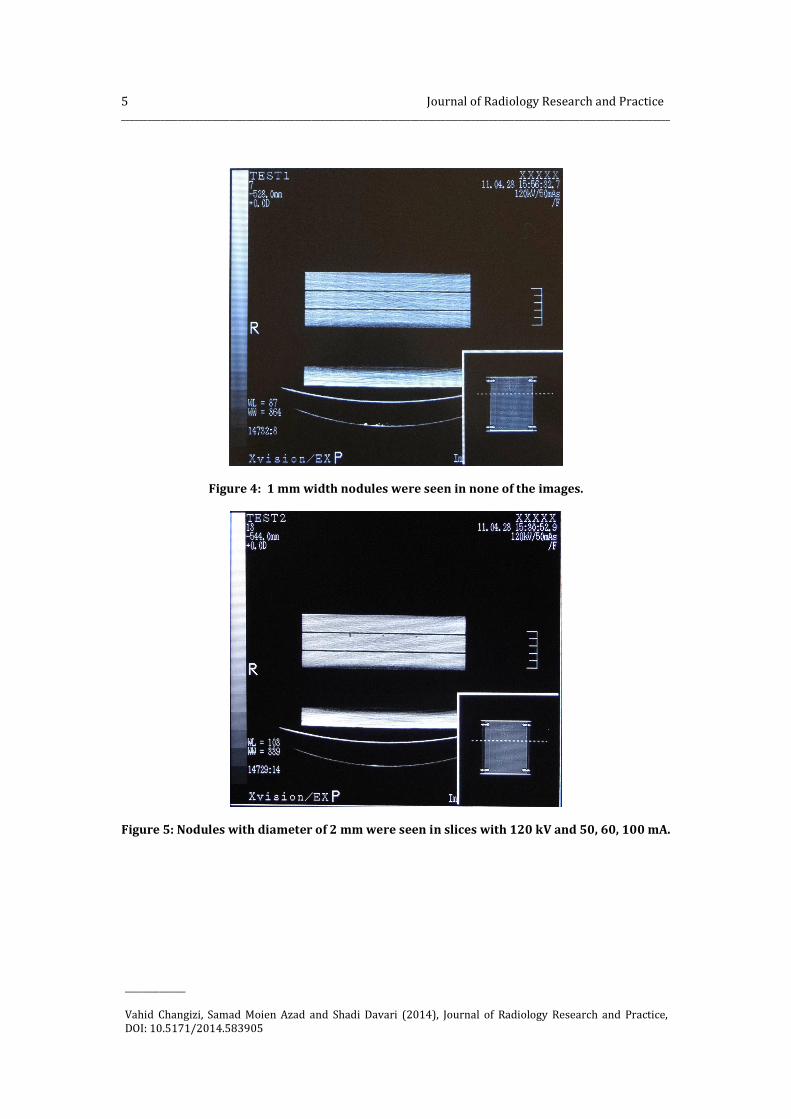
This study revealed nodules of 1 mm in
width that were seen in none of the images
(Figure 4). Nodules of 2 mm in width were
noted in 3 and 5 mm slices with 120 kVp and
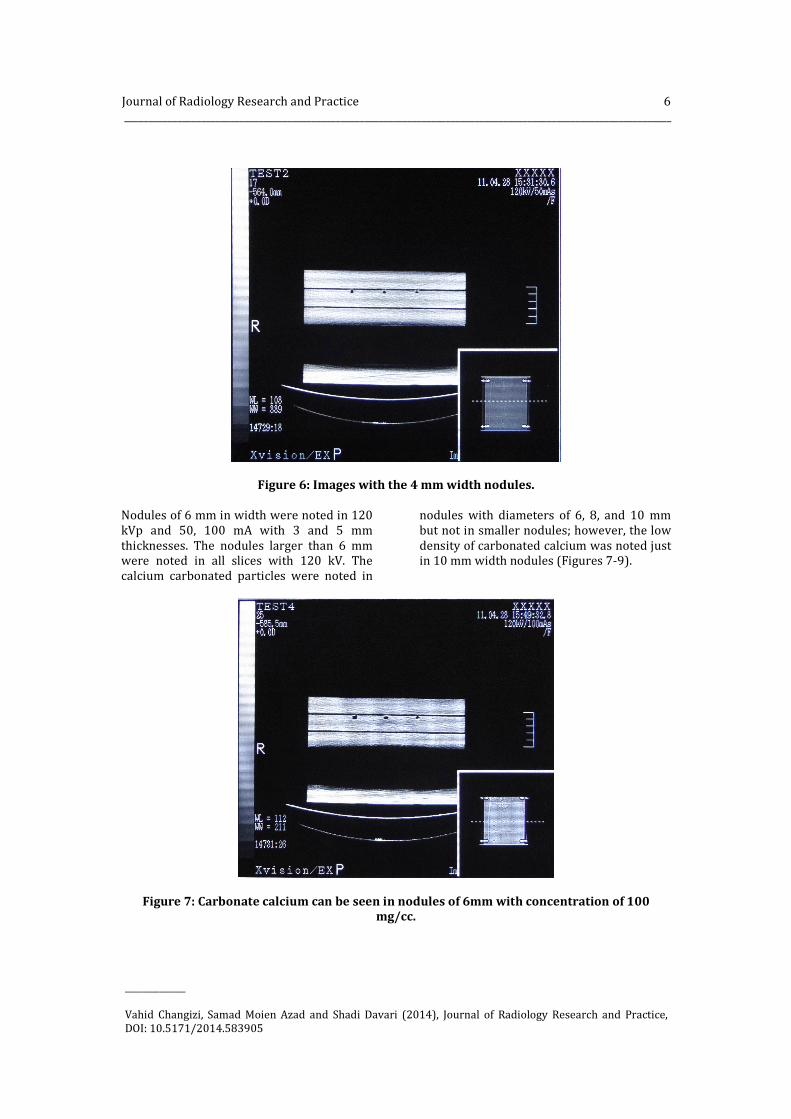
50, 60 and 100 mA (Figure 5). Nodules of 4
mm in width were noted both in 3 and 5 mm
slice thicknesses with 120 kVp and 50, 100
mA and in 80 kVp and 60 mA (Figure 6).
5 Journal of Radiology Research and Practice _______________________________________________________________________________________________________________________________
______________
Vahid Changizi, Samad Moien Azad and Shadi Davari (2014), Journal of Radiology Research and Practice,
DOI: 10.5171/2014.583905
Figure 4: 1 mm width nodules were seen in none of the images.
Figure 5: Nodules with diameter of 2 mm were seen in slices with 120 kV and 50, 60, 100 mA.
Journal of Radiology Research and Practice 6
__________________________________________________________________________________________________________________
______________
Vahid Changizi, Samad Moien Azad and Shadi Davari (2014), Journal of Radiology Research and Practice,
DOI: 10.5171/2014.583905
Figure 6: Images with the 4 mm width nodules.
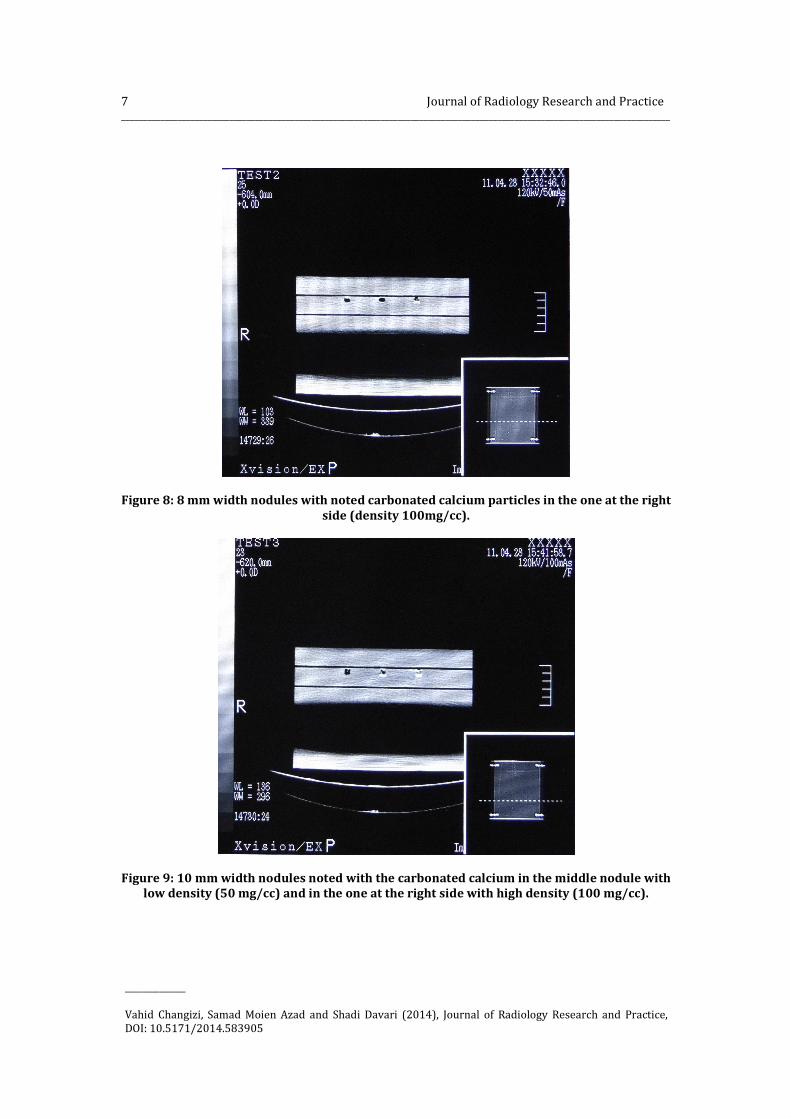
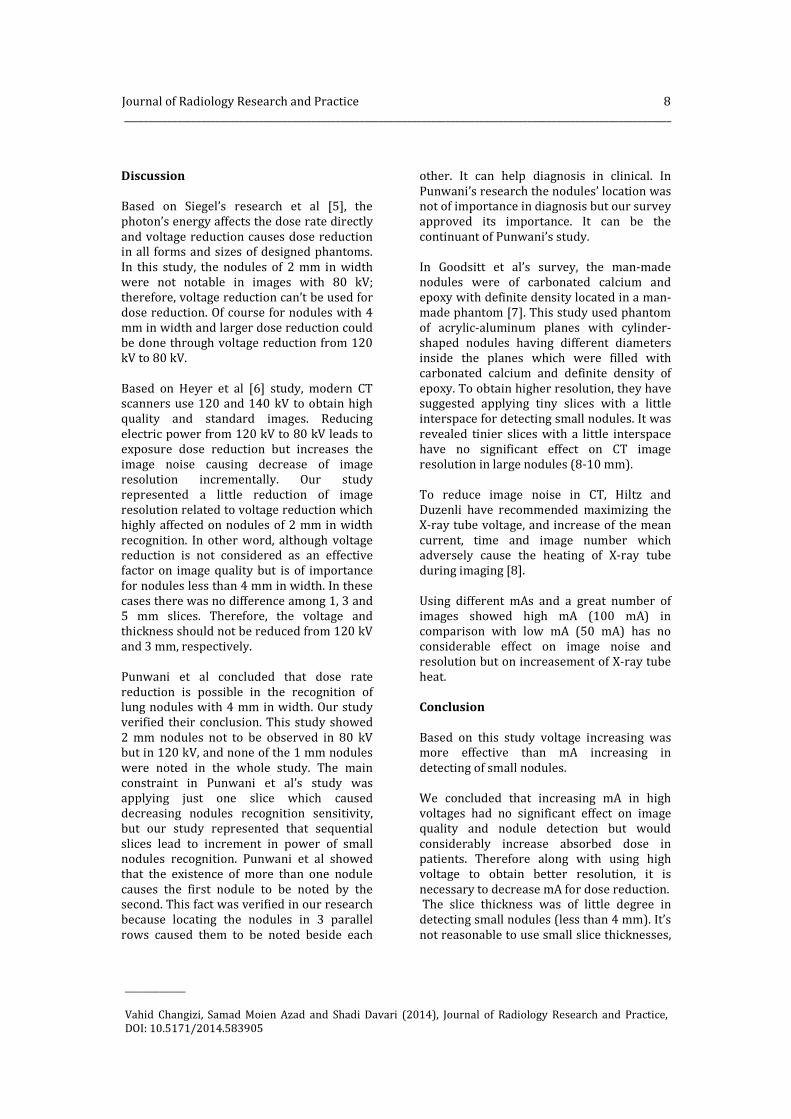
Nodules of 6 mm in width were noted in 120
kVp and 50, 100 mA with 3 and 5 mm
thicknesses. The nodules larger than 6 mm
were noted in all slices with 120 kV. The
calcium carbonated particles were noted in
nodules with diameters of 6, 8, and 10 mm
but not in smaller nodules; however, the low
density of carbonated calcium was noted just
in 10 mm width nodules (Figures 7-9).
Figure 7: Carbonate calcium can be seen in nodules of 6mm with concentration of 100
mg/cc.
7 Journal of Radiology Research and Practice _______________________________________________________________________________________________________________________________
______________
Vahid Changizi, Samad Moien Azad and Shadi Davari (2014), Journal of Radiology Research and Practice,
DOI: 10.5171/2014.583905
Figure 8: 8 mm width nodules with noted carbonated calcium particles in the one at the right
side (density 100mg/cc).
Figure 9: 10 mm width nodules noted with the carbonated calcium in the middle nodule with
low density (50 mg/cc) and in the one at the right side with high density (100 mg/cc).
Journal of Radiology Research and Practice 8
__________________________________________________________________________________________________________________
______________
Vahid Changizi, Samad Moien Azad and Shadi Davari (2014), Journal of Radiology Research and Practice,
DOI: 10.5171/2014.583905
Discussion
Based on Siegel’s research et al [5], the
photon’s energy affects the dose rate directly
and voltage reduction causes dose reduction
in all forms and sizes of designed phantoms.
In this study, the nodules of 2 mm in width
were not notable in images with 80 kV;
therefore, voltage reduction can’t be used for
dose reduction. Of course for nodules with 4
mm in width and larger dose reduction could
be done through voltage reduction from 120
kV to 80 kV.
Based on Heyer et al [6] study, modern CT
scanners use 120 and 140 kV to obtain high
quality and standard images. Reducing
electric power from 120 kV to 80 kV leads to
exposure dose reduction but increases the
image noise causing decrease of image
resolution incrementally. Our study
represented a little reduction of image
resolution related to voltage reduction which
highly affected on nodules of 2 mm in width
recognition. In other word, although voltage
reduction is not considered as an effective
factor on image quality but is of importance
for nodules less than 4 mm in width. In these
cases there was no difference among 1, 3 and
5 mm slices. Therefore, the voltage and
thickness should not be reduced from 120 kV
and 3 mm, respectively.
Punwani et al concluded that dose rate
reduction is possible in the recognition of
lung nodules with 4 mm in width. Our study
verified their conclusion. This study showed
2 mm nodules not to be observed in 80 kV
but in 120 kV, and none of the 1 mm nodules
were noted in the whole study. The main
constraint in Punwani et al’s study was
applying just one slice which caused
decreasing nodules recognition sensitivity,
but our study represented that sequential
slices lead to increment in power of small
nodules recognition. Punwani et al showed
that the existence of more than one nodule
causes the first nodule to be noted by the
second. This fact was verified in our research
because locating the nodules in 3 parallel
rows caused them to be noted beside each
other. It can help diagnosis in clinical. In
Punwani’s research the nodules’ location was
not of importance in diagnosis but our survey
approved its importance. It can be the
continuant of Punwani’s study.
In Goodsitt et al’s survey, the man-made
nodules were of carbonated calcium and
epoxy with definite density located in a man-
made phantom [7]. This study used phantom
of acrylic-aluminum planes with cylinder-
shaped nodules having different diameters
inside the planes which were filled with
carbonated calcium and definite density of
epoxy. To obtain higher resolution, they have
suggested applying tiny slices with a little
interspace for detecting small nodules. It was
revealed tinier slices with a little interspace
have no significant effect on CT image
resolution in large nodules (8-10 mm).
To reduce image noise in CT, Hiltz and
Duzenli have recommended maximizing the
X-ray tube voltage, and increase of the mean
current, time and image number which
adversely cause the heating of X-ray tube
during imaging [8].
Using different mAs and a great number of
images showed high mA (100 mA) in
comparison with low mA (50 mA) has no
considerable effect on image noise and
resolution but on increasement of X-ray tube
heat.
Conclusion
Based on this study voltage increasing was
more effective than mA increasing in
detecting of small nodules.
We concluded that increasing mA in high
voltages had no significant effect on image
quality and nodule detection but would
considerably increase absorbed dose in
patients. Therefore along with using high
voltage to obtain better resolution, it is
necessary to decrease mA for dose reduction.
The slice thickness was of little degree in
detecting small nodules (less than 4 mm). It’s
not reasonable to use small slice thicknesses,
9 Journal of Radiology Research and Practice _______________________________________________________________________________________________________________________________
______________
Vahid Changizi, Samad Moien Azad and Shadi Davari (2014), Journal of Radiology Research and Practice,
DOI: 10.5171/2014.583905
since it will be along with increasing patient
dose to get a qualified image.
We observed that small calcified nodules
(smaller than 4 mm) are not detectable in
different kV and mA, and carbonated calcium
is noted just in 6 mm nodules or the larger
ones. Identifying the density of carbonated
calcium depends on the nodule size because
high densities of carbonated calcium are
noted in 6-8 mm nodules but the 10 mm
nodules show different densities.
Acknowledgment
This project has been supported by Tehran
University of Medical Sciences
References
1. Samei, E., Stanton, A., Stebbins SA,
Dobbins, JT.and Lo, JY. (2007),
‘Multiprojection Correlation Imaging for
Improved Detection of Pulmonary Nodules,’
AJR 188, 1239-1245.
2. Punwani, S., Zhang, J., Wareen, D.,
Greenhalgh, R.and Humphries, P. (2008),
‘Paediatric CT: The Effects of Increasing
Image Noiseon Pulmonary Nodule Detection,’
Pediatr Radiol38,192-201.
3. Li, T., Li, X., Wang, J., Wen, J., Lu, H., Hsieh,
J. and Liang, Z. (2004),’Nonlinear Sinogram
Smoothing for Low Dose X-Ray CT,’ IEEE
Transactions on Nuclear Science 51, 2505-
2513.
4. Imai, K., Ikeda, M., Wada, S., Enchi, Y.and
Niimi, T. (2007),’Analysis of Streak Artefacts
on CT Images Using Statistics of Extrems,’
The British Jornal of Radiology 80, 911-918.
5. Siegel, M., Schmidt, B., Bradley, D., Suess,
C.and Hildebolt, C. (2004),’Radiation Dose
and Imaging Quality in Pediatric CT: Effect of
Technical Factors and Phantom Size and
Shape,’ Radiology 233, 515-522.
6. Heyer, CM., Mohr, PS., Lemburg, SP.
Peter, SA.and Volkmar, N. (2007),’Image
quality and Radiation Exposure at Pulmonary
CT Angiography with 100 or 120 kVp
Protocol:Prospective Randomized Study,’
Radiology 245, 577-583.
7. Goodsitt, MM., Chan, HP., Way, TM.,
Larson, SC., Christodoulou, EG.and Kim, J.
(2006),’Accuracy of the CT Numbers of
Simulated Lung Nodules Imaged with Multi –
Detector CT Scanners,’ NIH public Access-
Med Phys 33, 3006-3017.
8. Hilts, M.and Duzenli, C. (2004),’Image
Noise in X-ray CT Polymer Gel Dosimetry,’
Journal of Physics Conference Series 3, 252-
256.