Evaluation of Aircraft Boarding Scenarios Considering ... - MDPI
20
Article Evaluation of Aircraft Boarding Scenarios Considering Reduced Transmissions Risks Michael Schultz 1, * ,† and Jörg Fuchte 2,† 1 Institute of Logistics and Aviation, Dresden University of Technology, 01069 Dresden, Germany 2 Diehl Aviation, 21129 Hamburg, Germany; [email protected] * Correspondence: [email protected] † These authors contributed equally to this work. Received: 3 June 2020; Accepted: 24 June 2020; Published: 1 July 2020 Abstract: Air travel appears as particularly hazardous in a pandemic situation, since infected people can travel worldwide and could cause new breakouts in remote locations. The confined space conditions in the aircraft cabin necessitate a small physical distance between passengers and hence may boost virus transmissions. In our contribution, we implemented a transmission model in a virtual aircraft environment to evaluate the individual interactions between passengers during aircraft boarding and deboarding. Since no data for the transmission is currently available, we reasonably calibrated our model using a sample case from 2003. The simulation results show that standard boarding procedures create a substantial number of possible transmissions if a contagious passenger is present. The introduction of physical distances between passengers decreases the number of possible transmissions by approx. 75% for random boarding sequences, and could further decreased by more strict reduction of hand luggage items (less time for storage, compartment space is always available). If a second door is used for boarding and deboarding, the standard boarding times could be reached. Individual boarding strategies (by seat) could reduce the transmission potential to a minimum, but demand for complex pre-sorting of passengers. Our results also exhibit that deboarding consists of the highest transmission potential and only minor benefits from distance rules and hand luggage regulations. Keywords: passenger boarding; aircraft cabin; airport operations; transmission scenarios 1. Introduction The world is engulfed in a pandemic of the new coronavirus SARS-CoV2 and the respiratory illness COVID-19 it causes. The virus was first identified in Wuhan, China, and in three months spread throughout the entire world. To reduce the spread of the virus and prevent overload of local health systems, most nations have introduced measures such as physical distancing, movement restrictions, and temporary lockdown of both business and social activities. The global airline industry has been hit particularly hard by the pandemic. Revenue passenger kilometers have temporarily dropped by more than 90% in some regions and are only slowly recovering. Overall, the International Civil Aviation Organization (ICAO) expects an unprecedented drop in passenger demand and a crisis in the industry unseen before [1]. Air travel should be considered critical, as this globally well-connected transport network could be part of new transmission chains to remote locations. The confined space conditions inside the aircraft require a small physical distance between passengers and may, therefore, encourage virus transmission. Current research and studies indicate that there is only a low probability of transmission in aircraft, but also point out that activities before and after the flight could also contribute significantly to the spread of disease. Sustainability 2020, 12, 5329; doi:10.3390/su12135329 www.mdpi.com/journal/sustainability
-
Upload
khangminh22 -
Category
Documents
-
view
3 -
download
0
Transcript of Evaluation of Aircraft Boarding Scenarios Considering ... - MDPI
Article
Evaluation of Aircraft Boarding ScenariosConsidering Reduced Transmissions Risks
Michael Schultz 1,*,† and Jörg Fuchte 2,†
1 Institute of Logistics and Aviation, Dresden University of Technology, 01069 Dresden, Germany2 Diehl Aviation, 21129 Hamburg, Germany; [email protected]* Correspondence: [email protected]† These authors contributed equally to this work.
Received: 3 June 2020; Accepted: 24 June 2020; Published: 1 July 2020�����������������
Abstract: Air travel appears as particularly hazardous in a pandemic situation, since infected peoplecan travel worldwide and could cause new breakouts in remote locations. The confined spaceconditions in the aircraft cabin necessitate a small physical distance between passengers and hencemay boost virus transmissions. In our contribution, we implemented a transmission model in avirtual aircraft environment to evaluate the individual interactions between passengers during aircraftboarding and deboarding. Since no data for the transmission is currently available, we reasonablycalibrated our model using a sample case from 2003. The simulation results show that standardboarding procedures create a substantial number of possible transmissions if a contagious passengeris present. The introduction of physical distances between passengers decreases the number ofpossible transmissions by approx. 75% for random boarding sequences, and could further decreasedby more strict reduction of hand luggage items (less time for storage, compartment space is alwaysavailable). If a second door is used for boarding and deboarding, the standard boarding timescould be reached. Individual boarding strategies (by seat) could reduce the transmission potentialto a minimum, but demand for complex pre-sorting of passengers. Our results also exhibit thatdeboarding consists of the highest transmission potential and only minor benefits from distance rulesand hand luggage regulations.
Keywords: passenger boarding; aircraft cabin; airport operations; transmission scenarios
1. Introduction
The world is engulfed in a pandemic of the new coronavirus SARS-CoV2 and the respiratoryillness COVID-19 it causes. The virus was first identified in Wuhan, China, and in three months spreadthroughout the entire world. To reduce the spread of the virus and prevent overload of local healthsystems, most nations have introduced measures such as physical distancing, movement restrictions,and temporary lockdown of both business and social activities. The global airline industry has beenhit particularly hard by the pandemic. Revenue passenger kilometers have temporarily droppedby more than 90% in some regions and are only slowly recovering. Overall, the International CivilAviation Organization (ICAO) expects an unprecedented drop in passenger demand and a crisis in theindustry unseen before [1]. Air travel should be considered critical, as this globally well-connectedtransport network could be part of new transmission chains to remote locations. The confined spaceconditions inside the aircraft require a small physical distance between passengers and may, therefore,encourage virus transmission. Current research and studies indicate that there is only a low probabilityof transmission in aircraft, but also point out that activities before and after the flight could alsocontribute significantly to the spread of disease.
Sustainability 2020, 12, 5329; doi:10.3390/su12135329 www.mdpi.com/journal/sustainability

Sustainability 2020, 12, 5329 2 of 20
Unlike the first coronavirus now referred to as SARS-CoV1, the new coronavirus SARS-CoV2cannot be annihilated any more. With more than 5 million confirmed infections worldwide at theend of May 2020 and probably a three to tenfold higher number of unaccounted infected, completeextinction of the virus is unlikely until a vaccination exists. Most affected nations have introducedmeasures to control the spread and minimize the number of new infections. These measures areprimarily aimed at increasing the distance between people so that the virus cannot be transmitted.Most governments have advocated a strategy of maximum containment until either a vaccine isavailable or an effective medication is available to prevent a large number of seriously sick peoplefrom overburdening the local health system. A particular feature of SARS-CoV2 and COVID-19 isthat infected persons become contagious before they develop the first symptoms [2]. The isolationof apparently sick people (e.g., by measuring their body temperature) therefore does not sufficientlyreduce the spread. Early analyses have shown that about half of the infections occur before the infectedperson develops symptoms. Another difficulty is that many people do not develop any symptoms atall, but are still highly contagious [3]. Also, an effective containment strategy must be pursued for atleast one month, which will have a significant negative impact on (inter-) national economies if thisstrategy has to be continued in the longer term.
We assume in our contribution that air travel will be re-established between regions that havea sufficiently controlled situation with a low number of new infections. These regions will acceptpassengers from other equally affected regions if two main conditions can be met (a) prevent as far astechnically possible the transport of infected people to prevent the start of new transmission chainsat their destination, and (b) minimize the risk that undetected infected persons transmit the virus toother passengers during the travel and by that have “super-spreading” event with multiple infectionchains starting from a particular flight. The first condition can be met by looking for symptoms likecough or fever and denying access to these affected passengers. This reduces the probability of havinginfected people on board but does not fully eliminate it. A further step can be the use of contacttracking technologies, as already introduced in some Asian countries (especially in China), to identifypossible transmission chains in advance. The safest measure would be the actual testing of passengersbefore each flight. Current laboratory test methods based on polymerase chain reaction (PCR) requireroughly 4 to 6 hrs for processing if the (logistic) process is optimized [4]. But the costs for these testsare substantial, Vienna airport offers a test for arriving passengers at 190 EUR (May 2020).
The development of appropriate capacities for rapid, reliable, and cost-effective testing is urgentlyneeded. Currently, there are many rapid tests on the market, but they mainly target antigen andtherefore only indicate whether someone has been exposed to SARS-CoV2 [5]. More affordablePCR-based virus tests are currently under development to provide reliable results within one hour,making them applicable to air travel [6]. If physical distance can be maintained during a flight,the multiple testing of each passenger and the associated costs and time-consuming procedures couldbe avoided. Flying in airplanes has the advantage over other means of transport that passengers canbe tracked down more easily because all passengers are thoroughly registered. When the physicaldistance is required over an entire flight, the capacity of a standard single-aisle aircraft shrinks by 33%when the middle seats are not used, or even more when only every second row is allowed. This wouldprevent airlines from operating flights economically.
1.1. Review of Research on Virus Transmission in Aircraft
SARS-CoV2 is not the first pandemic disease that has confronted the modern world. Aircraft arerelevant for modern pandemics in two ways. First, they have always been identified as relevant fortransporting a disease through the entire world within a matter of days. Second, an aircraft may act asa place of “super spreading”, enabling many transmissions from a single infected person. Both factorscombined mean that air travel during pandemic conditions is risky for containment and restricting airtravel is usually one of the first things done. Nevertheless, travel from the Wuhan region in China is

Sustainability 2020, 12, 5329 3 of 20
likely the way how SARS-CoV2 has arrived in Europe and North America, probably as early as mid tolate January. As the first step a few terms are introduced:
1. Index Case: the first case of an infection chain.2. Secondary Attack Rate: the percentage of people infected out of the number of all contacts.
A measure of how contagious a disease is, different from reproduction number R, which describeshow many people an infected person infects on average.
3. Pre-symptomatic: positively confirmed person, but before developing symptoms.4. Symptomatic: an infected person has apparent illness symptoms like fever, coughing and other5. Asymptomatic: positively confirmed the infected person who does not recognize any symptoms.
An overview study reviewed the knowledge regarding disease spreading in an aircraft [7].The learning is that there is no proven model of how a disease spreads in an aircraft. A comparablevirus is the influenza virus, which is also transmitted via droplets. The study shows that transmissionshave been occurred in both cases seated close to and seated far away from the index case. The mostimportant finding is that the flight event itself is only one possible source of infection, the upstreamand downstream processes (contacts in the airport, boarding and deboarding, baggage collection)could similarly lead to infectious contacts. The cited studies used contact tracing after the flights andthe actual relevant point of contact can usually not be re-enacted. A key technical fact is that cabinair is constantly re-circulated at a high rate [4,7]. The recirculated air passes through High EfficiencyParticulate Air (HEPA) filters that remove above 99.9% of all virus and bacteria attached to droplets(see Figure 1). The assumption is that as long as the environmental control system of the aircraft isrunning in normal mode, the pure physical distance is not the key criterion that matters.
Figure 1. (Left) Air ventilation pattern in a single-aisle cabin, here an Airbus A320. Note that othertypes have similar flow patterns. (Right) High Efficiency Particulate Air (HEPA) filters being removedin an Airbus A380 aircraft from Emirates.
A detailed study on SARS-CoV1 shows how different infection spreads can be [8]. The studylooked at three flights with contagious passengers. On the first flight, no additional infection wasidentified, and only one new infection was reported on the second flight. But on the third flight, 22 newinfections were counted, which could be traced back to the index passenger. In this case, the physicalproximity to the index patient was related to the transmission. This was also indicated by a study,which confirms a higher chance of infection when being seated within 2 rows of the index case [9]and study focusing on inflight transmission of influenza during passenger movements [10]. However,the probability of other passengers still reached about one-third of those being seated within two rows.Thus, as a commonly accepted rule of thumb, each passenger seated two seats and two rows aroundthe index case shall be contacted for disease containment.
A very recent study documented the travel of a symptomatic index case flying a 15 h trip ineconomy class [11]. All 25 passengers being seated within a range of 2 m of the index case werecontacted and closely monitored after the trip. Some of these developed symptoms, however, noneof those were tested positive for SARS-CoV2 (that particular time of the year sees many respiratory

Sustainability 2020, 12, 5329 4 of 20
illnesses). The study specifically mentions the relevance of other shared events before the flight andduring boarding and deboarding. Another study from China reports 11 aircraft transmissions [12].There are no further details provided. Yet another study from France suspected the infection of a patienthappened during a flight. This is not confirmed yet [13]. The IATA in contrast states that 1.100 infectedpeople flying have been traced and no secondary cases have been identified [4]. The probabilityof infection while being seated appears to be rather low, up to being non-existing following someresearch [4]. Contributing factors to this observation are listed in the following.
- The airflow in an aircraft cabin is from above downwards (see Figure 1), reducing the probabilitythat virus-laden air is ingested by other passengers,
- The air in an aircraft cabin is exchanged rather frequently, about 20 times an hour.- The recirculated air is run through HEPA (High Efficiency Particulate Air) filters.- The air is quite dry at cruising altitude, which is problematic for Corona-type viruses.
However, most of these observations are only valid when the ventilation system is running,and some characteristics (like dry air) are only found when the aircraft is in cruise. When standing atthe gate, the cabin ventilation needs to be activated and this generally requires the auxiliary power unitto run. This is usually not desired as it creates lots of environmental impact at the airport (e.g., noise,air pollution), but in times of a pandemic, it might be a sensible operational procedure without toomuch additional cost or other repercussions.
1.2. Passenger Boarding
Comprehensive overviews are provided for aircraft ground operations, passenger boarding,and corresponding economic impact [14–20]. A common goal of simulation-based approaches forpassenger boarding is to minimize boarding time. Thus, the efficiency of different boarding strategieswas focus of the research activities [21–28]. These models are based on cellular automaton or analyticalapproaches, but also other models were developed: mixed integer linear program [29], statisticalmechanics [30], power law rule [31,32], cellular discrete-event system specification [33], stochasticapproach covering individual passenger behavior and aircraft/airline operational constraints [16,26].
The quantity and quality of hand luggage determine the duration of boarding significantly.Thus, research was conducted with a particular focus on the physique of passengers (maximum speed),the quantity of hand luggage, and individually preferred distance [34], seat assigned passengers withregards to hand luggage [28,35–37]. Furthermore, the fact that passengers travel in groups has animpact on the boarding efficiency [16,38]. Other research is aiming at the evaluation of pre-boardingareas [39,40], consideration of passenger expectations [41], use of apron busses [42], real-time seatallocation [43,44]. The aircraft cabin layout and design with regards to their impact of passengerboarding were focused on the following studies: aircraft interior design (seat pitch and passengers perrow) [45], aircraft seating layouts and alternative designs single and twin-aisle configuration [46,47],impact of aircraft cabin modifications [48], novel aircraft configurations and seating concepts [49,50],dynamic change of the cabin infrastructure [51].
Only a few experimental tests were conducted to provide data for the calibration of inputparameters and validation of simulation results, e.g., using a mock Boeing 757 fuselage [52], small-scalelaboratory tests [53], or a field trial configuration to get real operational and passenger data [54].Particular test setups were used to provide data for the time to store hand luggage items in theoverhead compartments [55] or to evaluate passenger perceptions during boarding/deboarding [56].
1.3. Previous Fields of Applications
We use a stochastic, cellular automata approach to model passenger interactions and operationalconstraints in the aircraft cabin. Details of the model are presented in Section 3. This particularmodel was already applied in several fields of scientific and applied research. These fields arenamely the analysis and evaluation of common group dynamic behaviors, the modeling of passenger

Sustainability 2020, 12, 5329 5 of 20
processes at the airport in regular and exceptional conditions, the egress characteristics of railwaycoaches, and evaluation of infrastructural adaptations in the aircraft cabin during passenger boarding.The dedicated model extension with a module for the evaluation of the transmission probability isbuilt upon these previous developments.
Pedestrian flows consist of mainly independent pedestrians possess a more homogeneous densitydistribution and individually higher flexibility to change the speed and the direction of motion,compared to flows consists of pedestrian groups [57]. Data conducted in the field point out thatthe individual movement characteristic of each group member depends on the group constellation(e.g., size, age). This results in a coordinated group movement (e.g., distance keeping, collisionavoidance) and a granular flow structure. Figure 2 depicts the position of individuals on a freeflow (left side) and congested environment (right side). In contrast to the classical V-formation ofbirds, the social interactions of group members lead to a reversed V-formation, where everyone cancommunicate from face to face (not behind one’s back, literally). If the group has to avoid obstacles,the positions of the individuals change, with larger groups tending to split up and come back togetherafter passing.
Figure 2. Position of individuals in groups depends on environmental conditions: free flow (left) andcongestion (right).
The coordinated group movement is often a result of a non-verbal, iterative considerationof observations and anticipated behavior of group members around [57]. Pedestrians becomepassengers in the context of transportation and use corresponding infrastructures and vehiclesto reaching their destinations. The tactical behavior enables (modeled) passengers to act withenvironmental anticipation, including knowledge about processes, infrastructure layout (navigation),and perception/processing of provided information [58–60]. Using the model of visual humanperception and modeling the necessary properties of signage components (see Figure 3) allows for avaluable extension of the operational motion behavior approach.
Figure 3. Navigation in complex environments (airport terminal) under regular operational conditions,such as path finding with limited information.
The model was also applied to non-normal situations (egress) where people cannot draw ontheir experience. This is further complicated by the fact that special procedures usually have to be
Sustainability 2020, 12, 5329 6 of 20
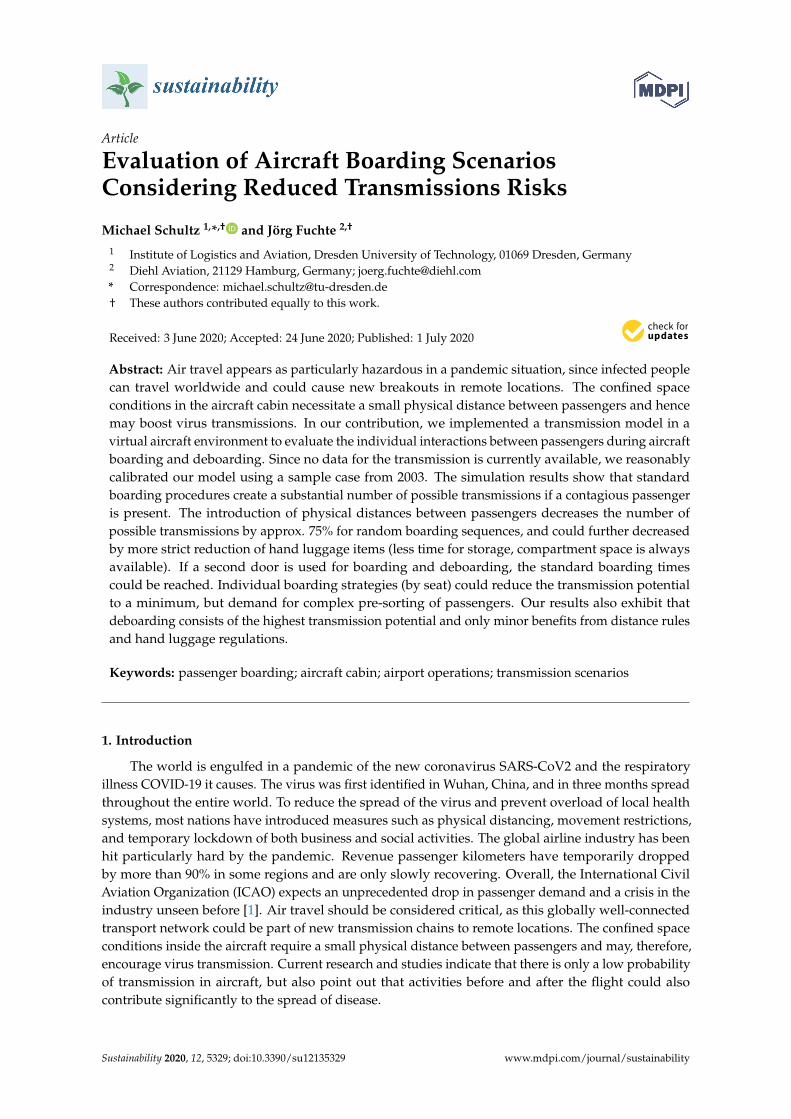
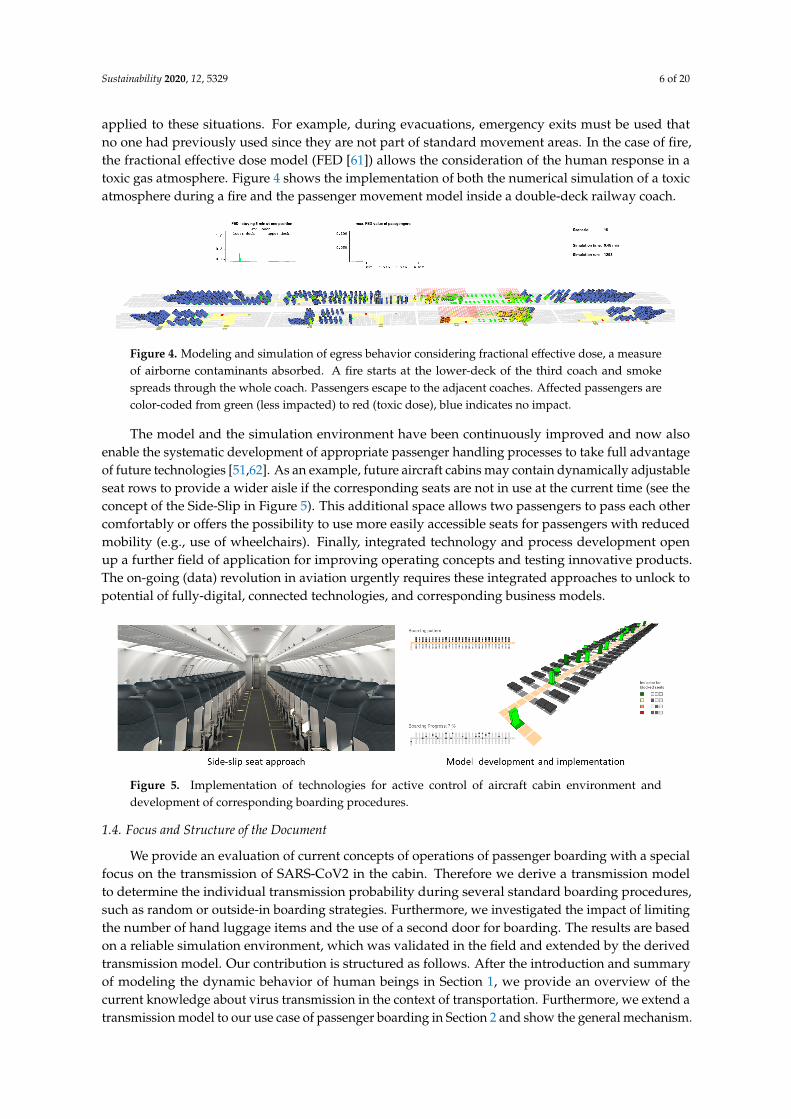
applied to these situations. For example, during evacuations, emergency exits must be used thatno one had previously used since they are not part of standard movement areas. In the case of fire,the fractional effective dose model (FED [61]) allows the consideration of the human response in atoxic gas atmosphere. Figure 4 shows the implementation of both the numerical simulation of a toxicatmosphere during a fire and the passenger movement model inside a double-deck railway coach.
Figure 4. Modeling and simulation of egress behavior considering fractional effective dose, a measureof airborne contaminants absorbed. A fire starts at the lower-deck of the third coach and smokespreads through the whole coach. Passengers escape to the adjacent coaches. Affected passengers arecolor-coded from green (less impacted) to red (toxic dose), blue indicates no impact.
The model and the simulation environment have been continuously improved and now alsoenable the systematic development of appropriate passenger handling processes to take full advantageof future technologies [51,62]. As an example, future aircraft cabins may contain dynamically adjustableseat rows to provide a wider aisle if the corresponding seats are not in use at the current time (see theconcept of the Side-Slip in Figure 5). This additional space allows two passengers to pass each othercomfortably or offers the possibility to use more easily accessible seats for passengers with reducedmobility (e.g., use of wheelchairs). Finally, integrated technology and process development openup a further field of application for improving operating concepts and testing innovative products.The on-going (data) revolution in aviation urgently requires these integrated approaches to unlock topotential of fully-digital, connected technologies, and corresponding business models.
Figure 5. Implementation of technologies for active control of aircraft cabin environment anddevelopment of corresponding boarding procedures.
1.4. Focus and Structure of the Document
We provide an evaluation of current concepts of operations of passenger boarding with a specialfocus on the transmission of SARS-CoV2 in the cabin. Therefore we derive a transmission modelto determine the individual transmission probability during several standard boarding procedures,such as random or outside-in boarding strategies. Furthermore, we investigated the impact of limitingthe number of hand luggage items and the use of a second door for boarding. The results are basedon a reliable simulation environment, which was validated in the field and extended by the derivedtransmission model. Our contribution is structured as follows. After the introduction and summaryof modeling the dynamic behavior of human beings in Section 1, we provide an overview of thecurrent knowledge about virus transmission in the context of transportation. Furthermore, we extend atransmission model to our use case of passenger boarding in Section 2 and show the general mechanism.

Sustainability 2020, 12, 5329 7 of 20
In Section 3 the derived transmission model is implemented in a fast stochastic model to provide ahigh number of simulation runs for each selected scenario. The results of the scenario analysis arepresented in Section 4. Finally, our contribution ends with a conclusion and outlook (Section 5).
2. Derivation of Transmission Model
Knowledge about the characteristics of SARS-CoV2 is evolving quickly as more studies becomeavailable. In this section, we derive a model for the transmission probability, based on three earlystudies on SARS-CoV2 propagation and general characteristics.
2.1. Understanding of SARS-CoV2
In a study from Germany, a small cluster was researched in depth [63]. The relevant finding wasthat the overall secondary attack rate was below 10% for close contacts. Even prolonged meetingsituations left some people without a transmission, while on another occasion a transmission happenedwhen a pre-symptomatic person sat back to back with another person and handed over a saltdispenser. This demonstrates the relevance of even short contacts to contagious people. In particular,the contagious person was pre-symptomatic and would not have been rejected for air travel bysymptom-based detection strategies. A study on the outbreak of COVID19 in the Italian town of Vòshows that the number of asymptomatic cases was at roughly 45% out of the entire number of cases [64].This means that even if symptomatic passengers are rejected from flying, the probability of havingcontagious passengers is still considering if the virus is active in a population. This is considered themost problematic characteristic of SARS-CoV2, next to the fact that also pre-symptomatic passengersare contagious. A study from Guangzhou and Hong Kong estimated the incubation period as 5.2 dayson average and—more importantly—the onset of infectiousness 2 days before the start of symptoms [2].The peak of infectiousness is estimated at half a day before symptoms onset. Thus, contagious peopleare likely to travel despite their best intentions and pose a similar or even higher danger than infectedpeople with clear illness symptoms.
In general, the coronavirus will survive for some time on surfaces, especially metal and syntheticmaterial [65]. The contagiousness of surfaces touched by multiple passengers is hence of concern.However, the virus load of asymptomatic or pre-symptomatic passengers likely puts on surfaces islimited, as he does not cough or sneeze. The overall contribution of contact transmission to the overalltransmission is currently deemed low.
Key parameters of epidemic spread were analyzed to evaluate the contribution of differenttransmission routes [66]. Therefore, a transmission rate of 45% from pre-symptomatic events and5% from the asymptomatic event was assumed. The study further assumed the transmission riskfrom contaminated surfaces at 10%. Consequently, a counter-infection strategy relying primarily oneliminating contact infection (for example through repeated disinfection of the cabin interiors) will notreduce infection risk sufficiently. However, the reduction of contact infections remains an effectiveelement of a comprehensive containment strategy and will also help to prevent the transmission ofother diseases.
2.2. Modelling Approach
Agent-based models allow for an efficient implementation of individual interactions in simulationenvironments. Transmission models require several parameters, foremost the distance between agentsand the duration of the interaction [67,68].
A comparable work has been published, in which an agent-based mobility model of an entire citywas used to show the spread of SARS-CoV2 as a function of different public distancing measures [69].The problem encountered was that the character of the individual contacts could not be modeled in itsentirety. That is, the time and distance between agents when being in the same place (e.g., in an officeor a public transport vehicle) is based on probabilities.

Sustainability 2020, 12, 5329 8 of 20
Our approach of an agent-based model provides a more profound estimation of the quality of thecontact between passengers. The initial idea of the transmission model [67] is shown in Equation (1)and specifically useful for diseases that spread via droplets or aerosols, such as SARS-CoV2.
Pn,t = 1− exp(−θ ∑ SRm,t inm,t tnm,t
)(1)
The sum is performed for each person n over all contagious persons m, with the followingvariables and parameters.
- Pn,t : the probability of the person n to receive an infectious dose. This shall not be understoodas “infection probability”, because this strongly depends on the immune response by the affectedperson.
- θ : the calibration factor for the specific disease- SRm,t : the shedding rate, the amount of virus the person m spreads during the time step t- inm,t : the intensity of the contact between n and m, which corresponds to their distance- tnm,t : the time the person n interacts with person m during the time step t
The resulting probability has to be understood as a possible transmission event, or dangerouscontact. It is not the infection probability. Unfortunately, current research does not provide any data tocalibrate the model parameters for the SARS-CoV2 case. Besides the distance between the passengers,further factors could impact the transmission and should be reflected carefully to derive a reasonableparameter setting.
- If the cabin ventilation is active (which is highly desirable and probably mandatory in timesof pandemic air travel) the air is circulated and quickly replaced. The exhale of a person doesnot remain in a place for very long. Hence the distance threshold is set lower than for otherinterior settings.
- Droplets sink to the ground, and the cabin ventilation also injects fresh air into the upper partof the cabin and extracts at floor level. Hence a passenger located at a lower position is moresusceptible to the virus exhaled from a passenger being located higher than vice versa. This isrelevant when people in the aisle pass seated passengers.
- The virus load increases with physical activity simply as more air is exchanged in the lungs.Talking (especially very loud, or even singing) also increases virus load in the exhale. Hence,the model considers moving passengers as having a higher shedding rate than seated passengers.Shedding rates are even higher when passengers store luggage in overhead bins or squeezethemselves into window seats.
In this context, the shedding rate and hence the infection probability is considerably higher,when a passenger stands in the aisle, stowing his bulky carry-on luggage, in contrast to a seatedpassenger at an aisle seat. The airflow characteristics of the aircraft cabin would further transport theexhale of the standing passengers along with the seated one. The used boarding simulation offersthe advantage that it considers these events with increased detail due to their relevance for normalboarding operations. In our approach, we define the shedding rate SR as a normalized bell-shapedfunction (Equation (2)) with z ∈ (x, y) for both longitudinal and lateral dimensions, respectively.
SRxy = ∏z∈(x,y)
(1 +|z− cz|
az
2bz)−1
(2)
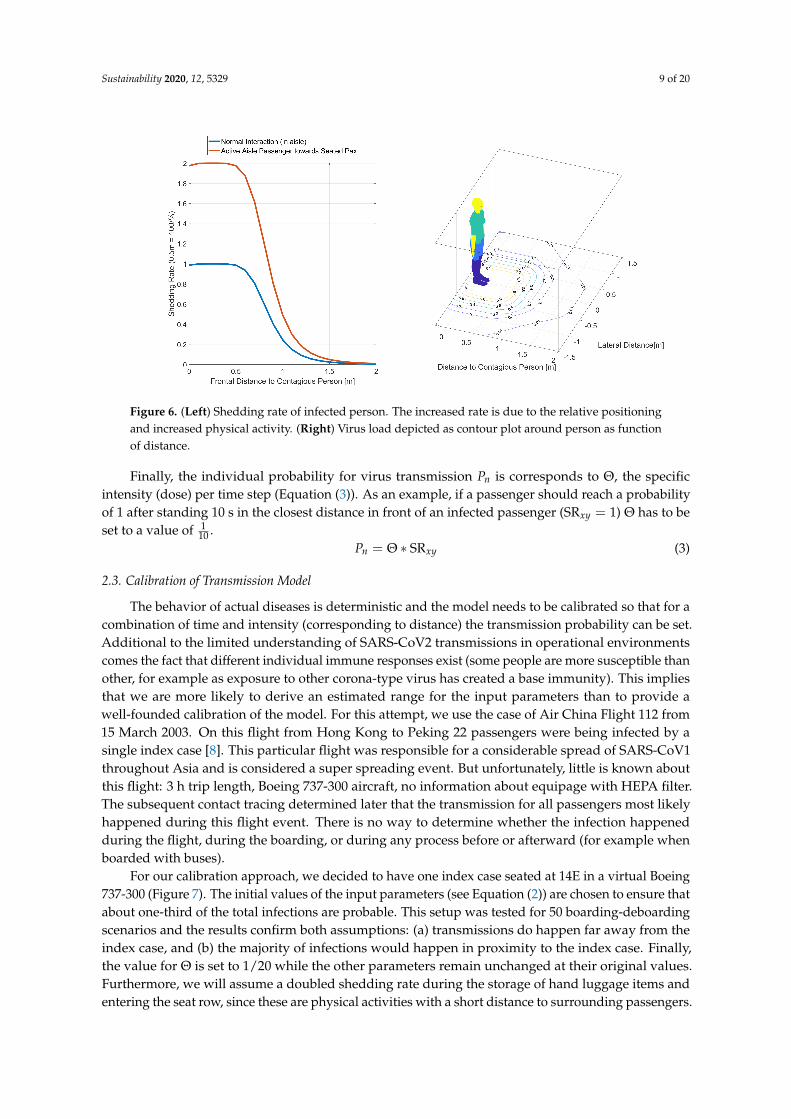
The parameters are a (scaling factor), b (slope of leading and falling edge), and c (offset) todetermine the shape of the curve. The parameters have been initially set to ax = 0.6, bx = 2.5,cx = 0.25, ay = 0.65, by = 2.7, and cy = 0. This provides the spread in y-direction (lateral) a slightlysmaller footprint than in x-direction (longitudinal). The spread in x-direction is higher in front of theindex case than behind it (see Figure 6).
Sustainability 2020, 12, 5329 9 of 20
Figure 6. (Left) Shedding rate of infected person. The increased rate is due to the relative positioningand increased physical activity. (Right) Virus load depicted as contour plot around person as functionof distance.
Finally, the individual probability for virus transmission Pn is corresponds to Θ, the specificintensity (dose) per time step (Equation (3)). As an example, if a passenger should reach a probabilityof 1 after standing 10 s in the closest distance in front of an infected passenger (SRxy = 1) Θ has to beset to a value of 1
10 .Pn = Θ ∗ SRxy (3)
2.3. Calibration of Transmission Model
The behavior of actual diseases is deterministic and the model needs to be calibrated so that for acombination of time and intensity (corresponding to distance) the transmission probability can be set.Additional to the limited understanding of SARS-CoV2 transmissions in operational environmentscomes the fact that different individual immune responses exist (some people are more susceptible thanother, for example as exposure to other corona-type virus has created a base immunity). This impliesthat we are more likely to derive an estimated range for the input parameters than to provide awell-founded calibration of the model. For this attempt, we use the case of Air China Flight 112 from15 March 2003. On this flight from Hong Kong to Peking 22 passengers were being infected by asingle index case [8]. This particular flight was responsible for a considerable spread of SARS-CoV1throughout Asia and is considered a super spreading event. But unfortunately, little is known aboutthis flight: 3 h trip length, Boeing 737-300 aircraft, no information about equipage with HEPA filter.The subsequent contact tracing determined later that the transmission for all passengers most likelyhappened during this flight event. There is no way to determine whether the infection happenedduring the flight, during the boarding, or during any process before or afterward (for example whenboarded with buses).
For our calibration approach, we decided to have one index case seated at 14E in a virtual Boeing737-300 (Figure 7). The initial values of the input parameters (see Equation (2)) are chosen to ensure thatabout one-third of the total infections are probable. This setup was tested for 50 boarding-deboardingscenarios and the results confirm both assumptions: (a) transmissions do happen far away from theindex case, and (b) the majority of infections would happen in proximity to the index case. Finally,the value for Θ is set to 1/20 while the other parameters remain unchanged at their original values.Furthermore, we will assume a doubled shedding rate during the storage of hand luggage items andentering the seat row, since these are physical activities with a short distance to surrounding passengers.

Sustainability 2020, 12, 5329 10 of 20
Figure 7. Calibrated viral load using the Air China Flight 112 from 15 March 2003. The numbers showthe infection probability 50 boarding-deboarding runs. Note that infections have occurred even inremote seats, albeit the highest probability is close to the index case in 14E. The transmission probabilityis color-coded with white (no-contact), orange (minor probability), red (highly probable), and black(index case).
We are aware of the fact, that our calibration is a straightforward approach. Several assumptionswere taken and it is not proven that Air China Flight 112 is the single source for all transmissions.It shall be stressed again that the resulting number is not the transmission probability, but a measure ofimpact if the index case is highly contagious. This means that below a threshold of 100% we considera transmission as unlikely. If a person becomes infected depends on many factors beyond the viralload itself.
In the following analyses, we consider always a single index case per aircraft, which is a 174 seatsingle-aisle aircraft (29 rows). If the infection rate in a population is about 5 persons per week and100,000 people (average rate in Germany between 18th and 25th of May 2020), the probability of havingan infectious person on board a fully booked 174 seat aircraft can be assumed to be less than 5%. Thisconsiders the absence of apparently ill people but considers the pre-symptomatic and asymptomaticcases. It further does not account for any contact tracing and subsequent quarantine. This roughcalculation is not provided herein detail as it does not influence the result, it is provided to explainwhy we do not assume more than a single index case.
3. Passenger Boarding Model Using Operational and Individual Constraints
In our contribution, we use a cellular automata model, which is based on individual transitionprobabilities to move to adjacent positions around the current position [70]. The model was developedto provide a stochastic approach covering short (e.g., avoid collisions, group behavior [57]) andlong-range interactions (e.g., tactical wayfinding) [59].
3.1. Operational Constraints and Rules of Movement
To reflect operational conditions of aircraft and airlines (e.g., seat load factor, compliance to theboarding procedure) as well as the non-deterministic nature of the underlying processes (e.g., amountand distribution of hand luggage) a stochastic model was developed [46,71] and calibrated [54,72].Herein, the passenger boarding can be understood as a stochastic, forward-directed, one-dimensional,and discrete (time and space) process, which is mapped to a regular grid. An appropriate mappingof the aircraft seat layout is shown in Figure 8 (Airbus A320, 29 rows, 174 seats). This regular gridconsists of equal cells with a size of 0.4 × 0.4 m, whereas a cell can either be empty or contain exactlyone passenger.
1 3 5 7 29272523... ...
front door rear door
seat row
seat aisle
Figure 8. Grid-based simulation environment—Airbus A320 as reference.

Sustainability 2020, 12, 5329 11 of 20
The boarding progress consists of a simple set of rules for the passenger movement: (a) enter theaircraft at the assigned door (based on the current boarding scenario), (b) move forward from cell tocell along the aisle until reaching the assigned seat row, and (c) store the baggage (aisle is blocked forother passengers) and take the seat. The storage time for the hand luggage depends on the individualnumber of hand luggage items. The seating process depends on the constellation of already usedseats in the corresponding row. The stochastic nature of the boarding model requires a minimumof simulation runs for each selected scenario to derive reliable simulation results. In this context,a simulation scenario is mainly defined by the underlying seat layout, the number of passengers toboard (seat load factor, default: 85%), the arrival frequency of the passengers at the aircraft, the numberof available doors (default 1 door), the specific boarding strategy (default: random) and the complianceof passengers in following the current strategy (default: 85%). Further details regarding the model andthe simulation environment are available at [16].
In the simulation environment, the boarding process is implemented as follows. Depending on theseat load, a specific number of randomly chosen seats are used for boarding. For each seat, a passenger(agent) is created. The agent contains individual parameters, such as the number of hand luggageitems, maximum walking speed in the aisle (set for all agents to 0.8 m/s [43,54]), seat coordinates,time to store the hand luggage and arrival time at the aircraft door. To create the time needed to storethe hand luggage, a stochastic distribution is used. The agents are sequenced concerning their seatsand the current boarding strategy. From this sequence, a given percentage of agents are taken out ofthe sequence (non-compliant behavior) and inserted into a position, which contradicts the currentstrategy (e.g., inserted into a different boarding block).
According to the exponential arrival time distribution and the boarding sequence, each agentgets a timestamp to appear on the aircraft door queue. When the simulation starts, the first agentof the queue always enters the aircraft by moving from the queue to the entry cell of the aisle grid(aircraft door), if this cell is free. In each simulation step, all agents located in the row are moved tothe next cell, if possible (free cell and not arrived at the seat row), using a shuffled sequential updateprocedure (emulate parallel update behavior [59,70]). If the agent arrives at the assigned seat row,he blocks this position as long as the time needed to store the hand luggage. Depending on the seat rowcondition (e.g., blocked aisle or middle seat or both), additional time is added to perform the seatingprocess (seat shuffle). The aisle is blocked for passing during the whole seating process. Each boardingscenario is simulated 125,000 times, to derive statistically relevant results defined by average boardingtime (start with the first passenger arrives the aircraft and finished when the last passenger is seated)and standard deviation of the boarding time.
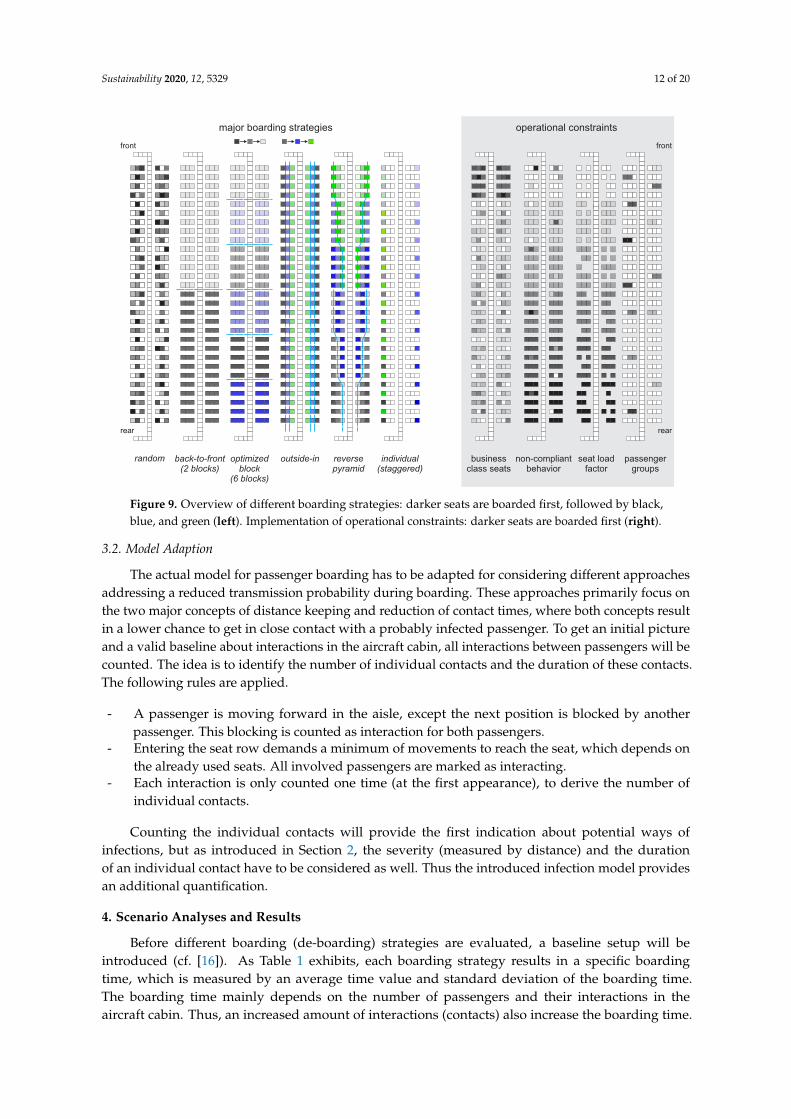
In general, boarding strategies follow three basic approaches: boarding per rows (aggregatedto blocks), boarding per seat (window, middle, aisle), and sequences of specific seats. Figure 9 (left)depicts how the boarding strategies and operational constraints are implemented in the boardingmodel. The seats are color-coded to emphasize the order of aircraft seats. In our contribution wewill consider six different boarding strategies (and deboarding): random, back-to-front (based on2 boarding blocks), optimized block (based on 6 boarding blocks), outside-in (window seats first,aisle seats last), reverse pyramid (back-to-front plus outside-in with 6 blocks), and individual seating.These strategies cover the most relevant operational and scientific approaches for passenger boarding.For the random boarding, passengers arrive with no specific chronological order. Finally, the individualboarding strategy is a specific solution of the optimized block (alternating rows) and outside-in strategy,where each block contains only one seat. Figure 9 (right) additionally emphasizes how the operationalconstraints of 1st class seats, passenger compliance to the boarding strategy, seat load factor, and theexistence of groups are covered by the boarding model.
Sustainability 2020, 12, 5329 12 of 20
front
rear
random businessclass seats
non-compliantbehavior
seat loadfactor
passengergroups
major boarding strategies operational constraints
back-to-front(2 blocks)
optimizedblock
(6 blocks)
outside-in reversepyramid
individual(staggered)
front
rear
Figure 9. Overview of different boarding strategies: darker seats are boarded first, followed by black,blue, and green (left). Implementation of operational constraints: darker seats are boarded first (right).
3.2. Model Adaption
The actual model for passenger boarding has to be adapted for considering different approachesaddressing a reduced transmission probability during boarding. These approaches primarily focus onthe two major concepts of distance keeping and reduction of contact times, where both concepts resultin a lower chance to get in close contact with a probably infected passenger. To get an initial pictureand a valid baseline about interactions in the aircraft cabin, all interactions between passengers will becounted. The idea is to identify the number of individual contacts and the duration of these contacts.The following rules are applied.
- A passenger is moving forward in the aisle, except the next position is blocked by anotherpassenger. This blocking is counted as interaction for both passengers.
- Entering the seat row demands a minimum of movements to reach the seat, which depends onthe already used seats. All involved passengers are marked as interacting.
- Each interaction is only counted one time (at the first appearance), to derive the number ofindividual contacts.
Counting the individual contacts will provide the first indication about potential ways ofinfections, but as introduced in Section 2, the severity (measured by distance) and the durationof an individual contact have to be considered as well. Thus the introduced infection model providesan additional quantification.
4. Scenario Analyses and Results
Before different boarding (de-boarding) strategies are evaluated, a baseline setup will beintroduced (cf. [16]). As Table 1 exhibits, each boarding strategy results in a specific boardingtime, which is measured by an average time value and standard deviation of the boarding time.The boarding time mainly depends on the number of passengers and their interactions in theaircraft cabin. Thus, an increased amount of interactions (contacts) also increase the boarding time.

Sustainability 2020, 12, 5329 13 of 20
The random boarding is taken as the reference case and points out an average of 3.5 individualcontacts per passenger during boarding with a corresponding relative standard deviation (RSD) of36%. The RSD is defined as the standard deviation divided by the average value. If block-basedstrategies are applied, the average number of contacts only slightly changes from the random boarding.More complex strategies addressing a minimized interaction during the seating process (outside-in)and combination of both block and seat consideration (reverse pyramid) result in a decrease toapprox. 2.7 contacts on average. Finally, the approach for the individual-based sequence results in2.2 contacts (RSD of 53). The deboarding case exhibits a significantly higher amount of individualcontacts since the passengers stand near the aisle and take their hand luggage out of the overheadcompartments whereas other passengers passing. This specific contact is counted for both passengersstanding, whereas passing seated passengers is not considered as direct individual contact in thissimplified approach. These indirect contacts (passing seated passengers) are considered in Section 4.3,where the introduced transmission model is applied for a more accurate evaluation of the overalltransmission probability.
Table 1. Baseline simulation to determine regular boarding time and number of individual contacts byusing average values and relative standard deviation (RSD).
Boarding Strategy Boarding Time (%) Number of Contacts (%)Average RSD Average RSD
reference random 100.0 7.3 3.5 36
by block back-to-front (2 blocks) 95.9 7.3 3.5 36optimized block (6 blocks) 95.3 7.3 3.3 35
by seat outside-in 79.5 7.1 2.8 39reverse pyramid 75.2 7.0 2.7 40individual 65.8 7.4 2.2 53
deboarding 54.5 6.5 5.3 35
4.1. Distance Keeping
As already introduced and analyzed in detail [59,70,73], social and long-range interaction couldbe reliably modeled by using a floor field. This field contains information about preceding passengers,which allows for a long-range interaction even considering adjacent cells around the actual position.So each passenger will leave a trace with a given length during movement to block the correspondingcells and indicate the minimum distance required. As Figure 10 exhibits, an increasing physical distanceresults and in a longer boarding time accompanied by a decreased standard deviation. Assuming aminimum distance of 1.6 m, which corresponds to 4 grid cells in the stochastic model, the boardingtime is nearly doubled for random boarding.
Figure 10. Characteristic of boarding time (left) and relative standard deviation of boarding time(right) with increasing physical distance between passengers.

Sustainability 2020, 12, 5329 14 of 20
The effect of physical distance superimposes all advantages by a significantly reduced arrivalrate and the completely coupling of the individual passenger movements. This is also indicated bythe reduced relative standard deviations, as depicted in Figure 10 (right). Furthermore, the increaseddistance between passengers results in a worse performance of block-based boarding strategies.This would be also true for the individual boarding, which follows the idea that each row is a blockand this block should be boarded with window seat first and aisle seat last (outside-in). The distance ofsubsequently following blocks has to be adapted according to the required distance of the passengers.Finally, each (optimized) block-based strategy will converge to this individual approach.
On the positive side, the introduced physical distance reduces the direct contact of a passenger inthe aisle to zero. As Table 2 shows, the remaining individual contacts result from the seating process.When a passenger arrives at the seat row and some seats already used by other passengers thenthese passengers have to stand up to allow entering the row if necessary, e.g., window seat to betaken and the middle seat is occupied. This process is time-consuming, because the aisle is normallyblocked during this seat shuffle, and consists of close distances between the involved passengers.The implementation of the outside-in boarding strategy leads to a minimum of these time-consumingshuffles, because here first the window seats, then the middle seats, and finally the aisle seats are beingtaken. As mentioned in Section 3, the passenger compliance to the boarding strategies will be not 100%since passengers arrive late or family members will not be separated. Therefore the number of contactsin Table 2 still show a value different from zero for all strategies.
4.2. Reduction of Hand Luggage Items
It will be assumed that the amount of hand luggage will be significantly reduced by the airlineto ensure a shorten time storing the hand luggage in the overhead compartment. If the averagenumber of hand luggage is reduced by 50%, the boarding time decreased by approx. 20% usingrandom passenger sequences [16]. Since we expect all SARS-CoV2 related modification of the boardingprocess will have a negative impact, we will implement a significant reduction of hand luggageitems (50%) in our scenarios to ensure that each passenger can store his items in the correspondingoverhead compartment at any time. As Table 2 points out, the average number of individual contacts issignificantly reduced but at the cost of the doubled boarding time. Thus, the random and block-basedstrategies lead to an average of 0.9 contacts with an RSD of approx 85% (standard deviation of approx.0.8). The seat-based strategies only show 0.2 individual contacts associated with RSD value higherthan 200% (standard deviation of approx. 0.5). The number of direct contacts during deboarding isonly reduced by 0.3 points.
Table 2. Impact of physical distance rules (1.6 m) on the number of individual contacts, boarding time,and compensation of boarding time by 50% less hand luggage item. The reference boarding time equals100% (random strategy), which corresponds to airline-specific implementations and reaches valuesbetween 10 and 20 min [54].
Reference Keeping 1.6 m Minimum Distance in AisleBoarding Strategy Number of Contacts Number of Contacts Average Boarding Time (%)
Average RSD (%) Average RSD (%) 100% Carry-on 50% Carry-on
random 3.5 36 0.9 85 198 154
back-to-front (2 blocks) 3.5 36 0.9 86 220 169optimized block (6 blocks) 3.3 35 0.9 85 279 210
outside-in 2.8 39 0.2 227 161 116reverse pyramid 2.7 39 0.2 261 185 128individual 2.2 53 0.2 271 114 104
deboarding 5.3 35 5.0 36 97 68
The approach to limit the number of hand luggage items to 50% of the standard amount mitigatesthe effect of longer boarding times. In conclusion, the boarding time of today random boarding

Sustainability 2020, 12, 5329 15 of 20
strategy could be reached with 1.6 m distance rule, using a passenger-wise, time-consuming presorting,and 50% reduction of hand luggage items. The boarding time for the random strategy increases by54% under the same conditions.
The often mentioned approach of having a free middle seat will also result in less interactionduring seating but also result in a 33% reduced seat load, which may result in efficient airline operationsfrom an ecological and economic perspective. This scenario could not be compared directly to therandom strategy since the number of passengers is intentionally reduced, which consequently reducesthe direct contacts as well.
4.3. Transmission Approach
At this stage, the interactions between passengers are only individually counted but not evaluatedagainst their probability to get passengers infected. Therefore Equations (2) and (3) are implementedusing the following parameters for longitudinal x (in the direction of motion) and lateral propagationy (across to the direction of motion): maxx = 1, ax = 0.6, bx = 2.5, cx = 0.25; maxy = 1, ay = 0.65,by = 2.7, cy = 0; Θ = 1/20, one randomly selected passenger as SARS-CoV2 source. Furthermore,we introduce an amplification factor of 2 to reflect the higher intensity of interactions during thehand luggage storage and seating process. This factor is active if the infected passengers start to storehis luggage until he is finally seated. This approach opens up a more detailed assessment, but alsocontains a high degree of uncertainty, because although we have chosen a reasonable approach, it isnot based on a reliable data set or scientific validation. We hope that upcoming research will help us togain additional insights into this highly dynamic process.
In the following Table 3 the necessity to distinguish between the simplified approach of countingindividual contacts in the aisle and the more differentiated approach of assessing possible transmissionsaround an infected passenger is emphasized. In particular, the implemented back-to-front strategyexhibits lower values for the transmission probability than the optimized block strategy. If passengersboard in blocks from the back to the front, the chance of passing an infected person is reduced toa minimum, as confirmed by the calculated reduction of the transmission probability. This effect isalso a root cause of the low transmission probabilities of outside-in, reverse pyramid, and individualboarding strategy. The table shows also the impact of distance keeping and reduction of handluggage, e.g., the reference case of random boarding initially shows an average value of 5.9 possibletransmissions which could be reduced by both operational changes finally to 1.1 possible transmissions.All these reductions are accompanied by an increase in the RSD values. Again, deboarding shows onlyminor changes.
Table 3. Evaluation of possible transmissions assuming one SARS-CoV2 passenger in the cabin andone door operations (front door).
Possible Transmissions0 m Distance 1.6 m Distance
100% Carry-on 50% Carry-on 100% Carry-on 50% Carry-onBoarding Strategy Average RSD Average RSD Average RSD Average RSD
Value (%) Value (%) Value (%) Value (%)
random 5.9 68 4.2 83 1.6 124 1.1 145
back-to-front (2 blocks) 5.6 65 3.9 81 1.4 123 1.0 144optimized block (6 blocks) 6.5 67 4.8 77 2.3 116 1.5 134
outside-in 3.5 62 1.7 97 0.4 226 0.2 329reverse pyramid 3.0 56 1.3 99 0.2 291 0.1 467individual 2.0 92 0.8 154 0.2 301 0.1 489
deboarding 10.0 36 8.0 42 9.7 34 7.8 43

Sustainability 2020, 12, 5329 16 of 20
4.4. Two Door Operations (Front and Rear Door)
The left front door is regularly used during standard boarding procedures at gate positions.Apron positions or special gate positions allow for the use of two doors for boarding and deboarding.The approach of using two doors accelerates the boarding progress and also results in reduced valuesfor possible transmissions. Table 4 exhibits that the boarding time for two-door operations with areduction of 50% hand luggage items reaches the reference time for random boarding using one door.
Table 4. Evaluation of possible transmissions (Transm.) and boarding time assuming one SARS-CoV2passenger in the cabin and two door operations (front and rear door).
0 m Distance 1.6 m DistanceCarry-on Carry-on Carry-on Carry-on
100% 50% 100% 50%Boarding Strategy Average Average Average Boarding Average Boarding(Two Doors) Transm. Transm. Transm. Time (%) Transm. Time (%)
random 4.3 2.5 1.4 133 1.0 103
back-to-front (2 blocks) 3.9 2.4 1.2 153 0.8 116optimized block (6 blocks) 5.5 3.4 1.5 166 1.0 125
outside-in 1.9 0.6 0.3 107 0.1 77reverse pyramid 1.7 0.5 0.2 119 0.1 82individual 1.0 0.3 0.2 103 0.1 74
deboarding 7.9 6.2 7.6 52 6.0 36
5. Discussion and Outlook
The new coronavirus SARS-CoV2 has demonstrated high contagiousness even before infectedpeople show any symptoms. Surface disinfection does not reduce the infection risk sufficiently as themajority of transmission is observed as droplet-based. However, the transmission probability duringthe flight itself is currently deemed low due to the airflow patterns in a cabin, the dry air, and theeffectiveness of filtering systems in the aircraft. Research on previous diseases has further shown therelevance of the pre- and post-flight processes, such as boarding and deboarding. In our contribution,we address this issue using a stochastic cellular automata model and a transmission model, which wascalibrated using an event from the previous SARS epidemic. The resulting transmission probabilitiesare likely to be conservative (means: higher than in actual life). We are not considering face masks inour model approach. The boarding and deboarding simulation were performed using a single-aisleaircraft with 174 seats, representative for the majority of Airbus A320 and Boeing B737 family aircraftin service. Several different boarding strategies are applied. There is a single infected person amongthe passengers, its seat position and entry position are randomly set and the result averaged over125,000 simulation runs.
The standard random boarding without additional distances and normal carry-on luggage results inabout 5–6 critical contacts between passengers. Changing the boarding procedure reduces the number ofcontacts by more than half. Introducing a distancing of 1.6 m reduces the number of critical contacts forthe random boarding to about 1–2. Hence, distancing alone does not eliminate these contacts. Carry-onluggage influences the time spent in the aisle at a high physical workload (high shedding rate). Reducingthe luggage by 50% reduces the number of critical contacts to about 1 for the random boarding. Boardingprocedures like outside-in or reverse pyramid have a profound effect and reduce the number of criticalcontacts substantially below 1, even with normal carry-on luggage. Particularly, the use of the rear doorwill reduce the transmission probability significantly for all boarding strategies.
The transmission probability during deboarding is only slightly influenced since physicaldistancing is difficult if not impossible to impose. The number of contacts and the transmissionprobability remain at a high level, which indicates deboarding as the critical process in the aircraftcabin. To reduce the transmission probability, the timing of passengers entering the aisle during

Sustainability 2020, 12, 5329 17 of 20
deboarding would need to be controlled. Further measures like having active ventilation after engineshutdown should be discussed with experts on cabin ventilation. This study does make any statementsregarding the risk during normal seating. Cited studies have shown that the infection risk is very low,also with normal seating densities. Reducing the risk through boarding and deboarding provides theadvantage, that remaining infection risk is limited to the passengers directly around the index case.
The used transmission model is not sufficiently calibrated to make a strong conclusion aboutactual transmission probabilities. Therefore we introduce the term critical contacts. We interpretour simulation results as such that we recommend boarding procedures that minimize interactionsbetween passengers. The application of seat-based boarding procedures recovers some of the additionalboarding time needed through the introduced physical distancing. The use of two doors for boardingwill provide a good solution for a reduced transmission risk inside and outside the cabin if nearapron stands could be used and passengers could walk from the terminal to the aircraft. This kindof walk boarding also prevents passengers from standing in the badly ventilated jetway during theboarding. Deboarding is difficult to control through procedures and passengers have demonstratedlittle discipline and high eagerness to leave the aircraft. We think this event should be given increasedattention, and either procedural or technical solutions considered.
Carry-on luggage has substantial influence. It should be considered to limit the carry-on tothe amount which can be put into the overhead bins with little effort or increasing the carry-oncapacity in the cabin. Assigning a place in the overhead bin for each passenger with carry-on mayfurther reduce the storage time and reduce contacts. This should also have a favorable effect onthe boarding times, also after the pandemic has ended. Removing the carry-on luggage entirelycould be an option, but there is also a diametrical effect of increased interaction before and after theflight. Although not modeled or discussed here, other hygienic measures need also to be considered.SARS-CoV2 is not specifically known to easily transmit via contaminated surfaces. Therefore advancedhygienic measures shall be applied, and shall be focused in places where passenger interaction happensfrequently, foremost the lavatories. This is specifically relevant for longer-range flights, and wouldalso help to contain other infectiousness diseases.
The infection risk of boarding and deboarding is substantial but can be addressed. This contributesto the effort to ensure a very low and overall acceptable risk of infection when traveling by aircraft.The procedural measures that are recommended do not add any cost or unacceptable inconvenience topassengers. The reduction of critical contacts by additional physical distance alone does not eliminatethe risk if random boarding is continued. Distance and different boarding procedures remove the riskfor the boarding process. The not regulated passenger deboarding remains an issue. Carry-on luggageand deboarding as a whole should receive further attention. The suggested changes to the boardingprocess would also enhance the travel experience and reduce turnaround time in the hopefully not toodistant future when the pandemic has ended.
Author Contributions: Conceptualization, M.S. and J.F.; methodology, M.S. and J.F.; software, M.S. and J.F.;validation, M.S. and J.F.; formal analysis, M.S. and J.F.; investigation, M.S. and J.F.; writing—review andediting, M.S. and J.F.; visualization, M.S. and J.F. All authors have read and agreed to the published version ofthe manuscript.
Funding: This research received no external funding.
Conflicts of Interest: The authors declare no conflict of interest.
References
1. ICAO. Effects of Novel Coronavirus (COVID-19) on Civil Aviation; Technical Report; International Civil AviationOrganisation: Montreal, QC, Canada, 2020.
2. He, X.; Lau, E.H.; Wu, P.; Deng, X.; Wang, J.; Hao, X.; Lau, Y.C.; Wong, J.Y.; Guan, Y.; Tan, X.; et al. Temporaldynamics in viral shedding and transmissibility of COVID-19. Nat. Med. 2020. [CrossRef]
3. Gandhi, M.; Yokoe, D.S.; Havlir, D.V. Asymptomatic Transmission, the Achilles’ Heel of Current Strategiesto Control Covid-19. New Engl. J. Med. 2020. [CrossRef]

Sustainability 2020, 12, 5329 18 of 20
4. IATA. Restarting Aviation Following COVID-19; IATA: Montreal, QC, Canada, 2020.5. Vandenberg, O. Development and potential usefulness of the COVID-19 Ag Respi-Strip diagnostic assay in
a pandemic context. medRxiv 2020. [CrossRef]6. Waltz, E. How Do Coronavirus Tests Work? IEEE Spectrum, 3 April 2020.7. Mangili, A.; Gendreau, M.A. Transmission of infectious diseases during commercial air travel. Lancet
2005, 365. [CrossRef]8. Olsen, S.J.; Chang, H.L.; Cheung, T.Y.Y.; Tang, A.F.Y.; Fisk, T.L.; Ooi, S.P.L.; Kuo, H.W.; Jiang, D.D.S.;
Chen, K.T.; Lando, J.; et al. Transmission of the severe acute respiratory syndrome on aircraft. N. Engl.J. Med. 2003, 349, 2416–2422. [CrossRef]
9. Hertzberg, V.S.; Weiss, H. On the 2-Row Rule for Infectious Disease Transmission on Aircraft.Ann. Glob. Health 2016, 82, 819–823. [CrossRef] [PubMed]
10. Hertzberg, V.S.; Weiss, H.; Elon, L.; Si, W.; Norris, S.L. Behaviors, movements, and transmission ofdroplet-mediated respiratory diseases during transcontinental airline flights. Proc. Natl. Acad. Sci. USA2018, 115, 3623–3627. [CrossRef] [PubMed]
11. Schwartz, K.L.; Murti, M.; Finkelstein, M.; Leis, J.A.; Fitzgerald-Husek, A.; Bourns, L.; Meghani, H.;Saunders, A.; Allen, V.; Yaffe, B.; et al. Lack of COVID-19 transmission on an international flight. Can. MedAssoc. J. 2020, 192. [CrossRef] [PubMed]
12. Qian, G.Q.; Yang, N.B.; Ding, F.; Ma, A.H.Y.; Wang, Z.Y.; Shen, Y.F.; Shi, C.W.; Lian, X.; Chu, J.G.;Chen, L.; et al. Epidemiologic and Clinical Characteristics of 91 Hospitalized Patients with COVID-19in Zhejiang, China: A retrospective, multi-centre case series. QJM Int. J. Med. 2020, hcaa089. [CrossRef][PubMed]
13. Eldin, C.; Lagier, J.C.; Mailhe, M.; Gautret, P. Probable aircraft transmission of Covid-19 in-flight from theCentral African Republic to France. Travel Med. Infect. Dis. 2020. [CrossRef]
14. Schmidt, M. A review of aircraft turnaround operations and simulations. Prog. Aerosp. Sci. 2017, 92, 25–38.[CrossRef]
15. Jaehn, F.; Neumann, S. Airplane boarding. Eur. J. Oper. Res. 2015, 244, 339–359. [CrossRef]16. Schultz, M. Implementation and application of a stochastic aircraft boarding model. Transp. Res. Part C
Emerg. Technol. 2018, 90, 334–349. [CrossRef]17. Nyquist, D.C.; McFadden, K.L. A study of the airline boarding problem. J. Air Transp. Manag. 2008,
14, 197–204. [CrossRef]18. Mirza, M. Economic Impact of Airplane Turn-Times. Aero Q. 2008, 4, 14–19.19. Cook, A.; Tanner, G. European Airline Delay Cost Reference Values—Updated and Extended Values (Version 4.1);
Technical Report; EUROCONTROL Performance Review Unit: Brussels, Belgium, 2015.20. Delcea, C.; Cotfas, L.A.; Paun, R. Agent-Based Evaluation of the Airplane Boarding Strategies’ Efficiency
and Sustainability. Sustainability 2018, 10, 1879. [CrossRef]21. Marelli, S.; Mattocks, G.; Merry, R. The Role of Computer Simulation in Reducing Airplane Turn Time.
Boeing AERO Mag. 2018, 1.22. Van Landeghem, H.; Beuselinck, A. Reducing passenger boarding time in airplanes: A simulation based
approach. Eur. J. Oper. Res. 2002, 142, 294–308. [CrossRef]23. Ferrari, P.; Nagel, K. Robustness of Efficient Passenger Boarding Strategies for Airplanes. Transp. Res. Rec.
2005, 1915, 44–54. [CrossRef]24. van den Briel, M.H.L.; Villalobos, J.R.; Hogg, G.L.; Lindemann, T.; Mulé, A.V. America West Airlines
Develops Efficient Boarding Strategies. INFORMS J. Appl. Anal. 2005, 35, 191–201.25. Bachmat, E.; Elkin, M. Bounds on the performance of back-to-front airplane boarding policies. Oper. Res. Lett.
2008, 36, 597–601. [CrossRef]26. Schultz, M.; Schulz, C.; Fricke, H. Efficiency of Aircraft Boarding Procedures. In Proceedings of the
3rd International Conference on Research in Airport Transportation, Fairfax, VA, USA, 1–4 June 2008;pp. 371–377.
27. Bachmat, E.; Khachaturov, V.; Kuperman, R. Optimal back-to-front airplane boarding. Phys. Rev. E Stat.Nonlinear Soft Matter Phys. 2013, 87, 062805. [CrossRef] [PubMed]
28. Steffen, J.H. Optimal boarding method for airline passengers. J. Air Transp. Manag. 2008, 14, 146–150. [CrossRef]29. Bazargan, M. A linear programming approach for aircraft boarding strategy. Eur. J. Oper. Res. 2007,
183, 394–411. [CrossRef]

Sustainability 2020, 12, 5329 19 of 20
30. Steffen, J.H. A statistical mechanics model for free-for-all airplane passenger boarding. Am. J. Phys. 2008,76, 1114–1119. [CrossRef]
31. Frette, V.; Hemmer, P.C. Time needed to board an airplane: A power law and the structure behind it.Phys. Review. E Stat. Nonlinear Soft Matter Phys. 2012, 85, 011130. [CrossRef]
32. Bernstein, N. Comment on “Time needed to board an airplane: A power law and the structure behind it”.Phys. Review. E Stat. Nonlinear Soft Matter Phys. 2012, 86, 023101. [CrossRef]
33. Jafer, S.; Mi, W. Comparative Study of Aircraft Boarding Strategies Using Cellular Discrete Event Simulation.Aerospace 2017, 4, 57. [CrossRef]
34. Tang, T.Q.; Wu, Y.H.; Huang, H.J.; Caccetta, L. An aircraft boarding model accounting for passengers’individual properties. Transp. Res. Part C Emerg. Technol. 2012, 22, 1–16. [CrossRef]
35. Qiang, S.J.; Jia, B.; Xie, D.F.; Gao, Z.Y. Reducing airplane boarding time by accounting for passengers’ individualproperties: A simulation based on cellular automaton. J. Air Transp. Manag. 2014, 40, 42–47. [CrossRef]
36. Milne, R.J.; Salari, M. Optimization of assigning passengers to seats on airplanes based on their carry-onluggage. J. Air Transp. Manag. 2016, 54, 104–110. [CrossRef]
37. Milne, R.J.; Kelly, A.R. A new method for boarding passengers onto an airplane. J. Air Transp. Manag. 2014,34, 93–100. [CrossRef]
38. Zeineddine, H. A dynamically optimized aircraft boarding strategy. J. Air Transp. Manag. 2017, 58, 144–151.[CrossRef]
39. Steiner, A.; Philipp, M. Speeding up the airplane boarding process by using pre-boarding areas. In Proceedingsof the 9th Swiss Transport Research Conference, Ascona, Switzerland, 9–11 September 2009; p. 30.
40. Wallace, R. The Flying Carpet. Available online: http://the-flying-carpet.com/wp-content/uploads/2013/11/The-Flying-Carpet-Information-Brochure.pdf (accessed on 29 June 2020).
41. Wittmann, J. Customer-oriented optimization of the airplane boarding process. J. Air Transp. Manag. 2019,76, 31–39. [CrossRef]
42. Milne, R.J.; Delcea, C.; Cotfas, L.A.; Salari, M. New methods for two-door airplane boarding using apronbuses. J. Air Transp. Manag. 2019, 80, 101705. [CrossRef]
43. Schultz, M. Fast Aircraft Turnaround Enabled by Reliable Passenger Boarding. Aerospace 2018, 5, 8. [CrossRef]44. Yazdani, D.; Omidvar, M.N.; Deplano, I.; Lersteau, C.; Makki, A.; Wang, J.; Nguyen, T.T. Real-time
seat allocation for minimizing boarding/alighting time and improving quality of service and safety forpassengers. Transp. Res. Part C Emerg. Technol. 2019, 103, 158–173. [CrossRef]
45. Bachmat, E.; Berend, D.; Sapir, L.; Skiena, S.; Stolyarov, N. Analysis of Airplane Boarding Times. Oper. Res.2009, 57, 499–513.
46. Schultz, M.; Kunze, T.; Fricke, H. Boarding on the critical path of the turnaround. In Proceedings ofthe 10th USA/Europe Air Traffic Management Research and Development Seminar, Chicago, IL, USA,10–13 June 2013.
47. Chung, C. Simulation Design Approach for the Selection of Alternative Commercial Passenger AircraftSeating Configurations. J. Aviat. Technol. Eng. 2012, 2. [CrossRef]
48. Fuchte, J.C. Enhancement of Aircraft Cabin Design Guidelines with Special Consideration of AircraftTurnaround and Short Range Operations. Ph.D. Thesis, Technische Universität Hamburg-Harburg, Hamburg,Germany, 2014.
49. Schmidt, M.; Nguyen, P.; Hornung, M. Novel Aircraft Ground Operation Concepts Based on Clustering ofInterfaces; SAE Technical Paper 2015-01-2401; SAE International: Warrendale, PA, USA, 2015. ISSN 0148-7191,2688-3627. [CrossRef]
50. Schmidt, M.; Heinemann, P.; Hornung, M. Boarding and Turnaround Process Assessment of Single- andTwin-Aisle Aircraft. In Proceedings of the 55th AIAA Aerospace Sciences Meeting, AIAA SciTech Forum,American Institute of Aeronautics and Astronautics, Grapevine, TX, USA, 9–13 January 2017. [CrossRef]
51. Schultz, M. Dynamic change of aircraft seat condition for fast boarding. Transp. Res. Part C Emerg. Technol.2017, 85, 131–147. [CrossRef]
52. Steffen, J.H.; Hotchkiss, J. Experimental test of airplane boarding methods. J. Air Transp. Manag. 2012,18, 64–67. [CrossRef]
53. Gwynne, S.M.V.; Senarath Yapa, U.; Codrington, L.; Thomas, J.R.; Jennings, S.; Thompson, A.J.L.; Grewal, A.Small-scale trials on passenger microbehaviours during aircraft boarding and deplaning procedures. J. AirTransp. Manag. 2018, 67, 115–133. [CrossRef]

Sustainability 2020, 12, 5329 20 of 20
54. Schultz, M. Field Trial Measurements to Validate a Stochastic Aircraft Boarding Model. Aerospace 2018.[CrossRef]
55. Kierzkowski, A.; Kisiel, T. The Human Factor in the Passenger Boarding Process at the Airport. Procedia Eng.2017, 187, 348–355. [CrossRef]
56. Miura, A.; Nishinari, K. A passenger distribution analysis model for the perceived time of airplaneboarding/deboarding, utilizing an ex-Gaussian distribution. J. Air Transp. Manag. 2017, 59, 44–49. [CrossRef]
57. Schultz, M.; Rößger, L.; Fricke, H.; Schlag, B. Group Dynamic Behavior and Psychometric Profilesas Substantial Driver for Pedestrian Dynamics. In Pedestrian and Evacuation Dynamics 2012; SpringerInternational Publishing: Cham, Switzerland, 2013; pp. 1097–1111. [CrossRef]
58. Schultz, M.; Schulz, C.; Fricke, H. Enhanced Information Flow and Guidance in Airport Terminals using bestPassenger‘s Visual Perception. In Proceedings of the 6th EUROCONTROL Innovative Research Workshop,Bretigny-sur-Orge, France, 4–6 December 2007; pp. 149–156.
59. Schultz, M. Entwicklung eines individuenbasierten Modells zur Abbildung des Bewegungsverhaltens vonPassagieren im Flughafenterminal. Ph.D. Thesis, Technische Universität Dresden, Faculty of Transport andTraffic Sciences “Friedrich List”, Dresden, Germany, 2010.
60. Schultz, M.; Fricke, H. Managing Passenger Handling at Airport Terminal. In Proceedings of the 9thUSA/Europe Air Traffic Management Research and Development Seminar, Berlin, Germany, 14–17 June 2011.
61. Speitel, L.C. Fractional effective dose model for post-crash aircraft survivability. Toxicology 1996, 115, 167–177.[CrossRef]
62. Schultz, M. Faster aircraft boarding enabled by infrastructural changes. In Proceedings of the 2017 WinterSimulation Conference (WSC), Las Vegas, NV, USA, 3–6 December 2017. [CrossRef]
63. Böhmer, M.M.; Buchholz, U.; Corman, V.M.; Hoch, M.; Katz, K.; Marosevic, D.V.; Böhm, S.; Woudenberg, T.;Ackermann, N.; Konrad, R.; et al. Outbreak of COVID-19 in Germany Resulting from a SingleTravel-Associated Primary Case. Lancet Infect. Dis. 2020. [CrossRef]
64. Lavezzo, E.; Franchin, E.; Ciavarella, C.; Cuomo-Dannenburg, G.; Barzon, L.; Del Vecchio, C.; Rossi, L.;Manganelli, R.; Loregian, A.; Navarin, N.; et al. Suppression of COVID-19 outbreak in the municipality ofVo’, Italy. medRxiv 2020. [CrossRef]
65. Van Doremalen, N.; Bushmaker, T.; Morris, D.H.; Holbrook, M.G.; Gamble, A.; Williamson, B.N.; Tamin, A.;Harcourt, J.L.; Thornburg, N.J.; Gerber, S.I.; et al. Aerosol and Surface Stability of SARS-CoV-2 as Comparedwith SARS-CoV-1. N. Engl. J. Med. 2020, 382, 1564–1567. [CrossRef]
66. Ferretti, L.; Wymant, C.; Kendall, M.; Zhao, L.; Nurtay, A.; Abeler-Dörner, L.; Parker, M.; Bonsall, D.;Fraser, C. Quantifying SARS-CoV-2 transmission suggests epidemic control with digital contact tracing.Science 2020. [CrossRef]
67. Smieszek, T. A mechanistic model of infection: Why duration and intensity of contacts should be includedin models of disease spread. Theor. Biol. Med. Model. 2009, 6. [CrossRef] [PubMed]
68. Smieszek, T. Models of Epidemics: How Contact Characteristics Shape the Spread of Infectious Diseases.Ph.D. Thesis, ETH Zurich, Zurich, Switzerland, 2010. [CrossRef]
69. Müller, S.A.; Balmer, M.; Neumann, A.; Nagel, K. Mobility traces and spreading of COVID-19. medRxiv 2020.[CrossRef]
70. Schultz, M. Stochastic Transition Model for Pedestrian Dynamics. In Pedestrian and Evacuation Dynamics2012; Springer International Publishing: Cham, Switzerland, 2013; pp. 971–985. [CrossRef]
71. Schultz, M.; Fricke, H. Improving Aircraft Turnaround Reliability. In Proceedings of the 3rd InternationalConference on Research in Airport Transportation, Fairfax, VA, USA, 1–4 June 2008; pp. 335–343.
72. Schultz, M. Aircraft Boarding—Data, Validation, Analysis. In Proceedings of the 12th USA/Europe AirTraffic Management Research and Development Seminar, Seattle, WA, USA, 27–30 June 2017.
73. Schultz, M.; Fricke, H. Stochastic Transition Model for Discrete Agent Movements. In Lecture Notes inComputer Science; Springer: Berlin/Heidelberg, Germany, 2010; pp. 506–512. [CrossRef]
c© 2020 by the authors. Licensee MDPI, Basel, Switzerland. This article is an open accessarticle distributed under the terms and conditions of the Creative Commons Attribution(CC BY) license (http://creativecommons.org/licenses/by/4.0/).