Evaluating the economics of and business models for metal ...
375
Evaluating the economics of and business models for metal recycling from waste printed circuit boards in a South African context by Evelyn Ruvimbo Manjengwa Thesis presented in partial fulfillment of the requirements for the Degree of MASTER OF ENGINEERING (EXTRACTIVE METALLURGICAL ENGINEERING) in the Faculty of Engineering at Stellenbosch University Supervisor Prof. C. Dorfling April 2019
-
Upload
khangminh22 -
Category
Documents
-
view
0 -
download
0
Transcript of Evaluating the economics of and business models for metal ...
Evaluating the economics of and business models for
metal recycling from waste printed circuit boards in a
South African context by
Evelyn Ruvimbo Manjengwa
Thesis presented in partial fulfillment
of the requirements for the Degree
of
MASTER OF ENGINEERING
(EXTRACTIVE METALLURGICAL ENGINEERING)
in the Faculty of Engineering
at Stellenbosch University
Supervisor
Prof. C. Dorfling
April 2019

ii
DECLARATION
By submitting this thesis electronically, I declare that the entirety of the work contained
therein is my own, original work, that I am the sole author thereof (save to the extent
explicitly otherwise stated), that reproduction and publication thereof by Stellenbosch
University will not infringe any third party rights and that I have not previously in its entirety
or in part submitted it for obtaining any qualification.
Date: April 2019
Copyright © 2019 Stellenbosch University
All rights reserved
Stellenbosch University https://scholar.sun.ac.za

iii
PLAGIARISM DECLARATION
6. Plagiarism is the use of ideas, material and other intellectual property of another’s work and to
present is as my own.
7. I agree that plagiarism is a punishable offence because it constitutes theft.
8. I also understand that direct translations are plagiarism.
9. Accordingly all quotations and contributions from any source whatsoever (including the
internet) have been cited fully. I understand that the reproduction of text without quotation
marks (even when the source is cited) is plagiarism.
10. I declare that the work contained in this assignment, except where otherwise stated, is my
original work and that I have not previously (in its entirety or in part) submitted it for grading in
this module/assignment or another module/assignment.
Initials and surname: ………E.R.Manjengwa…………..
Date: ….….April 2019………..
Stellenbosch University https://scholar.sun.ac.za

iv
ABSTRACT
Electronic waste is the fastest growing component of solid municipal waste in South Africa
however limited processing capacity exists in the country to economically recover metals from
printed circuit board (PCB) waste. Presently the majority of recycled e-waste is exported instead of
adding value to the processed material.
A hydrometallurgical process entailing the selective leaching of gold and copper from waste printed
circuit boards was developed by the research group (Rossouw, 2015; de Waal, 2018). This study
sought to evaluate the economic and business viability of the proposed hydrometallurgical process
within the South African context.
A PESTEL approach was used to evaluate the South African recycling landscape. In this approach
the status of the political, economic, environmental, legal, social and technological aspects
characterising e-waste recycling and management was undertaken.
Different business models were developed around the main activities of the associated operations
of the proposed process. Screening and selection was done on two levels. An assessment of the
collection and dismantling of e-waste was done and used as the first basis for screening the
business models. It was established that the reverse logistics and associated manpower
requirements and efficiencies associated with this operation were economically and operationally
restrictive.
Detailed costing and profitability studies were done on the last eight business models. The
recovery of copper and gold in the metallic state was found to be associated with the highest
capital and annual operating expenditures.
Profitability studies were conducted on two levels. Performance analysis over the life of the project
was done on the basis of discounted cash flows, time, cash and interest. The profitability ratios that
included return on investment (ROI), capital ratio (CR), terminal capital rate of return ratio
(CRRterm), present value ratio (PVR), net profit margin (NPM) and the (fixed asset turnover ratio)
FATR were used to assess the annual performance of each business model.
Both assessments revealed that all the business models under the specified process conditions,
were unviable and incapable of both capital and interest repayment. Detailed sensitivity studies of
the group 4 business was done.
The risk of failure within five years was certain as evidenced by the perpetually decaying plots of
the recapitalization risk curves. Four additional significant areas of risk were identified and
evaluated that had an impact on the performance of the business models. These included supply
and demand constraints, key raw material, technological and market related risks.
Stellenbosch University https://scholar.sun.ac.za

v
A consideration of alternative revenue streams from palladium, silver and tin recovery, did not
improve the performance of the business models. Decreasing both the capital costs and operating
costs by margins ranging between 48% and 65% shifted the performance of the business models.
The success of this project was driven strongly by the gold business, evidenced by improved
performance at elevated minimum gold concentrations ranging between 563ppm and 925ppm.
These concentrations implied that a consistent supply of high grade WPCBs would have to be
furnished to ensure project viability. It is necessary to consider alternative processing routes when
using medium grade WPCBs.
Stellenbosch University https://scholar.sun.ac.za

vi
OPSOMMING
Elektroniese afval is die vinnigste groeiende komponent van soliede munisipale afval in Suid-
Afrika. Beperkte prosesseringskapasiteit bestaan egter in die land om metale uit gedrukte
stroombaanpaneel (PCB) afval ekonomies te herwin. Tans word die meerderheid herwinde e-
afval uitgevoer in plaas daarvan om waarde tot die geprosesseerde materiaal te voeg.
ʼn Hidrometallurgiese proses wat die selektiewe loging van goud en koper uit afval PCB behels, is
deur die navorsingsgroep ontwikkel (Rossouw, 2015; de Waal 2018). Hierdie studie het beoog
om die ekonomiese en besigheidslewensvatbaarheid van die voorgestelde hidrometallurgiese
proses binne die Suid-Afrikaanse konteks te evalueer.
ʼn politiese, ekonomiese, sosiale, tegnologiese, omgewing en wettig (PESTEL) -benadering is
gebruik om die Suid-Afrikaanse herwinningslandskap te evalueer. In hierdie benadering is die
status van die politiese, ekonomiese, omgewings-, wettiglike, sosiale en tegnologiese aspekte
wat die e-afval herwinning en bestuur karakteriseer, onderneem.
Verskillende besigheidsmodelle is ontwikkel rondom die hoofaktiwiteite van die geassosieerde
bedrywighede van die voorgestelde proses. Sifting en seleksie is op twee vlakke gedoen. ʼn
Assessering van die versameling en afbreking van e-afval is gedoen en gebruik as die eerste
basis vir sifting van besigheidsmodelle. Dis vasgestel dat die omgekeerde logistiek en
geassosieerde mannekrag vereistes en doeltreffendhede geassosieer met hierdie bedryf
ekonomies en operasioneel beperkend is.
Gedetailleerde kosteberekeninge en winsgewendheidstudies is gedoen op die laaste agt
besigheidsmodelle. Dis gevind dat die herwinning van goud en koper in die metaal toestand
geassosieer word met die hoogste kapitaal en jaarlikse bedryfsuitgawes.
Winsgewendheidstudies is uitgevoer op twee vlakke. Werkverrigting analise oor die lewensduur
van die projek is gedoen op die basis van gediskonteerde kontantvloei, tyd, kontant en rente. Die
winsgewendheid verhoudings wat opbrengs op belegging (ROI), kapitaal verhouding (CR),
terminale kapitaal opbrengskoers verhouding (CRRterm), toonwaarde verhouding (PVR), netto
winsgrens (NPM) en die FATR (vaste bate omset verhouding) is gebruik om die jaarlikse
doeltreffendheid van elke besigheidsmodel te assesseer.
Beide assesserings het aangedui dat al die besigheidsmodelle binne die gespesifiseerde proses
kondisies nie lewensvatbaar was nie en onbevoeg is om beide kapitaal en rente terugbetalings te
doen. Gedetailleerde sensitiwiteitstudies van die groep vier besigheid is gedoen.
Die risiko van mislukking binne vyf jaar was seker soos bewys deur die onophoudelike afbreking
stippe op die herkapitalisering risiko kurwes. Vier addisionele beduidende areas van risiko is
geïdentifiseer en -evalueer wat ʼn impak op die prestasie van die besigheidsmodelle gehad het.
Stellenbosch University https://scholar.sun.ac.za

vii
Hierdie sluit in vraag en aanbod beperkinge, sleutel rou materiaal, tegnologiese en mark
verwante risiko’s.
ʼn Oorweging van alternatiewe inkomstestrome uit palladium, silwer- en tinherwinning het nie die
doetreffendheid van die besigheidsmodelle verbeter nie. Deur beide die kapitaalkostes en
bedryfskostes met marges binne bestek van 48% en 65% te verminder, het die doeltreffendheid
van die besigheidsmodelle geskuif. Die sukses van hierdie projek is grootliks gedryf deur die
goudbedryf, soos bewys deur verbeterde doeltreffendheid by verhoogde minimum
goudkonsentrasies binne bestek van 563 ppm en 925 ppm. Hierdie konsentrasies dui aan dat ʼn
konsekwente toevoer van hoë-graad WPCBs (waste printed circuit boards) ingerig moet word om
die projek se lewensvatbaarheid te verseker. Dit is nodig om alternatiewe prosesseringsroetes te
oorweeg wanneer medium-graad WPKCBs gebruik word.
Stellenbosch University https://scholar.sun.ac.za

viii
ACKNOWLEDGEMENTS
I give all gratitude to YHWH the Father of our Lord Jesus Christ through whom all things in creation
exist. Nothing happens without His knowledge He alone is the true source of wisdom.
I also express my sincere gratitude to my supervisor, Professor Christie Dorfling, of the
Department of Process Engineering at the University of Stellenbosch. He provided guidance,
mentorship and challenged me to think in different dimensions. I also thank him for his support and
encouragement and availing his time outside of scheduled appointments. I make special mention
of Doctor Anne Chimphango who availed her time prior to my enrolment at the University of
Stellenbosch and was a stepping stone to entering this program. I also express my gratitude to my
research colleague and friend Alicia de Waal with whom I had numerous discussions that
contributed to the research. I thank her for her support and encouragement.
I would also like to express my gratitude to SAMMRI for their financial support. Any opinion, finding
and conclusion or recommendation expressed in this material is that of the author and SAMMRI
does not accept any liability in this regard.
Finally, I would like to acknowledge my parents Mr and Mrs (late) M.A. Manjengwa and my two
brothers, Munya and Alban who have always believed the best about me. Special mention also
goes out to my industrial mentors Mr T.A. Mashingaidze and Mr P. Rusike who moulded my
formative years in industry, Mr Niels Shwarz, Mrs Mieke De Jager, my prayer partners, Shirné and
Jacques Le Roux, Chang Sung Hee, Stellenbosch Hillsong church for their support and
encouragement throughout the duration of this project.
Stellenbosch University https://scholar.sun.ac.za

ix
TABLE OF CONTENTS
Contents
DECLARATION .............................................................................................................................. ii
ABSTRACT .................................................................................................................................... iv
OPSOMMING ................................................................................................................................ vi
ACKNOWLEDGEMENTS ............................................................................................................. viii
TABLE OF CONTENTS ................................................................................................................. ix
LIST OF TABLES .......................................................................................................................... xvi
LIST OF FIGURES ....................................................................................................................... xxi
ABBREVIATIONS AND ACRONYMS ......................................................................................... xxiv
General abbreviations and acronyms ...................................................................................... xxiv
Economic abbreviations and acronyms .................................................................................. xxvii
Technical abbreviations and acronyms .................................................................................... xxix
Chapter 1: INTRODUCTION ....................................................................................................... 1
1.1. Project background ........................................................................................................... 1
1.2. Project scope .................................................................................................................... 1
1.3. Project objectives .............................................................................................................. 2
1.4. Findings and status of supporting projects ........................................................................ 2
1.5. Project methodology ......................................................................................................... 3
1.5.1. Literature review ........................................................................................................ 4
1.5.2. E-waste management in South Africa ........................................................................ 4
1.5.3. Process description and design considerations ......................................................... 4
1.5.4. Considerations for project economic evaluations ....................................................... 4
1.5.5. Development and selection of business models......................................................... 4
1.5.6. Project costing and profitability assessments ............................................................. 5
1.5.7. Sensitivity and risk analysis ....................................................................................... 5
1.5.8. Conclusions and recommendations ........................................................................... 5
Chapter 2: LITERATURE REVIEW ............................................................................................. 6
2.1. Introduction ....................................................................................................................... 6
Stellenbosch University https://scholar.sun.ac.za

x
2.2. Printed circuit boards ........................................................................................................ 6
2.2.1. Types of printed circuit boards ................................................................................... 6
2.2.2. Characterisation of waste printed circuit boards ......................................................... 7
2.2.3. Valuation of waste printed circuit boards (WPCBs) .................................................... 9
2.2.4. Environmental impacts of waste printed circuit boards handling .............................. 10
2.2.5. Motivation for WPCB recycling ................................................................................. 11
2.2.6. Perceived threats to the viability of WPCB recycling ................................................ 13
2.3. Recycling of metals from waste printed circuit boards (WPCBs) ..................................... 14
2.3.1. Recycling of WPCBs ................................................................................................ 14
2.3.2. Mechanical recycling of WPCBs .............................................................................. 15
2.3.3. Hydrometallurgical recycling of WPCBs ................................................................... 16
2.3.4. WPCB recycling process flow sheets ....................................................................... 18
2.4. Techno-economic feasibility studies of WEEE recycling ................................................. 21
2.4.1. The economics of recycling ..................................................................................... 21
2.4.2. Comparing reuse versus recycling ........................................................................... 21
2.4.3. E - waste recycling in Southern Africa ...................................................................... 21
2.4.4. Evaluating the economics of operating configurations ............................................. 22
2.5. Chapter summary ........................................................................................................... 24
Chapter 3: E-WASTE MANAGEMENT IN SOUTH AFRICA ...................................................... 26
3.1. Classifying waste electrical and electronic equipment ..................................................... 26
3.2. E-waste regulations ........................................................................................................ 27
3.2.1. Regulation of e-waste .............................................................................................. 27
3.2.2. Legislation ............................................................................................................... 31
3.2.3. Policy implementation .............................................................................................. 33
3.3. E-waste volumes in South Africa .................................................................................... 36
3.3.1. Accounting for e-waste flows ................................................................................... 36
3.3.2. Estimating e-waste volumes in South Africa ............................................................ 37
3.4. E- waste recycling ........................................................................................................... 39
3.4.1. E-waste recycling in comparison to other waste streams ......................................... 39
3.4.2. Employment creation ............................................................................................... 40
Stellenbosch University https://scholar.sun.ac.za

xi
3.4.3. E-waste recycling activity ......................................................................................... 41
3.5. Proposed models for e-waste management .................................................................... 51
3.6. Threats to successful e-waste management and recycling ............................................. 55
3.6.1. Supply chain dynamics - material flows ................................................................... 55
3.6.2. Data management and planning .............................................................................. 55
3.6.3. Legislative and regulatory climate ............................................................................ 56
3.7. The key findings – A PESTEL analysis ........................................................................... 57
3.7.1. Political .................................................................................................................... 58
3.7.2. Economic ................................................................................................................. 59
3.7.3. Social ....................................................................................................................... 60
3.7.4. Technological .......................................................................................................... 60
3.7.5. Environmental .......................................................................................................... 61
3.7.6. Legal ........................................................................................................................ 62
3.8. The future outlook ........................................................................................................... 62
3.9. Chapter summary ........................................................................................................... 63
Chapter 4: PROCESS DESCRIPTION AND DESIGN CONSIDERATIONS .............................. 65
4.1. Process description ........................................................................................................ 65
4.2. Process and design considerations ................................................................................. 68
4.2.1. Collection and dismantling ....................................................................................... 68
4.2.2. Shredding and comminution .................................................................................... 68
4.2.3. Solder leaching ........................................................................................................ 70
4.2.4. Copper extraction .................................................................................................... 71
4.2.5. Gold extraction ........................................................................................................ 93
4.3. Effluent, emissions and solid waste management ......................................................... 120
4.3.1. Emissions management ......................................................................................... 120
4.3.2. Effluent management ............................................................................................. 123
4.3.3. Solid waste management ....................................................................................... 126
4.4. Chapter summary ......................................................................................................... 127
Chapter 5: CONSIDERATIONS FOR PROJECT ECONOMIC EVALUATIONS ....................... 128
5.1. Purpose of economic evaluations ................................................................................. 128
Stellenbosch University https://scholar.sun.ac.za

xii
5.2. Important considerations for the evaluations ................................................................. 128
5.2.1. Raw material procurement ..................................................................................... 128
5.2.2. Philosophy of calculations ...................................................................................... 129
5.2.3. Key raw material supply data ................................................................................. 129
5.2.4. Tax considerations ................................................................................................. 130
5.2.5. Depreciation .......................................................................................................... 130
5.2.6. Interest rate (cost of capital)................................................................................... 131
5.2.7. Adjustments for inflation ......................................................................................... 132
5.2.8. Utilities ................................................................................................................... 133
5.2.9. Metal prices ........................................................................................................... 133
5.2.10. Material properties and losses ............................................................................ 133
5.3. Operations management .............................................................................................. 134
5.3.1. Equipment sizing and planning .............................................................................. 134
5.3.2. Utilities ................................................................................................................... 138
5.3.3. Plant maintenance ................................................................................................. 141
5.3.4. Organizational and operational structure ............................................................... 141
5.3.5. Selection of the operating configuration ................................................................. 145
5.4. Chapter summary ......................................................................................................... 145
Chapter 6: FIRST LEVEL SCREENING OF BUSINESS MODELS .......................................... 147
6.1. Development of business models ................................................................................. 147
6.1.1. Business models .................................................................................................... 147
6.1.2. Criteria for defining the business models ............................................................... 148
6.2. First level screening and selection ................................................................................ 160
6.2.1. Storage space requirements .................................................................................. 164
6.2.2. Raw material supply within South Africa ................................................................ 165
6.2.3. By-product and waste projections .......................................................................... 169
6.2.4. Additional revenues from by-products .................................................................... 169
6.2.5. Output of first level screening ................................................................................. 170
6.2.6. Production planning ............................................................................................... 171
6.3. The second level screening and selection ..................................................................... 172
Stellenbosch University https://scholar.sun.ac.za

xiii
6.4. Chapter summary ......................................................................................................... 172
Chapter 7: PROJECT COSTING AND EVALUATION ............................................................. 174
7.1. Capital cost estimation .................................................................................................. 174
7.1.1. Capital cost method ............................................................................................... 174
7.1.2. Capitalization costs ................................................................................................ 176
7.1.3. Analysis of the capital cost estimates ..................................................................... 177
7.2. Operating cost estimation ............................................................................................. 180
7.2.1. Raw material costs ................................................................................................ 180
7.2.2. Solid and waste management costs ....................................................................... 180
7.2.3. Labour costs .......................................................................................................... 180
7.2.4. Utility costs ............................................................................................................ 181
7.2.5. Indirect operating costs .......................................................................................... 181
7.2.6. Analysis of operating costs .................................................................................... 182
7.3. Sales and revenue ........................................................................................................ 187
7.3.1. Product pricing ....................................................................................................... 187
7.3.2. Handling product recovery streams in the process ................................................. 190
7.3.3. Revenue distributions ............................................................................................ 192
7.3.4. Evaluating economic efficiency of each business model ........................................ 193
7.4. Profitability analysis ...................................................................................................... 195
7.4.1. Measures of profitability ......................................................................................... 196
7.4.2. Profitability ratios ................................................................................................... 202
7.4.3. Exploring options for improving performance ......................................................... 207
7.5. Chapter summary ......................................................................................................... 210
Chapter 8: SENSITIVITY ANALYSIS ...................................................................................... 212
8.1. Sensitivity analysis ........................................................................................................ 212
8.2. Objectives of the analysis ............................................................................................. 212
8.2.1. Selection of the models for the sensitivity analysis ................................................. 212
8.2.2. Analysis of group 4 business models ..................................................................... 212
8.3. Limitations in this study ................................................................................................. 213
8.4. Findings of the analysis ................................................................................................ 213
Stellenbosch University https://scholar.sun.ac.za

xiv
8.4.1. Changes in total capital invested ........................................................................... 213
8.4.2. Changes in operating costs ................................................................................... 214
8.4.3. Changes in both CAPEX and OPEX ...................................................................... 216
8.4.4. Changes in copper revenues ................................................................................. 217
8.4.5. Changes in gold revenues ..................................................................................... 219
8.4.6. Changes in gold and copper product revenues ...................................................... 220
8.4.7. Changes in capacity utilization ............................................................................... 222
8.4.8. Changes in gold content in WPCBs ....................................................................... 223
8.5. Implications of the sensitivity analysis ........................................................................... 225
8.6. Risk analysis ................................................................................................................. 229
8.6.1. Recapitalization risk assessment ........................................................................... 229
8.6.2. Evaluating susceptibility to risk factors ................................................................... 231
8.7. Chapter summary ......................................................................................................... 232
Chapter 9: CONCLUSIONS AND RECOMMENDATIONS ...................................................... 234
9.1. Overview ....................................................................................................................... 234
9.2. Addressing the aims of the study .................................................................................. 234
9.2.1. Objective 1 ............................................................................................................. 234
9.2.2. Objective 2 ............................................................................................................. 236
9.2.3. Objective 3 ............................................................................................................. 237
9.3. Recommendations for further study .............................................................................. 239
REFERENCES ........................................................................................................................... 241
APPENDICES ............................................................................................................................. 267
A: Mass balances used for the economic evaluations .............................................................. 267
B: Mass balances for base metal treatment option – The Nitric acid wash ............................... 272
C: Calculations for process considerations ........................................................................... 279
D: Equipment flow sheets ..................................................................................................... 284
E: Calculations for the initial evaluation of the business models ............................................... 294
F: Calculations for economic evaluations ................................................................................. 300
G: Calculations for the sensitivity analysis ............................................................................. 324
H: Waste management landscape of South Africa ................................................................ 340
Stellenbosch University https://scholar.sun.ac.za

xv
Stellenbosch University https://scholar.sun.ac.za

xvi
LIST OF TABLES
Table 2.1: Classification of printed circuit boards (PCBs) based on mechanical properties ............................. 6
Table 2.2: The metal compositions (%) of WPCBs from nine different sources (Excerpt from Cucchiella et al.,
2016) .......................................................................................................................................................... 7
Table 2.3: The typical and variant WPCB metallic compositions ...................................................................... 8
Table 2.4: Economic classification of WPCBs (Hagelüken, 2006) .................................................................... 9
Table 2.5: Metals commonly used in the production of electrical and electronic equipment based on 2006
demand (Schluep et al., 2009)................................................................................................................. 12
Table 2.6: Energy savings realized when metals are recovered from recycling of WPCBs. .......................... 12
Table 2.7: A summary of some of the different flow sheets developed for recycling WPCBs and other
electronic waste ....................................................................................................................................... 19
Table 3.1: Categorization of e-waste sources (Commission of the European Communities, 2000) ............... 26
Table 3.2: Life spans of electrical and electronic equipment (Liechti & Finlay, 2008) .................................... 37
Table 3.3: The published estimates of e-waste generated.............................................................................. 38
Table 3.4: Summary of key stake holders in the South African e-waste recycling chain (Widmer & Lombard,
2005; Finlay, 2005; Lydall et al., 2017; GreenCape 2017; 2018) ............................................................ 50
Table 3.5: Comparative evaluations of proposed e-waste management models ........................................... 54
Table 4.1: Operating specifications for the crushing and comminution of WPCBs (Rossouw, 2015) ............. 68
Table 4.2: Comparative profiles based on empirical work and up-rated mass balances of material attacked
during the solder leaching step (Rossouw, 2015; de Waal, 2018) .......................................................... 70
Table 4.3: Comparative profiles based on empirical work and up-rated mass balances of material attacked
during the copper leaching step (Rossouw, 2015; de Waal, 2018) ......................................................... 71
Table 4.4: Stream analysis for the prediction of crud generation rates in LIX 984N extraction system .......... 80
Table 4.5: Crud formation data for the process under study ........................................................................... 81
Table 4.6: Main features of the ISA Process (Anderson et al., 2009; soleconsulting, 2013) .......................... 83
Table 4.7: Copper electrowinning and harvesting process design considerations ......................................... 85
Table 4.8: Dimensions for the electrowinning cell ........................................................................................... 86
Table 4.9: Data for determining loading rate of polypropylene macrospheres ................................................ 89
Table 4.10: Summary of the effects of different contaminants and other metals in the copper extraction
process (Hakakari, 1995; Miller, 1995; Sole et al., 2007; Zhang, 2007b; Mirza et al., 2016; Sole
&Tinkler, 2016). ....................................................................................................................................... 92
Table 4.11: The possible species of cyanide complexes during the cyanidation of WPCB leach liquor
(Marsden & House, 1992) ........................................................................................................................ 98
Table 4.12: Expected reactions during cyanide leaching (Bergstrom, 1924; Makanza, 2006; Estay et al.,
2010; Karimi et al., 2010; Uhlig, 2011; Rossouw, 2015; Webelements, 2018; docbrown, 2018) ........... 99
Table 4.13: Expected reactions during the nitric acid wash (Kleinschmidt, 1918; Bergstrom, 1924; Driver,
1988; Makanza, 2006; Estay et al., 2010; Karimi et al., 2010; Uhlig, 2011; Rossouw, 2015;
Webelements, 2018; docbrown, 2018) .................................................................................................. 102
Stellenbosch University https://scholar.sun.ac.za

xvii
Table 4.14: Expected reactions during the SART process (Bergstrom, 1924; Makanza, 2006; Manjengwa,
2009b; Estay et al., 2010; Karimi et al., 2010; Uhlig, 2011; van Wyk, 2014; Webelements, 2018;
docbrown, 2018) .................................................................................................................................... 105
Table 4.15: The expected behaviour and destinations of the by-products of the SART process for the system
(Bergstrom, 1924; Estay et al., 2010; Karimi et al., 2010; Uhlig, 2011; Rossouw, 2015) ..................... 106
Table 4.16: A comparative analysis of the two options for managing base metals in gold feed from the
copper extraction circuit. ........................................................................................................................ 107
Table 4.17: AARL acid wash cycle (Briggs, 1983; Steyn, 2010; Rogans, 2012; de Waal, 2018) ................. 111
Table 4.18: AARL elution process adopted for the designed process under study (Briggs, 1983; Steyn, 2010;
Rogans, 2012; de Waal, 2018) .............................................................................................................. 113
Table 4.19: Operating configurations available for reactivating the stripped carbon (Marsden & House, 1992)
............................................................................................................................................................... 114
Table 4.20: Carbon reactivation time profiles (adsorption resource handbook)* .......................................... 115
Table 4.21: Specifications for base metals in the gold electrowinning process (Marsden & House, 1992;
Steyn and Sandenbergh, 2004) ............................................................................................................. 117
Table 4.22: Final handling of the gold cathode produced ............................................................................. 119
Table 4.23: Emissions management in the respective plants ....................................................................... 121
Table 4.24: Solid waste streams generated in each section ......................................................................... 126
Table 5.1: WPCB grading and pricing (Lydall et al., 2017) ........................................................................... 129
Table 5.2: Process debottlenecking (extracted from Appendix F, Tables F.7) ............................................. 134
Table 5.3: Equipment sizing considerations .................................................................................................. 135
Table 5.4: Production operating configurations available .............................................................................. 137
Table 5.5: Regeneration of softening resin (extracted from the main operational data sheet appendix F,
Tables F.1 and F.2) ............................................................................................................................... 139
Table 5.6: Compressed air requirements for the plants (original basis business model 3a) ........................ 140
Table 5.7: Specific manpower requirements for each of the production operating configurations ............... 144
Table 5.8: Matrix for selection of the best production operating configuration .............................................. 145
Table 6.1: Matrix for defining combinations to specify business models ...................................................... 158
Table 6.2: SWOT analysis of the proposed project undertaking ................................................................... 163
Table 6.3: Assumptions used for first level analysis of business models ...................................................... 164
Table 6.4: Analysis of the raw WPCB purchase cost against maximum dismantling rate of a worker. ........ 167
Table 6.5: Characterization of output streams from each of the plants for business models 3a to 4d ......... 171
Table 7.1: Capital cost estimation methods................................................................................................... 174
Table 7.2: Categories of the production plants for the proposed process ..................................................... 175
Table 7.3: Percentages used for determining the costs associated with the project capital expenditure
(Peters & Timmerhaus, 1991; Perry et al., 1997) .................................................................................. 176
Table 7.4: Capitalization costs for process non consumables ...................................................................... 177
Table 7.5: Decrease in total capital investment in group 4 business models ................................................ 179
Table 7.6: Estimation of operating costs ....................................................................................................... 182
Table 7.7: Contribution of gold revenues ....................................................................................................... 193
Stellenbosch University https://scholar.sun.ac.za

xviii
Table 7.8: Analysis of WPCBs (adapted from Shuey & Taylor, 2004; Lydall et al., 2017). The gold content
was adjusted to 250ppm in this study .................................................................................................... 193
Table 7.9: Analysis of the economic efficiency of the copper and gold businesses...................................... 194
Table 7.10: Analysis of the economic efficiency of the gold business .......................................................... 195
Table 7.11: Analysis of the economic efficiency of the copper business ...................................................... 195
Table 7.12: Comparisons useful for economic decision making (Perry et al., 1997) .................................... 196
Table 7.13: Summary of the definitions applied for the study evaluating projects (Perry et al., 1997) ......... 197
Table 7.14: Performance evaluation of group 3 business models ................................................................ 198
Table 7.15: Performance evaluation of group 4 business models ................................................................ 198
Table 7.16: Profitability ratios used in the study (Perry et al., 1997) ............................................................. 203
Table 7.17: Analysis of the performance of group 3 business models using profitability ratios .................... 203
Table 7.18: Analysis of the performance of group 4 business models using profitability ratios .................... 203
Table 7.19: Benchmarking capital ratios, FATRs and minimum performance of each business model ....... 204
Table 7.20: Summary of the results of the analysis of annual business performance of the group 3 business
models ................................................................................................................................................... 205
Table 7.21: Summary of the results of the analysis of annual business performance of the group 4 business
models ................................................................................................................................................... 206
Table 8.1: NPV of the business models as gold content changes (US$) ...................................................... 223
Table 8.2: DCFRR of the business models as gold content changes (%) .................................................... 225
Table 8.3: DPBP of the business models as gold content changes .............................................................. 225
Table 8.4: Evaluation of the influence of the different factors ....................................................................... 226
Table 8.5: Sensitivity ranking of each business model .................................................................................. 228
Table 8.6: Evaluation of models’ susceptibility to risk factors ....................................................................... 231
Table A.1: Mass balances for the shredding and milling plant at a design basis of 400Tonnes processing
capacity of WPCBs ................................................................................................................................ 268
Table A.2: Mass balances for the solder leaching plant at a design basis of 400Tonnes processing capacity
of WPCBs (adapted from Rossouw, 2015; de Waal, 2018) .................................................................. 269
Table A.3: Mass balances for the copper extraction plant at a design basis of 400Tonnes processing
capacity of WPCBs (adapted from Rossouw, 2015; de Waal, 2018) .................................................... 270
Table A.4: Mass balances for the gold extraction plant at a design basis of 400Tonnes processing capacity
of WPCBs .............................................................................................................................................. 271
Table B.1: Detailed mass balances for the nitric acid wash process flow sheet ........................................... 274
Table B.2: Summary of the main reactions proceeding during the nitric acid wash ..................................... 275
Table B.3: Evaluation of main objective of the acid wash performance ........................................................ 276
Table B.4: Stream characterisation after water rinsing ................................................................................. 277
Table B.5: Evaluating likelihood of premature crystallization in the circuit .................................................... 278
Table C.1: Performance comparison of two options for managing the increased gold concentration as a
result of the nitric acid wash .................................................................................................................. 279
Table C.2: Costs associated with dilution as an option round the adsorption circuit .................................... 280
Table C.3: Costs associated with increased carbon concentration as an option around the adsorption circuit
............................................................................................................................................................... 281
Stellenbosch University https://scholar.sun.ac.za

xix
Table C.4: Nitric acid wash overall performance analysis for removal of base metals in WPCB recycling
campaign ............................................................................................................................................... 282
Table C.5: SART overall performance analysis for removal of base metals in WPCB recycling campaign . 283
Table E.1: Collection and dismantling materials requirement and feasibility analysis .................................. 295
Table E.2: Annual production plan during normal operations for copper and gold metal production (models
3a & 4a) ................................................................................................................................................. 296
Table E.3: Annual production plan during normal operations for copper sulphate and gold liquor production
(models 3b & 4b) ................................................................................................................................... 297
Table E.4: Annual production plan during normal operations for copper sulphate liquor and gold sludge
production (models 3c & 4c) .................................................................................................................. 298
Table E.5: Annual production plan during normal operations for copper cathodes and gold liquor production
(models 3d & 4d) ................................................................................................................................... 299
Table F.1: Water softener sizing and operational data sheet (Soft water requirements and process water
chemistry) .............................................................................................................................................. 301
Table F.2: Water softening sizing and operational data sheet (Effluent generation and costing) ................. 302
Table F.3: Key product output analysis for all the plants business models 3a and 4a ................................. 303
Table F.4: Key product output analysis for all the plants business models 3b and 4b ................................. 303
Table F.5: Key product output analysis for all the plants business models 3c and 4c .................................. 304
Table F.6: Key product output analysis for all the plants business models 3d and 4d ................................. 304
Table F.7: Generic main equipment schedule ............................................................................................... 305
Table F.8: Main equipment cost schedule for all the sections....................................................................... 306
Table F.9: Process usage ratios used for the calculations ............................................................................ 307
Table F.10: Summary of the effluent streams from the different plants (Effluent flows for model 3a used for
illustration kgs/annum) ........................................................................................................................... 308
Table F.11: Annual schedule of material requirements for the entire process (based on business model 3a)
............................................................................................................................................................... 309
Table F.12: Schedule of detailed labour requirements (Overall schedule based on business model 3a) .... 310
Table F.13: Capital cost distribution by plant in each business model .......................................................... 314
Table F.14: Overall capital cost distribution for each business model .......................................................... 314
Table F.15: Breakdown of annual operating costs for each of the business models .................................... 315
Table F.16: Analysis of individual plant operating costs ................................................................................ 316
Table F.17: Accounting for copper distribution in each of the business models ........................................... 317
Table F.18: Accounting for the distribution of gold in each business model ................................................. 317
Table F.19: Analysis of operating costs versus gross revenue of each business model 3a to 4d ................ 317
Table F.20: Comparison of discounted cumulative cash flows for each of the models (3a-4d) .................... 318
Table F.21: Calculations for plots of capitalization ratio (CR) against time for each of the models (3a-4d) . 319
Table F.22: Calculations for plots of capital rate of return ratio (CRR) against time for each of the models (3a-
4d) .......................................................................................................................................................... 320
Table F.23: Calculations for plots of interest recovery period (IRP) against time for each of the models (3a-
4d) .......................................................................................................................................................... 321
Stellenbosch University https://scholar.sun.ac.za
xx
Table F.24: A summary of the additional gross revenue from sales of palladium, silver and tin at a business
efficiency of 70% scenario 1 .................................................................................................................. 322
Table F.25: A summary of the additional gross revenue from sales of silver, tin and palladium at a business
efficiency of 70% scenario 2 .................................................................................................................. 322
Table F.26: Effluent outflows from the respective sections per annum (kgs per annum) ............................. 323
Table F.27: The expected solid waste outflows originating directly from the process (kgs per annum). ...... 323
Table G.1: Sensitivity of models to changes in total capital invested ............................................................ 325
Table G.2: Sensitivity of models to changes in annual operating costs ........................................................ 326
Table G.3: Sensitivity of business models to changes in CAPEX and OPEX ............................................... 327
Table G.4: Sensitivity of models to changes in annual effluent treatment costs ........................................... 328
Table G.5: Sensitivity of models to changes in copper metal price (fixed gold/ gold liquor) ......................... 329
Table G.6: Sensitivity of models to changes in gold metal price (fixed copper/copper liquor) ...................... 330
Table G.7: Sensitivity of models to changes in metal prices ......................................................................... 331
Table G.8: Sensitivity of models to changes in copper sales volume (with fixed gold sales) ....................... 332
Table G.9: Sensitivity of models to changes in gold sales volumes (with fixed copper sales) ...................... 333
Table G.10: Sensitivity of models to changes in copper and gold sales volumes......................................... 334
Table G.11: Sensitivity of models to changes in WPCB purchase prices ..................................................... 335
Table G.12: Sensitivity of models to changes in copper recoveries .............................................................. 336
Table G.13: Sensitivity of models to changes in gold recoveries .................................................................. 337
Table G.14: Sensitivity of models to changes in both copper and gold recoveries ....................................... 338
Table G.15: Sensitivity of models to changes in capacity utilization ............................................................. 339
Table H.1: Waste management landscape 1989 to 2017 (Godfrey & Oelofse, 2017) ................................. 341
Table H.2: Legislation in South Africa affecting e-waste management practices (Finlay, 2005; GIZ, 2013) 342
Stellenbosch University https://scholar.sun.ac.za

xxi
LIST OF FIGURES
Figure 2.1: An analysis of the potential revenue realisable based on sales of pure metals using LME prices in
low, medium and high grade WPCBs (Cui & Zhang, 2008; USGS, 2017; Infomine, 2017) ...................... 9
Figure 3.1: Framework for developing e-waste strategy (Schluep, 2014) ....................................................... 28
Figure 3.2: Assessment indicator system for comparison and measurement of WEEE management systems
(Widmer et al., 2005) ............................................................................................................................... 35
Figure 3.3: Proportion of waste streams recycled in South Africa in 2016 expressed as percentages of the
total tonnage of waste handled (GreenCape, 2017) ............................................................................... 39
Figure 3.4: A comparative analysis of the current market size and potential material values of waste streams
in South Africa 2016 (US$) (GreenCape, 2017) ...................................................................................... 39
Figure 3.5: Analysis of the e-waste recycling activity in South Africa 2016 (proportion of tonnage processed)
(GreenCape, 2017) .................................................................................................................................. 40
Figure 3.6: Potential jobs that can be generated from recycling of different waste streams in South Africa for
2016 (GreenCape, 2017) ......................................................................................................................... 41
Figure 3.7: The generic WEEE recycling chain describing e-waste recycling activity in South Africa (Mouton
& Wichers, 2016; Lydall et al., 2017; GreenCape, 2017; 2018) .............................................................. 42
Figure 3.8: Distribution of e-waste inflows into the WEEE value chain in South Africa (2017) (GreenCape,
2018) ........................................................................................................................................................ 43
Figure 3.9: The distribution of technologies applied by some e-waste recyclers in South Africa (Finlay, 2005;
Widmer & Lombard, 2005; Lydall et al., 2017) ........................................................................................ 44
Figure 3.10: Distribution of some of the formal recyclers across the WEEE value chain (2017) .................... 45
Figure 3.11: Analysis of the focus of WEEE recycling activity of some of the registered recyclers (Lydall et
al., 2017) .................................................................................................................................................. 46
Figure 3.12: Market distribution for fractions derived from e-waste recycling by formal recyclers in SA (Lydall
et al., 2017) .............................................................................................................................................. 47
Figure 3.13: Volumes of e-waste handled by at least 25% of formal recyclers in South Africa (2015) (Lydall et
al., 2017) .................................................................................................................................................. 48
Figure 3.14: The PESTEL approach to analysing e-waste management and recycling in South Africa ........ 58
Figure 4.1: The generic flow sheet for the WPCB recycling process .............................................................. 66
Figure 4.2: Shredding and comminution circuit ............................................................................................... 69
Figure 4.3: The solder leaching process ......................................................................................................... 71
Figure 4.4: The copper recovery circuit ........................................................................................................... 73
Figure 4.5: The proposed process flow sheet of the nitric acid wash circuit ................................................. 101
Figure 4.6: The SART process (Redrawn (Estay et al., 2010) ...................................................................... 104
Figure 4.7: The gold recovery circuit ............................................................................................................. 109
Figure 5.1: Proposed organogram for production operating configurations 1 and 3 ..................................... 142
Figure 5.2: Proposed organogram for production operating configuration 2 ................................................. 143
Figure 6.1: An illustration of the anatomy of business models ...................................................................... 148
Figure 6.2: Product classification A - production of copper and gold metal .................................................. 149
Stellenbosch University https://scholar.sun.ac.za

xxii
Figure 6.3: Product classification B - production of copper and gold liquors ................................................ 150
Figure 6.4: Product classification C - production of copper liquor and gold metal ........................................ 151
Figure 6.5: Product classification D - production of copper metal and gold liquor ........................................ 152
Figure 6.6: Operations based classification 1 - all operations done in-house ............................................... 154
Figure 6.7: Operations based classification 2 - only size reduction is outsourced ........................................ 155
Figure 6.8: Operations based classification 3 - only collection and dismantling is outsourced ..................... 156
Figure 6.9: Operations based classification 4 - collection & dismantling and size reduction are outsourced 157
Figure 6.10: The first eight business models, groups 1 and 2 characterised by in-house collection and
dismantling of WPCBs ........................................................................................................................... 159
Figure 6.11: The last eight business models, groups 3 and 4 characterised by outsourced collection and
dismantling ............................................................................................................................................. 159
Figure 6.12: Basic EEE goods supply chain and components of the logistical costs ................................... 160
Figure 6.13: Three termination points for the reverse supply chain for EOL electrical and electronic goods 161
Figure 6.14: Screening criteria for business models with output for first level analysis (refer to sections 6.2.5
and 6.3) .................................................................................................................................................. 162
Figure 7.1: Overall capital cost distribution for each business model ........................................................... 178
Figure 7.2: Start-up costs for each business model ...................................................................................... 178
Figure 7.3: Capital cost distribution by plant in each business model ........................................................... 179
Figure 7.4: Graphical summary of the operating costs of each business model........................................... 183
Figure 7.5: Percentage contributions of the major operating cost drivers ..................................................... 184
Figure 7.6: Contribution of WPCBs to the total raw material costs in each business model ........................ 185
Figure 7.7: Comparison of plant operating costs for business models 3a and 4a ........................................ 186
Figure 7.8: Comparison of plant operating costs for business models 3b and 4b ........................................ 186
Figure 7.9: Comparison of plant operating costs for business models 3c and 4c ......................................... 186
Figure 7.10: Comparison of plant operating costs for business models 3d and 4d ...................................... 187
Figure 7.11: Comparing cost of gold in liquor versus market price of gold for business model 3b ............... 188
Figure 7.12: Comparing cost of gold in liquor versus market price of gold for business model 3d ............... 188
Figure 7.13: Comparing cost of gold in liquor versus market price of gold for business model 4b ............... 189
Figure 7.14: Comparing cost of gold in liquor versus market price of gold for business model 4d ............... 189
Figure 7.15: Accounting for the distribution of copper metal in each of the business models 3a to 4d ........ 190
Figure 7.16: Accounting for the distribution of gold metal in each of the business models 3a to 4d ............ 191
Figure 7.17: Gross revenue contributions from each of the business models .............................................. 192
Figure 7.18: Value of metals in WPCBs (adapted from Shuey & Taylor, 2004; Lydall et al., 2017). The gold
content was adjusted to 250ppm for this study ..................................................................................... 194
Figure 7.19: Evaluation of operating costs versus gross revenues of each business model ........................ 196
Figure 7.20: Comparison of discounted cumulative cash flows for each of the models (3a-4d) ................... 200
Figure 7.21: Plots of interest recovery period (IRP) against time for each of the models (3a-4d) ................ 201
Figure 7.22: Plots of capital rate of return ratio (CRR) against time for each of the models (3a-4d) ............ 202
Figure 7.23: Assessing the impact of increasing revenue from palladium, silver and tin recovery (scenario 1
Pd 50 ppm) ............................................................................................................................................ 208
Stellenbosch University https://scholar.sun.ac.za

xxiii
Figure 7.24: Assessing the impact of increasing revenue from silver, tin and palladium recovery (scenario 2
with maximum Pd (294ppm)) ................................................................................................................. 209
Figure 8.1: Effect of change in total capital invested on the NPV of the business models 4a to 4d ............. 214
Figure 8.2: Effect of changes in operating costs on the NPV of the business models 4a to 4d .................... 214
Figure 8.3: Effect of changes in WPCB purchase prices on the NPV of the business models 4a to 4d ....... 215
Figure 8.4: Effect of changes in annual effluent treatment costs on the NPV of the business models 4a to 4d
............................................................................................................................................................... 216
Figure 8.5: The effect of changes in both CAPEX and OPEX on NPV of the business models ................... 216
Figure 8.6: Effect of changes in copper prices on the NPV of the business models 4a to 4d ...................... 217
Figure 8.7: Effect of changes in copper product sales on the NPV of the business models 4a to 4d........... 217
Figure 8.8: Effect of changes in copper recoveries on the NPV of the business models 4a to 4d ............... 218
Figure 8.9: Effect of changes in gold prices on the NPV of the business models 4a to 4d ........................... 219
Figure 8.10: Effect of changes in gold product sales on the NPV of the business models 4a to 4d ............. 219
Figure 8.11: Effect of changes in gold recoveries on the NPV of the business models 4a to 4d .................. 220
Figure 8.12: Effect of changes in gold and copper metal prices on the NPV of the business models 4a to 4d
............................................................................................................................................................... 221
Figure 8.13: Effect of changes in copper and gold product sales on the NPV of the business models 4a to 4d
............................................................................................................................................................... 221
Figure 8.14: The effect of changes in copper and gold recoveries on the NPV of the business models ...... 222
Figure 8.15: Effect of changes in capacity utilization on the NPV of the business models 4a to 4d ............. 223
Figure 8.16: Effect of changes in the gold content in the WPCBs on the NPV of the business models 4a to 4d
............................................................................................................................................................... 224
Figure 8.17: Effect of changes in the gold content in the WPCBs on the DCFRR of the business models 4a to
4d ........................................................................................................................................................... 225
Figure 8.18: Comparison of the level of significance of each variable factor studied ................................... 227
Figure 8.19: Recapitalization risk assessment for each of the business models 3a to 4d ............................ 230
Figure 8.20: Clustering of variable factors in the sensitivity study under the areas of risk ........................... 231
Figure B.1: Nitric acid wash circuit process flow sheet ................................................................................. 273
Figure D.1: Size reduction equipment process flow diagram ........................................................................ 285
Figure D.2: Solder leaching equipment process flow diagram ...................................................................... 286
Figure D.3: Copper extraction equipment process flow diagram .................................................................. 287
Figure D.4: Tracing the movement of copper throughout the entire scope of operations ............................. 288
Figure D.5: Nitric acid wash equipment process flow diagram...................................................................... 289
Figure D.6: Gold extraction equipment process flow diagram (Cyanide leaching section) ........................... 290
Figure D.7: Gold extraction equipment process flow diagram (Adsorption and carbon regeneration sections)
............................................................................................................................................................... 291
Figure D.8: Acid wash, elution and electrowinning sections ......................................................................... 292
Figure D.9: Tracing the movement of gold throughout the entire scope of operations ................................. 293
Figure F.1: Production operating schedule for the first configuration from start up ...................................... 311
Figure F.2: Production operating schedule for the second configuration from start up ................................ 312
Figure F.3: Production operating schedule for the third configuration from start up ..................................... 313
Stellenbosch University https://scholar.sun.ac.za

xxiv
ABBREVIATIONS AND ACRONYMS
General abbreviations and acronyms
Symbol Meaning and definition
ADF Advance disposal fee
AHP Analytical hierarchy process
ARF Advance recycling fees
APME Advanced Polymers, Macromolecular Engineering
BGS British Geological Service
CAA Clean Air Act
CWA Clean water act
CERCLA Comprehensive Environmental Response, Compensation and Liability Act
DEA Department of Environmental Affairs
DEAT Department of Environmental Affairs and Tourism
DP Development Planning
DRC Democratic Republic of Congo
ECA Environment Conservation Act
ECU Electronic control unit/s
EIA Environmental impact assessment
ELV End of life vehicle
EMPA Swiss Federal Laboratories for Materials Science and Technology
EOL End of life
EPR Extended producer responsibility
EU European Union
eWA e Waste Alliance
e-WASA E- waste association of South Africa
GIZ Deutsch Gesellschaft für Internationale Zusammenarbeit
GKPER Global Knowledge Partnerships in e-waste Recycling
ICCM International Conference on Chemicals Management
ICs Integrated circuits
IESSA Illumination engineering society of South Africa
IMDS A vehicle data management system
ITA Information technology association
IndWMP Industrial Waste Management Plan
IP& WM Integrated Pollution and Waste Management
IWMSA Institute of Waste Management Southern Africa
IndWMP Industrial Waste Management Plan
Stellenbosch University https://scholar.sun.ac.za

xxv
Symbol Meaning and definition
IP& WM Integrated Pollution and Waste Management
IWMSA Institute of Waste Management Southern Africa
LCA Life cycle analysis
LCC Life cycle costing
MCA Multi criteria analysis
MFA Material flow analysis
MRA Metal Recyclers Association of South Africa
MTN Mobile Telephone Network
NEMA The National Environmental Management Act
NGO Non-governmental organization
NRF National Recycling Forum
NRF* National Research Foundation
NWMS National Waste Management Summit
OECD Organisation for Economic Co-operation and Development
OHSA Occupational Health and Safety Act
Pa Pascals
PC Personal computer
pH Potential of hydrogen ions
PWB Printed wiring boards
RAG Recovery Action Group
RCRA Resource Conservation and Recovery Act
RoHS Restriction on the use of hazardous substances
RRIs Resource recovery indices
SA South Africa
SADC Southern African Development Community
SAICM Strategic Approach to International Chemicals Management
SAS An American software company
SAWIS South African Waste information system
SECO Swiss State Secretariat for Economic Affairs
SMEs Small and medium enterprises
SWEEEA South African Waste Electrical and Electronic Association
TV Television
UK United Kingdom
UNEP United Nations Environmental Program
UNICEF United Nations Children’s Fund
USEPA United States Environmental Protection Agency
USGS United States Geological Service
Stellenbosch University https://scholar.sun.ac.za

xxvi
Symbol Meaning and definition
US United States
WBCSD World Business Council for Sustainable Development
WCRAG WCRAG Western Cape Recovery Action Group
ZimPhos Zimbabwe Phosphate Industries
Stellenbosch University https://scholar.sun.ac.za

xxvii
Economic abbreviations and acronyms
Symbol Meaning and definition
ACF Annual cash flow
ADCF Annual discounted cash flow
Ad Annual depreciation charge
BEP Breakeven point
fd Discount factor
fk Capitalized cost factor
CAPEX Capital expenditure/initial capital outlay
CBA Cost benefit analysis
CF Fixed costs
CFC Fixed capital investment
CK Capitalised cost of equipment
CL Cost of land
CTC Total capital cost
CR Replacement cost
CRR Capital rate of return ratio
CRRterm Terminal capital rate of return ratio
CWC Working capital cost
DBEP Discounted breakeven point
DCF Discounted cash flow
DCFRR Discounted cash flow rate of return
DCFRRmax Discounted cash flow rate of return when project life has an unlimited number
of years
EMIP Equivalent maximum investment period
ERP Equity risk premium
i interest
IRP Interest recovery period
IRR Internal rate of return
JSE Johannesburg stock exchange
LME London metal exchange
LSE London Stock exchange
n Years
NPV Net present value
OPEX Operating expenditure
PBP Payback period
PESTEL Political, economic, sociological, technological, environmental, legal.
PVR Present value ratio
Stellenbosch University https://scholar.sun.ac.za

xxviii
Symbol Meaning and definition
ROR Rate of return
SWOT Environmental analysis tool: Strengths, Weaknesses, Opportunities and
Threats
S/Vs Salvage or scrap value
∑ Summation of
WACC Weighted average cost of capital
Stellenbosch University https://scholar.sun.ac.za

xxix
Technical abbreviations and acronyms
Symbol Meaning and definition
Ag Silver
Ag(CN)2- dicyanidoargentate
AgS Silver sulphide
Al Aluminium
Al(OH)63- Hexaaquaaluminium ion
Al2O3 Aluminium trioxide
Al2S3 Aluminium sulphide
AVR Acidification, volatilization and recovery
Au Gold
Au(CN)2- dicyanoaurate complex
Au2Pb Hunchunite
AuPb3 Novodneprite
Bi Bismuth
Br Bromine
Ca Calcium
CaCO3 Calcium carbonate
CaO Calcium oxide
Ca(OH)2 Calcium hydroxide
CO2 Carbon dioxide
Ce Cerium
CIS Carbon in solution
Cl- Chloride ion
cm Centimetre
Co Cobalt
Co(CN)63- Cobalt hexacyanide ion
Cu Copper
CuCl2 Copper II chloride
Cu(CN)32- Cupric tricyanide complex
CuCO3 Copper II carbonate
CuO Copper II oxide
CuS Copper sulphide
CRTs Cathode ray tubes
CN- Cyanide ion
DLC Diffusion limiting current
ΔG Change in free energy (Delta G)
Stellenbosch University https://scholar.sun.ac.za

xxx
Symbol Meaning and definition
OC Degrees Celsius
EEE Electrical and electronic equipment
E-pH Electrode potential & pH
Fe Iron
Fe(CN)64- Iron hexacyanide ion
Fe(OH)3 Ferric hydroxide
FeO Ferrous oxide
FeS Ferrous sulphide
Ge Germanium
g/L Grams per litre
GW General waste
HCl Hydrochloric acid
Hg(CN)42- Mercury (II) tetracyanide complex
HNO3 Nitric acid
H2O2 Hydrogen peroxide
H2S Hydrogen sulphide
H2SiO3 Metastannic acid
H2SO4 Sulphuric acid
HC Harvest cycle
Hp/hp Name plate horse power
hpb Full load horse power
HW Hazardous waste
ICT Information and communication technology
In Indium
ITO Indium tin oxide
IT Information technology
Kg Kilogram
KNO3 Potassium nitrate
KW/h Kilowatt/hours
La Lanthanum
LCA Life cycle assessment
LCC Life cycle costing
LCD Liquid crystal display
LEDs Liquid electronic displays
Li Lithium
Stellenbosch University https://scholar.sun.ac.za

xxxi
Symbol Meaning and definition
LiCoO2 Lithium cobalt oxide
LiFePO4 Lithium iron phosphate
LiMn2O4 Lithium manganese oxide
LiNiO2 Lithium nickel dioxide
M Molar
mm Millimetre
Mn Manganese
MCA Multi criteria analysis
MFA Material flow analysis
µmol/g Micro mole per gram
MLCC Multilayer ceramic capacitor
MnO Manganese oxide
MnO2 Manganese IV oxide
Na Sodium
NaCl Sodium chloride
NaClO Sodium hypochlorite
NaClO3 Sodium chlorate
NaHS Sodium hydrosulphide
NaOH Sodium hydroxide
NaS2O3 Sodium thiosulphate
Nd Neodymium
NH3 Ammonia
NH5CO3 Ammonium bicarbonate
NH4CO3 Ammonium carbonate
(NH4)2SO4 Ammonium sulphate
(NH4)2S2O3 Ammonium thiosulphate
Ni Nickel
Ni-Cd Nickel cadmium
Ni(CN)42- Tetracyanonickelate complex ion
NiMH Nickel metal hydride
NO Nitrogen oxide
NO2 Nitrogen dioxide
OCD Operating current density
OLED Organic light-emitting diode
P Phosphorus
OLED Organic light-emitting diode
Stellenbosch University https://scholar.sun.ac.za

xxxii
Symbol Meaning and definition
Pb Lead
PbCl2 Lead II Chloride
Pb(CN)42- Lead (II) tetracyanide
PbO Lead oxide
β PbO Beta lead oxide
Pb(OH)2 Lead hydroxide
Pb(OH)3- Lead trihydroxide ion
PbS Lead sulphide
PbSO4 Lead II sulphate
PBDD Polybrominated dibenzo-p-dioxins
PBDE Polybrominated diphenyl ethers
PBDF Polybrominated dibenzo furans
PCB Printed circuit board
PC Personal computer
Pd Palladium
PE Polyethylene
PEL Permissible exposure limits
PGMs Platinum group metals
PLS Pregnant leach solution
PMs Precious metals
PP Polypropylene
ppm Parts per million
PWB Printed wiring board
REE Rare earth elements
REO Rare earth oxides
Ru Ruthenium
SART Sulphuridization, Acidification, Recovery, Thickening acronym for post cyanide
leaching of copper rich liquors in gold processing
Sb Antimony
SDS Safety data sheets
Se Selenium
SiO2 Silicon dioxide
Sn Tin
SnO2 Tin II oxide
SnS2 Tin (IV) sulphide
SO2 Sulphur dioxide
TBB Tetrabromobenzotriazole
Stellenbosch University https://scholar.sun.ac.za

xxxiii
Symbol Meaning and definition
TBBPA Tetrabromobisphenol-A
TBP Tributylphosphate
TDS Total dissolved solids
Te Terullium
TWA Time weighted average
WAD Weak acid dissociable
WEEE Waste electrical and electronic equipment
WHS Working hours of stripping machine
WOC Weight of one sided copper cathode deposit
WPCB/s Waste printed circuit board/s
Y Yttrium
Zn Zinc
Zn(OH)2 Zinc hydroxide
Zn(OH)42- Zincate complex
ZnS Zinc sulphide
Stellenbosch University https://scholar.sun.ac.za

1
Chapter 1: INTRODUCTION
1.1. Project background
Electronic waste is the fastest growing municipal waste globally (Schluep et al., 2009). This
presents opportunities to exploit the rich source of metals found in waste printed circuit boards.
The same remarks can be made for South Africa as alluded to by the Department of Science and
Technology (DEA, 2012).
WPCBs are composed of metallic and non-metallic material of which the bulk of the value realized
is derived from the extraction of base and precious metals. Researchers have explored and
described several methods that include mechanical, bio-metallurgical, pyrometallurgical and
hydrometallurgical processes to recover these metals (Kamberović et al., 2011; Rossouw, 2015;
Birloaga et al., 2016).
Waste valorisation through waste printed circuit board (WPCB) recycling is limited by the existing
processing capacity and related infrastructure. At present no prospects for major capital
expenditure exist owing to the low inflows of raw material as reported by major findings of recent
surveys (Lydall et al., 2017; GreenCape 2017; 2018).
The existent players in the field are concentrated upstream of the e-waste recycling chain. The
major activities upstream of the recycling chain are associated with the collection, dismantling and
refurbishment of the e-waste.
1.2. Project scope
There exists scope for increasing the value realisable from hydrometallurgical recycling of WPCBs.
The detailed economic studies of the hydrometallurgical process and associated business models
have not been studied for processing capacities warranting the installation of field plants. Most
evaluations on a large scale have focused on pyrometallurgical processes (Hagelüken, 2006;
Ghodrat et al., 2016). Economic evaluations have been undertaken for mobile plants that process
not more than 2000 tonnes per annum of WPCBs in South Africa (Lydall et al., 2017). This project
seeks to also identify and relate the internal and external factors that affect the development of
business models suited to the South African e-waste recycling landscape and existing metals
processing facilities in the country. Further afield, other researchers have studied the economics
of proposed small scale hydrometallurgical processes for precious and base metals recovery
(Kamberović et al., 2011; Birloaga et al., 2016). Opportunity exists for the creation of more jobs
from e-waste recycling activities in South Africa (Godfrey et al., 2015; Lydall et al., 2017;
GreenCape, 2018).
Stellenbosch University https://scholar.sun.ac.za

2
1.3. Project objectives
A consideration of the best available technologies for recycling WPCBs was done. A study was
then undertaken to investigate the effect of mechanical pre-treatment on the leaching of base
metals from waste printed circuit boards (Rossouw, 2015). The findings of the investigation
showed that there was no significant improvement in the leaching performance following pre-
treatment of the WPCBs to concentrate the metal fractions. The results however revealed that
scope existed for selectively leaching the base metals, prior to the recovery of the precious metals.
The investigations formed the foundation upon which a hydrometallurgical process was developed
to selectively leach base metals and recover the copper and gold in two separate leaching
campaigns (de Waal, 2018).
Taking into consideration the material flows and existing legislation within South Africa, the
economics of selective base and precious metals leaching must be examined to ascertain its
viability and sustainability over a 20 year project life span. This project aims to add a capstone in
the decision-making process by examining the economic viability of the proposed process flow
sheets while exploring business models applicable to the South African context. Further, this study
aims to determine the best possible way to position businesses in the e-waste recycling industry in
the country.
In order to effectively examine the economic feasibility of the proposed hydrometallurgical process
and its applicability in the South African context, the project was approached with three major
objectives in mind which entailed:
• The development of an understanding of the current position of e-waste management and
legislation affecting e-waste recycling in South Africa.
• Defining and comparing different business models for WPCB metals recycling.
• Evaluating and assessing the economic performance of each business model based on the
proposed hydrometallurgical process.
1.4. Findings and status of supporting projects
Research exploring the recovery of copper and gold from waste printed circuit boards was
pioneered by investigations undertaken by previous researchers. Rossouw (2015) examined the
impact of pre-treatment on the leaching of base metals in waste printed circuit boards (WPCBs).
Two major options were presented for the recovery of copper and gold. The first incorporated a
metals enrichment stage through physical processes. The second option did not include further
physical pre-treatment after size reduction of the WPCBs.
Stellenbosch University https://scholar.sun.ac.za

3
It was noted that while the pre-treatment of the crushed solids allowed an enrichment of the lighter
fractions with gold, some of the copper also reported to this fraction. It was therefore necessary to
conduct selective leaching of the base metals. For the conditions specified, using nitric acid and
sulphuric acid as the chief lixiviants, the effect of pre-treatment on the leaching performance was
not altered significantly (Rossouw, 2015). In light of the arguments presented the second option
without physical pre-treatment was selected for further development. Having defined optimum
leaching conditions for the selective removal of base metals, the first preliminary flow sheet was
developed. The flow sheet however did not include the detailed recovery of gold and other
precious metals.
It has been demonstrated by researchers that the hydrometallurgical recovery of precious metals
from WPCBs is technically feasible (Kamberovič et al., 2011; Birloaga et al., 2011; 2013; Rossouw,
2015).
Building on the previous investigations, a detailed hydrometallurgical process, for selectively
leaching base metals prior to recovering gold was developed. The findings and proposed flow
sheet (Rossouw, 2015) were developed further by de Waal (2018).
A pyrometallurgical process rated at an operating capacity of 30 000 tonnes per annum was
designed by Ghodrat et al., (2016). The researchers analysed the economic performance of the
specified process. The potential available to recycle e-waste at this capacity motivated a
comparative evaluation of a hydrometallurgical process for recycling e-waste, in this case WPCBs
at a similar operating capacity. Detailed process flow sheets, accompanied by mass and energy
balances to selectively leach solder with the subsequent recovery of copper and gold were
therefore completed using an operating basis of 30 000 tonnes of WPCBs per annum. The scale of
operations of the proposed hydrometallurgical process was reviewed with a consideration of the
availability of the key raw material in the e-waste recycling chain and the available recycling activity
that could feed into the main operations. Findings of the due diligence conducted on the business
environment revealed that the operating scale would have to be reduced. A recycling rate of
400tonnes of WPCBs was used in the study.
The main process, operating parameters and major equipment requirements were specified. Using
a commercially established technology, cyanide leaching of gold was selected as the means to
extract the gold from the solids stripped of the base metals (de Waal, 2018).
1.5. Project methodology
The due diligence of the proposed operating capacity was undertaken in which a consideration of
the raw material availability This study was undertaken for a plant rated at a processing capacity of
400 tonnes of WPCBs per annum.
Stellenbosch University https://scholar.sun.ac.za
4
1.5.1. Literature review
A detailed literature study was undertaken which began with a discussion of printed circuit boards
and their types based on the methods of manufacture. The valuation and generation of WPCBs
was considered. A review of mechanical and hydrometallurgical recycling of WPCBs was also
considered in the discussion. The section was concluded by a detailed review of the economics
associated with recycling WPCBs.
1.5.2. E-waste management in South Africa
The analysis of the South African e-waste recycling landscape was undertaken with an
examination of the dominant technologies used for recycling e-waste. The first research objective
was addressed in this section and it enabled a holistic understanding of the prevailing status of e-
waste recycling and management in the country. In order to achieve this objective, a detailed
desktop study was undertaken to examine the factors that affect e-waste management and its
recycling in South Africa as a whole.
1.5.3. Process description and design considerations
Findings of the assessment of the South African landscape revealed that there were low barriers to
entry downstream of the e-waste recycling chain with respect to value adding activities. It was
revealed that an opportunity existed to exploit this observed deficit along the e-waste recycling and
value chain. The output of the previous and ongoing studies formed the foundation for the current
project. The data from the previous and current research was used to specify the process
parameters and plant operating considerations used for developing the proposed
hydrometallurgical process.
1.5.4. Considerations for project economic evaluations
Economic considerations used in the study were covered in chapter five. In this same chapter the
assumptions used for the capital and operating cost estimates were also discussed. The
development of production plans and specification of the organograms relevant for each production
plan was also outlined in this section. Assumptions related to the plant maintenance and utilities
were included.
1.5.5. Development and selection of business models
Sixteen business models were defined based on the criteria that were described in chapter six.
Key metrics influencing the strategic competitive position of the proposed venture was considered.
The output of the study formed the initial basis upon which the business models were evaluated
and screened.
Stellenbosch University https://scholar.sun.ac.za

5
1.5.6. Project costing and profitability assessments
The costing and economic evaluations were done for the selected business models using the
assumptions discussed in chapter five. The profitability of the business models was evaluated on
an annual basis and over the entire project life. Further screening of the remaining business
models was done based on the output of the economic study.
1.5.7. Sensitivity and risk analysis
Chapter eight was committed to a detailed sensitivity analysis of the selected business models in
order to examine the viability of the proposed venture in response to macro and microeconomic
influences. The findings were used to assess the robustness of the proposed process as a going
concern in the face of intrinsic and extrinsic influences. An assessment of susceptibility to
environmental risk factors for the selected business models was supported by the output of the
sensitivity analysis.
1.5.8. Conclusions and recommendations
Conclusions and recommendations were specified from the output of the studies covering an
assessment of the South African e-waste recycling landscape and the economic evaluation of the
business models specified for the hydrometallurgical recycling of WPCBs.
Stellenbosch University https://scholar.sun.ac.za

6
Chapter 2: LITERATURE REVIEW
2.1. Introduction
Several benefits are associated with e-waste recycling. Some of the benefits include materials
recovery, diversion of waste volumes from landfill, curbing potential illicit waste disposal practices,
realisation of potential energy savings and socio-economic benefits associated with the recycling
chain. The extraction of metals from low grade ore bodies is associated with the high energy usage
and a significant carbon foot print. While e-waste is a rich source of metals in concentrations often
four times or more than their respective native ores (Hagelüken, 2006). Metals recovery from
polymetallic urban ores such as, waste printed circuit boards (WPCBs) is characterised by a lower
carbon and energy footprint (Cui & Forrsberg, 2003; Wang & Gausted, 2012; Akcil et al., 2015).
Substantial research work combining different metallurgical processes has been undertaken. The
investigations are accompanied by detailed economic project evaluations (Ghodrat et al., 2016).
2.2. Printed circuit boards
2.2.1. Types of printed circuit boards
Printed circuit boards (PCBs) are complex polymetallic modules comprised of interconnected
electronic components with circuits printed onto a non-conducting substrate. Connectors in the
form of contact fingers enable PCBs and electrical devices to be joined together. There are three
major types of PCBs and they include: single sided, double sided and multi-layered PCBs. Table
2.1 below classifies the PCBs based on their mechanical properties (streamlinecircuits, 2016).
Table 2.1: Classification of printed circuit boards (PCBs) based on mechanical properties
Type Description
Single sided PCBs This type has one layer of substrate onto which a thin layer of metal covers it. Electronic components and circuits are found on one side.
Double sided PCBs Both sides of the substrate are lined with a thin layer of metal. Through hole or surface mount technology can be applied to these PCBs.
Multilayer PCBs Extension of double sided PCBs. The number of layers is a function of the applicability of the board. The holes can be used to interconnect the boards to each other.
Rigid PCBs This type has a substrate material composed of hard inflexible material chiefly fibre glass.
Flex PCBs This type is made of substrate material that is usually a flexible plastic single, double or multilayer.
Rigid-Flex These combine the properties associated with rigid and flex PCBs.
Stellenbosch University https://scholar.sun.ac.za

7
2.2.2. Characterisation of waste printed circuit boards
The metallic composition of a printed circuit board is dictated by the functional capabilities it has
been designed to achieve. The varied metallic composition is attributed to the different
conductivities and thermal stabilities associated with some of the metals which influence the extent
to which they are incorporated in the manufacture of the specific printed circuit board.
Table 2.2 shows the variation of the metal compositions of WPCBs from different sources across
the spectrum of the different e-waste classifications. E- waste sources from ICT equipment and
personal electronic gadgets have a higher precious metals content than the larger electronic and
electrical consumer goods.
Table 2.2: The metal compositions (%) of WPCBs from nine different sources (Excerpt from
Cucchiella et al., 2016)
Metal Fridge Washing Machine
Air con.
Desktop PC
Note book PC
Mobile phone
CRT TV
Stereo Sys.
Digital Cam.
Iron 2.10 9.50 2.00 1.30 3.70 1.80 3.40 1.20 3.00
Copper 17.00 7.00 7.50 20.00 19.00 33.00 7.20 15.00 27.00
Silver - - - - 0.10 0.40 - - 0.30
Gold - - - - 0.10 0.20 - - 0.10
Aluminium 1.60 0.10 0.70 1.80 1.80 1.50 6.20 2.90 2.40
Barium - - - 0.20 0.60 1.90 0.20 0.10 1.60
Chromium - - - - 0.10 0.10 - - 0.30
Lead 2.10 0.20 0.60 2.30 1.00 1.30 1.40 1.90 1.70
Antimony 0.30 - - 0.20 0.10 0.10 0.30 - 0.20
Tin 8.30 0.90 1.90 1.80 1.60 3.50 1.80 2.20 3.90
Zinc 1.70 0.20 0.50 0.30 1.60 0.50 5.30 1.40 0.90
Table 2.3 provides a summary of the typical and variant WPCB metallic compositions as analysed
by researchers over a 21 year period. The different WPCB samples analysed by the various
researchers were subjected to different forms of mechanical pre-treatment. Between 10% and 35%
of the precious metals in WPCBs reports to the fines fraction during the comminution stage
(Hagelüken, 2006; Yazici, 2015). Ogunniyi et al., (2009) noted that no standard literature is in
existence that provides a baseline frame of reference by which methods of WPCBs can be
analysed and characterised. The polymetallic nature of WPCBs further complicates the
development of a standard frame of reference for WPCBs. Spectroscopic methods however yield
good results for qualitative assays of WPCBs (Ogunniyi et al., 2009).
Stellenbosch University https://scholar.sun.ac.za

8
Table 2.3: The typical and variant WPCB metallic compositions
Researchers Ag Cu Sn Pb Ni Au Mn Sb Al Fe Zn Ca Pd
(ppm) (ppm) (ppm)
Silvana et al., (2013) 43.70 16.68 5.23 0.82 0.49 12.83 0.003 0.008 0.26 4.87 7.69 0.06
Birloaga et al., (2013) 668.00 30.57 7.36 6.70 1.58 238.00 11.69 15.21 1.86
Birloaga et al., (2013) second sample 689 31.77 6.98 4.92 1.96 369 10.54 13.77 2.23
Yang et al., (2009) 25.06 1.86 0.80 0.003 4.65 0.66 0.04
Oishi et al., (2007) 26.00 4.90 3.00 1.50 0.11 0.16 3.20 3.40 2.60
Behnamfard et al., (2013) 704.31 19.19 0.69 0.39 0.17 130.25 0.04 0.37 4.01 1.13 0.84
Park & Fray (2008) 0.10 16.00 3.00 2.00 5.00 5.00 1.00 0.01
Hao et al., (2008) 800.00 23.73 3.65 4.48 3.32 800.00 1.82 4.70 210.00
Ogunniyi & Vermaak (2009) 3301.00 23.47 1.54 0.99 2.35 570.00 1.33 1.22 1.51 294.00
Ogunniyi & Vermaak (2007) 1000.00 20.00 1.50 1.00 250.00 5.00 7.00 110.00
Hagelüken (2006) 2000.00 20.00 4.00 2.00 2.00 1000.00 0.40 2.00 8.00 1.00 50.00
Shuey & Taylor, (2004) 2000.00 20.00 4.00 2.00 2.00 1000.00 0.40 2.00 8.00 1.00 50.00
Sum (1991) 3300.00 26.80 1.00 0.06 1.90 5.30 1.50
Zhao et al., (2004) 110.00 10.00 1.20 0.85 280.00 7.00 12.00 1.60
Zhang & Forrsberg (1997) 1240.00 15.60 3.24 1.35 0.28 420.00 1.40 0.16 10.00
Kim et al., (not dated) 22.00 2.60 1.55 0.32 350.00 3.60
Iji & Yokoyama (1997) 1300.00 17.85 5.28 4.19 1.63 350.00 4.78 2.00 2.17 250.00
Cui & Zhang (2008) 280.00 10.00 1.20 0.85 110.00 7.00 12.00
Guo et al., (2009) 3300.00 26.08 1.00 0.47 80.00 4.70 5.30 1.50
Goosey & Kellner (2002) 0.05 16.00 2.00 0.03 3.00 0.01
Sum et al., (2005) 0.20 20.00 4.00 2.00 2.00 0.10 8.00 1.00 0.005
Albertyn (2017) 589.50 26.42 5.45 1.23 0.44 158.00 0.71 2.07
Stellenbosch University https://scholar.sun.ac.za
Stellenbosch University https://scholar.sun.ac.za

9
2.2.3. Valuation of waste printed circuit boards (WPCBs)
The purchase price of unprocessed e-waste has been estimated to range between US$375 to
US$500 per tonne and this variation is largely due to the grade of the e-waste (UNEP, 2007).The
value of printed circuit boards is predominantly a function the intrinsic metal value embedded within
it (Hagelüken, 2006). Three economic classifications of WPCBs were discussed by Hagelüken
(2006). The classifications are based on the amount of gold contained in the WPCBs and are
described in Table 2.4:
Table 2.4: Economic classification of WPCBs (Hagelüken, 2006)
Grade Typical gold content (ppm) Examples
Low < 100 TV-boards, monitor boards, phones, calculators, shredded bulk material (Al and Fe free)
Medium 100 to 400 PC-boards, lap-tops and hand held computers, some mobile phones
High > 400 Some mobile phones, ICs, MLCCs, circuit boards from main frames
Figure 2.1 shows the value distribution expressed in US dollars for the different types of WPCBs.
Typical assays of WPCBs from TV boards, PC boards and PC main boards were used for the
analysis (Cui & Zhang, 2008; USGS, 2017; Infomine, 2017).
Figure 2.1: An analysis of the potential revenue realisable based on sales of pure metals using LME
prices in low, medium and high grade WPCBs (Cui & Zhang, 2008; USGS, 2017; Infomine, 2017)
Stellenbosch University https://scholar.sun.ac.za

10
Cui & Zhang (2008) undertook a similar analysis of differing sources of electronic scrap. The
materials analysed also included WPCBs from varied sources. The findings allowed the
researchers to make a comparative illustration of the valuation of the electronic scrap. It was
shown that WPCBs derived from mobile phones and PCs attracted the highest value. This value
was derived from the precious metals content. A comparison of the gold content in each sample
showed a similar trend observed by other workers (Legarth et al., 1995; Zhang & Forrsberg, 1997;
Theo, 1998; Hagelüken, 2006; Cui & Forrsberg, 2003; CPCB, 2007).
2.2.4. Environmental impacts of waste printed circuit boards handling
Waste printed circuit boards are made up of metallic and non-metallic materials that are classified
as hazardous substances. An analysis of the current epidemiological data on the population of
Guiyu China has linked the bioaccumulation of heavy metals in the residents of Guiyu to the
pollution, both aquatic and terrestrial arising from e-waste recycling activity in the town. Results of
soil assays within and around the town also show comparatively elevated levels of heavy metals
associated with processing of e-waste.
Akcil et al., (2015) identified significant deleterious effects of e-waste recycling activities that
include, the generation of pollutant gases and acid effluent streams laden with heavy metals, the
cumulative deterioration of the quality of terrestrial, human and aquatic life, depletion of useful and
safe land space and the declining life expectancy of local communities and fauna.
Hazards and impacts emanating from e-waste recycling activities are derivatives of the primary,
secondary and tertiary contaminants. The primary hazards and impacts are derived from the waste
itself. These include the heavy metals contained within and the plastics impregnated with flame
retardants (Schluep et al., 2009). The flame retardants include tetrabromobisphenol-A (TBBPA)
and polybrominated diphenyl ethers (PBBs). These substances have been associated with the
generation of cancer precursors during low temperature combustion of the plastic materials in
which they are contained.
Secondary hazardous components are generated from the recycling methods typically associated
with informal practices. These hazards and impacts manifest as contaminated effluent discharges,
toxic emissions of combustion activities and dumping of scavenged e-waste components. The
effluent discharges are characteristically acidic and this promotes the migration of heavy metals
from residual e-waste into both the stagnant and mobile water bodies (Nnorom & Osibanjo, 2008).
The partial processing of e-waste also presents the additional risk of leaching the flame retardants
from the matrix of the plastics when exposed to environmental conditions (Commission of the
European Committees, 2000; Robinson, 2009).
Stellenbosch University https://scholar.sun.ac.za
11
Robinson (2009) discussed the mechanism of the migration of poly brominated diphenyl ethers
(PBDEs) into the environment. The researcher noted that the absence of chemical bonds between
the flame retardants and the plastic matrix increases the likelihood of the migration of the PBDEs
into the environment. While bioaccumulation coefficients have been reported to be marginal, the
effect in plant life was noted to still play a contributory role (Liu et al., 2008; Robinson, 2009).
The tertiary contaminants emanating from e-waste processing constitute by-products of recycling
operations that employ any of the technologies that include pyrometallurgy, hydrometallurgy, bio-
hydrometallurgy or mechanical processing. Large scale pyrometallurgical operations are
associated with gaseous emissions.
Flue gas scrubbers and other containment measures for handling the emissions have been used
successfully in these installations like Umicore in Belgium (Hagelüken, 2006).
The drive towards sustainable practices along the value and supply chains of the electrical and
electronic goods industry continues to be spear headed by forums that include the United Nations
Development Programme (UNDP), Strategic Approach to International Chemicals Management
(SAICM), the United Nations Environmental Programme (UNEP) and the International Conference
on Chemicals Management (ICCM).
Key issues brought to the fore include agendas that will enable the realisation of a reduction in
toxic substances during the design and manufacture of electrical and electronic goods, promote
the detailed investigation and hence understanding of polybrominated flame retardants and
promote global solutions for e-waste management problems. The solutions are also meant to cater
also cater for both developing and transitioning economies. In these forums it has been agreed that
concerted efforts are required to build capacity in these regions to better handle e-waste (SAICM,
2009).
2.2.5. Motivation for WPCB recycling
An analysis of the typical compositions of varied sources of electronic waste shows that scrap cell
phones, printed circuit boards and calculators report the highest metal value with respect to gold
and other precious metal content (Anon, 2001; Cui & Zhang, 2008). The gold value locked in waste
printed circuit boards has been reported to range between 80 and 1 500 grams/tonne (Veldhurizen
& Sippel, 1994; Amey, 2002). Base and precious metals are found in higher grades than traditional
ore bodies (Zhang & Forssberg, 1998; Cui & Zhang, 2008; Hagelüken 2006). The recent increases
in base and precious metal prices has provided sufficient stimulus for increased value addition
along the WPCB recycling chain (Wang & Gausted 2012; GreenCape, 2018). Table 2.5 provides a
summary of the annual production volumes and demand of metals commonly used in the
production of electrical and electronic equipment (EEE).
Stellenbosch University https://scholar.sun.ac.za

12
Table 2.5: Metals commonly used in the production of electrical and electronic equipment based on
2006 demand (Schluep et al., 2009)
Metal Primary production
Tonnes/annum
By product from
Demand for EEE
Tonnes/annum
Production or demand
%
Applications
Silver 20000 Lead, Zinc 6000 30 Contacts, switches and solders
Gold 2500 Copper 300 12 Bonding wire, contacts, integrated circuits
Palladium 230 PGM 33 14 Multilayer capacitors and connectors
Platinum 210 PGM 13 6 Hard disk, thermocouple, fuel cell
Cobalt 58000 Nickel, Copper
11000 19 Rechargeable batteries
Bismuth 5600 Lead, Tungsten and Zinc
900 16 Solders, capacitor, heat sink
Selenium 1400 Copper 240 17 Electro-optic, solar cell, copier
Indium 480 Zinc and lead
380 79 LCD glass, solder, semiconductor
Ruthenium 32 27 84 Hard disk, plasma displays
Copper 15000000 4500000 30 Rechargeable batteries
Tin 275000 90000 33 Solders
Antimony 130000 65000 50 Flame retardant, CRT glass
The energy expenditure associated with recycling WPCBs is comparatively lower than processes
associated with metal recovery from their native ores (Akcil et al., 2015). A comparison of the
material energy savings realised when metals were recovered from WPCBs was undertaken by
researchers (Cui & Forrsberg, 2003; Wang & Gausted, 2012). The results of the studies conducted
are summarized in Table 2.6. The results revealed significant energy savings associated with
recycling of base metals especially copper and gold.
Table 2.6: Energy savings realized when metals are recovered from recycling of WPCBs.
Metals Cui & Forrsberg (2003) %
Basis – not specified
Wang & Gausted (2012) %
Basis – per tonne WPCBs processed
Aluminium 95 5
Copper 85 1
Lead 65
Silver 65
Gold 1
Zinc 60
Iron 74
Platinum 4
Tin 6
Palladium 14
Nickel 1
Stellenbosch University https://scholar.sun.ac.za

13
A reduction in the carbon footprint associated with mining and extraction of gold, cobalt and
palladium is one of the attendant benefits of WPCB recycling. The production of a tonne of gold,
palladium or platinum from native ores is associated with the generation of 17 000 tonnes of
carbon dioxide. It is estimated that 23.4 million tonnes per annum of carbon dioxide are generated
as a result of the production of copper, cobalt, tin, tantalum, silver, indium, ruthenium, platinum and
palladium for use in the electrical and electronics industry. Gold and copper have been found to
contribute the highest carbon dioxide emissions based on an analysis of the demand of metals in
the EEE industry (Schluep et al., 2009).
2.2.6. Perceived threats to the viability of WPCB recycling
The evaluation of the overall recycling efficiency is a multiple function of the major activities across
the recycling chain. The synergy between the government, recyclers and recycling enterprises has
been identified as the means to enhance recycling efficiency of e-waste (Li et al., 2016). The
mobilization of existent participants into a more formalised structure is paramount to the success of
the synergy.
Inadequate financing structures to support the reverse logistics of e-waste collection erode the
viability of WPCB recycling. Decreasing intrinsic value of WPCBs as a result of the declining
precious metals content further reduces the viability of WPCB recycling operations (SAICM, 2009).
The development of alloys bearing similar performance characteristics to the precious metals have
led to the aforementioned decline.
Product miniaturization has also contributed to an overall reduction in metals composition which
has negative implications on the economic viability of WPCB recycling operations. Increasing the
volumes of material processed to recover the same output of target metals yields a net increase in
the volumes of effluent and emissions handled.
The viability of WPCB recycling with the objective of maximising metals recovery is also threatened
by the existence of conflicting material recovery priorities. The result is a sacrificial loss of rare
earth elements to landfills as residual material from copper, nickel, gold, silver, and PGMs
recovery. The recycling of gallium in LEDs and ICs for example was shown to conflict with gold and
copper recovery after a material flow analysis of gallium from EEE was undertaken (Ueberschaar,
2017).
The unregulated activities of the informal e-waste recycling sector, as seen in cases studies of
India, China, Pakistan, Ghana and Nigeria for example, are typically associated with low metals
recovery efficiencies and high rates of environmental pollution (Sinha 2004; Schluep et al., 2009;
Grant et al., 2013; Shamim et al., 2015; Hector, 2017).
Stellenbosch University https://scholar.sun.ac.za

14
The sustained existence and growth of the informal e-waste recycling sector is attributed to the
general unwillingness of the formal sector or potential participants in the formal sector to commit
financial resources towards proper e-waste disposal. Conflicting interests emanate from the
potential that exists for making money in a less capitally and operationally intensive manner.
Owners of obsolete equipment would rather exploit the opportunity to resell the EEE rather than
spend money to dispose of the end of life electrical and electronic equipment (EOL EEE) through
the prescribed channels.
The failure to grasp the long and short term pathological implications and environmental impacts of
informal e-waste recycling activities and the involved stakeholders weakens the efficacy of
measures instituted by governments to merge and formalise the e-waste recycling sector (Hicks et
al., 2005).
The existence of weak institutional structures unable to effectively merge informal recycling
activities, results in cumulatively low resource recovery rates ranging between 28% and 30%. Poor
accountability and lack of homogeneous practices complicates data collection process relevant to
all activity associated with the e-waste recycling chain. In systems where policy is enforced, weak
institutional structures have been also be shown to exhibit a retrogressive impacts to the effective
realisation of value in the long run (SAICM, 2009; Cuchiella et al., 2016).
2.3. Recycling of metals from waste printed circuit boards (WPCBs)
2.3.1. Recycling of WPCBs
The recycling of WPCBs has been under study for over three decades. Much of the research work
has exploited the varied properties of the waste printed circuit boards to extract metals of
significant economic relevance. The technologies include hydrometallurgical, pyrometallurgical,
mechanical and bio-hydrometallurgical processes. Combinations of the processing options have
been studied to examine the best configurations for maximising the extraction of target metals in
an economically and environmentally efficient manner.
Dismantling e-waste and recovery of WPCBs
Further to developing mechanical separation as the method of choice, is the question of
adequately addressing dismantling of the components. To date the automation of the dismantling
process still remains a challenge. Deep dismantling activities are characteristically associated with
a high manual input (Schluep et al., 2009). The manual sorting and dismantling of EOL electronic
waste still offers a more precise method for effectively separating reusable parts from those ready
for discarding or further processing in the recycling chain (Cui & Forssberg, 2003).
Stellenbosch University https://scholar.sun.ac.za

15
The extent to which deep dismantling is achieved determines the efficiency of accessing WPCBs in
a form in which the contained metal value is preserved. Mechanical intervention has been shown
to result in precious metal losses as a result of co-separation.
2.3.2. Mechanical recycling of WPCBs
Mechanical treatment of secondary metal sources in recent years has emerged as an alternative
and less chemically aggressive option for recovering metals from polymetallic secondary sources.
This method exploits the various physical properties associated with the constituent materials in
the scrap to achieve materials separation. A consideration of the heterogeneous composition of
WPCBs as noted by Cui and Forrsberg (2003), necessitates a thorough characterisation of the
material, key to the development of an efficient working process flow sheet for metals recovery. Cui
& Forssberg (2003) noted that research to date on mechanical recycling of WPCBs and other
electronic waste has shown an inclination towards recycling of electronic waste composed of a low
precious metals grade. A plethora of physical separation processes are employed in combination
owing to the complex material composition of EOL EEE like WPCBs. The work done to date
exploiting physical separation methods has focused predominantly on the major elements like
copper, iron and aluminium (Lee et al., 2004; Birloaga et al., 2016). Focus rapidly shifted in favour
of fully exploiting and maximising value realisation from all constituent materials of WPCBs.
Detailed investigations have been undertaken to develop eco-efficient flow sheets to separate the
various fractions of WEEE (Kiachevko et al., 1983; Lee et al., 2004; Li et al., 2007). Li et al., (2007)
described a process for achieving a metal rich fraction using a two step crushing process that
would liberate the metals from the basal plates. Alternative investigations have shown that
separation of different metals occur in varying degrees in differing size fractions (Kogan, 2006;
Zhao et al., 2006).
The extent to which specific metals are liberated presents the challenge of co-separation. This has
motivated the incorporation of stage wise separation and segregation of metals to be considered
during the design of flow sheets.
In alternative research the use of water to circumvent the challenges of dry processing of WPCBs
was considered. Xiang et al., (2007) proposed a water based technology to capture and handle
fines in the form of a paste. Froth flotation was also identified as a suitable method for the
beneficiation of WPCB fines (Ogunniyi & Vermaak, 2009). The output of the investigations
revealed that flotation models and the associated kinetics cannot be treated as simply as the
naturally occurring ore bodies.
Stellenbosch University https://scholar.sun.ac.za
16
The economic success of metal recovery in the recycling of electronic waste is dependent upon
effectively curtailing in-process losses of metals (van Heukelem, 2004; Huisman, 2004; Hagelüken,
2006). Between 10% and 35% of the precious metals in WPCBs reports to the fines fraction during
the comminution stage (Hagelüken, 2006; Yazici, 2015).
In an analysis of the non-metallic fraction of comminution fines it was established that a copper
assay of 2.1% was reported in the sample which was reported to be superior to several copper
porphyry commercial ores (Yokoyama & Iji, 1997; Ogunniyi & Vermaak, 2009).
Other workers have reported that the gold composition of comminution fines of milled electronic
scrap can be as high as 51% (Goosey & Kellner, 2002; Kogan, 2006). It was estimated that up to
10% of this value of gold reported in the fines is lost during physical processing.
The investigations of Cui (2005) also revealed that the economic attractiveness associated with
manual dismantling and mechanical processing of high value WPCBs may be severely limited
because of the precious metals co-separation.
Hanafi et al., (2012) characterised milled WPCB fractions from three different sources, primarily,
cell phones, computers and memory cards. The samples were treated with sulphuric acid and the
crystals that were produced were subjected to a detailed analysis which revealed a notable degree
of co-separation.
While the processes focus on the recovery of these dominant metals, researchers cautioned that
the risk of losing precious metals cannot be overlooked as these losses contribute to a significant
reduction of precious metals yield of the associated with the pre-processing stage (Hagelüken,
2006; Ghosh et al., 2015; Khanna et al., 2014).
In view of the research findings it is crucial to realise that any process designed for recovery of
target metals of the highest purity would entail several processing steps. This however would be at
the expense of higher material recoveries of the target metals (Hagelüken, 2006).
Mechanical recycling of WPCBs has been shown to be a useful technology for WPCB recycling.
On its own however, the precise segregation of the different commercial groups of metals is
surpassed by hydrometallurgical processes. Used in combination with other recycling technologies
it is useful for achieving the necessary size reduction and liberation of metals prior to further
processing (Rossouw, 2015).
2.3.3. Hydrometallurgical recycling of WPCBs
Hydrometallurgy lends itself as a technology well known for its selectivity, scalability, rapid kinetics
and precision during the extraction of metals from native ores and urban polymetallic sources
(Rossouw 2015; Birloaga et al., 2016; Albertyn, 2017).
Stellenbosch University https://scholar.sun.ac.za

17
The comparatively rapid kinetics of extraction makes it a commercially attractive option to consider
when extracting metals from polymetallic sources such as EOL WPCBs. It has been argued that
hydrometallurgical leaching plants and associated processes are not advisable for the recovery of
metals from WPCBs due to the complexity of handling the toxic waste effluent and solid residue
(Schluep et al., 2009).
In light of this the extent of the research has merged the advantages associated with
hydrometallurgy together with other extractive processes to develop process flow sheets that
broaden the scope of metals recovered from WPCBs. Several configurations for leaching
operations combined with recovery technologies have been and continue to be proposed
(Kamberovič et al., 2011; Birloaga et al., 2016).
Hydrometallurgy remains the technology of choice for bridging the operational gap associated with
maximising returns for low volume feed while drawing on the comparatively higher kinetics
(Kamberovič et al., 2011; Birloaga et al., 2016; Cuchiella et al, 2016). The hydrometallurgical
extraction of base and precious metals has been studied using a plethora of lixiviants. Both
aggressive mineral acids and strong bases and more environmentally friendly lixiviants have been
investigated (Pyper & Hendrix, 1981; Monhemius, 1987; Yannapoulos, 1991; La-Brooy et al., 1994;
Wu et al., 2008; Jing-Ying et al., 2012; Gurung et al., 2013).
The extraction of metals using thiourea was investigated as an alternative to cyanide (Pyper &
Hendrix, 1981; Monhemius, 1987; Yannapoulos, 1991; La-Brooy et al., 1994; Wu et al., 2008; Jing-
Ying et al., 2012; Gurung et al., 2013). Findings of the studies revealed that thiourea is prone to
oxidative degradation at elevated temperatures, high pH and is sensitive to elevated ferric ion
concentrations. The commercial application of thiourea is however limited (Gurung et al., 2013).
The high material usage ratios compounded by higher material costs make it economically
unattractive (Wu et al., 2008).
The basic leaching of base metals using NH3/NH4CO3 was also studied. The investigations
revealed that it is possible to recover a pregnant leach solution with a high copper content in
comparison to the other base metals like tin. It was also shown that the preferential extraction of tin
from WPCBs can be achieved prior to copper removal using ammonia and ammonium carbonate
(Liu et al., 2009; Yang et al., 2012; Xiao et al., 2013; Somansundaram et al., 2014).
Sulphuric acid leaching was also considered by researchers that attempted to extract both base
and precious metals in varying conditions. The economics and technical efficiencies of the
proposed processes were compared to leaching campaigns in which alternative lixiviants were
employed (Behnamfard et al., 2013; Birloaga et al., 2013; 2014; 2016; Rossouw, 2015; Birloaga &
Veglio, 2016).
Stellenbosch University https://scholar.sun.ac.za
18
Detailed investigations examining the selective extraction and recovery of precious metals were
undertaken using aqua regia and halides (Ramadorai, 1993; Korte & Coulston, 1998; McNulty,
2001; Hongguang & David, 2002; Kinoshita et al., 2003; Kogan, 2006; Sheng & Estell, 2007; Syed,
2012; Sadeghi et al., 2013; Somansundaram et al., 2014; Yazici & Devici, 2015).
The commercial application of the proposed technologies is limited by the aggressive nature and
costs of the lixiviants. Halides exhibit marked handling difficulties as a result of the toxic and
corrosive nature (Yannapoulos, 1991; Korte & Coulston,1998; Ramadorai, 1993). Further, the
recovery of gold chloride through carbon adsorption has been shown to be thwart with process
losses of gold particles resulting from their adhesion to the surface of activated carbon particles.
The potential of thiosulphate as another alternative to cyanide has also been investigated.
Researchers have explored the use of diverse operating conditions to maximize precious metals
recoveries using thiosulphate (Marsden & House, 2006; Ha et al., 2010; Zhang et al., 2012; Petter
et al., 2014; Akcil, 2015; Albertyn, 2017). In systems containing copper the process efficiency with
respect to thiosulphate usage deteriorated. This was due to the irreversible decomposition of the
thiosulphate which was catalysed by copper in solution. In comparison to cyanide its commercial
relevance is dwarfed.
Ionic liquids on the other hand have been found to possess attractive features that include
negligible vapour pressures, excellent thermal stability and thermal conductivities. This has
stimulated research that explores their applicability as lixiviants (Huang et al., 2014). The
researchers were able to optimise process conditions. The commercial application of this
technology has however not yet been reported.
Thiocyanate is associated with high precious metals recoveries, especially gold. Research findings
have demonstrated that thiocyanate displays greater stability when used under normal process
conditions. Complexes were formed with gold I (Au (I)) and gold III (Au (III)) species (Barbosa-Filho
& Monhemius, 1994; Kuzugundenli & Kantar, 1999; Senanayake, 2004). The commercial
application of thiocyanate is yet to be established.
2.3.4. WPCB recycling process flow sheets
Different researchers have proposed a varied number of flow sheets to extract the metals of
interest and separate the constituents for either in-house or external processing. The flow sheets
are outlined in Table 2.7.
Stellenbosch University https://scholar.sun.ac.za

19
Table 2.7: A summary of some of the different flow sheets developed for recycling WPCBs and other
electronic waste
Process Description Researchers
Cu, Sn and Pb recovery
Mechanical pre-processing (crushing and grinding) followed by copper leaching with NH3/NH5CO3. After distillation to recover NH3 which is returned into the main circuit. The resultant CuCO3 is calcined to yield CuO. Co-dissolution of other base metals noted with high zinc levels. HCl used to leach Pb and Zn.
Liu et al., (2009)
Non ferrous metals and ferrous metals
Disassembly, hand sorting, shredding and then isolation of ferrous metals. Further size reduction followed by magnetic and then eddy current separation to isolate the metals from the non metals.
Tuncuk et al., (2012)
Base and precious metals
Illustration of potential process options that embraces physical separation, size reduction and isolate ferrous and non ferrous metals. Mechanical separation can be by-passed to progress to hydrometallurgical or pyrometallurgical treatment.
Yazici & Devici (2015b)
Base and precious metals copper, gold and silver
Mechanical pre-treatment, selective two stage counter current leaching of base and precious metals.
Birloaga & Veglio (2016)
Ferrous metals, filter dust with entrained metal fines, aluminium and non ferrous metals, WPCBs and plastics
Mechanical process for pre-treating high grade electronic waste enabling isolation of WPCBs. The flow sheet makes use of manual sorting prior to size reduction that is followed by pneumatic, magnetic and eddy current sorting. At the final stage optical sorting is utilized to segregate plastics from WPCBs
Bigum et al., (2012)
Recovery of high purity gold
Embraces a nine stage process for recovering gold from scrap. After dissolution with aqua regia iron is removed. The system is acidified with HCl. The gold rich liquor undergoes extraction, stripping, reduction and removal of impurities. Regeneration of HCl and HNO3 is included in the loop.
(Syed, 2006; 2012)
Recovery of gold and base metals
Feed material is comprised of WPCBs, glass bangles and mirrors. The recycling process entails size reduction, washing and boiling in formic acid. After skimming further boiling is done with 20% aqueous potassium persulphate. Final washing with Borax and KNO3 to recover gold.
(Syed, 2006; 2012)
Stellenbosch University https://scholar.sun.ac.za

20
Table 2.7: An summary of some of the different flow sheets developed for recycling WPCBs and
other electronic waste con’t.
Process Description Researchers
Recovery of precious metal Ag, Au and Pd
Hydrometallurgical process. Base metal leaching with sulphuric acid, chloride and cyanide leaching of precious metals. Cementation and activated carbon adsorption for precious metals recovery.
Quinet et al., (2005)
Recovery of gold Thermal degradation of waste followed by nitric acid leaching, solvent extraction and reduction.
Chmielewski et al., (1997)
Recovery of base metals
Mechanical pre-processing followed by nitric acid leaching and electro-hydrometallurgy.
Mecucci & Scott (2002)
Recovery of base and precious metals
Mechanical pre-processing to segregate non metals and concentrate metal fraction prior to hydrometallurgical treatment to recover copper. Metallic concentration ineffective for gold and silver.
Kasper et al., (2011)
Recovery of copper and precious metals. Fe, Al, Cu, Ni, Zn, Ag, Au,
Three process flow sheets were proposed that all entail mechanical pre-processing followed by selective base metal leaching and the final leaching stage is for the extraction of precious metals. The second process flow sheet provides for the removal of nickel and zinc at the last stage. The third process flow sheet relies on environmentally friendly leachants. An economic evaluation of the sulphuric acid and thiourea based process flow sheet was undertaken. The evaluation indicated that for a gold value in excess of 500ppm the project was feasible.
(Kamberović et al., 2009; 2011)
Recovery of Cu, Au, Ag
Incorporates physical pre-treatment of WPCBs. Followed by selective base metal leaching. Selective leaching of precious metals with HNO3. Leaching of gold followed by reduction that is refined to recover pure gold.
Zhang et al., (2012)
Sn, Cu and Pb as PbO2
Mechanical pre-treatment mainly size reduction by shredding. Leaching WPCBs with HNO3 to remove Sn. Recovery of Sn through dissolution of metastannic acid. Resultant solution neutralized prior to electro-winning to recover copper. Nitric acid is regenerated.
Mecucci & Scott (2002)
Au, Ag, Pd and Cu
Milling of WPCBs to -300 microns. Directs feed through a four stage leaching step that commences with a two stage leaching of copper, followed by solvent extraction of copper and cementation with iron to recover the copper fines.
Behnamfard et al., (2013)
Selective recovery of gold and silver
Mechanical treatment (size reduction) followed by calcination. Non selective leaching of WPCBs with acido thiourea. Selective recovery of gold and silver by adsorption with CPT gel.
Gurung et al., (2013)
Recovery of ultrafine copper particles
Crushing of PCBs. Mechanical pre-treatment to enrich the metals fraction. Leaching of copper with NH3/NH4SO4 followed by solvent extraction, stripping and reduction to recover ultrafine copper particles.
Yang et al., (2012)
Stellenbosch University https://scholar.sun.ac.za
21
2.4. Techno-economic feasibility studies of WEEE recycling
2.4.1. The economics of recycling
Several methods are available for determining the techno economic feasibility of a recycling
process. Ferreira et al., (2012) described three methods that include the Input-Output method, Life
Cycle Costing (LCC) and Cost Benefit Analysis (CBA). Of these methods LCC is most popularly
used. Two major costs are associated with LCC of recycling operations and include internal costs
and external costs. The internal costs include the conventional costs also referred to as direct
costs and the indirect costs. The indirect costs are made up of the hidden costs and the less
tangible costs. The external costs are incurred by virtue of operating within a business
environment and can include costs such as carbon taxes, environmental taxes and licencing fees,
emissions and effluent discharge fees. These costs are not derived from the operations of the
business and are normally accounted for as indirect costs when computing the operating
expenditures.
The economic success of e-waste recycling is dependent on the effective segregation and
concentration of the constituent materials feed prior to reporting to further processing steps. The
most significant contributors to the cost of e-waste recycling is associated with collection, storage
and handling, dismantling and pre-treatment and segregation of hazardous components (Schluep
et al., 2009).
2.4.2. Comparing reuse versus recycling
Miniaturization has played a part in the increased volumes of e-waste with lower relative metal
concentrations. Attempts to increase the metals recovered at the already low concentrations would
yield no significant benefit due to high logistics costs that overtake revenue generation rates. The
combined effects of product miniaturization, low outflows of high grade raw material feedstock and
unstructured e-waste collection rates in emerging and developing economies have culminated into
the observed low margins associated with e-waste and WPCB recycling. The observed trend as a
result, has been the combination of both e-waste recycling and refurbishment in both small and
larger well established facilities. A bias for refurbishment activities in smaller establishments has
been observed by researchers (Geyer & Blass 2010; Lydall et al., 2017).
2.4.3. E - waste recycling in Southern Africa
A case study looking at the economic feasibility of e-waste recycling in Tanzania embraced a
business model that examined the viability of refurbishment activities combined with value addition
using a manual system. The supply risk of obsolete electronic equipment was identified as a threat
to the viability of the undertaking.
Stellenbosch University https://scholar.sun.ac.za
22
This observation agrees with findings made by other workers (Patil & Patil, 2015; Li et al., 2016).
Findings of the study revealed that a financing mechanism at the onset of the project to facilitate
collection activities would be necessary to build up a healthy operating raw material inventory.
Exogenous factors were also identified that presented a threat to the viability of the business
namely, reduced quality of raw material feedstock due to changing appliance composition, informal
cannibalization of the bulk material and a drop in commodity prices. Rather than recycle the e-
waste or attempt to separate materials, the resale of salvaged parts was found to be a more
lucrative option. The study also revealed that the sale and processing of printed wiring boards was
a significant revenue driver. It was proposed to merge the collection of WPCBs at a regional level
to curtail the interruption of material flows in the business. It was noted that a combined throughput
of 980 tonnes per year of WPCBs would be required to ensure the viability of the business. A
strategy proposed to manage the supply chain entailed a centralised collection of WPCBs at a
regional level. Implementation of the strategy is strongly dependent on regional cooperation.
The success of regional co-operation it was noted, is dependent on an active awareness campaign
supported by a regional policy framework which will impact domestic e-waste policy frameworks in
regional member states, combining efficient and supportive local and regional policy frameworks,
value adding activities complementing core activities and reduce the total dependence on the
intrinsic value of raw material, enhancing collection activities would contribute positively towards
sustainable recycling business in Tanzania (Blaser & Schluep, 2012).
2.4.4. Evaluating the economics of operating configurations
2.4.4.1. Economics of field plants
Kang & Shoenung (2006) studied the economics of electronic waste recycling that focused on
processing of monitors, CRTs and PCs. The economic evaluations did not take into account
though, the overhead costs. In this study the researchers were able to show that almost 40% of the
annual operating costs were attributable to pre-processing activities that involved collection,
sorting, testing and dismantling. A further interrogation of the operating cost distribution revealed
that labour and materials together contributed 60% of the overall operating costs.
A sensitivity analysis examining the influence of capacity utilization and the CRT tonnages treated
revealed that the rate of change of revenue changed faster than the rate of change of treatment
cost as observed by Ghodrat et al., (2016). To improve the economics of a recycling facility, the
researchers noted that the e-waste quality would need to be high. This would have to be
accompanied by the automation of labour intensive processes coupled with high capacity
utilization.
Stellenbosch University https://scholar.sun.ac.za

23
2.4.4.2. Economics of mobile plants
A mobile recycling plant process consisting of two containers was developed with the objective of
sustainably recycling e-waste while reducing the environmental burden of existing e-waste
volumes (Zeng et al., 2015). Economic studies of the process suggested that field installations
associated with the process displayed greater profitability than the mobile plants.
An alternative hydrometallurgical process was developed for the recovery of base and precious
metals that included copper, gold, silver, iron, nickel, lead and tin (Kamberović et al., 2011). A
techno-economic feasibility study was done using batch sizes of 50kg and 100kg. The impact of
gold concentration in the WPCBs feedstock, operational time and the effect of the batch size on
the profitability were studied. The process exhibited the greatest sensitivity to gold content in the
feed and the batch size. When the batch size doubled the total operating costs almost increased in
a similar fashion. A 49% slump in the total operating costs was realised at a comparative gold
concentration of 500ppm at which a 50kg batch became profitable, the payback period slumped by
66%, indicating a high sensitivity to increased capacity utilization. Costing and evaluation was done
only for the main process and did not include WPCB pre-treatment and the detailed effluent
treatment programme.
Mobile plants have shown promise in alleviating the growing burden associated with the
inaccessibility to efficient recycling technologies in more remote regions (Zeng et al., 2015). The
associated operational costs for field plants were demonstrated to be higher than the mobile plant.
The operational costs are a function of raw material, utility and maintenance costs and the largest
contributor is governed by the process selected and the raw material quality.
2.4.4.3. Comparing field and mobile plants
Cuchiella et al., (2016) examined the profitability of WPCB recycling and other electronic
equipment. Using the projected estimates as discussed in UNEP reports of e-waste growth rates
and the estimated contribution of the WPCBs to the total weight of a component the researchers
were able to work out the profitability of field and mobile plants. The WPCB purchasing cost was
shown to be sensitive to commodity and metal price fluctuations and the composition of the
WPCBs. A comparative analysis of the economic performance of e-waste field and mobile
recycling plants was undertaken by Zeng et al., (2015).
The researchers observed that recycling of both low and high grade e-waste displayed marginal
profitability. It was also shown that this set up would be suitable for economies with highly
dispersed e-waste collection points, fluctuating returns and feed volumes that do not appeal to the
economics of large scale field plants.
Stellenbosch University https://scholar.sun.ac.za
24
The disparity between the findings discussed by Cuchiella et al., (2016) and Zeng et al., (2015)
demonstrates that the geographical location of the plants has a bearing on the economic
performance of an operation. Field plants were shown to have longer lives and larger net present
values (NPVs) in comparison to the mobile plants.
The comparative NPV per capita (total initial capital investment) between field and mobile plants
for all European countries in the EU is variable. The NPV per capita (total initial capital investment)
of the field plants however remained greater than that of the mobile plants (Zeng et al., 2015;
Cuchiella et al., 2016).
2.5. Chapter summary
The literature study was opened by a discussion of the definition, classification and profiling of
printed circuit boards. A disparity exists between the valuation and of the types of waste printed
circuit boards. The composition of the waste printed circuit boards varies according to the end use
of the commodity for which it is manufactured. Three major economic classes have thus defined to
classify the grades of WPCBs based on the content of gold contained.
It was demonstrated in the study that the recycling of WPCBs offers several benefits that include a
reduction in the carbon footprint associated with precious metals recoveries and potential for
energy conservation. Several studies have been done to investigate technically and economically
sound methods to recover base and precious metals from WPCBs. The methods include
pyrometallurgical, hydrometallurgical, mechanical and bio-hydrometallurgical processes. The
recovery of the metals has been shown in a number of research papers to be dependent upon the
degree of liberation of the metals from the non-metallic matrix of the WPCB.
Hydrometallurgy remains the technology of choice for bridging the operational gap associated with
maximising returns for low volume feed while drawing on the comparatively higher kinetics. The
technical feasibility of the varied hydrometallurgy processes was demonstrated. The commercial
success of the proposed flows sheets was shown to be limited mainly by the restrictive operating
costs and in some cases the aggressive nature of the reaction media selected. A comparison of
the economic evaluations of different WPCB recycling campaigns was also examined. It was seen
that the compositional variation of the WPCBs had a strong influence on the process developed
and the overall project profitability.
The performance of mobile and field installations were also compared. Contrasting observations
made by different researchers, revealed the importance of factoring the effect of geographical
location on the performance of a project. It was generally observed that the recycling of WPCBs is
a low margins business that deteriorates with the increasing degree of process complexity and
decreasing precious metals value in the WPCB feedstock.
Stellenbosch University https://scholar.sun.ac.za

25
The high costs of reverse logistics associated with WPCB recycling also contributed to the
observed low margins. Based on findings of previous research however, the financial
attractiveness of WPCB recycling is threatened by the observed decrease in precious metals
content in the raw material feedstock. Compounded by low outflows of high grade raw material
feedstock and unstructured e-waste collection rates in emerging and developing economies,
recovery rate of metals will remain unsatisfactory. The economic studies conducted on the
proposed installations are not holistic. Most investigations focused on the main process. While
some researchers incorporated the contribution of overheads in their studies, other aspects of the
economic evaluations such as detailed effluent management and treatment costs were not
addressed in great detail. The findings are relevant in providing other researchers and concerned
stakeholders a platform on which to plan and focus attention in order to make informed decisions.
Stellenbosch University https://scholar.sun.ac.za

26
Chapter 3: E-WASTE MANAGEMENT IN
SOUTH AFRICA
3.1. Classifying waste electrical and electronic equipment
WEEE is comprised of ferrous and non-ferrous metals, plastics, ceramics, glass, rubber, wood and
plywood in varying compositions specific to the design and the intended use of the component.
Five differing definitions of e-waste have been advanced by researchers (OECD, 2001; Sinha,
2004; StEP, 2005; Widmer et al., (2005); GreenCape, 2018).
E-waste can be categorized into two groups: WEEE normally considered e-waste and WEEE not
normally considered e-waste. A comprehensive list of the associated electronic and electrical
devices falling into the respective categories is detailed in literature (Robinson, 2009).
The European Parliament and the council of the European union distinguished ten different
categories of e- waste and listed them as follows; large household appliances, small household
appliances, IT and telecommunications equipment, consumer equipment, light equipment,
electrical and electronic goods, toys, leisure and sports equipment, medical devices, monitoring
and control instruments and finally automatic dispensers. These ten categories are outlined in
Table 3.1. In an alternative study a more condensed categorization was discussed (Baldĕ et al.,
2015). Six categories of e-waste were defined that include temperature exchange equipment,
screens and monitors, lamps, large equipment, small equipment and small IT and
telecommunication equipment.
Table 3.1: Categorization of e-waste sources (Commission of the European Communities, 2000)
Category Details Examples (the list is not exhaustive)
1 Large household appliances Refrigerators, washing machines, microwaves, hot plates.
2 Small household appliances Vacuum cleaners, bathroom scales, clocks, weaving and processing equipment for textiles.
3 IT and Telecommunications Centralised data processing: mainframes, minicomputers, printer units, personal computing: personal computers (cpu, mouse, screen and keyboard included), laptop.
4 Consumer equipment Radios, televisions, amplifiers, video recorders.
5 Lighting equipment Low pressure lamps, sodium lamps, metal halide lamps.
6 Electrical and electronic tools Sewing machines, tools for riveting, nailing or screwing, welding.
7 Toys, leisure and sports equipment
Sports equipment with electric and electronic components, video games and consoles.
8 Medical devices with the exclusion of contaminated items
Freezers, radio therapy equipment, pulmonary ventilators
9 Monitoring and control instruments
Smoke detectors, thermostats, weighing or adjusting appliances
10 Automatic dispensers Food, beverages or cash dispensers
Stellenbosch University https://scholar.sun.ac.za
27
3.2. E-waste regulations
3.2.1. Regulation of e-waste
3.2.1.1. The Basel convention
The inception of the Basel convention which was adopted in 1989 and came into effect in 1992
(Hector, 2017) was motivated by the need to curtail the unrestricted dumping and transboundary
movement of hazardous wastes from producer nations to potential consumer nations and dumping
grounds (Needhidasan et al., 2004). The convention does not seek to violate the sovereignty of
States over their territorial sea established in accordance with international law, the sovereign
rights and the jurisdiction which States have in their exclusive economic zones and their
continental shelves in accordance with international law.
The Basel convention mandates generators of hazardous waste to execute their duties regarding
the transportation of hazardous waste and waste in an environmentally sustainable manner.
Liability is assumed in accordance with international law. Member nations are required to take into
account the limited capabilities of developing countries to manage hazardous wastes and other
wastes.
Independent research findings have highlighted the failures of the Basel Convention and its
subsequent revision the Basel Ban, in curtailing the transboundary movement of e-waste from the
developed nations to the developing economies (Hector, 2017). The observed failures were
attributed to the existent gaps in the system such as the inconsistencies in defining e-waste and
specifying what a hazardous material is across differing geographical boundaries. The unregulated
movement of large shipments of e-waste, which in many cases are beyond refurbishment, into the
country potentially poses a risk of burdening the country with volumes of material which after the
various forms recycling result in the generation of large quantities of by-products that have a lower
market absorption rate. Such by-products include non-recyclable plastic fractions.
3.2.1.2. The Swiss e-waste management approach
The principle of extended producer responsibility (EPR) is the basis upon which WEEE
management in Europe is founded. In other developed and developing economies EPR has
percolated into e-waste management systems in varying degrees while it remains more voluntary
in Canada and Australia (Schluep, 2014).The concept of EPR is engrained within the Swiss e-
waste management approach. Four stakeholder levels, used in the Swiss e-waste management
approach have been specified and the inclusive obligations of these levels in the e-waste
management and recycling chain have been discussed in literature (Schluep, 2014). The
stakeholder approach used in the Swiss e-waste management system is outlined in Figure 3.1.
Stellenbosch University https://scholar.sun.ac.za

28
This approach is more condensed when compared to the stakeholder analysis described in
literature (Finlay & Liechti, 2008) in an assessment of the state of e-waste management practices
in South Africa.
Figure 3.1: Framework for developing e-waste strategy (Schluep, 2014)
3.2.1.3. Extended Producer Responsibility
Extended producer responsibility (EPR) describes a comprehensive obligation and approach that
businesses and organizations have and must adopt to reduce the environmental impact of their
products and packaging.
The adoption of EPR is at an advanced stage in the developed nations and is either non-existent
or in the early stages of its adoption in developing and transitioning economies. Varied schools of
thought regarding the approaches, extent of implementation and effectiveness of EPR in the
developing and transitioning economies have been discussed in detail by different researchers
(Nnorom & Osibanjo, 2008; Schluep, 2014; Baldĕ et al., 2015).
Manufacturers embed the concept of enhanced recyclability within the design of their products and
cost of recycling activities that are passed onto consumers within their product costing structures.
The effectiveness of EPR must not be limited by geographical boundaries but must follow products
thereby contributing to addressing the negative impact of transboundary movement of e-waste.
DEVELOPING AN E-WASTE STRATEGY
Country assessment
Framework conditions
Develop structured strategy
Multi stakeholder approach
Policy and legislation
Business and finance
Technology and skills
Monitoring and control
Marketing and awareness
Implement strategy
Develop road map embracing
population aspects in structured
strategy
Immediate Mid term Long term
Stellenbosch University https://scholar.sun.ac.za

29
Three key objectives for EPR principle have been defined and include the following: the objectives
must holistically embrace the manufacture of goods and materials, secondly manufacturers are
obligated to prioritize environmentally sound designs with recyclability in mind and finally the
products should possess reasonable utilization efficiency while the recoverability of the materials
must not be neglected.
The concept of product self management must be included as part of the product specification.
Information pertaining to the design attributes of the components or device as a whole is included.
This is meant to inform recyclers on the technical aspects of the product affecting its recyclability,
safe handling and management of any other aspect associated with it.
It has also been envisaged that the adoption of EPR as an e-waste management approach aims to
achieve a closed loop in which the downstream accumulation of pollutants at the end of a product’s
life cycle without any solution for reuse or reintroduction into the main production chain is
eliminated. The take back system is the crucial fulcrum upon which the EPR system functions.
Four schools of thought have been advanced regarding the adoption of EPR that include the
product take back programs, regulatory approaches, voluntary industry practices and economic
instruments (OECD, 2001).
3.2.1.4. E- waste regulation in South Africa
In 2004 an initiative was launched by the Federal Laboratory for Materials Testing and Research
(EMPA) to assess the e-waste streams and final pathways in South Africa. It was proposed that
the major players would include the National Recycling Forum (NRF), Institute of Waste
Management of Southern Africa (IWMSA), Non-Ferrous Metal Industry Association, the Metal
Recyclers Association, Foundry Manufacturing Association and the South African Iron and Steel
Institution.
Metal Recyclers Association of South Africa (MRA) regulates the metal recycling activities in South
Africa. The MRA is made up of members involved in the collection and processing of over 80% of
scrap metal in the country. An executive committee convenes almost on a monthly basis to
address matters that affect the scrap metal recycling industry in South Africa.
The association also oversees the smooth interaction between the recyclers and consumers. It
helps to ensure that local industry requirements are attended to so that members positively
contribute to the metal recycling industry in a manner that does not compromise the principles of
sustainable practices pertaining to the metals recycling industry. Finally, the association polices the
adherence of the members to the set code of conduct of the association (MRA, 2017).
Stellenbosch University https://scholar.sun.ac.za
30
South Africa, India and China joined the global e-waste knowledge sharing program spearheaded
by the Swiss State Secretariat for economic affairs (SECO). Implementation has been the
responsibility of EMPA (Finlay & Liechti, 2008). South Africa was a signatory to the Basel
Convention. A Basel Convention Regional Centre representing Africa was set up, one of four, to
institute training programs with the objective of empowering participants with technical and
practical expertise in effective hazardous waste management.
A synchronised collection and waste management approach within a nation is essential in
promoting an efficient e-waste economy within a country that also has globalized approach to e-
waste management with interdependent structures (Schluep et al., 2009; Schluep, 2014). The
absence of a clear policy and legislation addressing collection, dismantling, pre-processing and
end processing were highlighted and have been identified as the most significant barriers to e-
waste management systems in developing and transitioning economies. While the South African
formal system has attempted to develop structure in this arena several loop holes and system
inefficiencies still exist as will be discussed in sections to follow.
A model based on the Swiss e-waste management approach was developed and tested. A review
of the model’s performance however exposed the shortcomings that were associated with a poor
appreciation of the differences in the operating environments, namely the European context versus
the South African context (Lawhon, 2013). The existent discourses on e-waste management and
recycling in South Africa were also examined (Lawhon, 2013). It was noted that key stakeholders
were at a point of conflict regarding the approach to adopt in managing e-waste in South Africa.
Lawhon (2013) noted that one side of the argument was in favour of fully adopting the Swiss
recommended model. The counter argument favoured the provision of a uniquely tailored solution
for South Africa described in alternative reports (Schluep et al., 2009; Lawhon, 2013; Schluep,
2014).
The e-waste Association of South Africa was formed in 2008 as a body comprised of key
stakeholders in the e-waste sector. Like recommendations made by Schluep et al., (2009) a new
forum for manufacturers in South Africa, ITA-PEG was formed.
This was a brain child of English Africa Hewlet Packard in which proposals for collection, transport
and storage schemes of e-waste were drafted. The architects of the proposed scheme were
confident that while the recycling rate has not matched the performance of counterparts in more
developed economies the initiative would provide sufficient stimulus to draw greater participation
from other interest groups. It was believed that the proposed scheme would boost the efficiency of
collection and positively impact recycling of e-waste in South Africa.
Stellenbosch University https://scholar.sun.ac.za

31
The concerted effort led to broader alliances. E-WASA in collaboration with eWA (e Waste
Alliance), RAG (Recovery Action Group), WCRAG (Western Cape Recovery Action Group), GIZ
(Deutsch Gesellschaft für Internationale Zusammenarbeit), MTN (Mobile Telephone Network), ITA-
PEG, Nokia’s Ulrike Volt, DELL, IWMSA (Institute of Waste Management Southern Africa),
documented guidelines for emerging entrepreneurs venturing into the business of e-waste
recycling. The initiative was undertaken to promote controlled and well managed e-waste recycling
activities without endangering human health and the environment.
The publication allows new participants a platform to understand what e-waste is, legislation
influencing the activities they intend to embark on and offers guidelines for proper accounting
mechanisms in managing an e-waste business (Pocket information guide for Southern African e-
waste Collectors, 2013).
3.2.2. Legislation
The South African e-waste management systems and status were assessed by different
researchers. Earlier recycling activities of e-waste in South Africa have been independent of
significant government intervention (Widmer & Lombard, 2005). More recently the e-waste
management and recycling activities have been increasingly influenced by existing legislation
pertaining to environmental and waste management regulations in the country.
The e-waste management and legal landscape
Godfrey & Oelofse (2017) identified the four stages characterising the development of the
legislative background influencing e-waste recycling in South Africa. This has spanned a 30 year
time frame since 1989 and is outlined in appendix H, Table H.1. which shows that there is an
active and concerted effort within the South African waste recycling landscape to move towards a
more circular economy by varied stakeholders that also include formal and informal recyclers and
beneficiaries along the e-waste recycling chain. The shift has been progressing with varying
degrees of adoption without a clear policy laid out for e-waste management and recycling.
The challenges, proposed actions and responses to the measures were also discussed by the
researchers (Godfrey & Oelofse, 2017). The strides in the developed nations have played a
significant role in influencing the direction of e-waste management legislation in South Africa. This
has been evidenced by the active initiative to adopt and implement EPR in varying degrees as the
South Africa shifts to a more circular economy (Dittke, 2007; Godfrey & Oelofse, 2017).
A summary of relevant legislation affecting e-waste management and recycling in South Africa is
detailed in appendix H, Table H.2 provides a more comprehensive account of legislation
influencing e-waste recycling activities was however discussed by Dittke (2007).
Stellenbosch University https://scholar.sun.ac.za

32
From the overview it is clear that a more distinct legal framework unique to e-waste management is
required. The adoption of the legislation described in Table H.2 varies at provincial and municipal
levels as will be described in the following discussion.
Weaknesses of the current legislation
Several research findings revealed the absence of a unique legislation in South Africa for e-waste
management and associated recycling activities (Finlay, 2005; Dittke, 2007; Lawhon, 2013;
Mouton & Wichers, 2016; Godfrey & Oelofse, 2017). It was also noted that the enforcement of
legislation in the different provinces was and is not homogeneous. Investigations also revealed that
the monitoring of enforcement differs with the level of priority accorded to the subject matter
(Dittke, 2007). No mention of e-waste has been made in any of the laws that can be applied to the
management and handling of e-waste. Dittke (2007) exposed the vagueness of some of the
provincial legislation in terms of scope and applicability. The extent of the effectiveness in attaining
national e-waste recycling targets becomes varied and in the worst cases is illusive.
The fourth observation revealed that the existent laws in place do not adequately address the
difficulties associated with handling complex e-waste. This has manifested by the current challenge
associated with the provision of a suitable and simple disposal plan for e-waste like CRTs and
nickel-cadmium batteries.
Based on the research findings it can be concluded that the crafted legislation must be holistic and
uniform in its enforcement and monitoring. The legal instruments must be capable of addressing
areas that include handling and storage of e-waste, licensing, supporting architecture, emissions
and effluent management, water management, dissemination of information of public concern,
logistics and supply chain management, occupational health and safety related matters,
emergency response plans and procedures in the e-waste recycling chain and the monitoring and
evaluation of e-waste related activities.
Legislation relating to buildings and associated infrastructure unique to e-waste handling must also
be defined to provide for the appropriate storage of hazardous material. Training, certifications and
associated accreditations should be clarified with provision for assessment and continuous
development around e-waste management. By embracing these aspects of e-waste management,
it is essential that uniformity in adoption of the crafted legislation is achieved at the point of
execution at government levels.
Stellenbosch University https://scholar.sun.ac.za

33
3.2.3. Policy implementation
Proceedings in Geneva 2009 revealed that a solid policy regarding e-waste management in African
nations must be established and consolidated. A request was made for the more experienced
nations to assist African nations in developing architecture for managing e-waste, developing the
legislation and curbing illegal transboundary movement of e-waste. The adoption of EPR as an
approach to managing e-waste volumes in South Africa for instance, is in its infantile state.
A number of constraints have been identified that hinder the progress of the EPR in developing
economies. These constraints include the resolution of conflicting priorities associated with
manufacturers and recyclers, the achievement of a balanced alignment of the EPR with the
existent business models and strategic objectives of stakeholders, distinguishing between what
must be defined an industrial standard and what is law and finally defining the specific
responsibilities and limits of authority.
It has been proposed that a unique model can be tailored for the developing and transitioning
economies (Schluep et al., 2009; Schluep, 2014). The model is developed by merging the success
elements of the European recycling and e-waste management system together with the high
collection rates associated with the informal sector and resources of the respective country.
Schluep (2014) noted that the institution of an efficient e-waste management system to curtail
monopolistic practices without necessarily depending on the enforcement of rigid and punitive
policy measures would suffice to suppress these undesirable practices. A case in point illustrating
the objectionable ramifications resulting from the failure to circumvent loop holes in any instituted
policy framework, is the continued transboundary movement of e-waste to West Africa, Eastern
Europe, parts of Asia like India, Pakistan and China despite the institution of global protocols like
the Basel Convention (Widmer et al., 2005; Nnorom & Osibanjo, 2009; Chatterjee & Kumar, 2009;
SAICM, 2009; Schluep et al., 2009; Chatterjee, 2012; Hector, 2017).
Although South Africa is a signatory to the Basel Convention, there have been reports of illegal
shipments of e-waste from the US into the country, current legislation and involvement of the
government was ineffective in aborting further movement of a reported load into South Africa from
the Durban port (Lawhon, 2013). This incident has brought to light the weakness in the Basel
Convention in curbing illegal transboundary movement of hazardous materials (Nnorom &
Osibanjo, 2009; Chatterjee & Kumar, 2009; Chatterjee, 2012; Hector, 2017).
The co-operation of stakeholders must be strengthened to promote the efficacy of policy
implementation at all levels (Chatterjee & Kumar, 2009; Chatterjee, 2012; Lawhon, 2013; Dittke,
2007; Finlay & Liechti, 2008; Schluep, 2014; Mouton & Wichers, 2016). Recommendations have
thus been advanced to remedy the observed deficiencies in the system.
Stellenbosch University https://scholar.sun.ac.za

34
The proposed solutions include: the establishment of an institutional framework to allocate
responsibilities, schedules and objectives within the e-waste sector, the creation of awareness at
all governance levels and the public at large, the identification, quantification and evaluation of
existing support markets, the identification of collection and data management systems, the
development of legal frameworks achieved through a review of existing legislations followed
through by the development of a qualified and efficient e-waste recycling sector (Finlay, 2005;
Dittke 2007; Lawhon 2013; Mouton & Wichers, 2016; Godfrey & Oloefse, 2017; Lydall et al., 2017;
GreenCape, 2018).
Widmer et al., (2005) attempted to put these ideas into context by developing an assessment
indicator system with the main objective of developing a system to measure and compare WEEE
management systems. The model is depicted in Figure 3.2.
Stellenbosch University https://scholar.sun.ac.za

35
Figure 3.2: Assessment indicator system for comparison and measurement of WEEE management systems (Widmer et al., 2005)
Stellenbosch University https://scholar.sun.ac.za
Stellenbosch University https://scholar.sun.ac.za

36
The assessment indicator shown in Figure 3.2 specifies the key pillars that enable users of the
framework to holistically address the operational, administrative and measurable long and short
term effects of the e-waste management system adopted. By addressing the three major pillars
input of all stakeholders (direct and indirect) is taken into consideration and monitored for progress
in its contribution towards the broad e-waste management objectives. Financing structures and
performance measures are crystallized at all levels along the e-waste chain.
3.3. E-waste volumes in South Africa
E-waste flows in the country are derived from the direct procurement of new EEE typically from
international suppliers. Secondly the importation or receipt of second hand goods in the form of
donations or second hand purchases and the receipt of obsolete equipment from within the
continent (Lawhon, 2013). Between 3% and 20% of the WEEE entering the South African e-waste
recycling economy is sourced from the SADC region. Domestically, e-waste is derived from the
government, households and businesses (Lydall et al., 2017).
3.3.1. Accounting for e-waste flows
The quantification of e-waste generation rates remains a grey area, subject to the weaknesses of
inadequate accounting and documentation of collection activities, disposal and recycling rates
(Schluep et al., 2009; Nnorom & Osibanjo, 2009; DEA, 2012; Lawhon, 2013; Shamim et al., 2015;
Lydall et al., 2017; GreenCape, 2018).
Statistics describing the growth and accumulation rates of waste electronic equipment revealed
that the South African e-waste management and recycling data base is limited (Ogunniyi &
Vermaak, 2009). The existent data collected has been the output of inferences derived from
market Figures from active recyclers and dealers of electronic equipment (Lydall et al., 2017;
GreenCape, 2018). Most estimates have been and continue to be derived from mathematical
deductions determined from sales volumes, market forecasts and the projected life spans of
equipment (Furter, 2004; Mackay, 2004).
Finlay & Liechti (2008) have provided a summary of the life spans of typical electrical and
electronic products associated with the South African consumer market. The data is summarized in
Table 3.2.
Stellenbosch University https://scholar.sun.ac.za

37
Table 3.2: Life spans of electrical and electronic equipment (Liechti & Finlay, 2008)
Equipment or gadget Life (years) Mass (kg)
Refrigerator 10 45
Washing machine 8 65
Microwaves 7 10
Televisions 10 20
Desktop PCs with monitors 4 27
Printers 5 8
Mobile phones 1.50 0.15
Laptops 4 3.50
E-waste flows on a provincial level were analysed by researchers. A projected e-waste growth rate
of 4% was determined from the output of previous survey reports and mathematical extrapolations
of baseline data (DEA, 2012; Lydall et al., 2017). Gauteng and the Western Cape contribute
towards the major portion of e-waste inflows in the country. Gauteng however dominates as the
major e-waste processing zone in the country (Lydall et al., 2017; GreenCape, 2018).
Currently the majority of recycling activities gravitates around economically active regions that
include KwaZulu Natal, the Western Cape and Gauteng. The smaller operators concentrate their
activities within the provinces housing their operations.
The distribution generally mirrored the degree of economic activity associated with each of the
provinces. The remaining 35% was spread over the other seven provinces indicating a need for the
installation of processing and recycling facilities suited to match the lower outputs and transient
material flows.
3.3.2. Estimating e-waste volumes in South Africa
The growth rate of WEEE is a general indicator of the generation rate of WPCBs. It is estimated
that of the WEEE volumes estimated, WPCBs comprise between 3% and 5% of the total weight of
WEEE (Hadi et al., 2015).
The growth rate of electronic waste and subsequently WPCBs is stimulated by the push for
innovativeness in the electronic sector to address the changing needs of the market. Improving
productivity, safety and advancing operational efficiencies of large commercial enterprises, has
provided a significant stimulus for the development of robotics and computing software (Akcil et al.,
2015). On the consumer side, increased personal disposable income within the populations of
emerging economies and a desire for a better quality of life has stimulated the growth of the
consumer electronic and electrical goods sector.
Previous research findings revealed that e-waste volumes comprising of white goods, consumer
electronics and IT are within households and range between 1 000 000 and 2 200 000 tonnes
(Finlay & Liechti, 2008). Estimates described in alternative investigations were far lower than those
reported by the researchers (Godfrey, 2015).
Stellenbosch University https://scholar.sun.ac.za

38
Fetzer (2009) reported an e-waste generation rate of 100 000 tonnes per annum and added that
20% of this tonnage is recycled by formal recyclers whereas another report alluded to a tonnage of
322 000 per annum (GreenCape, 2017). Results of the survey revealed that not less than 36% of
e-waste in the country is comprised of consumer electronics and IT goods. Recent market surveys
have projected a compounded annual growth rate of 7.3% for ICT products which are of great
interest in the e-waste recycling business, due to the high intrinsic value (GreenCape, 2018).
Between 15 000 and 43 000 tonnes of PC equivalents are reported to finally end up in the landfill.
This is only a fraction of the e-waste accounted for.
Material outflows into the e-waste recycling chain are low. A summary of the published estimates
of e-waste volumes in South Africa are summarized in Table 3.3. Attempts to develop a statistical
study reference point based on waste generation trends influenced by macroeconomic variables
were done by different researchers. Results generated were used to derive a dispersion model of
WEEE generated by provinces (DEA, 2012; Lydall et al., 2017).
Table 3.3: The published estimates of e-waste generated
Source Generation rate of e-waste (Tonnes/year)
Estimated e-waste in storage (Tonnes)
Material being handled or received by recyclers (Tonnes per year)
Finlay and Liechti (2008)
- 1 129 000 to 2 108 000
-
Fetzer (2009) 100 000 - -
DEA (2012) 64 045 with a global estimated growth rate of 4%.
- -
StEP (2013) For the year 2014 346 000 tonnes per annum were projected with an average annual growth rate of 10% per year.
- -
GreenCape (2017) 322 000 - -
GreenCape (2017) - - 315 000 to 555 000
eWASA (2017) Mail & Guardian (2018)
360 000 - -
Based on the data summarized in Table 3.3 estimation of e-waste volumes generated within the
country and in storage is still a grey area. The margin between the lowest and highest estimates
stands at almost 850% indicating that the average global estimates cannot be used with great
certainty for estimating e-waste growth rates in South Africa. The estimates rely on subjective data
that is limited and dependent on the active participants in the available statistical data pool. In the
absence of a central statistical national data base on e-waste the variations in reported data as
displayed in Table 3.3 can be expected.
Stellenbosch University https://scholar.sun.ac.za

39
3.4. E- waste recycling
3.4.1. E-waste recycling in comparison to other waste streams
E-waste recycling rates have been shown to be the lowest in comparison to other recycling
sectors. In a survey of the current status of the e-waste recycling landscape in South Africa, it was
established that e-waste flows into the main recycling value chain are derived from the
government. An analysis of the different waste streams in South Africa for the year 2016 was
summarized graphically as shown in Figure 3.3. The recycling of e-waste reported the lowest
activity which has been attributed to varied factors discussed in greater detail in section 3.6.
Figure 3.3: Proportion of waste streams recycled in South Africa in 2016 expressed as percentages
of the total tonnage of waste handled (GreenCape, 2017)
The analysis of the current and potential market values associated with e-waste recycling activity,
revealed a similar trend with e-waste reporting the lowest market size and revenue depicted in
Figure 3.4.
Figure 3.4: A comparative analysis of the current market size and potential material values of waste
streams in South Africa 2016 (US$) (GreenCape, 2017)
Stellenbosch University https://scholar.sun.ac.za

40
The potential material value shown in Figure 3.4 describes the revenue realisable from sales of the
unrefined or unprocessed waste stream in its raw form. Enhancing the quality of the final product
along the waste recycling chain of each of the materials shown in Figure 3.4 improves the current
market size (due to attractiveness of product to the market) of the associated waste fraction. This
is evidenced by the superior market sizes associated with the paper, metals and e-waste fractions.
The influence of global metal prices contributes to increasing the market size for the metal and e-
waste fractions. Scope exists to boost the market potential and revenue realisable from the
exploitation of greater volumes of e-waste and fractions that are directed to landfill. This is
achieved through an expansion of marketable by-product streams derived from e-waste recycling
and associated support activities. The expansion of the product portfolio is however ineffective
without a corresponding market readiness and absorption capacity.
An analysis of e-waste recycling activity in 2016 revealed that 48% of the e-waste recycled in
South Africa contains high value material in the form of WPCBs. This proportion combined both the
recycling of consumer equipment and information technology as shown in Figure 3.5 (GreenCape,
2017). Based on the pessimistic and optimistic estimates, between 1 150 and 5 190 tonnes of
WPCBs are recycled annually (Schluep et al., 2009; Fetzer, 2009; GreenCape, 2017).
Based on the inferences made from the estimated recycling rates of e-waste in as at 2015 (Lydall
et al., 2017) it is estimated that 3 000 tonnes of WPCBs were processed and recycled in 2016.
Figure 3.5: Analysis of the e-waste recycling activity in South Africa 2016 (proportion of tonnage
processed) (GreenCape, 2017)
3.4.2. Employment creation
The development of the e-waste recycling sector has the potential to generate employment.
E-waste recycling is associated with a higher job factor of when compared to other waste streams
(30 jobs per 100 tonnes e-waste diverted) (GreenCape, 2017). Figure 3.6 shows that e-waste has
the largest jobs potential in comparison to the other major waste streams recycled in the country.
Stellenbosch University https://scholar.sun.ac.za

41
Figure 3.6: Potential jobs that can be generated from recycling of different waste streams in South
Africa for 2016 (GreenCape, 2017)
3.4.3. E-waste recycling activity
E-waste recycling activities are composed of the six interrelated elements the form the pillars of an
e-waste value chain. The generic structure evolves according to the specific geographical location,
nature of e-waste streams being handled, existing legislative structures and frameworks in place,
the relevant technologies adopted for processing the e-waste and handling waste streams thereof
and finally, the business models that define the targeted revenue streams. Figure 3.7 is an
illustration of a generic picture of the WEEE recycling chain.
The closed loop philosophy does not apply to the model illustrated in Figure 3.7 It is a simplified
version of the existing recycling system in South Africa. What is apparent from the schematic is
that failure to maximise material recovery results in a net accumulation of metallic and non-metallic
fractions in concentrations above the permissible quantities that disturb the ecosystem and
inefficient utilization of resources expended to recover fewer targeted end products.
Stellenbosch University https://scholar.sun.ac.za

42
Figure 3.7: The generic WEEE recycling chain describing e-waste recycling activity in South Africa (Mouton & Wichers, 2016; Lydall et al., 2017;
GreenCape, 2017; 2018)
Stellenbosch University https://scholar.sun.ac.za
Stellenbosch University https://scholar.sun.ac.za

43
The existence of an established metals processing industry forms a critical supporting structure for
the downstream processing of outputs from the pre-processing of e-waste. The sustained
development of the e-waste recycling business in the country is therefore achieved (Widmer et al.,
2005). The exploitation of the country’s vibrant metals processing industry and potential to upgrade
and modify existing plants to process greater e-waste volumes, is a crucial step in bolstering South
Africa’s e-waste processing capability (Schluep et al., 2009). The South African government has
responded by intensifying the prioritization of e-waste management activities over the years, as
highlighted by Godfrey & Oloefse (2017).
In recent studies it has been noted that with the full adoption of operation Phakisa, it is expected
that outflows of e-waste into the e-waste recycling economy from government sources will be
enhanced further (GreenCape, 2018). The bulk of the e-waste inflows are derived from the
government. Figure 3.8 provides an illustration of the distribution of e-waste from the three major
sources into the WEEE value chain as of 2017.
Figure 3.8: Distribution of e-waste inflows into the WEEE value chain in South Africa (2017)
(GreenCape, 2018)
A study of 27 formal recycling companies in South Africa indicated that 30% of the companies
studied actively export the WPCB material they handle. It was noted that the WPCBs are usually
shredded prior to export as opposed to the selling of whole WPCBs done for the local market
(GreenCape, 2017; 2018; Lydall et al., 2017). Most of the companies studied are involved in
collection and dismantling activities.
Figure 3.9 provides a summary of significant recycling technologies used by the surveyed
registered recyclers (Lydall et al., 2017). In addition to collection activities four major categories
used in isolation or as a combination exist to process e-waste and include mechanical,
pyrometallurgical, hydrometallurgical and bio-hydrometallurgical technologies. The different
coloured bars depict the technology or activity associated with each of the recyclers. In South
Africa the use of hydrometallurgical processing is not as well established as mechanical
processing as revealed by the higher frequency of blue bars in comparison to the pink bars
depicted in Figure 3.9. Great scope exists for expansion in this arena.
Stellenbosch University https://scholar.sun.ac.za
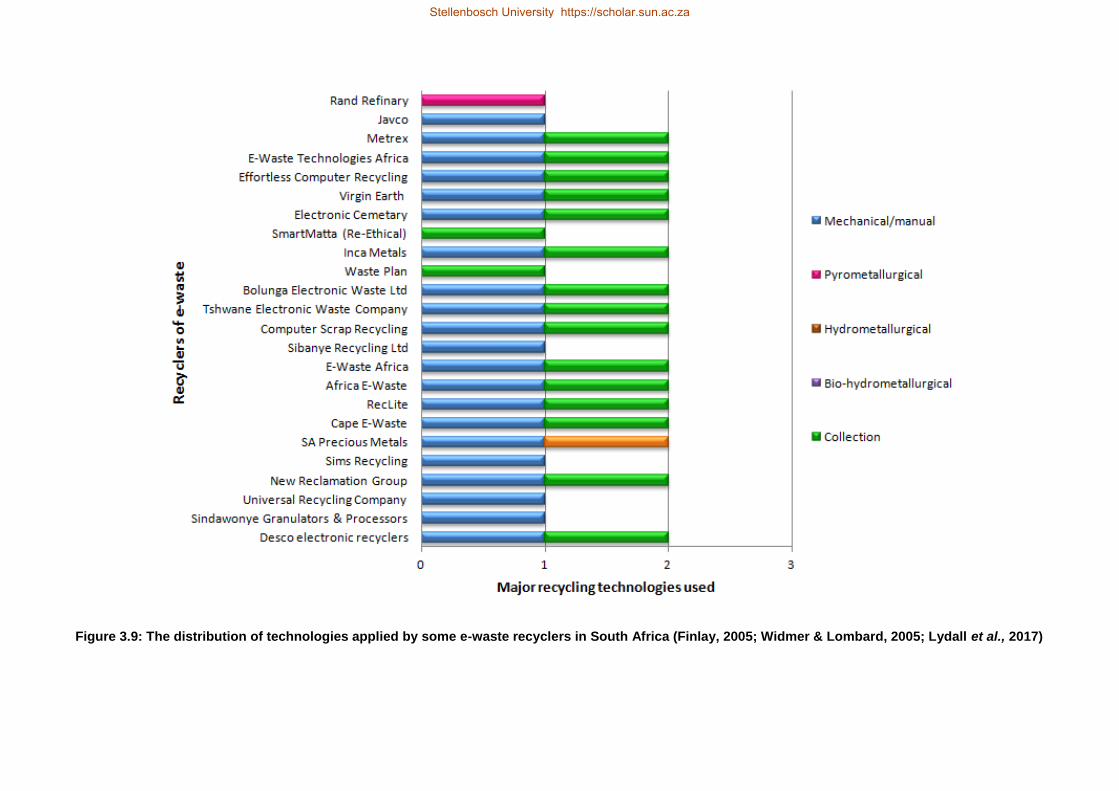
44
Figure 3.9: The distribution of technologies applied by some e-waste recyclers in South Africa (Finlay, 2005; Widmer & Lombard, 2005; Lydall et al., 2017)
Stellenbosch University https://scholar.sun.ac.za
Stellenbosch University https://scholar.sun.ac.za

45
Based on the distribution of some of the formally registered e-waste recyclers shown in Figure 3.9,
there is evidence that the dominant technology upstream of the WEEE value chain is associated
with the manual and mechanical recycling of e-waste. The distribution of the formal recyclers along
the WEEE value chain based on the focal points of their business models is depicted in Figure
3.10. The pie chart is based on results of a survey of registered e-waste recyclers (Lydall et al.,
2017).
Figure 3.10: Distribution of some of the formal recyclers across the WEEE value chain (2017)
High barriers to entry were reported at the pre-processing and processing stages with respect to
investment in technology. The reverse is true for the collecting and dismantling stages. The
pyrometallurgical processing of WEEE on a larger scale is restricted by the low and inconsistent
material flows of e-waste into the recycling chain. The current e-waste volumes reporting into the
value chain cannot at present support the large pyrometallurgical processing of e-waste for the
recovery of metals at economically feasible capacities. The operations cannot be expected to run
at an annual capacity utilization in excess of 10% if one were to considered running operations at
similar levels done by e-waste recycling firms in the more developed economies.
An analysis of the current value and supply chain reveals great scope for a hybrid horizontal
growth in e-waste business as shown by the distribution of activity and technologies in Figures 3.9
and 3.11. Such activities can include marketing, consultancy services or waste disposal
businesses revolving around the existent e-waste value and supply chain. Figures 3.9 and 3.11
further demonstrate the existence of a platform to exploit the established collection and dismantling
network that is more mature than advanced value adding recycling activities such as the
hydrometallurgical processing of e-waste in South Africa. The primary and secondary activities
described in Figure 3.11 refer to the collection and dismantling and pre-processing activities that
dominate the e-waste value in South Africa.
Stellenbosch University https://scholar.sun.ac.za

46
Figure 3.11: Analysis of the focus of WEEE recycling activity of some of the registered recyclers
(Lydall et al., 2017)
Small to medium scale enterprises have been identified as key drivers to achieving this growth.
Mobile operating configurations are suited for this. At present vertical expansion is limited by the
low e-waste volumes are being handled in the country.
Fluctuations in the key raw material supply (e-waste) and capacity utilization make it difficult for
concerns to secure long term funding for further capital expenditures. Irregular revenue streams
increase a firm’s susceptibility to environmental risk factors.
Based on the baseline report published by the DEA (2012) and estimates of WEEE generation
rates a supporting framework for planning collection and storage systems, configuration of
recycling facilities and distribution centres is requisite.
3.4.3.1. Status of the formal recycling sector
The formal e-waste recycling of South Africa is broadly characterised by the diverse in-
homogeneity of pricing structures and material movement largely dictated by supply and demand
factors. These factors influence pricing structures and the resultant adoption of the most feasible
business models to maximise economic viability of a going concern.
Material flows
Low e-waste material outflows have led to the active business process re-engineering by formal
recyclers. The players in the formal sector have undertaken the initiative to actively re-engineer
their business strategies and models to circumvent the prevalent supply risk of raw material. This
has been achieved by entering into long term supplier agreements and strategic collaborations
along the e-waste value chain. Raw materials are also sourced from other parts of the country
even in the SADC region. A degree of e-waste pre-processing is undertaken in the source
countries. This has eased the burden of the costs associated with reverse logistics of bulkier
material volumes being moved into South Africa.
Stellenbosch University https://scholar.sun.ac.za

47
The low material volumes of WEEE entering the recycling chain have restrained significant
acquisition of large capital equipment for major expansion projects. The capacity utilization for the
companies studied ranged between 10% and 60%.
Figure 3.12 provides a graphical summary of the distribution of the major fractions associated with
formal e-waste recyclers. The recyclers surveyed represent not more than 30% of registered
formal recyclers in the country (Lydall et al., 2017). Based on the graphical plot, WPCBs, plastics,
ferrous and non-ferrous metals and plastic materials commanded the largest market share
destined for local pre-processing. The bulk of processing activity of WPCBs is done by foreign
processors. Lydall et al., (2017) reported that at least 90% of WPCBs are exported for final
processing. The recycling of glass, phosphor powders and other fractions is still low. The trend
depicted demonstrated the existence of a technological risk factor. The capacity to handle large
outflows of glass and phosphors derived from e-waste is low. This is also aggravated by depressed
market Figures for these streams.
Figure 3.12: Market distribution for fractions derived from e-waste recycling by formal recyclers in
SA (Lydall et al., 2017)
An analysis of the distribution of recycling volumes handled by some of the formal recyclers in
South Africa shown in on Figure 3.13 reveals that the bulk of e-waste handled is concentrated to a
few recyclers. The five major e-waste recyclers processed almost 80% of the e-waste handled in
2015. All the recycling was associated with pre-processing and collection activities, with no further
value addition through the exploitation of either one or both hydrometallurgical or pyrometallurgical
technologies.
Stellenbosch University https://scholar.sun.ac.za

48
Figure 3.13: Volumes of e-waste handled by at least 25% of formal recyclers in South Africa (2015)
(Lydall et al., 2017)
Developing technologies
A trial hydrometallurgical process that has been developed in South Africa, for over 16 years to
recover precious metals from WPCBs of all grades, is currently in operation, with reportedly no
effluent and emissions discharges (Lydall et al., 2017). The core activities are associated with the
precious metals business. The precious metals are extracted and recovered as intermediate
chemical products coupled with the production of copper cathode. The concern sources all its
feedstock from the nine provinces of South Africa. Additional feedstock is supplemented by
supplies within the SADC region, namely Zambia, Namibia, Botswana and Mozambique. The plant
has a maximum processing capacity of 1 300 tonnes per annum of WPCBs but is however utilizing
50% of it.
Market dynamics
The predatory pricing of raw materials is low due to the need to maintain inflows of materials.
Larger more established firms command a significant bargaining power. Recycling of WEEE is
generally a low margins business. The combined refurbishment of e-waste with recycling and
export of processed e-waste are the more favourable options for most of the recyclers. The export
revenues exceed domestic revenues by a 70% margin (Lydall et al., 2017). Upstream activities in
the recycling chain are labour intensive. Most of the recyclers recruit labour on a contractual basis
as opposed to running with a large permanent work force. The degree in the variation of the
customers’ specific requirements has slowed movement of selected by-product fractions from the
processing of e-waste.
Stellenbosch University https://scholar.sun.ac.za

49
The absorption for example of complex impregnated with flame retardants, glass and phosphors is
still low in comparison to other fractions recovered from the recycling of e-waste (see Figure 3.12).
3.4.3.2. The informal sector
This sector has not been well documented, and no concrete statistics are in place to account for
informal recycling and dumping practices. A divide still exists between the formal and informal
sectors. Operating structures are loosely defined and prone to high levels of risk within the
business environment. Finlay & Liechti (2008) have estimated that between 40 000 and 50 000
informal recyclers are active in South Africa. Regulation of activities in this sector is largely
rudimentary. Attempts to regulate the activities of this sector have been driven largely by the
intervention of nongovernmental organizations (Lawhon, 2013).
Researchers in the field have argued that the low level of synchronised activities of both the formal
and informal sectors has contributed towards the observed inefficiencies in the e-waste
management and recycling scene in both transitioning and emerging economies.
Efforts are however in place in some of these countries to promote sustainable management of e-
waste in an economy that has been and continues to witness a burgeoning of e-waste (Chatterjee
& Kumar, 2009; Jain & Garg, 2011; Chatterjee, 2012).
The barrier to the successful merger of the formal and informal sectors is reinforced by the
availability of exploitable economic benefits of e-waste recycling (Chatterjee & Kumar, 2009;
Shamim et al., 2015). Unless equivalent or superior benefits can be derived from a marriage of the
two sectors, significant effort warranting punitive measures, where potentially applicable, would
have to be enforced. This demands more policing to effectively monitor the success of any
proposed strategies to broaden the involvement of participants in e-waste management
endeavours. If the systems are prone to corruption and monopolistic behaviour, this will further
sabotage progress and the success of legislative measures to manage e-waste on a consensus
between the formal and informal sectors.
3.4.3.3. Overview of stakeholder analysis in South African e-waste economy
A highly integrated network exists among the recyclers within the South African e-waste recycling
landscape (GreenCape, 2018). The output from smaller recyclers both formal and informal is
eventually passed on to the large recyclers. No data base exists however, to accurately monitor
the inflows of e-waste from the informal recycling sector.
The rather centralised positioning of major e-waste recycling facilities has however limited the
extent to which other parts of the country can adequately benefit from the activities of larger formal
e-waste recyclers (Mouton & Wichers, 2016). Table 3.6 provides an overview of the stakeholder
analysis in the South African e-waste recycling chain.
Stellenbosch University https://scholar.sun.ac.za

50
Table 3.4: Summary of key stake holders in the South African e-waste recycling chain (Widmer &
Lombard, 2005; Finlay, 2005; Lydall et al., 2017; GreenCape 2017; 2018)
Stakeholder Description
Importers and manufacturers
The white goods sector is dominated by foreign brands. Commitment of the foreign companies is non-existent or lacking in commitment. They are not involved in e-waste recycling or take back activities of large electronic consumer goods.
Distributers Includes major retail chains and smaller stakeholders. Some of the retailers form crucial links in the e-waste recycling chain by hosting collection bins on their premises. Collection of white goods is complicated by the need for more land space.
Collectors and facilitators
Informal collectors are reported to contribute 25% of the e-waste volume handled in SA.
Formal collection is typically associated with contractual and structured agreements with the government and large businesses.
The formal collectors include large integrated waste collection companies, smaller operators and consumers. The formal collection normally handles large consignments of e-waste.
Stealing of collection bins occurs so that the collected e-waste is lost to the informal sector.
The informal collectors are involved in the salvaging and scavenging of e-waste at municipal waste dumps. There is a high level of risk and criminal activity associated with their activities.
Refurbishers Through the refurbishment of devices and gadgets the useful service life of EEE is prolonged, delaying entry into the main stream recycling chain.
Some of the refurbished material is exported while the other material is sold locally. Refurbished gadgets and devices are derived from imports from both the international suppliers and the continent.
Recyclers Recycling operations are not uniform.
They are predominantly characterized by collection, dismantling and mechanical recycling activities. Pyrometallurgical, bio-hydrometallurgical and hydrometallurgical processing activity is still low. Hydrometallurgical processes fall under strict control but the looming threat of the illicit extraction operations exists.
Major exports by formal recyclers include PC boards, non ferrous metals and plastics.
The main operations are based in Gauteng and Western Cape provinces.
Stock piles of hazardous material like nickel cadmium batteries or lead containing materials are held until a time they are specially disposed of in a registered landfill.
The e-waste was exported in its raw form without further processing to maximise its value as a result of metal enrichment.
Downstream vendors
Downstream vendors further process and refine material from recyclers. They include plastics recyclers and metal refiners and smelters.
The major precious metals refinery Rand refinery deals with gold refinery. Expected to increase capacity of operations by 5% at the time of reporting.
A comprehensive list of metals refiners is available from the South African Department of Minerals and Energy.
Final dispensers
The recyclers themselves can be final disposers. Upon failure to recycle some of the residue or by-product, the material is ultimately disposed of at the hazardous waste disposal sites managed by the municipality.
The illicit disposal of smaller electronic gadgets also occurs. Discarded fractions from activities of informal recyclers also occur.
Stellenbosch University https://scholar.sun.ac.za

51
3.5. Proposed models for e-waste management
GKPER and SECO initiative
Models have been developed to address e-waste management and recycling activities in the
country. Small scale e-waste recycling projects were initiated in Cape Town in 2004 supported by
Global Knowledge Partnerships in e-waste Recycling (GKPER) a brain child of Swiss State
Secretariat of Economics Affairs (SECO). The small-scale programmes sought to achieve a
decentralised approach to e-waste collection and dismantling and broadly create a pipeline through
which local awareness on the significance of proper e-waste recycling could be undertaken in more
remote regions. Through the success of the pilot programme, it was expected that it would be the
representative model upon which other regions lacking in e-waste management programs of a
similar nature could build upon (Schluep et al., 2009).
The Cradle to Cradle EEE management system
The Cradle to Cradle EEE management system seeks to maximise material reuse, reduce disposal
rate and hence landfill accumulation rates and formalise job creation in the e-waste recycling
sector (Widmer & Lombard, 2005). The institution of this model is dependent on the active and
continued positive partnership of concerned stakeholders. The researchers noted that the
institution of this model would be dependent on the active and continued positive partnership of
concerned stakeholders that would include the interested and affected parties, consumers, traders
and ICT industry captains. Stumbling blocks of a socio-political nature have limited the effective
institution of wealth creating initiatives associated with e-waste recycling (Widmer & Lombard,
2005).
Modified Swiss adapted approach
A four-step process flow chart embracing the formal and informal sectors and existent industries
was described by Chatterjee & Kumar (2009). The model was designed to enhance e-waste
management practices in India. The flow chart encapsulates ideas that can be applied to the South
African scene such as the exploitation of existent supply and value chain relationships in the
current recycling chain. Widmer et al., (2005) developed a model that specified the key players and
activities in the sector. The features of the existing model embrace concepts from the Swiss
structure.
Three step framework for developing e-waste strategy
A three step methodology to developing a structured approach to e-waste management was
advanced by Schluep (2014) (see Figure 3.1). The methodology entailed a detailed assessment of
a country’s legal structure, socio-political environment and materials inventory and infrastructural
capabilities to develop a structured strategy involving key stakeholders.
Stellenbosch University https://scholar.sun.ac.za

52
The obligations of the stakeholders are clarified regarding policy and legislation, business and
finance, technology and skills, monitoring and control and marketing and awareness. The final step
involves the implementation phase which must be followed up, monitored and evaluated against
set performance criteria.
The nation can draw lessons from the success of initiatives championed by EMPA and GIZ and the
progress in Kenya (Schluep et al., 2009). It was reported that in Kenya small scale models for
collecting e-waste through the active engagement of the informal sector and formal sector
comprising of formally registered collectors, demonstrated that sustainable e-waste initiatives can
be adopted in developing and transitioning economies and regions. Proper training at all levels, the
formalisation of the informal sector coupled with strong government support, is key to the success
of such models.
South African Tailor-made approach to e-waste recycling and disposal
Based on detailed research and findings of site visits within South Africa and Europe, a model for
e-waste management in South Africa was developed (Mouton & Wichers, 2016). The model
considered the existent weaknesses in the prevalent South African system, chiefly: the non-
uniformity of recycling systems in the country, inadequate infrastructure to support collection,
recycling, refurbishment and disposal of e-waste and its by-products. The researchers proposed a
holistic model that has attempted to address legislative and financial controls, define supporting
structures, enhance and homogenise collection activities of e-waste, provide for monitoring and
control and cover all geographical locations to ensure that no regions are isolated from e-waste
collection activities.
Measures were also proposed to safe guard against corruption and other objectionable business
practises that countermand sustainable e-waste management activities (Mouton & Wichers, 2016).
Within the framework of this model all four approaches to EPR were embraced. An analysis of the
assessment indicator system developed by Widmer et al., (2005) parallels the architecture of the
proposed model by the researchers.
Main observations of the proposed models
The areas crucial to enhancing the e-waste management and recycling activities in South Africa
were identified. Widmer et al., (2005) described five major parameters that must be considered
during the evaluation of an adopted e-waste management system or model. The parameters
address the following areas: system coverage, financing of the system, producer responsibility,
compliance and legal regulation. A broad evaluation of the proposed models and approaches to e-
waste management was done. The evaluation was based on the observed areas supporting the
South African e-waste management landscape (Dittke, 2007; Lawhon, 2013; Lydall et al., 2017)
and the five aforementioned parameters described by Widmer et al., (2005).
Stellenbosch University https://scholar.sun.ac.za

53
The broad assessment is summarised in Table 3.5. The general picture over the last decade has
shown a trend towards increasing the scope of issues addressed in developing a more efficient e-
waste management system in South Africa. Earlier models did not clearly define specific methods
for improving data collection and management in the e-waste economy. Recent research has
however alluded to a concerted drive towards the need to improve data capture and management
in the South African e-waste recycling economy (Lydall et al., 2017; GreenCape, 2018).
Stellenbosch University https://scholar.sun.ac.za

54
Table 3.5: Comparative evaluations of proposed e-waste management models
Areas addressed by the proposed models Cradle to cradle EEE management
system. Widmer &
Lombard, (2005)
Modified Swiss adopted
approach. Widmer et al.,
(2005)
Global Knowledge
Partnerships in e-waste
Recycling (GKPER) & SECO small
scale initiatives. Schluep et al.,
(2009)
Frame work for developing e-waste strategy Schluep (2014)
A model for effectively
recycling and disposing of e-waste in South
Africa Mouton & Wichers (2016)
Formalising job creation and improve synchronization of the formal and informal sectors
Yes Yes Yes Yes Yes
Moving towards a more circular economy Yes Yes Not clear Yes Yes
Financing the national waste strategy on e-waste management
Not clear Yes Not clear Yes Yes
Expansion of market absorption capacity Not clear Not clear Not clear Yes Yes
Mitigating high logistics costs and improving e-waste collection rates
Not clear Not clear Yes Not clear Yes
Improving data collection and management Not clear Yes Not clear Not clear Yes
Increasing awareness of society on e-waste and scope of stakeholder involvement
Not clear Yes Yes Yes Yes
Homogenize adoption and execution of regulations and statues on e-waste management.
Not clear Yes Not clear Yes Yes
Stellenbosch University https://scholar.sun.ac.za
Stellenbosch University https://scholar.sun.ac.za

55
3.6. Threats to successful e-waste management and recycling
3.6.1. Supply chain dynamics - material flows
Researchers in China, India and the United States of America for example, have acknowledged
that the low collection rate of e-waste is one of the most significant retardants to achieving a high
recycling efficiency (Kang & Shoenung, 2006; Patil & Patil 2015; Li et al., 2016). Between 70% and
90% of known e-waste in South Africa is reported to be in storage pending processing and safe
disposal (Lydall et al., 2017; GreenCape, 2018). The result has been the high inventory of e-waste
and hazardous material in domestic governmental and private institutes. It has been revealed by
researchers that a significant supply risk of e-waste into the main stream recycling chain is
prevalent. The result is that most recycling concerns operate at capacities not exceeding 60%
(Lydall et al., 2017). This not a financially sustainable model conducive to supporting expansion or
major recapitalisation projects as alluded to earlier. The existence of a centralised geographical
location of the major e-waste collection centres further erodes the financial merits associated with
the surrender or collection of e-waste (Finlay, 2005; Mouton & Wichers, 2016).
3.6.2. Data management and planning
The accurate accounting and validation of the specific volumes is still outstanding though efforts
are in place to actively remedy the deficiency through the establishment of a structured legal
framework. Efforts are in place to institutionalise the reuse, recovery and recycling through the
National Waste Management Strategy that was approved by cabinet in 2011. Responsibility for
collection and management of the data will fall under the auspices of national data repository
headed by Statistics South Africa. The efficiency of this strategy is hinged upon the accurate
recording of information on waste which has been a challenge (DEA, 2012; Lydall et al., 2017).
The factors contributing to the lack of a broad updated e- waste intelligence data base include the
absence of a mandatory enforcing regulation, the sensitivity of the information and the potential
implications associated with releasing of obsolete storage devices sensitive data. The available
statistical data pool is yet to be validated. There is also an observed a lack of analytical data
pertaining to waste streams. The organizations that do take the initiative to populate the statistical
pool do so, on a voluntary basis. A formalised mechanism for collecting data from the informal
sector is yet to be established. Variations exist in the quantity and type of data collected and the
proportion of active companies furnishing their WEEE statistics. This further weakens the validity of
the estimates (Godfrey, 2008). The meaning of this that known statistics tracing the life cycle of
EEE through the value, supply and recycling chains in South Africa can either be of two extremes;
pessimistic or optimistic, which complicates planning and budgeting for large capital expenditures
for e-waste recycling and associated management activities.
Stellenbosch University https://scholar.sun.ac.za
56
The future implementation of the South African Waste information system (SAWIS) has been
considered to enforce reporting of the discussed statistics pertaining to waste management (DEA,
2012).
3.6.3. Legislative and regulatory climate
In section 3.2.2 of this discussion, it was noted that the absence of specific legislation documented
for e-waste management is the dominant feature characterising the legal and regulatory climate in
the country. This loop hole has created a window through which illicit recycling activities proliferate
in the nation. Backyard recycling operations are a threat to the environmental sustainability and
well being of the affected communities.
The absence of clear policy and legislation complicates the merger of the formal and informal
sectors due to lack of regulatory and monitoring measures that are systematic and quantifiable.
The informal recycling sector is notorious for poor metals recoveries while accompanied by a
significant level of environmental pollution originating from the uncontrolled burning, disposal of
scavenged material and disposal of toxic acidic leach solutions (Finlay & Liechti, 2008). It is feared
that the existence of illicit recycling operations much like those of Nigeria, Ghana, China and India
are in existence in South Africa. It is however uncertain to what extent the challenge is rampant in
the country (Furter, 2004).
The existence of restrictive and complex legislative requirements delays the process of regulatory
compliance. The application of relevant operating licences is a lengthy process that is
counterproductive to recycling operations. Delays in processing documents have culminated in
some cases into losses of crucial supply contracts. Some of the legislation has an impact on the
applicable technologies that can be selected by e-waste recyclers and this can have a bearing on
the profitability of their operations (Dittke, 2007; Godfrey & Oelofse, 2017; Lydall et al., 2017).
It has also been observed that the cost of compliance in the last 30 years has shown an almost
proportional growth to the number of instruments being enacted. The result has witnessed the
progressive erosion in competitiveness as profit margins are being trimmed at the cost of
compliance (Godfrey & Oelofse, 2017).
National and provincial government only oversees waste management of local authorities. They
are not active participants in the absence of a well defined e-waste management policy and
legislation (Dittke, 2007). This arrangement limits the impact of regulations enforced when an arm’s
length approach is taken by the government.
Stellenbosch University https://scholar.sun.ac.za

57
3.6.3.1. New Quasi agency conflict
Views regarding the urgency of e-waste management and recycling are varied. As a result, the
level of priority accorded to e-waste management for a number of years was vague thereby
delaying the structured institutionalization of e-waste management policy and legislation. The
present set up of the system has favoured the export of varying degrees of recycled e-waste
contrary to government’s agenda targeting value addition along the e-waste recycling chain
(Godfrey, 2015; Lydall et al., 2017). In the absence of a well defined pricing strategy for e-waste
material to be recycled and metals recovered from the treatment operations promotes unhealthy
competitive behaviour in a growing business niche.
3.6.3.2. Capacity building
The current e-waste recycling activities in South Africa are characterised by the land filling of
plastic material impregnated with flame retardants that are not chemically bound to the plastic
matrix. The mobility of these substances into the ecosystem is probable. The fate of some of the
batteries removed from EOL EEE it was noted was unknown, though efforts more recently are now
underway to recover metals through recycling of batteries (Finlay & Liechti, 2008). Research has
also revealed that some recyclers are not ISO 14 0001 compliant. As a result of improper storage
of e-waste and failure to adequately treat effluent water, the potential for ground water
contamination is significant.
3.6.3.3. Transnational co-operation and responsibility
IT companies on the other hand affiliated to industry associations and bodies have been and
continue to be involved in refurbishment projects. The reluctance of some multinational companies
to participate in e-waste management drives on the domestic scene is a set back to the
establishment of EPR in South Africa. Producer countries are signatories to protocols regulating
the life cycle of electrical and electronic goods. Commitment to the mandatory regulations is limited
(Finlay & Liechti, 2008). As a result, this has undermined the overall objective of solving the global
e-waste challenge in regions of the world without the requisite capacity and infrastructure to
sustainably handle e-waste.
3.7. The key findings – A PESTEL analysis
In order to summarize the key findings made in the study of the South African e-waste
management and recycling scene a holistic approach was used to address all the relevant facets
of the country’s business environment. The PESTEL approach is a tool that is originally used to
evaluate the environment of a business as a part of assessing conditions for growth and strategic
realignment.
Stellenbosch University https://scholar.sun.ac.za

58
The acronym describes the political, economic, social, technological, environmental (influences to
a concern’s operating activities and tactical decision making) and legal facets of the business
sphere. This tool was adopted in the analysis of the country’s e-waste recycling economy assess
the status of e-waste management and recycling in South Africa as the operating environment.
The approach enabled a detailed stakeholder relationship to be critically interrogated across the
value and supply chain in the e-waste recycling operations. Figure 3.14 illustrates the elements of
the PESTEL approach used in this study. The key findings from the study of the South African e-
waste scene are summarized using the PESTEL approach.
Figure 3.14: The PESTEL approach to analysing e-waste management and recycling in South Africa
3.7.1. Political
E-waste recycling has been identified as one of the pivotal solutions to alleviating the high
unemployment rate particularly in the unskilled population groups. Pilot projects initiated by interest
groups in partnership with foreign NGOs were launched in response to the urgent need to create
employment through small scale establishments that can easily be set up in the different provinces.
Concerns have been raised at the potential value that is being lost to export markets. The
government has increasingly been promoting and prioritising efforts by different research groups in
the country towards the increased recycling and value addition along the e-waste recycling chain.
The value addition is targeted at the exploitation of all materials associated with e-waste with a
strong interest in the recovery of precious and rare earth elements. The traditional disposal of e-
waste is being rejected in favour of waste diversion from landfills and value addition through
recycling.
Stellenbosch University https://scholar.sun.ac.za

59
In response to the growing urgency to manage the growing volumes of e-waste an association was
formed in an attempt to homogenise and regulate e-waste management activities through the
formation of e-WASA. Through this body stakeholders’ involvement is drawn from across the value
and supply chain. Diversion of waste from landfills has also been supported by the efforts leading
towards the achievement of a more circular and green economy by the promotion of Extended
Producer Responsibility (EPR). This has been evidenced by the changing face of the waste
management bills enacted with an effort towards effectively crystallizing the regulation and
management of the e-waste recycling sector (Godfrey & Oelofse, 2017).
The need to merge the formal and informal sectors is pivotal in curtailing illicit activities detrimental
to human health and the environment, violence and crime. The study has revealed that no
association or collective forum exists for the informal sector.
The stringent enforcement of legislation may not be the adequate solution alone: the legal and
regulatory instruments must be concise, well structured with measurable and obtainable objectives
while identifying the relevant supporting structures to ensure and aid compliance (Schluep, 2014).
South Africa is a significant participant in the global economy and therefore must judiciously
enforce any legislation with conscious regard to the potential implication of future global trade.
3.7.2. Economic
Asian and European markets have been the major recipients of South African exports of recycled
e-waste products. The export of processed e-waste is greater than local sales suggesting that the
continued existence of the recyclers is dependent on a predominantly export based business
model.
Current activity in the e-waste economy is characterised by the reuse and refurbishment activities
that offer superior margins than recycling activities. Research findings revealed that some of the
recyclers combine other activities to boost revenues into their businesses.
The market responsiveness is demand driven and this affects the movement of material from the
recyclers. This has resulted in a low processing activity for some materials.
A large proportion of e-waste in South Africa is projected to be derived mostly from white goods in
the near future (Finlay & Liechti, 2008). Planning for the expansion and large scale diversification
of e-waste recycling activities is complicated by the lack of sufficient data. The available data has
not been verified and is heavily reliant on subjective estimates.
Stellenbosch University https://scholar.sun.ac.za

60
In earlier remarks it was noted that the quality of recyclable high value e-waste is decreasing and
this trend is expected to continue. This has a strong impact on the future dynamics of the e-waste
recycling sector in South Africa. The economy in South Africa has not matured to the level that it
can absorb large outflows of low value by-product streams. A clear plan for the operations and
continued research must be merged to ensure a sustainable and viable contribution from e-waste
recycling in coming years.
3.7.3. Social
The output of informal activities feeds into the more structured settings within the e-waste recycling
sector. No concrete statistics exist for the number of participants in the sector. The activities are
diverse and range from the collection of special parts or materials like copper for resale to larger
collectors who in turn supply even larger collectors. The nature of operations affords greater
liberties as a result of being exempt from environmental regulations. Some of the operations are
associated with activities that endanger human health and the environment. The participants in this
sector are vulnerable and possess little or no bargaining power for the material they salvage for
sale.
The high supply risk and cyclic raw material supply forces larger players to employ the bulk of
unskilled labour on a contractual basis as opposed to running on permanent labour contracts
(Lydall et al., 2017). The majority of participants in the informal e-waste recycling value chain in the
country comprise the unskilled segment of the population. The input from this highly unregulated
sector forms a crucial feeding point into the country’s e-waste value chain. Input from this segment
of the population trims the costs associated with the reverse logistics that could be incurred by
larger formal recycling companies associated with the collection and dismantling of e-waste in the
country.
The successful merger and regulation of informal activities is therefore a priority agenda in the
country’s broad e-waste management and employment creation initiatives. The success however
of small pilot initiatives provides a more permanent solution for absorbing the available unskilled
work force. Findings in this study have shown that the greatest job potential when examining waste
management activities in South Africa is associated with e-waste recycling (GreenCape, 2017).
3.7.4. Technological
The country has been making strides towards a more sustainable e-waste management model.
While general waste management activities in South Africa focus on waste collection and land
filling, e-waste recycling has been on the spotlight for over 13 years.
Stellenbosch University https://scholar.sun.ac.za
61
While there exists a vibrant metals processing industry, attempts to adopt large scale WEEE
facilities like the Noranda process in Quebec Canada or Umicore, Hoboken Belgium, command
substantial capital outlays with low supply risk operations. To date however, some of the firms
have been absorbing output from e-waste pre-processors to recover precious metals like gold and
PGMs. Some of the metal processors have signalled intentions to expand their processing
capability for handling e-waste feed streams. The operations of most recyclers have however
remained conservative, largely due to low and irregular raw material inflows. This has slowed the
implantation of capital upgrade and operating expansion projects of most of the recyclers.
South Africa is also supported by a vibrant research community. The continued research and
development expertise contribute towards value realisation, operating and extraction efficiencies in
the field of e-waste recycling. Further research associated with e-waste management provides
relevant material for debottlenecking areas retarding progress in the sector as a whole.
Capacity exists for developing technologies tailored for the needs of local manufacturers in the e-
waste recycling business. More established recyclers and pre-processors have developed
equipment for the in-house processes. The option for importing equipment from Europe and Asia
also exists.
Dismantling and mechanical processing options are the more established technologies in South
Africa. The capacity to expand pyrometallurgical processing is restricted by raw material supply
risk and the larger capital outlay that must be committed at the onset. To date however, there are
no pyrometallurgical facilities solely dedicated to e-waste smelting and refining operations.
In this study it was shown that Hydrometallurgical recycling of e-waste is slowly gaining traction.
One registered recycler has been reported to run a small scale operation with a process flow sheet
that has been improved for almost two decades. The operations of the hydrometallurgical plant can
range between 650 and 1 300 tonnes of WPCBs per annum. The recycler sources feed stock from
within South Africa and other SADC States.
3.7.5. Environmental
The e-waste recycling is characterized by a mix of formal and informal activities. The activities of
larger formalised recyclers tend to be more concentrated in the economic hubs of the country. The
smaller players are more dispersed while concentrating their activities in the region of origin.
It can be seen that the investment climate for exploitation is favourable. Opportunities for
investment in e-waste recycling within the e-waste recycling chain are available in the area of
research, industry, consultancy in e-waste management, small business development and various
training programs.
Stellenbosch University https://scholar.sun.ac.za

62
An analysis of the recycling rate of all waste streams in the country has revealed that e-waste has
the lowest rate. High barriers to entry upstream of the recycling chain with respect to the active
participants were identified. Low barriers to entry exist downstream of the recycling chain with
respect to value adding activities
The prevalent raw material supply risk however has altered the business dynamics across the
value chain. The high supply risk and centralized activity of major players has forced entrants and
established recyclers to reconfigure their business models to ensure survival.
The recycling rate of e-waste in the country has not exceeded 20% and in comparison with the
recycle rates of more established economies, the recycling activity is still in the infantile stages
especially further down the e-waste recycling chain. The operations of formal recyclers do not
exceed an annual capacity utilization of 50%. The depressed e-waste collection rates have
culminated in a low cumulative efficiency and the overall recycling rate.
3.7.6. Legal
A unique legislation for e-waste management and recycling activities in South Africa is lacking. The
enforcement of legislation affecting e-waste management and recycling in South Africa lacks
homogeneity. It varies along the different government levels. The existence of different municipal
by-laws contributes to this variation. Some by-laws do not contribute positively towards e-waste
management hindering operating activities (Dittke, 2007).The current legislation does not provide
for the protection of stakeholders in the informal sector. Further it does not provide for the
regulation and a means for monitoring informal e-waste recycling activities.
There still lacks a means of regulating the flow of and handling of materials in the supply chain. No
pricing strategy exists for appropriately valuing e-waste. As a result, irregularities exist across the
value chain. Accounting for value realised from e-waste is subjective.
The enforcement of extended producer responsibility as a means of enhancing e-waste
management activities is still in its infancy. As yet it is more voluntary than it is compulsory while
the active participation by foreign suppliers of white goods remains unsatisfactory.
3.8. The future outlook
Effective e-waste management is achieved through a synergy existing among researchers,
industry, consumers and government. It also embraces a balanced marriage of access to the
principal raw material, availability of the market for the waste and associated by products of e-
waste processing activities, the technical infrastructure and competences to support e-waste
management activities and sound economic viability (Widmer et al., 2005; Schluep et al., 2009;
Schluep, 2014; Mouton & Wichers, 2016, Lydall et al., 2017; GreenCape, 2017; 2018).
Stellenbosch University https://scholar.sun.ac.za

63
The perceived future position of South Africa and e-waste recycling is better understood from a
consideration of the findings of the research conducted. It is argued that with the appropriate
support and structures in place South Africa will be better positioned to be an efficient e-waste
recycler with the potential of being the role model for efficient recycling practices on the continent
(Schluep et al., 2009). It has been predicted that as South Africa is positioned to be the recycling
hub of the continent, the inflows of PC scrap and mobile phones from neighbouring countries like
Zimbabwe, Botswana and Zambia, will be significant contributors to the e-waste volumes destined
for recycling in the country (Schluep et al., 2009).
Secondly the existent strong metallurgical process industry supported by vibrant research support
networks and analytical capabilities help to equip the country to handle inflows of e-waste.
Thirdly there exists a large unskilled labour market in South Africa that can be absorbed into new
mainstream e-waste recycling activities. A strong manpower base supports the long term national
e-waste recycling goals.
Efforts to enforce a ban on imports into South Africa of e-waste however, may not be successful as
a measure to curtail the illegal influx of e-waste into the country.
3.9. Chapter summary
An analysis of the e-waste recycling economy of South Africa formed the first objective of this
study. In this chapter an appreciation of the legislation and other existing instruments influencing e-
waste management and recycling was developed. An exposition of the history of e-waste recycling
and management was made, by tracking the history of waste management legislation and its
impact on the e-waste recycling economy in the country. Other key findings were also discussed in
the close of the chapter. The PESTEL approach was used to summarize these findings that
included:
• The absence of a unique legislation pertaining to e-waste management and recycling,
• The existence of an underdeveloped market and technological capacity for absorbing
complex by-product streams from high volume processing of complex e-waste,
• A clear aggressive thrust towards the attainment of a circular economy through EPR,
• The prevalent low inflows of the key raw material into the mainstream e-waste recycling
economy,
• Finally the absence of a concrete statistical data pool for planning purposes.
The weaknesses in the system and constraints affecting the efficient management of e-waste were
brought to the fore. The discussion also highlighted the enthusiasm and the active participation of
the government and non-governmental interest groups in addressing e-waste management in the
country.
Stellenbosch University https://scholar.sun.ac.za

64
Tertiary and other institutions are actively involved in providing a solution towards homogenizing
the stakeholder relationships and improving the existent infrastructure in place.
The study also examined the existent market environment and forces dominant on the e-waste
landscape. South Africa as a business environment was analysed and found to be in the early
stages in comparison to the developed countries with more mature e-waste management and
recycling systems. E-waste recycling rates have been constrained a high raw material supply risk
derived from the low e-waste inflows into the e-waste recycling chain.
While the drive towards reducing the e-waste reporting to land fill is high the extent to which
material volumes within the e-waste value and supply chains is not well accounted for and has
presented a challenge when the need to plan for capital investment related to managing the
resource arises.
Factors contributing towards the reported low e-waste volumes in circulation were alluded to.
Researchers have agreed that a holistic model that has strong representation from all
stakeholders, backed by well policed and monitored regulatory measures will contribute to an
enhancement in efficient e-waste management. Bearing in mind the need for a strong interplay of
key elements discussed previously, the absence of a potentially profitable venture is meaningless.
In chapters 7 and 8 a detailed investigation of the economic feasibility of a hydrometallurgical
recycling process designed for copper and gold recovery to be operated in the context of South
Africa, was undertaken.
Prior to this study a discussion of the underlying process and economic considerations used in the
study is discussed in chapters 4 and 5. The proposed processing capacity was pegged at WPCB
recycling rate of 400 tonnes per annum of WPCBs. This implies that 100% of the estimated annual
generation of e-waste with WPCBs in South Africa will be absorbed. The development of potential
business models around the proposed hydrometallurgical process was discussed in chapter 6.
These business models were aligned to the confines of the operating environment and analysed
qualitatively and quantitatively.
Stellenbosch University https://scholar.sun.ac.za

65
Chapter 4: PROCESS DESCRIPTION
AND DESIGN CONSIDERATIONS
4.1. Process description
Four major technologies are available for recycling e-waste and can be used in isolation or in
combination with each other. Hydrometallurgy has been identified to be a technology that is
scalable, associated with high process kinetics offering a degree of selectivity that made it an
attractive technology to explore for the recovery of metals from pre-processed e-waste as a value
adding activity (Pyper & Hendrix, 1981; Monhemius, 1987; Yannapoulos, 1991; La-Brooy et al.,
1994; Wu et al., 2008; Kamberovič et al., 2011; Jing-Ying et al., 2012; Gurung et al., 2013;
Rossouw, 2015; Birloaga, et al., 2016).
A hydrometallurgical process to selectively recover copper and gold from end of life printed circuit
boards (WPCBs) rated initially at a recycling capacity of 30 000 tonnes per annum of WPCBs was
designed following previous empirical work (Rossouw, 2015; de Waal, 2018). The initial design
capacity allowed the researchers an opportunity to compare the economic performance of a
hydrometallurgical process against that of a pyrometallurgical process rated at a similar production
capacity developed by Ghodrat et al., 2016.
It was established in the current study that the operation at a name plate capacity of 30 000 tonnes
per annum of WPCBs would require a consistent supply ranging between 590 000 and 1 770 000
tonnes of unprocessed e-waste based on the proportion of WPCBs in e-waste described by
researchers (Widmer et al., 2005; Schluep et al., 2009). A comparison of operations at an
established facility, Umicore running at a name plate capacity of 250 000 tonnes per annum of
varied secondary metal sources, which includes WPCBs and high value electronics (Hagelüken,
2006), revealed that the success of the proposed hydrometallurgical venture would be affected by
the extent to which the capability of logistics function of Umicore could be replicated and even
exceeded in South Africa.
A due diligence of different operating capacities was therefore undertaken in the study in light of
the existent raw material supply constraint. As evidenced from the analysis, operations in excess of
1 000 tonnes of WPCBs per annum would be burdened by steep reverse logistics costs associated
with circumventing the existent raw material supply risk (see appendix E, Table E.1). The
consistent supply of high grade WPCBs was noted to be limited and is expected to deteriorate with
the active interest in replacing the use of precious metals in electronics manufacture with cheaper
alloys that have similar performance characteristics.
Stellenbosch University https://scholar.sun.ac.za

66
It was envisaged that the WPCBs would be recovered from multiple electrical and electronic
components. An analysis of the activity and capability of existent recyclers upstream of the South
African e-waste recycling chain revealed that an installation with a processing capacity of up to 500
tonnes per annum could be supported. There were indications that a reliable supply of the key raw
material could be supplied by the existent recyclers. Using a pessimistic approach the calculations
based on inferences made by Widmer et al., 2005, revealed that operating at a name plate
capacity of 400 tonnes per annum for example, would require sourcing of approximately 23 530
tonnes of unprocessed e-waste.
The plant was designed to recycle WPCBs at a rate of 400 tonnes per annum. The quality of the
feed material was varied so that the plant would process all three grades of WPCBs: low, medium
and high grade. The mix of WPCBs reflected the most realistic representation of what is prevalent
in the South African e-waste recycling economy. For the scope of this study categories two, three
and four of e-waste, as defined by The European Parliament and the council of the European
union, were considered for the collection and dismantling section of the operations (see Table 3.1
section 3.1).
Due to the large variation in the age and material specification of the WPCBs composition an
assay detailed in literature (Shuey & Taylor, 2004) was used in previous studies for the empirical
test work and development of the process flow sheets used in the current studies (Rossouw, 2015;
de Waal, 2018). Five major operations were associated with the proposed venture that defines the
first business model and these include: collection, dismantling and segregation, size reduction,
solder leaching, copper extraction and gold extraction.
Figure 4.1: The generic flow sheet for the WPCB recycling process
Stellenbosch University https://scholar.sun.ac.za

67
Detailed flow sheets showing the equipment for all the processes are shown in appendix D. Figure
4:1 outlines the main operations associated with the proposed venture.
For the study, the collection of e-waste was assumed to be achieved through a dispersed system
relying on remittance from all nine provinces in South Africa. It was also assumed that the
collection model was dependent on material that was voluntarily surrendered at designated
collection points already in existence. Published e-waste recycling rates in South Africa have
revealed the need to boost collection volumes through a financed incentive scheme that will
support buy back of obsolete equipment and strengthen the engagement of the informal sector.
The collected e-waste was transferred to the central processing plant located in the central
commercial hub of the South African e-waste industry namely Gauteng. It was assumed that this
was achieved by using a dedicated fleet of vehicles that include the company’s own and hired
vehicles for the periodic collection of e-waste. The collected material was stored onsite prior to
dismantling. Bulk storage of the e-waste onsite was done with the assumption that relevant
legislation affecting bulk storage of hazardous material was amended.
The dismantled fractions were directed to a transitory warehouse facility for dispatch to other
recyclers in the metals and plastics recycling business. The recovered WPCBs were directed to the
pre-treatment plant designed to process at least 1.28 tonnes/day of WPCBs. Pre-treatment
entailed dry crushing and screening. Based on the designed process, 45% of the material was
redirected to the hammer crusher as oversized material. The underflow reported to the ball mill
where the material underwent dry milling. The material exiting the ball mill was channelled by
means of a screw conveyer into a buffer storage hopper.
An extractor screw conveyed the milled WPCBs to the buffer feed hopper located in the solder
leaching plant. Copper was extracted under oxidative conditions using sulphuric acid and hydrogen
peroxide. The pregnant leach solution (PLS) was pumped to the pregnant leach solution holding
tank.
The PLS was transferred after 24 hour cycle times to the solvent extraction circuit and
electrowinning plant. Copper was recovered as copper cathode plates of LME Grade A quality. The
solid residue from the copper leaching circuit underwent cyanide leaching after stripping the
remaining base metals. The leached material was then filtered and the PLS directed to the carbon
in pulp (CIP) adsorption circuit. The pregnant carbon was then washed with hydrochloric acid
before undergoing elution to recover the gold in solution. The basic gold solution was then
channelled to the electrowinning circuit where gold was recovered in plated form as sludge.
The mass balances applicable to the copper extraction circuit are specified in appendix A, Table
A.3. The solvent and aqueous phase recovered rates were assumed to approximate steady state
conditions.
Stellenbosch University https://scholar.sun.ac.za

68
The mass balances applicable to the gold extraction circuit at steady state are specified in
Appendix B. The steady state conditions factor in the carbon losses across the circuit, gold losses
to tailings derived from carbon losses and barren solution from the adsorption section and the
carryover of base metals to the carbon adsorption circuit after filtration. Make up of carbon
inventory is factored in at steady state operations.
4.2. Process and design considerations
4.2.1. Collection and dismantling
Collection and dismantling as a separate operation in the business was considered in the study.
Literature has reported that the logistical and handling cost components associated with the
collection and dismantling of e-waste function are high (Lydall et al., 2017; GreenCape, 2018).
During the development of the business models the viability of housing a collection and dismantling
business unit was assessed. The detailed assessment was covered in chapter 6. The collection
and dismantling of e-waste to recover WPCBs was not included in the scope of the operations of
the group 3 and 4 business models.
4.2.2. Shredding and comminution
The mechanical treatment of WPCBs can be done in either dry or wet conditions. The dry
shredding and comminution of WPCBs in preparation for subsequent processing steps has
however been associated with a notable degree of co-separation of precious metals. This co-
separation is increasingly marked at higher degrees of particle size reduction and the resultant
metal liberation from the main board matrix.
The high returns associated with recycling high grade WPCBs deteriorates with the use of
mechanical methods as a result of higher losses of valuable metals due to the co-separation of
precious metals (Goosey & Kellner, 2002; Cui, 2005; Hagelüken, 2006; Kogan, 2006; Hanafi et al.,
2012; Khanna et al., 2014; Ghosh et al., 2015). Hagelüken (2006) reported precious metals losses
of up to 20%.
For the process under consideration dry shredding and comminution of the WPCBs was selected.
It was assumed that the WPCBS were shredded and crushed to a size < 2mm in diameter. The
specifications for the size reduction are outlined in Table 4.1 below.
Table 4.1: Operating specifications for the crushing and comminution of WPCBs (Rossouw, 2015)
Main operation Equipment Size specification
Crude Crushing Hammer Mill 1mm
Screen 15mm 20mm
Pulverisation Ball Mill <2mm
Stellenbosch University https://scholar.sun.ac.za

69
In the previous studies size classification and removal of the 2mm particles was done intermittently
to avoid the generation of fines.
The final product size distribution of shredding and crushing is influenced by the volume feed rates,
residence time in the circuit, material composition and moisture. The detailed size distribution for
the crushed WPCBs was not provided (Rossouw, 2015).
For the purpose of this study the material size distribution was based on previous work done by
He et al., (2015) as detailed in Table 4.2. Based on these results it was assumed that 7.16% of the
material was recovered by the dust recovery mechanisms inbuilt into the purchased equipment.
Localised temperature elevations occur during the dry shredding of WPCBs, which releases fumes
of infused flame retardants (Zhao et al., 2006; Li et al., 2010).
It was assumed that comminution fines would be recovered within the process by use of dust
socks built into the purchased equipment while the fugitive dust emissions and the toxic fumes
generated were eliminated by the use of fume extractors. Outlined in Figure 4.2 is a schematic
representation of the size reduction operation entailing shredding and comminution.
Figure 4.2: Shredding and comminution circuit
Owing to the variability in the composition and physical size of WPCBs no single density can be
assigned to all WPCBs. For the study categories 2 to 4 of e-waste formed the source of the
WPCBs used in the process.
All grades of WPCBs were included. For the mass and energy balances the WPCB analysis
provided in literature was used to calculate an un-compacted bulk density for the milled WPCBs
(Shuey & Taylor, 2004). For the study a density of 1 718kg/m3 was used. It was assumed that the
unmilled WPCBs had a voidage of 30% when stored in an un-compacted state so that the bulk
density of the unmilled WPCBs was estimated to be 1 203kg/m3.
Stellenbosch University https://scholar.sun.ac.za

70
4.2.3. Solder leaching
The objective of this step was to remove the lead and tin prior to the extraction of copper. Elevated
concentrations of lead and tin are undesirable in the copper and gold recovery circuits. Based on
previous studies it was established that lead, tin, nickel, zinc, iron, and small amounts of copper,
aluminium and silver were leached under the conditions specified (Rossouw, 2015; de Waal,
2018).
Table 4.2 summarises the proportions of materials that were attacked by the acid based on
previous empirical studies (Rossouw, 2015). The data from these studies was used for determining
the mass and energy balances and predicting the reactions that were expected during the solder
leaching. The ceramics and plastic fractions were not attacked by the acid.
Table 4.2: Comparative profiles based on empirical work and up-rated mass balances of material
attacked during the solder leaching step (Rossouw, 2015; de Waal, 2018)
Item Material Percentage that reacted (%) Empirical (Rossouw, 2015)
Percentage reacted based on mass balances (de Waal, 2018)
1 Iron 83.80 76.20
2 Copper 0.20 0.19
3 Aluminium 21.40 15.30
4 Tin 15.10 6.99
5 Nickel 43.00 33.60
6 Zinc 2.30 1.69
7 Lead 84.30 97.90
8 Manganese N/D N/D
9 Antimony N/D N/D
10 Gold 0.00 0.00
11 Silver 2.10 1.31
12 Ceramics (SiO2, Al2O3, alkali and alkaline earth oxides, mica)
0.00 0.00
13 Plastics (Polyethylene, epoxies, PVC, PTFE, polypropylene, polyesters)
0.00 0.00
The hydrogen produced was estimated to be in concentrations low enough to vent into the
atmosphere. Two options were incorporated in this process to handle the oxides of nitrogen
generated. The options include direct venting to the atmosphere and scrubbing. The first option
which entails direct venting to the atmosphere formed the basis of the original mass balances. It
was envisaged that the concentration of the oxides of nitrogen vented would be low and the
diluting effect of the background atmosphere would contribute towards a low emission level (de
Waal, 2018).
Following a review of the process flow sheets a second option for handling the fumes was
considered. The second option allowed for the recycling of the fumes to generate weak nitric acid
at concentrations not exceeding 10%. The first option for handling the fumes was considered for
this study. Figure 4.3 illustrates the main solder leaching process.
Stellenbosch University https://scholar.sun.ac.za

71
Figure 4.3: The solder leaching process
4.2.4. Copper extraction
4.2.4.1. Leaching
The objective of the copper extraction plant was to produce copper of LME Grade A standard
through electrowinning of the PLS derived from leaching of the WPCBs. This was achieved by an
oxidative leaching step using sulphuric acid and hydrogen peroxide based on the results of
leaching and optimisation tests done (Rossouw, 2015). Combining the findings of the test work
done it was determined that the solid materials in the feed would react with the sulphuric acid in the
proportions listed in Table 4.3.
Table 4.3: Comparative profiles based on empirical work and up-rated mass balances of material
attacked during the copper leaching step (Rossouw, 2015; de Waal, 2018)
Item Material Percentage that reacted (%) Empirical
(Rossouw, 2015)
Percentage reacted based on mass balances (de Waal, 2018)
1 Iron 84.10 84.10
2 Copper 96.46 96.50
3 Aluminium 26.14 18.40
4 Tin 5.83 0.80
5 Nickel 72.01 57.80
6 Zinc 92.20 93.40
7 Lead 0.00 0.00
8 Manganese N/D N/D
9 Antimony N/D N/D
10 Gold 0.00 0.00
11 Silver 0.00 8.50
12 Ceramics (SiO2, Al2O3, alkali and alkaline earth oxides, mica)
0.00 0.00
13 Plastics (PE, epoxies, PVC, PTFE, PP, polyesters) 0.00 0.00
Stellenbosch University https://scholar.sun.ac.za

72
Polishing of the acidic liquor was achieved in the solvent extraction circuit prior to electrowinning.
Empirical data for designing the solvent extraction and electrolysis circuits was not available.
Instead, using heuristics from literature combined with standard industrial practice, mass and
energy balances around these two circuits were performed, which have been discussed in greater
depth in the sections to follow. Figure 4.4 depicts the main unit operations associated with the
recovery of copper from WPCBs. For this study it was assumed that no leaching aids were used
and would not be necessary.
Stellenbosch University https://scholar.sun.ac.za

73
Figure 4.4: The copper recovery circuit
Stellenbosch University https://scholar.sun.ac.za
Stellenbosch University https://scholar.sun.ac.za

74
4.2.4.2. Solvent extraction
Equipment
Contactors can generally be categorised as stage wise or differential. Stage wise contactors are
easier to scale up or down. For the process that was developed no empirical studies on a
laboratory and plant scale supported the choice of contactor. Industrial experience and literature
studies (Ritcey & Ashbrook, 1979) were instead used to support the decision to use the mixer
settlers. Mixer settlers were selected as the contactors to be used (de Waal, 2018).
Costs of solvent extraction
The operating costs associated with solvent extraction may be divided into 8 general categories.
These costs include: feed liquor preparation, solvent pre-equilibration, scrubbing, stripping, solvent
loss and recovery, labour and maintenance costs, energy costs, metal recovery from raffinate
streams, chemicals and other consumables. These costs were factored into the economic
evaluation of the process under study (Ritcey & Ashbrook, 1979).
Extractants
Three broad categories of extractants exist and include those that form compounds, those
involving ion association and those involving solvation of the metal ion. Extractants are expected to
be inexpensive, relatively insoluble in the aqueous phase and possess a notable degree of stability
after repeated use in the process (Ritcey & Ashbrook, 1979). The extractant must not be prone to
the formation of stable emulsions and crud. It is also desirable that the extractant possess good
coalescing properties to minimise phase disengagement time. High metal loadings and ease of
stripping are also desirable in an extractant (Ritcey & Ashbrook, 1979).
The most widely used extractants in the copper processing industry include aldoximes, oximes and
blends of modified aldoximes and ketoximes. Examples of these extractants include ACORGA
OPT5510, ACORGA OPT5540, ACORGA M5774, the Shell chemicals (SME series), Kelex series
and LIX 984N (Ritcey & Ashbrook, 1979; Maes et al., 2003; Mwale 2009; BASF, 2015; Sole &
Tinkler, 2016). These extractants are chelating extractants that fall into the category of the
compound forming extractants.
The first LIX extractants were developed to extract copper from copper dump leach solutions. Most
LIX extractants can be used without the use of a modifier (Sole et al., 2007). Typical modifiers
used in commercial extractants include tridecanol and nonylphenol. Pilot studies were conducted
with LIX 860. It was shown revealed that the rate of crud build up using modified extractants was
double the rate associated with the use of an unmodified extractant (LIX 680).
Stellenbosch University https://scholar.sun.ac.za

75
This confers an advantage in using LIX extractants over the other extractants containing modifiers
or requiring modifiers during use. Mwale (2009) compared the performance of LIX 984NC and
ACORGA M5774 and noted that LIX 984N offered the advantage of low copper losses to tailings.
For the process under study LIX 984N was selected as the most appropriate extractant. LIX 984N
is comprised of an equimolar blend of LIX 860N-I and LIX84-I. This aldoxime and oxime blend
displays superior Cu2+ extraction rates when compared to the performance of ketoximes. The
extractant requires no addition of a modifier in the process (Ritcey & Ashbrook, 1979; Bacon &
Mihaylov, 2002; BASF, 2015).
Typical industrial practice recommends an extractant concentration of between 10% and 40%
(Kuipa & Hughes, 2002). A concentration of 32% LIX 984N diluted in kerosene was specified in the
process design (de Waal, 2018). An organic to acid ratio of 3.53 was used. Using the specified O/A
ratio in the extraction stage 80% copper extraction was assumed that resulted in a copper loading
of 9.6g/L. The specified process configuration for the extraction-washing-stripping based on typical
industrial practice was 3-1-2 (de Waal, 2018).
The wash stage was included to minimise aqueous entrainment into the loaded organic phase
(Ritcey & Ashbrook, 1979; Maki, 1999). The wash stage also served to scrub co-extracted and
entrained inorganic contaminants. It was assumed that the wash stage was run in the organic
continuous profile. Clean water acidified with sulphuric acid was used for the process. It was
assumed that the wash stage was operated at the same capacity as the stripping stage with an
O/A ratio of 1.56. It was further assumed that the aqueous phase entrained during the extraction
stage was captured in the wash stage and no solvent was entrained in the effluent wash water.
Co – extraction of non - target metals
Metals exhibiting chemical similarity display similar extraction properties at differing or matching
rates. The co-extraction of other metals in the feed contributes to an alteration of the chemistry of
the solvent phase. Manganese is deleterious to the extractant as will be discussed in later
sections. Iron is also co-extracted with copper. The use of a highly selective extractant for this
study was assumed to reduce the tenor of iron reporting to the electrowinning circuit.
Cobalt and nickel exhibit chemical similarity to copper and will be co-extracted. Sridhar et al., 2009
investigated the extraction of copper and nickel using LIX 984N. Findings of the research indicated
that the selective uptake of copper and nickel is achievable by varying the pH of operation. It was
shown that nickel was more likely to be extracted in an alkaline media for the conditions that were
studied (Alguacil & Cobo, 1999; Sridhar et al., 2009; Kumar et al., 2013). A comparison of the
extraction rates at equimolar concentrations revealed however, that copper extraction was still
superior, attaining equilibrium at a faster rate than nickel (Sridhar et al., 2009).
Stellenbosch University https://scholar.sun.ac.za

76
The concentration of the metals present in a solution also acts as a driving force to towards the
rate of attainment of equilibrium. In less than 5 minutes of extraction, all the copper was extracted
and achieved equilibrium, while only 61% of the nickel extracted attained equilibrium (Sridhar et al.,
2009). While the system applies to alkaline conditions the results do give a possible indicator of the
strong influence of the concentration of the species and relative stabilities in the specified pH of the
medium.
For the process under consideration the ratio of Cu to Ni was found to be 25:1 which was 2.5 times
greater when compared to the work of previous researchers (Sridhar et al., 2009). Sridhar et al.,
(2009) observed that the co-extraction of nickel occurred at a pH of 2. It would thus be expected
that in a contact time of less than 60 seconds a negligible amount of nickel would be co-extracted.
No empirical data however, was available to support this prediction for the process under study. It
therefore was assumed that all the nickel was co-extracted together with cobalt.
Within the scope of this study it was also assumed that in a case where aqueous entrainment
(when running in an organic continuous profile) into the organic phase occurred, it was expected
that aluminium, zinc, tin, lead, manganese, silver, silica and alumina would report to this phase.
Based on the performance data of LIX 984N for the operating parameters specified and the mass
balances calculated, it was established that the maximum iron content to be co-extracted would
amount to 0.009mol/hour. For the final processing of the pregnant leach solution no iron was
present.
Extractant losses
Solubility data on the LIX and Kelex extractants indicate that these materials are poorly soluble in
aqueous media. In copper extraction systems running at pH values in the neighbourhood of 1.5,
the reported extractant losses have been noted to range between 15ppm and 140ppm. At levels as
high as 140ppm, solvent losses represent a major cost of the solvent extraction process. These
losses include both soluble and entrainment losses as determined from inventory calculations
(Ritcey & Ashbrook, 1979). Solvent entrainment losses for the LIX systems are estimated to be
higher than those of the Kelex systems because of the higher organic/acid (O/A) ratio required but
at half the cost per unit mass of reagent required (Ritcey & Ashbrook, 1979).
A review of the LIX 984N solubility data on the material data sheet (BASF, 2015) indicates that this
extractant forms insoluble copper complexes in the aqueous phase. Losses for the process under
study were deemed not to arise from organic solubility in the aqueous phase.
Entrainment
Solvent entrained in the aqueous raffinate, in the strip liquor or in cruds is the most significant
contributor to organic solvent losses. Organic losses to the raffinate have been reported to range
between 7ppm and 125ppm (Sole et al., 2013).
Stellenbosch University https://scholar.sun.ac.za

77
Entrainment losses can be attributed to a number of factors. The factors include a combination of
one or more of the following: insufficient settling area or inadequate settling time for phase
disengagement, poorly designed or operated mixers, a high energy input during the mixing stage,
lack of additives to suppress emulsion formation, poor diluent choice, high extractant concentration
in the solvent and solids in the aqueous feed.
During the design and revision of the process flow sheets it was assumed that the operating
conditions and the selected reagent would not contribute towards solvent losses due to inadequate
settling time.
Any losses of the copper complex and solvent would be a result of entrainment of the organic
phase in an aqueous continuous system. It was also assumed that with the smaller operating scale
and ease of monitoring a smaller installation in comparison to larger facilities the losses of solvent
were maintained at an average of 15ppm.
Volatilization
Volatilization of solvent components can be a problem when the system is run at elevated
temperatures or in hot climates. The operating conditions specified during the development of the
process were below the flash points of the constituents of the solvent and the diluent (de Waal,
2018). Operating in regions close to the flash point of the organic constituents increases the risk of
fire. In this study minimal volatilization of the diluent was assumed to occur for the specified
conditions of operation, therefore significant losses of diluent were not factored into the economic
study.
Reagent stability and degradation
Sufficient data was unavailable to account for the stability of various extractants, modifiers and
diluents being used in the solvent extraction process. The degradation of solvent components can
arise from various sources. These sources include the oxidising properties of the aqueous phase,
high temperatures in the system, aging and oxidation by atmospheric exposure and general
instability of the component over repeated cycles of operation (Miller, 1995).
Studies on LIX reagents have shown a tendency towards degradation resulting from the
dehydration that occurs between the proximal oximoto and hydroxyl groups within the extractant
molecule (Miller, 1995).
In this study it was assumed that the normal degradation rate associated with the nature of the
chemical groups and their influence on each other would be the major contributing factor towards
solvent degradation.
There are cases where extractants can interact with the diluent resulting in the formation of species
that alter the uptake of the metal ion of choice (Ritcey & Ashbrook, 1979; Kuipa & Hughes, 2002).
Stellenbosch University https://scholar.sun.ac.za

78
Diluents with high dielectric constants have been predicted to show a greater interaction with the
aqueous phase. Kuipa & Hughes (2002) noted that the capacity of the extractant would be reduced
as a result of the potential uptake of water molecules at the liquid-liquid interface between the two
liquids. In this study however, it was assumed that this phenomenon occurred to such a low degree
that did not influence the performance of the bulk organic phase.
The formation of other species can lead to the generation of third phases that have the ability to
contribute towards the formation of cruds. The temperature dependence of third phases has been
observed in commercial copper operations. Large scale commercial copper producers have used
this knowledge to manage the formation of this phase when the plant is in operation (Ritcey &
Ashbrook, 1979). Further research has shown the tendency of aliphatic diluents to form another
organic phase. In the scope of this study however, third phase formation was assumed not to
occur.
Modifiers are often added to suppress the formation of third phases. The modifier typically
constitutes between 2% and 5% of the organic solvent. Carboxylic acid-kerosene and chelating
extractant-diluent mixtures do not usually require the addition of a modifier. As with diluents, the
extractive properties of a solvent can also be affected by modifiers (Ritcey & Ashbrook, 1979). For
the process under study it was assumed that no interaction between kerosene and LIX984N
occurred. As detailed earlier with the use of LIX 984N, no modifier was necessary.
Crud formation
Literature reports that crud formation is common to all or most solvent extraction operations in the
metals extraction processes with an average of 50% organic in its composition (Bishop et al., 1999;
Hartmann & Corbella, 2007).
Solids in the feed are precursors to the formation of crud that act as emulsion stabilizers during the
mixing stage. Practical experience however has shown that LIX systems are prone to crud
formation. The formation of stable emulsions leads to the formation of cruds. The crud can
constitute a significant solvent loss negatively affecting the process economics of the circuit.
Several factors have been noted to contribute towards the formation of crud. These factors include:
fungal and bacterial growth, degradation products of the solvent, the presence of fine solids, by-
products associated with the extractant manufacture, components of the main raw material
entering the process, chemical interactions between constituents of solvent phase, high shearing
rates during mixing and poor phase disengagement times. The types of crud formed are unique to
a process and vary in composition and structure.
Stellenbosch University https://scholar.sun.ac.za

79
The nature of the raw material feed and its handling upstream of the process plays a part in the
formation of crud. The presence and concentration of certain cations such as iron (Fe3+), silica
(SiO2), calcium (Ca2+), magnesium (Mg2+), manganese (Mn7+), aluminium (Al3+), phosphorus (P)
and sulphate (SO42-) can, with sufficient shearing effects during mixing, yield cruds (Ritcey &
Ashbrook, 1979, Sole et al., 2018).
Solids present from suspended material form sites that stabilize the emulsion as they exist in the
aqueous phase as a dispersed colloid. Solid matter that includes jarosites, dissolved and
suspended silica, quartz, micas and gypsum are well known contributors towards the formation of
crud in copper solvent extraction systems (Ritcey & Ashbrook, 1979; Readett & Miller, 1995;
Sole et al., 2018).
As particles increase in the degree of hydrophobicity, the tendency towards crud formation follows
a similar pattern. Normal operations therefore include filtration in the operation to reduce the solids
concentration in the rich liquor to 10ppm (Ritcey & Ashrook, 1979). Dissolved silica is well known
for polymerizing in aging solutions. The polymerized silica contributes towards elevating the
solution viscosity and impedes the transfer of ions across the organic and aqueous interface
(Sole & Tinkler, 2016).
Solids responsible for the formation of crud from WPCB feed include, silica and mica fines. For the
purposes of this study it was assumed that filtration was able to achieve a solids concentration of
up to 10ppm. It was also assumed that silica originally present in the WPCBs was not attacked by
acid. No silica gels were formed for the process under consideration. Organic matter, humic acids,
dust and low ionic strength, were also considered inapplicable factors contributing to crud
formation in this study.
Unreacted chemicals from the manufacture of the extractant or impurities from the containers also
contribute to the formation of crud. Their presence can either promote or depress phase separation
and enhance or suppress the uptake of the targeted metal (Ritcey & Ashbrook, 1979). The specific
effects are usually verified through bench scale and pilot studies. During the development of the
process no empirical data was available to consider this factor. It was therefore assumed for the
mass balances done (de Waal, 2018) and the scope of this study that the influence of unreacted
species was not applicable. Crud formation for the process under study was attributed to the
presence of fine solids of SiO2 and mica, fungal growth and aging of the solutions.
Managing crud formation and solvent recovery
No universal treatment scheme exists that broadly covers the recovery of solvent for all solvent
extraction processes. This is attributed to the uniqueness of the process and crud that is formed.
Stellenbosch University https://scholar.sun.ac.za

80
Several options however do exist for breaking down crud and the selected option is also subject to
experience in the plants. The options include, settling and skimming, filtration, acidification,
neutralization to pH values close to 7 and intense agitation (Ritcey & Ashbrook, 1979).
As the feed grade changes the frequency and nature of the crud formed will also respond in a
similar manner. Sole & Tinkler (2016) noted that crud formation can result in the filling of the
settler within a one and half to a twelve month period of operation.
Copper recovery circuits using LIX solvents were earlier noted to be notorious for crud formation
(Ritcey & Ashbrook, 1979). Test work and full operation of a centrifuge have proved successful in
systems with a high degree of fines. In the Bwana Mkubwa solvent extraction plant, that uses LIX
984N, the centrifuge was reported to enable the successful and consistent recovery of at least 95%
of the solvent (Mukutuma et al., 2007). It was noted that the centrifuge is capable of handling three
phases during operation. A fourth phase was however observed due to the presence of ultrafine
solids that stabilised the emulsion. The researchers noted that further work was required to
improve the design to manage the fourth phase that formed.
Studies examining the rate of crud formation in a copper pilot plant using a mixer settler were
undertaken by Aminian & Bazin (1999). The researchers were able to derive a correlation based
on time and thickness of crud formed in the LIX 984N extraction system. The expression, detailed
in 4.1 below, revealed the existence of a non linear relationship between the crud formation rate
and time.
h(t) = 21.39(1- e-0.004t) (4.1)
The time ‘t’ is expressed in hours and the thickness ‘h’ is expressed in centimetres.
Results of the study also revealed that the rate of increase in crud thickness declined with time.
The crud was shown to be associated with Al2O3, gypsum, silica, and Fe2O3. A comparison of the
liquor compositions for the process under study and the studies of Aminian & Bazin (1999) are
summarized in the Table 4.4:
Table 4.4: Stream analysis for the prediction of crud generation rates in LIX 984N extraction system
Aminian & Bazin (1999) (Rossouw, 2015; de Waal, 2018) Comparative proportion Element Concentration (g/L) Element Concentration (g/L)
Cu 1.62 Cu 1.41 0.87
Fe 15.60 Fe 2.88 0.19
Al 7.69 Al 0.70 0.09
Mg 2.93 Mg 0.00 0.00
Si 758.50 Si 0.00 0.00
Mean proportion 0.07
An analysis of the data revealed that the crud formation rates for the system under study were
predicted to be lower in comparison to findings in literature (Aminian & Bazin, 1999).
Stellenbosch University https://scholar.sun.ac.za

81
The predicted crud formation rate, using a comparative analysis of the results estimated a rate
which was only 7% of the rate predicted by the researchers (Aminian & Bazin, 1999).
In this the study the rate of crud formation was therefore assumed to follow the model derived by
Aminian & Bazin, 1999. An additional 3% was added to account for the effects of fungal and
bacterial growth, typical of LIX systems. It was therefore assumed that 10% of the calculated crud
thickness at the end of 24 hours was the thickness of the crud formed for the process under study.
In commercial mixer settler operations crud accumulates towards the discharge end of the settler.
The crud in this study was assumed to form in the settler area which was removed at the discharge
end of the settler. It was assumed that the settler area occupied 85% of the total surface area
available in the mixer-settler. The crud formation data used for this study is summarized in Table
4.5.
Table 4.5: Crud formation data for the process under study
Item Detail Data
1 Mixer-settler units 3
2 Available mixer settler area 7.50m2
3 Settler area of crud 6.40m2
4 Operation time 24hours
5 Calculated crud thickness (h1) at t=24 hrs 1.96cm
6 Crud thickness for the process under study = 0.1h1 0.20cm
7 Crud composition (Bishop et al., 1999; Hartmann & Corbella; 2007). 50% v/v organic
8 Crud density 994.72kg/m3
9 Crud volume formed per day 0.04m3
10 Crud mass formed per day 37.34kg
11 Solvent recovery (calculated) 97.25%
12 Solvent recovered 15.41kg/hr
13 Solvent to effluent clay treatment 0.44kg/hr
It was assumed that the rate and nature of the crud formed was fairly consistent since an averaged
feed grade of WPCBs was considered for the study. The settlers and skimmers for crud removal
and management were considered to have been incorporated in the design of the purchased
equipment. Based on the commercial success of the centrifuge reported by Mukutuma et al.,
(2007) a centrifuge was also included in the main equipment schedule to provide for continuous
removal of crud and solvent recovery. The formation of a fourth phase for the process under study
was assumed not to occur. Incorporating the use of a centrifuge and clay treatment, it was
assumed that at least 97% of the solvent would be recovered and returned to the main solvent
extraction circuit.
The aqueous phase recovered from the centrifuge was directed to further clay treatment discussed
in section 4.3.2, which was redirected to the leach circuit without organic. It was also assumed that
the solids exiting the centrifuge were discharged to the solid waste tailings for specialised disposal.
Stellenbosch University https://scholar.sun.ac.za

82
4.2.4.3. Electrowinning
Power usage
Over-potential describes the energy required to drive the cationic reduction reaction forward.
Diffusion limiting current (DLC) density describes a limiting current beyond which any further
increase in the operating current will not enhance the rate of copper deposition. Other factors come
into play such as the copper ion concentration at the cathode surface, viscosity of the system,
concentration of competing species, and the influence of operating temperatures. An expression
for determining the DLC density has been derived that relates the copper ion concentration,
Faraday constant and the moles of the target ion to the current:
DLC = iL = n.F.kd [Cu2+]bulk (4.2)
This value is also validated through empirical study. The DLC density is useful for making plots of
voltamograms for optimising the design and operation of the electrowinning cell (Beukes &
Badenhorst, 2009). Large copper electrowinning plants have DLC densities ranging between 193
and 285A/m2. For 22 plants studied the maximum recorded DLC density was reported to be
321A/m2 (Beukes & Badenhorst, 2009).
Typical industrial practice recommends maintaining the current density in excess of 250A/m2 to
achieve LME Grade A copper cathodes (Ritcey & Ashbrook, 1979; Beukes & Badenhorst, 2009). In
the initial development of the process flow sheet, a current density of 300A/m2 was specified which
was assumed to be above the DLC density for the process under study (de Waal, 2018).
Anodes
Lead based alloys are used extensively in copper electrowinning operations. The use of lead
based alloys is however associated with the passivation of the anode and migration of lead into the
electrolyte solution (Mirza et al., 2016). The corrosion of lead anodes during copper electrowinning
is discussed in literature in which weakly adherent and adherent forms of PbO are formed (Mirza et
al., 2016). This results in final product contamination (Prengaman & Siegmund, 1999; Mirza et al.,
2016). Periodic cleaning of the anodes in use provides for the removal of weakly adherent β-PbO.
For this study, a lead-calcium-tin alloy was specified for use as the anodes (de Waal, 2018).
Typical methods for managing lead anode passivation and contamination entail the addition of
cobalt and the practice of periodic current reversal. The addition of cobalt is discussed in section
4.2.4.4. Periodic current reversal is often practiced to manage passivation and is done for short
periods of time. The practice is well suited to continuous processes (Beukes & Badenhorst, 2009).
Stellenbosch University https://scholar.sun.ac.za

83
Prengaman & Siegmund (1999) in an alternative vein discussed the transient effects of power
losses in copper electrowinning circuits and the subsequent reversal of the anodic and cathodic
reactions. The researchers noted that an insulating layer of lead II sulphate (PbSO4) would be
formed that has a passivating effect on the anodes.
In this study it was assumed that periodic current reversal was practiced and was factored into the
calculated energy consumption and associated costs. It was also assumed that the practice of
periodic current reversal would not allow sufficient time for the generation of deleterious amounts
of PbSO4.
Prengaman & Siegmund (1999) highlighted four major effects of oxygen generation at the anode
during copper electrowinning. In addition to the corrosion of lead with the formation of oxides of
lead and lead sulphate as intermediates, the researchers noted that the generation of localised
oxidising conditions is detrimental to the life of organic froth and acid mist suppressants. The
oxidising conditions were found to contribute towards the formation of organic radicals. For the
current density specified in this study however, it was assumed that the generation of such organic
radicals was in negligible quantities that would not compromise the normal useful service life of the
anodes.
The typical life span of anodes ranges between 7 and 10 years (soleconsulting, 2013). The use of
anode spacers is reported to increase the service life of the anodes by a 20% margin (Manjengwa,
2018b). The cost of cathode spacers was factored into the cost of the electrowinning cells.
Cathodes
More than two different electrowinning technologies are in use globally. They include a
combination of well established processes and technologies tailored to the operating plant’s
requirements (soleconsulting, 2013). Examples of the technologies include Aisco/Falconbridge,
Mesco, WENMEC, T.M. Engineers, Outokumpo, Mesco and Xstrata (Armstrong, 1999; Anderson
et al., 2009; soleconsulting, 2013). The technology specified for this study was the ISA process.
Key features of the ISA process are summarized in Table 4.6.
Table 4.6: Main features of the ISA Process (Anderson et al., 2009; soleconsulting, 2013)
ISA PROCESS
Copper plated 304 stainless steel hanger bar
U” shaped rectilinear cathode washing and stripping machine design
3.25 mm thick 316L stainless steel cathode plate.
The cathode sheets are separate from each plate.
Typical anode dimensions (Depth, width and thickness) 1.171m x 0.95m x 6.4mm
Stellenbosch University https://scholar.sun.ac.za

84
The wax-less ISA PROCESS was specified for the process, which is better known as the ISA
PROCESS 2000, in which stainless steel starter sheets are used in a number of commercial
copper electrowinning operations (Beukes & Badenhorst, 2009).
For the process under study stainless steel starter sheets (SS316/304) were specified for the
cathodes (Anderson et al., 2009; Beukes & Badenhorst, 2009; de Waal, 2018).
Configuration of electrode pairs
The configuration of the anode and cathode pairs affects the current balances hence the overall
process efficiencies (Mirza et al., 2016). Bent sheets associated with beaten copper tend to
promote short circuiting (Ritcey & Ashbrook, 1979). Deformities and misalignment associated with
hanger bar corrosion also contribute to the distortion of the anode and cathode spacing. This leads
to the formation of dendrites, short circuiting and uneven deposition of copper on the cathode
surfaces, spalling of PbO2 and reduced service life of the anodes (Mirza et al., 2016).
For the process under study it was assumed that no short circuits were experienced due to
physical deformities associated with the cathode starter sheets. It was also assumed that the inter-
electrode spacing was maintained at 10cm as practiced in typical commercial copper
electrowinning operations (Mirza et al., 2016).
The copper electrowinning and harvesting considerations specified for the study are summarized in
Table 4.7 as follows:
Stellenbosch University https://scholar.sun.ac.za
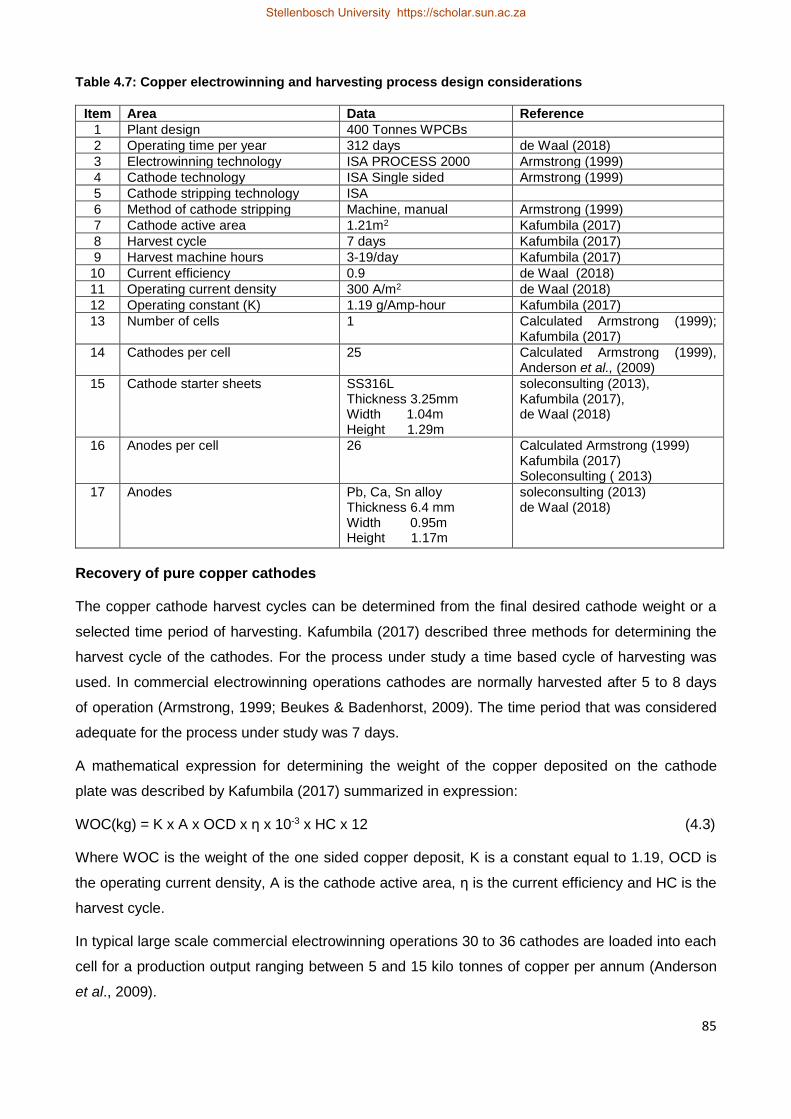
85
Table 4.7: Copper electrowinning and harvesting process design considerations
Item Area Data Reference
1 Plant design 400 Tonnes WPCBs
2 Operating time per year 312 days de Waal (2018)
3 Electrowinning technology ISA PROCESS 2000 Armstrong (1999)
4 Cathode technology ISA Single sided Armstrong (1999)
5 Cathode stripping technology ISA
6 Method of cathode stripping Machine, manual Armstrong (1999)
7 Cathode active area 1.21m2 Kafumbila (2017)
8 Harvest cycle 7 days Kafumbila (2017)
9 Harvest machine hours 3-19/day Kafumbila (2017)
10 Current efficiency 0.9 de Waal (2018)
11 Operating current density 300 A/m2 de Waal (2018)
12 Operating constant (K) 1.19 g/Amp-hour Kafumbila (2017)
13 Number of cells 1 Calculated Armstrong (1999); Kafumbila (2017)
14 Cathodes per cell 25 Calculated Armstrong (1999), Anderson et al., (2009)
15 Cathode starter sheets SS316L Thickness 3.25mm Width 1.04m Height 1.29m
soleconsulting (2013), Kafumbila (2017), de Waal (2018)
16 Anodes per cell 26 Calculated Armstrong (1999) Kafumbila (2017) Soleconsulting ( 2013)
17 Anodes Pb, Ca, Sn alloy Thickness 6.4 mm Width 0.95m Height 1.17m
soleconsulting (2013) de Waal (2018)
Recovery of pure copper cathodes
The copper cathode harvest cycles can be determined from the final desired cathode weight or a
selected time period of harvesting. Kafumbila (2017) described three methods for determining the
harvest cycle of the cathodes. For the process under study a time based cycle of harvesting was
used. In commercial electrowinning operations cathodes are normally harvested after 5 to 8 days
of operation (Armstrong, 1999; Beukes & Badenhorst, 2009). The time period that was considered
adequate for the process under study was 7 days.
A mathematical expression for determining the weight of the copper deposited on the cathode
plate was described by Kafumbila (2017) summarized in expression:
WOC(kg) = K x A x OCD x η x 10-3 x HC x 12 (4.3)
Where WOC is the weight of the one sided copper deposit, K is a constant equal to 1.19, OCD is
the operating current density, A is the cathode active area, η is the current efficiency and HC is the
harvest cycle.
In typical large scale commercial electrowinning operations 30 to 36 cathodes are loaded into each
cell for a production output ranging between 5 and 15 kilo tonnes of copper per annum (Anderson
et al., 2009).
Stellenbosch University https://scholar.sun.ac.za

86
For this study the weight of a one sided copper deposit for each cathode was calculated to be 32.4
kg. The total weight of copper deposited onto the stainless steel cathode was therefore 64.8kg
which is a reasonable estimate that closely approximates typical industrial performance data
(Beukes & Badenhurst, 2009; Kafumbila, 2017). This translated to a total of approximately 25
cathodes. For the study and scale of operations one electrowinning cell was specified with the
dimensions summarized in Table 4.8.
Table 4.8: Dimensions for the electrowinning cell
Description Cell length conversion factor
Industrial reference data (soleconsulting, 2013) Toquepala, Southern Peru Limited, Peru
Dimensions for the current process
Dimensions of electrowinning cell
0.403 Width 1.47m Width 1.47m
Length 6.39m Length 2.58m
Depth 1.54m Depth 1.54m
It was assumed that LME Grade A copper was the final product recovered for sale as cathode
sheets. A manually operated cathode stripping machine was specified for use.
Cathode stripping
Cathode stripping can be achieved manually or automatically depending on the scale of
operations. The cathode stripping rate can be calculated from a knowledge of the working hours of
the machine, the harvest cycle and the number of cathodes per cell house as shown in equation
4.4 (Kafumbila, 2017).
Mc = n/(HC x WHS) (4.4)
Where n = cathodes per cell house
HC = Harvest cycle
WHS = Working hours of stripping machine
In this study a stripping rate based on a working time of 1.25 hours was assumed. This meant that
at least 3 cathodes were stripped and washed each day for the entire electrowinning cycle during
idle periods in the copper extraction circuit. Using this cathode stripping rate it was assumed that
two sets of cathode starter sheets were purchased as part of the working capital.
Additives
Four groups of additives defined by their purpose are normally added to copper electrowinning
circuits. They include the froth and acid mist suppressants, levelling and smoothing agents, coating
agents and grain refiners. Other additives specific to the production of copper cathodes include
accelerators, inhibitors and carriers.
Stellenbosch University https://scholar.sun.ac.za

87
Cathodes can be coated with anti-deposition agents at the bottom of the cathode or can be left
bare. Coating the base of the cathode reduces contamination due to slime at the base of the tank.
For the process under study no coating of the cathodes was included in the initial design (de Waal,
2018). The mass balances suggested the unlikelihood of sludge formation that would form to such
an extent that would contaminate the cathode product.
Porous, nodular and dendritic deposits are not desirable. Additives are also used to improve the
final quality of the cathode and enhance electro-deposition at the same time. The porous cathodes
can entrain impurities. Additives typically added in commercial copper electrowinning operations
include levelling agents like glue, oligosaccharides for example, DXG-F7 and guar gum (Ritcey &
Ashbrook, 1979). The addition of DXG-F7 was factored in the economic study of the process
study.
DXG-F7 has a lower preparation time with a reported solubility in water favouring comparatively
high dissolution rates in lower water volumes (Cifuentes et al., 2015). Standard industrial
operations normally specify a dosage rate of 150g/tonne to 400g/tonne (Beukes & Badenhorst,
2009; Robinson et al., 2013). For the study the lower dosage rate of 150g per tonne was used.
The third group of additives serve as grain refiners and they include thiourea and chloride ions. For
the process under study, sodium chloride was added. Industrial practice recommends maintaining
the chloride content between 10ppm and 15ppm (Beukes & Badenhorst, 2009). Mirza et al., (2016)
reported a higher chloride average ranging between 20ppm and 30ppm.
It has been noted that chloride concentrations greater than 30ppm are detrimental to the service
life of the anodes. A high chloride concentration (100ppm >) not only results in aggressive media
that is deleterious to the operation of the anodes, the elevated chloride levels also result in friable
copper sheets during the stripping of the copper cathodes and corrosive operating conditions that
promotes the attack of the stainless steel cathodes. The corrosion of the stainless steel cathodes
leads to a build up in chromium, iron and nickel in the electrolyte that leads to process temperature
rise, reduced current efficiency and generation of chlorine gas at the anode (Beukes & Badenhorst,
2009). A concentration of 10ppm of chloride was maintained for the process under study.
Cobalt has been found to be beneficial in copper electrowinning circuits due to the role it plays in
passivating the anode thereby minimizing lead contamination. This is reported to be well
pronounced in acidic media due to the low reduction potential cobalt has (-0.28V) when compared
to hydrogen (0.00V) (Mulaudzi & Kotze, 2013). Hydrogen in low pH media competes with the
cobalt due to its larger bulk concentration. A concentration ranging between 100ppm and 150ppm
suffices for copper electrowinning circuits (Al Shakarji, 2012; Sole & Tinkler, 2016). Operating
above an upper limit of 200ppm, leads to a reduction in the cost/benefit ratio (Mirza et al., 2016).
Typically if the feed source contains cobalt there is no need to add cobalt into the process.
Stellenbosch University https://scholar.sun.ac.za

88
The WPCB analysis used in the study indicated the absence of cobalt (Shuey & Taylor, 2004).
Based on the mass balances specific to the process it was assumed that cobalt sulphate was
dosed into the process as a 24.25% m/m solution and factored into the operating costs of the
copper electrowinning circuit. The dosage rate is subject to the results of empirical studies of the
system. Within the scope of the development of the process under study no empirical work was
done to determine the specific usage ratio of cobalt. A lower dosage rate was however selected
since the feed did not contain manganese for the original process that was developed (Shuey &
Taylor, 2004; de Waal, 2018).
Sole and Tinkler (2016) have reported a cost contribution ranging between US$3.50 to US$4.00
per tonne copper produced. An average cost contribution of US$3.75 from cobalt usage was
specified for the process under study. This translated to a usage ratio of 0.493kg cobalt
sulphate/ton copper produced. Mirza et al., (2016) noted that cobalt sulphate is a substantial
contributor towards copper electrowinning costs.
In this study it was assumed that the co-deposition of cobalt with the copper was marginal. It was
also assumed that at start up all the cobalt remained in the spent electrolyte. During bleeding 20%
of the total cobalt dosed into the system reported to the leaching stage. No accumulation of cobalt
was reported for the process under study. It was further assumed that the cobalt derived from the
recycle of electrolyte bleed was washed out in the solvent extraction circuit during the loaded
solvent washing stage, since cobalt is co-extracted with copper (Sridhar et al., 2009).
Acid mists and the suppressants
Acid mists are generated during the electrowinning process and are aggravated by elevated
process temperatures (Ritcey & Ashbrook, 1979; Al Shakarji, 2012). As oxygen is liberated at the
anodes, the collapsing film of the bubbles that rise to the electrolyte surface rapture with the
entrainment of acid in the gas phase in the form of an aerosol. There are a number of methods in
use to manage acid mist and they include adapted engineering design configurations, physical and
chemical means.
The methods include the use of mist suppression foams, floating macromolecular macrospheres,
open tank house designs, positive flow ventilation and cell top hoods (Anderson et al., 2009; Al
Shakarji, 2012). The methods listed can be used in isolation or as combinations of two or more
alternatives.
Al Shakarji (2012) examined the mechanisms of and factors influencing acid mist formation. The
research findings showed that the use of FC-1100 reduced the formation of acid mist. The
performance of FC-1100 was complemented by the use of macrospheres reducing acid mist
generation by a 29% margin.
Stellenbosch University https://scholar.sun.ac.za

89
The generation of the acid aerosol is a function of the site elevation, current density, barometric
pressure, ambient temperature, anode condition, electrolyte temperature and the composition of
the electrolyte. For the process under study it was assumed that acid mists were managed by use
of an acid mist suppressant, 3M acid mist suppressant FC-1100. The action of the acid mist
suppressant was complemented by using 20 mm polypropylene macrospheres.
The loading rate of the polypropylene spheres was determined using the available surface area of
the electrowinning cells as summarized in Table 4.9.
Table 4.9: Data for determining loading rate of polypropylene macrospheres
Item Description Data Reference for calculations
1 Cross sectional area occupied by anodes 0.16m2 soleconsulting (2013) Kafumbila (2017)
2 Cross sectional area occupied by anodes and cathodes
0.09m2 soleconsulting (2013) Kafumbila (2017)
3 Cross sectional area occupied by the electrodes
0.24m2 soleconsulting (2013) Kafumbila (2017)
4 Diameter of polypropylene macrosphere 20mm Selected, Kafumbila (2017)
5 Maximum area a polypropylene macrosphere can occupy
0.0004m2
6 Number of polypropylene macrospheres required
8875 units Calculated
7 Polypropylene macrospheres/kg bag 2000 Vendor data
8 Bags of spheres required 4.43 Calculated
Based on the performance data sheet of FC-1100 it was assumed that there would be no
interference with the extraction kinetics of LIX984N and stripping of loaded organic, if dosed at
these points (Robinson et al., 2013; 3M, 2016). Further, the additives would not interfere with the
deposition rate of copper and the final cathode quality. Performance test results have been shown
to display satisfactory performance at concentrations lower than 30ppm (Al Shakarji, 2012; 3M,
2016). In this study it was also assumed that FC-1100 would be dosed into PLS holding tank prior
to pumping the pregnant leach solution to the electrowinning tank house, at a rate of 20ppm (3M,
2016). It was assumed that no foam would be generated during the electrowinning process.
4.2.4.4. Process contaminants
Iron
Iron that reports to the electrowinning circuit occurs as a result of aqueous ingress, slippage during
the washing stage or co-extraction and must not exceed a concentration range of between 1 g/L
and 3g/L in the electrowinning circuit. Sole &Tinkler (2016) have reported an average of 3.4g/L of
iron in some African copper electrowinning circuits. Studies and experience have shown that for
every gram increase of iron, a 2 to 3 percent loss in current efficiency is reported (Beukes &
Badenhorst, 2009). For the process under study the concentrations of co-extracted iron
determined, were deemed sufficiently low enough (0.005g/L) not to affect electrowinning of copper
even if a wash stage were to be excluded in the solvent extraction circuit.
Stellenbosch University https://scholar.sun.ac.za

90
Manganese
The ability of manganese to assume several stable oxidation states contributes to an increase in
the solution potential, resulting in a reduced current efficiency in the electrowinning operation. It
reduces solution potential during copper electrowinning (Miller, 1995). Sole et al., (2007) noted that
commercial operations in African and Australian copper extraction circuits have high manganese
concentrations in the liquors. The practice in some operations has been to dose the liquor with Fe2+
to maintain the manganese in a reduced state (Mn2+). This is illustrated in the reactions 4.5 and 4.6
shown below:
Mn7+ + 5Fe2+ 5Fe3+ + Mn2+ (4.5)
Mn4+ + 2Fe2+ 2Fe3+ + Mn2+ (4.6)
While some operations in South America maintain the Fe:Mn ratio at 10:1, research indicates that
other operations run their processes at lower ratios without experiencing challenges (Sole et al.,
2007).
Manganese is not chemically extracted during the solvent extraction stage but will report
downstream of the solvent extraction circuit in the absence of a wash stage to the electrowinning
circuit as a result of aqueous entrainment (Sole et al., 2007). Manganese promotes the generation
of chlorine gas. The presence of manganese is also associated with a reduction in the conductivity
of the solution. It has been shown that as MnO2 is produced in the system an accelerated
degradation of the anodes is observed in the form of PbO (Hakakari, 1995; Miller, 1995; Sole et al.,
2007; Zhang, 2007b). As a result PbO2-MnO2 is formed that spalls into the bulk electrolyte solution
leading to contamination of the copper cathode (Prengaman & Siegmund, 1999).
Recycling of electrowinning bleed solutions and aqueous entrainment into the organic phase
during stripping introduces manganese into the organic phase. The presence of manganese in the
organic phase exhibits deleterious properties through solvent degradation. The increased solution
potential due to manganese is responsible for the observed degradation rates.
The degradation products formed are known to stabilize emulsions thereby increasing the
likelihood of aqueous entrainment due to increased phase disengagement times (Miller, 1995).
This entrained aqueous phase increases the load of contaminant metals reporting to the
electrowinning circuit. The degradation products formed further contribute towards crud formation
discussed in section 4.2.4.2.
The tolerable operating range of manganese lies between 10ppm and 500ppm. At concentrations
in excess of 500ppm, the degradation of the anodes ensues. Manganese is also a constituent in
some WPCBs as noted in the work of researchers in the field (Oishi et al., 2007; Silvana et al.,
2013; Behnamfard et al., 2013).
Stellenbosch University https://scholar.sun.ac.za

91
For the process under study, no manganese was however detected for the characteristic sample of
WPCBs used for the mass balances in the developed process (Shuey & Taylor, 2004; de Waal,
2018).
Antimony and bismuth
Antimony and bismuth were not factored into the development of the original process flow sheets
(de Waal, 2018). Results of the original empirical work did not detect the presence of antimony
(Rossouw, 2015). These metals are also constituents of some WPCBs (Sum, 1991; Hagelüken,
2006; Oishi et al., 2007; Hao et al., 2008; Behnamfard et al., 2013). As a result of aqueous
entrainment the metals eventually report to the copper electrowinning circuit ultimately reducing the
quality of the final product.
Organics
The carryover of organic into the electrowinning circuit is associated with solution corrosion that
has been postulated to be a result of the action of free radicals on the exposed anode in direct
contact with the electrolyte organic mixture. Mirza et al., (2016) discussed the mechanism of attack
by the free radicals. The carryover of organic cannot be ruled out entirely from the process
operations of typical copper electrowinning operations. Beukes & Badenhorst (2009) have
recommended a split operating configuration to handle the main production stream and the organic
laden stream. For the purposes of the current study it was however assumed that organic
entrainment was negligible as described in section 4.2.4.2 (under extractant losses).
Stellenbosch University https://scholar.sun.ac.za

92
Overview
From the discussion the effects of some of the constituent metals associated with the acid leaching
of WPCBs to extract copper have been summarized below in Table 4.10.
Table 4.10: Summary of the effects of different contaminants and other metals in the copper
extraction process (Hakakari, 1995; Miller, 1995; Sole et al., 2007; Zhang, 2007b; Mirza et al., 2016;
Sole &Tinkler, 2016).
Metal Specification Remarks
Lead (Pb) Reduces final copper cathode quality.
Manganese (Mn) General < 40ppm
10ppm-500ppm
(process specific)
Accelerates degradation of solvent, promoting aqueous entrainment and eventual contamination of electrolyte.
Promotes chlorine formation, corrosion of the anode and reduces current efficiency.
Cobalt (Co) 100ppm-200ppm Depolarizes the lead anodes resulting in a reduction in the corrosion rate and subsequent contamination of the electrolyte.
Iron (Fe) 1g/L-3 g/L Reduces final copper cathode quality.
Promotes process temperature rise, reduced current efficiency and generation of chlorine gas at the anode.
Nickel (Ni) Reduces final copper cathode quality.
Promotes process temperature rise, reduced current efficiency and generation of chlorine gas at the anode.
Chromium (Cr) Reduces final copper cathode quality.
Promotes process temperature rise, reduced current efficiency and generation of chlorine gas at the anode.
Antimony (Sb) Reduces final copper cathode quality.
Bismuth (Bi) 100ppm-200ppm Reduces final copper cathode quality.
Bleeding
Bleeding is practised to reduce the accumulation of additives and other species that have a
negative impact on the electrowinning process. Such effects manifest as low current efficiencies,
higher operating process temperatures, generation of higher volumes of corrosive vapours,
dissolution of the anodes, an increased potential for contamination of the copper cathode and a
higher frequency of rejects that must be recycled. The overall result is a higher power usage ratio
reflected by lower returns per productive operating cycle time.
The proportion of liquor to be bled off is defined by the characteristic profile of the barren leachate
exiting the electrowinning circuit. Major process changes arising from the variability of the feed, as
is characteristic of WPCB recycling, destabilises the system. To cater for the variations in feed
quality and the effects on the downstream processes, the mass balances across the process flow
sheets were undertaken assuming consistent feed grade (de Waal, 2018).
Stellenbosch University https://scholar.sun.ac.za

93
While this is a hypothetical and almost non-existent scenario, provision in further analyses of the
process for a reconditioning stage prior to entering the solvent extraction stage was assumed. This
would have to be considered in greater detail in further refining of the process flow sheets should
the preliminary economic studies prove to be viable. For the purpose and scope of this study
however, a consistent feed quality into the solvent extraction circuit and from the solvent extraction
circuit into the electrowinning circuit was assumed.
Four destinations exist for the bleed and these include leaching, pregnant leach solution, solvent
extraction wash and raffinate (Ritcey & Ashbrook, 1979). Since the bleed carries contaminants
(Mn, Pb, Fe and Ni) entering the potential destinations and residual copper, each of the
destinations will experience a compositional disturbance from the original stable operating
conditions. Through a consideration of the applicable kinetics and equilibrium driving forces at
each of the destinations, for the process under study, it was thus opted to recycle the bleed to the
leaching circuit (de Waal, 2018).
The movement of copper in the process was traced. In the initial development of the copper
process flow sheet, it was assumed that 20% of the spent electrolyte was bled after every
electrowinning cycle (de Waal, 2018). For the study it was assumed that a scavenging
electrowinning section was included to polish effluent liquor from this section. The barren
electrolyte from the scavenging section was bled and the remaining 80% was returned to the
process in the stripping section. The detailed handling of the copper recovery is handled in section
7.3.2). A volume equivalent to the bleed from the spent electrolyte was directed to effluent
treatment. Mass balances of fresh feed were adjusted to prevent accumulation in the circuit.
4.2.5. Gold extraction
4.2.5.1. Process chemistry
An analysis of the in the solids existing the copper extract plant revealed that the base metals
content reporting to the gold extraction circuit was high. The treatment of feed material entering the
gold extraction circuit or leach solutions reporting to the downstream processes in the gold
extraction circuit was therefore considered in this study. The treatment can be achieved prior to
cyanide leaching or after cyanide leaching. Two processes were considered for these options. The
SART process and the concentrated nitric acid wash.
In the earlier development of the process flow sheets, incorporation of both treatment options was
not included (de Waal, 2018). Further revision of the gold circuit incorporated a consideration of
either pre cyanide treatment or post cyanide treatment.
Stellenbosch University https://scholar.sun.ac.za

94
A discussion of the process chemistry associated with cyanide leaching, the SART and nitric acid
wash processes is outlined in the next section as a background to the analysis and selection of the
most appropriate option that was undertaken. The metals considered in this section include all the
metals specified in the analysis of WPCBs by Shuey & Taylor (2004). The analysis was used for
the development of the process flow sheets and working out the respective mass and energy
balances.
Localised galvanic effects contribute to the dissolution and existence of different ionic species in
the reacting media. To accurately predict the predominant reacting species in alkaline or acidic
systems pourbaix diagrams would have to be specified for handling complex polymetallic feed
systems as characterised by WPCBs. For the preliminary studies, use was made of previous
research investigations and published pourbaix diagrams (Bergstrom, 1924; Estay et al., 2010;
Karimi et al., 2010; Uhlig, 2011; Rossouw, 2015; Webelements, 2018; docbrown, 2018) to predict
the expected reacting species and states of the metals for both the cyanide leaching, the SART
process and the nitric acid wash. Results from the mass balances were incorporated in evaluating
the effectiveness of both treatment options and also in determining material recoveries in the
updated gold process flow sheets.
4.2.5.2. Cyanide leaching
Typical residence times range between 20 to 40 hours (Stange, 2009). For the process under
study it was assumed that a total of 24 hours was committed to the cyanide leaching process using
6 agitated leach tanks (de Waal, 2018).
Cyanide is capable of forming many complexes with a number of transition metals. In this section a
number of reactions will be discussed that typically occur in gold cyanide leaching systems. The
precipitation of the complexes within the process is governed by the pH, ionic strength, oxygen and
cyanide concentrations.
Temperature
Higher temperatures are associated with lower oxygen partial pressures. In such a case the use of
pressurized leaching systems with oxygen enrichment becomes necessary (Marsden & House,
1992). While studies have supported the operation at high temperatures, reflected by higher gold
dissolution rates, operating the process, at temperatures in excess of 85OC results in a depletion of
dissolved oxygen. Industrial practice recommends a dissolved oxygen concentration greater than
6ppm. Elevated oxygen partial pressures however promote the rate of zinc dissolution in a manner
that consumes cyanide and depresses gold dissolution.
Since WPCBs contain gold concentrations exceeding that of native ores (Hagelüken, 2006),
oxygen enrichment at 25OC was applied in the process under study (de Waal, 2018).
Stellenbosch University https://scholar.sun.ac.za

95
Precious metals
While PGMs were not detailed in the process flow sheets originally developed, mention of the fate
of PGMs has to be considered. In a more practical scenario dependent on more varied WPCB
sources, the existence of PGMs especially platinum and palladium are expected (Iji & Yokoyama,
1997; Zhang & Forrsberg, 1997; Hagelüken, 2006; Ogunniyi & Vermaak, 2007; 2009;).
During cyanidation it is expected that recovery rates of palladium will exceed platinum recovery
rates (van Wyk, 2014) so that the residual solid fraction would be directed for further treatment or
sale to refiners specialising in platinum recovery. Palladium would report in greater concentrations
with gold.
In studies conducted investigating the recovery of gold and PGMs from low grade Platreef ores, it
was shown that at the reaction conditions specified, a two stage cyanide leach process would
suffice to enhance platinum recovery. It was proposed that the PGMs would be isolated prior to
pumping the gold rich solution to the electrowinning circuit (Mpinga, 2012; Schoeman, 2012;
Snyders et al., 2013; van Wyk, 2014).
The dissolution of gold, palladium and platinum has been described using Elsner’s equation
(Adams, 2016):
4 Au + CN- +O2 + 2H2O 4Au(CN)2- + 4OH- (4.7)
2Pt + 8CN- + O2 + 2H2O 2Pt(CN)42- + 4OH- (4.8)
2Pd + 8CN- + O2 + 2H2O 2Pd(CN)42- + 4OH- (4.9)
The leaching of palladium and platinum according to reactions 4.8 and 4.9 are noted to be slow at
ambient operating conditions.
Tin
Tin was assumed to exist in two forms in this study; as the amphoteric SnO and in its native state.
Prior to treatment of the feed material to remove base metals, it was assumed that the finely
divided tin was oxidised due to the localised heated generated during shredding and comminution
of the WPCBs (Li et al., 2010). Amphoteric SnO was assumed to have been produced.
Following the nitric acid wash under the specified reaction conditions, any of the tin nitrate that was
formed was rapidly hydrolysed to metastannic acid. In highly acidic conditions tin exhibits
behaviour similar to silisic acid (Manjengwa, 2011), forming a stable colloid gel insoluble in acid or
water and is difficult to filter. To improve the filtration characteristics on a more practical note the
pH of the stream exiting the acid wash tank should be raised to just above 7.
Stellenbosch University https://scholar.sun.ac.za

96
Empirical verification will be required in further refinement of the process flow sheets in separate
studies. For the study it was assumed that the slurry formed did not experience severe pressure
drops due to premature blinding of the filter cloths. For the purposes of the study it was also
assumed that tin was carried over as metastannic acid to the cyanide leaching stage.
At increasing pH values Sn(OH)4 was formed that dissolved in excess alkali to yield Sn(OH)62- and
reacted with cyanide and calcium ions. Sodium metastannate and calcium metastannate were the
two dominant products formed in the alkaline media. For the study in the presence of calcium ions
calcium stannate was assumed to have been precipitated continuously until the metastannate was
exhausted. Calcium stannate is insoluble in water at the temperature conditions specified. The
solid product was filtered out prior to the process stream reporting to the adsorption train. As a
result, calcium hydroxide was added to compensate for this precipitation reaction in the material
balances. The precipitation of the tin was assumed to follow the reactions 4.10 and 4.11 described
below:
H2SnO3 + 2OH-(aq) + H2O Sn(OH)62-(aq) (4.10)
Sn(OH)62-(aq)+ Ca2+(aq)- CaSnO3(s) + 3H2O (4.11)
As the conditions become very acidic the stannic acid is reformed. For the study it was assumed
that all the tin was eliminated during the filtration of the gold leach slurry.
Lead
Lead (II) ions in cyanide react with gold to yield AuPb2, AuPb3 and metallic lead. Metallic lead on
the gold surface has been reported to have a depolarizing effect on the reduction of oxygen
(Adams, 2016). Makanza (2006) showed that at a pH close to 7, lead exists as PbOH+ species
wherein 20% of the lead used in the investigations existed as Pb2+ ions. It is reported that Pb2+
does not react directly with cyanide. The predominant species at pH values greater than 10 for
gold cyanidation include, Pb(OH)3- , Pb(OH)2
- , PbOH+.
In the presence of Pb2+, the reactions associated with the dissolution of gold were reported in
literature (Adams, 2016) as follows:
2Pb(OH)2 + 5Au(s) + 8CN-(aq) AuPb2(aq) + 4Au(CN)2- + 4OH- (4.12)
AuPb2 + 2CN- + 4OH- Au(CN)2- + 2PbO + 2H2O + 5e (4.13)
2PbO + 5Au + 8CN- + 2H2O AuPb2 + 4Au(CN)2- + 4OH- (4.14)
Pb(OH)2 + 4Au + 4CN- Au2Pb + 2AuPb + 2Au(CN)2- + 2OH- (4.15)
3Pb(OH)2 + 7Au + 12CN- AuPb3 + 6Au(CN)2- + 6OH- (4.16)
Stellenbosch University https://scholar.sun.ac.za

97
Zinc
In oxygenated alkaline systems zinc forms a complex with cyanide as described by the Elsner
reaction and Zn(OH)2. At higher ratios of free zinc in solution gold dissolution can be retarded.
Research however reports that at decreasing free cyanide concentrations, the liberation of CN-
ligand for uptake in gold is favoured (Makanza, 2006; Adams, 2016). Several competing reactions
exist due to the formation of hydroxyl ions. Zinc undergoes the following reactions in the system:
2Zn + 8CN- + O2 + 2H2O 2Zn(CN)42- + 4OH- (4.17)
2Zn + 8CN- + 2H2O 2Zn(CN)42- + 2(OH)- + H2(g) (4.18)
2Au(CN)2- + Zn + 3OH- 2Au + HZnO2
- + 4CN- + H2O (4.19)
Zn + 2OH- Zn(OH)2 (4.20)
Silver
An analysis of the initial raw material feed concentration showed that the concentration ratio of
silver to gold was 1.63:1, which is economically significant. Research has shown that under normal
alkaline cyanide gold leaching conditions, the silver dissolution rates are inferior to gold. In the
previous studies it was assumed that the complete dissolution of silver occurred under the reaction
conditions specified (de Waal, 2018).
Copper
Copper dissolves in alkaline cyanide solutions though the rate is superseded by that of both gold
and silver. Solubility has been shown to increase with increasing temperature. Based on the Eh-pH
diagram for Cu-CN-H2O system the species expected to dominate at pH values greater than 10 is
Cu(CN)32-. Other cyanide species of copper, Cu(CN)2
- and Cu(CN)43-, have also been reported to
exist in the normal gold extraction conditions. This is influenced by the concentration of free
cyanide species in the system. The species exhibit similar stability constants under these
conditions (Marsden & House, 1992). At high cyanide concentrations Cu(CN)43-, predominates.
This species is not adsorbed as well as Cu(CN)32-.
Iron
After the nitration of the residue to remove base metals Fe2+ is rapidly oxidised to Fe3+ in the
presence of oxygen, with a resultant mixture of Fe2+ and Fe3+ cyanide complexes that are stable
(Marsden & House, 1992). In the presence of OH- it is expected that Fe(CN)63-, Fe(CN)6
4- and
Fe(OH)3 will predominate. Fe(OH)3 must be avoided since this reduces the leaching efficiency due
to the precipitation of Fe(OH)3 onto the surface of the gold particles. In the presence of cations
double salts can be formed (Marsden & House, 1992). Some of the salts expected to be formed
during cyanidation are summarized in Table 4.11 below.
Stellenbosch University https://scholar.sun.ac.za

98
Antimony and arsenic
These species do not form cyanide complexes in their native state. Arsenic was not detected in the
analysis used for the study (Shuey & Taylor, 2004; Rossouw, 2015). For the process under study
antimony was not factored in the development of the flow sheets (de Waal, 2018).
Mercury
Mercury forms complexes with cyanide ligands. It is a competitor with gold for the ligands and
exhibits the ability to displace CN- ligands from zinc.
Table 4.11: The possible species of cyanide complexes during the cyanidation of WPCB leach liquor
(Marsden & House, 1992)
Oxidation Nickel Copper Zinc Silver Iron Gold
CN is oxidised
NiCN- Cu(CN)2- ZnCN+ Ag(CN)(s) Fe(CN)6
4- Au(CN)2-
Ni(CN)42- Cu(CN)3
2- Zn(CN)2(aq) Ag(CN)2- Fe(CN)6
3- Au(CN)4-
NiH(CN)4- Cu(CN)4
3- Zn(CN)3- Ag(CN)3
2- Fe2(Fe(CN)6)(s)
NiH2(CN)4 CuCN(s) Zn(CN)42- Ag(CN)4
3- Fe(Fe(CN)6)(aq)
NiH3(CN)4 Cu2(Fe(CN)6)(s) Zn(CN)53- Ag(OH)CN- Fe4(Fe(CN)6)3(s)
Ni(CN)64- Cu3(Fe(CN)6)2(s) Zn2(Fe(CN)6)(s) Ag4(Fe(CN)6)(s)
Ni2(Fe(CN)6)(s)
Adams (2016) noted that the most important complexes formed during gold cyanidation include:
Au(CN)2-, Cu(CN)3
2-, Pd(CN)42-, Pt(CN)4
2-, Ag(CN)2-, Zn(CN)4
2-, Fe(CN)64-, Ni(CN)4
2-, Co(CN)63- and
Hg(CN)42-. Mercury cobalt, platinum and palladium were not considered in the previous studies (de
Waal, 2018). Based on the analysis by Shuey & Taylor (2004) platinum was not present.
Table 4.12 provides a summary of the expected reactions and observations that were incorporated
in the study for the constituent metals associated with the WPCB raw material feed that reported
from the copper extraction circuit.
Stellenbosch University https://scholar.sun.ac.za

99
Table 4.12: Expected reactions during cyanide leaching (Bergstrom, 1924; Makanza, 2006; Estay et
al., 2010; Karimi et al., 2010; Uhlig, 2011; Rossouw, 2015; Webelements, 2018; docbrown, 2018)
Cyanide leaching
Metal Expected reactions and remarks
Al Aluminium is rapidly oxidised in air to form Al2O3.
This reaction was expected during the shredding and comminution of the WPCBs.
This points to the existence of Al2O3 and aluminium metal (protected by the oxide layer) in the feed.
The reactive form of Al2O3 was assumed to react with the base during cyanide leaching to form aluminate.
It was assumed that metallic aluminium was in negligible quantities; as a result the displacement of other transition metals was considered insignificant.
It was assumed that there were no cyanide complexes of aluminium since the complex is rapidly hydrolysed to yield a soluble complex of Al(OH)6
3- in strongly alkali media.
Zn Zinc metal also undergoes cyanidation.
Fe Formation of ferrous cyanide complexes (Fe(CN)64-) was assumed for the study though at inferior
rates to zinc.
Pb In the finely divided state it was assumed that lead would react to form plumbates and intermediate species.
Sn It was assumed that the finely divided tin was oxidised due to the heated generated during the shredding and comminution to generate the amphoteric SnO.
At increasing pH values Sn(OH)4 was formed that reacted with cyanide and calcium ions prior to the nitric acid wash.
Calcium stannate was precipitated.
Au It was assumed that the predominant complex of gold formed was Au(CN)2-.
Ag Silver was assumed to form cyanide complexes.
The most predominant species being Ag(CN)2- (Makanza, 2006).
Ni It was assumed that nickel underwent cyanidation though the rate would be inferior to zinc.
The predominant complex formed was expected to be Ni(CN)42-.
Cu Copper cyanide complexes formed are readily adsorbed onto carbon (Mpinga, 2012)).
A consideration of the existing species was made through a study of the E-pH diagram for the Cu-H2O-CN system at 25OC (Dai et al., 2012).
The most predominant species assumed to be adsorbed for this study were Cu(CN)23-and
Cu(CN)2-.
Cyanide usage
Maintaining a pH above 10 suppresses the hydrolysis of the free cyanide and the dissociation of
the complexes formed with base metals. The formation of cyanate is a non essential reaction that
is promoted in conditions of high oxygen partial pressures. The result of these competing reactions
necessitates dosing the system with NaCN concentrations that maintain the desired gold
dissolution rates. The concentrations are adjusted accordingly as contaminant concentrations and
subsequent gold dissolution rates drop or increase. This is verified empirically during pilot studies.
Cyanide degradation rates have been reported to range between 0.1g/L and 0.3g/L as NaCN.
Stellenbosch University https://scholar.sun.ac.za

100
The in-process decomposition of cyanide, as a result of the catalytic effect of carbon proceeds
according to equation 4.21:
CN-(aq) + O2 + 4H2O CO32-(aq)+ 2NH4
+ .(4.21)
In the presence of Ca2+, CaCO3 (aq) is generated. The CaCO3 (aq) formed tends to precipitate
within the pores of the activated carbon. This contributes to a reduction in the activity of the
activated carbon and hence gold adsorption efficiency (Marsden & House, 1992).
The concentration of competing metal species in the process under study was assumed to be
fixed. Cyanide degeneration was assumed to proceed at a rate of 0.1g/L. A NaCN concentration of
250 ppm (25% excess of the stoichiometric amount) was specified for the process (de Waal,
2018). The excess was considered suitable to compensate for cyanide degeneration on the carbon
surfaces, unwanted side reactions associated with the non beneficial consumption of cyanide and
the competitive consumption of cyanide as a result of contaminant base metal species. A
significant cost driver in cyanide leaching processes is the cyanide usage rate (Marsden & House,
1992). An analysis of the fluctuating rates to minimize the changing concentrations of contaminants
was also undertaken.
4.2.5.3. Base metals management
Nitric acid wash - Pre cyanide treatment of feed
The objective of this process was to eliminate all base metals that were carried over from the
previous processes (size reduction, solder leaching and copper extraction circuits). An analysis of
the base metal content in the feed streams revealed that the constituent ratios of the metals under
study were high when compared to standard industrial practice. The subsequent accumulation of
chloride in the system following hydrochloric acid washing resulted in its rejection as a potential
stripping agent. The benefits of washing feed with nitric acid have also been demonstrated by
Karimi et al., (2010). The researchers reported an increased gold and silver recovery during
cyanide leaching of ores rich in base metals coupled with a reduction in cyanide consumption by
8.5% and 8.4% for the experimental runs. The nitric acid wash circuit was therefore developed. It
was added to the original gold process flow sheet and is outlined in the Figure 4.5 below:
Stellenbosch University https://scholar.sun.ac.za

101
Figure 4.5: The proposed process flow sheet of the nitric acid wash circuit
Stellenbosch University https://scholar.sun.ac.za
Stellenbosch University https://scholar.sun.ac.za

102
Table 4.13 provides a summary of the expected reactions and outputs of the nitric acid wash.
Table 4.13: Expected reactions during the nitric acid wash (Kleinschmidt, 1918; Bergstrom, 1924;
Driver, 1988; Makanza, 2006; Estay et al., 2010; Karimi et al., 2010; Uhlig, 2011; Rossouw, 2015;
Webelements, 2018; docbrown, 2018)
Nitric acid wash (55%)
Metal Expected reactions and remarks
Al Aluminium was rapidly oxidised in air to form Al2O3.
This reaction was expected during the shredding and comminution of the WPCBs.
This points to the existence of Al2O3 and aluminium metal (protected by the oxide layer) in the feed. For the study it was assumed that the reactive species of Al2O3 was formed.
The Al2O3 was assumed to react with the nitric acid to ultimately form Al3+ ions.
Zn Zinc metal was attacked by nitric acid to form stannic acids (Uhlig, 2011).
Fe The iron was attacked by the nitric acid.
Formation of Fe3+ was promoted by an oxidising environment.
Pb Lead in the finely divided state will react to form lead nitrate.
It was assumed in this study that no lead oxide existed.
Formation of a passive layer of PbO was expected at temperatures in excess of 600OC.
The presence of lead accelerated the attack of aluminium and zinc (Uhlig, 2011).
Sn It was also assumed that some of the tin formed SnO during the comminution stage due to the heat generated during the size reduction of the WPCBs.
The reaction system was highly exothermic and for the conditions specified it was assumed that tin would react to form stannic acids.
Initially a precipitate of metastannic nitrate was formed that underwent rapid hydrolysis to form metastannic acid.
It was also assumed that the gel precipitate was carried over to the cyanide leaching stage.
The stable colloid of metastannic acid was destabilized in the alkaline cyanide leach.
Under strongly alkaline conditions it was assumed that calcium stannate was precipitated.
Any residual tin was eliminated at the HCl acid pre-soak and wash stage prior to elution of the carbon.
Au Gold was assumed to remain inert under the reaction conditions.
Ag It was assumed that silver nitrate was formed.
Ni It was assumed for the study that nickel reacted with the nitric acid to yield nickel nitrate (Ni(NO3)2)
Cu Copper was assumed to react with nitric acid to form copper nitrate (Cu(NO3)2) with the liberation of nitrogen dioxide.
Stellenbosch University https://scholar.sun.ac.za

103
The SART process – Post treatment of the leach solution
This process was originally developed to achieve a reduction in the concentration of copper
reporting to the adsorption and electrowinning circuits from gold heap leach liquors. It also provides
a means for achieving the recovery of cyanide as a result of the destruction of weak acid
dissociable (WAD) dissociable cyanide complexes from base metals like copper, nickel, zinc, silver
and mercury (Estay et al., 2010).
Pregnant leach solution is acidified to a pH of between four and five. This is done using sulphuric
acid. The pH drop results in the generation of hydrogen cyanide that is captured in the scrubbing
stage downstream. Sodium hydrogen sulphide is added as a source of HS-that is necessary for the
formation of sulphides that precipitate in acidic media (Karbanee et al., 2008).
Rapid settling rates are achieved through the use of a flocculant. A portion of the solids under-flow
is recycled in order to accelerate the precipitation process through seeding. The remaining filtered
sulphides are dewatered and neutralised using sodium hydroxide prior to exporting to the smelting
process to recover the copper.
The leach liquor from the thickening stage is neutralized with hydrated lime to a pH of 11. Most of
the hydrogen cyanide (HCN) which was retained in the solution phase reacts with the lime to form
calcium cyanide (Ca(CN)2). Due to the presence of sulphate, gypsum dihydrate and gypsum
hemihydrate are formed. The conditions of operation and moisture content do not support the
formation of the finer anhydrous crystals. The solution is filtered and gypsum with a maximum
moisture content of 10% is recovered for storage or sale. The filtrate and settler overflow is then
redirected into the main process with a reduced base metal content. Hydrogen sulphide (H2S) and
HCN generated in the process is captured and scrubbed using sodium hydroxide (NaOH) and
water (Ford et al., 2008; Estay et al., 2010). The outline of the process is depicted in Figure 4.6.
Stellenbosch University https://scholar.sun.ac.za

104
Figure 4.6: The SART process (Redrawn (Estay et al., 2010)
Stellenbosch University https://scholar.sun.ac.za
Stellenbosch University https://scholar.sun.ac.za

105
An attempt to apply the SART process to the current gold recovery under study was done. The
assessment of likely by-products aligned with the characteristic profile of the feed material was
done and the findings were summarized in Tables 4.14 and 4.15. The analysis revealed that
adoption of the SART process within the gold flow sheet would realise a reduction in the lead,
copper, tin, iron and silver content reporting to the adsorption section. Aluminium, nickel and zinc
would however be carried over.
Table 4.14: Expected reactions during the SART process (Bergstrom, 1924; Makanza, 2006;
Manjengwa, 2009b; Estay et al., 2010; Karimi et al., 2010; Uhlig, 2011; van Wyk, 2014; Webelements,
2018; docbrown, 2018)
SART process
Metal Expected reactions and remarks
Al It was assumed that the reactive form of Al2O3 formed was attacked by sulphuric acid to form aluminium sulphate.
The existence of aluminium sulphate aids in settling of the precipitate formed after acidification an sulphidzation since it is a coagulant.
However the agglomerated particles are dispersed and settling is poor in the acidic pH range 4-5 (Manjengwa, 2009b).
The formation of Al2S3 was considered non-existent since the sulphide is rapidly hydrolysed in the presence of water.
Zn Zinc ions interact with HS-. Zinc sulphide dissolves in acid to yield zinc oxide.
In excess base Zn(OH)42- was produced and carried over to the adsorption section.
Fe FeS formed reacts with sulphuric acid to yield FeO and SO2.
Expected to precipitate during the neutralisation stage to form Fe(OH)3.
Iron will be recovered as a solid precipitate along with gypsum.
Pb Lead will react with NaSH to form PbS precipitate.
Sn The metallic tin was assumed to react with NaSH to yield SnS2 which precipitates in acidic media Uhlig (2011).
Au The gold complex was assumed not to dissociate under the process conditions.
Ag The silver was assumed to be recovered as AgS along with the sulphides that are insoluble in the acidic media.
Ni Ni2+ ions from the sulphate salt forms sulphides which are sparingly soluble in acidic medium. Nickel was assumed be recovered as NiS and Ni(H2O)4(OH)2.
Cu Copper was assumed to be recovered as the CuS precipitate.
Stellenbosch University https://scholar.sun.ac.za

106
Table 4.15: The expected behaviour and destinations of the by-products of the SART process for the
system (Bergstrom, 1924; Estay et al., 2010; Karimi et al., 2010; Uhlig, 2011; Rossouw, 2015)
Metal Solubility of sulphide in acid
Solubility of sulphide in base
Remarks
Pb No - PbS precipitate formed and removed with CuS.
Cu No - CuS formed and settling is accelerated using flocculent.
Sn No - SnS2 is formed and reports to settler with PbS and CuS.
Fe - - FeS formed reacts with sulphuric acid to yield FeO and SO2.
Expected to precipitate during the neutralisation stage to form Fe(OH)3.
Iron will be recovered as a solid precipitate along with gypsum.
Ni - No Ni2+ ions from the sulphate salt forms sulphides which are sparingly soluble in acidic medium.
Nickel will be recovered as NiS and Ni(H2O)4(OH)2.
Zn - No Zinc sulphide dissolves in acid to yield zinc oxide.
In excess base Zn(OH)42- is produced and carried over to the
adsorption section.
Ag No No The sulphide will decompose in very strong acids.
The silver will be recovered as AgS along with the sulphides precipitated during treatment with H2S.
Al - - Stable sulphide will not be recovered.
Undergoes rapid hydrolysis to yield hydrated oxides and hydroxides. In basic media it will exist as aluminate.
Aluminium will be carried over to the adsorption circuit as Al(OH)6
3-.
Comparison of the two options
An analysis of the key attributes of the nitric acid wash and the SART process was undertaken. A
prediction of the expected concentrations of the metals reporting to the adsorption section was
done. The findings of the analyses are summarized in Table 4.16 and appendix C (Tables C4 and
C5).
Stellenbosch University https://scholar.sun.ac.za

107
Table 4.16: A comparative analysis of the two options for managing base metals in gold feed from
the copper extraction circuit.
Metrics Pre-treatment: Nitric acid wash
Post –treatment: SART
Reagents consumption
55% Nitric acid Water
Hydrated lime NaOH NaSH H2SO4
Flocculent
By products Regenerated nitric acid (≈10%) Hot soft water for elution circuit Nitrous oxides, chiefly NO2
Gypsum Sulphide precipitates (Ag, Cu, Pb, Sn) Recovery of cyanide Hydrogen sulphide Ferric hydroxide
Efficiency >98%. Gold composition with respect to other metals in feed is quadrupled prior to leaching. Residual copper for the process under study reporting to the adsorption circuit was 0.017ppm. Refer to Appendix D for the detailed analysis.
65-95% (Ford et al., 2008; Estay et, al., 2010) Residual copper for the process under study reporting to the adsorption circuit was 82.14ppm. Refer to Appendix D for the detailed analysis.
Objective features
Removal of competing metals prior to cyanide leaching and adsorption. Enriching the solid feed prior to cyanide leaching.
Removal of copper and other competing metals prior to adsorption and elution. Recovery of copper and other base metals as insoluble sulphides for smelting. Recovery of cyanide
Drawbacks The need to contain the oxides of nitrogen. Feed rate into the reactor must be monitored carefully. The process is highly exothermic. As the wash cycles increase the acid bled and returned into the wash progressively weakens, increasing acid to effluent treatment. There is need to capture NO2 exiting the solder leach circuit. High entry gas temperatures do not favour high NO2 adsorption rates.
HCN generated must be well contained. Generation of H2S. The need for additional capital investment in flocculation and dewatering equipment. The potential calcium loading to the adsorption circuit is elevated. The process does not always guarantee 100% removal of base metals (Estay et al., 2010). Extensive bench studies required prior to using it in the process. Increased likelihood of CaCO3 crystallizing within the activated carbon. There is a reduction in active sites and pathways within the activated carbon are blocked. A risk of gypsum carryover exists that can be deposited in the macro pores (Estay et al., 2010). Risk of increased carbon losses as CaCO3 during thermal regeneration. Carbon losses are noted to be 6% higher for calcium concentrations increased from 0.10% to 0.5% on the activated carbon. (Marsden & House, 1992) There is an introduction of organics from subsequent flocculation and settling operations that foul the carbon.
Stellenbosch University https://scholar.sun.ac.za

108
Using published process data (Ford et al., 2008) for the SART process, a prediction (applicable to
the process under study) of the expected copper recovery was calculated to be at least 66% as
copper sulphide.
Based on the comparison of residual copper reporting to the adsorption circuit it was established
that the nitric acid wash displayed superior performance results. Further studies are however
required to examine the efficiencies of the SART process in the removal of other base metals in
the polishing of WPCB leach solutions.
Having considered the merits and drawbacks associated with both options the nitric acid wash
circuit was selected as the most suitable measure to reduce the contaminant metal concentrations
prior to the PLS reporting to the adsorption train. Outlined in Figure 4.7 is the schematic
representation of the proposed gold extraction process flow sheet used in this study.
Stellenbosch University https://scholar.sun.ac.za
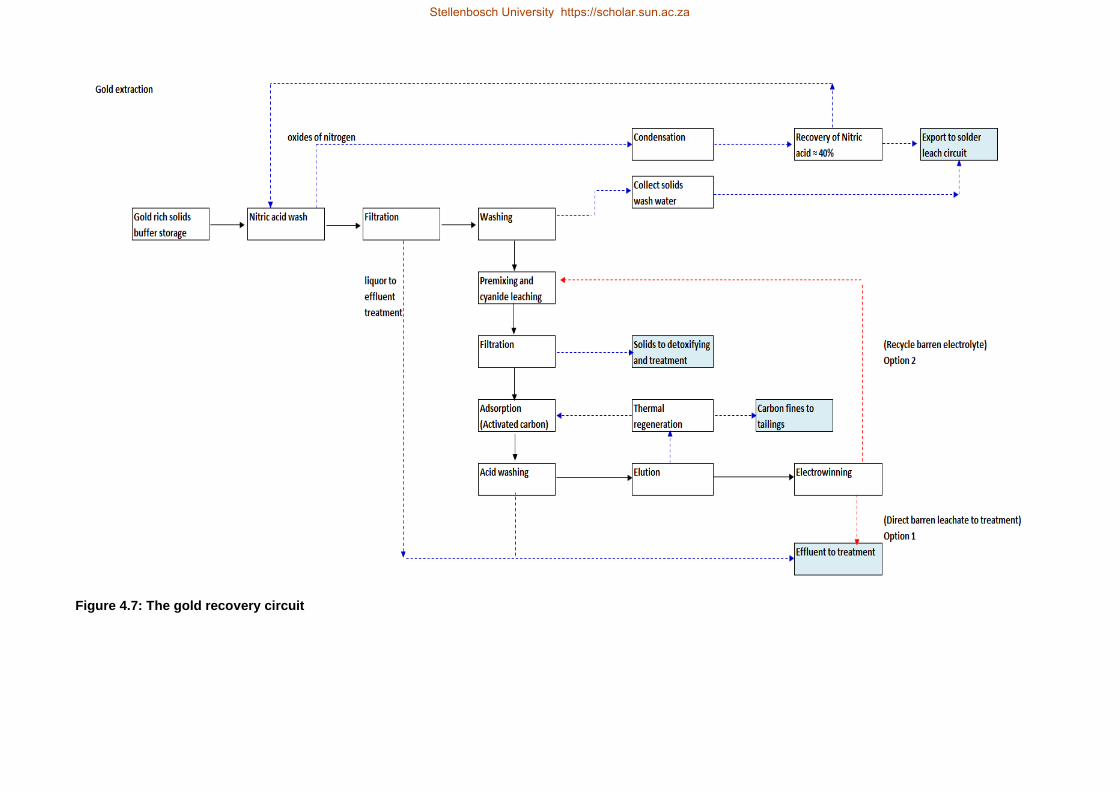
Figure 4.7: The gold recovery circuit
Stellenbosch University https://scholar.sun.ac.za
Stellenbosch University https://scholar.sun.ac.za

110
4.2.5.4. Carbon adsorption
For the process developed, the rate and loading of carbon was supported by typical industrial
performance data (de Waal, 2018). High carbon loadings result in gold and carbon inventories with
the added risk of higher losses of gold due to the higher carbon losses resulting from the effects of
attrition. With the incorporation of the nitric acid wash circuit, it was established that the gold head
grade to the adsorption circuit with relative to the concentration of other metals was at least
doubled. Three options were considered to adapt the process to this change.
The first was option entailed using a lower solids to liquids ratio during the cyanidation step. The
second option involved diluting the filtered leach liquor with softened process water to match the
original design parameters. This implied a doubling of the volumes handled. The third alternative
was to increase the carbon concentration to match the increased gold head grade. A consideration
of the operating time frames within the process circuit indicated that a bottle neck existed during
the leaching stage. A total residence time of 24 hours was allocated (de Waal, 2018). The
adsorption, acid wash and elution stages have a combined operating cycle time of up to 12 hours
(Stange, 2009; Rogans, 2012). The second option was selected (refer to appendix C, Tables C.1
and C.2). The liquor buffer storage tank was therefore doubled in size.
A consideration of the losses of gold to tailings indicated that higher losses would be associated
with increased carbon concentration coupled with losses in the barren leach solution (Marsden &
House, 1992; Snyders et al., 2017). For the study granular activated carbon (coconut shell) at a
concentration of 15g/L was specified (de Waal, 2018). It was also assumed that gold to tailings in
the barren solution ranged between 0.001ppm and 0.02ppm consistent with standard industrial
practice (Stange, 1999).
In typical industrial practice, carbon is replaced after 400 cycles of use if contaminant metal
loadings are high (Marsden & House, 1992). Debottlenecking of the entire scope operations (refer
to section 5.3.1, Table 5.3) under study revealed that the carbon in the gold section would undergo
approximately 27 cycles of use each month, which was estimated to equate to 283 cycles per year.
Since the nitric acid wash was included on the original gold process flow sheet it was assumed that
contaminant loading would be comparatively lower than typical industrial process leach liquors
derived from ores. Based on the calculated cycles of carbon usage it was assumed that carbon
replacement would be done after a period of service ranging between 1.5 years and 2 years.
4.2.5.5. Acid washing
Washing of the loaded carbon with hydrochloric acid prior to elution was incorporated in the
process. A total residence time of 140 minutes for the acid wash cycle was assumed based on
industry practice.
Stellenbosch University https://scholar.sun.ac.za

111
Hydrochloric acid and nitric acid are the two acids typically used for this process (Marsden &
House, 1992; Stange, 2009; Rogans, 2012). The use of nitric acid is typically associated with the
oxidation of the carbon surfaces. This results in a reduction of the active surface area for
adsorption. Nitric acid is however beneficial in the removal of mercury.
AARL acid wash stages were adopted in the specified process under study (de Waal, 2018).
Briggs (1983) described the detailed operating conditions and time profiles for a typical AARL acid
wash cycle process during the commissioning of the CIP plant at Beisa mine. A similar approach
was adopted in the operation of the proposed process in the current study. It was assumed that the
cycle consisted of an acid wash cycle that was followed by an acid soak cycle and ended with the
acid rinse cycle which has been summarized in Table 4.17.
Table 4.17: AARL acid wash cycle (Briggs, 1983; Steyn, 2010; Rogans, 2012; de Waal, 2018)
Stage Column loading
Acid wash Acid soak Acid rinse Column drainage
Residence/operation time
15 minutes 20 minutes 40 minutes 90 minutes 15 minutes
Reagents Loaded carbon from adsorption
3% HCl circulated, 90OC
3% acid solution remains stagnant in the column. 90OC
4 bed volumes of water soft water are used to rinse the carbon. 90OC
Washed carbon
The conditions outlined in Table 4.17 combine typical operating conditions described in literature
(Briggs, 1983; Steyn, 2010; Rogans, 2012; de Waal, 2018). A hydrochloric acid concentration of
3% was specified for the process under study, similar to that used in industry. During the acid wash
stage other complexes are formed as a result of the presence of the chloride ions. Nickel forms a
precipitate within the pores of the carbon. To ensure the effective removal of these base metals
and the associated cyano-chloride complexes the washing is achieved at temperatures in excess
of 30OC (Rogans, 2012). It was assumed that gold, silver and copper cyanide complexes were not
removed. All the residual copper reported to the gold electrowinning circuit (Marsden & House,
1992; Rogans, 2012; Steyn, 2010). A process temperature of 90 OC under a maximum pressure of
101KPa was specified for the process under study (de Waal, 2018). It was also assumed that the
design of the circuit provided for the containment of the liquid and gas phases.
The generated HCN would be extracted and appropriate measures were in place to contain any
generated HCN. For the process under study it was also assumed that moderate calcium loadings
were expected in a well mixed system and that 95% of the CaCO3 would be removed in this
process. Secondly precipitated Ni(CN)2 within the carbon pores was re-dissolved during the acid
soak and was washed out with the other base metals. Rogans (2012) noted that higher acid wash
temperatures promote the deposition of gold within the carbon and the formation of polymeric
aurocyanide.
Stellenbosch University https://scholar.sun.ac.za

112
It was assumed for this study that most of the gold formed in the hot acid wash would remain
trapped in the micropores of the carbon together with the polymeric aurocyanide. No gold was
assumed to have been lost during the acid wash cycle. Further it was assumed that this gold would
be re-dissolved during the elution stage.
The presence of iron in the reduced state facilitates the reduction of stannic compounds to
stannous chloride which is soluble (Driver, 1988). For the study it was assumed that all the tin
reacted with the hydrochloric acid to form stannic tetrachloride pentahydrate under the reaction
conditions. It was assumed that the conditions prevailing would not support the formation of a
stable colloid gel of metastannic acid. This chloride of tin is very soluble and it was assumed that
all the tin was washed to effluent prior to the stream reporting to the elution stage. The iron present
was assumed not to be in comparatively sufficient proportions to yield significant amounts of
stannous chloride. The iron complexes of chloride and cyanide ligands that were formed were
assumed to have been washed out to the effluent stream.
Removal of organics
Four major sources of organic foulants have been identified. They arise from the raw material or
activities within the process. These foulants can be either volatile or non volatile. The non volatile
contaminants are eliminated by the use of steam in temperatures exceeding 650OC (Rogans,
2012).
For the process specified it was assumed that the concentration of organic substances in the
system is negligible and was therefore not factored into the mass and energy balances and the
subsequent economic study. No flocculants were used for the process specified.
4.2.5.6. Elution
Elution refers to the stripping of the loaded carbon. By a reversal of operating conditions the gold is
desorbed from the loaded carbon (Stange, 2009). In previous studies (de Waal, 2018) the AARL
elution process conditions of operation were selected. It was noted that this process is the most
preferred in African and Australian gold processing operations. The major steps associated with
the AARL elution are summarized in Table 4.18. The associated residence times were also
included in the Table.
Stellenbosch University https://scholar.sun.ac.za
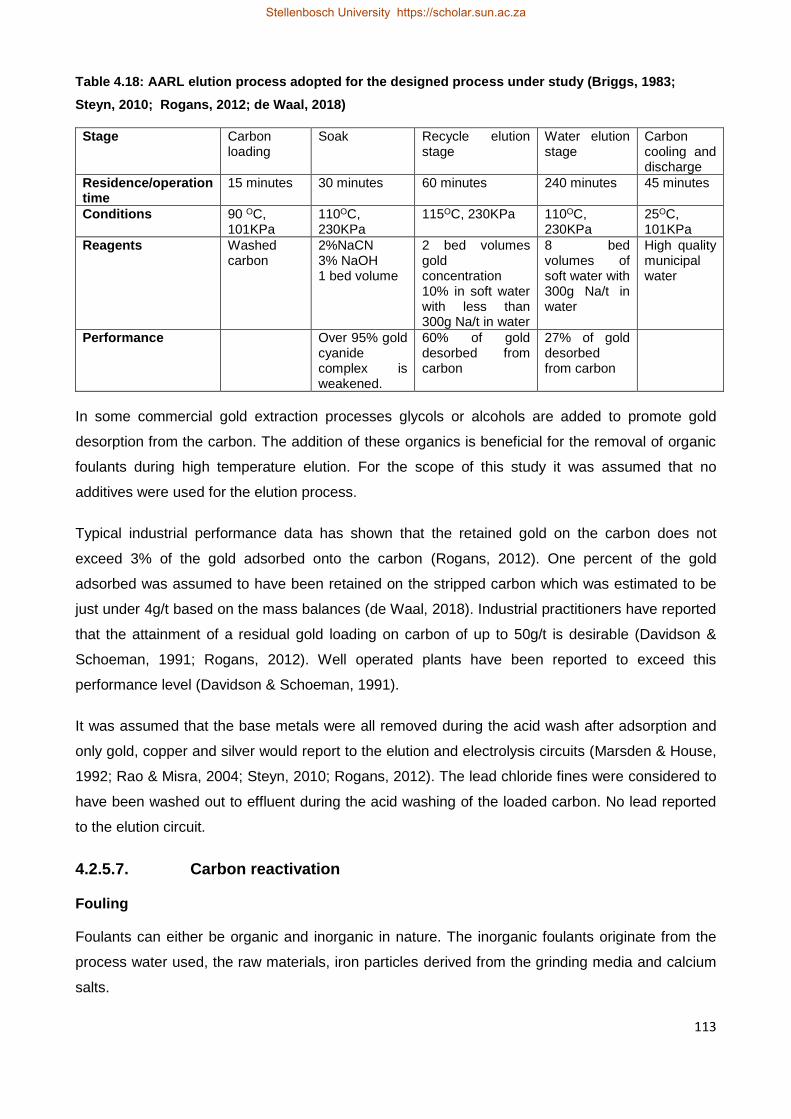
113
Table 4.18: AARL elution process adopted for the designed process under study (Briggs, 1983;
Steyn, 2010; Rogans, 2012; de Waal, 2018)
Stage Carbon loading
Soak Recycle elution stage
Water elution stage
Carbon cooling and discharge
Residence/operation time
15 minutes 30 minutes 60 minutes 240 minutes 45 minutes
Conditions 90 OC, 101KPa
110OC, 230KPa
115OC, 230KPa 110OC, 230KPa
25OC, 101KPa
Reagents Washed carbon
2%NaCN 3% NaOH 1 bed volume
2 bed volumes gold concentration 10% in soft water with less than 300g Na/t in water
8 bed volumes of soft water with 300g Na/t in water
High quality municipal water
Performance Over 95% gold cyanide complex is weakened.
60% of gold desorbed from carbon
27% of gold desorbed from carbon
In some commercial gold extraction processes glycols or alcohols are added to promote gold
desorption from the carbon. The addition of these organics is beneficial for the removal of organic
foulants during high temperature elution. For the scope of this study it was assumed that no
additives were used for the elution process.
Typical industrial performance data has shown that the retained gold on the carbon does not
exceed 3% of the gold adsorbed onto the carbon (Rogans, 2012). One percent of the gold
adsorbed was assumed to have been retained on the stripped carbon which was estimated to be
just under 4g/t based on the mass balances (de Waal, 2018). Industrial practitioners have reported
that the attainment of a residual gold loading on carbon of up to 50g/t is desirable (Davidson &
Schoeman, 1991; Rogans, 2012). Well operated plants have been reported to exceed this
performance level (Davidson & Schoeman, 1991).
It was assumed that the base metals were all removed during the acid wash after adsorption and
only gold, copper and silver would report to the elution and electrolysis circuits (Marsden & House,
1992; Rao & Misra, 2004; Steyn, 2010; Rogans, 2012). The lead chloride fines were considered to
have been washed out to effluent during the acid washing of the loaded carbon. No lead reported
to the elution circuit.
4.2.5.7. Carbon reactivation
Fouling
Foulants can either be organic and inorganic in nature. The inorganic foulants originate from the
process water used, the raw materials, iron particles derived from the grinding media and calcium
salts.
Stellenbosch University https://scholar.sun.ac.za

114
Organic contaminants originate from the flocculants that may be used in upstream processes and
leaks associated with lubricant oils used on moving parts of the process equipment upstream of
the adsorption circuit.
Inorganic contaminants adsorbed or deposited onto the carbon are removed during the acid
washing stage. The organic foulants however do not respond to the acid washing. They are
removed during the thermal reactivation stage of the stripped carbon.
Reactivation
Three options exist for the operating configurations associated with the reactivation of activated
carbon. These are outlined below in Table 4.19 with the attendant advantages and disadvantages
(Marsden & House, 1992).
Table 4.19: Operating configurations available for reactivating the stripped carbon (Marsden &
House, 1992)
Operating configuration
1 2 3
Profile Acid wash Desorption Thermal reactivation
Desorption Acid wash Thermal reactivation
Desorption Thermal reactivation Acid wash
Advantages Removal of inorganic foulants. Removal of calcium to minimise carbon loss as CaCO3 during thermal reactivation at 750OC. Reducing scaling and deposition in the circuit. A cleaner PLS reports to the electrowinning circuit.
Avoids corrosion effects in the desorption circuit. Removal of inorganic contaminants and excess calcium before thermal reactivation.
Avoids corrosion of elution column. Avoids corrosion of thermal reactivation equipment from the presence of residual Cl- ions.
Disadvantages Corrosive environment in the elution circuit Residual Cl- attacks thermal reactivation equipment downstream. Risk of chloride carryover to the electrowinning circuit.
Higher load of base metal complexes are carried over to the electrowinning circuit. This profile is unsuitable for feed sources with a high base metals concentration. Residual Cl- ions attack thermal reactivation equipment downstream.
Higher load of base metal complexes is carried over to the electrowinning circuit. This profile is unsuitable for feed sources with a high base metals concentration. Higher carbon losses as calcium carbonate CaCO3.
For the process under study the feed was noted to have a high concentration of copper as Cu2+.
WPCBs have higher base and precious metal concentrations as well as heavy metals than their
native ores (Hagelüken, 2006). The first operating configuration for carbon reactivation was
selected for the process under study. It was also assumed that the total residence time of the
carbon in the reactivation circuit would amount to 85 minutes. This time was distributed as follows
in Table 4.20:
Stellenbosch University https://scholar.sun.ac.za
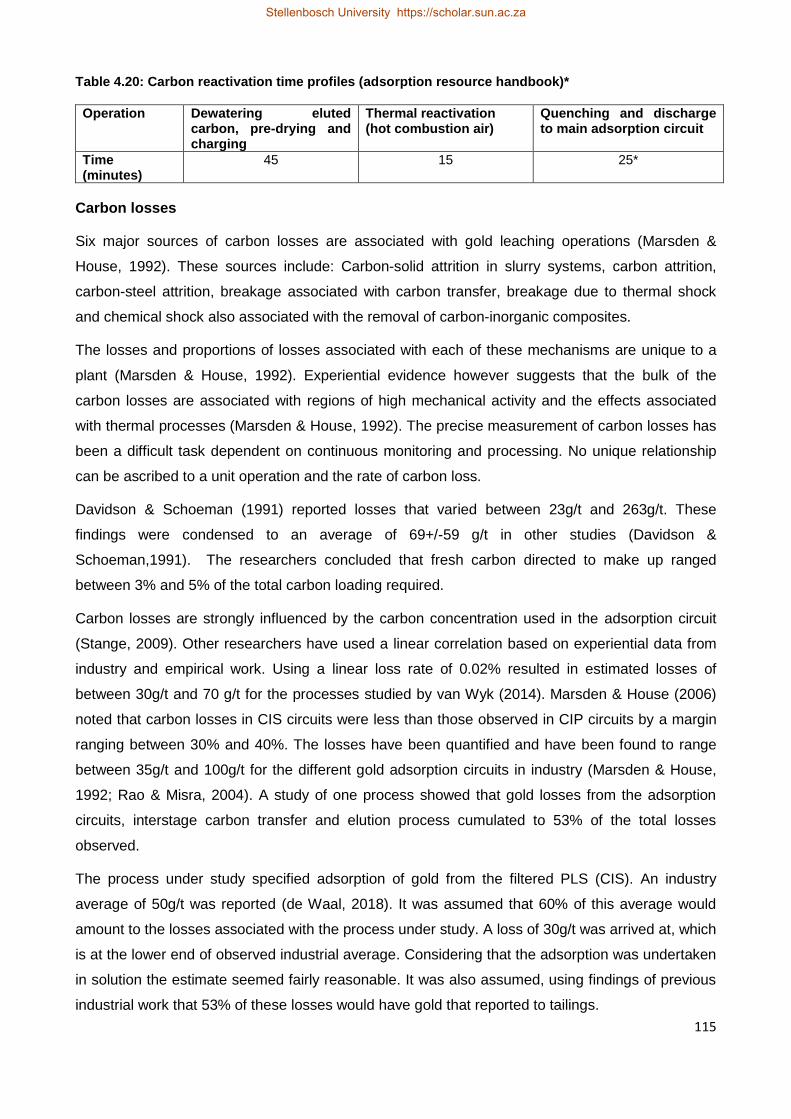
115
Table 4.20: Carbon reactivation time profiles (adsorption resource handbook)*
Operation Dewatering eluted carbon, pre-drying and charging
Thermal reactivation (hot combustion air)
Quenching and discharge to main adsorption circuit
Time (minutes)
45 15 25*
Carbon losses
Six major sources of carbon losses are associated with gold leaching operations (Marsden &
House, 1992). These sources include: Carbon-solid attrition in slurry systems, carbon attrition,
carbon-steel attrition, breakage associated with carbon transfer, breakage due to thermal shock
and chemical shock also associated with the removal of carbon-inorganic composites.
The losses and proportions of losses associated with each of these mechanisms are unique to a
plant (Marsden & House, 1992). Experiential evidence however suggests that the bulk of the
carbon losses are associated with regions of high mechanical activity and the effects associated
with thermal processes (Marsden & House, 1992). The precise measurement of carbon losses has
been a difficult task dependent on continuous monitoring and processing. No unique relationship
can be ascribed to a unit operation and the rate of carbon loss.
Davidson & Schoeman (1991) reported losses that varied between 23g/t and 263g/t. These
findings were condensed to an average of 69+/-59 g/t in other studies (Davidson &
Schoeman,1991). The researchers concluded that fresh carbon directed to make up ranged
between 3% and 5% of the total carbon loading required.
Carbon losses are strongly influenced by the carbon concentration used in the adsorption circuit
(Stange, 2009). Other researchers have used a linear correlation based on experiential data from
industry and empirical work. Using a linear loss rate of 0.02% resulted in estimated losses of
between 30g/t and 70 g/t for the processes studied by van Wyk (2014). Marsden & House (2006)
noted that carbon losses in CIS circuits were less than those observed in CIP circuits by a margin
ranging between 30% and 40%. The losses have been quantified and have been found to range
between 35g/t and 100g/t for the different gold adsorption circuits in industry (Marsden & House,
1992; Rao & Misra, 2004). A study of one process showed that gold losses from the adsorption
circuits, interstage carbon transfer and elution process cumulated to 53% of the total losses
observed.
The process under study specified adsorption of gold from the filtered PLS (CIS). An industry
average of 50g/t was reported (de Waal, 2018). It was assumed that 60% of this average would
amount to the losses associated with the process under study. A loss of 30g/t was arrived at, which
is at the lower end of observed industrial average. Considering that the adsorption was undertaken
in solution the estimate seemed fairly reasonable. It was also assumed, using findings of previous
industrial work that 53% of these losses would have gold that reported to tailings.
Stellenbosch University https://scholar.sun.ac.za

116
The remaining 47% were associated with carbon losses in the regeneration circuit. Previous
research has shown that as the fines move down the adsorption train, changes in the equilibrium
occur due to increasingly lower gold tenors (Schubert et al., 1993). The result is a preferential
desorption into solution though at rates inferior to those expected during elution. Due to co-current
movement of the fines it was assumed that pseudo-equilibrium loading would be less than that
observed for the bulk carbon moving up the carbon train. For the study it was therefore assumed
that the retained gold on the fines reporting to the barren solution would not exceed 2%. The
losses of gold at the carbon regeneration circuit were derived from the gold that remained on the
carbon after elution which was assumed to be 1% of the total gold adsorbed (Marsden & House,
1992; Rogans, 2012).
4.2.5.8. Electrowinning
Reactions proceeding
Four major reactions proceeding during the electrowinning of gold have been reported in literature
(Marsden & House, 1992; Steyn, 2004). The reactions are outlined as follows:
The cathode reactions:
Au(CN)2-(aq) + e- Au(s) + CN- (aq) (4.22)
2H2O (l) + 2e- H2(g) +2OH- (aq) (4.23)
O2(g) + 2H2O (l) + 4e- 4OH-(aq) (4.24)
The anodic reaction:
2 H2O(l) O2(g) + 4H+(aq) + 4e- (4.25)
At overpotentials close to or exceeding the limiting diffusion current density the generation of
hydrogen is noted to increase (Steyn & Sandenbergh, 2004). It has been noted that reactions 4.22
and 4.23 occur simultaneously.
For the purposes of the study it was assumed that hydrogen evolution did not occur in such a
manner as to be detrimental to the deposition of gold. The system was not operated in excess of
the limiting diffusion current density. It was assumed that oxygen was evolved at the anode
according to reaction described in equation 4.25.
Co-deposition
Co-deposition of silver, mercury and lead occurs during electrowinning of gold. If the silver has a
composition greater than 50% of the total metal composition in the pregnant leach solution (PLS)
and is greater than the gold concentration, it is preferentially deposited. The gold deposition rate
increases as the silver in solution is depleted. In the presence of copper, nickel, zinc and iron, co-
deposition will also occur (Marsden & House, 1992; Steyn & Sandenbergh, 2004).
Stellenbosch University https://scholar.sun.ac.za

117
The rate of deposition of base metals increases as time progresses due to lower concentrations of
the aurocyanide complex (Steyn & Sandenbergh, 2004). This reduction is followed by a cathodic
shift in the reduction potential of the gold half cell reaction (Steyn & Sandenberg, 2004), resulting in
the prioritization of base metals removal. Summarised in Table 4.21 are the permitted
concentrations of some metals in the gold electrowinning process.
Table 4.21: Specifications for base metals in the gold electrowinning process (Marsden & House,
1992; Steyn and Sandenbergh, 2004)
Metal Specification Remarks
Lead (Pb) <1ppm Co-deposits with the gold and reduces dore quality of the final product. In high concentrations the complex will be electrodeposited in preference to gold.
Copper (Cu) <100ppm Reduces current efficiency. Co-deposits with the gold and reduces dore quality of the final product. The gold to copper ratio must be maintained below 1:5.
Mercury (Hg) Produces effluent that is complex to handle. In high concentrations the complex will be electrodeposited in preference to gold.
Iron (Fe) Co-deposits with the gold and reduces dore quality of the final product. Refineries require Fe2+/Fe3+ concentrations to be less than 2%.
Nickel (Ni) Co-deposits with the gold and reduces dore quality of the final product.
Chromium (Cr) 5ppm Co-deposits with the gold and reduces dore quality of the final product. At 100ppm or more, gold deposition ceases.
Silver In high concentrations silver will be electrodeposited in preference to gold.
The nitric acid wash achieved the enrichment of the gold composition relative to that of the other
metals in WPCB solids. This led to an increased gold concentration in the PLS after cyanide
leaching and filtration of the liquor. The mass balances performed around the nitric acid wash
circuit showed that the ratio of gold to silver was not less than 8600:1 (Appendix F). The
concentration of the silver relative to other metals in the PLS, was less than 1%. The base metals
that reported into the cyanide leaching circuit were in the form of soluble nitrates derived from the
retained moisture after filtration of the wash feed.
The residual concentrations of these metals formed weak acid (WAD) cyanide complexes. It was
assumed that the base metals were all removed during the acid wash after adsorption and only
gold, copper and silver would report to the elution and electrolysis circuits (Marsden & House,
1992; Rao & Misra, 2004; Rogans, 2012; Steyn, 2010). Since no mercury was present in the
original analysis of the WPCBs this was not considered a problem in the process.
Research has shown that the gold to copper ratio of 1:40 favours the preferential deposition of
copper over gold (Steyn & Sandenbergh, 2004). Gold to copper ratios of at least 1:5 were shown to
produce highly adherent gold cathode deposits. This would result in significant gold lockup in the
electrowinning circuit (Steyn & Sandenbergh, 2004).
Stellenbosch University https://scholar.sun.ac.za

118
Spent electrolyte
The spent electrolyte liquor can be handled in three ways: disposal after detoxification, recycle to
leach or recycle to elution. An inspection of the mass balances around the electrowinning circuit
revealed that recycling of the spent electrolyte would reduce the fresh sodium cyanide usage in
leaching by 75%. The spent electrolyte could also be reused in leaching thereby reducing fresh
water feed by a margin of 100%. The sodium load would however be increased in manner
favouring the existence of NaAu(CN)2 species as opposed to Ca(Au(CN)2)2. The third option
provided for the recycling of the spent electrolyte to the elution section. The spent electrolyte
contained 2.61ppm of the gold complex (Refer to mass the balances in appendix A, Table A.4).
The spent electrolyte was polished in the scavenging cells prior to reuse in the process (see
section 7.3.2) for the detailed handling of the gold recovery streams). For the process under study
it was assumed that the spent electrolyte was recycled to the elution section. Streams of spent
electrolyte not recycled join the gold recovery circuit.
Product quality
The quality of the product obtained is also governed by the applied cathode over-potential. High
over-potentials are desirable in cases where impurity concentrations that co-deposit with gold are
high. The sludge produced can then be refined further. Low over-potentials produce gold from
solutions with lower contaminant concentrations. The product tends to have more compact gold
precipitates (Marsden & House, 1992; Steyn & Sandenbergh, 2004). For the process under study
the attainment of a less compact weakly adherent product was desirable. It was assumed that the
combined effect of the applied overpotential and high gold to copper ratio (8600:1) would yield a
loosely adherent product. Varying the over-potentials applied contributes to the varied recovery of
the gold in the form of solid gold cathode or sludge. It was also assumed that very large
overpotentials were avoided to suppress the generation of hydrogen and the generation of
hydroxyl ions at the cathode. The production of hydrogen at the cathode would retard the gold
deposition rates (Steyn & Sandenbergh, 2004).
Two major reactions were assumed to predominate for the system under study, namely: the
reduction of gold at the cathode and the oxidation of hydroxyl to oxygen at the anode (de Waal,
2018). Having considered the high gold to silver ratio that was in the electrolysis circuit, a lower
over-potential was specified for the process.
Based on the mass balances done in a separate study, during electrowinning an overall efficiency
of 99% was assumed for both gold and silver (de Waal, 2018). It was also assumed that the final
product generated from the electrowinning of the PLS was rich in gold with a copper, silver and
PGMs concentration of less than 2%. The bulk of the product was therefore assumed to be
recovered in the form of a rich gold cathode with a minimum purity of 98%.
Stellenbosch University https://scholar.sun.ac.za

119
While calculations the based on the mass balances indicate a product purity of 99.98%, 98% has
however been assumed for the economic study to factor in the presence of palladium and platinum
which are associated with diverse WPCB feedstocks for practical purposes.
Two major options were considered for handling the final product. The options are outlined in Table
4.22.
Table 4.22: Final handling of the gold cathode produced
Option and wash method 1 (Pyrometallurgical smelting) 2 (Electrorefining)
A (Acid wash) 1A = acid wash and smelt 2A = acid wash and electro-refine
B (Water wash) 1B = water wash and smelt 2B =water wash and electro-refine
For the process under study it was assumed that the major contaminants were silver, copper and
PCMs in concentrations not exceeding 2%. A water wash prior to smelting the gold cathode
(Option 1B) was selected. The product produced was assumed to be of a grade suitable enough to
be sold to Rand Refinery.
Solution face velocities
Typical solution face velocities are maintained in the range of 250L/m2 to 500L/m2 at the cathode
(Marsden & House, 1992). Industrial experience has recommended running the electrowinning of
gold cyanide solutions at pH values greater than 12.5 (Marsden & House, 1992). For the process
under study a pH of 13 was specified (de Waal, 2018). At this pH it is expected that the generation
of hydrogen is suppressed. Van Wyk (2014) developed process flow sheets for the recovery of
PGMs and gold from low grade ores.
A residence time of 5 hours was used for the simulation studies (van Wyk, 2014). It was reported
that high gold recoveries in a non cyanide electrolyte are achievable in electrowinning times in
excess of 4 hours (van Tonder & Sole, 2006). Briggs (1983) reported a residence time of 12 hours
for test work done at Beisa mine using a Mintek cell. It was noted that this electrowinning time
translated to approximately 4 passes to achieve a gold recovery in excess of 95%.
For the process under study it was assumed that a solution flow rate of 500L/m2 was used at the
cathode. In the previous studies a total of 6 cathodes per cell were specified (de Waal, 2018). A
single pass efficiency of 60% was assumed (de Waal, 2018). A residence time of 5 hours in the
electrowinning section was used for the purposes of this study. This residence time is equivalent to
two passes of the electrolyte solution. Using cathodes with an area of 0.31m2/cathode (Briggs,
1983) and a face velocity of 500L/m2 it was estimated that 6 cells would be used for the
electrowinning process.
Stellenbosch University https://scholar.sun.ac.za

120
4.3. Effluent, emissions and solid waste management
The mass balances and detailed process flow diagrams for effluent management were not
included within the scope of previous studies (Rossouw, 2015; de Waal, 2018). The process
however is associated with different unit operations generating varied effluent and solid waste
streams that could be handled as by-products for sale, reuse in the main process, toxic materials in
need of pre-treatment and special storage and objectionable materials in need of conditioning prior
to disposal in the main municipal discharge stream.
A consideration of the varied destinations of the output of effluent handling therefore necessitated
a brief discussion pertaining to the handling, characterisation and management of the different
effluent and solid waste streams associated with the operations under study.
4.3.1. Emissions management
Following an inspection of the preliminary mass balances, a comparison against recommended
emissions and occupational health and safety guidelines was undertaken. Using the results of the
comparative inspections, refinement of the original process was done by addition of the relevant
equipment to handle the emissions generated. This is reflected in the equipment flow sheets
included in appendix E. All the emissions predicted to be within safe operating levels with respect
to the recommended guidelines were vented, as reflected in the original process flow sheets
(de Waal, 2018). Summarized in Table 4.23 is the summary of the expected emissions generated
from the operations and the applied management method.
Stellenbosch University https://scholar.sun.ac.za

121
Table 4.23: Emissions management in the respective plants
Plant/ section
Emissions Key aspect Volumes/ mass generated
Source for calculations
Recommended guidelines (MSDS sheets for materials, USA OSHA, EU (2005))
Intervention
Size reduction (Crushing plant)
Fugitive dust Ceramic, plastic particulates with metals
43.71kg/hr He et al., (2015) de Waal (2018)
Permissible levels 350μg/m3 per hour.
Equipment specified included dust socks to capture the fines generated. It was assumed that the dust recovered from the socks was shaken into the main solids hopper. Within the building further polishing of the operating air space was achieved through the use of dust extractors. It was also assumed that the formation of stable aerosols was not applicable to the process under study.
Solder leaching
Noxious fumes NO 2.06kg/hr Rossouw (2015) de Waal (2018)
30mg/m3 Extraction fan included. Vented to atmosphere.
NO2 0.59kg/hr Rossouw (2015) de Waal (2018)
50μg/m3 over 24 hours
Extraction fan included. Vented to atmosphere.
H2 0.01kg/hr Rossouw (2015) de Waal (2018)
40 000ppm lower flammability limit
Extraction fan included. Vented to atmosphere.
Copper extraction
Gas from leaching and electrowinning, volatile fumes from solvent in the solvent extraction circuit.
H2 0.0001kg/hr Rossouw (2015) de Waal (2018)
40 000ppm lower flammability limit
Vented to atmosphere.
O2 ND Rossouw (2015) de Waal (2018)
NA Vented to atmosphere.
Acid vapours
< 1mg/m3 CS 1-3mg/m3 An additive was used to suppress acid mist formation. This was included in the economic evaluations.
Kerosene fumes
Up to 18667ppm at 293K
CS 7000 ppm – 50000ppm Occupational exposure limit 10ppm.
It was assumed that the installed facilities incorporated adequate ventilation to manage ambient concentrations. Excessive air currents in the operating area were avoided.
Stellenbosch University https://scholar.sun.ac.za
Stellenbosch University https://scholar.sun.ac.za

122
Table 4.23: Emissions management in the respective plants con’t
Plant/ section
Emissions Key aspect Volumes/ mass generated
Source for calculations
Recommended guidelines (SDS sheets for materials, USA OSHA, EU (2005))
Intervention
Gold extraction
Noxious fumes Hot process vapours WAD cyanide Hot acidic process gases
HCN At least 0.011kg/hr
Estay (2010) Adams (2016)
11mg/m3 A minimum generation rate was calculated based on the WAD cyanide expected to be formed. It was assumed that an extraction system with a scrubber would be factored into the detailed design. This was not shown on the original flow sheets (de Waal, 2018).
HCl NQ-Variable Marsden & House (1979) Rogans (2012)
7mg/m3 Extraction fan included. Vented to atmosphere after scrubbing.
CO NQ-Variable Marsden & House (1979) Rogans (2012)
55mg/m3
((PEL) TWA) Extraction fan included. Vented to atmosphere after scrubbing.
CO2 NQ-Variable Marsden & House (1979) Rogans (2012)
9150 mg/m3
(TWA): EH40 WEL Extraction fan included. Vented to atmosphere after scrubbing.
NH3 NQ-Variable Marsden & House (1979) Rogans (2012)
35 mg/m3
(TWA) Extraction fan included. Vented to atmosphere after scrubbing.
NO 0.009kg/hr CS 30mg/m3 Generated during the nitric acid wash. Included an extraction fan and a condenser. Gases not absorbed were vented to the atmosphere.
NO2 2.20kg/hr CS 50μg/m3 over 24 hours
Included a scrubbing system to recover the fumes as weak nitric acid (10%).
Hot acidic vapours
26.36kg/hr CS 2 ppm (TWA)
Generated during the nitric acid wash. Included an extraction fan and a condenser. The option for preheating the acid wash water and elution water was considered.
O2 0.008 kg/hr de Waal (2018) NA Vented to atmosphere.
H2 0.0005 kg/hr de Waal (2018) 40 000ppm lower flammability limit
Vented to atmosphere.
Stellenbosch University https://scholar.sun.ac.za
Stellenbosch University https://scholar.sun.ac.za
123
4.3.2. Effluent management
The effluent streams from the different sections of the plant and the respective business models
derive from the original process flow sheets, were analysed and summarized on an annual basis.
The distribution of the effluent flows for each business model is depicted in appendix F, Table F.26.
4.3.2.1. Municipal and general housekeeping
The effluent derived from this source is largely associated with typical municipal waste water and
general housekeeping activities. The housekeeping actives include the cleaning of offices,
changing rooms and canteens. Effluent from this source is usually disposed of in the regular
municipal effluent reticulation system. No material balances were incorporated for this effluent. In
the study however no Figures were captured for this effluent stream since the volumes vary in a
manner that was not captured in the material balances.
4.3.2.2. Size reduction
Any effluent from this section of the plant was assumed to be associated with discharges derived
from general plant housekeeping. It was expected that this effluent would be associated with clay
particles, lubrication oils, heavy metals, base and precious metals of varying and minute quantities
relative to the composition in the feed source. The source of the metals and non-metallic fractions
were assumed to arise from extremely fine particles capable of forming dust aerosols. It was also
assumed that the formation of stable dust aerosols was negligible.
The main objectionable features of this stream were the potential presence of lubrication oils and
heavy metal dust. The possible inclusion of an oil sump to capture the oils prior to exporting the
water to the main water treatment plant was assumed. In the study however no figures were
captured for this effluent stream since the volumes vary in a manner that was not captured in the
material balances.
4.3.2.3. Solder leaching process
Effluent streams generated from the solder leaching processes were characterized by low pH, high
TDS, high lead and iron concentrations. As a result of recycling the wash water from the gold
extraction plant, the nitrate, silver and base metals content increased in this stream. Potential
exists for recovering these metals and silver through precipitation as sulphides or concentration
using ion exchange. Neutralization of this effluent stream with calcium hydroxide would result in the
precipitation of hydroxides of the base metals. Following the thickening of the solids, the
supernatant could be recycled in the other areas of the factory for general plant use.
Stellenbosch University https://scholar.sun.ac.za

124
4.3.2.4. Copper extraction process
The effluent from this circuit was expected to be acidic with organics derived from the solvent
extraction circuit. It was assumed that at least 97% of the solvent would be recovered by use of a
centrifuge and clay treatment. The remaining 3% was assumed to be locked up in clay solids to be
disposed of in tailings the pond. Solvent losses that reported to the effluent stream would be
treated by carbon adsorption prior to joining the main effluent water discharge flow.
Literature reports that spent electrolyte is evaporated in commercial operations to crystallize nickel
and iron sulphide. Neutralization of the effluent, reduction of TDS and scavenging of copper, was
also considered a key objective in the treatment of the copper extraction effluent streams. The
main effluent streams associated with the copper extraction circuit were the spent electrolyte from
the electrolysis bank and an acidic aqueous phase.
The aqueous phase recovered from the centrifuge was assumed to carry the residual solvent
which was redirected into the main process. It was assumed that this stream was treated with
bentonite clay to adsorb and immobilise the solvent. Wang (2005) described in detail the
destabilizing effect bentonite clay has on the organic phase of crud. Industrial practice
recommends a clay concentration averaging between 2wt% and 5 wt% in the stream being treated
(Crane et al., 2009). A clay concentration of 2 wt% was specified for the process. It was assumed
that all the organic was immobilised and the polished stream was redirected to the leach circuit.
Potential exists for the installation of a unique electrowinning circuit to recover the copper in the
bleed using EMEW cell technology suitable for low copper feed concentrations of 0.1g/L (Roux et
al., 2007). The barren leach solution based on mass balances was calculated to have a copper
concentration greater than 30g/L. For the study EMEW cell technology was assumed to be
incorporated for the polishing of copper rich effluent streams.
4.3.2.5. Gold extraction process
Effluent streams from the gold extraction operations under study were derived from the in process
spillages and outflows of water to the plant drainage from general housekeeping activities. Spent
leach solutions, used acid wash solutions, filtrates, process blow downs were also assumed to be
the chief sources of effluent flows from the plant. It was expected that these flows were
characterized by high total dissolved solids (TDS), nitrate, calcium, sodium, chloride, cyanide,
hydroxyl, nickel, iron, copper, silver and lead. The pH of the streams was assumed to gravitate
between two extremes of high acidity and high alkalinity, arising from the hydrochloric acid wash
prior to elution and the electrolysis banks respectively. The data has been summarized in appendix
F, Table F.26.
Stellenbosch University https://scholar.sun.ac.za
125
The general nature of the effluent from the gold process also revealed that there would be need to
reduce the TDS levels, potentially recover the base metals, correct the pH and reduce or destroy
the cyanide present. The presence of cyanide was noted to be the most objectionable feature of
this effluent stream. It was therefore necessary reduce the cyanide levels in the effluent or else
consider options for returning barren leach solutions into the process circuit. The major flow of
cyanide was derived from 75% of the spent electrolyte that was stored for further leaching
campaigns. A consideration of the generation rates of spent electrolyte at steady state operations
revealed that the inventory would increase faster than its reuse.
A number of options exist for handling cyanide effluent from the process, described in depth by
Marsden & House (1992). The options include:
• Reuse of some of the barren solutions and tailings
• Acidify, volatilize and re-neutralize (AVR)
• The use of ion exchange resins to recover soluble metal complexes
• Electrolytic treatment
• Ion precipitation flotation
Detoxification
Dilution- fresh solvent can be added to the spent liquor prior to recycling it back into the process.
A portion of the bled effluent is redirected into the process. This quantity must not interfere with the
performance of the process. Marsden & House (1992) have also discussed options that include the
treatment of effluent for disposal, treatment of effluent for reuse in the process, treatment for reuse
and bleeding a portion followed by blending with fresh solvent.
Detoxification- this can be achieved by the formation of cyanite. Research indicates that 10% to
15% of the cyanite undergoes hydrolysis to form NH4+ and CO32-. Three methods exist for the
detoxification of cyanide laden streams and include cyanide removal, oxidation to less toxic
cyanate species and the complexation to less toxic cyanide complexes species of (Fe2+). A
detailed description of each option is available in literature (Marsden & House, 1992)
A likely option for the process under study would be recycling some of the effluent streams with
high TDS values to precipitate double salts and to pass the effluent through an activated carbon
bed to catalyse the oxidation to cyanite. Alternatively, the detoxification and potential evaporation
of the liquor can to be considered as an option to reduce the volumes being handled prior to
returning the spent electrolyte into the process.
The options presented for handling the effluent streams above can be explored in greater detail as
the process is refined in separate studies. For the study RenoCell technology was applied to
electrolytically recover the residual metal values in the tailings and effluent streams.
Stellenbosch University https://scholar.sun.ac.za

126
4.3.3. Solid waste management
Table 4.24 details the expected solid waste outflows originating directly from the process. A
summary of the key features and destinations of the solid material is outlined in the Table. The
volumes and characteristics of the solid waste outflows are summarized in appendix F, Table F.27
Table 4.24: Solid waste streams generated in each section
Section Solids outflows By product feed for next process
By product for potential exploitation
Waste for special treatment and disposal
Municipal and general house keeping
Canteen waste Office waste Dunnaging and packaging material from bulk handling of raw materials and chemicals used in the process.
N/A Yes- Plastic, styrofoam, steel, cardboard for recycling
Yes – some of the material will contain toxic or corrosive substances like caustic soda flakes, sodium cyanide, cobalt sulphate.
Size reduction
Crushed WPCBs Yes N/A No
Solder leaching
Desoldered WPCBs dewatered cake
Yes- raw material for copper extraction circuit
N/A No
Copper extraction
Dewatered WPCBs stripped of copper
Yes- raw material for gold extraction circuit
N/A No
Spent clay No No Yes – detoxify. The clay is impregnated with acidic solvent.
Gold extraction
Dewatered WPCBs stripped of gold (Palladium and platinum are also stripped though this was not included in the scope of previous and the current studies)
N/A – no provision for recovery of REE in this study
Yes- Contains plastic fractions that can be treated as feedstock for other recyclers. Ceramics can be used as feedstock for construction material. Feedstock for recovery of REE and other PGMs
Yes – At least 22kg of gold can be recovered each year from the solids. Washing of solids to recover diaurocyanide is required. Further detoxification and neutralization of solid cake prior to disposal or use for further processing will follow.
Carbon fines from attrition losses in the gold circuit.
These fines were assumed to have 1% of the gold adsorbed on them. These fines can potentially be blended with the leached solids from the gold leaching plant that contain unleached PGMs
Fines in need of detoxification.
Stellenbosch University https://scholar.sun.ac.za

127
4.4. Chapter summary
A detailed discussion of the operating conditions and process parameters affecting the
performance of the proposed design was undertaken. An outline of the assumptions and data used
to derive the mass and energy balances for each plant was provided. The output of the mass and
energy balances built from previous studies (Rossouw, 2015; de Waal, 2018), was used to feed
into the development of the production plan and sizing of the equipment in order to carry out an
evaluation of the capital and operating expenditures for the detailed economic study covered in
chapters 7 and 8.
An analysis of the characteristic feed stream reporting to the gold section was undertaken in which
it was established that the base metal composition was high. An evaluation of possible measures
to manage the concentrations of the base metals reporting to the gold electrowinning circuit was
done. Two treatment options were analysed in detail. The options studied were the SART process
(post cyanide leaching treatment) and the nitric acid wash process (pre-cyanide leaching
treatment).
Pre-treatment of the feed prior to cyanide leaching was selected as the most suitable option for the
scope of this study. This resulted in a revision of the gold extraction process flow sheet and the
material balances around the gold circuit. Following this intervention it was established that the
gold head grade to the adsorption circuit was increased. This increase necessitated a
consideration of three options to cater for the increase namely: reducing the solids to liquids ratio in
the leaching circuit, increasing the carbon concentration or diluting the liquor reporting to the
adsorption circuit to match the original process design conditions. Having considered the operating
constraints within the gold extraction circuit upstream and downstream of the adsorption circuit and
the potential gold losses associated with increased carbon concentration, dilution was selected as
the more feasible option.
The output of this chapter also created a foundation for predicting and characterizing the nature of
the effluent flows, emissions and solid waste streams associated with the plants. The detailed
study around the emissions, effluent and solid waste management was not included in the scope of
the study. Heuristics based on previous studies were instead used to estimate the costs associated
with the management of these streams in chapter eight (Turton et al., 2009; van Wyk, 2014).
Other areas for further study were also outlined in this section and include the development of
detailed Pourbaix diagrams for multi-component systems associated with WPCB leach chemistry,
the use of EMEW electrowinning technology to recover the copper in the bleed using EMEW cell
technology suitable for low copper feed concentrations of 0.1g/L (Roux et al., 2007). Further
upgrading of the process should be considered in the flow sheets should the project economics be
found to be favourable.
Stellenbosch University https://scholar.sun.ac.za

128
Chapter 5: CONSIDERATIONS FOR
PROJECT ECONOMIC EVALUATIONS
5.1. Purpose of economic evaluations
Economic evaluations are useful for the assessment of the economic impact of any business
concern such as recycling operations, diagnosing bottlenecks in the entire recycling operation and
characterising the financial attributes of a proposed or existing process. By making use of the
output of the evaluations, relevant adjustments can be made in tandem with recommendations
derived from environmental and sociological impact assessments.
Economic evaluations allow crucial investment decisions to be made. They provide a broader
picture of the financial direction a venture will be likely to assume in the short or long term. The
responsiveness of a minor or major alteration to the configuration of a production concern can be
predicted in a manner that incorporates the detailed assessment of the impact of changes in the
market.
Market dynamics are a part of macroeconomic factors that behave as negative or positive catalysts
to making investment decisions. The degree of financial risk can be predicted so that appropriate
contingencies can be incorporated in the planning stages to provide a cushion against unforeseen
shocks emanating within a concern or the macroeconomic environment.
It must be noted however, that while rigorous analysis of the operating environment is undertaken
through economic evaluations, it is not a fool proof measure of the certainty against severe
changes within the business environment. The shocks associated with the operating environment
are normally addressed in an analysis of strengths, weaknesses, opportunities and threats
(SWOT) or other environmental assessment tools. Such shocks can include adverse commodity
price dips or increases.
5.2. Important considerations for the evaluations
5.2.1. Raw material procurement
In the scope of this study categories two, three and four electronic waste as defined by the EU
Directive guidelines for categorization of e-waste (see Table 3.1) were used as the raw material
supply. The gold content in WPCBs averages between 110g and 250 g per tonne for the e-waste
categories specified for this study (Hagelüken, 2006; Lydall et al., 2017). Pricing and grading of
WPCBs is not standardized. Typically it is sold in the raw unprocessed form to maximise returns.
Table 5.1 outlines the typical price structures prevailing for whole WPBC boards.
Stellenbosch University https://scholar.sun.ac.za

129
Table 5.1: WPCB grading and pricing (Lydall et al., 2017)
Grade of WPCB Low Medium High
Description High copper content, low precious metals derived from large household appliances.
Pins, edge connectors and capacitors contribute to the value of these boards.
Highly populated boards from IT equipment. Highest grades are sourced from older electronic equipment
Price (US$/kg) 0.10-1.02 1.36-2.04 2.72-5.78
Competition for raw materials
Sale to agents and metal merchants for recovery in Asia and Europe. Global co-processors namely Belgian, Swedish and Canadian concerns.
Domestic pre-processors Global co-processors namely Belgian, Swedish and Canadian concerns.
Domestic pre-processors
5.2.2. Philosophy of calculations
The profitability and all financial calculations and production rates were determined using a
pessimistic calculation to incorporate risk factors within the micro and macroeconomic
environments.
5.2.3. Key raw material supply data
The calculations were done using a WPCB recycling rate of 400tonnes per annum. In an earlier
discussion (section 3.6.1), a major supply risk due to low e-waste inflows into the e-waste recycling
economy was identified. The risk has potential to creep adversely into the operations of existing
downstream players who are likely to respond by tightening supply contracts to protect their niche.
It was assumed for practical purposes, that raw material to be accepted included a combination of
white and brown goods. These provide WPCBs that vary in grade. Discrimination of the source of
the WPCBs was not done due to the perceived supply risk.
In chapter 3 again it was noted that 3% to 5% of the e-waste weight is comprised of WPCBs
(Schluep et al., 2009). Widmer et al., (2005) reported an average composition of 1.7% of WPCBs
in e-waste. It was also noted that WPCBs from end of life vehicles contribute on average 0.11% of
the total weight (Cuchiella et al., 2016).
According to literature the proportion of recycled waste streams in South Africa comprising of e-
waste is 12% (DEA, 2012; GreenCape, 2017). For the purposes of the study the maximum
average of WPCBs weight in raw e-waste discussed by Widmer et al., (2005) was used in the
calculations. Based on estimates of the proportion of WPCBs in e-waste the requisite tonnage of
WEEE to be committed to this plant per annum is equal to 23 530 tonnes (Widmer et al., 2005). In
the study it was established that almost 25% of known registered e-waste recyclers process e-
waste each year.
Stellenbosch University https://scholar.sun.ac.za

130
The tonnage of e-waste required to recover 400 tonnes of WPCBs each year was estimated to be
23 530 tonnes. This means that the major e-waste recyclers can supply up to 64% of the material
requirements of the proposed venture. Thirty six percent of the required e-waste would have to be
furnished by the informal sector and the remaining 75% of formally registered recyclers. The
possibility of additional costs of acquiring WPCBs cannot be ruled out a scenario where the
remaining 36% cannot be supplied consistently.
The collection of materials also has inherent business models depending on the prevailing
dynamics and influences associated with the efficiency of guaranteeing adequate material volumes
for operations.
Three have been identified and include:
• Incentivised collection (full cost of reverse logistics wherein the recycler incurs the cost of
buying back and collection of the e-waste),
• Secondly controlled incentive (recycler collects and offers a scrap value for the items being
released for recycling),
• Finally the non-incentivised scheme where the recycler enters into a strategic business
partnership with a known proprietor that acts as a collection point for e-waste.
The major cost is associated with the collection of the bins and paying agreed levies for the bins.
The last collection model has the advantage of advertising itself due to non e-waste related
activities which draw consumers, such as shopping. For the purposes of this study it was been
assumed that e-waste would be collected from major collection points or delivered by small
collectors to the central collection points.
5.2.4. Tax considerations
The tax rate applicable to the scale of business operations used. Three major tax bands have been
specified by the South African Revenue Authority: large corporate, venture capitalists and small to
medium scale enterprises. In the study a tax rate of 28% was used applicable to small for medium
scale enterprises.
5.2.5. Depreciation
Depreciation can be regarded as a tax allowance, cost of operation or measure of the declining
value of an asset or a mechanism to build up an equipment replacement fund (Peters &
Timmerhaus, 1991). For preliminary cost evaluations straight line depreciation is often used. The
choice of depreciation method used in later stages of the project is subject to the relevant tax
regulation authority within the country. An average useful service life of 10 years was used for each
of the business models analysed.
Stellenbosch University https://scholar.sun.ac.za

131
5.2.6. Interest rate (cost of capital)
Power (2004) in a presentation at the OECD development seminar defined the cost of capital as
being the function of an organization’s capital base, the equity and debt. An expression can be
derived for determining a weighted average cost of capital (WACC). This is achieved by taking into
account a beta value for determining the contribution of equity to the cost of capital and specifying
the equity risk premium. This WACC combines risk free lending rate, lending margin and the equity
risk premium and prevailing tax rate. The weighted average cost of capital can be regarded as a
determinant of the true economic value of a project wherein discounted cash flows at the end of a
project life at a specified internal rate of return (IRR) are targeted to be positive.
If the IRR is less than the hurdle rate, the difference between the returns to capital and cost of
capital will be less thereby yielding an unprofitable investment. The WACC is a reflection of the
extent of gearing. The hurdle rate is the price of capital and is that discount rate used to determine
the financial viability of a project, commonly the interest rate defined ‘i’. The risk adjusted hurdle
rate using capital asset pricing model is calculated as follows:
WACC = equity% of capital base (risk free rate) + (Beta x ERP*(Equity risk premium)) + debt% of
capital base (risk free rate + lending margin) x (1- tax rate)
(5.1)
As illustrated in equation 5.1 it can be seen that as the tax rates for venture capital in South Africa
increase and the degree of gearing increases, the WACC decreases. The risk of the project is
however increased as the project is more prone to disturbances in the macro-economic
environment. Such a scenario motivates lenders to add a premium to cushion against increased
risk through the lending rates (Power, 2004). In South Africa an ungeared company has a WACC
of 14.9%.
Presently it has been shown that large concerns that can be potential investors listed on the
London Stock Exchange (LSE) as opposed to the Johannesburg Stock Exchange (JSE), have
lower discount rates. This leaves two options; foreign direct investment or targeting local
companies with foreign listings in capital markets that have a deeper appetite for risk and on a
supply side a greater breadth (a diverse plethora of investment options).
Depending on the company’s asset base and listing, the prevalent WACC in major South African
companies is reported to range between 9.5% and 15%. Ghodrat et al., (2016) conducted an
economic feasibility study of the large scale pyrometallurgical processing of WPCBs through the
black copper smelting route within an Australian context and made use of a comparatively lower
cost of capital of only 10% compared to South Africa’s average of 12%.
According to the South African reserve bank statistics, the prime lending rate by private banks has
been pegged at an average of 10.25% since December 2012 (SA Reserve Bank Statistics, 2018).
Stellenbosch University https://scholar.sun.ac.za

132
It has been assumed that the cost of capital in South Africa due to equity is on the higher side.
Using a debt to equity ratio of one, a hurdle rate of 12.6% was specified for the economic study.
The arithmetic mean of the ungeared and current prime lending rates was used.
Depending on the degree of risk associated with the project, the hurdle rate can be adjusted
upwards or downwards. It is envisaged that low lending rates can be expected from strong
concerns with a strong leverage to finance their activities using debt capital or concerns with off
shore holdings. The higher cost of capital may be expected in regions where high risk is expected
with the project or from financiers with a lower appetite to carry risk. The hurdle rate specified was
also assumed to remain constant for the entire project life. Adverse changes in the business
environment were assumed not to apply within the scope of the study.
5.2.7. Adjustments for inflation
The degree of accuracy of project profitability estimations is subject to the reliability of
considerations made in the calculations that include inflation, interest on capital, prevailing tax
regulations and provisions for depreciation. Sell (1997) described the major components that
embody inflation accounting that are necessary for producing the balance sheet. Inflation
accounting takes into account the stock valuation methodology, depreciation method (typically
based on the historical costs of the assets) and taxation of the inflation premium.
In seeking project finance, development banks and other finance institutes require this level of
detail. Sell (1997) has argued that investment appraisal in this light is independent of inflation
accounting.
Two types of inflation exist that are the output of political, global economic changes and
government (domestic and foreign policies). Perry et al., (1997) described two distinct types that
include differential and general inflation.
General inflation is characterised by a uniform increase in prices and all costs. Differential inflation
shows a variation in the rate at which costs and prices increase. This is a result of different factors
exerting varied influences on pricing structures such as government controls. Inflation does not
remain constant every year.
Perry et al., (1997) has noted that the trend has been to neglect the effects of inflation, a posture
that echoes remarks advanced by Sell (1997). Sell (1997) noted that project appraisal in regions
burdened by high inflation rates are undertaken by use of real and constant prices. It has however
been shown that both the general and differential rates influence the outcome of the payback
period (PBP), net present value (NPV) and discounted cash flow rate of return (DCFRR). Failure to
account for inflation during project investment appraisals manifests in an exaggerated profitability
being reported (Perry et al., 1997).
Stellenbosch University https://scholar.sun.ac.za

133
Further, the tax reported for remittance to the government is erroneous. The inherent perceived
benefit of differential inflation where goods and services are inflated at a fixed cost of capital an
increase in NPV is realised. This is the inherent perceived benefit of differential inflation as is the
case of general inflation (Perry et al., 1997). Higher profit margins are associated with higher
DCFRR and shorter payback periods (PBPs) that are misleading.
The South African reserve bank announced that the benchmark repo rate has been pegged at
6.75%. The result is that the average 2017 reported inflation rate was recorded at a rate of 5.3%.
The 2018 Figure declined to 4.9% while the 2019 forecast registered a climb to 5.4%. This reports
an average of 5.2% over the three years.
A mean inflation rate for the period 2012 to 2022 was used in this study. Statistica.com (2018)
reported a mean inflation rate of 5.56% for the aforementioned 11 year period embracing historical
and future estimates. The discounted cash flows did not include inflation. The effects of inflation
were considered in the sensitivity analysis. It has also been assumed that significant
hyperinflationary effects do not exist,
5.2.8. Utilities
Standard prices for municipal water and power for purchased utilities were used. Specific usage
rates were evaluated from the usage ratios determined from the mass and energy balances (de
Waal, 2018). The costing of soft water and saturated steam at 2.70 bars was done based on the
output of calculations used for rating the water softener unit and evaluating the need for a boiler.
The detailed boiler and softener sizing and material requirements are discussed in section 5.3.2.2.
5.2.9. Metal prices
London metal stock exchange and Infomine prices were used to evaluate the expected revenues
from the sale of the finished products and ascribe a value to intermediate products pending further
processing (Infomine, 2017; LME, 2018; 2018b).
5.2.10. Material properties and losses
For the purposes of the preliminary evaluations it has been assumed that no alloys of copper exist
in the feed material. Standard losses of material and reagents have been determined from
experiential calculations based on industrial heuristics described in previous and current studies
alluded to in chapter 4. The average analysis of WPCBs used for the development of the process
flow sheets in a previous and separate study was based on the work of Shuey & Taylor (2004).The
gold content was revised downwards to 250 ppm to match the prevalent averaged supply of
medium grade WPCBs in the country.
Stellenbosch University https://scholar.sun.ac.za

134
Palladium was not captured in the original studies which have formed the basis for this study
(Rossouw, 2015; de Waal, 2018). The contribution towards potential revenue from palladium was
however considered in chapter 7.
5.3. Operations management
5.3.1. Equipment sizing and planning
Equipment sizing was done based on the output of the mass and energy balances that were
developed in a separate study (de Waal, 2018). Equipment and building facilities were assumed to
have been sized to 120% the design capacity. All bunding for liquid storage tanks has been sized
to accommodate 110% of the maximum volume contained in the storage vessel. These were
updated to incorporate the relevant recycle streams. Refer to appendix A for the mass balances
performed for the process plants. Appendix B provides details of the mass balances used for
developing the nitric acid wash circuit.
Results from previous empirical work and industrial performance data were used to define the
operating time profiles for each section. The schedule of residence times used in identifying
process bottlenecks is summarized in Table 5.2 extracted from the main equipment list schedule
detailed in appendix F, Table F.7. The time profiles also factored in the vessel change over,
material transfer times and vessel preparation times.
Table 5.2: Process debottlenecking (extracted from Appendix F, Tables F.7)
Item Plant Maximum running time (hrs) Batch runs/ day
Section References
1 Size reduction
Continuous 1 Crushing and milling
Allocated based on longest cycle time.
2 Solder leaching
8 hours leaching 1 hour material transfer
2 Leaching Rossouw (2015) de Waal (2018)
3 Copper extraction
168 hours electrowinning 1 hour material transfer
0.006 Electrowinning Steyn (2004)
4 Nitric acid wash
5 hour acid wash, 1 hour Material transfer, 1 hour sluicing 2.25hours material transfer 1 hr wash filtration
2 2
Acid wash Water sluicing
As developed. Operation inherited from solids output from copper leaching.
5 Gold extraction
24 hours leaching, 1 hour material preparation and loading, 0.5hours conditioning 1 hour discharge and filtration
1 Leaching As developed.
Table 5.3 summarizes the equipment sizing considerations drawn from the profile of the process
debottlenecking outlined in Table 5.2 above.
Stellenbosch University https://scholar.sun.ac.za

135
Table 5.3: Equipment sizing considerations
Item Plant Maximum running time (hrs)
Batch runs/day
Monthly output Sizing guide lines
1 Size reduction 24 1 30 production cycles Sized section to produce solids for leaching that covered tonnage of copper to be harvested after 7 days of electrowinning. Simultaneous transfer of solids to the solder leaching plant occurs.
2 Solder leaching
9 2 80 production cycles Sized main equipment to leach all solids from the size reduction plant within 24 hours.
3 Copper extraction
169 0.006 4.26 production Cycles
Sized leach tanks to absorb all solids from the solder leach within 12 hours. Storage capacity of the filtered leach liquor to handle all the liquor from leach section. The inventory capacity was equivalent to 7 days of continuous production. The SX circuit was sized to handle all the output of the leaching section in 12 hours. The inventory capacity of the leaching circulation tank was equivalent to the PLS liquor storage tank. Volume of liquor handled in electrowinning cells was equivalent to 7 days of continuous production.
4 Nitric acid wash
6.00 4.25
2 2
77.83 production cycles The central nitric acid storage tank was located in this section. (Sized to feed solder leaching plant at start up and running of the nitric acid wash circuit). Solids buffer hoppers and wash vessels sized to run two batches within 24 hours.
5 Gold extraction
26.50
1 27.17 production cycles at 1000ppm of gold in WPCB feed. 6.79 production cycles at 250ppm of gold in WPCB feed.
Feed hopper sized to handle solids output from the nitric acid wash circuit produced in 24 hours.
Stellenbosch University https://scholar.sun.ac.za
Stellenbosch University https://scholar.sun.ac.za

136
These time profiles were used to identify bottlenecks and specify material movements across the
plants. The effluent and solid waste flows were discussed in detail in section 4.3. Sizing was of
equipment was done with objective of nullifying the influence of the most significant bottleneck.
The bottleneck was identified to be the copper electrowinning process.
Based on the time profiles of the different sections, semi batch operations were identified as the
predominant operating configurations. To minimize idle times in the respective sections, sizing of
the storage vessels was done to maximize continuity of operations and ensure smooth change
over while reducing the frequency of plant moth balling. This ensures that the cost of labour per
tonne of copper and gold produced is reduced. In order to achieve this objective an analysis of
possible production operating configurations was undertaken. Three operating configurations
influencing sizing of equipment upstream of the copper plant and downstream of the copper plant
were identified.
The first configuration was based on sizing the equipment upstream and downstream of the copper
extraction circuit to run 4.26 cycles per month. In this configuration, equipment was sized to the
largest capacity possible on both ends of the copper extraction circuit.
The second configuration that could be adopted was associated with sizing the vessels to run at
rates designed to accumulate 7 days’ worth of process inventory prior to feeding the copper
extraction circuit. A similar sizing criterion was applied to the processes downstream of the copper
extraction plant.
The third configuration entailed the maximization of equipment sizing upstream of the copper
extraction circuit and the minimisation of equipment sizing downstream of the copper extraction
circuit. The schedules of production operations in each plant based on the operating configurations
are depicted schematically in appendix F, Figures F.1, F.2 and F.3.
For all production configurations it was assumed that the lead time for purchasing all relevant raw
materials that are locally available would not exceed one week. Imported raw materials or additives
were assumed to have a lead time of one month. Stocking of imported materials was assumed to
support a month’s operations. Local purchased materials were stocked at inventory levels
supporting a week’s production. The portfolio of products derived from the operations was based
on the business models developed and is discussed in detail in section 6.1.2. The production plans
specified for the respective business models are discussed in section 6.2.6. Table 5.4 provides a
summary of the implications of each of the three production operating configurations.
Stellenbosch University https://scholar.sun.ac.za

137
Table 5.4: Production operating configurations available
Production operating configuration
Configuration 1
Configuration 2 Configuration 3
Equipment sizing
Based on 4.26 cycles a month Based on maximum cycles each section will run as specified in Table 5.3.
Based on 4.26 cycles a month
Start up operations
Solder leaching plant goes on line 24 hours after the WPCBs size reduction plant. Copper electrowinning goes on line 179.75 hours after hot commissioning of all upstream sections. The nitric wash acid plant goes on line 179.75 hours after hot commissioning all upstream sections. The gold extraction section goes online 190 hours after hot commissioning of the sections upstream.
Solder leaching plant goes on line 24 hours after the WPCBs size reduction plant. Copper electrowinning goes on line 59.75 hours after hot commissioning of all upstream production plants. The nitric wash acid plant goes on line 59.75 hours after hot commissioning all upstream sections. The gold extraction section goes online 70 hours after hot commissioning of the sections upstream.
Solder leaching plant goes on line 24 hours after the WPCBs size reduction plant. Copper electrowinning goes on line 179.75 hours after hot commissioning of all upstream sections. The nitric wash acid plant goes on line 179.75 hours after hot commissioning all upstream sections. The gold extraction section goes online 190 hours after hot commissioning of the sections upstream.
Steady state running times
Size reduction 1 day a week Solder leaching 1 day a week Copper extraction 1 day a week except electrowinning Copper electrowinning 7 days a week (one cycle) Nitric acid wash plant 1 day a week Gold extraction 2 days a week.
Size reduction 7 days a week Solder leaching 7 days a week Copper extraction 1 day a week except electrowinning Copper electrowinning 7 days a week (one cycle) Nitric acid wash plant 7 days a week. Gold extraction 7 days a week.
Size reduction 1 day a week Solder leaching 1 day a week Copper extraction 1 day a week except electrowinning Copper electrowinning 7 days a week (one cycle) Nitric acid wash plant 7 days a week. Gold extraction 7 days a week.
Raw material inventory management
Minimum inventory 1 week for locally available materials. Minimum inventory 1 month for materials that are not available in South Africa.
Minimum inventory 1 week for locally available materials. Minimum inventory 1 month for materials that are not available in South Africa.
Minimum inventory 1 week for locally available materials. Minimum inventory 1 month for materials that are not available in South Africa.
Man power utilization
Permanent staff. Versatility training for crusher operators to be able to run the solder leaching plant on a three shift roaster. Permanent staff for the copper plant. 3 shift roaster. Permanent staff. Versatility training for nitric acid wash plant operators to be able to run the gold extraction plant can be considered. Process superintendent
Permanent staff. Running Three shift roaster. Permanent staff for the copper plant. Four shift roaster. Permanent staff. Versatility training for Nitric acid wash plant operators to be able to run the gold extraction plant can be considered. Process superintendent and shift foremen
Permanent staff. Versatility training for crusher operators to be able to run the solder leaching plant on a three shift roaster. Permanent staff for the copper plant. 3 shift roaster. Permanent staff. Versatility training for nitric acid wash plant operators to be able to run the gold extraction plant can be considered. Process superintendent and shift foremen
Stellenbosch University https://scholar.sun.ac.za
Stellenbosch University https://scholar.sun.ac.za

138
5.3.2. Utilities
5.3.2.1. Water softening
Softened water was used in the gold extraction circuit. The determination of the water softener
capacity was done using knowledge of the average water quality water assays that were pumped
into the main process plant. A crucial parameter in specifying the operational capacity of the
softener is the total hardness based on total magnesium and calcium available. Factors were used
to convert the calcium ion and magnesium ion concentrations to an equivalent calcium carbonate
concentration (Purolite, 2014). Factors of 2.5 for Ca2+ ion concentration and 4.18 for Mg2+ ion
concentration have been specified for use in industry (Purolite, 2014). Based on the calcium
carbonate hardness, the usage ratio of salt for both the softening of water and regeneration of the
exhausted resin was calculated.
For this study the usage ratio of salt was determined by evaluating the equivalent hardness as
CaCO3. It was also assumed that the initial set up would be installed in the Johannesburg
metropolitan area. An average water hardness of typical municipal water in the Johannesburg
metropolitan area was used to specify the salt usage ratios for softening the water and
regenerating the resin (Mohotsi, 2016).
The performance data was compared against the performance of known operations for installed
softeners at Zimbabwe Phosphate Industries (ZimPhos) (Msuku, 2012; Manjengwa, 2014). The
typical water hardness for the ZimPhos feed water ranges between 40ppm and 110ppm. During
the commissioning of the SPD 1500 water softener at ZimPhos the intake water hardness
averaged 40 ppm (Msuku, 2012). Using the water quality report for the Johannesburg metropolitan
area a water hardness based on equivalent CaCO3 was determined to be 74.70ppm which
approximated to the mean water hardness of Zimphos feed water (Msuku, 2012; Mohotsi, 2016).
Using the proximal similarity in total water hardness, the sizing of the water softener and
specification of reagents associated with softening water was done using the ZimPhos water
softening operations as a guide. The water softening reactions can be summarized as follows:
Softening:
RNa2(s) + Ca(HCO3)2 (aq) CaR + 2NaHCO3 ... (5.2)
Resin regeneration:
CaR(s) + NaCl (aq) (excess) RNa2(s) + NaCl (aq) (excess) + CaCl2 (aq) .. (5.3)
Stellenbosch University https://scholar.sun.ac.za

139
Resin regeneration
The regeneration of water softener resins differs slightly in time periods and ranges between 1.5
and 2 hours. The standard procedure for resin regeneration of softeners consists of four different
stages that also differ in length and are subject to the uniqueness of the operations of the plant and
the feed water quality. The stages are summarized in Table 5.5. Typical operational data was
drawn from plant data during the commissioning of the SPD 1500 water softener at ZimPhos and
the DOW water conditioning manual and data sheet (DOW Water Solutions (not dated); DOW,
1999; Msuku, 2012).
It was assumed for this study that the regeneration cycle would replicate a similar profile for the
operating times. For the process under study a strong acid cationic resin was selected namely,
DOWEX HCR. A brine solution ranging between 8% and 12% is recommended for the brine
injection stage (DOW Water Solutions (not dated); DOW, 1999). It was assumed that a 10% brine
solution and a flow through velocity of 0.296m3/hour was calculated for the process under study. A
detailed operational data sheet was generated for the water softening parameters for the process
under study. This data sheet was used as the base case for all the business models (see appendix
F, Tables F.1 and F.2). Respective data sheets were generated based on the specific water
requirements of each business model.
Table 5.5: Regeneration of softening resin (extracted from the main operational data sheet appendix
F, Tables F.1 and F.2)
Stage Backwash Brine injection Rapid rinse Brine refill
Time (minutes) 10 60 12 18
Salt demand (kg/day)
0 0.83 0 0.83
Water usage (m3) 0.047 0.281 0.056 0.068
Flow destination Effluent Effluent Effluent Process
Resin replacement
Resin performance is governed by the operating conditions to which it is subjected. The damage
results from swelling and weakening of the divinylbenzene (DVB) cross linking within the resin
structure. Feed water streams with high chlorine and iron cause extensive damage to the resin
cross-linking structure and swelling as a result of the iron that is oxidised while within the resin. The
normal operating life for water softener resin bed in urban areas can extend from 10 to 15 years.
For this study it was assumed that the resin bed was replenished once for the life of the project. It
was also assumed that topping of the resin bed volume was not be done since there were no
losses of resin to drain or carryover into the main process.
Stellenbosch University https://scholar.sun.ac.za

140
5.3.2.2. Steam generation and process heating
Steam was not included as the main heat source in the process. The determination of the total
energy requirements from previous studies were used to evaluate the steam demand. The steam
requirements were used to size the boiler for the operations. For this process the tonnage of steam
at 130OC and 2.70 bars required per day was found to be just under one tonne (0.029tonnes/hour).
The volume of steam required did not justify the installation of a boiler and the auxiliary equipment.
Electric heat exchangers and compressed air were instead used for the process. Compressed air
was assumed to be used for maintaining pressurized operating conditions in the elution column
and fluidizing the slurry bed in the nitric acid wash circuit.
5.3.2.3. Compressed air
The compressor was sized based on the requirements of the respective plants. The actual
compressor size was 1.5 times the compressed air requirements to factor in pressure drop along
the compressed air piping system. A reciprocating compressor with its receiving cylinder was
included in the list of major equipment.
The compressed air requirements for the plants are summarized in Table 5.6. The specific
compressed air requirements were updated for each business model in the economic studies. The
requirements summarized in Table 5.6 were based on the original basis (production of metallic
copper and gold).
Table 5.6: Compressed air requirements for the plants (original basis business model 3a)
Plant Size reduction
Solder leaching
Copper extraction
Nitric acid wash
Gold extraction
Pressurizing (m3) 0.00 0.00 0.00 0.00 11.25
Running time (hours) 0.00 0.00 0.00 0.00 12.00
Process (m3) 0.00 0.00 0.00 0.00 0.05
Running time (hours) 0.00 0.00 0.00 0.00 24.00
Agitation/fluidization (m3) 0.00 0.00 0.00 3.75 0.00
Running time (hours)
0.00 0.00 0.00 4.00 0.00
Total compressed air (m3) 0.00 0.00 0.00 3.75 11.31
The costing of the compressed air was done based on the running time, load, operating efficiency
and its availability according to the formula specified as follows (Hydraulicspneumatics, 2018):
Total cost = [(hpb) x (0.746) x (operating hours) x ($/KWh) x (% available time) x (%full load
hp)] / (Motor efficiency) (5.4)
Typically, the efficiency of compressors ranges between 10% and 15%. For the process under
study a compressor efficiency of 15% was assumed and the required power was 6.67 times the
rated power for the compressor motor (Hydraulicspneumatics, 2018).
Stellenbosch University https://scholar.sun.ac.za

141
The running configurations were specified based on the compressed air requirements in the
process. For this study it was found that the compressor would run on full load for 13 hours each
day. For the remaining 11 hours it was assumed that the compressor would run on 25% of the full
load. It was also assumed that the compressor motor efficiency when running on full load was 95%
and 90% when running at 25% of the full load.
5.3.3. Plant maintenance
Routine equipment plant maintenance for the plant was assumed to be fitted into the operations of
the plant requiring between one to two hours per session. For the study it was also assumed that
during steady state operations no major process interruptions would occur to prolong unplanned
downtime. Routine maintenance in each plant was assumed to be done once on a weekly basis.
Sections that were offline during material discharge or material preparation were subject to
preventative maintenance inspections.
For the study it was assumed that no anti-scalant was dosed in line in all of the heat exchangers. It
was assumed that the operation of the softeners and municipal feed water quality would not
generate scale at rates warranting frequent suspension of operations to remove scale. The heat
transfer efficiency of the heat exchangers remained satisfactory throughout the production year.
Descaling would be done annually during major plant servicing on a major plant shutdown
campaign. Major shutdown work was scheduled for the close of the production year between
November through December.
5.3.4. Organizational and operational structure
The proposed organograms for each of the three operating configurations are depicted in Figures
5.1 and 5.2. Supporting departments were included in the structure. The proposed organograms
support the inclusion of all major activities, namely size reduction, solder leaching, copper
electrowinning, nitric acid washing and gold extraction. The costs associated with the manpower
complement and supporting operations of the other departments used in the economic study were
estimated using typical labour prices from available online and supporting heuristics available in
literature (Peters & Timmerhaus, 1991; Turton et al., 2009; Indeed, 2018; 2018b; Indeed, 2018;
2018b).Independent engineering, supplies logistics, quality assurance control and safety
departments were not specified for the defined scale of operations. The roles were assumed to be
handled by appropriate skilled personnel supported by external service providers for more complex
functions. The security function was assumed to be managed in house by the administration
department with the assistance of an external security company. External maintenance engineers
were assumed to be outsourced at defined periods. Three resident support artisans housed under
the production department would be employed to support operations in the plant.
Stellenbosch University https://scholar.sun.ac.za

142
Figure 5.1: Proposed organogram for production operating configurations 1 and 3
Stellenbosch University https://scholar.sun.ac.za
Stellenbosch University https://scholar.sun.ac.za
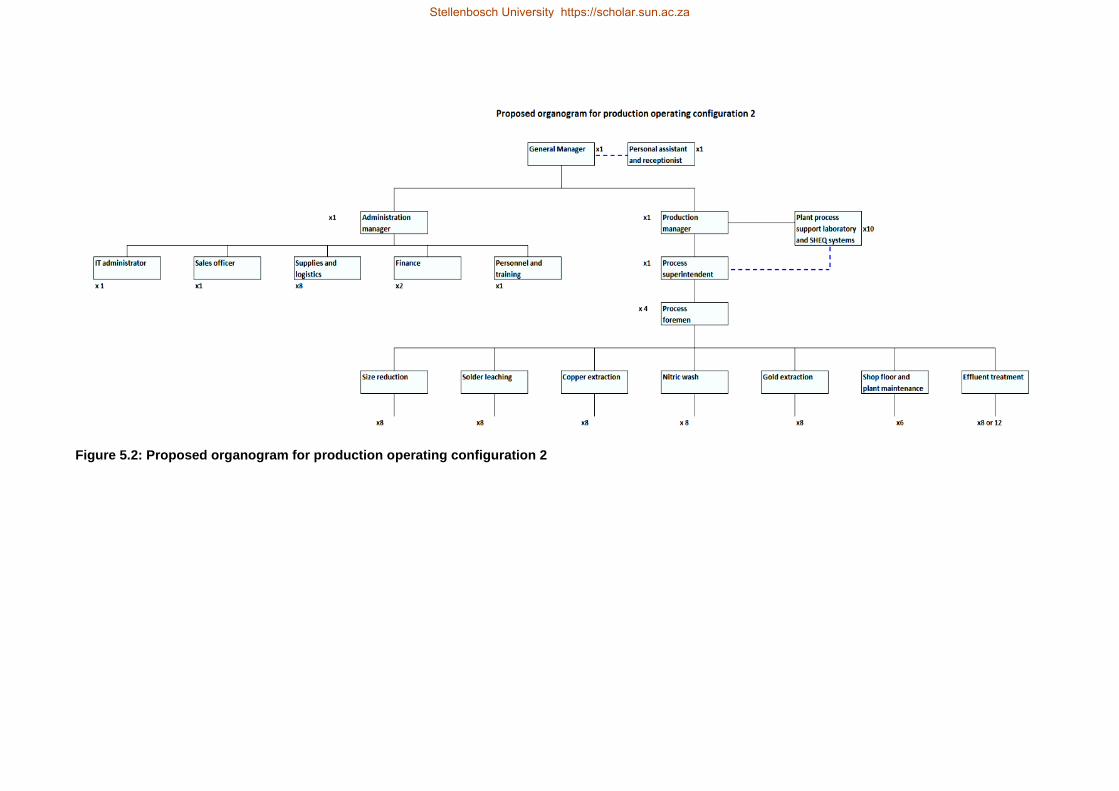
143
Figure 5.2: Proposed organogram for production operating configuration 2
Stellenbosch University https://scholar.sun.ac.za
Stellenbosch University https://scholar.sun.ac.za

144
Table 5.7 summarizes the proposed distribution of the manpower required for the entire operation
in the configurations depicted in the organograms. The manpower requirements are not static and
were subject to change as the scale, complexity of operations and business model changes.
Table 5.7: Specific manpower requirements for each of the production operating configurations
Department Configuration 1
Configuration 2 Configuration 3 Skill level
Executive management
General manager General manager General manager Specialised
Administration department
Administration manager
Administration manager
Administration manager
Specialised
Suppliers and logistics officer
Suppliers and logistics officer
Suppliers and logistics officer
Skilled
Warehouse clerk Warehouse clerk Warehouse clerk Semiskilled
Buyer Buyer Buyer Skilled
Accountant Accountant Accountant Skilled
Personnel officer Personnel officer Personnel officer Skilled
Shift drivers x4 Shift drivers x4 Shift drivers x4 Unskilled
Fork lift driver Fork lift driver Fork lift driver Unskilled
Finance and salaries administrator
Finance and salaries administrator
Finance and salaries administrator
Skilled
IT administrator x1 IT administrator x1 IT administrator x1 Skilled
Sales officer Sales officer Sales officer Skilled
Receptionist/Personal assistant
Receptionist/Personal assistant
Receptionist/Personal assistant
Semi skilled
Production department
Production manager Production manager Production manager Specialised
Process superintendent x2
Process superintendent x2
Process superintendent x2
Skilled
Shift foreman x4 Shift foreman x4 Shift foreman x4 Skilled
Analytical chemist Analytical chemist Analytical chemist Specialised
SHE systems officer SHE systems officer SHE systems officer Skilled
Shift laboratory technicians x8
Shift laboratory technicians x8
Shift laboratory technicians x8
Skilled
Size reduction plant floor operators x4
Size reduction plant floor operators x4
Size reduction plant floor operators x4
Semi skilled
Solder leaching plant floor operators x4
Solder leaching plant floor operators x4
Solder leaching plant floor operators x4
Semi skilled
Copper extraction plant operators x4
Copper Sulphate extraction plant operators x4
Copper Sulphate extraction plant operators x4
Semi skilled
Nitric acid wash plant floor operators x4
Nitric acid wash plant floor operators x4
Nitric acid wash plant floor operators x4
Semi skilled
Gold extraction plant floor operators x4
Gold extraction plant floor operators x4
Gold extraction plant floor operators x4
Semi skilled
Effluent and solid waste plant x12
Effluent and solid waste plant x12
Effluent and solid waste plant x12
Semi skilled
Shift artisans x4 Shift artisans x4 Shift artisans x4 Skilled
General hands x3 General hands x3 General hands x3 Unskilled
Stellenbosch University https://scholar.sun.ac.za

145
5.3.5. Selection of the operating configuration
The selection of the most appropriate production operating configuration was done by making use
of a matrix outlined in Table 5.8. Five different metrics were defined for the selection and are listed
as follows:
• Initial capital investment
• Equipment utilization
• Potential for employment creation
• Potential for stable production rates and equipment utilization in constrained operating
environments
• Strategic and tactical flexibility in conditions of perpetual uncertainty
• Ease of including inter-organisational lateral diversification
By ranking the metrics in the order of priority a scale of 1 to 3 was used for scoring each of the
metrics under consideration. The highest score out of 3 for each metric was awarded for the most
favourable option. Similarly the least favourable option scored 1 out of a maximum score of 3.
Based on the sum of the scores, the operating configuration that had the highest overall score out
of a maximum of 18 was selected.
Table 5.8: Matrix for selection of the best production operating configuration
Production operating configuration/Metric Configuration 1
Configuration 2 Configuration 3
Lowest initial capital investment 1 3 2
Equipment utilization 1 3 2
Potential for employment creation 1 3 2
Potential for stable production rates and equipment utilization in constrained operating environments
1 3 2
Strategic and tactic flexibility in conditions of perpetual uncertainty
3 1 2
Ease of including inter-organisational lateral diversification
1 3 2
Score 8 15 12
All equipment sizing was done based on the production operating configuration 2, which had the
highest score of 15 out of 18. Further costing and economic evaluations of all the remaining
business models were based on the second production operating configuration. The detailed
schedule of equipment sizes and operating conditions is included in appendix F, Table F.7.
5.4. Chapter summary
This chapter described in detail the key considerations that were factored during the economic
study. The first part of the study provided a discussion of the factors that affect the calculation of
capital and operating costs and the overall profitability analysis.
Stellenbosch University https://scholar.sun.ac.za

146
The bases of the assumptions used were discussed in the early part of the chapter. This section
was followed by a detailed discussion of the aspects related to operations management around the
production plant.
A discussion of the main supporting plant services was incorporated namely, utilities that include
soft water supply, compressed air and plant maintenance. The continuous, weekly and annual
maintenance schedules were described in this chapter. The service sections were also factored in
the detailed economic studies in chapters 7 and 8 of this study. A description of the generic
inventory plan affecting raw material supply and handling was also included.
Potential production plans were specified drawn from a detailed process debottlenecking of each
section. Three possible configurations were described which formed the basis of equipment sizing.
Each configuration was accompanied by a supporting organogram that listed the operating, plant
supervision and other personnel that supported activities associated with the proposed venture. It
was assumed that there was no independent engineering, supplies & logistics, quality assurance
control and safety departments. These functions were housed either under the production
department or the administration department as depicted in the organograms. The roles were
assumed to be handled by appropriate skilled personnel supported by external service providers
for more complex functions.
Six metrics were used to evaluate each of the operating configurations. The metrics included the
initial capital investment associated with the configuration, equipment utilization, potential for
employment creation, potential for stable production rates and equipment utilization in constrained
operating environments, strategic and tactical flexibility in conditions of perpetual uncertainty and
the ease of including inter-organisational lateral diversification. Following the analysis of each
operating configuration based on the metrics, the second operating configuration was selected.
This option minimized the sizing of all equipment while maximizing plant and time utilization. The
second operating configuration was used for all the remaining business models for the economic
study covered in chapters 7 and 8.
Stellenbosch University https://scholar.sun.ac.za

147
Chapter 6: FIRST LEVEL SCREENING
OF BUSINESS MODELS
6.1. Development of business models
6.1.1. Business models
A business model can be described as the philosophy behind an organization, concern or
individual’s ability to generate revenue. Revenue can be generated within the life cycle of a service
or product through the provision of related services associated with product realization or through
the actual generation of the product of interest.
The selection of a business model is a function of prevailing macro-economic factors that define
the need for the product and legal frameworks governing the activities of the business, threats in
the environment that will nullify the need for the product and hence terminate the revenue stream.
Business models possess interdependencies. This becomes especially defined in established
economies with vibrant market activity.
The selection of a business model depends on the economics and revenues realisable. The
profitability embraces the financial aspect and the measure to which risk is shouldered by the
concern. A combination of these types of profitability influences the selection of a business model.
Contemporary business environments however embrace the relevance of additional metrics such
as the sociological and environmental impacts and the concept of energy preservation on the
selection and adoption of a business model.
In the absence of existent or supporting structures for a concern’s activities, opportunities exist for
the establishment of businesses to support their activities. The permanency however is affected by
the size and turnover of the parent concern from which the other businesses were birthed and the
likelihood of the emergence of parallel ventures emerging in need of their services. The absence of
the support services to a company are what become the business models of the new ventures
established around the activities of the parent company in producing its scope of products.
If these new businesses are unviable they will either collapse or else realign their activities to
generate better or additional revenue streams. In the case where alternative revenue streams are
defined, the concern’s business model is said to have evolved. Figure 6.1 illustrates the basic
anatomy of a business model. As noted in the latter remarks, when the need is removed from the
chain the immediate result is death unless the model is reinvented through alternative strategic
intervention.
Stellenbosch University https://scholar.sun.ac.za

148
Figure 6.1: An illustration of the anatomy of business models
A regular analysis of a concern’s competitive advantage and business environment is therefore
essential for the architects of the business to ascertain the feasibility, the practical life span and
risks associated with the adoption of a business model.
Within the framework of this study, two major factors were considered in the development of
business models from the proposed hydrometallurgical process and are discussed in the following
section.
6.1.2. Criteria for defining the business models
Two criteria were combined to define the business models for the hydrometallurgical operations
named HYDROMET WPCB Inc. The first criterion used was based on the final products produced
for sale. In the scope of this discussion the main products of interest are the production of gold and
copper based products. Four classes of the business models were defined. The classes are
illustrated by Figures 6.2 through to Figure 6.5
Stellenbosch University https://scholar.sun.ac.za

149
Figure 6.2: Product classification A - production of copper and gold metal
Stellenbosch University https://scholar.sun.ac.za
Stellenbosch University https://scholar.sun.ac.za

150
Figure 6.3: Product classification B - production of copper and gold liquors
Stellenbosch University https://scholar.sun.ac.za
Stellenbosch University https://scholar.sun.ac.za

151
Figure 6.4: Product classification C - production of copper liquor and gold metal
Stellenbosch University https://scholar.sun.ac.za
Stellenbosch University https://scholar.sun.ac.za

152
Figure 6.5: Product classification D - production of copper metal and gold liquor
Stellenbosch University https://scholar.sun.ac.za
Stellenbosch University https://scholar.sun.ac.za

153
The second criteria used was based on a consideration of the activities that could either be
incorporated as an in-house function in the entire scope of operations or could be outsourced. A
consideration of the existent stakeholders in the South African e-waste recycling and value chain
enabled the identification of operations that could be outsourced. The chief activities considered
included collection and dismantling, crushing and shredding (size reduction), the extraction of
copper and gold, purification of copper, purification of gold and selling of the output.
The analysis of the South African value chain revealed that the well established collection and
dismantling and pre-treatment activities could be exploited. This meant that the collection and
dismantling of e-waste and the size reduction functions could potentially be outsourced. Four
alternative classifications of business models were then defined based on this criterion. The
classifications labelled 1 through to 4, are illustrated schematically in Figures 6.6 through to 6.9.
Stellenbosch University https://scholar.sun.ac.za

154
Figure 6.6: Operations based classification 1 - all operations done in-house
Stellenbosch University https://scholar.sun.ac.za
Stellenbosch University https://scholar.sun.ac.za

155
Figure 6.7: Operations based classification 2 - only size reduction is outsourced
Stellenbosch University https://scholar.sun.ac.za
Stellenbosch University https://scholar.sun.ac.za
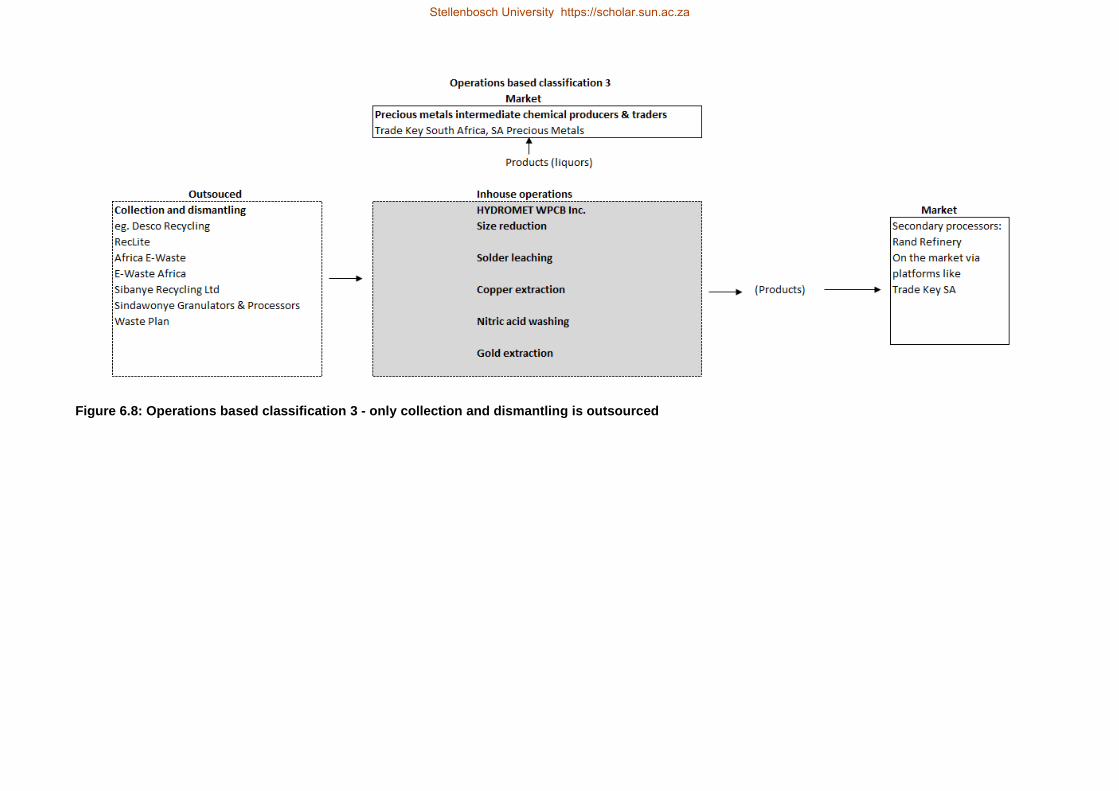
156
Figure 6.8: Operations based classification 3 - only collection and dismantling is outsourced
Stellenbosch University https://scholar.sun.ac.za
Stellenbosch University https://scholar.sun.ac.za
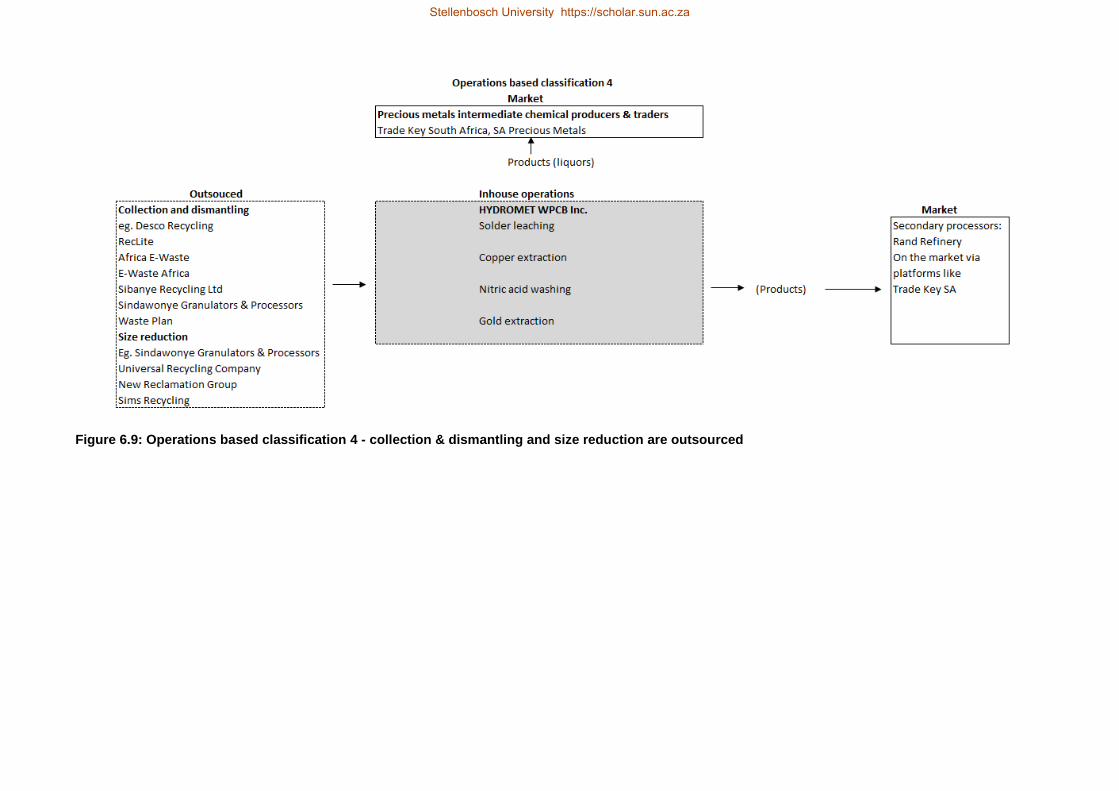
157
Figure 6.9: Operations based classification 4 - collection & dismantling and size reduction are outsourced
Stellenbosch University https://scholar.sun.ac.za
Stellenbosch University https://scholar.sun.ac.za

158
Combining the two criteria a 4 x 4 matrix for specifying different combinations was generated. The
combinations are outlined in the matrix in Table 6.1:
Table 6.1: Matrix for defining combinations to specify business models
CRITERIA Product based classification
a b c d
Operations based classification
Matrix of possible combinations
1 1a 1b 1c 1d
2 2a 2b 2c 2d
3 3a 3b 3c 4c
4 4a 4b 4d 4d
Sixteen business models were therefore defined from these combinations and are depicted in
Figures 6.10 and 6.11 below. The blue boxes depict production activities that are done in-house.
The pink boxes represent operations that are outsourced or are associated with the production of
chemical intermediates. In the context of this discussion the chemical intermediates were gold
liquor (aurocyanide solution 142.52 ppm gold content) and copper liquor (copper sulphate solution,
3.71% Cu).
Stellenbosch University https://scholar.sun.ac.za

159
Figure 6.10: The first eight business models, groups 1 and 2 characterised by in-house collection and dismantling of WPCBs
Figure 6.11: The last eight business models, groups 3 and 4 characterised by outsourced collection and dismantling
Stellenbosch University https://scholar.sun.ac.za
Stellenbosch University https://scholar.sun.ac.za

160
6.2. First level screening and selection
Supply chain logistics costs
The costs associated with the manufactured product being moved from its point of origin to the end
user are what make up the costs of supply chain logistics. Figure 6.12 illustrates the typical cost
components of the supply chain of electrical and electronic goods.
Figure 6.12: Basic EEE goods supply chain and components of the logistical costs
The reverse logistics costs describe the cumulative costs along the supply chain typically
associated with reuse or recycling industries. The structure of the reversed supply chain for the
good at the end of its useful service life destined for recycling often does not terminate at the
original manufacturer alone. There are three major termination points associated with the reverse
supply chain. Depending on the business model associated with the recovery of the good in
question, more than one termination point can exist as illustrated in Figure 6.13.
The first termination point (Point 1) associated with the original producer characterises the
fundamental attribute of extended producer responsibility (EPR). In such a case the producer
houses a business unit in the broad portfolio of the concern’s operating activities capable of
reusing, refurbishing or recycling the whole or part of the product and reintegrating the output into
the normal production activities.
The second termination point (Point 2) is peculiar in its ability to potentially be extended beyond the
original manufacturer closing the reversed supply chain without returning to the point of origin.
When the termination of the reverse supply chain extends beyond the closed loop characterizing
an EPR system, the cost components cumulating to the overall cost of the reverse logistics
increases.
Stellenbosch University https://scholar.sun.ac.za

161
The reversed supply chain is extended to independent recyclers who incur both costs of
warehousing, transfer and collection from the central supplier in addition to paying premiums
charged on the elements of the reversed supply chain. The effect of the higher logistics costs
associated with this supply chain is magnified when the capacity to add value is low, the market
absorption capacity for by-products is very low and the regulatory climate is unconducive to
supporting the operations of the enterprise. This can also be seen when the reverse supply chain
terminates at point 3, disassembly and material recycling.
As in the case of the prevalent e-waste recycling economy of South Africa, the supply chain has
assumed a two pronged and highly branched configuration, characterised by a high reverse
logistics cost component (both hidden and direct). A highly branched reverse supply chain
oftentimes can be characterised by varied and increasing costs along the supply chain due to the
increased frequency of premiums charged onto the desired product of interest: in this case e-
waste.
The hidden costs such as inhomogeneous purchase prices and material quality increase with the
increasing complexity of the EOL EEE supply chain and is aggravated in conditions of scarce
supply of the key material, EOL EEE.
Figure 6.13: Three termination points for the reverse supply chain for EOL electrical and electronic
goods
Selection of the business models
The selection of the business models was conducted on two levels illustrated in Figure 6.14. The
first level entailed an assessment of the internal and external capacity to manage the reverse
logistics function. Results of the analysis conducted on the first level created a platform for the
elimination of some of the business models as depicted in Figure 6.14. Refer to section 6.2.5 for
the output of the first level screening used for eliminating some of the business models from further
study. Level 2 selection was described briefly in section 6.3.
Stellenbosch University https://scholar.sun.ac.za

162
Figure 6.14: Screening criteria for business models with output for first level analysis (refer to sections 6.2.5 and 6.3)
Stellenbosch University https://scholar.sun.ac.za
Stellenbosch University https://scholar.sun.ac.za

163
An understanding of the proposed venture’s projected competitive strategic positioning in the
existent e-waste recycling economy in South Africa was established by means of a SWOT
analysis. Porter’s five force model was not used in this stage of the analysis since the proposed
undertaking was only at the preliminary stage of development. The output of the SWOT analysis is
detailed in Table 6.2.
Table 6.2: SWOT analysis of the proposed project undertaking
Attribute Findings
Strengths Possesses expertise in base metals management within the gold circuit. There is leverage for diversification of the business models for potential scale up of operations and expansion of product portfolio. Process was designed to maximise water utilization and lower internal inventory of hazardous effluent.
Opportunities The existence of a vibrant and established collection and dismantling industry. Established organizations specializing in pre-treatment of WPCBs. Diversion of capital and operating risk associated with outsourcing collection and dismantling and e-waste pre-treatment operations.
Weaknesses Operating capacity may disadvantage the business in strained macro-economic conditions of raw material supply. No access and exposure to detailed market intelligence on the aurocyanide liquor market. Unhealthy dependence on a sole proprietor for market intelligence with very similar operations. Overdependence on a sole chief revenue base. Susceptible to commodities market risk factors for both copper and gold businesses. Has no operating leverage to use predatory pricing as defence strategy. Does not possess the capacity to use penetration pricing as an aggressive entry strategy. Unable to retain a healthy market share in the face uncompetitive business operations or saturation of similar or parallel value adding activities downstream of the value chain. Gold liquor business heavily dependent on strong, reliable client/supplier collaborations.
Threats Low and inconsistent e-waste inflows into the e-waste recycling economy. The existence of a pseudo monopolistic business climate in the distribution of large e-waste consignments. Tightening regulations and legislative requirements on handling of effluent discharge. Risk of operating at a capacity of not more than 65% per year.
In this study five metrics critical to maximising competitive advantage of the proposed venture,
were therefore considered in the first screening level. These metrics included an analysis of the
impact of the proposed operations in relation to:
• The storage space requirements,
• Raw material supply within South Africa,
• Manpower and wage bill requirements,
• By-product and waste projections
• The potential revenue sources and streams from the associated by-products.
Stellenbosch University https://scholar.sun.ac.za

164
Calculations for all the analyses done in the first level screening were based on the assumptions
summarized in Table 6.3. The output of the calculations used for the analysis is included in
appendix E, Table E.1.
Table 6.3: Assumptions used for first level analysis of business models
Parameter Assumptions Reference
Bulk density of raw e-waste 210 kg/m3 SITA waste calculator
Proportion by weight of WPCBs in raw e-waste
1.7% Widmer et al., (2005)
Maximum dismantling rate per person.
3.5 Tonnes/month Blaser & Schluep (2012)
Projected tonnages of e-waste in storage (RSA)
2 108 000 Tonnes Finley & Lietchi (2008)
Projected annual growth rate of e-waste
322 000 Tonnes/year GreenCape (2018)
Minimum wage as at November 2017 for a 40 hour working week
R3 500/month US$238/month
(fin24, 2018:23)
Minimum wage as at November 2017 for a 45 hour working week
R3 900/month US$265.20/month
(fin24, 2018:23)
6.2.1. Storage space requirements
The existent handling and storage capacity for large volumes of unprocessed e-waste was noted to
be large, requiring extensive land space as revealed in the analysis (Appendix E, Table E.1). This
was also accompanied by a significant input towards security and monitoring associated with the
storage spaces. Existing recycling and dismantling operations at present have been reported to
operate below the installed capacity of the plants (Lydall et al., 2017). Recent reports indicated that
the low and inconsistent inflows of e-waste within the SADC region and South Africa have
contributed towards the conservative operating capacities of most established recyclers (Lydall et
al., 2017; GreenCape, 2017; 2018).
Most of the recyclers in the formal sector receive e-waste that has undergone some degree of
recycling from the smaller suppliers (Lydall et al., 2017). Typically, the informal sector feeds into
the formal sector. The smaller recyclers in the formal sector forward their output to the larger
recyclers. It would appear that the contribution of the informal sector helps to alleviate the burden
of handling and processing large volumes of what may be regarded non-essential material within
the scope of the formal recyclers’ operations. The case does not hold true for all recyclers
however. One recycler was reported to having an inventory of plastics derived from e-waste
recycling of up to 2 tonnes (Lydall et al., 2017). It was noted that failure to secure a market to
absorb these plastics led to the build up of inventory on the recycler’s operating premises.
The nature of operations of each of the recyclers in the formal and informal sectors is unique. They
are strongly market driven, dictated largely by the specific supplier client agreements within and
outside of the South Africa.
Stellenbosch University https://scholar.sun.ac.za

165
In the absence of such collaborations and agreements in the South African e-waste economy, the
likelihood of the businesses operating with meaningful returns to support operating activities
declines. The alternative options will then entail exporting, land filling or stockpiling of the fractions.
Earlier findings of the research (section 3.6) revealed that the existing legislation and the municipal
by-laws in place are varied in their application, definition and specification across the different
regions in South Africa (Dittke, 2007). Research findings further revealed that the existent
legislation would have to be revised to allow for specialised long term storage of complex
hazardous waste and by-products associated with e-waste recycling. At very high operating
capacities, typically associated with field installations, handling of large unprocessed e-waste
inventories becomes unsustainable.
Research findings made by Zeng et al., (2015) revealed that WPCB recycling plants tend to be
characterised by low margins for both field and mobile (modular) plants. As a measure to curtail
the operational risk that lead to the observed low margins (Zeng et al., 2015), it was necessary to
review options available to reduce the potential operational capital outlay associated with bulk
handling and storage of unprocessed e-waste, enhancing the security of the unprocessed material
and paying the fees associated with environmental and other regulatory instruments. Consideration
of the existing legislative constraints and restrictive land spaces required for material storage was
also done. It became apparent that the inclusion of collection and dismantling as a business unit
operation in the scope of operations of the proposed process was an unfavourable undertaking.
6.2.2. Raw material supply within South Africa
Based on the projections of e-waste growth rates advanced by researchers (Finlay & Lietchi, 2008;
GreenCape, 2017), sufficient volumes exist to sustain operations at full capacity in the plant. While
projections of e-waste growth rates favour the expansion of existing e-waste recycling operations,
the existent raw material supply risk was identified as one of the threats to the viability and growth
of e-waste recycling in South Africa.
The due diligence of different operating capacities was undertaken in light of the existent raw
material supply constraint earlier described in section 4.1. It was noted that operations in excess of
an annual recycling rate of 1 000 tonnes of WPCBs per annum would be burdened by steep
reverse logistics costs associated with circumventing the existent raw material supply risk. The
consistent supply of high grade WPCBs into the main e-waste recycling stream was noted to be
limited and is expected to deteriorate with the active interest in replacing the use of precious
metals in electronics manufacture with cheaper alloys that have similar performance
characteristics.
Stellenbosch University https://scholar.sun.ac.za
166
The entire scope of operations initially pegged at a processing capacity of 30 000 tonnes per
annum of WPCBs would require a consistent supply of approximately 1 770 000 tonnes of
unprocessed e-waste. Based on the inference of previous researchers it has been estimated that
the current formal and informal recyclers will only be able to furnish 7.7% of the material
requirements of the proposed venture. At this operating capacity the proposed venture will collapse
in less than a year of operations as a result of failure to finance operating activities.
A comparison of operations at an established facility, Umicore running at a name plate capacity of
250 000 tonnes per annum of varied secondary metal sources, which includes WPCBs and high
value electronics (Hagelüken, 2006), revealed that the success of the proposed hydrometallurgical
venture would be affected by the extent to which the capability of logistics function of Umicore
could be replicated and even exceeded in South Africa.
Remarks made by current formal recyclers showed that collection and dismantling activities, in
isolation, within the South African environment is a specialised business function dependent on
extensive raw material supplier networks and collaborative partnerships across the supply and
value chains (Mouton & Wichers, 2016; Lydall et al., 2017).
Managing the effects associated with the prevalent raw material supply risk on the proposed
hydrometallurgical installation would be dependent on the adoption of such collaborations,
characterised by strong lateral integration across the e-waste recycling supply and value chains.
As the proposed operating capacity of the recycling campaign increases the dependence on the
reliability of such collaborations within the supply and value chains has to increase. These
business relationships would have to be sustained for the long term.
Research findings also revealed that there is need to introduce frameworks and working models to
promote the release of the e-waste into the main recycling chain to support ongoing e-waste
recycling activities and therefore enhance plant capacity utilization of established recyclers
(Mouton & Wichers, 2016). The existence of the supply risk is evidenced by the consistently low
capacity utilization observed in the formal recycling sector (Lydall et al., 2017). Operations of these
recyclers have been reported not to exceed a capacity utilization of 60%.
An initial investigation into the feasibility of handling 30 000 tonnes/annum of WPCBs also exposed
the potential existence of unfavourable economics of the reverse logistics associated with
collection and dismantling activities. This posed a threat to the economic viability of the
undertaking at increasing operating capacities. The interrogation of the proposed operating
capacity revealed that a clear plan which forms a specialised function for handling large volumes of
non-metallic material would also be required. Without the existence of such a plan, the government
objectives, set out to divert larger waste material volumes from landfill would be retarded (Godfrey
& Oelofse, 2017).
Stellenbosch University https://scholar.sun.ac.za

167
This however, would place significant pressure on the focus of operations and cost structure of the
core activities with the risk of the emergence of protective behaviours by established e-waste
recyclers.
In light of these findings the due diligence of the proposed initial operating capacity exposed a
likely failure to operate beyond a capacity utilization of 10%. This revealed that the installation of a
large scale field installation of a hydrometallurgical plant to recover copper and gold is at present
not feasible under the current operating environment.
The operating capacity (name plate) was revised downwards to match the existing raw material
supply in South Africa. The operating capacity of Desco recyclers was used as the closest
benchmark for further studies. The proposed operating capacity as a result was trimmed by a
factor of 75 to give a recycle rate of 400 tonnes per annum of WPCBs. A capacity of 400 tonnes
per annum potentially assumes a configuration which is more suited to geographically dispersed
raw material supplies in South Africa (Mouton & Wichers, 2016; Lydall et al., 2017).
Table 6.4 summarizes the results of the analysis of the unprocessed WPCB purchase cost against
the maximum dismantling rate of a worker.
Table 6.4: Analysis of the raw WPCB purchase cost against maximum dismantling rate of a worker.
WPCB grade Cost per kg
(US$)
WPCBs kg/(per month
per person)
Purchase cost of
equivalent amount of
WPCBs
Minimum wage for
40hr working
week
Variance of purchase cost
against minimum
wage (US$)
Remarks
Low mean Lydall et al., (2017)
0.54 59.50
32.37 238 -205.63 Buy WPCBs
Medium mean Lydall et al., (2017)
1.70 59.50
101.15 238 -136.85 Buy WPCBs
Average of all grades Lydall et al., (2017)
2.49 59.50 128.78 238 -109.22 Buy WPCBs
High mean Lydall et al., (2017)
4.25 59.50
252.88 238 14.88 Consider buying WPCBs.
Maximum purchase cost of WPCBs Lydall et al., (2017)
5.78 59.50 343.91 238 105.91
Buying is still an option when handling and logistics costs are factored.
An inspection of the results in Table 6.4 revealed that the purchase of low grade, medium grade
and an average of all grades of WPCBs was a more viable option compared to in-house
dismantling.
Stellenbosch University https://scholar.sun.ac.za

168
The purchase cost of the equivalent weight of WPCBs dismantled was always lower than the
minimum wages paid to a worker to dismantle the e-waste in order to recover an equivalent
quantity of WPCBs.
In the case of high grade WPCBs the purchase cost of WPCBs exceeded the required minimum
wage by a 6% margin. It was expected that the effect of the inflation on the purchase cost of
WPCBs would be overshadowed by the additional costs associated with operations dependent
entirely on manual labour.
An analysis of the comparative cost of labour versus the highest purchase price of WPCBs was
also undertaken. The results of the analysis revealed that wages will always be 31% less than the
WPCB purchase costs. At a glance it would appear more attractive to conduct in house collection
and dismantling activities. Using a similar analogy to that presented for high mean WPCB
purchase cost, the combined influence of other costs associated with reverse logistics was
expected to dilute the perceived benefit associated with in-house collection and dismantling of e-
waste.
The consistent supply of high grade WPCB is at present also limited and is expected to deteriorate
with the active interest in replacing precious metals in electronics WPCBs with cheaper alloys that
have similar performance characteristics.
The recovery of WPCBs requires deep dismantling of e-waste to avoid premature losses of metals
associated with the liberation of crushed WPCBs still attached to the body of the gadget. Deep
dismantling activities however, are more specific. Correspondence with a supplier of e-waste
recycling machines noted that the more specialised e-waste recycling equipment is designed for
small scale operations. The discussion with the supplier revealed that the deep dismantling of e-
waste normally achieved by use of manual labour cannot be replicated at present by the machines
designed for e-waste dismantling (Manjengwa, 2018). Large scale recycling operations rely on e-
waste that has undergone some degree of dismantling and pre-processing (Hagelüken, 2006).
An increase, therefore in the tonnages of WPCBs to be handled would be associated with an
increase in the manpower requirement to achieve the desired deep dismantling (see appendix E,
Table E.1). This would be accompanied by a congruent inflation in the wage bill and a reduction on
the overall profitability of the operations.
Combining the inflated wage bill with the costs associated with the reverse logistics of handling raw
e-waste, the direct purchase of WPCBs remained a more viable option.
Stellenbosch University https://scholar.sun.ac.za

169
6.2.3. By-product and waste projections
Collect–a-can in the 1970s went on a massive drive to collect cans. While successful at building
large inventories of cans for recycling, the existent consumer industries and players were not at an
operating and technical capacity geared to absorb the sudden influx of raw material. A similar
challenge is foreseen with the current status of the South African e-waste recycling climate.
In remarks made in chapter 3, findings of the investigations revealed that the present absorption
capacity of e-waste into the main stream e-waste recycling chain has not surpassed the set target
of 20% in South Africa (GreenCape, 2017). A maximum of 12% was reported and for the study a
cap of 15% was used. The implication of the calculations done suggests a need to investigate the
specific material and product requirements of the existing potential consumers in the value chain.
Based on the results of study it was shown that a detailed cost benefit analysis must be
undertaken if one is to consider expanding the portfolio of operations as an alternative to exporting.
This expansion would be achieved as a result of additional processing of by-products and waste
streams.
The low off take rates of some by product streams like plastics in the current operating
environment was noted to be cyclic in nature (GreenCape, 2017). The analysis predicted the
burgeoning of large volumes of waste and by-product streams (appendix E, Table E.1).
The status of the existent market has not developed to such an extent to absorb this influx. In a
similar vein the existing infrastructure is also yet to mature to a level to handle the safe processing
of large volumes of complex polymetallic effluent and solid waste streams.
A disposal plan for any material not absorbed must therefore be considered carefully. Key
operations stakeholders must take responsibility for the land space required to dump the
unprocessed by-products. The calculations based on research data suggested that an estimated
1390 acres per month would be taken up as a result of the collection and dismantling activities.
This land space requirement is contrary to the thrust towards diversion of waste from landfills. The
by-products and waste material also require specialised disposal and storage that prevents the
contamination of ground water sources from the progressive seepage of flame retardants and
heavy metals.
6.2.4. Additional revenues from by-products
The potential revenue streams associated with the collection and dismantling of e-waste showed
that value could be derived from the additional processing of substantial volumes of plastic, glass
and metallic fractions. The analysis of the collection and dismantling activities however revealed
that the current absorption capacity of the by-product fractions was not expected to exceed 15%.
The projection was backed by the reported e-waste recycling rate of 12% (GreenCape, 2017).
Stellenbosch University https://scholar.sun.ac.za

170
In earlier discussions of this study (section 3.4.3.1, Figure 3.11), it was shown that certain by-
product fractions ultimately reported to landfill. The recycling of glass, phosphor powders and other
fractions in comparison to other streams was noted to be low. The observed trend was aggravated
by a low market demand for these streams (Lydall et al., 2017, GreenCape, 2017; 2018). The
market for specialised plastic fractions was also noted to be low and turnovers from this niche of e-
waste by-products have remained largely cyclic.
To date well established formal recyclers have noted that the export of metallic and non-metallic
fractions from e-waste recycling is at present a more lucrative business model (Lydall et al., 2017).
The climate in the main export regions for e-waste and the associated by-products has witnessed a
shifting trend towards the rigid control of material inflows as evidenced by tightened e-waste
legislation in China. Any future consideration for exporting material must be undertaken with an
understanding of the need to upgrade material quality to secure customer confidence in cases
where the economic viability for local processing is unfavourable.
In a broader light it was seen that the successful and sustained exploitation of by-product streams
was and is threatened by the prevalent domestic and emergent export market risk factors. The risk
factors were characterised by both the disproportionate material generation and absorption rates.
6.2.5. Output of first level screening
The findings of the first level selection based on the five metrics interrogated revealed that the in
house collection and dismantling business unit function was not a favourable undertaking in the
prevailing South African context. The key features of the analysis revealed the existence of:
• High raw material supply risk
• High domestic market supply risk for by product streams
• Emergent export market supply risk for by-product streams
• Incongruent technological and infrastructural capacity to manage large outflows of complex
hazardous materials
• Commitment of large tracts of land for disposing of unsalable by-products
• High costs associated with reverse logistics
• Comparatively higher man power costs for large scale deep dismantling of e-waste
On the basis of these findings the first eight business models (1a to 2d) as indicated in Figure 6.10,
hosting the in-house collection and dismantling business unit function, were eliminated from the
study as depicted by Figure 6.12. The last eight business models (3a to 4d), highlighted in Figure
6.11 were subjected to further interrogation following capital and economic evaluations of the size
reduction, solder leaching, copper extraction, nitric acid wash and gold extraction circuits.
Stellenbosch University https://scholar.sun.ac.za

171
6.2.6. Production planning
Combining the output of the operations study covered in section 5 and the development and
selection of the business models, production plans were specified for the operations. The outputs
for each of the plants that included the key products, by products and wastes were characterised.
The results are summarized in Table 6.5.
Table 6.5: Characterization of output streams from each of the plants for business models 3a to 4d
Material/product Material specifications
Crushing and milling or outsource
WPCBs 60% non metals 40% metals
Solder leaching
Desoldered solids 2-15% lead as percentage of metals
Solder leach Pb 0.13%, Sn 0.03%, Ni 0.04%, Fe 0.39%, Cu 26ppm, Ag 3.4ppm, Al 0.019%
Copper Extraction
Filtered solids 1.03%Cu, 2.1% Al, Fe 1.95%, Co 0%, Sn 5.5%, Ni 0,84%, Zn 0.096%, Pb 0.072%, Sb 0.55ppm, Au 0.149%, Ag 0.26%
Copper Liquor 3.71% Cu
Copper (cathode sheets) LME Grade A > 99%
Nitric acid wash
Stripped solids Au 0.16%, 1.44% as H2SnO3, at least 94.10% non-metallics
Silver rich liquor Cu 0.21%, Ag 0.55%, Ni 0.17%, Al 0.42%, Fe 0.4%, 93,61% H2O 93.61%
Gold extraction
Gold liquor
pH 12.68, Au 142.52ppm, Ag 0.093ppm, Ca(OH)2 0.35%, NaCN 98.39ppm, Fe 54.10%, Cu 0.39%, Al 0.77ppm, Sn 0ppm, Ni 0.31ppm, Zn 0.036 ppm, Pb 0.00081ppm
Gold sludge > 98% Au, <120 ppm Ag
Non-metallic solids 3.76% Sn, 50ppm Au, 0.00044ppm Ag
The outputs derived from each of the plants for the respective business models were quantified on
an hourly, weekly, monthly and annual basis and the results are detailed in appendix F, Tables F.3
through to F.6 for the remaining eight business models 3a to 4d. Based on the second operating
configuration selected in section 5.3.5 and the results of the output analysis, generic production
plans for the group 3 and 4 business models were specified. The production plans assumed steady
state operating conditions after commissioning the plants. It was also assumed that all products
produced are sold and there is no inventory build up. The annual production plans and raw
material schedules are summarised in appendix E, Tables E.2 to E.5 and appendix F, Table F.11.
Stellenbosch University https://scholar.sun.ac.za

172
6.3. The second level screening and selection
The second level screening and selection was done using the results generated from the detailed
economic studies of the remaining eight business models, 3a through to 4d described in chapter 7.
The final selection of the business models selected for further study by means of a sensitivity
analysis is detailed in chapter 8.
6.4. Chapter summary
Within this chapter a detailed discussion of the development of the business models around the
proposed process was undertaken. Based on selected core activities within the business units 16
business models, clustered into groups 1 through to 4, were defined which also bear an inter-
relationship to the current business environment and e-waste recycling scene in South Africa. The
screening of the business models was considered on two levels. In this chapter the first level
screening was discussed in detail. The first level screening entailed an initial assessment of the
first business unit of all the business models. The existence of a high raw material supply risk due
to low e-waste inflows into the recycling economy was established. This current situation would not
allow for very large scale installations of hydrometallurgical operations. Additional observations
noted included the potential domestic market supply risk for by product streams with low and
seasonal off-takes, emergent export market supply risk for by-product streams, incongruent
technological and infrastructural capacity to manage large outflows of complex hazardous
materials.
It was established that incorporating the collection and dismantling function within the entire scope
of operations would be a capitally and operationally intensive undertaking. Large scale operations
would require a large manpower complement to carry out deep dismantling activities that are very
specific in nature.
A consideration of the current value chain revealed that sufficient capacity exists to support the
proposed hydrometallurgical process. This was supported from findings of the SWOT analysis
done for the proposed venture. An examination of the potential capability of effectively
circumventing current raw material supply constraints and the steep costs associated with the
reverse logistics of collecting e-waste was undertaken. Metrics were specified for conducting the
initial evaluation. These metrics covered the key risks, technological capabilities, resource
requirements and labour requirements.
Results of the analysis also revealed that the business activity associated with the collection and
dismantling function is a specialised function that is capitally intensive and would best be handled
by independent proprietors specialising in this role in both the existent informal and formal
recycling sectors.
Stellenbosch University https://scholar.sun.ac.za

173
There is potential to also eliminate the size reduction function from the entire scope of operations
of the proposed hydrometallurgical process. Registered formal recyclers were identified in the
discussion that will serve as suppliers of whole or crushed WPCBs. The attendant raw material,
market and technological risk factors also rendered collection and dismantling an unattractive
undertaking to be handled as an internalized operation. It was on this basis that the first eight
business models, groups 1 and 2, associated with in-house collection and dismantling of e-waste
were eliminated. The second level screening of the remaining business models 3a through to 4d
was handled in chapter 7.
Stellenbosch University https://scholar.sun.ac.za

174
Chapter 7: PROJECT COSTING AND
EVALUATION
7.1. Capital cost estimation
The detailed costing and evaluation of the proposed process flow is covered in this chapter.
Costing and evaluation of the project profitability has been done by considering all the remaining
eight business models. In this study it was assumed that all the costs were determined at full
operating capacity with the assumption that all the material produced was sold.
7.1.1. Capital cost method
Different methods exist for determining capital expenditure (CAPEX). A combination of a
summation of actual vendor prices and estimates adjusted using plant cost indices available in
literature can be used. The accuracy of the estimates declines as the estimates depend more on
adjusted prices. Five types of estimates were described by the American Association of Cost
Engineers in 1958 (Perry et al., 1997). The methods are listed in the Table 7.1 as follows:
Table 7.1: Capital cost estimation methods
Item Estimate Accuracy
1 Order of magnitude/ratio estimate (For similar types of plant) 10-50%
2 Study estimate (factored estimate) requires knowledge of major equipment. Up to 30%
3 Preliminary estimate (budget authorisation) more detailed than the study estimate.
Up to 20%
4 Definitive estimate (Project control estimate). Based on considerable data prior to drawings.
Up to 10%
5 Detailed estimate (Firm or contractors estimate) requires completed drawings, specifications and site surveys.
Within 5%
For the purposes of the preliminary economic feasibility study, the study estimate method was
used. A combination of available vendor prices data from literature was also used for the capital
cost estimates. Bare module cost estimation and CAPCOST software was also employed for
estimating equipment costs not readily available or accessible (Perry et al., 1997; Turton et al.,
2009). Estimates were also made using the six tenths rule and a factor for reduction based on the
difference in capacity of operation and material of construction (Peters & Timmerhaus, 1991; Perry
et al., 1997; Turton et al., 2009). The conversion was also corrected using the applicable chemical
engineering cost index. Van Wyk (2014) described a similar set up for the recovery of precious
metals from low grade ores through cyanide leaching and specified equipment identified in the
process under study. Some estimates used in this study using the six tenths rule were derived from
the similar design proposed by Van Wyk (2014).
Stellenbosch University https://scholar.sun.ac.za

175
The detailed equipment list for all the remaining business models was based on the equipment list
prepared for business model 3a. The schedule is included in appendix F, Table F.7 and F.8. The
equipment lists for each business model were adjusted appropriately to cater for the changes in
the final product streams.
Start up time is a function of the type and complexity of the process, the degree of
interdependency of the available process plants or sections and manpower (Perry et al., 1997).
Plants with an initial capital investment of up to US$7.8 million can be completed within 0.83 to 1.5
years and those with initial capital investments in excess of US$7.8 million are estimated to take
between 1.5 to 2 years to complete (Perry et al., 1997).
Each business model had different initial capital outlays. Start up times and costs for each of the
business models were determined on this basis.
Start up costs range between 8 to 10% of the fixed capital investment (Peters & Timmerhaus,
1991). In this study it was assumed that start up cost was included in the total capital cost of the
business models. It was also assumed that the start up cost was 9% of the fixed cost investment
for all the models which is reflected in the capital cost estimation of each business model.
In this study all three plant categories were included. They are summarized in Table 7.2 as follows:
Table 7.2: Categories of the production plants for the proposed process
Solids processing sections Solids/fluids processing sections
Fluids processing
Size reduction plant Solder leaching plant Nitric acid wash circuit Copper extraction plant Gold extraction plant Soft water production unit Effluent treatment plant
Compressed air unit
The costs making up the direct, indirect and working capital costs can be evaluated as
percentages of the delivered equipment cost. The percentages of the purchased equipment costs
used were also a function of the type of materials being processed. Peters & Timmerhaus (1991)
provide a detailed account of the percentage ranges for the different process plants. Table 7.3
provides the percentage factors used for the estimation of the direct, indirect and working capital
cost estimates for the sections in this study.
Stellenbosch University https://scholar.sun.ac.za

176
Table 7.3: Percentages used for determining the costs associated with the project capital
expenditure (Peters & Timmerhaus, 1991; Perry et al., 1997)
Direct Costs Solids processing Solids/fluids processing
Fluids processing
Direct costs
Purchased Equipment Delivered Vendor prices and estimates based on known quotations
Vendor prices and estimates based on known quotations
Vendor prices and estimates based on known quotations
Equipment Installation 45% 39% 47%
Piping (Installed) 16% 31% 66%
Instrumentation & Controls (installed) 9% 13% 18%
Electrical (Installed) 10% 10% 11%
Service facilities (installed) 40% 55% 70%
Land (if purchase is required) 6% 6% 6%
Buildings (including services) 25% 29% 18%
Yard improvements 13% 10% 10%
Indirect costs
Design, Engineering and Supervision 33% 32% 33%
Construction Expenses 39% 34% 41%
Contractors Fee 17% 18% 21%
Contingency 34% 36% 42%
Working Capital 68% 74% 86%
7.1.2. Capitalization costs
In accounting terms capitalization costs refer to the funds required for the repurchase of equipment
that is regarded as an asset in the balance sheet. These assets and their purchase and
replacement at the end of the useful service lives are not expenses since they continue to work for
the business generating value. In this study capitalization costs were calculated for all the major
equipment.
An estimated life of 11 to 12 years is reported for chemical process equipment (Peters &
Timmerhaus, 1991). The useful service lives of the equipment ranged between 4 and 12 years. For
the operations under study, an average equipment life of 10 years was assumed for the
equipment. Some of the listed equipment had useful service lives of at least 2 years. Capitalized
costs were evaluated using the expression 7.1, described in literature (Perry et al., 1997).
Stellenbosch University https://scholar.sun.ac.za

177
CK = [CFC - (S/(1 + i)n)] x [(1 + i)n/((1 + i)n – 1)] (7.1)
Where:
‘CK’ is the capitalized cost
‘S’ is the salvage value at the end of the estimated useful life. This is evaluated by subtracting the
equipment value after ‘n’ years of use from original equipment purchase price.
‘n’ is the estimated useful life of the equipment
‘I’ is the interest rate
CFC is the fixed capital cost
Capitalization costs were also calculated for process non consumables detailed in Table 7.4.
Table 7.4: Capitalization costs for process non consumables
Section Material Estimated service life (years)
Replacement frequency over
project life
Copper extraction plant Kerosene 3 5
Copper extraction plant LIX 984N 3 5
Copper extraction plant Polypropylene macrospheres
5 3
Gold extraction plant Activated carbon 2 9
Water softening unit Resin (DOWEX
Marathon C)
10 1
For the evaluation the capitalization costs were also used as one of the metrics for selecting the
most attractive business model. The choice with the lowest capitalization cost was the most
desirable.
Two methods can be used for factoring in the capitalization costs. The first method entails treating
this cost as part of the initial capital expenditure during initial project evaluations (Peters &
Timmerhaus, 1991). The second method discussed in literature describes a method for providing
for capitalization costs through amortization throughout the project life (Perry et al., 1997). In this
study the first method was used to avoid the inflation of profitability associated with making
provisions that reduce taxable income.
7.1.3. Analysis of the capital cost estimates
Perry et al., (1997) defines the total capital cost of a project as being the sum of the fixed capital
cost, the working capital and the cost of land and other non-depreciable costs:
CTC = CF + CWC + CLand and other non-depreciable costs (7.2)
Stellenbosch University https://scholar.sun.ac.za

178
In this study the total capital cost also embraced capitalized costs of equipment and process non
consumables replaced at intervals of at least one year or more. The project life was specified at 20
years. The capital cost estimation of the remaining eight business models was undertaken. The
equipment sizes were corrected based on the desired products of the respective business models.
The summary of the capital cost estimates for the remaining eight business models are detailed in
appendix F, Tables F.13 and F.14 and are illustrated graphically in Figure 7.1.
Figure 7.1: Overall capital cost distribution for each business model
An analysis of the capital cost distributions for the group 3 and 4 business models reveals that the
business models associated with the production of the solid metal products were associated with
the highest fixed capital investment and capitalization costs. A similar trend was observed for the
start-up costs for each of the respective business models shown in Figure 7.2.
Figure 7.2: Start-up costs for each business model
The elimination of the size reduction plant associated with the group 4 business models resulted in
a decrease in the total capital invested by margins ranging between 1% and 5.5%. These changes
are summarized in Table 7.5.
Stellenbosch University https://scholar.sun.ac.za

179
Table 7.5: Decrease in total capital investment in group 4 business models
Business model 4a 4b 4c 4d
Drop in total capital investment (%)
1.25 5.29 2.87 2.16
The largest change was witnessed in business model 4b that was associated with the production
of gold and copper liquors. The decision to pursue business models 3b and 4b as opposed to the
production of metals associated with 3a and 4a, would lead to a reduction of the initial capital
outlay of 76.64% and 77.39% respectively. The greater reduction in the initial capital outlay was
associated with business model 4b which was the least capitally intensive. The resultant effect of
the elimination of the size reduction plant was more significant compared the other business
models with superior initial capital outlays.
An analysis of the distribution of the capital costs on a plant basis was undertaken and is depicted
in Figure 7.3. The significant contributors to the initial capital outlay were evidenced by the plants
producing one or both of the metal products chiefly, the gold and copper plants associated with
business models 3a, 3c, 3d and 4a, 4c and 4d.
Figure 7.3: Capital cost distribution by plant in each business model
The gold metal sludge production commanded the highest capital investment in both group 3 and 4
business models, exceeding the capital investment in copper cathode production facilities by a
margin of 15%. The elimination of equipment associated with the electrowinning of copper and
gold liquors resulted in an almost equal distribution of capital outlay in the copper, gold and effluent
treatment plants.
Stellenbosch University https://scholar.sun.ac.za

180
7.2. Operating cost estimation
Operating expenses were calculated by summing the direct, indirect and the general operating
costs. Contingency costs were added to the sum of these costs to give the total operating cost for
each respective business model.
7.2.1. Raw material costs
The raw material requirements were calculated from the mass balances of the respective plants
and service units. Prices of the materials for each section were gathered from online vendor prices,
direct enquiries from agents and published data from raw material manufacturers. The purchase
price of WPCBs used was based on literature as discussed in chapter 6 (Lydall et al., 2017).
An average gold content in the WPCBs feedstock of 250ppm was assumed to represent the
closest typical average available when all three grades of WPCBs were blended. Using published
data the purchase price for the WPCBs was estimated to be US2.49/kg (Lydall et al., 2017). The
WPCB prices used in each of the respective sections of the plant was based on the interplant
transfer prices calculated from the knowledge of the total operating costs associated with the
section from which the WPCBs were derived.
No firm market prices were however available to use for comparing and assigning a working cost
for the crushed WPCBs in the study of the group 4 business models. The interplant transfer price
for crushed WPCBs from the size reduction plant, derived from the costing of the group 3 business
models was therefore used as the entry cost for all economic evaluations associated with the
group 4 business models.
7.2.2. Solid and waste management costs
The projected material flows of waste and effluent discharges were determined from the detailed
mass balances of all the sections. The material flows were characterised and grouped according to
the degree of toxicity of each stream. Using these classifications, solid wastes and effluent costs
can be estimated from heuristics in literature (Turton et al., 2009; van Wyk, 2014). The costs
previously estimated in another study (van Wyk, 2014) were found suitable for use in this study.
Non toxic material incurred a charge of US$0.04/kg. This factored in costs associated with material
transfer and handling. Moderately and very toxic material incurred charges of US$0.04/kg and
US$0.1/kg respectively.
7.2.3. Labour costs
Operating labour requirements were determined specifically for each section and the labour costs
were estimated from the respective industrial average of the specified job descriptions. Online data
from major South African recruiters was utilized (Indeed, 2018; 2018b; Payscale, 2018; 2018b).
Stellenbosch University https://scholar.sun.ac.za

181
Refer to appendix F, Table F.12 for the specific wage rates and salaries used for the study. For this
process supervisory labour was found to be 14.79% of the operating labour which approximates
closely to the reported estimate in literature of 15% (Peters & Timmerhaus, 1991; Perry et al.,
1997). This labour component was found to constitute about 62% of the total operating cost which
was above the reported maximum of 50% in literature (Peters & Timmerhaus, 1991). The cost of
labour associated with the effluent treatment plant was assumed not to have been captured in the
overall waste and effluent treatment of each section. It was included in the overall wage bill of the
entire operation.
Labour in the plant service sections
The two plant service sections associated with the designed process included the compressed air
unit and the water softening section. Two man-hours each day were allocated to the softening
water unit and the central compressed air supply.
A cost of operating labour was allocated to the compressed air and water softening sections. The
provision of operating personnel specifically dedicated to the compressed air and water softening
sections was not included in the organograms of each business model.
The water softening section was manned by the gold extraction plant operators. The compressed
air unit was manned by the engineering servicemen. The cost of labour from these sections was
not included to avoid double accounting. It was only calculated to determine the specific cost of
softened water.
7.2.4. Utility costs
The costs that were categorized as utility costs include the compressed air costs, power, steam,
water to the softening unit and fuel (coal). The costs were calculated using the process usage
ratios calculated for the respective plants (refer to appendix F, Table F.9). The compressed air and
softened water costs were calculated based on the operating costs associated with running the
unit. Peas coal prices were determined from online quotations of typical vendor prices. The prices
of water and power were based on industrial tariffs in the Johannesburg metropolitan area. A cost
of US$2.63/m3 of water was used in the calculations (johannesburgwater, 2017). The cost of power
used was pegged at US$1.17/kWh (Eskom, 2018). A coal price of US$0.11/kg was used in this
study. Steam costs were not estimated since it was not used in this process (Alibaba, 2018).
7.2.5. Indirect operating costs
Indirect operating costs were estimated using heuristics from literature (Peters & Timmerhaus,
1991; Perry et al., 1997). These costs included the plant and payroll overheads, local taxes and
insurance and general operating expenses.
Stellenbosch University https://scholar.sun.ac.za

182
An allowance for contingency was provided for each of the operating sections. Table 7.6 provides
a summary of the percentages and method used for evaluating the operating costs.
Table 7.6: Estimation of operating costs
Direct operating costs Method for estimation (Peters & Timmerhaus, 1991; Perry et al., 1997)
Raw materials Calculated from material balances, process usage ratios and vendor prices.
Process raw material losses Calculated from material balances, process usage ratios
Waste and effluent treatment Calculated from material balances, process usage ratios and heuristics in literature.
Utilities Calculated from material balances, process usage ratios and relevant vendor prices.
Operating labour Calculated from specific requires of each section and online labour costs from recruiting agencies.
Direct supervisory 14.79% of operating labour
Maintenance and repairs 6% of fixed capital cost
Operating supplies 15% of maintenance and repairs
Laboratory charges 15% of operating labour
Patents and royalties 4% of total operating costs
Indirect operating costs (fixed)
Local taxes and insurance 3% of fixed capital cost
Payroll overheads 15% of operating labour
Plant overhead costs 125% of operating labour
General operating expenses
Administration costs (other labour)
61.69% of operating labour
Distribution and selling costs 8% of total manufacturing costs
Research and development 4% of total manufacturing costs
Gross operating cost
Contingency 3.80% of total operating costs
7.2.6. Analysis of operating costs
The annual operating costs for each business model were evaluated and are summarized in
appendix F, Table F.15 and Figures 7.4. An analysis of the data revealed that the direct costs of
the group 4 business models were greater than the direct costs of the group 3 business models.
This was attributed to the cost of crushed WPCBs used in the costing of the group 4 business
models. The internal transfer price of crushed WPCBs was used for the calculation since no
market data was available for comparison. The results did show that the reduction in the direct
costs of the group 4 business models would be realised when the purchase cost of WPCBs
remained at least 30% lower than the internal transfer price of crushed WPCBs.
Stellenbosch University https://scholar.sun.ac.za
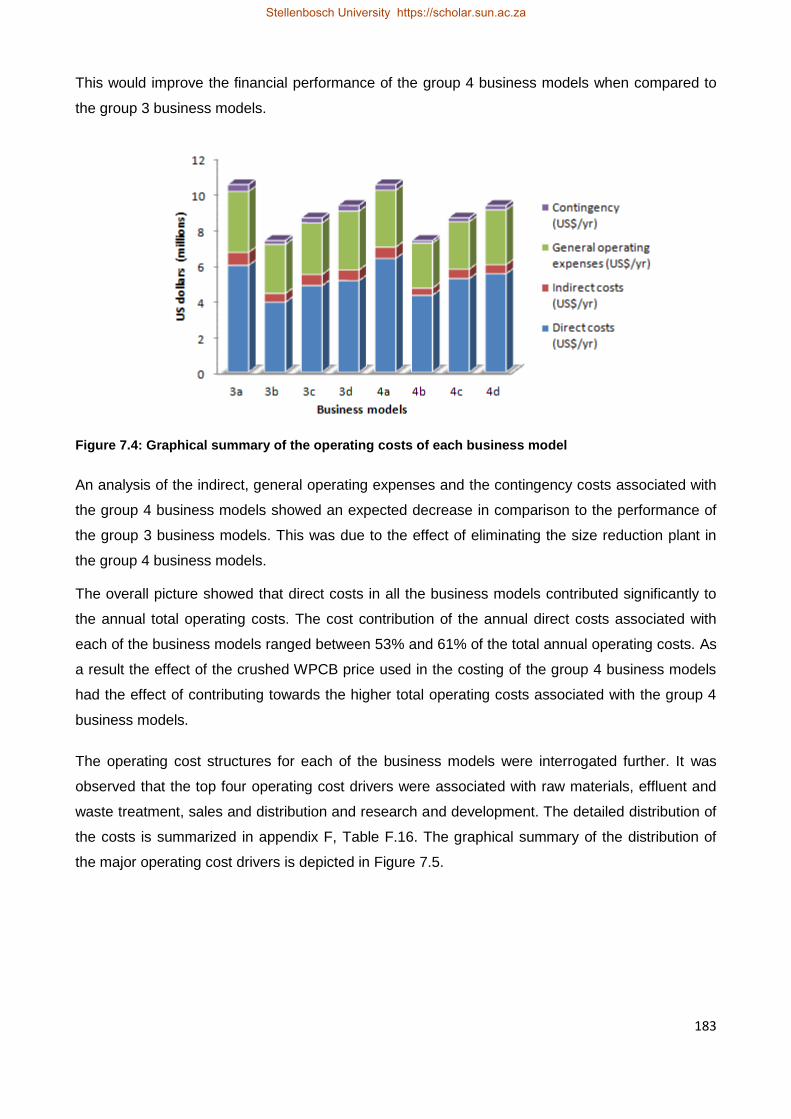
183
This would improve the financial performance of the group 4 business models when compared to
the group 3 business models.
Figure 7.4: Graphical summary of the operating costs of each business model
An analysis of the indirect, general operating expenses and the contingency costs associated with
the group 4 business models showed an expected decrease in comparison to the performance of
the group 3 business models. This was due to the effect of eliminating the size reduction plant in
the group 4 business models.
The overall picture showed that direct costs in all the business models contributed significantly to
the annual total operating costs. The cost contribution of the annual direct costs associated with
each of the business models ranged between 53% and 61% of the total annual operating costs. As
a result the effect of the crushed WPCB price used in the costing of the group 4 business models
had the effect of contributing towards the higher total operating costs associated with the group 4
business models.
The operating cost structures for each of the business models were interrogated further. It was
observed that the top four operating cost drivers were associated with raw materials, effluent and
waste treatment, sales and distribution and research and development. The detailed distribution of
the costs is summarized in appendix F, Table F.16. The graphical summary of the distribution of
the major operating cost drivers is depicted in Figure 7.5.
Stellenbosch University https://scholar.sun.ac.za

184
Figure 7.5: Percentage contributions of the major operating cost drivers
Operational leverage exists to manage the contribution of sales and distribution costs by
establishing supply contracts wherein cyclic deliveries can be done over extended contractual
agreements of up to a month as opposed to shorter time frames such as weekly deliveries. This fits
well with the capacity of the operations under study which allows for the accumulation of product
over a period of one month.
A well designed and engineered production process will also contribute towards trimming the
contribution associated with the research and development costs. Little control however exists to
manage the raw material costs of which, the costs of WPCBs were the significant raw material cost
drivers. The prices of WPCBs within the operating framework of the South African e-waste
recycling economy are governed strongly by supply and demand constraints. As the scarcity of the
high value WPCBs increase so does the leverage of the supplier of the raw material. The prevalent
raw material supply risk associated with WPCBs provides sufficient stimulus for supply driven
inflation of prices.
As a new entrant into the recycling chain operating on a relatively low capacity, the bargaining
power is very limited and potentially non-existent. The percentage contribution of the cost of
WPCBs is shown in Figure 7.6 for each of the business models. The internal costs of effluent
treatment can only be managed as far as the efficiency of the process is designed and operated.
External factors such as the existing regulations on Hazardous waste management and applicable
statutes affecting the effluent and waste treatment operations cannot be dictated on both the
tactical operational and corporate strategic levels. They are mandatory.
Stellenbosch University https://scholar.sun.ac.za

185
Figure 7.6: Contribution of WPCBs to the total raw material costs in each business model
The effluent and waste treatment costs contribution were highest in the business models, 3a and
4a which were associated with the recovery of both copper and gold in the metallic form. The
lowest contribution from effluent and solid waste treatment was associated with the less
operationally complex processes of business models 3b and 4b associated with gold and copper
recovery as chemical intermediates in solution.
The comparative distribution of the operating costs is also depicted on a plant by plant basis as
shown by Figures 7.7 through to 7.10. In both the group 3 and group 4 business models the
significant operating costs were associated with copper extraction, nitric acid wash and gold
extraction plants.
Moving across the graphs from the size reduction plant to the gold extraction plant, the observed
trend was a progressive increase in the total operating costs associated with each plant. The
increase was driven by the price of WPCBs. The value addition that occurred as the WPCBs were
processed in each section was accompanied by a progressive increase in the interplant transfer
prices of the WPCBs. To avoid double accounting, the internal transfer price of the WPCBs across
these plants was therefore not used in the overall estimation of the annual operating costs of each
business model. Only the WPCB purchase price at the point of entry into the system was used.
Stellenbosch University https://scholar.sun.ac.za

186
Figure 7.7: Comparison of plant operating costs for business models 3a and 4a
Figure 7.8: Comparison of plant operating costs for business models 3b and 4b
Figure 7.9: Comparison of plant operating costs for business models 3c and 4c
Stellenbosch University https://scholar.sun.ac.za

187
Figure 7.10: Comparison of plant operating costs for business models 3d and 4d
7.3. Sales and revenue
In this study it was assumed that all the revenue was generated from sales of the gold and copper
based products. It was also assumed that during the life of the project a fixed budget was used
each year. This was based on the premise that sales volumes, market demand and raw material
costs would remain fairly constant over the life of the project. The analysis of the specific effects of
inflation, moving tax rates, sales projections reflecting market behaviour, were examined in depth
in the sensitivity analysis of the selected business models.
7.3.1. Product pricing
The methods available for allocating a price to a final product include full absorption pricing,
marginal pricing, pricing on the basis of the cost of production and the rate of return pricing method
(Perry et al., 1997). The metals business is strongly market driven. The prevailing LME market
prices of gold and copper metals were therefore used in the study. The market price of copper
liquor was used as the comparative basis for evaluating the performance of the business models
that produced copper liquor. The current market price for 30% copper sulphate solutions is
US$460/tonne (Alibaba, 2018). The copper liquor produced in the process under study had a
copper sulphate concentration of 14.26%. Based on the concentration of the solution in the liquor a
selling price of US$218.65/tonne was used for the study.
No reference data was available to compare and benchmark the gold liquor selling price. A
proportion of 80% of the gold content in the liquor was therefore used as the basis for allocating a
price to the gold liquor. An evaluation of the competitiveness of the gold liquor price revealed that
the cost of gold in the liquor exceeded the prevailing market price of gold by a margin of about
64%. This indicated that the gold liquor production cost was high.
Stellenbosch University https://scholar.sun.ac.za

188
Reduction of the cost of gold in the liquor could only be achieved within the scope of the current
process by the reduction of the proportion of the gold charged. Alternatively a reduction in the
purchase costs of the crushed WPCBs would also lead to a reduction in the cost of producing the
gold liquor.
A reduction in the proportion of the gold content charged in the product liquor price was associated
with a decrease in gross revenues from the gold liquor business. The comparative performance of
the gold liquor business against the prevailing market price of gold is illustrated in Figures 7.11
through to 7.14.
Figure 7.11: Comparing cost of gold in liquor versus market price of gold for business model 3b
Figure 7.12: Comparing cost of gold in liquor versus market price of gold for business model 3d
Stellenbosch University https://scholar.sun.ac.za

189
Figure 7.13: Comparing cost of gold in liquor versus market price of gold for business model 4b
Figure 7.14: Comparing cost of gold in liquor versus market price of gold for business model 4d
An initial analysis of the graphical plots of the gold liquor market price versus the cost of gold in the
liquor at the onset revealed that the gold liquor business is uncompetitive and using price as a
market penetration strategy in the absence pre-existing buyer supplier contractual agreements, this
business will fail. There will never be room for predatory pricing to protect this untapped niche in
the event of emergent competition.
Stellenbosch University https://scholar.sun.ac.za

190
7.3.2. Handling product recovery streams in the process
7.3.2.1. Product recoveries
Revenue derived from the sale of gold and copper based products from the respective recovery
streams was also factored into the economic evaluations. No consideration was however made of
the potential revenue associated with other by-products that included: liquor streams from the
solder leaching and nitric acid wash circuits and the dewatered solids exiting the gold extraction
plant.
The recoveries of the target metals in each of the business models were evaluated from the
material balances using the process considerations discussed in chapter 4. Product tracing was
also done to account for the movement of the target metals for each of the business models. The
detailed production volumes of the output streams is detailed in appendix F, Tables F.3 to F.6.
The recoveries for the copper metal as LME grade A cathodes and gold sludge of at least 98%
purity in the main process were lower than the recoveries associated with the liquors respectively.
The movement of the target metals in the process was analysed and the distribution of the metals
in the process for each of the metals was found to be associated with tailings stream, scavenging
and final product recovered for sale. The tracing of the target metals for each of the business
models is summarized in appendix F, Tables F.17 and F.18. A plot of the distribution of the copper
metal throughout the process of each of the business models is depicted in Figure 7.15.
Figure 7.15: Accounting for the distribution of copper metal in each of the business models 3a to 4d
A plot of the distribution of the gold metal throughout the process of each of the business model is
depicted in Figure 7.16. To improve the recoveries of both copper and gold in each of the business
models the streams reporting to tailings and recycle were also directed to scavenging cells. The
handling of the recovery streams is covered in detail in the sections to follow.
Stellenbosch University https://scholar.sun.ac.za

191
Figure 7.16: Accounting for the distribution of gold metal in each of the business models 3a to 4d
7.3.2.2. Handling copper recovery streams
Copper liquor business
Copper in the form of copper sulphate reporting to tailings in the copper liquor business was not
recovered as impound liquor. The tailings stream was found to contain high concentrations of lead,
iron and nickel which would compromise the process efficiencies and final product qualities (see
Table 6.4).
Copper cathode business
EMEW technology can be used to recover copper from solutions with copper concentrations low as
1g/L. Industrial experience with EMEW cell technology has shown that this technology is capable
of producing LME grade A copper cathode or powder (Roux et al., 2007). Based on the previous
studies the copper concentrations in the liquor reporting to the scavenging circuit were expected to
range between 20g/L and 35g/L (de Waal, 2018). Copper that reported to the scavenging circuit
was recovered using EMEW cell technology depicted in the copper flow diagram (refer to appendix
D, Figure D.4). In this study it was assumed that copper cathode plates were harvested from the
electrowinning of this copper liquor stream in the copper solids business.
7.3.2.3. Handling gold recovery streams
Gold liquor business
Gold that was in the entrained moisture (as sodium aurocyanide) contained in the dewatered filter
cake exiting the leaching circuit was assumed to have been recovered as a dilute solution after
sluicing with water.
Stellenbosch University https://scholar.sun.ac.za

192
The weak sodium aurocyanide solution recovered was then directed back into the process as
impound liquor thus enabling the recovery of the gold. In this study it was assumed that all the gold
in the impound liquor was recovered. The recoveries of gold as sodium aurocyanide resulting from
impound liquor generation and usage was applicable to the business models producing gold liquor
as the final product for sale.
Gold solids business
RenoCell electrowinning technology is capable of achieving the recovery of precious metals from
feed solutions containing metal concentrations as low as 1ppm (Renovare, 2011). The technology
is useful for polishing tailings and effluent streams. In the gold solids business the gold was
recovered from the impound liquor and the spent electrolyte. The spent electrolyte contained
2.61ppm of sodium aurocyanide (equivalent to 1.89ppm of pure gold) (Refer to mass the balances
in appendix A, Table A.4). The two streams were blended and directed to the scavenging circuit
that made use of RenoCell electrowinning technology as indicated in the gold flow diagram (Refer
to appendix D, Figure D.9). It was assumed that gold sludge was recovered.
7.3.3. Revenue distributions
The comparison of the different revenue contributions on a product basis for each of the business
models is depicted in Figure 7.17. The significant business units in each business model as
depicted in the graphical plot are associated with gold related products. The performance of each
of the models depends strongly on the success of the gold production, efficiency and recovery of
gold and plant capacity utilization. The degree of sensitivity to the aforementioned factors was
analysed in detail in the next chapter.
Figure 7.17: Gross revenue contributions from each of the business models
Stellenbosch University https://scholar.sun.ac.za

193
Table 7.7 Summarizes the revenue contributions associated with the gold business in each of the
models.
Table 7.7: Contribution of gold revenues
Business model 4a 4b 4c 4d
Gold revenues contribution (%)
89.08 86.96 89.20 86.83
Business models associated with the production and sale of the gold and copper based products in
the metallic state were associated with higher revenues. The observed trend in order of decreasing
revenues for both the copper and gold businesses was shown as follows 4a > 4c > 4d > 4d. On the
basis of revenue realisation, the production of gold in the metallic state, associated with business
models 4a and 4c was the more lucrative option as opposed to the production of gold liquor.
Similar remarks can be made regarding the copper business.
7.3.4. Evaluating economic efficiency of each business model
The analysis of WPCBs used in this study is summarized in Table 7.8 below.
Table 7.8: Analysis of WPCBs (adapted from Shuey & Taylor, 2004; Lydall et al., 2017). The gold
content was adjusted to 250ppm in this study
Metal price US$/tonne Metal value Composition Intrinsic value US$
5 890.00 Cu 20.00% 1178.00
2 170.00 Al 2.00% 43.40
700.00 Fe 8.00% 56.00
20 950.00 Sn 4.00% 838.00
12 419.96 Ni 2.00% 248.40
2 638.05 Zn 1.00% 26.38
2 580.00 Pb 2.00% 51.60
Mn 0.00% 0.00
Sb 0.00% 0.00
38 104 430.00 Au 0.03% 9526.11
475 510.00 Ag 0.20% 951.02
30 237 780.00 Pd 0.01% 1511.89
The evaluation of the monetary value associated with the metals contained in the WPCBs was
done and the results plotted in Figure 7.18.
Stellenbosch University https://scholar.sun.ac.za

194
Figure 7.18: Value of metals in WPCBs (adapted from Shuey & Taylor, 2004; Lydall et al., 2017). The
gold content was adjusted to 250ppm for this study
Based on the plot in Figure 7.18 gold was the major revenue contributor accounting for 66% of the
potential revenue realisable from metal sales in WPCBs. Potential revenue from copper sales
accounted for an estimated 8%. A combination of sales from palladium, tin and silver revealed that
gross turnover from these metals would account for approximately 23% of the potential revenue
realisable from metals in WPCBs. Based on these observations the scope for the recovery of pure
palladium, tin and silver was considered in the study. The impact on the viability of the business
models of recovering palladium, silver and tin was discussed in section 7.4.3. An analysis of the
economic efficiencies of the business models was undertaken. The overall economic efficiencies
associated with each key revenue base were determined by working out the gross turnovers from
copper and gold products as a percentage of the maximum realisable revenue of the combined
metal sales in WPCBs. The economic copper and gold business efficiencies were calculated by
expressing the realised revenues from the sales of the respective metal products as a percentage
of the total realisable value of the respective target metal contained in the WPCBs. The results are
summarized in Tables 7.9 to 7.11.
Table 7.9: Analysis of the economic efficiency of the copper and gold businesses
Overall metals efficiencies
Business models
Maximum revenue from all metals in
WPCB Actual revenues
(US$/year) Overall business
efficiency (%)
3a & 4a 6 601 251 4 836 231 73.26%
3b & 4b 6 601 251 4 001 948 60.62%
3c & 4c 6 601 251 4 829 960 73.17%
3d & 4d 6 601 251 4 008219 60.72%
Stellenbosch University https://scholar.sun.ac.za
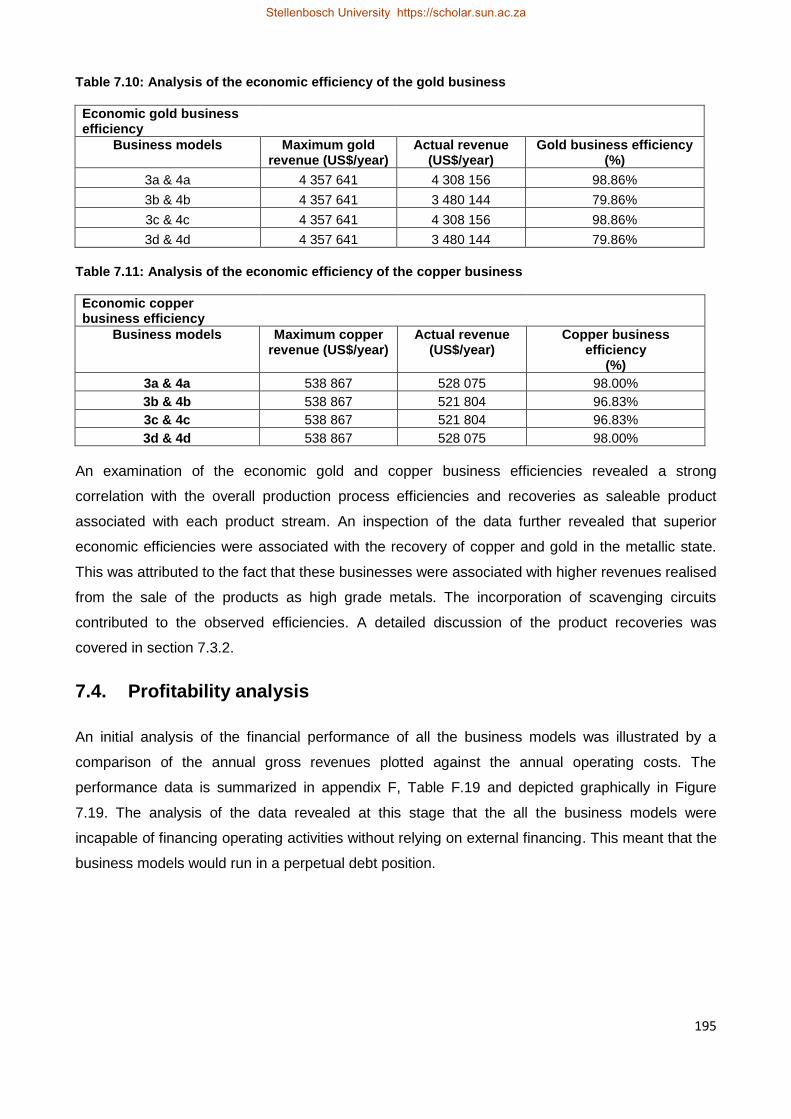
195
Table 7.10: Analysis of the economic efficiency of the gold business
Economic gold business efficiency
Business models
Maximum gold revenue (US$/year)
Actual revenue (US$/year)
Gold business efficiency (%)
3a & 4a 4 357 641 4 308 156 98.86%
3b & 4b 4 357 641 3 480 144 79.86%
3c & 4c 4 357 641 4 308 156 98.86%
3d & 4d 4 357 641 3 480 144 79.86%
Table 7.11: Analysis of the economic efficiency of the copper business
Economic copper business efficiency
Business models
Maximum copper revenue (US$/year)
Actual revenue (US$/year)
Copper business efficiency
(%) 3a & 4a 538 867 528 075 98.00%
3b & 4b 538 867 521 804 96.83%
3c & 4c 538 867 521 804 96.83%
3d & 4d 538 867 528 075 98.00%
An examination of the economic gold and copper business efficiencies revealed a strong
correlation with the overall production process efficiencies and recoveries as saleable product
associated with each product stream. An inspection of the data further revealed that superior
economic efficiencies were associated with the recovery of copper and gold in the metallic state.
This was attributed to the fact that these businesses were associated with higher revenues realised
from the sale of the products as high grade metals. The incorporation of scavenging circuits
contributed to the observed efficiencies. A detailed discussion of the product recoveries was
covered in section 7.3.2.
7.4. Profitability analysis
An initial analysis of the financial performance of all the business models was illustrated by a
comparison of the annual gross revenues plotted against the annual operating costs. The
performance data is summarized in appendix F, Table F.19 and depicted graphically in Figure
7.19. The analysis of the data revealed at this stage that the all the business models were
incapable of financing operating activities without relying on external financing. This meant that the
business models would run in a perpetual debt position.
Stellenbosch University https://scholar.sun.ac.za
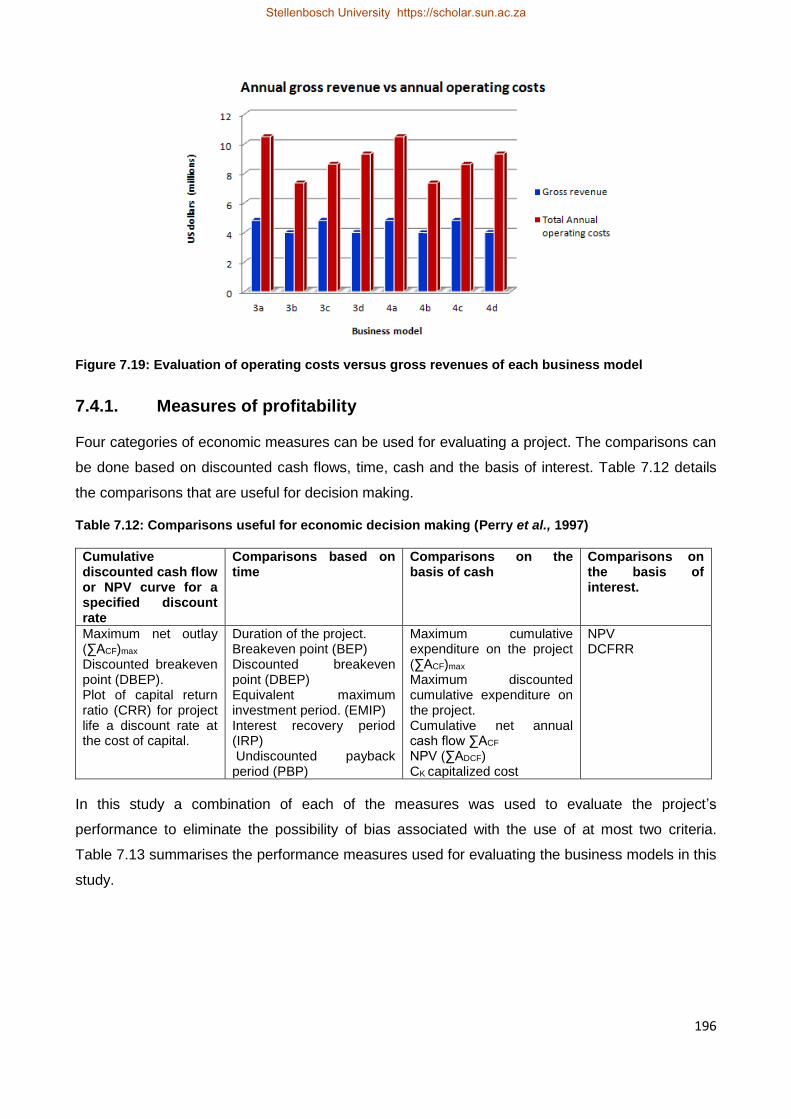
196
Figure 7.19: Evaluation of operating costs versus gross revenues of each business model
7.4.1. Measures of profitability
Four categories of economic measures can be used for evaluating a project. The comparisons can
be done based on discounted cash flows, time, cash and the basis of interest. Table 7.12 details
the comparisons that are useful for decision making.
Table 7.12: Comparisons useful for economic decision making (Perry et al., 1997)
Cumulative discounted cash flow or NPV curve for a specified discount rate
Comparisons based on time
Comparisons on the basis of cash
Comparisons on the basis of interest.
Maximum net outlay (∑ACF)max
Discounted breakeven point (DBEP). Plot of capital return ratio (CRR) for project life a discount rate at the cost of capital.
Duration of the project. Breakeven point (BEP) Discounted breakeven point (DBEP) Equivalent maximum investment period. (EMIP) Interest recovery period (IRP) Undiscounted payback period (PBP)
Maximum cumulative expenditure on the project (∑ACF)max Maximum discounted cumulative expenditure on the project. Cumulative net annual cash flow ∑ACF NPV (∑ADCF) CK capitalized cost
NPV DCFRR
In this study a combination of each of the measures was used to evaluate the project’s
performance to eliminate the possibility of bias associated with the use of at most two criteria.
Table 7.13 summarises the performance measures used for evaluating the business models in this
study.
Stellenbosch University https://scholar.sun.ac.za

197
226
Table 7.13: Summary of the definitions applied for the study evaluating projects (Perry et al., 1997)
Measure Application Calculation Key performance indicator used in the study
Discounted payback period
It is a measure of the time it takes for cash flows to recoup the original fixed capital expenditure. The earlier the capital is recovered the better the project is.
On a graphical plot it is the time period at which annual cash flows are equal to the depreciable fixed capital investment. ∑ACF = CFC-S Where S is the scrap value.
< 4 years. The shortest time frame.
DCFRR The investor’s true rate of return The interest rate yielding an NPV of 0 at the end of the project life.
The highest interest rate when compared with other projects being evaluated.
DCFRRmax The maximum attainable rate of return for an infinite project life.
1/DPBP The highest interest rate when compared with other projects being evaluated.
Net present value
Measures the actual profitability when the time value of money is taken into account. It is the sum of discounted cash flows for the life of the project.
NPV = ∑ADCF for life n years Target an NPV> 0. The highest NPV.
Discounted breakeven point DBEP
Measure of the time it takes for the project to move from the capital risk zone to a point on the curve where y = 0.
Determined from a plot of ∑ADCF against time for the life of the project in years
< 4 years. The shortest time period.
CRR Plot of capital rate of return ratio for the life of the project for a discount rate at the cost of capital.
CRR = (NPV)/(∑ACF)max for ACF < or = 0 Plots with the steepest gradient.
EMIP Equivalent maximum investment period is the time frame during which the project debt would be outstanding if it were all incurred in one instant and all repaid in one instant. The shorter the EMIP the more attractive the project.
EMIP = area under the capital risk zone/(∑ACF)max for ACF < 0.
The smallest area under the capital risk zone.
IRP Interest recovery period On a plot of the graph of cumulative undiscounted cash flows against time yields a portion of the curve above ACF = 0. The time period that results in the area above ACF = 0 being equal to the area below ACF = 0 is the IRP.
The shortest time period to cut the y=0 graph.
CK Capitalized cost. This is the amount of capital required to replace any piece of equipment in the project after it breaks down. This should be perpetual.
CK = [CF – (S/(1+i)n)] x [(1+i)n/((1+i)n - 1)
The least capitalized cost
Stellenbosch University https://scholar.sun.ac.za
Stellenbosch University https://scholar.sun.ac.za

198
The results of the evaluation based on the metrics described in Table 7.13 are summarized in
Tables 7.14 and 7.15 for the group 3 and 4 business models respectively.
Table 7.14: Performance evaluation of group 3 business models
Models 3a 3b 3c 3d
Key products Copper cathode LME grade A Gold sludge >98%
Copper sulphate liquor 3.71% Cu Gold cyanide liquor, 142.52ppm Au
Copper sulphate liquor 3.71% Cu Gold sludge >98%
Copper cathode LME grade A Gold sludge >98% Gold cyanide liquor 142.52ppm Au
NPV -$43 661 431 -$20 805 697 -$29 284 288 -$35 834 822
Capitalized cost $3 078 960 $715 290 $2 129 930 $1 772 789
DCFRR no infl. Unviable Unviable Unviable Unviable
DPBP no infl. Unviable Unviable Unviable Unviable
EMIP
Not done. Unviable. The project debt will remain outstanding.
Not done. Unviable. The project debt will remain outstanding.
Not done. Unviable. The project debt will remain outstanding.
Not done. Unviable. The project debt will remain outstanding.
DCFRR max Unviable Unviable Unviable Unviable
IRP No recovery No recovery No recovery No recovery
CRR Decays in capital risk zone
Decays in capital risk zone
Decays in capital risk zone
Decays in capital risk zone
DBEP Will not break even
Will not break even Will not break even
Will not break even
Table 7.15: Performance evaluation of group 4 business models
Models 4a 4b 4c 4d
Key products Copper cathode LME grade A Gold sludge >98%
Copper sulphate liquor 3.71% Cu Gold cyanide liquor , 142.52ppm Au
Copper sulphate liquor 3.71% Cu Gold sludge >98%
Copper cathode LME grade A Gold sludge >98% Gold cyanide liquor 142.52ppm Au
NPV -$43 472 752 -$20 614 882 -$28 990 635 -$35 644 029
Capitalized cost $3 037 995 $674 325 $1 984 806 $1 731 824
DCFRR no infl. Unviable Unviable Unviable Unviable
DPBP no infl. Unviable Unviable Unviable Unviable
EMIP
Not done. Unviable. The project debt will remain outstanding.
Not done. Unviable. The project debt will remain outstanding.
Not done. Unviable. The project debt will remain outstanding.
Not done. Unviable. The project debt will remain outstanding.
DCFRR max Unviable Unviable Unviable Unviable
IRP No recovery No recovery No recovery No recovery
CRR Decays in capital risk zone
Decays in capital risk zone
Decays in capital risk zone
Decays in capital risk zone
DBEP Will not break even Will not break even Will not break even
Will not break even
Stellenbosch University https://scholar.sun.ac.za

199
Net present value
The analysis of the profitability assessments for the group 3 and 4 business models based on the
net present value (NPV) indicates that all the business models associated with the project are
unviable. Business models 3a and 4a with the highest capitalization costs showed the worst
performance. Business models 3d and 4d showed an improvement of just below 19% when
compared to business models 3a and 4a. This observed behaviour was due to the comparatively
lower annual operating costs and lower capital investment associated with business models 3d and
4d.
The superior performance of business model 3c and 4c compared to business models 3a and 4a
was attributed to the effect of high gross revenues associated with solid gold sales and the
comparatively lower initial capital outlay and operating costs discussed in sections 7.1 and 7.2. The
gross revenues of business model 3c and 4c surpassed those of models 3d and 4d allowing them
to perform better as a result. Business models 3b and 4b had the lowest initial capital outlay and
operating costs. As a result these models had the highest NPV values in comparison to the
aforementioned models.
Capitalization costs
The business models were compared using the total capitalization costs. In this case it was
desirable to have the lowest capitalization cost. The lowest capitalization costs were associated
with the business models that produced the solutions of the intermediate metal salts as the final
products, in this case business models 3b and 4b. The business models 3a and 4a had the highest
capitalization costs because of the higher capital investment associated with these models.
Discounted cash flow rate of return
The performance of the business models based on the discounted cash flow rate of return
revealed that none of the business models associated with the proposed process would realise a
positive return on the capital invested. The plots of the cumulative discounted cash flows for each
of the business models are illustrated in Figure 7.20.
Stellenbosch University https://scholar.sun.ac.za

200
Figure 7.20: Comparison of discounted cumulative cash flows for each of the models (3a-4d)
None of the curves of the business models, 3a to 4d, moved out of the capital risk zone, that is, the
region below y=0 or ∑ADCF = 0. All the curves continued to decay throughout the life of the project
indicating an increased debt position as the years progressed. Business models 3a and 4a
displayed the most significant risk to capital invested as indicated by the greatest area in the
capital risk zone.
Discounted payback period
Scanning the shape of all the cumulative discounted cash flow curves of each business model, it is
clear that none of the business models will ever break even for the duration of the project life. It
can be seen that when running the project using any of the business models, the project is
incapable of paying back the capital invested.
Investor’s true rate of return DCFRRmax
The calculation of the investors’ rate of return could not be done for any of the business models
since all the business models were found to be incapable of paying back the capital invested.
Based on the results in Tables 7.14 and 7.15 no gain will be realised from this from project under
the specified operating conditions. The same will hold true in the case when the business is run
with an infinite project life. The curves displayed in Figure 7.20 will maintain the trend of decay for
an infinite number of operating years.
Equivalent maximum investment period
The curves in Figure 7.20 remained in the capital risk zone. There is no point at which any of the
curves in Figure 7.20 shifted into the capital risk free region.
Stellenbosch University https://scholar.sun.ac.za

201
Based on the shape of the curves, should all the capital invested be due in a single instant, none of
the business models under the conditions of operation were capable of repaying the capital at any
stage of the project.
Interest recovery period
Plots of the cumulative undiscounted cash flows against time were done for each of the business
models and are depicted in Figure 7.21. On a plot of the graph of cumulative undiscounted cash
flows against time yields a portion of the curve above ∑ACF = 0. The time period that results in the
area above ∑ACF = 0 being equal to the area below ∑ACF = 0 is the interest recovery period (IRP).
Figure 7.21: Plots of interest recovery period (IRP) against time for each of the models (3a-4d)
In the case of the business models under study, the plots of IRP against time for the entire duration
of the project showed that the curves continued to decay. There was no point of inflection leading
to the possibility of any of the curves crossing into the capital risk free region. This behaviour was
strongly indicative of the fact that none of the business models at the current concentration of gold
of 250ppm in the WPCBs feedstock, would at any stage of the project be in a position to recover
the interest on the capital invested. Using the IRP curves as criteria for assessing each business
model, it is advisable not to pursue the project operating with any of the business models.
Capital rate of return ratio
The net present value divided by the maximum initial capital outlay yields the capital rate of return
ratio. When this ratio is used to develop a plot over the life of the project it is desirable to generate
a curve that increases rapidly in the capital risk free region (area above y=0).
Stellenbosch University https://scholar.sun.ac.za

202
Plots of the capital rate of return ratios (CRR) against time were done for each business model as
shown in Figure 7.22. The trend displayed by all the curves displayed a perpetual decay
maintained in the capital risk zone. This observed trend for the business models based on CRR
plots against time was indicative of the fact that no positive returns would be realised for the capital
invested at any stage of the life of the project. This trend supports similar observations made when
plots of IRP were made against time (Figure 7.21).
Figure 7.22: Plots of capital rate of return ratio (CRR) against time for each of the models (3a-4d)
On the basis of the plots of the DCFRR, IRP, CRR and the evaluation of DPBP, EMIP, DCFRRmax,
NPV and capitalized costs, the project operating with any of the business models is unviable. All
the measures used, indicate that investing in the proposed process under the specified operating
conditions will result in a loss of capital that can never be recovered. Further interrogation of the
business models was done to dissect the annual performance of the business models by use of
profitability ratios outlined in section 7.4.2.
7.4.2. Profitability ratios
The performance of the business models was also analysed by making use of additional
profitability ratios. In this study six ratios were used and are summarized in Table 7.16 below:
Stellenbosch University https://scholar.sun.ac.za

203
Table 7.16: Profitability ratios used in the study (Perry et al., 1997)
Ratio Relevance Performance indicator
Net profit margin
Measures the actual amount of money earned for the sales of product made.
>1 the project is performing well NPM = 0. The business is at breakeven
Return on investment
Measures the actual earning power for every dollar invested into the project.
>1 the project is performing well. A greater ratio is desirable.
Capital ratio Measures the extent to which sales are generated from the fixed capital invested. Computationally worked as CFC/As.
0< x < 1. A smaller ratio when comparing different projects or operating configurations is desirable. CR < industrial target.
Capital rate of return ratio (CRRterm) (end of project life)
Provides a measure of the monetary gain in the capital invested into the project.
CRRterm< 0 project is unviable, reject. CRRterm = 1, consider alternative and more profitable options. Project is capable of recovering invested capital and repaying interest. CRRterm> 0 Project is viable
Fixed asset turnover ratio
This ratio provides a measure of the operating performance and effectiveness in utilizing fixed assets to generate revenue.
>1. A greater ratio when comparing different projects or operating configurations is desirable. CR > industrial or set target.
Present value ratio
It is useful for measuring the economic relevance of a project.
PVR> 1 economically satisfactory PVR = 0 economic breakeven of project PVR< 0 economically unsound
The analysis of the business models based on these ratios was undertaken and the results are
summarized in Tables 7.17 and 7.18 below.
Table 7.17: Analysis of the performance of group 3 business models using profitability ratios
Business models 3a 3b 3c 3d
Net profit margin (NPM) -78.21% -58.78% -52.70% -91.36%
Return on investment (ROI) -0.23 -0.60 -0.23 -0.38
Capital ratio (CR) 2.21 0.63 1.46 1.54
Fixed asset turnover ratio (FATR)
0.45 1.58 0.68 0.65
Terminal capital rate of return ratio (CRRterm)
-2.63 -5.31 -2.64 -3.74
Present value ratio (PVR) -1 -1 -1 -1
Table 7.18: Analysis of the performance of group 4 business models using profitability ratios
Business models 4a 4b 4c 4d
Net profit margin (NPM) -78.26% -58.82% -52.74% -91.41%
Return on investment (ROI) -0.23 -0.67 -0.26 -0.41
Capital ratio (CR) 2.18 0.60 1.43 1.50
Fixed asset turnover ratio (FATR)
0.46 1.67 0.70 0.67
Terminal capital rate of return ratio (CRRterm)
-2.65 -5.55 -2.69 -3.80
Present value ratio (PVR) -1 -1 -1 -1
Stellenbosch University https://scholar.sun.ac.za

204
Capital ratios (CR) and fixed asset turnover ratios (FATRs) of a concern must be compared against
set targets within the industry. For this particular process however, no industrial targets were
available for benchmarking the performance of the models. In this study the benchmarks were
derived using the result of the sensitivity analysis performed around the concentration of gold in the
WPCBs (see section 8.4.8). The results of the benchmarking the capital ratios and fixed asset
turnover ratios are summarized in Table 7.19.
Table 7.19: Benchmarking capital ratios, FATRs and minimum performance of each business model
Business model
Minimum gold content
Minimum target sales per year Target CR Target FATR
3a 875ppm 15606621 0.68 1.46
3b 563ppm 8 359 089 0.30 3.31
3c 625ppm 11 292 194 0.62 1.60
3d 925ppm 13 404 608 0.46 2.18
4a 875ppm 15 606 621 0.67 1.48
4b 563ppm 8 359 089 0.29 3.49
4c 625ppm 11 292 194 0.61 1.63
4d 925ppm 13 404 608 0.45 2.23
The target minimum gold content in each business model used to evaluate the minimum sales
required in each business model. The minimum sales value was then used in calculating industrial
target ratios for both the CR and FATR against which each of the business models were
compared.
Stellenbosch University https://scholar.sun.ac.za

205
Table 7.20: Summary of the results of the analysis of annual business performance of the group 3 business models
Business model and ratio
Net profit margin (NPM)
Return on investment (ROI)
Capital ratio (CR)
Fixed asset turnover ratio (FATR)
Terminal capital return ratio (CRRterm)
Present value ratio (PVR)
3a The NPM is less than 1. This business model will run at an annual loss.
The return on investment is negative. This business model will run in an annual loss position of US$0.23 for every dollar invested.
CR was greater than the target of 0.68. It was 3.25 times greater than the target. Annual sales in this business model are not sufficient to ensure viability of this business model.
FATR was less than 1 and below the target of .,46 by a margin of 324%. This indicates that the fixed assets were unable to generate revenue sufficient to shift and maintain the business in a profitable position each year under the specified operating conditions.
The CRRterm for this model was less than 1 indicating that the net annual returns during the life the project up to maturity were negative.
The PVR was less than 0. This model is economically unviable and is an unsuitable investment option under the current operating conditions.
3b The NPM is less than 1. This business model will run at an annual loss.
The return on investment is negative. This business model will run in an annual loss position of US$0.60 for every dollar invested.
CR 2.1 times above the set target. Annual sales will not ensure profitability of the business model.
While FATR was greater than 1 however, a comparison against the minimum target revealed that the FATR was 209% below the target. The model is unviable.
The CRRterm for this model was less than 1 indicating that the net annual returns during the life the project up to maturity were negative.
The PVR was less than 0. This model is economically unviable and is an unsuitable investment option under the current operating conditions.
3c The NPM is less than 1. This business model will run at an annual loss.
The return on investment is negative. This business model will run in an annual loss position of US$0.23 for every dollar invested.
CR 2.35 times greater than the target. Business model unviable at this level of sales.
FATR is below the target by a margin of 235%. This model is unviable under the specified operating conditions.
The CRRterm for this model was less than 1 indicating that the net annual returns during the life the project up to maturity were negative.
The PVR was less than 0. This model is economically unviable and is an unsuitable investment option under the current operating conditions.
3d The NPM is less than 1. This business model will run at an annual loss. This business model is the least profitable of the group 3 models.
The return on investment is negative. This business model will run in an annual loss position of US$0.38 for every dollar invested.
CR is greater than 1 and 3.35 times greater than the target. Business model unviable at this level of sales
The business model is 335% below the target. This model is unviable under the specified operating conditions.
The CRRterm for this model was less than 1 indicating that the net annual returns during the life the project up to maturity were negative.
The PVR was less than 0. This model is economically unviable and is an unsuitable investment option under the current operating conditions.
Stellenbosch University https://scholar.sun.ac.za
Stellenbosch University https://scholar.sun.ac.za

206
Table 7.21: Summary of the results of the analysis of annual business performance of the group 4 business models
Business model and ratio
Net profit margin (NPM)
Return on investment (ROI)
Capital ratio (CR)
Fixed asset turnover ratio (FATR)
Terminal capital return ratio (CRRterm)
Present value ratio (PVR)
4a The NPM is less than 1. This business model will run at an annual loss.
The return on investment is negative. This business model will run in an annual loss position of US$0.23 for every dollar invested.
CR is 3.25 times above the target and greater than 1. Annual sales in this model will not guarantee positive returns each year.
This business model is 3.22 times less than the target. The model is unviable under the specified operating conditions.
The CRRterm for this model was less than 1 indicating that the net annual returns during the life the project up to maturity were negative.
The PVR was less than 0. This model is economically unviable and is an unsuitable investment option under the current operating conditions.
4b The NPM is less than 1. This business model will run at an annual loss.
The return on investment is negative. This business model will run in an annual loss position of US$0.67 for every dollar invested.
The capital ratio is 2.07 times above the target of 0.29. The business is unprofitable and uncompetitive at this level of sales.
This business model is 2.09 times less than the target. The model is unviable under the specified operating conditions.
The CRRterm for this model was less than 1 indicating that the net annual returns during the life the project up to maturity were negative.
The PVR was less than 0. This model is economically unviable and is an unsuitable investment option under the current operating conditions.
4c The NPM is less than 1. This business model will run at an annual loss.
The return on investment is negative. This business model will run in an annual loss position of US$0.26 for every dollar invested.
The capital ratio is above the target ratio of 0.61 by a margin of 234%. At the current level of annual sales of the business model is unprofitable.
This business model is 2.33 times less than the target. The model is unviable under the specified operating conditions.
The CRRterm for this model was less than 1 indicating that the net annual returns during the life the project up to maturity were negative.
The PVR was less than 0. This model is economically unviable and is an unsuitable investment option under the current operating conditions.
4d The NPM is less than 1. This business model will run at an annual loss. It is the least profitable of all the models.
The return on investment is negative. This business model will run in an annual loss position of US$0.41 for every dollar invested.
The capital ratio is 3.33 times greater than the set target of 0.45. At the current level of annual sales this business model is unviable.
This business model is 3.33 times less than the target. The model is unviable under the specified operating conditions.
The CRRterm for this model was less than 1 indicating that the net annual returns during the life the project up to maturity were negative.
The PVR was less than 0. This model is economically unviable and is an unsuitable investment option under the current operating conditions.
Stellenbosch University https://scholar.sun.ac.za
Stellenbosch University https://scholar.sun.ac.za

207
Overview of findings of the analysis of profitability ratios
The net profit margins for all the business models were all less than 1. This showed that all the
business models on the basis of the net profit margin were unviable. A comparison of the NPM
ratios revealed that business models 3d and 4d and 3a and 4a that had the lowest profit margins.
This paralleled the observations made when the performance of these business models was
analysed on the basis of the fixed asset turnover ratios (FATR).
An analysis of the CR and FATR values indicated that business models 3b and 4b had the lowest
deviations from the bench mark performance targets detailed in Table 7.19. This indicated that the
aforementioned business models displayed superior performance in comparison to the other
business models in terms of operating performance and utilization of fixed capital in generating
sales. On the basis of the observed CR and FATR values, using high grade WPCBs feedstock this
business models 3b and 4b would be the most desirable investment option to consider.
The return on investment calculated for each of the business models showed a consistent annual
loss position for each of the business models. The worst performance was displayed by business
models 3b and 4b associated with the production of gold and copper liquors. These business
models had the lowest annual sales revenues. Business models associated with the production of
gold in the metallic state performed better.
The capital ratios of all the business models were below the minimum targets indicating that all the
business models were incapable of generating positive returns each year for the life of the project.
The CRRterm and PVRs associated with each business model were all negative. This behaviour
was congruent with the results of the analysis of the performance curves of DCFRR, IRP and CR
in section 7.4.1.
Comparisons of the operating costs of group 3 and 4 business models reveal that the reduction in
the purchase price of crushed WPCBs will result in superior performance of the group 4 models.
The elimination of the size reduction plant in the group 4 business models also resulted in a
reduction in the CAPEX and associated overheads. It is on this basis that the group 3 business
models were eliminated from further study. The group 4 business models were selected for a
detailed sensitivity analysis covered in chapter 8.
7.4.3. Exploring options for improving performance
An evaluation of the additional revenue streams that could be realised from sales of other metals
was undertaken. Based on the analysis of value in the WPCBs used in this study, it was found that
silver, tin and palladium were also relevant contributors to revenue, contributing an estimated 14%
of potential monetary revenue from the sale of these metals.
Stellenbosch University https://scholar.sun.ac.za

208
A mean business efficiency of 70% was used to approximate turnover from the tin, silver and
palladium businesses. No operating costs were allocated and as a result the data obtained
modelled an ideal business scenario that minimized overall annual operating costs for each of the
business models analysed. The objective was to establish the extent to which the loss position
would be contracted when revenues were increased by sales of tin, silver and palladium metals. In
the first scenario the palladium had a composition of 50ppm based on the assays from previous
work (Shuey & Taylor, 2004). The potential gross annual revenues from the sales of tin, silver and
palladium metals are summarized in appendix F Table F.24 and depicted in Figure 7.23.
Figure 7.23: Assessing the impact of increasing revenue from palladium, silver and tin recovery
(scenario 1 Pd 50 ppm)
Based on results of previous investigations in literature studies, a maximum palladium
concentration of 294ppm has been analysed in WPCBs (Ogunniyi & Vermaak, 2009). Using this
concentration as the basis of the second assessment, a similar analysis was undertaken whereby
the palladium concentration in the WPCBs was increased to 294ppm. A mean business efficiency
of 70% was again used to approximate gross turnovers from the tin, silver and palladium
businesses. The costs of recovering the metals were not factored. Figures 7.23 and 7.24 therefore
illustrate the ideal scenarios which are still not lucrative for all the business models understudy. It is
reasonable to expect the magnitude of variance between the gross revenues and overall operating
costs to increase further when the objective of tin, silver and palladium recovery is the metallic
state. An analysis of the CAPEX and OPEX structures of the business models 3a and 4a are
strong indicators that the inclusion of the recovery sections for these additional metals in the
metallic state will be associated with high CAPEX and OPEX budgets. The potential gross annual
revenues from sales of tin, silver and palladium metals are summarized in appendix F, Table F.25.
Stellenbosch University https://scholar.sun.ac.za

209
The results are depicted graphically in Figure 7.24. The additional operating costs related to the
recovery of these metals were not included in the analysis. As a result the data obtained reflected
a best case scenario that again minimized overall annual operating costs for each business model.
Figure 7.24: Assessing the impact of increasing revenue from silver, tin and palladium recovery
(scenario 2 with maximum Pd (294ppm))
In the first scenario, an inspection of the comparative gross turnovers plotted in Figure 7.23 against
the current operating costs of each business model revealed only a marginal improvement in the
performance of each business model. The contribution of the additional revenue from tin, silver and
palladium sales was however unable to shift any of the business models into the profitable
position. The pursuit of further refining the silver, tin and palladium by-product streams is therefore
not an advisable undertaking. The expansion of the operating portfolio of the proposed venture by
installation of separate facilities for the recovery of pure silver, tin and palladium will be
unprofitable.
In the second scenario (Figure 7.24) the increased palladium content in the hypothetical WPCBs
feedstock showed an improvement in the performance of each business model. Business models
3a, 3c, 4a and 4c showed the most benefit from the increased palladium content. The gross
revenues exceeded the annual operating expenses by an average margin of approximately 21%.
The low average margin between the gross revenues and annual operating costs indicates that all
the business models have a strong likelihood of remaining unviable when the additional operating
costs for the recovery of palladium, silver and tin are factored. The additional revenue from the
recovery of these metals at a gold concentration of 250ppm in the WPCB feedstock with a high
palladium content does not improve the performance of the project. The expansion of the operating
portfolio of the proposed venture by installation of separate facilities for the recovery of these
metals will increase the capital risk of each business model.
Stellenbosch University https://scholar.sun.ac.za

210
7.5. Chapter summary
The economic performance of the project was examined in detail in this chapter. It was split into
sections that covered a brief discussion relating to the techniques available for capital cost
estimates, the estimation of the capital expenditure, estimation of operating cost expenditures,
revenue and sales estimation and the analysis of project profitability. All the costs were determined
at full operating capacity, on a fixed budget with the added assumption that all the material
produced was sold.
The study estimate for preliminary project evaluations was used. Capital cost estimates were
calculated for each of the remaining business models 3a to 4d. The highest capital expenditures
were associated with the models 3a and 4a that entailed the recovery of both copper and gold in
the solid state.
The estimation of the operating costs for each section was undertaken. In this section the
distribution of the costs was examined. Major cost drivers in each of the business models were
identified to examine the potential areas for trimming and potentially modifying the process. Similar
to the observations made in the capital cost estimates, the business models associated with the
recovery of the copper and gold in the metallic state had the highest operating expenditures. The
movement of the target metals in the process was also analysed.
The prevailing market prices of gold and copper metals were used in the study. The market price of
copper liquor was used for evaluating the performance of the business models that produced
copper liquor. No reference data was available to compare and benchmark the gold liquor selling
price. A proportion of 80% of the gold content in the liquor was therefore used as the basis for
pricing the gold liquor. An evaluation of the competitiveness of the gold liquor price revealed that
the cost of gold in the liquor exceeded the prevailing market price of gold by a margin of 64%. This
indicated that the gold liquor production cost was high.
Reduction of the cost of gold in the liquor could only be achieved within the scope of the current
process by the reduction of the proportion of the gold charged in the final selling price of the liquor
produced and utilizing crushed WPCBs with a purchase price lower than the transfer price used in
the group 3 business models. Reduction of the gold proportion charged in the liquor however
increased the loss position of the gold liquor business. Indications at the onset showed that the
gold liquor business was uncompetitive. Penetration pricing of the liquor was a weak market entry
strategy. There will never be room for predatory pricing to protect this untapped niche in the event
of emergent competition.
An initial assessment of the performance of each of the business models was done by comparing
the gross revenue to the total operating costs. The graph of these comparisons revealed that the
business models were all unviable at the current gold concentration of 250ppm in the WPCBs.
Stellenbosch University https://scholar.sun.ac.za

211
This initial assessment was reinforced by the results of the profitability analysis. It was established
that all the business models to varying degrees, as reflected by the curves in the recapitalization
risk analysis, CRR, IRP and DCRFF plots, were incapable of repaying the interest on the capital,
repaying the capital invested and continuing operations for the full term of the project.
It was also established that the operating costs were in excess of the gross revenues by margins
ranging between 79% and 133%. These findings were further reinforced by a detailed analysis of
the annual performance ratios associated with each business model. On the basis of these
findings, investing in the proposed process without improvement in the revenues is not advisable.
Against the background of the prevalent raw material supply risk within the South African e-waste
recycling sector, the poor performance was found to be compounded by the strong likelihood of
running below the name plate plant capacity of each business model.
Following the results of the evaluation of the business models it was seen that the performance of
each the models could be improved by reducing the operating costs and increasing the gold
content in the WPCBs. Comparisons of the operating costs of group 3 and 4 business models
showed that the reduction in the purchase price of crushed WPCBs would result in superior
performance of the group 4 models. The elimination of the size reduction plant in the group 4
business models also resulted in a reduction in the CAPEX and associated overheads. It was on
this basis that the group 3 business models were eliminated from further study.
The group 4 business models were selected for the detailed sensitivity analysis to establish the
conditions necessary to shift the performance of the models from the capital risk region into the risk
free region associated with the performance curves. The sensitivity analysis of the group 4
business models was covered in depth in chapter 8.
Stellenbosch University https://scholar.sun.ac.za

212
Chapter 8: SENSITIVITY ANALYSIS
8.1. Sensitivity analysis
Internal and external forces in the concern’s environment affect profitability. The cumulative effect
may enhance or depress the overall profitability and life of the business. Graphical plots were
made to depict the effect of these factors on the profitability of a project. More influential variables
can be combined to examine different scenarios that attempt to simulate a random combination of
events in the economic environment.
8.2. Objectives of the analysis
8.2.1. Selection of the models for the sensitivity analysis
In the chapter 7 all the business models were shown to be unviable. A consideration of the initial
capital invested and plots of CRR, DCFRR and IRP showed that the elimination of the size
reduction plant, associated with the group 4 business models did not result in large variations in
the performance of the models. The performance of the group 4 business models and the group 3
business models was similar. It was observed that the performance of the group 4 models would
surpass the performance of the group 3 business models when the purchase costs of crushed
WPCBs was less than the internal transfer price of crushed WPCBs. It was also shown that one of
the top four cost drivers to operating costs were associated with raw materials, of which WPCBs
were the most significant. The elimination of the size reduction business unit in the entire portfolio
of operations also led to a reduction in the operating and recapitalization costs associated with this
plant. In light of the attendant advantages, the group 4 business models were selected for further
study.
8.2.2. Analysis of group 4 business models
The analysis of the group 4 models was undertaken with the aim of examining the influence of
changes in WPCB gold content, initial capital investment, operating costs, capacity utilization,
changing revenues (due to changing sales, metal prices and recoveries) and WPCB purchase
prices on the performance of the business models.
The study was also undertaken to examine which factors had the most significant influence on the
business models. The findings were necessary to provide further information in order to justify
modifying the operations where necessary, thereby improving the economic performance of the
proposed undertaking.
Stellenbosch University https://scholar.sun.ac.za

213
Thirdly a study of the effect of the gold content in WPCBs enabled an appreciation of the extent to
which the proposed venture operating with any four of the business models was likely to run as a
going concern in light of the features characterizing the South African e-waste recycling landscape.
The data sheets used in plotting the graphs discussed in section 8.4 are included in appendix H.
8.3. Limitations in this study
The detailed economic feasibility and profitability assessments revealed that all the business
models were unviable. The business models 3a to 4d had negative NPV values. It was also shown
in the study that all the business models using WPCBs with an average gold content of 250ppm
were incapable of repaying the invested capital, replacing equipment that reached its useful
service life before the maturity of the project and repaying the interest on the capital. As a result
the calculation of DCFFR and the development of plots of DCFRR against time in the sensitivity
analysis were not possible.
Secondly the effects of changes in tax, inflation and WACC could not be studied. Plots of changes
in these three parameters were distorted by the negative NPV values giving rise to inverted curves
that did not reflect the true performance of the business models under study. The plots of inflation
rapidly tended towards a large negative value.
The effects of tax are not studied further since tax cannot be deducted where there is no income.
As a result only plots showing the degree to which each variable factor under study affected the
NPV over the life of the project were done in this study.
8.4. Findings of the analysis
8.4.1. Changes in total capital invested
The plot in Figure 8.1 examined the influence of the changes in the total capital invested for each
of the group 4 business models. The slope of the curve associated with the business model with
inherently high capital costs and capitalization costs (business model 4a), had steeper gradients
compared to business models 4b, 4c and 4d.
Business model 4b which had the lowest capital outlay, showed the lowest sensitivity to changes in
the initial capital invested. In this regard potentially doubling the name plate operating capacity of
business model 4b would have a lower risk compared to extreme cases like models 4a and 4d. An
evaluation of the potential for each of the models to move out of the risk zone revealed that a
decrease in the initial capital outlay by a margin of 50% would not improve the performance of the
models. All the models remained unviable.
Stellenbosch University https://scholar.sun.ac.za
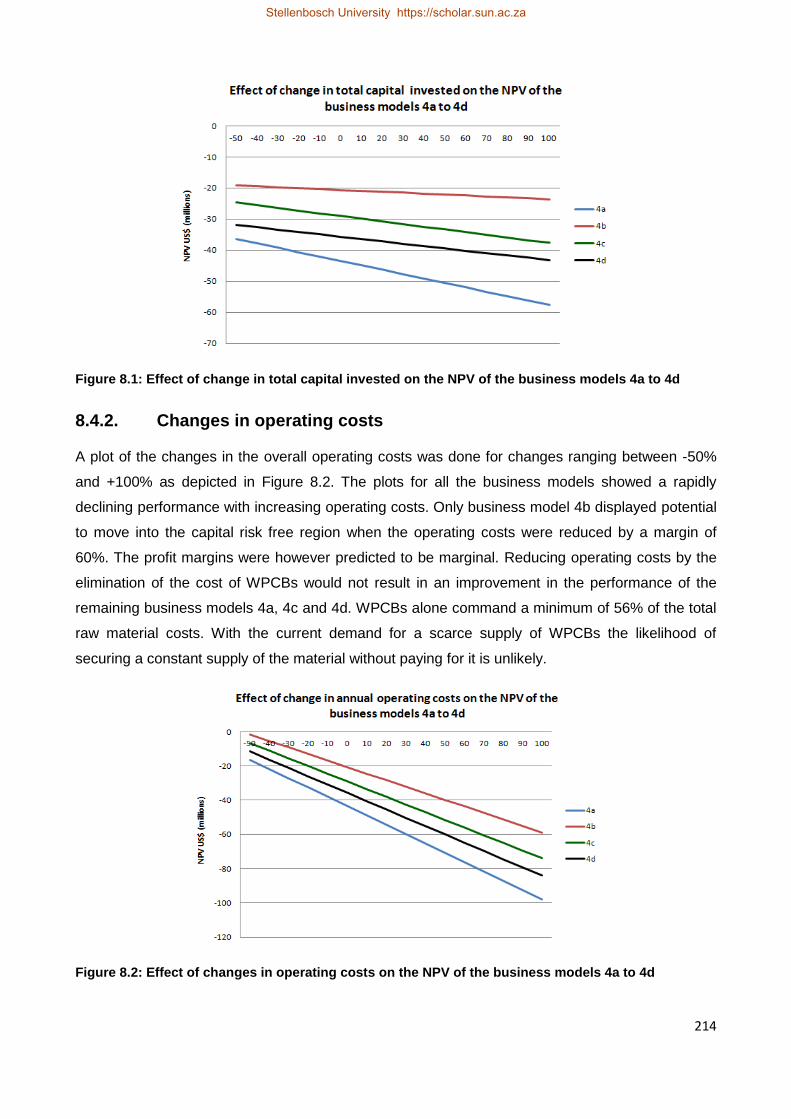
214
Figure 8.1: Effect of change in total capital invested on the NPV of the business models 4a to 4d
8.4.2. Changes in operating costs
A plot of the changes in the overall operating costs was done for changes ranging between -50%
and +100% as depicted in Figure 8.2. The plots for all the business models showed a rapidly
declining performance with increasing operating costs. Only business model 4b displayed potential
to move into the capital risk free region when the operating costs were reduced by a margin of
60%. The profit margins were however predicted to be marginal. Reducing operating costs by the
elimination of the cost of WPCBs would not result in an improvement in the performance of the
remaining business models 4a, 4c and 4d. WPCBs alone command a minimum of 56% of the total
raw material costs. With the current demand for a scarce supply of WPCBs the likelihood of
securing a constant supply of the material without paying for it is unlikely.
Figure 8.2: Effect of changes in operating costs on the NPV of the business models 4a to 4d
Stellenbosch University https://scholar.sun.ac.za

215
In the previous chapter a study of the operating costs revealed that raw material costs and effluent
treatment costs were two of the top four operating cost drivers. The significant raw material cost
driver was associated with WPCB purchase prices. A more intimate analysis within the framework
of changing operating costs was done on the basis of changing effluent and waste treatment costs
and changing WPCB purchase prices.
The effect of changes in WPCB purchase prices was studied for the margin of change ranging
between -100% to +100%. The results of the analysis are depicted by the graphical plot in Figure
8.3. Despite a reduction in WPCB purchase prices by a margin of 100% (acquiring the WPCBS
free of charge), none of the business models were able to move out of the capital risk region. The
slopes of the plots for each business model did however indicate that the performance of the
business models was affected significantly by the changes in WPCB purchase prices.
Figure 8.3: Effect of changes in WPCB purchase prices on the NPV of the business models 4a to 4d
Figure 8.4 displays the effect of the changes in effluent and waste treatment costs ranging
between -50% and +100%. The slopes of each of the business models revealed a similar degree
of sensitivity to changes in effluent and waste treatment costs. Although the effluent and waste
treatment costs were reduced by a 50% margin there was no improvement in the performance of
the business models. All the business models remained in the capital risk region.
Effluent and waste treatment costs constitute an average of approximately 14% of the annual
operating costs for all the business models. The elimination of these costs entirely would not
realise a shift of any of the business models into the capital risk free region, since an equivalent
reduction in overall operating costs due to the elimination of the effluent and waste treatment by a
margin of only 10% would not improve the project performance.
Stellenbosch University https://scholar.sun.ac.za

216
Figure 8.4: Effect of changes in annual effluent treatment costs on the NPV of the business models
4a to 4d
8.4.3. Changes in both CAPEX and OPEX
The simultaneous changes of CAPEX and OPEX were studied and a plot of the effects is depicted
in Figure 8.5. The capitally intensive business models showed the greatest rate of decay in project
performance with increasing operating costs. A reduction in both the initial capital outlay and
annual operating expenses by margins of at least 48% for model 4b, 54% for model 4c and 65%
for both models 4a and 4d was necessary to improve the performance of the project. The observed
findings qualify the need to modify the proposed process in a manner that reduces the operating
steps and hence the initial capital outlay and annual operating expenditures. Alternatively, the
entire process can be rejected and another process with CAPEX and OPEX budgets within the
neighboured of the margins depicted in Figure 8.5 can be designed.
Figure 8.5: The effect of changes in both CAPEX and OPEX on NPV of the business models
Stellenbosch University https://scholar.sun.ac.za

217
8.4.4. Changes in copper revenues
Changes in copper product based revenues were attributed to one or more of the following factors:
the movement in the copper metal prices, changes in copper sales volumes or the changes in
copper recoveries in the process.
Figure 8.6: Effect of changes in copper prices on the NPV of the business models 4a to 4d
Figure 8.7: Effect of changes in copper product sales on the NPV of the business models 4a to 4d
Stellenbosch University https://scholar.sun.ac.za
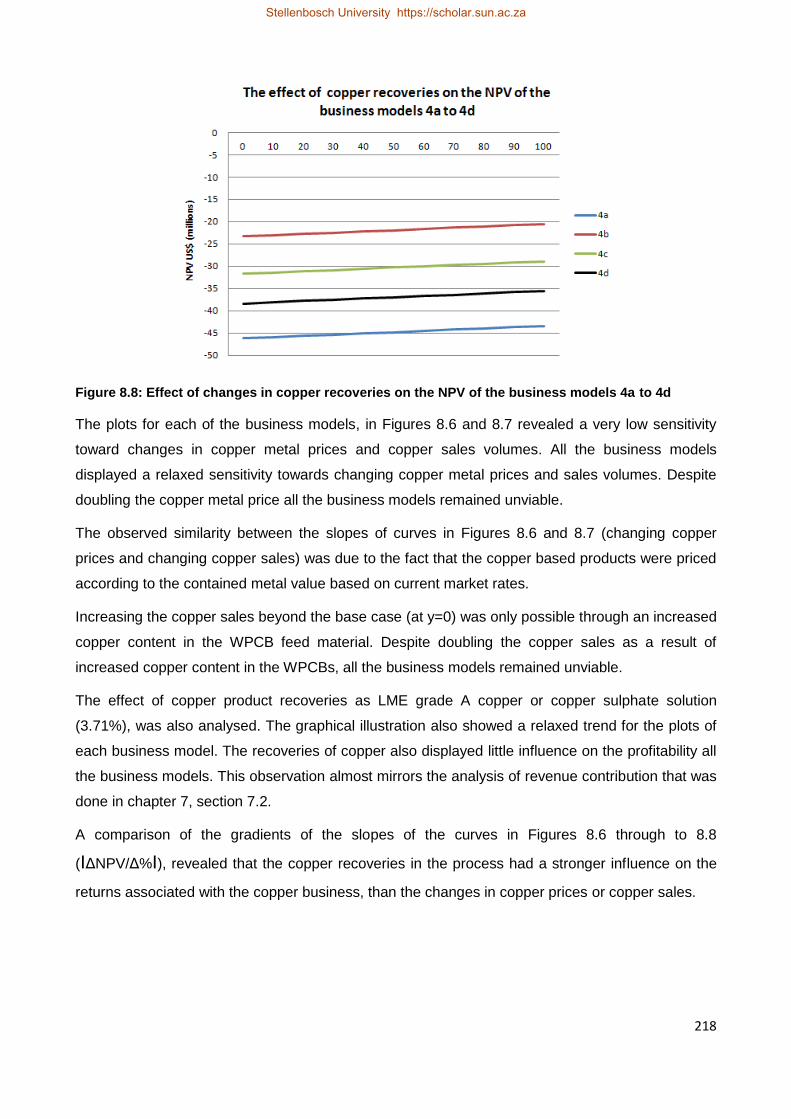
218
Figure 8.8: Effect of changes in copper recoveries on the NPV of the business models 4a to 4d
The plots for each of the business models, in Figures 8.6 and 8.7 revealed a very low sensitivity
toward changes in copper metal prices and copper sales volumes. All the business models
displayed a relaxed sensitivity towards changing copper metal prices and sales volumes. Despite
doubling the copper metal price all the business models remained unviable.
The observed similarity between the slopes of curves in Figures 8.6 and 8.7 (changing copper
prices and changing copper sales) was due to the fact that the copper based products were priced
according to the contained metal value based on current market rates.
Increasing the copper sales beyond the base case (at y=0) was only possible through an increased
copper content in the WPCB feed material. Despite doubling the copper sales as a result of
increased copper content in the WPCBs, all the business models remained unviable.
The effect of copper product recoveries as LME grade A copper or copper sulphate solution
(3.71%), was also analysed. The graphical illustration also showed a relaxed trend for the plots of
each business model. The recoveries of copper also displayed little influence on the profitability all
the business models. This observation almost mirrors the analysis of revenue contribution that was
done in chapter 7, section 7.2.
A comparison of the gradients of the slopes of the curves in Figures 8.6 through to 8.8
(IΔNPV/Δ%I), revealed that the copper recoveries in the process had a stronger influence on the
returns associated with the copper business, than the changes in copper prices or copper sales.
Stellenbosch University https://scholar.sun.ac.za
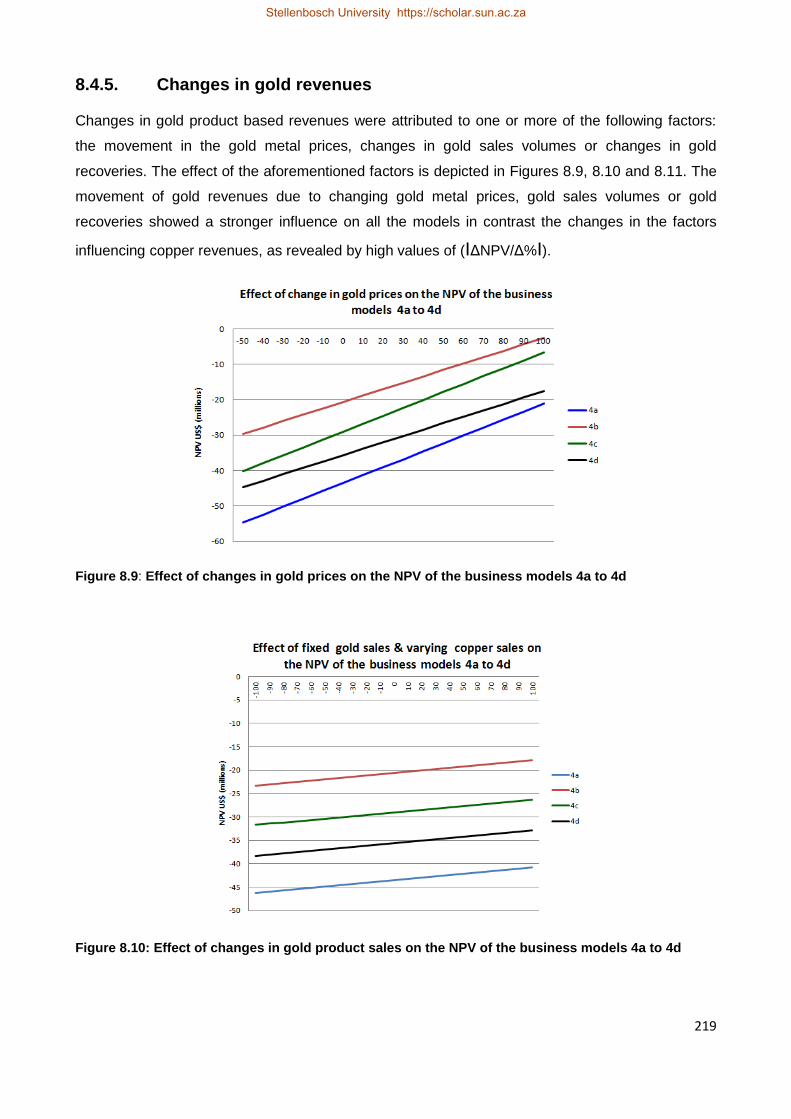
219
8.4.5. Changes in gold revenues
Changes in gold product based revenues were attributed to one or more of the following factors:
the movement in the gold metal prices, changes in gold sales volumes or changes in gold
recoveries. The effect of the aforementioned factors is depicted in Figures 8.9, 8.10 and 8.11. The
movement of gold revenues due to changing gold metal prices, gold sales volumes or gold
recoveries showed a stronger influence on all the models in contrast the changes in the factors
influencing copper revenues, as revealed by high values of (IΔNPV/Δ%I).
Figure 8.9: Effect of changes in gold prices on the NPV of the business models 4a to 4d
Figure 8.10: Effect of changes in gold product sales on the NPV of the business models 4a to 4d
Stellenbosch University https://scholar.sun.ac.za

220
Figure 8.11: Effect of changes in gold recoveries on the NPV of the business models 4a to 4d
Business models 4a and 4c displayed the greatest sensitivity to changing gold prices, gold sales
volumes and gold recoveries. An all time high on the gold prices of US$67.65/g (Infomine, 2017)
equivalent to a change of 60% depicted by the graph in Figure 8.9, did not register an improvement
in the performance of any of the business models.
Business model 4a with the highest initial capital outlay and annual operating costs remained the
most unviable business model. The performance of all the business models was in the negative at
the base case scenario (0% change). Increasing sales beyond the base case meant that there
would have to be an increase in the gold content in the WPCBs feedstock.
Increasing revenue based on gold based product sales volumes beyond the base case implied that
the initial WPCB stock would need to have a gold content greater than 250ppm.
A doubling of the revenue from sales translated to an equivalent gold concentration in the WPCBs
feedstock of 500ppm. At this concentration however, all the business models remained unviable.
A further interrogation of the effect of gold content in the WPCBs was therefore covered in section
8.4.8.
8.4.6. Changes in gold and copper product revenues
The changes in revenues from both copper and gold based products were attributed one or more
of the following: the movement in the metal prices, the changes in the total product sales volumes
and changes in the copper and gold recoveries. The changes in revenues from changing metal
prices, changes in copper and gold product sales and changing recoveries are shown in Figures
8.12, 8.13 and 8.14. The slopes of each of the business models in Figures 8.12 and 8.13 were
congruent.
Stellenbosch University https://scholar.sun.ac.za
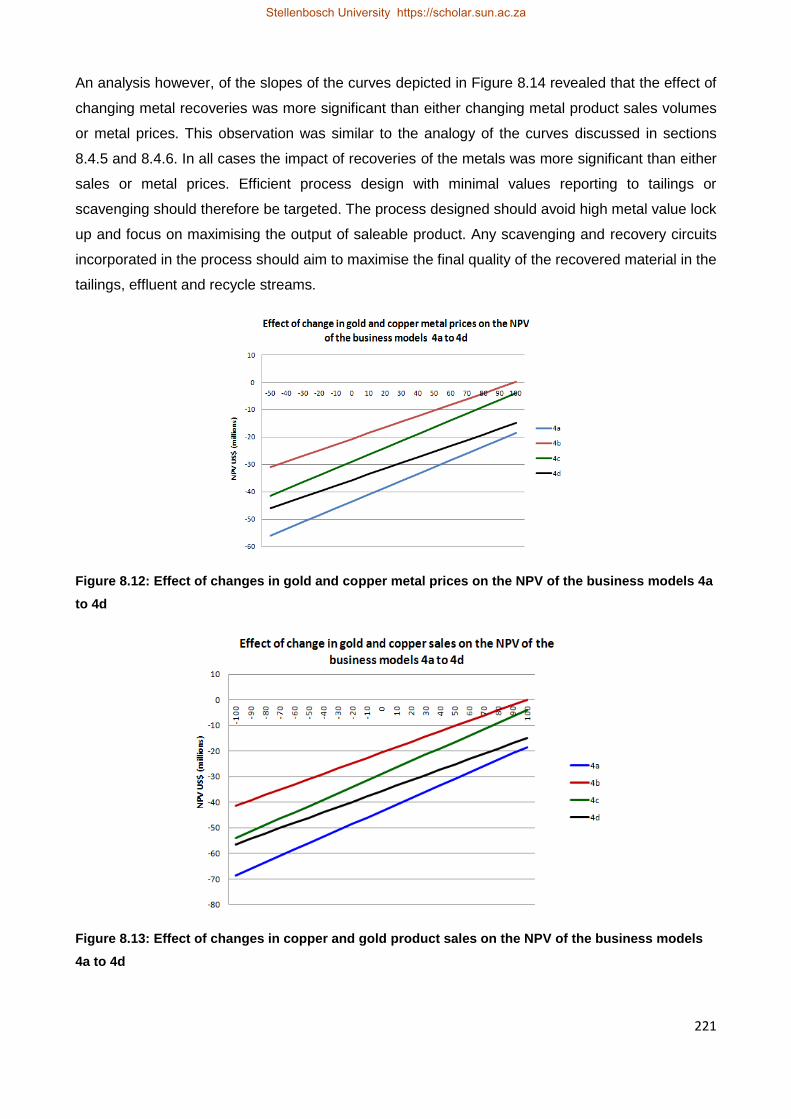
221
An analysis however, of the slopes of the curves depicted in Figure 8.14 revealed that the effect of
changing metal recoveries was more significant than either changing metal product sales volumes
or metal prices. This observation was similar to the analogy of the curves discussed in sections
8.4.5 and 8.4.6. In all cases the impact of recoveries of the metals was more significant than either
sales or metal prices. Efficient process design with minimal values reporting to tailings or
scavenging should therefore be targeted. The process designed should avoid high metal value lock
up and focus on maximising the output of saleable product. Any scavenging and recovery circuits
incorporated in the process should aim to maximise the final quality of the recovered material in the
tailings, effluent and recycle streams.
Figure 8.12: Effect of changes in gold and copper metal prices on the NPV of the business models 4a
to 4d
Figure 8.13: Effect of changes in copper and gold product sales on the NPV of the business models
4a to 4d
Stellenbosch University https://scholar.sun.ac.za

222
Figure 8.14: The effect of changes in copper and gold recoveries on the NPV of the business models
Comparing the plots of the changes in revenue from gold based product to the plots of changes in
the revenue from both copper and gold based products showed that the impact of the revenues
from the copper business was not as significant as that of the gold business. The plots in Figures
8.12, 8.13 and 8.14 are shifted up marginally.
The similarity of the plots discussed in section 8.4.6 and Figures 8.12, 8.13 and 8.14 showed that
the performance of the business models is strongly dependent on the success of the gold
business.
The focal point of process improvement and upgrading should therefore be directed to the
significant revenue driver, the gold business. This observation agrees with findings of the analysis
of revenue contribution from gold products that was done in section 7.2. The average contribution
of gold revenues to the combined metal product gross revenues in all the business models
averaged over 88%.
8.4.7. Changes in capacity utilization
The effect of changing capacity utilization on the performance of the business models was
analysed and the results are depicted in Figure 8.15.
Stellenbosch University https://scholar.sun.ac.za

223
Figure 8.15: Effect of changes in capacity utilization on the NPV of the business models 4a to 4d
The activity based costing method was applied in the project costing done in chapter 7. The effect
of this accounting method meant that the operating costs showed a direct proportional change to
changes in capacity utilization. As the capacity utilization increased the overall project profitability
decreased. This decrease was due to the overshadowing effects of the steep operating costs
associated with each business model. Revenues realised could not outweigh the effects of annual
operating costs as discussed in section 7.2.
8.4.8. Changes in gold content in WPCBs
An analysis of the influence of changing gold content in the WPCBs was undertaken. The base
case in this study was a gold composition of 250ppm in the WPCBs, which is associated with
medium grade WPCBs. The upper concentration studied was 1000ppm which corresponds to the
highest WPCB grade. The purchase prices of the WPCBs were adjusted in this sensitivity study
based on the gold content as reported in literature (Hagelüken, 2006; Lydall et al. 2017).
The results of the analysis are summarized in Table 8.1 which shows the effect on the NPV of
each business model as the gold content increased. These results were illustrated graphically in
Figure 8.16.
Table 8.1: NPV of the business models as gold content changes (US$)
Sensitivity of models to changes in gold content
NPV (US$)
Gold content (ppm) 4a 4b 4c 4d
250 -43 472 752 -20 614 882 -28 990 635 -35 644 029
500 -22 665 062 -3 625 881 -8 182 946 -18 606 483
750 -7 373 040 7 847 452 7 109 077 -7 084 603
1000 7 880 944 19 282 747 22 363 061 4 399 237
Stellenbosch University https://scholar.sun.ac.za

224
The results showed that all the business models displayed a strong sensitivity to the gold content
in the WPCBs feedstock. The lowest minimum gold content required for a business model to
become profitable was associated with the business model 4b. This was attributed to the lower
initial capital investment and annual operating costs associated with this business model. Business
model 4b became profitable when a minimum gold content in the WPCB feedstock of 563ppm was
used.
Business model 4c with a lower initial capital outlay and annual operating costs than model 4a
performed better, becoming profitable at a WPCB feedstock gold concentration of 625ppm.
Business model 4c performed better than 4d since it has greater annual gross revenues and the
potential for a greater return on investment and higher profit margins as demonstrated in section
8.5.2, Table 8.20.
The performance of business model 4a matched that of business model 4d at a gold content of
775ppm and became viable when a minimum gold content of 875ppm in the WPCB feedstock was
specified for the operations of model 4a.
Business model 4d displayed the poorest performance. This was attributed to the combined effects
of running with high operating costs, typical of operations associated with the production of metal
products.
A comparison of the capital and the fixed asset turnover ratios (Table 7.18) of business models 4a
and 4d revealed that business model 4a would rapidly outperform model 4d. This was because
business model 4a was able to generate revenue at a faster rate than model 4d. Business model
4d only became viable when the gold content in the WPCB feedstock was 925ppm.
Figure 8.16: Effect of changes in the gold content in the WPCBs on the NPV of the business models
4a to 4d
Stellenbosch University https://scholar.sun.ac.za

225
The effects of the gold concentration in the WPCB feedstock on the DCFRR and DPBP were also
considered. DCFRR values increased for each of the business models and the results are
summarized by the data in Table 8.2.
Table 8.2: DCFRR of the business models as gold content changes (%)
DCFRR (%)
Gold content (ppm) 4a 4b 4c 4d
250
500
750 4.76% 43.09% 22.57% -2.15%
1000 19.94% 85.93% 42.56% 19.78%
The results in Table 8.2 were consolidated into a graphical plot depicted by Figure 8.17.
Figure 8.17: Effect of changes in the gold content in the WPCBs on the DCFRR of the business
models 4a to 4d
The increasing gold content in the WPCBs feedstock witnessed declining discounted payback
periods for each of the business models depicted in Table 8.3.
Table 8.3: DPBP of the business models as gold content changes
DPBP (Years)
Gold content (ppm) 4a 4b 4c 4d
250
500
750 2.92 6.74
1000 8.09 1.35 2.96 8.20
8.5. Implications of the sensitivity analysis
The output of the sensitivity analysis is summarized in Table 8.4 which showed a comparison of
the rate of change of NPV (IΔNPV/Δ%I) over the project life for every percentage change of the
variable factor under study. The results apply to WPCBs with a gold concentration of 250ppm.
Stellenbosch University https://scholar.sun.ac.za

226
A mean rate of change of NPV for all the four models was calculated. The mean values of each
variable factor were compared against each other.
The mean with the greatest magnitude of change was associated with the variable factor having
the most significant influence on the performance of the business models. The mean values were
ranked according to the level of significance of the impact.
Table 8.4: Evaluation of the influence of the different factors
Sensitivity of business models to changes in the different
parameters Rate of change of NPV as factors change
(US$/%) (IΔNPV/Δ%I)
Business model 4a 4b 4c 4d I Mean I Rank
Operating costs -543 931 -381 566 -447 381 -483 356 -464 059 1
CAPEX and OPEX
-541 056 -324 768 -421 548 -441 098 432 118 2
Gold and copper recoveries
254 098 209 624 254 123
209 599 231 861 3
Copper and gold prices or Copper and gold sales
250 611 207 379 250 286 207 703 228 995 4
Gold recoveries 229 653 182 161 229 653 182 161 205 907 5
Gold prices or Gold sales
223 246 180 339 223 246 180 339 201 793 6
WPCB purchase prices
-154 439 -154 439 -154 439 -154 439 -154 439 7
Capacity utilization
-188 946 -106 625 -112 274 -165 943 -143 447 8
Total capital investment
-141 407 -29 807 -86 580 -75 368 -83 291 9
Effluent treatment costs
-83 424 -46 974 -51 538 -78 655 -65 148 10
Copper recoveries
28 413 28 076 28 076 28 413 28 244 11
Copper prices or Copper sales
27 365 27 040 27 040 27 365 27 202 12
Gold content in WPCBs
128 384 99 744 128 384 100 108 104 958 Critical
Figure 8.18 provides a graphical representation that compares the magnitudes of the average
mean changes of the NPV against percentage change in the variable factor under study
(IΔNPV/Δ%I). The data was extracted from Table 8.4.
Based on the analysis of the means in Table 8.4 and the graphical plot in Figure 8.18, it was
established that the performance and overall profitability of the business models was most
sensitive to changes in the overall operating costs. A combination therefore, of reduced effluent
and WPCB purchase prices would have a more positive impact on the performance of each
business model than they would when reduced individually.
Stellenbosch University https://scholar.sun.ac.za
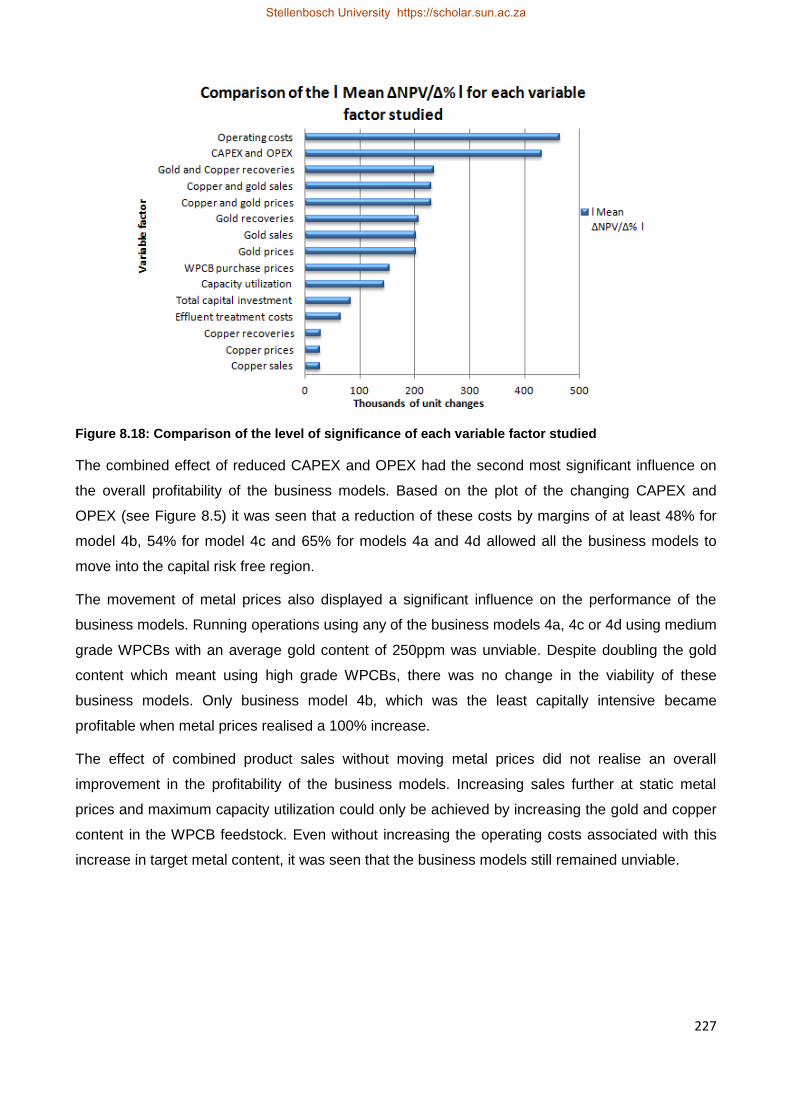
227
Figure 8.18: Comparison of the level of significance of each variable factor studied
The combined effect of reduced CAPEX and OPEX had the second most significant influence on
the overall profitability of the business models. Based on the plot of the changing CAPEX and
OPEX (see Figure 8.5) it was seen that a reduction of these costs by margins of at least 48% for
model 4b, 54% for model 4c and 65% for models 4a and 4d allowed all the business models to
move into the capital risk free region.
The movement of metal prices also displayed a significant influence on the performance of the
business models. Running operations using any of the business models 4a, 4c or 4d using medium
grade WPCBs with an average gold content of 250ppm was unviable. Despite doubling the gold
content which meant using high grade WPCBs, there was no change in the viability of these
business models. Only business model 4b, which was the least capitally intensive became
profitable when metal prices realised a 100% increase.
The effect of combined product sales without moving metal prices did not realise an overall
improvement in the profitability of the business models. Increasing sales further at static metal
prices and maximum capacity utilization could only be achieved by increasing the gold and copper
content in the WPCB feedstock. Even without increasing the operating costs associated with this
increase in target metal content, it was seen that the business models still remained unviable.
Stellenbosch University https://scholar.sun.ac.za

228
Table 8.5: Sensitivity ranking of each business model
Business model 4a 4b 4c 4d Most
sensitive model
Total capital investment 1 4 2 3 4a
Operating costs 1 4 3 2 4a
CAPEX and OPEX 1 4 3 2 4a
Effluent treatment costs 1 4 3 2 4a
Copper prices or Copper sales
2 1 1 2 4b, 4c
Gold prices or Gold sales
1 2 1 2 4a,4c
Copper and gold prices or Copper and gold sales
2 3 1 4 4c
WPCB purchase prices 1 1 1 1 4a - 4d
Capacity utilization 1 4 3 2 4a
Copper recoveries 2 1 1 2 4b, 4c
Gold recoveries 1 2 1 2 4a, 4c
Gold and copper recoveries 2 3 1 4 4c
Gold content in WPCBs 1 2 1 2 4a, 4c
Overall sensitivity 1.38 2.56 1.56 2.38 4a
The sensitivity ranking of a business model in comparison to the others for each variable factor
was also done. Based on the results in Table 8.5 overall sensitivity was calculated for each
business model. This was done by calculating the arithmetic mean of the sensitivity rank scores for
each business model to each factor. The results are summarized in Table 8.5. The results in this
Table showed a strong congruency with output from the project costing and profitability studies
covered in chapter 7.
It can be seen that the capitally intensive business models, associated with recovery of metals in
the solid state, were most sensitive to the effect of changing operating costs and initial capital
outlay. These models also displayed great sensitivity towards changes in metal prices and product
sales.
The general conclusion drawn from the sensitivity analysis is that the project profitability was
compromised by steep operating costs which could not be matched by the revenues derived from
gold and copper sales. The performance of the business models is driven by gold revenues. All the
business models displayed a zero tolerance towards low recoveries. Operating costs must be
managed by running operations with high single stage recoveries.
High in-process recycling frequencies push up the operating costs. If the costs of recycling
processes outweigh revenues associated with the sale of the recovered metals process redesign
or rejection are the two options left to consider.
Stellenbosch University https://scholar.sun.ac.za

229
While operating at full capacity it was seen that it is necessary to increase revenue from gold sales
by upgrading the choice of WPCB grade used for the proposed process. The proposed process
can only run profitably with a guaranteed supply of high grade WPCBs with a minimum gold
content ranging between 563ppm and 925ppm as depicted by Figure 8.15.
Successful operation using medium grade WPCBs can only be achieved by drastic process
modification that is characterised by a simultaneous reduction in the initial capital outlay and
annual operating costs. As the grade of WPCBs deteriorates, marked by decreasing gold content,
the proposed process is more of a high risk venture for investors to consider as an investment
option. Further there is no means of buffering the effects of other risk factors that will be discussed
in section 8.6.
8.6. Risk analysis
8.6.1. Recapitalization risk assessment
DCFRR and NPVs for projects can never be predicted absolutely because cash flow data for such
projects are subject to uncertainty. A measure of confidence is required for these projects. The
uncertainty of estimates increases the farther into the future that estimate is projected.
The venture premium method used to assess the riskiness of a project is based on a subjective
estimate of the fraction of capital investment likely to be lost if the project is unexpectedly
terminated (Perry et al., 1997). The risk is used to determine insurance Figures that creep into the
project’s profitability. As risk values increase due to increasing likelihood of fire, theft, accidents
due to technical factors of the project, delayed start up, law suits, the sensitivity of the project
increases due to these risk factors. These factors are threats to the life of the project which often
times require determination of capitalization costs. The comparison of ratios of capitalization cost
and NPV gives an indicator of the potential risk of a project terminating as a result of failure to
finance equipment replacement. The capitalization ratio is useful for comparing technologies or
comparing changes in capital investment within the context of a sensitivity analysis.
Probabilistic methods, some depending on historical performance are available for estimating risk.
At the preliminary stage of the project evaluations, detailed determinations using numerical
methods like the Delphic method were not used in the analysis since all the business models
analysed were found to be unviable (Perry et al., 1997).
In this study the magnitude of the ratios of capitalized cost and NPV were compared to determine
the level of risk associated with each business model. Plots of the ratios over the life of the project
were done.
Stellenbosch University https://scholar.sun.ac.za

230
Figure 8.19 is a plot of the recapitalization risk assessment for each of the business models 3a to
4d.
Figure 8.19: Recapitalization risk assessment for each of the business models 3a to 4d
Based on the plots for each business model in Figure 8.19, the probability of risk associated with
closure and failure of the business models is 100%. Each of the plots shows a perpetual decay in
the recapitalization ratios over the life of the project. The implication of the observed trend points
towards the failure of all the models to finance the recapitalization of process equipment at any
stage during and over the entire life of the project. The certainty of prematurely terminating all
operating activities before the life of the project is 100%.
All the business models operating with WPCBs feedstock with an average gold content of 250 ppm
were found to be incapable of sustaining continued operations even beyond a minimum period of
one year. The risk position can only be improved by ensuring a consistent supply of high grade
WPCBs with a minimum values of 875ppm, 563ppm, 625ppm and 925ppm for business models
4a, 4b 4c and 4d respectively.
Secondly, reducing the operating costs or reviewing the entire scope of operations in favour of less
fiscally intensive processes. In conditions of strained economic operating conditions the tactical
decision at an operational level and strategic intervention at a corporate level would be the
disinvestment in the copper business.
Focus must be shifted to outsourcing the fiscally intensive operations of the copper business to
well established copper processors or intermediate chemical product processors with larger
economies of scale. Thirdly it is prudent to recover other precious metals as more concentrated
solutions or salts for sale if the net returns are positive. Investing in purifying the other precious
metals streams is not advisable.
Stellenbosch University https://scholar.sun.ac.za

231
8.6.2. Evaluating susceptibility to risk factors
Based on the analysis of the sensitivity of each business model to the factors discussed in section
8.4, four additional categories of major risk areas were identified that were found to affect the
operations and overall performance of the proposed process. The clustering of the variable factors
studied under the most appropriate risk area was done and is illustrated in Figure 8.20.
Figure 8.20: Clustering of variable factors in the sensitivity study under the areas of risk
The relative assessment of the susceptibility of each business model to each defined areas of risk
is detailed in Table 8.6. Each of the variable factors in Table 8.5 was allocated to the type of risk
area shown in Figure 8.20. A mean of the ranking scores for each business model in the risk areas
was computed. The business model with the lowest score was found to display the greatest
susceptibility to that area of risk in comparison to the other business models.
Table 8.6: Evaluation of models’ susceptibility to risk factors
Risk susceptibility
4a
4b
4c
4d
Most susceptible
model
Market 1.67 2.00 1.00 2.67 4c
Supply and demand constraints 1.50 2.50 1.50 2.50 4a, 4c
Raw material supply 1.00 1.50 1.00 1.50 4a, 4c
Technological 1.29 3.14 2.00 2.43 4a
Overall analysis (ẋ) 1.37 2.29 1.38 2.28 4a
Based on the results in Table 8.5 overall sensitivity was calculated for each business model. This
was done by calculating the arithmetic mean of the sensitivity rank scores for each business model
to each factor. The results are summarized in Table 8.6.
Stellenbosch University https://scholar.sun.ac.za

232
The sensitivity analysis revealed that the most capitally intensive business model 4a had the
highest overall degree of susceptibility to risk as indicated by the lowest score of 1.37 (see Table
8.6). The least capitally intensive business model, 4b displayed the lowest overall susceptibility to
risk scoring an average of 2.29 for the overall sensitivity. The results mirrored the findings in Table
8.5. The most capitally intensive business model displayed the greatest sensitivity to intrinsic and
extrinsic influences in the business environment.
The least capitally and operationally intensive models displayed the lowest sensitivity to the
different factors studied. The likelihood of failure of business model 4a was also exposed by the
position of the plots of model 4a relative to other business models in each of the graphs in section
8.4. The combination of high operating costs and high recapitalization rates makes it most
susceptible. The lowest overall susceptibility to risk displayed by 4a is congruent with the position
of all the plots of business model 4a in relation to the other business models for all the variables
studied in section 8.4.
To circumvent the observed areas of risk it is advisable to ensure a broad and secure customer
base with minimum specialised product requirements Reliable customer supplier relationships
must also be secured and maintained especially for specialised new entry products like the
aurocyanide liquor with limited market data. The aurocyanide liquor business is most susceptible to
this market risk. While business model 4d scores the highest in this area, it is not immune to the
market risk associated with gold liquor sales volumes. Reliable supplier contracts and symbiotic
partnerships across the value and supply chains are crucial to nullify the effect of the prevalent raw
material supply risk and supply and demand related constraints. From the conceptual stage of
project the design of a process with high single stage recoveries and few complex steps must be
targeted as noted earlier.
8.7. Chapter summary
The sensitivity analysis was done on the group 4 business models. It had been identified in chapter
7, that the economic performance curves of the group 3 and group 4 business models were
congruent. Significant departures in the overall economic performance were expected when the
crushed WPCB purchase costs were less than the internal transfer price used in the group 3
business models. The elimination of the size reduction business unit also meant a reduction in the
overall operating costs when each group 4 business model was compared to its respective group 3
business model. It was against these arguments that the group 3 business models were eliminated
leaving the group 4 business models for further analysis.
Stellenbosch University https://scholar.sun.ac.za

233
A detailed sensitivity analysis of the group 4 business models was undertaken. The effects of the
movement of annual corporate taxation rates were not studied since tax cannot be levied against a
perpetual loss position. The influence of changes in the annual inflation rate and changes in WACC
were also not studied in depth since the associated plots were distorted by the negative discounted
cash flows throughout the life of the project for all the business models studied.
An examination of the different plots showed a recurrent trend for all the business models, which
reinforced the findings of the project evaluations made in the previous chapter. It was also revealed
that at an average gold content of 250ppm in the WPCBs, all the business models remained in the
capital risk zone. In spite of improving recoveries and running at full rates, coupled with high
product off takes, the business models remained unviable.
The variation of the gold content was studied since the chief contributor to revenue in WPCBs is
gold. As the gold content increased a rapid performance increase was observed for the business
models. Model 4b showed the greatest sensitivity and moved out of the capital risk zone at a
minimum gold content of 563ppm. The more capitally intensive models associated with recovery of
copper and/or gold in the solid state displayed positive returns at higher gold contents in excess of
620ppm. This high gold content is associated with high grade WPCBs which at present do not
have a consistent supply as indicated in chapter 3.
An assessment of all the factors affecting the operations of the proposed project was rated and it
was observed that the business models displayed the greatest sensitivity to changes in the
operating costs and changing revenues driven by the gold business. Coupled with the findings of
the project evaluations it was established that the pursuit of the proposed hydrometallurgical
process for the recovery of copper and gold is an unviable undertaking. The performance of all the
business models is affected by the restrictive operating costs. A review of the process is requisite.
It is advisable to consider less capitally and operationally intensive processes. The findings of the
sensitivity analysis enabled an evaluation of the susceptibility to areas of risk that affected the
project’s performance to be undertaken.
Combining the output of the profitability studies in chapter 7 it has been found that the success of
the proposed venture using medium grade WPCBs requires business and process re-engineering.
From the conceptual stage of project the design of a process with high single stage recoveries and
few complex steps must be targeted. This intervention must be complemented by reliable
producer/client contracts. Symbiotic partnerships across the value and supply chains are crucial to
nullify the effect of the prevalent raw material supply risk emanating from low e-waste out flows in
the country.
Stellenbosch University https://scholar.sun.ac.za

234
Chapter 9: CONCLUSIONS AND
RECOMMENDATIONS
9.1. Overview
The overarching goal of this study sought to determine the economic feasibility of establishing a
hydrometallurgical facility to recycle waste printed circuit boards. The broad objective of the project
was to achieve the recovery of gold and copper. The undertaking was confined to the South
African business sphere. In the course of the study 16 potential business models were developed.
An initial screening and selection of the business models was undertaken following which the first
eight models hosting the collection and dismantling function were eliminated. Costing and
economic performance evaluation of the remaining eight business models, 3a to 4d, was
undertaken. It was found that none of the business models were viable. The findings of this
analysis enabled further screening of the business models. A sensitivity analysis was performed on
the remaining business models to examine the existence of specific intrinsic and exogenous
operational conditions that would potentially improve the performance of the project.
9.2. Addressing the aims of the study
9.2.1. Objective 1
Develop an understanding of the current position of e-waste management and legislation
affecting e-waste recycling in South Africa.
Aspects of the South African business environment were examined in detail using six facets. The
PESTEL analysis approach was used to describe the status of e-waste recycling and management
in South Africa.
The findings of the study revealed that the recycling of e-waste in the country is progressively
evolving into a more structured system. Scope however exists for improving the execution of
legislative frameworks in a more homogeneous fashion. A clear policy and budget were identified
as being relevant to implementing municipal focused intervention in managing the diversion of
waste to landfill. While there has been growing activity in the last three decades the scene
remains largely dominated by inconsistent legislative frameworks. The efforts to crystallize the
legal framework have had retrogressive impacts on several formal e-waste recycling enterprises.
Stellenbosch University https://scholar.sun.ac.za

235
A large divide between formal and informal activities, with an unclear accounting framework to
monitor activities and output from e-waste recycling is still one the attendant features of e-waste
recycling activities in the country. There still lacks a means of regulating the flow of and handling of
materials along the supply chain. No pricing strategy exists for appropriately valuing e-waste.
Coupled with the low margins characterised by the e-waste recycling business as one moves
further up the value chain, the level of participation is drastically reduced.
There is however an active concerted effort to redress the low recycling rate of e-waste in the
country. This has been reflected by the drive towards the promotion of small and medium scale
initiatives, attempts to homogenise the legislation influencing e-waste recycling and enhancing the
involvement of the participation of stakeholders and electronic goods producers. This has been
evidenced by efforts to move towards a more circular recycling economy through the adoption of
EPR.
The findings of the study revealed that, while there exists vibrant research activity in the area of e-
waste recycling and management, the technical capacity to handle large outflows of toxic and
metallurgically diverse by products and waste is still inadequate. Failure to adequately absorb the
outflows contributes to the continued land filling and quarantining of the waste as the most effective
solution to handle the waste.
Findings of the study also revealed that low barriers to entry however exist downstream of the e-
waste recycling chain that can be exploited with alternative technologies, to add value to the output
of e-waste recycling. Room exists for the development of large scale hydrometallurgical activities
to exploit WPCBs in the country. The barriers to entry with respect to the level of participation
remain low. Prevalent environmental influences were found to exert a negative influence on
achieving meaningful activity downstream of the e-waste recycling and value chain. These factors
include the legislative structures in place, material flow across the value chain and technical
capacity for handling waste and by-product streams.
As yet the current status of e-waste inventory in the country has remained the predominant
motivating factor for conservative activity in the area marked by low levels of expansion. The bulk
of the key raw material is reported to be within private and public sectors in storage. The outflows
of e-waste and as a result, WPCBs, present a significant threat to the viability and life of the
proposed hydrometallurgical facility. The scarcity of the key raw material presents supply and
demand related constraints that limit the full utilization of installed facilities, delayed capital
repayment, thereby countermanding efforts to ensure a new and relevant source of employment.
The present e-waste recycling climate in South Africa is in the infantile stages when compared to
the strides made in the developed economies. Findings of the study revealed that the country is yet
to strengthen the technical and fiscal muscle to launch a large scale hydrometallurgical processing
facility described in the study.
Stellenbosch University https://scholar.sun.ac.za

236
As outflows of e-waste and hopefully consistent supply of high grade WPCBs for the tenure of the
project improve in the country, potential exists to expand the operating capacity and viably produce
copper and gold. The viability of the concern will potentially be faced with a new threat, namely the
reduction in the precious metals content in printed circuit board manufacture. Concerned
stakeholders in the e-waste recycling sector in South Africa must be operationally and technically
prepared to embrace these developments.
9.2.2. Objective 2
Define and compare different business models for WPCB metals recycling.
Sixteen business models were developed based on the two major criteria namely: the potential
product portfolio of the business models and the scope of focus of the internal plant operations of
the entire hydrometallurgical process flow. A due diligence was conducted to ascertain the extent
to which the different facets of the South African business environment could support the
undertaking at the initial proposed capacity of 30 000 tonnes per annum. It was established that
the existent deficiencies and inconsistencies in the legal system, the high raw material supply risk
and low capacity to absorb a high production capacity and the associated outflow of toxic by-
products was a major stumbling block to such an undertaking. Such an undertaking was noted to
be in need of an organised and well funded reverse logistics and warehousing structure. This
would also have to be supported by a consistent off take of final and by-product streams to remain
viable in the long term.
It was established that the collection and dismantling function was retrogressive towards achieving
high profit margins within each of the group 1 and 2 business models. The costs and infrastructural
demands associated with the reverse logistics on both a large and small scale were noted to be
restrictive. Through entering into collaborative partnerships and restructuring of business models
some of the businesses have managed to circumvent the retrogressive effects associated with
high reverse logistics costs. Failure to restructure business models has resulted in closure of
business operations of some of the recycling firms like Africa Sky. In the current business
environment the competition for WPCBs is steep and significant barriers to entry were foreseen
due to potentially protective reactions from existent players in this niche of WEEE recycling.
A consideration of the operating capacity of a well established recycling facility revealed that a safe
entry capacity for the proposed process should be pegged at a capacity of less than 1000 tonnes
per annum. The capacity used in this study was pegged at a recycle rate of 400 tonnes per annum
of WPCBs. At this capacity it was envisaged that the existent raw material supply risk will be
managed to the extent that it is less of a threat to the continued operations of the proposed
hydrometallurgical facility.
Stellenbosch University https://scholar.sun.ac.za

237
It is expected that the burden of managing the costs associated with the reverse logistics and
handling toxic by products of dismantling activities will be shouldered by proprietors specialising in
this role as revealed by the SWOT analysis.
An analysis of the e-waste recycling supply and value chains in South Africa has shown that
sufficient capacity exists to supply crushed WPCBs to the proposed process. This allows for the
elimination of another plant, the size reduction plant and the plant’s associated plant and labour
overhead costs.
It was on this basis that the most favourable business models selected were those that did not
incorporate the collecting and dismantling function and the size reduction of WPCBs as part of the
internal operating portfolio. An analysis of the scope of products produced and the available market
to absorb the products reveals that detailed market data is required to support the gold liquor
business. Knowledge of the minimum acceptable quality specifications of the liquor is required
prior to committing all resources into full scale production of the liquor. With scarce market
intelligence on sodium aurocyanide liquor the product off take rates are difficult to predict.
Established long term buyer and supplier contracts are required to protect the integrity surrounding
the gold liquor business.
The production of copper sulphate liquor, LME grade A copper cathodes and gold sludge is a
viable undertaking supported by an established metals processing industry and market in South
Africa. The risks associated with these products are driven chiefly by global metal prices which will
affect the returns to the business. It is therefore necessary to ensure the consistent supply of high
grade WPCBs to improve the viability of the operations. This analysis was covered in depth in the
evaluation of the project economics. At this stage it is advisable to reject the proposed process in
view of the prevalent raw material supply risk and inconsistent supply of high grade WPCBs. The
uncertain supplies of key raw materials in the absence of concrete statistics on e-waste volumes
complicate the operations planning and budgeting in the short and long term for the proposed
venture.
9.2.3. Objective 3
Evaluate and assess the economic performance of each business model based on the
proposed hydrometallurgical process
The detailed costing and economic evaluations of the project under the scope of the screened
business models 3a to 4d was undertaken. The findings revealed that for the specified operating
conditions the project is unviable. Performance curves based on the discounted and undiscounted
cash flows were used in tandem with profitability ratios to assess the long and short term
performance of the selected business models. The results of the metrics were congruent.
Stellenbosch University https://scholar.sun.ac.za

238
The concentrations of silver, tin and the PGMs were in quantities too low to shift the returns of the
business models into a profitable position. Additional hydrometallurgical processing to recover
these metals would prove to be uneconomical.
A detailed sensitivity analysis interrogating the most significant factors affecting the performance of
the business models was also done. Using the rate of change of NPV against percentage change
in the variable factor under study, the most significant influences on the performance of the
business models were identified. The results of analysis revealed that all the business models
displayed a marked sensitivity to the combined effect of the high operating costs and gold
revenues. An analysis of the sensitivity to changing gold revenues revealed that changes in
revenues due to gold recoveries had the most significant impact.
The level of sensitivity of each business model relative to the other models in the group was also
studied. It was established that business model 4a, with the highest initial capital outlay, gross
turnover and operating costs was the most sensitive to changes in the intrinsic and external
influences around the business. It was seen that for the performance of the project to improve,
intervention at a technical engineering level is necessary. This would be characterised by an
improvement in the process by reducing the number of processing stages or choosing an
alternative process route. It was seen however that the compositional diversity of the WPCBs
complicates the process as the degree of product purity targeted is increased. The use of medium
grade WPCBs with an average gold content of 250ppm would require the modification of the
current process or the development of an alternative process route. This was supported by findings
of the sensitivity analysis done, that examined the combined effect of changing CAPEX and OPEX.
A reduction of CAPEX and annual operating costs by margins of 65% for models 4a and 4d, 48%
for business model 4b and 54% for business model 4c, would ensure project viability using
medium grade WPCBs with a minimum average gold content of 250ppm. It is therefore evident
that the proposed process is unsuitable for treating low grade WPCBs. In conditions of strained
economic operating conditions the tactical decision at an operational and corporate strategic level
would be disinvestment in the copper business, and divert attention to expanding the portfolio
around the gold business, capture the market around the gold business and pursue long term
buyer/supplier contracts with fiscally and operationally robust business entities, capable of
cushioning exogenous risk factors.
The analysis of findings from the sensitivity analysis also showed that all the models have a low
tolerance for operating below the name plate capacity. The success of the business models is
hinged upon the gold concentration in the WPCBs. It is therefore imperative to ensure optimum
and undisrupted supplies of high grade WPCBs feedstock with a minimum gold content ranging
between 563ppm and 925ppm for the proposed process to be viable. The viability however is least
favourable as the more capitally intensive business models are adopted.
Stellenbosch University https://scholar.sun.ac.za

239
Secondly focus must be shifted to outsourcing the fiscally intensive operations of the copper
business to well established copper processors or intermediate chemical product processors with
larger economies of scale.
Thirdly it is prudent to recover other precious metals as more concentrated solutions or salts for
sale only if the net potential returns exceed the operating costs. Investing in purifying the other
precious metals streams is not advisable.
9.3. Recommendations for further study
Improve collection and distribution of e-waste
The creation and operation of a centralized e-waste distribution system should be adopted. The
central distribution system will act as the point of contact between the informal and formal recyclers
on a broader scale. It should be housed with the appropriate facilities to handle e-waste with
sensitive data. Operating frameworks and guidelines can be specified which are governed by
existing national legislation on the handling and recycling of e-waste. The existence of the system
will improve the planning and operations management of the recyclers. Secondly it will offer a safer
and more competitive business environment for informal recyclers and improve the accessibility to
e-waste to more recyclers or potential entrants into this niche of the recycling economy. Within the
scope of operations of the central distribution system, the collective interests of the informal
recycling sector can be addressed. By drawing informal recyclers scope exists for enhancing the
accountability and regulation of informal recycling activities.
Improving the accountability and material flow analysis
To circumvent the negative effect of low recovery rates associated with the proliferation of informal
recycling activities in developing and transitional economies for example, a detailed analysis of
material flows and material balances of existent recycling chains must be undertaken. In the case
of South Africa an account of options available for materials recovery must be interrogated. Owing
to the unknown volumes of material salvaged and pushed into the e-waste recycling chain by
informal recyclers, extrapolation of e-waste volumes recycled can be done using production
records of the recycling companies. With the creation of a structured mechanism for accounting for
e-waste recycling activities, it is possible to capture this data accurately and integrate it into the
national industrial statistics data pool.
Creating and maintaining a central material technical reference data bank
The output of the study was based on a very specific analysis of WPCBs which was adjusted to
reflect the typical grade of WPCBs handled in the country. The results of additional economic
evaluations and profitability studies are therefore subject to variation.
Stellenbosch University https://scholar.sun.ac.za
240
Findings from the work of numerous researchers have shown how the composition of WPCBs
varies (see Tables 2.2 and 2.3). For future work a mean analysis for each category of WPCBs
should be defined relative to the period of study. The mean values should be updated annually to
parallel the changing precious metals composition of WPCBs. In earlier discussions covered in
chapters 2 and 3 it was noted that there has been a shifting trend towards the reduction of the
precious metals content in printed circuit boards. This finding is supported by comparative assays
of WPCBs from older e-waste sources against the more recent e-waste sources (Cuchiella et al.,
2016).
Deepening the understanding WPCB chemistry
The findings in the study can also be improved by a more detailed understanding of the chemistry
of WPCBs. A detailed investigation of the solvent extraction of copper can be done while varying
the mix of metallic species and operating conditions in acidic media using LIX 984N. The study of a
multi component medium is especially useful in handling complex leach solutions from complex
polymetallic sources like WPCBs.
In this study the adsorption of gold onto carbon was based on published performance data. The
findings of the study and future studies in this area can be improved by empirical work to determine
the closest fit to adsorption models studied by previous researchers. Empirical investigations will
enable a better understanding of gold adsorption from WPCB leach liquor to be developed.
Exploring alternative processing options
Alternative technical studies exploring the leaching of all metals with the objective of electrowinning
with more current technologies can be considered. The impure metal product harvested from the
cathodes can be directed to the local pyrometallurgical facilities. The iron content however must be
reduced prior to the bulk leaching of the residual material.
Stellenbosch University https://scholar.sun.ac.za

241
REFERENCES
3M (2016). 3M acid mist suppressant FC-1100 product description,
https://multimedia.3m.com/mws/media/593688O/3m-acid-mist-suppressant-fc-1100.pdf [Accessed
5 July 2018]
Acevedo, F. (2000). The use of reactors in biomining processes. Electronic Journal of
Biotechnology, vol. 3, no. 3, pp 184-194.
Adams, M.D. Ed. (2016). Gold Ore Processing. Project Development and Operations (2nd Edition).
Published: 3 May 2016 http://dx.doi.org/10.1016/B978-0-444-63658-4.00026-8.
Ajiwe,V.I.E. and Anyadiegwu, I.E. (2000). Recovery of silver from industrial wastes, cassava
solution effects. Separation and Purification Technology, vol. 18, pp. 89-92.
Akcil, A., Erust, C., Gahan, C.S., Ozgun, M., Sahin, M. and Tuncuk, A. (2015). Precious metal
recovery from waste printed circuit boards using cyanide and non-cyanide lixiviants -A review.
Waste Management, vol. 45, pp. 258-271.
Al Shakarji, R. (2012). Mechanisms of Acid Mist Formation in Electrowinning, PhD Thesis, James
Cook University, Australia. Available online: http://researchonline.jcu.edu.au/27530/ [Accessed 26
June 2018]
Albertyn, P.W. (2017). Ammonium thiosulphate leaching of gold from printed circuit board waste,
MEng Thesis, Department of Process Engineering, Stellenbosch University, Stellenbosch, South
Africa.
Aleksandrovich, S., Nicolaevich, E. and Ivanovich, E. (1998). Method of processing of products
based on chalcogenides of base metals containing metals of platinum group and gold. Russian
Patent, RU2112064, C22B 11/02.
Alguacil, F.J.and Cobo, A. (1999). Solvent Extraction with LIX 973N for the Selective Separation of
Copper and Nickel. Journal of Chemical Technology and Biotechnology, vol. 74, no. 5, pp. 467-
471. doi:10.1002/(SICI)1097-4660(199905)74:53.0.CO;2-7
Alibaba (2018). Alibaba.com Global Products. https://www.alibaba.com/product-detail/Low-price
Copper-Sulphate
Solutions_50038840912.html?spm=a2700.7724857.normalList.13.4a646e32AkDGbm [Accessed
28 August 2018].
Aminian, H and Bazin, C. (1999). Rate of crud formation in a copper pilot plant settler. Minerals
Engineering, vol. 12, no.8, pp. 985-990.
Stellenbosch University https://scholar.sun.ac.za

242
Anderson, C.G., Giralico, A.M., Post, T.A., Robinson, T.G. and Tinkler, O.S. (2009). An Update:
Equipment selection, sizing and flow sheet applications in copper solvent extraction and
electrowinning. Available online:
https://www.researchgate.net/profile/Corby_Anderson/publication/288004303_An_Update_Selectio
n_Equipment_Sizing_And_Flowsheet_Applications_In_Copper_Solvent_Extraction_And_Electrowi
nning/links/567db6a608ae19758387bcb7/An-Update-Selection-Equipment-Sizing-And-Flowsheet-
Applications-In-Copper-Solvent-Extraction-And-Electrowinning.pdf [Accessed 12 August 2018]
Armstrong, W. (1999). The ISA PROCESS and its contribution to electrolytic copper. Presented at
the Rautmead Conference, Scotland, UK.
Association of Plastics Manufacturers in Europe (APME) (2000). Plastics recovery from waste
electrical and electronic equipment in non-ferrous metal processes, 8036/GB/07/00, Report.
Atkins, P. and de Paula, J. (2006). Atkins' Physical Chemistry (8th Edition). Oxford University
Press. ISBN 978-0-19-870072-2.
Awasthi, A.K., Zlamparet, G.I., Zeng, X. and Li, J. (2017). Evaluating waste printed circuit boards
recycling: Opportunities and challenges, a mini review. Waste Management and Research, vol. 35,
no.4, pp 346-356 .
Bacon, G and Mihaylov, I. (2002). Solvent extraction as an enabling technology in the nickel
industry. The Journal of The South African Institute of Mining and Metallurgy, vol.102, no. 8, pp.
435 – 443.
Baldĕ, C.P., Wang, F., Kuehr, R. and Huisman, J. (2015). The Global E-waste Monitor-2014,
United Nations University, IAS-SCYCLE, Bonn, Germany.
Barbosa-Filho, O. and, Monhemius, A.J. (1994). Iodine Ethiocyanate Leaching System for Gold.
Hydrometallurgy ’94. Institution of Mining and Metallurgy, UK, pp. 425-440.
Basel Convention (2014). Available
onine:www.basel.int/Portals/4/Basel%20Convention/docs/text/BaselConventionText-e.pdf, pp. 5-9,
46 [Accessed 28 May 2018]
BASF Global mining solutions. (2015). Technical information, LIX® 984N Solvent Extraction
Reagent TI/EVH 0132 e
Behnamfard, A., Salarirad, M.M. and Veglio, F. (2013). Process development for recovery of
copper and precious metals from waste printed circuit boards with emphasize on palladium and
gold leaching and precipitation. Waste Management, vol. 33, pp. 2354-2363.
Bergstrom, F. W. (1924). The reaction between mercuric cyanide and certain metals in liquid
ammonia. Available online: https://pubs.acs.org/doi/pdf/10.1021/ja01672a002 [Accessed 26 June
2018]
Stellenbosch University https://scholar.sun.ac.za

243
Beukes, N.T. and Badenhorst, J. (2009). Copper electrowinning: theoretical and practical design.
In: Hydrometallurgy Conference 2009. The South African Institute of Mining and Metallurgy, South
Africa, 2009.
Bhat, V., Rao, P. and Patil, Y. (2012). Development of an integrated model to recover precious
metals from electronic scrap – A novel strategy for e-waste management. International Conference
on Emerging Economies – Prospects and Challenges (ICEE-2012). Procedia – Social and
Behavioural Sciences, vol. 37, pp. 397 – 406.
Bigum, M., Brogaard, L. and Christensen, T.H. (2012). Metal recovery from high-grade WEEE: A
life cycle assessment. Journal of Hazardous Materials, vol. 207-208, pp. 8-14.
Birloaga, I., and Veglio, F. (2016). Study of multi-step hydrometallurgical methods to extract the
valuable content of gold, silver and copper from waste printed circuit boards. Journal of
Environmental Chemistry Engineering, vol. 4, pp. 20-29.
Birloaga, I., Coman, V., Kopacek, B. and Veglió, F. (2014). An advanced study on the
hydrometallurgical processing of waste computer printed circuit boards to extract their valuable
content of metals. Waste Management , vol. 34, pp. 2581-2586.
Birloaga, I., De Michaelis, I. and Veglió, F. (2016). Treatment of Printed Circuit Board Wastes by a
Hydrometallurgical Process. In: Hydrometallurgy Conference 2016: Sustainable Hydrometallurgical
Extraction of Metals, Cape Town, 1-3 August 2016, SAIMM.
Birloaga, I., De Michelis, I., Ferella, F., Buzatu, M. and Veglió, F. (2013). Study on the influence of
various factors in the hydrometallurgical processing of waste printed circuit boards for copper and
gold recovery. Waste Management. vol 33, pp. 935-941.
Bishop, M.D., Gray, L.A., Greene, M.G., Bauer, K., Young, T.L., May, J., Evans, K.E. and
Amerson-Treat, I. (1999). Investigation of evaporative losses in solvent extraction circuits. In
Copper 99-Cobre 99 Proceedings of the Fourth International Conference, Vol. IV Hydrometallurgy
of Copper, ed. Young, S.K., Dreisinger, D.B., Hackl, R.P. and Dixon, D.G., TMS, Warrendale, PA,
277 289.
Blaser, F and Schluep, M. (2012). Economic Feasibility of eWaste Treatment in Tanzania. Final
Report, St. Gallen, Switzerland, United Nations Industrial Development Organisation (UNIDO).
Available online:
https://open.unido.org/api/documents/4784290/download/Economic%20Feasibility%20of%20e-
Waste%20Treatment%20in%20Tanzania [Accessed 6 April 2018]
Briggs A.P.W. (1983). Problems encountered during the commissioning of the carbon-in-pulp plant
at Beisa mine. Journal of South African Institute of mining and metallurgy, pp. 246-253.
Stellenbosch University https://scholar.sun.ac.za

244
Brusselaers, J., Hagelüken, C., Mark, F, Mayne, N. and Tange, L. (2005). An Eco-efficient Solution
for Plastics-Metals-Mixtures from Electronic Waste: the Integrated Metals Smelter. In: 5TH
IDENTIPLAST 2005, the Biennial Conference on the Recycling and Recovery of Plastics
Identifying the Opportunities for Plastics Recovery, Brussels, Belgium, 2005.
Businesstech (2018). https://businesstech.co.za/news/wealth/222853/south-african-salaries-what-
professionals-earn-in-2018/ [Accessed 23 August 2018]
Buson, G.D., Ngandu, D.S., le Roux, J.C. and Rogans, E.J. (1999). The West Driefontein
reclamation carbon-in-pulp plant; pilot plant testwork, design, commissioning and optimization.
Journal of the South African Institute of Mining and Metallurgy, vol. 99, no. 2, pp. 63 - 68.
Busselle, L.D., Moore, T.A., Shoemaker, J.M. and Allred, R.E. (1999). Separation Processes and
Economic Evaluation of Tertiary recycling of Electronic Scrap. In: Proceedings of the 1999 IEEE-
International Symposium on Electronics & the Environment, IEEE, Piscataway, NJ, USA
Byoung, H.J., Yi, Y.P., Jeon, W.A., Seong, J.K., Tam, T. and Myong, J.K. (2009). Processing of
high purity gold from scraps using diethylene glycol di-N-butyl ether (dibutyl carbitol).
Hydrometallurgy vol. 95, pp. 262-266.
Cabinet approves minimum wage bill. (2017). Fin24,18 April:23.
https://www.fin24.com/Economy/cabinet-approves-minimum-wage-bill. [Accessed 2 November
2017]
CEPCI (2011). Chemical Engineering plant cost indices (1995 – 2011)
http://folk.ntnu.no/magnehi/cepci_2011_py.pdf [Accessed 8 August 2018]
Chatterjee, S. (2012). Sustainable Electronic Waste Management and Recycling Process.
American Journal of Environmental Engineering, vol. 2, no.1: 23-33 DOI:
I0.5923/jajee.20120201.05
Chatterjee, S. and Kumar, K. (2009). Effective electronic waste management and recycling
process involving formal and non-formal sectors. International Journal of Physical Sciences, vol. 4,
no.13, pp. 893-905.
chemengonline (2018). http://www.chemengonline.com/cepci-updates-january-2018-prelim-and-
december-2017-final/?printmode=1 [Accessed 25 July 2018]
Chen A., Dietrich K.N., Huo, X. and Ho, S.M. (2011). Developmental neurotoxins in E-waste: an
emerging health concern. Environmental Health Perspective, vol. 119, no.4, pp. 431-433.
Chmielewski, A.G., Urbanski, T.S. and Migdal, W. (1997). Separation technologies for metals
recovery from industrial wastes, Hydrometallurgy, vol. 45, no. 3, pp. 333-344.
Stellenbosch University https://scholar.sun.ac.za

245
Cifuentes, R., Rigoberto Bravo, R. and Schwarz, N. (2015). Effective Grain Modification in Copper
Electrowinning with DXG-F7. Available online: http://www.sgconsulting.co.za/wp-
content/uploads/CCBM33-DXG-F7.pdf [Accessed 6 August 2018]
City of Johannesburg (2018). http://www.johannesburgwater.co.za/about/city-of-johannesburg-
tariffs-2016-17/ [Accessed 20 July 2018]
Commission of the European Communities (2000). Proposal for a directive of the European
parliament and of the council on waste electric and electronic equipment.
CPCB (2007). Draft guidelines for Environmentally sound management of electronic waste. pp. 10-
25, Available online: http://www.cpcb.nic.in/Electronic%20Waste/chapter4.html
Crane, P., Urbani, M., Dudley, K., Horner, A., and Virnig, M. (2009). Solvent extraction (SX)
reagent selection for high temperature, acid, chloride and Cu PLS at Port Pirie and its impact on
electrowinning (EW). In: Hydrometallurgy Conference 2009, The Southern African Institute of
Mining and Metallurgy.
Cuchiella, F., D’Adamo, I., Koh, S.C.L. and Rosa, P. (2016). A profitability assessment of
European recycling processes treating printed circuit boards from waste electrical and electronic
equipments. Renewable and Sustainable Energy Reviews, vol. 64, no. 7, pp. 749-760.
Cuchiella, F., D’Adamo, I., Rosa, P. and Terzi, S. (2016b). Automative printed circuit boards
recycling: an economic analysis. Journal of Cleaner Production, vol. 121, pp. 130-141.
Cui, H. and Anderson C G (2016). Literature Review of Hydrometallurgical Recycling of Printed
Circuit Boards (PCBs). Journal of Advanced. Chemical Engineering, vol. 6, pp.11.
http://dx.doi.org/10.4172/2090-4568.1000142.
Cui, J. (2005). Mechanical Recycling of Consumer Electronic Scrap. Minerals and Metals
Recycling Research Center.
Cui, J. and Forssberg, E. (2003). Mechanical recycling of waste electric and electronic equipment:
a review. Journal of Hazardous Materials, vol. 99, no. 3, pp. 243-263.
Cui, J. and Zhang, L. (2008). Metallurgical recovery of metals from electronic waste: A review.
Journal of Hazardous Materials, vol. 158, pp. 228-256.
Dai, X., Simons, A. and Breuer, P. (2012). A review of copper cyanide recovery technologies for the
cyanidation of copper containing gold ores. Minerals Engineering, vol. 25, no. 1, pp.1-13.
Das N. (2010). Recovery of precious metals through biosorption – A review. Hydrometallurgy, vol.
103, pp. 180-189.
Stellenbosch University https://scholar.sun.ac.za

246
de Waal, A. (2018). Evaluating the efficiency of metal recycling processes by means of life cycle
assessment & exergy analysis, MEng Thesis in progress, Department of Process Engineering,
Stellenbosch University, South Africa.
Department of Environmental Affairs (DEA) (2012). National Waste Information Baseline Report.
Department of Environmental Affairs. Pretoria, South Africa.
Deschenes, G., Lastra, R., Brown, J.R., Jin, S., May, O. and Ghali, E. (2000). Effect of lead nitrate
on cyanidation of gold ores: progress on the study of the mechanisms. Minerals Engineering, vol.
13, no.12, pp. 1263-1279.
Dittke, M. (2007). A review of South African Environmental and General Legislation governing e-
waste. Final Report.
docbrown (2018). Transition metals. Available online:
http://www.docbrown.info/page07/appendixtrans12.htm [Accessed 26 June 2018]
Dow Water Solutions. (not dated).DOWEX™ Ion Exchange Resins, Water conditioning manual
http://msdssearch.dow.com/PublishedLiteratureDOWCOM/dh_0885/0901b80380885879.pdf?filepa
th=liquidseps/pdfs/noreg/177-01766.pdf [Accessed 07 August 2018]
DOW(1999). DOWEX HCR Softening Resin product information. Available online:
http://www.reskem.com/wp-uploads/2015/04/dow-dowexhcrsoftening.pdf [Accessed 07 August
2018]
Dreisinger, D. and Scholey, B.J.Y. (1995). Ion exchange removal of antimony and bismuth from
copper refinery electrolytes. Copper, Santiago, Chile, 26-29 November 1995. (Ed.), W.C. Cooper,
D.B. Dreisinger, J.E. Dutrizac, H. Hein, and G. Ugarte. Montreal, Quebec: Canadian Institute of
Mining, Metallurgy and Petroleum, pp. 305-314.
Driver, J.E. (1988). Bentley and Driver's Qualitative Chemical Analysis A Handbook for Teaching
Practice Supervisors - Hong Kong University Press, pp. 11
https://books.google.co.za/books?id=CM1dRNF2zAAC&pg=PA11&lpg=PA11&dq=solubility+of+sta
nnic+cyanide&source=bl&ots=qI0NRkSn7c&sig=9OEShX5wI-
B7t_ibW5ppvHuxF84&hl=en&sa=X&ved=0ahUKEwjo25G386XcAhUcOsAKHUltBRsQ6AEIdTAI#v
=onepage&q=solubility%20of%20stannic%20cyanide&f=false [Accessed 20 July 2018]
Duan, C., Sheng, C., Wu, L., Zhao, Y., He, J. and Zhou, E. (2014). Separation and Recovery of
Fine Particles from Waste Circuit Boards Using an InflaTable Tapered Diameter Separation Bed.
The Scientific World Journal, vol. 2014, Article ID 843579, http://dx.doi.org/10.1155/2014/843579
Dunn, Jr., Carda, D.D. and Storbeck, T.A. (1991). Chlorination process for recovering gold values
from gold alloys, US Patent, US5004500.
Stellenbosch University https://scholar.sun.ac.za

247
Elliot, H.A. and Shastri, N.L. (1999). Extractive decontamination of metal-polluted soils using
oxalate. Water, Air and Soil Pollution, vol. 110, no. (3-4), pp. 335-346.
Engineering toolbox (2018). https://www.engineeringtoolbox.com/horsepower-compressed-air-
d_1363.html [Accessed 17 August 2018]
Eskom (2018). Eskom schedule of standard prices 2018/19,
http://www.eskom.co.za/CustomerCare/TariffsAndCharges/Documents/Eskom%20schedule%20of
%20standard%20prices%202018_19.pdf [Accessed 10 August 2018]
Estay, H., Arriagada, F. and Bustos, S. (2010). Design, development and challenges of the SART
process. In: Proceedings-HydroProcess 2010 – 3th International Workshop on Process
Hydrometallurgy, Santiago, Chile.
European Commission Recast of the WEEE Directive (2012).
http://ec.europa.eu/environment//waste/weee/index_en.htm, [Accessed 9 April 2018].
European Parliament (2012). Directive 2012/19/EU of the European Parliament and of the Council
of 4 July 2012 on waste electrical and electronic equipment (WEEE). Official Journal of the
European Union. 2012, L197, 38-71
European Union Air quality standards (2005).
http://ec.europa.eu/environment/air/quality/standards.htm [Accessed 3 July 2018]
Eurostate (2016). Waste statistics-electrical and electronic equipment.
http://ec.europa.eu/eurostat/statistics-explained/index.php/Waste_statistics_-
_electrical_and%20electronic_equipment [Accessed 12 October 2017]
eWASA (2017). https://ewasa.org/ [Accessed 26 October 2017]
Day, F.G. (1984). Recovery of platinum group metals, gold and silver from scrap, US Patent,
US4427442
Ferreira, B., Monedero, J., Martí, J.L., Aliaga C., Hortal, M. and Dobón, A. (2012). Economic
Aspects of Recycling. Chapter of the book “Post-Consumer Waste Recycling and Optimal
Production”. ISBN 978-953-51-0632-6, InTech, May 5, 2012.
Fetzer, A. (2009). E-waste management in South Africa, Kenya and Morocco: Developing a
pathway to sustainable systems. Report commissioned by Hewlett-Packard 2009.
Finlay, A. (2005). E-waste challenges in developing countries: South Africa case study. APC Issue
Papers. Association for Progressive Communications. November 2005.
https://www.apc.org/sites/default/files/e-waste_EN_1.pdf [Accessed 25 October 2017]
Finlay, A. and Liechti, D. (2008). E-waste management in South Africa. Johannesburg, South
Africa: Openresearch, Empa.
Stellenbosch University https://scholar.sun.ac.za

248
Ford, K., Flemming, C. and Henderson, R. (2008). Application of the SART Process to Heap
Leaching of Gold-Copper Ores at Maricunga, Chile. 40th annual meeting of the Canadian Mineral
Processors, Ottawa, January 22-24.
Froment, G. F. and Bischoff, K. B. (1979). Chemical Reactor Analysis and Design, Wiley, New
York, pp.310.
Furter, L. (2004). Gauteng e-waste project: mission findings. RéSource (May), 13-15
Geyer, R. and Blass, V.D. (2010). The economics of cell phone reuse and recycling. International
Journal of Advanced Manufacturing Technology 47:515-525. DOI 10.1007/s00170-009-2228-z.
Ghodrat, M., Rhamdhani, M.A., Brooks, G., Masood, S. and Corder, G. (2016). Techno- economic
analysis of electronic waste processing through black copper smelting route. Journal of Cleaner
Production, vol. 126, pp.178-190.
Ghosh, B., Ghosh, M.K., Parhi, P., Mukherjee, P.S. and Mishra, B.K. (2015). Waste Printed Circuit
Boards Recycling: An Extensive Assessment of Current Status, Journal of Cleaner Production, doi:
10. 1016/j.jclepro.2015.02.024.
GIZ (2013). Deutsch Gesellschaft für Internationale Zusammenarbeit, Pocket information guide for
South African E-Waste collectors. https://www.giz.de/expertise/downloads/giz2014-en-southafrica-
pocket-guide-ewaste-collectors.pdf. December 2013. [Accessed 15 October 2017]
Godfrey, L. (2015). Finding value in waste. Identifying opportunities for growth in a secondary
resources economy. The 5th CSIR Conference. Ideas that work. 8-9 October 2015. CSIR
Godfrey, L. and Oelofse, S. (2017). Historical Review of Waste Management and Recycling in
South Africa. Resources, 6, 57; doi:10.3390/resources6040057.
Godfrey, L. (2008). Facilitating the improved management of waste in South Africa through a
national waste information system. Waste Management, vol. 28, pp. 1660-1671.
Gold plating services (2018). https://www.goldplating.com/collections/ [Accessed 29 August 2018]
goldrate24 (2018). http://www.goldrate24.com/gold-prices/africa/south_africa/ [
Goosey, M. and Kellner, R. (2002). A scoping study: End-of-life printed circuit boards. Department
of Trade and Investment, Shipley Europe Ltd.
Grant, K., Goldizen, F.C., Sly, P.D., Brune, M., Neira, M., Van den Berg, M. and Norman, R.E.
2013. Health consequences of exposure to e-waste: a systematic review. Lancet Global Health,
vol. 1, pp. 350-361.
GreenCape (2017). Waste Economy - 2017 Market Intelligence Report. http://www.green-
cape.co.za/assets/Uploads/GreenCape-Waste-MIR-2017-electronic-FINAL-v2.pdf [Accessed 12
November 2017].
Stellenbosch University https://scholar.sun.ac.za

249
GreenCape (2018). Waste – 2018 Market Intelligence Reporthttps://www.green-
cape.co.za/assets/Uploads/20180622-GreenCape-Waste-MIR-FA-LR.pdf [Accessed 6 November
2018]
Gregory, J.R. and Kirchain, R.E. (2008). A framework for evaluating the economic performance of
recycling systems a case study of North American electronics recycling systems. Environmental.
Science and Technology, vol. 42, no.18, pp. 6800-6808.
Guo, J., Guo, J. and Xu, Z. (2009). Recycling of non-metallic fractions from waste printed boards: a
review. Journal of Hazardous Materials, vol.168, no. 2-3, pp. 567-590.
Gurdal, B. (2008). Gold recovery and optimization from polish waste. MSc Thesis, Institute of
Science, Istanbul Technical University, Istanbul, Turkey.
Gurung, M., Adhikari, B.B., Kawatika, H., Ohto, K., Inoue, K. and Alam, S. (2013). Recovery of
gold and silver from spent mobile phones by means of acidothiourea leaching followed by
adsorption using biosorbent prepared from persimmon tannin. Hydrometallurgy, vol. 133, pp. 84-
93.
Ha, V.H., Lee, J.-C., Jeong, J., Hai, H.T. and Jha, M.K. (2010). Thiosulphate leaching of gold from
waste mobile phones. Journal of Hazardous Materials, vol. 178, no.1-3, pp. 1115-1119.
Hadi, P., Xu, M., Lin, C.S.K., Hui, C-W. and MacKay, G. (2015). Waste printed circuit board
recycling techniques and product utilization. Journal of Hazardous Materials, vol. 283, pp. 234-
243.
Hagelüken, C. (2006). Recycling of Electronic Scrap at Umicore. Precious Metals Refining.
Conference Paper in Acta Metallurgica Slovaca, June 2006.
Hageluken, C. (2006). Recycling of electronic scrap at Umicore’s integrated metals smelter and
refinery, World of Metallurgy – ERZMETALL, vol. 59, no. 3, pp. 152-161.
Hagelüken, C. (2006b). Improving metal returns and eco-efficiency in electronics recycling - A
holistic approach for interface optimisation between pre-processing and integrated metals smelting
and refining. IEEE International Symposium on Electronics and the Environment, 2006, pp. 218-
223.
Hagelüken, C. and Corti, C.W. (2010). Recycling of gold from electronics: cost-effective use
through ‘Design for Recycling’. Gold Bull, vol. 43, pp. 209-220.
Hakakari, H. (1995). Study of operational factors affecting copper anode quality. Copper, Santiago,
Chile, 26-29 November 1995. Ed. W.C., Cooper, D.B., Dreisinger, J.E., Dutrizac, H. and Ugarte, G.
Montreal, Quebec: Canadian Institute of Mining Metallurgy and Petroleum, pp. 165- 173.
Stellenbosch University https://scholar.sun.ac.za
250
Hanafi, J., Jobiliong, E., Christiani, A., Soenarta, D.C., Kurniawan, J. and Irawan, J. (2012).
Material Recovery and Characterization of PCB from Electronic Waste. International conference on
Asia Pacific Business Innovation and Technology Management. Procedia-Social and Behavioural
Sciences, vol. 57, pp. 331-338.
Hao, J., Wang, H.F. and Song, S.L. (2008). Status of recycling scrap printed circuit boards by
pyrolysis. China Resources Comprehensive Utilization, vol. 26, pp. 30-33.
Hartmann, T. and Corbella, J. (2007). Tailor made crud treatment with 3 phase separating
centrifuge. Copper, Toronto, Canada, 26-29 August 2007. Ed. Riveros, P.A., Dixon, D.G.,
Dreisinger, D.B. and Collins, M.J. Montreal, Quebec: Canadian Institute of Mining Metallurgy and
Petroleum, 2007.
He, J.F., Duan, C.L., He, Y.Q. and Zhang, H. J. (2015). Recovery of valuable metal concentrate
from waste printed circuit boards by a physical beneficiation technology. International Journal of
Environmental Science and Technology. 12:2603–2612 DOI 10.1007/s13762-014-0664-2.
Hector, M.C. (2017). Toxic Trade: E-Waste Disposal and Environmental Governance in West
Africa, M.A Thesis, Faculty of Arts and Social Sciences, Stellenbosch University, Stellenbosch ,
South Africa.
Hicks, C., Dietmar, R. and Eugster, M. (2005). The recycling and disposal of electronic waste in
China – legislative and market response. Environmental Impact Assessment Review, vol. 25, pp.
459–471.
Hong, K.J., Tokunaga, S. and Kajiuchi, T. (2000). Extraction of heavy metals from msw incinerator
fly ashes by chelating agents. Journal of Hazardous Materials, vol. 75, no. 1, pp. 57-73.
Hongguang, Z., and David, B.D. (2002). The adsorption of gold and copper onto ion-exchange
resins from ammoniacal thiosulphate solutions. Hydrometallurgy, vol. 66, pp. 67-76.
Huang, J., Chen, M., Chen, H., Chen, S. and Sun, Q. (2014). Leaching behaviour of copper from
waste printed circuit boards with Brønsted acidic ionic liquid. Waste Management, vol. 34, pp.483-
488.
Huang, K., Jie Guo, J. and Xu, Z. (2009). Recycling of waste printed circuit boards: a review of
current technologies and treatment status in China, Journal of Hazardous Materials, vol.164, pp.
399-408.
Hydraulicspneumatics (2018). Available online:
https://www.hydraulicspneumatics.com/datasheet/determine-cost-compressed-air-your-plant-pdf-
download [Accessed17 August 2018]
Iji, M and Yokoyama, S.(1997). Recycling of printed wiring boards with mounted electronic
components. Circuit World, vol. 23, pp. 10-15.
Stellenbosch University https://scholar.sun.ac.za

251
Indeed (2018). General Worker Salaries. Available online:
https://www.indeed.co.za/salaries/General-Worker-Salaries [Accessed 23 August 2018]
Indeed (2018b). Laboratory technician salaries. Available
online:https://www.indeed.co.za/salaries/Laboratory-Technician-Salaries [Accessed 23 August
2018]
Infomine (2017). Commodity and Metal Prices. http://www.infomine.com/investment/metal-prices/
[Accessed October –November 2017]
International Union of Pure and Applied Chemistry (1993). Quantities, Units and Symbols in
Physical Chemistry (2nd Edition), Oxford: Blackwell Science. ISBN 0-632-03583-8. pp. 49–
50. Electronic version.
IUPAC (1997). Compendium of Chemical Terminology, (2nd Edition) the "Gold Book".
Jain, S. and Garg, K.M. (2011). Managing E-Waste in India: Adoption of Need Based Solutions.
Journal of Internet Banking and Commerce, vol. 16, no.3.
Jing-ying, L., Xui-li, X. and Wen-quan, L. (2012). Thiourea leaching gold and silver from the printed
circuit boards of waste mobile phones. Journal of Waste Management, vol. 32, pp. 1209-1212.
Jirang Cui, J. and Røven, H.J. (2011). Electronic Waste, Waste: A Handbook for Management (1st
Edition). Elsevier, 2011, pp. 281-296 ... in 2005 [1]. 281Waste Doi: 10.1016/B978-0-12-381475-
3.10020-8 Ó2011.
johannesburg climatemps (2018). http://www.johannesburg.climatemps.com/humidity.php
[Accessed 17 August 2018]
johannesburgwater (2017).The-JoburgTariffs-2017-2018,https://www.johannesburgwater.co.za/wp-
content/uploads/2018/04/The-Jozi-Water-bill-Tariffs-2017-2018.pdf [Accessed 10 August 2018]
Kafumbila, J. (2017). Design of copper electrowinning circuit using conventional
https://www.911metallurgist.com/blog/wp-content/uploads/2015/11/Design-Copper-Electrowinning-
Circuit.pdf [Accessed 12 August 2018]
Kamberović, Ž., Korać, Ivšić, D., Nikolić, V., M. and Ranitović, M. (2009). Hydrometallurgical
process for extraction of metals from electronic waste-part II: Material characterization and process
option selection. Association of Metallurgical Engineers of Serbia.
Kamberović, Ž., Korać, M. and Ranitović, M. (2011). Hydrometallurgical process for extraction of
metals from electronic waste-part II: Development of the processes for the recovery of copper from
printed circuit boards (PCB). Association of Metallurgical Engineers of Serbia.
Stellenbosch University https://scholar.sun.ac.za

252
Kang, H-Y. and Shoenung, J.M.(2006). Economic Analysis of Electronic Waste Recycling:
Modelling the Cost and Revenue of a Materials Recovery Facility in California. Environmental
Science and Technology, vol. 40, pp. 1672-1680.
Karbanee, N., van Hlle, N.P and Lewis, A.E. (2008). Controlled Nickel Sulfide Precipitation Using
Gaseous Hydrogen Sulfide. Industrial Engineering and Chemistry Research, vol. 47, no. 5, pp
1596-1602 DOI: 10.1021/ie0711224.
Karimi, P., Abdollahi , H., Amini, A., Noaparast , M., Shafaei, S.Z. and Habashi, F. (2010).
Cyanidation of gold ores containing copper, silver, lead, arsenic and antimony. International
Journal of Mineral Processing, vol. 95, pp. 68–77.
Kasper, A.C., Berselli, G.B.T., Freitas, B.D., Tenório, J.A.S. and Bernardes, A.M. (2011). Printed
wiring boards for mobile phones: Characterisation and recycling of copper. Waste Management,
vol. 31, pp. 2536-2545.
Kaufman, M. (2002). Principles of thermodynamics, CRC Press, p. 213, ISBN 0-8247-0692-7.
Ketrick, B. (2014). Water softening resin technology filtration, AWT training seminars 2/18/2014
https://www.awt.org/pub/08A9A26A-BA93-0C41-6B7C-AB2F7946D2C6 [Accessed 1 August 2018]
Khaliq, A., Rhamdhani, M.A., Brooks, G. and Masood, S. (2014). Metal Extraction Processes for
Electronic Waste and Existing Industrial Routes: A Review and Australian Perspective. Resources,
vol.3, pp.152-179; doi:10.3390/resources3010152.
Khanna, R., Cayumil, R., Mukherjee, P.S. and Sahajwalla, V. (2014). A novel recycling approach
for transforming waste printed circuit boards into a material resource. Urban Environmental
Pollution 2013 – Creating Healthy, Livable Cities. Procedia Environmental Sciences, vol. 21 pp. 42-
54.
Kiddee, P., Naidu, R. and Wong, M.H. (2013). Electronic waste management approaches: An
Overview. Waste Management, vol. 33, pp. 1237-1250.
Kim, B.-S., Lee, J., Seo, S.-P., Park, Y.-K. and Sohn, H. (2004). A process for extracting precious
metals from spent printed circuit boards and automobile catalysts. Journal of the Minerals, Metals
and Materials Society, vol. 56, no. 12, pp. 55-58.
Kim, Y.H. and Nakano, Y. (2005). Adsorption mechanism of palladium by redox within condensed-
tannin gel. Water Resources, vol. 39, no. 7, pp. 1324-1330.
Kinoshitaa, T., Akitaa, S., Kobayashib, N., Niib, S., Kawaizumib, F. and Takahashi, K. (2003).
Metal recovery from non-mounted printed wiring boards via hydrometallurgical processing.
Hydrometallurgy, vol. 69, pp. 73-79.
Stellenbosch University https://scholar.sun.ac.za

253
Kita, Y., Nishikawa, H. and Takemoto, T. (2006). Effects of cyanide and dissolved oxygen
concentration on biological gold recovery. Journal of Biotechnology, vol. 124, pp. 545-551.
Kleinschmidt, A . (1918). Mefastannic Acid and its Compounds. Monatsh, vol. 39, pp. 149-178.
htps://www.sciencemadness.org/whisper/files.php?pid=118137&aid=4809 [Accessed 16 July 2018]
Kogan, V. (2006). Process for the recovery of precious metal scrap by means of hydrometallurgical
technique. Patent application, WO 6006/013568 A3.
Korte, G. and Coulston, F. (1998). From single-substance evaluation to ecological process
concept: the dilemma of processing gold with cyanide. Ecotoxicology and Environmental safety,
vol. 32, pp. 96-101.
Kravchenko, N.D., Dubinskii, Y.M. and Krichevskii, V.I. (1983), Processing scrap of radio-electronic
equipment. The Soviet Journal of Non-Ferrous Metals (Tsvetnye Metally), vol. 24, pp. 100-101.
Kuipa, P.K. and Hughes, M.A. (2002). Diluent effect on the solvent extraction rate of copper.
Separation Science and Technology, vol. 37, no.5, pp.1135-1152.
Kumar, R., Shah, D. J. and Kant Tiwari, K. (2013). Separation of Copper and Nickel by Solvent
Extraction Using LIX 664N. Journal of Environmental Protection, vol.4, pp. 315-318.
10.4236/jep.2013.44037.
Kuzugudenli, O.E. and Kantar, C. (1999). Alternatives to Gold Recovery by Cyanide Leaching,
Erciyes üniversitesi Fen Bilimleri Enstitüsü Dergisi, vol. 15, no.1-2, pp. 119-127.
Theo. L. (1998). Integrated recycling of non ferrous metals at Boliden Ltd. Ronnskar smelter, IEEE
International Symposium on Electronics and the Environment, pp. 42-47.
La-Brooy, S.R., Linge, H.G. and Walker, G.S. (1994). Review of gold extraction from ores. Minerals
Engineering, vol. 7, no.10, pp.1213-1241.
Laddha, G. S. and Degalessan, T. E. (1978). Transport Phenomena in Liquid Extraction, McGraw-
Hill, New York.
Lawhon, M. (2013). Dumping ground or country-in-transition? Discourses of e-waste in South
Africa. Environment and Planning C: Government and Policy, 2013.
Lee, C.-H., Chang-Tang, C., Kuo-Shuh, F. and Tien-Chin, C. (2004). An overview of recycling and
pre-treatment of scrap computers. Journal of Hazardous Materials, B114, pp. 93-100.
Lee, J., Song, H.T. and Yoo, J.-M. (2007). Present status of the recycling of waste electrical and
electronic equipment in Korea. In: Resources Conservation and Recycling, vol. 50, no. 4, pp. 380-
397.
Stellenbosch University https://scholar.sun.ac.za

254
Lee, M.-S., Ahn, J.-G. and Ahn, J.-W.(2003). Recovery of copper, tin and lead from the spent nitric
etching solutions of printed circuit board and regeneration of the etching solution. Hydrometallurgy,
vol. 70, pp. 23-29.
Legarth, J. B., Alting, L. and Baldo, G. L. (1995). Sustainability issues in circuit board recycling. In
Proceedings of the IEEE International Symposium on Electronics and the Environment, pp. 126-
131. IEEE. DOI: 10.1109/ISEE.1995.514963.
Li, J., Dong, Q, Liu, L. and Song, Q. (2016). Measuring treatment costs of typical waste electrical
and electronic equipment: A pre-research for Chinese policy making. Waste Management, vol. 57,
pp. 36-45.
Li, J., Duan, H., Yu, K. and Wang, S. (2010). Interfacial and Mechanical Property Analysis of
Waste Printed Circuit Boards Subject to Thermal Shock, Journal of the Air and Waste
Management Association, vol. 60, no. 2, pp. 229-236, DOI: 10.3155/1047-3289.60.2.229
Li, J., Lu, H., Guo, J., Xu, Z. and Zhou, Y. (2007). Recycle Technology for Recovering Resources
and Products from Waste Printed Circuit Boards. Environmental Science and Technology, vol. 41,
pp.1995-2000.
Liu, R., Shieh, R.S., Yeh, R.Y.L. and Lin, C.H. (2009). The general utilization of scrapped PC
board. Waste Management, vol. 29, pp. 2842-2845.
Lohse, J., Winteler, S. and Wulf-Schnabel, J. (1998). Collection targets for waste from electrical
and electronic equipment (WEEE) the directorate general (DG XI) environment. Nuclear safety and
civil protection of the Commission of the European Communities.
LME (2018). London Metal Exchange-Metals. Available online: https://www.lme.com/en-GB/Metals
[Accessed June-September 2018]
LME (2018b). London Metal Exchange- Market Data. Available online: https://www.lme.com/en-
GB/Market-Data [Accessed June-September 2018]
Long, L., Sun, S., Zhong, S., Dai, W., Liu, J. and Song, W. (2010). Using vacuum pyrolysis and
mechanical processing for recycling waste printed circuit boards. Journal of Hazardous Materials,
vol.177, pp. 626-632.
Lydall, M., Nyanjowa, W. and James, Y. (2017). Mapping South Africa’s Waste Electrical and
Electronic Equipment (WEEE) Dismantling, Pre-Processing and Processing Technology
Landscape. Waste Research Development and Innovation Roadmap Research Report. March
2017. Mintek external report #7574.
Mackay, T., (2004). Where do PCs go to die?” PC Format, August., pp. 16-20.
Stellenbosch University https://scholar.sun.ac.za

255
Maeda, Y., Inoue, H., Kawamura, S. and Ohike, H. (2000). Metal Recycling at Kosaka Smelter. In:
Proceedings of the 4th International Symposium on Recycling of Metals and Engineering Materials,
Pittsburgh, PA, USA, 22-25 October 2000.
Maes, C., Tinkler, O., Moore, T. and Mejias, J. (2003).The evolution of modified aldoxime copper
extractants.” Copper, Santiago, Chile, 30 November-3 December, 2003. Ed. Riveros, P.A. Dixon,
D.G., Dreisinger, D.B. and Menacho, J.M. Montreal Quebec: Canadian Institute of Mining,
Metallurgy and Petroleum, pp. 753-760.
Mail & Guardian (2018). South Africans are drowning in 2 waste. https://mg.co.za/article/2018-03-
16-00-south-africans-are-drowning-in-2-waste [Accessed 27 May 2018]
Makanza, A.T. (2006). Chapter 8: Activation of Pyrite by Pb2+ and Cu2+ in the presence of
Cyanide, University of Pretoria, Pretoria, South Africa.
https://repository.up.ac.za./bitstream/handle/2263/23759/08chapter8.pdp?sequence=9 [Accessed
10 June 2018]
Maki, T. (1999). Evolution of Cathode Quality at Phelps Dodge Mining Company. Society for
Mining, Metallurgy and Exploration.
Mandl, F. Statistical Physics, Wiley, London, 11971 ISBN 0 471 56658 6, pp. 88.
Manjengwa E.R. (2011). Interim research and development – Silicic acid production by Zimphos
Technical Services Department, Zimbabwe Phosphate Industries.
Manjengwa E.R. (2014). Efficiency report - Phosphate Boilers section. Technical Services
Department, Zimbabwe Phosphate Industries March 2014.
Manjengwa, E R. (2008). Zimbabwe Phosphate Industries Technical services projects report,
(period May 2008 – December 2008).
Manjengwa, E.R. (2009). Zimbabwe Phosphate Industries Technical services projects report,
(period January 2009 – December 2009).
Manjengwa, E.R. (2009b). Zimbabwe Phosphate Industries Cleveland Water Treatment Plant
commissioning report (June 2009- October 2009).
Manjengwa, E.R. (2018). E-Waste recycling machine, E-mail to S. Wong [Online], 2 May. Available
E-mail: [email protected].
Manjengwa, E.R. (2018b). Price enquiry for DXG-F7 and FC-1100, E-mail to N. Shwartz [Online],
11 August. Available messaging thread:
https://www.linkedin.com/messaging/thread/6433997692652916736/
marketsandmarkets (2011). Global E-Waste Management Market (2011-2016) Report Code:
SE1588, Retrieved from: marketsandmarkets.com. Publishing Date: August 2011
Stellenbosch University https://scholar.sun.ac.za
256
Marsden, J.O. and House, C.I. (1992). The chemistry of gold extraction, New York, N.Y.: Horwood.
Marsden, J.O. and House, C.I. (2006). The Chemistry of Gold Extraction (2nd Edition). Society of
Mining, Metallurgy and Exploration, Littleton, Colorado, USA.
McNulty, T. (2001). Cyanide substitutes. Mining Magazine.vol. 184, no. 5, pp. 256-261.
Mecucci, A. and Scott.K. (2002). Leaching and electrochemical recovery of copper, lead and tin
from scrap printed circuit boards, Journal of Chemical Technology and Biotechnology. vol. 77, no.
4, pp. 449-457.
MEPS - world stainless steel prices (2018). http://www.meps.co.uk/stainless%20prices.htm.
[Accessed 15 August 2018]
Metal Recyclers Association of South Africa (MRA) (2017).www.mra.co.za/about-us.php.
[Accessed 27 October 2017]
Miller, G.M. (1995). The problem of manganese and its effects on copper SX-EW operations.
Copper, Santiago, Chile, 26-29 November 1995. Ed. W.C. Cooper, D.B. Dreisinger, J.E. Dutrizac,
H. Hein, and G. Ugarte. Montreal, Quebec: Canadian Institute of Mining Metallurgy and Petroleum,
pp. 649-663.
Mirza, A., Burr, M., Ellis, T., Evans, D., Kakengela, D., Webb, L., Gagnon, J., Leclercq, F and
Johnston, A. (2016). Corrosion of lead anodes in base metals electrowinning. The Journal of The
Southern African Institute of Mining and Metallurgy, vol.116, pp. 533-538.
MIT (2011). Educational course on material properties
http://web.mit.edu/course/3/3.11/www/modules/props.pdf. [Accessed 12 August 2018]
Mohabuth, N., P. Hall, P. and Miles, N. (2007). Investigating the use of vertical vibration to recover
metal from electrical and electronic waste. Minerals Engineering, vol, 20, no. 9, pp. 926-932,
SPEC ISS.
Mohotsi, M. (2016). Johannesburg Metro PoTable Water Quality Report. Reports for Date
generated: 05 January 2016 Metro 21 November 2015 to 22 December 2015.
Monhemius, A.J. (1987). Recent advances in the treatment of refractory gold ores. Paper
presented at II Meeting of the Southern Hemisphere on Mineral Technology, Rio de Janeiro.
Mouton, A.J.J. & Wichers, J.H. 2016. A proposed model for South Africa to effectively recycle and
dispose waste electrical and electronic equipment. In Van Dyk, L., ed. Proceedings of the 27th
annual Southern African Institute for Industrial Engineering Conference, 27-29 October,
Stonehenge, South Africa. p.87-101. [http://conferences.sun.ac.za/index.php/saiie27/saiie27]
Stellenbosch University https://scholar.sun.ac.za

257
Mpinga, C.N. (2012). The extraction of precious metals from alkaline cyanided medium by granular
activated carbon. MSc Thesis, Department of Process Engineering, Stellenbosch University,
Stellenbosch, South Africa.
Msuku, D. (2012). Commissioning of the SPD 1500 Duplex Water Softening Unit. Improchem
Water and Energy Solutions, Zimbabwe district 17th June 2012
Mukariri, W. (2010). Proforma invoice dosing pumps, dosing tanks and tubing for Cleveland Water
treatment plant. Improchem Water and Energy Solutions, Zimbabwe district 30 April 2010.
Mukariri, W. (2012). Proforma invoice SPD 1500 Duplex Water Softening Unit. Improchem Water
and Energy Solutions, Zimbabwe district 6 August 2012.
Mukutuma, A., Mbao, B., Schwarz, N., Chisakuta, G. and Feather, A. (2007). A case study on the
operation of a Flottweg Tricanter® centrifuge for solvent-extraction crud treatment at Bwana
Mkubwa, Ndola, Zambia, Fourth Southern African Base Metals Conference, Symposium Series
S47, SAIMM, Johannesburg 2007; pp 393-404.
Mulaudzi, N and Kotze, M.H. (2013). Mintek. Direct cobalt electrowinning as an alternative to
intermediate cobalt mixed hydroxide product. The Southern African Institute of Mining and
Metallurgy Base Metals Conference.
Mwale, A.N. (2009). Comparison of LIX 984NC versus ACORGA M5774 for copper extraction
process, University of Zambia, Zambia.
Namias, J. (2013). The future of electronic waste recycling in the United States: Obstacles and
domestic solutions, MSc Thesis, Department of Earth and Environmental Engineering, Columbia
University, USA. Available online:
http://www.seas.columbia.edu/earth/wtert/sofos/Namias_Thesis_07-08-13.pdf [Accessed 11
December 2017].
Naseri Joda, N. and Rashchi, F. (2012). Recovery of ultra fine grained silver and copper from PC
board scraps. Separation and Purification Technology, vol. 92, pp. 36-42.
Needhidasan, S., Samuel, M. and Chidambaram, R. (2014). Electronic Waste – an emerging threat
to the environment of urban India. Journal of Environmental Health Science and Engineering, vol
12, no. 36, http://wwwijehse.com/content/12/1/36.
Niu, Q., Liu, X., Xiang, D. and Duan, G. (2007). The recycle model of printed circuit board and its
economy evaluation. In: Electronics & the Environment, Proceedings of the 2007 IEEE
International Symposium on: IEEE, pp. 106-111.
Nnorom, I.C. and Osibanjo, O. (2008). Review. Electronic waste (e-waste): Material flows and
management practices in Nigeria. Waste Management, vol. 28, pp. 1472-1479.
Stellenbosch University https://scholar.sun.ac.za

258
OECD (2001). Extended producer responsibility: a guidance manual for governments. Paris:
OECD; 2001.
OECD (2008). OECD Environmental Outlook to 2030. Organisation for Economic Cooperation and
Development http://213.253.134.43/oecd/pdfs/browseit/970801 1E. PDF, 2008.
Ogunniyi, I. O., Vermaak, M. K. G., and Groot, D. R. (2009). Chemical composition and liberation
characterization of printed circuit board comminution fines for beneficiation investigations. Waste
Management, vol. 29, no.7, pp. 2140–2146. https://doi.org/10.1016/j.wasman.2009.03.004
Ogunniyi, I.O. and Vermaak, M.K.G. (2007). Improving printed circuit board physical processing –
an overview. In: Proceedings of European Metallurgical Conference, Dusseldorf, Germany.
Ogunniyi, I.O. and Vermaak, M.K.G. (2009). Froth flotation for beneficiation of printed circuit
boards comminution fines: an overview. Mineral Processing and Extractive Metallurgy Review, vol.
30, pp.101-121.
Oishi, T. Koyama, K. Alam, S. Tanaka, M. and Lee, J.C. (2007). Recovery of high purity copper
cathode from printed circuit boards using ammoniacal sulphate or chloride solutions.
Hydrometallurgy, vol. 89 no. (1-2), pp. 82-88.
OSHA (2018). https://www.osha.gov/dsg/annotated-pels/ [Accessed 3 July 2018]
Park, Y.J. and Fray, D.J. (2009). Recovery of high purity precious metals from printed circuit
boards. Journal of hazardous Materials, vol. 164, pp. 1152-1158.
Patil, T.A. and Patil, S.T. (2015). Techno-economic Feasibility of Recycling E-waste to Recover
Precious Metals. International Journal of Advanced Scientific and Technical Research, vol. 7, no.
5.
Payscale (2018). Electrician salary.
https://www.payscale.com/research/ZA/Job=Electrician/Salary/a1a5594c/Artisan [Accessed 23
August 2018]
Payscale (2018b). https://www.payscale.com/research/ZA/ [Accessed 23 August 2018]
Perry, R. H., Green, D.W. and Maloney, J.O, Eds. (1997). Chemical Engineer’s Handbook (7th
Edition), New York: McGraw-Hill.
Peters, M.S. and Timmerhaus, K.D. (1991). Plant design and economics for chemical engineers
(4th Edition). McGraw-Hill, New York, USA.
Petter, P.M.H., Veit, H.M. and Bernardes, A.M. (2014). Evaluation of gold and silver leaching from
printed circuit board of cellphones. Waste Management , vol, 34, pp. 475-482.
Power, M. (2004). OECD Development Centre Seminar: Cheaper Money for Southern Africa-
Unlocking Growth. 7 October 2004, Paris.
Stellenbosch University https://scholar.sun.ac.za

259
Prengaman, D.R. and Siegmund, A. (1999). Improved copper electrowinning operations using
wrought Pb-Ca-Sn anodes. Copper 99-Cobre 99. In Proceedings: International Symposium
(Phoenix , Arizona), October 10-13, pp.1-11, 1999.
Purolite (2014). Application Guide Purolite Water Softening Resin _01 07 2014_AC.
www.purolite.com/dam/jcr:58133bec-8fe3-45d2-9afe-4a9c16eab21d/Application [Accessed 1
August 2018]
Pyper, R.A. and Hendrix, J.L.(1981). Extraction of gold from finely disseminated gold ores by use
of acidic thiourea solution. Extractive Metallurgy, 81. Institution of Mining ad Metallurgy, London,
pp. 57-75.
Quinet, P., Proost, J. and Van Lierde, A. (2005). Recovery of precious metals from electronic scrap
by hydrometallurgical processing routes. Minerals and Metallurgical Processing, vol. 22, no. 1, pp.
17-22.
Treybal, R. E. (1963). Liquid Extraction, (2nd Edition), McGraw-Hill, New York, 1963.
Ramadorai, G. (1993). Use of chlorine in the processing of gold ores. In: Mishra, R.K. (Ed.),
Precious Metals 1993. International Precious Metals Institute, Pennsylvania, pp. 265-279.
Rao, G.V. and Misra, V.N. Eds. (2004) Mineral Processing Technology, (Allied Publishers Pvt. Ltd
2004) ISBN: 81-7764-599-4.
Readett, D.J. and Miller, G.M. (1995). The impact of silica on solvent extraction: Girilambone
Copper Company case study. Copper, Santiago, Chile, 26-29 November 1995. (Eds.), Cooper,
W.C., Dreisinger, D.B., Dutrizac, J.E., Hein, H. and Ugarte. G. Montreal, Quebec: Canadian
Institute of Mining Metallurgy and Petroleum, pp. 679-690.
Renovare (2011). Renovare International, Inc. Reviewing the operation of gold electrowinning cells
RenoCell® Technical Bulletin June 28 2011 static1.1.sqspcdn.com/static/f/926595/.../RRII-
+110010-0-AuRENOCELL.pdf [Accessed 24 July 2018]
Uhlig (2011). Revie,R.W . ed., Uhlig’s Corrosion Handbook, (3rd Edition), John Wiley & Sons, 2011.
Ritcey, G.M. and Ashbrook, A.W. (1979). Solvent Extraction, Principles and applications to
Process Metallurgy. Part I, Elsevier, Amsterdam.
Ritcey, G.M. and Ashbrook, A.W. (1979). Solvent Extraction, Principles and applications to
Process Metallurgy. Part II, Chapters 4-6, Elsevier, Amsterdam.
Robinson, H.B. (2009). E-waste: An assessment of global production and environmental impacts.
Science of the Total Environment, vol. 408, pp.183-191.
Stellenbosch University https://scholar.sun.ac.za

260
Robinson, T.G., Sole, K.C., Sandoval, S., Moats, M.S., Siegmund, A. and Davenport, W.G. (2013).
Copper electrowinning: 2013 World tank house operating data. Proceedings of Copper 2013,
Santiago, Chile.
Rockwood, A.L. (2015). Meaning and measurability of single ion activities, the thermodynamic
foundations of pH, and the Gibbs free energy for the transfer of ions between dissimilar
materials. Physical Chemistry, vol. 16, pp. 1978–1991. doi:10.1002/cphc.201500044.
Rogans, J. (2012). Activated Carbon in Gold Recovery; Kemix: 2012.
http://www.kemix.com/brochures/Kemix_Activated-Carbon-In-Gold-Recovery.pdf
Rossouw W.A. (2015). Effect of mechanical pre-treatment on leaching of base metals from waste
printed circuit boards, MEng Thesis, Stellenbosch University, Stellenbosch, South Africa.
Roux, E., Gnoinski, J., Ewart, I. and Dreisinger, D. (2007). Cu-Removal from the Skorpion Circuit
using EMEW® Technology. (2007) The Southern African Institute of Mining and Metallurgy The
Fourth Southern African conference on Base Metals.
http://www.saimm.co.za/Conferences/BM2007/027_044_Roux.pdf [Accessed 24 June 2018]
Sadeghi, N., Alamdari, E.K., Fatmehsari, D.H., Darvishi, D., Alamdari, A. and Kafash Rafsanjani,
A.B. (2013). Solvent Extraction of Gold form Chloride Solution by Tri-Butyl Phosphate (TBP). 23rd
International Mining Congress and Exhibition of Turkey. 16-19 April 2013 ANTALYA.
Saeedi, M., Alamdari, E.K., Fatmehsari, D.H., Alamdari, E.K., Darvishi, D., Alamdari, A.K. and
Kafash Rafsanjani, A.B. (2013). Effect of Temperature on Dissolution of Gold from Copper Anode
Slime. 23rd International Mining Congress &Exhibition of Turkey. 16-19 April 2013 ANTALYA.
Schluep, M., Hagelueken, C., Kuehr, R., Magalini, F., Maurer, C., Meskers, C., Mueller, E. and
Wang, F. (2009). Recycling – from e-waste to resources, Sustainable innovation and technology
transfer industrial sector studies, United Nations Environmental Programme (UNEP), Paris, France
2009.
Schluep, M. (2014). Case study e-waste management. E-Waste – Multi Country Case Study. July
2014.
Schneiderhöhn, H. (1962). Erzlagerstätten-Kurzvorlesungen zur Einführung und Wiederholung,
Fischer, Jena. pp. 371.
Schoeman, E. (2012). Recovery of platinum, palladium and gold from a pregnant cyanide heap
leach solution, with the use of ion exchange resins. MSc Thesis, Department of Process
Engineering, Stellenbosch University, South Africa.
Schubert, I.H., Barker, 1.J. and Swartz, C.L.E. (1993). Performance evaluation of a carbon-inpulp
plant by dynamic simulation, Journal of the Southern African Institute of Mining and Metallurgy
Johannesburg , vol. 93, no. 11-12, pp. 293-299.
Stellenbosch University https://scholar.sun.ac.za
261
Sell, A. (1997) Inflation: does it matter in project appraisal? Project Appraisal, 12:2, 107-118, DOI:
10.1080/02688867.1997.9727047.
Senanayake, G. (2004). Gold leaching in non-cyanide lixiviant systems: critical issues on
fundamentals and applications. Minerals Engineering, vol. 17, pp. 785-801.
Shamim, A., Mursheda, A. and Rafiq, I. (2015). E-Waste Trading Impact on Public Health and
Ecosystem Services in Developing Countries. International Journal of Waste Resources, vol,5, no.
4 Doi:10.4172/2252-5211.1000188.
Sheng, P.P. and Estell, T.H. (2007). Recovery of gold from computer circuit board scrap using
aqua regia. Waste Management Research, vol. 25, no. 4, pp. 380-383.
Shuey, S.A., Vidal, E.E. and Taylor, P.R. (2006). Pyrometallurgical processing of electronic waste.
Proceedings of the SME Annual Meeting, St.Louis, MO., F, 2006.
Shuey, S.A. and Taylor, P.A. (2004). A review of Pyrometallurgical Treatment of Electronic Scrap.
In Proceedings of the SME Annual Meeting, Denver, CO, USA, 23-25 February 2004.
Silvana, D., Vlastimir, T., Aleksandra, I., Stevan, D. and Mladen, M. (2013). Recycling of precious
metals from E-scrap. Iranian Journal of Chemistry and Chemical Engineering, vol. 32, no. 4.
Sinha, D. (2004). The management of electronic waste: a comparative study on India and
Switzerland. Masters Thesis, University of St. Gallen, St. Gallen.
Snyders, C.A., Mpinga, C.N., Bradshaw, S.M., Akdogan, G. and Eksteen, J.J. (2013). The
application of activated carbon for the adsorption and elution of platinum group metals from dilute
cyanide leach solutions. Journal of the South African Institute of Mining and Metallurgy, vol. 113,
no. 5, pp. 381 - 388.
Snyders, C.A. (2015). The adsorption and elution of Pt-, Pd- and Au cyanide using activated
carbon, PhD Thesis, Stellenbosch University, Stellenbosch, South Africa.
Snyders, C.A., Akdogan, G., Bradshaw, S.M. and van Wyk, A.P. (2017). Gold CIP and CIL process
optimization in a capital constraint environment. The Journal of the Southern African Institute of
Mining and Metallurgy, vol 17. http://dx.doi.org/10.17159/2411-9717/2017/v117n8a13.
Sole, K. C., Viljoen, K., Ferreira, B., Soderstrom, M., Tinkler, O. and Hoffman, L. (2007a).
Customising copper–iron selectivity in modified aldoxime extractants: pilot plant evaluation. In
Proceedings copper 2007, vol. IV, book 2, 3–14. Montreal: Canadian Institute of Mining, Metallurgy
and Petroleum.
Sole, K. C., Zárate, G., Steeples, J., Tinkler, O. and Robinson, T.G. (2013). Global survey of
copper solvent extraction operations and practices. Conference Paper · January 2013.
Stellenbosch University https://scholar.sun.ac.za

262
Sole, K.C. and Tinkler, O.S. (2016). Copper solvent extraction: Status, operating practices, and
challenges in the African Copperbelt. Journal of the Southern African Institute of Mining and
Metallurgy, Johannesburg , vol. 116, no. 6, pp. 553-560. Available online:
<http://www.scielo.org.za/scielo.php?script=sci_arttext&pid=S2225-
62532016000600012&lng=en&nrm=iso>. [Accessed 25 June 2018].
http://dx.doi.org/10.17159/2411-9717/2016/v116n6a10.
soleconsulting ( 2013). Copper electrowinning world operating tank house data. Available online:
soleconsulting.co.za/publications/Cu4.xlsx
Somasundaram, M., Saravanathamizhan, R., Ahmed Basha, C., Nandakumar, V., Nathira Begum,
S. and Kannadasan, T. (2014). Recovery of copper from scrap printed circuit board: modelling and
optimization using response surface methodology. Powder Technology, vol. 266, pp.1-6.
South African Reserve Bank statistics (2018),
https://www.resbank.co.za/Research/Statistics/Pages/MonthlyReleaseOfSelectedData.aspx
[Accessed 13 March 2018]
Sridhar, V., Verma J.K., and Kumar, S.A. (2009). Selective Separation of Copper and Nickel by
Solvent Extraction Using LIX 984N. Hydrometallurgy, vol. 99, No. 1-2, REFERENCES 2009, pp.
124-126. doi:10.1016/j.hydromet.2009.07.007.
Stange, W. (1999).The process design of gold leaching and carbon-in-pulp circuits. The Journal of
The South African Institute of Mining and Metallurgy, vol. 99, no. 1, pp. 13-26.
StEP (2013). Available online: http://www.step-initiative.org/Overview_South_Africa.html
[Accessed 27 November 2017]
StEP (2005). Solving the e-waste problem: a synthetic approach (StEP), Draft Project Document;
2005. http://step.ewaste.ch.
Steyn, J. and Sandenbergh, R.F. (2004). A study of the influence of copper on the gold
electrowinning process. The Journal of The South African Institute of Mining and Metallurgy,
https://www.saimm.co.za/Journal/v104n03p177.pdf [Accessed 29 June 2018]
Steyn, R. (2010). Available online: https://rsteyn.files.wordpress.com/2010/07/elution-and-carbon-
reactivation-basics.pdf [Accessed 29 June 2018]
SAICM (2009). Strategic Approach to International Chemicals Management. International
Conference on Chemicals Management: emerging policy issues. Second session. Geneva, 11-15
May 2009. SAICM/ICCM.2/INF/36.
streamlinecircuits (2016). Printed circuit boards http://streamlinecircuits.com/2016/06/introduction-
types-printed-circuit-boards/ [Accessed 15 October 2017]
Stellenbosch University https://scholar.sun.ac.za

263
Sum, E.L. (1991). The recovery of metals from electronic scrap. Journal of Metallurgy, vol. 43, pp.
53-61.
Sum, E.Y.L. (2005). Recovery of metals from electronic scrap. Journal of the Minerals Metals &
Materials Society, vol. 43, pp. 53-61.
Syed, S., (2006). A green technology for recovery of gold from non-metallic secondary sources.
Hydrometallurgy, vol. 82, pp. 48-53.
Syed. S. (2012). Recovery of gold from secondary Sources – A review. Hydrometallurgy, vol. 115-
116, pp. 30-51.
tradingeconomics (2018). Available online: https://tradingeconomics.com/south-africa/interest-rate.
[Accessed 9 March 2018]
Tuncuk, A., Stazi, V., Akcil, A., Yacizi, H. and Devici, H. (2012). Aqueous metal recovery
techniques from e-scrap: Hydrometallurgy in recycling. Minerals Engineering, vol. 25, pp. 28-37.
Turton, R., Baile, R.C., Whiting, W.B. and Shaeiwitz, J.A. (2009). Analysis, Synthesis, and Design
of Chemical Processes, (3rd Edition). Upper Saddle River, N,J., Prentice Hall.
Ueberschaar, M., Otto, J.S. and Rotter, S.V. (2017). Challenges for critical raw material recovery
from WEEE-The case study of gallium. Waste Management, vol. 60, pp. 534-545.
UNEP (2006). UNEP. Call for Global Action on E-waste. United Nations Environment Programme;
2006.
UNEP (2007). E-waste Inventory assessment Manual Volume 1.
UNEP (2013). Global Waste Management Outlook 2015.
UNEP (2013). Metal recycling: opportunities, limits, infrastructure, 2013.
United Nations Environment Programme (2009). Recycling-From e-waste to resources- Final
Report. – Sustainable Innovation and Technology Transfer Industrial Sector Studies
http://www.unep.fr/shared/publications/pdf/DTIx1192xPA-
Recycling%20from%20ewaste%20to%20Resources.pdf [Accessed 26 October 2017]
USGS (2014). USGS/PGMs, 2014. Minerals Yearbook of Platinum-group metals Available online:
http://minerals.usgs.gov/minerals/pubs/commodity/platinum/ [Accessed 28 November 2017]
USGS (2017).minerals.usgs.gov/minerals/pubs/commodity/gold/mcs-2017-gold.pdf. [Accessed 27
November 2017]
USGS (2017a). Historcal statistics. Available online:
https://minerals.usgs.gov/minerals/pubs/historical-statistics/ accessed [29 November 2017]
Stellenbosch University https://scholar.sun.ac.za

264
USGS (2017b). Silver commodity price. Available online:
https://minerals.usgs.gov/minerals/pubs/commodity/silver/mcs-2017-silve.pdf [Accessed 28
November 2017]
van Aswegen, P.C., van Niekerk, J. and Olivier, W. (2007). The BIOX ™ process for the treatment
of refractory gold concentrates. In: Rawlings, D.E., Johnson, D.B. Eds. Biomining. Springer-Verlag,
Berlin Heidelberg, pp. 1-33.
van Heukelem, A.M.H., Reuter, M.A., Huisman, J., Hagelüken, C. and Brusselaers, J. (2004). Eco
efficient optimization of pre-processing and metal smelting. Electronics Goes Green 2004+,
Congress Proceedings, Sept. 6-8, 2004, Berlin, 657-661.
van Tonder, C. and Sole, M.J. (2006). Innovations in precious metal recovery. Journal of the South
African Institute of Mining and Metallurgy, vol. 106, no. 4, pp. 297 - 304.
van Wyk. A.P. (2014). Flowsheet development and comparison for the recovery of precious metals
from cyanide leach solutions, MEng Thesis, Stellenbosch University, Stellenbosch, South Africa.
Veit, H.M., Bernardes, A.M., Ferreira, J.Z., Tenório, J.A.S. and de Fraga Malfatti, C. (2006).
Recovery of copper from printed circuit boards scraps by mechanical processing and
electrometallurgy. Journal of Hazardous Materials, vol. B137, pp. 1704-1709.
Veldhurizen, H. and Sippel, B. (1994). UNEP Industry and Environment, vol. 17, no. 3-4.
Wadsworth, M.E. (1987). Handbook of Separation Process Technology, Chapter 9 Leaching –
Metals Applications. Ed. Ronald W. Rousseau. Georgia Institute of Technology. pp 500-535.,
Published by John Wiley and Sons.
Walker, C.H.H. (1863). Products of the action of nitric acid on tin. Journal of the Chemical Society,
Transactions articles, vol. 63, pp. 845-852, http://dx.doi.org/10.1039/CT8936300845.
Wang, C. Y. (2005). Crud formation and its control in solvent extraction. In Proceedings
international solvent extraction conference. Beijing: China Academic Journal Electronic Publishing
House.
Wang, J. and Chen, M. (2011). Recycling of Electronic Control Units from End-of-Life Vehicles in
China. Recycling of Electronic Wastes. Journal Of The Minerals Metals & Materials Society, vol 63,
no. 8 https://doi.org/10.1007/s11837-011-0136-9 [Accessed 7 April 2018].
Wang, X. and Gaustad, G. (2012). Prioritizing material recovery for end-of-life printed circuit
boards. Waste Management, vol. 32, pp.1903-1913.
Webelements (2018). Lead chemistry. Available online:
https://www.webelements.com/lead/chemistry.html [Accessed 26 June 2018]
Stellenbosch University https://scholar.sun.ac.za
265
Wernick, I. K. and Themelis, N. J. (1998). Industrial Ecology of Earth Resources (EAEE E4001),
Week 10: Metals and Environment. Recycling metals for the environment. Annual Review Energy
Environment, vol. 23, pp.465-497.
Widmer, R. and Lombard, R. (2005). e-Waste assessment in South Africa – A case study of the
Gauteng province. EMPA Materials Science and Technology.
Widmer, R., Oswald-Krapf, H., Sinha-Khetriwal, D., Schnellmann, M. and Böni, H. (2005). Global
perspectives on e-waste. Environmental Impact Assessment Review, vol. 25, pp. 436-458.
Winter, O. (1969). Preliminary Economic Evaluation of Chemical Processes at the Research Level.
Industrial and Engineering Chemistry, vol. 61, no. 4.
Wu, J., Chen, L. and Qiu, L. (2008). Gold and silver selectively leaching gold from waste printed
circuit boards with thiourea. Gold, vol. 29 no. 6, pp. 55-58.
Xiang, D., Mou, P., Wang, J., Duan, G. and Zhang, C.H. (2007). Printed circuit board recycling
process and its environmental impact assessment. International Journal of Advanced.
Manufacturing Technology, vol. 34: 1030-1036 DOI 10.1007/s00170-006-0656-6
Xiao, Y., Yang, Y., van den Burg, J., Sietsma, J., Agterhuis, H., Visser, G. and Bol, D. (2013).
Hydrometallurgical recovery of copper from complex mixtures of end-of-life shredded ICT products.
Hydrometallurgy, vol. 140, pp. 128-134.
Yamane, H.L., de Moraes, V.T., Espinosa, D.C.R. and Tenório, J.A.S. (2011). Waste Management,
vol. 31, pp. 2553-2558.
Yang, J., Wu, Y. and Li, J. (2012). Recovery of ultrafine copper particles from metal components of
waste printed circuit boards. Hydrometallurgy, vol.121-124, pp.1- 6.
Yannapoulos, J.C. (1991). The Extractive Metallurgy of Gold. Van Nostrand Reinhol, USA.
Yazici, E.Y. and Devici, H. (2015). Cupric chloride leaching (HCl-CuCl2-NaCl) of metals from waste
printed circuit boards (WPCBs). International Journal of Mineral Processing, vol. 134, pp. 89-96.
Yazici, E.Y., Devici, H. and Yazici, R. (2015b). Base and precious metal losses in magnetic
separation of waste printed circuit boards. Proceeding of EMC 2015, Düsseldorf, Germany.
pp:649-662.
Yu, S., J. Peng, J., Zhang, X. and Wang, G. (2016). A Simulation on the Regeneration of Activated
Carbon with an Indirect Heating. Kemija u. Industriji, vol. 65, no. 9-10, pp. 465−470.
Zanitsch, R.H. and Lynch, R.T. (1978). Selecting a thermal regeneration system for activated
carbon. Chemical Engineering, vol. 85, no. 1, pp. 95 - 100.
Zeng, X., Li, J., Xie, H. and Liu, L. (2013). A novel dismantling process of waste printed circuit
boards using water-soluble ionic liquid. Chemosphere, vol. 93, pp. 1288-1294.
Stellenbosch University https://scholar.sun.ac.za
266
Zeng, X., Song, Q., Li, J., Y, W., Duan, H. and Liu, L. (2015). Solving e-waste problem using an
integrated mobile recycling plant. Journal of Cleaner Production, vol. 90, pp. 55-59.
Zhan, L. and Xu, Z. (2009). Separating and recycling metals from mixed metallic particles of
crushed electronic wastes by vacuum metallurgy. Environmental Science and Technology, vol. 43,
pp. 7074-7078.
Zhan, L. and Xu, Z. (2011). Separating criterion of Pb, Cd, Bi and Zn from metallic particles of
crushed electronic wastes by vacuum evaporation. Separation Science and Technology, vol. 47,
pp. 913-919.
Zhang, S. and Forssberg, E. (1997). Mechanical separation –oriented characterization of electronic
scrap, Resources Conservation Recycling, vol. 21, pp. 247-269.
Zhang, S. and Forssberg, E. (1998). Optimization of electrodynamic separation for metals recovery
from electronic scrap. Resources Conservation Recycling, vol. 22, pp.143-162.
Zhang, S. and Forssberg, E. (2007). Characterization of shredded television scrap and
implications for material recovery, Waste Management, vol. 27, no. 3, pp. 415-424.
Zhang, S., Ding, Y., Liu, B. and Chang, C. (2017). Supply and demand of some critical metals and
present status of their recycling in WEEE. Waste Management, vol. 65, 113-127.
Zhang, W. and Cheng, C.Y. (2007b). Manganese metallurgy review. Part III: Manganese control in
zinc and copper electrolytes. Hydrometallurgy, vol. 89, pp. 178-188.
Zhang, Y., Liu, S., Xie, H., Zeng, X. and Li, J. (2012). Current status on leaching of precious
metals from waste printed circuit boards. The 7th International Conference on Waste Management
and Technology. Procedia Environmental Sciences, vol. 16, pp. 500-568.
Zhao, M., Li, J., Yu, K., Zhu, F. and Wen, X. (2006). Measurement of Pyrolysis contamination
during Crushing of Waste Printed Circuit Board (in Chinese), Journal of Tsinghua University, vol.
46, pp. 1995-1998.
Zhou, G., Luo, Z. and Zhai, X. (2007). Experimental study on metal recycling from waste PCB:
Proceedings of the International Conference on Sustainable Solid Waste Management, Chennai,
India: pp. 155-162.
Zhou, Y. and Qiu, K. (2010). A new technology for recycling materials from waste printed circuit
boards. Journal of Hazardous Materials, vol. 175, no.1-3, pp. 823-828.
Stellenbosch University https://scholar.sun.ac.za

267
APPENDICES
A: Mass balances used for the economic
evaluations
The mass balances that are detailed in this appendix were updated from the original design
specifications and empirical work presented by Rossouw (2015) and de Waal (2018).
Stellenbosch University https://scholar.sun.ac.za

268
298
Table A.1: Mass balances for the shredding and milling plant at a design basis of 400Tonnes processing capacity of WPCBs
(adapted from Rossouw, 2015; de Waal, 2018)
Pre-treatment mass balance
Units 1 2 3 4 5 6 7 8 9
Temperature (K) 298,15 298,15 298,15 298,15 298,15 298,15 298,15 298,15
Pressure (kPa) 101,32 101,32 101,32 101,32 101,32 101,32 101,32 101,32
Material Flow (Total) kg/hr 61,05 61,05 61,05 61,05 0,00 0,00 61,05 0,00 61,05
Metal Flow (Total) kg/hr 24,42 24,42 24,42 24,42 0,00 24,42 0,00 24,42
Ferrous Metal kg/hr 4,97 4,97 4,97 4,97 0,00 4,97 0,00 4,97
Fe kg/hr 4,97 4,97 4,97 4,97 4,97 0,00 4,97
Non-Ferrous Metal kg/hr 19,45 19,45 19,45 19,45 0,00 19,45 0,00 19,45
Cu kg/hr 12,43 12,43 12,43 12,43 12,43 0,00 12,43
Al kg/hr 1,24 1,24 1,24 1,24 1,24 0,00 1,24
Sn kg/hr 2,49 2,49 2,49 2,49 2,49 0,00 2,49
Ni kg/hr 1,24 1,24 1,24 1,24 1,24 0,00 1,24
Zn kg/hr 0,62 0,62 0,62 0,62 0,62 0,00 0,62
Pb kg/hr 1,24 1,24 1,24 1,24 1,24 0,00 1,24
Mn kg/hr 0,00 0,00 0,00 0,00 0,00 0,00 0,00
Sb kg/hr 0,00 0,00 0,00 0,00 0,00 0,00 0,00
Au kg/hr 0,06 0,06 0,06 0,06 0,06 0,00 0,06
Ag kg/hr 0,12 0,12 0,12 0,12 0,12 0,00 0,12
Ceramic kg/hr 18,32 18,32 18,32 18,32 18,32 0,00 18,32
SiO2 kg/hr 9,16 9,16 9,16 9,16 9,16 0,00 9,16
Al2O3 kg/hr 3,66 3,66 3,66 3,66 3,66 0,00 3,66
Alkali and alkaline earth oxides kg/hr 3,66 3,66 3,66 3,66 3,66 0,00 3,66
Titanates and mica, etc. kg/hr 1,83 1,83 1,83 1,83 1,83 0,00 1,83
Plastic kg/hr 18,32 18,32 18,32 18,32 18,32 0,00 18,32
Polyethylene kg/hr 6,04 6,04 6,04 6,04 6,04 0,00 6,04
Polypropylene kg/hr 2,93 2,93 2,93 2,93 2,93 0,00 2,93
Polyesters kg/hr 2,93 2,93 2,93 2,93 2,93 0,00 2,93
Epoxies kg/hr 2,93 2,93 2,93 2,93 2,93 0,00 2,93
Polyvinyle chloride kg/hr 1,47 1,47 1,47 1,47 1,47 0,00 1,47
Polytetraflouroethane kg/hr 1,47 1,47 1,47 1,47 1,47 0,00 1,47
Nylon kg/hr 0,55 0,55 0,55 0,55 0,55 0,00 0,55
H2O kg/hr 0,00 0,00 0,00 0,00 0,00 0,00 0,00 0,00
Stream No.
Stellenbosch University https://scholar.sun.ac.za
Stellenbosch University https://scholar.sun.ac.za

269
Table A.2: Mass balances for the solder leaching plant at a design basis of 400Tonnes processing
capacity of WPCBs (adapted from Rossouw, 2015; de Waal, 2018)
Solder leaching mass balance
Units 9 10 11 12 13 14
Temperature (K) 298,15 298,15 306,00 306,00 306,00 306,00
Pressure (kPa) 101,32 405,00 1600,00 101,33 101,33 101,33
Material Flow (Total) kg/hr 61,05 957,30 1015,45 960,22 55,23 2,95
Metal Flow (Total) kg/hr 24,42 18,60 18,60 0,00
Ferrous Metal (Elemental) kg/hr 4,97 1,18 1,18
Fe kg/hr 4,97 1,18 1,18
Non-Ferrous Metal (Elemental) kg/hr 19,45 17,41 17,41
Cu kg/hr 12,43 12,40 12,40
Al kg/hr 1,24 1,05 1,05
Sn kg/hr 2,49 2,31 2,31
Ni kg/hr 1,24 0,83 0,83
Zn kg/hr 0,62 0,61 0,61
Pb kg/hr 1,24 0,03 0,03
Mn kg/hr 0,00 0,00 0,00
Sb kg/hr 0,00 0,00 0,00
Au kg/hr 0,06 0,06 0,06
Ag kg/hr 0,12 0,12 0,12
Ceramic kg/hr 18,32 18,32 18,32
SiO2 kg/hr 9,16 9,16 9,16
Al2O3 kg/hr 3,66 3,66 3,66
Alkali and alkaline earth oxides kg/hr 3,66 3,66 3,66
Titanates and mica, etc. kg/hr 1,83 1,83 1,83
Plastic kg/hr 18,32 18,32 18,32
Polyethylene kg/hr 6,04 6,04 6,04
Polypropylene kg/hr 2,93 2,93 2,93
Polyesters kg/hr 2,93 2,93 2,93
Epoxies kg/hr 2,93 2,93 2,93
Polyvinyle chloride kg/hr 1,47 1,47 1,47
Polytetraflouroethane kg/hr 1,47 1,47 1,47
Nylon kg/hr 0,55 0,55 0,55
Stream No.
E-
Wa
ste
Ele
me
nts
Rea
gents
H2O kg/hr 0,00 900,55 900,55 903,55
HNO3 kg/hr 56,75 35,06 35,06
NaCl kg/hr
Pb(NO3)2 kg/hr 1,94 1,94
Sn(NO3)2 kg/hr 0,36 0,36
Ni(NO3)2 kg/hr 1,30 1,30
Zn(NO3)2 kg/hr 0,03 0,03
Fe(NO3)3 kg/hr 16,40 16,40
Al(NO3)3 kg/hr 1,50 1,50
AgNO3 kg/hr 0,01 0,01
Cu(NO3)2 0,07 0,07
NO2 kg/hr 0,65
NO kg/hr 2,29
H2 kg/hr 0,01
AgCl kg/hr
NaNO3 kg/hr
Cu(NO3)2 kg/hr
H2O 2,99
Phase Liquid Liquid Slurry Liquid Solids Gas
Pro
du
cts
Rea
gents
Stellenbosch University https://scholar.sun.ac.za

270
Table A.3: Mass balances for the copper extraction plant at a design basis of 400Tonnes processing
capacity of WPCBs (adapted from Rossouw, 2015; de Waal, 2018)
Copper extraction mass balance
Units 13 15 16 17 18 19 20 21 22 23 24 25 26 27 28 29
Temperature (K) 306,00 298,00 298,00 312,00 312,00 312,00 312,00 298,00 312,00 301,00 301,00 301,00 345,00 345,00
Pressure (kPa) 101,33 400,00 400,00 1600,00 400,00 101,00 400,00 400,00 300,00 343,00 300,00 101,33 300,00
Material Flow (Total) kg/hr 59,01 29,66 273,81 0,00 359,13 41,62 317,51 3,96 321,47 308,19 747,96 737,20 9,70 2,44
Metal Flow (Total) 22,38
Ferrous Metal (Elemental) kg/hr 4,97 0,81 0,81
Fe kg/hr 4,97 0,81 0,81
kg/hr
Non-Ferrous Metal (Elemental) kg/hr 17,41 4,18 4,18
Cu kg/hr 12,403 0,43 0,4341
Al kg/hr 1,05 0,86 0,86
Sn kg/hr 2,31 2,29 2,29
Ni kg/hr 0,83 0,35 0,35
Zn kg/hr 0,61 0,04 0,04
Pb kg/hr 0,03 0,03 0,03
Mn kg/hr 0,00 0,00 0,00
Sb kg/hr 0,00 0,00 0,00
Au kg/hr 0,06 0,06 0,06
Ag kg/hr 0,12 0,11 0,11
Ceramic kg/hr 18,32 18,32 18,32
SiO2 kg/hr 9,16 9,16 9,16
Al2O3 kg/hr 3,66 3,66 3,66
Alkali and alkaline earth oxides kg/hr 3,66 3,66 3,66
Titanates and mica, etc. kg/hr 1,83 1,83 1,83
Plastic kg/hr 18,32 18,32 18,32
Polyethylene kg/hr 6,04 6,04 6,04
Polypropylene kg/hr 2,93 2,93 2,93
Polyesters kg/hr 2,93 2,93 2,93
Epoxies kg/hr 2,93 2,93 2,93
Polyvinyle chloride kg/hr 1,47 1,47 1,47
Polytetraflouroethane kg/hr 1,47 1,47 1,47
Nylon kg/hr 0,55 0,55 0,55
H2O kg/hr 20,76 228,91 249,66 257,98 257,98 257,98 0,48
HNO3 kg/hr
NaCl kg/hr
H2SO4 kg/hr 44,90 22,28 22,28 22,28 22,28
H2O2 kg/hr 8,90 1,05 1,05 1,05 1,05
LIX984N kg/hr
Cobalt sulphate 12,5% kg/hr 0,00478
Kerosene kg/hr
Pb(NO3)2 kg/hr
H2SnO3 kg/hr
Ni(NO3)2 kg/hr
Zn(NO3)2 kg/hr
Fe(NO3)3 kg/hr
Al(NO3)3 kg/hr
AgNO3 kg/hr
NO2 kg/hr
NO kg/hr
H2 kg/hr 0,00
AgCl kg/hr
NaNO3 kg/hr
Cu(NO3)2 kg/hr
CuSO4 kg/hr 30,06 30,06 30,06 6,01 81,25 56,87
Al2(SO4)3 kg/hr 1,23 1,23 1,23 1,23
FeSO4 kg/hr 2,20 2,20 2,20 2,20
NiSO4 kg/hr 1,26 1,26 1,26 1,26
ZnSO4 kg/hr 1,41 1,41 1,41 1,41
PbSO4 kg/hr 0,00 0,00 2,75
SnSO4 kg/hr 0,03 0,03 0,03
Ag2SO4 kg/hr 0,02 0,02 0,02
H2O kg/hr 8,31 564,76 563,40 1,36
H2SO4(aq) kg/hr 14,78 101,47 116,44
O2 kg/hr 2,44
Cu kg/hr 9,704
CoSO4 12,5% kg/hr 0,48318
V L/hr 282,16 3,80 285,95 285,95 646,91 646,91
Cu kg/hr 11,97 11,97 11,97 2,39 32,35 22,64 9,704
Cu (g/l) g/l 42,42 41,85 8,371 50,00 35,00
H2SO4 g/l 78,95 77,90 156,85 180,00
H2SO4(M) M
pH 1,37 1,80
NaOH M 2,00
NaOH kg/hr 0,30 0,30
H2O kg/hr 3,65 3,65
Phase kg/hr Solids LS + Cu-Raffinate PLS PLS Loaded Org Stripped Org Raffinate A-Electrolyte S-Electrolyte Cu- cathode Gas
E-
Wa
ste E
lem
en
tsP
ro
du
cts
Rea
gen
ts
Copper Balance for SX/EW
9,60
1010,80
9,70
SX EW
Stream No.
Leaching
Stellenbosch University https://scholar.sun.ac.za

271
301
Table A.4: Mass balances for the gold extraction plant at a design basis of 400Tonnes processing capacity of WPCBs
(adapted from Rossouw, 2015; de Waal, 2018)
Gold extraction mass balances
30 31 32 33 34 35 36 37 38 39 40 41 42 43 44 45 46 47 48 49 50 51 52 53
Units 19
Temperature (K) 312,00 298,00 298,00 298,00 298,00 298,00 299,00 299,00 299,00 298,00 298,00 298,00 298,00 298,00 298,00 298,00 298,00 298,00 363,00 363,00 363,00 363,00 363,00
Pressure (kPa) 400,00 400,00 101,33 300,00 101,33 101,33 1600,00 400,00 350,00 450,00 450,00 450,00 450,00 450,00 450,00 450,00 450,00 450,00 400,00 400,00 400,00 400,00 400,00
Material Flow (Total) kg/hr 43,27 116,13 309,66 0,00 467,51 0,01 0,01 462,48 61,92 405,60 36,37 404,10 36,45 150,67 602,67 36,45 753,33 292,38 9,03 301,33 602,75 36,37 0,01 602,69 0,06
Metal Flow (Total) 3,32
Ferrous Metal (Elemental) kg/hr 0,00 0,00 0,00 0,00 0,00 0,00 0,00 0,00 0,00 0,00
Fe kg/hr 0,00029 0,00 0,00 0,00029 0,00029 0,00029 0,00029 0,00000 0,00029
Non-Ferrous Metal (Elemental) kg/hr 3,32 0,06 0,00 0,00 0,00 0,00 0,00 0,00 0,00 0,00
Cu kg/hr 0,00016 0,0002 0,00016 0,00016 0,00016 0,00016 0,00000 0,00016
Al kg/hr 0,00031 0,0003 0,00031 0,00031 0,00031 0,00000 0,00031
H2SnO3 kg/hr 3,25891 0,0000 0,00000 0,00 0,00000 0,00000 0,00000 0,00000
Ni kg/hr 0,00013 0,0001 0,00013 0,00013 0,00013 0,00000 0,00013
Zn kg/hr 0,00001 0,0000 0,00001 0,00001 0,00001 0,00000 0,00001
Pb kg/hr 0,00000 0,0000 0,00000 0,00000 0,00000 0,00000 0,00000
Mn kg/hr 0,00000 0,0000 0,00000 0,00000 0,00000 0,00000 0,00000
Sb kg/hr 0,00000 0,0000 0,00000 0,00000 0,00000 0,00000 0,00000
Au kg/hr 0,06214 0,0621 0,00000 0,00000 0,00000 0,00000 0,00000
Ag kg/hr 0,00004 0,0000 0,00000 0,00000 0,00000 0,00000 0,00000
Ceramic kg/hr 18,32 0,00 18,32 18,32 18,32 0,00 0,00 0,00 0,00
SiO2 kg/hr 9,16 0,00 9,16 9,16 9,16 0,00 0,00 0,00 0,00
Al2O3 kg/hr 3,66 0,00 3,66 3,66 3,66 0,00 0,00 0,00 0,00
Alkali and alkaline earth oxides kg/hr 3,66 0,00 3,66 3,66 3,66 0,00 0,00 0,00 0,00
Titanates and mica, etc. kg/hr 1,83 0,00 1,83 1,83 1,83 0,00 0,00 0,00 0,00
Plastic 18,32 0,00 18,32 18,32 18,32 0,00 0,00 0,00 0,00
Polyethylene kg/hr 6,04 0,00 6,04 6,04 6,04 0,00 0,00 0,00 0,00
Polypropylene kg/hr 2,93 0,00 2,93 2,93 2,93 0,00 0,00 0,00 0,00
Polyesters kg/hr 2,93 0,00 2,93 2,93 2,93 0,00 0,00 0,00 0,00
Epoxies kg/hr 2,93 0,00 2,93 2,93 2,93 0,00 0,00 0,00 0,00
Polyvinyle chloride kg/hr 1,47 0,00 1,47 1,47 1,47 0,00 0,00 0,00 0,00
Polytetraflouroethane kg/hr 1,4652 0,00 1,47 1,47 1,47 0,00 0,00 0,00 0,00
Nylon kg/hr 0,5495 0,00 0,55 0,55 0,55 0,00 0,00 0,00 0,00
H2O kg/hr 0,00 114,68 309,58 424,26 424,26 21,21 404,09 404,09 146,15 602,67 748,81 286,28 301,33 587,61 587,61
Ca(OH)2 kg/hr 1,45 1,45 1,45 0,07 1,37
Ca(OH)2 ppm 12616
Air (enriched Oxygen) kg/hr 0,0068 0,00
N2 kg/hr 0,0048 0,00
NaCN kg/hr 0,08 0,08 0,05 0,00 0,04 9,03 9,03 9,03
NaOH kg/hr 6,03 6,03 6,00
Carbon kg/hr 36,37 36,37 36,37 36,37
HCl kg/hr 4,52 4,52
V L/hr 150,67 150,67 301,33 0,00
pH desired 11,00
pH actual 12,96
NaOH kg/hr 0,012 0,001 0,012 0,012 0,01 0,00
NaCN kg/hr 0,040
NaAu(CN)2 kg/hr 0,08 0,00 0,08 0,00 0,08 0,08 0,079 0,079 0,08 0,001 0,002
NaAg(CN)2 kg/hr 0,00 0,00 0,00 0,00 0,00 0,00 0,00 0,0001 0,00 0,000 0,000
Au kg/hr 0,05613
Ag kg/hr 0,00
O2 kg/hr 0,01
H2 kg/hr 0,00
H2O kg/hr 1,04 1,04 1,04 1,04
CaSnO3 kg/hr 3,99 3,99 3,99
Reag
en
tsP
rod
ucts
Stream No.
E-
Waste
Ele
men
ts
Leaching Filtering Adsorption Acid Washing ElectrowinningElution
Stellenbosch University https://scholar.sun.ac.za
Stellenbosch University https://scholar.sun.ac.za

272
B: Mass balances for base metal treatment
option – The Nitric acid wash
Stellenbosch University https://scholar.sun.ac.za

273
303
Figure B.1: Nitric acid wash circuit process flow sheet
Stellenbosch University https://scholar.sun.ac.za
Stellenbosch University https://scholar.sun.ac.za

274
304
Table B.1: Detailed mass balances for the nitric acid wash process flow sheet
Basis 400 Tonnes per annum
Units 19 19a 19b 19c 19d 19e 19f 19g 19h 19i 19j 19k 19l 19m Mr Density/SG g/cm3
Temperature K >363 >338
Pressure Kpa
Material flows Kg/hr 41,62 68,70 29,62 455,62 199,22 44,33 236,88 281,22 237,18 0,00 44,04 44,04 29,62
Feed 20% solids acid 10-18%
Cake from Fe Kg/hr 0,81 55,85 7,87
Copper leach Cu Kg/hr 0,43 63,55 8,96
Al Kg/hr 0,86 26,98 2,70
Sn Kg/hr 2,29 118,70 7,31
Ni Kg/hr 0,35 58,69 8,90
Zn Kg/hr 0,04 65,41 7,13
Pb Kg/hr 0,03 207,20 11,35
Mn Kg/hr 0,00 54,94 7,43
Sb Kg/hr 0,00 121,80 6,70
Au Kg/hr 0,06 196,96 19,32
Ag Kg/hr 0,11 107,90 10,50
Ceramics SiO2 Kg/hr 9,16 9,16 9,16 9,16 9,16 9,16 2,27
Al2O3 Kg/hr 3,66 3,66 3,66 3,66 3,66 3,66 3,89
Alkali & Alkali earth oxides Kg/hr 3,66 3,66 3,66 3,66 3,66 3,66 3,00
Titanates and Mica Kg/hr 1,83 1,83 1,83 1,83 1,83 1,83 3,50
Plastics Polyethylene Kg/hr 6,04 6,04 6,04 6,04 6,04 6,04 1,40
Polypropylene Kg/hr 2,93 2,93 2,93 2,93 2,93 2,93 1,24
Polyesters Kg/hr 2,93 2,93 2,93 2,93 2,93 2,93 8,95
Epoxies Kg/hr 2,93 2,93 2,93 2,93 2,93 2,93 1,25
Polyvinylchloride Kg/hr 1,47 1,47 1,47 1,47 1,47 1,47 1,47
Polytetraflouroethane Kg/hr 1,47 1,47 1,47 1,47 1,47 1,47 2,20
Nylon Kg/hr 0,55 0,55 0,55 0,55 0,55 0,55 1,15
Reagents
Reagents and Water Kg/hr 21,32 212,07 236,88 18,00 1,00
utilities 55% Nitric acid Kg/hr 47,38 63,00 1,34
Bleach air Kg/hr 0,00
Ca(OH)2 Kg/hr 74,10
N2 Kg/hr 28,00
NaCN Kg/hr 49,10
NaOH Kg/hr 40,00
Ca(OH)2 Kg/hr 74,10
HCl Kg/hr 36,50
V L/hr
pH desired >6.5 >6.5
pH actual
Products
Products Fe(NO3)3 Kg/hr 3,51 3,44 0,07 0,07 0,07 0,00 0,00 241,86 1,68
Cu(NO3)2 Kg/hr 1,28 1,26 0,03 0,03 0,03 0,00 0,00 187,56 3,05
Al(NO3)3 Kg/hr 6,78 6,64 0,14 0,14 0,14 0,00 0,00 213,00 1,72
Sn(NO3)2 Kg/hr 0,00 0,00 0,00 0,00 0,00 0,00 0,00 242,72
Ni(NO3)2 Kg/hr 1,08 1,06 0,02 0,02 0,02 0,00 0,00 182,70 2,05
Zn(NO3)2 Kg/hr 0,12 0,11 0,00 0,00 0,00 0,00 0,00 189,36 2,06
Pb(NO3)2 Kg/hr 0,04 0,04 0,00 0,00 0,00 0,00 0,00 331,20 4,53
Mn(NO3)2 Kg/hr 0,00 0,00 0,00 0,00 0,00 0,00 0,00 178,95 1,54
Sb2O3 Kg/hr 0,00 0,00 0,00 0,00 0,00 0,00 0,00 291,58 5,20
AgNO3 Kg/hr 0,18 0,17 0,00 0,00 0,00 0,00 0,00 169,87 4,35
Au Kg/hr 0,06 0,00 0,06 0,06 0,00 0,06 0,06 196,96 19,32
H2 Kg/hr 0,00 0,00 0,00 0,00 0,00 0,00 0,00 2,00 0,00
NO2 Kg/hr 3,98 0,00 0,00 0,00 0,00 0,00 0,00 46,00 0,00
NO Kg/hr 0,78 0,00 0,00 0,00 0,00 0,00 0,00 0,78 30,00 0,00
NH4NO3 Kg/hr 0,00 0,00 0,00 0,00 0,00 0,00 0,00 80,00 1,72
H2SnO3 Kg/hr 3,26 0,00 3,26 3,26 0,00 3,26 3,26 168,70
H20 Kg/hr 24,86 190,61 186,50 4,11 240,99 236,91 4,08 4,08 24,08 18,00 1,00
HNO2 Kg/hr 2,03
HNO3 Kg/hr 2,72
Stellenbosch University https://scholar.sun.ac.za
Stellenbosch University https://scholar.sun.ac.za

275
305
Table B.2: Summary of the main reactions proceeding during the nitric acid wash
Reaction outputs (Literature)
Original Basis 400 Tes/yr feed rate per hour Products
Reactions proceeding with 55% HNO3 at ambient conditions Metal/Element Mass in feed Moles in feed NO2 NO H20 Nitrate Oxide Stannic acid H2 Acid required 55% Mr element Mr Oxide Mr stannic Mr Nitrate
Kg/hr moles/hr Kg/hr Kg/hr Kg/Hr Kg/hr Kg/hr Kg/hr Kg/hr Kg/hr g/mole g/mol g/mol g/mol
Fe + 6HNO3 Fe(NO3)3 + 3NO2 + 3H2O Fe 0,81 14,52 2,00 0,00 0,78 3,51 0,00 0,00 0,00 9,98 55,85 N/A N/A 241,86
Cu + 4HNO3 Cu(NO3)2 + 2NO2 + 2H2O Cu 0,43 6,84 0,63 0,00 0,25 1,28 0,00 0,00 0,00 3,13 63,55 N/A N/A 187,56
2Al + 6HNO3 Al2O3 + NO2 + 3H2O Al 0,86 31,84 0,73 0,00 0,86 0,00 1,62 0,00 0,00 21,88 26,98 101,96 N/A 213,00
Al2O3 + 6HNO3 2Al(NO3)3 + 3H2O 0,00 0,00 0,00 0,00 0,86 6,78 0,00 0,00 0,00 N/A
3Sn + 4HNO₃ + nH₂O 3H₂SnO₃. nH20 + 4NO Sn 2,29 19,32 0,00 0,77 0,26 0,00 0,00 3,26 0,00 8,85 118,70 N/A 168,70 242,72
Ni + 4HNO3 Ni(NO3)2 + 2NO2 + 2H2O Ni 0,35 5,93 0,55 0,00 0,32 1,08 0,00 0,00 0,00 2,72 58,69 N/A N/A 182,70
Zn + 4HNO3 Zn(NO3)2 + 2NO2 + 2H2O Zn 0,04 0,62 0,06 0,00 0,03 0,12 0,00 0,00 0,00 0,28 65,41 N/A N/A 189,36
Pb + 4HNO3 Pb(NO3)2 + 2NO2 + H2O Pb 0,03 0,13 0,01 0,00 0,01 0,04 0,00 0,00 0,00 0,06 207,20 N/A N/A 331,20
Mn + 2HNO3 Mn(NO3)2 + H2 Mn 0,00 0,00 0,00 0,00 0,00 0,00 0,00 0,00 0,00 0,00 54,94 N/A N/A N/A
2Sb + 2HNO3 Sb2O3 + 2NO + H2O Sb 0,00 0,00 0,00 0,00 0,00 0,00 0,00 0,00 0,00 0,00 121,80 291,58 N/A N/A
3Ag + 4HNO3 3AgNO3 + 2H2O + NO Ag 0,11 1,04 0,00 0,01 0,01 0,18 0,00 0,00 0,00 0,48 107,90 N/A N/A 169,87
Au + 3HNO3 Au + 3HNO3 Au 0,06 0,32 0,00 0,00 0,02 0,06 0,00 0,00 0,00 0,00 196,96 N/A N/A N/A
Total 4,99 80,54 3,98 0,78 3,40 13,06 1,62 3,26 0,00 47,38
Assumptions for the calculations: For the thermodynamic data available there is a predicted heat rise in the system. All fine aluminium in oxide and
metallic form ultimately reacts with HNO3, all reactions proceed to completion, metals are in solid form and salts produced exist in the aqueous media
with respect to their solubilities. Heat produced will catalyse the decomposition of nitric acid. During pilot tests, factor in the excess acid to be added
to ensure reactions proceed to completion. An ideal basis is assumed for the calculations wherein all NO2 and NO is generated solely from the
reactions listed in the Table above. The maximum tolerable moisture content in solids for the vacuum filter with minimum cake thickness of 5mm is
10% without upstream and down thickening operations.
Stellenbosch University https://scholar.sun.ac.za
Stellenbosch University https://scholar.sun.ac.za

276
306
Table B.3: Evaluation of main objective of the acid wash performance
Analysis of feed stream Analysis of washed stream
Initial feed ex Copper circuit Feed ex Acid and water wash
Component Kg/hr Percentage composition Component Kg/hr to T402 (19f) Kg/hr of pure metals Percentage composition as nitrates Δ component (mass) Δ component (%) Proportion of dissolved salts in liquid phase
Fe 0,81 1,95 Fe(NO3)3 0,07 0,02 0,17 -0,79 -1,78 0,02
Cu 0,43 1,04 Cu(NO3)2 0,03 0,01 0,06 -0,43 -0,98 0,01
Al 0,86 2,06 Al(NO3)3 0,14 0,02 0,32 -0,84 -1,74 0,03
Sn 2,29 0,27 Sn(NO3)2 0,00 0,00 0,00 -2,29 -0,27 0,00
Ni 0,35 0,04 Ni(NO3)2 0,02 0,01 0,05 -0,34 0,01 0,01
Zn 0,04 0,00 Zn(NO3)2 0,00 0,00 0,01 -0,04 0,00 0,00
Pb 0,03 0,00 Pb(NO3)2 0,00 0,00 0,00 -0,03 0,00 0,00
Mn 0,00 0,00 Mn(NO3)2 0,00 0,00 0,00 0,00 0,00 0,00
Sb 0,00 0,00 Sb2O3 0,00 0,00 0,00 0,00 0,00 0,00
Ag 0,11 0,01 AgNO3 0,00 0,00 0,01 -0,11 0,00 0,00
Au 0,06 0,01 Au 0,06 0,06 0,00 0,00 -0,01
NH4NO3 0,00 0,00 NH4NO3 0,00 0,00 0,00 0,00 0,00 0,00
H2SnO3 0,00 0,00 H2SnO3 3,26 2,29 0,00 0,00 0,00 0,00
H20 0,00 0,00 H20 4,11 0,00 9,26 0,00 9,26 0,92
Total leachables 4,99 Total leachables 7,70 2,41 206,86
SiO2 9,16 1,09 SiO2 9,16 68,68 1,05 59,52 -0,04
Al2O3 3,66 0,44 Al2O3 3,66 27,47 0,42 23,81 -0,02
Alkali & Alkali earth oxides 3,66 0,44 Alkali & Alkali earth oxides 3,66 27,47 0,42 23,81 -0,02
Titanates and Mica 1,83 0,22 Titanates and Mica 1,83 13,74 0,21 11,91 -0,01
0,00
Polyethylene 6,04 0,72 Polyethylene 6,04 45,33 0,69 39,29 -0,03
Polypropylene 2,93 0,35 Polypropylene 2,93 21,98 0,34 19,05 -0,01
Polyesters 2,93 0,35 Polyesters 2,93 21,98 0,34 19,05 -0,01
Epoxies 2,93 0,35 Epoxies 2,93 21,98 0,34 19,05 -0,01
Polyvinylchloride 1,47 0,17 Polyvinylchloride 1,47 10,99 0,17 9,52 -0,01
Polytetraflouroethane 1,47 0,17 Polytetraflouroethane 1,47 10,99 0,17 9,52 -0,01
Nylon 0,55 0,07 Nylon 0,55 4,12 0,06 3,57 0,00
Total mass 41,62 4,97 Total mass 44,33 277,14 5,09 235,52 0,12
Stellenbosch University https://scholar.sun.ac.za
Stellenbosch University https://scholar.sun.ac.za

277
307
Table B.4: Stream characterisation after water rinsing
Rinsing of acid washed solids in T402
Worked with basis 400Tes/yr
Material flows of solids ex T402 stream 19h Material flows of solids ex T402 stream 19k after filtration
Materials Amount exiting T402 (kg/hr) 19h Proportion of soluble salts Proportion of soluble salts % Materials Amount exiting F402 (kg/hr) 19k Proportion of materials in stream 19k % Proportion of materials after acid washing 19h% Δ component (%)
Fe(NO3)3 0,07 0,00 0,03 Fe(NO3)3 0,00 0,00 0,03 -0,02
Cu(NO3)2 0,03 0,00 0,01 Cu(NO3)2 0,00 0,00 0,01 -0,01
Al(NO3)3 0,14 0,00 0,06 Al(NO3)3 0,00 0,01 0,05 -0,05
Sn(NO3)2 0,00 0,00 0,00 Sn(NO3)2 0,00 0,00 0,00 0,00
Ni(NO3)2 0,02 0,00 0,01 Ni(NO3)2 0,00 0,00 0,01 -0,01
Zn(NO3)2 0,00 0,00 0,00 Zn(NO3)2 0,00 0,00 0,00 0,00
Pb(NO3)2 0,00 0,00 0,00 Pb(NO3)2 0,00 0,00 0,00 0,00
Mn(NO3)2 0,00 0,00 0,00 Mn(NO3)2 0,00 0,00 0,00 0,00
Sb2O3 0,00 0,00 0,00 Sb2O3 0,00 0,00 0,00 0,00
AgNO3 0,00 0,00 0,00 AgNO3 0,00 0,00 0,00 0,00
Au 0,06 0,00 0,00 Au 0,06 0,14 0,02 0,12
NH4NO3 0,00 0,00 0,00 NH4NO3 0,00 0,00 0,00 0,00
H2SnO3 3,26 0,00 0,00 H2SnO3 3,26 7,40 1,16
H20 240,99 0,99 98,56 H20 4,08 9,27 85,70 -76,42
Total solubles 3,53 0,00 Total solubles 0,12 0,01 1,26 -1,25
SiO2 9,16 SiO2 9,16 20,79 3,26 17,54
Al2O3 3,66 Al2O3 3,66 8,32 1,30 7,01
Alkali & Alkali earth oxides 3,66 Alkali & Alkali earth oxides 3,66 8,32 1,30 7,01
Titanates and Mica 1,83 Titanates and Mica 1,83 4,16 0,65 3,51
0,00 0,00 0,00
Polyethylene 6,04 Polyethylene 6,04 13,72 2,15 11,57
Polypropylene 2,93 Polypropylene 2,93 6,65 1,04 5,61
Polyesters 2,93 Polyesters 2,93 6,65 1,04 5,61
Epoxies 2,93 Epoxies 2,93 6,65 1,04 5,61
Polyvinylchloride 1,47 Polyvinylchloride 1,47 3,33 0,52 2,81
Polytetraflouroethane 1,47 Polytetraflouroethane 1,47 3,33 0,52 2,81
Nylon 0,55 Nylon 0,55 1,25 0,20 1,05
Total material flow 281,22 Total material flow 44,04 100,00
Notes:
For vacuum filtration the maximum tolerable moisture retained in solid should not exceed 10% (Literature). Using simultaneous equations the solute
in stream 19k was calculated to be 0.116 at a retained moisture content of 10% in the filter cake. After acid washing and rinsing the percentage
composition of the gold has been upgraded to 1.35% up from 0.50% in the solid material exiting the copper leach and recovery circuit.
Stellenbosch University https://scholar.sun.ac.za
Stellenbosch University https://scholar.sun.ac.za

278
308
Table B.5: Evaluating likelihood of premature crystallization in the circuit
Prediction of premature crystallization
Basis at 400Tes/ annum and T = 298K
Salt Solubility g/100g
H2O Moisture demand at saturation
factor Moisture demand at saturation
(kg/hr) Residual H2O in T401 kg/hr
190.61
Fe(NO3)3 150 0.67 2.34 188.26
Cu(NO3)2 381 0.26 0.34 187.93
Al(NO3)3 73 1.37 9.29 178.64
H2SnO3 NA NA NA NA
Ni(NO3)2 243 0.41 0.45 178.19
Zn(NO3)2 184.3 0.54 0.12 178.08
Pb(NO3)2 597 0.17 0.01 178.07
Mn(NO3)2 118 0.85 0.00 178.07
Sb2O3 0.037 2702.70 0.15 177.92
AgNO3 256 0.39 0.07 177.85
Au NA NA 0 177.85
H2 NA NA 0 177.85
NO2 NA NA 0 177.85
NO NA NA 0 177.85
NH4NO3 150 0.67 0 177.85
Net H2O 12.75 177.85
.
Remarks
A positive net demand of water has been calculated for maximum solubilities of the nitrates between 293K and 298K. The value predicts that no
crystallization of the nitrates is expected in the nitric acid wash circuit. All salts listed are soluble
Stellenbosch University https://scholar.sun.ac.za
Stellenbosch University https://scholar.sun.ac.za
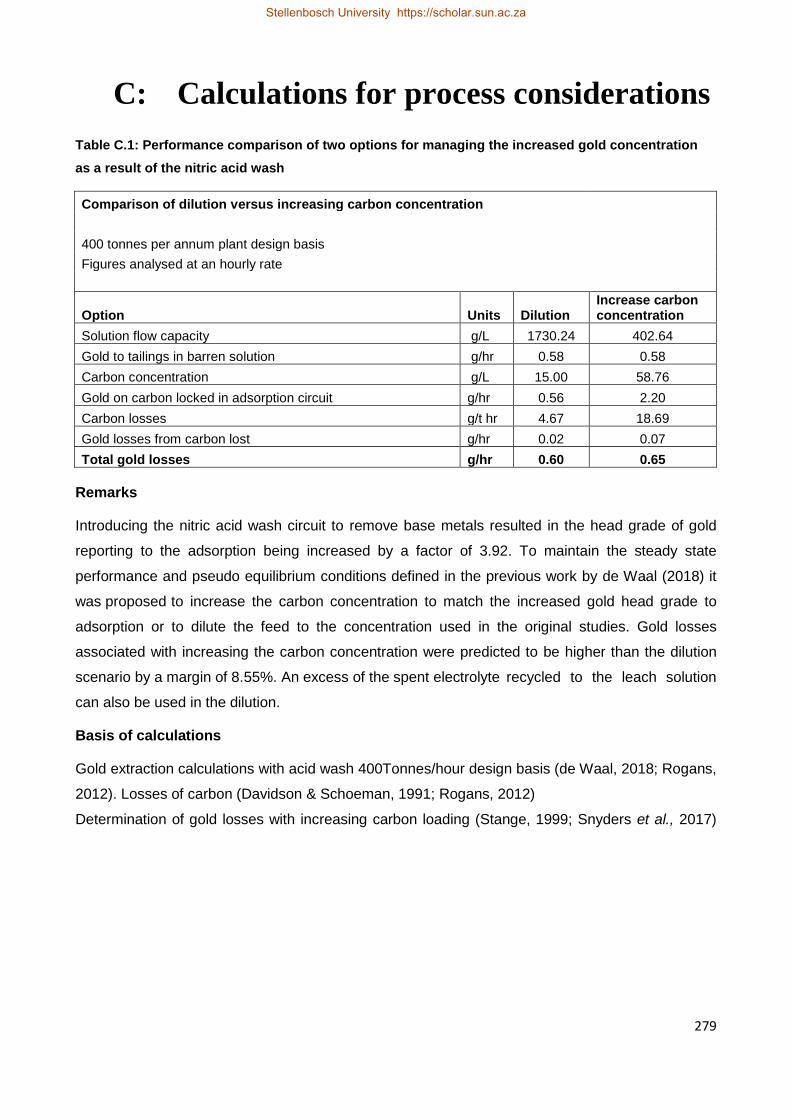
279
C: Calculations for process considerations
Table C.1: Performance comparison of two options for managing the increased gold concentration
as a result of the nitric acid wash
Comparison of dilution versus increasing carbon concentration
400 tonnes per annum plant design basis
Figures analysed at an hourly rate
Option Units Dilution Increase carbon concentration
Solution flow capacity g/L 1730.24 402.64
Gold to tailings in barren solution g/hr 0.58 0.58
Carbon concentration g/L 15.00 58.76
Gold on carbon locked in adsorption circuit g/hr 0.56 2.20
Carbon losses g/t hr 4.67 18.69
Gold losses from carbon lost g/hr 0.02 0.07
Total gold losses g/hr 0.60 0.65
Remarks
Introducing the nitric acid wash circuit to remove base metals resulted in the head grade of gold
reporting to the adsorption being increased by a factor of 3.92. To maintain the steady state
performance and pseudo equilibrium conditions defined in the previous work by de Waal (2018) it
was proposed to increase the carbon concentration to match the increased gold head grade to
adsorption or to dilute the feed to the concentration used in the original studies. Gold losses
associated with increasing the carbon concentration were predicted to be higher than the dilution
scenario by a margin of 8.55%. An excess of the spent electrolyte recycled to the leach solution
can also be used in the dilution.
Basis of calculations
Gold extraction calculations with acid wash 400Tonnes/hour design basis (de Waal, 2018; Rogans,
2012). Losses of carbon (Davidson & Schoeman, 1991; Rogans, 2012)
Determination of gold losses with increasing carbon loading (Stange, 1999; Snyders et al., 2017)
Stellenbosch University https://scholar.sun.ac.za

280
310
Table C.2: Costs associated with dilution as an option round the adsorption circuit
Costs associated with dilution as an option around adsorption circuit
400 tonnes per annum plant design basis
Figures analysed at an hourly rate
Costs at start up
Units Dilution Unit cost Total cost US $
Activated carbon inventory g/L 155.72 $2.00/kg 0.31
Water kg/hr 1 730.24 $1.41/Kl 2.44
Hydrated lime Ca(OH)2 kg/hr 0.05 US$93/tonne 0.00
Carbon losses g/t hr 4.67 $2.00/kg 0.01
Gold losses from carbon lost g/hr 0.02 US$39.35 0.73
Gold to tailings in barren solution g/hr 0.58 US$39.35 22.80
Total costs at start up 26.30
Running costs at steady state
Units Dilution Equivalent cost
US $ Total cost US$/hr
Water kg/hr 1 327.60 $1.41/Kl 1.87
Hydrated lime Ca(OH)2 kg/hr 0.05 US$93.00/tonne 0.00
Carbon losses g/t hr 4.67 $2.00/kg 0.01
Gold losses from carbon lost g/hr 0.02 US$39.35 0.73
Gold to tailings in barren solution g/hr 0.58 US$39.35 22.80
Total operational costs at steady state 25.42
Source of prices
(Alibaba, 2018; Infomine (2017); www.johannesburgwater, 2017)
Stellenbosch University https://scholar.sun.ac.za
Stellenbosch University https://scholar.sun.ac.za

281
311
Table C.3: Costs associated with increased carbon concentration as an option around the adsorption circuit
Costs associated with increased carbon concentration as an option around adsorption circuit
400 tonnes per annum plant design basis
Figures analysed at an hourly rate
Costs at start up
Units Dilution Unit cost Total cost US $
Activated carbon inventory g/L 610.03 $2.00/kg 1.22
Water kg/hr 402.64 $1.41/Kl 0.57
Hydrated lime Ca(OH)2 kg/hr 0.00 US$93.00/tonne 0.00
Carbon losses g/t hr 18.69 $2.00/kg 0.04
Gold losses from carbon lost g/hr 0.07 US$39.35 2.93
Gold to tailings in barren solution g/hr 0.58 US$39.35 22.80
Total costs at start up 27.56
Running costs at steady state
Units Dilution Equivalent cost US $ Total cost US$/hr
Water kg/hr 402.64 $1.41/Kl 0.57
Hydrated lime Ca(OH)2 kg/hr 0.00 US$93.00/tonne 0.00
Carbon losses g/t hr 18.69 $2.00/kg 0.04
Gold losses from carbon lost g/hr 0.07 US$39.35 2.93
Gold to tailings in barren solution g/hr 0.58 US$39.35 22.80
Total operational costs at steady state 26.34
Source of prices
(Alibaba, 2018; Infomine (2017); www.johannesburgwater, 2017)
Stellenbosch University https://scholar.sun.ac.za
Stellenbosch University https://scholar.sun.ac.za

282
312
Table C.4: Nitric acid wash overall performance analysis for removal of base metals in WPCB
recycling campaign
Nitric acid wash performance analysis for removal of base metals
Basis 400 Tonnes per annum
Feed Quantities in
feed Pure metals
after Composition to adsorption
circuit
kg/hr acid wash
kg/hr kg/hr
Fe 0.81 0.00 0.00
Cu 0.43 0.00 0.00
Al 0.86 0.00 0.00
Sn 2.29 0.00 0.00
Ni 0.35 0.00 0.00
Zn 0.04 0.00 0.00
Pb 0.03 0.00 0.00
Mn 0.00 0.00 0.00
Sb 0.00 0.00 0.00
Au 0.06 0.06 0.06
Ag 0.11 0.00 0.00
SiO2 9.16 9.16 0.00
Al2O3 3.66 3.66 0.00
Alkali & Alkali earth oxides 3.66 3.66 0.00
Titanates and Mica 1.83 1.83 0.00
Polyethylene 6.04 6.04 0.00
Polypropylene 2.93 2.93 0.00
Polyesters 2.93 2.93 0.00
Epoxies 2.93 2.93 0.00
Polyvinylchloride 1.47 1.47 0.00
Polytetraflouroethane 1.47 1.47 0.00
Nylon 0.55 0.55 0.00
Material to adsorption kg/hr 0.062 Proportion of gold to adsorption% 99.85
Stellenbosch University https://scholar.sun.ac.za

283
313
Table C.5: SART overall performance analysis for removal of base metals in WPCB recycling campaign
SART performance analysis for removal of base metals
Basis 400 Tonnes per annum
Feed Quantities in
feed Metals after cyanidation
Precipitated metals after SART
Metals to adsorption circuit
kg/hr kg/hr kg/hr kg/hr
Fe 0.81 0.81 0.53 0.28
Cu 0.43 0.00 0.00 0.00
Al 0.86 0.86 0.00 0.77
Sn 2.29 2.29 1.49 0.80
Ni 0.35 0.23 0.08 0.04
Zn 0.04 0.04 0.00 0.04
Pb 0.03 0.03 0.02 0.01
Mn 0.00 0.00 0.00 0.00
Sb 0.00 0.00 0.00 0.00
Au 0.06 0.06 0.06 0.06
Ag 0.11 0.11 0.07 0.04
SiO2 9.16 9.16 0.00 0.00
Al2O3 3.66 3.66 0.00 0.00
Alkali & Alkali earth oxides 3.66 3.66 0.00 0.00
Titanates and Mica 1.83 1.83 0.00 0.00
Polyethylene 6.04 6.04 0.00 0.00
Polypropylene 2.93 2.93 0.00 0.00
Polyesters 2.93 2.93 0.00 0.00
Epoxies 2.93 2.93 0.00 0.00
Polyvinylchloride 1.47 1.47 0.00 0.00
Polytetraflouroethane 1.47 1.47 0.00 0.00
Nylon 0.55 0.55 0.00 0.00
Material to adsorption kg/hr 2.05
Proportion of gold to adsorption% 3.03
Stellenbosch University https://scholar.sun.ac.za
Stellenbosch University https://scholar.sun.ac.za

284
D: Equipment flow sheets
Stellenbosch University https://scholar.sun.ac.za
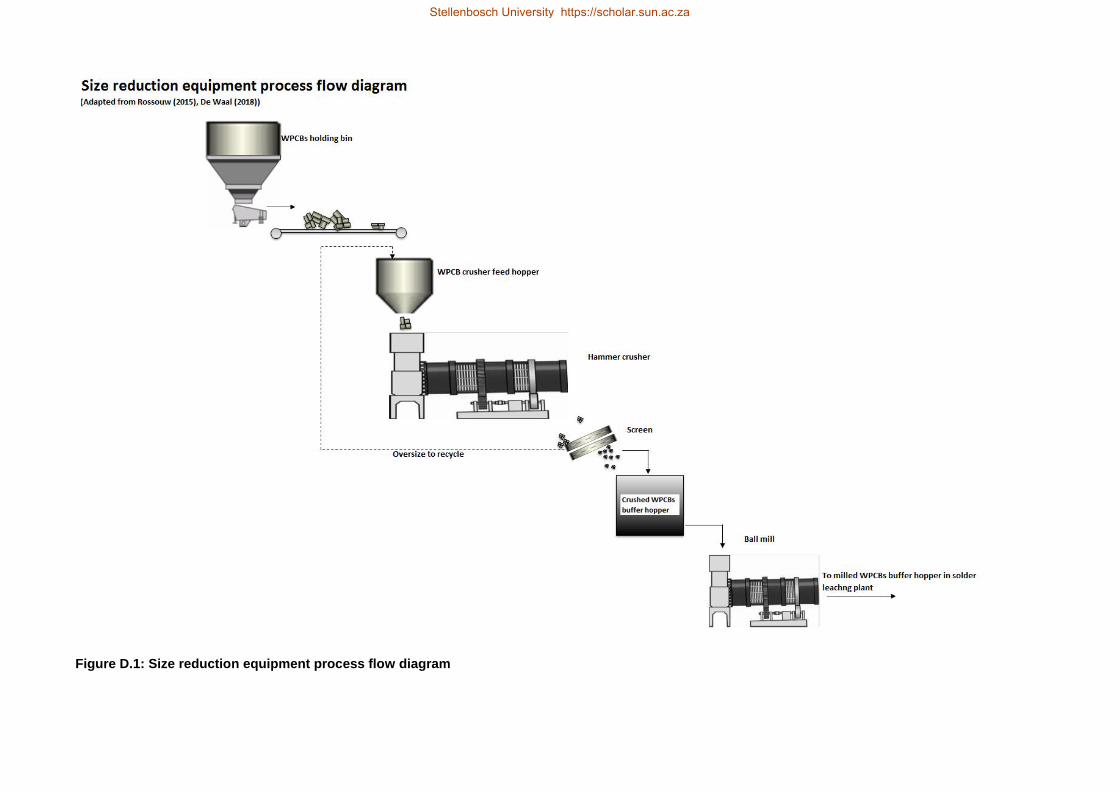
285
316
Figure D.1: Size reduction equipment process flow diagram
Stellenbosch University https://scholar.sun.ac.za
Stellenbosch University https://scholar.sun.ac.za

286
317
Figure D.2: Solder leaching equipment process flow diagram
Stellenbosch University https://scholar.sun.ac.za
Stellenbosch University https://scholar.sun.ac.za

287
Figure D.3: Copper extraction equipment process flow diagram
Stellenbosch University https://scholar.sun.ac.za

288
319
Figure D.4: Tracing the movement of copper throughout the entire scope of operations
Stellenbosch University https://scholar.sun.ac.za
Stellenbosch University https://scholar.sun.ac.za

289
320
Figure D.5: Nitric acid wash equipment process flow diagram
Stellenbosch University https://scholar.sun.ac.za
Stellenbosch University https://scholar.sun.ac.za

290
321
Figure D.6: Gold extraction equipment process flow diagram (Cyanide leaching section)
Stellenbosch University https://scholar.sun.ac.za
Stellenbosch University https://scholar.sun.ac.za

291
Figure D.7: Gold extraction equipment process flow diagram (Adsorption and carbon regeneration
sections)
Stellenbosch University https://scholar.sun.ac.za

292
323
Figure D.8: Acid wash, elution and electrowinning sections
Stellenbosch University https://scholar.sun.ac.za
Stellenbosch University https://scholar.sun.ac.za

293
Figure D.9: Tracing the movement of gold throughout the entire scope of operations
Stellenbosch University https://scholar.sun.ac.za

294
E: Calculations for the initial evaluation of
the business models
Stellenbosch University https://scholar.sun.ac.za

295
326
Table E.1: Collection and dismantling materials requirement and feasibility analysis
Collection and dismantling
Storage space requirements 40% of design
Plant availability Days 312 312
Rated operating capacity Tonnes/yr 10 000 4 000
Proportion of PCBs in raw e-waste (Widmer et al., (2005)) % 2 1
Raw e-waste requirement Tonnes/yr 588 235 235 294
Bulk density of raw e-waste (SITA excel spread sheet calculator) kg/m3 210 210
Material requirements per 30 days of operation Tonnes 56 561 22 624
Storage space requirements per 30 days (for h= 4m) m2 67 335 26 934
Manpower
Dismantling rate per individual (Blaser & Schluep (2012)) Tonnes/month 3.50 3.50
Dismantling rate per 14 days per individual Tonnes/fortnight 1.75 1.75
Manpower requirement to dismantle four weeks worth of material Persons 16 160 6 464
Material supply in RSA
Projected tonnages in South Africa yet to join recycling chain (Finlay and Lietchi (2008)) Tonnes 2 108 000 2 108 000
Projected annual growth rate (GreenCape (2017)) Tonnes/yr 322 000 322 000
Expected e-waste volumes as at December 2018 in RSA Tonnes 5 006 000 5 006 000
Expected e-waste volumes as at December 2030 in RSA Tonnes 12 090 000 12 090 000
By-product and waste projections
By-product to be generated from e-waste processing (Widmer et al., (2005) Tonnes/month 55 600 22 240
Projected absorption capacity of by-products in South Africa (GreenCape (2017))* % 15 15
Projected absorption capacity of by-products in South Africa (GreenCape (2017))* Tonnes/month 8 340 3 336
Projected inventory build up of by-products from dismantling operations Tonnes/month 47 260 18 904
Projected inventory build up of by-products from dismantling operations Tonnes/yr 567 115 226 846
Projected inventory build up of by-products from dismantling operations at the end of the project life Tonnes 11 342 308 4 536 923
Land space required for managing unprocessed by product inventory (pile heights of 4m) m2/month 56 261 22 505
Land space required for managing unprocessed by product inventory (pile heights of 4m) at the end of the project life m2 13 502 747 5 401 099
Potential revenue sources and streams from by-products
Potential plastics for pyrolysis, export or composite hard material processing generated (Widmer et al., (2005)) Tonnes/month 7 183 2 873
Potential metals for recycling (Widmer et al., (2005)) Tonnes/month 28 450 11 380
Potential cables for recycling (Widmer et al. (2005)) Tonnes/month 945 378
Metals and plastics mixture for further processing (Widmer et al., (2005)) Tonnes/month 2363 945
Potential source of Indium for further processing (Widmer et al., (2005)) Tonnes/month 5 624 2 250
Stellenbosch University https://scholar.sun.ac.za
Stellenbosch University https://scholar.sun.ac.za

296
327
Table E.2: Annual production plan during normal operations for copper and gold metal production (models 3a & 4a)
WPCB hydrometallurgical plant
Annual production plan Production summary
Annual Totals (tonnes)
3a & 4a 3b & 4b 3c & 4c 3d & 4d
Gold sludge sales 0.113 0.00 0.113 0.00
Gold liquor sales 0.00 761.07 0.00 761.07
Copper LME Grade A
89.54 0.00 0.00 72.72
CuSO4 liquor
(3.71%) 0.00 2386.44 2386.44 0.00
Month Jan Feb Mar April May June July Aug Sep Oct Nov Dec Plan BUDGET Actual
Days 30 28 31 30 31 30 31 31 30 31 30 31 312 312 312
Remark plan plan plan plan plan plan plan plan plan plan plan plan Normal Normal Year 1
Business Gold Gold sludge sales
tonnes 0.01 0.01 0.01 0.01 0.01 0.01 0.01 0.01 0.01 0.01 0.003 0.00 0.113 0.113 0.113
Models sludge Rand Refinery tonnes 0.01 0.01 0.01 0.01 0.01 0.01 0.01 0.01 0.01 0.01 0.003 0.00 0.113 0.113 0.113
3a & 4a >98% Opening stocks tonnes 0.00 0.00 0.00 0.00 0.00 0.00 0.00 0.00 0.00 0.00 0.00 0.00 0.00 0.00 0.00
Production tonnes 0.01 0.01 0.01 0.01 0.01 0.01 0.01 0.01 0.01 0.01 0.003 0.00 0.113 0.113 0.113
Shut down days 0 0 0 0 0 0 0 0 0 0 21 31 52 52 52
Plant availability TU% 100% 100% 100% 100% 100% 100% 100% 100% 100% 100% 30% 0% 85.71% 85.71% 85.71%
Copper Copper cathode sales
tonnes 8.61 8.04 8.90 8.61 8.90 8.61 8.90 8.90 8.61 8.90 2.58 0.00 89.54 89.54 89.54
LME Trade Key.com tonnes 8.61 8.04 8.90 8.61 8.90 8.61 8.90 8.90 8.61 8.90 2.58 0.00 89.54 89.54 89.54
grade A Opening Stocks tonnes 0.00 0.00 0.00 0.00 0.00 0.00 0.00 0.00 0.00 0.00 0.00 0.00 0.00 0.00 0.00
>99% Production tonnes 8.61 8.04 8.90 8.61 8.90 8.61 8.90 8.90 8.61 8.90 2.58 0.00 89.54 89.54 89.54
Shut down days 0 0 0 0 0 0 0 0 0 0 21 31 52 52 52
Plant availability TU% 100% 100% 100% 100% 100% 100% 100% 100% 100% 100% 30% 0% 85.71% 85.71% 85.71%
Stellenbosch University https://scholar.sun.ac.za
Stellenbosch University https://scholar.sun.ac.za

297
328
Table E.3: Annual production plan during normal operations for copper sulphate and gold liquor production (models 3b & 4b)
WPCB hydrometallurgical plant
Annual production plan Production summary
Annual Totals (tonnes)
3a & 4a 3b & 4b 3c & 4c 3d & 4d
Gold sludge sales 0.113 0.00 0.113 0.00
Gold liquor sales 0.00 801.04 0.00 761.07
Copper LME Grade A 72.72 0.00 0.00 72.72
CuSO4 liquor (3.71%) 0.00 2386.44 2386.44 0.00
Month Jan Feb Mar April May June July Aug Sep Oct Nov Dec Plan BUDGET Actual
Days 30 28 31 30 31 30 31 31 30 31 30 31 312 312 312
Remark plan plan plan plan plan plan plan plan plan plan plan plan Normal Normal Year 1
Business Gold Gold liquor sales
tonnes 77.02 71.89 79.59 77.02 79.59 77.02 79.59 79.59 77.02 79.59 23.11 0.00 801.04 801.04 801.04
Model liquor SA Precious metals
tonnes 77.02 71.89 79.59 77.02 79.59 77.02 79.59 79.59 77.02 79.59 23.11 0.00 801.04 801.04 801.04
3b & 4b 142.52ppm Opening stocks
tonnes 0.00 0.00 0.00 0.00 0.00 0.00 0.00 0.00 0.00 0.00 0.00 0.00 0.00 0.00 0.00
Production tonnes 77.02 71.89 79.59 77.02 79.59 77.02 79.59 79.59 77.02 79.59 23.11 0.00 801.04 801.04 801.04
Shut down days 0 0 0 0 0 0 0 0 0 0 21 31 52 52 52
Plant availability
TU% 100% 100% 100% 100% 100% 100% 100% 100% 100% 100% 30% 0% 85.71% 85.71% 85.71%
Copper Copper liquor sales
tonnes 229.47 214.17 237.11 229.47 237.11 229.47 237.11 237.11 229.47 237.11 68.84 0.00 2386.44 2386.44 2386.44
liquor Trade Key.com/SA Prec. Met.
tonnes 229.47 214.17 237.11 229.47 237.11 229.47 237.11 237.11 229.47 237.11 68.84 0.00 2386.44 2386.44 2386.44
3.70% Opening Stocks
tonnes 0.00 0.00 0.00 0.00 0.00 0.00 0.00 0.00 0.00 0.00 0.00 0.00 0.00 0.00 0.00
Production tonnes 229.47 214.17 237.11 229.47 237.11 229.47 237.11 237.11 229.47 237.11 68.84 0.00 2386.44 2386.44 2386.44
Shut down days 0 0 0 0 0 0 0 0 0 0 21 31 52 52 52
Plant availability
TU% 100% 100% 100% 100% 100% 100% 100% 100% 100% 100% 30% 0% 85.71% 85.71% 85.71%
Stellenbosch University https://scholar.sun.ac.za
Stellenbosch University https://scholar.sun.ac.za

298
329
Table E.4: Annual production plan during normal operations for copper sulphate liquor and gold sludge production (models 3c & 4c)
WPCB hydrometallurgical plant
Annual production plan Production summary
Annual Totals (tonnes)
3a & 4a 3b & 4b 3c & 4c 3d & 4d
Gold sludge sales 0.113 0.00 0.113 0.00
Gold liquor sales 0.00 761.07 0.00 761.07
Copper LME Grade A 72.72 0.00 0.00 72.72
CuSO4 liquor (3.71%)
0.00 2386.44 2386.44 0.00
Month Jan Feb Mar April May June July Aug Sep Oct Nov Dec Plan BUDGET Actual
Days 30 28 31 30 31 30 31 31 30 31 30 31 312 312 312
Remark plan plan plan plan plan plan plan plan plan plan plan plan Normal Normal Year 1
Business Gold Gold sludge sales tonnes 0.01 0.01 0.01 0.01 0.01 0.01 0.01 0.01 0.01 0.01 0.003 0.00 0.113 0.113 0.113
Model sludge Rand Refinery tonnes 0.01 0.01 0.01 0.01 0.01 0.01 0.01 0.01 0.01 0.01 0.003 0.00 0.113 0.113 0.113
3c & 4c >98% Opening stocks tonnes 0.00 0.00 0.00 0.00 0.00 0.00 0.00 0.00 0.00 0.00 0.00 0.00 0.00 0.00 0.00
Production tonnes 0.01 0.01 0.01 0.01 0.01 0.01 0.01 0.01 0.01 0.01 0.003 0.00 0.113 0.113 0.113
Shut down days 0 0 0 0 0 0 0 0 0 0 21 31 52 52 52
Plant availability TU% 100% 100% 100% 100% 100% 100% 100% 100% 100% 100% 30% 0% 85.71% 85.71% 85.71%
Copper Copper liquor sales
tonnes 229.47 214.17 237.11 229.47 237.11 229.47 237.11 237.11 229.47 237.11 68.84 0.00 2386.44 2386.44 2386.44
liquor Trade Key.com/SA Prec. Met.
tonnes 229.47 214.17 237.11 229.47 237.11 229.47 237.11 237.11 229.47 237.11 68.84 0.00 2386.44 2386.44 2386.44
3.70% Opening Stocks tonnes 0,00 0,00 0,00 0,00 0,00 0,00 0,00 0,00 0,00 0,00 0,00 0,00 0,00 0,00 0,00
Production tonnes 229.47 214.17 237.11 229.47 237.11 229.47 237.11 237.11 229.47 237.11 68.84 0.00 2386.44 2386.44 2386.44
Shut down days 0 0 0 0 0 0 0 0 0 0 21 31 52 52 52
Plant availability TU% 100% 100% 100% 100% 100% 100% 100% 100% 100% 100% 30% 0% 85.71% 85.71% 85.71%
Stellenbosch University https://scholar.sun.ac.za
Stellenbosch University https://scholar.sun.ac.za

299
330
Table E.5: Annual production plan during normal operations for copper cathodes and gold liquor production (models 3d & 4d)
WPCB hydrometallurgical plant
Annual production plan Production summary
Annual Totals (tonnes) 3a & 4a 3b & 4b 3c & 4c 3d & 4d
Gold sludge sales 0.113 0.00 0.113 0.00
Gold liquor sales 0.00 761.07 0.00 801.04
Copper LME Grade A 72.72 0.00 0.00 89.54
CuSO4 liquor (3.71%) 0.00 2386.44 2386.44 0.00
Month Jan Feb Mar April May June July Aug Sep Oct Nov Dec Plan BUDGET Actual
Days 30 28 31 30 31 30 31 31 30 31 30 31 312 312 312
Remark plan plan plan plan plan plan plan plan plan plan plan plan Normal Normal Year 1
Business Gold Gold liquor sales
tonnes 77.02 71.89 79.59 77.02 79.59 77.02 79.59 79.59 77.02 79.59 23.11 0.00 801.04 801.04 801.04
Model liquor SA Precious metals
tonnes 77.02 71.89 79.59 77.02 79.59 77.02 79.59 79.59 77.02 79.59 23.11 0.00 801.04 801.04 801.04
3d & 4d 142.52ppm Opening stocks
tonnes 0.00 0.00 0.00 0.00 0.00 0.00 0.00 0.00 0.00 0.00 0.00 0.00 0.00 0.00 0.00
Production tonnes 77.02 71.89 79.59 77.02 79.59 77.02 79.59 79.59 77.02 79.59 23.11 0.00 801.04 801.04 801.04
Shut down days 0 0 0 0 0 0 0 0 0 0 21 31 52 52 52
Plant availability
TU% 100% 100% 100% 100% 100% 100% 100% 100% 100% 100% 30% 0% 85.71% 85.71% 85.71%
Copper Copper cathode sales
tonnes 8.61 8.04 8.90 8.61 8.90 8.61 8.90 8.90 8.61 8.90 2.58 0.00 89.54 89.54 89.54
LME Trade Key.com
tonnes 8.61 8.04 8.90 8.61 8.90 8.61 8.90 8.90 8.61 8.90 2.58 0.00 89.54 89.54 89.54
grade A Opening Stocks
tonnes 0.00 0.00 0.00 0.00 0.00 0.00 0.00 0.00 0.00 0.00 0.00 0.00 0.00 0.00 0.00
>99% Production tonnes 8.61 8.04 8.90 8.61 8.90 8.61 8.90 8.90 8.61 8.90 2.58 0.00 89.54 89.54 89.54
Shut down days 0 0 0 0 0 0 0 0 0 0 21 31 52 52 52
Plant availability
TU% 100% 100% 100% 100% 100% 100% 100% 100% 100% 100% 30% 0% 85.71% 85.71% 85.71%
Stellenbosch University https://scholar.sun.ac.za
Stellenbosch University https://scholar.sun.ac.za

300
F: Calculations for economic evaluations
Stellenbosch University https://scholar.sun.ac.za

301
Table F.1: Water softener sizing and operational data sheet (Soft water requirements and process water chemistry)
Operating basis for process 400 Tonnes/year
Units Quantity Quantity Reference data source Original worked with 92% availability with 12,5% excess capacity 400Tonnes/annum capacity
Soft water requirements (2 elution cycles) m3/day 11.92 11.33 Updated mass balances,de Waal (2018)) Operating time for softener Hours/day 22.33 21.24 DOW (1999), Commissioning data (Msuku (2012) Resin regeneration time Hours/day 1.67 1.59 DOW (1999), Commissioning data (Msuku (2012) Softener tank capacity m3 0.16 0.15 Updated mass balances (de Waal (2018)) Flow through velocity m3/hour 0,53 0.51 Calculated Resin loading m3 0.05 0.05 Calculated Resin bed voidage m3 0.02 0.02 Ketrick (2014) Volume for water flow m3 0.11 0.10 Calculated Flow through volume in softener m3 0.13 0.12 Calculated Recommended flow in softener lower limit L/min m3 66.87 63.60 Technical data for softener operation Ketrick (2014) Recommended flow in softener lower limit L/min m3 1337.46 1272.06 Technical data for softener operation Ketrick (2014)
Softener flow for the process L/min m3 68.41 65.07 Calculated. Resin bed will expand within normal limits of 67% of softener (Ketrick(2014))
Brine tank capacity m3 0.59 0.56 Manjengwa (2014)
Process water chemistry
Feed water for softening m3/day 11.92 11.33 Local municipality (Mohotsi (2016)) Regeneration water m3/day 1.26 1.20 Backwash water m3/day 0.09 0.08 DOW (1999), Commissioning data (Msuku (2012) Brine injection and slow rinse m3/day 0.53 0.51 DOW (1999), Commissioning data (Msuku (2012) Rapid rinse m3/day 0.11 0.10 DOW (1999), Commissioning data (Msuku (2012) Brine refill m3/day 0.53 0.51 DOW (1999), Commissioning data (Msuku (2012) Daily water usage for running the water softener m3/day 13.18 12.53 DOW (1999), Commissioning data (Msuku (2012) Effluent water from regeneration m3/day 0.73 0.69 DOW (1999), Commissioning data (Msuku (2012) Calcium ion concentration mg/L 17.89 17.02 Local municipality (Mohotsi (2016)) Magnesium ion concentration mg/L 7.31 6.95 Local municipality (Mohotsi (2016)) Ca 2+ conversion factor units 2.50 2.38 Ketrick (2014), Purolite (2014) Mg 2+ conversion factor units 4.18 3.98 Ketrick (2014), Purolite (2014) Total hardness as CaCO3 mg/L 75.29 71.61 Calculated (Ketrick (2014), Purolite (2014), Mohotsi (2016)) Equivalent moles of CaCO3 moles/L 0.00 0.00 Equivalent moles of CaCO3 moles/day 8.96 8.52 Calculated (Ketrick (2014), Purolite (2014), Mohotsi (2016)) Moles of sodium ions loaded on resin for softening moles/day 17.93 17.05 Calculated (Ketrick (2014), Purolite (2014), Mohotsi (2016)) Moles of salt required for regenerating resin moles/day 26.89 25.57 Calculated (Ketrick (2014), Purolite (2014), Mohotsi (2016)) Mass of salt required for regenerating resin kgs/day 1.57 1.49 Calculated (Ketrick (2014), Purolite (2014), Mohotsi (2016)) Moles of salt required for making up new brine solution moles/day 26.89 25.57 Calculated (Ketrick (2014), Purolite (2014), Mohotsi (2016)) Mass of salt for making up new brine solution moles/day 1.57 1.49 Calculated (Ketrick (2014), Purolite (2014), Mohotsi (2016)) Daily salt usage for running the water softener kgs/day 3.14 2.99 Calculated (Ketrick (2014), Purolite (2014), Mohotsi (2016))
Stellenbosch University https://scholar.sun.ac.za
Stellenbosch University https://scholar.sun.ac.za
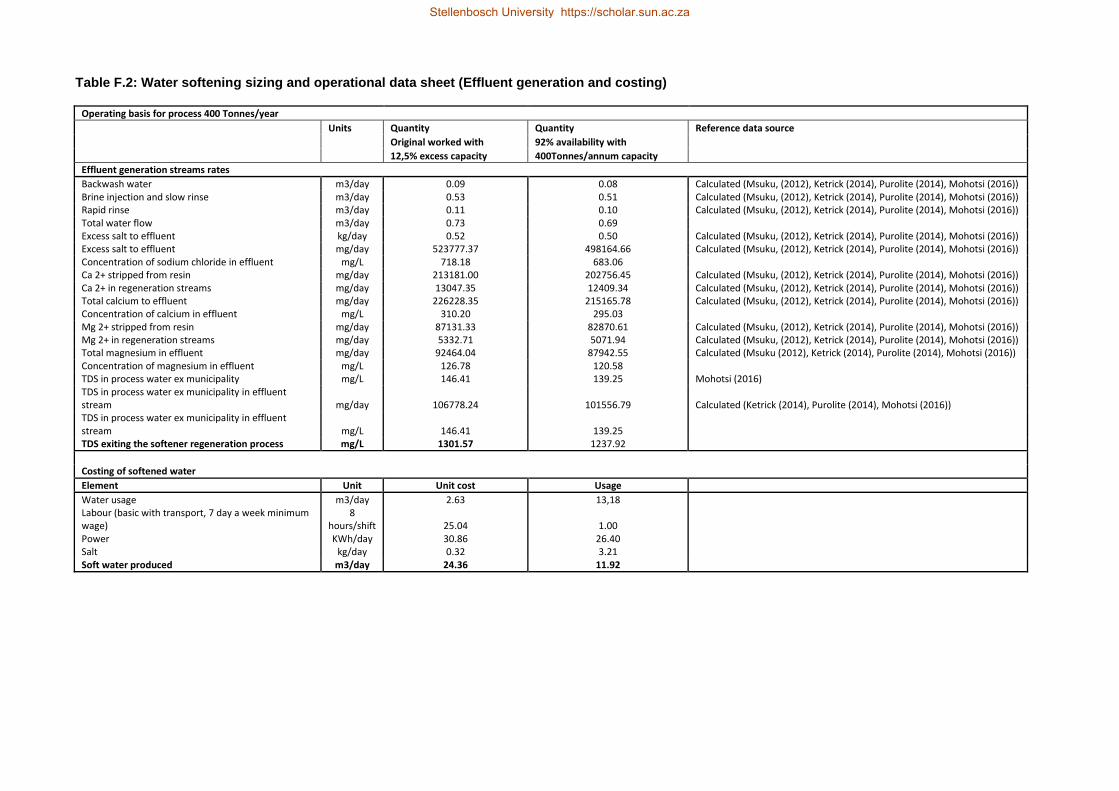
302
Table F.2: Water softening sizing and operational data sheet (Effluent generation and costing)
Operating basis for process 400 Tonnes/year
Units Quantity Quantity Reference data source
Original worked with 92% availability with
12,5% excess capacity 400Tonnes/annum capacity
Effluent generation streams rates
Backwash water m3/day 0.09 0.08 Calculated (Msuku, (2012), Ketrick (2014), Purolite (2014), Mohotsi (2016)) Brine injection and slow rinse m3/day 0.53 0.51 Calculated (Msuku, (2012), Ketrick (2014), Purolite (2014), Mohotsi (2016)) Rapid rinse m3/day 0.11 0.10 Calculated (Msuku, (2012), Ketrick (2014), Purolite (2014), Mohotsi (2016)) Total water flow m3/day 0.73 0.69 Excess salt to effluent kg/day 0.52 0.50 Calculated (Msuku, (2012), Ketrick (2014), Purolite (2014), Mohotsi (2016)) Excess salt to effluent mg/day 523777.37 498164.66 Calculated (Msuku, (2012), Ketrick (2014), Purolite (2014), Mohotsi (2016)) Concentration of sodium chloride in effluent mg/L 718.18 683.06 Ca 2+ stripped from resin mg/day 213181.00 202756.45 Calculated (Msuku, (2012), Ketrick (2014), Purolite (2014), Mohotsi (2016)) Ca 2+ in regeneration streams mg/day 13047.35 12409.34 Calculated (Msuku, (2012), Ketrick (2014), Purolite (2014), Mohotsi (2016)) Total calcium to effluent mg/day 226228.35 215165.78 Calculated (Msuku, (2012), Ketrick (2014), Purolite (2014), Mohotsi (2016)) Concentration of calcium in effluent mg/L 310.20 295.03 Mg 2+ stripped from resin mg/day 87131.33 82870.61 Calculated (Msuku, (2012), Ketrick (2014), Purolite (2014), Mohotsi (2016)) Mg 2+ in regeneration streams mg/day 5332.71 5071.94 Calculated (Msuku, (2012), Ketrick (2014), Purolite (2014), Mohotsi (2016)) Total magnesium in effluent mg/day 92464.04 87942.55 Calculated (Msuku (2012), Ketrick (2014), Purolite (2014), Mohotsi (2016)) Concentration of magnesium in effluent mg/L 126.78 120.58 TDS in process water ex municipality mg/L 146.41 139.25 Mohotsi (2016) TDS in process water ex municipality in effluent stream mg/day 106778.24 101556.79 Calculated (Ketrick (2014), Purolite (2014), Mohotsi (2016)) TDS in process water ex municipality in effluent stream mg/L 146.41 139.25 TDS exiting the softener regeneration process mg/L 1301.57 1237.92
Costing of softened water
Element Unit Unit cost Usage
Water usage m3/day 2.63 13,18 Labour (basic with transport, 7 day a week minimum wage)
8 hours/shift 25.04 1.00
Power KWh/day 30.86 26.40 Salt kg/day 0.32 3.21 Soft water produced m3/day 24.36 11.92
Stellenbosch University https://scholar.sun.ac.za
Stellenbosch University https://scholar.sun.ac.za

303
Table F.3: Key product output analysis for all the plants business models 3a and 4a
* crushed WPCBs were outsourced in the case of 4a
Business models 3a & 4a
Hourly production
Daily production
Monthly production
Annual production
Material/product (Tonnes/hr) (Tonnes/day) (Tonnes/month) (Tonnes/annum)
Crushing and milling or outsource
WPCBs 0.06 1.47 43.98 457.44
Solder leaching
Desoldered solids 0.06 1.33 39.79 413.79
Solder leach 0.96 23.16 694.71 7225.02
Copper Extraction
Filtered solids 0.04 1.00 29.98 311.75
Copper Liquor 0.32 7.65 229.47 2386.44
Copper (cathode sheets) 0.01 0.29 8.62 89.66
Nitric acid wash
Stripped solids 0.04 1.04 31.18 324.23
Silver rich liquor 0.20 4.78 143.44 1491.76
Gold extraction
Gold liquor 0.10 2.44 73.18 761.07
Gold sludge 0.00002 0.0004 0.0109 0.1131
Non-metallic solids 0.04 0.94 28.34 294.71
Table F.4: Key product output analysis for all the plants business models 3b and 4b
* crushed WPCBs were outsourced in the case of 4b
Business models 3b & 4b Hourly
production Daily
production Monthly
production Annual
production
Material/product (Tonnes/hr) (Tonnes/day) (Tonnes/month) (Tonnes/annum)
Crushing and milling/outsourced
WPCBs 0.06 1.47 43.98 457.44
Solder leaching
Desoldered solids 0.06 1.33 39.79 413.79 Solder leach 0.96 23.16 694.71 7225.02
Copper Extraction
Filtered solids 0.04 1.00 29.98 311.75
Copper Liquor 0.32 7.65 229.47 2386.44
Nitric acid wash
Stripped solids 0.04 1.04 31.18 324.23
Silver rich liquor 0.20 4.78 143.44 1491.76
Gold extraction
Gold liquor 0.11 2.57 77.02 801.04
Non-metallic solids 0.00 0.0003 0.010 0.105
Stellenbosch University https://scholar.sun.ac.za

304
Table F.5: Key product output analysis for all the plants business models 3c and 4c
* crushed WPCBs were outsourced in the case of 4c
Business models 3c & 4c Hourly
production Daily
production Monthly
production Annual
production Material/product (Tonnes/hr) (Tonnes/day) (Tonnes/month) (Tonnes/annum)
Crushing and milling/outsourced
WPCBs 0.06 1.47 43.98 457.44
Solder leaching
Desoldered solids 0.06 1.33 39.79 413.79 Solder leach 0.96 23.16 694.71 7225.02
Copper Extraction
Filtered solids 0.04 1.00 29.98 311.75 Copper Liquor 0.32 7.65 229.47 2386.44
Nitric acid wash
Stripped solids 0.04 1.04 31.18 324.23 Silver rich liquor 0.20 4.78 143.44 1491.76
Gold extraction
Gold liquor 0.10 2.44 73.18 761.07 Gold sludge 0.00002 0.0004 0.0109 0.1131 Non-metallic solids 0.04 0.94 28.34 294.71
Table F.6: Key product output analysis for all the plants business models 3d and 4d
* crushed WPCBs were outsourced in the case of 4d
Business model 3d & 4d Hourly
production Daily
production Monthly
production Annual
production
Material/product (Tonnes/hr) (Tonnes/day) (Tonnes/month) (Tonnes/annum)
Crushing and milling/outsourced
WPCBs 0.06 1.47 43.98 457.44
Solder leaching
Desoldered solids 0.06 1.33 39.79 413.79
Solder leach 0.96 23.16 694.71 7225.02
Copper Extraction
Filtered solids 0.04 1.00 29.98 311.75
Copper Liquor 0.32 7.65 229.47 2386.44
Copper (cathode sheets) 0.01 0.29 8.62 89.66
Nitric acid wash
Stripped solids 0.04 1.04 31.18 324.23
Silver rich liquor 0.20 4.78 143.44 1491.76
Gold extraction
Gold liquor 0.11 2.57 77.02 801.04
Non-metallic solids 0.00 0.0003 0.010 0.105
Stellenbosch University https://scholar.sun.ac.za

305
Table F.7: Generic main equipment schedule
Guide and remarks Equipment Number Capacity Material of construction Residence time (hours) Temperature (Deg C) Pressure (Kpa)
Size reduction
1 week x1,1 actual WPCBs holding bin 1 9,38m3 Rigid PVC 10mm thick 168 25,15 101,325
1 shift WPCBs crusher feedhopper 1 0,084m3 Mild steel 24 25,15 101,325
1 day Hammer crusher 1 0,067tes/hr MSS (250*360 mm internal chamber) Continuous flow through 25,15 101,325
1 day Screen (1.3 times crushing rate) 1 0,087tes/hr Mild steel (2 deck, 1350*700*1250mm) Continuous flow through 25,15 101,325
1 day Crushed WPCBs buffer hopper 1 0,252m3 Mild steel 24 25,15 101,325
1 day Ball mill 1 0,067tes/hr MSS (1500x1000x1200) Continuous flow through 25,15 101,325
Solder leaching
1 day x1,1 actual Milled solids buffer hopper 1 0,94m3 Rigid PVC 10mm thick 24 25,15 101,325
x1,1 actual I day storage Pregnant leach tank 1 24,78m3 Mild steel 24 33 101,325
holds material for a batch Solder leach tanks 2 7,53m3 SS316 8 33 101,325
I day's operation 1,1 x actual Pressure filter 1 49,57m3/hr Mild steel 0,5 33 1600
Copper extraction
x 1.1 actual for 7 days Dewatered solids buffer hopper 1 6,35m3 Mild steel 12 25,15 101,325
7 days x 1,1 actual Hydrogen peroxide dosing tank 1 2,74m3 SS316 168 (Continuous flow through) 25,15 101,325
For 7 days Sulphuric storage 1 4,60m3 SS316 168 (Continuous flow through) 25,15 101,325
1 week Sodium chloride dosing tank 1 0,03m3 PVC 168 (Continuous flow through) 25,15 101,325
One month Cobalt sulphate dosing tank 1 0,03m3 PVC 168 (Continuous flow through) 25,15 101,325
1 week FC-1100 dosing tank 1 0,03m3 PVC 168 (Continuous flow through)
1 week DXG solution tank 1 0,033m3 PVC 168 (Continuous flow through) 25,15 101,325
1 week Electrolyte make up tank 1 27,66m3 SS316 168 25,15 101,325
1 week Copper leach tank 2 27,79m3 SS904 8 40 101,325
1 week of material Pressure filter 1 49,57m3/hr SS316 1 FP 40 1600
1 week Leach filtrate surge tank 1 2m3 SS904 1 FP 25-40 101,325
x 1.1 actual Sodium hydroxide solution tank 1 0,703m3 Rigid PVC 10mm thick 12 25,15 101,325
1 week of material x 1,1 actual Pregnant leach solution tank 1 52,81m3 SS316 12 FP 25,15 101,325
Mixer settler 3 7,50m3 FRP composite 0,583333333 <40 101,325-400
Updated Loaded organic solvent washer 1 7,50m3 FRP composite 0,583333333 <40 101,325-400
Organic stripper 2 7,50m3 FRP composite 0,583333333 <40 101,325-400
x 1.1 actual Electrolyte circulation tank 1 119,64m3 SS316 7,598 40 101,325
x 1.1 actual Heat exchanger 1 3.82KW SS316 FP 40 101,325
x 1.1 actual to 4 sig figures Centrifuge 1 0,002t/hr Mild steel (Dia 30cm) FP 25,15 101,325
for handling 7 days of production, operates once a week Cathode stripping machine 1 1 Cathode/hour Stainless steel 316/38/220V 50Hz (manual) 1 25-143 101,325-
actual (with anode spacers) Electrowinning cells 1 5,2t/hr Pb-Ca-Sn/SS 304 anode and cathode, Glass lined mild steel 168 30-45 101,325
Nitric acid wash
7 days from copper plant Dewatered solids feed/buffer hopper 1 4,48m3 Mild steel 24/FP 25,15 101,325
2 weeks x1,1 actual 55% nitric acid storage tank (central) 1 20,87m3 SS316 336 FP 25,15 101,325
1,1 x actual for 4 cycles each day. Sized to handle 1 day of materialNitric acid wash tank 1 1,72m3 SS316 5 100 101,325
x1,1 actual. Rated as tonnage of saturated steam condensed. Condenser 1 19,51KW (54,90m3/hr) SS316 5 35-100 101,325
3,79% vol of acid wash tank Silver liquor surge tank 1 0,07m3 Mild steel 0,5-1 80-90 101,325
1,1 x actual for 4 cycles each day. Sized to handle 1 day of materialPressure filter 1 10,89m3/hr SS316 0,25 90-100 1600
1,1 x actual for 4 cycles each day. Sized to handle 1 day of materialPressure filter 1 10,89m3/hr Mild steel 0,25 25-35 1600
1.1 x actual. 7 days material Stripped solids hopper 1 4,74m3 Mild steel 24 FP 25,15 101,325
1,1 x actual for 4 cycles each day. Sized to handle 1 day of materialSolids sluice tank 1 1,67m3 Mild steel 1 25,15 101,325
3,79% vol of sluice tank Slurry wash water surge tank 1 0,07m3 Mild steel 0,5-1 25,15 101,325
Gold extraction
1 day 1,1 actual Dewatered solids buffer hopper 1 0,68m3 Polymer concrete (Epoxy resin 58%) 24 FP 25,15 101,325
1 day x 1,1 actual Hydrated lime feed hopper 1 0,867m3 Polymer concrete (Epoxy resin 58%) 24 FP 25,15 101,325
1 day x 1,1 actual Sodium cyanide dosing tank 1 8,17m3 SS316 2FP 25,15 101,325
1 day x 1,1 actual Sodium cyanide dosing tank (Elution) 1 7,95m3 SS316 2FP 25,15 101,325
I cycle for 24 hours of material flow Leach slurry conditioning tank 1 11,19m3 SS316 0,5 25,15 101,325
x1,1 actualx 1,104 to absorb lag time Gold leach tanks 6 2,21m3 SS316 24 25,15 101,325
1 day's material Pressure filter 1 10,89m3/hr SS316 1 25,15 1600
x 1.1 holds 1 leaching campaign Gold leach surge tank 1 10,67m3 SS316 12 maximum 25,15 101,325
x1.1 handles 12hrs worth of leachate Adsorption tanks 6 0,912m3 Mild steel 1 hour in each, 11 hours total flow per batch 25,15 101,325
For running 2 batches x1,1 of actual Dilute hydrochloric acid tank 3% 1 3,98m3 Hastelloy C FP 25,15 101,325
A day's production x1,1 Preheated soft water tank 1 14,4m3 Mild steel FP 90 101,325
A day's production x1,1 Eluant solution (make up & storage) 1 7,96m3 SS316 FP 25,15 101,325
1-2 times larger than elution x1,5 elution column (Rogans (2012)) Loaded carbon feed hopper 1 6,90m3 Mild steel 12 25,15 101,325
x 1,1 actual, for running 2 batches Acid wash column 1 3,98m3 Hastelloy C 3 90 101,325
x 1,1 actual, for running 2 batches each day Elution column 1 4,60m3 Hastelloy C 6,5 110-115 101,325-230
x 1,1 actual for handling 14 batches of material (week) NaOH pH correction tank 1 0,59m3 Rigid PVC 10mm thick or composite 168 (Continuous flow through) 25,15 101,325
x 1,1 actual (2 bed vols) Weak eluant recycle tank 1 3,98m3 SS316 26,5 90 101,325
x 1,1 actual Heat exchanger (electrowinning) 1 4,544KW SS316 (Shell and tube) 24 FP 90 101,325
x 1,1 actual Heat exchanger (eluant solution) 1 4,544KW Mild steel (plate) 24 FP 90 101,325
x 1,1 actual Heat exchanger (soft water) 1 4,544KW Hastelloy C (shell and tube) 24 FP 90 101,325
x1,1 actual Heat exchanger (dilute hydrochloric acid) 1 4,544KW Reinforced PVC 24 FP 90 101,325
Handles 2 batches each day Eluate storage tank/circulation (electrowinning) 1 7,96m3 SS316 5 90 101,325
x1,1 actual Electrowinning cells 6 1,21 tes/hr Mild steel 5 25,15 101,325
x1,1 actual Eluted carbon tank 1 1,065m3 Mild steel 0,25 650-750 101,325
x 1,1 actual based on carbon per 12hr batch Rotary kiln 1 1.92 tes/hr Mild steel 0,25 25 101,325
x1,1 actual Barren carbon dewatering screen (single deck) 1 1,32 tes/hr (1m2) Mild steel 0,33 25 101,325
x1,3 actual Carbon quencher/cooler 1 (2,31 tes/hr) 1,26m3 Mild steel 0,42 25 101,325
x1,1 actual Regeneration carbon screen (double deck) 1 1,32 tes/hr (1m2) Mild steel 0,33 25 101,325
x1,1 actual, sized to handle two batches of carbon Activated carbon feed hopper 1 2,13m3 Mild steel 0,25 25-40 101,325
Utilities
7 days Water softening unit 1 0,162m3 Mild steel 22,33 hrs operation 1,67 hours regeneration 25,15 253-405,3
x1,1 actual capacity Brine tank 1 0,65m3 PVC 22,33 hrs 25,15 101,325
x 1.5 actual capacity Air compressor 1 1,41m3/hr MSS, Reciprocating, single stage 13 hrs full load, 11 hours 25% of full load 25 233,05
Recommended for the specified compressor output Receiving cylinder 1 0,027m3 Mild steel 24 FP 35 350
Scavenging and effluent management
x 1,1 actual I day Scavenging cells acid stream 1 2,43tes/hr Equipment supplier specifications 24hrs continous electrowinning (EMEW cell technology) 25-40 101,325
x 1,1 actual I day Scavenging cells basic gold stream 1 0,48 tes/hr Equipment supplier specifications 24 hrs continous electrowinning (RenoCell technology) 25-40 101,325
x 1,1 actual I day Blended effluent tank (acid stream) 1 58,26m3 SS316 24 hrs continous flow through 25-40 101,325
x 1,1 actual I day Blended effluent tank (basic stream) 1 11,46m3 SS316 24 hrs continous flow through 25-40 101,325
x 1,1 actual per day Barren effluent conditioning tank 1 69,72m3 Mild steel 24 hrs continous dilution and discharge or recirculation 25 101,325
x 1,1 actual I day Polished effluent distribution tank (acid stream) 1 58,26m3 Mild steel 24 hrs continous or recirculation 25 101,325
x 1,1 actual I day Polished effluent distribution tank (basic stream) 1 11,46m3 Mild steel 24 hrs continous or recirculation 25 101,325
1 week x1,1 actual Spent WPCB solids hopper 1 6,78m3 Rigid PVC 10mm thick 168 25,15 101,325
Stellenbosch University https://scholar.sun.ac.za
Stellenbosch University https://scholar.sun.ac.za

306
Table F.8: Main equipment cost schedule for all the sections
M ain equipment l ist
*FP - Feed to process, SS stainless steels series, M SS -manufacturer's specif icat ion sheet
Size reduct ion
Equipment Quant it y M at er ial o f const ruct ion C apacit y R ef erence capacit y R ef erence cost B ase year Index Fact o r Est imat ed U nit cost R ef erence dat a/ vendor
WPCBs holding bin 1 Rigid PVC 10mm thick 9,38m3 1 m3 $150,00 2010 550,8 0,6 $592,09 Improchem (M ukariri (2012))Timmerhaus & Peters (1991)
WPCBs crusher feedhopper 1 M ild steel 0,084m3 1 m3 $1 000,00 2014 576,1 0,6 $985,07 Online est imator (http:/ /www.matche.com/equipcost/Bin.html), Timmerhaus & Peters (1991)
Hammer crusher 1 M SS (250*360 mm internal chamber) 0,067tes/hr 55tes/hr $10 000,00 2018 567,5 0,6 $5 123,79 Henan Fineschina M achinery, Henan, China (M ainland)
Screen (1.3 t imes crushing rate) 1 M ild steel (2 deck, 1350*700*1250mm) 0,087tes/hr 0,6tes/hr (2,97 m2) $20 800,00 2014 576,1 0,6 $10 656,71 Online est imator (http:/ /www.matche.com/equipcost/Bin.html), Timmerhaus & Peters (1991)
Crushed WPCBs buffer hopper 1 M ild steel 0,252m3 20,95m3 $13 300,00 2014 576,1 0,6 $923,53 Online est imator (http:/ /www.matche.com/equipcost/Bin.html), Timmerhaus & Peters (1991)
Ball mill 1 M SS (420mmx450mm) 911M PEPPGR426 0,067tes/hr 0,146 tes/hr $25 000,00 2018 567,5 0,6 $15 666,54 Henan Deya M achinery Company Limited, Henan, China (M ainland)
So lder leaching
M illed solids buffer hopper 1 Rigid PVC 10mm thick 0,94m3 1 m3 $150,00 2010 550,8 0,6 $148,92 Improchem (M ukariri (2012))Timmerhaus & Peters (1991)
Pregnant leach tank 1 M ild steel 24,78m3 75,71m3 $46 800,00 2014 576,1 0,6 $23 587,54 Online est imator (http:/ /www.matche.com/equipcost/Bin.html), Timmerhaus & Peters (1991)
Solder leach tanks 2 SS316 7,53m3 5m3 $11 500,00 2000 394,1 0,53 $20 573,33 Timmerhaus & Peters (1991), Turton et al., (2009), Van Wyk (2014)
Pressure f ilter 1 M ild steel (49,57m3/hr) 0,5 m2 18,58m2 $86 500,00 2014 576,1 0,55 $11 666,55 Online est imator (http:/ /www.matche.com/equipcost/Bin.html), Timmerhaus & Peters (1991), Perry et al ., (1997)
C opper ext ract ion
Dewatered solids buffer hopper 1 M ild steel 6,35m3 20,95m3 $13 300,00 2014 576,1 0,6 $6 401,38 Online est imator (http:/ /www.matche.com/equipcost/Bin.html), Timmerhaus & Peters (1991)
Hydrogen peroxide dosing tank 1 SS316 2,74m3 5m3 $11 500,00 2000 394,1 0,53 $12 039,57 Timmerhaus & Peters (1991), Turton et al., (2009), Van Wyk (2014)
Sulphuric storage 1 SS316 4,60m3 5m3 $11 500,00 2000 394,1 0,53 $15 844,00 Timmerhaus and Peters (1991), Turton et al., (2009), Van Wyk (2014)
Sodium chloride dosing tank 1 PVC 0,03m3 1 m3 $150,00 2010 550,8 0,6 $18,85 Improchem (M ukariri (2012)),Timmerhaus & Peters (1991)
Cobalt sulphate dosing tank 1 PVC 0,03m3 1 m3 $150,00 2010 550,8 0,6 $18,85 Improchem (M ukariri (2012)),Timmerhaus & Peters (1991)
FC-1100 dosing tank 1 PVC 0,03m3 1 m3 $150,00 2010 550,8 0,6 $18,85 Improchem (M ukariri (2012)),Timmerhaus & Peters (1991)
DXG solut ion tank 1 PVC 0,033m3 1 m3 $150,00 2010 550,8 0,6 $19,96 Improchem (M ukariri (2012)),Timmerhaus & Peters (1991)
Electrolyte make up tank 1 SS316 27,66m3 5m3 $11 500,00 2000 394,1 0,53 $41 000,09 Timmerhaus & Peters (1991), Turton et al., (2009), Van Wyk (2014)
Copper leach tank 2 SS904 27,79m3 5m3 $11 500,00 2000 394,1 0,53 $41 102,11 Timmerhaus & Peters (1991), Turton et al., (2009), Van Wyk (2014)
Pressure f ilter 1 SS316 (49,57m3/hr) 0,5 m2 18,58m2 $190 400,00 2014 576,1 0,55 $25 679,90 Online est imator (http:/ /www.matche.com/equipcost/Bin.html), Timmerhaus & Peters (1991), Perry et al ., (1997)
Leach f ilt rate surge tank 1 SS904 2m3 5m3 $11 500,00 2000 394,1 0,53 $10 189,41 Timmerhaus & Peters (1991), Turton et al., (2009), Van Wyk (2014)
Sodium hydroxide solut ion tank 1 Rigid PVC 10mm thick 0,703m3 1 m3 $150,00 2010 550,8 0,6 $125,09 Improchem (M ukariri (2012))Timmerhaus and Peters (1991)
Pregnant leach solut ion tank 1 SS316 52,81m3 5m3 $11 500,00 2000 394,1 0,53 $57 762,07 Timmerhaus & Peters (1991), Turton et al., (2009), Van Wyk (2014)
M ixer sett ler 3 FRP composite (7,50m3) 158 Tonnes 31 Tonnes $75 000,00 2018 567,5 0,6 $28 466,92 Timmerhaus and Peters (1991)
Loaded organic solvent washer 1 FRP composite (7,50m3) 158 Tonnes 31 Tonnes $75 000,00 2018 535,3 0,6 $30 179,29 Timmerhaus and Peters (1991), M aterial propert ies http:/ /web.mit .edu/course/3/3.11/www/modules/props.pdf 12/08/2018
Organic stripper 2 FRP composite (7,50m3) 158 Tonnes 31 Tonnes $75 000,00 2018 541,7 0,6 $29 822,74 Timmerhaus and Peters (1991), M aterial propert ies http:/ /web.mit .edu/course/3/3.11/www/modules/props.pdf 12/08/2018
Electrolyte circulat ion tank 1 SS316 119,64m3 5m3 $11 500,00 2000 394,1 0,53 $89 099,99 Timmerhaus & Peters (1991), Turton et al., (2009), Van Wyk (2014)
Heat exchanger 1 SS316 3.82KW 1500KW $52 451,00 2001 394,3 0,81 $598,04 Timmerhaus & Peters (1991), Turton et al., (2009), Van Wyk (2014)
Centrifuge 1 M ild steel (Dia 30cm) (0,002t/hr) Dia 30cm 60,96 $14 300,00 2014 576,1 0,6 $13 133,74 Online est imator (http:/ /www.matche.com/equipcost/Bin.html), Timmerhaus & Peters (1991)
Cathode stripping machine 1 Stainless steel 316/38/220V 50Hz (manual) 3 Cathodes/hour 200 Cathodes/hour $4 502 500,00 2018 567,5 0,6 $362 333,49 Unisam, Hunan, China (M ainland)
Electrowinning cells 1 Pb-Ca-Sn/SS 304 anode & cathode, Glass lined mild steel 5,2t/hr (5,84m3) 5,84m3 $90 000,00 2014 576,1 0,6 $89 516,48 Online est imator (http:/ /www.matche.com/equipcost/Bin.html), Timmerhaus & Peters (1991)
N it r ic acid wash
Dewatered solids feed/buffer hopper 1 M ild steel 4,48m3 20,95m3 $13 300,00 2014 576,1 0,6 $5 192,49 Online est imator (http:/ /www.matche.com/equipcost/Bin.html), Timmerhaus & Peters (1991)
55% nitric acid storage tank (central) 1 SS316 20,87m3 5m3 $11 500,00 2000 394,1 0,53 $35 314,26 Timmerhaus & Peters (1991), Turton et al., (2009), Van Wyk (2014)
Nitric acid wash tank 1 SS316 1,72m3 5m3 $11 500,00 2000 394,1 0,53 $9 406,61 Timmerhaus & Peters (1991), Turton et al., (2009), Van Wyk (2014)
Condenser 1 SS316 19,51KW (54,90m3/hr) 1500KW $52 451,00 2001 394,3 0,59 $5 824,39 Timmerhaus & Peters (1991), Turton et al., (2009), Van Wyk (2014)
Silver liquor surge tank 1 M ild steel 0,07m3 75,71m3 $46 800,00 2014 576,1 0,6 $697,08 Online est imator (http:/ /www.matche.com/equipcost/Bin.html), Timmerhaus & Peters (1991)
Pressure f ilter 1 SS316 10,89m3/hr (0,33m2) 18,58m2 $190 400,00 2014 576,1 0,55 $5 641,60 Online est imator (http:/ /www.matche.com/equipcost/Bin.html), Timmerhaus & Peters (1991), Perry et al ., (1997) M EPS (2018)
Pressure f ilter 1 M ild steel 10,89m3/hr (0,33m2) 18,58m2 $86 500,00 2014 576,1 0,55 $2 563,02 Online est imator (http:/ /www.matche.com/equipcost/Bin.html), Timmerhaus & Peters (1991), Perry et al ., (1997)
Stripped solids hopper 1 M ild steel 4,74m3 0.2832m3 $1 800,00 2014 576,1 0,6 $9 615,05 Online est imator (http:/ /www.matche.com/equipcost/Bin.html), Timmerhaus & Peters (1991)
Solids sluice tank 1 M ild steel 1,67m3 75,71m3 $46 800,00 2014 576,1 0,6 $4 675,76 Timmerhaus & Peters (1991), Turton et al., (2009), Van Wyk (2014)
Slurry wash water surge tank 1 M ild steel 0,07m3 75,71m3 $46 800,00 2014 576,1 0,6 $697,08 Timmerhaus & Peters (1991), Turton et al., (2009), Van Wyk (2014)
Gold ext ract ion
Dewatered solids buffer hopper 1 Polymer concrete (Epoxy resin 58%) 0,68m3 1 m3 $150,00 2010 550,8 0,6 $449,61 Improchem (M ukariri (2012))M aterial propert ies http:/ /web.mit .edu/course/3/3.11/www/modules/props.pdf 12/08/2018
Hydrated lime feed hopper 1 Polymer concrete (Epoxy resin 58%) 0,867m3 1 m3 $150,00 2010 550,8 0,6 $520,17 Improchem (M ukariri (2012))M aterial propert ies http:/ /web.mit .edu/course/3/3.11/www/modules/props.pdf 12/08/2018
Sodium cyanide dosing tank 1 SS316 8,16m3 5m3 $11 500,00 2000 394,1 0,53 $21 482,30 Timmerhaus & Peters (1991), Turton et al., (2009), Van Wyk (2014)
Sodium cyanide dosing tank (Elut ion) 1 SS316 7,95m3 5m3 $11 500,00 2000 394,1 0,53 $21 173,75 Timmerhaus & Peters (1991), Turton et al., (2009), Van Wyk (2014)
Leach slurry condit ioning tank 1 SS316 11,19m3 5m3 $11 500,00 2000 394,1 0,53 $25 379,50 Timmerhaus & Peters (1991), Turton et al., (2009), Van Wyk (2014)
Gold leach tanks 6 SS316 2,21m3 5m3 $11 500,00 2000 394,1 0,53 $10 189,41 Timmerhaus & Peters (1991), Turton et al., (2009), Van Wyk (2014)
Pressure f ilter 1 SS316 10,89m3/hr (0,33m2) 18,58m2 $86 500,00 2014 576,1 0,6 $2 139,18 Online est imator (http:/ /www.matche.com/equipcost/Bin.html), Timmerhaus and Peters (1991)
Gold leach surge tank 1 SS316 10,67m3 5m3 $11 500,00 2000 394,1 0,53 $24 747,44 Timmerhaus & Peters (1991), Turton et al., (2009), Van Wyk (2014)
Adsorpt ion tanks 6 M ild steel 0,912m3 30m3 $216 837,00 2013 567,6 0,47 $41 976,62 Timmerhaus & Peters (1991), Turton et al., (2009), Van Wyk (2014)
Dilute hydrochloric acid tank 3% 1 Hastelloy C 3,98m3 5m3 $11 500,00 2000 394,1 0,53 $14 673,75 Timmerhaus & Peters (1991), Turton et al., (2009), Van Wyk (2014)
Preheated soft water tank 1 M ild steel 14,4m3 75,71m3 $46 800,00 2014 576,1 0,6 $17 030,97 Timmerhaus & Peters (1991), Turton et al., (2009), Van Wyk (2014)
Eluant solut ion (make up & storage) 1 SS316 7,96m3 5m3 $11 500,00 2000 394,1 0,53 $21 187,86 Timmerhaus & Peters (1991), Turton et al., (2009), Van Wyk (2014)
Loaded carbon feed hopper 1 M ild steel 6,90m3 20,95m3 $13 300,00 2014 576,1 0,6 $6 728,51 Online est imator (http:/ /www.matche.com/equipcost/Bin.html), Timmerhaus and Peters (1991)
Acid wash column 1 Hastelloy C 3,98m3 2,6m3 $5 366,00 2001 394,3 0,3 $8 775,31 Timmerhaus & Peters (1991), Turton et al., (2009), Van Wyk (2014)
Elut ion column 1 Hastelloy C 4,60m3 2,6m3 $5 366,00 2001 394,3 0,3 $9 164,84 Timmerhaus & Peters (1991), Turton et al., (2009), Van Wyk (2014)
NaOH pH correct ion tank 1 Rigid PVC 10mm thick or composite 0,59m3 1 m3 $150,00 2010 550,8 0,6 $112,61 Improchem (M ukariri (2012))Timmerhaus and Peters (1991)
Weak eluant recycle tank 1 SS316 3,98m3 5m3 $11 500,00 2000 394,1 0,53 $14 673,75 Timmerhaus & Peters (1991), Turton et al., (2009), Van Wyk (2014)
Heat exchanger (electrowinning) 1 SS316 (Shell and tube) 4,544KW 1500KW $52 451,00 2001 394,3 0,81 $688,31 Timmerhaus & Peters (1991), Turton et al., (2009), Van Wyk (2014)
Heat exchanger (eluant solut ion) 1 M ild steel (plate) 4,544KW 1500KW $52 451,00 2001 394,3 0,81 $688,31 Timmerhaus & Peters (1991), Turton et al., (2009), Van Wyk (2014)
Heat exchanger (soft water) 1 Hastelloy C (shell and tube) 4,544KW 1500KW $52 451,00 2001 394,3 0,81 $688,31 Timmerhaus & Peters (1991), Turton et al., (2009), Van Wyk (2014)
Heat exchanger (dilute hydrochloric acid) 1 Reinforced PVC 4,544KW 1500KW $52 451,00 2001 394,3 0,81 $688,31 Timmerhaus & Peters (1991), Turton et al., (2009), Van Wyk (2014)
Eluate storage tank/circulat ion (electrowinning) 1 SS316 7,96m3 5m3 $11 500,00 2000 394,1 0,53 $21 187,86 Timmerhaus & Peters (1991), Turton et al., (2009), Van Wyk (2014)
Electrowinning cells 6 M ild steel 1,21 tes/hr 5tes/hr $42 092,00 2013 567,6 0,8 $13 436,68 Timmerhaus & Peters (1991), Turton et al., (2009), Van Wyk (2014)
Eluted carbon tank 1 M ild steel 1,065m3 75,71m3 $46 800,00 2014 576,1 0,6 $3 569,70 Online est imator (http:/ /www.matche.com/equipcost/Bin.html), Timmerhaus & Peters (1991)
Rotary kiln 1 M ild steel 1.92 tes/hr 4,55tes/hr $360 000,00 1978 218,8 0,7 $510 415,59 Zanitsch & Lynch (1978), Van Wyk (2014)
Barren carbon dewatering screen (single deck) 1 M ild steel 1,32 tes/hr (1m2) 2,97m2 $20 900,00 2014 576,1 0,6 $10 714,22 Online est imator (http:/ /www.matche.com/equipcost/Bin.html), Timmerhaus & Peters (1991)
Carbon quencher/cooler 1 M ild steel (2,31 tes/hr) 1,26m3 75,71m3 $46 800,00 2014 576,1 0,6 $3 948,61 Online est imator (http:/ /www.matche.com/equipcost/Bin.html), Timmerhaus & Peters (1991)
Regenerat ion carbon screen (double deck) 1 M ild steel 1,32 tes/hr (1m2) 0,6tes/hr (2,97 m2) $20 800,00 2014 576,1 0,6 $10 662,95 Online est imator (http:/ /www.matche.com/equipcost/Bin.html), Timmerhaus & Peters (1991)
Act ivated carbon feed hopper 1 M ild steel 2,13m3 20,95m3 $13 300,00 2014 576,1 0,6 $3 323,82 Online est imator (http:/ /www.matche.com/equipcost/Bin.html), Timmerhaus & Peters (1991)
U t il it ies
Water softening unit 1 M ild steel 0,162m3 3,53m3 $19 212,22 2012 584,6 0,6 $2 935,82 Improchem (M ukariri (2012)), Timmerhaus and Peters (1991)
Brine tank 1 PVC 0,65m3 1 m3 $150,00 2010 550,8 0,6 $119,35 Improchem (M ukariri (2012)), Timmerhaus and Peters (1991)
Air compressor 1 M SS, Reciprocat ing, single stage 1,41m3/hr/ 0,45Hp 125Hp $88 700,00 2014 576,1 0,9 $3 123,76 Online est imator (http:/ /www.matche.com/equipcost/Bin.html), Timmerhaus & Peters (1991)
Receiving cylinder 1 M ild steel 0,027m3/ 80,59kg 9071,85kg $76 700,00 2014 576,1 0,62 $4 901,46 Online est imator (http:/ /www.matche.com/equipcost/Bin.html), Timmerhaus & Peters (1991)
Scaveng ing and ef f luent management
Scavenging cells acid stream 1 Equipment supplier specif icat ions 2,43tes/hr 5tes/hr $42 092,00 2013 567,6 0,8 $23 628,28 Timmerhaus and Peters (1991), Turton et al., (2009), Van Wyk (2014)
Scavenging cells basic gold stream 1 Equipment supplier specif icat ions 0,48 tes/hr 5tes/hr $42 092,00 2013 567,6 0,8 $6 455,65 Timmerhaus and Peters (1991), Turton et al., (2009), Van Wyk (2014)
Blended eff luent tank (acid stream) 1 SS316 58,26m3 5m3 $11 500,00 2000 394,1 0,53 $60 848,45 Timmerhaus and Peters (1991), Turton et al., (2009), Van Wyk (2014)
Blended eff luent tank (basic stream) 1 SS316 11,46m3 5m3 $11 500,00 2000 394,1 0,53 $25 702,24 Timmerhaus and Peters (1991), Turton et al., (2009), Van Wyk (2014)
Barren eff luent condit ioning tank 1 M ild steel 69,72m3 75,71m3 $46 800,00 2014 576,1 0,6 $43 876,94 Online est imator (http:/ /www.matche.com/equipcost/Bin.html), Timmerhaus & Peters (1991)
Polished eff luent distribut ion tank (acid stream) 1 M ild steel 58,26m3 75,71m3 $46 800,00 2014 576,1 0,6 $39 395,28 Online est imator (http:/ /www.matche.com/equipcost/Bin.html), Timmerhaus & Peters (1991)
Polished eff luent distribut ion tank (basic stream) 1 M ild steel 11,46m3 75,71m3 $46 800,00 2014 576,1 0,6 $14 850,21 Online est imator (http:/ /www.matche.com/equipcost/Bin.html), Timmerhaus & Peters (1991)
Spent WPCB solids hopper 1 Rigid PVC 10mm thick 6,78m3 1 m3 $150,00 2010 550,8 0,6 $487,31 Improchem (M ukariri (2012)), Timmerhaus & Peters (1991)
Stellenbosch University https://scholar.sun.ac.za
Stellenbosch University https://scholar.sun.ac.za

307
376
Table F.9: Process usage ratios used for the calculations
C rushing and mill ing
M at er ial/ chemical R emarks U sage rat io U nit s C ommercial Purit y ( %) St reng t h f o r p rocess U nit Pr ice Source
WPCBs 4350.60 Tes/Tes Au 100% (Categories 2, 3 and 4. Low, medium and high grade) 100% Average NGOs, Private suppliers, informal traders, governement off ices
Power 312.65 KWh/Tes WPCBs 3 phase AC for industry 350-380V R17,19/KWh Eskom business rate tarrifs 2018/2019 (VAT included), Business rate 3
Water 0.00 m3/Tes WPCBs M unicipal potable 100% Potable 100% R38,72/Klit re metered City of Johanessburg tarrifs 2017/2018
So lder leaching
WPCBs 4353542.94 Kg/Tes Au 100% (Categories 2, 3 and 4. Low, medium and high grade) 100% Internal t ransfer price () WPCBs pretreatment plant
Nitric acid 933.39 kg/Tes solids 55% Industrial grade 0,0593 US$350/tonne Shijiazhuang Xinlongwei Chemical Co., Ltd, China
Water 13.98 m3/ Tes solids M unicipal Potable 100% R38,72/Klit re metered City of Johanessburg tarrifs 2017/2018
Power 121.65 KWh/ Tes solids 3 phase AC for industry 220V R17,19/KWh Eskom business rate tarrifs 2018/2019 (VAT included), Business rate 3
C opper ext ract ion
WPCBs 6080.78 kg/Tes Cu 100% (Categories 2, 3 and 4. Low, medium and high grade) 100% Internal t ransfer price Solder leaching plant
Sulphuric acid start up Start up 4623.72 Kg/Tes Cu 98% Industrial grade 16,4% US290/tonne
Sulphuric acid Steady state 2713.95 Kg/Tes Cu 98% Industrial grade 16,4% US290/tonne Shijiazhuang Xinlongwei Chemical Co., Ltd, China
Water Process, SX wash and cathode stripping 40.64 m3/Tes Cu M unicipal potable 100% Potable 100% R38,72/K lit re metered City of Johanessburg tarrifs 2017/2018
Kerosene Once off loading per annum 115.56 m3 Aviat ion Kerosene JP54, sulphonated 99,96% min 68% blend US$315/Tonne LLC Alliance (Alibaba.com)
LIX 984N Once off loading per annum 54.38 m3 100% (1 : 1 volume blend of LIX 860N-I and LIX 84-I) 32% blend US$11,14/kg BASF, (M wale (2009))
Solvent losses 0.37 kg/Tes Cu 32% LIX 984N 68% Kerosene 32:68 LIX:Kerosene US3,78/kg Calculated
Sodium chloride 0.77 kg/Tes Cu (Industrial grade) 99% 4,19% US$100/tonne Lianyungang Huaihua Internat ional Trade Co.,Ltd (FOB), China (Alibaba.com)
Hydrogen peroxide 917.52 kg/Tes Cu Industrial grade 50% 30,00% US$580/tonne Zhengzhou Double Tree Enterprise Co., Ltd (Alibaba. Com)
Sodium Hydroxide 30.89 kg/Tes Cu Industrial grade 97%> 7,55% US$400/tonne Henan Bright Commercial Co., Ltd, China (Alibaba.com)
Cobalt Sulphate 0.49 kg/Tes Cu Industrial grade >96,96% 12,50% US$7,60/kg Sincere Union- Import & Export Co., Ltd, Hebei, China (Alibaba.com)
Bentonite clay For treatment bled raff inate to eff luent 340.7 kg/Tes Cu Industrial grade 2,00% US0,45/kg Shandong Jiqi Internat ional Trade Co., Ltd. China (Alibaba.com)
DXG-F7/Guar gum Grain modif ier 0.15 kg/Tes Cu Yellow powder, maximum humidity 14%, solubilty 90% (min) 0,83% US$2/kg M ARKHOR (Albaba.com)
FC-1100 /Eagles FC-1100 Acid mist suppressant 0.16 L/Tes Cu 55% Fluorochemicals, 45% water (FC-1100), 50% Eagles 1100 10% US$200/kg 3M mining chemicals/ Henan, China (M ainland)(Alibaba.com)
Polypropylene macrospheresAcid mist suppressant, once off loading per four years2.72 kg 2000 units per kg. White, hollow. 100% polypropylene, dia 20mm US$485,24/kg K-M ac plast ics (http:/ /k-mac-plast ics.com/polypropylene-plast ic-balls.htm)
Power 3507.87 KWh/Tes Cu 50 Hz, 3 phase AC for industry 350-380V R17,19/KWh Eskom business rate tarrifs 2018/2019 (VAT included), Business rate 3
N it r ic acid wash
WPCBs 2966883.00 kg/Tes Au 100% (Categories 2, 3 and 4. Low, medium and high grade) 100% Internal t ransfer price Copper extract ion plant
Nitric acid 426.54 kg/Tes solids 55% Industrial grade 55% US$350/tonne Shijiazhuang Xinlongwei Chemicals, China
Water 10.78 m3/Tes solids M unicipal potable 100% Potable 100% R38,72/Klit re metered City of Johanessburg tarrifs 2017/2018
Compressed air 3.75 m3/Tes solids 21% Oxygen, 79% Nitrogen, 2,3 bars 21% O2, 79% N2, 2.3 bars US$6,56/m3 https:/ /www.hydraulicspneumatics.com/air-compressors/determine-cost-compressed-air-your-plant
Power 159.82 KWh/Tes solids 3 phase AC for industry 220V R17,19/KWh Eskom business rate tarrifs 2018/2019 (VAT included), Business rate 3
Gold ext ract ion
WPCBs 3086935.23 kg/Tes Au 100% (Categories 2, 3 and 4. Low, medium and high grade) 100% Internal t ransfer price Nitric acid wash plant
Sodium cyanide 649207.20 kg/Tes Au 98% NaCN briquettes 0,025% leaching, 3% elut ion US$1650/tonne ex China Alibaba.com
Sodium hydroxide 601251.66 kg/Tes Au >98% NaOH f lakes 2% elut ion, pH correct ion of eluate 50%US$400/tonne Henan Bright Commercial Co., Ltd, China (Alibaba.com)
Hydrated lime 103101.95 kg/Tes Au Industrial grade 95% >95% US130/tonne Zibo Qilu Chemicals Company China (Alibaba.com)
Water 33513.39 m3/Tes Au M unicipal water (Carbon regenerat ion, leaching, eluate pH correct ion)Potable 100% US$2,63/Klit re metered City of Johanessburg tarrifs 2017/2018
Water 35382.77 m3/Tes Au Soft water (Acid washing and elut ion) <1ppm Total hardness Internal t ransfer price () Water softening sect ion
Purchased Oxygen 393.68 kg/Tes Au 100% 100% R41,29/Kg AFROX
Total Oxygen gas 484.60 kg/Tes Au Enriched air and purchased oxygen 100% R41,29/Kg AFROX
Activated carbon Once off loading per annum for 2 batches/day218.21 kg 100% coconut shell, 1,2-1,5 mm dia 100% US$1000/tonne Chifeng Fuyue Act ivated Carbon Factory, China (Alibaba. Com)
Act ivated carbon losses 155.50 kg/Tes Au Carbon f ines <0,65mm dia, <30g/t US$1000/tonne ex China Alibaba.com
Peas coal 4033463.98 kg/Tes Au Peas , anthracite. Calorif ic value 27,4 -29,5 M J/kg, <8% SulphurM inimum calorif ic value 27,4M J/Kg US$106,70/tonne https:/ / t radingeconomics.com/commodity/coal
Hydrochloric acid 644218.78 kg/Tes Au Industrial grade 33% 3% US$250/tonne Zouping Changshan Town Zefeng Fert ilizer Factory, China (Alibaba.com)
Compressed air 33569.93 m3/Tes Au 21% Oxygen, 79% Nitrogen, 2,3 bars 21% Oxygen, 79% Nitrogen, 2,3 bars US$6,56/m3 https:/ /www.hydraulicspneumatics.com/air-compressors/determine-cost-compressed-air-your-plant
Power 1161986.83 KWh/Tes Au 3 phase AC for industry 350-380V R17,19/KWh Eskom business rate tarrifs 2018/2019 (VAT included), Business rate 3
W at er so f t ening
Water for soft water 35382.77 m3/Tes Au M unicipal potable 100% Potable 100% US$2,63/Klit re metered City of Johanessburg tarrifs 2017/2018
Water for regenerat ion 3750.08 m3/Tes Au M unicipal potable 100% Potable 100% US$2,63/Klit re metered City of Johanessburg tarrifs 2017/2018
Sodium chloride 0.27 kg/m3 soft water Industrial course salt , 99% 10% brine US$150/tonne Xinle City Hongyuan Carbon Black Sales Center, Hebei, China
Power 2,215469515894742.22KWh/m3 soft water day3 phase AC for industry 220V R17,19/KWh Eskom business rate tarrifs 2018/2019 (VAT included), Business rate 3
Resin (DOWEX M arathon C)Once off loading per annum 65.00 kg/annum Cationic resin Styrene-DVB gel with a sulphonic acid act ive group100% US$3,88/kg https:/ /www.servapure.com/Dowex-M arathon-C-Softening-Na-Form-Cation-Resin_p_5546.html
A ir compression
Power 0.24 KWh/m3 air 21% Oxygen, 79% Nitrogen, 2,3 bars 21% Oxygen, 79% Nitrogen, 2,3 bars US$1,17/KWh https:/ /www.hydraulicspneumatics.com/air-compressors/determine-cost-compressed-air-your-plant
Stellenbosch University https://scholar.sun.ac.za
Stellenbosch University https://scholar.sun.ac.za

308
377
Table F.10: Summary of the effluent streams from the different plants (Effluent flows for model 3a used for illustration kgs/annum)
Material Size
reduction Solder
leaching
Copper
extraction
Nitric acid wash
Gold
extraction
Soft water generation
Compressed air section
Summary of entire process
Raffinate
bleed SX LO wash
water
Barren leachate
Ex HCl acid wash
H2O 0 6463314 949288 4844062 1396508 756451 555635 56886 2231 15024374
HNO3 0 256042 0 0 0 0 0 0 0 256042
NaCl 0 0 5 0 0 0 0 41 0 46
Pb(NO3)2 0 14563 0 0 312 0 0 0 0 14876
Sn(NO3)2 0 2664 0 0 0 0 0 0 0 2664
Ni(NO3)2 0 9788 0 0 7946 0 0 0 0 17733
Zn(NO3)2 0 229 0 0 855 0 0 0 0 1085
Fe(NO3)3 0 110650 0 0 25740 0 0 0 0 136390
Al(NO3)3 0 11400 0 0 49703 0 0 0 0 61104
AgNO3 0 39 0 0 1295 0 0 0 0 1334
Cu(NO3)2 0 549 0 0 9398 0 0 0 0 9946
Solvent 0 0 0 0 0 0 0 0 0 0
H2SO4 0 0 54266 7078 0 0 0 0 0 61345
Al2(SO4)3 0 0 4570 0 0 0 0 0 0 4570
FeSO4 0 0 8093 39 0 0 0 0 0 8132
NiSO4 0 0 4640 9415 0 0 0 0 0 14055
ZnSO4 0 0 5176 0 0 0 0 0 0 5176
PbSO4 0 0 0 0 0 0 0 0 0 0
SnSO4 0 0 0 0 0 0 0 0 0 0
Ag2SO4 0 0 0 0 0 0 0 0 0 0
CoSO4 0 0 0 24818 0 0 0 0 0 24818
DXG-F7 0 0 1 0 0 0 0 0 0 1
FC-1100 0 0 1 0 0 0 0 0 0 1
HCl 0 0 0 0 0 0 8459 0 0 8459
FeCl3 0 0 0 0 0 0 120 0 0 120
AlCl3 0 0 0 0 0 0 3 0 0 3
ZnCl2 0 0 0 0 0 0 0 0 0 0
NiCl2 0 0 0 0 0 0 1 0 0 1
PbCl2 0 0 0 0 0 0 0 0 0 0
NaOH 0 0 0 0 0 22 0 0 0 22
NaCN 0 0 0 0 0 0 0 0 0 0
NaAu(CN)2 0 0 0 0 0 1 0 0 0 1
NaAg(CN)2 0 0 0 0 0 0 0 0 0 0
Carbon fines 0 0 0 0 0 4 0 0 0 4
NaAu(CN)2 on carbon
fines 0 0 0 0 0 0 0 0 0 0
Total material flow
0 6869237 1026042 4885412 1491758 756478 564216 56927 2231 15652302
Approximate pH range
n/a 3-4,5 0,2-1 1,8-2,0 4-6,0 10-11,0 0,3-1 6,8-7 7
TDSmg/L 0 21819 22406 7065 68206 31 221 1302 0 17293
Stellenbosch University https://scholar.sun.ac.za
Stellenbosch University https://scholar.sun.ac.za

309
378
Table F.11: Annual schedule of material requirements for the entire process (based on business model 3a)
Materials
Commercial purity/strength/pressure
Strength for the process
Units
Size reduction
Solder leaching
Copper extraction
Nitric acid wash
Gold extraction
Soft water generation
Compressed air section
The entire operation
Waste PCBs (100) 100% (Categories 2, 3 and 4. Low, medium and high grade) 100% kg 457140.86 457450.09 442170.12 311746.30 324360.83 0.00 0.00 457140.86 Nitric acid (%) 55% Industrial grade 0.0593% SL, 55%NA kg 0.00 776311.08 0.00 354758.06 0.00 0.00 0.00 1131069.15 Sulphuric acid 98% Industrial grade 16% kg 0.00 0.00 45.82 0.00 0.00 0.00 0.00 45.82 Sulphuric acid steady state
98% Industrial grade 0.164 kg 0.00 0.00 197347.20 0.00 0.00 0.00 0.00 197347.20
Kerosene Aviation Kerosene JP54, sulphonated 99,96% min 68% blend kg 0.00 0.00 115.56 0.00 0.00 0.00 0.00 115.56 LIX 984N 100% (1 : 1 volume blend of LIX 860N-I and LIX 84-I) 32% blend kg 0.00 0.00 54.38 0.00 0.00 0.00 0.00 54.38 Solvent losses (crud) 32% LIX 984N 68% Kerosene 32:68 LIX:Kerosene kg 0.00 0.00 26.81 0.00 0.00 0.00 0.00 26.81 Sodium chloride (Industrial grade) 99% 4.19% kg 0.00 0.00 56.56 0.00 0.00 1000.42 0.00 56.56 Hydrogen peroxide Industrial grade 50% 30.00% kg 0.00 0.00 133436.71 0.00 0.00 0.00 0.00 133436.71
Sodium Hydroxide >98% NaOH flakes 2% elution, 7.55% Cu pH correction
kg 0.00 0.00 57.13 0.00 64466.06 0.00 0.00 64523.19
Cobalt Sulphate Industrial grade >96,96% 12.50% kg 0.00 0.00 36.97 0.00 0.00 0.00 0.00 36.97 Bentonite clay Industrial grade 2.00% kg 0.00 0.00 24774.39 0.00 0.00 0.00 0.00 24774.39 DXG-F7/Guar gum Yellow powder, maximum humidity 14%, solubilty 90% (min) 0.83% kg 0.00 0.00 10.91 0.00 0.00 0.00 0.00 10.91 FC-1100 /Eagles FC-1100
55% Fluorochemicals, 45% water (FC-1100), 50% Eagles 1100 10.00% kg 0.00 0.00 11.63 0.00 0.00 0.00 0.00 11.63
Polypropylene macrospheres
100 100 kg 0.00 0.00 2.72 0.00 0.00 0.00 0.00 2.72
Sodium cyanide 98% NaCN briquettes 0.025% leaching, 3% elution
kg 0.00 0.00 0.00 0.00 69607.84 0.00 0.00 69607.84
Hydrated lime Industrial grade 95% >95% kg 0.00 0.00 0.00 0.00 11403.66 0.00 0.00 11403.66 Water Municipal poTable 100% PoTable 100% m3 0.00 6395.65 2028.51 3360.46 3521.43 0.00 0.00 15306.05
Soft Water Soft water (Acid washing and elution) <1ppm Total hardness
m3 0.00 0.00 0.00 0.00 3717.86 0.00 0.00 3717.86
Purchased Oxygen 100% 100% kg 0.00 0.00 0.00 0.00 41.37 0.00 0.00 41.37 Total Oxygen gas Enriched air and purchased oxygen 100% kg 0.00 0.00 0.00 0.00 50.92 0.00 0.00 50.92 Activated carbon 100% coconut shell, 1,2-1,5 mm dia 100% kg 0.00 0.00 0.00 0.00 218.21 0.00 0.00 218.21 Activated carbon losses
Carbon fines <0.65mm dia, <30g/t
kg 0.00 0.00 0.00 0.00 49.51 0.00 0.00 49.51
Hydrochloric acid Industrial grade 33% 3% kg 0.00 0.00 0.00 0.00 205125.82 0.00 0.00 205125.82 Resin (DOWEX Marathon C)
Cationic resin Styrene-DVB gel with a sulphonic acid active group
100% kg 0.00 0.00 0.00 0.00 0.00 65.00 0.00 0.00
Utilities
Power 50 Hz, 3 phase AC for industry 220V/350-380V
KWh
143020.80 55648.32
255078.28 49823,28 122096.18 8236.80 1144.03 625666.87
Fuel (Peas coal) Peas , anthracite. Calorific value 27,4 -29,5 MJ/kg, <8% Sulphur
Minimum calorific value 27.4MJ/Kg
kg 0.00 0.00 0.00 0.00 423817.68 0,00 0.00 423817.68
Water for softening Municipal poTable 100% PoTable 100% m3 0.00 0.00 0.00 0.00 0.00 3717.86 0.00 0.00 Water for regeneration
Municipal poTable 100% PoTable 100% m3 0.00 0.00 0.00 0.00 0.00 1170024.14 0.00 0.00
Compressed air (bar) Ambient air 1,01 bars Ambient air 2.3 bars
m3 0.00 0.00 0.00 1216.98 3527.37 0.00 0.00 4744.36
Stellenbosch University https://scholar.sun.ac.za
Stellenbosch University https://scholar.sun.ac.za

310
349
Table F.12: Schedule of detailed labour requirements (Overall schedule based on business model 3a)
Manpower requirements for operating configuration 2
Roaster structure - 4 shift system
Position Man hours/day
Man-hours/year & individual
Complement for 4 shift roaster
Total man-hours per year Skill level Average hourly wage Total labour costs
Executive management
General manager 8 1784 1 1784 Specialised $15.50 $29 031.50
Administration department Administration manager 8 1784 1 1784 Specialised $9.77 $18 299.21
IT administrator 8 1784 1 1784 Skilled $4.05 $7 585.80
Supplies and logistics officer 8 1784 1 1784 Skilled $5.53 $10 357.69
Warehouse and dispatch clerk 8 1784 1 1784 Semiskilled $2.93 $5 487.89
Buyer 8 1784 1 1784 Skilled $5.05 $9 458.65
Accountant 8 1784 1 1784 Specialised $5.54 $10 382.71 Finance and salaries administrator 8 1784 1 1784 Skilled $5.54 $10 382.71 Personnel and training officer 8 1784 1 1784 Skilled $4.55 $8 522.15
Sales officer 8 1784 1 1784 Skilled $5.05 $9 458.65 Personnel assistant and receptionist 8 1784 1 1784 Semiskilled $1.65 $3 090.45 Production department Production manager 8 2014 1 2014 Specialised $9.77 $20 546.31
Process superintendent 8 2060 2 4120 Skilled $6.04 $25 422.36
Process foremen 8 1784 1 1784 Skilled $5.69 $10 657.37
Analytical chemist 8 1784 1 1784 Skilled $6.04 $11 312.92
SHEQ systems officer 8 1784 1 1784 Skilled $5.69 $10 657.37
Shift laboratory technician 8 2496 8 19968 Skilled $5.19 $103 633.92
Shift drivers 8 2496 4 9984 Unskilled $2.95 $29 452.80
Fork lift drivers 8 2496 1 2496 Unskilled $2.95 $7 363.20
Shift artisans (engineering) 8 2496 4 9984 Skilled $6.95 $69 388.80
General hands 8 1784 3 5352 Unskilled $1.59 $8 509.68
Size reduction plant operators 8 2496 8 19968 Semiskilled $3.13 $62 500.64
Solder leaching plant operators 8 2496 8 19968 Semiskilled $3.13 $62 500.64 Copper extraction plant operators 8 2496 8 19968 Semiskilled $3.13 $62 500.64 Nitric acid wash plant operators 8 2496 8 19968 Semiskilled $3.13 $62 500.64
Gold extraction plant operators 8 2496 8 19968 Semiskilled $3.13 $62 500.64 Effluent and solid waste treatment plant operators 8 2496 12 29952 Semiskilled $3.13 $93 750.96 Operating labour $406 254.15
Other labour $362 376.11
Supervisory and labour $56 626.04
TOTAL WAGE BILL $825 256.30
Stellenbosch University https://scholar.sun.ac.za
Stellenbosch University https://scholar.sun.ac.za

311
Production schedule - operating schedule 1 Basis 400 Tonnes WPCBs per annum
Day M T W T F S S Operation key
Utilization %
Start up a Size reduction 14.29
Week 1 a Solder leaching 14.29
a a a a a Copper extraction 100.00
a Nitric acid wash 14.29
a a Gold extraction 28.57
Steady state b
Week 2 b Batch codes a,b,c,d….
a a a/b b b b b
b From start up first batch a
b b Second batch b
Week 3 c Third batch c
c Fourth batch d
b b b/c c c c c Fifth batch e
c …….. …….
c c
Week 4 d
d
c c c/d d d d d
d
d d
Week 5 e
e
d d d/e e e e e
e
e e
Figure F.1: Production operating schedule for the first configuration from start up
Stellenbosch University https://scholar.sun.ac.za
Stellenbosch University https://scholar.sun.ac.za

Production schedule - operating schedule 2
Basis 400 Tonnes WPCBs per annum
Day M T W T F S S Operation key
Utilization %
Start up a a a a a a a Size reduction 100
Week 1 a Solder leaching 100
Copper extraction 100
Nitric acid wash 100
Gold extraction 100
Week 2 b b b b b b b
a a a a a a b Batch codes a,b,c,d….
a a
a a From start up first batch a
Second batch b
Steady state c c c c c c c Third batch c
Week 3 b b b b b b c Fourth batch d
a a a a a a/b b Fifth batch e
a a a a a b b …….. …….
a a
Week 4 d d d d d d d
c c c c c c d
b b b b b b/c c
b b b b b c c
a a a a a b b
Week 5 e e e e e e e
d d d d d d
c c c c c c/d d
c c c c c d d
b b b b b c c
Figure F.2: Production operating schedule for the second configuration from start up
Stellenbosch University https://scholar.sun.ac.za
Stellenbosch University https://scholar.sun.ac.za

313
Production schedule - operating schedule 3 Basis 400 Tonnes WPCBs per annum
Day M T W T F S S Operation key
Utilization %
Start up a Size reduction 14,29
Week 1 a Solder leaching 14,29
a a a a a Copper extraction 100,00
a a a a a Nitric acid wash 100,00
Gold extraction 100,00
Steady state b
Week 2 b Batch codes a,b,c,d….
a a a/b b b b b
a a b b b b b From start up first batch a
a a a a a Second batch b
Week 3 c Third batch c
c Fourth batch d
b b b/c c c c c Fifth batch e
b b c c c c c …….. …….
a a b b b b b
Week 4 d
d
c c c/d d d d d
c c d d d d d
b b c c c c c
Week 5 e
e
d d d/e e e e e
d d e e e e e
c c d d d d d
Figure F.3: Production operating schedule for the third configuration from start up
Stellenbosch University https://scholar.sun.ac.za
Stellenbosch University https://scholar.sun.ac.za

314
347
Table F.13: Capital cost distribution by plant in each business model
Business model
Size reduction
plant (US$)
Solder leaching
plant (US$)
Copper extraction plant
(US$)
Nitric acid wash circuit (US$)
Gold extraction
circuit (US$)
Soft water production
unit (US$)
Compressed air unit (US$)
Effluent and solid waste
management plant (US$)
Total capital investment
(US$)
3a 195 427 465 021 5 970 240 483 698 6 984 490 21 699 55 330 1 484 069 15 659 976
3b 195 427 465 021 915 413 483 698 825 268 0 55 330 751 518 3 691 676
3c 195 427 465 021 1 019 572 483 698 6 984 490 21 699 55 330 1 227 522 10 452 761
3d 195 427 465 021 5 970 240 483 698 825 268 0 55 330 1 033 859 9 028 845
4a 0 465 021 5 968 218 483 698 6 984 490 21 699 55 330 1 484 069 15 464 549
4b 0 465 021 915 413 483 698 825 268 0 55 330 751 518 3 496 249
4c 0 465 021 915 413 483 698 6 984 490 21 699 55 330 1 227 522 10 153 174
4d 0 465 021 5 970 240 483 698 825 268 0 55 330 1 033 859 8 833 418
Table F.14: Overall capital cost distribution for each business model
Business model 3a 3b 3c 3d 4a 4b 4c 4d
Fixed capital 10 665 504 2 525 046 7 054 890 6 152 941 10 534 126 2 393 669 6 923 513 6 021 564
Working capital 1 909 327 451 340 1 262 592 1 101 152 1 886 243 428 255 1 239 508 1 078 067
Process non consumables
3 087 0 2 250 1 962 2 432 0 2 250 1 962
Equipment capitalized costs
3 072 471 715 290 2 128 534 1 767 696 3 031 506 674 325 1 983 410 1 726 731
Capitalized costs-Process materials
9 587 0 4 494 5 093 6 489 0 4 494 5 093
Stellenbosch University https://scholar.sun.ac.za
Stellenbosch University https://scholar.sun.ac.za

315
348
Table F.15: Breakdown of annual operating costs for each of the business models
Business model
Direct costs Indirect costs General
operating expenses
Contingency Total operating costs
(US$/yr) (US$/yr) (US$/yr) (US$/yr) (US$/yr)
3a 5 975 558 724 675 3 416 689 381 611 10 498 533
3b 3 907 702 496 300 2 751 957 209 688 7 365 647
3c 4 842 028 621 772 2 890 377 281 312 8 635 490
3d 5 116 899 599 203 3 299 507 314 366 9 329 975
4a 6 363 107 633 233 3 190 015 310 318 10 496 672
4b 4 294 953 404 858 2 525 159 138 404 7 363 374
4c 5 229 422 530 330 2 663 692 210 029 8 633 472
4d 5 504 154 507 761 3 072 710 243 082 9 327 706
Stellenbosch University https://scholar.sun.ac.za
Stellenbosch University https://scholar.sun.ac.za

316
348
Table F.16: Analysis of individual plant operating costs
Plant 3a 3b 3c 3d 4a 4b 4c 4d
Size reduction
$1 858 652 $1 858 651 $1 858 492 $1 858 651 $0.00 $0.00 $0.00 $0.00
Solder leaching
$3 600 443 $3 600 443 $3 600 265 $3 600 443 $3 598 833 $3 598 833 $3 598 833 $3 598 833
Copper extraction
$6 456 799 $4 937 127 $4 971 687 $6 460 410 $6 455 241 $4 935 201 $4 969 973 $6 458 484
Nitric acid wash
$7 999 538 $6 276 700 $6 336 167 $8 003 538 $7 997 748 $6 274 542 $6 334 248 $8 001 384
Gold extraction
$10 748 753 $7 615 173 $8 885 028 $9 580 197 $10 746 748 $7 612 756 $8 882 878 $9 577 783
Softened water
$46 168 $0.00 $48 785 $0.00 $46 168 $0.00 $48 785 $0.00
Compressed air
$7 234 $5 172 $7 235 $5 202 $7 234 $5 172 $7 234 $5 202
Effluent treatment
plant $1 607 464 $902 444 $992 138 $1 517 770 $1 607 464 $902 444 $992 138 $1 517 770
Operating cost drivers
Raw materials
19.13% 23.81% 23.94% 18.79% 25.99% 33.58% 32.27% 26.50%
Effluent and waste
treatment 15.31% 12.25% 11.49% 16.27% 15.31% 12.26% 11.49% 16.27%
Sales and distribution
20.47% 23.16% 20.83% 22.20% 19.28% 21.47% 19.38% 20.86%
Research and dev
10.24% 11.58% 10.41% 11.10% 9.64% 10.73% 9.69% 10.43%
Cumulative of op costs
65.15% 70.81% 66.66% 68.35% 70.22% 78.04% 72.83% 74.06%
Stellenbosch University https://scholar.sun.ac.za
Stellenbosch University https://scholar.sun.ac.za
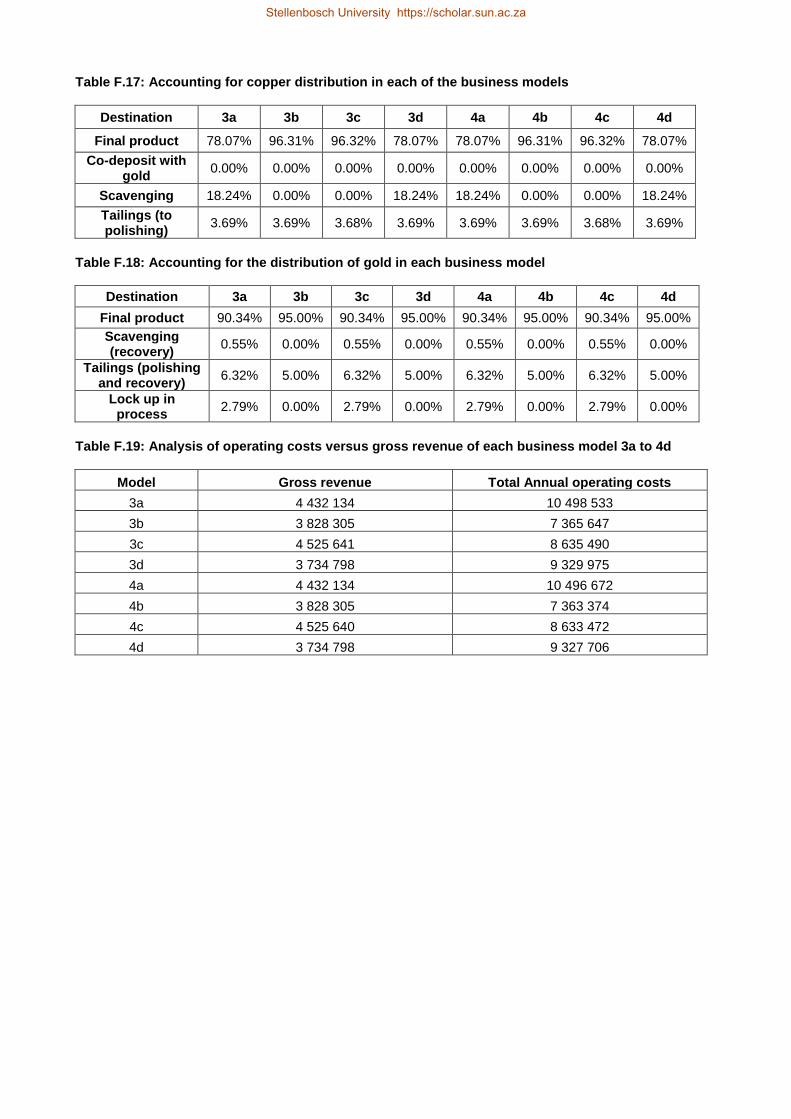
317
Table F.17: Accounting for copper distribution in each of the business models
Destination 3a 3b 3c 3d 4a 4b 4c 4d
Final product 78.07% 96.31% 96.32% 78.07% 78.07% 96.31% 96.32% 78.07%
Co-deposit with gold
0.00% 0.00% 0.00% 0.00% 0.00% 0.00% 0.00% 0.00%
Scavenging 18.24% 0.00% 0.00% 18.24% 18.24% 0.00% 0.00% 18.24%
Tailings (to polishing)
3.69% 3.69% 3.68% 3.69% 3.69% 3.69% 3.68% 3.69%
Table F.18: Accounting for the distribution of gold in each business model
Destination 3a 3b 3c 3d 4a 4b 4c 4d
Final product 90.34% 95.00% 90.34% 95.00% 90.34% 95.00% 90.34% 95.00%
Scavenging (recovery)
0.55% 0.00% 0.55% 0.00% 0.55% 0.00% 0.55% 0.00%
Tailings (polishing and recovery)
6.32% 5.00% 6.32% 5.00% 6.32% 5.00% 6.32% 5.00%
Lock up in process
2.79% 0.00% 2.79% 0.00% 2.79% 0.00% 2.79% 0.00%
Table F.19: Analysis of operating costs versus gross revenue of each business model 3a to 4d
Model Gross revenue Total Annual operating costs
3a 4 432 134 10 498 533
3b 3 828 305 7 365 647
3c 4 525 641 8 635 490
3d 3 734 798 9 329 975
4a 4 432 134 10 496 672
4b 3 828 305 7 363 374
4c 4 525 640 8 633 472
4d 3 734 798 9 327 706
Stellenbosch University https://scholar.sun.ac.za
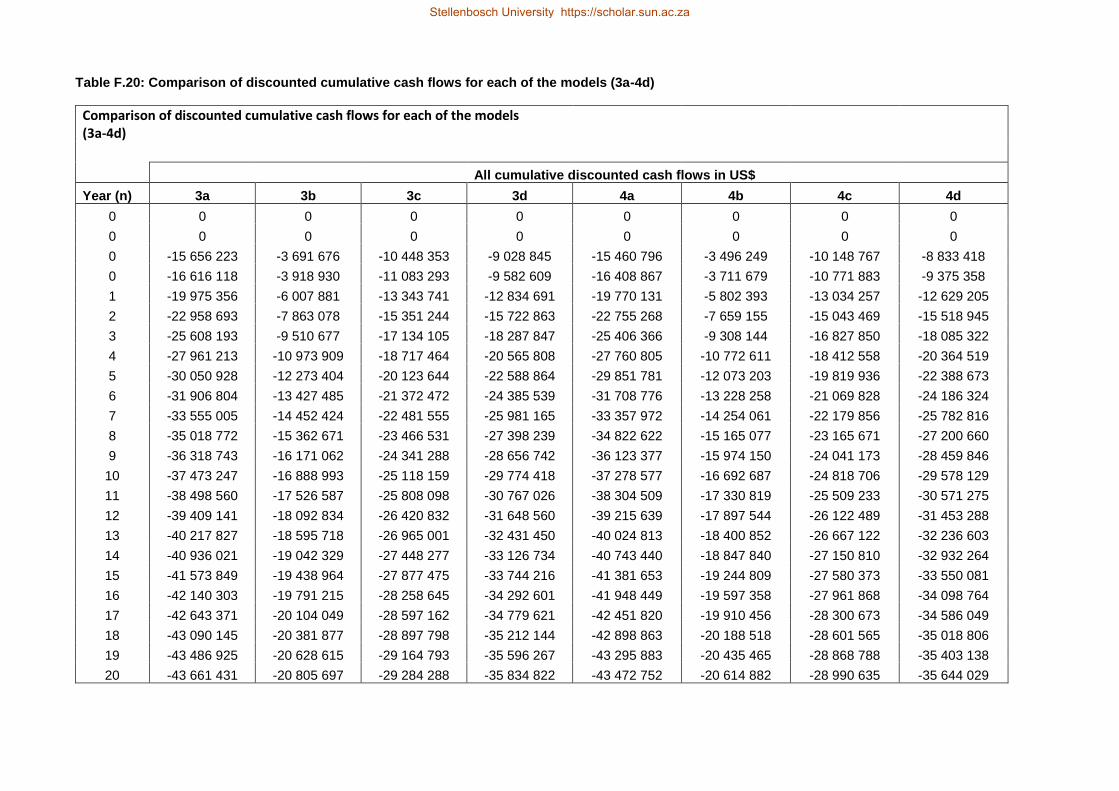
318
349
Table F.20: Comparison of discounted cumulative cash flows for each of the models (3a-4d)
Comparison of discounted cumulative cash flows for each of the models (3a-4d)
All cumulative discounted cash flows in US$
Year (n) 3a 3b 3c 3d 4a 4b 4c 4d
0 0 0 0 0 0 0 0 0
0 0 0 0 0 0 0 0 0
0 -15 656 223 -3 691 676 -10 448 353 -9 028 845 -15 460 796 -3 496 249 -10 148 767 -8 833 418
0 -16 616 118 -3 918 930 -11 083 293 -9 582 609 -16 408 867 -3 711 679 -10 771 883 -9 375 358
1 -19 975 356 -6 007 881 -13 343 741 -12 834 691 -19 770 131 -5 802 393 -13 034 257 -12 629 205
2 -22 958 693 -7 863 078 -15 351 244 -15 722 863 -22 755 268 -7 659 155 -15 043 469 -15 518 945
3 -25 608 193 -9 510 677 -17 134 105 -18 287 847 -25 406 366 -9 308 144 -16 827 850 -18 085 322
4 -27 961 213 -10 973 909 -18 717 464 -20 565 808 -27 760 805 -10 772 611 -18 412 558 -20 364 519
5 -30 050 928 -12 273 404 -20 123 644 -22 588 864 -29 851 781 -12 073 203 -19 819 936 -22 388 673
6 -31 906 804 -13 427 485 -21 372 472 -24 385 539 -31 708 776 -13 228 258 -21 069 828 -24 186 324
7 -33 555 005 -14 452 424 -22 481 555 -25 981 165 -33 357 972 -14 254 061 -22 179 856 -25 782 816
8 -35 018 772 -15 362 671 -23 466 531 -27 398 239 -34 822 622 -15 165 077 -23 165 671 -27 200 660
9 -36 318 743 -16 171 062 -24 341 288 -28 656 742 -36 123 377 -15 974 150 -24 041 173 -28 459 846
10 -37 473 247 -16 888 993 -25 118 159 -29 774 418 -37 278 577 -16 692 687 -24 818 706 -29 578 129
11 -38 498 560 -17 526 587 -25 808 098 -30 767 026 -38 304 509 -17 330 819 -25 509 233 -30 571 275
12 -39 409 141 -18 092 834 -26 420 832 -31 648 560 -39 215 639 -17 897 544 -26 122 489 -31 453 288
13 -40 217 827 -18 595 718 -26 965 001 -32 431 450 -40 024 813 -18 400 852 -26 667 122 -32 236 603
14 -40 936 021 -19 042 329 -27 448 277 -33 126 734 -40 743 440 -18 847 840 -27 150 810 -32 932 264
15 -41 573 849 -19 438 964 -27 877 475 -33 744 216 -41 381 653 -19 244 809 -27 580 373 -33 550 081
16 -42 140 303 -19 791 215 -28 258 645 -34 292 601 -41 948 449 -19 597 358 -27 961 868 -34 098 764
17 -42 643 371 -20 104 049 -28 597 162 -34 779 621 -42 451 820 -19 910 456 -28 300 673 -34 586 049
18 -43 090 145 -20 381 877 -28 897 798 -35 212 144 -42 898 863 -20 188 518 -28 601 565 -35 018 806
19 -43 486 925 -20 628 615 -29 164 793 -35 596 267 -43 295 883 -20 435 465 -28 868 788 -35 403 138
20 -43 661 431 -20 805 697 -29 284 288 -35 834 822 -43 472 752 -20 614 882 -28 990 635 -35 644 029
Stellenbosch University https://scholar.sun.ac.za
Stellenbosch University https://scholar.sun.ac.za

319
381
Table F.21: Calculations for plots of capitalization ratio (CR) against time for each of the models (3a-4d)
Recapitalization risk assessment for each business model
Plot of capitalization ratio over the life of the project
Year (n) 3a 3b 3c 3d 4a 4b 4c 4d
0
0
1 -6.49 -8.40 -6.26 -7.24 -6.51 -8.60 -6.57 -7.29
2 -7.46 -10.99 -7.21 -8.87 -7.49 -11.36 -7.58 -8,96
3 -8.32 -13.30 -8.04 -10.32 -8.36 -13.80 -8.48 -10.44
4 -9.08 -15.34 -8.79 -11.60 -9.14 -15.98 -9.28 -11.76
5 -9.76 -17.16 -9.45 -12.74 -9.83 -17.90 -9.99 -12.93
6 -10.36 -18.77 -10.03 -13.76 -10.44 -19.62 -10.62 -13.97
7 -10.90 -20.20 -10.56 -14.66 -10.98 -21.14 -11.17 -14.89
8 -11.37 -21.48 -11.02 -15.45 -11.46 -22.49 -11.67 -15.71
9 -11.80 -22.61 -11.43 -16.16 -11.89 -23.69 -12.11 -16.43
10 -12.17 -23.61 -11.79 -16.80 -12.27 -24.75 -12.50 -17.08
11 -12.50 -24.50 -12.12 -17.36 -12.61 -25.70 -12.85 -17.65
12 -12.80 -25.29 -12.40 -17.85 -12.91 -26.54 -13.16 -18.16
13 -13.06 -26.00 -12.66 -18.29 -13.17 -27.29 -13.44 -18.61
14 -13.30 -26.62 -12.89 -18.69 -13.41 -27.95 -13.68 -19.02
15 -13.50 -27.18 -13.09 -19.03 -13.62 -28.54 -13.90 -19.37
16 -13.69 -27.67 -13.27 -19.34 -13.81 -29.06 -14.09 -19.69
17 -13.85 -28.11 -13.43 -19.62 -13.97 -29.53 -14.26 -19.97
18 -14.00 -28.49 -13.57 -19.86 -14.12 -29.94 -14.41 -20.22
19 -14.12 -28.84 -13.69 -20.08 -14.25 -30.31 -14.54 -20.44
20 -14.18 -29.09 -13.75 -20.21 -14.31 -30.57 -14.61 -20.58
Stellenbosch University https://scholar.sun.ac.za
Stellenbosch University https://scholar.sun.ac.za

320
382
Table F.22: Calculations for plots of capital rate of return ratio (CRR) against time for each of the models (3a-4d)
Comparison of capital rate of return ratio for each of the models (3a-4d)
CRRs over the life of the project for each model
Year (n) 3a 3b 3c 3d 4a 4b 4c 4d
0
0 -1.00 -1.00 -1.00 -1.00 -1.00 -1.00 -1.00 -1.00
1 -1.20 -1.53 -1.20 -1.34 -1.20 -1.56 -1.21 -1.35
2 -1.38 -2.01 -1.39 -1.64 -1.39 -2.06 -1.40 -1.66
3 -1.54 -2.43 -1.55 -1.91 -1.55 -2.51 -1.56 -1.93
4 -1.68 -2.80 -1.69 -2.15 -1.69 -2.90 -1.71 -2.17
5 -1.81 -3.13 -1.82 -2.36 -1.82 -3.25 -1.84 -2.39
6 -1.92 -3.43 -1.93 -2.54 -1.93 -3.56 -1.96 -2.58
7 -2.02 -3.69 -2.03 -2.71 -2.03 -3.84 -2.06 -2.75
8 -2.11 -3.92 -2.12 -2.86 -2.12 -4.09 -2.15 -2.90
9 -2.19 -4.13 -2.20 -2.99 -2.20 -4.30 -2.23 -3.04
10 -2.26 -4.31 -2.27 -3.11 -2.27 -4.50 -2.30 -3.15
11 -2.32 -4.47 -2.33 -3.21 -2.33 -4.67 -2.37 -3.26
12 -2.37 -4.62 -2.38 -3.30 -2.39 -4.82 -2.43 -3.35
13 -2.42 -4.75 -2.43 -3.38 -2.44 -4.96 -2.48 -3.44
14 -2.46 -4.86 -2.48 -3.46 -2.48 -5.08 -2.52 -3.51
15 -2.50 -4.96 -2.52 -3.52 -2.52 -5.18 -2.56 -3.58
16 -2.54 -5.05 -2.55 -3.58 -2.56 -5.28 -2.60 -3.64
17 -2.57 -5.13 -2.58 -3.63 -2.59 -5.36 -2.63 -3.69
18 -2.59 -5.20 -2.61 -3.67 -2.61 -5.44 -2.66 -3.74
19 -2.62 -5.26 -2.63 -3.71 -2.64 -5.51 -2.68 -3.78
20 -2.63 -5.31 -2.64 -3.74 -2.65 -5.55 -2.69 -3.80
Stellenbosch University https://scholar.sun.ac.za
Stellenbosch University https://scholar.sun.ac.za

321
Table F.23: Calculations for plots of interest recovery period (IRP) against time for each of the models (3a-4d)
Comparison of IRP for each of the business models (3a-4d)
All cumulative undiscounted cash flows in US$
Year (n) 3a 3b 3c 3d 4a 4b 4c 4d
0
0
1 -16 616 118 -3 918 930 -11 083 293 -9 582 609 -16 408 867 -3 711 679 -10 771 883 -9 375 358
2 -20 398 620 -6 271 089 -13 628 557 -13 244 453 -20 193 651 -6 065 823 -13 319 316 -13 039 190
3 -24 181 121 -8 623 248 -16 173 822 -16 906 297 -23 978 434 -8 419 967 -15 866 748 -16 703 022
4 -27 963 623 -10 975 407 -18 719 086 -20 568 141 -27 763 217 -10 774 111 -18 414 181 -20 366 854
5 -31 746 125 -13 327 566 -21 264 350 -24 229 985 -31 548 000 -13 128 255 -20 961 614 -24 030 686
6 -35 528 626 -15 679 725 -23 809 614 -27 891 829 -35 332 783 -15 482 399 -23 509 047 -27 694 517
7 -39 311 128 -18 031 884 -26 354 878 -31 553 673 -39 117 567 -17 836 542 -26 056 479 -31 358 349
8 -43 093 629 -20 384 043 -28 900 143 -35 215 517 -42 902 350 -20 190 686 -28 603 912 -35 022 181
9 -46 876 131 -22 736 202 -31 445 407 -38 877 361 -46 687 133 -22 544 830 -31 151 345 -38 686 013
10 -50 658 632 -25 088 361 -33 990 671 -42 539 205 -50 471 916 -24 898 974 -33 698 778 -42 349 845
11 -54 441 134 -27 440 521 -36 535 935 -46 201 049 -54 256 699 -27 253 118 -36 246 210 -46 013 676
12 -58 223 635 -29 792 680 -39 081 200 -49 862 893 -58 041 483 -29 607 262 -38 793 643 -49 677 508
13 -62 006 137 -32 144 839 -41 626 464 -53 524 737 -61 826 266 -31 961 406 -41 341 076 -53 341 340
14 -65 788 638 -34 496 998 -44 171 728 -57 186 581 -65 611 049 -34 315 550 -43 888 508 -57 005 172
15 -69 571 140 -36 849 157 -46 716 992 -60 848 424 -69 395 832 -36 669 693 -46 435 941 -60 669 004
16 -73 353 641 -39 201 316 -49 262 256 -64 510 268 -73 180 615 -39 023 837 -48 983 374 -64 332 836
17 -77 136 143 -41 553 475 -51 807 521 -68 172 112 -76 965 399 -41 377 981 -51 530 807 -67 996 667
18 -80 918 645 -43 905 634 -54 352 785 -71 833 956 -80 750 182 -43 732 125 -54 078 239 -71 660 499
19 -84 701 146 -46 257 793 -56 898 049 -75 495 800 -84 534 965 -46 086 269 -56 625 672 -75 324 331
20 -88 483 648 -48 609 952 -59 443 313 -79 157 644 -88 319 748 -48 440 413 -59 173 105 -78 988 163
Stellenbosch University https://scholar.sun.ac.za
Stellenbosch University https://scholar.sun.ac.za

322
Table F.24: A summary of the additional gross revenue from sales of palladium, silver and tin at a
business efficiency of 70% scenario 1
Model
Gross revenue scenario 2
Tin, silver, and palladium revenue
Total Annual operating costs
3a 6 466 509 1 630 278 10 498 533
3b 5 632 226 1 630 278 7 365 647
3c 6 460 238 1 630 278 8 635 490
3d 5 638 497 1 630 278 9 329 975
4a 6 466 509 1 630 278 10 496 672
4b 5 632 226 1 630 278 7 363 374
4c 6 460 238 1 630 278 8 633 472
4d 5 638 497 1 630 278 9 327 706
Table F.25: A summary of the additional gross revenue from sales of silver, tin and palladium at a
business efficiency of 70% scenario 2
Model
Gross revenue scenario 2
Tin, silver, and palladium revenue
Total Annual operating costs
3a 11 758 120 6 921 890 10 498 533
3b 10 923 838 6 921 890 7 365 647
3c 11 751 850 6 921 890 8 635 490
3d 10 930 108 6 921 890 9 329 975
4a 11 758 120 6 921 890 10 496 672
4b 10 923 838 6 921 890 7 363 374
4c 11 751 850 6 921 890 8 633 472
4d 10 930 108 6 921 890 9 327 706
Stellenbosch University https://scholar.sun.ac.za

323
382
Table F.26: Effluent outflows from the respective sections per annum (kgs per annum)
Business model
Size reduction Solder leaching Copper extraction Nitric acid wash
Gold extraction Soft water generation
Compressed air section
3a 0 6869237 5911454 1491758 1320695 56927 2231
3b 0 6869237 0 1491758 0 0 2231
3c 0 6869237 0 1491758 1320695 56927 2231
3d 0 6869237 5911454 1491758 0 0 2231
4a 0 6869237 5911454 1491758 1320695 56927 2231
4b 0 6869237 0 1491758 0 0.00 2231
4c 0 6869237 0 1491758 1320695 56927 2231
4d 0 6869237 5911454 1491758 0 0 2231
Approximate pH range
n/a 3-4.5 0.2-1 &1.8-2.0 4-6.0 0.3-1.0 & 10-11.0 6.8-7 7.00
TDSppm 0 21819 22406 & 7065 68205.71 31 & 221 1302 0
Table F.27: The expected solid waste outflows originating directly from the process (kgs per annum).
Business model
Size reduction
Solder leaching
Copper extraction
Nitric acid wash
Gold extraction
Soft water generation
Compressed air section
3a 0 0 5144 0 316348 0 0
3b 0 0 0 0 316348 0 0
3c 0 0 0 0 316348 0 0
3d 0 0 5144 0 316348 0 0
4a 0 0 5144 0 316348 0 0
4b 0 0 0 0 316348 0 0
4c 0 0 0 0 316348 0 0
4d 0 0 5144 0 316348 0 0
Stellenbosch University https://scholar.sun.ac.za
Stellenbosch University https://scholar.sun.ac.za

324
G: Calculations for the sensitivity analysis
The sensitivity analysis was done with the broad objective of determining at which points variable
the factors would improve the performance of the remaining models in group 4. An examination of
all these factors revealed that the performance of the business models could only be improved
significantly by increasing the gold content. Detailed in this appendix are the data sheets used in
plotting the graphs discussed in chapter 8.
Stellenbosch University https://scholar.sun.ac.za

Changes in total capital investment
The base case has been highlighted in grey. Where the base case lies between two percentages the range is highlighted in grey
Table G.1: Sensitivity of models to changes in total capital invested
Sensitivity of models to changes in total capital investment
NPV (US$)
Change in initial capital invested (%) 4a 4b 4c 4d
-50 -36 402 410 -19 124 507 -24 661 660 -31 875 617
-40 -37 816 478 -19 422 582 -25 527 455 -32 629 299
-30 -39 230 546 -19 720 657 -26 393 250 -33 382 982
-20 -40 644 615 -20 018 732 -27 259 045 -34 136 664
-10 -42 058 683 -20 316 807 -28 124 840 -34 890 347
0 -43 472 752 -20 614 882 -28 990 635 -35 644 029
10 -44 886 820 -20 912 956 -29 856 430 -36 397 711
20 -46 300 889 -21 211 031 -30 722 225 -37 151 394
30 -47 714 957 -21 509 106 -31 588 020 -37 905 076
40 -49 129 026 -21 807 181 -32 453 815 -38 658 759
50 -50 543 094 -22 105 256 -33 319 610 -39 412 441
60 -51 957 163 -22 403 331 -34 185 406 -40 166 124
70 -53 371 231 -22 701 406 -35 051 201 -40 919 806
80 -54 785 300 -22 999 481 -35 916 996 -41 673 489
90 -56 199 368 -23 297 555 -36 782 791 -42 427 171
100 -57 613 437 -23 595 630 -37 648 586 -43 180 854
Stellenbosch University https://scholar.sun.ac.za
Stellenbosch University https://scholar.sun.ac.za

Changes in operating costs
The base case has been highlighted in grey. Where the base case lies between two percentages the range is highlighted in grey
Table G.2: Sensitivity of models to changes in annual operating costs
Sensitivity of models to changes in annual operating costs
NPV (US$)
Change in annual operating costs (%) 4a 4b 4c 4d
-50 -16 276 191 -1 536 603 -6 621 570 -11 476 223
-40 -21 715 503 -5 352 259 -11 095 383 -16 309 785
-30 -27 154 815 -9 167 915 -15 569 196 -21 143 346
-20 -32 594 127 -12 983 570 -20 043 009 -25 976 907
-10 -38 033 440 -16 799 226 -24 516 822 -30 810 468
0 -43 472 752 -20 614 882 -28 990 635 -35 644 029
10 -48 912 064 -24 430 537 -33 464 448 -40 477 590
20 -54 351 376 -28 246 193 -37 938 261 -45 311 151
30 -59 790 689 -32 061 849 -42 412 074 -50 144 712
40 -65 230 001 -35 877 504 -46 885 887 -54 978 273
50 -70 669 313 -39 693 160 -51 359 700 -59 811 835
60 -76 108 625 -43 508 816 -55 833 513 -64 645 396
70 -81 547 937 -47 324 471 -60 307 326 -69 478 957
80 -86 987 250 -51 140 127 -64 781 139 -74 312 518
90 -92 426 562 -54 955 783 -69 254 952 -79 146 079
100 -97 865 874 -58 771 438 -73 728 765 -83 979 640
Stellenbosch University https://scholar.sun.ac.za
Stellenbosch University https://scholar.sun.ac.za

Changes in CAPEX and OPEX
The base case has been highlighted in grey. Where the base case lies between two percentages the range is highlighted in grey
Table G.3: Sensitivity of business models to changes in CAPEX and OPEX
Sensitivity of models to changes in CAPEX and OPEX
NPV (US$)
Change in CAPEX and OPEX (%) 4a 4b 4c 4d
-90 18 207 674 16 408 693 19 065 837 14 641 163
-80 11 354 294 12 294 963 13 726 229 9 053 920
-70 4 500 913 8 181 232 8 386 621 3 466 676
-60 -2 352 468 4 067 502 3 047 013 -2 120 568
-50 -9 205 848 -46 229 -2 292 595 -7 707 811
-40 -16 059 229 -4 159 959 -7 632 203 -13 295 055
-30 -22 912 610 -8 273 690 -12 971 811 -18 882 298
-20 -29 765 990 -12 387 421 -18 311 419 -24 469 542
-10 -36 619 371 -16 501 151 -23 651 027 -30 056 785
0 -43 472 752 -20 614 882 -28 990 635 -35 644 029
10 -50 326 133 -24 728 612 -34 330 243 -41 231 273
20 -57 179 513 -28 842 343 -39 669 851 -46 818 516
30 -64 032 894 -32 956 073 -45 009 459 -52 405 760
40 -70 886 275 -37 069 804 -50 349 067 -57 993 003
50 -77 739 655 -41 183 534 -55 688 675 -63 580 247
60 -84 593 036 -45 297 265 -61 028 283 -69 167 490
70 -91 446 417 -49 410 995 -66 367 892 -74 754 734
80 -98 299 797 -53 524 726 -71 707 500 -80 341 978
90 -105 153 178 -57 638 456 -77 047 108 -85 929 221
100 -112 006 559 -61 752 187 -82 386 716 -91 516 465
Stellenbosch University https://scholar.sun.ac.za
Stellenbosch University https://scholar.sun.ac.za

Changes in annual effluent treatment costs
The base case has been highlighted in grey. Where the base case lies between two percentages the range is highlighted in grey
Table G.4: Sensitivity of models to changes in annual effluent treatment costs
Sensitivity of models to changes in annual effluent and waste treatment costs
NPV (US$)
Change in effluent and waste treatment costs (%) 4a 4b 4c 4d
-50 -39 301 554 -18 266 188 -26 413 729 -31 711 273
-40 -40 135 794 -18 735 927 -26 929 110 -32 497 824
-30 -40 970 033 -19 205 666 -27 444 491 -33 284 376
-20 -41 804 273 -19 675 404 -27 959 873 -34 070 927
-10 -42 638 512 -20 145 143 -28 475 254 -34 857 478
0 -43 472 752 -20 614 882 -28 990 635 -35 644 029
10 -44 306 991 -21 084 620 -29 506 016 -36 430 580
20 -45 141 231 -21 554 359 -30 021 398 -37 217 131
30 -45 975 471 -22 024 098 -30 536 779 -38 003 682
40 -46 809 710 -22 493 836 -31 052 160 -38 790 234
50 -47 643 950 -22 963 575 -31 567 541 -39 576 785
60 -48 478 189 -23 433 314 -32 082 923 -40 363 336
70 -49 312 429 -23 903 052 -32 598 304 -41 149 887
80 -50 146 668 -24 372 791 -33 113 685 -41 936 438
90 -50 980 908 -24 842 530 -33 629 066 -42 722 989
100 -51 815 148 -25 312 268 -34 144 448 -43 509 541
Stellenbosch University https://scholar.sun.ac.za
Stellenbosch University https://scholar.sun.ac.za

Changes in copper prices
The base case has been highlighted in grey. Where the base case lies between two percentages the range is highlighted in grey
Table G.5: Sensitivity of models to changes in copper metal price (fixed gold/ gold liquor)
Sensitivity of models to changes in copper metal price (fixed gold/ gold liquor)
NPV (US$)
Change in copper price (%) 4a 4b 4c 4d
-50 -44 840 977 -21 966 860 -30 342 614 -37 012 254
-40 -44 567 332 -21 696 464 -30 072 218 -36 738 609
-30 -44 293 687 -21 426 069 -29 801 822 -36 464 964
-20 -44 020 042 -21 155 673 -29 531 427 -36 191 319
-10 -43 746 397 -20 885 277 -29 261 031 -35 917 674
0 -43 472 752 -20 614 882 -28 990 635 -35 644 029
10 -43 199 107 -20 344 486 -28 720 240 -35 370 384
20 -42 925 462 -20 074 090 -28 449 844 -35 096 739
30 -42 651 817 -19 803 695 -28 179 448 -34 823 094
40 -42 378 172 -19 533 299 -27 909 052 -34 549 449
50 -42 104 527 -19 262 903 -27 638 657 -34 275 804
60 -41 830 882 -18 992 507 -27 368 261 -34 002 159
70 -41 557 237 -18 722 112 -27 097 865 -33 728 514
80 -41 283 591 -18 451 716 -26 827 470 -33 454 869
90 -41 009 946 -18 181 320 -26 557 074 -33 181 224
100 -40 736 301 -17 910 925 -26 286 678 -32 907 579
Stellenbosch University https://scholar.sun.ac.za
Stellenbosch University https://scholar.sun.ac.za

Changes in gold prices
The base case has been highlighted in grey. Where the base case lies between two percentages the range is highlighted in grey
Table G.6: Sensitivity of models to changes in gold metal price (fixed copper/copper liquor)
Sensitivity of models to changes in gold metal price (fixed copper/copper liquor)
NPV (US$)
Change in gold price (%) 4a 4b 4c 4d
-50 -54 635 054 -29 631 830 -40 152 937 -44 660 977
-40 -52 402 594 -27 828 440 -37 920 477 -42 857 588
-30 -50 170 133 -26 025 051 -35 688 017 -41 054 198
-20 -47 937 673 -24 221 661 -33 455 556 -39 250 808
-10 -45 705 212 -22 418 271 -31 223 096 -37 447 419
0 -43 472 752 -20 614 882 -28 990 635 -35 644 029
10 -41 240 291 -18 811 492 -26 758 175 -33 840 639
20 -39 007 831 -17 008 102 -24 525 714 -32 037 250
30 -36 775 371 -15 204 713 -22 293 254 -30 233 860
40 -34 542 910 -13 401 323 -20 060 793 -28 430 470
50 -32 310 450 -11 597 933 -17 828 333 -26 627 081
60 -30 077 989 -9 794 543 -15 595 873 -24 823 691
70 -27 845 529 -7 991 154 -13 363 412 -23 020 301
80 -25 613 068 -6 187 764 -11 130 952 -21 216 911
90 -23 380 608 -4 384 374 -8 898 491 -19 413 522
100 -21 148 147 -2 580 985 -6 666 031 -17 610 132
Stellenbosch University https://scholar.sun.ac.za
Stellenbosch University https://scholar.sun.ac.za

Changes in metal prices
The base case has been highlighted in grey. Where the base case lies between two percentages the range is highlighted in grey
Table G.7: Sensitivity of models to changes in metal prices
Sensitivity of models to changes in metal prices
NPV (US$)
Change in product prices (%) 4a 4b 4c 4d
-50 -56 003 279 -30 983 809 -41 504 916 -46 029 203
-40 -53 497 174 -28 910 023 -39 002 060 -43 952 168
-30 -50 991 068 -26 836 238 -36 499 204 -41 875 133
-20 -48 484 963 -24 762 452 -33 996 347 -39 798 099
-10 -45 978 857 -22 688 667 -31 493 491 -37 721 064
0 -43 472 752 -20 614 882 -28 990 635 -35 644 029
10 -40 966 646 -18 541 096 -26 487 779 -33 566 994
20 -38 460 541 -16 467 311 -23 984 923 -31 489 960
30 -35 954 435 -14 393 525 -21 482 067 -29 412 925
40 -33 448 330 -12 319 740 -18 979 211 -27 335 890
50 -30 942 224 -10 245 955 -16 476 354 -25 258 855
60 -28 436 119 -8 172 169 -13 973 498 -23 181 821
70 -25 930 013 -6 098 384 -11 470 642 -21 104 786
80 -23 423 908 -4 024 598 -8 967 786 -19 027 751
90 -20 917 802 -1 950 813 -6 464 930 -16 950 716
100 -18 411 697 122 972 -3 962 074 -14 873 682
Stellenbosch University https://scholar.sun.ac.za
Stellenbosch University https://scholar.sun.ac.za
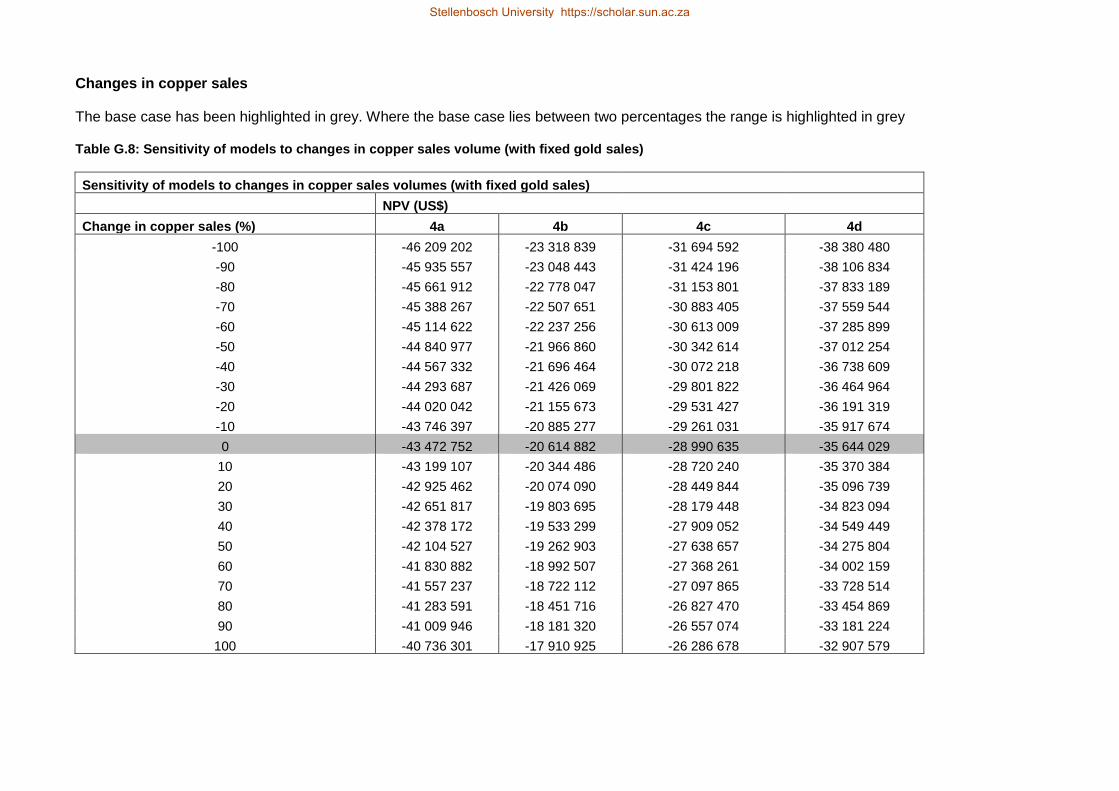
Changes in copper sales
The base case has been highlighted in grey. Where the base case lies between two percentages the range is highlighted in grey
Table G.8: Sensitivity of models to changes in copper sales volume (with fixed gold sales)
Sensitivity of models to changes in copper sales volumes (with fixed gold sales)
NPV (US$)
Change in copper sales (%) 4a 4b 4c 4d
-100 -46 209 202 -23 318 839 -31 694 592 -38 380 480
-90 -45 935 557 -23 048 443 -31 424 196 -38 106 834
-80 -45 661 912 -22 778 047 -31 153 801 -37 833 189
-70 -45 388 267 -22 507 651 -30 883 405 -37 559 544
-60 -45 114 622 -22 237 256 -30 613 009 -37 285 899
-50 -44 840 977 -21 966 860 -30 342 614 -37 012 254
-40 -44 567 332 -21 696 464 -30 072 218 -36 738 609
-30 -44 293 687 -21 426 069 -29 801 822 -36 464 964
-20 -44 020 042 -21 155 673 -29 531 427 -36 191 319
-10 -43 746 397 -20 885 277 -29 261 031 -35 917 674
0 -43 472 752 -20 614 882 -28 990 635 -35 644 029
10 -43 199 107 -20 344 486 -28 720 240 -35 370 384
20 -42 925 462 -20 074 090 -28 449 844 -35 096 739
30 -42 651 817 -19 803 695 -28 179 448 -34 823 094
40 -42 378 172 -19 533 299 -27 909 052 -34 549 449
50 -42 104 527 -19 262 903 -27 638 657 -34 275 804
60 -41 830 882 -18 992 507 -27 368 261 -34 002 159
70 -41 557 237 -18 722 112 -27 097 865 -33 728 514
80 -41 283 591 -18 451 716 -26 827 470 -33 454 869
90 -41 009 946 -18 181 320 -26 557 074 -33 181 224
100 -40 736 301 -17 910 925 -26 286 678 -32 907 579
Stellenbosch University https://scholar.sun.ac.za
Stellenbosch University https://scholar.sun.ac.za

Movement of gold sales
The base case has been highlighted in grey. Where the base case lies between two percentages the range is highlighted in grey
Table G.9: Sensitivity of models to changes in gold sales volumes (with fixed copper sales)
Sensitivity of models to changes in gold sales volumes (with fixed copper sales)
NPV (US$)
Change in gold sales (%) 4a 4b 4c 4d
-100 -65 797 356 -38 648 779 -51 315 240 -53 677 926
-90 -63 564 896 -36 845 389 -49 082 779 -51 874 536
-80 -61 332 435 -35 041 999 -46 850 319 -50 071 147
-70 -59 099 975 -33 238 609 -44 617 858 -48 267 757
-60 -56 867 515 -31 435 220 -42 385 398 -46 464 367
-50 -54 635 054 -29 631 830 -40 152 937 -44 660 977
-40 -52 402 594 -27 828 440 -37 920 477 -42 857 588
-30 -50 170 133 -26 025 051 -35 688 017 -41 054 198
-20 -47 937 673 -24 221 661 -33 455 556 -39 250 808
-10 -45 705 212 -22 418 271 -31 223 096 -37 447 419
0 -43 472 752 -20 614 882 -28 990 635 -35 644 029
10 -41 240 291 -18 811 492 -26 758 175 -33 840 639
20 -39 007 831 -17 008 102 -24 525 714 -32 037 250
30 -36 775 371 -15 204 713 -22 293 254 -30 233 860
40 -34 542 910 -13 401 323 -20 060 793 -28 430 470
50 -32 310 450 -11 597 933 -17 828 333 -26 627 081
60 -30 077 989 -9 794 543 -15 595 873 -24 823 691
70 -27 845 529 -7 991 154 -13 363 412 -23 020 301
80 -25 613 068 -6 187 764 -11 130 952 -21 216 911
90 -23 380 608 -4 384 374 -8 898 491 -19 413 522
100 -21 148 147 -2 580 985 -6 666 031 -17 610 132
Stellenbosch University https://scholar.sun.ac.za
Stellenbosch University https://scholar.sun.ac.za

Movement of copper and gold sales
The base case has been highlighted in grey. Where the base case lies between two percentages the range is highlighted in grey
Table G.10: Sensitivity of models to changes in copper and gold sales volumes
Sensitivity of models to changes in sales volumes
NPV (US$)
Change in sales (%) 4a 4b 4c 4d
-100 -68 533 807 -41 352 736 -54 019 197 -56 414 376
-90 -66 027 701 -39 278 950 -51 516 340 -54 337 342
-80 -63 521 596 -37 205 165 -49 013 484 -52 260 307
-70 -61 015 490 -35 131 379 -46 510 628 -50 183 272
-60 -58 509 385 -33 057 594 -44 007 772 -48 106 237
-50 -56 003 279 -30 983 809 -41 504 916 -46 029 203
-40 -53 497 174 -28 910 023 -39 002 060 -43 952 168
-30 -50 991 068 -26 836 238 -36 499 204 -41 875 133
-20 -48 484 963 -24 762 452 -33 996 347 -39 798 099
-10 -45 978 857 -22 688 667 -31 493 491 -37 721 064
0 -43 472 752 -20 614 882 -28 990 635 -35 644 029
10 -40 966 646 -18 541 096 -26 487 779 -33 566 994
20 -38 460 541 -16 467 311 -23 984 923 -31 489 960
30 -35 954 435 -14 393 525 -21 482 067 -29 412 925
40 -33 448 330 -12 319 740 -18 979 211 -27 335 890
50 -30 942 224 -10 245 955 -16 476 354 -25 258 855
60 -28 436 119 -8 172 169 -13 973 498 -23 181 821
70 -25 930 013 -6 098 384 -11 470 642 -21 104 786
80 -23 423 908 -4 024 598 -8 967 786 -19 027 751
90 -20 917 802 -1 950 813 -6 464 930 -16 950 716
100 -18 411 697 122 972 -3 962 074 -14 873 682
Stellenbosch University https://scholar.sun.ac.za
Stellenbosch University https://scholar.sun.ac.za

Changes in WPCB prices
The base case has been highlighted in grey. Where the base case lies between two percentages the range is highlighted in grey
Table G.11: Sensitivity of models to changes in WPCB purchase prices
Sensitivity of models to changes in WPCB purchase prices
NPV (US$)
Change in WPCB prices (%) 4a 4b 4c 4d
-100 -28 028 884 -5 171 014 -13 546 767 -20 200 161
-90 -29 573 271 -6 715 401 -15 091 154 -21 744 548
-80 -31 117 658 -8 259 787 -16 635 541 -23 288 935
-70 -32 662 044 -9 804 174 -18 179 928 -24 833 322
-60 -34 206 431 -11 348 561 -19 724 315 -26 377 708
-50 -35 750 818 -12 892 948 -21 268 701 -27 922 095
-40 -37 295 205 -14 437 334 -22 813 088 -29 466 482
-30 -38 839 592 -15 981 721 -24 357 475 -31 010 869
-20 -40 383 978 -17 526 108 -25 901 862 -32 555 255
-10 -41 928 365 -19 070 495 -27 446 248 -34 099 642
0 -43 472 752 -20 614 882 -28 990 635 -35 644 029
10 -45 017 139 -22 159 268 -30 535 022 -37 188 416
20 -46 561 525 -23 703 655 -32 079 409 -38 732 803
30 -48 105 912 -25 248 042 -33 623 796 -40 277 189
40 -49 650 299 -26 792 429 -35 168 182 -41 821 576
50 -51 194 686 -28 336 816 -36 712 569 -43 365 963
60 -52 739 073 -29 881 202 -38 256 956 -44 910 350
70 -54 283 459 -31 425 589 -39 801 343 -46 454 736
80 -55 827 846 -32 969 976 -41 345 729 -47 999 123
90 -57 372 233 -34 514 363 -42 890 116 -49 543 510
100 -58 916 620 -36 058 749 -44 434 503 -51 087 897
Stellenbosch University https://scholar.sun.ac.za
Stellenbosch University https://scholar.sun.ac.za

Changes in copper recoveries
The base case has been highlighted in grey. Where the base case lies between two percentages the range is highlighted in grey
Table G.12: Sensitivity of models to changes in copper recoveries
Sensitivity of models to changes in copper recoveries
NPV (US$)
Copper recovery (% per year) 4a 4b 4c 4d
0 -46 209 202 -23 318 839 -31 694 592 -38 380 480
10 -45 925 073 -23 038 083 -31 413 837 -38 096 350
20 -45 640 944 -22 757 327 -31 133 081 -37 812 221
30 -45 356 814 -22 476 572 -30 852 325 -37 528 091
40 -45 072 685 -22 195 816 -30 571 570 -37 243 962
50 -44 788 555 -21 915 061 -30 290 814 -36 959 832
60 -44 504 426 -21 634 305 -30 010 059 -36 675 703
70 -44 220 296 -21 353 550 -29 729 303 -36 391 574
80 -43 936 167 -21 072 794 -29 448 548 -36 107 444
90 -43 652 038 -20 792 038 -29 167 792 -35 823 315
100 -43 367 908 -20 511 283 -28 887 036 -35 539 185
Stellenbosch University https://scholar.sun.ac.za
Stellenbosch University https://scholar.sun.ac.za

Changes in gold recoveries
The base case has been highlighted in grey. Where the base case lies between two percentages the range is highlighted in grey
Table G.13: Sensitivity of models to changes in gold recoveries
Sensitivity of models to changes in gold recoveries
NPV (US$)
Gold recovery (% per year) 4a 4b 4c 4d
0 -65 797 356 -38 648 779 -51 315 240 -53 677 926
10 -63 500 823 -36 827 173 -49 018 706 -51 856 320
20 -61 204 289 -35 005 567 -46 722 172 -50 034 714
30 -58 907 755 -33 183 961 -44 425 638 -48 213 109
40 -56 611 221 -31 362 356 -42 129 105 -46 391 503
50 -54 314 688 -29 540 750 -39 832 571 -44 569 897
60 -52 018 154 -27 719 144 -37 536 037 -42 748 291
70 -49 721 620 -25 897 538 -35 239 504 -40 926 686
80 -47 425 086 -24 075 933 -32 942 970 -39 105 080
90 -45 128 553 -22 254 327 -30 646 436 -37 283 474
100 -42 832 019 -20 432 721 -28 349 902 -35 461 868
Stellenbosch University https://scholar.sun.ac.za
Stellenbosch University https://scholar.sun.ac.za

Changes in gold and copper recoveries
The base case has been highlighted in grey. Where the base case lies between two percentages the range is highlighted in grey
Table G.14: Sensitivity of models to changes in both copper and gold recoveries
Sensitivity of models to changes in gold and copper recoveries
NPV (US$)
Gold & Copper recovery (% per year) 4a 4b 4c 4d
0 -68 533 807 -41 352 736 -54 019 197 -56 414 376
10 -65 953 144 -39 250 374 -51 441 907 -54 308 641
20 -63 372 480 -37 148 013 -48 864 618 -52 202 906
30 -60 791 817 -35 045 652 -46 287 329 -50 097 171
40 -58 211 154 -32 943 290 -43 710 039 -47 991 436
50 -55 630 491 -30 840 929 -41 132 750 -45 885 701
60 -53 049 828 -28 738 568 -38 555 461 -43 779 965
70 -50 469 165 -26 636 206 -35 978 171 -41 674 230
80 -47 888 502 -24 533 845 -33 400 882 -39 568 495
90 -45 307 838 -22 431 484 -30 823 593 -37 462 760
100 -42 727 175 -20 329 122 -28 246 303 -35 357 025
Stellenbosch University https://scholar.sun.ac.za
Stellenbosch University https://scholar.sun.ac.za

Changes in capacity utilization
The base case has been highlighted in grey. Where the base case lies between two percentages the range is highlighted in grey
Table G.15: Sensitivity of models to changes in capacity utilization
Sensitivity of models to changes in capacity utilization
NPV (US$)
Capacity utilization (% per year) 4a 4b 4c 4d
10 -26 467 609 -11 018 651 -18 885 978 -20 709 122
20 -28 357 069 -12 084 899 -20 008 717 -22 368 556
30 -30 246 529 -13 151 147 -21 131 457 -24 027 991
40 -32 135 990 -14 217 394 -22 254 197 -25 687 425
50 -34 025 450 -15 283 642 -23 376 937 -27 346 859
60 -35 914 910 -16 349 890 -24 499 676 -29 006 293
70 -37 804 371 -17 416 138 -25 622 416 -30 665 727
80 -39 693 831 -18 482 386 -26 745 156 -32 325 161
90 -41 583 292 -19 548 634 -27 867 895 -33 984 595
100 -43 472 752 -20 614 882 -28 990 635 -35 644 029
Stellenbosch University https://scholar.sun.ac.za
Stellenbosch University https://scholar.sun.ac.za

H: Waste management landscape of South
Africa
Stellenbosch University https://scholar.sun.ac.za

Table H.1: Waste management landscape 1989 to 2017 (Godfrey & Oelofse, 2017)
Age Key highlights
Land-filling as of 1989
South African waste management still reliant on land-filling as the method of choice. Promoted by low gate fees to access landfills. 90% of all waste generated in the country reporting to land-filling. Policy development and regulation of landfills stimulated by impacts to environment and societies. Birth of the Environmental Conservation Act (Act 73 of 1989). Provided guidelines for handling and classification of waste. Active licensing of landfills.
Emergence of recycling
Stimulus driven by social needs and demand for specific resources. Push by government to increase waste recycling White paper on IP & WM and the first National Waste Management Summit (NWMS). Polokwane declaration published. Recycling targets defined and ratified however not legalised. Publication of guidelines by the Department of Environmental Affairs and Tourism (DEAT) to assist in the implementation of the NWMS. Growth in the waste recycling sector and reuse characterised by the significant input of the informal sector. Government spearheaded efforts to define formalised structures to effectively capture input of the informal sector. This was through promotion of cooperatives that suffered due to operational setbacks.
Flood of regulation Publication of the white paper on Integrated Pollution and Waste Management (IP & WM). In 2009 the first legislation on waste management was published. Provided mechanism to regulate every aspect of waste management and exploitation of secondary resources in the value chain. Objectives aimed to control the sector and impacts of poor waste management efforts, promote value realisation from recycling activities. 41 other acts related to waste management were documented. Legislative acts also supported by local municipal bylaws. First talk about EPR being adopted in SA
Drive for EPR Alternative policy instruments published to support EPR drive New tax measures instituted which became an area of debate. After 2009 shift from voluntary to mandatory EPR schemes Government expressed desire for EPR schemes for the lighting, WEEE and the packaging and paper sectors.
Stellenbosch University https://scholar.sun.ac.za
Stellenbosch University https://scholar.sun.ac.za

Table H.2: Legislation in South Africa affecting e-waste management practices (Finlay, 2005; GIZ,
2013)
Legislation Description
The National Environmental Management Act (Act 107 of 1998) (NEMA)
Pillars for waste management are specified in the operating context of this act. Elements of EPR are however not succinctly defined. The act embodies aspects related to the polluter pays principle, re-use, and waste reduction, recycling and proper disposal.
The Constitution of the Republic of South Africa (Act 106 of 1996)
Provides overarching policy on the preservation of the environment.
The National Environmental Management: Waste Act (Act 59 of 2008)
Provides for the regulation and control of all waste and includes electronic and electrical waste.
The Hazardous Substances Act
This Act is concerned with the regulation of the management of hazardous substances, storage and disposal of hazardous waste.
The Health Act Supporting Act that advances healthy living and occupational conditions.
The White Paper on Integrated Pollution and Waste Management
This paper is concerned with the allocation of environmental and waste management powers. The holistic waste management of water is embodied in the core function of the National Waste Management strategy. Other focal areas include the waste information system, general waste collection, waste treatment and disposal and capacity building and educational activities.
(ECA) The Environment Conservation Act. Act 73 of 1989
Works in collaboration with the Department of Environmental Affairs and Tourism (DEAT) for the administration of the disposal of waste. This act covers the protection of the environment.
The Occupational Health and Safety Act (OHSA) (Act 85 of 1993)
Aspects of health and safety concerning workplaces are covered in this act.
Municipal Services Act (Act 32 of 2000)
Effective local governance is specified within this act.
Second –hand Goods Bill
Provides for the regulation of the trade in second-hand goods. Objectively it limits the trade in stolen goods while promoting ethical standards in the second-hand sector.
Atmospheric Pollution Prevention Act, 45 of 1965
Specific smelting, melting or burning processes require a registration certificate. These processes include lead, copper, waste incineration, cadmium, metal recovery, mercury and glass processes.
Air Quality Act, 39 of 2004
This act aims to improve air quality standards and control. It has a significant bearing on smelter operations.
Precious Metals legislation
The trade and smelting activities of precious metals are highly regulated in South Africa. This act covers gold, silver, PGMs
National Pricing Strategy for Waste Management
Was instituted in 2016 with the realisation that undercharging of waste management services does nothing to encourage recycling and reuse of materials. The charges for waste management will be determined in South Africa
Industrial Waste Management Plan IndWMP
The first draft notice was published in 2015. Listed sectors are required to submit waste management plans within two years (12 months for registration and 12 months for submission). Recyclers are required to register with the minister.
Stellenbosch University https://scholar.sun.ac.za