Evaluating students' science notebooks as an assessment tool
32
This article was downloaded by: [171.67.216.21] On: 21 August 2014, At: 09:19 Publisher: Routledge Informa Ltd Registered in England and Wales Registered Number: 1072954 Registered office: Mortimer House, 37-41 Mortimer Street, London W1T 3JH, UK International Journal of Science Education Publication details, including instructions for authors and subscription information: http://www.tandfonline.com/loi/tsed20 Evaluating students' science notebooks as an assessment tool Maria A. Ruiz‐Primo a , Min Li b , Carlos Ayala c & Richard J. Shavelson d a School of Education , Stanford University , 485 Lasuen Mall, Stanford, CA 94305–3096, USA E-mail: b 312D Miller Hall, College of Education , University of Washington , Seattle, WA 98195, USA E-mail: c Sonoma State University , 1801 East Cotati Avenue, Rohnert Park, CA 94928, USA E-mail: d School of Education , Stanford University , 485 Lasuen Mall, Stanford, CA 94305–3096, USA E-mail: Published online: 22 Feb 2007. To cite this article: Maria A. Ruiz‐Primo , Min Li , Carlos Ayala & Richard J. Shavelson (2004) Evaluating students' science notebooks as an assessment tool, International Journal of Science Education, 26:12, 1477-1506, DOI: 10.1080/0950069042000177299 To link to this article: http://dx.doi.org/10.1080/0950069042000177299 PLEASE SCROLL DOWN FOR ARTICLE Taylor & Francis makes every effort to ensure the accuracy of all the information (the “Content”) contained in the publications on our platform. However, Taylor & Francis, our agents, and our licensors make no representations or warranties whatsoever as to the accuracy, completeness, or suitability for any purpose of the Content. Any opinions and views expressed in this publication are the opinions and views of the authors, and are not the views of or endorsed by Taylor & Francis. The accuracy of the Content should not be relied upon and should be independently verified with primary sources of information. Taylor and Francis shall not be liable for any losses, actions, claims, proceedings, demands, costs, expenses, damages, and other liabilities whatsoever or howsoever caused arising directly or indirectly in connection with, in relation to or arising out of the use of the Content. This article may be used for research, teaching, and private study purposes. Any substantial or systematic reproduction, redistribution, reselling, loan, sub-licensing,
-
Upload
independent -
Category
Documents
-
view
4 -
download
0
Transcript of Evaluating students' science notebooks as an assessment tool

This article was downloaded by: [171.67.216.21]On: 21 August 2014, At: 09:19Publisher: RoutledgeInforma Ltd Registered in England and Wales Registered Number: 1072954 Registeredoffice: Mortimer House, 37-41 Mortimer Street, London W1T 3JH, UK
International Journal of ScienceEducationPublication details, including instructions for authors andsubscription information:http://www.tandfonline.com/loi/tsed20
Evaluating students' science notebooksas an assessment toolMaria A. Ruiz‐Primo a , Min Li b , Carlos Ayala c & Richard J.
Shavelson da School of Education , Stanford University , 485 Lasuen Mall,Stanford, CA 94305–3096, USA E-mail:b 312D Miller Hall, College of Education , University of Washington ,Seattle, WA 98195, USA E-mail:c Sonoma State University , 1801 East Cotati Avenue, Rohnert Park,CA 94928, USA E-mail:d School of Education , Stanford University , 485 Lasuen Mall,Stanford, CA 94305–3096, USA E-mail:Published online: 22 Feb 2007.
To cite this article: Maria A. Ruiz‐Primo , Min Li , Carlos Ayala & Richard J. Shavelson (2004)Evaluating students' science notebooks as an assessment tool, International Journal of ScienceEducation, 26:12, 1477-1506, DOI: 10.1080/0950069042000177299
To link to this article: http://dx.doi.org/10.1080/0950069042000177299
PLEASE SCROLL DOWN FOR ARTICLE
Taylor & Francis makes every effort to ensure the accuracy of all the information (the“Content”) contained in the publications on our platform. However, Taylor & Francis,our agents, and our licensors make no representations or warranties whatsoever as tothe accuracy, completeness, or suitability for any purpose of the Content. Any opinionsand views expressed in this publication are the opinions and views of the authors,and are not the views of or endorsed by Taylor & Francis. The accuracy of the Contentshould not be relied upon and should be independently verified with primary sourcesof information. Taylor and Francis shall not be liable for any losses, actions, claims,proceedings, demands, costs, expenses, damages, and other liabilities whatsoever orhowsoever caused arising directly or indirectly in connection with, in relation to or arisingout of the use of the Content.
This article may be used for research, teaching, and private study purposes. Anysubstantial or systematic reproduction, redistribution, reselling, loan, sub-licensing,

systematic supply, or distribution in any form to anyone is expressly forbidden. Terms &Conditions of access and use can be found at http://www.tandfonline.com/page/terms-and-conditions
Dow
nloa
ded
by [
171.
67.2
16.2
1] a
t 09:
19 2
1 A
ugus
t 201
4

International Journal of Science Education ISSN 0950–0693 print/ISSN 1464–5289 online © 2004 Taylor & Francis Ltdhttp://www.tandf.co.uk/journals
DOI: 10.1080/0950069042000177299
INT. J. SCI. EDUC., 8 OCTOBER 2004,VOL. 26, NO. 12, 1477–1506
* The report herein was supported by the National Science Foundation (No. SPA-8751511 and TEP-9055443). The opinions expressed, however, are solely those of the authors.
RESEARCH REPORT
Evaluating students’ science notebooks as an assessmenttool*
Maria A. Ruiz-Primo, School of Education, Stanford University, 485 LasuenMall, Stanford, CA 94305–3096, USA; e-mail: [email protected]; Min Li,312D Miller Hall, College of Education, University of Washington, Seattle, WA98195, USA; e-mail: [email protected]; Carlos Ayala, Sonoma StateUniversity, 1801 East Cotati Avenue, Rohnert Park, CA 94928, USA;e-mail: [email protected]; Richard J. Shavelson, School of Education,Stanford University, 485 Lasuen Mall, Stanford, CA 94305–3096, USA;e-mail: [email protected]
The idea of using science notebooks as a classroom assessment tool is not new. There is general agreement thatscience notebooks allow teachers to assess students’ conceptual and procedural understanding and to providethe feedback students need for improving their performance. In this study we examined the use of sciencenotebooks as an unobtrusive assessment tool that can also be used by individuals outside the classroom (forexample, school district personnel), and as a means for obtaining information about students’ learning and theiropportunities to learn. More specifically, in this study students’ science notebooks were used as a source of dataabout the (a) implementation of a curriculum’s intended activities, (b) students’ performance, and (c) qualityof teachers’ feedback. Our results indicated that: (1) Students’ science notebooks can be reliably scored. Unitimplementation, student performance, and teacher feedback scores were highly consistent across raters andunits. (2) High and positive correlations with other performance assessment scores indicated that the studentperformance score can be considered as an achievement indicator. And (3) low performance scores across thetwo units revealed that students’ communication skills and understanding were far away from the maximumscore and did not improve over the course of instruction during the school year. This result may be due, in part,to the fact that no teacher feedback was found in any of the students’ notebooks across the six classroomsstudied. This may reflect some characteristics of the teachers’ assessment practices that may require furtherprofessional development.
Introduction
Science notebooks or journals are seen as a log of what students do in their scienceclass. (We prefer the former term, notebook, to stay away from the meaning ofscience journal as diary.) Keeping science notebooks encourages students to writeas a natural part of their daily science class experience. Students may describe theproblems they are trying to solve, the procedures they use, observations they make,conclusions they arrive at, and their reflections. As expected, there are severalvariations on this basic idea. (For example, thinking journals (Lozaukas and Barell1992), affirmational dialogue journals (Hanrahan 1999), log sheets (Lucido 1992),
Dow
nloa
ded
by [
171.
67.2
16.2
1] a
t 09:
19 2
1 A
ugus
t 201
4

1478 M. A. RUIZ-PRIMO ET AL.
dialectical journals, think-aloud journals, and team journals (see Rivard 1994).)Still, science notebooks are viewed mainly as a written account in more or less detailand with diverse quality, of what students do and, hopefully, learn in their scienceclass. In this study we defined notebooks as a compilation of entries (or items in alog) that provide a record, at least partially, of the instructional experiences studentshave in their classroom for a certain period of time (for example, unit of study).Since notebooks are generated during the process of instruction, the characteristicsof their entries vary from entry to entry as they reflect the diverse set of activities ina science class.
There is general agreement that science notebooks allow teachers to assessstudents’ understanding (for example, Audet et al. 1996, Dana et al. 1991, Fellows1994, Heinmiller 2000, Hewitt 1974, McColskey and O’Sullivan 1993, Shepardsonand Britsch 1997) and to provide the feedback students need for improving theirperformance (for example, Audet et al. 1996).
We moved a step further and proposed another perspective and function ofscience notebooks (Ruiz-Primo 1998, Ruiz-Primo et al. 1999). We proposednotebooks as an unobtrusive assessment tool to be used not only by teachers butalso by individuals outside the classroom (for example, school district personnel).What information can be collected from an outsider’s perspective when usingstudents’ science notebooks as an assessment tool? The most evident answer isinformation on students’ performance. However, we proposed (Ruiz-Primo et al.1999) that students’ notebooks could also be used to collect information aboutopportunity to learn. Consistent with the National Science Education Standards(National Research Council 1996), we believe that students should not be heldaccountable for achievement unless they are given adequate opportunity to learnscience. Therefore, both students’ performance and opportunity to learn scienceshould be assessed.
In what follows we: (a) propose a framework for conceptualizing students’notebooks as an assessment tool, (b) propose an approach for scoring them, and (c)provide evidence on the technical quality of science notebook scores.
On student performance
According to the National Science Education Standards (National ResearchCouncil 1996), inferences about students’ achievement can be based on an analysisof their classroom performances and work products. Communication and under-standing are considered in the Standards as fundamental for both performance- andproduct-based assessments. If science notebooks are considered as one of thepossible products of students’ work, evidence about students’ communication andunderstanding might be collected from the written/schematic/pictorial accounts ofwhat they do in a science class.
Focusing on the characteristics of students’ scientific communications is notirrelevant. Constructing sound and scientifically appropriate communications helpsstudents not only to better understand scientific concepts and procedures, but alsoto participate in a scientific community. Not knowing the “rules of the game”alienates students from the scientific culture and keeps them scientifically illiterate(for example, Bybee 1996, Lemke 1990, Martin 1989, 1993). Results acrossdifferent studies (see Rivard 1994) have suggested that writing science in anexpository fashion (for example, explaining, taking notes, summarizing results)
Dow
nloa
ded
by [
171.
67.2
16.2
1] a
t 09:
19 2
1 A
ugus
t 201
4

SCIENCE NOTEBOOKS AS ASSESSMENT TOOLS 1479
enhances students’ learning. Although expressive writing appears to be useful, itseffectiveness in improving science learning is not conclusive (see Rivard 1994). Thismeans that if science notebooks invite students to write expressively rather thanfocus on what is being learned and how to communicate it, the notebook’susefulness may be diminished. The more emphasis that is placed on “doing sciencein your own words” the less students are helped to understand the fundamental roleof scientific language in doing science (for example, Lemke 1990, Marks andMousley 1990, Martin 1989, 1993). In sum, a necessary part of becoming aproficient science student is learning to read and write the various genres in science,such as writing a report (for example, Bybee 1996, Lemke 1990, Martin, 1989,1993). Therefore, one aspect of the students’ performance we proposed to focus onis the quality of communication in their notebooks.
The second aspect is understanding. An analysis of students’ writing canprovide insight into the state of students’ understanding, misconceptions, and otherfactors associated with learning (for example, Audet et al. 1996; Dana et al. 1991,Fellows 1994, Heinmiller 2000, Hewitt 1974, McColskey and O’Sullivan 1993,Shepardson and Britsch 1997). Following some of Bybee’s (1996) dimensions ofscientific literacy we focused on conceptual and procedural understanding.Conceptual understanding involves the functional use of scientific words/vocabularyappropriately and adequately as well as relating the concepts, represented by thosewords (i.e., understanding facts, concepts, and principles as parts of conceptualschemes). Procedural understanding emphasizes the abilities of inquiry–theprocesses of science. These abilities include not only observing, hypothesizing, andexperimenting, but also using evidence, logic, and knowledge to constructexplanations (Duschl 2003).
On opportunity to learn
Opportunity to learn focuses on evidence that the curricular objectives aretranslated into topics actually taught in the classroom (i.e., Do teachers provideinstruction on the knowledge stated in the adopted science curriculum?). Inferencesabout opportunities to learn using students’ notebooks are based on the assumptionthat science notebooks are an account of what students do in their scienceclassroom. If this assumption holds, it should be possible to map instructionalactivities implemented in a science classroom when information from individualscience notebooks is aggregated at the classroom level. If none of the students’notebooks from a class has any evidence that an instructional activity was carriedout, it is unlikely that the activity was implemented.
According to the National Science Education Standards (National ResearchCouncil 1996), another aspect of opportunity to learn is the quality of teaching. Ifscience notebooks allow teachers to assess students’ understanding, we think someevidence of this assessment should be found in the students’ notebooks in the formof teacher’s written comments. Indeed, Black and Wiliam (1998) provide strongevidence on the relation of the nature of feedback and student achievement. Black(1993) has shown that formative evaluation of student work (for example, feedback)can produce improvements in science learning. However, teachers’ effective use offormative evaluation is hard to find (for example, Black 1993, Black and Wiliam1998). Furthermore, classroom teachers are rarely good at providing usefulfeedback (for example, Sadler 1989, 1998, Wiggins 1993). Most of the time
Dow
nloa
ded
by [
171.
67.2
16.2
1] a
t 09:
19 2
1 A
ugus
t 201
4
1480 M. A. RUIZ-PRIMO ET AL.
feedback is considered as a comment in the margin that involves praise and/or blameor code phrases for mistakes (for example, “seg. sentence!”). Research has foundthat quality of feedback (for example, helpful comments, comments with grade, orgrade only) affects its effectiveness for improving students’ performance (forexample, Butler 1987). Teachers’ feedback, such as a grade (for example, B-) or acode phrase (for example, “incomplete!” or a happy face sticker), can hardly helpstudents redirect their efforts to meet the needs revealed by their notebook entries(for example, Sadler 1989, 1998).
Based on these arguments, we proposed (Ruiz-Primo 1998, Ruiz-Primo et al.1999) two indicators to evaluate opportunity to learn using science notebooks: (1)exposure to the science content as specified in the curriculum/program adopted,and (2) quality of teachers’ feedback on students’ performance. (We acknowledgethat there are many indicators of opportunity to learn at the classroom level (forexample, teachers’ content and pedagogical knowledge, and their understanding ofstudents). Science notebooks are seen as one source of evidence, among others, thatcan be used as an indicator of opportunity to learn.) We (Ruiz-Primo et al. 1999)named the first indicator unit implementation, and the second, teacher feedback onstudent performance.
Evidence of the implementation of an instructional activity can be found indifferent forms in a student’s notebook: description of a procedure, hands-onactivity report, interpretation of results, and the like. Variation in these forms isexpected across activities and students’ notebooks. Furthermore, notebook entriesmay vary from one student to the next within the same classroom for a number ofreasons (for example, the student was absent when a particular instructional activitywas implemented). The variety of notebook entries can be even wider whenstudents’ science notebooks are compared across different classrooms. To tap thevariation in notebook entries within- and between-classes, entries in the notebooksare linked to the intended instructional activities specified in the curriculumadopted.
Students’ science notebooks can also be used as a source of evidence onteachers’ feedback. If science notebooks allow teachers to assess students’understanding, we would expect to see some evidence of feedback in the students’notebooks. If teachers do not respond, probe, challenge, or ask for elaborations ofnotebook entries, the benefit of the notebook as a learning tool and as an instrumentto inform students about their performance may be lost.
Assessment approach
In previous papers (Ruiz-Primo 1998, Ruiz-Primo et al. 1999) we pointed out thatscience notebooks could be viewed as an assessment tool at two levels: (1) individuallevel–a source of evidence bearing on a student’s performance over the course ofinstruction; and (2) classroom level–a source of evidence of opportunities studentshad to learn science.
Our assessment approach focuses on three aspects of students’ sciencenotebooks: (1) Unit Implementation–What intended instructional activities wereimplemented as reflected in the students’ notebooks? Were any other additionalactivities implemented that were appropriate to achieve the unit’s goals? (2) StudentPerformance–Were students’ notebook communications appropriate according tothe scientific genres? Did students’ communications indicate conceptual and
Dow
nloa
ded
by [
171.
67.2
16.2
1] a
t 09:
19 2
1 A
ugus
t 201
4
SCIENCE NOTEBOOKS AS ASSESSMENT TOOLS 1481
procedural understanding of the content? And (3) Teacher Feedback–Did theteacher provide helpful feedback on students’ performance? Did the teacherencourage students to reflect on their work?
Notebooks as an assessment tool
We conceived of an assessment as a combination of a task, a response format, anda scoring system (for example, Ruiz-Primo and Shavelson 1996a). Based on thistriple, a notebook used as an assessment tool can be thought as a: (a) task thatallows students to provide evidence bearing on their knowledge and communicationskills; (b) format for students’ communication (that is, entry); and (c) scoringsystem by which the students’ notebook entries can be evaluated accurately andconsistently.
In contrast to other forms of assessment (for example, multiple-choice,performance assessments or concept maps), the identification or correspondence ofthe triple is not straightforward for notebooks (see Ruiz-Primo 1998, Ruiz-Primoand Shavelson 1996a, b). How can a notebook assessment task be defined? Whatwould the response format be? How can a scoring system be defined? As mentionedbefore, notebooks are a compilation of communications with diverse characteristics.Each of these communications is considered as a notebook entry and we view eachentry as an instance of the triple. A notebook entry can be a set of definitions, a setof data, an interpretation of results, a description of an experiment, or a quick noteabout what was learned in the class on a particular day.
A notebook assessment task varies according to the notebook entry, which isviewed as the “what” students were asked to do. For example, reporting the data fromthe experiment carried out on a particular day. The entry format also varies accordingto the type of entry. Reporting data may take the form of a table or graph (a schematiccommunication), or simply a description of observations (a verbal communication).Finally, the scoring system is the criteria used to judge the notebook entry. Thescoring system should allow scoring the same aspects across different types of entries.For example, each student’s notebook entry should be considered as evidence of thestudent’s understanding; some entries will focus more on conceptual understanding(for example, explaining a concept), some others on procedural (for example,conducting an experiment properly). In what follows, we explain how our approachincorporates the assessment triple to form an assessment tool.
Science notebook assessment tasks
As mentioned before, the characteristics of notebook entries vary since each entrymay ask students to complete different tasks depending on the instructional activityimplemented on a particular day (for example, write a procedure or explain aconcept). The key issue, from the assessment perspective, is to identify the notebookentries according to the “what” students were asked to do. After reviewing dozensof students’ science notebooks from different classrooms, and looking into the typesof activities that students are supposed to do in a science class (see National ScienceEducation Standards/National Research Council 1996), we identified fourteengeneral entry categories. We acknowledge that many different schemes can be usedto analyze students’ notebooks communications (see Audet et al. 1996, Keys1999).
Dow
nloa
ded
by [
171.
67.2
16.2
1] a
t 09:
19 2
1 A
ugus
t 201
4

1482 M. A. RUIZ-PRIMO ET AL.
Notebook entries can be found in different forms of communication: verbal–written/text–(for example, explanatory, descriptive, inferential statements); sche-matic (for example, tables, lists, graphs showing data); or pictorial (for example,drawing of apparatus). Moreover, some of the categories proposed also include sub-types of entries according to the form of communication. For example, a definitioncan be verbal or pictorial (for example, drawing of a pendulum system). Therefore,the type of entry, definition, includes two sub-types of definitions. Table 1 presentsthe types and sub-types that we have identified. We assumed that all the entriesprovide information, at least partially, about the students’ conceptual andprocedural understanding and communication skills.
Each type of entry is considered to have its own characteristics that make itidentifiable. For example, reporting results focuses on describing observations orpresenting data, whereas interpretation focuses on summarizing and generalizingthe data, or highlighting specific cases (for example, Penrose and Katz 1998). Oncea notebook entry is identified as an instance of a particular type, the “what” that thestudent was asked to do is inferred. For scoring purposes and assuming that entry
Table 1. Types and sub-types of notebook entries.
Genre Type of Entry Code Sub-Types
Minor Defining 1 • Defining, verbalGenre 2 • Defining, pictorial
Exemplifying 3 –Applying Concepts 4 –Predicting/Hypothesizing 5 –Reporting Results 6 • Reporting results, verbal
7 • Reporting results, graphicInterpreting Data and/orConcluding
8 –
Reporting and Interpreting Dataand/or Concluding
9 • Reporting and interpreting, verbal
10 • Reporting and interpreting, graphicContent Questions/Short Answer 17 –Quick Writes 18 • Contextualizing science
19 • Narrative affective20 • Narrative reflections
Major Reporting Procedure 11 • Procedure recountGenre 12 • Procedure instructions
13 • Procedure directionsReporting a Quasi Experiment 14 –Reporting an Experiment 15 –Designing an Experiment 16 –
NA Assessment 21 • Simple forms (for example, shortanswer)
22 • Complex forms (for example,performance assessments)
Don’t Care About Activity 23 –
NA: Not applicable– No sub-type of entry
Dow
nloa
ded
by [
171.
67.2
16.2
1] a
t 09:
19 2
1 A
ugus
t 201
4
SCIENCE NOTEBOOKS AS ASSESSMENT TOOLS 1483
types can be more or less identifiable, each type of entry was assigned a code (seetable 1).
Science notebook entry formats
Entry formats vary according not only to the type of entry, but also to who providesthe format–curriculum developers, the teacher, or the student. For example, ascience unit/module adopted by a teacher/class/district may have, as part of itsdesign, activity sheets that students fill out as they carry out the activity. Other timesthe teacher provides students an entry format; for example, a table for reportingdata or a printed sheet on which to report an experiment. In these cases the entryformats are given to the student. Still, in other cases students are not provided withany response format. They are asked by the teacher to write about, say, theprocedure used that day, and the students write about it with no response formatimposed. We have, then, identified those possible sources of response formats withcorresponding codes (for example, when the format is provided by the teacher thescorer provides the code “.6” after the type of entry, say 5.6).
Science notebook scoring system
The scoring system focuses on collecting information on students’ performance andopportunity to learn. Therefore, for each entry identified, students’ performancecan be scored as to the quality of the communication–Did the student’scommunication correspond to the appropriate communication genre?–and theunderstanding–Did students’ communications indicate conceptual and proceduralunderstanding of the content presented? Both aspects are scored according to therequirements of the task. Opportunity to learn focuses on identifying entries thatreflect the implementation of the intended instructional activities, as well as someaspects of the quality of instruction students received.
Student performance. In a pilot study we scored each communication as to:completeness, clarity, and organization (Ruiz-Primo et al. 1999). Completeness andclarity in communication were dichotomously scored 0 (No) or 1 (Yes).Organization of communication was evaluated using a three-level score: 0–NoOrganization (i.e., no sign of organization); 1–Minimal Organization (for example,student only uses dates to separate information or only lists information); and2–Strong Organization (for example, student uses titles, subtitles, and labelsappropriately). Unfortunately, results indicated that students’ scores varied littlesince most communications were scored as complete and clear (score of 1) and withminimal organization (score of 1). The criteria did not accurately discriminate thequality of communication across students.
In this study, we approached the scoring of the quality of communication fromthe perspective of genres in scientific communication (for example, Lemke 1990,Martin 1989, 1993). (Lemke (1990) classifies the scientific genres into: (1) minorgenres, short or simpler forms of communication, such as descriptions, compar-isons, and definitions, and (2) major genres, usually longer, more complex, andmore specialized communications, such as lab reports.) We focused on linking typesof entries with scientific communication genres (see table 1). We defined the generalcharacteristics of each genre so as to develop scoring criteria that went beyond
Dow
nloa
ded
by [
171.
67.2
16.2
1] a
t 09:
19 2
1 A
ugus
t 201
4

1484 M. A. RUIZ-PRIMO ET AL.
completeness, clarity, and organization (that is, Does the student’s communicationhave the distinctive elements of the written genre in hand?). (The approach did notintend to focus on the functional analysis of the students’ written communication(for example, lexical density or characteristics of the clauses; see Halliday andMartin 1993, Keys 1999). Instead it used only the general characteristics of thegenres as criteria for scoring the quality of the communications.)
Take as an example, “definitions”. Definitions are considered a minor scientificgenre with clauses (the term to be defined and the definition) that explain what iswhat or who is who (for example, Lemke 1990, Martin 1993). The generalcharacteristics of definitions are that they: (1) are always reversible (for example,“solutions are mixtures that . . .”, or “mixtures that have the same properties . . . arecalled solutions”); (2) use technical terms, when appropriate, to condenseinformation (for example, it is better to refer to mixtures than to substances that canbe easily separated without making any new chemicals); and (3) are timeless (verbsin present tense) since technical/scientific definitions do not apply only to the “hereand now”. (We acknowledge that people may complain that focusing on the use oftechnical terms, when appropriate, may focus attention on “jargon” instead ofunderstanding. First, translating jargon into common sense is responsibility notonly of scientists but also of teachers. Second, scientists could not do their jobwithout technical discourse. Not only it is compact, and therefore efficient, but,most importantly, it codes an alternative perspective on reality to common sense, aperspective accumulated over centuries of scientific inquiry (Martin 1993).) Usingthese general characteristics of the “definition genre” we developed scoring criteria(table 2). Criteria such as those presented in table 2 were developed for each typeof entry. table 3 provides some examples of the criteria developed for minor genre(“defining pictorial” and “reporting data graphic”) and major genre (“reportingprocedures” and “designing experiments”).
Some entry categories were considered to be “narrative” communications (forexample, affective) rather than scientific communications and we also developedcriteria to score them. Once a notebook entry was identified, the correspondinggenre criteria were applied. If a student’s quality of communication was 0 no furtherattempt was made to score understanding as evidenced by that entry.
Each entry/communication was also scored as to the conceptual or proceduralunderstanding it reflected (for example, Does a student’s explanation apply theconcepts learned in the unit correctly? Does the student’s description providecorrect examples of a concept? Is the student’s inference justified based onrelevant evidence?). Scoring focused on conceptual understanding when thecommunication in the entry referred to defining, exemplifying, relating, compar-ing, or contrasting unit-based concepts, and on procedural understanding whenthe communication referred to reporting procedures carried out during anactivity/experiment, reporting observations/results/outcomes, interpreting results,or concluding.
Conceptual and procedural understanding was evaluated on a four-point scale:(NA)–Not applicable (i.e., instructional task does not require any conceptual orprocedural understanding); 0–No Understanding (for example, examples orprocedures described were completely incorrect); 1–Partial Understanding (forexample, relationships between concepts or descriptions of observations were onlypartially accurate or incomplete); 2–Adequate Understanding (for example,comparisons between concepts or descriptions of a plan of investigation were
Dow
nloa
ded
by [
171.
67.2
16.2
1] a
t 09:
19 2
1 A
ugus
t 201
4

SCIENCE NOTEBOOKS AS ASSESSMENT TOOLS 1485
appropriate, accurate, and complete); and 3–Advanced Understanding (forexample, communication focused on justifying student’s responses/choices/deci-sions based on the concepts learned or the communication provided relevant data/evidence to formulate the interpretation). Table 4 provides examples of students’notebook entries focusing on conceptual and procedural understanding and thescores assigned.
Opportunity to learn. To answer the question about the implementation of theintended curriculum (i.e., What intended instructional activities, as specified by aparticular curriculum/unit, were implemented as reflected in the student’snotebook?), we first defined the instructional activities to be considered as evidencethat the unit was implemented. The specification of these activities was based on ananalysis of the intended curriculum. An inventory of the major activities served asa verification list for capturing the implementation of the basic instructionalactivities, as well as “other” activities implemented but not required by thecurriculum (i.e., Were any other additional activities implemented that wereappropriate to achieve the curriculum/unit goals?). Implementation was evaluateddichotomously based on the question, “Is there any evidence in the student’s
Table 2. Example of the criteria used to score “quality of communicationfor definitions”.
Score Criteria Example
0Incoherent,incomplete, and notunderstandablecommunication
Definition is incomplete, not understandable. Mixture. When youput . . . (Incompletesentence.)
1Understandable butdoes not use thecharacteristics of thegenre
Definition is complete–the two parts of adefinition are identifiable, BUT the definitiondoes not have technical terms whenappropriate. Definition may or may not haveverbs in present tense OR may or may notmake reference to the here and now.
Mixture. When youput two or morethings together.
2Understandable anduses some of thebasic characteristics ofthe genre
Definition is complete–the two parts of adefinition are identifiable, AND the definitionhas technical terms if appropriate. Definitionmay have verbs in present tense OR may notmake reference to the here and now, BUT notboth.
Mixture. When youput two or morematerials together.
3Understandable anduses all of the basiccharacteristics of thegenre
Definition is complete–the two parts of adefinition are identifiable, AND has technicalterms if appropriate, AND has verbs in presenttense AND does not make reference to the hereand now.
Mixture. Combiningtwo or morematerials togetherforms a mixture.
Dow
nloa
ded
by [
171.
67.2
16.2
1] a
t 09:
19 2
1 A
ugus
t 201
4

1486M
. A. RU
IZ-PR
IMO
ET
AL.
Table 3. Examples of the criteria used to score quality of communication.
Codes Type of Genre Score
0 1Understandable but not using the
characteristics of the genre
2Understandable and uses some of the basic
characteristics of the genre
3Understandable and uses all the basic
characteristics of the genre
2 DefiningPictorial
Incoherent,incomplete, notunderstandablecommunication
Representation can be easily identified (forexample, as a drawing of a pendulum), BUTmost of the important parts are not labeled(i.e., it can have one or more labels, but notthe most important ones).
Representation may or may not have atitle, AND may or may not have technicalterms if appropriate (for example, studentuses “little pieces of glasses” instead of“crystals”).
Representation can be easily identified ANDmost of the important parts are labeled.
Representation may or may not have atitle, OR may or may not have technicalterms if appropriate, but not both.
Representation can be easily identified ANDmost of the important parts of therepresentation are labeled, AND has a title,AND has technical terms if appropriate.
7 ReportingResults,Graphic
Incoherent,incomplete, notunderstandablecommunication
Representation is clearly a table, a graph, or aschematic representation, BUT is not labeledproperly (for example, columns and rows arenot labeled), AND data is not presented in away that shows a data trend (for example,data are not in ascendant/descendent order).
Representation may or may not have a titleAND/OR may or may not have technicalterms if appropriate.
Representation is clearly a table, a graph, or aschematic representation, AND is labeledproperly, AND data is presented in a way thatshows a data trend (for example, data is inascendant/descendent order).
Representation may or may not have a titleOR may or may not have technical terms ifappropriate, BUT not both.
Representation is clearly a table, a graph, or aschematic representation, AND is labeledproperly, AND data is presented in a way thatshows a data trend (for example, data is inascendant/descendent order), ANDrepresentation has a title AND has technicalterms if appropriate.
11 Reporting aProcedure
Incoherent,incomplete, notunderstandablecommunication
Procedure covers some of the importantsteps, BUT steps are not presented in a clearsequence (i.e., numbered), so it is difficult toreplicate procedure.
Procedure may or may not have a title,AND/OR may or may not have technicalterms when appropriate.
Procedure covers most of the importantsteps, AND steps are presented in a clearsequence (i.e., are numbered or clearlysequenced), so procedure can be replicated.
Procedure may or may not have a title, ORmay or may not have technical terms ifappropriate, BUT not both.
Procedure covers all of the important steps,AND steps are presented in a clear sequence(i.e., are numbered), so procedure can bereplicated, AND has a title, AND hastechnical terms if appropriate.
16 Designing anExperiment
Incoherent,incomplete, notunderstandablecommunication
Experiment staging is incomplete becauseonly has procedure, but there is not purpose.
Description of procedure may or may notbe in future tense or imperatives AND/ORmay or may not have technical terms ifappropriate.
Experiment staging is complete, has apurpose and a procedure BUT verbs tense orforms in both descriptions are notappropriate.
Descriptions may or may not havetechnical terms if appropriate.
Experiment staging is complete, has apurpose and a procedure AND verbs tense orforms in both descriptions are appropriate.Descriptions have technical terms whenappropriate.
Dow
nloa
ded
by [
171.
67.2
16.2
1] a
t 09:
19 2
1 A
ugus
t 201
4

SC
IEN
CE
NO
TE
BO
OK
SA
SA
SS
ES
SM
EN
TT
OO
LS
1487Table 4. Examples of students’ notebook entries focusing on conceptual and procedural understanding and the scores
assigned.
Type ofUnderstanding
Example of Students’ Notebook Entries Score
Conceptual:Defining
Example 1 * Definition of Solution1 – Partial Understating: Definition does not provide indicationthat student considers solutions as a special type of mixturewhere a material dissolves in a liquid and cannot be separatedby screening or filtering (two types of separation methodsstudied in this activity).
Definition of Mixture1 – Partial Understating: Definition is partially accurate since amixture is not a type of solution. However, the student providestwo extra pieces of information: Mixtures include more thanone material (i.e., “thing”) and a correct example.
Procedural:Reporting results,graphic
Example 2 1 – Partial Understating: The student records most of the resultscollected from the experiment. However, the student seems toconduct the controlled-experiment inappropriately by changingmore than one variable at the same time. In addition, thestudent does not report the slope information precisely.
* This example was taken from the pilot study. We erased the student’s name for confidentiality concern.
Dow
nloa
ded
by [
171.
67.2
16.2
1] a
t 09:
19 2
1 A
ugus
t 201
4

1488 M. A. RUIZ-PRIMO ET AL.
notebook that activity “X” was implemented?” A score of 1 denoted the affirmativeand 0 denoted absence.
We also assessed the quality of teacher feedback for each notebook entryidentified. We used a six-level score: –2–feedback provided, but incorrect (forexample, teacher provided a positive feedback, say A + , to a student’s communica-tion that was incorrect); –1–no feedback, but it was needed (for example, teachershould point out errors/misconceptions/inaccuracies in student’s communication);0–no feedback; 1–grade or code phrase comment only; 2–comments that providedstudents with direct, usable information about current performance againstexpected performance (for example, comment is based on tangible differencesbetween current and hoped performance, “Don’t forget to label your diagrams!”);and 3–comments that provided students with information that helped them reflecton/construct scientific knowledge (for example, “Why do you think is important toknow whether the material is soluble for selecting the method of separation?). Ruleswere created for those entries in which one instructional task had more than onetype of feedback.
Pilot study
The notebook assessment approach proposed was applied in an exploratory studywith a sample of 32 students’ science notebooks from six classrooms (see Ruiz-Primo et al. 1999). Three of the classrooms taught the Full Option Science System(FOSS) Variables Unit and the other three the FOSS Mixtures and Solutions Unit.The results of this exploratory study indicated that: (1) Students’ science notebookscould be reliably scored. Unit implementation, student performance, and teacherfeedback scores were highly consistent across scorers and units. Interrater reliabilitywas, on average across the two units, 0.91 for the unit implementation score, .86 forthe student performance score, and 0.88 for the teacher feedback score. (2)Inferences about unit implementation using notebook scores were accurate andhence justified. We found a high agreement between the unit implementation scoreand independent sources of information (for example, teachers’ unit logs). (Thereis no information available about the validity of the teacher logs. The Teacher Logswere developed by another institution who at that moment was partner in theresearch project in which this pilot study was immersed. However, it is important tomention that the main focus of Teacher Logs was on the curriculum activitiesimplemented by the teachers and the percentage of time they spent on them.Teachers only had to check those activities implemented on a particular day. Weconsidered that the information provided by the Teacher Logs could be useful as asource of validation of the implementation score.) On average, the percentages ofagreement between the activities reported in the teachers’ logs and the activitiescaptured in the notebook scoring form were: 93 for Variables and 97 for Mixturesand Solutions. (3) Evidence for the validity of inferences about student performancewas also encouraging. High and positive correlations with hands-on performanceassessment scores indicated that the student performance score could be consideredan achievement indicator. (4) The unit implementation score helped explaindifferences in the performance across classrooms. Those classrooms in whichnotebooks showed that more instructional activities were implemented were alsoassociated with higher performance assessment mean scores. And (5) teacherfeedback scores corresponded with the variation observed on students’ performance
Dow
nloa
ded
by [
171.
67.2
16.2
1] a
t 09:
19 2
1 A
ugus
t 201
4

SCIENCE NOTEBOOKS AS ASSESSMENT TOOLS 1489
assessment scores. Those classrooms with higher scores on teacher feedback werethose with higher performance assessment mean scores.
The purposes of this study were to: (1) replicate, if possible, the pilot studyresults using a larger sample of students’ notebooks, (2) provide evidence about thetechnical quality of notebook scores, and (3) track improvement of student learningover a course of a school year using the notebooks as an assessment tool.
The study
Students’ notebook selection
Six fifth-grade classrooms in the Bay Area participated in this study. Theseclassrooms were selected among the 20 classrooms (484 fifth-graders) thatparticipated in a larger study to evaluate the impact of inquiry science curriculareform (Ruiz-Primo et al. 2002b). (In Ruiz-Primo et al. (2002b), we proposed amultilevel-multifaceted approach to evaluating the impact of education reform onstudent achievement that would be sensitive to context and small treatment effects.The approach uses different assessments based on their proximity to the enactedcurriculum. The rationale behind this approach is the spread of effect of reform. Ifthere is a reform effect to be found, first it should be found centrally and then theeffect should trail off in regions increasingly distant to the enacted curriculum. Toprovide evidence about the sensitivity of the approach in ascertaining outcomes ofhands-on science programs we administered close, proximal, and distal perform-ance assessments to evaluate the impact of instruction based on two FOSS units.)The school district in which the study was conducted had received support fromNSF to implement hands-on science since 1990. All teachers had been providedwith professional development to support the implementation of the FOSS sciencecurriculum adopted by the school district for the elementary school.
In Ruiz-Primo and colleagues’ (2002b) study all students were administeredthree assessments that differed in their proximity to the curriculum enacted: closeassessment–close to the content and activities of the unit; proximal assessment–tapknowledge and skills relevant to the curriculum, but specific topics can be differentfrom the ones studied in the unit; and distal assessment–based on state/nationalstandards in a particular knowledge domain but topics not related to those studied.In all 20 classrooms two FOSS units (1993) were implemented, Variables in the fall,and Mixtures and Solutions (henceforth Mixtures) in the spring. The close andproximal assessments were administered before and after the instruction of eachunit, Variables and Mixtures. (See Appendix A for a detailed description of theassessments.)
We selected the six classrooms based on the magnitude of the effect sizes (�)observed (for details see Ruiz-Primo et al. 2002b). Assuming that effect sizesindicated the students’ performance improvement from pretest to posttest, wewanted to take a closer look into those classrooms whose effect size magnitudesindicated not much growth, some growth, and large growth across the two units.Based on the effect sizes observed for the close assessments across the two units,Variables (V) and Mixtures (M), we selected two top-classrooms (Top 1 – �V =1.11, �M = 1.62 and Top 2 – �V = .95, �M = 1.60), two middle-classrooms(Middle 3 – �V = .73, �M = 1.16 and Middle 4 – �V = .62, �M = 1.37), and twolow-classrooms (Low 5 – �V = .60, �M = .66 and Low 6 – �V = . 53, �M = . 59)
Dow
nloa
ded
by [
171.
67.2
16.2
1] a
t 09:
19 2
1 A
ugus
t 201
4

1490 M. A. RUIZ-PRIMO ET AL.
(see figure 1). (A scatterplot of the effect sizes across the two units helped inselecting the classrooms and classifying them on the three levels.)
Teachers reported that they regularly used notebooks in their science classes.No instructions were provided to teachers on how to use science notebooks or onthe characteristics notebooks should have. Students’ notebooks were collected atthe end of the school year. Teachers were asked to sort students into five abilitygroups–from the top 20 percent in the class to the bottom 20 percent–according totheir science classroom performance on each unit. Criteria used for thisclassification were based on the teachers’ own evaluation system.
For each of the six classes we randomly selected notebooks from two top-, twomiddle-, and two low-student groups. Each student in the sample had twonotebooks, one for Variables, generated during the fall, and another one forMixtures, generated during the spring. A total of 72 science notebooks (877 pages),36 for the Variables unit and 36 for the Mixtures, were scored for this study.
Performance assessments scores were available for each student. As mentioned,we administered the close and proximal assessments for each unit before and afterinstruction. Students within each classroom were randomly assigned to one of twosequences of pretest and posttest: (1) close–close or (2) proximal–proximal (forexample, those students who took the close assessment as a pretest, also took theclose assessment as a posttest). The distal assessment was administered to allstudents after instruction in both units during the spring. (Distal performanceassessment scores were provided by the CSIAC project director, KathyComfort.)
Students’ notebook scoring
The scoring materials consisted of two parts: (1) Notebook Scoring Form–averification list that included, as rows, the instructional activities to be considered asevidence that the unit was implemented and, as columns, the aspects to be scored;and (2) a Criteria Table–a table that specifies codes, criteria, and examples to beused in scoring. To score students’ notebooks two scoring forms, one per unit, weredeveloped. The instructional activities specified in the Notebook Scoring Form werebased on the description of the implementation presented in the teacher guide foreach FOSS unit. The Notebook Scoring Form followed the units’ organization: one
Figure 1. Effect size for close performance assessments across units forthe classrooms selected for the study.
Dow
nloa
ded
by [
171.
67.2
16.2
1] a
t 09:
19 2
1 A
ugus
t 201
4

SCIENCE NOTEBOOKS AS ASSESSMENT TOOLS 1491
verification list for each activity and one for assessments suggested in the guide (i.e.,hands-on assessments, pictorial assessments, reflective questions). Each activity-verification list contained different Parts (P) that corresponded to the organizationof the activity (figure 2. As an example, only the first four columns of the scoringform are presented).
For each instructional activity specified on the Notebook Scoring Form, sevenquestions are asked according to the three aspects of the notebook evaluated: (1)Unit Implementation (Is there any evidence that the unit-based instructionalactivity or that an appropriate extra-instructional activity was implemented? Is theactivity sheet/report complete? What type of entry is identified in the evidenceprovided?). (2) Student Performance (Quality of the communication–Is thecommunication appropriate according to the genre at hand? UnderstandingReflected in the Communication–Is there any evidence of conceptual under-standing in the communication? Is there any evidence of procedural understanding
Figure 2. Example of a portion of the notebook scoring form for Activity1, Separating Mixtures, of the Mixtures Unit.
Dow
nloa
ded
by [
171.
67.2
16.2
1] a
t 09:
19 2
1 A
ugus
t 201
4
1492 M. A. RUIZ-PRIMO ET AL.
in the communication?). And (3) Teacher Feedback (Is there any evidence that theteacher provided feedback on the student’s communication?).
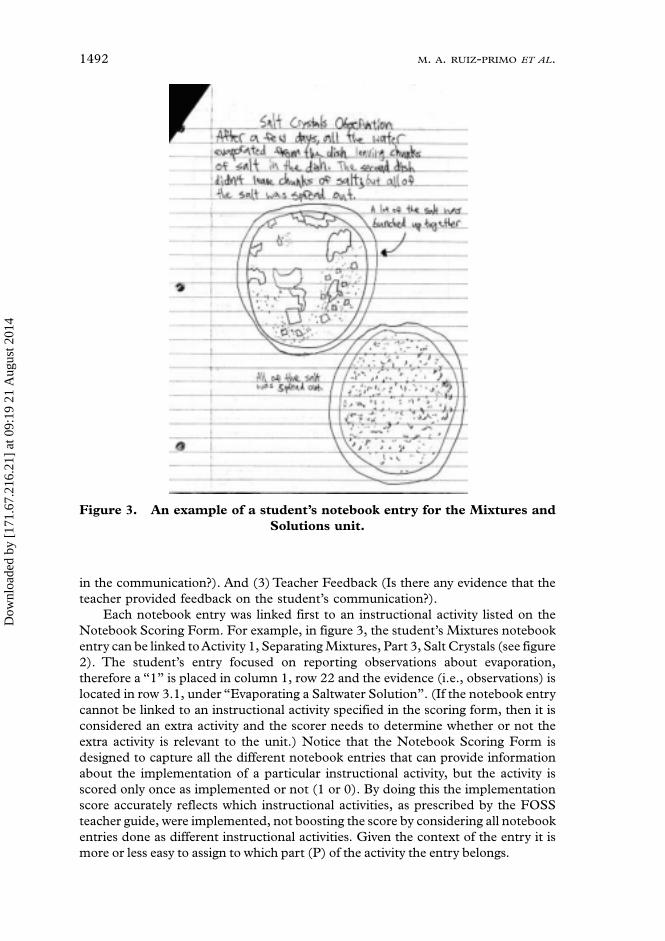
Each notebook entry was linked first to an instructional activity listed on theNotebook Scoring Form. For example, in figure 3, the student’s Mixtures notebookentry can be linked to Activity 1, Separating Mixtures, Part 3, Salt Crystals (see figure2). The student’s entry focused on reporting observations about evaporation,therefore a “1” is placed in column 1, row 22 and the evidence (i.e., observations) islocated in row 3.1, under “Evaporating a Saltwater Solution”. (If the notebook entrycannot be linked to an instructional activity specified in the scoring form, then it isconsidered an extra activity and the scorer needs to determine whether or not theextra activity is relevant to the unit.) Notice that the Notebook Scoring Form isdesigned to capture all the different notebook entries that can provide informationabout the implementation of a particular instructional activity, but the activity isscored only once as implemented or not (1 or 0). By doing this the implementationscore accurately reflects which instructional activities, as prescribed by the FOSSteacher guide, were implemented, not boosting the score by considering all notebookentries done as different instructional activities. Given the context of the entry it ismore or less easy to assign to which part (P) of the activity the entry belongs.
Figure 3. An example of a student’s notebook entry for the Mixtures andSolutions unit.
Dow
nloa
ded
by [
171.
67.2
16.2
1] a
t 09:
19 2
1 A
ugus
t 201
4

SCIENCE NOTEBOOKS AS ASSESSMENT TOOLS 1493
Once a notebook entry was linked to an instructional activity, the next step wasto identify the type of entry it reflected. In our example, the type of entry can beidentified as “Reporting results, verbal”. Therefore, Code “6” (see table 1) waswritten in Column 3, Row 25–3.1. Once the type of entry was identified, we scoredquality of communication (Column 4), conceptual understanding if appropriate(Column 5), procedural understanding if appropriate (Column 6), and teacherfeedback (Column 7 for feedback). If a student’s communication was scored “0” wedid not attempt to score the student’s understanding.
The shaded boxes (figure 2) in the Notebook Scoring Form mean that thecriteria do not apply to the notebook entries in hand. For example, the criterion,“Completeness of Report,” only applies to the “Activity Sheet”. Activity sheets areprovided by FOSS for students to fill out for each activity and they are consideredan essential piece of the implementation of any unit activity.
Types of scores
Five types of scores were obtained with the approach: unit implementation, qualityof communication, conceptual understanding, procedural understanding, andteacher feedback. Unit implementation and teacher feedback scores were the sum ofscores obtained for each notebook entry identified whereas the three studentperformance scores were mean scores (that is, the sum score divided by the numberof entries identified in each student’s notebook; Li et al. 2000). The advantage ofthese “mean scores” was that they shared the same scale (from 0 to 3) making it easyto compare the level of a student’s performance on the different aspects.
Results
Analyses focused on two main issues: (1) The technical quality of the notebookassessment–Can different raters reliably score student’s science notebooks? Canscores on quality of communication, conceptual understanding, and proceduralunderstanding be interpreted as reflecting students’ academic performance? And,do notebook scores bearing on student performance correlate positively with othermeasures of their performance? And (2) students’ improvement over a course of theschool year using notebooks as an assessment tool.
Reliability
Eighteen of the 72 notebooks (236 pages) were used to train and calibrate scorers.After training, 24 notebooks (394 notebook pages), 12 from Variables and 12 fromMixtures, were scored by three independent raters. Notebooks were sampled acrossclassrooms and students’ performance level. We evaluated interrater agreement inclassifying notebook entries according to entry type. Also, interrater reliability wascalculated for each score across units (table 5). Results are consistent with ourprevious studies (Ruiz-Primo et al. 1999, Li et al. 2000). In general the magnitudeof the coefficients were high across types of scores. Magnitudes were lower forstudent performance scores than for implementation and teacher feedback scores.
We interpreted these results as evidence that despite the variability in thenumber and type of entries in a notebook and the diversity of the forms ofcommunications (written, schematic or pictorial), raters consistently identified
Dow
nloa
ded
by [
171.
67.2
16.2
1] a
t 09:
19 2
1 A
ugus
t 201
4
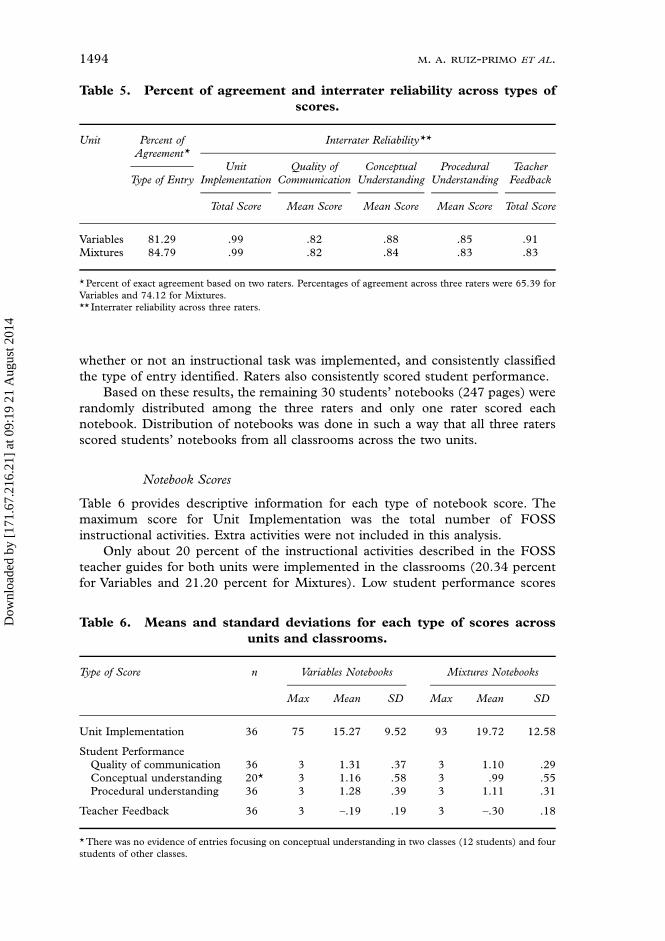
1494 M. A. RUIZ-PRIMO ET AL.
whether or not an instructional task was implemented, and consistently classifiedthe type of entry identified. Raters also consistently scored student performance.
Based on these results, the remaining 30 students’ notebooks (247 pages) wererandomly distributed among the three raters and only one rater scored eachnotebook. Distribution of notebooks was done in such a way that all three ratersscored students’ notebooks from all classrooms across the two units.
Notebook Scores
Table 6 provides descriptive information for each type of notebook score. Themaximum score for Unit Implementation was the total number of FOSSinstructional activities. Extra activities were not included in this analysis.
Only about 20 percent of the instructional activities described in the FOSSteacher guides for both units were implemented in the classrooms (20.34 percentfor Variables and 21.20 percent for Mixtures). Low student performance scores
Table 5. Percent of agreement and interrater reliability across types ofscores.
Unit Percent ofAgreement*
Type of Entry
Interrater Reliability**
UnitImplementation
Total Score
Quality ofCommunication
Mean Score
ConceptualUnderstanding
Mean Score
ProceduralUnderstanding
Mean Score
TeacherFeedback
Total Score
Variables 81.29 .99 .82 .88 .85 .91Mixtures 84.79 .99 .82 .84 .83 .83
* Percent of exact agreement based on two raters. Percentages of agreement across three raters were 65.39 forVariables and 74.12 for Mixtures.** Interrater reliability across three raters.
Table 6. Means and standard deviations for each type of scores acrossunits and classrooms.
Type of Score n Variables Notebooks
Max Mean SD
Mixtures Notebooks
Max Mean SD
Unit Implementation 36 75 15.27 9.52 93 19.72 12.58
Student PerformanceQuality of communication 36 3 1.31 .37 3 1.10 .29Conceptual understanding 20* 3 1.16 .58 3 .99 .55Procedural understanding 36 3 1.28 .39 3 1.11 .31
Teacher Feedback 36 3 –.19 .19 3 –.30 .18
* There was no evidence of entries focusing on conceptual understanding in two classes (12 students) and fourstudents of other classes.
Dow
nloa
ded
by [
171.
67.2
16.2
1] a
t 09:
19 2
1 A
ugus
t 201
4

SCIENCE NOTEBOOKS AS ASSESSMENT TOOLS 1495
across units revealed that students’ communication skills were not well developedand that students only partially understood the different topics addressed in theunits. Teacher feedback scores were negative across the two units, meaning thatteachers tended not to provide feedback to students despite errors or misconcep-tions that were evident in the students’ communications. In fact, no teacherfeedback was provided in any of the students’ notebooks in this sample. (Only inone notebook entry in one student’s notebook did we find evidence of feedback. Theteacher only corrected student’s spelling errors). If one aspect of good teaching isinformative feedback, this finding says something about the quality of instructionthese students received. Since no teacher feedback was provided, we only focus onunit implementation and student performance scores.
Validity
The validity analysis focused on the following issues: If scores on quality ofcommunication, conceptual understanding, and procedural understanding can beinterpreted as reflecting students’ academic performance, they should correlatepositively with one another. And, if notebook scores bear on student performance,they should correlate positively with other measures of their performance.
Correlations among student performance scores
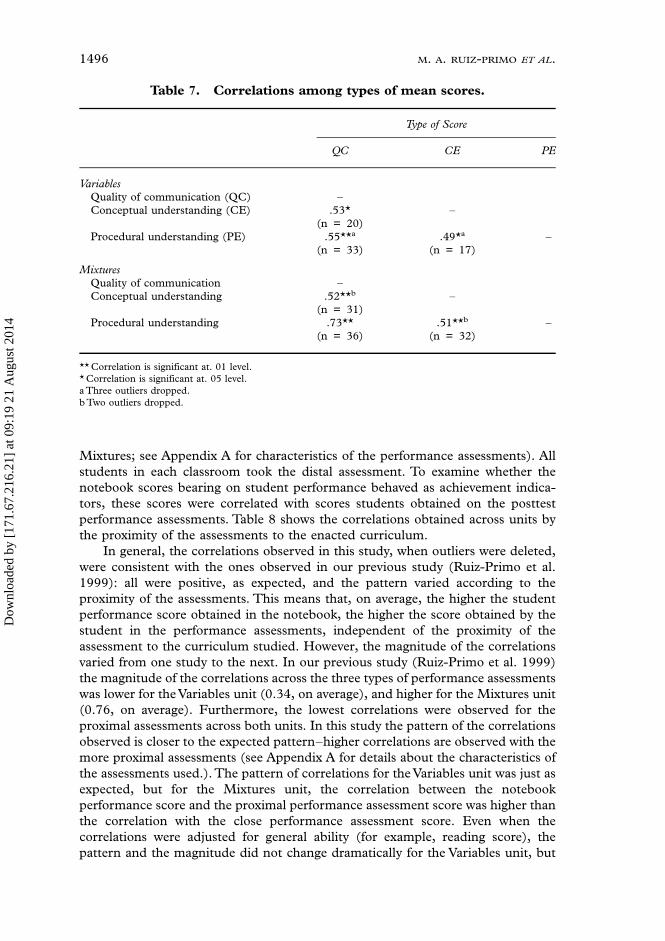
If quality of communication, conceptual understanding, and procedural under-standing are related, we should expect positive correlations among the three typesof scores. However, if they are not tapping overlapping aspects of achievement, thedirection may not be positive and the magnitude of the correlations should not behigh.
We found positive correlations (table 7). (We acknowledge that since the samplesize is not very large, deviant scores could change the magnitude of the correlations.Therefore, we checked every scatterplot to decide whether or not to delete a case.)The magnitude of the correlations (0.49–0.73) indicated that the three aspects wererelated but still tapping somewhat different aspects of student performance. Thecorrelation between quality of communication and procedural understanding wasthe highest in magnitude, especially in the Mixtures unit. This was probably due tothe type of entries that Mixtures notebooks had. Entries that focused more onprocess skills require better communication skills than those focusing on definitionsor examples.
Based on the magnitudes of the correlations, we concluded that the scoringsystem tapped, as claimed, somewhat different aspects of the student achievement.Still, since we wanted to create a composite score that reflected a student’s overallperformance, we averaged the three scores and created a total score for studentperformance, named simply, “student performance score.” We used this score, witha maximum of 3, in the rest of the analyses.
Notebook student performance scores as achievement indicators
As mentioned, students within each classroom were randomly assigned to one of thetwo types of performance assessments (i.e., close or proximal assessments)administered before and after the instruction of the units (i.e., Variables and
Dow
nloa
ded
by [
171.
67.2
16.2
1] a
t 09:
19 2
1 A
ugus
t 201
4
1496 M. A. RUIZ-PRIMO ET AL.
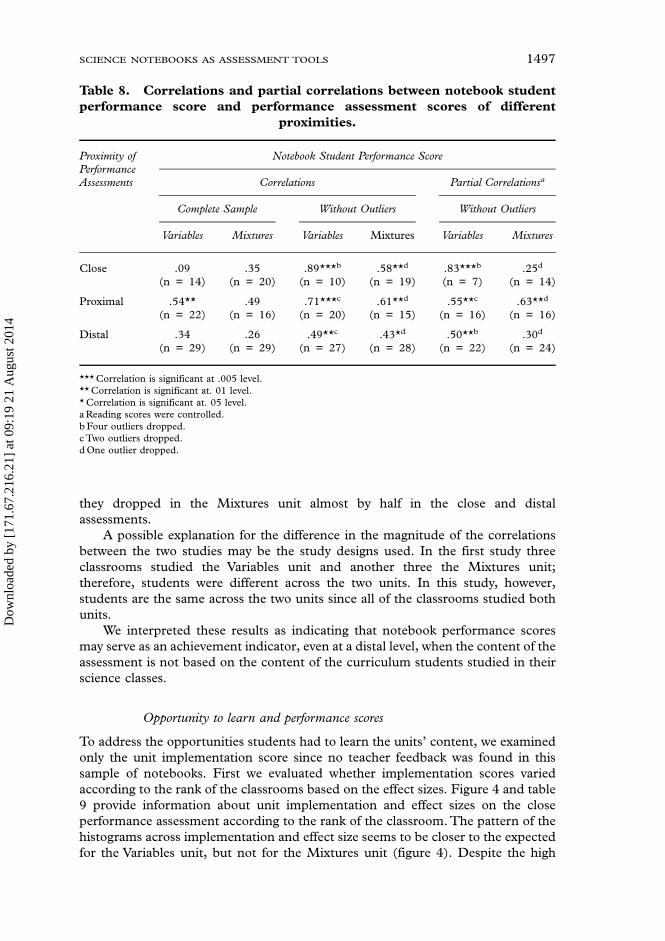
Mixtures; see Appendix A for characteristics of the performance assessments). Allstudents in each classroom took the distal assessment. To examine whether thenotebook scores bearing on student performance behaved as achievement indica-tors, these scores were correlated with scores students obtained on the posttestperformance assessments. Table 8 shows the correlations obtained across units bythe proximity of the assessments to the enacted curriculum.
In general, the correlations observed in this study, when outliers were deleted,were consistent with the ones observed in our previous study (Ruiz-Primo et al.1999): all were positive, as expected, and the pattern varied according to theproximity of the assessments. This means that, on average, the higher the studentperformance score obtained in the notebook, the higher the score obtained by thestudent in the performance assessments, independent of the proximity of theassessment to the curriculum studied. However, the magnitude of the correlationsvaried from one study to the next. In our previous study (Ruiz-Primo et al. 1999)the magnitude of the correlations across the three types of performance assessmentswas lower for the Variables unit (0.34, on average), and higher for the Mixtures unit(0.76, on average). Furthermore, the lowest correlations were observed for theproximal assessments across both units. In this study the pattern of the correlationsobserved is closer to the expected pattern–higher correlations are observed with themore proximal assessments (see Appendix A for details about the characteristics ofthe assessments used.). The pattern of correlations for the Variables unit was just asexpected, but for the Mixtures unit, the correlation between the notebookperformance score and the proximal performance assessment score was higher thanthe correlation with the close performance assessment score. Even when thecorrelations were adjusted for general ability (for example, reading score), thepattern and the magnitude did not change dramatically for the Variables unit, but
Table 7. Correlations among types of mean scores.
Type of Score
QC CE PE
VariablesQuality of communication (QC) –Conceptual understanding (CE) .53* –
(n = 20)Procedural understanding (PE) .55**a .49*a –
(n = 33) (n = 17)
MixturesQuality of communication –Conceptual understanding .52**b –
(n = 31)Procedural understanding .73** .51**b –
(n = 36) (n = 32)
** Correlation is significant at. 01 level.* Correlation is significant at. 05 level.a Three outliers dropped.b Two outliers dropped.
Dow
nloa
ded
by [
171.
67.2
16.2
1] a
t 09:
19 2
1 A
ugus
t 201
4
SCIENCE NOTEBOOKS AS ASSESSMENT TOOLS 1497
they dropped in the Mixtures unit almost by half in the close and distalassessments.
A possible explanation for the difference in the magnitude of the correlationsbetween the two studies may be the study designs used. In the first study threeclassrooms studied the Variables unit and another three the Mixtures unit;therefore, students were different across the two units. In this study, however,students are the same across the two units since all of the classrooms studied bothunits.
We interpreted these results as indicating that notebook performance scoresmay serve as an achievement indicator, even at a distal level, when the content of theassessment is not based on the content of the curriculum students studied in theirscience classes.
Opportunity to learn and performance scores
To address the opportunities students had to learn the units’ content, we examinedonly the unit implementation score since no teacher feedback was found in thissample of notebooks. First we evaluated whether implementation scores variedaccording to the rank of the classrooms based on the effect sizes. Figure 4 and table9 provide information about unit implementation and effect sizes on the closeperformance assessment according to the rank of the classroom. The pattern of thehistograms across implementation and effect size seems to be closer to the expectedfor the Variables unit, but not for the Mixtures unit (figure 4). Despite the high
Table 8. Correlations and partial correlations between notebook studentperformance score and performance assessment scores of different
proximities.
Proximity ofPerformanceAssessments
Notebook Student Performance Score
Correlations
Complete Sample
Variables Mixtures
Without Outliers
Variables Mixtures
Partial Correlationsa
Without Outliers
Variables Mixtures
Close .09 .35 .89***b .58**d .83***b .25d
(n = 14) (n = 20) (n = 10) (n = 19) (n = 7) (n = 14)
Proximal .54** .49 .71***c .61**d .55**c .63**d
(n = 22) (n = 16) (n = 20) (n = 15) (n = 16) (n = 16)
Distal .34 .26 .49**c .43*d .50**b .30d
(n = 29) (n = 29) (n = 27) (n = 28) (n = 22) (n = 24)
*** Correlation is significant at .005 level.** Correlation is significant at. 01 level.* Correlation is significant at. 05 level.a Reading scores were controlled.b Four outliers dropped.c Two outliers dropped.d One outlier dropped.
Dow
nloa
ded
by [
171.
67.2
16.2
1] a
t 09:
19 2
1 A
ugus
t 201
4

1498 M. A. RUIZ-PRIMO ET AL.
implementation mean score for the middle-classes in this unit, students did notperform in the performance assessment as well as it would be expected (table 9). Insum, high implementation mean scores were not always associated with highclassroom performance. These results were not consistent with what we observedbefore. In our previous study (Ruiz-Primo et al. 1999) we found that those
Figure 4. Histograms comparing unit implementation and close perform-ance assessments effect sizes across units.
Table 9. Unit implementation mean score across units and classrooms.
Class Rank* n
Unit Implementation Score
Variables(Max = 75)
Mean SD
Mixtures(Max = 93)
Mean SD
Top 12 25.06 5.70 13.69 5.38Middle 12 9.75 2.78 29.13 12.56Low 12 11.00 9.53 16.33 12.96All 36 15.27 9.53 19.72 12.58
* Rank based on effect sizes observed across the two units.
Dow
nloa
ded
by [
171.
67.2
16.2
1] a
t 09:
19 2
1 A
ugus
t 201
4

SCIENCE NOTEBOOKS AS ASSESSMENT TOOLS 1499
classrooms in which more instructional activities were implemented, higherperformance assessment scores were observed.
The issue, then, might be not on how much was implemented, but the qualityof the implementation. To explore some aspects of quality of implementation weanalyzed the type of activities done in the classrooms as reflected in the students’notebooks. Was there a difference in the activities carried out in the classroomsaccording to their rank? Across the three groups the types of activities mostfrequently found were “reporting data” (on average, 38.11 percent of the notebookentries in the Variables notebooks and 40.83 percent in the Mixtures notebooks),“definitions” (on average, 22.92 percent in the Variables notebooks and 22.90percent in the Mixtures notebooks), and “short-answer questions” (on average,8.17 percent in the Variables notebooks and 18.90 percent in the Mixturesnotebooks). (See Appendix B for number of entries by classroom and unit.) Thedifferences across the three groups of classroom were observed more clearly in othertypes of activities. For example, the top classrooms had a higher percentage ofentries under the category of “applying concepts” (for example, 7.92 percent in theMixtures unit, versus 1.31 percent on average for the other two classroom groups),“predicting/hypothesizing” (for example, 2.04 percent in the Variables unit, versus0 percent for the other two groups), and “interpreting data/concluding” (forexample, 4.08 percent in the Variables unit, versus 0.98 percent on average for theother two classroom groups). It seems that students from top classrooms hadslightly better opportunities to explore other types of activities that might helpedthem improve understanding, than students from the other two groups.
Differences in performance across units
A final issue to consider is whether students improved their performance over thecourse of instruction during the school year. It is clear that the content of the unitsdiffered (Variables was taught in the fall and Mixtures in the spring), so it might bedifficult to compare students’ understanding from one unit to the next. However,students’ communication skills should improve over the course of the school year.That is, independent of science unit content, students should, for example, improvethe quality of their reports of an experiment or data collected.
To assess the difference between communication skills across the two units, wecarried out an overall- (that is, across all classrooms) and within classroom-dependent t-tests (table 10). Results of the overall t-test indicated a significantdifference in the quality of communication score (t = 3.12; p = 0.004).Unfortunately, the means for quality of communication was lower for the Mixturesnotebooks, taught during the spring, than for Variables notebooks, taught in thefall.
Overall, students’ quality of communications not only did not improve, butperformance decreased over the course of instruction. At the class level, the patternof means was reproduced–quality of communication mean score was higher forVariables than for the Mixtures. However, only in Classroom 1, one of the two topclassrooms, the difference was significant (t = 8.57, p = 0.000; see table 10). Ifdefinitions, reporting data, and short-answer questions were the type of entries mostfrequently found in students’ notebooks across the Variables and Mixtures units, itshould be expected that those entries that focused on reporting data be of muchhigher quality, assuming appropriate attention and feedback was provided to
Dow
nloa
ded
by [
171.
67.2
16.2
1] a
t 09:
19 2
1 A
ugus
t 201
4
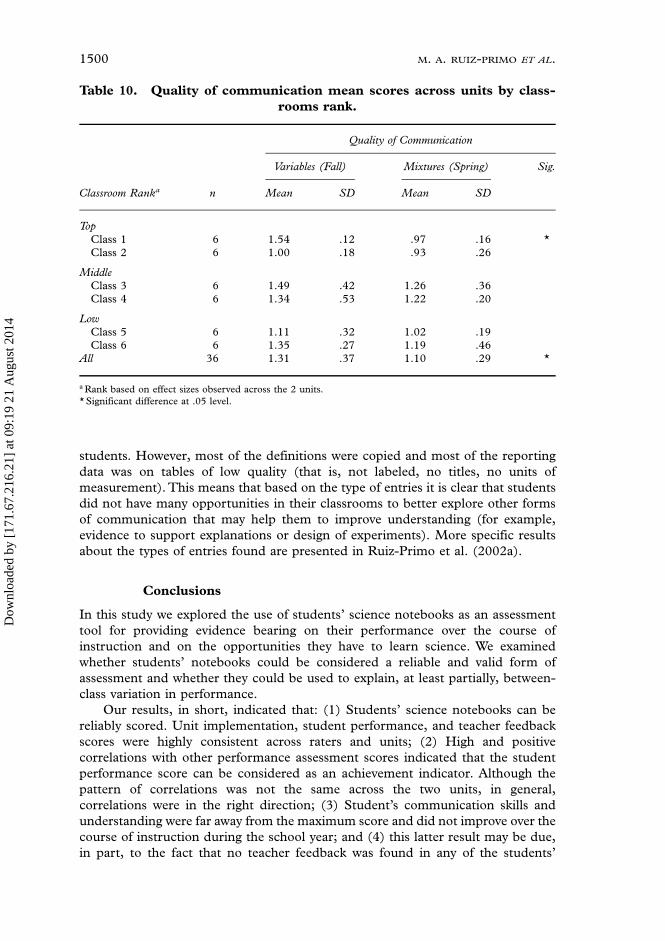
1500 M. A. RUIZ-PRIMO ET AL.
students. However, most of the definitions were copied and most of the reportingdata was on tables of low quality (that is, not labeled, no titles, no units ofmeasurement). This means that based on the type of entries it is clear that studentsdid not have many opportunities in their classrooms to better explore other formsof communication that may help them to improve understanding (for example,evidence to support explanations or design of experiments). More specific resultsabout the types of entries found are presented in Ruiz-Primo et al. (2002a).
Conclusions
In this study we explored the use of students’ science notebooks as an assessmenttool for providing evidence bearing on their performance over the course ofinstruction and on the opportunities they have to learn science. We examinedwhether students’ notebooks could be considered a reliable and valid form ofassessment and whether they could be used to explain, at least partially, between-class variation in performance.
Our results, in short, indicated that: (1) Students’ science notebooks can bereliably scored. Unit implementation, student performance, and teacher feedbackscores were highly consistent across raters and units; (2) High and positivecorrelations with other performance assessment scores indicated that the studentperformance score can be considered as an achievement indicator. Although thepattern of correlations was not the same across the two units, in general,correlations were in the right direction; (3) Student’s communication skills andunderstanding were far away from the maximum score and did not improve over thecourse of instruction during the school year; and (4) this latter result may be due,in part, to the fact that no teacher feedback was found in any of the students’
Table 10. Quality of communication mean scores across units by class-rooms rank.
Classroom Ranka n
Quality of Communication
Variables (Fall)
Mean SD
Mixtures (Spring)
Mean SD
Sig.
TopClass 1 6 1.54 .12 .97 .16 *Class 2 6 1.00 .18 .93 .26
MiddleClass 3 6 1.49 .42 1.26 .36Class 4 6 1.34 .53 1.22 .20
LowClass 5 6 1.11 .32 1.02 .19Class 6 6 1.35 .27 1.19 .46
All 36 1.31 .37 1.10 .29 *
a Rank based on effect sizes observed across the 2 units.* Significant difference at .05 level.
Dow
nloa
ded
by [
171.
67.2
16.2
1] a
t 09:
19 2
1 A
ugus
t 201
4

SCIENCE NOTEBOOKS AS ASSESSMENT TOOLS 1501
notebooks. Therefore, there was no effort to close the gap between the studentperformance at the time that a notebook entry was produced and the desiredperformance.
Overall, our approach for assessing students’ science notebooks is promising inits capacity to describe important aspects of student performance and opportunityto learn in science. The technical quality of the notebook scores is adequate.Although interrater reliability and agreement was appropriate, the scoring approachcan be improved to reduce scoring time and improve consistency between raters.The three aspects of student performance–quality of communication, conceptualunderstanding, and procedural understanding–correlated positively and moder-ately. Therefore, this distinction seems to be pertinent and should be maintained inscoring the next set of data. The results indicated that the notebook studentperformance and opportunity to learn scores have the potential of being educationalindicators of classroom practice and student achievement. Notebook scorescorrelated high and positively with other achievement measures (that is, scienceperformance assessments).
Our findings also appeared useful in suggesting areas for professionaldevelopment. It is clear that keeping a science notebook is a wide spread teachingscience practice. All the classrooms in which we have collected information usedscience notebooks. (It is important to remember that teachers who have participatedin our studies were not trained on how to use science notebooks or were not askedto create them for these studies.) However, the main issue is how science notebooksare used.
Results from our studies indicated that writing in science notebooks wasmainly mechanical. Almost for every instructional activity, students were asked towrite down the procedure used and the results found. As mentioned, the qualityof the descriptions was poor. Procedures were hardly replicable, results werealmost never organized in a way that could help students to find patterns, andalmost never were used as evidence in explanations or conclusions. Furthermore,explanations and conclusions were difficult to find across students’ notebooks andclassrooms.
Science notebooks can assist students’ thinking, reasoning, and problemsolving if used appropriately. The ongoing accurate and systematic documentationof the development of ideas, concepts, and procedures is a powerful scientific toolfor replicating studies, for discussing and validating findings, and developing modelsand theories; in sum, for developing scientific inquiry. Furthermore, it has beendemonstrated that writing in science in an appropriate, purposeful, and relevantway can improve students’ learning and understanding (Lemke 1990, Martin 1989,1993, Rivard 1994). Unfortunately, teachers in our sample were not using sciencenotebooks in an efficient and effective manner to help students improve theirperformance and understanding in science. Students’ notebooks hardly had entriesfocused on the understanding of the concepts learned that day. The only entryrelated to the concepts learned were definitions, mainly copied from the textbook ora dictionary. Students were never asked, for example, to contrast and compareconcepts (for example, mixtures and solutions), or to apply them in differentcontexts (to improve transferability of knowledge). In sum, notebook entries werenot intellectually challenging or coherent. Notebook entries were mainly a set ofunconnected activities within each unit that could hardly reflect an alignmentbetween the tasks and the unit goals.
Dow
nloa
ded
by [
171.
67.2
16.2
1] a
t 09:
19 2
1 A
ugus
t 201
4

1502 M. A. RUIZ-PRIMO ET AL.
The fact that teacher feedback was not found in any of the classrooms scored forthis study, tells something about the teachers’ classroom assessment practices.Some readers may argue that feedback might be provided verbally during thediscussion of the notebook entries in the class. If this was true, and we are sure insome cases it was, why was there no improvement on students’ communicationsover the course of instructions? How much do teachers know about effectivefeedback and its impact in improving students learning (for example, Black andWiliam 1998, Sadler 1989, 1998)? Time constraints may be an argument thatalmost any teacher can make for not providing feedback to students. To overcomethis problem, we believe that first teachers need to carefully select the type of entryto work with students. (Which types of entries are useful and effective for promotingunderstanding, scientific inquiry, and improving performance?) Second, teachersneed to think of options for assisting their assessment practices and helping studentsmoving toward self-monitoring (for example, self- and peer-assessment, Sadler1989). Third, the educators and research community need to think carefully abouthow science notebooks can be conceptualized, implemented, and assessed in formsthat most effectively reflect their main purpose. If science notebooks are to be usedas an unobtrusive assessment tool we need to make an effort to help teacherscoordinate the power of purposeful recording and thoughtful reflection aboutstudents’ work with helping students improve their understanding and perform-ance, as well as the meaning of science inquiry.
References
AUDET, R. H., HICKMAN, P. and DOBRYNINA, G. (1996). Learning logs: A classroom practice forenhancing scientific sense making. Journal of Research in Science Teaching, 33(2),205–222.
BLACK, P. (1993). Formative and summative assessment by teachers. Studies in Science Education,21, 49–97.
BLACK, P. and WILIAM, D. (1998). Assessment and classroom learning. Assessment in Education,5(1), 7–74.
BUTLER, R. (1987). Task involving and ego-involving properties of evaluation: effects of differentfeedback conditions on motivational perceptions, interest, and performance. Journal ofEducational Psychology, 79(4), 474–482.
BYBEE, R. W. (1996). The contemporary reform of science education. In J. Rhoten and P. Bowers(Eds.), Issues in science education (Arlington, VA), 1–14.
DANA, T. M., LORSBACH, A. W., HOOK, K. and BRISCOE, C. (1991). Students showing what theyknow: a look at alternative assessments. In G. Kulm and S. M. Malcom (Eds.), Scienceassessment in the service of reform (Washington, DC: American Association for theAdvancement of Science), 331–337.
DUSCHL, R. (2003). Assessment of inquiry. In M. Atkin and J. E. Coffey (Eds.), Everydayassessment in the science classroom (Arlington, VA: NSTA press), 41–59.
FELLOWS, N. (1994). A window into thinking: using student writing to understand conceptualchange in science learning. Journal of Research in Science Teaching, 31(9), 985–1001.
FULL OPTION SCIENCE SYSTEM (1993). Britannica science system (Chicago, IL: EncyclopaediaBritannica Educational Corporation).
HALLIDAY, M. A. K. and MARTIN, J. R. (1993) (Eds.). Writing science: literacy and discursive power(Pittsburgh, PA: University of Pittsburgh Press), 166–202.
HANRAHAN, M. (1999). Rethinking science literacy: enhancing communication and participationin school science through affirmational dialogue journal writing. Journal of Research inScience Teaching, 36(6), 699–717.
HEINMILLER, B. (2000). Assessing student learning–and my teaching–through student journals.Eisenhower National Clearinghouse web page: www.enc.org/focus/topics/assessment/arti-cles/a06/index.htm.
Dow
nloa
ded
by [
171.
67.2
16.2
1] a
t 09:
19 2
1 A
ugus
t 201
4

SCIENCE NOTEBOOKS AS ASSESSMENT TOOLS 1503
HEWITT, H. C. (1974). The journal. Science and Children, 11(8), 30–31.KEYS, C. W. (1999). Language as an indicator of meaning generation: an analysis of middle school
students’ written discourse about scientific investigations. Journal of Research in ScienceTeaching, 36(9), 1044–1061.
LEMKE, J. L. (1990). Talking science. Language, learning and values (Norwood, NJ: Ablex PublishingCorporation).
LI, M., RUIZ-PRIMO, M. A., AYALA, C. and SHAVELSON, R. J. (2000, April). Study of the reliabilityand validity of inferring students’ understanding from their science journals. Paper presented atthe AERA Annual Meeting. New Orleans, LA.
LOZAUKAS, D., and BARELL, J. (1992). Reflective reading. A journal for inquiring minds. TheScience Teacher, 59(8), 42–45.
LUCIDO, H. (1992). Physics for mastery. The Physics Teacher, 30, 96–101.MARKS, G. and MOUSLEY, J. (1990). Mathematics education and genre: dare we make the process
writing mistake again? Language and Education, 4(2), 117–135.MARTIN, J. R. (1989). Factual writing: exploring and challenging social reality (Oxford: Oxford
University Press).MARTIN, J. R. (1993). Literacy in science: learning to handle text as technology. In M.A.K.
Halliday and J.R. Martin (Eds.), Writing science: literacy and discursive power (Pittsburgh, PA:University of Pittsburgh Press), 166–202.
MCCOLSKEY, W. and O’SULLIVAN, R. (1993). How to assess student performance in science: goingbeyond multiple-choice tests (Tallahassee, FL: Southeastern Regional Vision for Education(SERVE)).
NATIONAL RESEARCH COUNCIL (1995). National science education standards. (Washington, DC:National Research Council).
PENROSE, A. and KATZ, S. (1998). Writing in the sciences (New York: St. Martin’s Press).RIVARD, L. P. (1994). A review of writing to learn in science: implications for practice and research.
Journal of Research in Science Teaching, 31(9), 969–983.RUIZ-PRIMO, M. A. (1998). On the use of students’ science journals as an assessment tool: a scoring
approach (Stanford University, CA: School of Education).RUIZ-PRIMO, M. A. and SHAVELSON, R. J. (1996a). Problems and issues in the use of concept maps
in science assessment. Journal of Research in Science Teaching, 33(6), 569–600.RUIZ-PRIMO, M. A. and SHAVELSON, R. J. (1996b). Rhetoric and reality in science performance
assessments: an update. Journal of Research in Science Teaching, 33(10), 1045–1063.RUIZ-PRIMO, M. A., LI, M., AYALA, C. and SHAVELSON, R. J. (1999, March). Student science
journals and the evidence they provide: classroom learning and opportunity to learn. Paperpresented at the NARST Annual Meeting. Boston, MA.
RUIZ-PRIMO, M. A., LI, M. and SHAVELSON, R. J. (2002a). Looking into students’ science notebooks:what do teachers do with them? Paper submitted for publication.
RUIZ-PRIMO, M. A., SHAVELSON, R. J., HAMILTON, L. and KLEIN, S. (2002b). On the evaluationof systemic education reform: searching for instructional sensitivity. Journal of Research inScience Teaching, 39(5), 369–393.
SADLER, R. D. (1989). Formative assessment and the design of instructional systems. InstructionalScience, 18, 119–144.
SADLER, R. D. (1998). Formative assessment: revisiting the territory. Assessment in Education, 5(1),77–84.
SHEPARDSON, D. P. and BRITSCH, S. J. (1997). Children’s science journals: tool for teaching,learning, and assessing. Science and Children, 34(5), 13–17, 46–47.
SOLANO-FLORES, G. and SHAVELSON, R. J. (1997). Development of performance assessments inscience: conceptual, practical, and logistical issues. Educational Measurement: Issues andPractices, 16, 16–25.
STECHER, B. M. and KLEIN, S. P. (1995). Performance assessment in science: hands-on tasks andscoring guides (Technical Report DRU-1087-NSF) (Santa Monica, CA: RANDCorporation).
WIGGINS, G. P. (1993). Assessing student performance. Exploring the purpose and limits of testing (SanFrancisco, CA: Jossey-Bass Publishers).
Dow
nloa
ded
by [
171.
67.2
16.2
1] a
t 09:
19 2
1 A
ugus
t 201
4

1504 M. A. RUIZ-PRIMO ET AL.
Appendix A: description of the performance assessments byproximity to the curriculum
To provide an idea of what close, proximal, and distal assessments are, we brieflydescribe the units and the assessments used. In the Variables unit students designand conduct experiments; describe the relationship between variables discoveredthrough experimentation; record, graph and interpret data; and use these data tomake predictions. Students identify, control variables, and conduct experimentsusing four multivariable systems, each corresponding to an activity: Swingers,Lifeboats, Plane Sense and Flippers. Students construct all of the system they use.For example, in the Swingers activity students construct a pendulum and in theLifeboats, they construct boats of different capacity with paper cups.
In the Mixture unit students gain experience with the concepts of mixtures andsolutions, saturation, concentration, and chemical reaction. One concept is thefocus of each activity in the unit: Separating Mixtures, Reaching Saturation,Concentration and Fizz Quiz. During the unit students make up mixtures andsolutions, use different methods to separate mixtures, determine the amountrequired to saturate certain volume of water, determine the relative concentrationsof several solutions, and observe changes in substances by mixing solutions.
The table below provides a brief description of the assessments of differentproximity by unit. To establish the proximity of the assessment tasks to the centralcharacteristics of the curriculum, we judged their goals, content, and character-istics. For details about the assessments see Ruiz-Primo et al. (2002b).
Dow
nloa
ded
by [
171.
67.2
16.2
1] a
t 09:
19 2
1 A
ugus
t 201
4
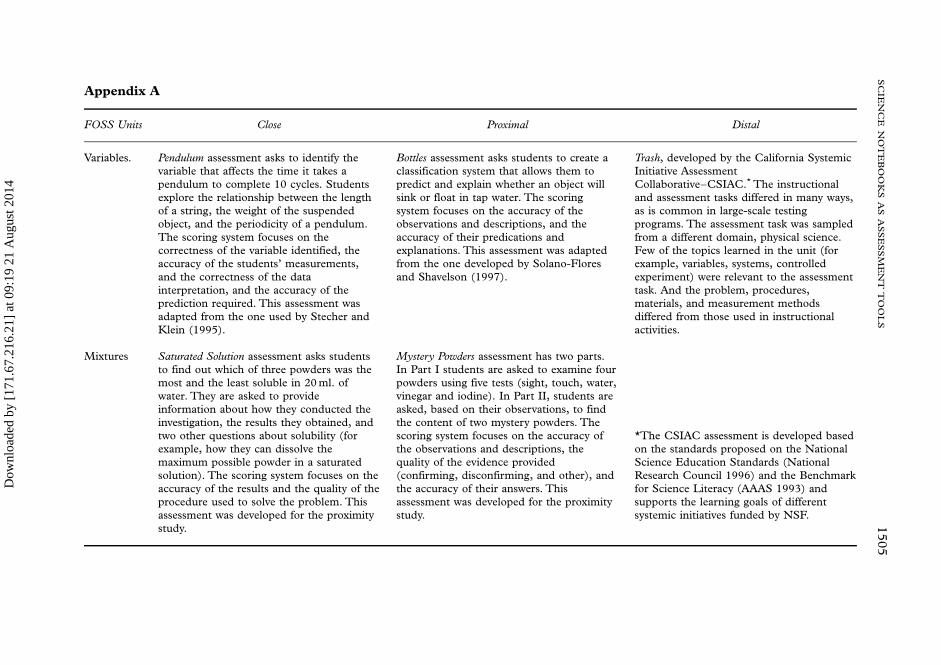
SC
IEN
CE
NO
TE
BO
OK
SA
SA
SS
ES
SM
EN
TT
OO
LS
1505
Appendix A
FOSS Units Close Proximal Distal
Variables. Pendulum assessment asks to identify thevariable that affects the time it takes apendulum to complete 10 cycles. Studentsexplore the relationship between the lengthof a string, the weight of the suspendedobject, and the periodicity of a pendulum.The scoring system focuses on thecorrectness of the variable identified, theaccuracy of the students’ measurements,and the correctness of the datainterpretation, and the accuracy of theprediction required. This assessment wasadapted from the one used by Stecher andKlein (1995).
Bottles assessment asks students to create aclassification system that allows them topredict and explain whether an object willsink or float in tap water. The scoringsystem focuses on the accuracy of theobservations and descriptions, and theaccuracy of their predications andexplanations. This assessment was adaptedfrom the one developed by Solano-Floresand Shavelson (1997).
Trash, developed by the California SystemicInitiative AssessmentCollaborative–CSIAC.* The instructionaland assessment tasks differed in many ways,as is common in large-scale testingprograms. The assessment task was sampledfrom a different domain, physical science.Few of the topics learned in the unit (forexample, variables, systems, controlledexperiment) were relevant to the assessmenttask. And the problem, procedures,materials, and measurement methodsdiffered from those used in instructionalactivities.
Mixtures Saturated Solution assessment asks studentsto find out which of three powders was themost and the least soluble in 20 ml. ofwater. They are asked to provideinformation about how they conducted theinvestigation, the results they obtained, andtwo other questions about solubility (forexample, how they can dissolve themaximum possible powder in a saturatedsolution). The scoring system focuses on theaccuracy of the results and the quality of theprocedure used to solve the problem. Thisassessment was developed for the proximitystudy.
Mystery Powders assessment has two parts.In Part I students are asked to examine fourpowders using five tests (sight, touch, water,vinegar and iodine). In Part II, students areasked, based on their observations, to findthe content of two mystery powders. Thescoring system focuses on the accuracy ofthe observations and descriptions, thequality of the evidence provided(confirming, disconfirming, and other), andthe accuracy of their answers. Thisassessment was developed for the proximitystudy.
*The CSIAC assessment is developed basedon the standards proposed on the NationalScience Education Standards (NationalResearch Council 1996) and the Benchmarkfor Science Literacy (AAAS 1993) andsupports the learning goals of differentsystemic initiatives funded by NSF.
Dow
nloa
ded
by [
171.
67.2
16.2
1] a
t 09:
19 2
1 A
ugus
t 201
4

1506 SCIENCE NOTEBOOKS AS ASSESSMENT TOOLS
Appendix B: Number of entries by class and unit
Classroom Rank n Unit
Variables Mixtures
TopClass 1 6 197 119Class 2 6 209 78
MiddleClass 3 6 72 119Class 4 6 90 167
LowClass 5 6 52 65Class 6 6 135 147
All 36 755 695
Dow
nloa
ded
by [
171.
67.2
16.2
1] a
t 09:
19 2
1 A
ugus
t 201
4