Evaluating air quality with and without air fresheners
13
1 Evaluating air quality with and without air fresheners Nigel Goodman a,* , Neda Nematollahi a,c , Giovanni Agosti d , Anne Steinemann a,b a Department of Infrastructure Engineering, School of Engineering, The University of Melbourne, Parkville VIC 3010 Australia b College of Science and Engineering, James Cook University, Townsville QLD 4811 Australia c School of Chemistry, The University of Melbourne, Parkville VIC 3010 Australia d Envirolab Group Laboratories, 12 Ashley Street, Chatswood, NSW 2067 Australia * Corresponding Author email: [email protected] This is a post-peer-review, pre-copyedit version of an article published in Air Quality, Atmosphere & Health. The final authenticated version is available online at: https://doi.org/10.1007/s11869-019-00759-9
-
Upload
khangminh22 -
Category
Documents
-
view
4 -
download
0
Transcript of Evaluating air quality with and without air fresheners
1
Evaluating air quality with and without air fresheners
Nigel Goodman a,*, Neda Nematollahi a,c, Giovanni Agosti d, Anne Steinemann a,b
a Department of Infrastructure Engineering, School of Engineering, The University of
Melbourne, Parkville VIC 3010 Australia
b College of Science and Engineering, James Cook University, Townsville QLD 4811
Australia
c School of Chemistry, The University of Melbourne, Parkville VIC 3010 Australia
d Envirolab Group Laboratories, 12 Ashley Street, Chatswood, NSW 2067 Australia
*Corresponding Author
email: [email protected]
This is a post-peer-review, pre-copyedit version of an article published in Air Quality,
Atmosphere & Health. The final authenticated version is available online at:
https://doi.org/10.1007/s11869-019-00759-9
2
Abstract
Air fresheners emit a range of volatile organic compounds, which can include hazardous air
pollutants. Exposure to air fresheners has been associated with health problems such as
migraine headaches, respiratory difficulties, and asthma attacks. To reduce pollutant
exposures and potential adverse effects, air fresheners can be discontinued from use within
indoor environments. However, little is known about how much air quality can be improved
and over what time. This study evaluates the effects of air fresheners on air quality, with a
focus on d-limonene, a prevalent and dominant compound in air fresheners, and one that can
generate hazardous air pollutants. Using workplace environments, the study analyses and
compares d-limonene concentrations in restrooms that use air fresheners, that discontinue the
use of air fresheners, and that do not use air fresheners. In restrooms that use air fresheners,
d-limonene concentrations averaged 6.78 µg/m3 compared with 0.84 µg/m3 in restrooms that
do not use air fresheners. Further, after discontinuing the use of air fresheners, d-limonene
concentrations decreased up to 96% within two weeks, with an average reduction of 81% and
an average concentration down to 1.17 µg/m3. These findings suggest that a straightforward
strategy, such as ceasing the use of air fresheners, can produce measurable benefits for indoor
air quality.
Key Words: air fresheners, fragrance, fragrance-free, restrooms, volatile organic compounds,
indoor air quality
3
Introduction
Volatile organic compounds (VOCs) are a main category of air pollutants that typically occur
at much higher concentrations indoors than outdoors (Goodman et al. 2017). A primary
source of indoor VOCs are common fragranced consumer products, such as air fresheners
(Steinemann 2015, 2017a). Emissions from fragranced products used indoors can also
migrate outdoors and contribute to the formation of urban smog (McDonald et al. 2018).
Air fresheners are widely used throughout society in a range of indoor environments
including offices, schools, health care facilities, stores, and restrooms (Steinemann 2017a).
All types of air fresheners (e.g., sprays, gels, solids, oils, diffusers), including so-called
green and organic air fresheners, can emit potentially hazardous VOCs (Steinemann 2015,
2017a; Kim et al. 2015; Uhde and Schulz 2015).
Air fresheners typically consist of dozens of different VOCs, such as terpenes (e.g.,
limonene, alpha-pinene, beta-pinene, gamma-terpinene, and linalool), ethanol, acetone, and
acetaldehyde (Steinemann 2015; Uhde and Schulz 2015; Jo et al. 2008). In addition,
terpenes can react with ozone to generate hazardous pollutants such as formaldehyde
(Nazaroff and Weschler 2004). Prior studies have found that, among all air freshener
compounds, limonene is typically the most common, at the highest concentration, or at the
highest emission rate (Steinemann 2015; Uhde and Schulz 2015; Jo et al. 2008).
Exposure to emissions from air fresheners has been associated with adverse health effects in
the general population and in vulnerable sub-populations. National population studies in the
United States (US), Australia (AU), the United Kingdom (UK), and Sweden (SE) found
that, on average, 17.4% of adults report adverse health effects from air fresheners and
deodorizers (Steinemann 2016, 2017b, 2018a, 2018b, 2019a, b). Of those 17.4 % reporting
adverse effects, the most common health problems were respiratory difficulties (50.6%),
mucosal symptoms (35.8%) migraine headaches (30.8%), skin problems (26.2%), and
asthma attacks (23.7%) (Steinemann 2019a).
Among vulnerable sub-populations, reports of adverse health effects are higher. For instance,
across the US, AU, UK and SE, on average, 36.7% of asthmatic adults report adverse health
effects, such as respiratory difficulties (58.0%) and asthma attacks (40.3%), from exposure to
4
air fresheners and deodorizers (Steinemann and Goodman 2019). Across the US, AU, and
UK, on average, 62.9% of autistic adults report adverse health effects, such as migraine
headaches (37.0%) from exposure to air fresheners and deodorizers (Steinemann 2018c).
Air fresheners are also associated with loss of access in society. Across the US, AU, UK and
SE, 13.3% of adults are unable or reluctant to use restrooms in a public place if it has an air
freshener, deodorizer, or scented product. Further, 17.0% of adults enter a business and then
want to leave as quickly as possible if they smell air fresheners or a fragranced product
(Steinemann 2019a).
To reduce potential exposures and adverse effects, a typical strategy is to remove, disconnect,
or otherwise restrict the use of air fresheners. However, we lack information on the
effectiveness of ceasing the use of air fresheners on air quality, and a quantitative comparison
between indoor environments that use air fresheners with those that don't use air fresheners.
The purpose of this study is to investigate and evaluate the effects on air quality from the use,
discontinued use, and non-use of air fresheners. Specifically, it will analyze and compare the
concentrations of air freshener chemicals (1) within restrooms that use air fresheners, (2)
within those same restrooms after air fresheners are discontinued, and (3) within similar
restrooms that did not use air fresheners. Results of this study provide a scientific basis for a
practicable approach to potentially improve both indoor and outdoor air quality, reduce
personal exposures and possible health risks, and improve societal access.
Methods
The study was conducted within eight restrooms located within engineering buildings at the
University of Melbourne, Australia. The restrooms are designated as #1–8 for this paper.
Air fresheners were installed and operating in restrooms #1–4. No air fresheners were
installed or operating in restrooms #5–8. Characteristics of the restrooms are described in
Supplementary Table S1. This study received ethics approval from The University of
Melbourne (Application number: 1954006.1).
The same type of air freshener was used in all four restrooms (#1–4). Each air freshener
consisted of a plastic housing unit secured to the wall approximately two metres above floor
level, a pressurized fragrance canister (250 ml), and a battery powered programmable
5
control module that activated the canister's spray nozzle at regular intervals (i.e., 10 or 15
minutes) between 8:00 am and 11:59 pm.
The experimental and sampling protocol proceeded as follows. Baseline air quality
measurements were collected within all restrooms #1–8 on Day 1. After these baseline
samples were collected, air fresheners were discontinued from use (pressurized cannisters
removed) in restrooms #1–4 at the end of Day 1. To assess the attenuation of air freshener
chemicals, samples were collected in restrooms #1–4 on Days 3, 7, and 14. For comparison
with restrooms that did not use air fresheners, samples were also collected in restrooms #5–8
on Day 14.
All sampling was conducted after normal business hours, in the late evening, to avoid
contact with people. Signs were posted to prevent entrance into the restrooms. In addition,
special precautions were taken to minimise the potential for introduction of chemicals into
the restrooms. For instance, although the restrooms were cleaned daily, this occurred in the
early morning hours, and typically at least nine hours before any sampling. Also, cleaning
staff had been asked to minimize the use of fragranced cleaning products in the restrooms.
Samples were collected following USEPA compendium methods TO 17 (US EPA 1999).
For VOCs (i.e., d-limonene), a single multi-adsorbent tube was connected to a sampling
pump at a flow rate of approximately 150 mL per minute for 1 h, to collect approximately 9
L of air. Temperature, relative humidity, and barometric pressure were measured using a
portable monitor. In all restrooms, the air sampling point was approximately 1.6 m above
floor level, and approximately 1.5 m from the air freshener. This location was chosen to
approximate breathing zone of restroom occupants, and to provide a secure location for the
aluminium ducting, sampling pump, and monitor. Analysis and reporting of VOCs follows
methods previously detailed (Goodman et al. 2019).
For the VOC analyses of samples, the study focused on d-limonene because it is (a) a
prevalent and dominant VOC across all types of air fresheners, (b) associated with adverse
health effects and classified as a potentially hazardous compound (SWA 2018), and (c) a
terpene that readily reacts with ozone to generate a range of secondary hazardous air
pollutants.
The air freshener used in restrooms #1–4 was analysed for its VOC emissions using gas
chromatography/mass spectrometry (GC/MS) headspace analysis, according to methods
6
previously described (Nematollahi et al. 2018). The analysis confirmed the presence of 54
VOCs, including d-limonene (Supplementary Table 2).
Results and Discussion
Concentrations of d-limonene at each phase of sampling and at each restroom are provided
in Table 1.
In restrooms that used air fresheners (#1–4), the concentrations of d-limonene ranged from
5.15 µg/m3 to 9.68 µg/m3 (mean 6.78 µg/m3) on Day 1. After discontinuing use of air
fresheners in those same restrooms, the concentrations of d-limonene ranged from (a) 0.23
µg/m3 to 0.72 µg/m3 on Day 3, (b) 0.35 µg/m3 to 1.31 µg/m3 on Day 7 and (c) 0.24 µg/m3 to
2.99 µg/m3 (mean 1.17 µg/m3) on Day 14.
In restrooms that did not use air fresheners (#5–8), the concentrations of d-limonene ranged
from 0.23 µg/m3 to 2.29 µg/m3 (mean 0.84 µg/m3) on Day 1, and from 0.60 µg/m3 to 1.34
µg/m3 (mean 1.29 µg/m3) on Day 14.
Key findings are as follows: (1) After air fresheners were discontinued from use,
concentrations of d-limonene decreased up to 96% (average 81%) over two weeks, and major
reductions (i.e., 92%) were accomplished by Day 3. (2) For all samples in all restrooms after
air fresheners were discontinued or were not used, d-limonene concentrations were lower
than any of the initial samples when air fresheners were in use. (3) After air fresheners were
discontinued from use, concentrations of d-limonene approached the lower levels of
restrooms that had not used any air fresheners.
Thus, these findings suggest that discontinuing the use of air fresheners can have an almost
immediate benefit for air quality by reducing d-limonene concentrations. These findings are
supported by a prior study of dryer vent emissions (Goodman et al. 2019), which found d-
limonene concentrations up to 118 µg/m3 during use of fragranced laundry products, and less
than 1 µg/m3 during use of fragrance-free laundry products. After switching from fragranced
to fragrance-free products for four weeks, concentrations of d-limonene decreased as much as
99.7% (mean 79.1%).
7
A strength of this current study is that it used real-world environments: restrooms within a
workplace. A further strength is that the approach is relatively straightforward and cost
effective to implement. Thus, results indicate the practicably achievable improvements in air
quality. However, a limitation is that it was not possible to control for all possible
confounding factors. This may help to explain some of the anomalous datapoints (e.g., #2
and #3 Day 7, and #2 Day 14). For instance, an individual may have entered the restroom
immediately prior to sampling and used or was wearing a fragranced product. Also, this
study examined just one type of air freshener over just two weeks. Future research can
examine different types of air fresheners over longer periods of time.
Conclusion
This study indicated improvements to air quality, in terms of d-limonene concentrations,
after discontinuing the use of air fresheners in restrooms. Reductions in air freshener use
may also reduce the formation and concentrations of secondary pollutants. Findings from
this study can provide an important foundation for future research to help reduce VOC
emissions and exposures.
Acknowledgements
We thank the supporters of this study: the Australian Government's National Environmental
Science Program through the Clean Air and Urban Landscapes Hub; CSIRO Land and Water;
the Melbourne School of Engineering Teaching and Learning Infrastructure Fund; and the
Australian Government Research Training Program Scholarship through the University of
Melbourne. We also thank Kirsten Raynor, Trish Harrison, Behzad Rismanchi, George Fox,
and the University of Melbourne Infrastructure Services staff for their generous assistance.
Finally, we are grateful to the anonymous reviewers of this paper.

8
References
Goodman NB, Wheeler AJ, Paevere PJ, Agosti G, Nematollahi N, and Steinemann A (2019)
Emissions from dryer vents during use of fragranced and fragrance-free laundry products. Air
Quality, Atmosphere & Health, 12(3):289-295. doi: 10.1007/s11869-018-0643-8
Goodman NB, Steinemann A, Wheeler AJ, Paevere PJ, Cheng M, Brown SK (2017) Volatile
organic compounds within indoor environments in Australia. Building and Environment
122:116-125. doi: 10.1016/j.buildenv.2017.05.033
Jo WK, Lee JH, Kim MK (2008) Head-space, small-chamber and in-vehicle tests for volatile
organic compounds (VOCs) emitted from air fresheners for the Korean market, Chemosphere
70(10):1827e1834.
Kim S, Hong SH, Bong CK, Cho, MH (2015) Characterization of air freshener emission: the
potential health effects, J. Toxicol. Sci. 40 (5) (2015) 535-550. doi: 10.2131/jts.40.535
McDonald BC, de Gouw JA, Gilman JB, Jathar SH, Akherati A, Cappa CD, Jimenez JL, Lee-
Taylor J, Hayes PL, McKeen SA, Cui YY (2018) Volatile chemical products emerging as
largest petrochemical source of urban organic emissions. Science, 359.6377:760-764. doi:
10.1126/science.aaq0524
Nazaroff WW, Weschler CJ (2004) Cleaning products and air fresheners: exposure to
primary and secondary air pollutants. Atmospheric Environment 38.18:2841-2865. doi:
10.1016/j.atmosenv.2004.02.040
Nematollahi N, Doronila A, Mornane PJ, Duan A, Kolev SD, Steinemann A (2018) Volatile
Chemical Emissions from Fragranced Baby Products. Air Quality, Atmosphere and Health
11.7:785–790. doi: 10.1007/s11869-018-0593-1
SafeWork Australia (SWA) (2018) Hazardous chemical information system (HCIS): search
hazardous chemicals, http://hcis.safeworkaustralia.gov.au/HazardousChemical Accessed 10
September 2018.
Steinemann A (2019a) International Prevalence of Fragrance Sensitivity. Air Quality,
Atmosphere & Health (01 Jun)
9
Steinemann, A (2019b) Ten questions concerning fragrance-free policies and indoor
environments. Building and Environment, 159, p.106054.
doi.org/10.1016/j.buildenv.2019.03.052
Steinemann A (2018a) Fragranced consumer products: sources of emissions, exposures, and
health effects in the UK. Air Quality, Atmosphere & Health 11(3):253–256.
doi.org/10.1007/s11869-018-0550-z
Steinemann A (2018b) Exposures and effects from fragranced consumer products in Sweden.
Air Quality, Atmosphere & Health 11(5):485–491. doi.org/10.1007/s11869-018-0565-5
Steinemann A (2018c) Fragranced Consumer Products: Effects on Autistic Adults in the
United States, Australia, and United Kingdom. Air Quality, Atmosphere & Health
11(10):1137-1142.
Steinemann, A (2017a) Ten questions concerning air fresheners and indoor built
environments. Building and Environment, 111, pp.279-284.
doi.org/10.1016/j.buildenv.2016.11.009
Steinemann A (2017b) Health and societal effects from exposure to fragranced consumer
products. Prev Med Rep 5:45–47. doi.org/10.1016/j.pmedr.2016.11.011
Steinemann A (2016) Fragranced consumer products: exposures and effects from emissions.
Air Quality, Atmosphere & Health 9:861–866. doi.org/10.1007/s11869-016-0442-z
Steinemann A (2015) Volatile Emissions from Common Consumer Products. Air Quality,
Atmosphere & Health 8.3:273-281. doi: 10.1007/s11869-015-0327-6
Steinemann A, and Goodman N (2019) Fragranced consumer products and effects on
asthmatics: an international population-based study. Air Quality, Atmosphere & Health,
12(6):643-649. doi: 10.1007/s11869-019-00693-w
Uhde E, Schulz N (2015) Impact of room fragrance products on indoor air quality, Atmos.
Environ. 106 (2015) 492-502. doi: 10.1016/j.atmosenv.2014.11.020
US EPA (1999) Compendium Method for the Determination of Toxic Organic Compounds in
Ambient Air. Compendium Method TO-17, Second Edition. Center for Environmental
10
Research Information Office of Research and Development U.S. Environmental Protection
Agency Cincinnati, OH 45268.
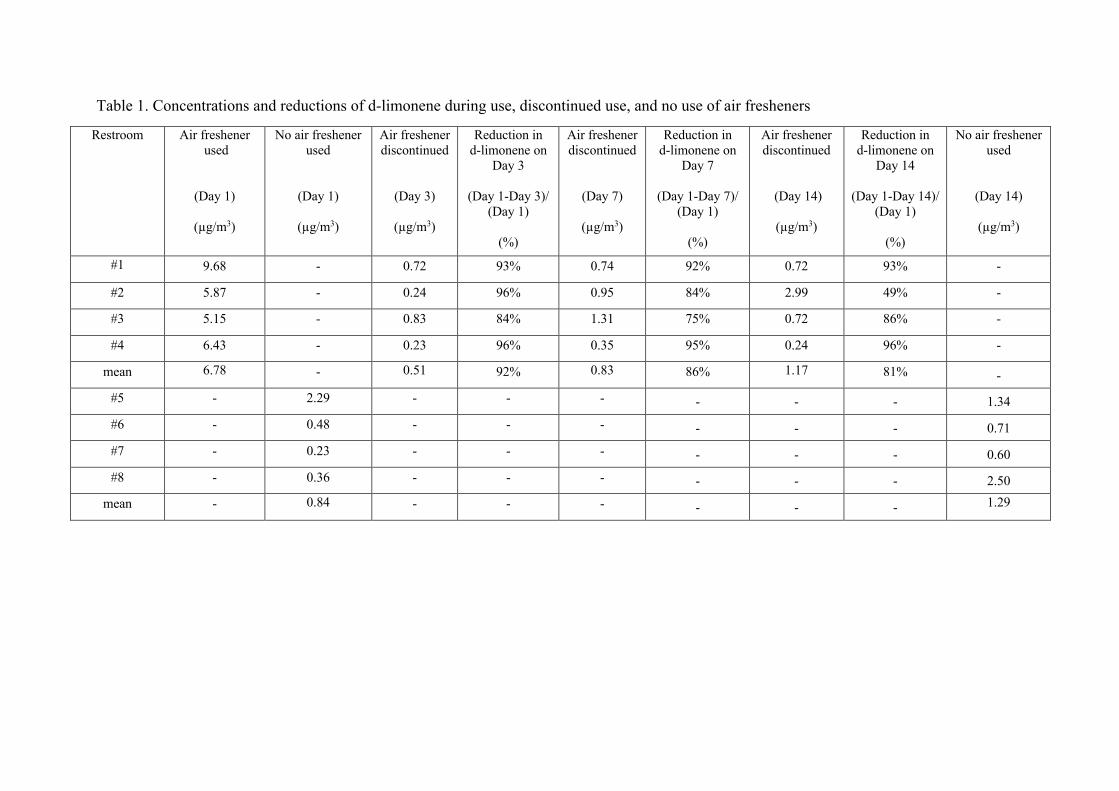
Table 1. Concentrations and reductions of d-limonene during use, discontinued use, and no use of air fresheners
Restroom Air freshener used
(Day 1)
(µg/m3)
No air freshener used
(Day 1)
(µg/m3)
Air freshener discontinued
(Day 3)
(µg/m3)
Reduction in d-limonene on
Day 3
(Day 1-Day 3)/ (Day 1)
(%)
Air freshener discontinued
(Day 7)
(µg/m3)
Reduction in d-limonene on
Day 7
(Day 1-Day 7)/ (Day 1)
(%)
Air freshener discontinued
(Day 14)
(µg/m3)
Reduction in d-limonene on
Day 14
(Day 1-Day 14)/ (Day 1)
(%)
No air freshener used
(Day 14)
(µg/m3)
#1
9.68 - 0.72 93% 0.74 92% 0.72 93% -
#2 5.87 - 0.24 96% 0.95 84% 2.99 49% -
#3 5.15 - 0.83 84% 1.31 75% 0.72 86% -
#4 6.43 - 0.23 96% 0.35 95% 0.24 96% -
mean 6.78
- 0.51
92% 0.83
86% 1.17
81% -
#5 - 2.29 - - - - - - 1.34
#6 - 0.48 - - - - - - 0.71
#7 - 0.23 - - - - - - 0.60
#8 - 0.36 - - - - - - 2.50
mean - 0.84
- - - - - - 1.29
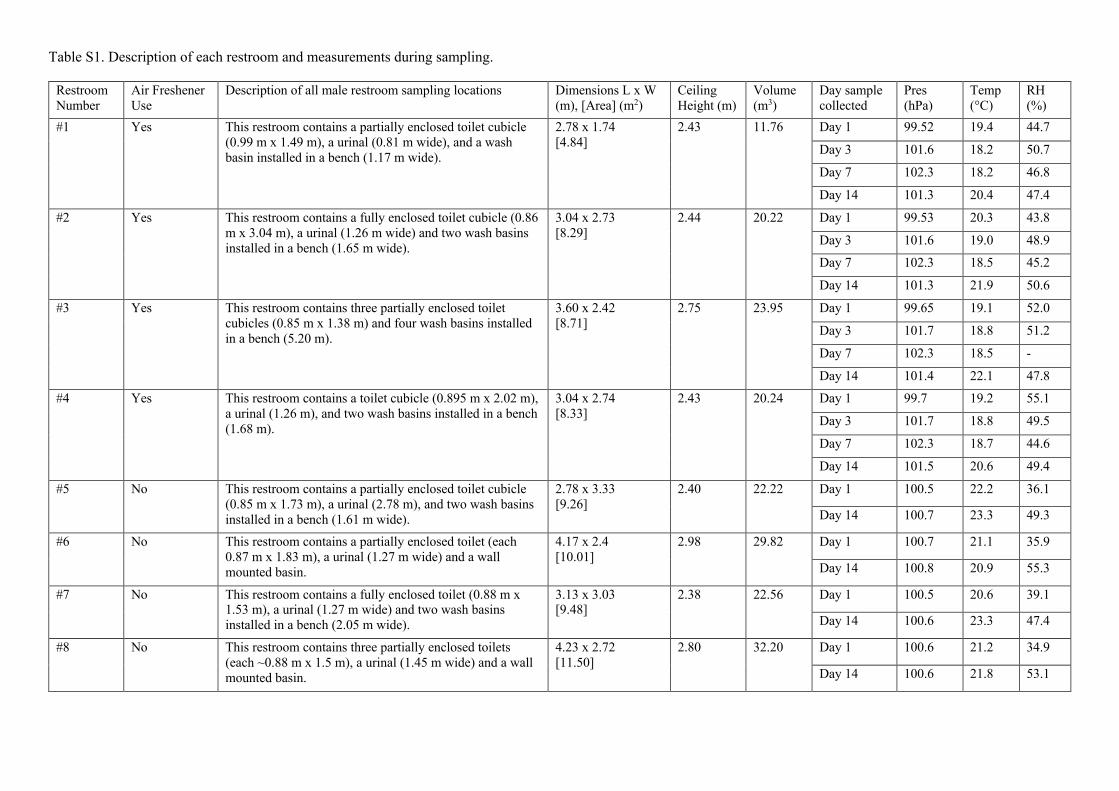
Table S1. Description of each restroom and measurements during sampling.
Restroom Number
Air Freshener Use
Description of all male restroom sampling locations Dimensions L x W (m), [Area] (m2)
Ceiling Height (m)
Volume (m3)
Day sample collected
Pres (hPa)
Temp (°C)
RH (%)
#1
Yes This restroom contains a partially enclosed toilet cubicle (0.99 m x 1.49 m), a urinal (0.81 m wide), and a wash basin installed in a bench (1.17 m wide).
2.78 x 1.74 [4.84]
2.43 11.76 Day 1 99.52 19.4 44.7
Day 3 101.6 18.2 50.7
Day 7 102.3 18.2 46.8
Day 14 101.3 20.4 47.4
#2 Yes This restroom contains a fully enclosed toilet cubicle (0.86 m x 3.04 m), a urinal (1.26 m wide) and two wash basins installed in a bench (1.65 m wide).
3.04 x 2.73 [8.29]
2.44 20.22 Day 1 99.53 20.3 43.8
Day 3 101.6 19.0 48.9
Day 7 102.3 18.5 45.2
Day 14 101.3 21.9 50.6
#3
Yes This restroom contains three partially enclosed toilet cubicles (0.85 m x 1.38 m) and four wash basins installed in a bench (5.20 m).
3.60 x 2.42 [8.71]
2.75 23.95 Day 1 99.65 19.1 52.0
Day 3 101.7 18.8 51.2
Day 7 102.3 18.5 -
Day 14 101.4 22.1 47.8
#4
Yes This restroom contains a toilet cubicle (0.895 m x 2.02 m), a urinal (1.26 m), and two wash basins installed in a bench (1.68 m).
3.04 x 2.74 [8.33]
2.43 20.24 Day 1 99.7 19.2 55.1
Day 3 101.7 18.8 49.5
Day 7 102.3 18.7 44.6
Day 14 101.5 20.6 49.4
#5
No This restroom contains a partially enclosed toilet cubicle (0.85 m x 1.73 m), a urinal (2.78 m), and two wash basins installed in a bench (1.61 m wide).
2.78 x 3.33 [9.26]
2.40 22.22 Day 1 100.5 22.2 36.1
Day 14 100.7 23.3 49.3
#6 No This restroom contains a partially enclosed toilet (each 0.87 m x 1.83 m), a urinal (1.27 m wide) and a wall mounted basin.
4.17 x 2.4 [10.01]
2.98 29.82 Day 1 100.7 21.1 35.9
Day 14 100.8 20.9 55.3
#7
No This restroom contains a fully enclosed toilet (0.88 m x 1.53 m), a urinal (1.27 m wide) and two wash basins installed in a bench (2.05 m wide).
3.13 x 3.03 [9.48]
2.38 22.56 Day 1 100.5 20.6 39.1
Day 14 100.6 23.3 47.4
#8 No This restroom contains three partially enclosed toilets (each ~0.88 m x 1.5 m), a urinal (1.45 m wide) and a wall mounted basin.
4.23 x 2.72 [11.50]
2.80 32.20 Day 1 100.6 21.2 34.9
Day 14 100.6 21.8 53.1
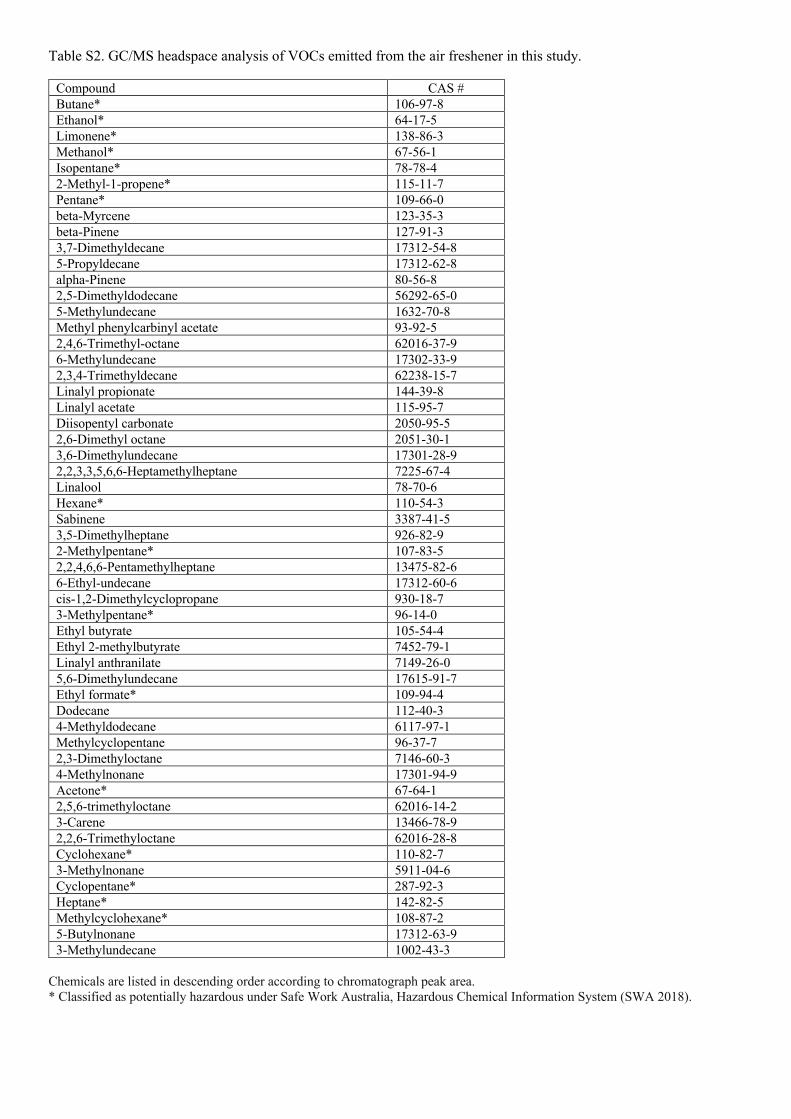
Table S2. GC/MS headspace analysis of VOCs emitted from the air freshener in this study.
Compound CAS # Butane* 106-97-8 Ethanol* 64-17-5 Limonene* 138-86-3 Methanol* 67-56-1 Isopentane* 78-78-4 2-Methyl-1-propene* 115-11-7 Pentane* 109-66-0 beta-Myrcene 123-35-3 beta-Pinene 127-91-3 3,7-Dimethyldecane 17312-54-8 5-Propyldecane 17312-62-8 alpha-Pinene 80-56-8 2,5-Dimethyldodecane 56292-65-0 5-Methylundecane 1632-70-8 Methyl phenylcarbinyl acetate 93-92-5 2,4,6-Trimethyl-octane 62016-37-9 6-Methylundecane 17302-33-9 2,3,4-Trimethyldecane 62238-15-7 Linalyl propionate 144-39-8 Linalyl acetate 115-95-7 Diisopentyl carbonate 2050-95-5 2,6-Dimethyl octane 2051-30-1 3,6-Dimethylundecane 17301-28-9 2,2,3,3,5,6,6-Heptamethylheptane 7225-67-4 Linalool 78-70-6 Hexane* 110-54-3 Sabinene 3387-41-5 3,5-Dimethylheptane 926-82-9 2-Methylpentane* 107-83-5 2,2,4,6,6-Pentamethylheptane 13475-82-6 6-Ethyl-undecane 17312-60-6 cis-1,2-Dimethylcyclopropane 930-18-7 3-Methylpentane* 96-14-0 Ethyl butyrate 105-54-4 Ethyl 2-methylbutyrate 7452-79-1 Linalyl anthranilate 7149-26-0 5,6-Dimethylundecane 17615-91-7 Ethyl formate* 109-94-4 Dodecane 112-40-3 4-Methyldodecane 6117-97-1 Methylcyclopentane 96-37-7 2,3-Dimethyloctane 7146-60-3 4-Methylnonane 17301-94-9 Acetone* 67-64-1 2,5,6-trimethyloctane 62016-14-2 3-Carene 13466-78-9 2,2,6-Trimethyloctane 62016-28-8 Cyclohexane* 110-82-7 3-Methylnonane 5911-04-6 Cyclopentane* 287-92-3 Heptane* 142-82-5 Methylcyclohexane* 108-87-2 5-Butylnonane 17312-63-9 3-Methylundecane 1002-43-3
Chemicals are listed in descending order according to chromatograph peak area. * Classified as potentially hazardous under Safe Work Australia, Hazardous Chemical Information System (SWA 2018).