Euclidean color-difference formula for small-medium color differences in log-compressed OSA-UCS...
14
Euclidean color-difference formula for small–medium color differences in log-compressed OSA-UCS space Claudio Oleari, 1, * Manuel Melgosa, 2 and Rafael Huertas 2 1 Dipartimento di Fisica, Università degli Studi di Parma, I-43100 Parma, Italy 2 Departamento de Óptica, Facultad de Ciencias, Universidad de Granada, 18071 Granada, Spain * Corresponding author: claudio.oleari@fis.unipr.it Received May 14, 2008; revised September 8, 2008; accepted September 22, 2008; posted October 1, 2008 (Doc. ID 96155); published December 19, 2008 This work continues previous research by the same authors [J. Opt. Soc. Am. A 23, 2077 (2006)], where em- pirical small–medium color differences were represented by an ellipsoidal equation E GP in the Uniform Color System of the Optical Society of America. Now logarithmic compressions on chroma and lightness are intro- duced to produce a new space with Euclidean color-difference formulas E E . The CIEDE2000, E GP , and E E formulas are found statistically equivalent in the prediction of many available empirical datasets. However, E E is the simplest formula providing relationships with visual processing. These analyses hold true for CIE 1964 Supplementary Standard Observer and D65 illuminant. © 2008 Optical Society of America OCIS codes: 330.1690, 330.1730, 330.1710, 330.1720. 1. INTRODUCTION The definition of the best color-difference formula for small–medium color differences is a problem in color sci- ence still open to debate today [1]. The CIEDE2000 for- mula [2], denoted by E 00 , has a very high complexity and depends on many parameters. The number of indepen- dent parameters has to be related to the complexity of the phenomenon represented and to the space where the for- mula is defined. This distinction is important because it allows understanding of the whole complexity of the for- mula. The empirical small–medium color differences, rep- resented in CIELAB space, show irregularities that the formula must describe. The space, where the lowest num- ber of parameters is needed for defining the formula, is preferable. Now the quality of the formula depends on the meaning of the parameters and on the transformations required for obtaining this space from the fundamental reference frame of the tristimulus space. The high com- plexity of the CIEDE2000 formula is a consequence of the irregularities shown by the empirical small–medium color differences represented in the CIELAB space. Our previous work [3] represented the empirical small– medium color differences in the OSA-UCS space [4,5], which is spanned by the lightness L OSA and J , G, corre- sponding to the empirical j and g (see [6,7] and Appendix A of [3]). Such a view shows empirical data with high regularity and induced us to represent the small–medium color differences in this space by a simple ellipsoidal equation [3] (in the formula and in this work, if necessary, a factor of 10 is written before the coordinates of the OSA- UCS space, because the unit of these coordinates is 10 times the just noticeable difference for large color differ- ences): E GP 2 = 10L OSA S L 2 + 10C OSA S C 2 + 10H OSA S H 2 , 1 which leads to chromaticity ellipses in very good agree- ment with experimental ones (Fig. 1), where L OSA , C OSA , and H OSA are differences between quantities de- pendent on the coordinates L OSA ; J , G related to a color pair in comparison, defined as follows: C OSA is the chroma C OSA = G 2 + J 2 , 2 H OSA is defined as H OSA 2 = E 0 2 - L OSA 2 - C OSA 2 3 with E 0 2 = L OSA 2 + J 2 + G 2 , 4 in analogy with the CIELAB system, and S L = a L + b L 10L ¯ OSA = 2.499 + 0.00710L ¯ OSA , S C = a C + b C 10C ¯ OSA = 1.235 + 0.05810C ¯ OSA , S H = a H + b H 10C ¯ OSA = 1.392 + 0.01710C ¯ OSA 5 are weights, where L ¯ OSA and C ¯ OSA are the average light- ness and chroma coordinates of two color samples, respec- tively, and a L , b L , a C , b C , a H , and b H are suitable con- stants fitted by us using the weighted COM (Combined) dataset used at CIEDE2000 development (Appendix A) Oleari et al. Vol. 26, No. 1/January 2009/J. Opt. Soc. Am. A 121 1084-7529/09/010121-14/$15.00 © 2009 Optical Society of America
Transcript of Euclidean color-difference formula for small-medium color differences in log-compressed OSA-UCS...

1Tsemddpmamrfbpmrrpid
mwsArceaUte
Oleari et al. Vol. 26, No. 1 /January 2009 /J. Opt. Soc. Am. A 121
Euclidean color-difference formula forsmall–medium color differences in log-compressed
OSA-UCS space
Claudio Oleari,1,* Manuel Melgosa,2 and Rafael Huertas2
1Dipartimento di Fisica, Università degli Studi di Parma, I-43100 Parma, Italy2Departamento de Óptica, Facultad de Ciencias, Universidad de Granada, 18071 Granada, Spain
*Corresponding author: [email protected]
Received May 14, 2008; revised September 8, 2008; accepted September 22, 2008;posted October 1, 2008 (Doc. ID 96155); published December 19, 2008
This work continues previous research by the same authors [J. Opt. Soc. Am. A 23, 2077 (2006)], where em-pirical small–medium color differences were represented by an ellipsoidal equation �EGP in the Uniform ColorSystem of the Optical Society of America. Now logarithmic compressions on chroma and lightness are intro-duced to produce a new space with Euclidean color-difference formulas �EE. The CIEDE2000, �EGP, and �EEformulas are found statistically equivalent in the prediction of many available empirical datasets. However,�EE is the simplest formula providing relationships with visual processing. These analyses hold true for CIE1964 Supplementary Standard Observer and D65 illuminant. © 2008 Optical Society of America
OCIS codes: 330.1690, 330.1730, 330.1710, 330.1720.
wm�pp
�
w
i
antsd
. INTRODUCTIONhe definition of the best color-difference formula formall–medium color differences is a problem in color sci-nce still open to debate today [1]. The CIEDE2000 for-ula [2], denoted by �E00, has a very high complexity and
epends on many parameters. The number of indepen-ent parameters has to be related to the complexity of thehenomenon represented and to the space where the for-ula is defined. This distinction is important because it
llows understanding of the whole complexity of the for-ula. The empirical small–medium color differences, rep-
esented in CIELAB space, show irregularities that theormula must describe. The space, where the lowest num-er of parameters is needed for defining the formula, isreferable. Now the quality of the formula depends on theeaning of the parameters and on the transformations
equired for obtaining this space from the fundamentaleference frame of the tristimulus space. The high com-lexity of the CIEDE2000 formula is a consequence of therregularities shown by the empirical small–medium colorifferences represented in the CIELAB space.Our previous work [3] represented the empirical small–edium color differences in the OSA-UCS space [4,5],hich is spanned by the lightness LOSA and �J ,G�, corre-
ponding to the empirical j and g (see [6,7] and Appendixof [3]). Such a view shows empirical data with high
egularity and induced us to represent the small–mediumolor differences in this space by a simple ellipsoidalquation [3] (in the formula and in this work, if necessary,factor of 10 is written before the coordinates of the OSA-CS space, because the unit of these coordinates is 10
imes the just noticeable difference for large color differ-nces):
1084-7529/09/010121-14/$15.00 © 2
��EGP�2 = ���10LOSA�
SL�2
+ ���10COSA�
SC�2
+ ���10HOSA�
SH�2
, �1�
hich leads to chromaticity ellipses in very good agree-ent with experimental ones (Fig. 1), where �LOSA,COSA, and �HOSA are differences between quantities de-endent on the coordinates �LOSA ;J ,G� related to a colorair in comparison, defined as follows: COSA is the chroma
COSA = �G2 + J2, �2�
HOSA is defined as
��HOSA�2 = ��E0�2 − ��LOSA�2 − ��COSA�2 �3�
ith
��E0�2 = ��LOSA�2 + ��J�2 + ��G�2, �4�
n analogy with the CIELAB system, and
SL = aL + bL�10L̄OSA� = 2.499 + 0.007�10L̄OSA�,
SC = aC + bC�10C̄OSA� = 1.235 + 0.058�10C̄OSA�,
SH = aH + bH�10C̄OSA� = 1.392 + 0.017�10C̄OSA� �5�
re weights, where L̄OSA and C̄OSA are the average light-ess and chroma coordinates of two color samples, respec-ively, and aL, bL, aC, bC, aH, and bH are suitable con-tants fitted by us using the weighted COM (Combined)ataset used at CIEDE2000 development (Appendix A)
009 Optical Society of America

av
(ctw
i
dE
cr
p
feu
e
thi
rnwd(pttc(ft
fcfetr
tcscnsda
psedpccccCted
mcntfscwfRcUeodaccs
FtUteagstes
122 J. Opt. Soc. Am. A/Vol. 26, No. 1 /January 2009 Oleari et al.
nd minimizing the product of the root-mean-squarealue (RMS) times the PF /3 index [3] (Appendix B).
The plot in the OSA-UCS space of the whole set of BFDBradford University) ellipses [8], which represents thehromaticity discrimination at a constant luminance fac-or, shows clearly the following properties (Fig. 1), whiche term the hue-independence hypothesis:
• The shape of the ellipses is hue independent.• The ellipses have the long axes lying on lines radiat-
ng from the achromatic point.• Both ellipse axes have lengths that are hue indepen-
ent and linearly chroma dependent, as represented byq. (5).• The consequence of these remarks is that the ellipse
entered in the �J ,G� coordinate origin is a circle with aadius approximately equal to 1.
These properties induce us to search for a chroma com-ression in the OSA-UCS space such that [9]
(a) the ellipses satisfying these hypotheses are trans-ormed into circular lines with radius approximatelyqual to 1, and the circle centered in the axis origin is leftnchanged;(b) the color-difference formula for color samples with
qual luminance factor becomes Euclidean.
As is well known, ellipses are only an approximate wayo represent the discrimination threshold; therefore weave not to search for an exact transformation of ellipses
nto circles, but only an approximate one. The goodness of
ig. 1. Figure equal to Fig. 3 of the previous paper [3], showinghe (J, G) plane of the OSA-UCS space with the BFD (Bradfordniversity) ellipses [8] (thick line) and the ellipses representing
he color-difference formula �EGP (thin line). The ellipse param-ters are aH=1.154, bH=0.018, aC=1.121, and bC=0.051, while aLnd bL are assumed to have no effect because the ellipses areiven at constant lightness; the values of the parameters are theame as in the previous paper up to a rounding [3] and are equalo those given in Table 1, although obtained in two different butquivalent ways, by minimizing RMS�PF /3 (RMS, root meanquare) in [3] and by minimizing only the RMS in this work.
epresenting a discrimination threshold at constant light-ess by circles is evaluated by comparing these circlesith empirical data and is quantified here by the stan-ardized residual sum of squares (STRESS) index [10]Appendix B). STRESS improves previous indices re-orted in literature (e.g., PF /3 [11]) and has the impor-ant property of allowing an easy statistical inference onhe statistical significance of the difference between twoolor-difference formulas, e.g., CIEDE2000 and formula1), with respect to a given set of empirical data. There-ore, different color-difference formulas can be comparedhrough the STRESS index.
In the next section, a new space is derived, obtainedrom the OSA-UCS by a logarithmic compression of thehroma COSA, where the small–medium color-differenceormula at constant lightness is well represented by thequation of a circle, and its goodness is strengthened byhe simplicity due to the reduction of the number of pa-ameters to only two with regard to the chroma and hue.
In Section 3, two possibilities of the lightness scale inhe OSA-UCS space in relation to the small–mediumolor differences are considered. Specifically, the verymall dependence of the weight SL on LOSA, induces us toonsider this linear dependence with a consequent light-ess log compression, or to consider SL as a simple con-tant. Both hypotheses give completely Euclidean color-ifference formulas in log-compressed OSA-UCS spacesnd are discussed in Section 4.Section 4 is subdivided into three parts: (1) in the first
art, the chroma log compression is considered with re-pect to the BFD ellipses, and the compression param-ters are obtained by the RMS-value optimization andiscussed on the basis of the STRESS; (2) in the secondart, analogous computations and analysis on Euclideanolor-difference formulas based on individual datasetsonstituting the COM datasets and crispening effect arearried out; (3) in the third part, the log compression isonsidered in the whole space with regard to the correctedOM dataset (Appendix A), used in the development of
he CIEDE2000 formula, and the compression param-ters are obtained again by RMS minimization and areiscussed.Besides CIEDE2000, the DIN99d color-difference for-ula [12] is also considered here as another recent Eu-
lidean formula, which incorporates a logarithmic light-ess compression. In fact, many efforts have been made inhe past years to achieve new Euclidean color-differenceormulas, most of them involving logarithmic compres-ion. Thus, for example, Thomsen [13] proposed a chromaompression in CIELAB, leading to a Euclidean formulaith a performance similar to the CIE94 color-difference
ormula, following methods previously suggested byohner and Rich [14]; Nobbs [15] has also proposed a Eu-lidization of the CIEDE2000 color-difference formula;rban et al. [16] suggested a computational method of
mbedding non-Euclidean color spaces into Euclideannes; Berns and Zue [17] proposed a Euclidean color-ifference formula based on CIECAM02 that incorporateslogarithmic compression of chroma. In summary, the
urrent paper is another step toward a new Euclideanolor-difference formula using log compression on the ba-is of the properties of the OSA-UCS color space.
mpsf
2OIts
Te
a
ts
m
w
lealw
smptTmcCvfa+al
TOc
TratrBiBR0a
ls
Ftc
FllTvttr
Oleari et al. Vol. 26, No. 1 /January 2009 /J. Opt. Soc. Am. A 123
This work shows that CIEDE2000, �EGP, and �EE for-ulas are statistically equivalent; consequently, any com-
arison has to consider not only the goodness of repre-enting empirical data but also the complexity of theormulas and their relation with visual processing.
. CHROMA LOG COMPRESSION INSA-UCS SPACE
n order to perform a chroma compression, the contribu-ion of the chroma difference of formula (1) must be con-idered:
��10COSA�
SC=
��10COSA�
aC + bC�10COSA�. �6�
he transformed chroma CE (subscript E means Euclid-an) must be defined such that
�CE =��10COSA�
aC + bC�10COSA�, �7�
nd this requirement is satisfied if
CE � � 1
bC�ln�1 +
bC
aC�10COSA��; �8�
hen a new chroma is obtained by logarithmic compres-ion.
Because the chroma log compression leaves the hue un-odified, the new log-compressed coordinates are
GE = − CE cos�h�,
JE = CE sin�h�, �9�
here h is the hue angle, defined as
h = arctan�−J
G� . �10�
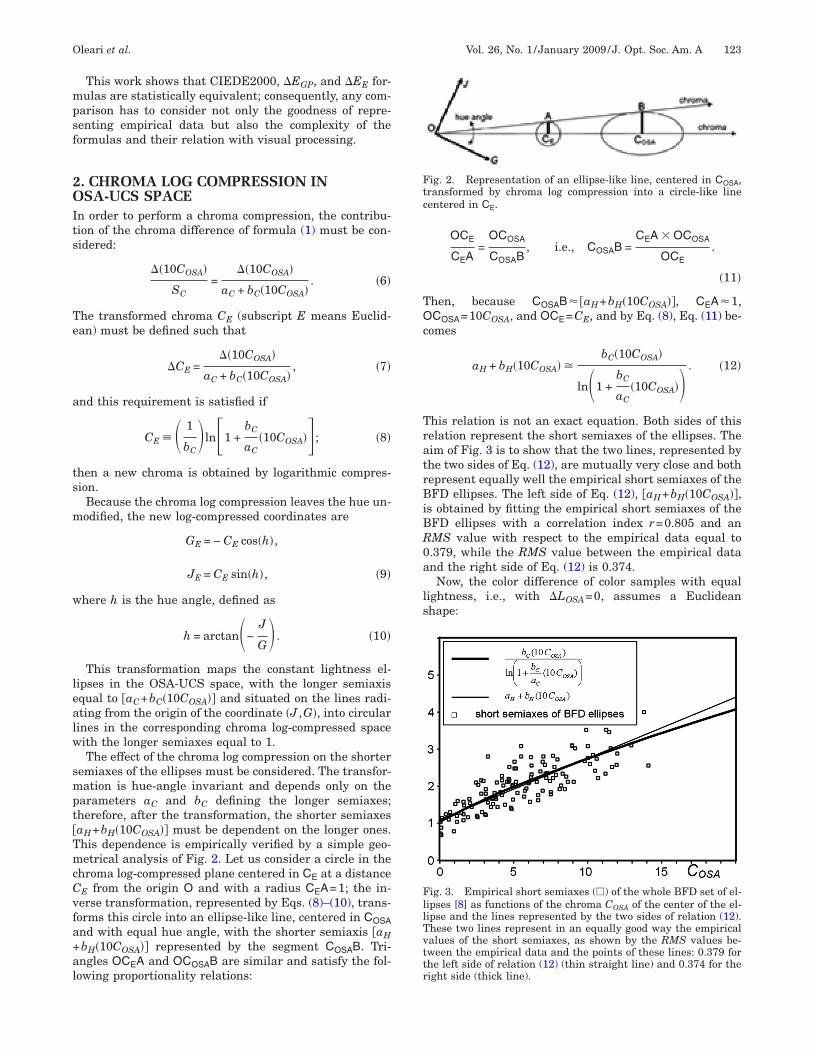
This transformation maps the constant lightness el-ipses in the OSA-UCS space, with the longer semiaxisqual to aC+bC�10COSA� and situated on the lines radi-ting from the origin of the coordinate �J ,G�, into circularines in the corresponding chroma log-compressed spaceith the longer semiaxes equal to 1.The effect of the chroma log compression on the shorter
emiaxes of the ellipses must be considered. The transfor-ation is hue-angle invariant and depends only on the
arameters aC and bC defining the longer semiaxes;herefore, after the transformation, the shorter semiaxesaH+bH�10COSA� must be dependent on the longer ones.his dependence is empirically verified by a simple geo-etrical analysis of Fig. 2. Let us consider a circle in the
hroma log-compressed plane centered in CE at a distanceE from the origin O and with a radius CEA=1; the in-erse transformation, represented by Eqs. (8)–(10), trans-orms this circle into an ellipse-like line, centered in COSAnd with equal hue angle, with the shorter semiaxis aHbH�10COSA� represented by the segment COSAB. Tri-ngles OCEA and OCOSAB are similar and satisfy the fol-owing proportionality relations:
OCE
CEA=
OCOSA
COSAB, i.e., COSAB =
CEA � OCOSA
OCE.
�11�
hen, because COSAB�aH+bH�10COSA�, CEA�1,COSA=10COSA, and OCE=CE, and by Eq. (8), Eq. (11) be-
omes
aH + bH�10COSA� �bC�10COSA�
ln�1 +bC
aC�10COSA�� . �12�
his relation is not an exact equation. Both sides of thiselation represent the short semiaxes of the ellipses. Theim of Fig. 3 is to show that the two lines, represented byhe two sides of Eq. (12), are mutually very close and bothepresent equally well the empirical short semiaxes of theFD ellipses. The left side of Eq. (12), aH+bH�10COSA�,
s obtained by fitting the empirical short semiaxes of theFD ellipses with a correlation index r=0.805 and anMS value with respect to the empirical data equal to.379, while the RMS value between the empirical datand the right side of Eq. (12) is 0.374.Now, the color difference of color samples with equal
ightness, i.e., with �LOSA=0, assumes a Euclideanhape:
ig. 2. Representation of an ellipse-like line, centered in COSA,ransformed by chroma log compression into a circle-like lineentered in CE.
ig. 3. Empirical short semiaxes (�) of the whole BFD set of el-ipses [8] as functions of the chroma COSA of the center of the el-ipse and the lines represented by the two sides of relation (12).hese two lines represent in an equally good way the empiricalalues of the short semiaxes, as shown by the RMS values be-ween the empirical data and the points of these lines: 0.379 forhe left side of relation (12) (thin straight line) and 0.374 for theight side (thick line).

3OT�
Tlt
ed
s
v
a
Ac
a�
tatcaradbtt
4STFEsltipfidtUtdGtanffpthfm
fitdrcmcwsbRfTge
AEBcsglBteecslep
124 J. Opt. Soc. Am. A/Vol. 26, No. 1 /January 2009 Oleari et al.
��EE�2 � ��GE�2 + ��JE�2 � ���10HOSA�
SH�2
+ ���10COSA�
SC�2
. �13�
. LIGHTNESS LOG COMPRESSION INSA-UCS SPACE
he contribution of the lightness difference in formulaEGP (1) is as follows:
��10LOSA�
SL=
��10LOSA�
aL + bL�10LOSA�. �14�
he slope bL is very small [Eq. (5) and [3]], generallyower than 0.01 using different empirical datasets, andhis value induces us to consider two options:
(1) No omission of bL; i.e., SL=aL+bL�10LOSA� is consid-red as it is. In this case, as for the chroma, the lightnessependence allows a log-compressed lightness LE
LE � � 1
bL�ln�1 +
bL
aL�10LOSA�� �15�
uch that
�LE =��10LOSA�
SL=
��10LOSA�
aL + bL�10LOSA�. �16�
(2) Omission of bL; i.e., SL�aL, with aL a constantalue, which means rescaling the lightness as follows:
LE �10LOSA
aL�17�
nd
��10LOSA�
SL� �LE =
��10LOSA�
aL. �18�
nyway, now, the final color-difference formula in the log-ompressed OSA-UCS space is Euclidean:
�EE = ���LE�2 + ��GE�2 + ��JE�2, �19�
nd the coordinates �LE ,JE ,GE� are obtained fromLOSA ,J ,G� by Eqs. (2), (8)–(10), and (15) or (17).
Moreover, the crispening phenomenon is considered inhe definition of the lightness in the OSA-UCS system, inccordance with the experimental visual evaluations ofhe color differences. The lightness LOSA takes into ac-ount the crispening produced by a gray background withluminance factor Yb=30. The current definition of LOSA
equires that the color samples be visually compared overuniform background with Yb=30. Because the empiricalatasets considered in this paper have been obtained onackgrounds with different luminance factors Yb, compu-ations with Yb=30 and true Yb are discussed below for allhe datasets (Subsection 4.B and Appendix A).
. PARAMETER OPTIMIZATION ANDTATISTICAL PERFORMANCE OFHE EUCLIDEAN COLOR-DIFFERENCEORMULASmpirical color-difference data are used to define the bestet of parameters of our Euclidean color-difference formu-as and to evaluate their statistical performance. Thesewo operations could be considered as only one operationf the best parameters are those with the best statisticalerformance. Some statistical measures have been de-ned for the evaluation of the agreement between twoatasets one constituted by visually measured data andhe other by data computed by a mathematical formula.p to now, the most used statistical index for measuring
he goodness of the fit of a formula to a set of empiricalata has been the performance factor PF /3, proposed byuan and Luo [11], which is the arithmetic average of
hree different indices. This index, although well knownnd widely used, allows no inference on the statistical sig-ificance of the difference between two color-differenceormulas with respect to a given set of color pairs. There-ore, a statistically more meaningful index, widely em-loyed in multidimensional scaling (MDS) techniques andermed standardized residual sum of squares (STRESS),as been proposed [10] for research on color-differenceormulas (Appendix B). In this work we use this lasteaningful index.The STRESS, as well as PF /3, is independent of a scale
actor; i.e., any change of the unit of distance in the spacen which we specify the color differences or any change ofhe unit used to specify the perceived color differencesoes not alter the STRESS value. This means that the pa-ameters of the Euclidean color-difference formula, whichontribute to define the color space, can be defined byinimizing the STRESS up to a constant factor on the
olor-space coordinates. Moreover, all the computationse have made show that the minimum RMS value corre-
ponds to the minimum STRESS. Therefore, to define theest parameters in our formulas, we decided to choose theMS minimization between visual (empirical) color dif-
erences and color differences computed by the formula.hen the STRESS is used as a statistical index of theoodness of a color-difference formula to represent thempirical color-difference dataset.
. Euclidean Color-Difference Formula Based on BFDllipsesFD ellipses represent chromaticity discrimination at aonstant luminance factor and are constituted by threeets of ellipses [8]: (1) the BFD-P dataset (80 ellipses), re-arding the Perceptibility; (2) the BFD-A dataset (52 el-ipses), regarding the Acceptability; and (3) the wholeFD dataset (132 ellipses), obtained by putting together
he BFD-P and BFD-A datasets. These ellipses are thempirical data used in this section for fitting the param-ters and for evaluating the goodness of the chroma logompression. Because the BFD ellipses are defined at con-tant luminance, it is supposed that for these ellipses theightness difference is equal to zero and the color differ-nce is represented by formula (13), although only ap-roximately, because OSA-UCS lightness takes into ac-
cA
pl
cabettsda
cc(coa
scpt2 ommpRfbwi
trvt�
gT(CleBd
Fo[aca
Oleari et al. Vol. 26, No. 1 /January 2009 /J. Opt. Soc. Am. A 125
ount the Helmholtz–Kohlrausch and crispening effects.nyway, in this section we use Eq. (13).The log compression given by Eq. (8) depends on two
arameters, aC and bC, which, in the case of the BFD el-ipses, can be obtained in two different ways:
I. Minimizing the RMS between the color differencesomputed by �EGP formula (1), in the OSA-UCS space,nd constant visual differences of color pairs constitutedy the centers of the BFD ellipses and points on the samellipses (Table 1), as done in [3] and considered here. Inhis case aH and bH are also considered in the optimiza-ion process. For comparison purposes, the STRESS re-ults achieved by the CIEDE2000 and DIN99d color-ifference formulas are also given in Table 1 (columns 8nd 9).II. Minimizing the RMS between the color differences
omputed by �EE formula (13), in the chroma log-ompressed OSA-UCS space defined by transformations8)–(10), and the constant visual differences of color pairsonstituted by the centers of the BFD ellipses and pointsn the same ellipses (Table 1). In this case only aC and bCre considered in the optimization process.
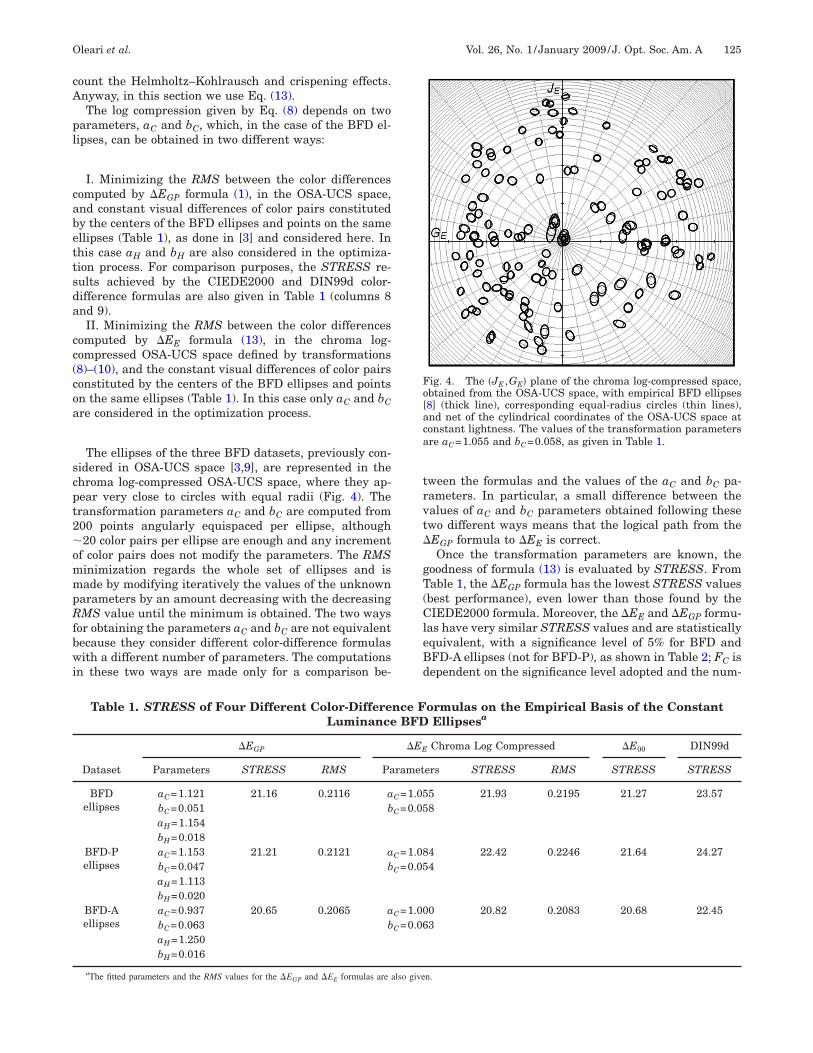
The ellipses of the three BFD datasets, previously con-idered in OSA-UCS space [3,9], are represented in thehroma log-compressed OSA-UCS space, where they ap-ear very close to circles with equal radii (Fig. 4). Theransformation parameters aC and bC are computed from00 points angularly equispaced per ellipse, although20 color pairs per ellipse are enough and any increment
f color pairs does not modify the parameters. The RMSinimization regards the whole set of ellipses and isade by modifying iteratively the values of the unknown
arameters by an amount decreasing with the decreasingMS value until the minimum is obtained. The two ways
or obtaining the parameters aC and bC are not equivalentecause they consider different color-difference formulasith a different number of parameters. The computations
n these two ways are made only for a comparison be-
Table 1. STRESS of Four Different Color-DiffereLuminance
Dataset
�EGP
Parameters STRESS RMS Pa
BFDellipses
aC=1.121 21.16 0.2116 abC=0.051 baH=1.154bH=0.018
BFD-Pellipses
aC=1.153 21.21 0.2121 abC=0.047 baH=1.113bH=0.020
BFD-Aellipses
aC=0.937 20.65 0.2065 abC=0.063 baH=1.250bH=0.016
aThe fitted parameters and the RMS values for the �E and �E formulas are
GP Eween the formulas and the values of the aC and bC pa-ameters. In particular, a small difference between thealues of aC and bC parameters obtained following thesewo different ways means that the logical path from theEGP formula to �EE is correct.Once the transformation parameters are known, the
oodness of formula (13) is evaluated by STRESS. Fromable 1, the �EGP formula has the lowest STRESS valuesbest performance), even lower than those found by theIEDE2000 formula. Moreover, the �EE and �EGP formu-
as have very similar STRESS values and are statisticallyquivalent, with a significance level of 5% for BFD andFD-A ellipses (not for BFD-P), as shown in Table 2; FC isependent on the significance level adopted and the num-
ormulas on the Empirical Basis of the ConstantEllipsesa
Chroma Log Compressed �E00 DIN99d
ers STRESS RMS STRESS STRESS
5 21.93 0.2195 21.27 23.578
4 22.42 0.2246 21.64 24.274
0 20.82 0.2083 20.68 22.453
n.
ig. 4. The �JE ,GE� plane of the chroma log-compressed space,btained from the OSA-UCS space, with empirical BFD ellipses8] (thick line), corresponding equal-radius circles (thin lines),nd net of the cylindrical coordinates of the OSA-UCS space atonstant lightness. The values of the transformation parametersre aC=1.055 and bC=0.058, as given in Table 1.
nce FBFD
�EE
ramet
C=1.05
C=0.05
C=1.08
C=0.05
C=1.00
C=0.06
also give

bcBcl1wtssC
BICAttwfi[ttBDcltUasssf
rE
Ocpcobgeteefcw
ciei=iSedbadwYloiR
ct
RetvSortata
tporbsf�
tSbDt
signific
126 J. Opt. Soc. Am. A/Vol. 26, No. 1 /January 2009 Oleari et al.
er of color pairs used to define the parameters, i.e., 20olor pairs per ellipse and then globally 1600 for theFD-P ellipses and 1040 for BFD-A ones. The empiricalolor pairs employed in [8] were 2776 for the BFD-P el-ipses and around 1550 for the BFD-A ones. From Tables
and 2, we can also conclude that �EE performs slightlyorse than CIEDE2000 (although the difference between
hese two formulas is statistically not significant at a 5%ignificance level), and DIN99d is the worst formula, withtatistically significant differences with respect toIEDE2000, �EGP, and �EE at a 5% significance level.
. Euclidean Color-Difference Formulas Based onndividual Datasets Constituting the COM Datasets andrispening Effectll the empirical color-difference datasets used to define
he CIEDE2000 formula are considered in this section af-er appropriate corrections mentioned in Appendix A,hich are important for correctness but do not alter ournal results deeply. These datasets are BFD-P [8], Leeds
18], RIT-DuPont [19], and Witt [20], which together areermed COM (from Combined) datasets [2]. In this work,aking into account the different light sources used, theFD-P dataset is subdivided into three subsets, BFD-65, BFD-M, and BFD-C. The orders of magnitude of the
orrelated color temperatures of these three adaptationights are 6500 K, 6300 K, and 6800 K, respectively, notoo far from the 6500 K used in the definition of the OSA-CS system, to hinder a comparison and a fusion and tovoid the use of a color appearance model, although,trictly speaking, these three sets should be consideredeparately. On the other side, these three sets were con-idered together in the definition of the color-differenceormula CIEDE2000.
The revised COM datasets are used for fitting the pa-ameters of the color-difference formula (19), defined byqs. (8)–(10) and (15) or (17).Lightness crispening enters both in the definition of the
SA-UCS space and in the spaces derived in this work byhroma and lightness redefinitions, as well as in the em-irical judgment of the color differences. The lightness–rispening phenomenon shifts the lightness of all the col-rs that have a lightness different from that of theackground: the color samples lighter than the back-round appear ever lighter, and the darker ones appearver darker. The luminance crispening has an effect onhe whole lightness scale, but, as the Semmelroth crisp-ning formula shows [21], the effect on the color differ-nces is evident only for color samples with luminanceactors close to that of the background, particularly oneolor sample with luminance lower than Yb and the otherith luminance higher than Y . No one color pair of the
Table 2. F-Test among All the Color-Differenand
Dataset F�EE/�EGPF�EE/�E00
F�EG
BFD ellipses 1.074 1.063 1.0BFD-P ellipses 1.117 1.073 1.0BFD-A ellipses 1.017 1.014 1.0
aThe STRESS values are given in Table 1. Underlined values indicate statistically
b
onsidered datasets is of this kind; therefore the crispen-ng effect on the empirical judgment of the color differ-nces could be ignored. Crispening in the OSA-UCS spaces produced by a background with luminance factor Yb30, while the datasets considered here have crispening
n correspondence to their proper Yb (Appendix A).trictly speaking, we can compare data given with differ-nt Yb only by using a color appearance model suitable too the transformation from a visual situation to another,ut this work has not in its aims the evaluation of a colorppearance model. The OSA-UCS crispening has an evi-ent effect on the color differences only for color pairsith luminance factors close to that of the backgroundb=30, particularly one color sample with luminance
ower than 30 and the other higher than 30. The numberf such color pairs in the considered datasets is low: 2.4%n the BFD-D65 dataset, 0.5% in the BFD-M, 0.3% in theIT-DuPont, 2.6% in the Leeds, and 0% in all the others.In order to evaluate the influence of the crispening, two
omputations are made, considering any dataset as dis-inct from the others:
(1) First, the parameters are computed minimizing theMS with the background-luminance factor Yb proper ofach considered dataset, substituting the value of Yb inhe OSA-UCS lightness formula (Table 3). From STRESSalues given in Table 3, the best formula (lowestTRESS) for all individual datasets is �EGP, followed inrder by �EE with compressed lightness and �EE withescaled lightness. In addition, it is worth noting thathere are no statistically significant differences ��=5% �mong any of these three formulas (with only one excep-ion: the Leeds dataset with �EE with rescaled lightnessnd �EGP).(2) Second, the parameters are computed minimizing
he RMS with the background-luminance factor Yb=30roper of the OSA-UCS lightness formula and are basedn all individual datasets (Appendix A). Table 4 gives theesults only for the W-COM and unW-COM datasets. Asefore, the conclusion from Table 4 is that no statisticallyignificant differences ��=5% � exist among the resultsound by �EGP, �EE with compressed lightness, and byEE with rescaled lightness.
On the basis of the analysis of the crispening effect onhe color differences of the considered datasets, theTRESS values of the first computation are expected toe lower than those of the second one only for the BFD-65, BFD-M, RIT-DuPont, and Leeds datasets. In fact,
he STRESS values for �E and for �E formulas are
rmulas Considered, �EGP, �EE, CIEDE2000,9da
F�EGP/�EDIN99dF�EDIN99d/�E00
F�EDIN99d/�EE
1.241−1 1.228 1.1551.309−1 1.258 1.1721.182−1 1.179 1.163
ant differences at a 5% significance level.
ce FoDIN9
P/�E00
10−1
41−1
03−1
GP E

lDdTLepshms
�ade
riScab
Oleari et al. Vol. 26, No. 1 /January 2009 /J. Opt. Soc. Am. A 127
ower using the measured Yb value only for the RIT-uPont and Leeds datasets, while all BFD and Wittatasets are almost insensitive to shifts of the Yb values.he empirical color differences of the color pairs of theeeds dataset are in large part due to a lightness differ-nce, which may make the �EE with rescaled lightnessarticularly worse. As expected, the �EGP formula, withix fitted parameters regarding lightness, chroma, andue, fits the empirical data better than the Euclidean for-ulas with only four/three fitted parameters. But, even
o, Euclidean formulas are statistically equivalent to the
Table 3. Equation Parameters „aL ,bL ,aC ,bC ,aH ,bH�EE Formulas, Computed for Each One of the Data
Empirical Background Lu
Datasets Yb
�EGP
Parameters RMS STRESS Pa
BFD-D65 20 aL=3.066 0.4716 24.63 abL=0.011 baC=1.162 abC=0.045 baH=1.374bH=0.015
BFD-M 20 aL=4.124 1.0116 31.57 abL=0.036 baC=1.074 abC=0.042 baH=0.834bH=0.028
BFD-C 20 aL=2.405 0.1564 27.76 abL=0.005 baC=1.076 abC=0.057 baH=1.988bH=0.015
BFD-P 20 aL=3.196 0.6233 28.67 abL=0.013 baC=1.198 abC=0.043 baH=1.135bH=0.021
WITT 24.9 aL=2.299 0.4286 33.65 abL=0.001 baC=1.109 abC=0.065 baH=1.535bH=0.016
RIT-DuPont 10.9 aL=2.016 0.1956 19.18 abL=0.004 baC=1.719 abC=0.046 baH=1.783bH=0.010
Leeds 20 aL=2.571 0.2230 20.12 abL=0.010 baC=1.291 abC=0.068 baH=0.965bH=0.027
EGP one, with a significance level of 5%, on the basis ofll individual datasets and excluding the BFD-D65ataset, as it is shown in the next section, with param-ters fitted on COM datasets and Yb=30.
With regard to the considered empirical datasets, theesults have a small dependence on the crispening, lim-ted to a few percent of color pairs of some datasets.trictly, we should not be taking into account therispening-sensitive color pairs, but for comparison withll the other color-difference formulas considered here, allased on the COM datasets, we choose the whole COM
S, and STRESS Values for �EGP and for the TwoConstituting the COM Datasets, Using Their Ownnce Yb (Second Column)
E Log-CompressedLightness (15)
�EE Rescaled Lightness(17)
rs RMS STRESS Parameters RMS STRESS
7 0.4718 24.65 aL=3.040 0.4838 25.2728 aC=1.3553 bC=0.037
2 1.0414 32.50 aL=3.105 1.0727 33.4826 aC=1.0348 bC=0.055
7 0.1618 28.73 aL=2.38 0.1672 29.6967 aC=1.8359 bC=0.037
0 0.6275 28.87 aL=2.888 0.6410 29.4143 aC=1.1918 bC=0.053
3 0.4315 33.88 aL=2.308 0.4322 33.9217 aC=1.3927 bC=0.052
8 0.2028 19.89 aL=2.038 0.2068 20.2533 aC=1.7129 bC=0.036
9 0.2268 20.47 aL=2.511 0.2521 22.7408 aC=1.1737 bC=0.063
…, RMsetsmina
�E
ramete
L=3.08
L=0.01
C=1.24
C=0.04
L=4.18
L=0.04
C=1.02
C=0.05
L=2.40
L=0.00
C=1.64
C=0.04
L=3.19
L=0.01
C=1.18
C=0.04
L=2.29
L=0.00
C=1.34
C=0.05
L=1.99
L=0.00
C=1.67
C=0.03
L=2.56
L=0.01
C=1.14
C=0.06

dei
CWCIbdptCaswa
9(WsofCttcddTTmTd
128 J. Opt. Soc. Am. A/Vol. 26, No. 1 /January 2009 Oleari et al.
atasets for the definition of the parameters of the Euclid-an formula in the log-compressed OSA-UCS space withts Yb=30 (Table 4).
. Euclidean Color-Difference Formulas Based on thehole COM Datasets in Comparison with �EGP,
IEDE2000, and DIN99d Formulasn order to define the transformation parameters on theasis of the greatest set of color pairs, the whole COMatasets with the background-luminance factor Yb=30,roper of the OSA-UCS lightness formula, are used inhis section. Specifically, the four datasets employed atIEDE2000 development (BFD-P, Leeds, RIT-DuPont,nd Witt) are considered here in two different ways: aimple addition of these four datasets (the so-called un-eighted COM dataset, here denoted by unW-COM) andweighted addition, with weight 1 for the BFD-P dataset,
Table 4. Equation Parameters „aL ,bL ,aC ,bC ,aH ,bH�EE Formulas, Computed for the Two COM Datase
OSA-U
Datasets
�EGP �EE Log
Parameters RMS STRESS Paramete
unW-COM aL=3.042 0.5597 28.70 aL=3.07bL=0.014 bL=0.01aC=1.191 aC=1.19bC=0.045 bC=0.04aH=1.197bH=0.019
W-COM aL=2.499a 0.4350 29.70 aL=2.89bL=0.007a bL=0.01aC=1.235a aC=1.25bC=0.058a bC=0.05aH=1.392a
bH=0.017a
aParameters defined on the weighted COM dataset before the revision given in A
Table 5. STRESS Values of All the Color-Differencand DIN99d, Related to All th
Dataset
�EGP
Fitted onW-COM
�EGP
Fitted onunW-COM
�EE Log-Compressed
Lightness (15)Fitted onW-COM
�
CoLig
Fu
BFD ellipses 21.27 21.98 21.46BFD-P ellipses 21.34 21.71 21.37BFD-A ellipses 20.91 22.02 21.28
BFD-D65 27.64 24.88 25.66BFD-M 33.14 32.15 32.27BFD-C 30.09 32.27 31.38BFD-P 30.14 28.28 28.73
Witt 32.19 36.46 35.08RIT-DuPont 24.29 26.70 25.32
Leeds 27.41 27.36 26.22unW-COM 30.09 28.70 28.95
W-COM 29.70 29.89 29.48
aThe parameters of the �E and �E ’s formulas are given in Table 4.
GP Efor the RIT-DuPont, 9 for the Leeds and 7 for the Wittthe so-called weighted COM dataset, here denoted by
-COM). These weighting factors (Appendix A) were cho-en by the CIE TC 1–47 at CIEDE2000 development inrder to produce a similar number of color pairs from theour laboratories providing the experimental datasets.ertainly, this weighting is controversial, and we think
hat only metrological and visual accuracy and uncer-ainty, as well as statistical and instrumental reasons,ould introduce different weightings on the empiricalatasets. Anyway, the unweighted and weighted COMatasets are considered here for comparison purposes.he parameters are obtained by minimizing the RMS.able 4 gives the parameters of the color-difference for-ulas fitted on the W-COM and unW-COM datasets.
able 5 summarizes the STRESS values for differentatasets and all the considered color-difference formulas,
S, and STRESS Values for �EGP and for the Twosing the Background Luminance Yb=30, as in thepace
ressed Lightness (15)�EE
Rescaled Lightness (17)
RMS STRESS Parameters RMS STRESS
0.5598 28.71 aL=2.788 0.5770 29.46
aC=1.205bC=0.051
0.4317 29.48 aL=2.616 0.4403 29.99
aC=1.276bC=0.053
A and proposed in the previous work 3.
mulas Considered, �EGP, both �EE’s, CIEDE2000,ferent Datasets Considereda
g-sed(15)nM
�EE
RescaledLightness (17)
Fitted onW-COM
�EE
RescaledLightness (17)
Fitted onunW-COM
�E00Fitted onW-COM
DIN99dFitted onW-COM
21.37 21.34 21.27 23.5721.32 21.30 21.64 24.2721.15 21.09 20.68 22.4527.58 26.36 24.09 26.3032.44 32.54 35.22 37.3631.67 32.75 29.08 28.7929.85 29.24 29.55 31.7032.09 33.56 30.22 30.0626.49 27.48 19.48 20.9129.03 28.69 19.25 22.7629.92 29.46 29.20 31.2429.99 30.02 27.49 29.24
…, RMts, UCS S
-Comp
rs
0508
0560
ppendix
e Fore Dif
EE Lompreshtnessitted o
nW-CO
21.4321.3521.2424.8232.3232.2428.3336.2126.5626.8128.7129.74
inoauFtmabRu(
mawsttsnfiCCnmdfieiSec
�
fpw
Cu2tt=�
dCnB
Cess�
slL�
ldl�
daf(
imd
Oleari et al. Vol. 26, No. 1 /January 2009 /J. Opt. Soc. Am. A 129
.e., �EGP, �EE with log-compressed and rescaled light-ess, CIEDE2000, and DIN99d. Table 6 gives the resultsf the F-tests related to the comparison between �EGPnd both �EE’s for parameters fitted on the W-COM andnW-COM datasets. Table 7 gives the results of the-tests related to all the color-difference formulas and all
he datasets considered here, taking the CIEDE2000 for-ula as a reference. In these tables the critical values FC
re assumed at the significance level of 5%, and the num-er of degrees of freedom adopted is �N−1�, except for theIT-DuPont and weighted COM datasets (W-COM andnW-COM), where we adopt 155 and 3656, respectivelyAppendix B and [22]).
Let us consider separately three comparisons:
(i) Comparison of the ellipsoidal color-difference for-ula �EGP formula with the CIEDE2000 based on the
nalysis of the STRESS (not considered in our previousork [3]). The formulas �EGP (1), evaluated on the three
ets of BFD ellipses, show STRESS values slightly higherhan CIEDE2000, except for BFD-P ellipses and �EGP fit-ed on W-COM (Table 5), but the F-test (Table 7) reveals atatistical equivalence among these formulas with a sig-ificance level �=5% (except for BFD-A ellipses and �EGPtted on unW-COM). From Table 7, �EGP fitted on unW-OM is not statistically significantly different fromIEDE2000 ��=5% � for the unW-COM dataset but is sig-ificantly different for the W-COM dataset. This resultay be a consequence of differences among the four
atasets involved in the COM datasets [22]: while �EGPtted on W-COM and CIEDE2000 are significantly differ-nt for the RIT-DuPont and Leeds datasets, the opposites true for the Witt and BFD-P datasets (Table 7). TheTRESS values reveal different capabilities of the differ-nt formulas to fit the empirical data, which could be as-ribed to a nonhomogeneity of the empirical datasets [22].
(ii) Comparison of the two Euclidean formulas with the
EGP. Because the two Euclidean formulas are derivedrom the �EGP formula with a reduction in the number ofarameters, we expect a lower performance of �EE’s, butith a high statistical compatibility.Formulas �EGP (1) and �EE, fitted on the weighted
OM and unweighted COM datasets, have STRESS val-es for the three sets of BFD ellipses in a short range:0.91–22.02 (Table 5). The F-test comparison based onhese STRESS values reveals that both �EE’s are statis-ically equivalent to �EGP with a significance level �5% (Table 6) with two minor exceptions: the formulaEE with log-compressed lightness fitted on the W-COMataset and evaluated on the BFD-D65, BFD-P, and unW-OM datasets; and the formula �EE with rescaled light-ess fitted on the unW-COM dataset and evaluated on theFD-D65 dataset.(iii) Comparison of the Euclidean formulas with the
IEDE2000. If in most cases formula �EGP is statisticallyquivalent to formula CIEDE2000 and the �EE’s are alsotatistically equivalent to formula �EGP with an equalignificance level, this does not mean that the formulasEE’s are statistically equivalent to CIEDE2000 with theame significance level. The CIEDE2000 formula has theowest STRESS values related to the RIT-DuPont andeeds datasets, and the significant differences betweenEE’s and CIEDE2000 for these two datasets (Table 7)
ead also to significant differences for the W-COMataset, but not for the unW-COM one. For the BFD el-ipses, there are no significant differences between theEE’s formulas and CIEDE2000, while for the four BFDatasets (BFD-D65, BFD-M, BFD-C, and BFD-P) therere statistically significant differences between the �EE’sormulas and the CIEDE2000 in 6/16 (37.5%) of the casesTable 7).
Tables 3–7 show that the different datasets constitut-ng the COM datasets are quite inhomogeneous, in agree-
ent with recent research [22], and probably someatasets have high noise:
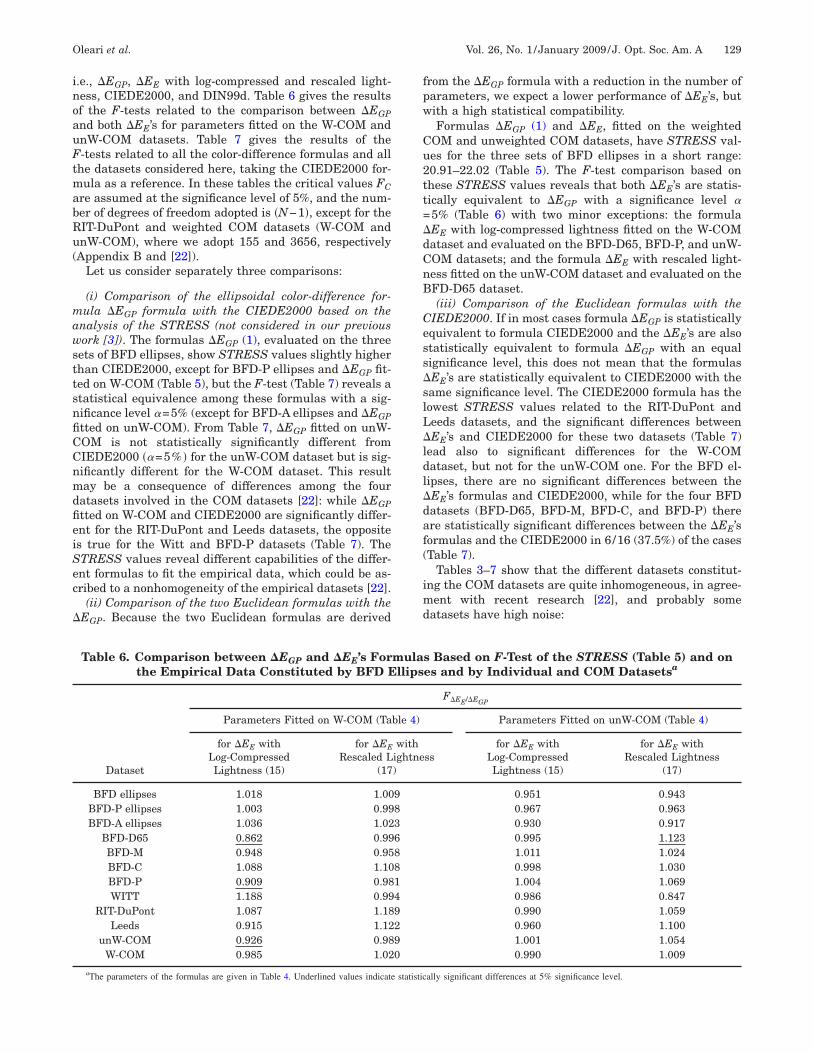
Table 6. Comparison between �EGP and �EE’s Formulas Based on F-Test of the STRESS (Table 5) and onthe Empirical Data Constituted by BFD Ellipses and by Individual and COM Datasetsa
Dataset
F�EE/�EGP
Parameters Fitted on W-COM (Table 4) Parameters Fitted on unW-COM (Table 4)
for �EE withLog-CompressedLightness (15)
for �EE withRescaled Lightness
(17)
for �EE withLog-CompressedLightness (15)
for �EE withRescaled Lightness
(17)
BFD ellipses 1.018 1.009 0.951 0.943BFD-P ellipses 1.003 0.998 0.967 0.963BFD-A ellipses 1.036 1.023 0.930 0.917
BFD-D65 0.862 0.996 0.995 1.123BFD-M 0.948 0.958 1.011 1.024BFD-C 1.088 1.108 0.998 1.030BFD-P 0.909 0.981 1.004 1.069WITT 1.188 0.994 0.986 0.847
RIT-DuPont 1.087 1.189 0.990 1.059Leeds 0.915 1.122 0.960 1.100
unW-COM 0.926 0.989 1.001 1.054W-COM 0.985 1.020 0.990 1.009
aThe parameters of the formulas are given in Table 4. Underlined values indicate statistically significant differences at 5% significance level.
dh
1a
�0
�
f1
drcufi
dpadstlu
ttenc
brfilofiottt
chct(cDrwdefl
ed value
130 J. Opt. Soc. Am. A/Vol. 26, No. 1 /January 2009 Oleari et al.
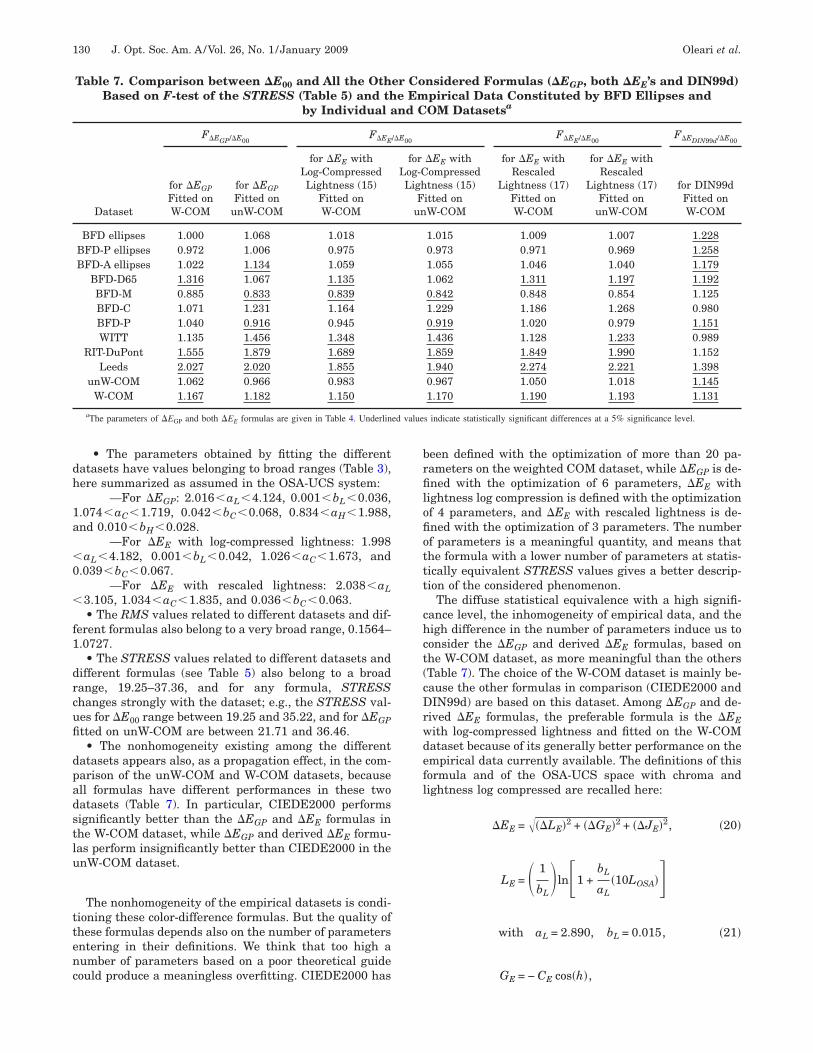
• The parameters obtained by fitting the differentatasets have values belonging to broad ranges (Table 3),ere summarized as assumed in the OSA-UCS system:
—For �EGP: 2.016�aL�4.124, 0.001�bL�0.036,.074�aC�1.719, 0.042�bC�0.068, 0.834�aH�1.988,nd 0.010�bH�0.028.
—For �EE with log-compressed lightness: 1.998aL�4.182, 0.001�bL�0.042, 1.026�aC�1.673, and
.039�bC�0.067.—For �EE with rescaled lightness: 2.038�aL
3.105, 1.034�aC�1.835, and 0.036�bC�0.063.• The RMS values related to different datasets and dif-
erent formulas also belong to a very broad range, 0.1564–.0727.• The STRESS values related to different datasets and
ifferent formulas (see Table 5) also belong to a broadange, 19.25–37.36, and for any formula, STRESShanges strongly with the dataset; e.g., the STRESS val-es for �E00 range between 19.25 and 35.22, and for �EGPtted on unW-COM are between 21.71 and 36.46.• The nonhomogeneity existing among the different
atasets appears also, as a propagation effect, in the com-arison of the unW-COM and W-COM datasets, becausell formulas have different performances in these twoatasets (Table 7). In particular, CIEDE2000 performsignificantly better than the �EGP and �EE formulas inhe W-COM dataset, while �EGP and derived �EE formu-as perform insignificantly better than CIEDE2000 in thenW-COM dataset.
The nonhomogeneity of the empirical datasets is condi-ioning these color-difference formulas. But the quality ofhese formulas depends also on the number of parametersntering in their definitions. We think that too high aumber of parameters based on a poor theoretical guideould produce a meaningless overfitting. CIEDE2000 has
Table 7. Comparison between �E00 and All the OthBased on F-test of the STRESS (Table 5) and th
by Individual a
Dataset
F�EGP/�E00F�EE
for �EGP
Fitted onW-COM
for �EGP
Fitted onunW-COM
for �EE withLog-CompressedLightness (15)
Fitted onW-COM
BFD ellipses 1.000 1.068 1.018BFD-P ellipses 0.972 1.006 0.975BFD-A ellipses 1.022 1.134 1.059
BFD-D65 1.316 1.067 1.135BFD-M 0.885 0.833 0.839BFD-C 1.071 1.231 1.164BFD-P 1.040 0.916 0.945WITT 1.135 1.456 1.348
RIT-DuPont 1.555 1.879 1.689Leeds 2.027 2.020 1.855
unW-COM 1.062 0.966 0.983W-COM 1.167 1.182 1.150
aThe parameters of �EGP and both �EE formulas are given in Table 4. Underlin
een defined with the optimization of more than 20 pa-ameters on the weighted COM dataset, while �EGP is de-ned with the optimization of 6 parameters, �EE with
ightness log compression is defined with the optimizationf 4 parameters, and �EE with rescaled lightness is de-ned with the optimization of 3 parameters. The numberf parameters is a meaningful quantity, and means thathe formula with a lower number of parameters at statis-ically equivalent STRESS values gives a better descrip-ion of the considered phenomenon.
The diffuse statistical equivalence with a high signifi-ance level, the inhomogeneity of empirical data, and theigh difference in the number of parameters induce us toonsider the �EGP and derived �EE formulas, based onhe W-COM dataset, as more meaningful than the othersTable 7). The choice of the W-COM dataset is mainly be-ause the other formulas in comparison (CIEDE2000 andIN99d) are based on this dataset. Among �EGP and de-
ived �EE formulas, the preferable formula is the �EEith log-compressed lightness and fitted on the W-COMataset because of its generally better performance on thempirical data currently available. The definitions of thisormula and of the OSA-UCS space with chroma andightness log compressed are recalled here:
�EE = ���LE�2 + ��GE�2 + ��JE�2, �20�
LE = � 1
bL�ln�1 +
bL
aL�10LOSA��
with aL = 2.890, bL = 0.015, �21�
G = − C cos�h�,
nsidered Formulas (�EGP, both �EE’s and DIN99d)pirical Data Constituted by BFD Ellipses andOM Datasetsa
F�EE/�E00F�EDIN99d/�E00
�EE withompressedtness (15)itted onW-COM
for �EE withRescaled
Lightness (17)Fitted onW-COM
for �EE withRescaled
Lightness (17)Fitted on
unW-COM
for DIN99dFitted onW-COM
1.015 1.009 1.007 1.2280.973 0.971 0.969 1.2581.055 1.046 1.040 1.1791.062 1.311 1.197 1.1920.842 0.848 0.854 1.1251.229 1.186 1.268 0.9800.919 1.020 0.979 1.1511.436 1.128 1.233 0.9891.859 1.849 1.990 1.1521.940 2.274 2.221 1.3980.967 1.050 1.018 1.1451.170 1.190 1.193 1.131
s indicate statistically significant differences at a 5% significance level.
er Coe Emnd C
/�E00
forLog-CLigh
Fun
E E
w
5TtrmattAeselhdplc
l
av
nfponsfissesrtdsvsc
rcU
Rwconta
Clbodpatprmsrtttetl(lt
ATddh
cfl
bo
ag
ct
imi
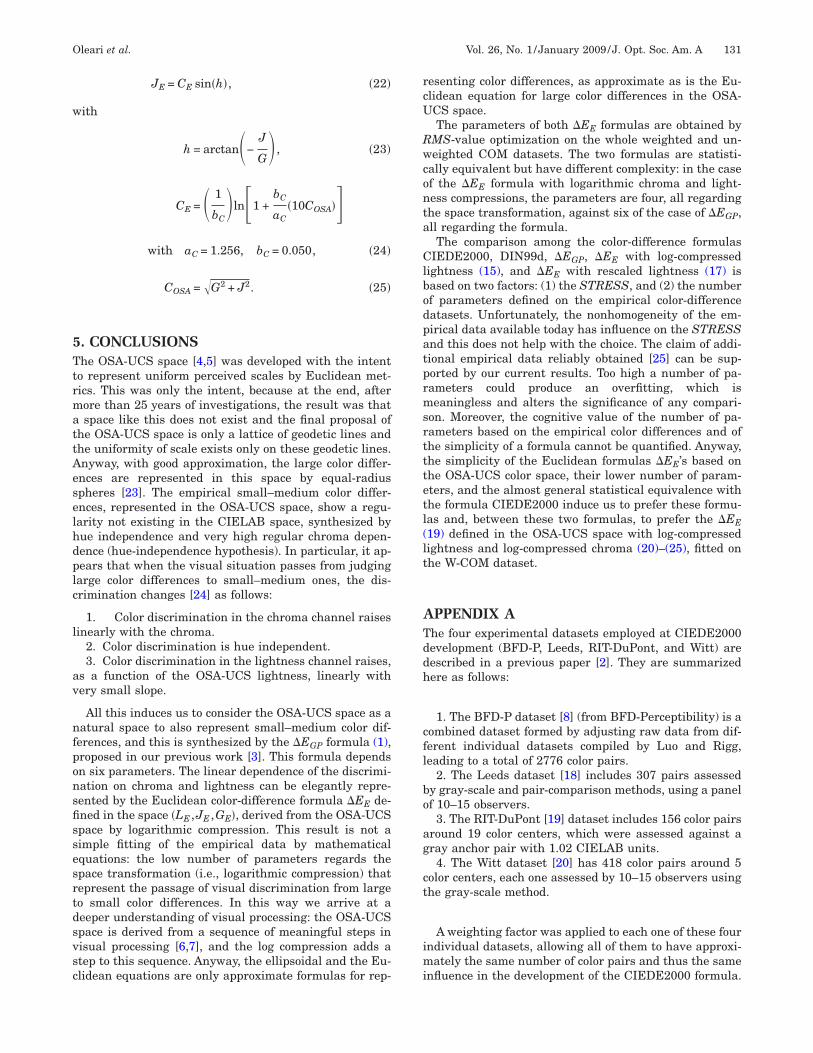
Oleari et al. Vol. 26, No. 1 /January 2009 /J. Opt. Soc. Am. A 131
JE = CE sin�h�, �22�
ith
h = arctan�−J
G� , �23�
CE = � 1
bC�ln�1 +
bC
aC�10COSA��
with aC = 1.256, bC = 0.050, �24�
COSA = �G2 + J2. �25�
. CONCLUSIONShe OSA-UCS space [4,5] was developed with the intento represent uniform perceived scales by Euclidean met-ics. This was only the intent, because at the end, afterore than 25 years of investigations, the result was thatspace like this does not exist and the final proposal of
he OSA-UCS space is only a lattice of geodetic lines andhe uniformity of scale exists only on these geodetic lines.nyway, with good approximation, the large color differ-nces are represented in this space by equal-radiuspheres [23]. The empirical small–medium color differ-nces, represented in the OSA-UCS space, show a regu-arity not existing in the CIELAB space, synthesized byue independence and very high regular chroma depen-ence (hue-independence hypothesis). In particular, it ap-ears that when the visual situation passes from judgingarge color differences to small–medium ones, the dis-rimination changes [24] as follows:
1. Color discrimination in the chroma channel raisesinearly with the chroma.
2. Color discrimination is hue independent.3. Color discrimination in the lightness channel raises,
s a function of the OSA-UCS lightness, linearly withery small slope.
All this induces us to consider the OSA-UCS space as aatural space to also represent small–medium color dif-erences, and this is synthesized by the �EGP formula (1),roposed in our previous work [3]. This formula dependsn six parameters. The linear dependence of the discrimi-ation on chroma and lightness can be elegantly repre-ented by the Euclidean color-difference formula �EE de-ned in the space �LE ,JE ,GE�, derived from the OSA-UCSpace by logarithmic compression. This result is not aimple fitting of the empirical data by mathematicalquations: the low number of parameters regards thepace transformation (i.e., logarithmic compression) thatepresent the passage of visual discrimination from largeo small color differences. In this way we arrive at aeeper understanding of visual processing: the OSA-UCSpace is derived from a sequence of meaningful steps inisual processing [6,7], and the log compression adds atep to this sequence. Anyway, the ellipsoidal and the Eu-lidean equations are only approximate formulas for rep-
esenting color differences, as approximate as is the Eu-lidean equation for large color differences in the OSA-CS space.The parameters of both �EE formulas are obtained by
MS-value optimization on the whole weighted and un-eighted COM datasets. The two formulas are statisti-
ally equivalent but have different complexity: in the casef the �EE formula with logarithmic chroma and light-ess compressions, the parameters are four, all regardinghe space transformation, against six of the case of �EGP,ll regarding the formula.The comparison among the color-difference formulas
IEDE2000, DIN99d, �EGP, �EE with log-compressedightness (15), and �EE with rescaled lightness (17) isased on two factors: (1) the STRESS, and (2) the numberf parameters defined on the empirical color-differenceatasets. Unfortunately, the nonhomogeneity of the em-irical data available today has influence on the STRESSnd this does not help with the choice. The claim of addi-ional empirical data reliably obtained [25] can be sup-orted by our current results. Too high a number of pa-ameters could produce an overfitting, which iseaningless and alters the significance of any compari-
on. Moreover, the cognitive value of the number of pa-ameters based on the empirical color differences and ofhe simplicity of a formula cannot be quantified. Anyway,he simplicity of the Euclidean formulas �EE’s based onhe OSA-UCS color space, their lower number of param-ters, and the almost general statistical equivalence withhe formula CIEDE2000 induce us to prefer these formu-as and, between these two formulas, to prefer the �EE19) defined in the OSA-UCS space with log-compressedightness and log-compressed chroma (20)–(25), fitted onhe W-COM dataset.
PPENDIX Ahe four experimental datasets employed at CIEDE2000evelopment (BFD-P, Leeds, RIT-DuPont, and Witt) areescribed in a previous paper [2]. They are summarizedere as follows:
1. The BFD-P dataset [8] (from BFD-Perceptibility) is aombined dataset formed by adjusting raw data from dif-erent individual datasets compiled by Luo and Rigg,eading to a total of 2776 color pairs.
2. The Leeds dataset [18] includes 307 pairs assessedy gray-scale and pair-comparison methods, using a panelf 10–15 observers.
3. The RIT-DuPont [19] dataset includes 156 color pairsround 19 color centers, which were assessed against aray anchor pair with 1.02 CIELAB units.
4. The Witt dataset [20] has 418 color pairs around 5olor centers, each one assessed by 10–15 observers usinghe gray-scale method.
A weighting factor was applied to each one of these fourndividual datasets, allowing all of them to have approxi-
ately the same number of color pairs and thus the samenfluence in the development of the CIEDE2000 formula.
TtcwwWm
di
fvct
(atpsmt
couC
icc
0f
aw
a
igtfw
d
vscefbpcLtY
Ygnwt#vla
ptidtdawd93dT
ALw
wvdmp
Sa
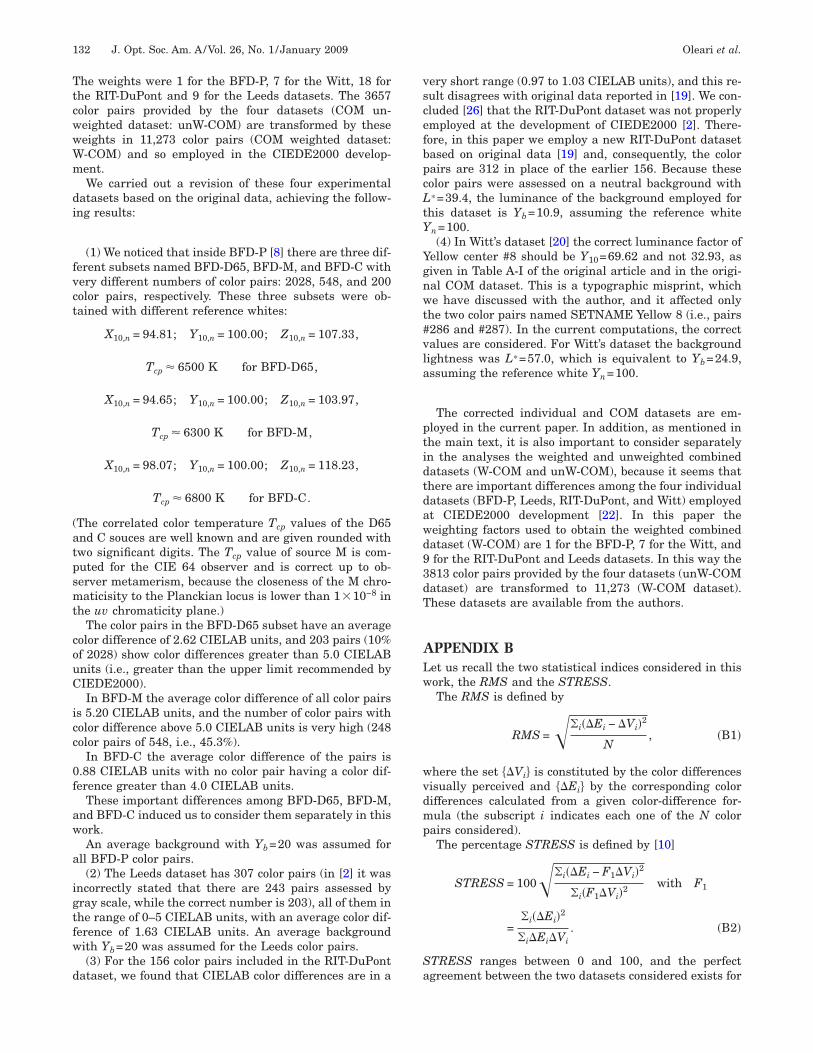
132 J. Opt. Soc. Am. A/Vol. 26, No. 1 /January 2009 Oleari et al.
he weights were 1 for the BFD-P, 7 for the Witt, 18 forhe RIT-DuPont and 9 for the Leeds datasets. The 3657olor pairs provided by the four datasets (COM un-eighted dataset: unW-COM) are transformed by theseeights in 11,273 color pairs (COM weighted dataset:-COM) and so employed in the CIEDE2000 develop-ent.We carried out a revision of these four experimental
atasets based on the original data, achieving the follow-ng results:
(1) We noticed that inside BFD-P [8] there are three dif-erent subsets named BFD-D65, BFD-M, and BFD-C withery different numbers of color pairs: 2028, 548, and 200olor pairs, respectively. These three subsets were ob-ained with different reference whites:
X10,n = 94.81; Y10,n = 100.00; Z10,n = 107.33,
Tcp � 6500 K for BFD-D65,
X10,n = 94.65; Y10,n = 100.00; Z10,n = 103.97,
Tcp � 6300 K for BFD-M,
X10,n = 98.07; Y10,n = 100.00; Z10,n = 118.23,
Tcp � 6800 K for BFD-C.
The correlated color temperature Tcp values of the D65nd C souces are well known and are given rounded withwo significant digits. The Tcp value of source M is com-uted for the CIE 64 observer and is correct up to ob-erver metamerism, because the closeness of the M chro-aticisity to the Planckian locus is lower than 1�10−8 in
he uv chromaticity plane.)The color pairs in the BFD-D65 subset have an average
olor difference of 2.62 CIELAB units, and 203 pairs (10%f 2028) show color differences greater than 5.0 CIELABnits (i.e., greater than the upper limit recommended byIEDE2000).In BFD-M the average color difference of all color pairs
s 5.20 CIELAB units, and the number of color pairs witholor difference above 5.0 CIELAB units is very high (248olor pairs of 548, i.e., 45.3%).
In BFD-C the average color difference of the pairs is.88 CIELAB units with no color pair having a color dif-erence greater than 4.0 CIELAB units.
These important differences among BFD-D65, BFD-M,nd BFD-C induced us to consider them separately in thisork.An average background with Yb=20 was assumed for
ll BFD-P color pairs.(2) The Leeds dataset has 307 color pairs (in [2] it was
ncorrectly stated that there are 243 pairs assessed byray scale, while the correct number is 203), all of them inhe range of 0–5 CIELAB units, with an average color dif-erence of 1.63 CIELAB units. An average backgroundith Yb=20 was assumed for the Leeds color pairs.(3) For the 156 color pairs included in the RIT-DuPont
ataset, we found that CIELAB color differences are in a
ery short range (0.97 to 1.03 CIELAB units), and this re-ult disagrees with original data reported in [19]. We con-luded [26] that the RIT-DuPont dataset was not properlymployed at the development of CIEDE2000 [2]. There-ore, in this paper we employ a new RIT-DuPont datasetased on original data [19] and, consequently, the colorairs are 312 in place of the earlier 156. Because theseolor pairs were assessed on a neutral background with*=39.4, the luminance of the background employed for
his dataset is Yb=10.9, assuming the reference whiten=100.(4) In Witt’s dataset [20] the correct luminance factor of
ellow center #8 should be Y10=69.62 and not 32.93, asiven in Table A-I of the original article and in the origi-al COM dataset. This is a typographic misprint, whiche have discussed with the author, and it affected only
he two color pairs named SETNAME Yellow 8 (i.e., pairs286 and #287). In the current computations, the correctalues are considered. For Witt’s dataset the backgroundightness was L*=57.0, which is equivalent to Yb=24.9,ssuming the reference white Yn=100.
The corrected individual and COM datasets are em-loyed in the current paper. In addition, as mentioned inhe main text, it is also important to consider separatelyn the analyses the weighted and unweighted combinedatasets (W-COM and unW-COM), because it seems thathere are important differences among the four individualatasets (BFD-P, Leeds, RIT-DuPont, and Witt) employedt CIEDE2000 development [22]. In this paper theeighting factors used to obtain the weighted combinedataset (W-COM) are 1 for the BFD-P, 7 for the Witt, andfor the RIT-DuPont and Leeds datasets. In this way the
813 color pairs provided by the four datasets (unW-COMataset) are transformed to 11,273 (W-COM dataset).hese datasets are available from the authors.
PPENDIX Bet us recall the two statistical indices considered in thisork, the RMS and the STRESS.The RMS is defined by
RMS =��i��Ei − �Vi�2
N, �B1�
here the set ��Vi� is constituted by the color differencesisually perceived and ��Ei� by the corresponding colorifferences calculated from a given color-difference for-ula (the subscript i indicates each one of the N color
airs considered).The percentage STRESS is defined by [10]
STRESS = 100��i��Ei − F1�Vi�2
�i�F1�Vi�2 with F1
=�i��Ei�2
�i�Ei�Vi. �B2�
TRESS ranges between 0 and 100, and the perfectgreement between the two datasets considered exists for
tm
adnded
wwldofI
cpn−tics
t
t
t
p
w
b=
saspcdscnr
ACMAt22HRygPgw(tac
R
t color p
Oleari et al. Vol. 26, No. 1 /January 2009 /J. Opt. Soc. Am. A 133
he value 0, while value 100 indicates the worst agree-ent.As explained in the original paper [10], STRESS has
n important application (nonexisting for the PF /3 in-ex), because it allows an inference on the statistical sig-ificance of the difference between two different color-ifference formulas with respect to a given set of visuallyvaluated color pairs [10]. Let A and B be two color-ifference formulas and
FA/B � �STRESSA
STRESSB�2
, �B3�
here STRESSX indicates the value of STRESS foundith the formula X. It can be assumed that ratio (B3) fol-
ows a statistical F-distribution [22], and the inference isone by comparing it to a critical value FC, which dependsn the desired significance level � and on the degrees ofreedom related to the number N of employed color pairs.n this case the statistical hypotheses are
H0: both formulas are equivalent,H1: the two formulas are not equivalent,
and the significance test is two sided (e.g., the signifi-ance test should be only one sided for the different hy-othesis H1: the formula A is better than B). Since the sig-ificance test is two sided, a confidence interval [Fc=F�1� /2 ;N−1;N−1�, 1 /Fc=F�� /2 ;N−1;N−1�] exists such
hat, if FA/B belongs to such an interval, the formula A isnsignificantly different from formula B with a signifi-ance level �; as usual, the significance level �=5% is con-idered here:
—The color-difference formula A is significantly betterhan B when FA/B�FC.
—The color-difference formula A is significantly poorerhan B when FA/B�1/FC.
—The color-difference formula A is insignificantly bet-er than B when FC�FA/B�1.
—The color-difference formula A is insignificantlyoorer than B when 1�FA/B�1/FC.—The color-difference formula A is equivalent to B
hen FA/B=1.
For a significance level �=5%, the critical value Fc cane obtained from tables, or using the function FcDISTR.INV (0.975; N−1; N−1) of the Microsoft Excel
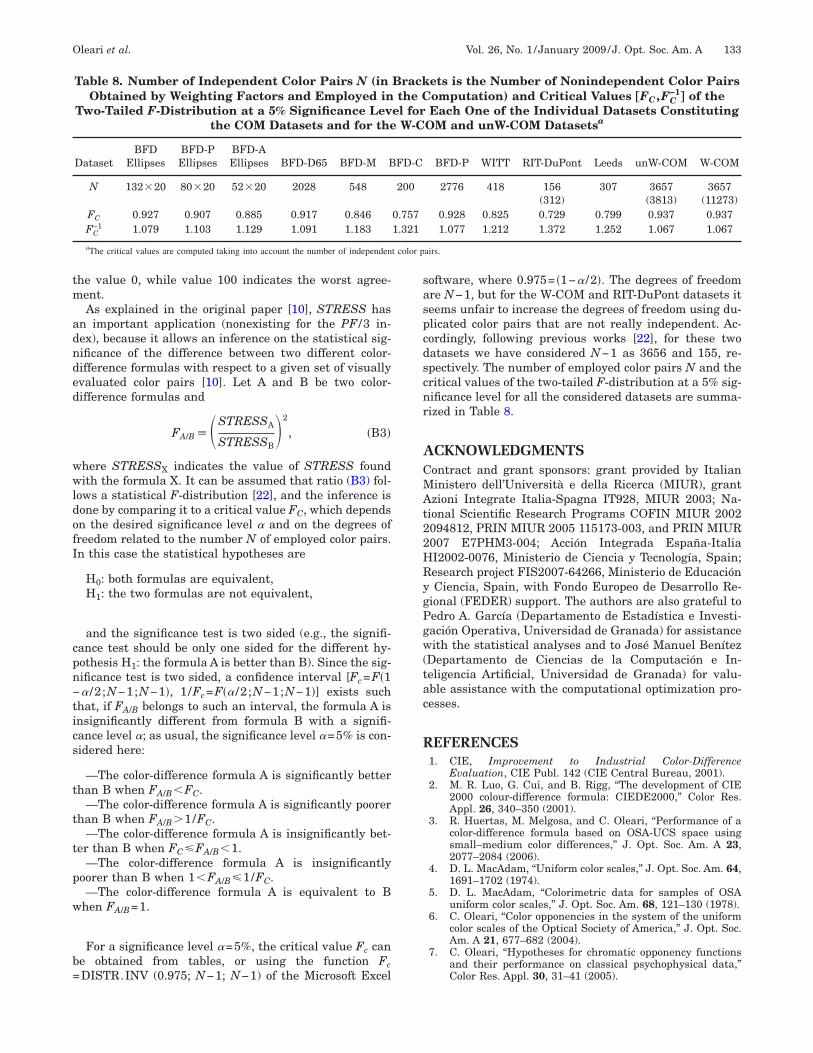
Table 8. Number of Independent Color Pairs N (inObtained by Weighting Factors and Employed in
Two-Tailed F-Distribution at a 5% Significance Levthe COM Datasets and for the
DatasetBFD
EllipsesBFD-PEllipses
BFD-AEllipses BFD-D65 BFD-M B
N 132�20 80�20 52�20 2028 548
FC 0.927 0.907 0.885 0.917 0.846FC
−1 1.079 1.103 1.129 1.091 1.183
aThe critical values are computed taking into account the number of independen
oftware, where 0.975= �1−� /2�. The degrees of freedomre N−1, but for the W-COM and RIT-DuPont datasets iteems unfair to increase the degrees of freedom using du-licated color pairs that are not really independent. Ac-ordingly, following previous works [22], for these twoatasets we have considered N−1 as 3656 and 155, re-pectively. The number of employed color pairs N and theritical values of the two-tailed F-distribution at a 5% sig-ificance level for all the considered datasets are summa-ized in Table 8.
CKNOWLEDGMENTSontract and grant sponsors: grant provided by Italianinistero dell’Università e della Ricerca (MIUR), grantzioni Integrate Italia-Spagna IT928, MIUR 2003; Na-
ional Scientific Research Programs COFIN MIUR 2002094812, PRIN MIUR 2005 115173-003, and PRIN MIUR007 E7PHM3-004; Acción Integrada España-ItaliaI2002-0076, Ministerio de Ciencia y Tecnología, Spain;esearch project FIS2007-64266, Ministerio de EducaciónCiencia, Spain, with Fondo Europeo de Desarrollo Re-
ional (FEDER) support. The authors are also grateful toedro A. García (Departamento de Estadística e Investi-ación Operativa, Universidad de Granada) for assistanceith the statistical analyses and to José Manuel Benítez
Departamento de Ciencias de la Computación e In-eligencia Artificial, Universidad de Granada) for valu-ble assistance with the computational optimization pro-esses.
EFERENCES1. CIE, Improvement to Industrial Color-Difference
Evaluation, CIE Publ. 142 (CIE Central Bureau, 2001).2. M. R. Luo, G. Cui, and B. Rigg, “The development of CIE
2000 colour-difference formula: CIEDE2000,” Color Res.Appl. 26, 340–350 (2001).
3. R. Huertas, M. Melgosa, and C. Oleari, “Performance of acolor-difference formula based on OSA-UCS space usingsmall–medium color differences,” J. Opt. Soc. Am. A 23,2077–2084 (2006).
4. D. L. MacAdam, “Uniform color scales,” J. Opt. Soc. Am. 64,1691–1702 (1974).
5. D. L. MacAdam, “Colorimetric data for samples of OSAuniform color scales,” J. Opt. Soc. Am. 68, 121–130 (1978).
6. C. Oleari, “Color opponencies in the system of the uniformcolor scales of the Optical Society of America,” J. Opt. Soc.Am. A 21, 677–682 (2004).
7. C. Oleari, “Hypotheses for chromatic opponency functionsand their performance on classical psychophysical data,”Color Res. Appl. 30, 31–41 (2005).
ets is the Number of Nonindependent Color Pairsomputation) and Critical Values †FC ,FC
−1‡ of the
Each One of the Individual Datasets ConstitutingOM and unW-COM Datasetsa
BFD-P WITT RIT-DuPont Leeds unW-COM W-COM
2776 418 156(312)
307 3657(3813)
3657(11273)
0.928 0.825 0.729 0.799 0.937 0.9371.077 1.212 1.372 1.252 1.067 1.067
airs.
Brackthe C
el forW-C
FD-C
200
0.7571.321
1
1
1
1
1
1
1
1
1
1
2
2
2
2
2
2
2
134 J. Opt. Soc. Am. A/Vol. 26, No. 1 /January 2009 Oleari et al.
8. M. R. Luo and B. Rigg, “Chromaticity-discriminationellipses for surface colors,” Color Res. Appl. 11, 25–42(1986).
9. C. Oleari, M. Melgosa, and R. Huertas, “Euclidean color-difference formula in chroma compressed OSA-UCS space,”in Proceedings of the 3rd European Conference on Color inGraphics, Imaging and Vision (CGIV 2006) (IEEEComputer Society, 2006), pp. 294–297.
0. P. A. García, R. Huertas, M. Melgosa, and G. Cui,“Measurement of the relationship between perceived andcomputed color differences,” J. Opt. Soc. Am. A 24,1823–1829 (2007).
1. S. S. Guan and M. R. Luo, “Investigation of parametriceffects using small colour-differences,” J. Opt. Soc. Am. A24, 331–343 (1999).
2. G. Cui, M. R. Luo, B. Rigg, G. Rösler, and K. Witt,“Uniform colour spaces based on the DIN99 colourdifference formula,” Color Res. Appl. 27, 282–290 (2002).
3. K. Thomsen, “A Euclidean color space in high agreementwith the CIE94 color difference formula,” Color Res. Appl.25, 64–65 (2000).
4. E. Rohner and D. C. Rich, “Eine angenähert gleichförmigeFarbabstandsformel für industrielle Farbtoleranzen vonKöorperfarben,” Die Farbe 42, 207–220 (1996).
5. J. H. Nobbs, “A lightness, chroma and hue splittingapproach to CIEDE2000 colour differences,” Adv. ColourSci. and Techno. 5, 46–53 (2002).
6. P. Urban, M. R. Rosen, and R. S. Berns, “Embeddingnon-Euclidean color spaces into Euclidean color spaceswith minimal isometric disagreement,” J. Opt. Soc. Am. A24, 1516–1528 (2007).
7. R. S. Berns and Y. Zue, “Optimizing color-differenceequations and uniform color spaces for industrial
tolerancing,” in Proceedings of AIC 2007—Color Science forIndustry, Y. E. Guanrong and X. U. Haisong, eds. (AIC,2007), pp. 24–28.
8. D. H. Kim and J. H. Nobbs, “New weightings functions forthe weighted CIELAB color difference formula,” inProceedings of AIC Colour 97 (AIC, 1997), Vol. 1, pp.446–449.
9. R. S. Berns, D. H. Alman, L. Reniff, G. D. Snyder, and M.R. Balonon-Rosen, “Visual determination of suprathresholdcolor tolerances using probit analysis,” Color Res. Appl. 16,297–316 (1991).
0. K. Witt, “Geometric relations between scales of small colourdifferences,” Color Res. Appl. 24, 78–92 (1999).
1. C. C. Semmelroth, “Prediction of lightness and brightnesson different backgrounds,” J. Opt. Soc. Am. 60, 1685–1689(1970).
2. M. Melgosa, R. Huertas, and R. S. Berns, “Performance ofrecent advanced color-difference formulas using thestandardized residual sum of squares index,” J. Opt. Soc.Am. A 25, 1828–1834 (2008).
3. C. Oleari, “Comparison between color-space scales, uniformcolor-scales atlases and color-difference formulae,” ColorRes. Appl. 26, 351–361 (2001).
4. S. S. Guan and M. R. Luo, “A colour-difference formula forassessing large colour-differences,” Color Res. Appl. 24,344–355 (1999).
5. R. G. Kuehni, “Color difference formulas: an unsatisfactorystate of affairs,” Color Res. Appl. 33, 324–326 (2008).
6. M. Melgosa, R. Huertas, and P. A. García, “Performance ofCIEDE2000 color difference models for the RIT-DuPontdataset,” in Proceedings of AIC 2007—Color Science forIndustry, Y. E. Guanrong and X. U. Haisong, eds. (AIC,2007), pp. 293–295.