Ethnic Differences in Medicinal Plant Use Among University Students: A Cross-Sectional Survey of...
10
RESEARCH ARTICLE Open Access Ethnic differences in medicinal plant use among University students: a cross-sectional survey of self-reported medicinal plant use at two Midwest Universities Rachel Craft 1* , Katrina C. McClure 2 , Steven Corbett 3 , Maria Pontes Ferreira 4 , Ashley M. Stiffarm 5 and Kelly Kindscher 3 Abstract Background: Numerous surveys of medicinal plant use among college students abound, but none compare use between students enrolled in two different Universities with significantly different ethnic compositions. The objective of this study is to compare medicinal plant use between two different ethnic college populations and explore differences between student medicinal plant users and non-users for comparison with previous research. Methods: Students (n = 721) at a large research university (n = 498) and a Pan-Tribal University for Native Americans (n = 233) completed surveys in October 2011 to assess past year medicinal plant use. The Mann-Whitney U test, Chi Square test, and General Linear Model were used to compare demographics and self-reported use of medicinal plants among students at both Universities and between past year users and non-users. Results: Over 23 % of university students surveyed reported past year medicinal plant use. Users were more likely to use commercial tobacco products and to report poorer health than non-users. While Native American student medicinal plant users reported significantly higher rates of commercial tobacco use, lower self-assessment of health, and less use of prescription medicine than non-Native users, no significant differences in prevalence of medicinal plant use were found between University student populations. Conclusions: Results are consistent with preexisting data showing higher rates of medicinal plant use among college students compared to the larger US population of adults and demonstrate previously documented health disparities in Native American populations compared to non-Native Americans. Keywords: US, Alternative medicine, Herbal medicine, Native American, Health disparities, Student health, College students, Surveys, Undergraduates Background Adult use of dietary supplements in the US has in- creased significantly in recent years. While in 1990 only 2.5 % of the US adult population used a dietary supple- ment in the past year, use of non-vitamin, non-mineral dietary supplements increased over seven-fold to 17.9 % in 2012 [1–5]. Scholars believe this increase in use oc- curred because dietary supplements became more widely available due to economic forces, political factors, and the increasing availability of information online [6–10]. Economic factors include the increase of: insurance coverage of Complementary and Alternative Medicine (CAM), pharmaceutical manufacturing of CAM prod- ucts, increased CAM advertising, and dietary supple- ment availability in superstores. Political factors include increased licensing of CAM professionals, the 1994 passage of the Dietary Supplement Health and Education Action, the creation of the National Center for Comple- mentary and Alternative Medicine (changed to the National Center for Complementary and Integrative Health * Correspondence: [email protected] 1 Department of Sociology, University of Kansas, 1415 Jayhawk Blvd., 730 Fraser Hall, Lawrence, KS 66045, USA Full list of author information is available at the end of the article © 2015 Craft et al. This is an Open Access article distributed under the terms of the Creative Commons Attribution License (http://creativecommons.org/licenses/by/4.0), which permits unrestricted use, distribution, and reproduction in any medium, provided the original work is properly credited. The Creative Commons Public Domain Dedication waiver (http:// creativecommons.org/publicdomain/zero/1.0/) applies to the data made available in this article, unless otherwise stated. Craft et al. BMC Complementary and Alternative Medicine (2015) 15:192 DOI 10.1186/s12906-015-0725-1
Transcript of Ethnic Differences in Medicinal Plant Use Among University Students: A Cross-Sectional Survey of...
RESEARCH ARTICLE Open Access
Ethnic differences in medicinal plant useamong University students: a cross-sectionalsurvey of self-reported medicinal plant use attwo Midwest UniversitiesRachel Craft1*, Katrina C. McClure2, Steven Corbett3, Maria Pontes Ferreira4, Ashley M. Stiffarm5 and Kelly Kindscher3
Abstract
Background: Numerous surveys of medicinal plant use among college students abound, but none compare usebetween students enrolled in two different Universities with significantly different ethnic compositions. Theobjective of this study is to compare medicinal plant use between two different ethnic college populations andexplore differences between student medicinal plant users and non-users for comparison with previous research.
Methods: Students (n = 721) at a large research university (n = 498) and a Pan-Tribal University for Native Americans(n = 233) completed surveys in October 2011 to assess past year medicinal plant use. The Mann-Whitney U test,Chi Square test, and General Linear Model were used to compare demographics and self-reported use of medicinalplants among students at both Universities and between past year users and non-users.
Results: Over 23 % of university students surveyed reported past year medicinal plant use. Users were more likelyto use commercial tobacco products and to report poorer health than non-users. While Native American studentmedicinal plant users reported significantly higher rates of commercial tobacco use, lower self-assessment of health,and less use of prescription medicine than non-Native users, no significant differences in prevalence of medicinalplant use were found between University student populations.
Conclusions: Results are consistent with preexisting data showing higher rates of medicinal plant use amongcollege students compared to the larger US population of adults and demonstrate previously documented healthdisparities in Native American populations compared to non-Native Americans.
Keywords: US, Alternative medicine, Herbal medicine, Native American, Health disparities, Student health,College students, Surveys, Undergraduates
BackgroundAdult use of dietary supplements in the US has in-creased significantly in recent years. While in 1990 only2.5 % of the US adult population used a dietary supple-ment in the past year, use of non-vitamin, non-mineraldietary supplements increased over seven-fold to 17.9 %in 2012 [1–5]. Scholars believe this increase in use oc-curred because dietary supplements became more widely
available due to economic forces, political factors, andthe increasing availability of information online [6–10].Economic factors include the increase of: insurancecoverage of Complementary and Alternative Medicine(CAM), pharmaceutical manufacturing of CAM prod-ucts, increased CAM advertising, and dietary supple-ment availability in superstores. Political factors includeincreased licensing of CAM professionals, the 1994passage of the Dietary Supplement Health and EducationAction, the creation of the National Center for Comple-mentary and Alternative Medicine (changed to theNational Center for Complementary and Integrative Health
* Correspondence: [email protected] of Sociology, University of Kansas, 1415 Jayhawk Blvd., 730Fraser Hall, Lawrence, KS 66045, USAFull list of author information is available at the end of the article
© 2015 Craft et al. This is an Open Access article distributed under the terms of the Creative Commons Attribution License(http://creativecommons.org/licenses/by/4.0), which permits unrestricted use, distribution, and reproduction in any medium,provided the original work is properly credited. The Creative Commons Public Domain Dedication waiver (http://creativecommons.org/publicdomain/zero/1.0/) applies to the data made available in this article, unless otherwise stated.
Craft et al. BMC Complementary and Alternative Medicine (2015) 15:192 DOI 10.1186/s12906-015-0725-1

in December 2014), and increased social movement sup-port in the form of women, gay, elderly, disabled, and otherhealth-based rights movements.
Previous researchNumerous surveys characterize herbal supplement use, asubset of dietary supplements that does not includevitamins, minerals, and other natural products that arenot wholly derived from plants. Typical herbal supple-ment users in the US are middle-age, middle-class,college educated, white, and female [1–3, 5, 11–13]. Somesurveys indicate that users self-rate their health as worsethan non-users [12, 14], while others indicate that herbalsupplement users report better health status [15, 16]. Usersalso exercise more than non-users [11]. Barnes et al foundthat the use of herbal supplements in the US ranges from24.4 % in the West, to 20.4 % in the Midwest, 18.2 % inthe Northeast, and 17.7 % in the South [1]. Data generatedby Gardiner et al, Peregoy et al, and Kennedy indicatesimilar regional use patterns [3, 5, 11].The most commonly cited sources of information for
herbal supplement use are friends and family, media, andhealth stores [15, 17–19]. The most often used herbal sup-plements are Echinacea, ginseng, Ginkgo, garlic, St. John’swort, Peppermint, ginger, and kava kava [1, 3, 11]. The topreasons cited for using herbal supplements are to improvehealth or well-being, relieve symptoms associated withchronic illness, prevent chronic disease, and to supple-ment a poor diet or unhealthy lifestyle [1, 11, 13].Studies have also been performed on population sub-
groups in the US, including: hospitalized patients [12,18], psychiatric outpatients [20], adults with depression[21], patients with cardiovascular disease [22], pregnantwomen with midwives [23], older adults [24], caregiversof children who use WIC [19], and Hispanic collegestudents [25].Studies on US college students indicate a greater
prevalence of herbal supplement use with a similardemographic profile to the larger US adult user popula-tion (i.e., white, female). This makes college students anideal demographic to explore the variation of herbalsupplement use. The percent of college students whoused an herbal supplement in the past year range from79 % of students surveyed at an unnamed large stateuniversity [26], to 54 % of undergraduates surveyed at amidsize Midwestern university [27], 51 % of surveyedRutgers University students [15], 48.5 % of surveyedWashington State University students [28], and 26.3 %of surveyed students at an urban, mid-sized university[17]. Of these college student surveys, the most com-monly used herbal supplements are Echinacea, ginseng,St. John’s wort, chamomile, aloe, and ginger, which iscomparable to US adult use studies. The most commonindications for students’ use are to promote health, prevent
illness (particularly physical), treat depression and anxiety[29], and lose weight.Despite some evidence that college students have a
higher prevalence of herbal supplement use than the restof the American adult population, CAM and herbal sup-plement use in college students remains understudied[27]. By way of the 1994 Dietary Supplement Health andEducation Act, herbal products are considered dietarysupplements that can be bought and sold without dem-onstrating evidence of their safety or efficacy. Given thedifficulty of ascertaining the safety of herbal supplementuse, as demonstrated by contradictory and incompleteresults that characterize much of the research in thisvein, and the possibility of herb-drug interactions, manyscholars indicate a need for research on the use andsafety of herbal supplements [30–32].
Research hypothesesThe purpose of this study was to establish the medicinalplant and herbal product usage frequency and characteris-tics of users among US college students in 2011. We choseto limit our inquiry to the use of medicinal plants, inorder to distinguish the use of plants for medicine fromother dietary supplements and to remain consistent withthe focus of the University of Kansas Native MedicinalPlant Research Program. Lawrence, Kansas is home fortwo universities: The University of Kansas and Haskell In-dian Nations University. The University of Kansas is apublic research university and the largest university inKansas, with an enrollment of nearly 30,000 students.Haskell Indian Nations University and Southwestern In-dian Polytechnic Institute in Albuquerque, New Mexicoare the only two US universities for Native Americans thatare federally operated and funded by the Bureau of IndianEducation. Haskell Indian Nations University offers Asso-ciate and Baccalaureate degrees, and has an enrollment ofapproximately 800 students (nearly twice that at theSouthwestern Indian Polytechnic Institute). The proximityof these two schools in the same community allows forthe expansion of the analysis to include a more in-depthinvestigation of ethnic differences in herbal product use.Our hypothesis was that the Native American students
from Haskell Indian Nations University (HINU) wouldutilize medicinal plant and herbal products more oftenthan non-Native students from the University of Kansas(KU), assuming a greater cultural exposure to traditionalplant medicine and fewer financial resources for pharma-ceuticals [33]. Previous studies indicate that those whoidentify more intensely with being Native American andare involved in traditional Native American spirituality aremore likely to embrace CAM practices [34, 35]. Fuchsand Bashshur demonstrated that strong cultural ties to aNative American community can predict traditionalNative American medicinal plant use [36]. In a review of
Craft et al. BMC Complementary and Alternative Medicine (2015) 15:192 Page 2 of 10

literature, Johnston found that CAM use by Native Amer-icans is dependent upon the intensity of assimilative forcesaffecting cultural traditions and the degree of cultural re-surgence following the marginalization of cultural prac-tices [37]. Therefore we explored the differences betweenHINU and KU student users to determine if there wouldbe any variation in use rates and patterns. This is the firststudent survey designed to focus on medicinal plant useand to compare use between two different universities inthe same US Midwestern city that feature significantlydifferent ethnic demographics.Additionally, consistent with previous student survey
work (discussed above), we also wanted to contributedata on the rate of medicinal plant use among these stu-dent populations and to explore differences betweenstudent user and non-user groups. To this end we reportoverall use rates and patterns of use among thesestudent populations for comparison with preexisting re-search on herbal use among college student populations.Additionally, we compare demographic, self-health as-sessment, and use of tobacco products between studentuser and non-user groups, again for comparison withpreexisting research.
MethodsThe HINU/KU student cross-sectional survey wasdrafted with similar questions used in previous collegestudent surveys so as to allow for comparisons acrosstime and space with preexisting research on the rate ofcollege student use of medicinal plants and herbal sup-plements [15, 17, 26, 28, 38]. Internal Review Board ap-provals were granted at both KU and HINU. Surveyswere administered to students during classes in the Fall2011 semester at both universities. Courses were se-lected for survey distribution to maximize the diversityof students responding and allow for comparable studentpopulations between both Universities. At KU, a soci-ology course that satisfies the social science requirementfor Liberal Arts and Sciences majors at KU was selectedfor survey distribution. And at HINU, Freshman Englishand psychology courses that satisfy the General Educa-tion requirement for all students were surveyed atHINU. An author at HINU, and an author or GraduateTeaching Assistant at KU explained the purpose of thesurvey and read an oral consent statement to each classprior to administering the survey during class time.Surveys were completed within 5-10 min at the begin-ning or end of class and collected by the researcher orinstructor. Students were given the option of notparticipating. No students at HINU chose not to partici-pate, while less than 10 blank surveys were returned byKU students.Part one of the survey (Additional file 1) included
demographic variables (ethnicity, age, grade level, and
gender), self-evaluation of health (on a five point likertscale ranging from good to poor), and health behaviorquestions. Part two of the survey consisted of medicinalplant and herbal product use questions, beginning withlifetime and past year use. If the student indicated life-time use, they were asked to indicate their age at firstuse, from where or whom they learned how to use, howmuch money they spent on medicinal plants and herbalproducts per month, and whether they informed theirphysician about their use. All survey respondents wereasked whether their physician asked them about medi-cinal plant or herbal product use, whether they takeover-the-counter or physician-prescribed medication,and if they found sufficient information (from anysource) on the use of medicinal plants and herbal prod-ucts. Students who indicated past year use were add-itionally asked in Part three of the survey to review a listof commonly used medicinal plants and to specify thefrequency and duration of use, the form of the plantused (e.g., dried, fresh, tincture, capsule/pill, topically, orinfusion), reasons for use, and whether the plant was ef-fective or had adverse effects. Although students weregiven the opportunity to add medicinal plants notalready listed on the survey, we did not aim to survey alltraditional medicinal plant use, nor were we seeking in-formation on the spiritual use of plants. We anticipatedthat some HINU students may be reluctant to providethis information in order to protect sacred knowledge orcultural traditions.Data were entered into a Microsoft Excel spreadsheet.
Parts one and two survey data were coded into nominaland interval variables and imported into IBM SPSS Statis-tics 20. All survey data were descriptively analyzed inExcel; while SPSS was additionally used to statisticallyanalyze Part one and two survey data. The Mann-WhitneyU test and Chi Square test were used to compare demo-graphics, health behaviors and medicinal plant use ratesand characteristics between KU and HINU, and to exploredifferences between past year users and non-users in bothstudent populations. A General Linear Model (GLM) wasused to identify which of the many variables surveyeddemonstrated the most variation in medicinal plant usepatterns. GLM analysis was used only for those partici-pants identified as users who completed Part three of thesurvey. Part two question answers, “Not Applicable orDon’t Remember” and “Haven’t looked for information,”were omitted from statistical analysis.Reliability of survey responses regarding the use of
medicinal plants were ascertained by comparing theconsistency of answers to question 1 (“Have you ever usedmedicinal plants or herbal products for health or well-being”) and question 2 (“Have you used medicinal plantsor herbal products for health or well-being in the pastyear”) alongside detailed use information as indicated in
Craft et al. BMC Complementary and Alternative Medicine (2015) 15:192 Page 3 of 10

Part three of the survey. Surveys of students who indi-cated inconsistent answers were scrutinized and, afterfinding their omission would have no significant impacton our overall findings, omitted from the final statisticalanalysis presented here.
ResultsDemographic informationA total of 721 surveys were completed (223 HINU and498 KU students). In 2012 (the first year student datawere available), HINU reported an enrollment of 846students: 51.7 % female and 48.3 % male [39]. Over 27 %of the HINU student population were surveyed for thisresearch and represented a similar gender distribution(48.6 % female; 51.4 % male). In 2011, KU reported atotal enrollment of 25,448 students: 49.8 % female and50.2 % male [40]. Of 19,222 total KU undergraduatesin 2011, nearly 3 % were surveyed for this research andrepresented a variable, but similar gender distribution(55.6 % female; 44.2 % male). Of undergraduate studentsenrolled at KU in 2011, 76.8 % identified as White, 5.3 %as Hispanic, 3.8 % as Black, and 3.6 % as Asian [41]. Ofstudents surveyed at KU, 80.2 % identified as White,3.6 % as Hispanic, 5.7 % as Black, and 5.9 % as Asian,which is comparable to the larger undergraduate studentpopulation. Additional demographic data for student en-rollment at both Universities were unavailable for deter-mining the representation of age and class in oursample. Table 1 presents a comparison of surveyed stu-dents’ demographic information between HINU and KU.
HINU and KU differencesHaskell Indian Nations University students were signifi-cantly more likely to rate their health as poor than KUstudents (p = .000); and significantly more likely to usecommercial tobacco products (p = .001). Whereas 73.5 %of KU students rated their health as “good” or “aboveaverage,” less than half (46.7 %) of the HINU samplerated their health as “good” or “above average.” Whereas29.4 % of the HINU sample used commercial tobaccoproducts, only 16.9 % of the KU sample indicated com-mercial tobacco use. KU students reported significantlyhigher use rates of prescription medication (50.2 % v.29.3 % at HINU, p = .000) and OTC medication (62.6 % v.42.8 % at HINU, p = .000). Many of these health behaviordifferences persist when comparing past year medicinalplant use between both university student populations.
HINU and KU past year user differencesHaskell Indian Nations University students reporting pastyear medicinal plant and herbal product use were signifi-cantly older than their KU counterparts (p = .000) (Table 2),despite featuring a higher percentage of underclassmen.
The gender makeup of the two groups did not differsignificantly (p = .198).There was no significant difference found between
HINU and KU regarding lifetime (p = .951) and past year(p = .384) use of medicinal plants or herbal products.With regard to students indicating past year use, age offirst use (p = .284), total money spent on medicinal plantproducts (p = .910), and whether the student informedtheir physician of their use (p = .360) were not statisti-cally different between HINU and KU. However, pastyear HINU users were less likely to report good or aboveaverage health (p = .000; 41.1 % v. 79.5 %), use less pre-scription medication (p = .005; 30.4 % v. 53.1 %) and
Table 1 Demographics of HINU and KUa
Demographic Information HINU KU Total
Total Number Cases 223 498 721
Race/ethnicity
Native American 84.3 % .4 % 26.5 %
White .4 % 80.2 % 55.4 %
Asian - 5.9 % 4.0 %
Black - 5.7 % 3.9 %
Hispanic/Latino - 3.6 % 2.5 %
Pacific Islander - .2 % .1 %
2+ Ethnicities 15.2 % 3.6 % 7.2 %
Other - .4 % .3 %
Missing (cases) - 3 3
Gender
Male 51.4 % 44.2 % 46.4 %
Female 48.6 % 55.6 % 53.4 %
Transgender - .2 % .1 %
Missing (cases) 11 27 38
Age (in years)
18-19 57.2 % 79.1 % 72.3 %
20-21 16.7 % 18.0 % 17.6 %
22-23 10.8 % 2.0 % 4.7 %
24-25 4.5 % .6 % 1.8 %
26-30 5.4 % - 1.7 %
31-40 3.6 % .2 % 1.3 %
41+ 1.8 % - .6 %
Missing (cases) 1 4 5
Class
Freshman 80.2 % 62.9 % 68.3 %
Sophomore 18.0 % 24.9 % 22.8 %
Junior 1.8 % 8.6 % 6.5 %
Senior - 3.7 % 2.5 %
Missing (cases) 1 8 9a Percentage of all students surveyed in each demographic at HINU and KU
Craft et al. BMC Complementary and Alternative Medicine (2015) 15:192 Page 4 of 10
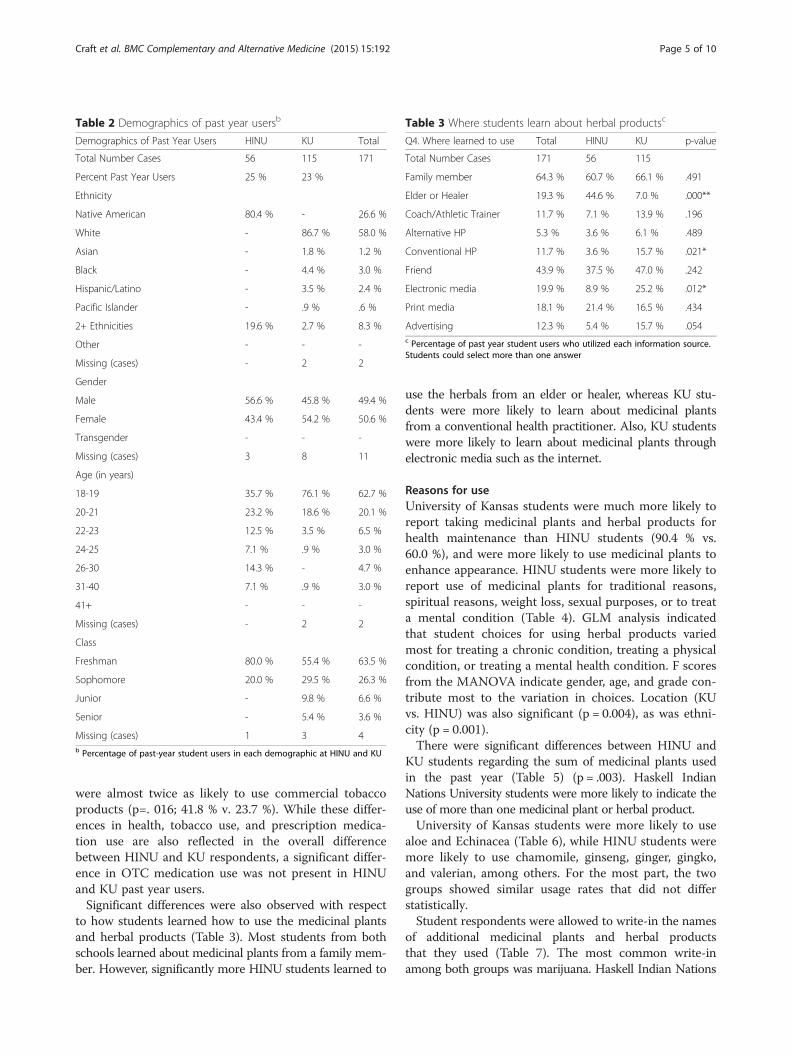
were almost twice as likely to use commercial tobaccoproducts (p=. 016; 41.8 % v. 23.7 %). While these differ-ences in health, tobacco use, and prescription medica-tion use are also reflected in the overall differencebetween HINU and KU respondents, a significant differ-ence in OTC medication use was not present in HINUand KU past year users.Significant differences were also observed with respect
to how students learned how to use the medicinal plantsand herbal products (Table 3). Most students from bothschools learned about medicinal plants from a family mem-ber. However, significantly more HINU students learned to
use the herbals from an elder or healer, whereas KU stu-dents were more likely to learn about medicinal plantsfrom a conventional health practitioner. Also, KU studentswere more likely to learn about medicinal plants throughelectronic media such as the internet.
Reasons for useUniversity of Kansas students were much more likely toreport taking medicinal plants and herbal products forhealth maintenance than HINU students (90.4 % vs.60.0 %), and were more likely to use medicinal plants toenhance appearance. HINU students were more likely toreport use of medicinal plants for traditional reasons,spiritual reasons, weight loss, sexual purposes, or to treata mental condition (Table 4). GLM analysis indicatedthat student choices for using herbal products variedmost for treating a chronic condition, treating a physicalcondition, or treating a mental health condition. F scoresfrom the MANOVA indicate gender, age, and grade con-tribute most to the variation in choices. Location (KUvs. HINU) was also significant (p = 0.004), as was ethni-city (p = 0.001).There were significant differences between HINU and
KU students regarding the sum of medicinal plants usedin the past year (Table 5) (p = .003). Haskell IndianNations University students were more likely to indicate theuse of more than one medicinal plant or herbal product.University of Kansas students were more likely to use
aloe and Echinacea (Table 6), while HINU students weremore likely to use chamomile, ginseng, ginger, gingko,and valerian, among others. For the most part, the twogroups showed similar usage rates that did not differstatistically.Student respondents were allowed to write-in the names
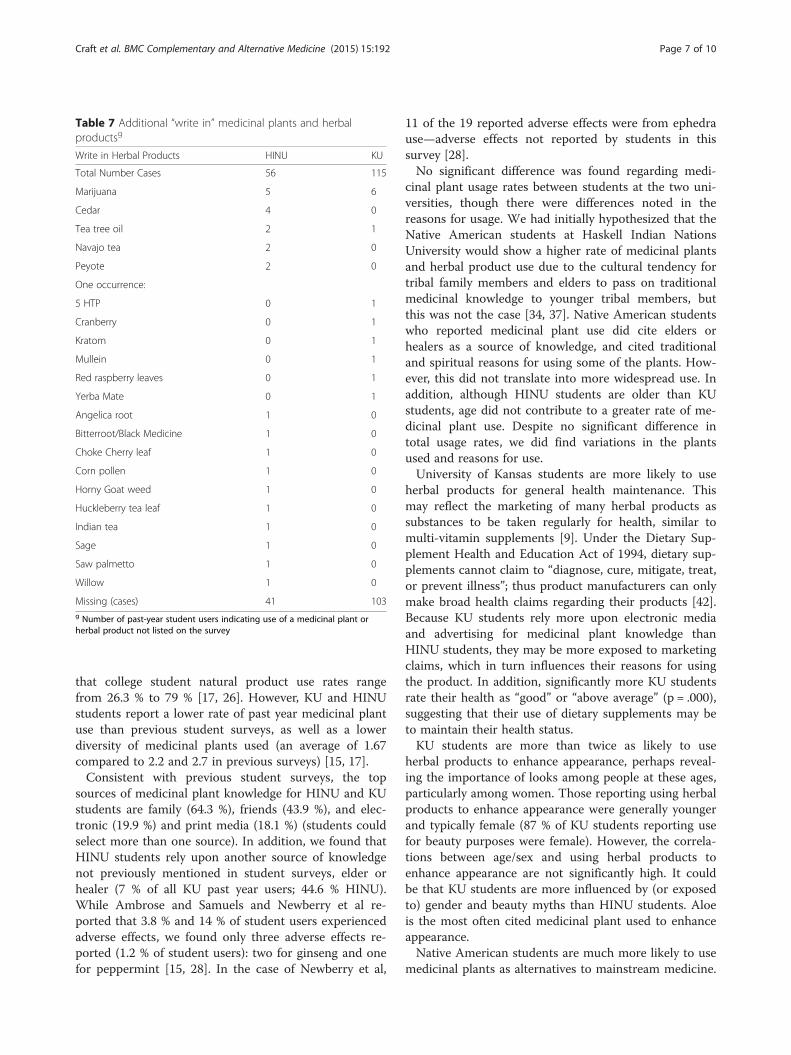
of additional medicinal plants and herbal productsthat they used (Table 7). The most common write-inamong both groups was marijuana. Haskell Indian Nations
Table 2 Demographics of past year usersb
Demographics of Past Year Users HINU KU Total
Total Number Cases 56 115 171
Percent Past Year Users 25 % 23 %
Ethnicity
Native American 80.4 % - 26.6 %
White - 86.7 % 58.0 %
Asian - 1.8 % 1.2 %
Black - 4.4 % 3.0 %
Hispanic/Latino - 3.5 % 2.4 %
Pacific Islander - .9 % .6 %
2+ Ethnicities 19.6 % 2.7 % 8.3 %
Other - - -
Missing (cases) - 2 2
Gender
Male 56.6 % 45.8 % 49.4 %
Female 43.4 % 54.2 % 50.6 %
Transgender - - -
Missing (cases) 3 8 11
Age (in years)
18-19 35.7 % 76.1 % 62.7 %
20-21 23.2 % 18.6 % 20.1 %
22-23 12.5 % 3.5 % 6.5 %
24-25 7.1 % .9 % 3.0 %
26-30 14.3 % - 4.7 %
31-40 7.1 % .9 % 3.0 %
41+ - - -
Missing (cases) - 2 2
Class
Freshman 80.0 % 55.4 % 63.5 %
Sophomore 20.0 % 29.5 % 26.3 %
Junior - 9.8 % 6.6 %
Senior - 5.4 % 3.6 %
Missing (cases) 1 3 4b Percentage of past-year student users in each demographic at HINU and KU
Table 3 Where students learn about herbal productsc
Q4. Where learned to use Total HINU KU p-value
Total Number Cases 171 56 115
Family member 64.3 % 60.7 % 66.1 % .491
Elder or Healer 19.3 % 44.6 % 7.0 % .000**
Coach/Athletic Trainer 11.7 % 7.1 % 13.9 % .196
Alternative HP 5.3 % 3.6 % 6.1 % .489
Conventional HP 11.7 % 3.6 % 15.7 % .021*
Friend 43.9 % 37.5 % 47.0 % .242
Electronic media 19.9 % 8.9 % 25.2 % .012*
Print media 18.1 % 21.4 % 16.5 % .434
Advertising 12.3 % 5.4 % 15.7 % .054c Percentage of past year student users who utilized each information source.Students could select more than one answer
Craft et al. BMC Complementary and Alternative Medicine (2015) 15:192 Page 5 of 10

University students reported a greater number (n = 25 v.n = 13) and wider diversity of write-in products, includingcedar, Navajo tea, peyote, bitterroot, horny goat weed,huckleberry tea, Indian tea, sage, saw palmetto, and wil-low. University of Kansas students added things such asmullein and yerba mate, neither of which is native toNorth America.
User and non-user differencesOf the 721 students surveyed, 236 students (32.7 %)indicated lifetime use of medicinal plants or herbal for-mulas. Of students indicating lifetime use of medicinalplants or herbal formulas, 171 students indicated pastyear use (23.7 %).Past year medicinal plant users were older than non-
users (p = .001), but gender was not a factor in usage(p = .164). Cigarette smoking was more common amongpast year users (29.5 %) than among non-users (18.3 %)(p = .002). There were no significant differences in overthe counter (OTC) medicine (p = .425) and prescriptionmedication (p = .635) use between past year users andnonusers. Past year users were more likely to report thata physician had inquired about their usage (p = .000),and that they were able to find sufficient information onmedicinal plant use (p = .000).
DiscussionUniversity of Kansas and Haskell Indian Nations Univer-sity medicinal plant and herbal product use rates (23.7 %past year; 32.7 % lifetime) are higher than the 2007 USadult natural product use rate (17.7 % past year). This isconsistent with prior student survey research indicating
Table 5 Total number of medicinal plants usede
Sum of Medicinal Plants Used Total HINU KU
Total Number Cases 171 56 115
1 36.7 % 20.0 % 44.7 %
2 23.7 % 31.1 % 20.2 %
3 12.9 % 13.3 % 12.8 %
4 8.6 % 11.1 % 7.4 %
5 4.3 % 8.9 % 2.1 %
6 2.2 % 2.2 % 2.1 %
7 2.9 % 4.4 % 2.1 %
9 2.2 % 4.4 % 1.1 %
10 or more 6.5 % 6.8 % 5.3 %
Missing (cases) 32 11 21e Percentage of student users who indicated the number of plants used in thepast year
Table 6 Usage rates of specific medicinal plants and herbalproductsf
Percent of Students Using a Medicinal Plant HINU KU
Total Number Cases 56 115
Aloe 73.3 % 88.3 %
Chamomile 42.2 % 27.7 %
Ginseng 37.8 % 27.7 %
Peppermint 22.2 % 24.5 %
Ginger 28.9 % 19.1 %
Echinacea 11.1 % 14.9 %
Garlic 17.8 % 10.6 %
Gingko 17.8 % 9.6 %
Combination Formula 13.3 % 9.6 %
St. John’s wort 11.1 % 8.5 %
Kava 11.1 % 7.4 %
Valerian 15.6 % 5.3 %
Ephedra 6.7 % 8.5 %
Licorice 8.9 % 7.4 %
Milk Thistle 11.1 % 6.4 %
Evening Primrose 6.7 % 6.4 %
Feverfew 4.4 % 6.4 %
Goldenseal 4.4 % 5.3 %
Missing (cases) 11 21f Percentage of past-year student users indicating use of specific medicinalplants or herbal products
Table 4 Indications for medicinal plant used
Indications for Medicinal Plant Use HINU KU
Total Number Cases 56 115
Health maintenance 60.0 % 90.4 %
Treat a physical condition 42.2 % 45.7 %
Simply like taking it 48.9 % 29.8 %
Traditional reasons 46.7 % 20.2 %
Treat a chronic condition 20.0 % 29.8 %
Alternative to other medicine 37.8 % 19.1 %
Beauty purposes 8.9 % 25.5 %
Increase energy 22.2 % 16.0 %
Other 31.1 % 10.6 %
Spiritual reasons 33.3 % 3.2 %
Weight loss 13.3 % 5.3 %
Treat a mental condition 17.8 % 2.1 %
Sexual purposes 8.9 % 2.1 %
Muscle gain 2.2 % 1.1 %
Missing (cases) 11 21d Percentage of past-year student users indicating reasons for use of medicinalplants and herbal products. Students could select more than one answer* All Cases: All (n = 721); HINU (n = 223); KU (n = 498)** Valid Cases (Answered ‘yes’ to Q1 & Q2): All (n = 171); HINU (n = 56);KU (n = 115)Note: of 171 valid cases, only 139 cases (45 HINU; 94 KU) indicated the use ofone or more medicinal plants in Part 3 of the survey
Craft et al. BMC Complementary and Alternative Medicine (2015) 15:192 Page 6 of 10
that college student natural product use rates rangefrom 26.3 % to 79 % [17, 26]. However, KU and HINUstudents report a lower rate of past year medicinal plantuse than previous student surveys, as well as a lowerdiversity of medicinal plants used (an average of 1.67compared to 2.2 and 2.7 in previous surveys) [15, 17].Consistent with previous student surveys, the top
sources of medicinal plant knowledge for HINU and KUstudents are family (64.3 %), friends (43.9 %), and elec-tronic (19.9 %) and print media (18.1 %) (students couldselect more than one source). In addition, we found thatHINU students rely upon another source of knowledgenot previously mentioned in student surveys, elder orhealer (7 % of all KU past year users; 44.6 % HINU).While Ambrose and Samuels and Newberry et al re-ported that 3.8 % and 14 % of student users experiencedadverse effects, we found only three adverse effects re-ported (1.2 % of student users): two for ginseng and onefor peppermint [15, 28]. In the case of Newberry et al,
11 of the 19 reported adverse effects were from ephedrause—adverse effects not reported by students in thissurvey [28].No significant difference was found regarding medi-
cinal plant usage rates between students at the two uni-versities, though there were differences noted in thereasons for usage. We had initially hypothesized that theNative American students at Haskell Indian NationsUniversity would show a higher rate of medicinal plantsand herbal product use due to the cultural tendency fortribal family members and elders to pass on traditionalmedicinal knowledge to younger tribal members, butthis was not the case [34, 37]. Native American studentswho reported medicinal plant use did cite elders orhealers as a source of knowledge, and cited traditionaland spiritual reasons for using some of the plants. How-ever, this did not translate into more widespread use. Inaddition, although HINU students are older than KUstudents, age did not contribute to a greater rate of me-dicinal plant use. Despite no significant difference intotal usage rates, we did find variations in the plantsused and reasons for use.University of Kansas students are more likely to use
herbal products for general health maintenance. Thismay reflect the marketing of many herbal products assubstances to be taken regularly for health, similar tomulti-vitamin supplements [9]. Under the Dietary Sup-plement Health and Education Act of 1994, dietary sup-plements cannot claim to “diagnose, cure, mitigate, treat,or prevent illness”; thus product manufacturers can onlymake broad health claims regarding their products [42].Because KU students rely more upon electronic mediaand advertising for medicinal plant knowledge thanHINU students, they may be more exposed to marketingclaims, which in turn influences their reasons for usingthe product. In addition, significantly more KU studentsrate their health as “good” or “above average” (p = .000),suggesting that their use of dietary supplements may beto maintain their health status.KU students are more than twice as likely to use
herbal products to enhance appearance, perhaps reveal-ing the importance of looks among people at these ages,particularly among women. Those reporting using herbalproducts to enhance appearance were generally youngerand typically female (87 % of KU students reporting usefor beauty purposes were female). However, the correla-tions between age/sex and using herbal products toenhance appearance are not significantly high. It couldbe that KU students are more influenced by (or exposedto) gender and beauty myths than HINU students. Aloeis the most often cited medicinal plant used to enhanceappearance.Native American students are much more likely to use
medicinal plants as alternatives to mainstream medicine.
Table 7 Additional “write in” medicinal plants and herbalproductsg
Write in Herbal Products HINU KU
Total Number Cases 56 115
Marijuana 5 6
Cedar 4 0
Tea tree oil 2 1
Navajo tea 2 0
Peyote 2 0
One occurrence:
5 HTP 0 1
Cranberry 0 1
Kratom 0 1
Mullein 0 1
Red raspberry leaves 0 1
Yerba Mate 0 1
Angelica root 1 0
Bitterroot/Black Medicine 1 0
Choke Cherry leaf 1 0
Corn pollen 1 0
Horny Goat weed 1 0
Huckleberry tea leaf 1 0
Indian tea 1 0
Sage 1 0
Saw palmetto 1 0
Willow 1 0
Missing (cases) 41 103g Number of past-year student users indicating use of a medicinal plant orherbal product not listed on the survey
Craft et al. BMC Complementary and Alternative Medicine (2015) 15:192 Page 7 of 10

This perhaps indicates a greater acceptance of plants as asource of medicine. Also, the greater usage of herbalmedicines for spiritual reasons reflects a Native Americancultural connection between medicinal plant use andhealth and overall well-being [34, 37]. Interestingly, thetendency for Haskell students to have a greater likelihoodof using herbal products to enhance mental health may re-flect higher stress or anxiety levels among HINU students.Data indicate that Native Americans are more likely tosuffer from depression and related mental health condi-tions [43]. Despite a smaller sample size, HINU studentsprovided a larger number of “write-in” medicinal plantsnot listed on the survey and indicated use of more medi-cinal plants that are native to North America. This mayalso be indicative of exposure to a wider variety of plantmedicines and localized knowledge across the lifespan.The lower self-assessment of health status among Na-
tive Americans that we documented have been reportedelsewhere, as have higher rates of cigarette smoking andlower utilization of conventional health practitioners andpharmaceuticals. Our results likely reflect historically-entrenched social structures that wrought economic andcultural impoverishment on American Indian reserva-tions. In consequence, American Indians as a whole aresignificantly more likely to rate their health as belowaverage [44–46], more likely to use tobacco products[47, 48], significantly less likely to see a physician due tocost and inaccessibility [45, 46, 48], and significantly lesslikely to use physician-prescribed drugs [45]. A lowerself-reported health rating and less access to prescriptionmedications did not translate into greater medicinalplant and herbal product usage among HINU students.Although HINU students were older, reported morevaried reasons for using medicinal plants, recognizedmore medicinal plants, and professed greater spiritualand traditional reasons for using the plants as comparedto KU students, none of these differences contributed tohigher overall medicinal plant use by HINU students.Similar to previous student surveys, aloe, ginseng,
chamomile, ginger, Echinacea, garlic, gingko, combinationformulas, St. Johns wort, kava kava, valerian, and ephedraare among the top 15 used herbal products. Peppermintand licorice were also selected by KU and HINU studentsbut not reported in previous student surveys.Past year medicinal plant and herbal product users in
this survey are older than non-users (p = .001), perhapsreflecting the tendency for older individuals to havemore health problems or health concerns. Gender wasnot a factor (p = .164). The use of commercial tobaccoproducts was significantly (p = .002) more prevalentamong past-year users than among students who did notuse a medicinal plant in the past year. Data from the2002 National Health Interview Survey and the 1999-2000 National Health and Nutrition Examination Survey
indicate that former smokers were much more likely touse dietary supplements [16, 49]. Perkin et al likewisefound a significant correlation between dietary supple-ment use and smoking among college students and con-cluded that dietary supplement use could be seen asoff-setting the unhealthy effects of smoking [17]. It couldalso be that college students who smoke will becomeformer smokers at some point in their life, which wouldexplain the correlation between smokers in college pop-ulations and former smokers in the larger adult popula-tion and the use of dietary supplements. Smoking anddietary supplement use may also correlate by way ofthe same mechanisms that cigarette, alcohol, and/ormarijuana use correlate with illicit drug use (e.g., gate-way drug hypothesis [50, 51]). That is, students who arewilling to smoke cigarettes may also be more willing toexperiment with and use medicinal plants and herbalproducts than their nonsmoking counterparts. Whilenot demonstrated by the data, it is possible that the useof medicinal plants, in addition to tobacco, indicatesattempts to self-medicate for anxiety and is a relatedphenomenon. Lastly, students who used medicinal plantsin the past year are also significantly more likely to reportthat a physician inquired about their use and that theyfound sufficient information (from any source) about me-dicinal plant and herbal product use, which likely reflectsa greater awareness of medicinal plants among users.
ConclusionsWhile we hypothesized that the Native American stu-dents from Haskell Indian Nations University would usemedicinal plant and herbal products more often thannon-Native students from the University of Kansas, thiswas not the case. However, our results are consistentwith previous findings regarding student medicinal plantuse, with 23.7 % of students reporting use of medicinalplants in the past year. Despite no significant differencein total usage rates, we did find variations in the plantsused and reasons for use. Thus, while rates of medicinalplant use are consistent between Native American andnon-Native university students, there are differences inthe way that students learn about and use medicinalplants that other research can explore. In addition,significant differences in medicinal plant use rates mightbe revealed among ethnicities outside of the universitystudent population, including within a wider diversity ofages, education levels, and geographic locations. Add-itional research could investigate the barriers to medi-cinal plant use for students and other populations, andhow Native American traditional and cultural practicesaffect medicinal plant use. Further, qualitative research,including interviews and case studies, of different cross-sections of medicinal plant users can reveal details thatthis survey did not capture, thereby adding explanatory
Craft et al. BMC Complementary and Alternative Medicine (2015) 15:192 Page 8 of 10

depth to the results reported here and in other surveysof CAM use.
LimitationsDirect comparison with previous student surveys is some-what problematic due to variation in herbal productterminology. Newberry et al and Perkin et al measurednon-vitamin, non-mineral product/supplement use, whichincludes products like protein powder and amino acids,green tea, cranberry, and acidophilus (products that werealso mentioned in previous herbal use surveys [15, 26]and did not appear in our more medicinal plant-focusedsurvey) [17, 28]. Furthermore, scrutiny of the completedsurveys indicated that nearly 20 % of students who indi-cated past year use of medicinal plants in Part three of thesurvey had either not indicated past year use in Part twoof the survey or changed their answer to reflect past yearuse. This highlights discrepancies in how the authors andrespondents conceived of ‘medicinal plant’ and ‘herbalproduct’ use. Finally, while herbal retailers were listed as asource of knowledge in previous student surveys, thisoption was not available on the KU/HINU survey.
Additional file
Additional file 1: Student Medicinal Plant and Herbal ProductSurvey.
Competing interestsThe authors declare that they have no financial or non-financial competinginterests.
Author contributionsKK and MPF designed the study and KK provided oversight at all stages ofthe project. All authors participated in the design of the survey. SC and TMreceived consent to administer the survey at both Universities. RC, SC, TM,and AS administered the survey and AS entered the data collected. RC andSC performed the statistical analyses and drafted the manuscript. All authorsread and approved the final manuscript.
AcknowledgementsThis study was supported by grant IND0061464 (awarded to BarbaraTimmermann and Kelly Kindscher) from the Kansas Bioscience Authority andHeartland Plant Innovations, and also from the University of Kansas StrategicInitiative. The authors would like to thank Dan Wildcat, Chuck Haines, LouHara, John Howland, and other instructors at Haskell Indian NationsUniversity and David Smith at the University of Kansas for allowing us tosurvey their students. In addition, we thank the Fall 2011 Elements ofSociology Graduate Teaching Assistants in the Department of Sociology atthe University of Kansas for distributing the surveys to students in theirdiscussion sections. Lastly, the authors thank the editors at BMCComplementary and Alternative Medicine, and Susan K. Johnson andWolfgang Weidenhammer for reviewing this work, and University of KansasOpen Access Author Fund reviewers for their patience and provision offunding for publication costs. This paper was previously presented at theMidwest Sociological Society Annual Meeting on March 28, 2013.
Author details1Department of Sociology, University of Kansas, 1415 Jayhawk Blvd., 730Fraser Hall, Lawrence, KS 66045, USA. 2Department of Geography, Universityof Kansas, 1475 Jayhawk Blvd., 213 Lindley Hall, Lawrence, KS 66045, USA.3Kansas Biological Survey, University of Kansas, 2101 Constant Ave.,
Lawrence, KS 66047, USA. 4Department of Nutrition & Food Service, Collegeof Liberal Arts & Sciences, Wayne State University, Detroit, MI 48202, USA.5Department of Environmental Science, Haskell Indian Nations University,Sequoyah 140, 155 Indian Avenue, Lawrence, KS 66046, USA.
Received: 2 December 2014 Accepted: 15 June 2015
References1. Barnes PM, Bloom B, Nahin RL. Complementary and alternative medicine
use among adults and children: United States, 2007. National HealthStatistics Reports; No 12. Hyattsville, MD: National Center for HealthStatistics; 2008. Available at http://nccam.nih.gov/sites/nccam.nih.gov/files/news/nhsr12.pdf. Accessed January 28, 2014
2. Eisenberg DM, Davis RB, Ettner SL, et al. Trends in alternative medicineuse in the United States, 1990-1997: results of a follow-up national survey.JAMA. 1998;280(18):1569–75.
3. Gardiner PR, Graham R, Legedza ATR, Ahn AC, Eisenberg DM, Phillips RS.Factors associated with herbal therapy use by adults in the United States.Altern Ther Health Med. 2007;13(2):22.
4. Millen A, Dodd D, Subar A. Use of vitamin, mineral, nonvitamin, andnonmineral supplements in the United States: The 1987, 1992, and 2000National Health Interview Survey Results. J Am Diet Assoc. 2004;104:942–50.
5. Peregoy JA, Clarke TC, Jones LI, Stussman BJ, Nahin RL. Regional variation inuse of complementary health approaches by U.S. adults. NCHS data brief,no 146. National Center for Health Statistics.: Hyattsville, MD; 2014.
6. Bardia A, Nisly N, Zimmerman M, Gryzlak M, Wallace R. Use of herbs amongadults based on evidence-based indications: findings from the NationalHealth Interview Survey. Mayo Clin Proc. 2007;82(5):561–6.
7. Coulter I, Willis E. The rise and rise of complementary and alternativemedicine: a sociological perspective. BMC Complement Altern Med.2004;180:587–90.
8. Evans S. Changing the knowledge base in western medicine. Soc Sci Med.2008;67(12):2098–106.
9. Goldstein M. The emerging socioeconomic and political support for alternativemedicine in the United States. Ann Am Acad Pol Soc Sci. 2002;583:44–63.
10. Ruggie M. Marginal to mainstream: alternative medicine in America.New York: Cambridge University Press; 2004.
11. Kennedy J. Herb and supplement use in the US adult population.Clin Ther. 2005;27(11):1847–58.
12. Hall LJ. Vitamin mineral herbal and other dietary supplement usage amonghospitalized patients admitted to an urban medical center [thesis].Chicago, IL: Rush University; 2007.
13. Egan B, Hodgkins C, Shepherd R, Timotijevic L, Raats M. An overview ofconsumer attitudes and beliefs about plant food supplements. Food Funct.2011;2:747–52.
14. Astin JA. Why patients use alternative medicine: results of a national study.JAMA. 1998;279(19):1548–53.
15. Ambrose E, Samuels S. Perception and use of herbals among students andtheir practitioners in a university setting. J Am Acad Nurse Pract.2004;16(4):166–76.
16. Radimer K, Bindewald B, Hughes J, Ervin B, Swanson C, Picciano MF.Dietary supplement use by US adults: data from the National Health andNutrition Examination Survey, 1999-2000. Am J Epidemiol. 2004;160(4):339–49.
17. Perkin J, Wilson W, Schuster K, Rodriguez J, Allen-Chabot A. Prevalence ofnonvitamin, nonmineral supplement usage among university students.J Am Diet Assoc. 2002;102(3):412–4.
18. Kuo GM, Hawley ST, Weiss LT, Balkrishnan R, Volk RJ. Factors associated withherbal use among urban multiethnic primary care patients: a cross-sectionalsurvey. BMC Complement Altern Med. 2004;4(18):9.
19. Lohse B, Stotts J, Priebe J. Survey of herbal use by Kansas and WisconsinWIC participants reveals moderate, appropriate use and identifies herbaleducation needs. J Am Diet Assoc. 2006;106:227–37.
20. Roy-Byrne PP, Bystritsky A, Russo J, Craske MG, Sherbourne CD, Stein MB.Use of herbal medicine in primary care patients with mood and anxietydisorders. Psychosomatics. 2005;46(2):117–22.
21. Letter HMH. Herbal and dietary supplements for depression. 2008. Availableat: http://www.health.harvard.edu/newsletters/Harvard_Mental_Health_Letter/2008/October/Herbal_and_dietary_supplements_for_depression.Accessed January 28, 2014.
Craft et al. BMC Complementary and Alternative Medicine (2015) 15:192 Page 9 of 10

22. Tachjian A, Maria V, Jahangir A. Use of herbal products and potentialinteractions in patients with cardiovascular disease. Amer J Cardiol.2010;55(6):515–25.
23. Holst J, Wright D, Haavik S, Nordeng H. The use and the user of herbalremedies during pregnancy. J Altern Complement Med. 2009;15(7):787–92.
24. Nahin RL, Dahlhamer JM, Taylor BL, et al. Health behaviors and risk factorsin those who use complementary and alternative medicine. BMC PublicHealth. 2007;7(217):9.
25. Quiroz TG. 0053afe medication use among Hispanic college students:knowledge, attitudes, and behaviors [thesis]. El Paso, TX: The University ofTexas at El Paso; 2010.
26. Johnson S, Blanchard A. Alternative medicine and herbal use amonguniversity students. J Am Coll Health. 2006;55(3):163–8.
27. LaCaille R, Kuvaas N. Coping styles and self-regulation predict complementaryand alternative medicine and herbal supplement use among college students.Psychol Health Med. 2004;16(3):323–32.
28. Newberry H, Beerman K, Duncan S, McGuire M, Hillers V. Use of nonvitamin,nonmineral dietary supplements among college students. J Am Coll Health.2001;50(3):123–9.
29. McCrea C, Pritchard M. Concurrent herb-prescription medication use andhealth care provider disclosure among university students. ComplementTher Med. 2011;19:32–6.
30. Foster BC, Arnason JT, Briggs CJ. Natural health products and drugdisposition. Annu Rev Pharmacol Toxicol. 2005;45(1):203–26.
31. Berman JD, Straus SE. Implementing a research agenda for complementaryand alternative medicine. Annu Rev Med. 2004;55(1):239–54.
32. van Breemen RB, Fong HHS, Farnsworth NR. Ensuring the safety of botanicaldietary supplements. Am J Clin Nutr. 2008;87(2):509S–13S.
33. Wilkinson D. Traditional medicine in American families: reliance on thewisdom of elders. Marriage Fam Rev. 1998;11(3-4):65-76.
34. Buchwald D, Beals J, Manson S. Use of traditional health practices amongNative Americans in a primary care setting. Med Care. 2000;38(12):1191–9.
35. Novins D, Beals J, Moore LA, Spicer P, Manson SM, AI_SUPERPFR Team.Use of biomedical services and traditional healing options among AmericanIndians: sociodemographic correlates, spirituality, and ethnic identity.Med Care. 2004;42(7):670–9.
36. Fuchs M, Bashshur R. Use of traditional Indian medicine among NativeAmericans. Med Care. 1975;13(11):915–27.
37. Johnston SL. Native American traditional and alternative medicine.Ann Am Acad Pol Soc Sci. 2002;583:195–213.
38. Driskell J. Vitamin-mineral supplementation habits and beliefs of male andfemale graduate students. J Fam Consum Sci. 1999;91(1):99–103.
39. Reeder, DL. 2013. Fall 2012 Student Facts. Available at: www.haskell.edu/downloads/registrar/enrollment%20data/FA12%20Enrollment%20Data.pdf.Accessed August 29, 2014.
40. KU Office of Institutional Planning and Research. 2013. Head Count By Sex;Table 4-110. Available at: www2.ku.edu/~oirp/profiles/old/4-110.pdf.Accessed August 29, 2014.
41. KU Office of Institutional Planning and Research. 2013. Enrollment by Race/Ethnicity; Table 4-116. Available at: www2.ku.edu/~oirp/profiles/old/4-116.pdf.Accessed August 29, 2014.
42. Dietary Supplement Health and Education Act of 1994. Section 6. Statementsof Nutritional Support. 1994. Available at: http://www.fda.gov/RegulatoryInformation/Legislation/FederalFoodDrugandCosmeticActFDCAct/SignificantAmendmentstotheFDCAct/ucm148003.htm. Accessed January 28, 2014.
43. Kansas Department of Health and Environment, Bureau of Epidemiologyand Public Health Informatics. Health Risk Behaviors of American Indians inKansas, BRFSS 2011. Available at: www.kdheks.gov/brfss/index.html.
44. Barents Group of KPMG Consulting, Inc. Disparities in health status and useof services: American Indians enrolled in Medicare managed care plans.Final report submitted to the Centers for Medicare and Medicaid Services,Contract No. HCFA-500-95-0057/TO#4; 2001. Available at: www.cms.gov/Research-Statistics-Data-and-Systems/Research/CAHPS/downloads/03_MMCCAHPSAmIndianEnrolRPT.pdf . Accessed January 28, 2014.
45. Gizlice Z, Huston S. Health risks and conditions among American Indians inNorth Carolina. SCHS Studies, A Special Report Series by the State Centerfor Health Statistics, Raleigh NC; 2004. Available at: www.schs.state.nc.us/SCHS/pdf/SCHS146.pdf. Accessed January 28, 2014
46. National Household Survey on Drug Abuse Report. Cigarette useamong American Indian/Alaskan youths; 2002, January 25. Available at:http://www.samhsa.gov/data/2k2/YouthIndianCigs/YouthIndianCigs.htm.Accessed January 28, 2014.
47. Rock VJ, Malarcher A, Kahende JW, Asman K, Husten C, Caraballo R. Officeon Smoking and Health, National Center for Chronic Disease Preventionand Health Promotion, CDC. Cigarette smoking among adults—UnitedStates, 2006; 2007. Available at: http://www.cdc.gov/mmwr/preview/mmwrhtml/mm5644a2.htm. Accessed January 28, 2014.
48. Office of the General Counsel, U.S. Commission on Civil Rights. NativeAmerican Health Care Disparities Briefing, February 2004; 2004. Available at:www.law.umaryland.edu/marshall/usccr/documents/nativeamerianhealthcaredis.pdf. Accessed January 24, 2014.
49. Barnes PM, Powell-Griner E, McFann K, Nahin RL. Complementary andalternative medicine use among adults: United States, 2002. Semin Integr Med2004;2(2):54-71.
50. Lai S, Lai H, Page JB, McCoy CB. The association between cigarette smokingand drug abuse in the United States. J Addict Dis. 2000;19(4):11–24.
51. Lynskey MT, Heath AC, Bucholz KK, et al. Escalation of drug use in early-onsetcannabis users vs co-twin controls. JAMA. 2003;289(4):429–33.
Submit your next manuscript to BioMed Centraland take full advantage of:
• Convenient online submission
• Thorough peer review
• No space constraints or color figure charges
• Immediate publication on acceptance
• Inclusion in PubMed, CAS, Scopus and Google Scholar
• Research which is freely available for redistribution
Submit your manuscript at www.biomedcentral.com/submit
Craft et al. BMC Complementary and Alternative Medicine (2015) 15:192 Page 10 of 10