Estimation the Amount of Oil Palm Production Using Artificial ...
7
Volume 4, Issue 11, November – 2019 International Journal of Innovative Science and Research Technology ISSN No:-2456-2165 IJISRT19NOV633 www.ijisrt.com 548 Estimation the Amount of Oil Palm Production Using Artificial Neural Network and NDVI SPOT-6 Imagery Shinta Rahma Diana Center for Aerospace Policy Studies National Institute of Aeronautics and Space (LAPAN) Jakarta – Indonesia Syaiful Muflichin Purnama Gadjah Mada University Yogyakarta – Indonesia Gusti Darma Yudha Remote Sensing Technology and Data Center National Institute of Aeronautics and Space (LAPAN) Jakarta – Indonesia Agil Sutrisnanto Center for Aerospace Policy Studies National Institute of Aeronautics and Space (LAPAN) Jakarta – Indonesia Intan Perwitasari Center for Aerospace Policy Studies National Institute of Aeronautics and Space (LAPAN) Jakarta – Indonesia Farida Farida Faculty of Economics and Bussiness UPI, YAI, Jakarta Indonesia Abstract:- oil palms industry has strategic role as the biggest contributor for foreign exchange in Indonesia. Meanwhile, Indonesia also the largest producer of oil palms all over the world. However, the productivity value is still less than optimal. Government policy through Presidencial decree Number 8 Year 2018 regarding moratorium/postponement and evaluation on oil palms plantation permit, gives mandate to stakeholders to increase productivity by intensification that needs technological support. The use of remote sensing technology allows the monitoring of oil palms plantation in giving direction for management policy making. This research aims to estimate the remote-sensing based productivity of oil palms plantation by utilizing satellite imagery data of SPOT 6. Method uses in this research is artificial neural network method, one of which detects the plant’s life age and analayze through linear regression which involving Normalized Different Vegetation Index (NDVI) value and production to have estimation of production. Results of the research shows that using ANN can predict oil palm plantation life age by 87% of accuracy. Meanwhile, production estimation done using NDVI for estimation of production generated an estimation formula Y = -24391 -766 X1 + 65482 X2 Keywords: Production, Oil Palms Plantation, Artificial Neural Network, Spot 6. I. INTRODUCTION Sub-sector of plantation has important role in the contribution of national gross domestic product (GDP) that is of Rp. 429 Trillion in 2016. This exceeded the oil and gas sector which is only Rp. 365 Trillion. Oil Palms hold a crucial role in generating the biggest foreign exchange in plantation sub-sector that is Rp. 260 Trillion or approximately 54% of total of foreign exchange that is generated from 2016, and increased to Rp. 290 Trillion in 2017 (BPS, 2019). The data shows that oil palm industry has a strategic role for Indonesia. This can be possible also because Indonesia’s position with the largest area and production of palm oil in the world. However, there is still a gap between riil production of oil palms with its production potential. At the moment, productivity of oil palms plantation in Indonesia is approximately 2,8 ton CPO/ha/year from 6-7 ton CPO/ha/year potential. Several efforts have been done to increase the productivity, one of which is the application of technology, both in cultivation, mechanism, and other technologies which may support production development.. Government policy through Presidential Decree No. 8 Year 2018 regarding postponement and evaluation on oil palms plantation permit, gives mandate to stakeholders to increase productivity by intensification efforts. This effort needs a proper technological support.
-
Upload
khangminh22 -
Category
Documents
-
view
0 -
download
0
Transcript of Estimation the Amount of Oil Palm Production Using Artificial ...
Volume 4, Issue 11, November – 2019 International Journal of Innovative Science and Research Technology
ISSN No:-2456-2165
IJISRT19NOV633 www.ijisrt.com 548
Estimation the Amount of Oil Palm Production Using
Artificial Neural Network and NDVI
SPOT-6 Imagery
Shinta Rahma Diana Center for Aerospace Policy Studies
National Institute of Aeronautics and Space (LAPAN)
Jakarta – Indonesia
Syaiful Muflichin Purnama
Gadjah Mada University
Yogyakarta – Indonesia
Gusti Darma Yudha
Remote Sensing Technology and Data Center
National Institute of Aeronautics and Space (LAPAN) Jakarta – Indonesia
Agil Sutrisnanto Center for Aerospace Policy Studies
National Institute of Aeronautics and Space (LAPAN)
Jakarta – Indonesia
Intan Perwitasari
Center for Aerospace Policy Studies
National Institute of Aeronautics and Space (LAPAN)
Jakarta – Indonesia
Farida Farida
Faculty of Economics and Bussiness UPI, YAI, Jakarta Indonesia
Abstract:- oil palms industry has strategic role as the
biggest contributor for foreign exchange in Indonesia.
Meanwhile, Indonesia also the largest producer of oil
palms all over the world. However, the productivity value
is still less than optimal. Government policy through
Presidencial decree Number 8 Year 2018 regarding
moratorium/postponement and evaluation on oil palms
plantation permit, gives mandate to stakeholders to
increase productivity by intensification that needs
technological support. The use of remote sensing
technology allows the monitoring of oil palms plantation
in giving direction for management policy making. This
research aims to estimate the remote-sensing based
productivity of oil palms plantation by utilizing satellite
imagery data of SPOT 6. Method uses in this research is
artificial neural network method, one of which detects the
plant’s life age and analayze through linear regression
which involving Normalized Different Vegetation Index
(NDVI) value and production to have estimation of
production. Results of the research shows that using ANN
can predict oil palm plantation life age by 87% of
accuracy. Meanwhile, production estimation done using
NDVI for estimation of production generated an
estimation formula Y = -24391 -766 X1 + 65482 X2
Keywords: Production, Oil Palms Plantation, Artificial
Neural Network, Spot 6.
I. INTRODUCTION
Sub-sector of plantation has important role in the
contribution of national gross domestic product (GDP) that is
of Rp. 429 Trillion in 2016. This exceeded the oil and gas
sector which is only Rp. 365 Trillion. Oil Palms hold a crucial
role in generating the biggest foreign exchange in plantation
sub-sector that is Rp. 260 Trillion or approximately 54% of
total of foreign exchange that is generated from 2016, and increased to Rp. 290 Trillion in 2017 (BPS, 2019).
The data shows that oil palm industry has a strategic role
for Indonesia. This can be possible also because Indonesia’s
position with the largest area and production of palm oil in the
world. However, there is still a gap between riil production of
oil palms with its production potential. At the moment,
productivity of oil palms plantation in Indonesia is
approximately 2,8 ton CPO/ha/year from 6-7 ton CPO/ha/year
potential. Several efforts have been done to increase the
productivity, one of which is the application of technology, both in cultivation, mechanism, and other technologies which
may support production development.. Government policy
through Presidential Decree No. 8 Year 2018 regarding
postponement and evaluation on oil palms plantation permit,
gives mandate to stakeholders to increase productivity by
intensification efforts. This effort needs a proper
technological support.
Volume 4, Issue 11, November – 2019 International Journal of Innovative Science and Research Technology
ISSN No:-2456-2165
IJISRT19NOV633 www.ijisrt.com 549
Development of remote sensing science allows the
monitoring of oil palm plantation in giving management
policy making. Sharma, et.al. (2017) utilizing remote sensing in agricultural sector, especially in plantation to identify
plants suitable to be planted in a particular season. Remote
sensing is also an important tools for monitoring in timely
manner and give an accurate imagery on agricultural sector
with high accuracy of frequency of repetition
(Shanmugapriya, et.al., 2019). Remote sensing is an
instrument to ease monitoring on performance and
development of oil palm plantation productivity. Remote
sensing with high resolution will generate precision of data
and applicative information which able to monitor the
development of oil palm plantation. Wiramoko, et.al. (2016),
and Carolita, et.al., (2015), stated that utilization of remote sensing technology in estimating production value using oil
palm life age as parameter reach a fairly high level of
accuracy.
According to several points above, the use of remote
sensing technology has the potential to support monitoring
activity in agricultural sector. Production potential of oil
palms in affected by some factors including physical factor,
plant factor, and management. One of the plant factors which
information can be extracted through remote sensing is the
life age of the plant. Identification on plant life age can be continued with productivity value, so it can offer economic
value which can be used as management monitoring tools for
governance of oil palm plantations. This research is
conducted to estimate productivity of oil palm plantations
based on remote sensing technology through the utilization of
SPOT-6 satellite image data.
II. RESEARCH METHOD
A. Research Location
Research object using case study in Plantation Adolina
and Pabatu which are located in Serdang Bedagai District and Deli Serdang North Sumatera, respectively. Research location
of Plantation Adolina is 3.59455 Latitude and 98.953759
Longitude. Meanwhile, plantation Pabatu is at 3.36126
Latitude and 99.053879 Longitude
B. Type and Source of Data Collection
Type of data used in this research is SPOT 6 satellite
imagery data of the recording dated 5 June 2017. Other data
used are plant life age data and production year 2017. Another
primary data is obtained through discussion and interview
with stakeholders related with the survey for validity testing process. Validity test is also done by using groun truth
method to compare between interpretation output with real
condition on site.
C. Data Analysis
Qualitative and quantitative method approaches used in
this research is Artificial Neural Network method from
SPOT-6 satellite imagery to differentiate plant’s life age.
1. Data Correction
Radiometric Correction
Radiometric correction is intended to improve the visual
quality of the image as well as to fix pixel values that are not
suitable with the real spectral radiance. There are 2 steps in
radiometric correction, namely equating pixel value range and
imagery fusion (pansharpen). This correction change radian
value into spectral and then its radians value will be converted
to refletion valuue by using FLAASH (Fast Line-odd-sight
Atmospheric Analysis of Hypercubes) of ENVI 5.0. software
Radiometric correction using FLAASH is done based on the
research of (Anderson et al., 2002) using the formula (1)
below
L = ( Aρ
1 − ρeS) + (
Bρe
1 − ρeS) + La … … … . . (1)
Where is pixel surface reflection, e means surface
reflection average for surrounding area, S is albedo of
atmospheric ball, La is backround luminous rays scattered by
atmospher without reaching the surface, meanwhile A and B
are the variation of surface independent coefficient with atmosphere and geometric conditions.
Geometric Correction
Geometric correction that is used to fix geometric
distortion or geometric image error recorded during its
imagery that causing mismatch in form, size, and image
position with the real condition. The image used in this
research has been corrected geometrically in systematic way
by the censor from acquisition process from LAPAN Pare-
Pare ground segment, so geometric correction is no longer
necessary.
2. Transformation of Vegetation Index (NDVI)
Normalized Different Vegetation Index (NDVI) is one
of transformations that is commonly used to increase accuracy
from multispectral classification output by expecting that the
band ratio able to minimize atmospheric errors. Value from
this vegetation index is ranged from – 1 to + 1. The (+)
number shows green vegetation. This transformation uses red
channel and closest infrared channel as its input channel
(Danoedoro, 2012). The formula used for NDVI calculation is
presented in formula (2) below.
NDVI = NIR − R
NIR + R… … … … . (2)
Where NIR : infrared reflectance band, and R : red
reflectance band.
3. Classification Modelling of Oil Palms Life Age Estimation
using Machine Learning
The stages conducted in this modeling are using QGIS
software, more details are available below :
Volume 4, Issue 11, November – 2019 International Journal of Innovative Science and Research Technology
ISSN No:-2456-2165
IJISRT19NOV633 www.ijisrt.com 550
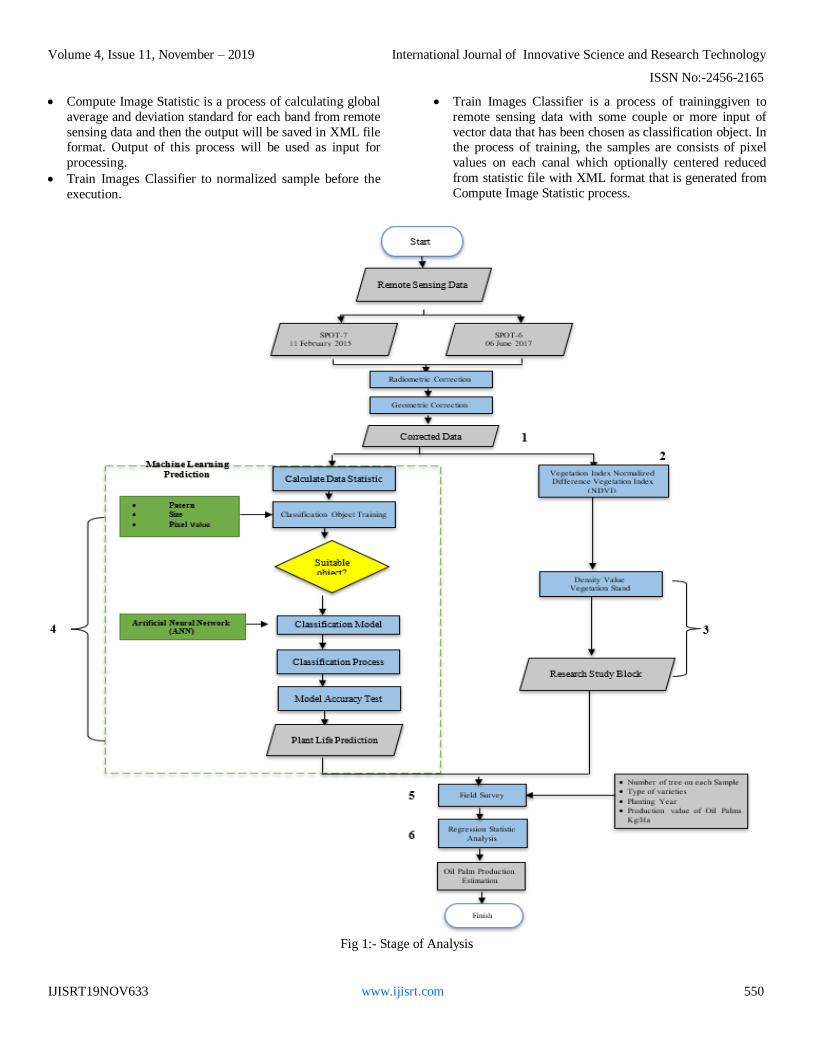
Compute Image Statistic is a process of calculating global
average and deviation standard for each band from remote
sensing data and then the output will be saved in XML file format. Output of this process will be used as input for
processing.
Train Images Classifier to normalized sample before the
execution.
Train Images Classifier is a process of traininggiven to
remote sensing data with some couple or more input of
vector data that has been chosen as classification object. In the process of training, the samples are consists of pixel
values on each canal which optionally centered reduced
from statistic file with XML format that is generated from
Compute Image Statistic process.
Fig 1:- Stage of Analysis
Volume 4, Issue 11, November – 2019 International Journal of Innovative Science and Research Technology
ISSN No:-2456-2165
IJISRT19NOV633 www.ijisrt.com 551
4. Modelling of Machine Learning Methode ANN (Artificial
Neural Network)
Artificial Neural Network Artificial (ANN) is one of a techniques of information processing inspired by how the
nervous system of human brain cells work in processing an
information. This network consists of neuron that is
connected by communication network or connector to do its
specific function based on weighting between elements
(Ismail & Khamis, 2011). ANN has a mathematical model
which consist of one set of simple function that are input x,
unit output y, and hidden unit z that connect to the output.
Eskandarin, et.al., (2010) share an infromation that the hidden
unit extracted the useful information and use it to predict the
output, so ANN is also commonly known as multi-layer
perceptron. Ismail & Khamis, (2011) delivered that network with element input vector xl (1 = 1, 2, ... Ni) is transmitted
through connection multiplied by weight, wji, given the
hidden unit zi (j = 1, 2, 3,..., Nk) as in the following formula
(3) :
zj = ∑ wjlxl + wj0
∞
i=1 ………….. (3)
Where Nk = Numbers of hidden unit Ni = Numbers of Input
unit.
5. Process of Accuracy Test
Process of accuracy test utilizing the tools from QGIS
that is, compute confusion matric. The tools needs initial
input data in the form of a model to be tested using matching method with output data from ground truth in vector or raster
format. Automatically, the tools compute by generating
output in a form of model sparability table in accordance with
number of classification. The stage of classification accurac
test is conducted using accuracy test method, Kappa
coefficient. Kappa coefficient value has a range of 0 to 1, in
the process of classificaiton mapping / land cover accuracy
value that is acceptable is 85% or 0,85 (Anderson, 1976),
1976). Kappa coefficient is based on consistency of
assessment by considering all aspects including producer’s
accuracy / omission error and user’s accuracy /commission
error which are generated from matrix error or confusion matrix.
OA =Վ B
Վ S x 100%..............(4)
Where OA is Overal Accuracy, B is correct amount
and S is total sample.
6. Production Estimation
Prouction estimation is done by linear regression
analysis which involving plant life age factor and NDVI
average value on the block under study.
As for the linear regression equation, will be presented
in formula 5.
Y = a + b1x1 + b2x2 … … … … … … . . (5)
Where Y is productivity of oil palm plantations
(kg/TBS/ha/year), x1 is plant’s life age and x2 is NDVI
average value in one block plant. Interpretation on correlation
value is vary, in this research, using classification done by
Sugiyono (2014) whom divided it into 5 (five) classes as
presented on Table 1.
Coefficient Interval Level of Correlation
0,00-0,199 Very low
0,20-0,399 Low
0,40-0,599 Medium
0,60-0,799 Strong
0,80-1,000 Very Strong
Table 1:- Guideline on Correlation Coefficient Interpretation
Source : Sugiyono, 2014
III. RESULTS AND DISCUSSION
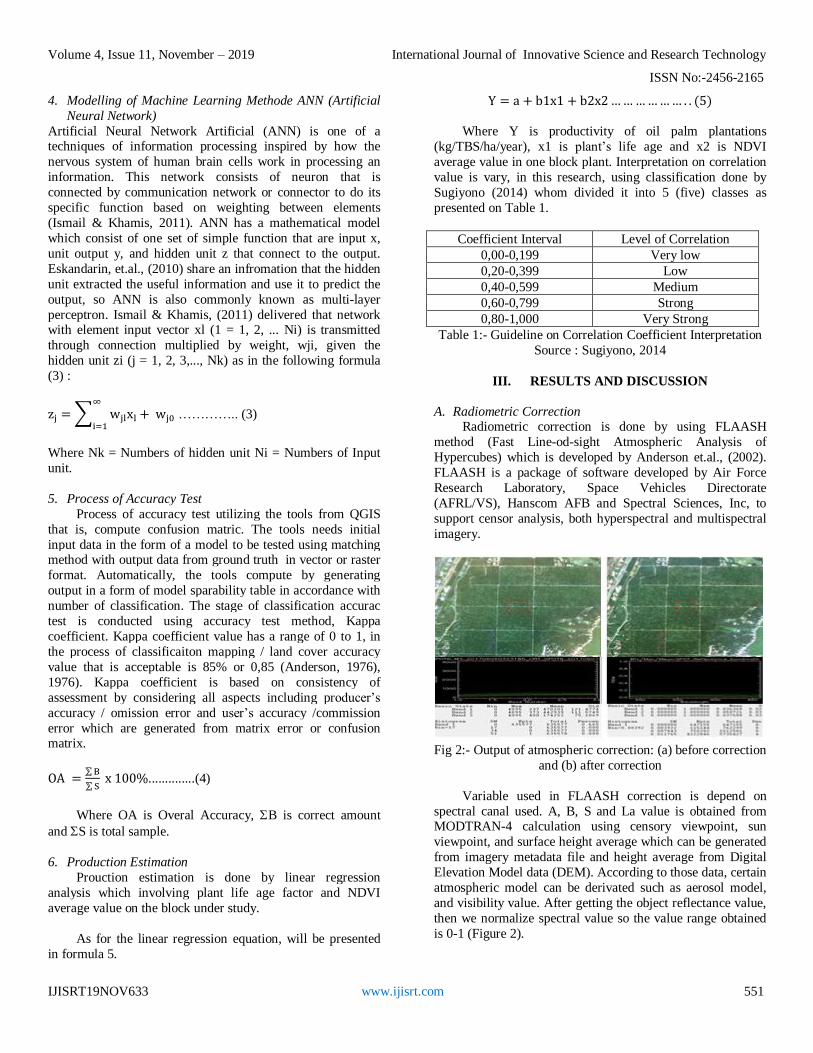
A. Radiometric Correction Radiometric correction is done by using FLAASH
method (Fast Line-od-sight Atmospheric Analysis of
Hypercubes) which is developed by Anderson et.al., (2002).
FLAASH is a package of software developed by Air Force
Research Laboratory, Space Vehicles Directorate
(AFRL/VS), Hanscom AFB and Spectral Sciences, Inc, to
support censor analysis, both hyperspectral and multispectral
imagery.
Fig 2:- Output of atmospheric correction: (a) before correction
and (b) after correction
Variable used in FLAASH correction is depend on
spectral canal used. A, B, S and La value is obtained from MODTRAN-4 calculation using censory viewpoint, sun
viewpoint, and surface height average which can be generated
from imagery metadata file and height average from Digital
Elevation Model data (DEM). According to those data, certain
atmospheric model can be derivated such as aerosol model,
and visibility value. After getting the object reflectance value,
then we normalize spectral value so the value range obtained
is 0-1 (Figure 2).

Volume 4, Issue 11, November – 2019 International Journal of Innovative Science and Research Technology
ISSN No:-2456-2165
IJISRT19NOV633 www.ijisrt.com 552
B. Calculation of NDVI Value
Results of NDVI value on research location get the NDVI
value ranged from -0.8 – 1 which inform the information extraction of vegetation object. Low value represents that the
object is indicated non-vegetation, meanwhile higher value is
a vegetation object. NDVI value that is close to 1 represents a
homogeny vegetation object with high level of density.
Fig 3:- Comparison of original colow imagery composite (a)
and NDVI value in some part of research location (b)
NDVI value that is used as a reference in sampling by
looking at the level of density of plants in one block. Density
value is assumed to be able to represent in choosing sample
that suit the oil palms planting year. Since it is assumed that spectral value is close to 1 means a plant with high level of
chlorophyl/young meanwhile for low value of spectral is
assumed to be senile. This fit the statement of Harfield, et.al,
(2008) who share NDVI value information which has a role in
analyzing cover crops. The number of NDVI will affect the
established production.
C. Artificial Neural Network
Calculation output from NDVI will be used as a
reference in sampling by looking at density level of trees in
one block. Density value is assumed to represent in choosing a sample that fit the oil palm life age. Since it is assumed that
spectral value close to 1 means a plant with high level of
chlorophyll/young meanwhile for low value of spectral is
assumed to be senile. This is not 100% correct, so ground
truth method and classification modelling using machine
learning is necessary to be done. Machine learning used is
ANN.
Vector data used in the training process is a data with
polygon topography with attribute information for positive
numbers to represent class labels. The name of each class is
regulated using parameter “Class Label Field” so the training process and validation of each clas is represented fairly.
Model classification class is determined based on planting
year distribution that is available in one afdeling andolina and
afdeling pabatu area. Model classification making refers to a
more general planting year classification that is divide over a
lifespan ranging from years 3-5 years, 6-13 years, 14-20 years
and 21-25 years.
Identification process of this lifespan classification using
an imagery that has been carried out transformation of
vegetation index (NDVI), is conducted by identifying density level. Other than looking at NDVI density level on model
classification making, it is necessary to pay attention to spatial
pattern of each block.
Fig 4:- ANN Process on research location
Fig 5:- Output of Analysis of Oil Palms Plantation life age in
Adolina and Pabatu plantation
Figure 5 shows the stage of classification model making
based on machine learning using ANN Artificial Neural
Network Artificial method. The model uses a threshold of 0,8 and neuron 6. The parameter is chosen based on prior testing
to get the best model in mahine learning-based classificaiton.
ANN output is presented in Figure 7 that classify oil palms
plantation into 5 life age groups, from years 3-5 years, 6-13
years, 14-20 years and 21-25 years.
Ground truth method is done to determine the accuracyof the
established model in estimating plant life age. Testing process
with field survey system by visiting sample of planting year
per-block afdeling according to secondary data generated
from plantation data. Data of planting year in Plantation Adolina are: 23, 22, 21, 20, 19, 14, 13, 12, 11, 10, 9 and 7
years. The number of plant age variations in plantation Pabatu
Volume 4, Issue 11, November – 2019 International Journal of Innovative Science and Research Technology
ISSN No:-2456-2165
IJISRT19NOV633 www.ijisrt.com 553
is less than in plantation Adolina, which only consist of 17,
14, 13, 12, 11, and 10 years of planting year.
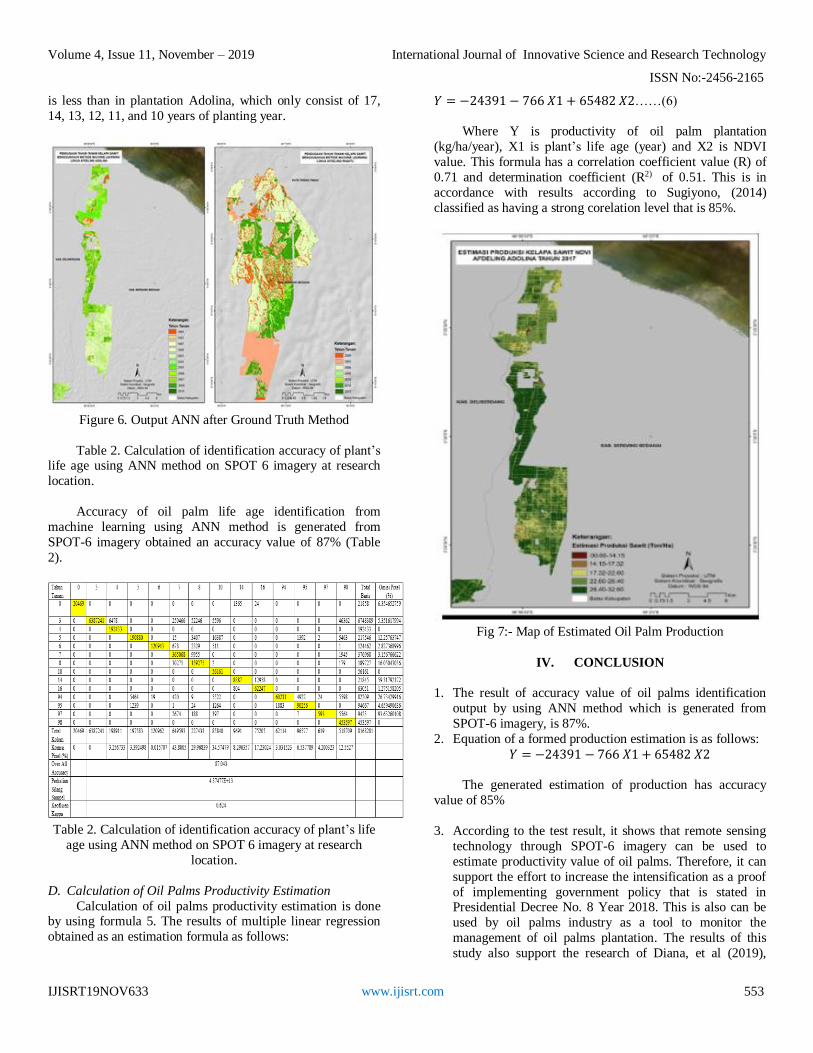
Figure 6. Output ANN after Ground Truth Method
Table 2. Calculation of identification accuracy of plant’s life age using ANN method on SPOT 6 imagery at research
location.
Accuracy of oil palm life age identification from
machine learning using ANN method is generated from
SPOT-6 imagery obtained an accuracy value of 87% (Table
2).
Table 2. Calculation of identification accuracy of plant’s life
age using ANN method on SPOT 6 imagery at research
location.
D. Calculation of Oil Palms Productivity Estimation
Calculation of oil palms productivity estimation is done by using formula 5. The results of multiple linear regression
obtained as an estimation formula as follows:
𝑌 = −24391 − 766 𝑋1 + 65482 𝑋2……(6)
Where Y is productivity of oil palm plantation
(kg/ha/year), X1 is plant’s life age (year) and X2 is NDVI
value. This formula has a correlation coefficient value (R) of
0.71 and determination coefficient (R2) of 0.51. This is in
accordance with results according to Sugiyono, (2014)
classified as having a strong corelation level that is 85%.
Fig 7:- Map of Estimated Oil Palm Production
IV. CONCLUSION
1. The result of accuracy value of oil palms identification
output by using ANN method which is generated from
SPOT-6 imagery, is 87%.
2. Equation of a formed production estimation is as follows:
𝑌 = −24391 − 766 𝑋1 + 65482 𝑋2
The generated estimation of production has accuracy
value of 85%
3. According to the test result, it shows that remote sensing
technology through SPOT-6 imagery can be used to
estimate productivity value of oil palms. Therefore, it can
support the effort to increase the intensification as a proof
of implementing government policy that is stated in Presidential Decree No. 8 Year 2018. This is also can be
used by oil palms industry as a tool to monitor the
management of oil palms plantation. The results of this
study also support the research of Diana, et al (2019),
Volume 4, Issue 11, November – 2019 International Journal of Innovative Science and Research Technology
ISSN No:-2456-2165
IJISRT19NOV633 www.ijisrt.com 554
about the direct use of remote sensing technology that can
provide high economic value.
ACKNOWLEDGEMENTS
Author is very grateful to Mr. Dhimas Wiratmoko
(Indonesian Oil Palm Research Institute), Mr. Agus Hidayat
and Mr. Robertus Heru Triharjanto (Center for Aerospace
Policy Studies, National Institute of Aeronautics and Space)
who has contributed to this research. We are also grateful to
PT. Perkebunan Nusantara IV for giving us permission to do
our research at Serdang Bedagai District and Deli Serdang
North Sumatera.
REFERENCES
[1]. Anderson, G. P., Felde, G., Holke, M., Ratkowski, A.,
Cooley, T., Chetwynd, J., Lewis, P. (2002).
MODTRAN4-based atmospheric correction algorithm :
FLAASH (Fast Line-of-sight Atmospheric Analysis of
Spectral Hypercubes). Algorithms and Technologies for
Multispectral, Hyperspectral, and Ultraspectral Imagery
VIII, Proceedings of SPIE Vol. 4725 (2002) © 2002
SPIE · 0277-786X/02/$15.00 Downloaded, 4725, 65–71.
[2]. BPS. (2019). Statistik Kelapa Sawit Indonesia 2018
(Indonesian Oil Palm Statistics 2018). 82 p.
[3]. Carolita, I., Sitorus, J., Manalu, J., & Wiratmoko, D.
(2015). Growth Profile Analysis of Oil Palm By Using
Spot 6 the Case of North Sumatra. International Journal
of Remote Sensing and Earth Sciences (IJReSES), 12(1),
21. https://doi.org/10.30536/j.ijreses.2015.v12.a2669
[4]. Danoedoro, P. (2012). Pengantar Penginderaan Jauh
Digital. Yogyakarta: PT. Andi.
[5]. Diana, S. R., Hidayat, A., Rafikasari, A., Ibrahim, I. M.,
Farida. (2019). Economic Assesstment of Satellite
Remote Sensing Data in Indonesia: A Net Present Value
Approach. International Journal of Economics and
Financial Issues. 9 (1). 140-146
[6]. Eskandarin, A., Nazarpour, H., Teimouri, M., & Z.
Ahmadi, M. (2010). Comparison of Neural Network and
K-Nearest Neighbor Methods in Daily Flow Forecasting.
Journal of Applied Sciences, Vol. 10, pp. 1006–1010.
https://doi.org/10.3923/jas.2010.1006.1010
[7]. Hartfield, L., Gitelson, A., Schepers, J., & Walthall, C.
(2008). Application of Spectral Remote Sensing for
Agronomic Decisions. Celebrate the Centennial
(Suplement to Agronomy Journal).
[8]. Ismail, Z., & Khamis, A. (2011). Neural network in
modeling malaysian oil palm yield. American Journal of
Applied Sciences, 8(8), 796–803.
https://doi.org/10.3844/ajassp.2011.796.803
[9]. JR. Anderson. (1976). A Land Use and Land Cover
Classification System for Use with Remote Sensor Data
(Vol. 964). Washington DC: US Goverment Printing
Office.
[10]. Shanmugapriya, S., Rathika, T., Ramesh, P., Janaki, P.
(2019). Applications of Remote Sensing in Agriculture -
A Review. International Journal of Current
Microbiology and Applied Sciences, 08(01), 2270–2283.
https://doi.org/https://doi.org/10.20546/ijcmas.2019.801.
238
[11]. Shivaprasad Sharma, S. V., Parth Sarathi, R.,
Chakravarthi, V., Srinivasarao, G., & Bhanumurthy, V.
(2017). Extraction of detailed level flood hazard zones
using multi-temporal historical satellite data-sets–a case
study of Kopili River Basin, Assam, India. Geomatics,
Natural Hazards and Risk, 8(2), 792–802.
https://doi.org/10.1080/19475705.2016.1265014
[12]. Sugiyono. (2014). Statistik untuk Penelitian. Bandung:
Alfabeta.
[13]. Wiratmoko, D., Hartono, H., & Murti BS, S. H. (2016).
Worldview-2 Imagery Vegetation Index Calculation for
Oil Palm Yield Estimation. Jurnal Penelitian Kelapa
Sawit, 24(3), 143–156.
https://doi.org/10.22302/iopri.jur.jpks.v24i3.17