Estimation of PSD Shifts for High-Resolution Metrology of Thickness Micro-Changes with Possible...
30
Sensors 2012, 12, 15394-15423; doi:10.3390/s121115394 sensors ISSN 1424-8220 www.mdpi.com/journal/sensors Article Estimation of PSD Shifts for High-Resolution Metrology of Thickness Micro-Changes with Possible Applications in Vessel Walls and Biological Membrane Characterization Antonio Ramos 1, *, Ivonne Bazán 2 , Carlos Negreira 3 , Javier Brum 3 , Tomás Gómez 1 , Héctor Calás 1 , Abelardo Ruiz 1 and José Manuel de la Rosa 2 1 Laboratorio Señales, Sistemas y Tecnologías Ultrasónicas, Consejo Superior de Investigaciones Científicas (CSIC), 28006 Madrid, Spain; E-Mails: [email protected] (T.G.); [email protected] (H.C.); [email protected] (A.R.) 2 ESIME, Instituto Politécnico Nacional (IPN), 07738 México DF, Mexico; E-Mails: [email protected] (I.B.); [email protected] (J.M.R.) 3 Departamento de Materiales, Facultad de Ciencias, Universidad de la Republica, 11400 Montevideo, Uruguay; E-Mails: [email protected] (C.N.); [email protected] (J.B.) * Author to whom correspondence should be addressed; E-Mail: [email protected]; Tel.: +34-91-561-8806; Fax: +34-91-411-7651. Received: 3 August 2012; in revised form: 29 October 2012 / Accepted: 2 November 2012 / Published: 9 November 2012 Abstract: Achieving accurate measurements of inflammation levels in tissues or thickness changes in biological membranes (e.g., amniotic sac, parietal pleura) and thin biological walls (e.g., blood vessels) from outside the human body, is a promising research line in the medical area. It would provide a technical basis to study the options for early diagnosis of some serious diseases such as hypertension, atherosclerosis or tuberculosis. Nevertheless, achieving the aim of non-invasive measurement of those scarcely-accessible parameters on patient internal tissues, currently presents many difficulties. The use of high-frequency ultrasonic transducer systems appears to offer a possible solution. Previous studies using conventional ultrasonic imaging have shown this, but the spatial resolution was not sufficient so as to permit a thickness evaluation with clinical significance, which requires an accuracy of a few microns. In this paper a broadband ultrasonic technique, that was recently developed by the authors to address other non-invasive medical detection problems (by integrating a piezoelectric transducer into a spectral measuring system), is extended to our new objective; the aim is its application to the thickness measurement of OPEN ACCESS
-
Upload
universidadistmoamericana -
Category
Documents
-
view
1 -
download
0
Transcript of Estimation of PSD Shifts for High-Resolution Metrology of Thickness Micro-Changes with Possible...
Sensors 2012, 12, 15394-15423; doi:10.3390/s121115394
sensors ISSN 1424-8220
www.mdpi.com/journal/sensors
Article
Estimation of PSD Shifts for High-Resolution Metrology of Thickness Micro-Changes with Possible Applications in Vessel Walls and Biological Membrane Characterization
Antonio Ramos 1,*, Ivonne Bazán 2, Carlos Negreira 3, Javier Brum 3, Tomás Gómez 1,
Héctor Calás 1, Abelardo Ruiz 1 and José Manuel de la Rosa 2
1 Laboratorio Señales, Sistemas y Tecnologías Ultrasónicas, Consejo Superior de Investigaciones
Científicas (CSIC), 28006 Madrid, Spain; E-Mails: [email protected] (T.G.);
[email protected] (H.C.); [email protected] (A.R.) 2 ESIME, Instituto Politécnico Nacional (IPN), 07738 México DF, Mexico;
E-Mails: [email protected] (I.B.); [email protected] (J.M.R.) 3 Departamento de Materiales, Facultad de Ciencias, Universidad de la Republica, 11400 Montevideo,
Uruguay; E-Mails: [email protected] (C.N.); [email protected] (J.B.)
* Author to whom correspondence should be addressed; E-Mail: [email protected];
Tel.: +34-91-561-8806; Fax: +34-91-411-7651.
Received: 3 August 2012; in revised form: 29 October 2012 / Accepted: 2 November 2012 /
Published: 9 November 2012
Abstract: Achieving accurate measurements of inflammation levels in tissues or thickness
changes in biological membranes (e.g., amniotic sac, parietal pleura) and thin biological
walls (e.g., blood vessels) from outside the human body, is a promising research line in the
medical area. It would provide a technical basis to study the options for early diagnosis of
some serious diseases such as hypertension, atherosclerosis or tuberculosis. Nevertheless,
achieving the aim of non-invasive measurement of those scarcely-accessible parameters on
patient internal tissues, currently presents many difficulties. The use of high-frequency
ultrasonic transducer systems appears to offer a possible solution. Previous studies using
conventional ultrasonic imaging have shown this, but the spatial resolution was not
sufficient so as to permit a thickness evaluation with clinical significance, which requires
an accuracy of a few microns. In this paper a broadband ultrasonic technique, that was
recently developed by the authors to address other non-invasive medical detection
problems (by integrating a piezoelectric transducer into a spectral measuring system), is
extended to our new objective; the aim is its application to the thickness measurement of
OPEN ACCESS
Sensors 2012, 12 15395
sub-millimeter membranes or layers made of materials similar to some biological tissues
(phantoms). The modeling and design rules of such a transducer system are described, and
various methods of estimating overtones location in the power spectral density (PSD) are
quantitatively assessed with transducer signals acquired using piezoelectric systems and
also generated from a multi-echo model. Their effects on the potential resolution of the
proposed thickness measuring tool, and their capability to provide accuracies around the
micron are studied in detail. Comparisons are made with typical tools for extracting spatial
parameters in laminar samples from echo-waveforms acquired with ultrasonic transducers.
Results of this advanced measurement spectral tool are found to improve the performance
of typical cross-correlation methods and provide reliable and high-resolution estimations.
Keywords: spectral metrology; transducer systems; systems integration; high-resolution;
non-invasive estimation; wall and membranes thickness; PSD shifts
1. Introduction. Piezoelectric Metrology and Working Hypotheses
Investigation lines to create new applications of piezoelectric electromechanical transducers in both
time and frequency domains, seeking accurate measurement of internal physical magnitudes in diverse
materials, are the subject of increasing research. This is because of their potential capability for solving
numerous metrological problems in diverse scientific, industrial and medical areas. The use of spectral
techniques applied to the raw measured data opens up the possibility of increasing the precision in the
analysis of the electrical signals provided by this type of piezoelectric devices. Particularly useful
applications are the precise metrology of internal distances and of plate thickness inside opaque pieces.
Examples in the medical field would be the accurate measure of early inflammation levels in biological
tissues, of possible preliminary changes in biological membranes thickness (amniotic sac and parietal
pleura) and of thin walls in certain body tissues (for instance, blood vessels [1,2]). In fact, this would
provide the technical basis to analyze the possible technological achievement of early diagnostic tools
intended for dangerous diseases such as atherosclerosis, hypertension or tuberculosis.
In the field of the membranes research and its applications, both frequency and time techniques
(e.g., time domain reflectometry TDR) have been used to determine early membrane fouling that can
be detected by effective thickness changes and variations in other membrane properties. The thickness
variation can be measured with good resolution, in the case of membrane compaction and TDR [37].
Applications for diagnostic purposes of new metrological procedures based on piezoelectric
transducer systems, working in the megahertz range, appear to offer possible solutions and thus allow
the mentioned precise spatial measurements in tissues. However, reaching this objective in patients
requires accurate estimation (in a non-invasive way) of scarcely measurable parameters related to
internal tissues, which presents many difficulties with the current technological “state of the art”. For
instance the use of commercial echography equipment, for estimating spatial sizes from tissue images
of internal organs, has serious limitations as the resolution is typically worse than 0.5 mm in such
instruments (even at working frequencies as high as 7.5 MHz). Units working at higher frequencies,
such as 20 MHz, are only adequate for analysis of superficial parts (like the skin, or for use in
Sensors 2012, 12 15396
ophthalmology). Besides, their technological complexity is always high since at least a hundred
ultrasonic channels are required: 100 piezo-transducers and their related Emission & Reception (E/R)
electronic units. This complexity is detailed in the Section 3 where an efficient implementation of the
pulsed electronic control stages for broadband ultrasonic array systems is addressed.
Additional studies based on echographic ultrasonic imaging units and also segmentation
algorithms [812] have provided improved measurements in vessels. Spatial resolutions so obtainable
from these imaging units (worse than 200–300 µm, even after advanced image processing), are not still
sufficient as to permit accurate wall thickness estimations with a precise application for early diagnosis
in arteries, where variations, so light as 35 µm [11] or 10 µm [12], have a clear clinical interest.
Therefore, specific techniques must be created, not necessarily involving significantly more
complexity in the transducers and electronics technology. In fact, they could be based on only one
ultrasonic channel (of a topology similar to only one of the “n” channels shown in the Section 3), but
specifically intended for one-side echo-estimation into thin layers, membranes and laminated pieces.
This can be achieved by adding sophisticated signal processing stages, which are focused on
improving the accuracy in spatial measurements ranging around a few microns.
This new option should be applicable to facilitate a non-invasive early diagnosis objective, and also
in the more general metrological field of thickness gauging [13,14] in opaque pieces with limited
access from only one side. Here, improvements in the conventional ultrasonic one-side piezoelectric
meters, to reach accuracies near one micron, would be of a high utility.
Certain similar high-resolution applications of mono-channel and array ultrasonic transducer
systems in other medical areas have been preliminarily explored (some of them, very recently) to make
possible internal measurements and non-invasive diagnosis of some human diseases [15–24]. They
include the case of only one transducer actuating as an ultrasonic emitter and also performing echo
detection. A two-way procedure is used with the radiation controlled by a pulsed high-voltage
electronic driving [25], detection-matching-tuning circuits and other analogue electronics (decoupling,
broadband amplifying and filtering circuits) [26]. The detected spectral echo-information is then
processed using custom digital signal techniques [27]. In each new application, an efficient integration
of the selected transducers with the interface and transceiver electronic sub-systems is required.
The entire piezoelectric transduction system, so composed, has been shown to be an efficient tool to
extract information about tissues in a non-invasive way to achieve different new medical objectives:
(i) to provide data for the diagnosis of some viral or degenerative diseases like cirrhosis [15–18]; (ii) to
estimate thermal distributions in tissues under hyperthermia cancer treatments by means of an analysis
of the time echo-waveforms [19,21–23]. In the last case, the frequency spectral patterns can be
successful processed [20,24], with promising further extensions, maybe making possible the detection
of some tumors (such as in breast) in their early phases. Thus, neo-vascularizations could be detected
from their related light thermal effects, due to increases of blood perfusion in the pre-tumor zone [27].
The spectral analysis of ultrasonic echoes can be a low-cost tool to estimate small changes of
anatomical and physiological parameters modifying spectral peaks, due to the interactions of emitted
ultrasonic pulses with the granular, dispersive (or as in our case, laminar), nature of certain tissues.
These ultrasonic echo-pulses present rather complex time and frequency distributions making, a
direct interpretation of the related tissue information, difficult, but just the spectral estimation is a
general purpose tool employed to analyze with improved resolution complex or noisy radiofrequency
Sensors 2012, 12 15397
time-signals. In fact, it has been probed as an effective option to obtain data hidden inside noisy echoes
related to tissue structures, for instance in non-invasive thermometry [24,28].
Some research lines in spectral ultrasonic metrology are oriented at determining the average
distance among scatterers, using high-resolution PSD (power spectral density) estimation [29]. Other
current research attempts to associate overtones frequency behavior with temperature changes in a
tissue [20].
In applying this processing tool to noisy bio-ultrasonic signals, some problems (derived from the
rather complex nature of the acquired signals) can be analyzed. For instance, the echoes are not always
of a clearly deterministic and totally regular type. In tissues, the required information could be mixed
with noise and undesirable masking perturbations, so accuracy in measuring peak frequencies in echo
spectra could be affected by unfavorable elements creating spurious frequency peaks on PSD.
In order to properly evaluate here these aspects and some advantages of this type of tools, several
previously reported analysis procedures [24,28] will be extended to this problem. These procedures
were intended for thermal measurement at the internal parts of tissues, or phantoms designed with
internal multiple scattering that emulates the texture of some human organs.
Our starting hypothesis, in the current work, is that the changes in the ultrasonic parameters to be
evaluated in each application could be obtained by applying the developed spectral techniques. They
are similar to those described above for other type of clinical applications, but adapted to the new
conditions because of a common circumstance: the tissue changes appear reflected on certain time and
frequency variations encountered between normal multi-pulse echo-traces and those acquired from
pathologic tissues. Here, these variations would be related to light inflammations in membranes or
micro-changes in thickness of vessel walls. The changes, in amplitude and phase of spectral peaks in
the echoes, could be caused by: (a) modifications in the tissue stiffness (fibrosis processes), (b) internal
distance changes among scatterers in hepatic tissues (as potential indicator of chronic hepatitis),
(c) variations in the thickness of artery walls (due to atherosclerosis or atheroma plaque formation).
2. General Aspects and Planning of the Article
In this article, broadband ultrasonic procedures (using spectral techniques developed for other
medical detection problems) are specifically modified and adapted to analyze their applications for
accurate thickness estimation of sub-millimeter membranes, thin layers or walls. This will be studied
in phantoms made of materials with acoustic properties similar to those encountered in biological
tissues. The technology associated with the experiments involved is based on the integration of a
piezoelectric transducer and related electronics into a whole metrological system working in the
frequency domain. The main objective of designing the proposed system and procedure is to provide
high resolution for the mentioned thickness measurements with mainly medical purposes. It will be
explained as follows: along the article sections, the addressed topics are structured to develop three
main objectives: (a) a description of the basic pulsed transducer systems to be applied in this work, of
their design bases and of aspects of transduction and signal modeling; (b) the application of specific
electronic and processing techniques for noninvasive metrology of distances and sizes inside thin
tissues (detecting frequency alterations in ultrasonic echo-information); (c) the study of most important
factors to be taken into account to establish our improved spectral analysis procedure. The final aim is
Sensors 2012, 12 15398
increasing the basic axial spatial resolution and therefore the resulting precision in thickness
measurements. For assessing it as future estimation tool for accurate medical diagnosis in biological
membranes and blood vessels, resolutions, accuracy, and robustness aspects (including noisy
conditions), will be considered.
Certain advanced processing options to estimate overtones location in power spectral densities are
quantitatively evaluated for echo-responses acquired in laminar pieces with a broadband piezoelectric
transducer of 10 MHz in nominal frequency, operated under transient electronic driving, and also with
calculated echoes computationally generated from reliable multi-echo models.
The main objective of this comparative analysis is to determine the contributions of each option to
the resulting potential resolutions of the complete thickness measuring system for opaque specimens,
investigating its capability to provide spatial accuracies around 1 micron. The measurement resolutions
so attained are compared with those obtained, using the same piezoelectric transducer and similar
electronic transceiver hypotheses, but applying conventional signal processing methods in time and
frequency domains, for the extraction of spatial parameters from ultrasonic echoes received in laminar
samples. Concretely, some estimation results from using conventional cross-correlation techniques
(well-known as useful time-delay estimators [23,30,31]), and of applying advanced frequency-domain
methods (specifically improved for our purpose [27]) are shown. They provide, in some options of the
second group, high-resolution estimations as required for the here selected problems.
In the applications addressed in this work, for accurate thickness metrology, advanced spectral
analysis of multi-echo signals is extended to evaluate the frequency peaks’ behavior associated to the
acoustical resonance induced into the inspected material and including its overtones. These are related
with internal spatial parameters of a determined laminar sample, like a biological membrane, a sheet of
a new material, or a sanguineous vessel wall. When a change occurs in the physical dimensions of the
internal structure of such specimens, certain variations in the resulting ultrasonic echoes (coming from
the major internal discontinuities) are also produced: in the echoes times-of-flight or in the density of
echoes included into a fixed time period. Then, correlated alterations must also appear in the frequency
spectrum of echo-traces obtained as response to a pulsed ultrasonic beam perpendicularly emitted to
tissue external surface. This is due to concentrations or expansions in time of the reflected pulses,
proportional to the magnitude of the changes to be sensed in the ultrasonic propagation direction [32].
In consequence, these modifications on the time waveforms can be detected as precise changes in
the location of overtones related with the fundamental internal resonance in the analyzed medium,
which are tied to the internal spatial parameters to be estimated. Thus, these spectral changes must be
very finely analyzed to find their relation with internal alterations of some dimension, originated by
particular tissue pathologies. It has direct clinic implications, associated for instance to inflammation,
vessel wall widening, tissue density changes, or thermal dilatation by blood irrigation variations; but
before making a robust application of the extended technique to advanced medical diagnosis (detecting
light changes in membranes and walls), some pending research aspects have to be solved and
quantitatively evaluated under laboratory conditions. Particular adaptations of our previous estimation
techniques to laminar samples must be introduced, and aspects related to frequency resolution of the
ultrasonic procedure intended for spectral metrology purposes must be improved.
Along the paper sections, a study is performed about results obtained for thickness estimation, by
adaptation of different temporal and spectral techniques (classical and also of high-resolution) to
Sensors 2012, 12 15399
echo-waveforms acquired from a real thin wall phantom, constructed ad-hoc with layers of latex
material. The objective is to evaluate the new procedure (under conditions similar to those encountered
in real tissues), as a future tool in medical diagnosis, estimating dimensions inside tissues of a laminar
or membrane type. The dependence of variations in peak frequencies of the echo spectrum with
widening or narrowing in the vessel walls, is analyzed with a tube subjected to a pulsatile flow. A-scan
registers are obtained for distinct situations under precise control (to simulate pathologic alterations in
the real blood vessel walls). Comparative studies are also made showing how the application of our
improved spectral procedure, with broadband transducers, provides a good spatial estimation in a
dynamically modified wall thickness. Finally, others echoes computationally calculated by means of
numerical simulation of multi-pulse waveforms coming from laminar pieces [32] are also processed.
3. Systems Based on Pulsed Piezoelectric Transducers for Noninvasive Reliable Metrology
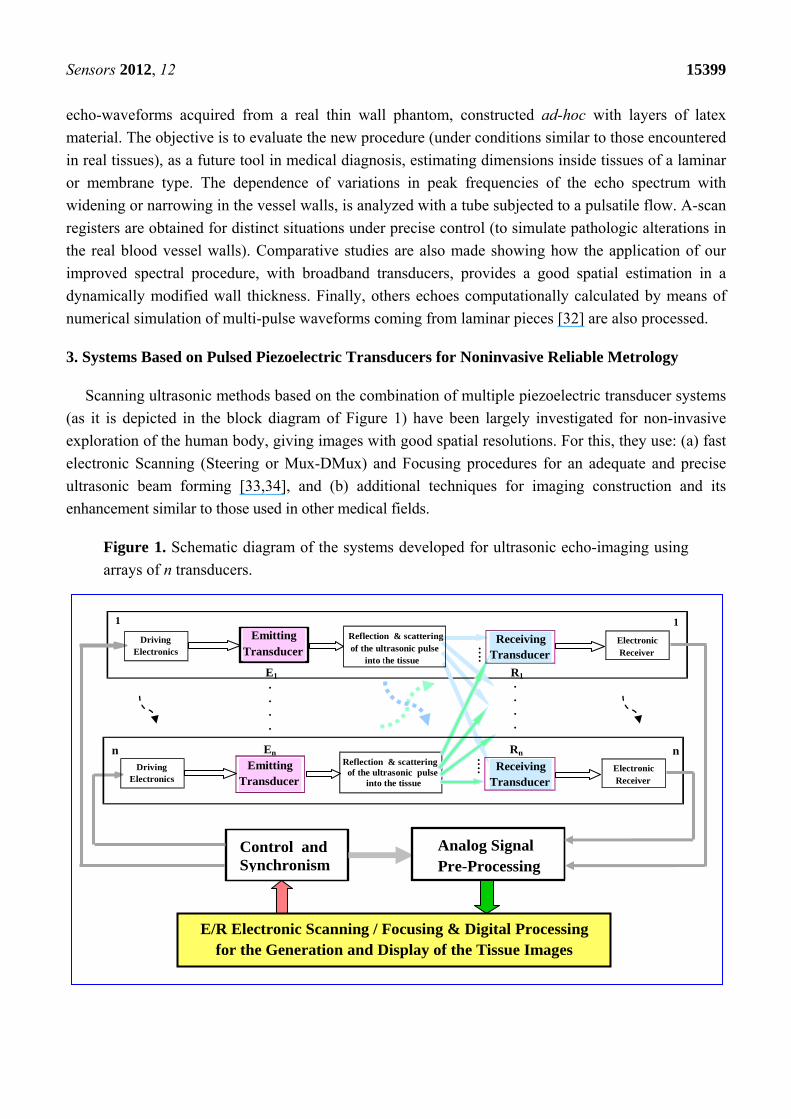
Scanning ultrasonic methods based on the combination of multiple piezoelectric transducer systems
(as it is depicted in the block diagram of Figure 1) have been largely investigated for non-invasive
exploration of the human body, giving images with good spatial resolutions. For this, they use: (a) fast
electronic Scanning (Steering or Mux-DMux) and Focusing procedures for an adequate and precise
ultrasonic beam forming [33,34], and (b) additional techniques for imaging construction and its
enhancement similar to those used in other medical fields.
Figure 1. Schematic diagram of the systems developed for ultrasonic echo-imaging using
arrays of n transducers.
Reflection & scattering of the ultrasonic pulse into the tissue
Analog Signal Pre-Processing
Electronic Receiver
n
R1 E1
En
1
Rn
1 Emitting Transducer
.
.
.
.
.
.
.
.
ReceivingTransducer
Driving Electronics
Emitting Transducer
n
DrivingElectronics
Electronic Receiver
ReceivingTransducer
Control and Synchronism
E/R Electronic Scanning / Focusing & Digital Processing for the Generation and Display of the Tissue Images
of the ultrasonic pulse into the tissue
Reflection & scattering... .
... .
Sensors 2012, 12 15400
The diverse implementations of these rather complex ultrasonic methods have made possible a very
ample commercial implementation of conventional echography equipment in hospitals for general
purpose diagnosis applications. They are based on displaying, at different colors or gray levels, distinct
echo-amplitudes associated to density changes detected by the ultrasonic beam during its propagation
through a human organ or a particular tissue. In addition to classical imaging technologies, some
proposals were reported to provide more specific ultrasonic tools for certain tissue characterizations or
facilitate complementary diagnosis of human diseases [16,17,19–23,35]. They use a direct processing
of the pulsed ultrasonic waveforms acquired from the analyzed medium, but searching other different
tissue physical parameters such as elasticity [15,16,18,35] or temperature [19–23], being more sensible
than the tissue densities with regards to some pathologic states.
By using this last type of characterization tools, complementary and useful information about
biological tissues can be easily extracted, which could make possible (in the future) more precise
diagnosis methods of viral or degenerative diseases; for example by a non-invasive estimation of
elastic modules or of thermal distribution into tissues from time and/or spatial changes in echoes.
These current research lines would be in conditions of defining solutions for an early detection of
some types of tumors or degenerative lesions in the near future. In these cases, the parameters being
analyzed before performing the display of the measurement results can be (instead of the classical echo
amplitude) the ultrasonic speed, the times-of-flight between echoes, the complex amplitude or phase of
the echo-spectra, changes of material stiffness or of distances between internal scatterers, etc.
3.1. Transducer Systems Topology for Detection and Measurements of Ultrasonic Echo-Signals
The general topology of a basic mono-channel ultrasonic system, using a bidirectional piezoelectric
transduction for measuring internal characteristics into biological tissues, is depicted in Figure 2. In
this type of applications, the piezoelectric transducers must to be specifically adapted to:
(a) the acoustical impedance of the radiated medium (which ranges around 1.5–1.6 × 10⁶ Kg m−1 s−2,
in soft tissues), using λ/4 coupling layers of impedances properly chosen for interfacing
with tissues.
(b) the electrical impedance of emitting and receiving electronics, by means of adding electrical
matching and tuning networks for interfacing with the high-voltage (HV) driving (supplied
from special pulse generators) and with the broadband receiving electronic subsystem.
Some tissues introduce high acoustic attenuation for frequency windows located into the rather
narrow working bands of the internal piezoelectric transducer vibrators. Besides, there is other important
reason imposing the broadband condition on the detection transducers: the ultrasonic responses have to
be of very short duration, to be capable of discriminating internal reflectors located in close positions.
Thus, the involved ultrasonic device must to be of broadband type, which is usually attained by
introducing acoustical losses in the piezoelectric vibrators. As a direct consequence, the broadband
piezoelectric transducers employed for biological measuring applications must have:
Sensors 2012, 12 15401
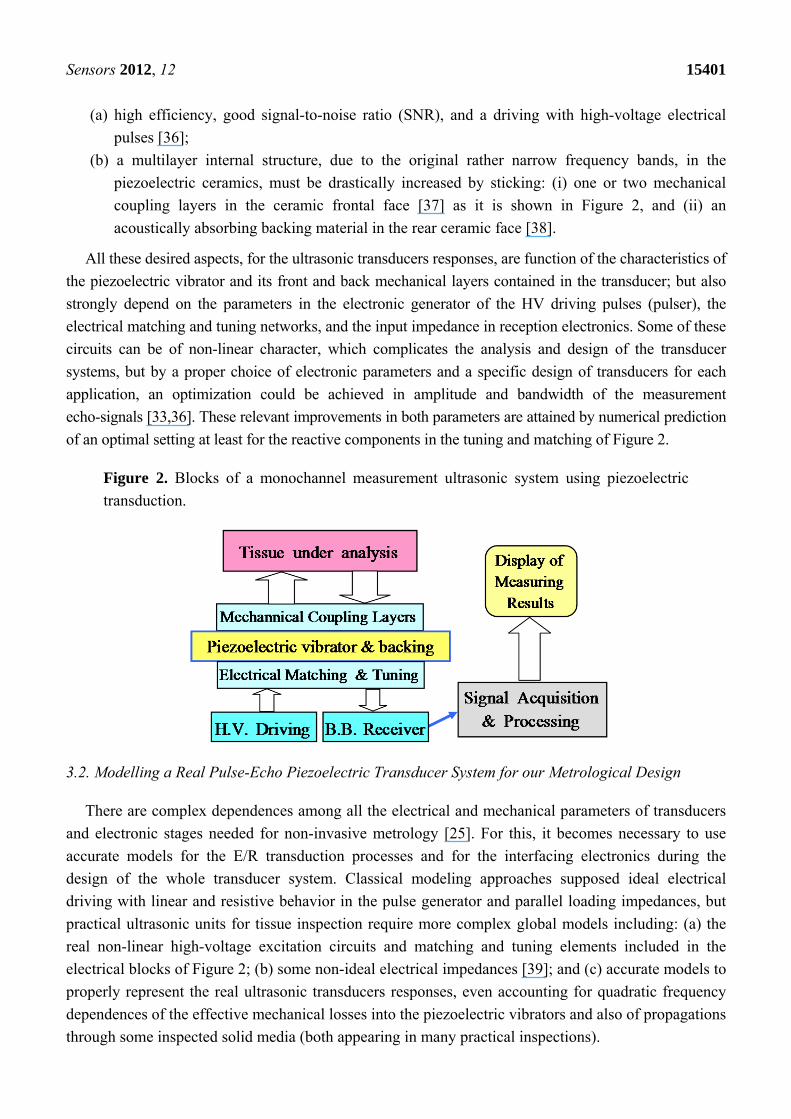
(a) high efficiency, good signal-to-noise ratio (SNR), and a driving with high-voltage electrical
pulses [36];
(b) a multilayer internal structure, due to the original rather narrow frequency bands, in the
piezoelectric ceramics, must be drastically increased by sticking: (i) one or two mechanical
coupling layers in the ceramic frontal face [37] as it is shown in Figure 2, and (ii) an
acoustically absorbing backing material in the rear ceramic face [38].
All these desired aspects, for the ultrasonic transducers responses, are function of the characteristics of
the piezoelectric vibrator and its front and back mechanical layers contained in the transducer; but also
strongly depend on the parameters in the electronic generator of the HV driving pulses (pulser), the
electrical matching and tuning networks, and the input impedance in reception electronics. Some of these
circuits can be of non-linear character, which complicates the analysis and design of the transducer
systems, but by a proper choice of electronic parameters and a specific design of transducers for each
application, an optimization could be achieved in amplitude and bandwidth of the measurement
echo-signals [33,36]. These relevant improvements in both parameters are attained by numerical prediction
of an optimal setting at least for the reactive components in the tuning and matching of Figure 2.
Figure 2. Blocks of a monochannel measurement ultrasonic system using piezoelectric
transduction.
3.2. Modelling a Real Pulse-Echo Piezoelectric Transducer System for our Metrological Design
There are complex dependences among all the electrical and mechanical parameters of transducers
and electronic stages needed for non-invasive metrology [25]. For this, it becomes necessary to use
accurate models for the E/R transduction processes and for the interfacing electronics during the
design of the whole transducer system. Classical modeling approaches supposed ideal electrical
driving with linear and resistive behavior in the pulse generator and parallel loading impedances, but
practical ultrasonic units for tissue inspection require more complex global models including: (a) the
real non-linear high-voltage excitation circuits and matching and tuning elements included in the
electrical blocks of Figure 2; (b) some non-ideal electrical impedances [39]; and (c) accurate models to
properly represent the real ultrasonic transducers responses, even accounting for quadratic frequency
dependences of the effective mechanical losses into the piezoelectric vibrators and also of propagations
through some inspected solid media (both appearing in many practical inspections).
Sensors 2012, 12 15402
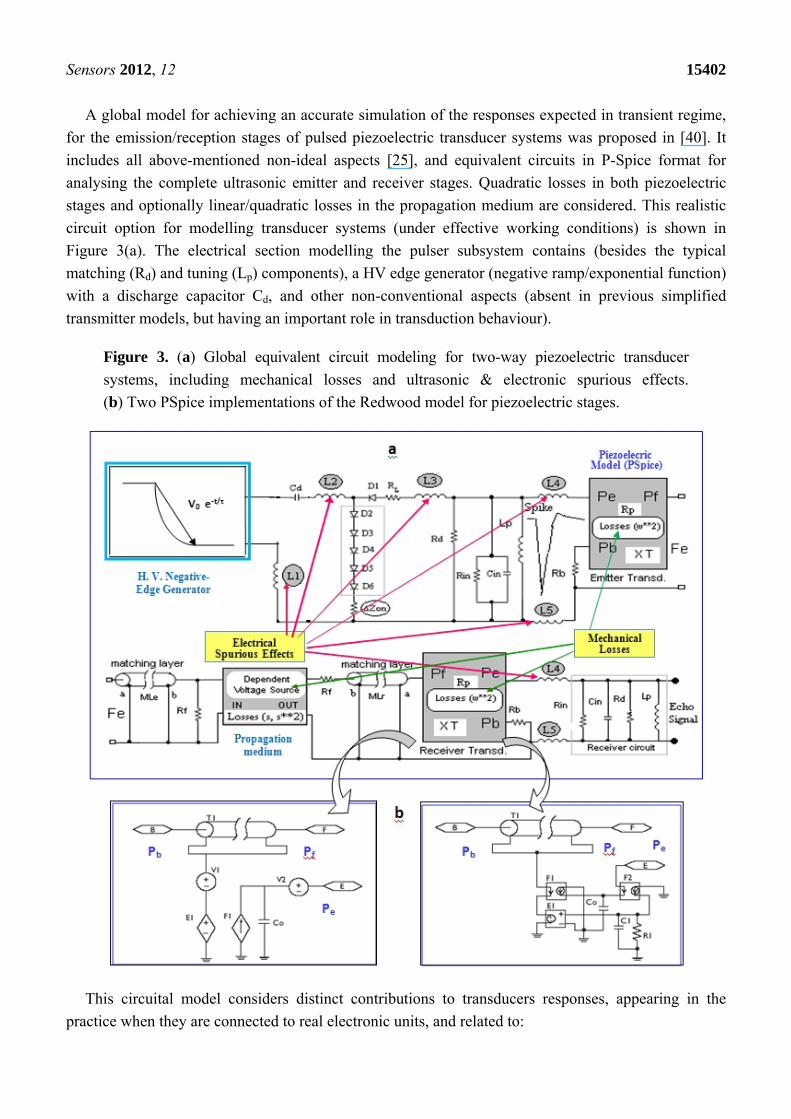
A global model for achieving an accurate simulation of the responses expected in transient regime,
for the emission/reception stages of pulsed piezoelectric transducer systems was proposed in [40]. It
includes all above-mentioned non-ideal aspects [25], and equivalent circuits in P-Spice format for
analysing the complete ultrasonic emitter and receiver stages. Quadratic losses in both piezoelectric
stages and optionally linear/quadratic losses in the propagation medium are considered. This realistic
circuit option for modelling transducer systems (under effective working conditions) is shown in
Figure 3(a). The electrical section modelling the pulser subsystem contains (besides the typical
matching (Rd) and tuning (Lp) components), a HV edge generator (negative ramp/exponential function)
with a discharge capacitor Cd, and other non-conventional aspects (absent in previous simplified
transmitter models, but having an important role in transduction behaviour).
Figure 3. (a) Global equivalent circuit modeling for two-way piezoelectric transducer
systems, including mechanical losses and ultrasonic & electronic spurious effects.
(b) Two PSpice implementations of the Redwood model for piezoelectric stages.
This circuital model considers distinct contributions to transducers responses, appearing in the
practice when they are connected to real electronic units, and related to:
Sensors 2012, 12 15403
- Non-ideal impedance elements in the grounding of the circuital branch containing several series
semiconductor elements Di, under high peaks of current: (Zon).
- Parasite inductive impedances from cabling (L4 and L5), and some critical segments of printed
circuit tracks (L1-L3) in the HV pulser board (which becomes relevant under HF conditions).
In piezoelectric and ultrasonic parts, some models are used: (a) Two transmission lines (MLe and
MLr) representing mechanical layers for acoustic impedance matching with the propagation medium
(Rf) in emission and reception. (b) Effects of very simplified diffraction, reflection and attenuation in
the inspection medium (in the gain of a dependent voltage source representing external propagation).
(c) Two PSpice piezoelectric modelling blocks in Figure 3(a) symbolizing the emitting & receiving
resonators with a backing section (Rb). They use an improved version of the classical PSpice models
proposed in [41,42]. Fi, and E1 are dependent sources of current and voltage, and Pb, Pf and Pe are the
mechanical (rear section, frontal medium) and electrical ports of the piezoelectric transducer.
The main improvement included in this modeling part is based on considering a quadratic approach
for the frequency dependence of the mechanical losses into transducers resonators. This is an option,
alternative to the classical linear-dependence implementations [42], which was theoretically derived
in [40], after analyzing some experimental measurements in piezo-ceramics reported in [43].
The PSPICE implementation of this quadratic approach allows the introduction of frequency-
dependent parameters in the transmission-line with losses T1 appearing in the Figure 3(b), which can
support the Laplace function. This quadratic-losses approach allows one to calculate echo-responses
more in consonance with the really measured ultrasonic signals, by attenuating the influence of the
ideal thickness odd-overtones [40], as it really happens in the practical and commercial transducers.
4. Simulating Echoes Patterns from Biological Phantoms only for Comparative Analyses
For properly optimizing echo-responses related to a particular metrological design in this area, the
modeling guides summarized in Section 3 must be used, but for the rather academic comparative
analyses to be made in this work, a simpler, operative and repetitive way to obtain adequate echo
patterns is to directly simulate the typical echo-waveforms, in an analytical way from a mathematical
expression. Another useful solution, giving repetitive and reliable bio-echo-patterns, is by using the
classic phantoms, e.g., of plastic material, in this case emulating arterial walls and thus producing real
experimental echoes.
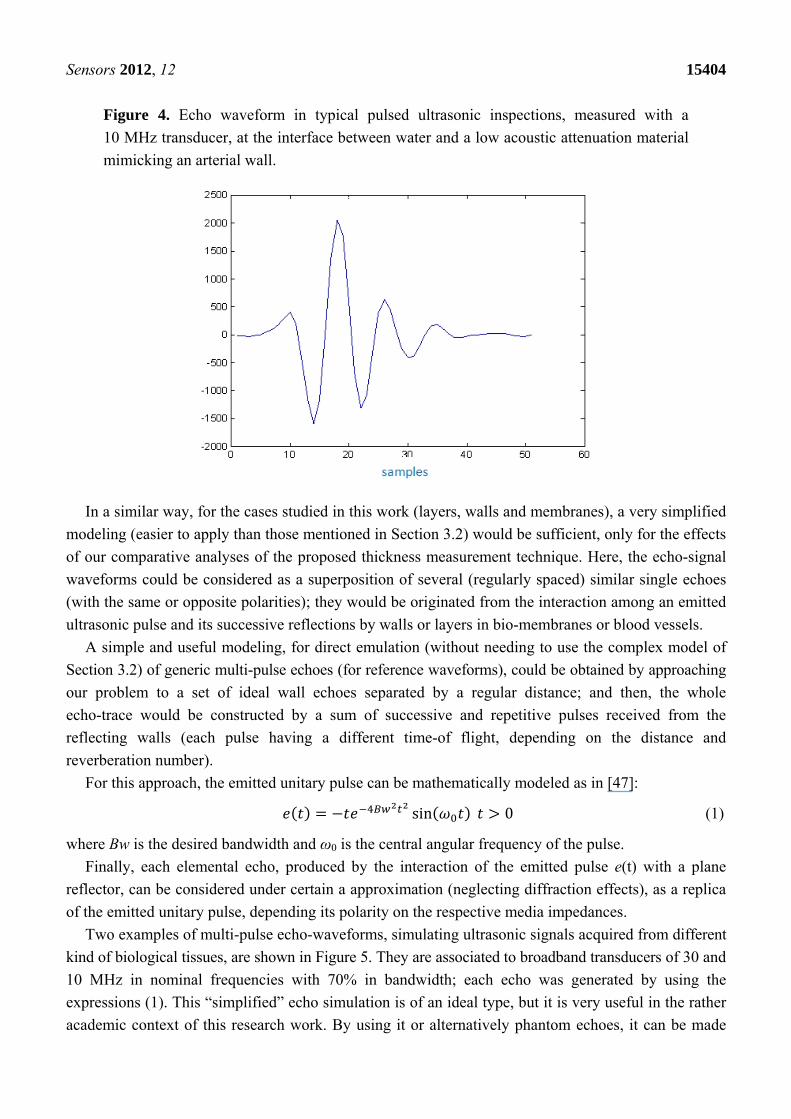
In the more typical ultrasonic inspection of vessel tissues, the echoes length used are quite short, as
can be appreciated in Figure 4, corresponding to an echo-signal measured from the interface of a latex
wall immersed in water, in a layered phantom of a blood vessel constructed in our laboratory.
The usual laboratory ultrasonic practice for research in this biomedical field uses distinct types of
biological phantoms with internal walls or reflectors approximating tissues under study in what regards
their echo-responses. For computer simulation of these responses in propagation media, some authors
explain the nature of the ultrasonic signals normally acquired from biological materials, using a model
consisting of structures regularly spaced among them [44,45], or well as a collection of randomly
distributed scatterers. Others options try to model it as a random distribution of the scattering with
certain statistic regularity for signals acquired from tissues with semi-regular structures [46,47].
Sensors 2012, 12 15404
Figure 4. Echo waveform in typical pulsed ultrasonic inspections, measured with a
10 MHz transducer, at the interface between water and a low acoustic attenuation material
mimicking an arterial wall.
In a similar way, for the cases studied in this work (layers, walls and membranes), a very simplified
modeling (easier to apply than those mentioned in Section 3.2) would be sufficient, only for the effects
of our comparative analyses of the proposed thickness measurement technique. Here, the echo-signal
waveforms could be considered as a superposition of several (regularly spaced) similar single echoes
(with the same or opposite polarities); they would be originated from the interaction among an emitted
ultrasonic pulse and its successive reflections by walls or layers in bio-membranes or blood vessels.
A simple and useful modeling, for direct emulation (without needing to use the complex model of
Section 3.2) of generic multi-pulse echoes (for reference waveforms), could be obtained by approaching
our problem to a set of ideal wall echoes separated by a regular distance; and then, the whole
echo-trace would be constructed by a sum of successive and repetitive pulses received from the
reflecting walls (each pulse having a different time-of flight, depending on the distance and
reverberation number).
For this approach, the emitted unitary pulse can be mathematically modeled as in [47]:
sin 0 (1)
where Bw is the desired bandwidth and ω0 is the central angular frequency of the pulse.
Finally, each elemental echo, produced by the interaction of the emitted pulse e(t) with a plane
reflector, can be considered under certain a approximation (neglecting diffraction effects), as a replica
of the emitted unitary pulse, depending its polarity on the respective media impedances.
Two examples of multi-pulse echo-waveforms, simulating ultrasonic signals acquired from different
kind of biological tissues, are shown in Figure 5. They are associated to broadband transducers of 30 and
10 MHz in nominal frequencies with 70% in bandwidth; each echo was generated by using the
expressions (1). This “simplified” echo simulation is of an ideal type, but it is very useful in the rather
academic context of this research work. By using it or alternatively phantom echoes, it can be made
Sensors 2012, 12 15405
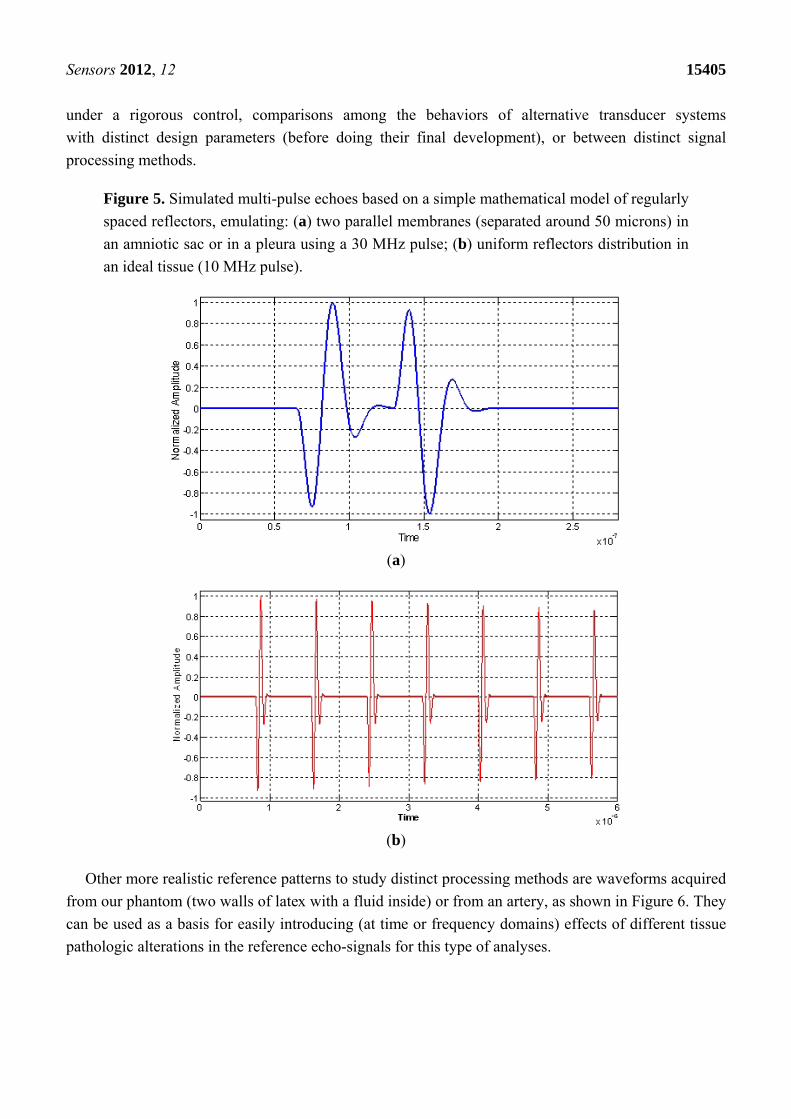
under a rigorous control, comparisons among the behaviors of alternative transducer systems
with distinct design parameters (before doing their final development), or between distinct signal
processing methods.
Figure 5. Simulated multi-pulse echoes based on a simple mathematical model of regularly
spaced reflectors, emulating: (a) two parallel membranes (separated around 50 microns) in
an amniotic sac or in a pleura using a 30 MHz pulse; (b) uniform reflectors distribution in
an ideal tissue (10 MHz pulse).
(a)
(b)
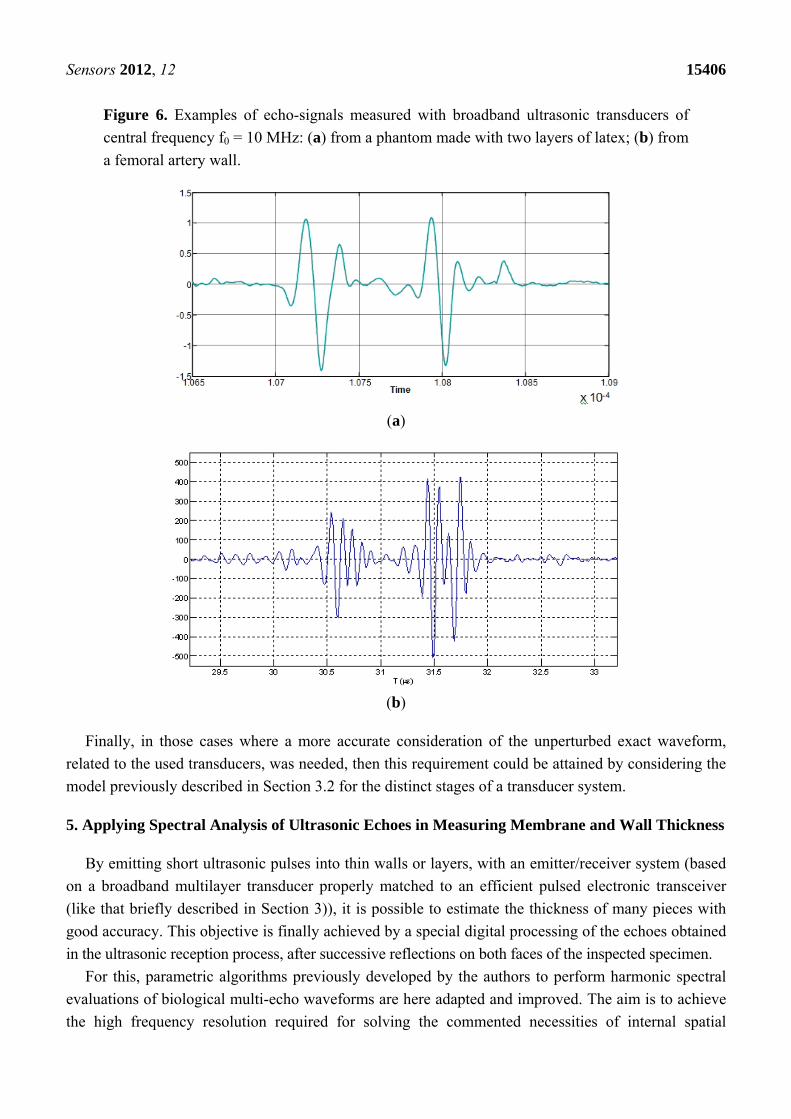
Other more realistic reference patterns to study distinct processing methods are waveforms acquired
from our phantom (two walls of latex with a fluid inside) or from an artery, as shown in Figure 6. They
can be used as a basis for easily introducing (at time or frequency domains) effects of different tissue
pathologic alterations in the reference echo-signals for this type of analyses.
Sensors 2012, 12 15406
Figure 6. Examples of echo-signals measured with broadband ultrasonic transducers of
central frequency f0 = 10 MHz: (a) from a phantom made with two layers of latex; (b) from
a femoral artery wall.
(a)
(b)
Finally, in those cases where a more accurate consideration of the unperturbed exact waveform,
related to the used transducers, was needed, then this requirement could be attained by considering the
model previously described in Section 3.2 for the distinct stages of a transducer system.
5. Applying Spectral Analysis of Ultrasonic Echoes in Measuring Membrane and Wall Thickness
By emitting short ultrasonic pulses into thin walls or layers, with an emitter/receiver system (based
on a broadband multilayer transducer properly matched to an efficient pulsed electronic transceiver
(like that briefly described in Section 3)), it is possible to estimate the thickness of many pieces with
good accuracy. This objective is finally achieved by a special digital processing of the echoes obtained
in the ultrasonic reception process, after successive reflections on both faces of the inspected specimen.
For this, parametric algorithms previously developed by the authors to perform harmonic spectral
evaluations of biological multi-echo waveforms are here adapted and improved. The aim is to achieve
the high frequency resolution required for solving the commented necessities of internal spatial
Sensors 2012, 12 15407
measurements in the medical field. The first advance is an improved algorithm permitting us to apply a
new auto-regressive technique in overtones to estimate physical properties of interest for the analysis
of wall thickness in blood vessels or of the inflammation level in some tissues.
This type of difficult analyses have an increasing interest for a possible early diagnostic of some
diseases and for an accurate estimation of the physical parameters required for the calculation of elastic
properties in (rather thin) walls or layers. Some data about thickness estimation will be shown, which
were obtained by digital processing of echo-traces acquired in our laboratories (from latex phantoms
mimicking vessel properties and also by numerical simulation). It confirms the promising performance
for our improved spectral technique in blood vessel characterization. This would propitiate a powerful
diagnostic tool, e.g., for early detection of cardiac attacks or of aneurism risk, aspects nowadays
receiving a growing attention from medical researchers. Results to be shown in this work suggest clear
improvements in the resulting resolutions for this type of measures, in comparison with classical
options. In particular, time cross-correlation and non-parametric frequency techniques (currently used
to estimate the delays existing between pulsed echo-signals) are considered for the comparisons.
There are some research works reporting laboratory ultrasonic experiments for estimation of wall
thickness in blood vessels (for instance: carotid and femoral arteries), with the aim of obtaining an
early diagnostic of relevant vascular problems [48–50]. They are related to diseases due to arterial
hypertension and atherosclerosis, which often create modifications of the physical properties of the
large vessels. This research topic becomes very relevant in some medical sectors due to its potential
application in future advanced vascular diagnosis; the related work lines generally include ultrasonic
measures of the radial displacement in arterial walls in function of the cardiac pulse. By estimating in
the laboratory the mechanical displacements of a phantom wall as a function of internal pressure
variations (induced from a pulsed liquid flow), its biomechanical behavior can be analyzed.
The measurements and evaluations required to validate (under laboratory conditions) the mentioned
researches were made on phantoms constructed for instance with latex tubes; and in some scant cases,
human arteries are also preliminarily characterized in this way [30], showing that when an atheroma
plaque is present, a quite different Young modulus appears, than in the case of healthy vessels.
Some ultrasonic procedures have been proposed and applied for evaluating layers and sheets
thicknesses, with well-established measurements solution working in time domain; nevertheless, more
accurate methods are still needed to respond to new challenges in this technological topic.
In the following paper sections, a new measurement procedure is proposed, capable of detecting the
thickness of arterial walls or biological membranes, with an improved resolution. It is based on the use
of a modified auto-regressive spectral analysis, for estimating spatial aspects from ultrasonic echoes.
The procedure is based on improving and extending a technique proposed in [27] for a quite different
medical objective (the estimation of thermal changes in biological tissues containing internal
scatterers). This last technique was based on detecting changes in the frequency location of overtones
related to echoes spectra acquired from tissues having a regular internal structure. Nevertheless, the
viability of this possible wall thickness estimations method, based in the above mentioned hypotheses,
must be confirmed with raw ultrasonic echoes difficult to analyze directly; and then, its possible
implementation can be decided with ultrasonic transducers, electronic and computer sub-systems. The
method performance, with well-controlled echoes coming from laminar or layered phantoms, must be
compared with delay measuring techniques previously proposed in both time and spectral domains.
Sensors 2012, 12 15408
6. Delay-Time and Spectrum Based Estimators of Ultrasonic Information Coming
from Phantoms
Ultrasonic estimation procedures have been largely investigated as non-invasive tools for diagnosis
of some diseases as was detailed in Sections 1 and 2. A research line with promising results is the
ultrasonic estimation of thermal distribution in phantoms, and in this context (for other medical
necessities) proposals of specific methods have been made by extracting data of interest from internal
parts in tissues. They apply direct-time and spectral procedures, looking for the detection of possible
morphological alterations from their effects on delays induced on echoes patterns. Such are the cases
of: (a) applying the conventional time cross-correlation operator [21,23] for delay estimation between
two waveforms; and (b) performing parametric spectral analyses, successfully employed for studying
broadband multi-pulse signals [20,24]. In the (b) case, the aim is always to extract clinical information
hidden among multiple echoes and speckles, by improving the frequency resolution and facilitating the
signal interpretation; in fact, the time-patterns of raw ultrasonic echoes are rather of complex
morphology and the tissue information contained in them is difficult to be interpreted with accuracy.
The spectral techniques to be applied in the current work are introduced looking for the solution of
new detection problems, with echoes in some way not very different than in previous applications and
with similar perturbations as the induced noise and speckles. This could difficult a good discernment
among the searched information (of spatial type, in the current case) and undesirable contaminations
masking the echoes arrival times (magnitudes to be measured). Thus, an evaluation of reliability for
this processing tool would be required before a proper application in a medical diagnostic context.
In consequence, for our particular analyses about thickness estimations, distinct time and frequency
domain procedures will be employed to compare their respective responses for improving the current
precision levels of conventional ultrasonic methods [13,14], which range around 5–10 microns.
For the time domain case, the cross-correlation operator was chosen as the best option to compare
echo-signals for distinct thicknesses in latex phantoms emulating different phases of the cardiac pulse
in arteries; this technique appears as the tool to measure delays with better results [30,51]. Though this
option is quite robust against signal deformation and moderate SNR levels, any time-domain method
has an inherent limitation in resolution for estimation of small delays, related to the sampling period.
A second option for thickness estimation will be tested here, using frequency-domain analyses (of
complex echo-signals) proposed for detecting changes on other physiological parameters, like texture
and temperature in tissues. They use to be directly related with variations in echo-delays [20,24,52];
in fact, these delays can be quantified by detecting the locations of certain peaks appearing in the
frequency spectra. This alternative procedure appears as adequate for delay measure with echoes as
those involved here, if conventional basic frequency resolutions in spectral analysis were improved.
6.1. Signal Processing Estimators and Operators to be Applied for Thickness Measurement Techniques
In this sub-section, some selected analysis tools implemented in time and frequency domains, for
achieving accurate estimations of thickness variations, are proposed and briefly summarized. For
obtaining in the Time domain a good analytical estimation of the delay between two ultrasonic
waveforms (x, y) similar in shape but with distinct time occurrences, as those obtained by reflection in
Sensors 2012, 12 15409
the two interfaces of a wall, a classical method based on making a Cross-correlation of both functions
can be applied. The true cross-correlation between two discrete signals can be defined in this way:
. ∗ (2)
where E[.] is the “expected value”, xn, yn are stationary sequences, and m is the lag between them.
The delay evolution can be calculated dynamically from the shifts produced in the signals, related to
a possible continuous change in the wall thickness. A measure of the delay between x and y is the
displacement existing between the maxima of CCxy and CCxx, quantified as number of samples.
The main limitation of the thickness estimations based on this operator (though they are intended
for advanced delay detection) is the resolution employed to acquire the high-frequency ultrasonic
echoes. This reduces the final resolution for the searched diagnosis parameter (in our case, the wall
thickness in blood vessels, or tissue inflammations for early detection of infections).
An optional alternative to using cross-correlation is by estimating Shifts into the Power Spectrum
(in Frequency domain), more concretely their variations with echo time-shifting. In the discrete case,
the power spectral density of xn is related to the autocorrelation (CCxx) by the discrete Fourier transform:
12
(3)
where ω = 2πf / fs, being fs the sampling frequency.
A quite simple spectral estimation method of non-parametric type, known as “Periodogram”, is
often employed for finding the power spectrum density (PSD):
1
2 (4)
In the present work, this method will be used to easily measure frequency shifts in overtones related
to time-delays between two pulsed signals contained in the same trace (echoes belonging to the two
spatial interfaces); but this option shows some limitations in resolution derived from the implied FFT
algorithm. For overcoming this resolution constraint, other spectral analyses, but already of parametric
types will be here used. The main advantage of using parametric methods for PSD estimation is the
achieving of a better frequency resolution without introducing distortion effects due to the windowing.
In order to perform “Parametric analyses”, some auto-regressive (AR) models can be assumed:
(a) One first approach for PSD estimation of the AR type (with high-resolution) is based on the
Yule-Walker method, which uses the autocorrelation estimates matrix to find the AR parameters [53,54],
extrapolating signal autocorrelation values for displacements greater than the signal length. As it is
necessary to know “a priori” information about how the signal data are generated, a model must be
constructed for data generation having certain parameters estimated from the signal data.
In this first parametric method, the data sequence is modeled as the output of a discrete linear
system with a transfer function defined at the z domain in the following way:
1 1
1 ∑ (5)
The output of this system is an autoregressive process of order p. The model parameters (ai) are
calculated with the linear Yule-Walker equations. The signal PSD is obtained by the expression:
Sensors 2012, 12 15410
| | (6)
where is the input sequence variance, assumed as white noise of average power similar to the unit.
Results obtained using a variant of this AR parametric method, focused on increasing resolution in
other distinct non-invasive procedure also based on ultrasonic estimation, have been presented in [24].
(b) A second approach for AR-PSD estimation of small frequency changes, improving the previous
high-resolution spectral technique, is used here, by adding an ulterior processing step in the acquired
waveforms and applying the Burg method, which produces better resolution for our spectral estimation
that the other classic spectral approaches. During the estimation of AR parameters by this last method,
a minimization is made (based on least squares criteria) of direct and inverse errors in linear predictors.
These errors, d(n) and i(n), for a discrete function x(n), are defined as:
(7)
where and are the estimate of direct and inverse linear prediction.
The minimum square error, ∑ | | | | , can be minimized by selecting the
prediction coefficient according to the restriction fulfilling Levinson-Durbin recursion [32]. In this
Burg method, the reflection coefficients of the equivalent lattice structure is computed, and the
Levinson-Durbin algorithm is used for obtaining the AR model parameters. Finally, based on the AR
parameters, the Power Spectrum can be estimated as:
1 ∑ (8)
where is an estimate of the driving noise variance, are AR parameter estimates, and p is the
model order.
There are three interesting advantages of using the Burg method for estimating the AR model
parameters: (i) a higher frequency resolution, (ii) a stable AR model, and (iii) a better computational
efficiency.
Our solution to achieve high-resolution in the proposed thickness estimation problem, is completed
by adapting to the processed waveform registers (that involves to extract rather short-time windows
from the acquired echo-signals) a procedure similar to the employed in techniques of other processing
areas. It consist in decomposing each total echo-trace in small fractional time-windows related to each
wall or membrane to be analyzed, and then extending their lengths (before and after of the occurrence
of each segmental window); null-value samples are added in number enough to attain a signal of Nw
digital samples, from the original register with Ni samples (Nw = xNi). For implementing it, each new
extended register (ERj) is arranged by properly modifying the original register, ORj(n), in this way:
ERj = [01, 02,… 0(x-1)Ni/2, ORj(1), ORj(2), … ORj(Ni), 0´1, 0´2,… 0´(x-1)Ni/2] (9)
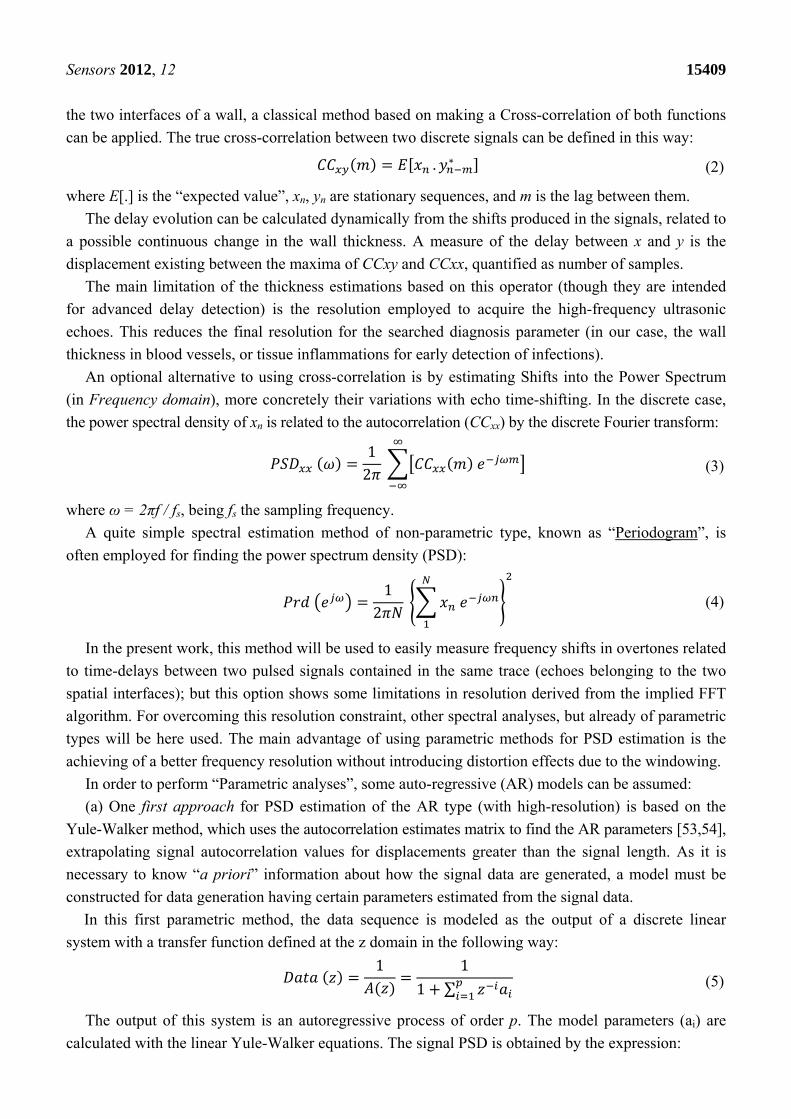
PSD estimations, calculated with the above described parametric and non-parametric methods for a
two-echoes signal related to a broadband piezoelectric transducer centered around 9,5 MHz, are shown
in Figure 7, where the respective methods performances can be comparatively analyzed.
Sensors 2012, 12 15411
Figure 7. PSD estimations by applying a non parametric technique (Periodogram) and our
two parametric options based on the Yule Walker and Burg methods.
It can be appreciated that: (a) the Periodogram option presents the widest frequency peaks among
the three PSD methods, producing a rather poor resolution in the peak frequency determination; (b) our
method (using the Burg PSD estimates) provides the narrowest frequency peaks, so optimizing the
spectral discrimination for overtones locations, and, in consequence, the potential spatial resolution.
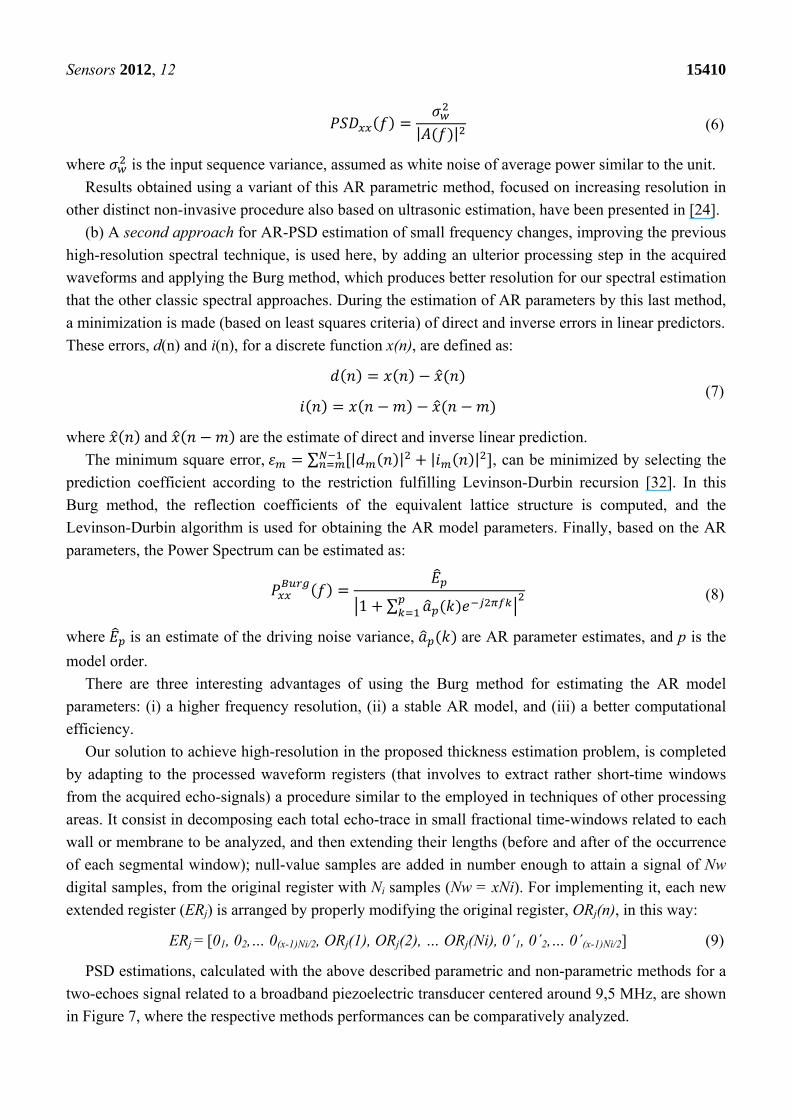
6.2. Experimental Setup and Echo-Signal Acquisitions for Ultrasonic Estimation of Wall Thickness
With the aim of calculating in the laboratory the variation in thickness of a latex phantom,
emulating the dynamic of the walls in arterial vessels, an experimental setup was constructed, which
provides the A-Scan echoes (originated from the wall) needed to estimate wall spatial dimensions. For
simulating a cardiac pulse in a controlled way, an elastic latex tube was intercalated in a dynamic
circuit (see Figure 8(a)) containing a perfusion line made of polyethylene and silicone connecting the
latex phantom to an artificial heart (Jarvik) that generates a variable pressure (from 25 to 125 mm Hg)
in the fluid medium.
Figure 8. (a) Scheme of the experimental set-up for wall displacement measurements
(circulating loop mimicking a physiological pulsatile flow inside the arterial phantom).
(b) A-Scan containing four echoes.
(a) (b)
4 6 8 10 12 14 16
x 106
0
0.1
0.2
0.3
0.4
0.5
0.6
0.7
0.8
0.9
1
Frequency (Hz)
Norm
alize
d Am
plitu
de
Yule Walker PSDPeriodogramBurg PSD
Sensors 2012, 12 15412
In addition to the non-invasive thickness measure, elastic parameters in tube walls can be estimated,
providing complementary information with a high diagnostic value to assess blood vessel states.
For echoes detection during the wall displacements, a broadband ultrasonic probe (Olympus V312SU,
10 MHz in nominal frequency and 70% in bandwidth at 6 dB) was operated in the pulse-eco mode, to
generate near-field ultrasonic beams perpendicular to the tube wall, as shown in Figure 8(b).
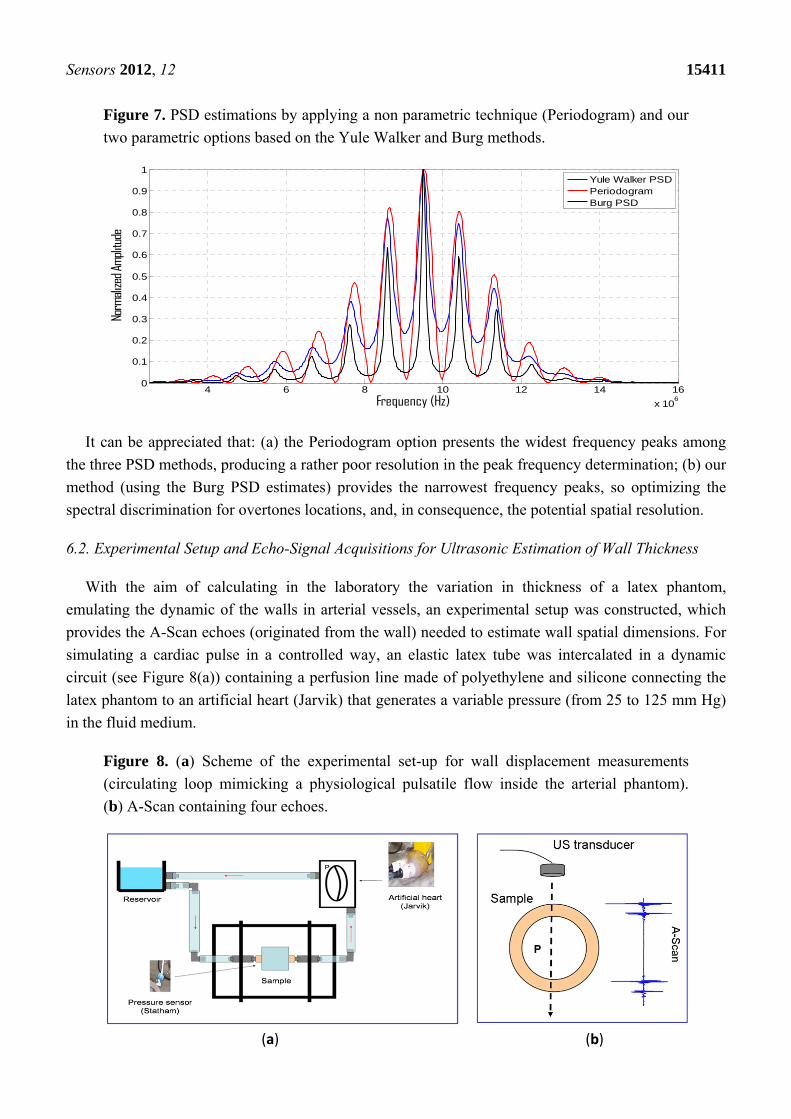
For different pressure values, many A-Scans were acquired at 80 MHz in sampling frequency.
Figure 9 shows some of the echoes taken from the tube wall zone closer to transducer, for 35 fluid
pressures.
Figure 9. Thirty five time-waveforms belonging to echoes experimentally acquired from
the nearest wall to transducer of an elastic latex tube, filled with water under dynamic
internal pressures.
The fluid used in our experiments was water, with impedance and velocity similar to blood. Low
amplitude speckles from sub-wavelength scattering in blood vessels are not significant in comparison
to the clear echo-signals coming from the wall interfaces. In the real vessels walls, micro-reflectors
appear, but always it is possible to discriminate the two echoes related to the Intima-Media Thickness
(IMT); in fact approximated IMT estimations are currently used in some vessel diagnosis with
high-frequency ultrasonic imaging units, but yet with a limited resolution [12].
Measuring the delays between the two echo-pulses in each one of the so acquired A-Scans, by
means of a conventional cross-correlation algorithm, the successive displacements, originated in this
wall by the externally induced pressure changes, can be approximately calculated in the time domain:
∆ ∆ ∆ (10)
where ΔW is the wall thickness variation, v is the average ultrasound velocity through the medium,
Δt0 = t2 − t1 is the difference detected between times of flight of both echo-pulses in the cycle instant
corresponding to the resting tube position (i.e., with the narrowest tube diameter), and Δt is the
changing difference between the flight times of both echoes during the tube expansions. For two states
of a same vessel, at similar body temperature, possible light changes in the average velocity v have a
minor influence, and the significant data for diagnosis are the differential changes to be produced.
Sensors 2012, 12 15413
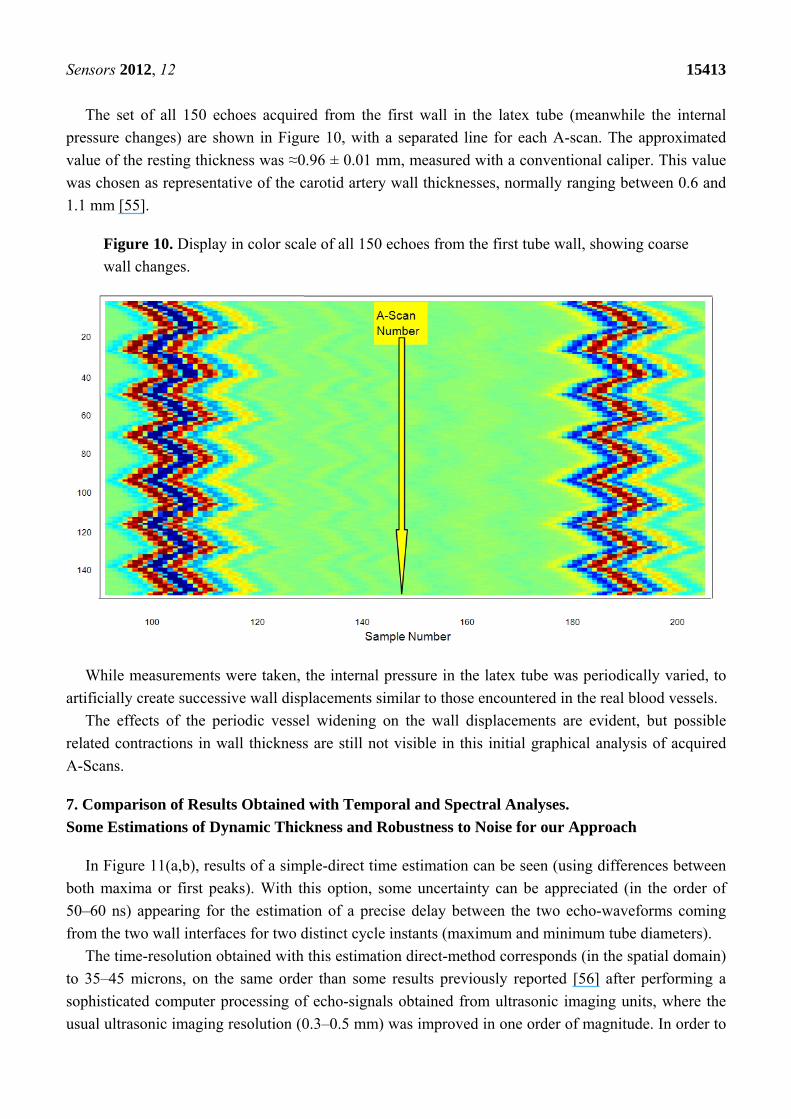
The set of all 150 echoes acquired from the first wall in the latex tube (meanwhile the internal
pressure changes) are shown in Figure 10, with a separated line for each A-scan. The approximated
value of the resting thickness was ≈0.96 ± 0.01 mm, measured with a conventional caliper. This value
was chosen as representative of the carotid artery wall thicknesses, normally ranging between 0.6 and
1.1 mm [55].
Figure 10. Display in color scale of all 150 echoes from the first tube wall, showing coarse
wall changes.
While measurements were taken, the internal pressure in the latex tube was periodically varied, to
artificially create successive wall displacements similar to those encountered in the real blood vessels.
The effects of the periodic vessel widening on the wall displacements are evident, but possible
related contractions in wall thickness are still not visible in this initial graphical analysis of acquired
A-Scans.
7. Comparison of Results Obtained with Temporal and Spectral Analyses.
Some Estimations of Dynamic Thickness and Robustness to Noise for our Approach
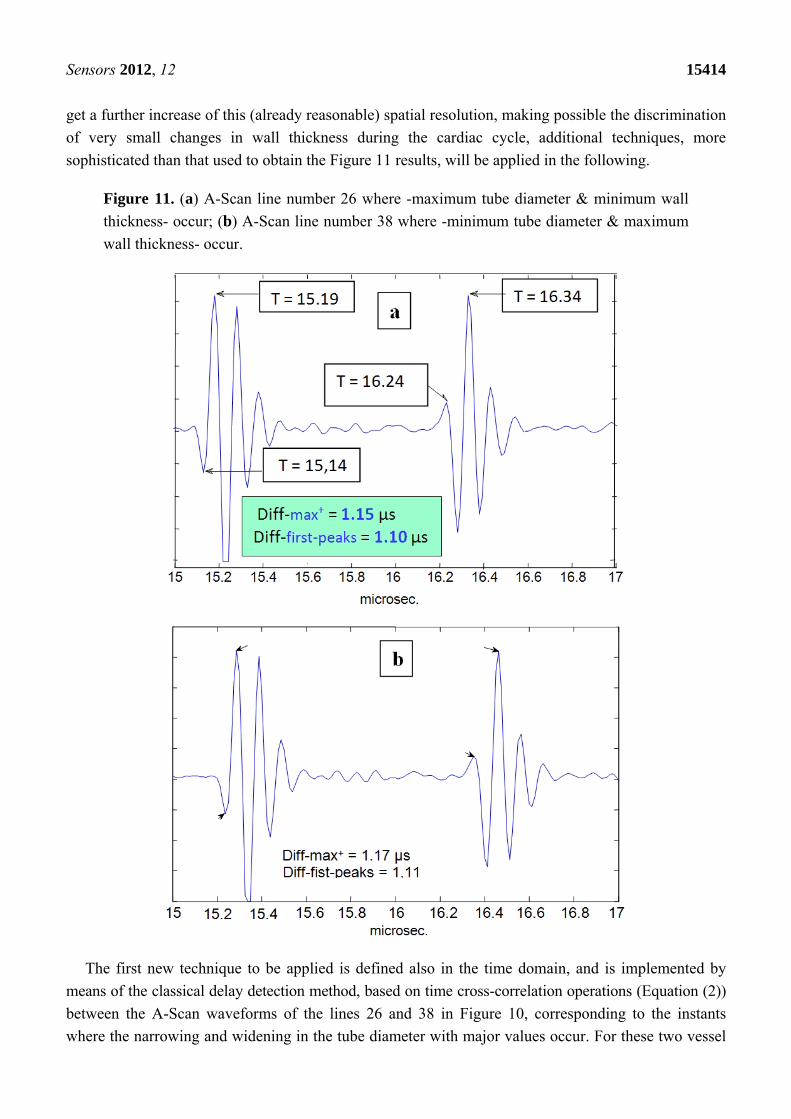
In Figure 11(a,b), results of a simple-direct time estimation can be seen (using differences between
both maxima or first peaks). With this option, some uncertainty can be appreciated (in the order of
50–60 ns) appearing for the estimation of a precise delay between the two echo-waveforms coming
from the two wall interfaces for two distinct cycle instants (maximum and minimum tube diameters).
The time-resolution obtained with this estimation direct-method corresponds (in the spatial domain)
to 35–45 microns, on the same order than some results previously reported [56] after performing a
sophisticated computer processing of echo-signals obtained from ultrasonic imaging units, where the
usual ultrasonic imaging resolution (0.3–0.5 mm) was improved in one order of magnitude. In order to
Sensors 2012, 12 15414
get a further increase of this (already reasonable) spatial resolution, making possible the discrimination
of very small changes in wall thickness during the cardiac cycle, additional techniques, more
sophisticated than that used to obtain the Figure 11 results, will be applied in the following.
Figure 11. (a) A-Scan line number 26 where -maximum tube diameter & minimum wall
thickness- occur; (b) A-Scan line number 38 where -minimum tube diameter & maximum
wall thickness- occur.
The first new technique to be applied is defined also in the time domain, and is implemented by
means of the classical delay detection method, based on time cross-correlation operations (Equation (2))
between the A-Scan waveforms of the lines 26 and 38 in Figure 10, corresponding to the instants
where the narrowing and widening in the tube diameter with major values occur. For these two vessel
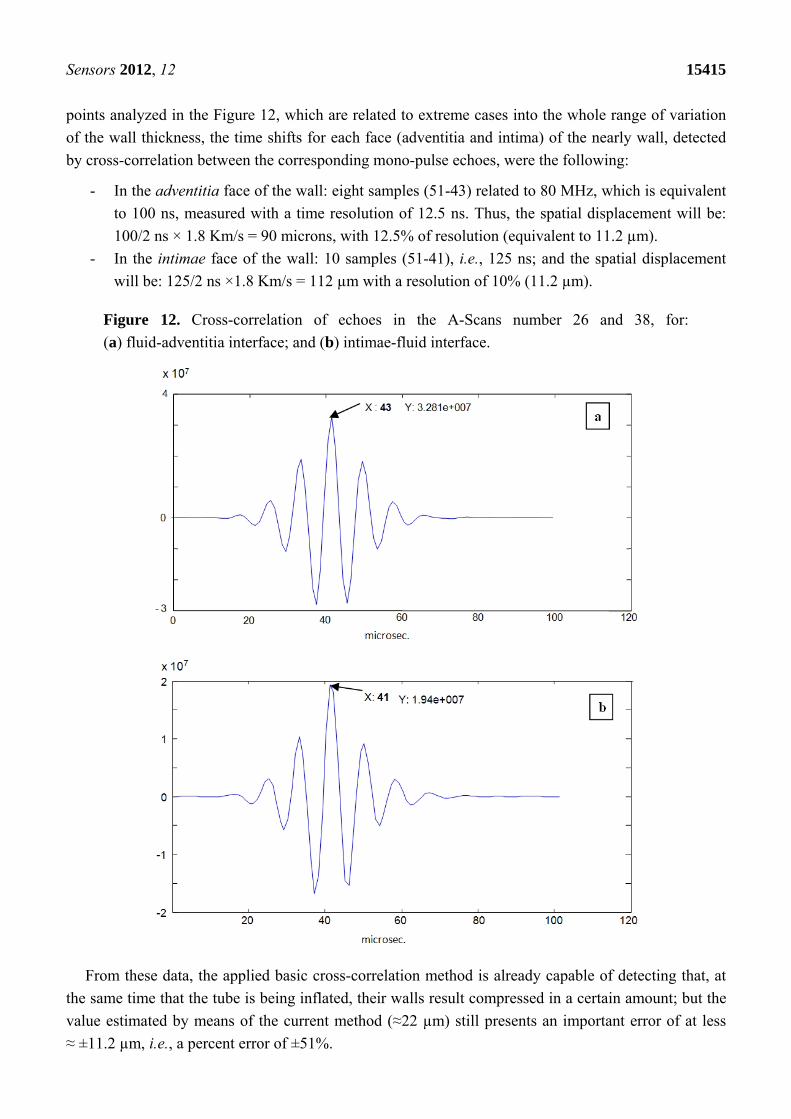
Sensors 2012, 12 15415
points analyzed in the Figure 12, which are related to extreme cases into the whole range of variation
of the wall thickness, the time shifts for each face (adventitia and intima) of the nearly wall, detected
by cross-correlation between the corresponding mono-pulse echoes, were the following:
- In the adventitia face of the wall: eight samples (51-43) related to 80 MHz, which is equivalent
to 100 ns, measured with a time resolution of 12.5 ns. Thus, the spatial displacement will be:
100/2 ns × 1.8 Km/s = 90 microns, with 12.5% of resolution (equivalent to 11.2 µm).
- In the intimae face of the wall: 10 samples (51-41), i.e., 125 ns; and the spatial displacement
will be: 125/2 ns ×1.8 Km/s = 112 µm with a resolution of 10% (11.2 µm).
Figure 12. Cross-correlation of echoes in the A-Scans number 26 and 38, for:
(a) fluid-adventitia interface; and (b) intimae-fluid interface.
From these data, the applied basic cross-correlation method is already capable of detecting that, at
the same time that the tube is being inflated, their walls result compressed in a certain amount; but the
value estimated by means of the current method (≈22 µm) still presents an important error of at less
≈ ±11.2 µm, i.e., a percent error of ±51%.
Sensors 2012, 12 15416
As a first conclusion, this clearly improved resolution (of 11.2 µm) respect to the direct-time
method (45 µm), still does not provide sufficiently accurate results to fulfill our initial purpose of
analyzing with enough accuracy the changes registered, during a cardiac cycle, on the thickness of the
vessel walls under study. On fact, due to this limitation in resolution, some methods based on
cross-correlation (for other applications) often must refine their direct results by applying some
additional statistical or interpolation techniques [30,31], which performance depends on the level
registered for the signal-to-noise ratio of the acquired echoes.
As a second attempt for increasing in a major amount the mentioned spatial resolution, we will
apply some methods based on spectral analyses of the echo-responses in the frequency domain. There
is a resonance frequency related to the original state of wall thickness, W0, and the averaged ultrasound
velocity on the medium (v) defined as:
2 (11)
This reference value in the frequency will be disturbed by any wall thickness variations. The
changes in this frequency due to wall thickness modifications are given by:
∆1
1 ∆
(12)
where Δf is the frequency change due to a wall thickness variation, f is the original resonance
frequency, W0 is wall thickness in the original state of the tube and ΔW is the wall thickness variation.
In the extended spectral analysis presented in this work, the change in the 10th harmonic peak value
will be used for deriving the thickness estimations: Δf10 = 10 × Δf.
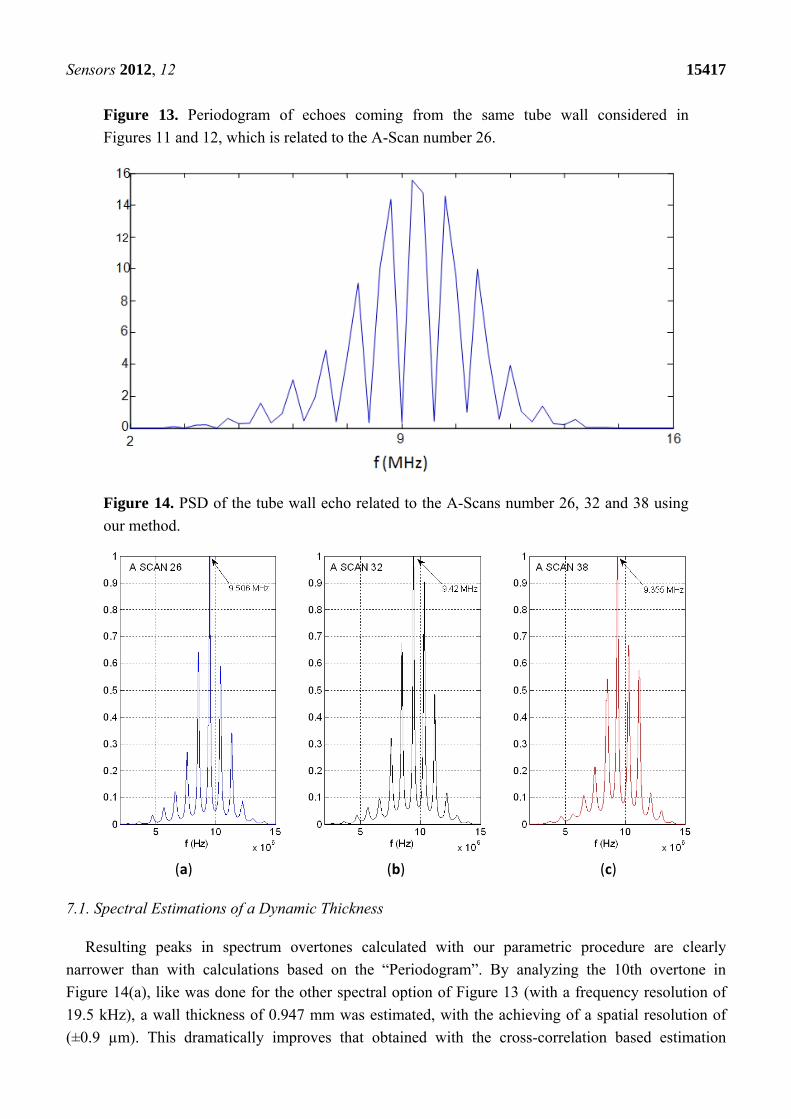
The more simple options in the frequency domain are based on non-parametric spectral analysis
methods, being the Periodogram option one of the most used. As a typical example, a result obtained
for the A-Scan line n° 26, applying this spectral option, is depicted in Figure 13. It can be seen as the
main peak in the spectral curve results truncated, and 310 kHz of the spectrum are lost, giving a spatial
resolution of 405 µm for the fundamental resonance location. This can be substantially improved by
analyzing the 10th overtone, which ranges around the center of the transducer band; nevertheless even
in this case, the final resolution would be of 40 µm, quite worse than with the correlation method. For
this reason, more sophisticated spectral techniques (of the parametric kind) were analyzed looking
forward finally achieving the required resolution for our specific problem of spatial estimation.
Figure 14(a) shows the power spectral density of the same time waveform as in Figures 11–13
(A-Scan number 26), but employing our new spectral procedure. This includes: (a) a time extension of
the two-pulse echo received from the tube wall, by applying the expression (9); (b) an autoregressive
parametric spectral technique based on the Burg method and using a relatively elevated sampling rate.
Sensors 2012, 12 15417
Figure 13. Periodogram of echoes coming from the same tube wall considered in
Figures 11 and 12, which is related to the A-Scan number 26.
Figure 14. PSD of the tube wall echo related to the A-Scans number 26, 32 and 38 using
our method.
(a) (b) (c)
7.1. Spectral Estimations of a Dynamic Thickness
Resulting peaks in spectrum overtones calculated with our parametric procedure are clearly
narrower than with calculations based on the “Periodogram”. By analyzing the 10th overtone in
Figure 14(a), like was done for the other spectral option of Figure 13 (with a frequency resolution of
19.5 kHz), a wall thickness of 0.947 mm was estimated, with the achieving of a spatial resolution of
(±0.9 µm). This dramatically improves that obtained with the cross-correlation based estimation
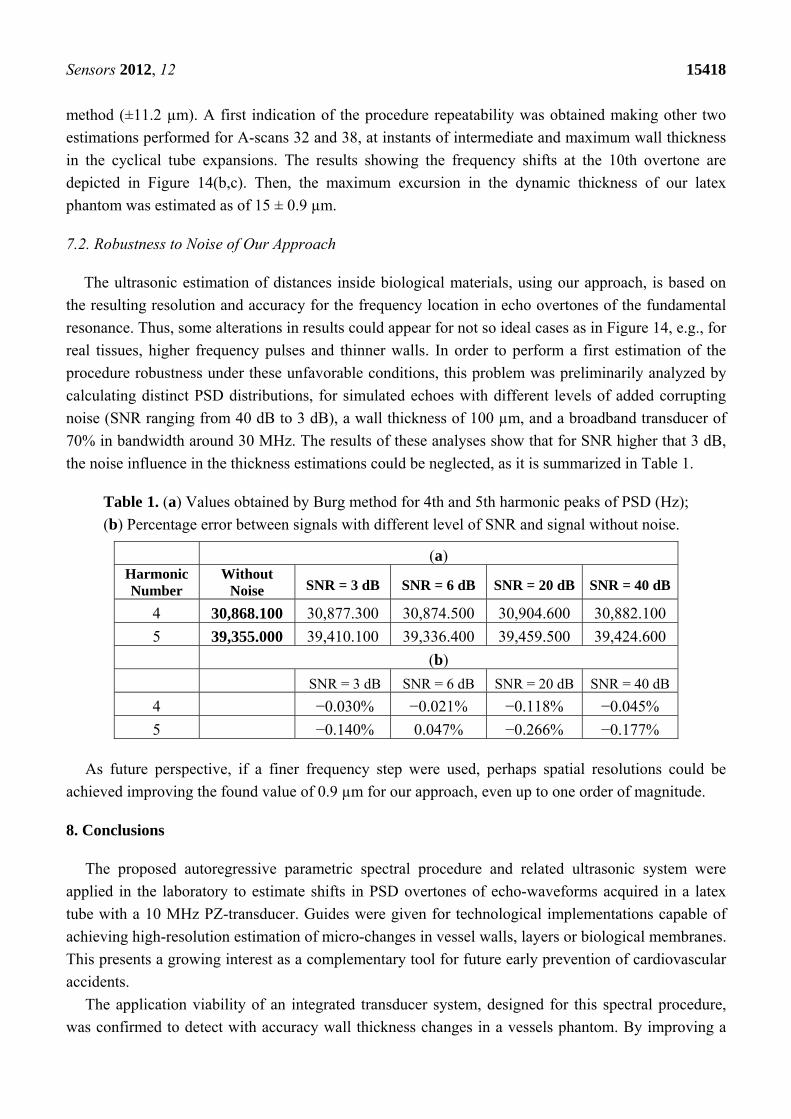
Sensors 2012, 12 15418
method (±11.2 µm). A first indication of the procedure repeatability was obtained making other two
estimations performed for A-scans 32 and 38, at instants of intermediate and maximum wall thickness
in the cyclical tube expansions. The results showing the frequency shifts at the 10th overtone are
depicted in Figure 14(b,c). Then, the maximum excursion in the dynamic thickness of our latex
phantom was estimated as of 15 ± 0.9 µm.
7.2. Robustness to Noise of Our Approach
The ultrasonic estimation of distances inside biological materials, using our approach, is based on
the resulting resolution and accuracy for the frequency location in echo overtones of the fundamental
resonance. Thus, some alterations in results could appear for not so ideal cases as in Figure 14, e.g., for
real tissues, higher frequency pulses and thinner walls. In order to perform a first estimation of the
procedure robustness under these unfavorable conditions, this problem was preliminarily analyzed by
calculating distinct PSD distributions, for simulated echoes with different levels of added corrupting
noise (SNR ranging from 40 dB to 3 dB), a wall thickness of 100 µm, and a broadband transducer of
70% in bandwidth around 30 MHz. The results of these analyses show that for SNR higher that 3 dB,
the noise influence in the thickness estimations could be neglected, as it is summarized in Table 1.
Table 1. (a) Values obtained by Burg method for 4th and 5th harmonic peaks of PSD (Hz);
(b) Percentage error between signals with different level of SNR and signal without noise.
(a) Harmonic Number
Without Noise SNR = 3 dB SNR = 6 dB SNR = 20 dB SNR = 40 dB
4 30,868.100 30,877.300 30,874.500 30,904.600 30,882.100
5 39,355.000 39,410.100 39,336.400 39,459.500 39,424.600
(b)
SNR = 3 dB SNR = 6 dB SNR = 20 dB SNR = 40 dB
4 −0.030% −0.021% −0.118% −0.045%
5 −0.140% 0.047% −0.266% −0.177%
As future perspective, if a finer frequency step were used, perhaps spatial resolutions could be
achieved improving the found value of 0.9 µm for our approach, even up to one order of magnitude.
8. Conclusions
The proposed autoregressive parametric spectral procedure and related ultrasonic system were
applied in the laboratory to estimate shifts in PSD overtones of echo-waveforms acquired in a latex
tube with a 10 MHz PZ-transducer. Guides were given for technological implementations capable of
achieving high-resolution estimation of micro-changes in vessel walls, layers or biological membranes.
This presents a growing interest as a complementary tool for future early prevention of cardiovascular
accidents.
The application viability of an integrated transducer system, designed for this spectral procedure,
was confirmed to detect with accuracy wall thickness changes in a vessels phantom. By improving a
Sensors 2012, 12 15419
parametric algorithm developed by the authors, increasing its sampling frequency for thickness
measures, a very good spatial resolution was attained. This was applied to evaluate changes in the
phantom, clearly better than with non-parametric spectral techniques. It may be applied for non-invasive
calculation of elastic properties in vessel walls, improving the precision currently obtainable with
conventional cross-correlation techniques. Models and design rules of transducer systems for this
purpose were summarized.
The overtone curves provided by our modified parametric spectral method are clearly narrower than
those calculated with the “Periodogram option”. For instance, by using the 10th overtone with a
reasonable frequency definition of 19.5 kHz, a spatial resolution of (±0.9 µm) was achieved, clearly
improving the spatial performance of the methods based on the periodogram or pure cross-correlation
operators.
Results calculated from multi-pulse echo-signals received by a wideband transducer (in the
5–10 MHz range) from a laminar opaque phantom, have shown resolutions better than 1 µm. This was
performed for a wall lightly modified in thickness (up to 15 µm) by using periodic inner pressure
changes (from an initial value around 0.95 mm). By simulating echoes from a 30 MHz broadband
transducer (for a wall thickness of 100 µm), with corrupting noises ranging from 40 dB to 3 dB, it was
shown that for SNR higher that 3 dB, noise influences in the thickness estimations are not significant.
Nevertheless, new efforts and rigorous overtones analyses with ultrasonic echoes acquired from
well-controlled sanguineous tissues patterns are needed, to optimize the potential resolution of this
thickness estimation proposal. Its possible clinical limitations must be also evaluated. In particular, its
applicability in a clinic context and the performance into real tissues (with “in vivo” measured signals)
must be assessed.
Acknowledgments
Work developed in the frame of the Project CONACYT-FOMIX (Estado de Veracruz) N° 128572,
Mexico, and in part sponsored by the Spanish National Plan (Projects PN-DPI2008-05213 & DPI2011-
22438). Our acknowledgment also to the R&D institutions in which laboratories these research works
have been developed: IPN (México), CSIC (Spain) and URU (Uruguay).
References
1. Pignoli, P.; Tremoli, E.; Poli, A.; Oreste, P.; Paoletti, R. Intimal Plus Medial Thickness of the
Arterial Wall: A Direct Measurement with Ultrasound Imaging. Circulation 1986, 74, 1399–1406.
2. Wendelhag, I.; Wiklund, O.; Wikstrand, J. Arterial Wall Thickness in Familial Hyper-Cholesterolemia
Ultrasound Measurement of Intima-Media Thickness in the Common Carotid Artery.
Arterioscler. Thromb. 1992, 12, 70–77.
3. Peterson, R.A.; Greenberg, A.R.; Bond, L.J.; Krantz, W.B. Use of Ultrasonic TDR for Real-Time
Non-Invasive Measurement of Compressive Strain during Membrane Compaction. Desalination
1998, 116, 115–122.
4. Mairal, A.P.; Greenberg, A.R.; Krantz, W.B.; Bond, L.J. Real Time Measurement of Inorganic
Fouling of RO Desalination Membranes Using Ultrasonic Time-Domain Reflectometry.
J. Membr. Sci. 1999, 159, 185–196.

Sensors 2012, 12 15420
5. Reinsch, V.E.; Greenberg, A.R.; Kelley, S.S.; Peterson, R.; Bond, L.J. A New Technique for the
Simultaneous, Real-Time Measurement of Membrane Compaction and Performance during
Exposure to High-Pressure Gas. J. Membr. Sci. 2000, 171, 217–228.
6. Li, J.; Sanderson, R.D.; Jacobs, E.P. Non-Invasive Visualization of the Fouling of Microfiltration
Membranes by Ultrasonic Time-Domain Reflectometry. J. Membr. Sci. 2002, 201, 17–29.
7. Gómez, T.E. Air-Coupled Ultrasonic Spectroscopy for the Study of Membrane Filters. J. Membr.
Sci. 2003, 213, 195–207.
8. Savić, Ž.N.; Soldatović, I.; Brajović, M.D.; Pavlović, A.M.; Mladenović, D.R.;
Škodrić-Trifunović, V.D. Comparison between Carotid Artery Wall Thickness Measured by
Multidetector Row Computed Tomography Angiography and Intimae-Media Thickness Measured
by Sonography. Sci. World J. 2011, 11, 1582–1590.
9. Groot, E.; Hovingh, G.K.; Wiegman, A.; Duriez, P.; Smit, A.J.; Fruchart, J.C.; Kastelein, J.J.P.
Measurement of Arterial Wall Thickness as a Surrogate Marker for Atherosclerosis. Circulation
2004, 109, 33–38.
10. Zhang, F.; Murta, L.O.; Chen, J.S.; Barker, A.J.; Mazzaro, L.; Lanning, C.; Shandas, R.
Evaluation of Segmentation Algorithms for Vessel Wall Detection in Echo Particle Image
Velocimetry. In Proceedings of 2009 IEEE International Ultrasonics Symposium, Rome, Italy,
20–23 September 2009; pp. 2476–2479.
11. Koskinen, J.; Kähönen, M.; Viikari, J.S.; Taittonen, L.; Laitinen, T.; Rönnemaa, T.;
Lehtimäki, T.; Hutri-Kähönen, N.; Pietikäinen, M.; Jokinen, E.; Helenius, H.; Mattsson, N.;
Raitakari, O.T.; Juonala, M. Conventional Cardiovascular Risk Factors and Metabolic Syndrome
in Predicting Carotid Intima-Media Thickness Progression in Young Adults. The Cardiovascular
Risk in Young Finns Study. Circulation 2009, 120, 229–236.
12. Bennett, P.C.; Gill, P.S.; Silverman, S.; Blann, A.D.; Lip, G.Y.H. Ethnic Differences in Common
Carotid Intima-Media Thickness, and the Relationship to Cardiovascular Risk Factors and
Peripheral Arterial Disease: The Ethnic-Echocardiographic Heart of England Screening Study.
Q. J. Med. 2010, 104, 245–254.
13. Fowler, K.A.; Elfbaum, G.M.; Smith, K.A.; Nelligan, T.J. Theory and Application of Precision
Ultrasonic Thickness Gauging. NDTnet 1997, 2. Available online: http://www.ndt.net/article/
wt1097/panam/panam.htm (accessed on 29 October 2012).
14. Hammond, P. On Resolution, Accuracy and Calibration of Digital Ultrasonic Thickness Gauges.
NDTnet 1997, 2. Available online: http://www.ndt.net/article/wt1097/hammond/hammond.htm
(accessed on 29 October 2012).
15. Boozari, B.; Potthoff, A.; Mederacke, I.; Hahn, A.; Reising, A.; Rifai, K.; Wedemeyer, H.;
Kubicka, S.; Manns, M.; Gebel, M. Evaluation of a Novel Ultrasound Method for the Detection of
Liver Fibrosis. Prospective Comparison with Transient Dynamic Elastography and Histology.
J. Hepatol. 2010, 52, doi:10.1016/S0168-8278(10)61045-8.
16. Dasarathy, S.; Dasarathy, J.; Khiyami, A.; Joseph, R.; Lopez, R.; McCullough, A.J. Validity of
Real Time Ultrasound in the Diagnosis of Hepatic Steatosis: A Prospective Study. J. Hepatol.
2009, 51, 1061–1067.
17. Goyala, N.; Jaina, N.; Rachapallia, V.; Cochlina, D.L.; Robinsonb, M. Non-Invasive Evaluation
of Liver Cirrhosis Using Ultrasound. Clin. Radiol. 2009, 64, 1056–1066.
Sensors 2012, 12 15421
18. Castéra, L.; Bail, B.L.; Roudot-Thoraval, F.; Bernard, P.; Foucher, J.; Merrouche, W.;
Couzigou, P.; de Le’dinghen, V. Early Detection in Routine Clinical Practice of Cirrhosis and
Oesophageal Varices in Chronic Hepatitis C: Comparison of Transient Elastography (FibroScan)
with Standard Laboratory Tests and Non-Invasive Scores. J. Hepatol. 2009, 50, 59–68.
19. Liu, D.; Ebbini, E.S. Real-Time 2-D Temperature Imaging Using Ultrasound. IEEE Trans.
Biomed. Eng. 2010, 57, 12–16.
20. Seip, R.; Ebbini, E.S. Noninvasive Estimation of Tissue Temperature Response to Heating Fields
Using Diagnostic Ultrasound. IEEE Trans. Biomed. Eng. 1995, 42, 828–839.
21. Maass-Moreno, R.; Damianou, C.A. Noninvasive Temperature Estimation in Tissue via
Ultrasound Echo-Shifts. Part I. Analytical Model. J. Acoust. Soc. Am. 1996, 100, 2514–2521.
22. Seip, R.; VanBaren, P.; Cain, C.A.; Ebbini, E.S. Noninvasive Real-Time Multipoint Temperature
Control for Ultrasound Phased Array Treatments. IEEE Trans. Ultrason. Ferroelectr. Freq.
Control 1996, 43, 1063–1073.
23. Maass-Moreno, R.; Damianou, C.A.; Sanghvi, N.T. Noninvasive Temperature Estimation
in Tissue via Ultrasound Echo-Shifts. Part II. In Vitro Study. J. Acoust. Soc. Am. 1996, 100,
2522–2530.
24. Bazán, I.; Vazquez, M.; Ramos, A.; Vera, A.; Leija, L. A Performance Analysis of Echographic
Ultrasonic Techniques for Non-Invasive Temperature Estimation in Hyperthermia Range Using
Phantoms with Scatterers. Ultrasonics 2009, 49, 358–376.
25. Ramos, A.; San Emeterio, J.L.; Sanz, P.T. Dependence of Pulser Driving Responses on Electrical
and Motional Characteristics of NDE Ultrasonic Probes. Ultrasonics 2000, 38, 553–558.
26. Ramos, A.; San Emeterio, J.L. Interface Electronic Systems for Broadband Piezoelectric
Ultrasonic Applications. Analysis of Responses by Means of Linear Approaches. In Piezoelectric
Transducers and Applications; Springer-Verlag: Berlin, Germany, 2008; pp. 187–203.
27. Bazán, I.; Ramos, A.; Calas, H.; Ramirez, A.; Pintle, R.; Gomez, T.E.; Negreira, C.;
Gallegos, F.J.; Rosales, A.J. Possible Patient Early Diagnosis by Ultrasonic Noninvasive
Estimation of Thermal Gradients into Tissues Based on Spectral Changes Modeling. Comput.
Math. Method. Med. 2012, doi:10.1155/2012/275405.
28. Bazán, I.; Ramos, A.; Trujillo, L. Quantitative Predictive Analysis of Responses Obtained from a
Strictly Noninvasive Procedure based on Parametric PSD Estimation for Measuring Thermal
Properties inside Biological Tissues. In Proceedings of 2011 Pan American Health Care
Exchanges (PAHCE), Rio de Janeiro, Brazil, 28 March–1 April 2011.
29. Wear, K.A.; Wagner, R.F.; Insana, F.M.; Hall, T.J. Application of Autoregressive Spectral
Analysis to Cepstral Estimation of Mean Scatterer Spacing. IEEE Trans. Ultrason. Ferroelectr.
Freq. Control 1993, 40, 50–58.
30. Brum, J.; Balay, G.; Bia, D.; Benech, N.; Ramos, A.; Armentano, R.; Negreira, C. Improvement
of Young Modulus Estimation by Ultrasound Using Static Pressure Step. Phys. Proced. 2010, 3,
1087–1094.
31. Walker, W.F.; Trahey, G.E. A Fundamental Limit on Delay Estimation Using Partially Correlated
Speckle Signals. IEEE Trans. Ultrason. Ferroelectr. Freq. Control 1994, 42, 301–308.
Sensors 2012, 12 15422
32. Bazán, I.; Negreira, C.; Ramos, A.; Calas, H.; Gómez, T.E.; Ramirez, A.; de la Rosa, J.M.;
Gallegos, F.J. Possible Application of Spectral Analysis Techniques on Ultrasonic Echo-Traces
Improved for Studying Changes in Blood Vessel Walls. In Proceedings of 2012 Pan American
Health Care Exchanges (PAHCE), Miami, FL, USA, 26–31 March 2012; pp. 111–116.
33. Ramos, A.; San Emeterio, J.L. Ultrasonic Systems for Non-Destructive Testing Using
Piezoelectric Transducers. Electrical Responses and Main Schemes. In Piezoelectric Transducers
and Applications; Springer-Verlag: Berlin, Germany, 2008; pp. 413–431.
34. Ramos, A.; Montero, F.; Sánz, P.T.; Torregrosa, J.M. A 5 MHz High-Voltage Demultiplexed
Ultrasonic Array System for Rapid-Scan Testing of Advanced Materials. Sens. Actuators A 1993,
37–38, 385–390.
35. Cui, L.; Shao, J.; Wang, J.; Bai, J.; Zhang, Y. Ultrasound Elastography of Ethanol-Induced
Hepatic Lesions: In Vitro Study. Chin. Med. Sci. J. 2009, 24, 81–85.
36. Ramos, A.; San Emeterio, J.L.; Sanz, P.T. Improvement in Transient Piezoelectric Responses of
NDE Transceivers Using Selective Damping and Tuning Networks. IEEE Trans. Ultrason.
Ferroelectr. Freq. Control 2000, 47, 826–835.
37. San Emeterio, J.L.; Ramos, A.; Sanz, P.T.; Ruiz, A. Evaluation of Impedance Matching Schemes
for Pulse-Echo Ultrasonic Piezoelectric Transducers. Ferroelectrics 2002, 273, 297–302.
38. San Emeterio, J.L.; Ramos, A. Models for Piezoelectric Transducers Used in Broadband
Ultrasonic Applications. In Piezoelectric Transducers and Applications; Springer-Verlag: Berlin,
Germany, 2008; pp. 187–203.
39. Ramos, A.; Ruiz, A.; Sanz, P.T.; San Emeterio, J.L. Some Non-Linear Aspects of the Electronic
Stages in Time Domain Modelling of NDE Pulse-Echo Ultrasonic Systems. Ultrasonics 2002, 40,
253–258.
40. Ramos, A.; Ruiz, A.; San Emeterio, J.L.; Sanz, P.T. Pspice Circuital Modelling of Ultrasonic
Imaging Transceivers Including Frequency-Dependent Losses and Signal Distortions in
Electronic Stages. Ultrasonics 2006, 44, 995–1000.
41. Leach, W.M. Controlled-Source Analogous Circuits and SPICE Models for Piezoelectric
Transducers. IEEE Trans. Ultrason. Ferroelectr. Freq. Control 1994, 41, 60–66.
42. Püttmer, A.; Hauptmann, A.P.; Lucklum, R.; Krause, O.; Henning, B. SPICE Model for Lossy
Piezoceramic Transducers. IEEE Trans. Ultrason. Ferroelectr. Freq. Control 1997, 44, 60–66.
43. Lethiecq, M.L.; Tran-Huu-Hue, L.P.; Patat, F.; Pourcelot, L. Measurements of Losses in Five
Piezoelectric Ceramics between 2 and 50 MHz. IEEE Trans. Ultrason. Ferroelectr. Freq. Control
1993, 40, 232–237.
44. Wagner, R.F.; Insana, M.F.; Brown, D.G. Statistical Properties of Radio-Frequency and
Envelope-Detected Signals with Applications to Medical Ultrasound. J. Opt. Soc. Am. A 1987, 4,
910–922.
45. Wear, K.A.; Wagner, R.F.; Insana, F.M.; Hall, T.J. Application of Autoregressive Spectral
Analysis to Cepstral Estimation of Mean Scatterer Spacing. IEEE Trans. Ultrason. Ferroelectr.
Freq. Control 1993, 40, 50–58.
46. Landini, L.; Verrazzani, L. Spectral Characterization of Tissues Microstructure by Ultrasounds:
A Stochastic Approach. IEEE Trans. Ultrason. Ferroelectr. Freq. Control 1990, 37, 448–456.
Sensors 2012, 12 15423
47. Shankar, P.M. A Model for Ultrasonic Scattering from Tissues Based on the K Distribution.
Phys. Med. Biol. 1995, 40, 1633–1649.
48. Warriner, R.K.; Johnston, K.W.; Cobbold, R.S.C. A Viscoelastic Model of Arterial Wall Motion
in Pulsatile Flow: Implications for Doppler Ultrasound Clutter Assessment. Pysiol. Meas. 2008,
29, 157–179.
49. Hasegawa, H.; Kanai, H.; Hoshimiya, N.; Chubachi, N.; Koiwa, Y. Measurement of Local
Elasticity of Human Carotid Arterial Walls and Its Relationship with Risk Index of Atherosclerosis.
In Proceedings of IEEE 1998 Ultrasonic Symposium, Sendai, Japan, 5–8 October 1998.
50. Bia, D.; Armentano, R.L.; Zócalo, Y.; Campos, H.P.; Fischer, E.I.C.; Graf, S.; Saldías, M.;
Silva, W.; Alvarez, I. Functional Properties of Fresh and Cryopreserved Carotid and Femoral
Arteries, and of Venous and Synthetic Grafts: Comparison with Arteries from Normotensive and
Hypertensive Patients. Cell Tissue Bank. 2007, 8, 43–57.
51. Vera, A.; Leija, L.; Tellez, A.; Bazán, I.; Ramos, A. Suitability of Alternative Methods of Time
Delay Measurements for Ultrasonic Noninvasive Temperature Estimation in Oncology
Hyperthermia. In New Trends in Electrical Engineering, Automatic Control, Computing and
Communication Sciences; Logos Verlag: Berlin, Germany, 2010.
52. Amini, A.N.; Ebbini, E.S.; Georgiou, T.T. Noninvasive Estimation of Tissue Temperature via
High-Resolution Spectral Analysis Techniques. IEEE Trans. Biomed. Eng. 2005, 52, 221–228.
53. Bruce, E.N. Biomedical Signal Processing and Signal Modeling; John Wiley & Sons: New York,
NY, USA, 2001.
54. Bazán, I. Evaluation and Improvement of Ultrasonic Techniques for Non Invasive Estimation of
Internal Thermal Distributions on Biologic Phantoms with Scatters. Ph.D. Thesis, Department of
Electrical Engineering, Center of Investigation and Advanced Studies, National Politechn.
Institute, Mexico DF, México, 2009.
55. Lorenz, M.W.; Markus, H.S.; Bots, M.L.; Rosvall, M.; Sitzer, M. Prediction of Clinical
Cardiovascular Events with Carotid Intima-Media Thickness: A Systematic Review and
Meta-Analysis. Circulation 2007, 115, 459–467.
56. Simon, A.; Gariepy, J.; Chironi, G.; Megnien, J.L.; Levenson, J. Intima-Media Thickness: A New
Tool for Diagnosis and Treatment of Cardiovascular Risk. J. Hypertens. 2002, 20, 159–169.
© 2012 by the authors; licensee MDPI, Basel, Switzerland. This article is an open access article
distributed under the terms and conditions of the Creative Commons Attribution license
(http://creativecommons.org/licenses/by/3.0/).