Estimation and Analysis Issues (Case Study: the City of Omsk)
12
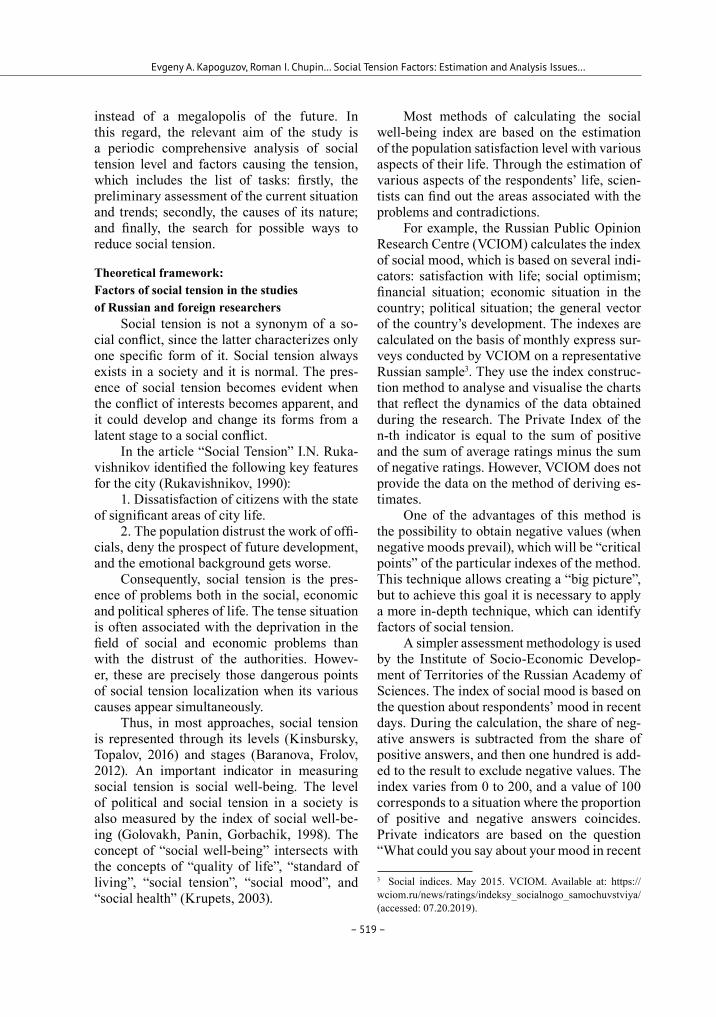
– 517 – DOI: 10.17516/1997-1370-0531 УДК 316.43, 338.2 Social Tension Factors: Estimation and Analysis Issues (Case Study: the City of Omsk) Evgeny A. Kapoguzov* a , Roman I. Chupin b , Maria S. Kharlamova c and Anastasia V. Pligunova a a Dostoevsky Omsk State University Omsk, Russian Federation b Institute of Economics and Industrial Engineering of SB RAS Novosibirsk, Russian Federation c Omsk Scientific Centre SB RAS Omsk, Russian Federation Received 01.11.2019, received in revised form 22.11.2019, accepted 11.12.2019 Abstract. The study describes the problems of social tension factors measurement and estimation in cities and its current state in Omsk. The empirical basis of the study is the sociological survey data, conducted by the Omsk Regional Center of Public Relations and the Sociology Department of Dostoevsky Omsk State University. 975 people from 5 urban districts of Omsk were interviewed during the survey. Data analysis was carried out using frequency analysis methods and contingency tables. The significance and essentiality of the differences were estimated using the chi-square and Cramer’s V criteria. Age and education turn out to have the most significant impact on respondents’ opinions; people with secondary or higher education are more often dissatisfied with the situation in the region, as for the age criterion, the group from 30 to 44 is the most dissatisfied one. The ranking of problems by importance from the respondents’ point of view was done on the basis of frequency analysis. The leading positions are occupied by the social and economic problems such as low salaries, consumer goods prices, infrastructure of the city and public utilities, as well as bureaucracy of local authorities. Judging by the protest potential of Omsk citizens, it was concluded that the population is dissatisfied with the work of the local government. However, the protest potential is estimated as low, which is partially explained by the growing negative migration balance. As a result, recommendations on improving monitoring and analysis of social tension factors in the city have been offered. Keywords: social tension, social tension estimation, social tension factors, social well- being, protest potential, trust in government. Journal of Siberian Federal University. Humanities & Social Sciences 2020 13(4): 517–528 © Siberian Federal University. All rights reserved * Corresponding author E-mail address: [email protected] ORCID: 0000-0001-8083-5654 (Kapoguzov); 0000-0002-8904-1380 (Chupin); 0000-0003-4144-5893 (Kharlamova); 0000- 0001-7816-9250 (Pligunova)
-
Upload
khangminh22 -
Category
Documents
-
view
0 -
download
0
Transcript of Estimation and Analysis Issues (Case Study: the City of Omsk)
– 517 –
DOI: 10.17516/1997-1370-0531УДК 316.43, 338.2
Social Tension Factors: Estimation and Analysis Issues (Case Study: the City of Omsk)
Evgeny A. Kapoguzov*a, Roman I. Chupinb, Maria S. Kharlamovac and Anastasia V. Pligunovaa
aDostoevsky Omsk State UniversityOmsk, Russian FederationbInstitute of Economics and Industrial Engineering of SB RASNovosibirsk, Russian FederationcOmsk Scientific Centre SB RASOmsk, Russian Federation
Received 01.11.2019, received in revised form 22.11.2019, accepted 11.12.2019
Abstract. The study describes the problems of social tension factors measurement and estimation in cities and its current state in Omsk. The empirical basis of the study is the sociological survey data, conducted by the Omsk Regional Center of Public Relations and the Sociology Department of Dostoevsky Omsk State University. 975 people from 5 urban districts of Omsk were interviewed during the survey. Data analysis was carried out using frequency analysis methods and contingency tables. The significance and essentiality of the differences were estimated using the chi-square and Cramer’s V criteria. Age and education turn out to have the most significant impact on respondents’ opinions; people with secondary or higher education are more often dissatisfied with the situation in the region, as for the age criterion, the group from 30 to 44 is the most dissatisfied one. The ranking of problems by importance from the respondents’ point of view was done on the basis of frequency analysis. The leading positions are occupied by the social and economic problems such as low salaries, consumer goods prices, infrastructure of the city and public utilities, as well as bureaucracy of local authorities. Judging by the protest potential of Omsk citizens, it was concluded that the population is dissatisfied with the work of the local government. However, the protest potential is estimated as low, which is partially explained by the growing negative migration balance. As a result, recommendations on improving monitoring and analysis of social tension factors in the city have been offered.
Keywords: social tension, social tension estimation, social tension factors, social well-being, protest potential, trust in government.
Journal of Siberian Federal University. Humanities & Social Sciences 2020 13(4): 517–528
© Siberian Federal University. All rights reserved* Corresponding author E-mail address: [email protected] ORCID: 0000-0001-8083-5654 (Kapoguzov); 0000-0002-8904-1380 (Chupin); 0000-0003-4144-5893 (Kharlamova); 0000-0001-7816-9250 (Pligunova)

– 518 –
Evgeny A. Kapoguzov, Roman I. Chupin… Social Tension Factors: Estimation and Analysis Issues…
The study was carried out within the framework of the state assignment of the Omsk Scientific Center SB RAS (the Programme of FSR SAS for 2013-2020 (state No. Reg. AAAA-A17-117041210229-2)).
Research area: sociology.
Citation: Kapoguzov, E.A., Chupin, R.I., Kharlamova, M.S., Pligunova, A.V. (2020). Social tension factors: estimation and analysis issues (case study: the city of Omsk). J. Sib. Fed. Univ. Humanit. Soc. Sci., 13(4), 517-528. DOI: 10.17516/1997-1370-0531.
IntroductionOver the past few years, urban refinement
trend, which explores the ways to improve the quality and standard of living in large cities, has been growing in the Russian Federation. At MOSCOW URBAN FORUM, the image on the metropolis’s future was presented as “smart” and comfortable residence for people, encour-aging them to start families, work and devel-op personally. The National Project “Housing and Urban Environment” has the similar tasks, i.e. “a sharp increase of the urban environment comfort” as its priority (which means reducing the number of cities with an unfavorable urban environment).
According to the architects designing “the cities of the future”, by 2024 the key role in the construction of the “Smart City” in almost ev-ery constituent entity of the Russian Federation should be played by citizens themselves, whose participation is planned to be approximate-ly 30% of the total number of the municipal-ity residents. However, the conducted studies show that the requirements of urban activists are not fully echoed by the authorities, which creates a tense social atmosphere in the region. The situation is aggravated with strong nega-tive connotation of media reports about the ur-ban environment (Ovodova, Chupin, Zhigunov, 2018: 126). In addition, researchers emphasize the “corporate nature” of smart cities that are built around high-tech companies, while ordi-nary citizens do not have place in the dominant model of entrepreneurial management (Hol-lands, 2015), which subordinates them to its needs (Tadiar, 2016) associated with new risks (Bibri, Krogstie, 2017), in particular, for the en-vironment, not-age-friendly structure (Buffel, Phillipson, 2016), etc.
The transformation processes, which are accompanied by political and economic instability, worsening living standards and other negative consequences, inevitably af-fect the mood of the population. They lead to a change in social relations and give rise to contradictions that take place in all spheres of society. The contradictions in society and their dynamics are manifested in social ten-sion changes.
Aggravation of economic and political problems is dangerous, since it entails neg-ative emotional and psychological moods of the population (Lezhnina, 2016). According to the Public Opinion Foundation (FOM) survey “The Main Problems of Regions”, citizens of the Siberian Federal District are the most dis-satisfied ones1. Omsk is among the territories of increased social tension2. During the eco-nomic crisis in 2014 in the city inhabited by more than a million people, approximately half of the population did not trust the local author-ities (65%) and the head of the region (48%), which significantly exceeded the national av-erage (45% on average in Russia). The activ-ists’ request for a “comfortable city” was not satisfied by the authorities and, therefore, the activists united in lots of different urban com-munities started transforming the public space of the city themselves. Moreover, this trend is noticeable in a wide range of megalopolises (Vakhshtayn, 2014).
Thus, Omsk is at risk of becoming one of the most prone to social tension agglomerations 1 Significant problems in the development of Russian re-gions. Available at: https://fom.ru/Obraz-zhizni/12465 (ac-cessed 05.15.19).2 Socio-economic and political tensions in the Russian regions for 2017. Available at: https://komitetgi.ru/analyt-ics/3493/ (accessed: 05.15.19).
– 519 –
Evgeny A. Kapoguzov, Roman I. Chupin… Social Tension Factors: Estimation and Analysis Issues…
instead of a megalopolis of the future. In this regard, the relevant aim of the study is a periodic comprehensive analysis of social tension level and factors causing the tension, which includes the list of tasks: firstly, the preliminary assessment of the current situation and trends; secondly, the causes of its nature; and finally, the search for possible ways to reduce social tension.
Theoretical framework: Factors of social tension in the studies of Russian and foreign researchers
Social tension is not a synonym of a so-cial conflict, since the latter characterizes only one specific form of it. Social tension always exists in a society and it is normal. The pres-ence of social tension becomes evident when the conflict of interests becomes apparent, and it could develop and change its forms from a latent stage to a social conflict.
In the article “Social Tension” I.N. Ruka-vishnikov identified the following key features for the city (Rukavishnikov, 1990):
1. Dissatisfaction of citizens with the state of significant areas of city life.
2. The population distrust the work of offi-cials, deny the prospect of future development, and the emotional background gets worse.
Consequently, social tension is the pres-ence of problems both in the social, economic and political spheres of life. The tense situation is often associated with the deprivation in the field of social and economic problems than with the distrust of the authorities. Howev-er, these are precisely those dangerous points of social tension localization when its various causes appear simultaneously.
Thus, in most approaches, social tension is represented through its levels (Kinsbursky, Topalov, 2016) and stages (Baranova, Frolov, 2012). An important indicator in measuring social tension is social well-being. The level of political and social tension in a society is also measured by the index of social well-be-ing (Golovakh, Panin, Gorbachik, 1998). The concept of “social well-being” intersects with the concepts of “quality of life”, “standard of living”, “social tension”, “social mood”, and “social health” (Krupets, 2003).
Most methods of calculating the social well-being index are based on the estimation of the population satisfaction level with various aspects of their life. Through the estimation of various aspects of the respondents’ life, scien-tists can find out the areas associated with the problems and contradictions.
For example, the Russian Public Opinion Research Centre (VCIOM) calculates the index of social mood, which is based on several indi-cators: satisfaction with life; social optimism; financial situation; economic situation in the country; political situation; the general vector of the country’s development. The indexes are calculated on the basis of monthly express sur-veys conducted by VCIOM on a representative Russian sample3. They use the index construc-tion method to analyse and visualise the charts that reflect the dynamics of the data obtained during the research. The Private Index of the n-th indicator is equal to the sum of positive and the sum of average ratings minus the sum of negative ratings. However, VCIOM does not provide the data on the method of deriving es-timates.
One of the advantages of this method is the possibility to obtain negative values (when negative moods prevail), which will be “critical points” of the particular indexes of the method. This technique allows creating a “big picture”, but to achieve this goal it is necessary to apply a more in-depth technique, which can identify factors of social tension.
A simpler assessment methodology is used by the Institute of Socio-Economic Develop-ment of Territories of the Russian Academy of Sciences. The index of social mood is based on the question about respondents’ mood in recent days. During the calculation, the share of neg-ative answers is subtracted from the share of positive answers, and then one hundred is add-ed to the result to exclude negative values. The index varies from 0 to 200, and a value of 100 corresponds to a situation where the proportion of positive and negative answers coincides. Private indicators are based on the question “What could you say about your mood in recent
3 Social indices. May 2015. VCIOM. Available at: https://wciom.ru/news/ratings/indeksy_socialnogo_samochuvstviya/ (accessed: 07.20.2019).
– 520 –
Evgeny A. Kapoguzov, Roman I. Chupin… Social Tension Factors: Estimation and Analysis Issues…
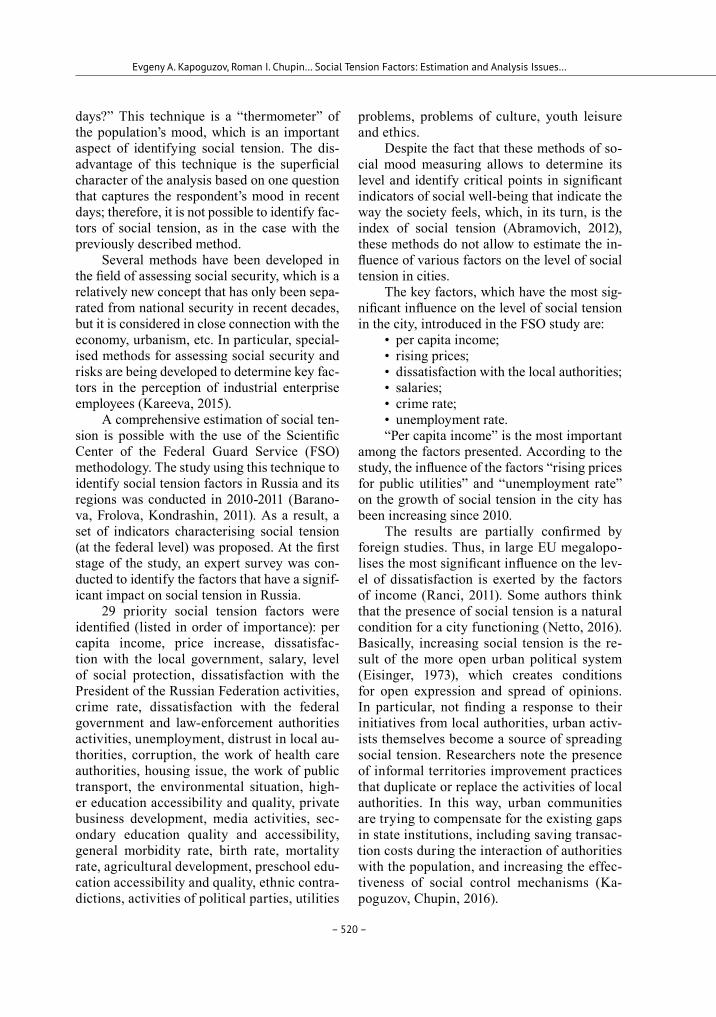
days?” This technique is a “thermometer” of the population’s mood, which is an important aspect of identifying social tension. The dis-advantage of this technique is the superficial character of the analysis based on one question that captures the respondent’s mood in recent days; therefore, it is not possible to identify fac-tors of social tension, as in the case with the previously described method.
Several methods have been developed in the field of assessing social security, which is a relatively new concept that has only been sepa-rated from national security in recent decades, but it is considered in close connection with the economy, urbanism, etc. In particular, special-ised methods for assessing social security and risks are being developed to determine key fac-tors in the perception of industrial enterprise employees (Kareeva, 2015).
A comprehensive estimation of social ten-sion is possible with the use of the Scientific Center of the Federal Guard Service (FSO) methodology. The study using this technique to identify social tension factors in Russia and its regions was conducted in 2010-2011 (Barano-va, Frolova, Kondrashin, 2011). As a result, a set of indicators characterising social tension (at the federal level) was proposed. At the first stage of the study, an expert survey was con-ducted to identify the factors that have a signif-icant impact on social tension in Russia.
29 priority social tension factors were identified (listed in order of importance): per capita income, price increase, dissatisfac-tion with the local government, salary, level of social protection, dissatisfaction with the President of the Russian Federation activities, crime rate, dissatisfaction with the federal government and law-enforcement authorities activities, unemployment, distrust in local au-thorities, corruption, the work of health care authorities, housing issue, the work of public transport, the environmental situation, high-er education accessibility and quality, private business development, media activities, sec-ondary education quality and accessibility, general morbidity rate, birth rate, mortality rate, agricultural development, preschool edu-cation accessibility and quality, ethnic contra-dictions, activities of political parties, utilities
problems, problems of culture, youth leisure and ethics.
Despite the fact that these methods of so-cial mood measuring allows to determine its level and identify critical points in significant indicators of social well-being that indicate the way the society feels, which, in its turn, is the index of social tension (Abramovich, 2012), these methods do not allow to estimate the in-fluence of various factors on the level of social tension in cities.
The key factors, which have the most sig-nificant influence on the level of social tension in the city, introduced in the FSO study are:
• per capita income; • rising prices;• dissatisfaction with the local authorities;• salaries;• crime rate;• unemployment rate.“Per capita income” is the most important
among the factors presented. According to the study, the influence of the factors “rising prices for public utilities” and “unemployment rate” on the growth of social tension in the city has been increasing since 2010.
The results are partially confirmed by foreign studies. Thus, in large EU megalopo-lises the most significant influence on the lev-el of dissatisfaction is exerted by the factors of income (Ranci, 2011). Some authors think that the presence of social tension is a natural condition for a city functioning (Netto, 2016). Basically, increasing social tension is the re-sult of the more open urban political system (Eisinger, 1973), which creates conditions for open expression and spread of opinions. In particular, not finding a response to their initiatives from local authorities, urban activ-ists themselves become a source of spreading social tension. Researchers note the presence of informal territories improvement practices that duplicate or replace the activities of local authorities. In this way, urban communities are trying to compensate for the existing gaps in state institutions, including saving transac-tion costs during the interaction of authorities with the population, and increasing the effec-tiveness of social control mechanisms (Ka-poguzov, Chupin, 2016).

– 521 –
Evgeny A. Kapoguzov, Roman I. Chupin… Social Tension Factors: Estimation and Analysis Issues…
Thus, the most comprehensive methodol-ogy is that of Scientific Center of the Federal Guard Service (FSO), which follows from so-cial tension measurement and estimation ap-proaches review. However, it is necessary to localize the social tension factors to the de-velopment conditions of a particular city or a group of cities.
Design: the methodology of analyzing social tension factors and information basis of research
Based on the review it is possible to point out the key factor groups which influence the level of social tension which are divided into respondents’ characteristics, social and eco-nomic factors and political factors. To obtain comprehensive characteristics of social tension factors, it is necessary to consider the factor groups in accordance with the blocks in Fig. 1.
The study used sociological study data (March-April 2018 survey), which was carried
out by the Omsk Regional Center on Public Relations and Dostoevsky Omsk State Univer-sity. The general aggregate: the adult popula-tion of Omsk in 2018 (residents of the Sovetsky Administrative District, Central Administra-tive District, Leninsky Administrative Dis-trict, Octiabrsky Administrative District and Kirovsky Administrative District of Omsk, total 1,172,000 people). The sample aggregate in administrative districts was 975 people; its structure is shown in Table 1. The dataset was obtained using a questionnaire (apartment sur-vey).
Taking the available information into ac-count, it is necessary determine the analysis methods (statistics characterising the factor groups are presented in the results section in more detail). The selected groups of factors in the information basis of the research are mea-sured by ordinal and nominal scales. The study of connection for nonmetric scales is carried out with the use of frequency analysis and con-
Fig. 1. Key blocks of social tension factors
Table 1. Sample structure by the administrative districts and age and gender characteristicsSample distribution
by administrative districtsSample distribution by age and gender
Administrative districts in Omsk
Number of respondents
Age group, years
total espondents
including men
including women
Kirovsky District 217 18-29 238 432 544Leninsky District 170 30-44 271 119 119
Oktiabrsky District 146 45-59/45-54 199 131 140Sovetski District 202
≥60/ ≥55 268 109 90Central District 239
total 975 total 975 432 544
– 522 –
Evgeny A. Kapoguzov, Roman I. Chupin… Social Tension Factors: Estimation and Analysis Issues…
Table 2. Estimation of the significance and essentiality based on the chi-square and Cramer’s V criteria, contingency tables for significant factors
Significance of factors
Variable Chi-square (Cramer’s V)
Degrees of freedom Asymptotic significance
Gender 0.178(0.014) 2 0.915Education 17.903 (0.097) 4 0.001
District 10.982 (0.076) 8 0.203Age group 29.599 (0.125) 6 0.000
Contingency tables for significant factors
Question and answer optionsEducation Age group
1 2 3 Total 1 2 3 4 Total
Are you dissatisfied with the situation
in the city?
Yes85 254 199 538 122 164 130 122 538
15.8% 47.2% 37.0% 100% 22.7% 30.5% 24.2% 22.7% 100%
No87 132 124 343 97 80 49 117 343
25.4% 38.5% 36.2% 100% 28.3% 23.3% 14.3% 34.1% 100%
Difficult to answer
13 38 17 68 11 20 14 23 6819.1% 55.9% 25.0% 100% 16.2% 29.4% 20.6% 33.8% 100%
In total185 424 340 949 230 264 193 262 949
19.5% 44.7% 35.8% 100% 24.2% 27.8% 20.3% 27.6% 100%Note: Education: “1” – secondary general education or lower (school), “2” – vocational education (vocational school, college, technical school), “3” – higher education; Age group: “1” – 18-29; “2” – 30-44, “3” – 45-59 (male), 45-54 (female); “4” – 60 or older (male), 55 or older (female).
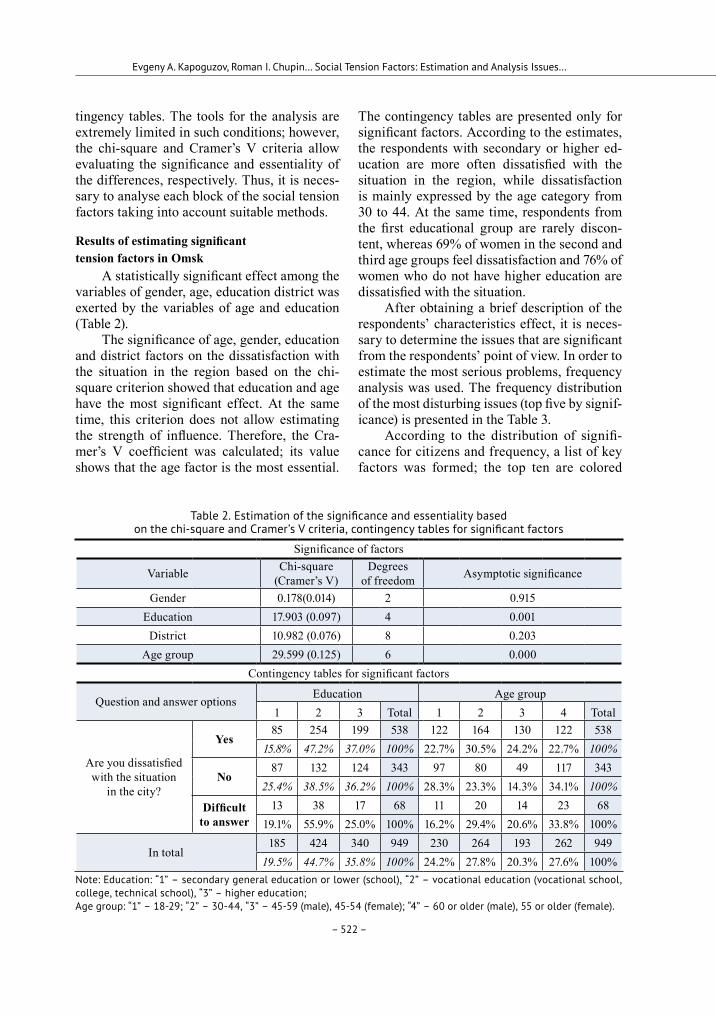
tingency tables. The tools for the analysis are extremely limited in such conditions; however, the chi-square and Cramer’s V criteria allow evaluating the significance and essentiality of the differences, respectively. Thus, it is neces-sary to analyse each block of the social tension factors taking into account suitable methods.
Results of estimating significant tension factors in Omsk
A statistically significant effect among the variables of gender, age, education district was exerted by the variables of age and education (Table 2).
The significance of age, gender, education and district factors on the dissatisfaction with the situation in the region based on the chi-square criterion showed that education and age have the most significant effect. At the same time, this criterion does not allow estimating the strength of influence. Therefore, the Cra-mer’s V coefficient was calculated; its value shows that the age factor is the most essential.
The contingency tables are presented only for significant factors. According to the estimates, the respondents with secondary or higher ed-ucation are more often dissatisfied with the situation in the region, while dissatisfaction is mainly expressed by the age category from 30 to 44. At the same time, respondents from the first educational group are rarely discon-tent, whereas 69% of women in the second and third age groups feel dissatisfaction and 76% of women who do not have higher education are dissatisfied with the situation.
After obtaining a brief description of the respondents’ characteristics effect, it is neces-sary to determine the issues that are significant from the respondents’ point of view. In order to estimate the most serious problems, frequency analysis was used. The frequency distribution of the most disturbing issues (top five by signif-icance) is presented in the Table 3.
According to the distribution of signifi-cance for citizens and frequency, a list of key factors was formed; the top ten are colored

– 523 –
Evgeny A. Kapoguzov, Roman I. Chupin… Social Tension Factors: Estimation and Analysis Issues…
blue in the table. The leading positions are oc-cupied by such issues as “Low salaries”, “The price of conveniences (electricity, gas, wa-ter, heating)”, “State of roads and pedestrian zones”, “Rising prices for clothes, food, med-icines”, “Quality of medical services”, “Ecol-ogy”, “Unemployment, bankruptcy”, “Cost of medical services”, “Low pensions”, “Bureau-cracy, corruption”.
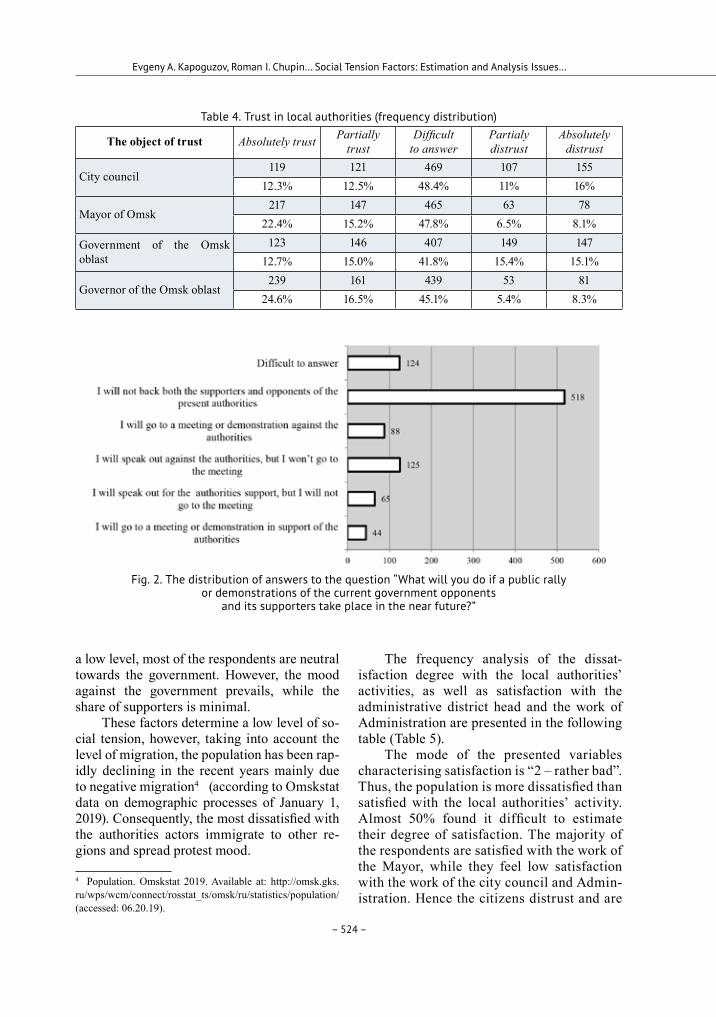
In order to estimate the political factors of social tension, firstly, a frequency analysis of the population trust to the local authorities was carried out. It was revealed that citizens found this question difficult to answer. Nevertheless, the “trusting group” prevails in assessing the
level of trust to the Mayor of the city, but the “distrusting group” prevails in assessing the level of trust to such local authorities as the Omsk City Council and the City Administra-tion of Omsk (Table 4).
As a part of the following analysis block, a frequency analysis of the protest potential of citizens was carried out. The results of measur-ing the protest potential are shown in Fig. 2.
If we enlarge the groups according to the values of variables, we will see that 53.2% are neutral towards the authorities, 21.9% are op-posed to the authorities, 12.8% found it diffi-cult to answer, 11.1% support the authorities. As a result, the protest potential seems to be at
Table 3. The most disturbing issues for the population (frequency distribution)
Issue 1 2 3 4 5 FrequencyExpensive property (purchase, construction), land allocation for private housing 86 31 33 32 17 199
Conditions for children’s development (playgrounds, clubs, sports facilities) 48 35 33 28 17 161
Bureaucracy, corruption in authorities and law-enforcement agencies 38 64 53 49 34 238
Quality of medical services, lack of medical facilities and medical staff 45 78 72 67 46 308
Cost of medical services 60 44 61 49 32 246Low salaries 96 81 78 78 70 403
Low pensions 31 61 64 49 44 239Unemployment, bankruptcy 25 44 57 61 65 252Cultural leisure activities of young people and adults (recreation centers, stadiums, gyms, libraries, theaters, etc.)
26 15 24 23 15 100
The price of modern conveniences (electricity, gas, water, heating) 79 89 66 92 63 389
Street lighting (absence, shortage) 21 22 19 20 21 103Badly maintained houses 14 31 29 25 31 130Alcoholism 53 26 25 18 25 147Drug addiction 41 42 25 31 37 176Rising prices for food, clothing, medicines 60 46 77 59 70 312Crime, criminal situation 5 6 11 8 11 41Lack of kindergartens and schools (lack of places) and poor material support 41 15 14 15 8 93
Public transport, fares 35 32 18 24 12 121State of roads and pedestrian zones 93 77 55 53 45 323Ecology, garbage collection, landfills 44 83 66 48 46 287
– 524 –
Evgeny A. Kapoguzov, Roman I. Chupin… Social Tension Factors: Estimation and Analysis Issues…
a low level, most of the respondents are neutral towards the government. However, the mood against the government prevails, while the share of supporters is minimal.
These factors determine a low level of so-cial tension, however, taking into account the level of migration, the population has been rap-idly declining in the recent years mainly due to negative migration44 (according to Omskstat data on demographic processes of January 1, 2019). Consequently, the most dissatisfied with the authorities actors immigrate to other re-gions and spread protest mood.
4 Population. Omskstat 2019. Available at: http://omsk.gks.ru/wps/wcm/connect/rosstat_ts/omsk/ru/statistics/population/ (accessed: 06.20.19).
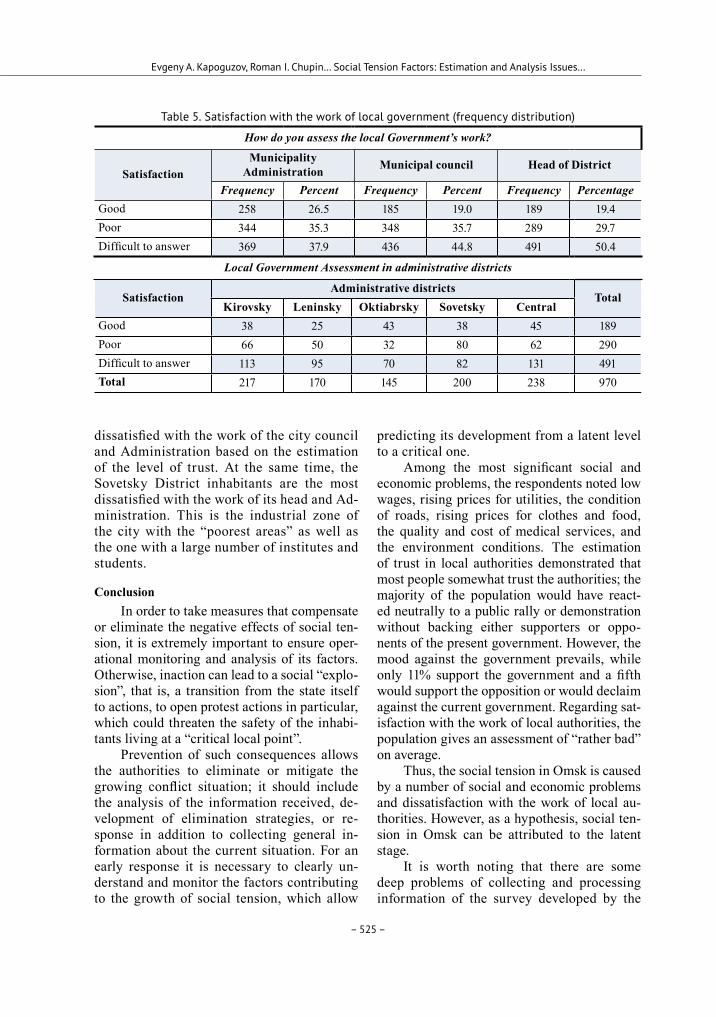
The frequency analysis of the dissat-isfaction degree with the local authorities’ activities, as well as satisfaction with the administrative district head and the work of Administration are presented in the following table (Table 5).
The mode of the presented variables characterising satisfaction is “2 – rather bad”. Thus, the population is more dissatisfied than satisfied with the local authorities’ activity. Almost 50% found it difficult to estimate their degree of satisfaction. The majority of the respondents are satisfied with the work of the Mayor, while they feel low satisfaction with the work of the city council and Admin-istration. Hence the citizens distrust and are
Table 4. Trust in local authorities (frequency distribution)
The object of trust Absolutely trust Partially trust
Difficult to answer
Partialy distrust
Absolutely distrust
City council119 121 469 107 155
12.3% 12.5% 48.4% 11% 16%
Mayor of Omsk217 147 465 63 78
22.4% 15.2% 47.8% 6.5% 8.1%
Government of the Omsk oblast
123 146 407 149 14712.7% 15.0% 41.8% 15.4% 15.1%
Governor of the Omsk oblast239 161 439 53 81
24.6% 16.5% 45.1% 5.4% 8.3%
Fig. 2. The distribution of answers to the question “What will you do if a public rally or demonstrations of the current government opponents
and its supporters take place in the near future?”
– 525 –
Evgeny A. Kapoguzov, Roman I. Chupin… Social Tension Factors: Estimation and Analysis Issues…
dissatisfied with the work of the city council and Administration based on the estimation of the level of trust. At the same time, the Sovetsky District inhabitants are the most dissatisfied with the work of its head and Ad-ministration. This is the industrial zone of the city with the “poorest areas” as well as the one with a large number of institutes and students.
ConclusionIn order to take measures that compensate
or eliminate the negative effects of social ten-sion, it is extremely important to ensure oper-ational monitoring and analysis of its factors. Otherwise, inaction can lead to a social “explo-sion”, that is, a transition from the state itself to actions, to open protest actions in particular, which could threaten the safety of the inhabi-tants living at a “critical local point”.
Prevention of such consequences allows the authorities to eliminate or mitigate the growing conflict situation; it should include the analysis of the information received, de-velopment of elimination strategies, or re-sponse in addition to collecting general in-formation about the current situation. For an early response it is necessary to clearly un-derstand and monitor the factors contributing to the growth of social tension, which allow
predicting its development from a latent level to a critical one.
Among the most significant social and economic problems, the respondents noted low wages, rising prices for utilities, the condition of roads, rising prices for clothes and food, the quality and cost of medical services, and the environment conditions. The estimation of trust in local authorities demonstrated that most people somewhat trust the authorities; the majority of the population would have react-ed neutrally to a public rally or demonstration without backing either supporters or oppo-nents of the present government. However, the mood against the government prevails, while only 11% support the government and a fifth would support the opposition or would declaim against the current government. Regarding sat-isfaction with the work of local authorities, the population gives an assessment of “rather bad” on average.
Thus, the social tension in Omsk is caused by a number of social and economic problems and dissatisfaction with the work of local au-thorities. However, as a hypothesis, social ten-sion in Omsk can be attributed to the latent stage.
It is worth noting that there are some deep problems of collecting and processing information of the survey developed by the
Table 5. Satisfaction with the work of local government (frequency distribution)
How do you assess the local Government’s work?
SatisfactionMunicipality
Administration Municipal council Head of District
Frequency Percent Frequency Percent Frequency PercentageGood 258 26.5 185 19.0 189 19.4Poor 344 35.3 348 35.7 289 29.7Difficult to answer 369 37.9 436 44.8 491 50.4
Local Government Assessment in administrative districts
SatisfactionAdministrative districts
TotalKirovsky Leninsky Oktiabrsky Sovetsky Central
Good 38 25 43 38 45 189Poor 66 50 32 80 62 290Difficult to answer 113 95 70 82 131 491Total 217 170 145 200 238 970
– 526 –
Evgeny A. Kapoguzov, Roman I. Chupin… Social Tension Factors: Estimation and Analysis Issues…
Omsk Regional Center on Public Relations. The database contains a large number of omissions about the most significant issues. The authors of the present paper faced diffi-culties asking respondents to rank “significant problems” where they had to select five issues from the list of twenty and mark them in or-der of importance. Most respondents did not mark the required number of important issues. The results are also distorted by the fact that this question is preceded by its open version, where some respondents started listing prob-lems without relying on the list, while others selected problems from the list and supple-mented their own variants. First of all, the information that was collected by the open question cannot be structured or correlated with the proposed list. But the main diffi-culty is that the respondents often think that the problem has already been identified and do not mention it in the following questions, where they need to select problems from the list. If they mention the problem in an open question, which is close in meaning to the one on the list, they do not repeat it. In addition to that, the respondents’ attention is scattered with a large number of options, and a respon-
dent rather notes the last remembered options for significant issues than those that follow in the ranking order.
During the analysis of such data, a consid-erable part of the information becomes useless, since it cannot be structured due to the indicat-ed problems. Nonmetric scales of variables are uninformative, since they are represented by a narrow list of possible values. This severely limits the definition of order relationships. As a result, using the base under consideration, a short list of questions can be studied using a narrow list of analysis methods, which leads to the need for additional collection of primary data.
Further research area is the estimation of the social tension stage. It is necessary to de-velop a survey toolkit that includes a scale of importance in order to identify the degree of satisfaction and dissatisfaction with the factors affecting social tension from the respondents’ point of view. The scale of importance and sat-isfaction will determine the “weight” of each factor in the final value of the social tension indicator. This dataset will allow deriving the social tension index, which reflects the stage of social tension.
References
Abramovich, Ye.S. (2012). Matematiko-statisticheskie metody analiza sotsial’noi napriazhennosti v rossiiskom obshchestve [Mathematical and Statistical Methods for Analysing Social Tension in Russian Society]. In Uchet i statistika [Accounting and Statistics], 1 (25), 85-89.
Baranova, G.V., Frolov, V.A. (2012). Metodologiia i metodika izmereniia sotsial’noi napriazhennosti [Methods and Techniques for Measuring Social Tension]. In Sotsiologicheskiie issledovaniia [Sociological Studies], 3, 50-65.
Baranova, G.V., Frolova, D.N., Kondrashin, A.V. (2011). Osobennosti sotsial’noi napriazhennosti v regionakh Rossii [Features of Social Tension in the Regions of Russia]. In Sotsiologicheskiie issledovaniia [Sociological Studies], 6, 48-54.
Bibri, S.E., Krogstie, J. (2017). On the Social Shaping Dimensions of Smart Sustainable Cities: A Study in Science, Technology, and Society. In Sustainable Cities and Society, 29, 219-246.
Buffel, T., Phillipson, C. (2016). Can Global Cities Be ‘Age-Friendly Cities’? Urban Development and Ageing Populations. In Cities, 55, 94-100.
Eisinger, P.K. (1973). The Conditions of Protest Behavior in American Cities. In American Political Science Review, 1 (67), 11-28.
Golovakha, Ye.I., Panina, N.V., Gorbachik, A.P. (1998). Izmerenie sotsial’nogo samochuvstviia: test IISS [Measurement of Social Well-Being: The IISS Test]. In Sotsiologiia: metodologiia, metody, matem-aticheskoe modelirovanie (4M) [Sociology: Methodology, Methods, Mathematical Modeling (4M)], 10, 45-71.
Hollands, R.G. (2015). Critical Interventions into the Corporate Smart City. In Cambridge Journal of Regions, Economy and Society, 8(1), 61-77.
Evgeny A. Kapoguzov, Roman I. Chupin… Social Tension Factors: Estimation and Analysis Issues…
Kapoguzov, Ye.A., Chupin, R.I. (2016). Sotsial’nyi kontrol’ kachestva gosudarstvennykh uslug: neoin-stitutsional’nyi podkhod [Social Control Over the Quality of Public Services: A Neo-Institutional Ap-proach]. In Ars Administrandi, 3, 41-51.
Kareeva, А.P. (2015). Perception of Social Security by the Employees of a Large Industrial Enterprise from the Perspective of Post-Nonclassical Sociology. In Journal of Siberian Federal University. Humanities & Social Sciences, 8(9), 1886-1892.
Kinsbursky, A.V., Topalov, M.N. (2016). Sotsial’naia napriazhonnost’ i massovye aktsii protesta (k voprosu o mekhanizme deistviia) [Social Tension and Mass Protests (On the Issue of the Mechanism of Action)]. In Sotsiologicheskaia nauka i sotsial’naia praktika [Sociological Science and Social Practice], 1, 20-34.
Krupets, Ya.N. (2003). Sotsial’noe samochuvstvie kak integral’nyi pokazatel’ adaptirovannosti [Social Well-Being as an Integral Indicator of Adaptability]. In Sotsiologicheskie issledovaniia [Sociological Stud-ies], 4, 143-144.
Lezhnina, Yu.P. (2016). Sotsial’no-ekonomicheskii krizis na prostranstve Rossii: problemy naseleniia i «ochagi bespokoistva» [Socio-Economic Crisis in Russia: Problems of the Population And “Centers of Concern”]. In Sotsiologicheskie issledovaniia [Sociological Studies], 10, 54-65.
Netto, V.M. (2016). The Social Fabric of Cities. Routledge.Ovodova, S.N., Chupin, R.I., Zhigunov, A.Yu. (2018). Urbanisticheskii diskurs o blagoustroistve goro-
da v gorode: ot narrativov k institutam [Urban Discourse on the Improvement of the City in the City: From Narratives to Institutions]. In Journal of Institutional Studies, 3 (10), 123-138.
Ranci, C. (2011). Competitiveness and Social Cohesion in Western European cities. In Urban Studies, 13 (48), 2789-2804.
Rukavishnikov, V.O. (1990). Sotsial’naia napriazhennost’ [Social Tension]. In Dialog [Dialogue], 8, 12.Tadiar, N.X. (2016). City Everywhere. In Theory, Culture & Society, 33 (7-8), 57-83.Vakhshtayn, V.S. (2014). Peresborka goroda: mezhdu yazykom i prostranstvom [Reassembly of The
City: Between Language and Space]. In Sotsiologiia vlasti [Sociology of Power], 2, 9-38.
Evgeny A. Kapoguzov, Roman I. Chupin… Social Tension Factors: Estimation and Analysis Issues…
Факторы социальной напряженности: проблемы оценки и анализа (на примере города Омска)
Е.А. Капогузова, Р.И. Чупинб, М.С. Харламовав, А.В. Плигуноваа
aОмский государственный университет им. Ф.М. Достоевского Российская Федерация, Омск бИнститут экономики и организации промышленного производства СО РАН Российская Федерация, Новосибирск вОмский научный центр СО РАН Российская Федерация, Омск
Аннотация. Статья посвящена проблемам оценки факторов социальной напряженности в крупных городских агломерациях, а также ее фактического состояния в городе Омске. В основу статьи легли данные социологического исследования, проведенного Региональным центром по связям с общественностью Омска при участии кафедры социологии ОмГУ им. Ф.М. Достоевского. В ходе проведения анкетирования опрошены 975 человек, проживающих на территории пяти административных округов города Омска. Анализ данных проведен с применением методов частотного анализа и таблиц сопряженности. Оценку значимости и существенности различий производили с использованием критериев хи-квадрат и V-Крамера. В результате было выявлено, что наиболее значимое влияние среди рассматриваемых характеристик респондентов оказывают возраст и образование: респонденты, имеющие среднее или высшее образование, чаще отмечают недовольство ситуацией в регионе, тогда как недовольство в основном испытывает возрастная категория от 30 до 44 лет. На основе частотного анализа проведено ранжирование проблем, волнующих население в наибольшей степени. Лидирующие позиции занимают социально-экономические проблемы оплаты труда, цен на потребительские товары, инфраструктуры города и ЖКХ, а также бюрократизм местных властей. Исходя из измерения протестного потенциала граждан города Омска сделан вывод о низком уровне удовлетворенности жителей местной властью. Однако при этом протестный потенциал оценен как низкий, что может быть частично объяснено нарастающим отрицательным миграционным сальдо. В результате на основе проведенного исследования разработаны рекомендации по совершенствованию мониторинга и анализа факторов социальной напряженности в городе.
Ключевые слова: социальная напряженность, оценка социальной напряженности, факторы социальной напряженности, социальное самочувствие, протестный потенциал, доверие органам власти.
Работа выполнена по государственному заданию ОНЦ СО РАН в соответствии с Программой ФНИ ГАН на 2013-2020 годы (№ гос. рег. AAAA-A17-117041210229-2).
Научная специальность: 22.00.00 – социологические науки.