Estimating global land use change over the past 300 years: The HYDE Database
17
GLOBAL BIOGEOCHEMICAL CYCLES, VOL. 15, No. 2, PAGES 417-433, JUNE 2001 Estimating global land use changeover the past 300 years: The HYDE Database KeesKlein Goldewijk NationalInstitute of PublicHealth andtheEnvironment (RIVM), Bilthoven, The Netherlands Abstract. Testing against historical datais an important step for validating integrated models of globalenvironmental change. Owing to longtime lagsin the climate system, these models should aim the simulation of the landusedynamics for longperiods, i.e., spanning decades up to a century. Developing such models requires understanding of past andcurrent trends andis therefore strongly data dependent. For thispurpose, a history database of the global environment has been developed: HYDE. Thispaper describes andanalyzes parts of HYDE version 2.0, presenting historical population andlanduse patterns for the past300 years. Results suggest, among other things, a global increase of cropland areafrom 265 million ha in 1700 to 1471 million ha in 1990, while the areaof pasture hasincreased more than six fold from 524 to 3451 million ha. In general, the increase of man-made agricultural landtook place at the expense of natural grasslands andto a lesser extent of forests. Thereare differences between the several regions in the temporal pace of these landuseconversions. The temperate/developed regions of Canada, United States, USSR, andOceania appear to have hadtheir strongest increase during the 19thcentury, while most of the tropical/developing regions witnessed the largest landuse conversions at the endof the last century. Results of thisanalysis canbe used to testintegrated models of globalchange and are available at http://www.rivm.nl/env/int/hyde/. 1. Introduction It is beyonddoubtthat human activities have modified the naturalenvironment considerably. Nowadays it becomes clear that duringthe last centuries the intensityand scale of these modifications has increased significantly [Watson et al., 1996]. The consequences of these modifications to the global society-biosphere-climate system are often referred to as global change. The possibleimplications of global change have resulted in variousinternational efforts to identify the underlying driving forces. An example of such an effort is the International Human Dimensions of Global Environmental Change Programme(IHDP), which identifies four science projects. One of these projects, cosponsoredby the International Geosphere-Biosphere Programme (IGBP), is "Land-Use and Land-Cover Change (LUCC)," whose objectives are "to obtain a better understanding of land-use and land-cover changes (e.g., degradation,desertification, biodiversity loss) and of the physical and human driving forces behindthese processes" [ Turner et al., 1990]. Another effort is a core project of the IGBP called PAGES (Human Interactions in Past Environmental Changes), charged with providing a quantitativeunderstanding of the Earth's past climateand environment. Its focus3, the Human Impacts on Terrestrial Ecosystems(HITE) initiative, concentrates on Copyright 2001 by the American Geophysical Union. Paper number1999GB001232. 0886-6236/01/1999GB001232512.00 man-made land cover conversions over the last 300 years. HYDE fits very well in initiatives like the aforementioned, supporting their empirical base. Historical land cover conversions have resulted in significant emissions of greenhouse gases, such as carbon dioxide, to the atmosphere. Several attempts havebeenmade to quantify the emission fluxes, both on regional and global scales, resulting in different ways to assessthis issue. Houghton et al. [1983] developed an accounting model to analyze the response of terrestrial carbon storage to changes in land use [see also Houghton and Hackler,1995; Houghton, 1999]. The modeltracks the extent of land area,which is affected by land cover changes such as harvest and deforestation, by applying historical clearing estimates. [Esser and Overdieck,1991 ] developed the so-calledOsnabruck Biosphere Model (OBM). The OBM model is a budget model that is developed on a high-resolution grid. Each grid is characterized by a specific landcover type, climate andsoil.It represents changing land usein a fairly mechanistic way. In the model the demand for agricultural land is a function of global population pressure andstatistics onhistorical changes in agriculturalarea, and of productivity.However, it is assumed that most of the land cover conversions occur in the tropics. Richards and Flint [1994] present an extensive study of historical landusechanges in Southeast Asia for the period 1880-1980. Hall [1995] developed a series of algorithms to represent (1) thetendency to develop ("nibble away at") land next to land that was already developed; (2) thejumping over of relative unfavorablelocations;and (3) the patterns and rates of land-use change caused by population density, 417
Transcript of Estimating global land use change over the past 300 years: The HYDE Database

GLOBAL BIOGEOCHEMICAL CYCLES, VOL. 15, No. 2, PAGES 417-433, JUNE 2001
Estimating global land use change over the past 300 years: The HYDE Database
Kees Klein Goldewijk National Institute of Public Health and the Environment (RIVM), Bilthoven, The Netherlands
Abstract. Testing against historical data is an important step for validating integrated models of global environmental change. Owing to long time lags in the climate system, these models should aim the simulation of the land use dynamics for long periods, i.e., spanning decades up to a century. Developing such models requires understanding of past and current trends and is therefore strongly data dependent. For this purpose, a history database of the global environment has been developed: HYDE. This paper describes and analyzes parts of HYDE version 2.0, presenting historical population and land use patterns for the past 300 years. Results suggest, among other things, a global increase of cropland area from 265 million ha in 1700 to 1471 million ha in 1990, while the area of pasture has increased more than six fold from 524 to 3451 million ha. In general, the increase of man-made agricultural land took place at the expense of natural grasslands and to a lesser extent of forests. There are differences between the several regions in the temporal pace of these land use conversions. The temperate/developed regions of Canada, United States, USSR, and Oceania appear to have had their strongest increase during the 19th century, while most of the tropical/developing regions witnessed the largest land use conversions at the end of the last century. Results of this analysis can be used to test integrated models of global change and are available at http://www.rivm.nl/env/int/hyde/.
1. Introduction
It is beyond doubt that human activities have modified the natural environment considerably. Nowadays it becomes clear that during the last centuries the intensity and scale of these modifications has increased significantly [Watson et al., 1996]. The consequences of these modifications to the global society-biosphere-climate system are often referred to as global change. The possible implications of global change have resulted in various international efforts to identify the underlying driving forces. An example of such an effort is the International Human Dimensions of Global Environmental
Change Programme (IHDP), which identifies four science projects. One of these projects, cosponsored by the International Geosphere-Biosphere Programme (IGBP), is "Land-Use and Land-Cover Change (LUCC)," whose objectives are "to obtain a better understanding of land-use and land-cover changes (e.g., degradation, desertification, biodiversity loss) and of the physical and human driving forces behind these processes" [ Turner et al., 1990]. Another effort is a core project of the IGBP called PAGES (Human Interactions in Past Environmental Changes), charged with providing a quantitative understanding of the Earth's past climate and environment. Its focus 3, the Human Impacts on Terrestrial Ecosystems (HITE) initiative, concentrates on
Copyright 2001 by the American Geophysical Union.
Paper number 1999GB001232. 0886-6236/01/1999GB001232512.00
man-made land cover conversions over the last 300 years. HYDE fits very well in initiatives like the aforementioned, supporting their empirical base.
Historical land cover conversions have resulted in
significant emissions of greenhouse gases, such as carbon dioxide, to the atmosphere. Several attempts have been made to quantify the emission fluxes, both on regional and global scales, resulting in different ways to assess this issue. Houghton et al. [1983] developed an accounting model to analyze the response of terrestrial carbon storage to changes in land use [see also Houghton and Hackler, 1995; Houghton, 1999]. The model tracks the extent of land area, which is affected by land cover changes such as harvest and deforestation, by applying historical clearing estimates. [Esser and Overdieck, 1991 ] developed the so-called Osnabruck Biosphere Model (OBM). The OBM model is a budget model that is developed on a high-resolution grid. Each grid is characterized by a specific land cover type, climate and soil. It represents changing land use in a fairly mechanistic way. In the model the demand for agricultural land is a function of global population pressure and statistics on historical changes in agricultural area, and of productivity. However, it is assumed that most of the land cover conversions occur in the
tropics. Richards and Flint [1994] present an extensive study of historical land use changes in Southeast Asia for the period 1880-1980. Hall [1995] developed a series of algorithms to represent (1) the tendency to develop ("nibble away at") land next to land that was already developed; (2) the jumping over of relative unfavorable locations; and (3) the patterns and rates of land-use change caused by population density,
417
418 KLEIN GOLDEWIJK: 300 YEARS OF GLOBAL HISTORICAL LAND USE CHANGE
economy, and political factors. The model has been applied to regions as Costa Rica, Southeast Asia, and sub-Saharan tropical Africa. Recently, Ramankutty and Foley [1999] presented a similar study in which they reconstructed global historical crop cover for the period 1700-1992, based on contemporary land cover derived from satellite images (the DISCover project, Loveland and Belward [ 1997]), hindcasted with a combination of historical statistics and percentage cropland in a grid cell. Major differences with this study and Ramankutty and Foley [1999] are the following: (1) this study uses the DISCover IGBP legend classification for contemporary land cover, while Ramankutty and Foley [1999] use an aggregation of the Olson Global Ecosystem classes; (2) this study uses an adjusted version of BIOME for undisturbed natural land cover [Prentice et al., 1992; Leeroans and van den Born, 1994], while Ramankutty and Foley [1999] use a BIOME version of Haxeltine and Prentice [1996]; (3) this study explicitly deals with pasture land; and (4) the allocation of cropland areas is steered in this study by the presence of historical population densities, rather than by downscaling contemporary land use as in Ramankutty and Foley [1999].
This paper describes a database that could make a contribution in particular areas of global environmental assessments, with emphasis on land use patterns during the last 300 years. The database presents not only historical statistical information on a country basis but offers a spatial representation on a high-resolution grid of the results as well, which can be used by integrated models of global change.
2. General Background of HYDE
The HYDE database was originally designed for testing and validation of the IMAGE 2 model. This was the result of
the 2nd IMAGE Advisory Board Meeting [Solomon, 1994], with the reasoning that models used for integrated environment assessments, which make projections for the next hundred years, should also be able to simulate the last hundred years. The objective of the IMAGE 2 model is to fill in some multidisciplinary gaps in global change research by providing a disciplinary and geographic overview of the society-biosphere-climate system. This steers the regional breakdown of the model (Table 1) and subsequently the organization of the HYDE database. IMAGE simulates greenhouse-gas emissions stemming from various industrial activities, energy use, and land use. Data from 1970-1990 are used to initiate and calibrate the model runs. Different
assumptions on population, wealth, technology, and policy developments are evaluated for global change consequences for the period 1990-2100. The model has been used, amongst other things, as a tool for international climate negotiations and Intergovernmental Panel on Climate Change (IPCC) assessments [Alcamo et al., 1995; Watson et al., 1996]. To improve the accuracy and credibility of projections made with models such as IMAGE 2, it is crucial that they are tested against reliable data sets. Because a dynamic model like IMAGE 2 simulates trends, it has a need for time series of historical data. For this purpose, a database with historical data of the global environment (HYDE) was created [Klein Goldewo'k and Batties, 1995; 1997]. HYDE can be used to test global change models, covering both general topics such
as population, land use, livestock, gross domestic product, and value added of industry and/or services as well as specific data categories concerning energy/economy, atmosphere/ocean, and the terrestrial environment. These "driving forces for global environmental change" occur at several spatial and temporal scales and dimensions, and differ often among regiens. Therefore a geographically explicit modeling approach is required. Most data have been organized at the country level for the period 1890-1990, and where possible for the period 1700-1990. Some data are also available with geographic detail [Klein Goldewijk, 1997; Klein Goldewijk and Battjes, 1997].
3. From Statistics to Maps
3.1. Population as a Proxy for Agricultural Activity
Global population numbers have been relatively low for a long period of time. Estimated numbers from 8000 B.C. of 5- 10 million people increased very slowly with fluctuations to -500 million in 1600 A.D. [Grigg, 1974]. Globally, both relative and absolute increases were still very small until the 1700s. From that point onward human lifetimes prolonged, mainly due to better living conditions. Later, death rates began to decline, first in Europe and later also in America, Australia, and other colonial areas [Durand, 1974]. After World War II, population growth rates accelerated in the less developed regions (Africa, Asia, and Latin America). A summary of estimated global population numbers is presented in Table 2.
Population data on a country basis for the period 1950-1995 were derived from the 1996 Revision of the United Nations
World Population Prospects [United Nations, 1997]. Mitchell [ 1993, 1998a,b] provides country population estimates for most countries of the world for a long historical time path (1750- 1993). Another important source is Maddison [1994] who presents estimates of population numbers and Gross Domestic Product (GDP) for several countries for the period 1820-1992. In order to create a consistent data set, the historical country data points from Mitchell and Maddison and were scaled to match the United Nations data in 1950. Data gaps were filled in with a logistic curve. Country and regional totals obtained in this way (see Table 3) were checked against other available estimates.
The starting point for the global georeferenced historical population maps is the 0.5 ø x 0.5 ø degree longitude/latitude population density map of 1994 from the National Center for Geographic Information and Analysis (NCGIA) [Tobler et al., 1995]. The NCGIA data set was overlayed with the HYDE country borders, and grid cells of the NCGIA database belonging to countries as defined by HYDE were aggregated to country totals. The HYDE country totals were adjusted in order to equal the country totals of the United Nations population database. Finally, the population densities were scaled to a 0.5 ø x 0.5 ø latitude/longitude grid by using the historical country totals combined with the same population distribution as in the NCGIA database, under the assumption that high population density areas remain in the same place over time. Of course, this assumption places a bias on the distribution of past populated areas. Therefore, subnational data for large countries like

KLEIN GOLDEWIJK: 300 YEARS OF GLOBAL HISTORICAL LAND USE CHANGE 419

420 KLEIN GOLDEWIJK: 300 YEARS OF GLOBAL HISTORICAL LAND USE CHANGE
o .•._•
o
o
(.• (.• • (.• • (.•
o ,--½
o ,--½


422 KLEIN GOLDEWIJK: 300 YEARS OF GLOBAL HISTORICAL LAND USE CHANGE
Canada, United States, Mexico, Brazil, Argentina, India, China, and Australia derived from Mitchell [ 1993, 1998a,b] were used, to allow for at least some internal population changes. The results are presented in Plate 1.
3.2. Allocation of Agricultural Land
Conversion of land cover is an important issue in global change studies. Population growth has resulted in an ever increasing demand for food, which in its turn resulted in a worldwide expansion and intensification of cropland and pasture [Turner e! al., 1990]. This expansion took most of the time place at the cost of natural primary forests and grasslands. Although the emphasis is laid on tropical regions when looking at (recent) deforestation, the same processes occurred in the industrialized countries centuries ago. Before the great outward movement from the continent, Europeans had already colonized their continent vigorously and had cleared most forests during the Middle Ages [Williams, 1990]. The expanding population needed more food and took away parts of the forest to create arable land and pasture. At the same time there was an increase of wood demanding iron smelting, production of charcoal, mining, and shipbuilding activities. In European Russia the deforestation really took off during the 16th and 17th century, when slash-and-bum agriculture gave way to a more sedentary and intensive three- field farming system.
Starting point in this study for the land use estimates is the statistical database of the Food and Agricultural Organization of the United Nations (FAO) [FAO, 1996], which was considered most authorative. The categories "Arable Land and Permanent Crops" were used for cultivated land and "?ermanent Pasture" for pasture. The FAO presents for each country data for the period 1961-1994. Additionally, for the United States state level information on cropland area was used, as described by Ramankutty and Foley [1998] for the period 1850-1990 (N. Ramankutty personal communication, 2000). Data for the period 1700-1850 were estimated by taking into account the colonization of the different states over time, which resulted in different curves per state. For India, Sri Lanka, Bangladesh, Myanmar, Laos, Thailand, Vietnam, Brunei, Indonesia and the Philippines, estimated cropland areas from Richards and Flint [ 1994] were used for 1880, 1920, 1950, and 1980; the years in between were interpolated. The 1700 estimate for countries belonging to the regions of Latin America, South Asia, Former USSR, China, Pacific Developed, and Southeast Asia were scaled to match the totals as estimated by Richards [1990] and Klein Goldewijk and Battjes [1997]. The analysis of Richards [1990] is drawn from the original work of Houghton e! al. [ 1983 ], and Klein Goldewijk and Battjes [ 1997] added pasture estimates to the data of Richards [1990]. The rest of the countries in the world were scaled to match the global estimate of Richards [ 1990].
Estimates from Richards [ 1990] for the world, Houghton e! al. [1991] for Latin America, and Klein Goldewijk and Battjes [1997] for other regions have been used to estimate the change in pasture areas. Again, countries in one region were assumed to follow the same regional trend if no additional country specific data were available. Furthermore,
the former Soviet Republics Armenia, Azerbijan, Belarus, Estonia, Georgia, Latvia, Lithuania, Kazakstan, Kyrgyzstan, Moldovia, Russia, Tajikistan, Turkmenistan, Ukraine, and Uzbekistan were assumed to follow the same trend as the
former USSR. The assumption was made that the share of cropland of each republic relative to the total area of the USSR has remained constant over time between 1700 and the
present. The same applies to the republics of Slovenia, Croatia, Bosnia-Herzegovina, the former Yugoslav Republic of Macedonia, and the Federal Republic of Yugoslavia which follow the trend of former Yugoslavia, the Czech Republic and Slovakia which follow Czechoslovakia, and Ethiopia D?R and Eritrea which follow the trend of former Ethiopia.
3.2.1. Starting point: Initial land cover. Potential natural vegetation patterns are simulated with a modified version of the BIOME model (original version described by Prentice e! al. [1992]; with some modifications as presented by Leeroans and van den Born [1994], driven with climate from the IIASA climate database of Leemarts and Cramer [1991]). Global vegetation patterns can be derived by agglomerations of plant functional types, each having definable environmental constraints (temperature, moisture, etc.). This dynamic approach has the advantage that it can anticipate to climate change.
The initial map for agricultural land is based on a combination of a georeferenced data set and national land use statistics. Calibration criteria are that "(i) geographic patterns of agricultural land are consistent with the national statistics from the FAO [1996], (ii) it supports the computation of the transient vegetation response to climate change, and (iii) computed geographic patterns of individual crops and potential national vegetation resemble the patterns simulated in the Terrestrial Vegetation Model of IMAGE 2" [Alcamo e! al., 1998]. Initial agricultural land cover is derived from the DISCover land use data set, classified according to the International Geosphere Biosphere ?rogramme Global Land Cover Legend [Loveland and Belward, 1997]. The scheme consists of 17 classes, of which "Croplands" and "Urban and built-up" were given the same weight, and then used for allocation of the amount of "arable Land and ?ermanent
Crops" as presented by FAO. If the need for arable area could not be satisfied with these categories, the DISCover classes "Savannas" (9), "Grasslands" (10) and "Cropland/Natural Vegetation Mosaic" (14) were also given the same weight (but lower then the "Cropland" and "Urban and Built-up") and used to allocate the rest. This approach is somewhat different as given by Ramankutty and Foley [ 1999], where the DISCover data set classified under the Olson Global
Ecosystems (OGE) framework was used in combination with the use of BIOME-3 model of Haxeltine and Prentice [ 1996] to fill in regions dominated by land use.
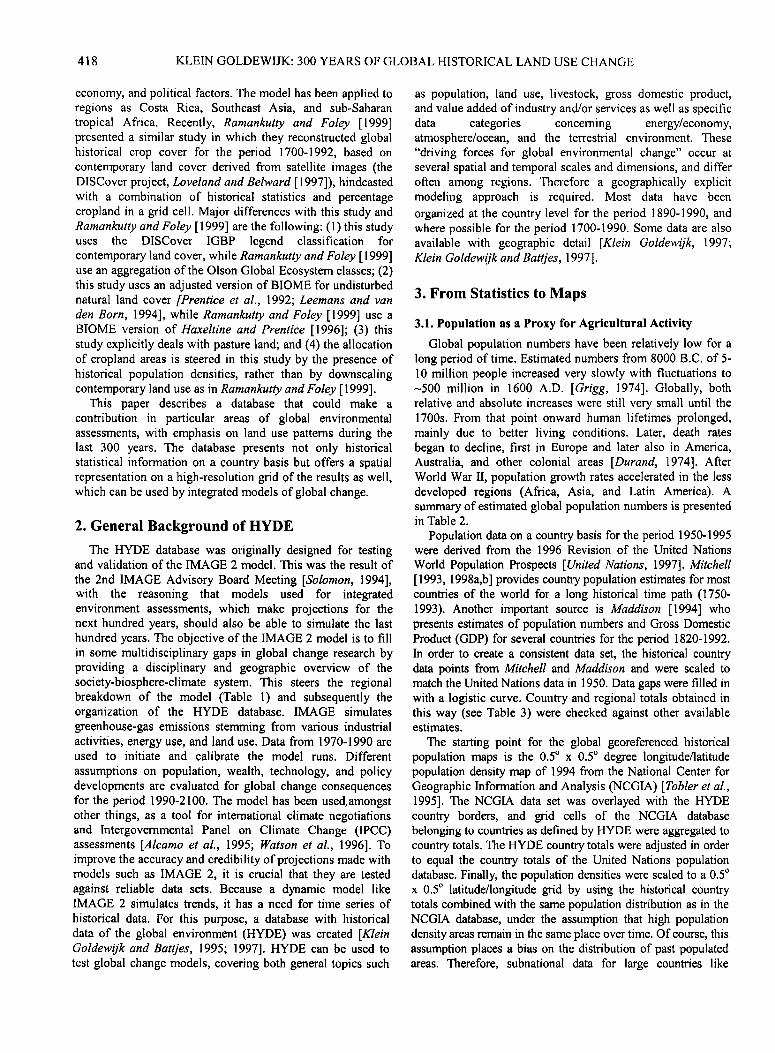
3.2.2. The allocation of cropland was done by applying the following rules. (1) The total amount of cropland on a sub-national (when available) or country scale was allocated according to historical population density maps (as described in section 3.1). The grid cells with the highest population densities were first assigned to cropland, then those with the second highest density, etc., until the total amount of cropland was allocated in that unit. (2) The allocation of cropland is restricted to the agricultural area as determined by the initial

KLEIN GOLDEWIJK: 300 YEARS OF GLOBAL HISTORICAL LAND USE CHANGE 423
land cover map, which is considered as being representative for present agricultural activity. This area is regarded as a maximum boundary for agricultural activities. Cropland was not allocated outside that area (see Figure 1).
3.2.3. The allocation of pasture was done by applying the following rules. (1) The total amount of pasture in a country or state was also allocated according to population density, while excluding those grid cells that were already allocated to cropland on the basis of the above-described rules (2) The allocation of cropland is restricted to the agricultural area as determined by the initial land cover map. This map serves as a maximum boundary were agricultural activities are assumed to be feasible (see Figure 1). A summary of the methods used to estimate historical land use is presented in Figure 2.
4. Results and Discussion
Results of the presented analys•s should be considered carefully as the study knows many uncertainties. It is very hard to compare between the several data sources because of the use of different classifications and methodologies. However, according to this study, the global area of cropland apparently has increased 5.5-fold in less than three centuries, from 265 Mha in 1700 to 1471 Mha in 1990 (which is equal to the FAO estimate, see Table 4). This is a lower estimate than Ramankutty and Foley [1999] who estimated 400 Mha in 1700 and 2000 Mha in 1990, but similar to the estimate of [ Williams, 1990] of 1400 Mha and the 1500 Mha estimate of [Richards, 1990], although both were for the year 1980. The
estimate of Matthews [1983] of 1760 Mha cropland in 1980 is somewhat higher. Compared to the original undisturbed global forest area, some 7% was cleared for agricultural purposes in 1700.
The global amount of pasture has also increased at a stunning rate during the last 300 years, from 524 Mha in 1700 to 3451 Mha in 1990 (a 6.6-fold increase, Table 5). Until 1700, some 6% of the natural undisturbed grasslands, steppe and savannas were already estimated to have been transformed into agricultural land; this number increased to 16% in 1850 and resulted in a total 49% loss in 1990. The
study of Ramankutty and Foley [ 1999] estimated losses of 3, 6, and 20%, respectively. Differences can be attributed to the fact that they did not include conversion to pasture. Especially in the temperate regions, large areas of natural grasslands were ploughed and converted to cropland (e.g., the prairies in the United States and steppe areas in the former USSR). Most of the tropical natural grasslands were converted into pasture for raising livestock (e.g., the campos in Brazil and the pampas in Argentina), or wild grazing animals were simply deposed by domestic herds (Subsaharan Africa). In some parts of the world pristine grasslands with no natural history of large herbivores (New Zealand and South America) were invaded by settlers and ranchers, encouraged by a growing market for beef and wool [Richards, 1986].
The increase in cropland has not been distributed evenly over the different regions. For example, Canada and the United States have experienced a relatively slow increase of their agricultural areas for a long time. This was merely due to the different agricultural practices of the indigenous people
Not used for agricultural activities 1 Used for agncultural activities
Based on:
- DISCover with IGBP legend; Loveland and Belward[1997]. - Statistics from FAO [1996].
Figure 1. Agricultural areas as defined by the IMAGE 2 model, based on the DISCover database with the IGBP legend classification and calibrated with FAO [ 1996] statistics.

424 KLEIN GOLDEWIJK: 300 YEARS OF GLOBAL HISTORICAL LAND USE CHANGE
Step 1' population density
Population density map of 1994 derived from Tobler et al. (1995)
Rule for historical population density map:
- Downscaling densities until country/state totals match the historical total estimate
Population density maps for the period 1700- 1994
1994
1950
1700
World Population Prospects, The 1996 Revision, United Nations Population Division, yearly national totals
Yearly (sub-)national totals from: International Historical Statistics
(Mitchell, 1993-1998) &
Country/state Census data (various sources)
&
Logistic curves for 'no data' and 'filling gaps'
Step 2: land use
Natural undisturbed land cover
computed by the BIOME model Current agricultural area based on DISCover (IGBP legend) & FAO (1996)
,
Current land use map
Set of rules for allocation cropland and pasture:
- Allocate cropland first according to population denstty maps until total amount of cropland per country/state is distributed
- No allocation outside initial agricultural area - Allocate pasture until total amount of pasture per country/state/s dtstributed, grid cells already allocated to cropland are excluded
Historical land use maps for 1700 - present
1961
_ • Historical land use estimates, per -•' country or state (several sources)
1700
Amount of cropland and pasture per country based on FAO (1996), and per state based on historical statistics
Figure 2. Scheme for calculations of historical land use.
before the colonization by European settlers, but once started, the expansion of agricultural land really took off after 1850. The area of cropland in both countries increased more than 70-fold in 300 years. Other regions with a considerable increase in cropland area are Oceania (25-fold, mainly due to Australia), Central America (15-fold), and Southeast Asia (l 1-fold). Some regions (Canada, United States, former USSR, Oceania) show a "peak" in their expansion during the 19th century (see Table 6), while most of the developing regions experienced their largest growth during the second half of the 20th century. See Plate 2 for a spatial representation of the results for 1700, 1800, 1900, and 1990. The regions with the lowest increase are OECD Europe and eastern Europe, but they still doubled their area of cropland. Increase of production in such regions has been apparently realized by improved management, better technology, and intensive use of artificial fertilizers rather than by expansion
of agricultural area. In absolute terms, the top three regions with the largest increase in cropland area are the former USSR (196 Mha), followed by the United States (184 Mha) and South Asia (162 Mha). However, it should be noted that for the period 1950-1990 the situation is quite different. USA, OECD Europe, eastern Europe, eastern Asia, and Japan show decreasing cropland areas, albeit small amounts. During this period, South America has known the largest absolute increase (50 Mha), followed by South East Asia (37 Mha), Oceania (25 Mha), and Western Africa (25 Mha).
According to HYDE, the clearing rates remained rather constant for a long period of time resulting in a loss of global forest area of 15% in 1850, but owing to continuous growth of the world population and colonization of the continents, this number has increased to 29% in 1990 (Table 7a and 7b). Ramankutty and Foley [1999] estimated somewhat lower forest loss rates, but the trend is similar (5% in 1700, 10% in

KLEIN GOLDEWIJK: 300 YEARS OF GLOBAL HISTORICAL LAND USE CHANGE 425


428 KLEIN GOLDEWIJK: 300 YEARS OF GLOBAL HISTORICAL LAND USE CHANGE
II

KLEIN GOLDEWIJK: 300 YEARS OF GLOBAL HISTORICAL LAND USE CHANGE 429
r
C

430 KLEIN GOLDEWIJK: 300 YEARS OF GLOBAL HISTORICAL LAND USE CHANGE
Table 7a. Comparison of Land Use Changes to Other Estimates in Absolute Terms
Reference Year Forest/ Steppe/ Shrubland Tundra/ Cropland Pasture
Woodland Savanna/ Hot Desert/
Grassland Ice Desert
Total
Matthews [1983] Pre-agricultural 61.5 33.9 13.0 23.1 0.9 1980 52.4 27.4 12.1 22.9 17.6
Richards [1990], after the original work of Houghton et al. [1983] b 1700 62.2 68.6 - - 2.7 1850 59.7 68.4 - - 5.4 1980 50.5 67.9 - - 15.0
132.4
132.4
133.4
133.4
133.4
Williams [! 990] 186O .... 5.7 1978 .... 14.2
Klein Goldewijk and Battjes [1997], after Richards [1990] 1700 62.2 63.3 - - 2.7 5.3 133.4 1850 59.7 60.6 - - 5.4 7.8 133.4 1980 50.5 34.5 - - 15.0 33.4 133.4
Ramankutty and Foley [!999] Undisturbed 55.3 33.4 17.9 23.6 0.0 - 130.1 1700 52.8 32.3 17.4 23.5 4.0 - 130.1 1850 49.9 31.4 17.1 23.5 8.2 - 130.1 1992 43.9 26.7 15.9 23.3 20.3 - 130.1
This Study Undisturbed 58.6 34.3 9.8 31.4 0.0 0.0 134.1 1700 54.4 32.1 8.7 31.1 2.7 5.2 134.1 1850 50.0 28.7 6.8 30.4 5.4 12.8 134.1 1990 41.5 17.5 2.5 26.9 14.7 31.0 134.1
a Estimates are given in million km 2. Note that the amount of pasture after 1970 does not correspond completely with the statistical input. This is due to the allocation scheme. Because the initial land cover map was calibrated for the IMAGE toward 1970 the amount of pasture after 1970 exceeds for some countries the area in which it can be allocated resulting in some areas a fraction of pasture which can not be allocated (10% of world total in 1990 mostly in the United States, Eastern Africa, Middle East and Southeast Asia).
b Pasture is here included in the Savanna/Grassland categorie.
Table 7a. Comparison of Land Use Change Results to Other Estimates in Absolute Terms.
1850, and 21% in 1990). Natural forests were cleared at a mass scale in return for wood and arable land (e.g., deltaic rain forests of Burma, the mixed deciduous-coniferous of European USSR, the "mallee scrub" forests of South Australia) or replaced by plantations (Atlantic coastal forests in Brazil). Also, numerous wetlands have been drained (the Midwest of the United States, USSR, Finland, Southeast Asia), and (semi)arid areas have been brought under ambitious irrigation schemes and became suitable for growing crops, for example Midwest United States, India, Mexico, South Africa, and Australia [Richards, 1986].
The expansion of pasture in the USA region has been as vigorous as the increase in cropland. From 2.5 Mha in 1700 it has increased almost 100-fold to 239 Mha in 1990. Other
regions which experienced a substantial increase are Japan
(45-fold increase from 0.014 Mha in 1700 to 0.647 Mha in 1990), Canada (32-fold from 0.9 to 28 Mha) and Oceania (15- fold from 29 Mha to 430 Mha in 1990). Again, the increase of pasture area in absolute terms results in a different ranking. The top three regions are East Asia with a total increase of 442 Mha over the period 1700 - 1990, followed by Oceania (401 Mha), and South America (398 Mha).
A number of uncertainties can be identified to the approach chosen here to estimate historical land cover. First it is
questionable whether population density is an acceptable proxy for the allocation of cropland and pasture. It seems reasonable to assume that where people are living, there always has been some sort of agricultural activity, especially in the past. With the current availability of historical population numbers, on the national scale as well as on the

KLEIN GOLDEWIJK: 300 YEARS OF GLOBAL HISTORICAL LAND USE CHANGE 431
Table 7b. Comparison of Land Use Changes to Other Estimates in Percentages
Period Forest/ Steppe/ Shrubland, % Tundra/ Cropland, % Pasture, %
Woodland, % Savanna/ Hot Desert/ Grassland, % Ice Desert, %
Pre b - 1980 Matthews [! 983]
- 14.9 33.9 13.0 23.1 0.9
1700 - 1850
1850 - 1980
1700 - 1980
Richards [1990], after the original work of Houghton et al. [1983] -4.0 -0.3 - - 102.6
-15.3 -0.7 - - 179.5
-18.7 -1.0 - - 466.4
1860 - 1978
Williams [i 990] - - 148.9
1700 - 1850
1850 - 1990
1700 - 1990
Klein Goldewijk and Battjes [1990], after Richards [1990] -4.0 -4.4 - - 102.6
-15.3 -43.0 - - 179.5
-18.7 -45.5 - - 466.4
48.7
326.5
534.0
Ramankutty and Foley [1999] Und. c - 1700 -4.5 -3.1 -2.5 -0.2 Und. - 1850 -9.7 -6.0 -4.2 -0.4 Und.- 1992 -20.5 -20.1 -10.9 -1.1 1700 - 1850 -5.4 -3.0 - 1.7 -0.2 1850- 1992 -12.0 -15.0 -7.0 -0.7 1700 - 1992 - 16.8 - 17.5 -8.6 -0.9
103.0
147.0
401.2
Und.- 1700
Und.- 1850
Und.- 1990
1700- 1850
1850 - 1990
1700 - 1990
This Study -7.2 -6.4 - 11.3 - 1.1
-14.8 -16.1 -30.8 -3.1
-29.2 -48.8 -74.4 -14.4
-8.2 -10.3 -22.0 -2.0
-16.9 -39.0 -63.1 -11.6
-23.7 -45.3 -71.2 -13.4
100.7 145.3
171.6 141.9
444.5 493.5
Total, %
Estimates are given in %.
Pre - Pre-agricultural.
Und. = Undisturbed Potential Vegetation.
Table 7b. Comparison of Land Use Change Results to Other Estimates in Percentages.
subnational scale, this approach has the advantage that some migration patterns can be reproduced (e.g., with state level information United States), in contrast to downscaling present agricultural areas [e.g., Ramankutty and Foley, 1999]. Second the allocation of pasture to land cover types such as savanna and grassland/steppe can also result in unforeseen difficulties. For example some grass-/shrubland areas in southern Africa are known to be rampant by plants that are not digestible for cattle and therefore very unlikely to be used as pasture (R. Leemans, personal communication, 2000). Third the scarcity of data for historical land use estimates, in particular for the 19th and 18th century, is a serious problem. In addition, the different definitions and classifications of land use classes
and the changing country boundaries (e.g., as result of wars,
independency of countries) are a major obstacle to provide consistent time series (see e.g., Ramankutty and Foley [1999] for the United States). Illustrative to that is the fact that even today many national census estimates differ quite often with, for example, the FAO estimates. Solving the problem of lack of national data by downscaling a group of country totals in a region to match a regional number seems hardly acceptable but is often the only way of getting a first-order estimate. Fourth using initial land use/cover maps from the DISCover data set, calibrated with the FAO statistics, can be questionable as well. Satellite-based data can be very difficult to use for some regions. For example, according to the analysis of Veldkamp et al. [1998], the DISCover data set classifies large parts of Europe as "cropland/natural mosaic".

432 KLEIN GOLDEWIJK: 300 YEARS OF GLOBAL HISTORICAL LAND USE CHANGE
This makes it very difficult to use such promising data sets for studies like this one.
5. Conclusions
A good knowledge of historic land use trends is important to understand current and future developments. Such knowledge can only emerge when historic databases with adequate coverage and resolution are developed and being distributed freely to the scientific community. This attempt to create a global georeferenced database has its obvious limitations and inconsistencies, but the structure of the database is clear, and the data are easily accessible, while providing an independent estimate for historical land use conversions. The scientific community involved in global environmental change modeling could clearly benefit from the translation of more historical statistical information into a
digital (spatial) format. Therefore a better access of researchers to national and sub-national statistics, especially on land use/cover, would be of great importance. Inclusion of more subnational land use data, such as location and size of cities, could still make further improvements to this database.
Acknowledgements. The author wishes to thank Lex Bouwman, Eric Kreileman, Rik Leemans, Bert de Vries, and Jaap van Woerden of RIVM for helping out with the computations and useful comments about the manuscript, and Navin Ramankutty from the Climate, People, and Environment Program (CPEP), Institute of Environmental Studies, University of Wisconsin, Madison, for generously providing historical state level information for the USA.
References
Alcamo, J., G.J.J. Kr½ilcman, and M. Krol, An overview of IMAGE 2.1. Brochure of the National Institute of Public Health and the
Environment (RIVM), Bilthovcn, The Netherlands, 1995. Alcamo, J., R. Lecmans, and E. Kr½ileman, (Eds.), Global Change
Scenarios of the 21th Century, Pergamon, Tarrytown, N.Y., 1998. Bogue, D.J., The Population of the United States, Historical Trends
and Future Projections, The Free Press, New York, 1985. Dcmeny, P., Population, in The Earth as Transformed by Human
Action, edited by B.L. Turner II ½t al., pp. 41-54, Cambridge Univ. Press, New York, 1990.
Durand, J.D., Historical Estimates of Worm Population.' An Evaluation, Analytical and Tech. Rcp. No. 10, Table 2, Univ. of Penn., Population Center, 1974.
Durand, J.D., Historical estimates of world population. Pop. and Der. Rev., 3(3), 253-296, 1977.
Esser, G., and D. Overdi½ck (Eds.), Osnabrt•ck Biosphere Model.' Structure, Construction, Results. Modern Ecology, Basic and Applied Aspects Ser., Elsevier Sci., New York, 1991.
Food and Agricultural Organization of the United Nations (FAO), FAOSTAT PC software, Rome, 1996.
Grigg, D.B., The Agricultural Systems of The WorM.' An Evolutionary Approach, Cambridge Univ. Press, New York, 1974.
Grigg, D., The industrial revolution and land transformation, in Land Tranformation in Agriculture, edited by M.G. Wolman and F.G.A. Fournicr, pp. 79-109, John Wiley, New York, 1987.
Hall, C.A.S., Modeling spatial and temporal patterns of tropical land use change. •. Biogeogr. 22, 2547-2551, 1995.
Haub, C., How many people have ever lived on Earth?, Population Today, February, 5, 1995.
Haxeltine, A., and C.I. Prentice, An equilibirium terrestrial biosphere model based on ecophysiological constraints, resource availability, and competition among plant functional types, Global Biogeochem. Cycles, ! 0(4), 693-709, 1996.
Houghton, R.A., The annual net flux of carbon to the atmosphere from changes in land use 1850-1990, Tellus, Ser.51B, 298-313, 1999.
Houghton, R.A., and J.L. Hackler, Continental scale estimates of the biotic carbon flux from land cover change: 1850- 1980, Num. Datapackage-050, Carbon Dioxide Infor. Anal. Cent., Oak Ridge Natl. Lab., Oak Ridge, Tenn., 1995.
Houghton, R.A., J.E. Hobbie, J.M. Melillo, B. Moore, B.J. Peterson, G.R. Shaver, and G.M. Woodwell, Changes in the carbon content of terrestrial biota and soils between 1860 and 1980: A net release
of CO2 to the atmosphere. Ecol. Monogr., 53(3), 235-262, 1983. Houghton, R.A., Lefkowitz, D.S. and Skole, D.L., Changes in the
landscape of Latin America between 1850 and 1985. I. Progressive loss of forests, Forest Ecology and Management, 38, 143-172, 1991.
Klein Goldewijk, C.G.M., and J.J. Batties, The IMAGE 2 hundred year (1890-1990) data base of the global environment (HYDE). Rep. 482523001, National Institute of Public Health and the Environment (RIVM), Bilthoven, The Netherlands, 1995.
Klein Goldewijk, C.G.M., and J.J. Battjes, A hundred year (1890 - 1990) database for integrated environmental assessments (HYDE, version 1.1). Rep. 422514002, National Institute of Public Health and the Environment (RIVM), Bilthoven, The Netherlands, 1997.
Klein Goldewijk, K., The role of historical GIS data in integrated models of global change, in Proceedings of the Third Joint European Conference and Exhibition on Geographical Information, pp. 317-328, IOS Press, Vienna, 1997.
Leemans, R., and W. Cramer, The IIASA database for mean monthly values of temperature, precipitation and cloudiness on a global terrestrial grid, Rep. RR-91-18, International Institute for Applied Systems Analysis (IIASA), Laxenburg, Austria, 1991.
Leemans, R., and G.J. van den Born, Determining the potential global distribution of natural vegetation, crops and agricultural productivity, l, Vat. Air Soil Pollut., 76(1-2), 133-162, 1994.
Loveland, T.R., and A.S. Belward, The IGBP-DIS global lkm land cover data set, DISCover: first results. Int. J. of Remote Sens., 18, 3289-3295, 1997.
Matthews, E., Global vegetation and land use: New high-resolution data bases for climate studies, d. Clim., Appl. Meteorol., 22, 474- 487, 1983.
Maddison, A., Monitoring the l, Vorld Economy, Organisation for Economic Co-operation and Development (OECD), Paris. 1994.
McEvedy, C. and R. Jones, Atlas of Worm Population History, pp. 368, Penguin, London, 1978.
Merrick, T.W., World population in transition, Population Bulletin, 41(2), 53, 1986.
Mitchell, B.R., International Historical Statistics, The Americas: 1750 - 1988, pp. 817, MacMillan, Indianapolis, Ind., 1993.
Mitchell, B.R., International historical statistics Europe.' 1750 - 1993, pp. 959, Fourth Ed., MacMillan, Indianapolis, Ind., 1998a.
Mitchell, B.R., International Historical Statistics, Africa, Asia & Oceania.' 1750 - 1993, pp. 1113, Third Ed., MacMillan, Indianapolis, Ind., 1998b.
Oxford University, Oxford Economic Atlas of the WorM, New York., 1972.
Prentice, I.C., W. Cramer, S.P. Harrison, R. Leemans, R.A. Monserud, A.M. and Solomon, A global biome model based on plant physiology and dominance, soil properties and climate, J. Biogeogr., 19, 117-134, 1992.

KLE1N GOLDEWIJK: 300 YEARS OF GLOBAL HISTORICAL LAND USE CHANGE 433
Ramankutty, N. and J.A. Foley, Estimating historical changes in global land cover: Croplands from 1700 to 1992. Global Biogeochem. Cycles, 13(4), 997-1027, 1999.
Richards, J.F., World environmental history and economic development, in Sustainable Development of The Biosphere, edited by W.C. Clark and R.E. Munn, pp. 53-73, Cambridge Univ. Press, New York, 1986.
Richards, J.F., Land transformation, in The Earth as Transformed by Human Action, edited by B.L. Turner II et al., pp. 163-178, Cambridge Univ. Press, New York, 1990.
Richards, J.F., and E. Flint, historic land use and carbon estimates for South and Southeast Asia 1880-1980, Data set NDP-046 CDIAC/ORNL, Carbon Dioxide Infor. Anal. Cent., Oak Ridge Natl. Lab., Oak Ridge, Tenn., 1994.
Solomon, A. (Ed.), Report from the IMAGE 2 advisory board meeting in Amsterdam, 20-22 June 1994. NRP Report no. 00-13, Nat. Res. Prog. on Global Air Pollut. and Clim. Change, Bilthoven, The Netherlands, 1994.
Stern, D.I., and R.K. Kaufmann, Estimates of global anthropogenic sulphate emissions 1860-1993, Working paper series 9602, Cent. for Energy and Env. Stud., Boston Univ., Boston, Mass., 1996.
Thomlinson, J.R., M.I. Serrano, T.D. Lopez, T.M. Aide, and J.K. Zimmerman, Land-use dynamics in a post-agricultural Puerto Rican landscape (1936-1988). Biotropica, 28(4 Part A), 525-536, 1996.
Tobler, W., U. Deichmann, J. Gottsegen, and K. Maloy, The global demography project. Tech. Rep. TR-95-6, National Center for Geographic Information and Analysis (NCGIA), Santa Barbara, California, 1995.
Turner, B.L.II., W.C. Clark, R.W. Kates, J.F. Richards, J.T. Mathews, and W.B. Meyer (Eds), The Earth as Transformed by Human Action, pp. 713, Cambridge Univ. Press, New York, 1990.
Tuve, G.L., Energy, environment, population, and food, pp. 264, Wiley-Interscience, New York, 1976.
United Nations, Long-range world population projections: Two centuries of population growth, 1950-2150, rep. New York. 1992.
United Nations, World Population Prospects, 1950 - 2050, The 1994 Revision, Rep. ST/ESA/SER.A/145, UN Population Division, New York. 1995.
United Nations, World Population Prospects, 1950 - 2050, The 1996 Revision. rep. UN Population Division, New York. 1997.
Veldkamp, J.G., C. Heunks, V.F. van Katwijk, M. Barkhof, C.A. Muecher, and B.J. ten Brink, Towards an improved methodology for pan-European land cover classification, Report NRSP-2 no. 98-06, National Institute of Public Health and the Environment (RIVM), Bilthoven, The Netherlands, 1998.
Watson, R., M.C. Zinyowera, and R.H. Moss, (Eds.), Climate Change 1995. Impacts, adaptations and mitigation of climate change: scientific-technical analysis, pp. 878, Cambridge Univ. Press, New York, 1996.
Williams, M., Forests. in The Earth as Transformed by Human Action, edited by B.L. Turner II et al., pp. 179-202, Cambridge Univ. Press, New York, 1990.
Winkler Prins, De grote Winklet Prins Wereldatlas. Elsevier Sci., New York, 1987.
Woytinsky, W.S., and E.S. Woytinsky, World Population and Production, The Lord Baltimore Press, New York, 1953.
World Resources Institute (WRI), World Resources, 1986-1987, Basic Books, New York, 1987.
K. Klein Goldewijk, National Institute of Public Health and the Environment (RIVM), P.O. Box 1, 3720 BA, Bilthoven, The Netherlands. (kees.klein. goldewij k•rivm.nl).
(Received September 20, 1999; revised February 9, 2000; accepted May 26, 2000)