Estimating glacial western Pacific sea-surface temperature: methodological overview and data...
14
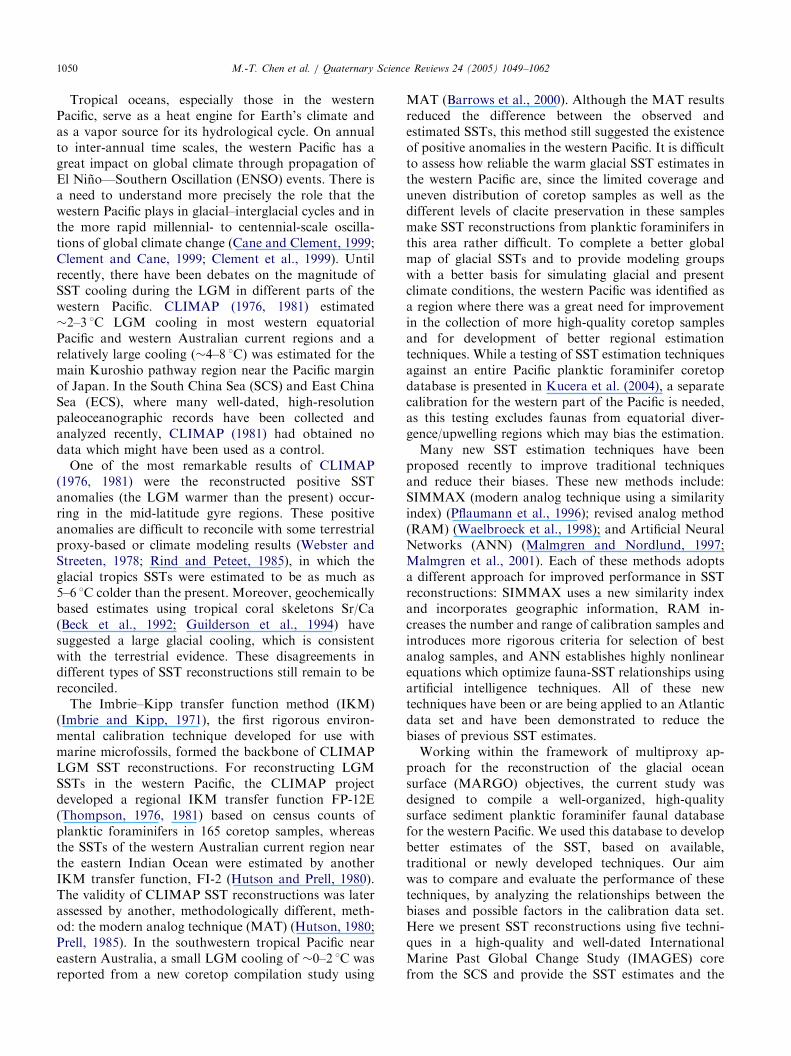
Quaternary Science Reviews 24 (2005) 1049–1062 Estimating glacial western Pacific sea-surface temperature: methodological overview and data compilation of surface sediment planktic foraminifer faunas M.-T. Chen a, , C.-C. Huang a , U. Pflaumann b , C. Waelbroeck c , M. Kucera d a Institute of Applied Geosciences, National Taiwan Ocean University, Keelung 20224, Taiwan b Institut fu¨r Geowissenschaften, Universita¨t Kiel, Olshausenstr. 40-60, 24118 Kiel, Germany c Laboratoire des Sciences du Climat et de l’Environnement, Laboratoire mixte CNRS-CEA, Domaine du CNRS, Gif-sur-Yvette, France d Department of Geology, Royal Holloway, University of London, Egham, Surrey TW20 0EX, UK Received 24 October 2003; accepted 15 July 2004 Abstract We present a detailed comparison of five ‘‘transfer function’’ techniques calibrated to reconstruct sea-surface temperature (SST) from planktic foraminifer counts in western Pacific surface sediments. The techniques include the Imbrie–Kipp method (IKM), modern analog technique (MAT), modern analog technique with similarity index (SIMMAX), revised analog method (RAM), and the artificial neural network technique (ANN). The calibration is based on a new database of 694 census counts of planktic foraminifers in coretop samples from the western Pacific, compiled under a cooperative effort within the MARGO (multiproxy approach for the reconstruction of the glacial ocean surface) project. All five techniques were used to reconstruct SST variation in a well-dated Holocene to last glacial maximum interval in core MD972151 from the southern South China Sea (SCS) to evaluate the magnitude of cooling in the western tropical Pacific during the LGM. Our results suggest that MAT, SIMMAX, RAM and ANN show a similar level of performance in SST estimation and produce p1 1C uncertainties in coretop SST calibrations of the western Pacific. When applying these techniques to the downcore faunal record, the IKM, which performed significantly worst in the calibration exercise, produced glacial SST estimates similar to present-day values, whereas the other four techniques all indicated 1 1C cooler glacial SST. Because of their better performance in the calibration dataset, and because of the convergence among the techniques in the estimated magnitude of glacial cooling in the studied core, we conclude that MAT, SIMMAX, RAM and ANN provide more robust planktic foraminifer paleo-SST estimates than traditional IKM techniques in western Pacific paleoceano- graphic studies. r 2004 Elsevier Ltd. All rights reserved. 1. Introduction Foraminifers growing in the oceans provide some of the richest paleoclimate archives in the world. For the purpose of reconstructing past sea surface temperatures (SSTs), planktic foraminifer faunas are particularly useful paleoclimate proxies because they are widely distributed and are abundant enough for quantitative and statistical analysis. The first extensive application of planktonic foraminifers in paleoclimatology was the pioneering study by CLIMAP (1976) in which the distribution data of planktic foraminifer faunal assem- blages and their relationships with SSTs were used for predicting past surface ocean-climate patterns during the last glacial maximum (LGM). Despite an intensive effort to develop new climatic and geochemical proxies for reconstructions of glacial surface ocean conditions, planktic foraminifer faunas continue to play an impor- tant role in providing essential information on past SSTs and for inferring water mass and circulation changes. ARTICLE IN PRESS 0277-3791/$ - see front matter r 2004 Elsevier Ltd. All rights reserved. doi:10.1016/j.quascirev.2004.07.013 Corresponding author. Tel.: +886-2-2462-2192x6503; fax: +886- 2-2462-5038. E-mail address: [email protected] (M.-T. Chen).
-
Upload
independent -
Category
Documents
-
view
2 -
download
0
Transcript of Estimating glacial western Pacific sea-surface temperature: methodological overview and data...
ARTICLE IN PRESS
0277-3791/$ - se
doi:10.1016/j.qu
�Correspond
2-2462-5038.
E-mail addr
Quaternary Science Reviews 24 (2005) 1049–1062
Estimating glacial western Pacific sea-surface temperature:methodological overview and data compilation of surface sediment
planktic foraminifer faunas
M.-T. Chena,�, C.-C. Huanga, U. Pflaumannb, C. Waelbroeckc, M. Kucerad
aInstitute of Applied Geosciences, National Taiwan Ocean University, Keelung 20224, TaiwanbInstitut fur Geowissenschaften, Universitat Kiel, Olshausenstr. 40-60, 24118 Kiel, Germany
cLaboratoire des Sciences du Climat et de l’Environnement, Laboratoire mixte CNRS-CEA, Domaine du CNRS, Gif-sur-Yvette, FrancedDepartment of Geology, Royal Holloway, University of London, Egham, Surrey TW20 0EX, UK
Received 24 October 2003; accepted 15 July 2004
Abstract
We present a detailed comparison of five ‘‘transfer function’’ techniques calibrated to reconstruct sea-surface temperature (SST)
from planktic foraminifer counts in western Pacific surface sediments. The techniques include the Imbrie–Kipp method (IKM),
modern analog technique (MAT), modern analog technique with similarity index (SIMMAX), revised analog method (RAM), and
the artificial neural network technique (ANN). The calibration is based on a new database of 694 census counts of planktic
foraminifers in coretop samples from the western Pacific, compiled under a cooperative effort within the MARGO (multiproxy
approach for the reconstruction of the glacial ocean surface) project. All five techniques were used to reconstruct SST variation in a
well-dated Holocene to last glacial maximum interval in core MD972151 from the southern South China Sea (SCS) to evaluate the
magnitude of cooling in the western tropical Pacific during the LGM. Our results suggest that MAT, SIMMAX, RAM and ANN
show a similar level of performance in SST estimation and produce p1 1C uncertainties in coretop SST calibrations of the western
Pacific. When applying these techniques to the downcore faunal record, the IKM, which performed significantly worst in the
calibration exercise, produced glacial SST estimates similar to present-day values, whereas the other four techniques all indicated
�1 1C cooler glacial SST. Because of their better performance in the calibration dataset, and because of the convergence among the
techniques in the estimated magnitude of glacial cooling in the studied core, we conclude that MAT, SIMMAX, RAM and ANN
provide more robust planktic foraminifer paleo-SST estimates than traditional IKM techniques in western Pacific paleoceano-
graphic studies.
r 2004 Elsevier Ltd. All rights reserved.
1. Introduction
Foraminifers growing in the oceans provide some ofthe richest paleoclimate archives in the world. For thepurpose of reconstructing past sea surface temperatures(SSTs), planktic foraminifer faunas are particularlyuseful paleoclimate proxies because they are widelydistributed and are abundant enough for quantitative
e front matter r 2004 Elsevier Ltd. All rights reserved.
ascirev.2004.07.013
ing author. Tel.: +886-2-2462-2192x6503; fax: +886-
ess: [email protected] (M.-T. Chen).
and statistical analysis. The first extensive application ofplanktonic foraminifers in paleoclimatology was thepioneering study by CLIMAP (1976) in which thedistribution data of planktic foraminifer faunal assem-blages and their relationships with SSTs were used forpredicting past surface ocean-climate patterns during thelast glacial maximum (LGM). Despite an intensive effortto develop new climatic and geochemical proxies forreconstructions of glacial surface ocean conditions,planktic foraminifer faunas continue to play an impor-tant role in providing essential information on past SSTsand for inferring water mass and circulation changes.
ARTICLE IN PRESSM.-T. Chen et al. / Quaternary Science Reviews 24 (2005) 1049–10621050
Tropical oceans, especially those in the westernPacific, serve as a heat engine for Earth’s climate andas a vapor source for its hydrological cycle. On annualto inter-annual time scales, the western Pacific has agreat impact on global climate through propagation ofEl Nino—Southern Oscillation (ENSO) events. There isa need to understand more precisely the role that thewestern Pacific plays in glacial–interglacial cycles and inthe more rapid millennial- to centennial-scale oscilla-tions of global climate change (Cane and Clement, 1999;Clement and Cane, 1999; Clement et al., 1999). Untilrecently, there have been debates on the magnitude ofSST cooling during the LGM in different parts of thewestern Pacific. CLIMAP (1976, 1981) estimated�2–3 1C LGM cooling in most western equatorialPacific and western Australian current regions and arelatively large cooling (�4–8 1C) was estimated for themain Kuroshio pathway region near the Pacific marginof Japan. In the South China Sea (SCS) and East ChinaSea (ECS), where many well-dated, high-resolutionpaleoceanographic records have been collected andanalyzed recently, CLIMAP (1981) had obtained nodata which might have been used as a control.
One of the most remarkable results of CLIMAP(1976, 1981) were the reconstructed positive SSTanomalies (the LGM warmer than the present) occur-ring in the mid-latitude gyre regions. These positiveanomalies are difficult to reconcile with some terrestrialproxy-based or climate modeling results (Webster andStreeten, 1978; Rind and Peteet, 1985), in which theglacial tropics SSTs were estimated to be as much as5–6 1C colder than the present. Moreover, geochemicallybased estimates using tropical coral skeletons Sr/Ca(Beck et al., 1992; Guilderson et al., 1994) havesuggested a large glacial cooling, which is consistentwith the terrestrial evidence. These disagreements indifferent types of SST reconstructions still remain to bereconciled.
The Imbrie–Kipp transfer function method (IKM)(Imbrie and Kipp, 1971), the first rigorous environ-mental calibration technique developed for use withmarine microfossils, formed the backbone of CLIMAPLGM SST reconstructions. For reconstructing LGMSSTs in the western Pacific, the CLIMAP projectdeveloped a regional IKM transfer function FP-12E(Thompson, 1976, 1981) based on census counts ofplanktic foraminifers in 165 coretop samples, whereasthe SSTs of the western Australian current region nearthe eastern Indian Ocean were estimated by anotherIKM transfer function, FI-2 (Hutson and Prell, 1980).The validity of CLIMAP SST reconstructions was laterassessed by another, methodologically different, meth-od: the modern analog technique (MAT) (Hutson, 1980;Prell, 1985). In the southwestern tropical Pacific neareastern Australia, a small LGM cooling of �0–2 1C wasreported from a new coretop compilation study using
MAT (Barrows et al., 2000). Although the MAT resultsreduced the difference between the observed andestimated SSTs, this method still suggested the existenceof positive anomalies in the western Pacific. It is difficultto assess how reliable the warm glacial SST estimates inthe western Pacific are, since the limited coverage anduneven distribution of coretop samples as well as thedifferent levels of clacite preservation in these samplesmake SST reconstructions from planktic foraminifers inthis area rather difficult. To complete a better globalmap of glacial SSTs and to provide modeling groupswith a better basis for simulating glacial and presentclimate conditions, the western Pacific was identified asa region where there was a great need for improvementin the collection of more high-quality coretop samplesand for development of better regional estimationtechniques. While a testing of SST estimation techniquesagainst an entire Pacific planktic foraminifer coretopdatabase is presented in Kucera et al. (2004), a separatecalibration for the western part of the Pacific is needed,as this testing excludes faunas from equatorial diver-gence/upwelling regions which may bias the estimation.
Many new SST estimation techniques have beenproposed recently to improve traditional techniquesand reduce their biases. These new methods include:SIMMAX (modern analog technique using a similarityindex) (Pflaumann et al., 1996); revised analog method(RAM) (Waelbroeck et al., 1998); and Artificial NeuralNetworks (ANN) (Malmgren and Nordlund, 1997;Malmgren et al., 2001). Each of these methods adoptsa different approach for improved performance in SSTreconstructions: SIMMAX uses a new similarity indexand incorporates geographic information, RAM in-creases the number and range of calibration samples andintroduces more rigorous criteria for selection of bestanalog samples, and ANN establishes highly nonlinearequations which optimize fauna-SST relationships usingartificial intelligence techniques. All of these newtechniques have been or are being applied to an Atlanticdata set and have been demonstrated to reduce thebiases of previous SST estimates.
Working within the framework of multiproxy ap-proach for the reconstruction of the glacial oceansurface (MARGO) objectives, the current study wasdesigned to compile a well-organized, high-qualitysurface sediment planktic foraminifer faunal databasefor the western Pacific. We used this database to developbetter estimates of the SST, based on available,traditional or newly developed techniques. Our aimwas to compare and evaluate the performance of thesetechniques, by analyzing the relationships between thebiases and possible factors in the calibration data set.Here we present SST reconstructions using five techni-ques in a high-quality and well-dated InternationalMarine Past Global Change Study (IMAGES) corefrom the SCS and provide the SST estimates and the

ARTICLE IN PRESSM.-T. Chen et al. / Quaternary Science Reviews 24 (2005) 1049–1062 1051
uncertainty ranges of the estimates for the Holocene(0–4 ka) and LGM (19–23 ka) intervals (EPILOGchronozone) (Mix et al., 2001).
2. Data and methods
2.1. Calibration data sets
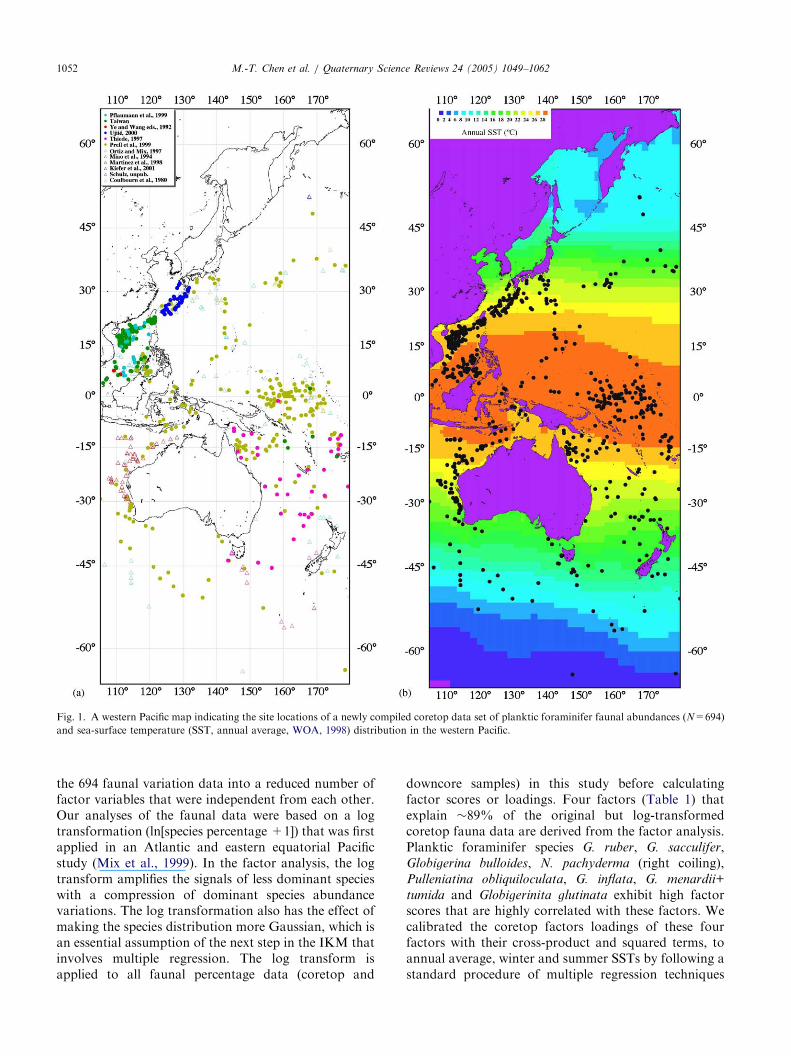
To obtain a data set of high-quality, well-organizedcoretop planktic foraminifer fauna data in surfacesediments from the western Pacific, we cooperated asone of the MARGO working groups and compiled awestern Pacific modern planktic foraminifera data basecomposed of 694 samples (data available on the internet[http://www.pangaea.de/Projects/MARGO/data.html]).The set of 694 coretop data used in this study hasbenefited from the contributions of various publicationsources: global compilation efforts from Prell et al.(1999) and Ortiz and Mix (1997); East China Sea andOkinawa Trough studies by Ujiie and Ujiie (2000); SCSdata collections from Miao et al. (1994), Chen et al.(1998), and Pflaumann and Jian (1999); SouthwesternPacific investigations by Thiede et al. (1997); severalindividual surveys of the North Pacific (Coulbourn etal., 1980; Ye and Yang, unpublished data; Kiefer et al.,2001); and unpublished data from M. Schulz. Thegeographical range of the 694 coretop data is from alatitude of 651N to 651S and a longitude of 1051E to1801E (Fig. 1); the samples provide good coverage of theSST range between �30 and 20 1C, but are relativelysparse in the SST range of 20–5 1C (Fig. 1). The datapoints are of especially high resolution in the westernequatorial Pacific and in the marginal basins of thewestern Pacific such as the SCS, the East China Sea, andWestern Australia. We think that this calibration dataset is most appropriate for developing SST estimationtechniques for the low- to mid-latitude western Pacificand should be suitable for reconstructing high-resolu-tion SST records from high sedimentation rate sites.
The relative abundance of each planktic foraminiferspecies is expressed as a percentage of the total faunalcount. Descriptive statistics of the relative abundancesof 28 species of planktic foraminifers were calculated forthe data set (Table 1). The taxonomy of plankticforaminifers used in this study was determined by theMARGO group and generally followed the workingschemes of Parker (1962), Be (1967) and Kipp (1976),with some modifications. We combined the two differentmorphotypes Globigerinoides sacculifer (no sac) and G.
sacculifer (with sac) together as one unit. We alsocombined Globorotalia menardii and G. tumida into onecategory to overcome an identification difficulty thatvexed previous studies. In this western Pacific data set,the most important taxonomic problem is the definitionand identification of morphologically similar groups
consisting of Neogloboquadrina dutertrei, N. pachyder-
ma-dutertrei intergrade (P-D intergrade)’’ (Kipp, 1976),and N. pachyderma (right coiling). Most western Pacificcoretop studies did not recognize the ‘‘P-D intergrade’’and different studies use different criteria for recogniz-ing N. dutertrei and N. pachyderma (right coiling); thus,we wanted to minimize this ‘‘taxonomic noise’’ duringthe processing of the coretop data for our SSTestimation. We have assumed that most ‘‘P-D inter-grade’’ specimens identified in previous western Pacificstudies represent juvenile forms of N. dutertrei and couldbe placed in the category of N. dutertrei. In this study wetherefore included specimens of ‘‘P-D intergrade’’ withN. dutertrei in coretop as well as downcore data.According to the sample processing procedures de-scribed in the published studies, all samples used togenerate faunal counting data were weighed and sievedthrough a 150 mm sieve. Census counts of planktonicforaminifers were made on fractions X150 mm for eachsample and at least 300 whole specimens were countedfor most samples. These coretop samples range in waterdepth between 42 and 5351 m, a wide interval thatoverlaps the depth of the regional carbonate lysoclineand represents various calcite preservation levels.
Modern SST values (summer, winter and annual)were assigned to each of the 694 coretop samples usingthe data in the World Ocean Atlas version 2 (WOA,1998), in the same way as in Kucera et al. (2004), toensure a common reference base for all SST proxies usedby the MARGO project. Temperatures at the samplelocations were computed using the WOA 98 samplesoftware (http://www.palmod.uni-bremen.de/~csn/woa-sample.html).
2.2. SST estimation techniques
Five SST estimation techniques (IKM, MAT, SIM-MAX, RAM and ANN) were applied to the newcalibration data set in the present study, to determinethe accuracy of SST estimates produced by differenttechniques through a validation in a coretop data setwith known SST values. The accuracy of SST estimatesbased on a validation of a coretop data set is the bestavailable measure of the likely performance of atechnique in fossil assemblages. For the purpose of thedowncore application we have chosen a SCS IMAGEScore MD972151 from which many good AMS C14 datesand age control data, and planktic foraminifer faunasand alkenone SST are available (Huang et al., 1999; Lee,in preparation; Lee et al., 1999; Huang et al., 2002).Since our calibration data set has good coverage in theSCS, the LGM reconstructions of this core should behighly accurate.
In developing the IKM transfer function we used thestandard statistical technique of VARIMAX Q-modefactor analysis (Imbrie and Kipp, 1971) to decompose
ARTICLE IN PRESS
Fig. 1. A western Pacific map indicating the site locations of a newly compiled coretop data set of planktic foraminifer faunal abundances (N=694)
and sea-surface temperature (SST, annual average, WOA, 1998) distribution in the western Pacific.
M.-T. Chen et al. / Quaternary Science Reviews 24 (2005) 1049–10621052
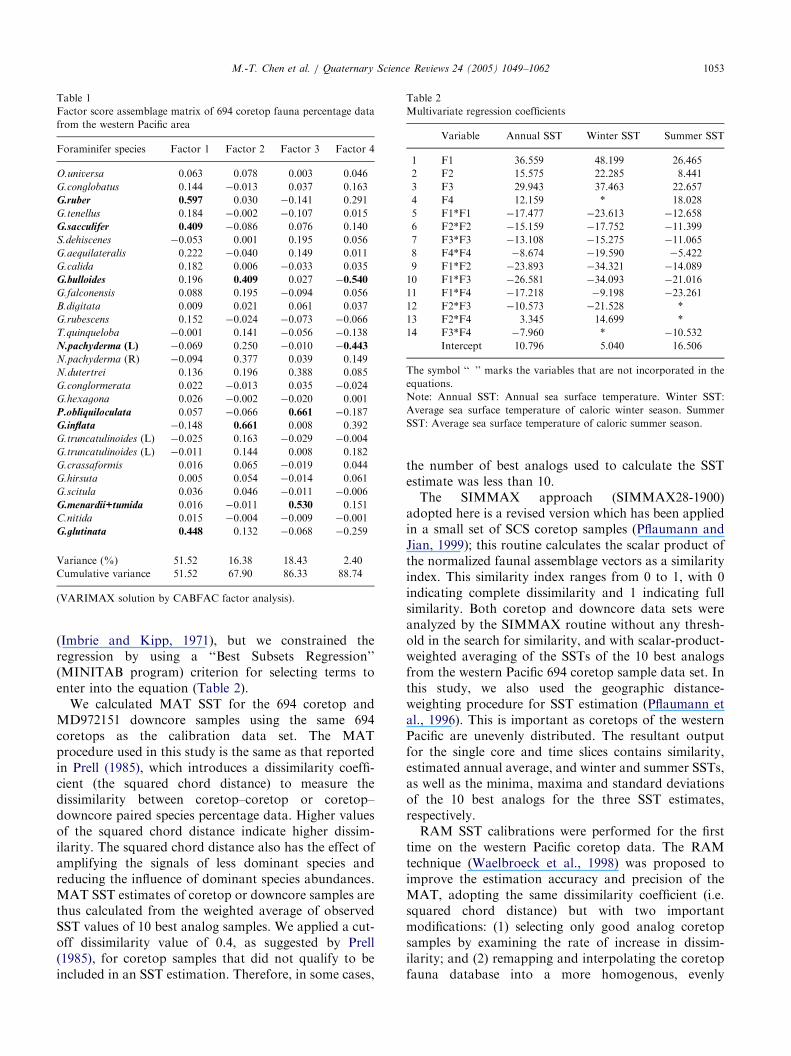
the 694 faunal variation data into a reduced number offactor variables that were independent from each other.Our analyses of the faunal data were based on a logtransformation (ln[species percentage +1]) that was firstapplied in an Atlantic and eastern equatorial Pacificstudy (Mix et al., 1999). In the factor analysis, the logtransform amplifies the signals of less dominant specieswith a compression of dominant species abundancevariations. The log transformation also has the effect ofmaking the species distribution more Gaussian, which isan essential assumption of the next step in the IKM thatinvolves multiple regression. The log transform isapplied to all faunal percentage data (coretop and
downcore samples) in this study before calculatingfactor scores or loadings. Four factors (Table 1) thatexplain �89% of the original but log-transformedcoretop fauna data are derived from the factor analysis.Planktic foraminifer species G. ruber, G. sacculifer,Globigerina bulloides, N. pachyderma (right coiling),Pulleniatina obliquiloculata, G. inflata, G. menardii+
tumida and Globigerinita glutinata exhibit high factorscores that are highly correlated with these factors. Wecalibrated the coretop factors loadings of these fourfactors with their cross-product and squared terms, toannual average, winter and summer SSTs by following astandard procedure of multiple regression techniques
ARTICLE IN PRESS
Table 1
Factor score assemblage matrix of 694 coretop fauna percentage data
from the western Pacific area
Foraminifer species Factor 1 Factor 2 Factor 3 Factor 4
O.universa 0.063 0.078 0.003 0.046
G.conglobatus 0.144 �0.013 0.037 0.163
G.ruber 0.597 0.030 �0.141 0.291
G.tenellus 0.184 �0.002 �0.107 0.015
G.sacculifer 0.409 �0.086 0.076 0.140
S.dehiscenes �0.053 0.001 0.195 0.056
G.aequilateralis 0.222 �0.040 0.149 0.011
G.calida 0.182 0.006 �0.033 0.035
G.bulloides 0.196 0.409 0.027 �0.540
G.falconensis 0.088 0.195 �0.094 0.056
B.digitata 0.009 0.021 0.061 0.037
G.rubescens 0.152 �0.024 �0.073 �0.066
T.quinqueloba �0.001 0.141 �0.056 �0.138
N.pachyderma (L) �0.069 0.250 �0.010 �0.443
N.pachyderma (R) �0.094 0.377 0.039 0.149
N.dutertrei 0.136 0.196 0.388 0.085
G.conglormerata 0.022 �0.013 0.035 �0.024
G.hexagona 0.026 �0.002 �0.020 0.001
P.obliquiloculata 0.057 �0.066 0.661 �0.187
G.inflata �0.148 0.661 0.008 0.392
G.truncatulinoides (L) �0.025 0.163 �0.029 �0.004
G.truncatulinoides (L) �0.011 0.144 0.008 0.182
G.crassaformis 0.016 0.065 �0.019 0.044
G.hirsuta 0.005 0.054 �0.014 0.061
G.scitula 0.036 0.046 �0.011 �0.006
G.menardii+tumida 0.016 �0.011 0.530 0.151
C.nitida 0.015 �0.004 �0.009 �0.001
G.glutinata 0.448 0.132 �0.068 �0.259
Variance (%) 51.52 16.38 18.43 2.40
Cumulative variance 51.52 67.90 86.33 88.74
(VARIMAX solution by CABFAC factor analysis).
Table 2
Multivariate regression coefficients
Variable Annual SST Winter SST Summer SST
1 F1 36.559 48.199 26.465
2 F2 15.575 22.285 8.441
3 F3 29.943 37.463 22.657
4 F4 12.159 * 18.028
5 F1*F1 �17.477 �23.613 �12.658
6 F2*F2 �15.159 �17.752 �11.399
7 F3*F3 �13.108 �15.275 �11.065
8 F4*F4 �8.674 �19.590 �5.422
9 F1*F2 �23.893 �34.321 �14.089
10 F1*F3 �26.581 �34.093 �21.016
11 F1*F4 �17.218 �9.198 �23.261
12 F2*F3 �10.573 �21.528 *
13 F2*F4 3.345 14.699 *
14 F3*F4 �7.960 * �10.532
Intercept 10.796 5.040 16.506
The symbol ‘‘�’’ marks the variables that are not incorporated in the
equations.
Note: Annual SST: Annual sea surface temperature. Winter SST:
Average sea surface temperature of caloric winter season. Summer
SST: Average sea surface temperature of caloric summer season.
M.-T. Chen et al. / Quaternary Science Reviews 24 (2005) 1049–1062 1053
(Imbrie and Kipp, 1971), but we constrained theregression by using a ‘‘Best Subsets Regression’’(MINITAB program) criterion for selecting terms toenter into the equation (Table 2).
We calculated MAT SST for the 694 coretop andMD972151 downcore samples using the same 694coretops as the calibration data set. The MATprocedure used in this study is the same as that reportedin Prell (1985), which introduces a dissimilarity coeffi-cient (the squared chord distance) to measure thedissimilarity between coretop–coretop or coretop–downcore paired species percentage data. Higher valuesof the squared chord distance indicate higher dissim-ilarity. The squared chord distance also has the effect ofamplifying the signals of less dominant species andreducing the influence of dominant species abundances.MAT SST estimates of coretop or downcore samples arethus calculated from the weighted average of observedSST values of 10 best analog samples. We applied a cut-off dissimilarity value of 0.4, as suggested by Prell(1985), for coretop samples that did not qualify to beincluded in an SST estimation. Therefore, in some cases,
the number of best analogs used to calculate the SSTestimate was less than 10.
The SIMMAX approach (SIMMAX28-1900)adopted here is a revised version which has been appliedin a small set of SCS coretop samples (Pflaumann andJian, 1999); this routine calculates the scalar product ofthe normalized faunal assemblage vectors as a similarityindex. This similarity index ranges from 0 to 1, with 0indicating complete dissimilarity and 1 indicating fullsimilarity. Both coretop and downcore data sets wereanalyzed by the SIMMAX routine without any thresh-old in the search for similarity, and with scalar-product-weighted averaging of the SSTs of the 10 best analogsfrom the western Pacific 694 coretop sample data set. Inthis study, we also used the geographic distance-weighting procedure for SST estimation (Pflaumann etal., 1996). This is important as coretops of the westernPacific are unevenly distributed. The resultant outputfor the single core and time slices contains similarity,estimated annual average, and winter and summer SSTs,as well as the minima, maxima and standard deviationsof the 10 best analogs for the three SST estimates,respectively.
RAM SST calibrations were performed for the firsttime on the western Pacific coretop data. The RAMtechnique (Waelbroeck et al., 1998) was proposed toimprove the estimation accuracy and precision of theMAT, adopting the same dissimilarity coefficient (i.e.squared chord distance) but with two importantmodifications: (1) selecting only good analog coretopsamples by examining the rate of increase in dissim-ilarity; and (2) remapping and interpolating the coretopfauna database into a more homogenous, evenly

ARTICLE IN PRESSM.-T. Chen et al. / Quaternary Science Reviews 24 (2005) 1049–10621054
distributed space as a function of winter and summerSSTs. These modifications should make RAM useful forSST reconstructions in the western Pacific, where lessevenly distributed and/or less well-preserved samplesmay limit the selection of good analogs for downcoreestimates. In this study, a threshold value of thedissimilarity coefficient of 0.6 was applied to reject pooranalog coretop samples. The 694 western Pacific coretopsamples were expanded by 466 ‘‘virtual coretops’’ by theRAM remapping procedure (with a grid step of 0.4 1Cand an interpolation radius of 0.5 1C) in a winter andsummer SST, and annual environmental space, respec-tively. In this paper, we use the latest RAM02 softwarewith the following parameters for all regional calibra-tions: initial a ¼ 0:1; b ¼ 10; g=0.25 1C, R=0.3 1C, asexplained in Kucera et al. (this volume).
A fundamentally different approach for SST calibra-tion, ANN uses sophisticated algorithms to search for arelationship between coretop fauna abundance distribu-tions and SSTs. The general principles and architectureof a back propagation (BP) neural network and itsapplication in reconstructions of past environmentalconditions from assemblage counts have been describedby Malmgren and Nordlund (1997) and Malmgren et al.(2001). A trained ANN can be best compared to a long,complicated, recurrent mathematical formula trans-forming species abundances into a desired variable(s).An ANN can successfully learn very complex, nonlinearrelationships; this technique is not as dependent on thesize, coverage and balance of the calibration dataset asare modern analog techniques (MAT, SIMMAX,RAM). Unfortunately, it is virtually impossible tointerpret the meaning of the coefficients associated withindividual neurons and thus to understand how thenetwork assigns output variables values to unknownsamples.
The networks used in this paper were trained on adatabase with counts of 28 species in 1111 Pacificcoretops. The details of the training results are presentedin Kucera et al. (2004). It is important to point out thatthe ANN SST estimation presented in this study wasbased on whole Pacific database training, which mayreduce the comparability to the other techniques.
3. Comparisons of SST estimations
3.1. Modern SST calibrations
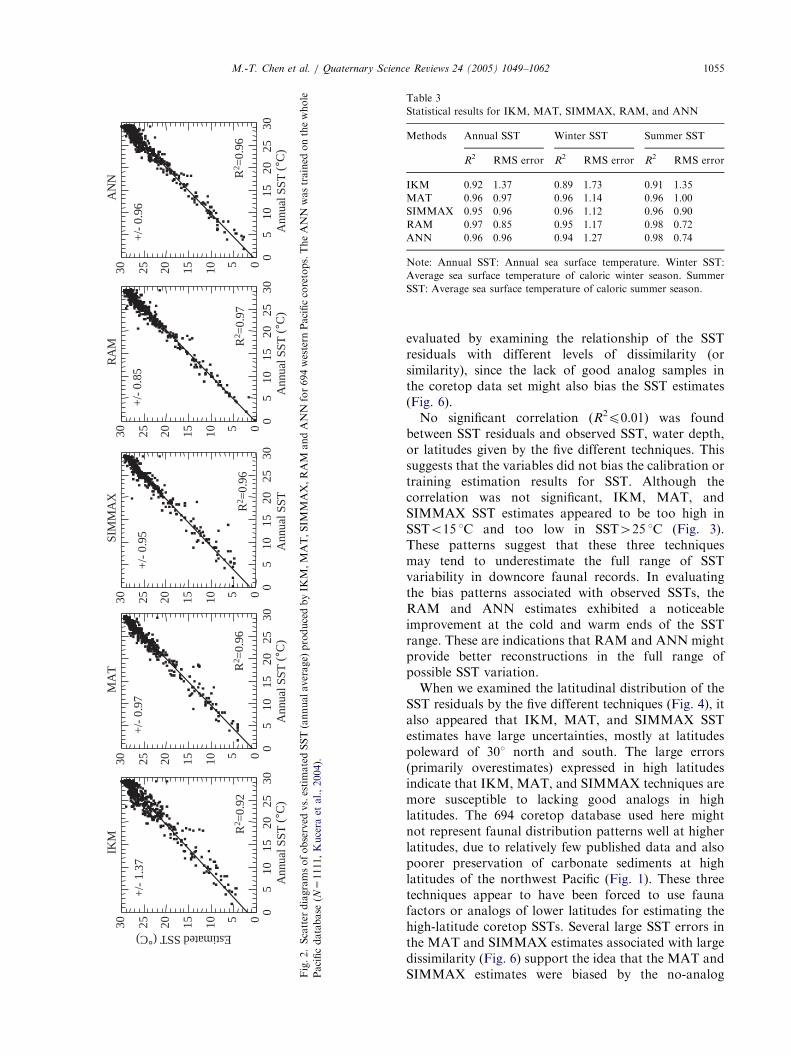
We calibrated (or trained) abundances of 28 species ofplanktic foraminifers in 694 coretops to annual average,winter, and summer SSTs following the procedures ofthe five individual SST estimation techniques (IKM,MAT, SIMMAX, RAM, ANN) described above. Thecalibration results are examined here by comparingscatter plots of observed vs. estimated SSTs (Fig. 2). The
success of the calibration can also be evaluated bycalculating the correlation (R2) between the observedand estimated SSTs as well as the root mean squarederror (RMS) of the residuals of the estimated SSTs(Table 3). To simplify the presentation of our results,only the annual average SSTs estimated by these fivedifferent techniques are presented for comparison.
Based on their success in predicting observed SSTsfrom coretop samples, the different techniques can bedivided into two distinct groups. For all SST estima-tions, the IKM technique produced by far the lowestcorrelation and the highest RMS value (Fig. 2; Table 3).The IKM showed relatively large scattering in observedvs. estimated SST plots and gave a magnitude of�1.3–1.4 1C of the uncertainties of the estimates.
MAT, SIMMAX, RAM and ANN appeared to yieldsimilarly accurate results. The relatively high correla-tions and small RMS values (Fig. 2; Table 3) producedby the four techniques indicated good predictability inestimating SSTs in the 694 coretop data. Applying thesefour techniques to the coretops gives somewhat lowerestimation uncertainties of �0.8–0.9 1C, which repre-sents a significant improvement over the IKM. Amongthe four techniques, our results suggest also that RAMproduces a much lower RMS value (�0.85 1C) thanMAT (�0.97 1C), SIMMAX (�0.95 1C), and ANN(�0.96 1C). Kucera et al. (this volume) have pointedout that the low error values produced by RAM reflectthe fact that the leaving-one-out validation procedure inthe RAM02 software is implemented only after the two-dimensional interpolation and thus underestimates thefull error rate. The difference is, however, negligiblecompared with the �0.5 1C estimation uncertaintydifference between the IKM and MAT/SIMMAX/RAM/ANN groups.
We also noticed that in estimating winter and summerSSTs, these five different techniques yielded resultssimilar to those for estimating annual average SSTs(Table 3). The IKM showed large errors in estimatingthe SSTs, while the other four (MAT, SIMMAX, RAM,and ANN) exhibited smaller errors with better predict-ability than the IKM. All five techniques producedrelatively larger uncertainties when estimating winterSSTs (1.2–1.7 1C) versus summer SSTs (0.7–1.3 1C).
3.2. Coretop evaluation of estimation biases
To evaluate potential biases in the calibration of thefive SST estimation techniques, which might lead toinaccurate downcore estimates, we examined the rela-tionship of SST residuals (the difference betweenestimated minus observed SSTs) with observed SST(Fig. 3), latitudinal distribution (Fig. 4), and waterdepth of coretops (Fig. 5). Techniques (MAT, SIM-MAX, RAM) adopting dissimilarity (or similarity)indices for comparing coretop faunal samples were also
ARTICLE IN PRESS
Table 3
Statistical results for IKM, MAT, SIMMAX, RAM, and ANN
Methods Annual SST Winter SST Summer SST
R2 RMS error R2 RMS error R2 RMS error
IKM 0.92 1.37 0.89 1.73 0.91 1.35
MAT 0.96 0.97 0.96 1.14 0.96 1.00
SIMMAX 0.95 0.96 0.96 1.12 0.96 0.90
RAM 0.97 0.85 0.95 1.17 0.98 0.72
ANN 0.96 0.96 0.94 1.27 0.98 0.74
Note: Annual SST: Annual sea surface temperature. Winter SST:
Average sea surface temperature of caloric winter season. Summer
SST: Average sea surface temperature of caloric summer season.
051015202530
05
1015
2025
30
AN
N
Ann
ual S
ST (
°C)
051015202530
05
1015
2025
30
MA
T
Ann
ual S
ST (
°C)
Estimated SST (°C)
051015202530
05
1015
2025
30
IKM
Ann
ual S
ST (
°C)
R2 =
0.92
+/-
1.37
R2 =
0.96
+/-
0.97
R2 =
0.96
+/-
0.96
051015202530
05
1015
2025
30
RA
M
Ann
ual S
ST (
°C)
R2 =
0.97
+/-
0.85
051015202530
05
1015
2025
30
SIM
MA
X
Ann
ual S
ST
+/-
0.95
R2 =
0.96
Fig
.2.
Sca
tter
dia
gra
msofobse
rved
vs.
estim
ate
dSST
(annualaver
age)
pro
duce
dby
IKM
,M
AT,SIM
MA
X,R
AM
and
AN
Nfo
r694
wes
tern
Paci
fic
core
tops.
The
AN
Nw
astr
ain
edon
the
whole
Paci
fic
data
base
(N=
1111,K
uce
raet
al.,2004).
M.-T. Chen et al. / Quaternary Science Reviews 24 (2005) 1049–1062 1055
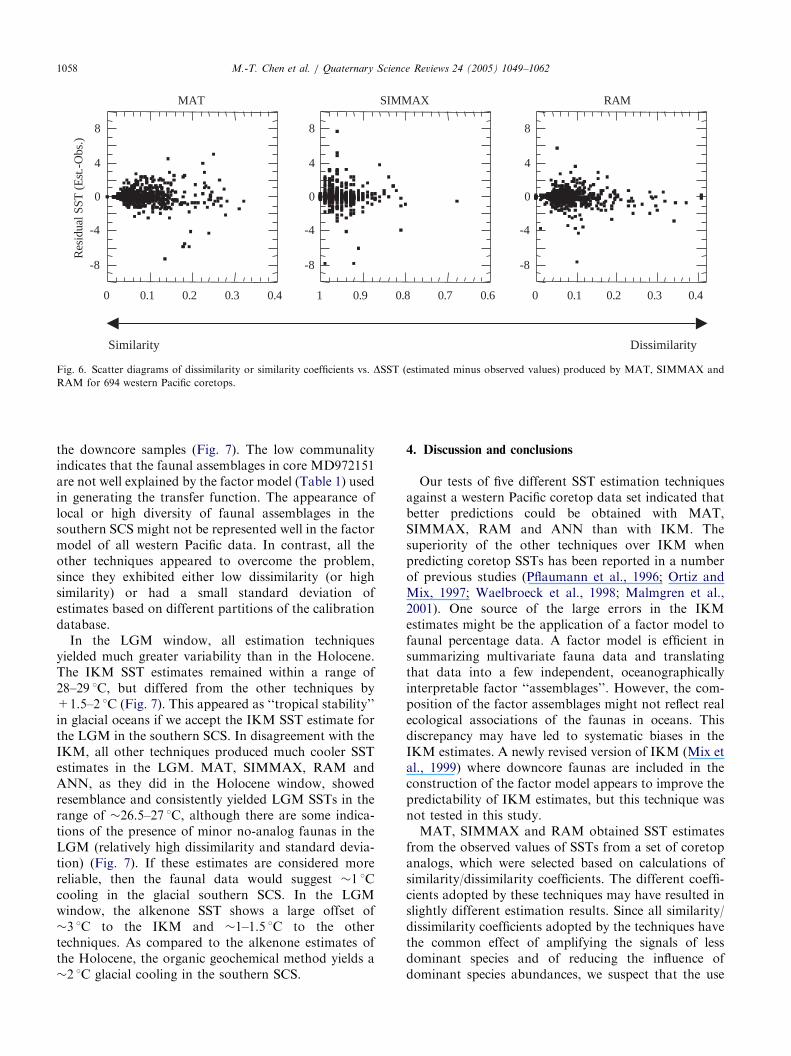
evaluated by examining the relationship of the SSTresiduals with different levels of dissimilarity (orsimilarity), since the lack of good analog samples inthe coretop data set might also bias the SST estimates(Fig. 6).
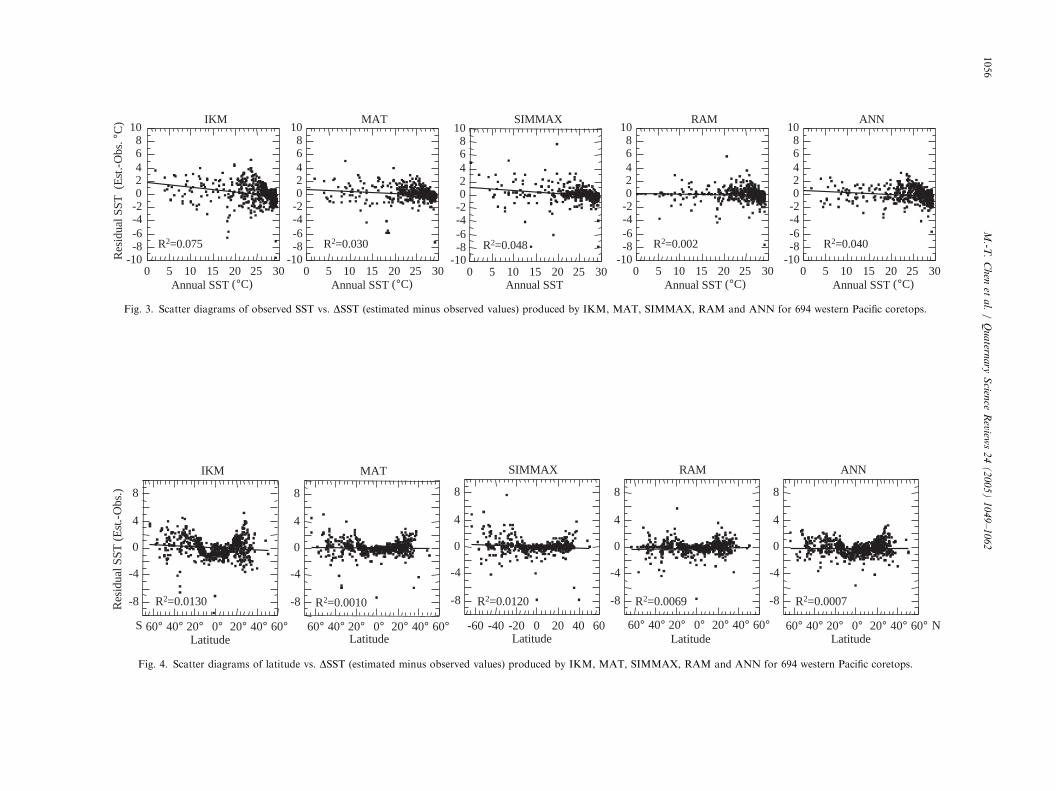
No significant correlation (R2p0.01) was foundbetween SST residuals and observed SST, water depth,or latitudes given by the five different techniques. Thissuggests that the variables did not bias the calibration ortraining estimation results for SST. Although thecorrelation was not significant, IKM, MAT, andSIMMAX SST estimates appeared to be too high inSSTo15 1C and too low in SST425 1C (Fig. 3).These patterns suggest that these three techniquesmay tend to underestimate the full range of SSTvariability in downcore faunal records. In evaluatingthe bias patterns associated with observed SSTs, theRAM and ANN estimates exhibited a noticeableimprovement at the cold and warm ends of the SSTrange. These are indications that RAM and ANN mightprovide better reconstructions in the full range ofpossible SST variation.
When we examined the latitudinal distribution of theSST residuals by the five different techniques (Fig. 4), italso appeared that IKM, MAT, and SIMMAX SSTestimates have large uncertainties, mostly at latitudespoleward of 301 north and south. The large errors(primarily overestimates) expressed in high latitudesindicate that IKM, MAT, and SIMMAX techniques aremore susceptible to lacking good analogs in highlatitudes. The 694 coretop database used here mightnot represent faunal distribution patterns well at higherlatitudes, due to relatively few published data and alsopoorer preservation of carbonate sediments at highlatitudes of the northwest Pacific (Fig. 1). These threetechniques appear to have been forced to use faunafactors or analogs of lower latitudes for estimating thehigh-latitude coretop SSTs. Several large SST errors inthe MAT and SIMMAX estimates associated with largedissimilarity (Fig. 6) support the idea that the MAT andSIMMAX estimates were biased by the no-analog
ARTIC
LEIN
PRES
S
R2=0.048-10-8-6-4-202468
10
0 5 10 15 20 25 30
ANN
Annual SST (°C)
-10-8-6-4-202468
10
0 5 10 15 20 25 30
MAT
Annual SST (°C)
Res
idua
l SST
(E
st.-
Obs
.°C
)
R2=0.030 R2=0.040-10
-8-6-4-202468
10
0 5 10 15 20 25 30
RAM
Annual SST (°C)
R2=0.002R2=0.075-10
-8-6-4-202468
10
0 5 10 15 20 25 30
IKM
Annual SST (°C)
-10-8-6-4-202468
10
0 5 10 15 20 25 30
SIMMAX
Annual SST
Fig. 3. Scatter diagrams of observed SST vs. DSST (estimated minus observed values) produced by IKM, MAT, SIMMAX, RAM and ANN for 694 western Pacific coretops.
R2=0.0130 R2=0.0010 R2=0.0007R2=0.0120 R2=0.0069 -8
-4
0
4
8
ANN
Latitude
Res
idua
l SST
(E
st.-
Obs
.)
-8
-4
0
4
8
MAT
LatitudeN
-8
-4
0
4
8
RAM
LatitudeS
-8
-4
0
4
8
60° 40° 20° 0° 20° 40° 60° 60° 40° 20° 0° 20° 40° 60° 60° 40° 20° 0° 20° 40° 60° 60° 40° 20° 0° 20° 40° 60°
IKM
Latitude
-8
-4
0
4
8
-60 -40 -20 0 20 40 60
SIMMAX
Latitude
Fig. 4. Scatter diagrams of latitude vs. DSST (estimated minus observed values) produced by IKM, MAT, SIMMAX, RAM and ANN for 694 western Pacific coretops.
M.-T
.C
hen
eta
l./
Qu
atern
ary
Scien
ceR
eviews
24
(2
00
5)
10
49
–1
06
21056
ARTICLE IN PRESS
R2 =
0.00
173
R2 =
0.00
396
R2 =
0.00
080
R2 =
0.02
870
Residual SST (Est.-Obs.)
-8-4048
01
23
45
6
AN
N
Wat
er D
epth
(K
m)
-8-4048
01
23
45
6
MA
T
Wat
er D
epth
(K
m)
R2 =
0.00
989
-8-4048
01
23
45
6
RA
M
Wat
er D
epth
(K
m)
-8-4048
01
23
45
6
IKM
Wat
er D
epth
(K
m)
-8-4048
01
23
45
6
SIM
MA
X
Wat
er D
epth
(K
m)
Fig
.5.
Sca
tter
dia
gra
ms
ofw
ate
rdep
thvs.DSST
(est
imate
dm
inus
obse
rved
)pre
dic
ted
by
IKM
,M
AT
,SIM
MA
X,R
AM
and
AN
Nfo
r694
wes
tern
Paci
fic
core
top
data
.
M.-T. Chen et al. / Quaternary Science Reviews 24 (2005) 1049–1062 1057
conditions. In contrast, RAM and ANN appear to bemore successful in estimating the high-latitude coretopSSTs, since there were only relatively small errors at thetwo ends (Fig. 3). For ANN, this could be in part due tothe larger calibration database on which the neuralnetworks were trained (Kucera et al., 2004).
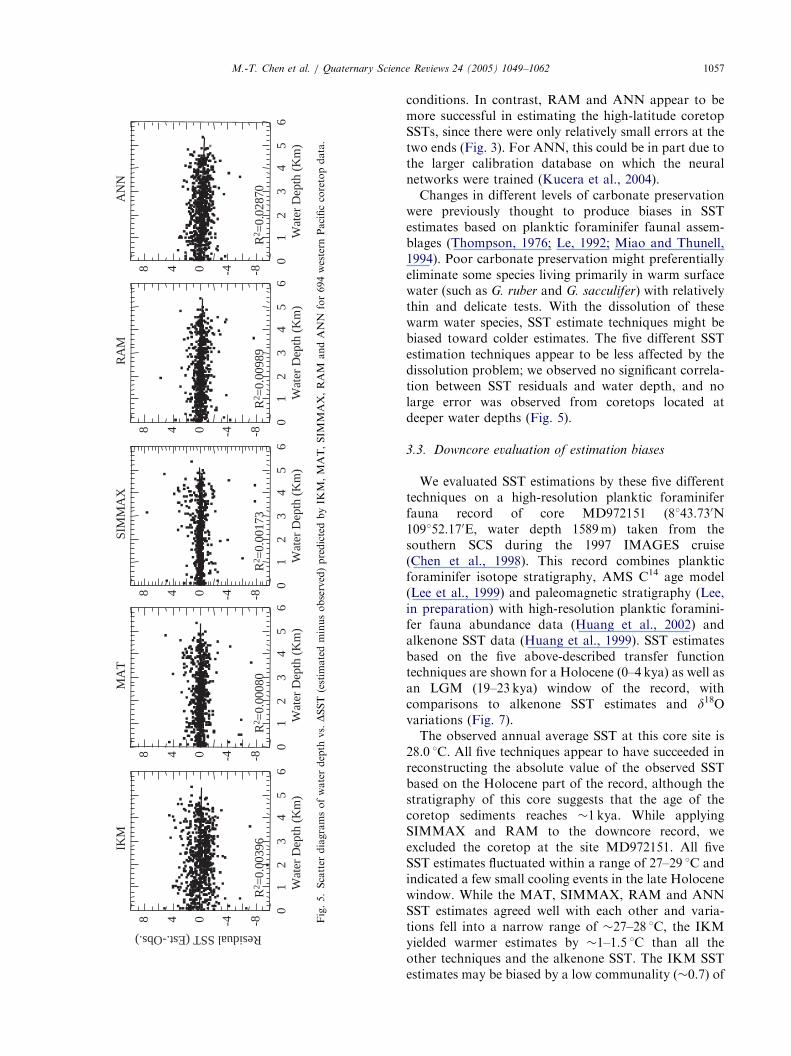
Changes in different levels of carbonate preservationwere previously thought to produce biases in SSTestimates based on planktic foraminifer faunal assem-blages (Thompson, 1976; Le, 1992; Miao and Thunell,1994). Poor carbonate preservation might preferentiallyeliminate some species living primarily in warm surfacewater (such as G. ruber and G. sacculifer) with relativelythin and delicate tests. With the dissolution of thesewarm water species, SST estimate techniques might bebiased toward colder estimates. The five different SSTestimation techniques appear to be less affected by thedissolution problem; we observed no significant correla-tion between SST residuals and water depth, and nolarge error was observed from coretops located atdeeper water depths (Fig. 5).
3.3. Downcore evaluation of estimation biases
We evaluated SST estimations by these five differenttechniques on a high-resolution planktic foraminiferfauna record of core MD972151 (8143.730N109152.170E, water depth 1589 m) taken from thesouthern SCS during the 1997 IMAGES cruise(Chen et al., 1998). This record combines plankticforaminifer isotope stratigraphy, AMS C14 age model(Lee et al., 1999) and paleomagnetic stratigraphy (Lee,in preparation) with high-resolution planktic foramini-fer fauna abundance data (Huang et al., 2002) andalkenone SST data (Huang et al., 1999). SST estimatesbased on the five above-described transfer functiontechniques are shown for a Holocene (0–4 kya) as well asan LGM (19–23 kya) window of the record, withcomparisons to alkenone SST estimates and d18Ovariations (Fig. 7).
The observed annual average SST at this core site is28.0 1C. All five techniques appear to have succeeded inreconstructing the absolute value of the observed SSTbased on the Holocene part of the record, although thestratigraphy of this core suggests that the age of thecoretop sediments reaches �1 kya. While applyingSIMMAX and RAM to the downcore record, weexcluded the coretop at the site MD972151. All fiveSST estimates fluctuated within a range of 27–29 1C andindicated a few small cooling events in the late Holocenewindow. While the MAT, SIMMAX, RAM and ANNSST estimates agreed well with each other and varia-tions fell into a narrow range of �27–28 1C, the IKMyielded warmer estimates by �1–1.5 1C than all theother techniques and the alkenone SST. The IKM SSTestimates may be biased by a low communality (�0.7) of
ARTICLE IN PRESS
Res
idua
l SST
(E
st.-
Obs
.)
-8
-4
0
4
8
0 0.1 0.2 0.3 0.4
MAT
DissimilaritySimilarity
-8
-4
0
4
8
0 0.1 0.2 0.3 0.4
RAM
-8
-4
0
4
8
0.60.70.80.91
SIMMAX
Fig. 6. Scatter diagrams of dissimilarity or similarity coefficients vs. DSST (estimated minus observed values) produced by MAT, SIMMAX and
RAM for 694 western Pacific coretops.
M.-T. Chen et al. / Quaternary Science Reviews 24 (2005) 1049–10621058
the downcore samples (Fig. 7). The low communalityindicates that the faunal assemblages in core MD972151are not well explained by the factor model (Table 1) usedin generating the transfer function. The appearance oflocal or high diversity of faunal assemblages in thesouthern SCS might not be represented well in the factormodel of all western Pacific data. In contrast, all theother techniques appeared to overcome the problem,since they exhibited either low dissimilarity (or highsimilarity) or had a small standard deviation ofestimates based on different partitions of the calibrationdatabase.
In the LGM window, all estimation techniquesyielded much greater variability than in the Holocene.The IKM SST estimates remained within a range of28–29 1C, but differed from the other techniques by+1.5–2 1C (Fig. 7). This appeared as ‘‘tropical stability’’in glacial oceans if we accept the IKM SST estimate forthe LGM in the southern SCS. In disagreement with theIKM, all other techniques produced much cooler SSTestimates in the LGM. MAT, SIMMAX, RAM andANN, as they did in the Holocene window, showedresemblance and consistently yielded LGM SSTs in therange of �26.5–27 1C, although there are some indica-tions of the presence of minor no-analog faunas in theLGM (relatively high dissimilarity and standard devia-tion) (Fig. 7). If these estimates are considered morereliable, then the faunal data would suggest �1 1Ccooling in the glacial southern SCS. In the LGMwindow, the alkenone SST shows a large offset of�3 1C to the IKM and �1–1.5 1C to the othertechniques. As compared to the alkenone estimates ofthe Holocene, the organic geochemical method yields a�2 1C glacial cooling in the southern SCS.
4. Discussion and conclusions
Our tests of five different SST estimation techniquesagainst a western Pacific coretop data set indicated thatbetter predictions could be obtained with MAT,SIMMAX, RAM and ANN than with IKM. Thesuperiority of the other techniques over IKM whenpredicting coretop SSTs has been reported in a numberof previous studies (Pflaumann et al., 1996; Ortiz andMix, 1997; Waelbroeck et al., 1998; Malmgren et al.,2001). One source of the large errors in the IKMestimates might be the application of a factor model tofaunal percentage data. A factor model is efficient insummarizing multivariate fauna data and translatingthat data into a few independent, oceanographicallyinterpretable factor ‘‘assemblages’’. However, the com-position of the factor assemblages might not reflect realecological associations of the faunas in oceans. Thisdiscrepancy may have led to systematic biases in theIKM estimates. A newly revised version of IKM (Mix etal., 1999) where downcore faunas are included in theconstruction of the factor model appears to improve thepredictability of IKM estimates, but this technique wasnot tested in this study.
MAT, SIMMAX and RAM obtained SST estimatesfrom the observed values of SSTs from a set of coretopanalogs, which were selected based on calculations ofsimilarity/dissimilarity coefficients. The different coeffi-cients adopted by these techniques may have resulted inslightly different estimation results. Since all similarity/dissimilarity coefficients adopted by the techniques havethe common effect of amplifying the signals of lessdominant species and of reducing the influence ofdominant species abundances, we suspect that the use

ARTICLE IN PRESS
IKM ANNMAT Uk'37SIMMAX RAM
0 1 2 3 4 5 6 7 8 9 10 11 12 13 14 15 16 17 18 19 20 21 22 23 24 25
-3.5-3
-2.5-2
-1.5-1
-0.50
18O
(‰
)
Age (kya)
SST
(°C
)
0.6
0.7
0.8
Com
mun
alit
y
0
0.2
0.4
0.60 1 2 3 4
Std
0.6
0.7
0.8
Com
mun
alit
y
0
0.1
0.2Dis
sim
ilart
y
19 20 21 22 23
0
0.2
0.4
0.6
Std
0.8
0.9
1
Sim
ilari
ty
0.8
0.9
1
Sim
ilari
ty
24
25
26
27
28
29
19 20 21 22 23D
issi
mila
rty0
0.1
0.2
24
25
26
27
28
29
0 1 2 3 4
Fig. 7. Holocene and LGM SST reconstructions in core MD972151 (southern South China Sea) by IKM, MAT, SIMMAX, RAM and ANN and by
planktic foraminifer isotope stratigraphy (Lee et al., 1999). The SST reconstructions presented here are compared with alkenone SST estimates from
the same core (Huang et al., 1999).
M.-T. Chen et al. / Quaternary Science Reviews 24 (2005) 1049–1062 1059
of different coefficients is not a major factor affectingthe accuracy of these estimations. While MAT onlytakes a simple average of the best 10 analogs, SIMMAXand RAM are considered to yield better estimationsbecause they adopt more advanced weighting ortruncating functions. In the SIMMAX estimations, acoretop sample from the downcore record was excludedfrom the analog searching because it would introduce astrong bias in the geographical distance weightingprocedure (Pflaumann et al., 1996). The very good
estimation ability indicated by the RAM results is onlypartly due to the analog searching that was based on aninterpolated, expanded database (coretop itself exclu-sive), which may have significantly improved thesparseness of the coretop data in the western Pacific.On the other hand, it may mainly result from theleaving-one-out technique which RAM applied aftervirtual samples were added, and which explains thegenerally lower prediction errors of this technique(Kucera et al., this volume).
ARTICLE IN PRESSM.-T. Chen et al. / Quaternary Science Reviews 24 (2005) 1049–10621060
The ANN technique offered the same high accuracyand precision in coretop SST estimations as RAM. Inour study, ANN demonstrated an ability to learn thevery complicated relationships between faunas and SSTsand to produce very accurate estimates. ANN, althoughits training procedures are extremely complex and time-consuming, provided the same potential as RAM forestimating highly accurate SSTs in the western Pacific.Future work will be needed to compare the estimationresults of ANN with training on western Pacific coretopdata only.
SST reconstructions based on alkenones (Pelejero etal., 1999) and Mg/Ca data (Lea et al., 2000; Stott et al.,2002; Visser et al., 2003; Rosenthal et al., 2003) suggest ageneral cooling of �2–3 1C in the western tropicalPacific marginal seas or open ocean during the LGM. Incontrast to the general agreement of LGM alkenone andMg/Ca SST data, atmosphere–ocean coupled GCMsproduce a relatively wide range of estimations of 1–6 1Cfor LGM cooling on the surface ocean of the westerntropical Pacific (Weaver et al., 1999; Bush andPhilander, 1999; Hewitt et al., 2001; Shin et al., 2003).Although different atmospheric and/or oceanic pro-cesses were incorporated in these GCMs, all modeledestimates of surface ocean temperatures in the westerntropical Pacific were interpretable by specific climaticmechanisms. If we consider the faunal SST estimates tobe more reliable when different techniques yield similarresults, the downcore data of MD972151 from thesouthern SCS suggest a �1 1C cooling of the westerntropical Pacific during the LGM. This �1 1C cooling issupported by MAT, SIMMAX, RAM and ANN (Fig.7), and thus it is robust and also independent of themethodology of SST estimation techniques that wereused.
The contribution of the SCS core to determining themagnitude of glacial cooling in the western Pacificassumes that the SCS is a good representative of tropicalPacific climate. However, recent studies (Kienast et al.,2001; Kiefer and Kienast, 2004) suggest that SST in theSCS appears strongly influenced by terrestrial and/orlocal climate conditions and therefore deviates fromopen ocean conditions in the western tropical Pacific.Nevertheless, if this �1 1C glacial cooling is accepted,our study implies that much larger variations in seasurface salinity can be extracted from the plankticforaminifer oxygen isotope data which show �1.6%difference between the Holocene and LGM (Fig. 7).This is consistent with the current though that largechanges in hydrological cycles analogous to ENSO are adominant feature of the tropical Pacific (Cane andClement, 1999; Clement and Cane, 1999; Clement et al.,1999; Stott et al., 2002; Koutavas et al., 2002; Visser etal., 2003). Although a �1 1C discrepancy exists betweenour faunal and alkenone SST estimates of the LGM incore MD972151, this discrepancy may result from
differential sensitivity of the faunal and alkenonemethods, or from different optimum growing seasonsof planktic foraminifers and coccoliths, and/or complexsedimentation patterns in the southern SCS. In any case,our results provide a more conservative estimate ofLGM cooling in the western tropical Pacific and willhave to be considered in further assessments of surfaceocean climate in the glacial tropics.
Acknowledgements
This research was supported by the National ScienceCouncil (NSC92-2611-M-019-016), Academia Sinica(Asian Paleoenvironmental Changes (APEC) Projects),and the National Taiwan Ocean University, Republic ofChina. We thank Thorsten Kiefer and Tim Barrows fortheir constructive reviews.
References
Barrows, T.T., Juggins, S., De Deckker, P., Thiede, J., Martinez, J.I.,
2000. Sea-surface temperatures of the southwest Pacific Ocean
during the last glacial maximum. Paleoceanography 15, 95–109.
Be, A.W.H., 1967. Foraminifera families: Globigerinide and Globo-
rotaliidae. Fiches d’Idendification du Zooplancton. Fraser, J.H.
Cons., Int. Explor. Mer, Charlottenlund: Sheet 118.
Beck, J.W., Edwards, R.L., Ito, E., Taylor, F.W., Recy, J., Rougerie,
F., Joannot, P., Heinin, C., 1992. Sea-surface temperature from
coral skeletal strontium/calcium ratios. Science 257, 644–647.
Bush, A.B.G., Philander, S.G.H., 1999. The climate of the last glacial
maximum: results from a coupled atmosphere-ocean general
circulation model. Journal of Geophysical Research 104,
24509–24525.
Cane, M., Clement, A.C., 1999. A role for the tropical Pacific coupled
ocean-atmosphere system on Milankovitch and millennial time-
scales. Part II: Global Impacts, American Geophysical Union, pp.
373–384.
Chen, M.T., Ho, H.W., Lai, T.D., Zheng, L., Miao, Q., Shea, K.S.,
Chen, M.P., Wang, P., Wei, K.Y., Huang, C.Y., 1998. Recent
planktonic foraminifers and their relationships to surface ocean
hydrography of the south China sea. Marine Geology 146,
173–190.
CLIMAP Project Members, 1976. The surface of the ice-age Earth.
Science 191, 1131–1137.
CLIMAP Project Members, 1981. Seasonal reconstructions of the
Earth’s surface at the last glacial maximum. Geological Society of
America Map and Chart Series, MC-36, Geological Society of
America, Boulder, CO.
Clement, A.C., Cane, M., 1999. A role for the tropical Pacific coupled
ocean-atmosphere system on Milankovitch and millennial time-
scales. Part I: a modeling study of tropical Pacific variability,
American Geophysical Union, pp. 363–371.
Clement, A.C., Seager, R., Cane, M.A., 1999. Orbital controls on the
El Nino/Southern Oscillation and the tropical climate. Paleocea-
nography 14 (4), 441–456.
Coulbourn, W.T., Parker, F.L., Berger, W.H., 1980. Faunal and
solution patterns of planktonic foraminifera in surface sediments of
the North Pacific. Marine Micropaleontology 5, 329–399.
Guilderson, T., Fairbanks, R.G., Rubenstone, J.L., 1994. Tropical
temperature variations since 20,000 years ago: modulating inter-
hemispheric climate change. Science 263, 663–665.

ARTICLE IN PRESSM.-T. Chen et al. / Quaternary Science Reviews 24 (2005) 1049–1062 1061
Hewitt, C.D., Broccoli, A.J., Mitchell, J.F.B., Stouffer, R.J., 2001. A
coupled model study of the last glacial maximum: was part of the
North Atlantic relatively warm? Geophysical Research Letters 28,
1571–1574.
Huang, C.-Y., Wang, C.-C., Zhao, M., 1999. High-resolution
Carbonate Stratigraphy of IMAGES Core MD972151 from South
China sea. The Journal of Terrestrial, Atmospheric, and Oceanic
Sciences 10, 225–238.
Huang, C.C., Chen, M.T., Lee, M.Y., Wei, W.Y., Huang, C.Y., 2002.
Planktic foraminifer faunal sea surface temperature records of the
past two glacial terminations in the South China Sea near Wan-An
shallow (IMAGES core MD972151). Western Pacific Earth
Sciences 2, 1–4.
Hutson, W.H., 1980. The Agulhas Current during the Late Pleistocene:
analysis of modern faunal analogs. Science 207, 64–66.
Hutson, W.H., Prell, W.L., 1980. A paleoecological transfer function,
FI-2, for Indian Ocean planktonic foraminifera. Paleontology 54,
381–399.
Imbrie, J., Kipp, N.G., 1971. A new micropaleontological method for
quantitative paleoclimatology: application to a Late Pleistocene
Caribbean core. In: Turekian, K.K. (Ed.), The Late Cenozoic
Glacial Ages. Yale University Press, New Haven, pp. 71–181.
Kiefer, T., Kienast, M., 2004. The deglacial warming in the
Pacific Ocean: a review with emphasis on Heinrich Event 1.
Quaternary Science Reviews, this issue (doi: 10.1016/j.quascirev.
2004.02.021).
Kiefer, T., Sarnthein, M., Erlenkeuser, H., Grootes, P.M., Roberts,
A.P., 2001. North Pacific response to millennial-scale changes in
ocean circulation over the last 60 kyr. Paleoceanography 16,
179–189.
Kienast, M., Steinke, S., Stattegger, K., Calvert, S.E., 2001.
Synchronous tropical South China Sea SST change and Greenland
warming during deglaciation. Science 291, 2132–2134.
Kipp, N.G., 1976. New transfer function for estimating past sea-
surface conditions from sea-bed distribution of planktonic
foraminiferal assemblages in the North Atlantic. Memoir of
Geological Society of America 3–41.
Koutavas, A., Lynch-Stieglitz, J., Marchitto Jr., T.M., Sachs, J.P.,
2002. El Nino-like pattern in ice age tropical Pacific sea surface
temperature. Science 297, 226–230.
Kucera, M., Weinelt, M., Kiefer, T., Pflaumann, U., Hayes, A.,
Weinelt, M., Chen, M.-T., Mix, A.C., Barrows, T., Cortijo, E.,
Duprat, J., Waelbroeck, C., 2004. Reconstruction of sea-surface
temperatures from assemblages of planktonic foraminifera: multi-
technique approach based on geographically constrained calibra-
tion datasets and its application to glacial Atlantic and Pacific
Oceans. Quaternary Science Reviews, this issue (doi: 10.1016/
j.quascirev.2004.07.014).
Le, J., 1992. Palaeotemperature estimation methods: sensitivity test on
two western equatorial Pacific cores. Quaternary Science Reviews
11, 801–820.
Lea, D.W., Pak, D.K., Spero, H.J., 2000. Climate impact of Late
Quaternary equatorial Pacific sea surface temperature variations.
Science 289, 1719–1724.
Lee, T.-Q., Environmental magnetic record of deep-sea core
MD972151 from the southwestern South China Sea, in pre-
paration.
Lee, M.-Y., Wei, K.-Y., Chen, Y.-G., 1999. High resolution oxygen
isotope stratigraphy for the last 150,000 years in the southern
South China Sea: core MD972151. The Journal of Terrestrial,
Atmospheric, and Oceanic Sciences 10, 239–254.
Malmgren, B.A., Nordlund, U., 1997. Application of artificial neural
networks to paleoceanographic data. Palaeogeography, Palaeocli-
matology, Palaeoecology 136, 359–373.
Malmgren, B.A., Kucera, M., Nyberg, J., Waelbroeck, C., 2001.
Comparison of statistical and artificial neural network techniques
for climating past sea surface temperatures from planktonic
foraminifer. Paleoceanography 16, 1–11.
Miao, Q., Thunell, R.C., 1994. Glacial-Holocene carbonate dissolution
and sea surface temperatures in the South China and Sulu Seas.
Paleoceanography 9, 269–290.
Mix, A.C., Bard, E., Schneider, R., 2001. Environmental processes of
the ice age: land, oceans, glaciers (EPILOG). Quaternary Science
Reviews 20, 627–657.
Mix, A.C., Morey, A.E., Pisias, N.G., Hosterler, S.W., 1999.
Foraminiferal faunal estimates of paleotemperature: circumventing
the no-analog problem yields cool ice age trophics. Paleocean-
ography 14 (3), 350–359.
Ortiz, J.D., Mix, A.C., 1997. Comparison of Imbrie–Kipp transfer
function and modern analog temperature estimates using sediment
trap and core top foraminiferal faunas. Paleoceanography 12 (2),
175–190.
Parker, F.L., 1962. Planktonic foraminiferal species in Pacific
sediments. Micropaleontology 8, 219–254.
Pelejero, C., Grimalt, J.O., Sarnthein, M., Wang, L., Flores, J.-A.,
1999. Molecular biomarker record of sea surface temperature and
climatic change in the South China Sea during the last 140,000
years. Marine Geology 156, 109–121.
Pflaumann, U., Jian, Z., 1999. Modern distribution patterns of
planktonic foraminifera in the South China Sea and western
Pacific: a new transfer technique to estimate regional sea-surface
temperatures. Marine Geology 156, 41–83.
Pflaumann, U., Duprat, J., Pujol, C., Labeyrie, L.D., 1996. SIMMAX:
a modern analog technique to deduce Atlantic sea surface
temperatures from planktonic foraminifera in deep-sea sediments.
Paleoceanography 11 (1), 15–35.
Prell, W.L., 1985. The stability of low-latitude sea-surface tempera-
tures: and evaluation of the CLIMAP reconstruction with
emphasis on the positive SST anomalies. United States Department
of Energy, Office of Energy Research, TR025, US, Government
Printing Office, vol. 1–2, pp. 1–60.
Prell, W., Martin, A., Cullen, J., Trend, M., 1999. The Brown
University Foraminiferal Data Base. IGBP PAGES/World
Data Center-A for Paleoclimatology Data Contribution Series #
1999-027.
Rind, D., Peteet, D., 1985. Terrestrial conditions at the last glacial
maximum and CLIMAP sea-surface temperature estimates: are
they consistent? Quaternary Research 24, 1–22.
Rosenthal, Y., Oppo, D.W., Linsley, B.K., 2003. The amplitude and
phasing of climate change during the last deglaciation in the Sulu
Sea, western equatorial Pacific, Geophysical Research Letters,
30(8), 2002GL016612.
Shin, S.-I., Liu, Z., Otto-Bliesner, B., Brady, E.C., Kutzbach, J.E.,
Harrison, S.P., 2003. A simulation of the last glacial
maximum climate using the NCAR-CCSM. Climate Dynamics
20, 127–151.
Stott, L., Poulsen, C., Lund, S., Thunell, R., 2002. Super ENSO and
global climate oscillations at millennial time scales. Science 297,
222–226.
Thiede, J., Nees, S., Schulz, H., De Deckker, P., 1997. Organic surface
conditions recorded on the sea floor of the southwest Pacific
Ocean through the distribution of foraminifers and biogenic
silica. Palaeogeography, Palaeoclimatology, Palaeoecology 131,
207–239.
Thompson, P.R., 1976. Planktonic foraminiferal dissolution
and the progress towards a Pleistocene equatorial Pacific
transfer function. Journal of Foraminiferal Research 6,
208–227.
Thompson, P.R., 1981. Planktonic foraminifera in the western north
Pacific during the past 150 000 years: comparison of modern and
fossil assemblages. Palaeogeography, Palaeoclimatology, Palaeo-
ecology 35, 241–279.

ARTICLE IN PRESSM.-T. Chen et al. / Quaternary Science Reviews 24 (2005) 1049–10621062
Ujiie, Y., Ujiie, H., 2000. Distribution and oceanographic relations of
modern planktonic foraminifera in the Ryukyu Arc region, northwest
Pacific Ocean. Journal of Foraminiferal Research 30 (4), 336–360.
Visser, K., Thunell, R., Stott, L., 2003. Magnitude and timing of
temperature changes in the Indo-Pacific warm pool during
deglaciation. Nature 421, 152–155.
Waelbroeck, C., Labeyrie, L., Duplessy, J.-C., Guiot, J., Labracherie,
M., Leclair, H., Duprat, J., 1998. Improving past sea surface
temperature estimates based on planktonic fossil faunas. Paleo-
ceanography 13 (3), 272–283.
Webster, P.N., Streeten, N., 1978. Late Quaternary ice age climates of
tropical Australia, interpretation and reconstruction. Quaternary
Research 10, 279–309.
WOA, 1998. World Ocean Atlas 1998, version 2, http://www.nodc.
noaa.gov/oc5/woa98.html. Technical report, National Oceano-
graphic Data Center, Silver Spring, Maryland.