ESR and TSL study of hole capture in PbWO4 - arXiv
21
ESR and TSL study of hole capture in PbWO 4 :Mo,La and PbWO 4 :Mo,Y scintillator crystals V.V. Laguta 1 , M. Nikl 1 , J. Rosa 1 , D. Savchenko 1 , S. Zazubovich 2 1 Institute of Physics AS CR, Cukrovarnicka 10, 162 53 Prague, Czech Republic 2 Institute of Physics, University of Tartu, Riia 142, 51014 Tartu, Estonia Abstract The processes of hole localization in double-doped PbWO 4 :Mo,La and PbWO 4 :Mo,Y single crystals have been studied by continuous wave and pulse electron spin resonance (ESR) and thermally stimulated luminescence (TSL) methods. We show that the holes created by the UV irradiation are preferably trapped at lattice oxygen ions in the vicinity of perturbing defects such as lead vacancies, impurity ions (La, Y, Mo), and other lattice imperfections. This leads to a variety of O - centers, which differ both by thermal stability (from about 170 K up to 240 K) and ESR parameters. The hole centers of this type were not observed neither in PbWO 4 :Mo nor in PbWO 4 :La(Y) crystals. The recombination processes of thermally released holes with electrons stored at different traps, including Pb + -WO 3 and (MoO 4 ) 3- centers, are systematically studied by TSL. Thermal stability parameters are defined by ESR and TSL techniques for different O - type defects. 1
-
Upload
khangminh22 -
Category
Documents
-
view
0 -
download
0
Transcript of ESR and TSL study of hole capture in PbWO4 - arXiv

ESR and TSL study of hole capture in PbWO4:Mo,La and PbWO4:Mo,Y scintillator crystals
V.V. Laguta1, M. Nikl1, J. Rosa1, D. Savchenko1, S. Zazubovich2
1Institute of Physics AS CR, Cukrovarnicka 10, 162 53 Prague, Czech Republic
2Institute of Physics, University of Tartu, Riia 142, 51014 Tartu, Estonia Abstract
The processes of hole localization in double-doped PbWO4:Mo,La and PbWO4:Mo,Y single crystals have
been studied by continuous wave and pulse electron spin resonance (ESR) and thermally stimulated
luminescence (TSL) methods. We show that the holes created by the UV irradiation are preferably
trapped at lattice oxygen ions in the vicinity of perturbing defects such as lead vacancies, impurity ions
(La, Y, Mo), and other lattice imperfections. This leads to a variety of O- centers, which differ both by
thermal stability (from about 170 K up to 240 K) and ESR parameters. The hole centers of this type were
not observed neither in PbWO4:Mo nor in PbWO4:La(Y) crystals. The recombination processes of
thermally released holes with electrons stored at different traps, including Pb+-WO3 and (MoO4)3- centers,
are systematically studied by TSL. Thermal stability parameters are defined by ESR and TSL techniques
for different O- type defects.
1

I. INTRODUCTION
PbWO4 (PWO) is a high-density scintillator with a fast intrinsic luminescence, which is successfully
applied in high-energy physics detectors. In this material, the intrinsic luminescence is of excitonic
nature, and charge transfer transitions at the (WO4)2- oxyanion complex give rise to the emission in the
blue spectral region [1-3]. It was shown in [4] that the blue emission spectrum consists of strongly
overlapping bands of the self-trapped exciton and various localized excitons. Mechanism of creation of
the localized excitons and their photo-thermally stimulated disintegration in PWO has been recently
reported in great details [4-5].
Because of the mentioned disintegration of the exciton-based emission centers, any shallow trap
states in the PWO lattice, taking part in carrier capture processes, become very important. They modify
the migration characteristics of free charge carriers through re-trapping. Consequently, the speed of their
delayed radiative recombination is altered. The simultaneous use of TSL and ESR experiments has
proved efficient to gain understanding about the nature of traps and details about the energy storage in the
PWO lattice. Specifically, electron traps are well investigated in this crystal (see, e.g., the last review [6]).
However, the question about the origin of the recombination partners in the TSL processes, i.e., the
counterpart hole traps, remains weakly understood.
Due to favorable properties of PWO (a high density, fast response, low cost), some research
laboratories tried to increase the light yield of PWO by doping [7-8]. Double doping by Mo6+ and A3+
(A=La, Y) ions appeared as the most successful way, providing a light yield increase by a factor of 2–3
[8-9] without deterioration of other scintillation characteristics. Similarly to undoped PWO, a favorable
influence of a trivalent rare-earth ion co-doping was found, evidenced by a lower concentration of
trapping states and higher radiation hardness with respect to PWO:Mo [9-10]. However, the defect
compensation appeared less efficient than in the undoped material, and a Mo clustering in PWO:Mo was
noticed at high Mo concentrations [9, 11]. Hence, the defects nature and their role in the energy transfer
and storage in PWO:Mo,A3+ deserves further studies. The origin of a composite TSL glow peak observed
in [5, 12] in the PWO:1200 ppm Mo, 80 ppm La crystal in the 170–250 K range requires further
investigations. In previous studies carried out for different undoped and Mo-doped PWO crystals, all the
TSL peaks in this temperature range were ascribed to the thermal destruction of various electron centers,
e.g., Pb+-WO3 centers [13], oxygen vacancy clusters with two trapped electrons [14-16], (MoO4)3- centers
[12, 15], etc. In these TSL peaks, the green G(II) emission (2.5 eV, FWHM=0.55 eV [17]) is observed
ascribed in [18] to the oxygen-deficient anion complexes in the form of WO3. As it has been shown in
[19, 20], this emission accompanies the optically and thermally stimulated tunneling recombination of
electron and hole centers in the 150-300 K temperature range. Thus, the origin of the G(II) emission is
2

strongly different from that of the relatively fast green G(I) emission observed at T<200 K under
photoexcitation in the Mo-related absorption band [17].
An indirect indication about existence of hole defects has been obtained in Mo,La-doped PWO
crystals [12]. There are also indirect ESR indications on the creation of hole centers in other PWO
crystals. For example, in the crystals grown by the Bridgman method, the thermal destruction of the hole
centers at 200-220 K is reflected in the lowering concentration of (MoO4)3- and (CrO4)3- electron centers
[14] which are thermally stable up to much higher temperatures. Due to the low probability of the hole
self-trapping in the PWO lattice [21], a hole stabilization by a defect seems to be necessary. Possible non-
paramagnetic character of the hole states suggests that a couple of trapped holes could be stabilized
around a lead vacancy (VPb) to restore the local charge balance [22, 23]. Such nonparamagnetic (VPb+2h)-
type hole centers can be responsible for some TSL peaks detected at 220-230 K [24].
Recently, we provided a direct evidence of an existence of intrinsic (related to regular lattice ions)
hole centers in PWO doped with Mo and La or Y by observation of their ESR spectra [25]. It was found
that holes created by the UV irradiation are trapped at a lattice oxygen ion nearby a lead ion vacancy
(VPb) and/or an impurity ion (e.g., La, Y, Mo), forming a variety of O- centers with thermal stability from
about 170 K up to 240 K. This enables the radiative recombination of freed holes with the electrons
localized at different traps, including Pb+-WO3 and (MoO4)3- centers, accompanied with the appearance of
the TSL peaks located around 190 K and in the 225-250 K temperature range. In the present paper,
characteristics of the O--related hole centers in PWO:Mo,La and PWO:Mo,Y crystals are studied in detail
by using correlated TSL and ESR measurements on the same crystals. In particular, we have determined
all spectral characteristics of O- centers. From measurement of concentration decay of trapped holes we
have determined thermal stability parameters such as ionization energies and frequency factors. These
parameters are in fair agreement with similar data obtained from analysis of TSL peaks.
II. EXPERIMENTALS
Two groups of Mo,La-doped PWO crystals were used in our investigation. The first one, #1, was
grown in Furkawa Co., Ltd., Japan (≈1200 ppm of Mo and 80 ppm of La in the crystal) from high purity
(5N) raw materials by the Czochralski method in air, using a platinum crucible and the third
crystallization method [26], and previously studied in [5, 12]. The second group of crystals, #2, (≈40 ppm
of Mo and 120 ppm of La) was grown in CRYTUR Ltd., Czech Republic, from 5N purity raw materials
by the same Czochralski method. The PWO:Mo,Y crystal, containing 1000 ppm Mo and 100 ppm Y, and
PWO:Mo crystal, containing 1000 ppm Mo were grown in Institute of Physics, Chech Republic by the
Czochralski method as well. For comparison, some measurements were made at the undoped PbWO4
crystal grown in Furukawa Co. and studied in [13, 24].
3
The PbWO4 crystal structure is characterized by the tetragonal space group I41/a or with the
unit-cell dimensions a = b = 5.456 Å and c = 12.020 Å. The W and Pb sites have the S4 point symmetry.
The O sites have only the trivial point symmetry. They are arranged in the tetrahedral coordination around
each W site. The WO4 tetrahedra are rotated around the c axis by an angle of 140. The main
crystallographic parameters of PWO can be found, e.g., in Ref. [27].
64hC
For ESR measurements, the crystals were oriented, cut in the (100) and (001) planes in a typical
shape of about 2.5×2.5×8 mm3, and polished. The continuous wave (CW) ESR measurements were
performed at 9.25-9.8 GHz with the standard 3 cm wavelength of the ESR spectrometer in the
temperature range 10-290 K using an Oxford Instrument cryostat. The pulsed ESR experiments were
performed with a Bruker E580 spectrometer with a dielectric resonator. A mercury high-pressure arc
lamp with optical filters was used for the UV irradiation of the samples.
For the thermally stimulated luminescence study, the crystal was selectively irradiated at 140-230 K
in the 4.7-3.5 eV energy range with the deuterium DDS-400 lamp through a monochromator (the spectral
width of the slit was 5 nm). The TSL curves were measured in the 140-300 K temperature range with the
heating rate of 0.2 K/s-1. The TSL intensity was detected by a photomultiplier with an amplifier and
recorder.
III. EXPERIMENTAL RESULTS AND DISCUSSION
A. CW ESR spectra
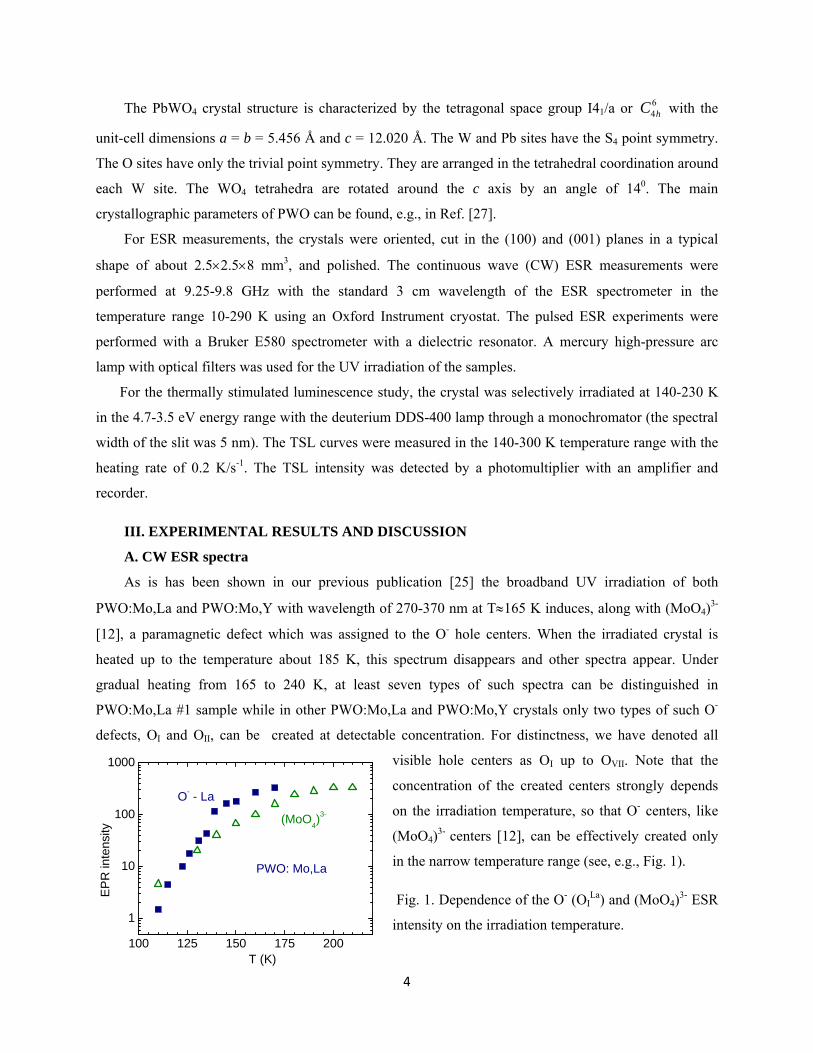
As is has been shown in our previous publication [25] the broadband UV irradiation of both
PWO:Mo,La and PWO:Mo,Y with wavelength of 270-370 nm at T≈165 K induces, along with (MoO4)3-
[12], a paramagnetic defect which was assigned to the O- hole centers. When the irradiated crystal is
heated up to the temperature about 185 K, this spectrum disappears and other spectra appear. Under
gradual heating from 165 to 240 K, at least seven types of such spectra can be distinguished in
PWO:Mo,La #1 sample while in other PWO:Mo,La and PWO:Mo,Y crystals only two types of such O-
defects, OI and OII, can be created at detectable concentration. For distinctness, we have denoted all
visible hole centers as OI up to OVII. Note that the
concentration of the created centers strongly depends
on the irradiation temperature, so that O- centers, like
(MoO4)3- centers [12], can be effectively created only
in the narrow temperature range (see, e.g., Fig. 1
100 125 150 175 200
1
10
100
1000
PWO: Mo,La
EP
R in
tens
ity
T (K)
(MoO4)3-
O- - La
).
Fig. 1. Dependence of the O- (OILa) and (MoO4)3- ESR
intensity on the irradiation temperature.
4

The spectral characteristics of the hole centers as determined from the fit of experimental angular
dependencies of the resonance fields are presented in Table I. The g tensor components, excepting the
OVII center, are typical for the O--type hole centers [28] and are close in value to those reported for
isostructural CaWO4 crystals where holes, however, are self-trapped [29].
300 310 320 330 340 350
Magnetic field (mT)
F=9252.1 MHz, T=90 K
a) PWO:Mo,Y
b) PWO:Mo,La
207Pb
207Pb+181W
a)
OII center
Gd3+
324 326 328 330 332
183W
207Pb(2)
Magnetic field (mT)
207Pb(1)
PbWO4: La,MoF=9224.3; T=90 K
OIV center
b)
326 328 330 332
207Pb(1)
Magnetic field (mT)
183W
207Pb(2)
PbWO4: La,MoF=9217.9; T=15 K
OVII center
c)
Fig. 2. Measured (points) and simulated (solid lines) ESR spectra of OII (a), OIV (b), and OVII (c) hole
centers showing the hf structure from 183W and 207Pb isotopes. A bit different structure of the central
components of OII center in PWO:Mo,La and PWO:Mo,Y is result of small deviation of crystal
orientation B II c, where four spectral lines merge into one.
In Table 1, we have also included the hyperfine (hf) constants in the cases when the corresponding
hf splitting due to the nearest nuclei with nonzero nuclear magnetic moment could be resolved and
analyzed with the sufficient reliability. As an example, Fig. 2 shows the simulation of the hf structure for
ESR spectra of OII center in PWO:Mo,La and PWO:Mo,Y crystals and OIV and OVII centers in
PWO:Mo,La #1 crystal. The electron-nuclear interactions being nearly isotropic are in the range from 0.5
mT for 207Pb up to 5.6 mT for 183W nuclei. However, much stronger (~35 mT) hf splitting was revealed in
the case of OII center (see Fig. 2(a)). These hf lines were overlooked in our previous study [25] due to
their really huge splitting. The intensities of these hf lines correspond to the interaction of a hole with 207Pb nucleus. As the OII spectrum is practically the same in the both types of PWO crystals, doped with
La or Y, one can conclude that it is produced by hole centers of the same origin. Complete simulation of
the hf structure (Fig. 2(a)) indicates that hole effectively interacts at least with two 207Pb and one 181W
nuclei. The local structure of this center can be similar to the Vk center in CaWO4 [29]. However,
essential difference from the Vk center in CaWO4 is that the trapped hole is mainly delocalized within 5
only one tetrahedron. The electron deficiency is also shifted from oxygen ion to the closest lead ion
producing high hf field at Pb nucleus. The second neighboring tetrahedron can be occupied by a Mo
impurity. Such perturbing defect is necessary in order to stabilize hole at a local energy level. Although 95,97Mo hf lines were not resolved in the CW spectrum due to weak their intensity and probably small hf
splitting comparable with the linewidth, the presence of Mo in the vicinity of O- ion can not be excluded
as the crystal was doped by this impurity. 2D HYSCORE spectrum shows that even OIY center contains
Mo ion at neighborhood of trapped hole (see section B).
B. Pulse EPR spectra and hyperfine sublevel correlation spectroscopy of OI hole center
In contrast to the OII center, which seems to have similar structure in both the La and Y doped PWO
crystals, the structure of the OI center essentially depends on type of impurity doping. In particular, hf
structure from 139La isotope is well resolved in La doped crystals [25]. However, expected hf structure
from 89Y nuclei is not resolved in Y doped crystals. In previous publication [25] this fact was reasonably
explained by a small value of 89Y nuclear magnetic moment so that the expected 89Y hf splitting is smaller
than the linewidth. In order to confirm our assignment of the OI spectrum to defect, the
PbWO4:Mo,Y crystals were investigated by echo-detected electron paramagnetic resonance (ED EPR)
and hyperfine sublevel correlation spectroscopy (HYSCORE) pulse techniques.
+ 2-Pb Pb[Y +V ]+O-
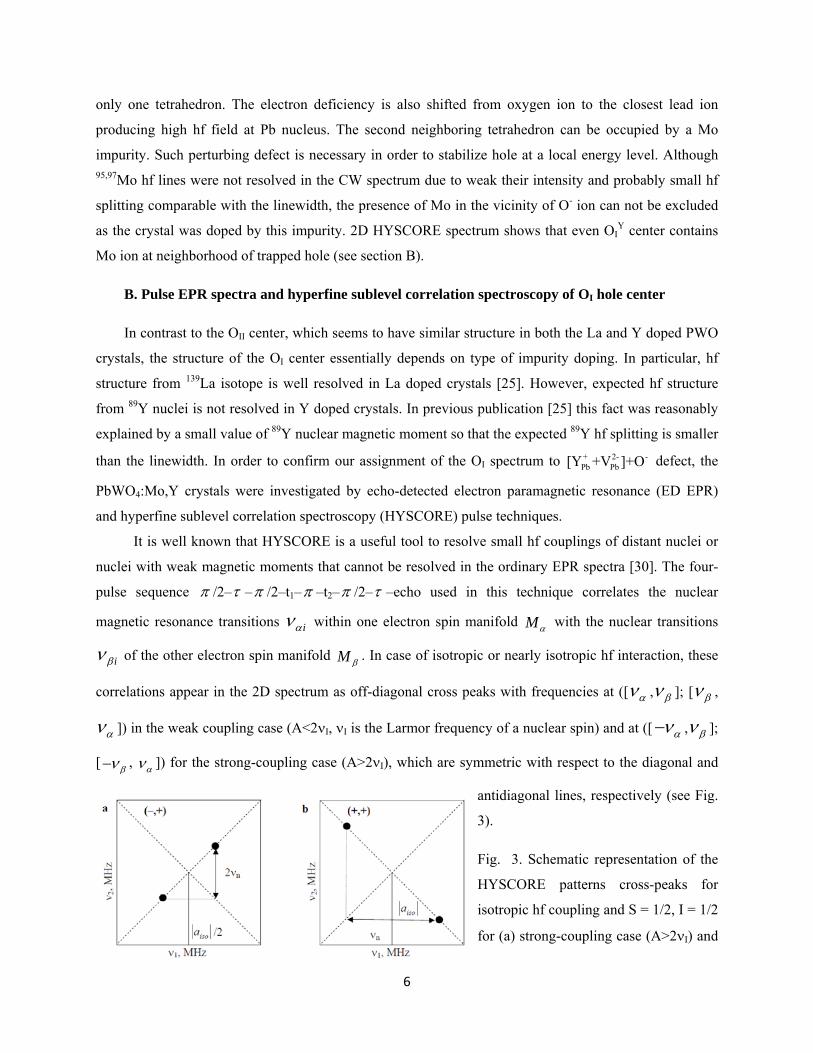
It is well known that HYSCORE is a useful tool to resolve small hf couplings of distant nuclei or
nuclei with weak magnetic moments that cannot be resolved in the ordinary EPR spectra [30]. The four-
pulse sequence π /2–τ –π /2–t1–π –t2–π /2–τ –echo used in this technique correlates the nuclear
magnetic resonance transitions iαν within one electron spin manifold Mα with the nuclear transitions
iβν of the other electron spin manifold M β . In case of isotropic or nearly isotropic hf interaction, these
correlations appear in the 2D spectrum as off-diagonal cross peaks with frequencies at ([ αν , βν ]; [ βν ,
αν ]) in the weak coupling case (A<2νI, νI is the Larmor frequency of a nuclear spin) and at ([ αν− , βν ];
[ βν− , αν ]) for the strong-coupling case (A>2νI), which are symmetric with respect to the diagonal and
antidiagonal lines, respectively (see Fig.
3).
Fig. 3. Schematic representation of the
HYSCORE patterns cross-peaks for
isotropic hf coupling and S = 1/2, I = 1/2
for (a) strong-coupling case (A>2νI) and
6

(b) weak-coupling case (A<2νI).
For the system with S = 1/2 and I > 1/2, the double-quantum transitions appear at frequencies [31]: 2 2 2 12[( / 2) (3 )]dq I A P /2ν ν η= ± + + , (1)
where is the nuclear quadrupole coupling frequency, and 2 / (4 )P e qQ= η is the asymmetry parameter
of the nuclear quadrupole interaction. Often, only these double-quantum transitions are well visible while
the single-quantum transitions are practically unresolved.
Finally, the dipole electron-nuclear hyperfine parameter B for system with axially symmetric g
tensor can be calculated from the maximum vertical shift Δνs of the cross peaks from the antidiagonal line
[32]:
2 83 2
s IB ν νΔ= . (2)
The ED EPR spectra were measured using two-pulse Hahn echo sequence: π /2–τ –π –τ –echo
with the pulse lengths: π /2 = 16 ns, τ = 400 ns, π = 32 ns. The pulse lengths for HYSCORE
experiment were: π /2 = 16 ns, π = 28 ns, t1 = t2 = 400 ns, time increment 30 ns. The τ values were:
160, 500, 680 and 800 ns. The spectra resolution was [256x256] points.
The ED EPR spectrum measured in PbWO4:Mo,Y crystal at T = 18 K after the UV light irradiation
at T = 155 K and further cooling down of the sample at dark is shown in Fig. 4. Note that for maximum
intensity of the ED spectrum from the O- ions, the measurements were performed at B II [001], where
four lines from four crystallographically equivalent centers merge into one spectral line. The ED spectrum
contain contributions from three paramagnetic centers: OI, Gd3+ and (MoO4)3–, in agreement with CW
measurements.
Fig. 4. The X-band ED EPR spectrum measured in
PbWO4:Mo,Y crystal at B II [001]) and T = 18 K after
irradiation of the crystal with UV light at T = 155 K. OI
spectrum is slightly distorted due to contribution of OVII
center.
The sum of HYSCORE spectra measured at the ED
EPR line position of OI center (B0 = 343.12 mT) with four
different τ values is presented in Fig. 5. It is seen from
this figure that there are three cross-peaks in (–, +) quadrant (strong-coupling case). The intense cross-
peaks at ([–6.71, 1.82], [–1.82, 6.71]) according to Eq. (1) were tentatively attributed to the double-
7

quantum transition of 95Mo (I = 5/2, 15.92 %, Iν = 0.96 MHz) and 97Mo (I = 5/2, 9.55%, Iν = 0.98
MHz) nuclei with small quadrupole contribution. The cross-peaks at ([–4.30, 2.54], [–2.54, 4.30]) were
attributed to hf interaction of hole with 89Y (I = 1/2, 100 %, Iν = 0.72 MHz) nuclei and the cross-peaks at
([–1.82, 0.52], [–0.52, 1.82]) can be assigned to hf interaction with 183W (I = 1/2, 14.31%, Iν = 0.62
MHz) nuclei.
In the (+, +) quadrant (weak-coupling case), there are six cross-peaks at ([0.65, 6.12], [6.12, 0.52]);
([0.65, 5.47], [5.47, 0.65]); ([0.98, 5.34], [5.34, 0.98]); ([1.30, 5.27], [5.27, 1.30]); ([1.69, 4.43], [4.43,
1.69]) and ([2.60, 3.65], [3.65, 2.60]) which are clearly related to hf interaction of a hole with 207Pb (I =
1/2, 22.1%, Iν = 3.07 MHz) nuclei. Some of 207Pb peaks are vertically shifted from the ν1 = -ν2 axis. This
shift is due to the dipole hf interaction.
The hf parameters for OI center with the surrounding nuclei in the [001] orientation obtained from
HYSCORE spectra analysis are represented in Table II. The B values were roughly estimated from the
cross peaks shift. It should be also noted that the spectral region of the hf frequencies detection in
HYSCORE experiments is usually limited by dead time of detection system to 20-30 MHz. Therefore, all
hf interactions with higher frequencies presented in Table I are not visible in such experiment.
Fig. 5. The sum of X-band HYSCORE spectra measured in PbWO4:Mo,Y crystal on the ED EPR position
of OI center (B0 = 343.12 mT) with different τ values. T = 18 K.
For the more precise determination of the shf parameters given in Table II, the angular dependence
of HYSCORE spectra should be measured.
8
C. Thermal stability and local energy levels of the hole centers
The last column in Table I contains thermal stability parameters, such as the temperature of the
thermal stability, ionization energy (trap depth), and frequency factor. These thermal parameters were
roughly determined by the method of pulsed heating and in case of OI and OII centers they were more
precisely determined by direct measurements of the temperature dependences of ionization probability of
corresponding center.
140 160 180 200 220 240 260
0.0
0.1
0.2
0.3
0.4
0.5
0.6
0.7
O- re
lativ
e co
ncen
tratio
n
T (K)
PWO: Mo,La
OI
OII
OIII-IV
OVII
OV-OVI
(MoO4)3-
a)
0.0045 0.0050 0.0055 0.0060
-8
-7
-6
-5
-4
-3
-2
E(OYII)=0.62 eV
E(OLaII )=0.44 eV
E(OYI)=0.44 eV
PWO:Mo,La PWO:Mo,Y
1/τ
(s-1)
1/T (K-1)
E(OLaI )=0.40 eV
b)
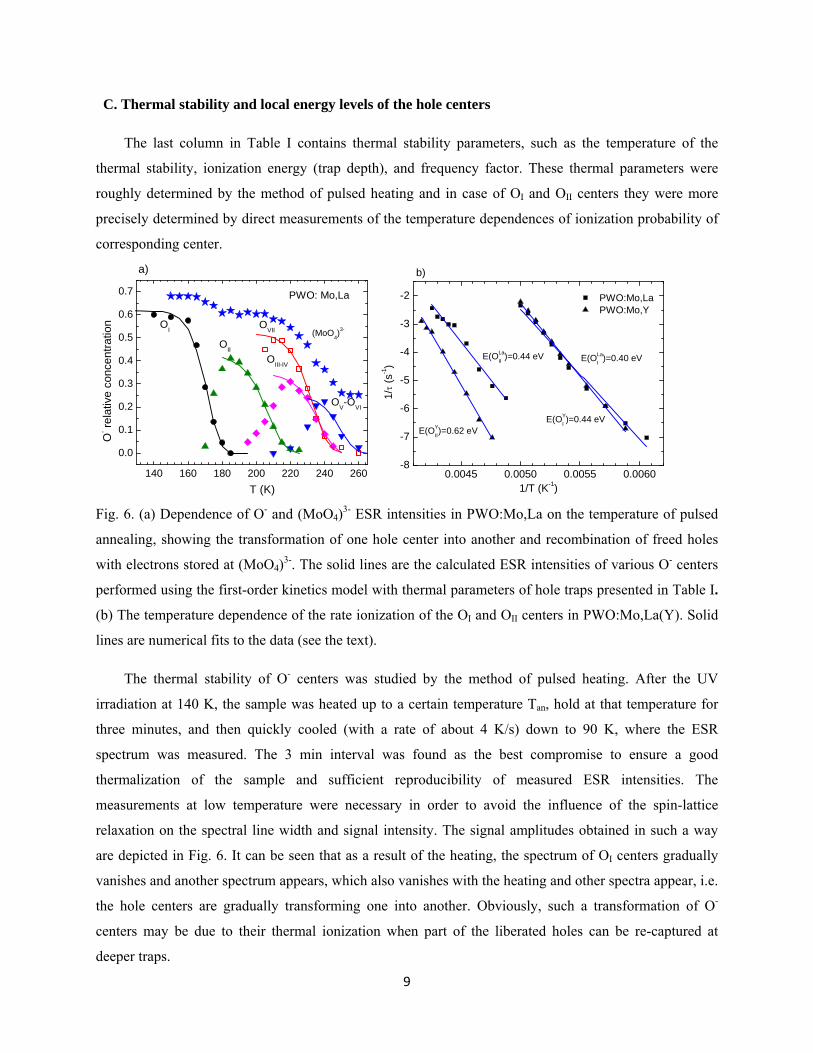
Fig. 6. (a) Dependence of O- and (MoO4)3- ESR intensities in PWO:Mo,La on the temperature of pulsed
annealing, showing the transformation of one hole center into another and recombination of freed holes
with electrons stored at (MoO4)3-. The solid lines are the calculated ESR intensities of various O- centers
performed using the first-order kinetics model with thermal parameters of hole traps presented in Table I.
(b) The temperature dependence of the rate ionization of the OI and OII centers in PWO:Mo,La(Y). Solid
lines are numerical fits to the data (see the text).
The thermal stability of O- centers was studied by the method of pulsed heating. After the UV
irradiation at 140 K, the sample was heated up to a certain temperature Tan, hold at that temperature for
three minutes, and then quickly cooled (with a rate of about 4 K/s) down to 90 K, where the ESR
spectrum was measured. The 3 min interval was found as the best compromise to ensure a good
thermalization of the sample and sufficient reproducibility of measured ESR intensities. The
measurements at low temperature were necessary in order to avoid the influence of the spin-lattice
relaxation on the spectral line width and signal intensity. The signal amplitudes obtained in such a way
are depicted in Fig. 6. It can be seen that as a result of the heating, the spectrum of OI centers gradually
vanishes and another spectrum appears, which also vanishes with the heating and other spectra appear, i.e.
the hole centers are gradually transforming one into another. Obviously, such a transformation of O-
centers may be due to their thermal ionization when part of the liberated holes can be re-captured at
deeper traps.
9

In order to get a deeper insight into kinetics of the trapped holes and determine their thermal stability
parameters, we have performed the numerical simulation of the ESR signal intensities. By neglecting the
possibility of carriers recapture as suggested by the first-order kinetics, the concentration of localized
holes is given by a simple exponential decay:
0 exp( ( ) ),n n P T t= −
where n0 is the initial concentration of trapped holes, P(T) is the probability of their thermal ionization
which is expressed in the form of Arrhenious law 0( ) exp( / )tP T f E kT= − , and t is the annealing time.
Here f0 is a frequency factor and Et stands for the ionization energy (trap depth). The results of the
simulation are shown in Fig. 6(a) by the solid lines for all the hole centers studied in PWO:Mo,La. For
comparison, the thermal decay of the electrons trapped at Mo tetrahedra is shown as well. One can see
that the thermal destruction of hole centers is accompanied with the corresponding decrease in the
concentration of electron (MoO4)3- centers. This proves the recombination of liberated holes with
(MoO4)3- centers which are stable up to higher temperatures. The determined thermal stability parameters
(the ionization energies Et and frequency factors f0) are listed in Table I.
In case of OI and OII centers, we were able to measure the decay rate 1/ ( ) ( )T P Tτ = of O-
concentration after turning off the irradiation. The concentration decay of localized holes obeys simple
exponential time dependence. Such dependence characterizes the first order kinetic process. The slope of
logarithm of the ionization probability as a function of the inverse temperature gives the thermal
ionization energy (see Fig. 6(b)) and the frequency factor f0 = NcSν can be calculated as well.
In spite of the fact that g tensors of OII center in the both La and Y doped PWO crystals are
practically the same, the thermal parameters, such as the thermal ionization energy, are distinctly different
(see, e.g. Table I). This fact can be understood taking into account that g factors change only due to the
spin-orbit coupling and therefore are not such sensitive to defect structure as a local energy level of a
defect. The energy structure of the hole center can slightly vary depending on the position of perturbing
impurities with respect to oxygen ions.
D. TSL results and their correlation with ESR data
The recombination process with participation of electron and hole centers can be studied by
measurements of TSL. The TSL glow curves measured after the UV irradiation of the PWO:Mo,La #2
and PWO:Mo,Y crystals at various temperatures in the band-to-band (4.7 eV), exciton (around 4.1 eV),
and Mo-related (around 3.8 eV) absorption regions are shown in Figs. 7 and 8. For comparison, the TSL
curves of the PWO:Mo crystal as well as the undoped PWO crystal studied in [13, 24] are presented in
Fig. 9. Figs. 7-9 illustrate that in all the crystals studied, the TSL glow curves are very complicated and
consist of many strongly overlapping peaks.
10
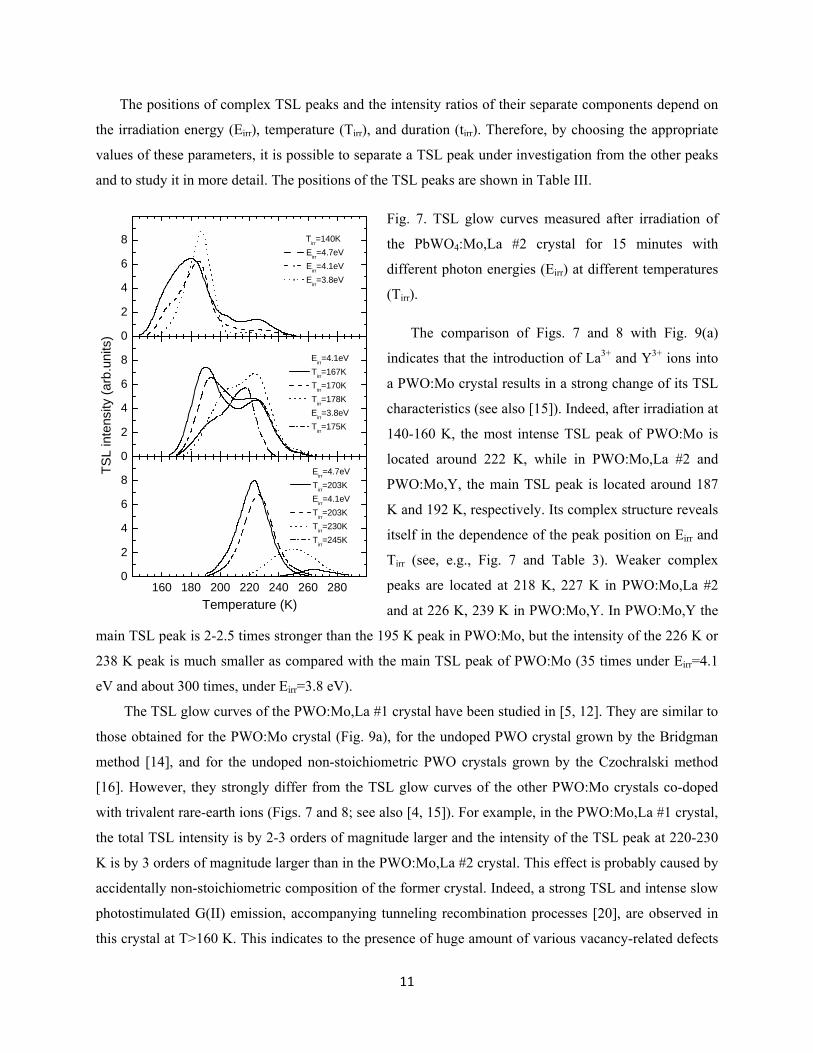
The positions of complex TSL peaks and the intensity ratios of their separate components depend on
the irradiation energy (Eirr), temperature (Tirr), and duration (tirr). Therefore, by choosing the appropriate
values of these parameters, it is possible to separate a TSL peak under investigation from the other peaks
and to study it in more detail. The positions of the TSL peaks are shown in Table III.
Fig. 7. TSL glow curves measured after irradiation of
the PbWO4:Mo,La #2 crystal for 15 minutes with
different photon energies (Eirr) at different temperatures
(Tirr).
The comparison of Figs. 7 and 8 with Fig. 9(a)
indicates that the introduction of La3+ and Y3+ ions into
a PWO:Mo crystal results in a strong change of its TSL
characteristics (see also [15]). Indeed, after irradiation at
140-160 K, the most intense TSL peak of PWO:Mo is
located around 222 K, while in PWO:Mo,La #2 and
PWO:Mo,Y, the main TSL peak is located around 187
K and 192 K, respectively. Its complex structure reveals
itself in the dependence of the peak position on Eirr and
Tirr (see, e.g., Fig. 7 and Table 3). Weaker complex
peaks are located at 218 K, 227 K in PWO:Mo,La #2
and at 226 K, 239 K in PWO:Mo,Y. In PWO:Mo,Y the
main TSL peak is 2-2.5 times stronger than the 195 K peak in PWO:Mo, but the intensity of the 226 K or
238 K peak is much smaller as compared with the main TSL peak of PWO:Mo (35 times under Eirr=4.1
eV and about 300 times, under Eirr=3.8 eV).
0
2
4
6
8
0
2
4
6
8
160 180 200 220 240 260 2800
2
4
6
8
Tirr=140K Eirr=4.7eV Eirr=4.1eV Eirr=3.8eV
Eirr=4.1eV Tirr=167K Tirr=170K Tirr=178K
Eirr=3.8eV Tirr=175K
TSL
inte
nsity
(arb
.uni
ts)
Eirr=4.7eV Tirr=203K
Eirr=4.1eV Tirr=203K Tirr=230K Tirr=245K
Temperature (K)
The TSL glow curves of the PWO:Mo,La #1 crystal have been studied in [5, 12]. They are similar to
those obtained for the PWO:Mo crystal (Fig. 9a), for the undoped PWO crystal grown by the Bridgman
method [14], and for the undoped non-stoichiometric PWO crystals grown by the Czochralski method
[16]. However, they strongly differ from the TSL glow curves of the other PWO:Mo crystals co-doped
with trivalent rare-earth ions (Figs. 7 and 8; see also [4, 15]). For example, in the PWO:Mo,La #1 crystal,
the total TSL intensity is by 2-3 orders of magnitude larger and the intensity of the TSL peak at 220-230
K is by 3 orders of magnitude larger than in the PWO:Mo,La #2 crystal. This effect is probably caused by
accidentally non-stoichiometric composition of the former crystal. Indeed, a strong TSL and intense slow
photostimulated G(II) emission, accompanying tunneling recombination processes [20], are observed in
this crystal at T>160 K. This indicates to the presence of huge amount of various vacancy-related defects
11

which causes a strong complexity of TSL characteristics
of the PWO:Mo,La #1 crystal. Unlike this crystal, under
photoexcitation of the PWO:Mo,La #2 and PWO:Mo,Y
crystals, only the G(I) emission (2.37 eV, FWHM=0.47
eV at 80 K) is observed. The excitation band of this
emission is located at 3.85 eV. The intensity of the G(I)
emission in these crystals decreases twice at 175-180 K
with the activation energy 0.23 eV.
2
4
6
8
10
160 180 200 220 240 260 280
2
4
6
8
10
TSL
inte
nsity
(arb
.uni
ts)]
Tirr=140K Eirr=4.7eV Eirr=4.1eV Eirr=3.8eV
Eirr=4.7ev Tirr=198K Eirr=4.1ev Tirr=175K Eirr=4.1ev Tirr=225K Eirr=3.8ev Tirr=205K
Temperature (K)
Fig. 8. TSL glow curves measured after irradiation of the
PbWO4:Mo,Y crystal for 15 minutes with different
photon energies (Eirr) at different temperatures (Tirr).
As the paramagnetic O--type hole centers are not detectable in undoped PWO and in PWO:Mo, the
TSL peaks, characteristic only for the La3+- and Y3+-codoped PWO:Mo crystals, are assumed to arise
from these hole centers. To identify the origin of various TSL peaks, the parameters of the corresponding
traps (trap depths Et and frequency factors f0) were determined from the TSL data and compared with
those obtained by the ESR method. For comparison, the Et values were calculated also for the PWO:Mo
crystal. The Et values were determined by the partial cleaning method (for more details see [12]) from the
ln ITSL(1/T) dependences after heating of the UV-irradiated sample up to the selected temperature Tstop.
Due to the complex structure of the TSL peaks, the Et values depend on Tstop. Therefore, they were
obtained for many values of Tstop (and also of Tirr) from the 150-240 K temperature range (Fig. 10). The
deviations from the average Et values were 5-10 %. The frequency factors f0 were calculated with the use
of the expression
0
2
4
6
8
a Tirr=150K Tirr=225K Eirr=4.5ev Eirr=4.1ev Eirr=4.1ev Eirr=3.8ev
160 180 200 220 240 260 280012345 Tirr=150 K
Eirr=4.1 eV
b
TS
L in
tens
ity (a
rb.u
nits
)]
Temperature (K)
f0=(βEt / kTm2) exp (Et / kTm),
where β is the crystal heating rate, k is the Boltsman
factor and Tm is the maximum position of the TSL peak.
The average values of the Et and f0 parameters are
shown in Table IV.
For the 187 K and 227 K peaks in PWO:Mo,La #2
Fig. 9. TSL glow curves measured after irradiation of (a)
the PbWO4:Mo crystal and (b) the undoped PbWO4
crystal for 15 minutes with different photon energies
(Eirr) at different temperatures (Tirr).
12

and
Fig. 10. Dependences of Et values on Tstop or Tirr
As it is evident from Fig. 10, at the high-
tem
0.8
192 K and 238 K peaks in PWO:Mo,Y, the parameters are close to the Et and f0 values obtained by
the ESR method for hole OI and OII centers, respectively (Table 1). One can conclude that these TSL
peaks are surely connected with the thermal destruction of OI and OII centers. For the PWO:Mo,La #1
crystal, smaller Et values (0.36 eV and 0.40 eV) are obtained for the TSL peaks observed at ≈186 K and
≈220 K, probably, due to their strong overlap with other peaks. For the weak TSL peaks around 250 K,
the values of Et and f0 in both PWO:Mo,La crystals are close to the parameters obtained by the ESR
method for OIII, OIV, OVII centers. However, these peaks are strongly overlapped with the 250 K peak
which arises from the thermal destruction of electron (MoO4)3- centers and has similar parameters. The
values Et≈0.53 eV, f0~109 s-1 are obtained for this peak in the PWO:Mo crystal where the O- -type hole
centers are not detectable in ESR. Note that for this crystal, much larger values of Et (0.60-0.75 eV) are
obtained for the TSL peaks located around 190 K and in the 225-240 K temperature range as compared
with those in PWO:Mo,La and PWO:Mo,Y (Fig. 10). The TSL peak at 265 K, probably arising from OV,
OVI centers, is also observed in both the PWO:Mo,La crystals studied (Fig. 7) but it is too weak to be
analyzed. Note that due to different crystal heating conditions used at the TSL and ESR studies, each TSL
peak is shifted towards higher temperatures with respect to the temperature (Tq) where the ESR signal
intensity from the corresponding center decreases twice (see Table III).
0.0
0.2
0.4
0.6
0.0
0.2
0.4
0.6
0.8
150 175 200 2250.0
0.2
0.4
0.6
0.8
PWO:Mo
PWO:Mo,Y
4.7eV 4.1eV 3.8eV
PWO:Mo,La
4.7eV 4.1eV 3.8eV
Trap
dep
th (e
V)
4.7eV 4.1eV 3.8eV
Temperature (K)
measured for PWO:Mo,La, PWO:Mo,Y and
PWO:Mo crystals under irradiation in the band-to-
band (4.7 eV, closed circles), exciton (≈4.10 eV, open
circles), and Mo-related (around 3.8 eV, open
triangles) absorption regions.
perature side of the main TSL peak in
PWO:Mo,La #2 and PWO:Mo,Y, an additional TSL
peak is present whose parameters are similar to those
obtained in [13] for electron Pb+ centers located close
to the oxygen vacancies of the type of WO3: Et≈0.56
eV, f0~1013 s-1. In the undoped PbWO4 crystals studied
in [13, 24], this peak is observed at the same
experimental conditions at about 193 K (Fig. 9(b)).
One can conclude that the hole-related TSL peaks
13

located at 187 K in PWO:Mo,La and at 192 K in PWO:Mo,Y are strongly overlapped with the ≈193 K
TSL peak arising from Pb+-WO3 centers.
The TSL characteristics were studied also for the PWO:100 ppm Mo, 100 ppm Y crystal and the
same peaks were observed at the TSL glow curve. However, the relative intensity of the ≈192 K peak in
this crystal was about two times larger as compared with the PWO:1000 ppm Mo, 100 ppm crystal,
probably, due to a larger concentration of oxygen vacancies. Like in the case of the PWO:1000 ppm Mo,
100 ppm Y crystal, four stages were clearly seen at the Et(Tstop) dependence with the Et values of about
0.45 eV, 0.56 eV, 0.63 eV and 0.52 eV, arising from OI-, Pb+-WO3, OII
-, and (MoO4)3- centers,
respectively (compare with Fig. 10).
The creation spectra of the TSL peaks in PWO:Mo,La #2 and PWO:Mo,Y are similar (Fig. 11). The
peaks at 165-180 K, 227 K and 238 K, as well as the peak around 250 K (obtained after heating of the
irradiated crystal up to 230 K followed by a quick cooling down to 140 K) are most effectively created
under irradiation in the band-to-band and exciton absorption regions. The complex 187 K and 192 K
peaks are effectively created also in the Mo-related region (see also Figs. 7 and 8). Similar creation
spectrum was obtained in [4] for the TSL peak ascribed to Pb+-WO3 centers. This fact confirms our
conclusion that the higher-temperature component of the main complex TSL peak of the crystals studied
arises from the electron Pb+-WO3 centers.
The activation energies Ea for the creation of the
TSL peaks at 187 K and 227 K in PWO:Mo, La #2 and
at 192 K and 238 K in PWO:Mo,Y are similar and vary
from 0.1 eV under irradiation at 4.4 eV to about 0.20 eV
at Eirr<4.15 eV (see the inset in Fig. 11). The value of
Ea=0.19 eV for the creation of hole OI centers in
PWO:Mo,La was obtained also from the temperature
dependence of the OILa ESR intensity shown in Fig. 1.
0
2
4
6
8
10
0
2
4
6
8
10
4.50 4.25 4.00 3.75 3.500
2
4
6
8
10
4.4 4.2 4.0 3.80.0
0.1
0.2
a
c
Tirr=140K 185-192K 218-227K
b
TSL
inte
nsity
(arb
.uni
ts)
Tirr=178K ~202K 218-227K 250K
Photon energy (eV)
Tirr=140K 193K 238K
Photon energy [eV]
Act
iv. e
nerg
y (e
V)
Fig. 11. Creation spectra of some TSL peaks measured
after the UV irradiation of the (a, b) PbWO4:Mo,La #2
and (c) PWO:Mo,Y crystals at different temperatures
(Tirr). In the inset: the dependence of the activation
energy for the creation of the ≈187 K (closed circles)
and 218-227 K (open circles) TSL peaks in the
PWO:Mo, La #2 crystal on the irradiation energy Eirr.
14

At the initial irradiation stage, the linear dependence on the irradiation duration was obtained both for
the number of paramagnetic OI centers and the TSL intensity around 190 K in the PWO:Mo, La #2
crystal.
In the TSL spectrum of undoped and Mo-doped PWO crystals, the G(II) emission (2.5 eV) was found
to dominate [19-20]. The maximum of the TSL spectrum of the PWO:Mo,Y crystal, measured around
190 K and 235 K, is located at 2.4 eV (Fig. 12, solid line), i.e., closer to the Mo-related G(I) emission
band which at any temperature in all the crystals studied is peaking at 2.37 eV (dotted line). This allows
to suggest that in the mentioned crystals, thermally released holes recombine mainly with electrons stored
at (MoO4)3- centers. This recombination process is directly visible in temperature decay of (MoO4)3-
concentration shown in Fig. 6(a). After heating of the irradiated PWO:Mo crystal up to 230 K, mainly the
Mo-related 250 K peak remains at the glow curve. The TSL spectrum in this temperature range has the
maximum at 2.48 eV (dashed line). One can conclude that the recombination of thermally released
electrons with the trapped holes results in the appearance of the G(II) emission. The dominating complex
TSL peak, observed in these crystals around 222 K, can arise from the thermal destruction of both the
non-paramagnetic electron centers (e.g., clusters of oxygen vacancies with two trapped electrons) and
non-paramagnetic hole centers (e.g., lead vacancies with two trapped holes). Indeed, the noticeable
reduction of the number of electron (MoO4)3- and (CrO4)3- centers in PWO has been observed just in this
temperature range [12, 14], although the thermally stimulated release of electrons from these centers takes
place at higher temperatures. This effect can be caused by the thermal destruction of the above mentioned
non-paramagnetic hole centers and recombination of the released holes with (MoO4)3- or (CrO4)3- groups
(see also [24]). If so, the complex band consisting of both the G(II) and G(I) emission should be observed
in the TSL spectrum around 222 K. Indeed, a wide (FWHM=0.6 eV) emission peaking at 2.45 eV is stimulated in this temperature range.
2.9 2.8 2.7 2.6 2.5 2.4 2.3 2.2 2.1 2.002468
1012
Inte
nsity
(arb
.uni
ts)
Photon energy (eV)
2.48eV2.4eV
2.37eVFig. 12. TSL spectra measured at 230-240 K for
the PWO:Mo,Y crystal (solid line) and around
250 K for the PWO:Mo crystal (dashed line). The
G(I) emission spectrum measured at 240 K under
3.6 eV excitation (dotted line).
IV. CONCLUSIONS
Detailed ESR measurements of PbWO4:Mo,La(Y) single crystals have shown that the holes created by
the UV irradiation can be trapped at regular oxygen ions nearby a perturbing defect such as a lead
15
vacancy, an impurity ion (La, Y, Mo) or another unidentified lattice perturbation, forming a variety of O-
centers with the thermal stability from about 170 K up to 240 K. The hole state (an electron deficiency at
an oxygen ion) is essentially delocalized over the surrounding ions resulting in rich hf structure of
corresponding ESR spectrum. The same ESR characteristics have been observed for the samples of
different origin and purity. Therefore, the behavior of the hole centers described above seems to be
characteristic of PbWO4:Mo,La(Y) itself. However, we emphasize that described here O- centers were
observed only in the doubly (Mo,La and Mo,Y) doped crystals. In our opinion, the presence of Mo
impurity was necessary in order to create a measurable number of traps for electrons and consequently
increased number of trapped holes. La3+ and Y3+ impurities also enable partial charge compensation of
lead vacancies in the vicinity of which the single hole can be localized at oxygen ion to provide the full
charge compensation of the lead vacancy defect. Without these impurities, holes should be preferably
trapped by a single lead vacancy forming the non paramagnetic {VPb+2h}-type centers.
The thermal release of the trapped holes and their subsequent radiative recombination with the
electrons stored at different traps, including Pb+-WO3 and (MoO4)3- centers, results in the appearance of
the TSL peaks located around 190 K and in the 225-250 K temperature range. The comparison of the
thermal stability parameters obtained by the ESR method for hole OI and OII centers with those obtained
for the TSL peaks at 187 K and 227 K in PWO:Mo,La #2 and at 192 K and 238 K in PWO:Mo,Y allows
the conclusion that the above-mentioned TSL peaks are surely connected with the thermal destruction of
the OI and OII centers. These peaks are most effectively created in the band-to-band and exciton
absorption region, i.e. at Eirr>4 eV. The activation energy for the hole centers creation under excitation in
the exciton region is about 0.2 eV.
ACKNOWLEDGEMENTS
The authors gratefully acknowledge the financial support of the Czech project GA AV IAA100100810,
the SAFMAT project CZ.2.16/3.1.00/22132, and the Estonian Science Foundation project No. 8678. The
authors are also grateful to Prof. Pöppl (University of Leipzig) for the useful discussion of the results
obtained.
16

References
[1] W. van Loo, Phys. Status Solidi A 27, 565 (1975); 28, 227 (1975).
[2] M. J. Treadaway and R. C.Powell, J. Chem. Phys. 61, 4003 (1974).
[3] M. J. J. Lammers, G. Blasse, and D. S. Robertson, Phys. Status Solidi A 63, 569 (1981).
[4] A. Krasnikov, M. Nikl, and S. Zazubovich, Phys. Status Solidi B 243, 1727 (2006).
[5] V. V. Laguta, M. Nikl, and S. Zazubovich, Radiat. Measur. 42, 515 (2007); IEEE Transactions on
Nuclear Science 55, 1275 (2008).
[6] M. Nikl, V. V. Laguta, and A. Vedda, Phys. Status Solidi B 245, 1701 (2008).
[7] M. Nikl, P. Bohacek, A. Vedda, M. Martini, G. P. Pazzi, P. Fabeni, and M. Kobayashi, Phys. Status
Solidi A 182, R3 (2000).
[8] A. A. Annenkov, A. E. Borisevich, A. Hofstaetter, M. V. Korzhik, P. Lecoq, V. D. Ligun, O. V.
Misevitch, R. Novotny, and J. P. Peigneux, Nucl. Instr. Methods Phys. Res. A 450, 71 (2000).
[9] M. Nikl, P. Bohacek, E. Mihokova, N. Solovieva, A. Vedda, M. Martini, G. P. Pazzi, P. Fabeni, and
M. Kobayashi, J. Appl. Phys. 91, 2791 (2002).
[10] J. Pejchal, P. Bohacek, M. Nikl, V. Mucka, M. Pospisil, M. Kobayashi, and Y. Usuki, Radiat.
Measur. 38, 385 (2004).
[11] A. Hofstaetter, R. Oeder, A. Scharmann, D. Schwabe, and B. Vitt, Phys. Status Solidi B 89, 375
(1978).
[12] V. V. Laguta, A. Vedda, D. Di Martino, M. Martini, M. Nikl, E. Mihokova, J. Rosa, and Y. Usuki,
Phys. Rev. B 71, 235108 (2005).
[13] V. V. Laguta, M. Martini, A. Vedda, M. Nikl, E. Mihokova, P. Bohacek, J. Rosa, A. Hofstaetter, B.
K. Meyer, and Y. Usuki, Phys. Rev. B 64, 165102 (2001).
[14] A. Krasnikov, V. V. Laguta, M. Nikl, and S. Zazubovich, J. Phys.: Condens. Matter 19, 306202
(2007).
[15] P. Fabeni, A. Krasnikov, V. V. Laguta, M. Nikl, G. P. Pazzi, C. Susini, and S. Zazubovich, Radiat.
Measur. 42, 807 (2007).
[16] S. Zazubovich and M. Nikl, Phys. Status Solidi B 247, 385 (2010).
[17] V. Babin, P. Bohacek, A. Krasnikov, M. Nikl, A. Stolovits, and S. Zazubovich, J. Lumin. 124, 113
(2007).
[18] J. A. Groenink and G. Blasse, J. Solid State Chem. 32, 9 (1980).
[19] P. Fabeni, V. Kiisk, A. Krasnikov, M. Nikl, G. P. Pazzi, I. Sildos, and S. Zazubovich, Phys. Status
Solidi C 4, 918 (2007).
[20] P. Fabeni, A. Krasnikov, T. Kärner, V. V. Laguta, M. Nikl, G. P. Pazzi, and S. Zazubovich, J.
Lumin. 129, 767 (2009).
17

[21] Y. B. Abraham, N. A. W. Holzwarth, R. T. Williams, G. E. Matthews, and A. R. Tackett, Phys. Rev.
B 64, 245109 (2001).
[22] A. A. Annenkov, M. V. Korzhik, and P. Lecoq, Nucl. Instrum. Methods Phys. Res. A 490, 30
(2002).
[23] L. Tingyu, Z. Qiren, and Z. Songlin, Solid State Commun. 132, 169 (2004).
[24] V. V. Laguta, M. Nikl, S. Zazubovich, IEEE Transactions on Nuclear Science (2012).
[25] V. V. Laguta, M. Buryi, M. Nikl, J. Rosa, and S. Zazubovich, Phys. Rev. B 83, 094123 (2011).
[26] M. Kobayashi, M. Ishii, K. Harada, Y. Usuki, H. Okuno, and T. Yazawa, Nucl. Instrum. Methods
Phys. Res. A 373, 333 (1996).
[27] J. M. Moreau, Ph. Galez, J. P. Peigneux, and M. V. Korzhik, J. Alloys Compd. 238, 46 (1996).
[28] O. F. Schirmer, J. Phys.: Condens. Matter 18, R667 (2006).
[29] R. Biederbick, G. Born, A. Hofstaetter, and A. Scharmann, Phys. Status Solidi B 69, 55 (1975).
[30] P. Höfer, A. Grupp, H. Nebenführ, and M. Mehring, Chem. Phys. Lett. 132, 272 (1986).
[31] A. Schweiger and G. Jeschke, in: Principles of pulse electron paramagnetic resonance (Oxford
University Press, 2001, p. 49).
[32] A. Pöppl and L. Kevan, J. Phys. Chem. 100, 3387 (1996).
18

Table I. Spectral characteristics of hole traps in PbWO4:Mo,La(Y) crystals obtained from the ESR data.
Principal axis directions of g tensors are given by polar (θ) and azimuthal (ϕ) angles relative to a,b,c
crystal axes and presented for one of four equivalent centers. The error margin of the polar and azimuthal
angles is approximately 2 deg.
Center g tensor Principal axes HF interaction*)
(10-4 cm-1)
Thermal stability
Parameters θ ϕ
OILa g[001]: 2.027(5)
g[100]: 2.010(5)
not
determ.
ALa: 0.9 mT
~165 K **)
Et=0.40(2) eV, f0≈109 1/s
OIY g1: 2.0142(5)
g2: 2.0274(5)
g3: 2.0503(5)
46
78
47
351
93
194
AW: 1.5 mT
APb: 2.8 mT
~160 K
Et=0.44(2) eV, f0≈1010 1/s
OII g1: 1.9973(5)
g2: 2.0094(5)
g3: 2.0400(5)
100
134
45
22
122
102
A1Pb: 34.8 mT
A2Pb: 1.4 mT
AW: 1.4 mT
∼190-210 K
EtLa = 0.44(2) eV, f0
La ≈ 108 1/s
EtY = 0.62(2) eV, f0
Y ≈ 1012 1/s
OIII g1: 1.9997(2)
g2: 2.0089(2)
g3: 2.0350(2)
91
127
37
350
80
79
not resolved
~220 K
Et=0.56(4) eV, f0 ~109 1/s
OIV g1: 2.0027(2)
g2: 2.0064(2)
g3: 2.0128(2)
106
41
53
29
319
106
AW: 5.6 mT
A1Pb: 1.9 mT
A2Pb: 0.5 mT
~220 K
Et=0.56(4) eV, f0 ~109 1/s
OV-VI
g[001]: 2.035(1)
g[100]: 2.015(1)
not
determ.
not resolved
~240 K
Et=0.72(4) eV, f0 ~1012 1/s
OVII g1: 2.0001(4)
g2: 2.0007(4)
g3: 2.0029(4)
102
43
49
119
197
40
AW: 4.58 mT
A1Pb: 1.15 mT
A2Pb: 0.52 mT
~210 K
Et=0.55(4) eV, f0 ~109 1/s
*) HF splitting is measured along c axis. **) Temperature of the thermal stability, see Fig. 6.
19
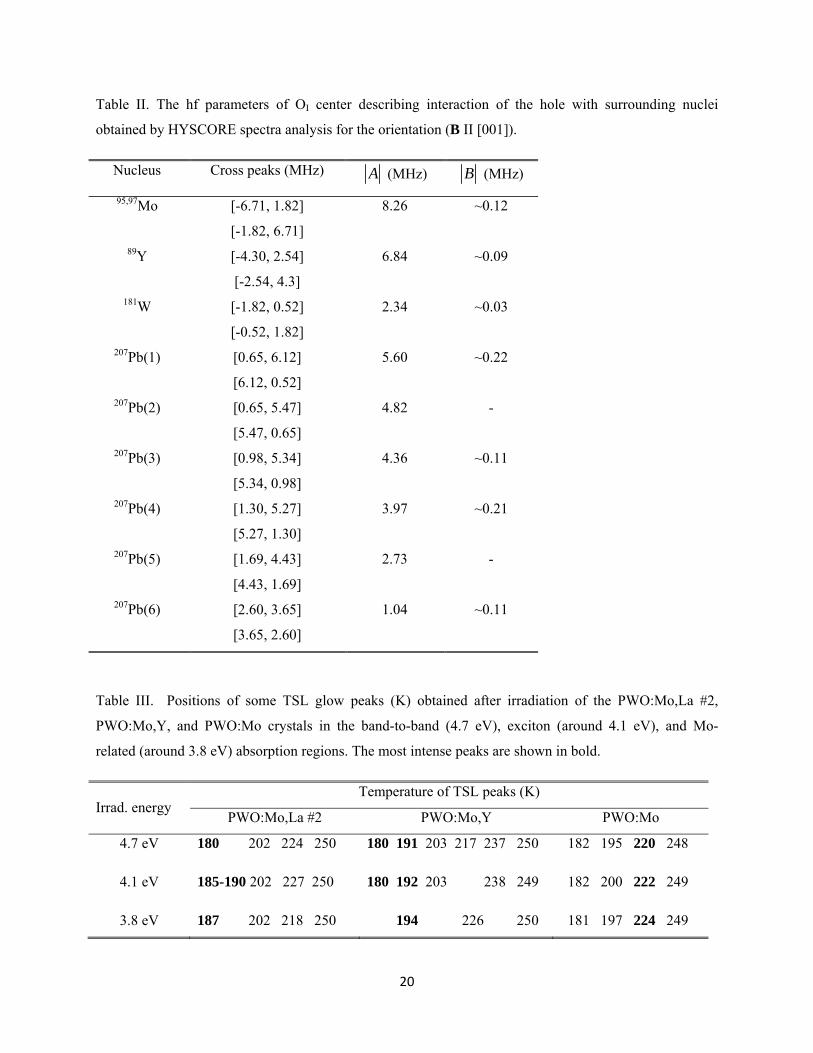
Table II. The hf parameters of OI center describing interaction of the hole with surrounding nuclei
obtained by HYSCORE spectra analysis for the orientation (B II [001]).
Nucleus Cross peaks (MHz) A (MHz) B (MHz)
95,97Mo [-6.71, 1.82]
[-1.82, 6.71]
8.26 ~0.12
89Y [-4.30, 2.54]
[-2.54, 4.3]
6.84 ~0.09
181W [-1.82, 0.52]
[-0.52, 1.82]
2.34 ~0.03
207Pb(1) [0.65, 6.12]
[6.12, 0.52]
5.60 ~0.22
207Pb(2) [0.65, 5.47]
[5.47, 0.65]
4.82 -
207Pb(3) [0.98, 5.34]
[5.34, 0.98]
4.36 ~0.11
207Pb(4) [1.30, 5.27]
[5.27, 1.30]
3.97 ~0.21
207Pb(5) [1.69, 4.43]
[4.43, 1.69]
2.73 -
207Pb(6) [2.60, 3.65]
[3.65, 2.60]
1.04 ~0.11
Table III. Positions of some TSL glow peaks (K) obtained after irradiation of the PWO:Mo,La #2,
PWO:Mo,Y, and PWO:Mo crystals in the band-to-band (4.7 eV), exciton (around 4.1 eV), and Mo-
related (around 3.8 eV) absorption regions. The most intense peaks are shown in bold.
Irrad. energy Temperature of TSL peaks (K)
PWO:Mo,La #2 PWO:Mo,Y PWO:Mo
4.7 eV
4.1 eV
3.8 eV
180 202 224 250
185-190 202 227 250
187 202 218 250
180 191 203 217 237 250
180 192 203 238 249
194 226 250
182 195 220 248
182 200 222 249
181 197 224 249
20

21
Table IV. Trap depths (Et) and frequency factors (f0) for the hole-related TSL peaks in the PbWO4:Mo,La
#2 and PWO:Mo,Y crystals.
Center Temp. of EPR signal
decay (K)*)
Temperature of
TSL peak (K)
Trap depth Et
(eV)
Frequency factor f0
(1/s)
OILa 170 187 0.39(2) ~109
OIILa 210 227 0.45(2) ~108
OIII,IV,VII 230-235 247, 251 0.54(2) ~109
OV,VI 250 265 not deter. not deter.
OIY 180 192 0.45(2) ~1010
OIIY 220 238 0.63(2) ~1012
*) Temperature where the EPR signal intensity from the corresponding center decreases about twice, see Fig. 6(a)