In Vitro Evaluation of Porcupine Bezoar Extracts as Anticancer ...
Erosional vs. accretionary shelf margins: theinfluenceofmargin typeondeepwatersedimentation:an example from the Porcupine Basin, offshorewestern IrelandM. C. Ryan,n1 W. Helland-Hansen,n E. P. Johannessenw and R. J. SteelznDepartment of Earth Science, University of Bergen, Bergen, NorwaywInternational Exploration, Statoil, Stavanger, NorwayzDepartment of Geology, University of Texas, Austin, USA
ABSTRACT
A1000 km2 three-dimensional (3D) seismic data survey that extends out from the western margin ofthe Porcupine Basin, o¡shore western Ireland reveals the internal geometry and depositional historyof a large Palaeogene (Palaeocene^Early Eocene) shelf-margin.Twowells intersect the margin therebyconstraining the depositional environments.The 34/19-1well (landward end) intersects slope, shelf,marginal marine to coastal plain facies.The 35/21-1well (basinward end) intersects seismically imagedshelf-margin clinoforms where base of slope back up to coastal plain deposits (source-to-sink) arerepresented.The basin- ¢ll stratal architecture of the Palaeogene succession reveals sedimentdeposition under two end member, basin physiographic styles: (1) an erosional margin style and (2) anaccretionary or progradational margin style. Uplift of the western margin of the basin is suggested asthe major cause of the initially oversteepened shelf-slope erosional pro¢le. Key characteristics of anerosional margin include sediment bypass of the shelf, canyon formation, and the development ofsigni¢cant onlapping submarine fan deposits on the lower slope. Failure on the slope is also revealedby several mass^transport complexes (MTCs) that carve out major erosive features across the slope.Three-dimensional seismic analysis illustrates variations in size, geometry and depositional trendand transport mechanisms of theMTCs.Con¢ned, thick chaotic seismic facies, erosional basal scoursand syn-depositional thrusting (pressure ridges) at terminus as opposed to thin, high-amplitudediscontinuous facies with an uncon¢ned lobate terminus are interpreted to indicate slump- andslide-dominated vs. debris £ow-dominatedMTCs, respectively.The erosional marginwastransformed into an accretionary margin when the gradient of the shelf-slope to basin- £oor pro¢lewas su⁄ciently lowered through the in¢lling and healing of the topographic lows by the onlappingsubmarine-fan deposits.This shallowing of the basin allowed nearshore systems to prograde acrossthe deepwater systems.The accretionary margin was characterised by a thick sediment prismcomposed of clinoforms both at the shoreface/delta (tens of metres) and shelf-margin (hundreds ofmetres) scales. Shelf-margin clinoforms, the focus of this study, are the fundamental regressive totransgressive building blocks (duration10^100 kyr) of the stratigraphic succession and can be observedon a larger scale ( �1Myr) through the migration and trajectory patterns of the shelf-edge.Trajectorypathways in the accretionary margin are accretionary in a descending or ascending manner.Thedescending style was characterised by a shelf- slope break that migrated seawards and obliquelydownwards as a result of a relative sea-level fall.The descending trajectory geometry is lobate alongstrike suggestive of a point source progradation. Internally, the descending trajectory consists ofdownward stepping, steeply dipping shelf-margin clinoforms that display extensive slumping anddeposition of sediment on the lower slope indicative of rapid deposition. Furthermore, basin- £oorfans and associated ‘feeder’channels extend basinwards beyond toe of slope.The ascending trajectoryre£ects a shelf- slope break that is interpreted to have migrated seawards during steady or risingrelative sea level.The ascending trajectory geometry is associatedwith signi¢cant lateral sediment
12345678910111213141516171819202122232425262728293031323334353637383940414243444546474849505152535455565758
Correspondence:M.C.Ryan,Department ofEarthScience,University ofBergen,5007Bergen,Norway.E-mail:[email protected] Present address: International Exploration, Statoil, 0246 Oslo, Norway.
BasinResearch (2009) doi: 10.1111/j.1365-2117.2009.00424.x
r 2009 The AuthorsJournal Compilationr 2009 Blackwell Publishing Ltd, European Association ofGeoscientists & Engineers and International Association of Sedimentologists 1
B R E 4 2 4 B Dispatch: 26.6.09 Journal: BRE CE: Neena PE: Mahendra
Journal Name Manuscript No. Author Received: No. of pages: 28 TE: Elan Op: gsraviBRE 424(B
WU
K B
RE
424
.PD
F 26
-Jun
-09
22:2
0 20
4346
13 B
ytes
28
PAG
ES
n op
erat
or=
T.P
rasa
th)
8
7
dispersal along the shelf-edge, re£ecting distributary systems that were less ‘¢xed’or a greaterreworking and longshore drift of sediment. Accretion involving the ascending shelf-edge trajectorycharacteristically lacked signi¢cant basin- £oor deposits.Variable ascending trajectories arerecognised in this study, as read from the angle atwhich the shelf- slope break migrates. Horizontal tohigh angle ascending trajectories correspond to dominantly progradational and dominantlyaggradational shelf-edge trajectories, respectively.The sequence stratigraphic analysis of thePorcupine deltaic complex reveals a long-term relative sea-level rise.
INTRODUCTION
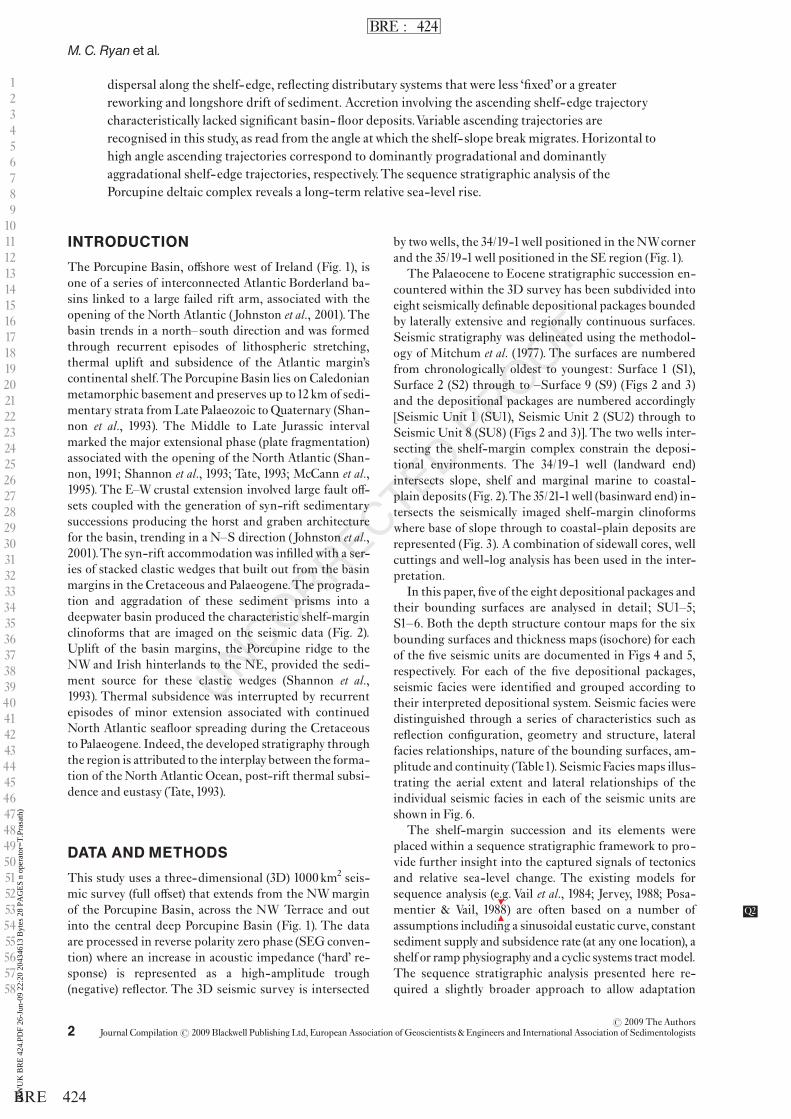
The Porcupine Basin, o¡shore west of Ireland (Fig. 1), isone of a series of interconnected Atlantic Borderland ba-sins linked to a large failed rift arm, associated with theopening of the North Atlantic (Johnston et al., 2001).Thebasin trends in a north^south direction and was formedthrough recurrent episodes of lithospheric stretching,thermal uplift and subsidence of the Atlantic margin’scontinental shelf.The Porcupine Basin lies on Caledonianmetamorphic basement and preserves up to12 km of sedi-mentary strata fromLate Palaeozoic to Quaternary (Shan-non et al., 1993). The Middle to Late Jurassic intervalmarked the major extensional phase (plate fragmentation)associated with the opening of the North Atlantic (Shan-non, 1991; Shannon et al., 1993; Tate, 1993; McCann et al.,1995). The E^W crustal extension involved large fault o¡-sets coupled with the generation of syn-rift sedimentarysuccessions producing the horst and graben architecturefor the basin, trending in a N^S direction (Johnston et al.,2001).The syn-rift accommodationwas in¢lledwith a ser-ies of stacked clastic wedges that built out from the basinmargins in the Cretaceous and Palaeogene.The prograda-tion and aggradation of these sediment prisms into adeepwater basin produced the characteristic shelf-marginclinoforms that are imaged on the seismic data (Fig. 2).Uplift of the basin margins, the Porcupine ridge to theNW and Irish hinterlands to the NE, provided the sedi-ment source for these clastic wedges (Shannon et al.,1993). Thermal subsidence was interrupted by recurrentepisodes of minor extension associated with continuedNorth Atlantic sea£oor spreading during the Cretaceousto Palaeogene. Indeed, the developed stratigraphy throughthe region is attributed to the interplay between the forma-tion of the North Atlantic Ocean, post-rift thermal subsi-dence and eustasy (Tate, 1993).
DATA ANDMETHODS
This study uses a three-dimensional (3D) 1000 km2 seis-mic survey (full o¡set) that extends from the NWmarginof the Porcupine Basin, across the NW Terrace and outinto the central deep Porcupine Basin (Fig. 1). The dataare processed in reverse polarity zero phase (SEG conven-tion) where an increase in acoustic impedance (‘hard’ re-sponse) is represented as a high-amplitude trough(negative) re£ector. The 3D seismic survey is intersected
by twowells, the 34/19-1well positioned in theNWcornerand the 35/19-1well positioned in the SE region (Fig.1).
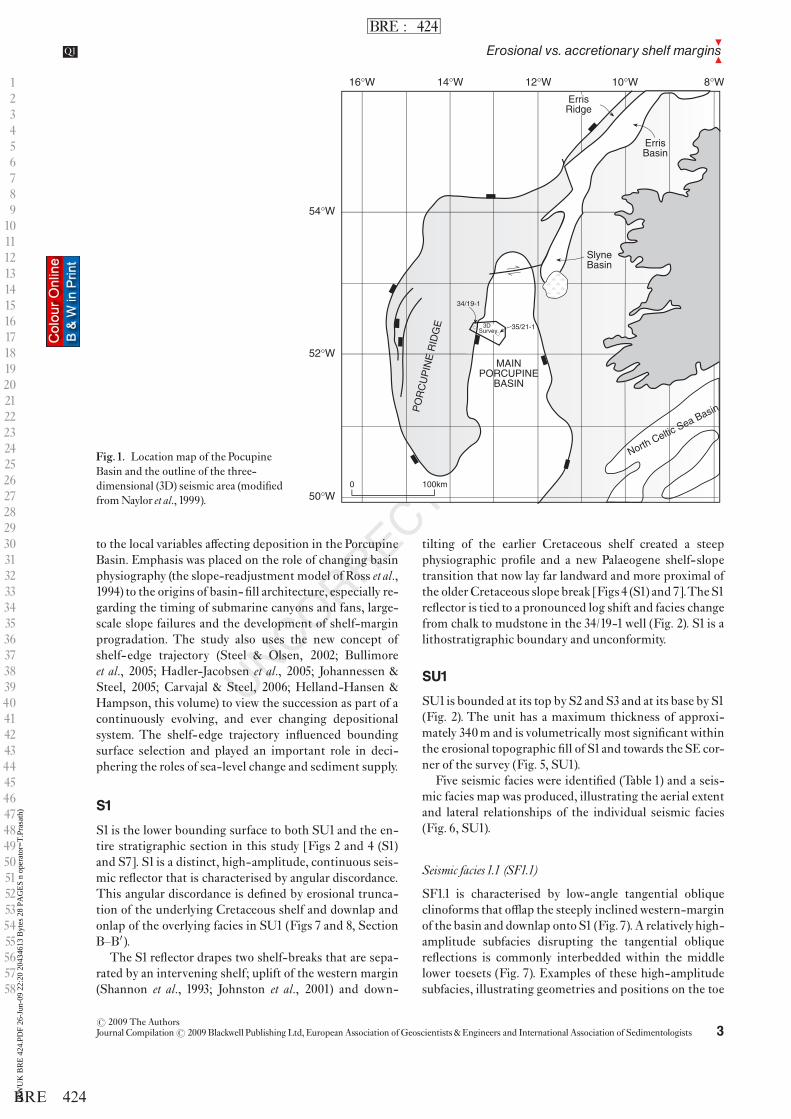
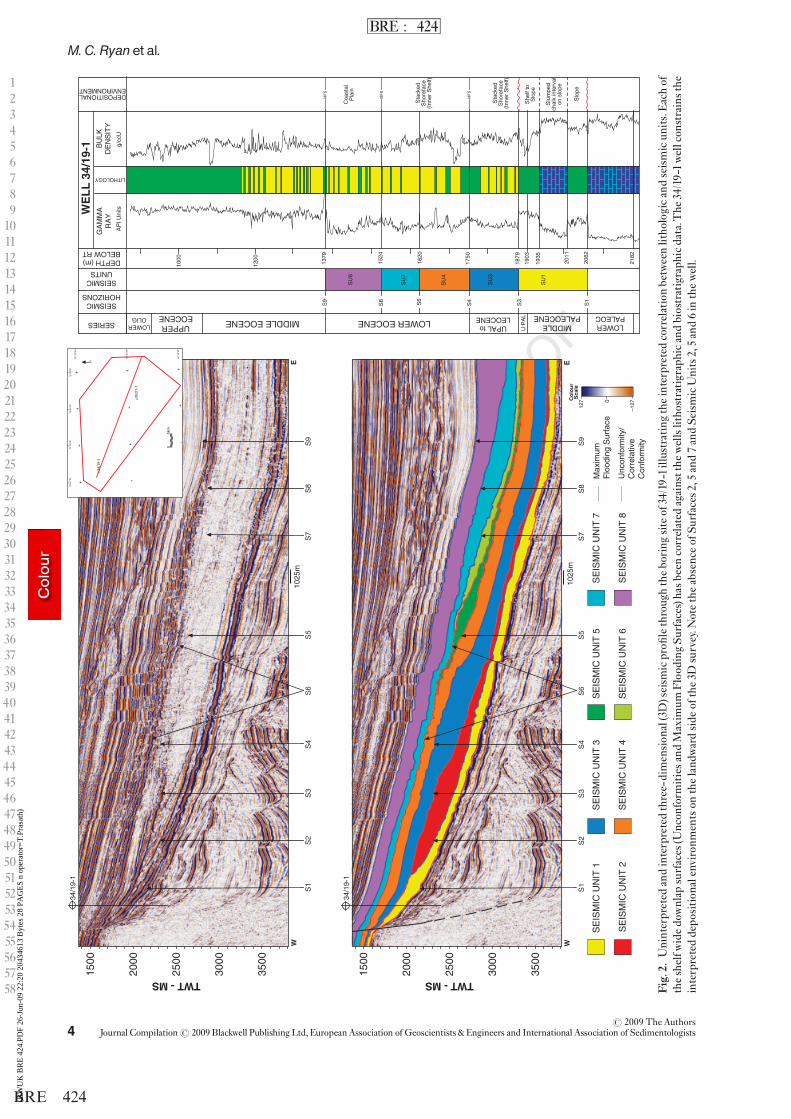
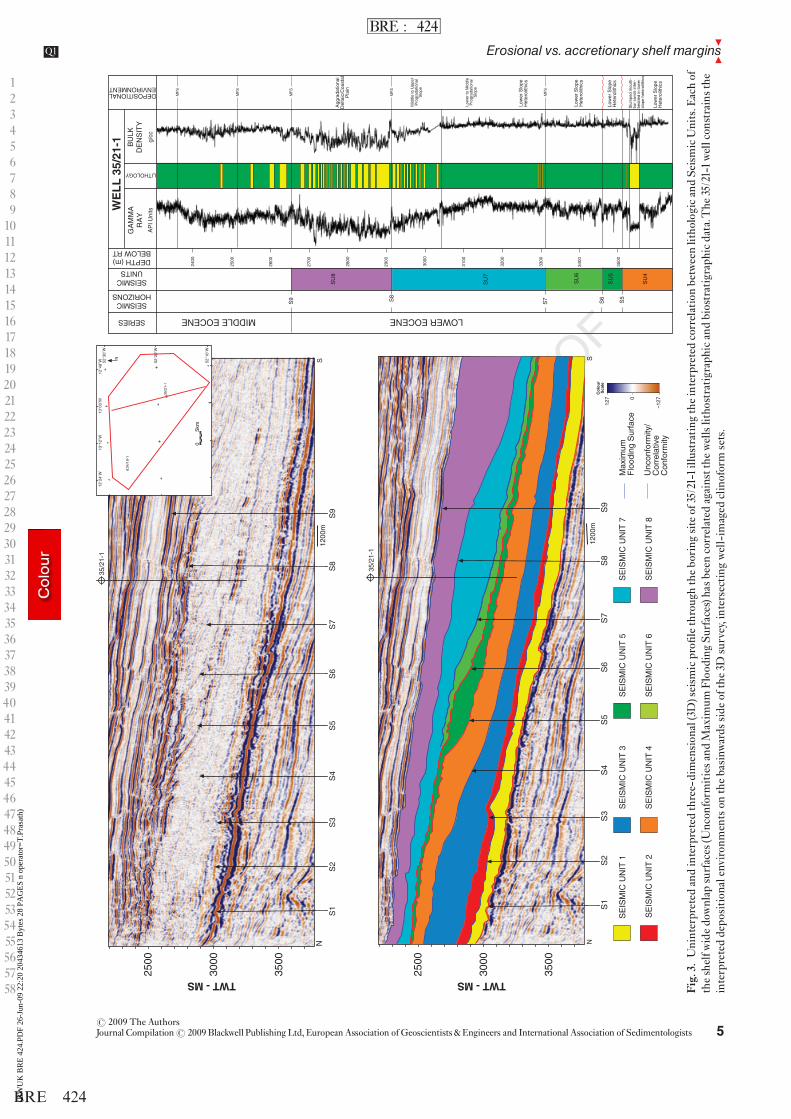
The Palaeocene to Eocene stratigraphic succession en-countered within the 3D survey has been subdivided intoeight seismically de¢nable depositional packages boundedby laterally extensive and regionally continuous surfaces.Seismic stratigraphy was delineated using the methodol-ogy of Mitchum et al. (1977). The surfaces are numberedfrom chronologically oldest to youngest: Surface 1 (S1),Surface 2 (S2) through to ^Surface 9 (S9) (Figs 2 and 3)and the depositional packages are numbered accordingly[Seismic Unit 1 (SU1), Seismic Unit 2 (SU2) through toSeismic Unit 8 (SU8) (Figs 2 and 3)].The two wells inter-secting the shelf-margin complex constrain the deposi-tional environments. The 34/19-1 well (landward end)intersects slope, shelf and marginal marine to coastal-plain deposits (Fig. 2).The 35/21-1well (basinward end) in-tersects the seismically imaged shelf-margin clinoformswhere base of slope through to coastal-plain deposits arerepresented (Fig. 3). A combination of sidewall cores, wellcuttings and well-log analysis has been used in the inter-pretation.
In this paper, ¢ve of the eight depositional packages andtheir bounding surfaces are analysed in detail; SU1^5;S1^6. Both the depth structure contour maps for the sixbounding surfaces and thickness maps (isochore) for eachof the ¢ve seismic units are documented in Figs 4 and 5,respectively. For each of the ¢ve depositional packages,seismic facies were identi¢ed and grouped according totheir interpreted depositional system. Seismic facies weredistinguished through a series of characteristics such asre£ection con¢guration, geometry and structure, lateralfacies relationships, nature of the bounding surfaces, am-plitude and continuity (Table1). SeismicFacies maps illus-trating the aerial extent and lateral relationships of theindividual seismic facies in each of the seismic units areshown in Fig. 6.
The shelf-margin succession and its elements wereplaced within a sequence stratigraphic framework to pro-vide further insight into the captured signals of tectonicsand relative sea-level change. The existing models forsequence analysis (e.g. Vail et al., 1984; Jervey, 1988; Posa-mentier & Vail, 1988 Q2) are often based on a number ofassumptions including a sinusoidal eustatic curve, constantsediment supply and subsidence rate (at any one location), ashelf or ramp physiography and a cyclic systems tract model.The sequence stratigraphic analysis presented here re-quired a slightly broader approach to allow adaptation
12345678910111213141516171819202122232425262728293031323334353637383940414243444546474849505152535455565758
r 2009 The AuthorsJournal Compilationr 2009 Blackwell Publishing Ltd, EuropeanAssociation of Geoscientists & Engineers and International Association of Sedimentologists2
M. C. Ryanet al.
BRE : 424
BRE 424(BW
UK
BR
E 4
24.P
DF
26-J
un-0
9 22
:20
2043
4613
Byt
es 2
8 PA
GE
S n
oper
ator
=T
.Pra
sath
)
to the local variables a¡ecting deposition in the PorcupineBasin. Emphasis was placed on the role of changing basinphysiography (the slope-readjustment model of Ross et al.,1994) to the origins of basin- ¢ll architecture, especially re-garding the timing of submarine canyons and fans, large-scale slope failures and the development of shelf-marginprogradation. The study also uses the new concept ofshelf-edge trajectory (Steel & Olsen, 2002; Bullimoreet al., 2005; Hadler-Jacobsen et al., 2005; Johannessen &Steel, 2005; Carvajal & Steel, 2006; Helland-Hansen &Hampson, this volume) to view the succession as part of acontinuously evolving, and ever changing depositionalsystem. The shelf-edge trajectory in£uenced boundingsurface selection and played an important role in deci-phering the roles of sea-level change and sediment supply.
S1
S1 is the lower bounding surface to both SU1 and the en-tire stratigraphic section in this study [Figs 2 and 4 (S1)and S7]. S1 is a distinct, high-amplitude, continuous seis-mic re£ector that is characterised by angular discordance.This angular discordance is de¢ned by erosional trunca-tion of the underlying Cretaceous shelf and downlap andonlap of the overlying facies in SU1 (Figs 7 and 8, SectionB^B0 ).
The S1 re£ector drapes two shelf-breaks that are sepa-rated by an intervening shelf; uplift of the western margin(Shannon et al., 1993; Johnston et al., 2001) and down-
tilting of the earlier Cretaceous shelf created a steepphysiographic pro¢le and a new Palaeogene shelf-slopetransition that now lay far landward and more proximal ofthe olderCretaceous slope break [Figs 4 (S1) and 7].TheS1re£ector is tied to a pronounced log shift and facies changefrom chalk to mudstone in the 34/19-1well (Fig. 2). S1 is alithostratigraphic boundary and unconformity.
SU1
SU1is bounded at its top byS2 andS3 and at its base byS1(Fig. 2). The unit has a maximum thickness of approxi-mately 340m and is volumetrically most signi¢cantwithinthe erosional topographic ¢ll of S1and towards the SE cor-ner of the survey (Fig. 5, SU1).
Five seismic facies were identi¢ed (Table 1) and a seis-mic facies map was produced, illustrating the aerial extentand lateral relationships of the individual seismic facies(Fig. 6, SU1).
Seismic facies 1.1 (SF1.1)
SF1.1 is characterised by low-angle tangential obliqueclinoforms that o¥ap the steeply inclinedwestern-marginof the basin and downlap onto S1 (Fig.7).A relativelyhigh-amplitude subfacies disrupting the tangential obliquere£ections is commonly interbedded within the middlelower toesets (Fig. 7). Examples of these high-amplitudesubfacies, illustrating geometries and positions on the toe
12345678910111213141516171819202122232425262728293031323334353637383940414243444546474849505152535455565758
16°W 14°W 12°W 10°W 8°W
54°W
52°W
50°W
MAINPORCUPINE
BASIN
North Celtic Sea BasinPO
RC
UP
INE
RID
GE
ErrisBasin
ErrisRidge
SlyneBasin
100km0
Fig.1. Location map of the PocupineBasin and the outline of the three-dimensional (3D) seismic area (modi¢edfromNaylor et al., 1999).
r 2009 The AuthorsJournal Compilationr 2009 Blackwell Publishing Ltd, European Association ofGeoscientists & Engineers and International Association of Sedimentologists 3
8
7Erosional vs. accretionary shelf marginsQ1
BRE : 424
BRE 424(BW
UK
BR
E 4
24.P
DF
26-J
un-0
9 22
:20
2043
4613
Byt
es 2
8 PA
GE
S n
oper
ator
=T
.Pra
sath
)
12345678910111213141516171819202122232425262728293031323334353637383940414243444546474849505152535455565758
3500
3000
2500
2000
1500
TWT - MS
3500
3000
2500
2000
1500
TWT - MS
SE
ISM
IC U
NIT
1
SE
ISM
IC U
NIT
2
SE
ISM
IC U
NIT
3
SE
ISM
IC U
NIT
4
SE
ISM
IC U
NIT
5
SE
ISM
IC U
NIT
6
SE
ISM
IC U
NIT
7
SE
ISM
IC U
NIT
8
MIDDLE EOCENE LOWER EOCENE
WE
LL
34/
19-1
Fig.2.
Uninterpreted
andinterpretedthree-dimension
al(3D)seism
icpro¢
lethroughtheboring
siteof34/19-1illu
strating
theinterpretedcorrelationbetweenlitho
logicandseismicun
its.Eachof
theshelfw
idedownlap
surfaces(U
nconform
itiesandMaxim
umFlood
ingSu
rfaces)h
asbeen
correlated
againstthe
wellslitho
stratigraphicandbiostratigraph
icdata.T
he34/19-1wellcon
strainsthe
interpreteddepo
sition
alenvironm
entson
thelandwardside
ofthe3D
survey.N
otetheabsenceofSu
rfaces2,5and7andSe
ismicUnits2,5and6in
thewell.
r 2009 The AuthorsJournal Compilationr 2009 Blackwell Publishing Ltd, EuropeanAssociation of Geoscientists & Engineers and International Association of Sedimentologists4
M. C. Ryanet al.
BRE : 424
BRE 424(BW
UK
BR
E 4
24.P
DF
26-J
un-0
9 22
:20
2043
4613
Byt
es 2
8 PA
GE
S n
oper
ator
=T
.Pra
sath
)
12345678910111213141516171819202122232425262728293031323334353637383940414243444546474849505152535455565758
SE
ISM
IC U
NIT
1
SE
ISM
IC U
NIT
2
SE
ISM
IC U
NIT
3
SE
ISM
IC U
NIT
4
SE
ISM
IC U
NIT
5
SE
ISM
IC U
NIT
6
SE
ISM
IC U
NIT
7
SE
ISM
IC U
NIT
8
3000
TWT - MS
2500
3500
3000
TWT - MS
2500
3500
MIDDLE EOCENE LOWER EOCENE
WE
LL
35/
21-1
Fig.3.
Uninterpreted
andinterpretedthree-dimension
al(3D)seism
icpro¢
lethroughtheboring
siteof35/21-1illustratingtheinterpretedcorrelationbetweenlitho
logicandSe
ismicUnits.E
achof
theshelfw
idedownlap
surfaces(U
ncon
form
itiesandMaxim
umFlood
ingSu
rfaces)h
asbeen
correlated
againstthe
wellslitho
stratigraphicandbiostratigraph
icdata.T
he35/21-1wellcon
strainsthe
interpreteddepo
sition
alenvironm
entson
thebasinw
ards
side
ofthe3D
survey,intersectingwell-im
aged
clinoformsets.
r 2009 The AuthorsJournal Compilationr 2009 Blackwell Publishing Ltd, European Association ofGeoscientists & Engineers and International Association of Sedimentologists 5
8
7Erosional vs. accretionary shelf marginsQ1
BRE : 424
BRE 424(BW
UK
BR
E 4
24.P
DF
26-J
un-0
9 22
:20
2043
4613
Byt
es 2
8 PA
GE
S n
oper
ator
=T
.Pra
sath
)
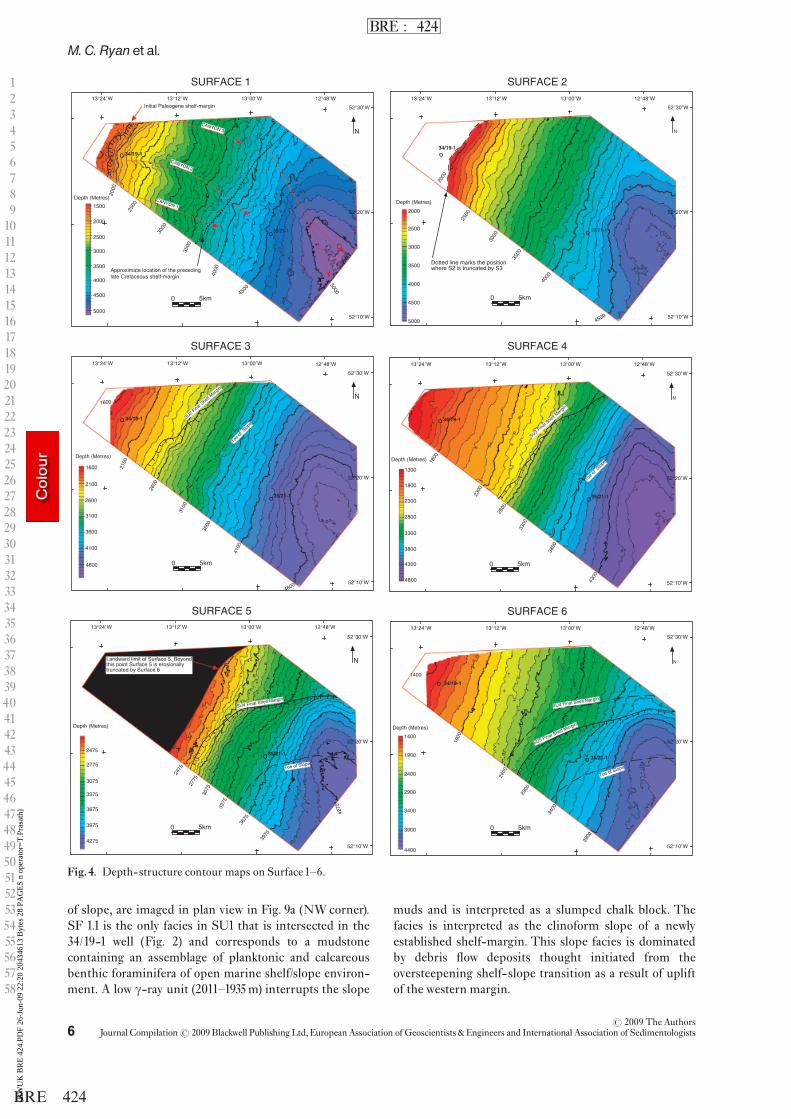
of slope, are imaged in plan view in Fig. 9a (NW corner).SF 1.1 is the only facies in SU1 that is intersected in the34/19-1 well (Fig. 2) and corresponds to a mudstonecontaining an assemblage of planktonic and calcareousbenthic foraminifera of open marine shelf/slope environ-ment. A low g-ray unit (2011^1935m) interrupts the slope
muds and is interpreted as a slumped chalk block. Thefacies is interpreted as the clinoform slope of a newlyestablished shelf-margin. This slope facies is dominatedby debris £ow deposits thought initiated from theoversteepening shelf-slope transition as a result of upliftof the western margin.
12345678910111213141516171819202122232425262728293031323334353637383940414243444546474849505152535455565758
SURFACE 3
SURFACE 2SURFACE 1
SURFACE 4
SURFACE 5 SURFACE 6
Fig.4. Depth-structure contour maps on Surface1^6.
r 2009 The AuthorsJournal Compilationr 2009 Blackwell Publishing Ltd, EuropeanAssociation of Geoscientists & Engineers and International Association of Sedimentologists6
M. C. Ryanet al.
BRE : 424
BRE 424(BW
UK
BR
E 4
24.P
DF
26-J
un-0
9 22
:20
2043
4613
Byt
es 2
8 PA
GE
S n
oper
ator
=T
.Pra
sath
)
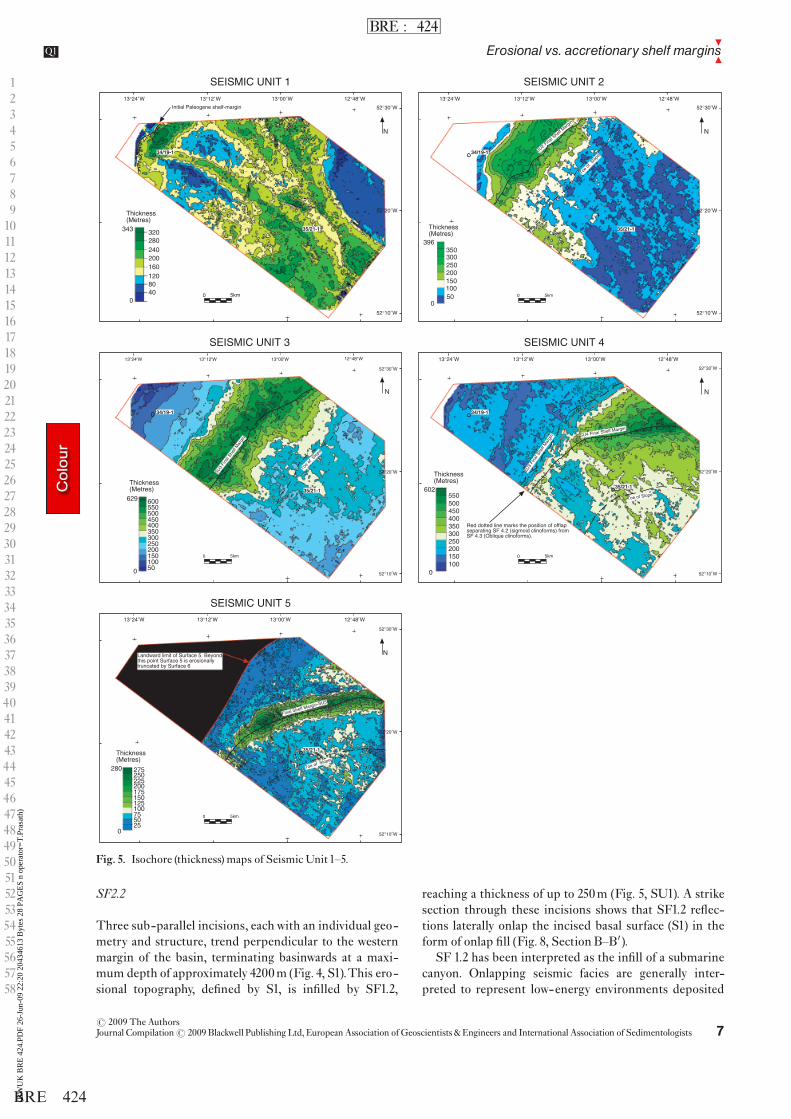
SF2.2
Three sub-parallel incisions, eachwith an individual geo-metry and structure, trend perpendicular to the westernmargin of the basin, terminating basinwards at a maxi-mum depth of approximately 4200m (Fig. 4, S1).This ero-sional topography, de¢ned by S1, is in¢lled by SF1.2,
reaching a thickness of up to 250m (Fig. 5, SU1). A strikesection through these incisions shows that SF1.2 re£ec-tions laterally onlap the incised basal surface (S1) in theform of onlap ¢ll (Fig. 8, Section B^B0).
SF 1.2 has been interpreted as the in¢ll of a submarinecanyon. Onlapping seismic facies are generally inter-preted to represent low-energy environments deposited
12345678910111213141516171819202122232425262728293031323334353637383940414243444546474849505152535455565758
SEISMIC UNIT 3
SEISMIC UNIT 2SEISMIC UNIT 1
SEISMIC UNIT 4
SEISMIC UNIT 5
Fig. 5. Isochore (thickness) maps of Seismic Unit 1^5.
r 2009 The AuthorsJournal Compilationr 2009 Blackwell Publishing Ltd, European Association ofGeoscientists & Engineers and International Association of Sedimentologists 7
8
7Erosional vs. accretionary shelf marginsQ1
BRE : 424
BRE 424(BW
UK
BR
E 4
24.P
DF
26-J
un-0
9 22
:20
2043
4613
Byt
es 2
8 PA
GE
S n
oper
ator
=T
.Pra
sath
)
12345678910111213141516171819202122232425262728293031323334353637383940414243444546474849505152535455565758 T
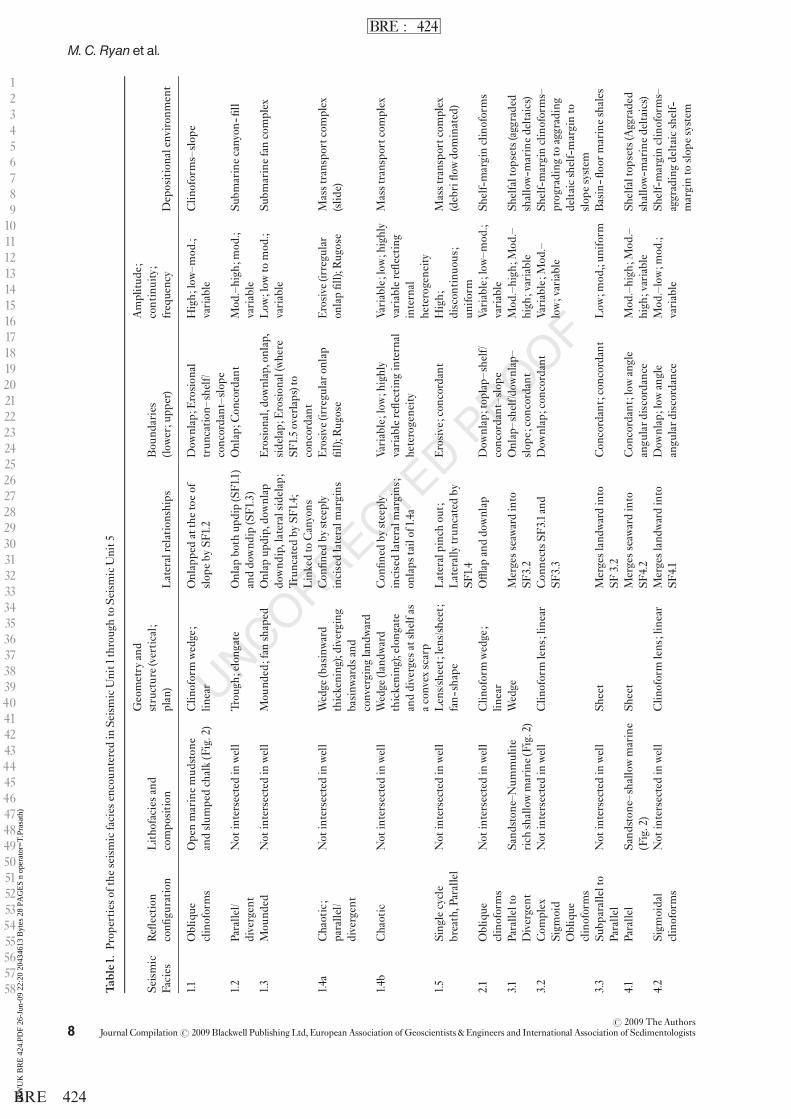
able1.
Prop
erties
oftheseismicfacies
encoun
teredinSe
ismicUnit1
throughtoSeism
icUnit5
Seismic
Facies
Re£ection
con¢
guration
Lithofacies
and
compo
sition
Geometry
and
structure(vertical;
plan)
Lateralrelation
ships
Bou
ndaries
(lower;upp
er)
Amplitud
e;continuity;
frequency
Depositionalenviron
ment
1.1Oblique
clinoforms
Openmarinemud
ston
eandslum
pedchalk(Fig.2)
Clin
oformwedge;
linear
Onlappedatthetoeof
slop
eby
SF1.2
Dow
nlap;E
rosion
altrun
cation^shelf/
concordant^slop
e
High;
low^m
od.;
variable
Clin
oforms^slop
e
1.2
Parallel/
divergent
Not
intersectedinwell
Trough
;elong
ate
Onlap
both
updip(SF1.1)
anddownd
ip(SF1.3)
Onlap;C
oncordant
Mod.^high
;mod.;
variable
Subm
arinecanyon
-¢ll
1.3
Mou
nded
Not
intersectedinwell
Mou
nded
;fan
shaped
Onlap
updip,downlap
downd
ip,lateralsidelap;
Trun
catedby
SF1.4;
LinkedtoCanyons
Erosion
al,dow
nlap,onlap,
sidelap;
Erosion
al(where
SF1.5overlaps)to
concordant
Low
;low
tomod.;
variable
Subm
arinefancomplex
1.4a
Chaotic;
parallel/
divergent
Not
intersectedinwell
Wedge
(basinward
thickening);diverging
basinw
ards
and
converging
land
ward
Con
¢ned
bysteeply
incisedlateralm
argins
Erosive
(irregularo
nlap
¢ll);Rug
ose
Erosive
(irregular
onlap¢ll);Rugose
Masstranspo
rtcomplex
(slid
e)
1.4b
Chaotic
Not
intersectedinwell
Wedge
(landward
thickening);elon
gate
anddiverges
atshelfas
aconvex
scarp
Con
¢ned
bysteeply
incisedlateralm
argins;
onlaps
tailof1.4a
Variable;low
;highly
variablere£ectinginternal
heterogeneity
Variable;low
;highly
variablere£ecting
internal
heterogeneity
Masstranspo
rtcomplex
1.5
Singlecycle
breath,Parallel
Not
intersectedinwell
Lens/sheet;lens/sheet;
fan-shape
Lateralpinchout;
Laterallytrun
catedby
SF1.4
Erosive;con
cordant
High;
discon
tinu
ous;
unifo
rm
Masstranspo
rtcomplex
(debri£owdo
minated)
2.1
Oblique
clinoforms
Not
intersectedinwell
Clin
oformwedge;
linear
O¥ap
anddownlap
Dow
nlap;toplap^
shelf/
concordant^slop
eVariable;low
^mod.;
variable
Shelf-marginclinoforms
3.1Parallelto
Divergent
Sand
ston
e^Num
mulite
rich
shallowmarine(Fig.2)
Wedge
Mergesseaw
ardinto
SF3.2
Onlap^shelf/d
ownlap^
slop
e;concordant
Mod.^high
;Mod.^
high
;variable
Shelfaltop
sets(aggraded
shallow-m
arinedeltaics)
3.2
Com
plex
Sigm
oid
Oblique
clinoforms
Not
intersectedinwell
Clin
oformlens;linear
Con
nectsS
F3.1
and
SF3.3
Dow
nlap;con
cordant
Variable;M
od.^
low;variable
Shelf-marginclinoforms^
prograding
toaggrading
deltaicshelf-marginto
slop
esystem
3.3
Subp
arallelto
Parallel
Not
intersectedinwell
Sheet
Mergeslandw
ardinto
SF3.2
Con
cordant;concordant
Low
;mod,;un
iform
Basin-£
oormarineshales
4.1Parallel
Sand
ston
e^shallowmarine
(Fig.2)
Sheet
Mergesseaw
ardinto
SF4.2
Con
cordant;lowangle
angu
lard
iscordance
Mod.^high
;Mod.^
high
;variable
Shelfaltop
sets(Aggraded
shallow-m
arinedeltaics)
4.2
Sigm
oidal
clinoforms
Not
intersectedinwell
Clin
oformlens;linear
Mergeslandw
ardinto
SF4.1
Dow
nlap;low
angle
angu
lard
iscordance
Mod.^low;m
od.;
variable
Shelf-marginclinoforms^
aggradingdeltaicshelf-
marginto
slop
esystem
r 2009 The AuthorsJournal Compilationr 2009 Blackwell Publishing Ltd, EuropeanAssociation of Geoscientists & Engineers and International Association of Sedimentologists8
M. C. Ryanet al.
BRE : 424
BRE 424(BW
UK
BR
E 4
24.P
DF
26-J
un-0
9 22
:20
2043
4613
Byt
es 2
8 PA
GE
S n
oper
ator
=T
.Pra
sath
)
8
7
8
7
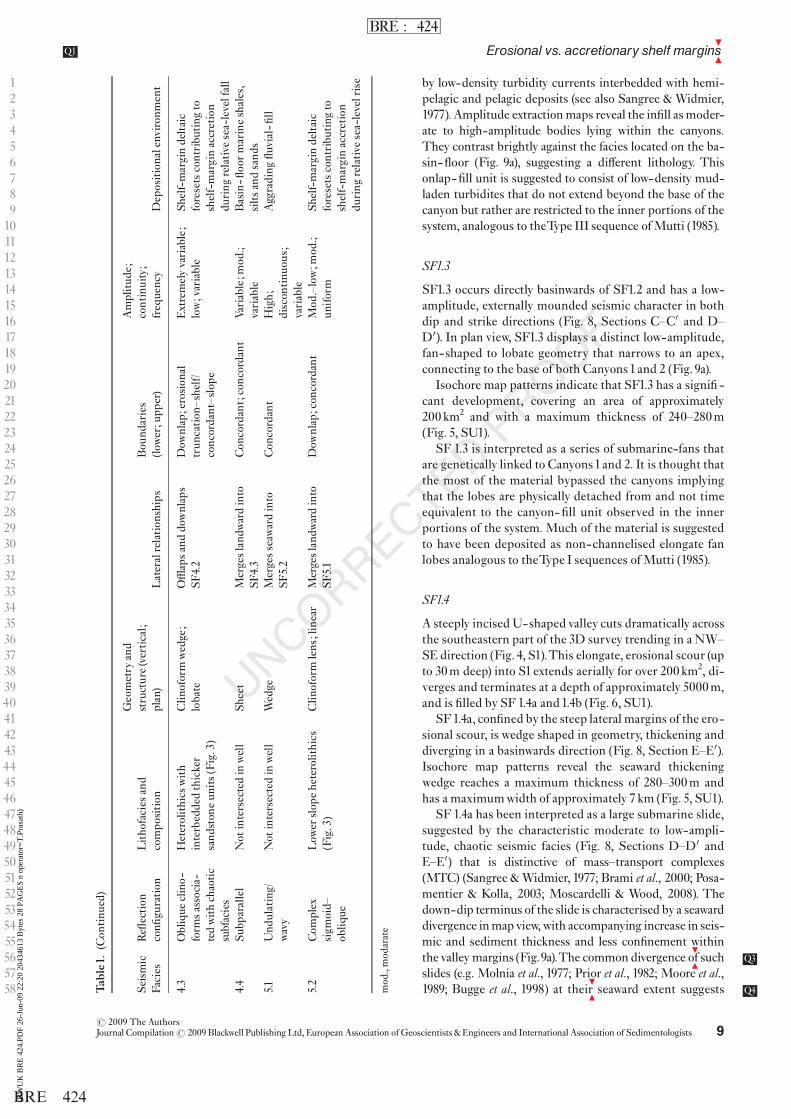
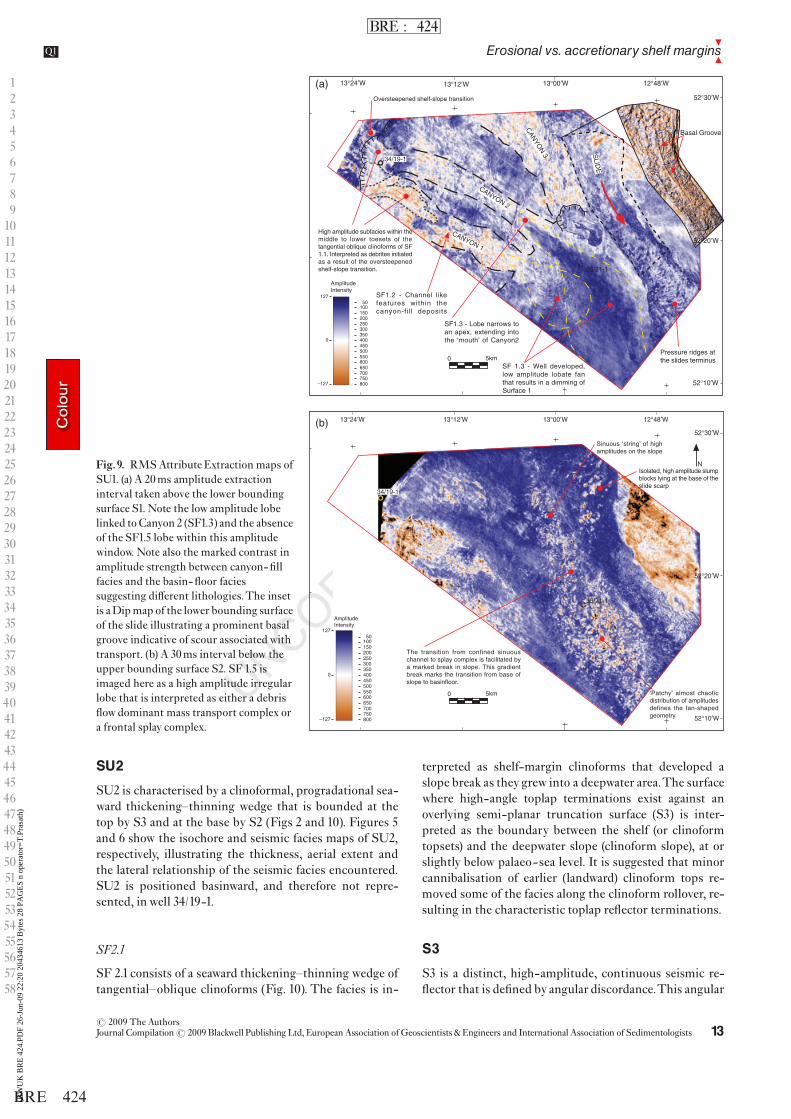
by low-density turbidity currents interbedded with hemi-pelagic and pelagic deposits (see also Sangree & Widmier,1977). Amplitude extraction maps reveal the in¢ll as moder-ate to high-amplitude bodies lying within the canyons.They contrast brightly against the facies located on the ba-sin- £oor (Fig. 9a), suggesting a di¡erent lithology. Thisonlap- ¢ll unit is suggested to consist of low-density mud-laden turbidites that do not extend beyond the base of thecanyon but rather are restricted to the inner portions of thesystem, analogous to theType III sequence ofMutti (1985).
SF1.3
SF1.3 occurs directly basinwards of SF1.2 and has a low-amplitude, externally mounded seismic character in bothdip and strike directions (Fig. 8, Sections C^C0 and D^D0). In plan view, SF1.3 displays a distinct low-amplitude,fan-shaped to lobate geometry that narrows to an apex,connecting to the base of both Canyons1and 2 (Fig.9a).
Isochore map patterns indicate that SF1.3 has a signi¢ -cant development, covering an area of approximately200 km2 and with a maximum thickness of 240^280m(Fig. 5, SU1).
SF 1.3 is interpreted as a series of submarine-fans thatare genetically linked to Canyons1and 2. It is thought thatthe most of the material bypassed the canyons implyingthat the lobes are physically detached from and not timeequivalent to the canyon- ¢ll unit observed in the innerportions of the system. Much of the material is suggestedto have been deposited as non-channelised elongate fanlobes analogous to theType I sequences ofMutti (1985).
SF1.4
A steeply incisedU-shaped valley cuts dramatically acrossthe southeastern part of the 3D survey trending in a NW^SE direction (Fig. 4, S1).This elongate, erosional scour (upto 30m deep) into S1 extends aerially for over 200 km2, di-verges and terminates at a depth of approximately 5000m,and is ¢lled by SF1.4a and1.4b (Fig. 6, SU1).
SF1.4a, con¢ned by the steep lateral margins of the ero-sional scour, is wedge shaped in geometry, thickening anddiverging in a basinwards direction (Fig. 8, Section E^E0).Isochore map patterns reveal the seaward thickeningwedge reaches a maximum thickness of 280^300m andhas a maximumwidth of approximately 7 km (Fig. 5, SU1).
SF1.4a has been interpreted as a large submarine slide,suggested by the characteristic moderate to low-ampli-tude, chaotic seismic facies (Fig. 8, Sections D^D0 andE^E0) that is distinctive of mass^transport complexes(MTC) (Sangree &Widmier, 1977; Brami et al., 2000; Posa-mentier & Kolla, 2003; Moscardelli & Wood, 2008). Thedown-dip terminus of the slide is characterised by a seawarddivergence inmapview,with accompanying increase in seis-mic and sediment thickness and less con¢nement withinthe valley margins (Fig.9a).The common divergence of Q3suchslides (e.g. Molnia et al., 1977; Prior et al., 1982; Moore et al.,1989; Bugge et al., 1998) at their Q4seaward extent suggests
12345678910111213141516171819202122232425262728293031323334353637383940414243444546474849505152535455565758 T
able1.
(Con
tinu
ed)
Seismic
Facies
Re£ection
con¢
guration
Lithofacies
and
compo
sition
Geometry
and
structure(vertical;
plan)
Lateralrelation
ships
Bou
ndaries
(lower;upp
er)
Amplitud
e;continuity;
frequency
Depositionalenviron
ment
4.3
Oblique
clino-
form
sassocia-
tedwith
chaotic
subfacies
Heterolithicswith
interbeddedthicker
sand
ston
eun
its(Fig.3)
Clin
oformwedge;
lobate
O¥apsanddownlaps
SF4.2
Dow
nlap;erosion
altrun
cation^shelf/
concordant^slop
e
Extremelyvariable;
low;variable
Shelf-margindeltaic
foresetscontribu
ting
toshelf-marginaccretion
during
relativ
esea-levelfall
4.4
Subp
arallel
Not
intersectedinwell
Sheet
Mergeslandw
ardinto
SF4.3
Con
cordant;concordant
Variable;m
od.;
variable
Basin-£
oormarineshales,
siltsandsand
s5.1
Und
ulating/
wavy
Not
intersectedinwell
Wedge
Mergesseaw
ardinto
SF5.2
Con
cordant
High;
discon
tinu
ous;
variable
Aggrading
£uvial-¢
ll
5.2
Com
plex
sigm
oid^
obliq
ue
Low
erslop
eheterolithics
(Fig.3)
Clin
oformlens;linear
Mergeslandw
ardinto
SF5.1
Dow
nlap;con
cordant
Mod.^low;m
od.;
unifo
rmSh
elf-margindeltaic
foresetscontribu
ting
toshelf-marginaccretion
during
relativ
esea-levelrise
mod.,mod
arate
r 2009 The AuthorsJournal Compilationr 2009 Blackwell Publishing Ltd, European Association ofGeoscientists & Engineers and International Association of Sedimentologists 9
8
7Erosional vs. accretionary shelf marginsQ1
BRE : 424
BRE 424(BW
UK
BR
E 4
24.P
DF
26-J
un-0
9 22
:20
2043
4613
Byt
es 2
8 PA
GE
S n
oper
ator
=T
.Pra
sath
)
£ow termination within an uncon¢ned setting (Posamen-tier & Kolla, 2003). As the slide slowed and reached lowergradients the erosional scouring capability of the slide wasreduced, allowing the slide to splay laterally. Another dis-tinguishing characteristic of the £ow terminus of debris
£ow/slide deposits are the convex ridges that appearclearly on attribute maps (e.g. Fig.9a) and time slices, inter-preted as pressure ridges.These imbricate thrust faults arecon¢ned solely to the chaotic facies of the slide depositsuggesting they are a syn-depositional feature that is
12345678910111213141516171819202122232425262728293031323334353637383940414243444546474849505152535455565758
SEISMIC UNIT 3
SEISMIC UNIT 2SEISMIC UNIT 1
SEISMIC UNIT 4
SEISMIC UNIT 5
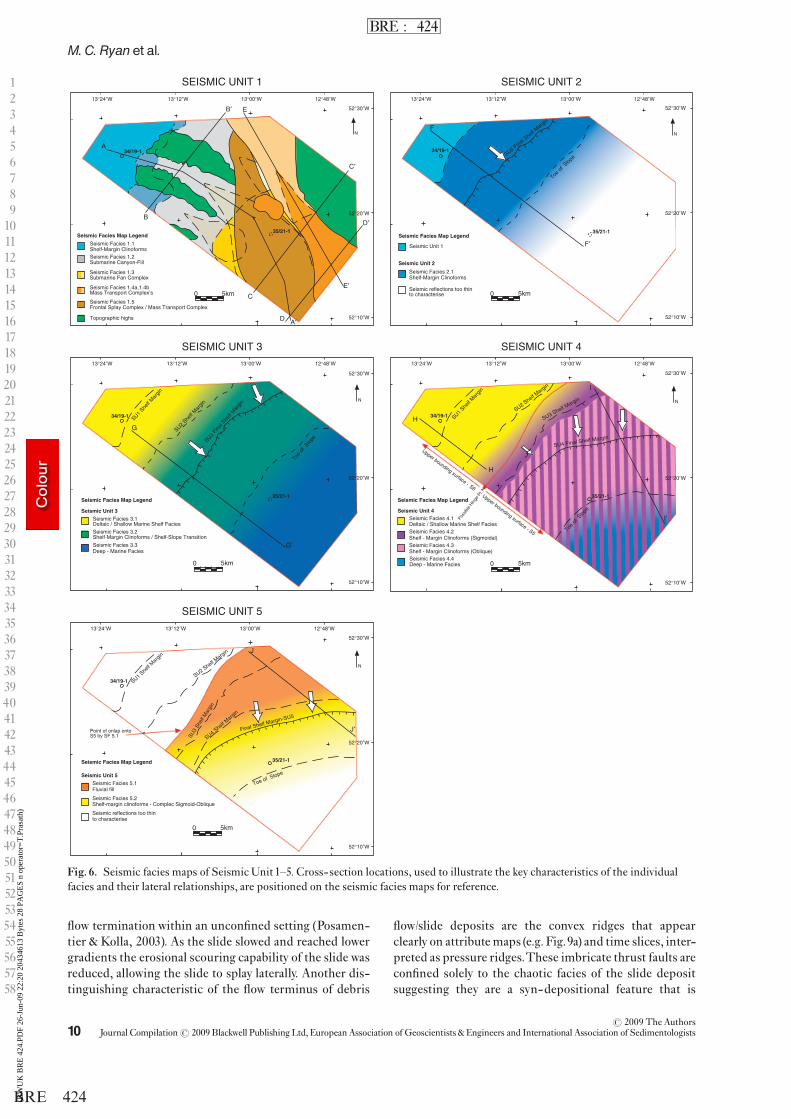
Fig. 6. Seismic facies maps of Seismic Unit 1^5. Cross-section locations, used to illustrate the key characteristics of the individualfacies and their lateral relationships, are positioned on the seismic facies maps for reference.
r 2009 The AuthorsJournal Compilationr 2009 Blackwell Publishing Ltd, EuropeanAssociation of Geoscientists & Engineers and International Association of Sedimentologists10
M. C. Ryanet al.
BRE : 424
BRE 424(BW
UK
BR
E 4
24.P
DF
26-J
un-0
9 22
:20
2043
4613
Byt
es 2
8 PA
GE
S n
oper
ator
=T
.Pra
sath
)
genetically related to transport and deposition (Bramiet al., 2000; Moscardelli &Wood, 2008). Evidence of scourassociated with transport is imaged in a dip map of S1(Fig. 9a inset). A long, linear groove is imaged; it scoursinto the basal surface (up to10m) of the valley for a distanceof approximately15 km and is interpreted to be geneticallyassociated with transport and deposition.The scour sug-gests the presence of large cohesive blocks, located at thebase of the £ow, that erosively cut into the substrate forlong distances (Brami et al., 2000; Posamentier & Kolla,2003).
SF1.4b is interpreted as an accumulation of later minorslides/debrites/turbidites.These £owswere con¢ned by thesteep-sided margins that were created by the large sub-marine slide of1.4a.TheU-shaped valley apparently actedas a conduit for the £ows, con¢ning themwithin the valleymargins. These smaller scale £ows deposited sedimentdownslope as acoustically transparent to semi-transparentdeposits that onlap basinwards onto the tail of SF1.4a (Fig.8, Section E^E0).
SF1.5
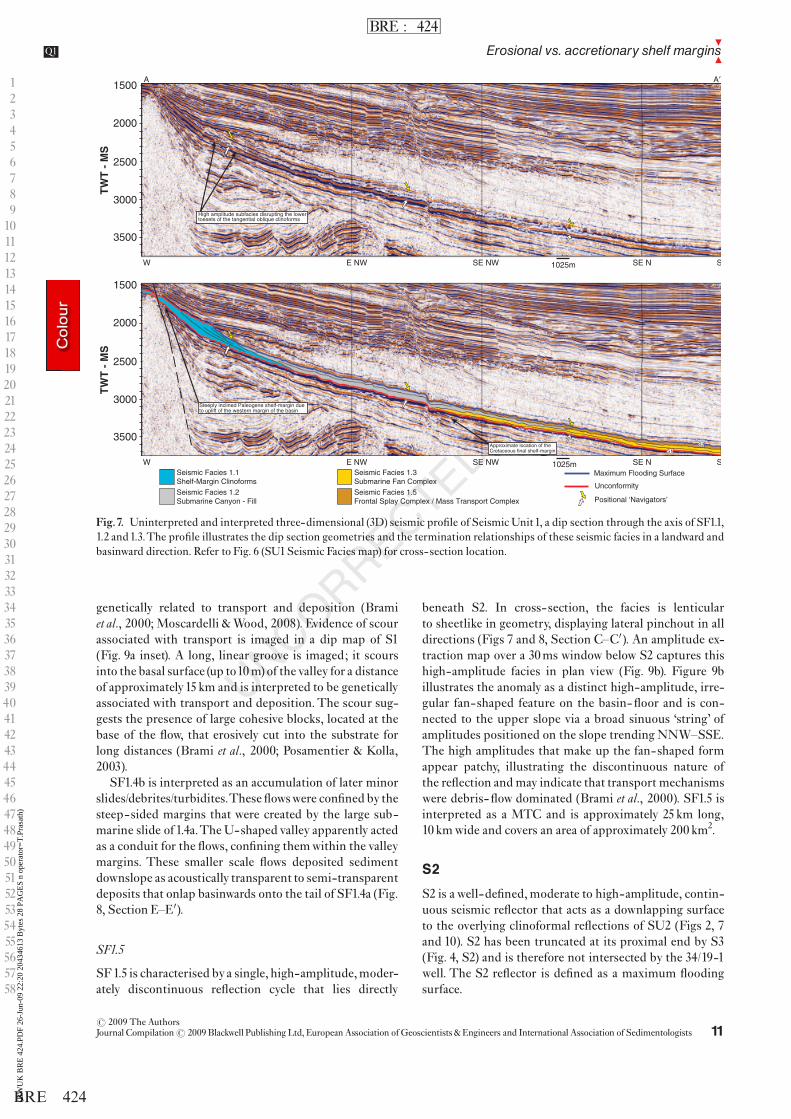
SF1.5 is characterised bya single, high-amplitude,moder-ately discontinuous re£ection cycle that lies directly
beneath S2. In cross-section, the facies is lenticularto sheetlike in geometry, displaying lateral pinchout in alldirections (Figs 7 and 8, Section C^C0). An amplitude ex-traction map over a 30ms window below S2 captures thishigh-amplitude facies in plan view (Fig. 9b). Figure 9billustrates the anomaly as a distinct high-amplitude, irre-gular fan-shaped feature on the basin- £oor and is con-nected to the upper slope via a broad sinuous ‘string’ ofamplitudes positioned on the slope trending NNW^SSE.The high amplitudes that make up the fan-shaped formappear patchy, illustrating the discontinuous nature ofthe re£ection andmay indicate that transport mechanismswere debris- £ow dominated (Brami et al., 2000). SF1.5 isinterpreted as a MTC and is approximately 25 km long,10 kmwide and covers an area of approximately 200 km2.
S2
S2 is awell-de¢ned,moderate to high-amplitude, contin-uous seismic re£ector that acts as a downlapping surfaceto the overlying clinoformal re£ections of SU2 (Figs 2, 7and 10). S2 has been truncated at its proximal end by S3(Fig. 4, S2) and is therefore not intersected by the 34/19-1well. The S2 re£ector is de¢ned as a maximum £oodingsurface.
12345678910111213141516171819202122232425262728293031323334353637383940414243444546474849505152535455565758
2500
2000
3000
3500
TW
T -
MS
2500
2000
3000
3500
TW
T -
MS
1500
1500
Fig.7. Uninterpreted and interpreted three-dimensional (3D) seismic pro¢le of Seismic Unit1, a dip section through the axis of SF1.1,1.2 and1.3.The pro¢le illustrates the dip section geometries and the termination relationships of these seismic facies in a landward andbasinward direction. Refer to Fig. 6 (SU1Seismic Facies map) for cross- section location.
r 2009 The AuthorsJournal Compilationr 2009 Blackwell Publishing Ltd, European Association ofGeoscientists & Engineers and International Association of Sedimentologists 11
8
7Erosional vs. accretionary shelf marginsQ1
BRE : 424
BRE 424(BW
UK
BR
E 4
24.P
DF
26-J
un-0
9 22
:20
2043
4613
Byt
es 2
8 PA
GE
S n
oper
ator
=T
.Pra
sath
)
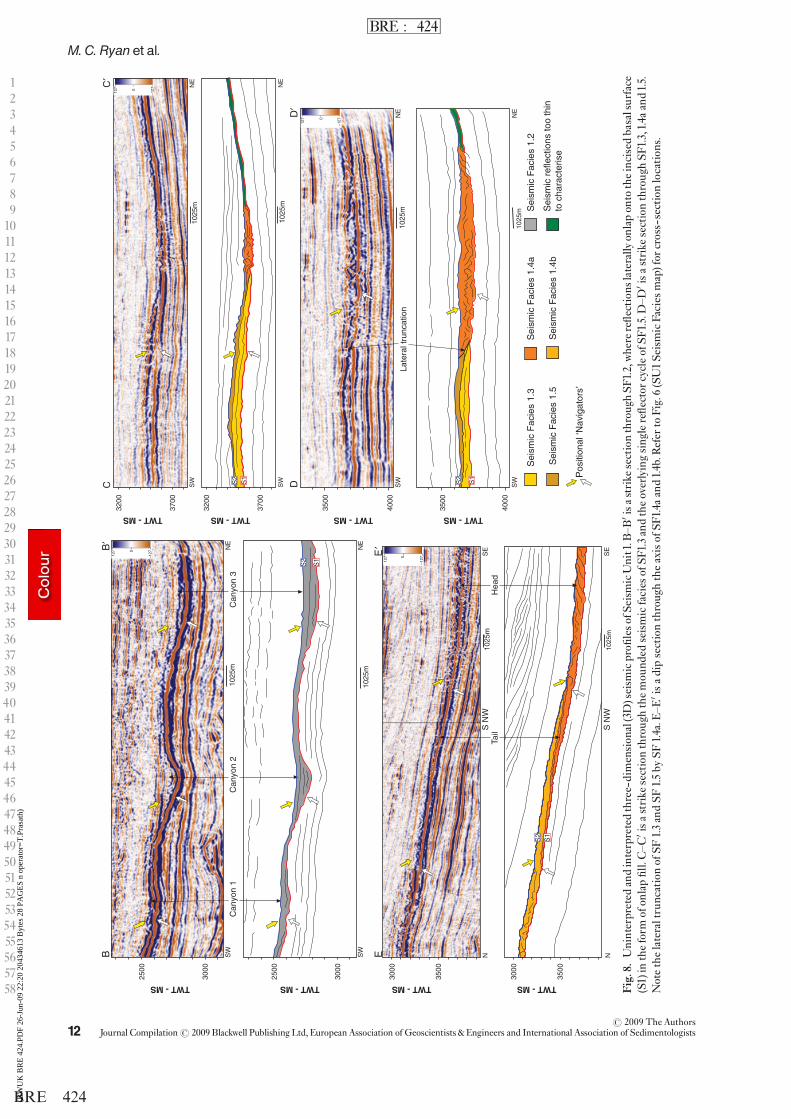
12345678910111213141516171819202122232425262728293031323334353637383940414243444546474849505152535455565758 Fi
g.8.
Uninterpreted
andinterpretedthree-dimension
al(3D)seism
icpro¢
leso
fSeism
icUnit1.B
^B0 isa
strike
sectionthroughSF
1.2,wherere£ections
laterally
onlapon
totheincisedbasalsurface
(S1)in
theform
ofon
lap¢ll.C^C0 isastrike
sectionthroughthemou
nded
seismicfacies
ofSF
1.3andtheoverlyingsinglere£ector
cycleofSF
1.5.D^D0 isastrike
sectionthroughSF
1.3,1.4a
and1.5.
NotethelateraltruncationofSF
1.3andSF
1.5by
SF1.4a.E
^E0 isadipsectionthroughtheaxisofSF
1.4a
and1.4b.R
efer
toFig.6(SU1Se
ismicFacies
map)for
cross-sectionlocation
s.
r 2009 The AuthorsJournal Compilationr 2009 Blackwell Publishing Ltd, EuropeanAssociation of Geoscientists & Engineers and International Association of Sedimentologists12
M. C. Ryanet al.
BRE : 424
BRE 424(BW
UK
BR
E 4
24.P
DF
26-J
un-0
9 22
:20
2043
4613
Byt
es 2
8 PA
GE
S n
oper
ator
=T
.Pra
sath
)
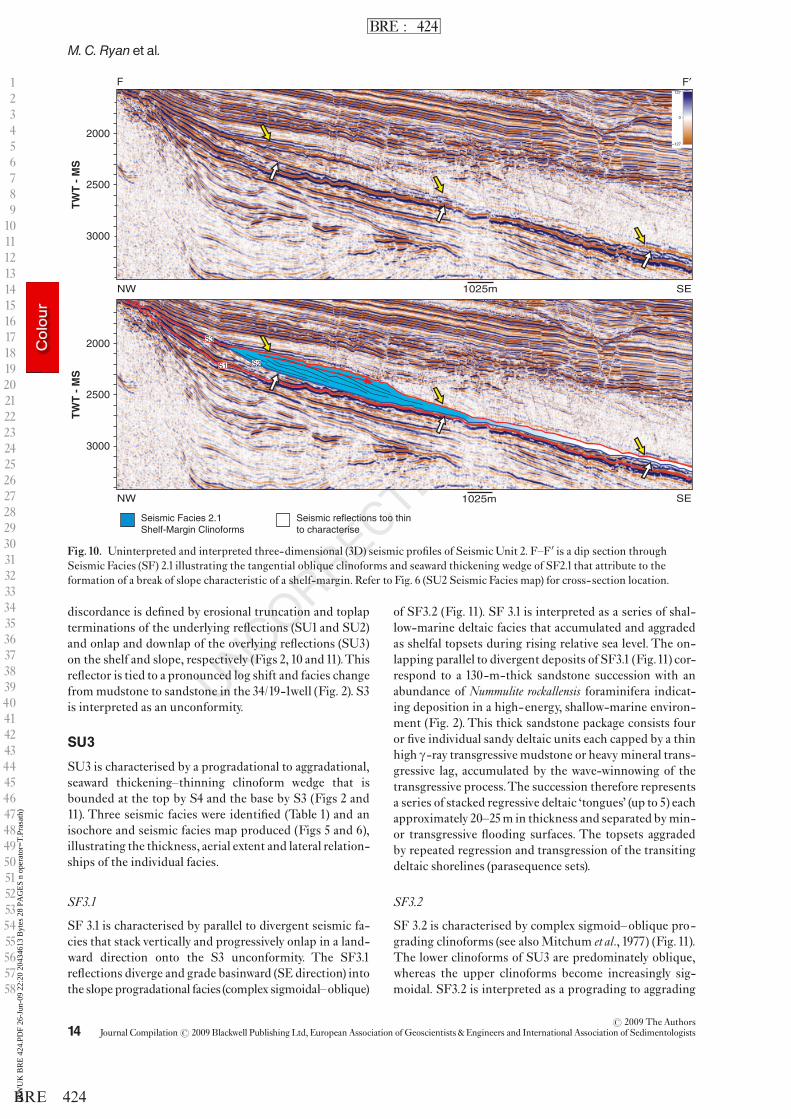
SU2
SU2 is characterised by a clinoformal, progradational sea-ward thickening^thinning wedge that is bounded at thetop by S3 and at the base by S2 (Figs 2 and 10). Figures 5and 6 show the isochore and seismic facies maps of SU2,respectively, illustrating the thickness, aerial extent andthe lateral relationship of the seismic facies encountered.SU2 is positioned basinward, and therefore not repre-sented, in well 34/19-1.
SF2.1
SF 2.1 consists of a seaward thickening^thinning wedge oftangential^oblique clinoforms (Fig. 10). The facies is in-
terpreted as shelf-margin clinoforms that developed aslope break as they grew into a deepwater area.The surfacewhere high-angle toplap terminations exist against anoverlying semi-planar truncation surface (S3) is inter-preted as the boundary between the shelf (or clinoformtopsets) and the deepwater slope (clinoform slope), at orslightly below palaeo-sea level. It is suggested that minorcannibalisation of earlier (landward) clinoform tops re-moved some of the facies along the clinoform rollover, re-sulting in the characteristic toplap re£ector terminations.
S3
S3 is a distinct, high-amplitude, continuous seismic re-£ector that is de¢ned by angular discordance.This angular
12345678910111213141516171819202122232425262728293031323334353637383940414243444546474849505152535455565758
(a)
(b)
Fig.9. RMSAttribute Extraction maps ofSU1. (a) A 20ms amplitude extractioninterval taken above the lower boundingsurface S1. Note the low amplitude lobelinked toCanyon 2 (SF1.3) and the absenceof the SF1.5 lobe within this amplitudewindow. Note also the marked contrast inamplitude strength between canyon- ¢llfacies and the basin- £oor faciessuggesting di¡erent lithologies.The insetis aDipmap of the lower bounding surfaceof the slide illustrating a prominent basalgroove indicative of scour associatedwithtransport. (b) A 30ms interval below theupper bounding surface S2. SF1.5 isimaged here as a high amplitude irregularlobe that is interpreted as either a debris£ow dominant mass transport complex ora frontal splay complex.
r 2009 The AuthorsJournal Compilationr 2009 Blackwell Publishing Ltd, European Association ofGeoscientists & Engineers and International Association of Sedimentologists 13
8
7Erosional vs. accretionary shelf marginsQ1
BRE : 424
BRE 424(BW
UK
BR
E 4
24.P
DF
26-J
un-0
9 22
:20
2043
4613
Byt
es 2
8 PA
GE
S n
oper
ator
=T
.Pra
sath
)
discordance is de¢ned by erosional truncation and toplapterminations of the underlying re£ections (SU1 and SU2)and onlap and downlap of the overlying re£ections (SU3)on the shelf and slope, respectively (Figs 2, 10 and11).Thisre£ector is tied to a pronounced log shift and facies changefrom mudstone to sandstone in the 34/19-1well (Fig. 2). S3is interpreted as an unconformity.
SU3
SU3 is characterised by a progradational to aggradational,seaward thickening^thinning clinoform wedge that isbounded at the top by S4 and the base by S3 (Figs 2 and11). Three seismic facies were identi¢ed (Table 1) and anisochore and seismic facies map produced (Figs 5 and 6),illustrating the thickness, aerial extent and lateral relation-ships of the individual facies.
SF3.1
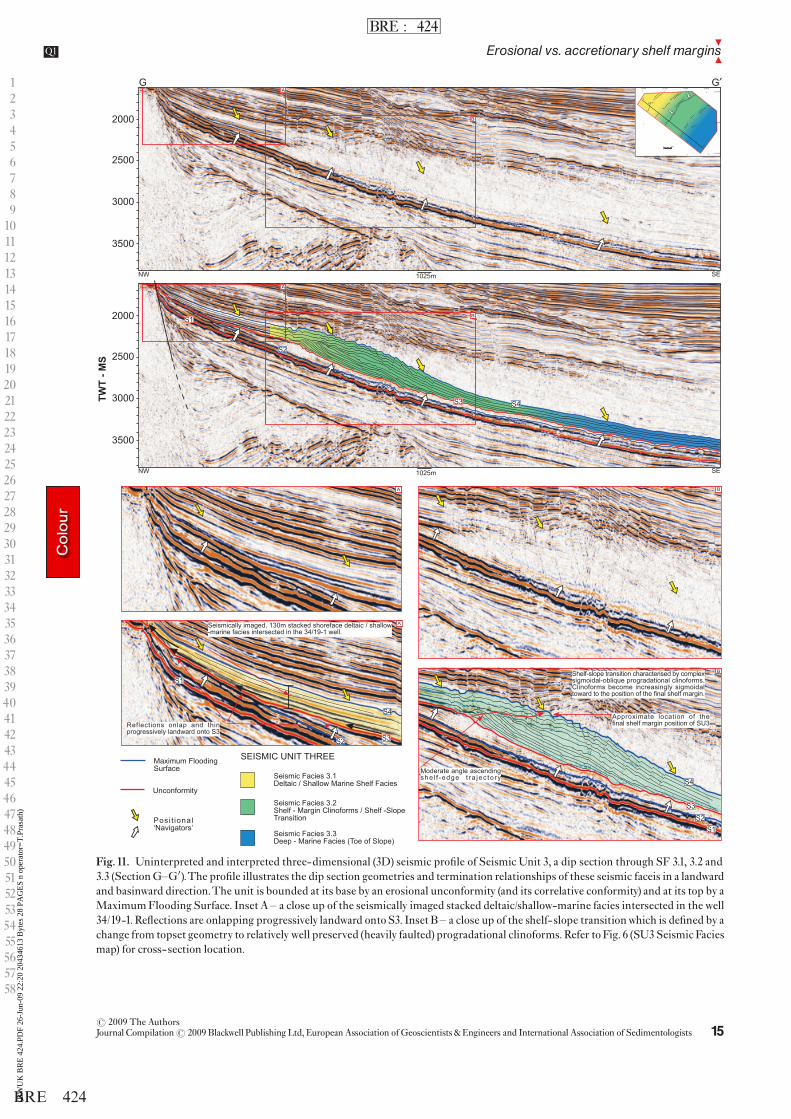
SF 3.1 is characterised by parallel to divergent seismic fa-cies that stack vertically and progressively onlap in a land-ward direction onto the S3 unconformity. The SF3.1re£ections diverge and grade basinward (SE direction) intothe slope progradational facies (complex sigmoidal oblique)
of SF3.2 (Fig. 11). SF 3.1 is interpreted as a series of shal-low-marine deltaic facies that accumulated and aggradedas shelfal topsets during rising relative sea level. The on-lapping parallel to divergent deposits of SF3.1 (Fig.11) cor-respond to a 130-m-thick sandstone succession with anabundance of Nummulite rockallensis foraminifera indicat-ing deposition in a high-energy, shallow-marine environ-ment (Fig. 2). This thick sandstone package consists fouror ¢ve individual sandy deltaic units each capped by a thinhigh g-ray transgressive mudstone or heavy mineral trans-gressive lag, accumulated by the wave-winnowing of thetransgressive process.The succession therefore representsa series of stacked regressive deltaic ‘tongues’ (up to 5) eachapproximately 20^25m in thickness and separated bymin-or transgressive £ooding surfaces. The topsets aggradedby repeated regression and transgression of the transitingdeltaic shorelines (parasequence sets).
SF3.2
SF 3.2 is characterised by complex sigmoid^oblique pro-grading clinoforms (see alsoMitchum et al., 1977) (Fig.11).The lower clinoforms of SU3 are predominately oblique,whereas the upper clinoforms become increasingly sig-moidal. SF3.2 is interpreted as a prograding to aggrading
12345678910111213141516171819202122232425262728293031323334353637383940414243444546474849505152535455565758
2500
3000
2000
TW
T -
MS
SE1025mNW
2500
3000
2000
TW
T -
MS
SENW 1025m
F F′
Seismic reflections too thinto characterise
Seismic Facies 2.1Shelf-Margin Clinoforms
Fig.10. Uninterpreted and interpreted three-dimensional (3D) seismic pro¢les of Seismic Unit 2. F^F0 is a dip section throughSeismic Facies (SF) 2.1 illustrating the tangential oblique clinoforms and seaward thickening wedge of SF2.1 that attribute to theformation of a break of slope characteristic of a shelf-margin. Refer to Fig. 6 (SU2 Seismic Facies map) for cross- section location.
r 2009 The AuthorsJournal Compilationr 2009 Blackwell Publishing Ltd, EuropeanAssociation of Geoscientists & Engineers and International Association of Sedimentologists14
M. C. Ryanet al.
BRE : 424
BRE 424(BW
UK
BR
E 4
24.P
DF
26-J
un-0
9 22
:20
2043
4613
Byt
es 2
8 PA
GE
S n
oper
ator
=T
.Pra
sath
)
12345678910111213141516171819202122232425262728293031323334353637383940414243444546474849505152535455565758
′
Fig.11. Uninterpreted and interpreted three-dimensional (3D) seismic pro¢le of Seismic Unit 3, a dip section through SF 3.1, 3.2 and3.3 (SectionG^G0).The pro¢le illustrates the dip section geometries and termination relationships of these seismic faceis in a landwardand basinward direction.The unit is bounded at its base by an erosional unconformity (and its correlative conformity) and at its top by aMaximumFlooding Surface. Inset A ^ a close up of the seismically imaged stacked deltaic/shallow-marine facies intersected in the well34/19-1. Re£ections are onlapping progressively landward onto S3. Inset B ^ a close up of the shelf-slope transitionwhich is de¢ned by achange from topset geometry to relativelywell preserved (heavily faulted) progradational clinoforms. Refer toFig. 6 (SU3Seismic Faciesmap) for cross- section location.
r 2009 The AuthorsJournal Compilationr 2009 Blackwell Publishing Ltd, European Association ofGeoscientists & Engineers and International Association of Sedimentologists 15
8
7Erosional vs. accretionary shelf marginsQ1
BRE : 424
BRE 424(BW
UK
BR
E 4
24.P
DF
26-J
un-0
9 22
:20
2043
4613
Byt
es 2
8 PA
GE
S n
oper
ator
=T
.Pra
sath
)
deltaic shelf-margin to slope system, developed during arising relative sea level (normal regression; Posamentieret al., 1992). This is substantiated in the seismic data by¢rstly, the complex sigmoid^oblique clinoform re£ectionsthat indicate slope progradationwith an aggradational (as-cending) component and secondly, the subhorizontal, coe-val up-dip topsets of the clinoforms (SF3.1) that stackvertically and onlap landward onto the S3 unconformity.These latter re£ect an aggrading shelf built by the repeatedtransits of a delta system.
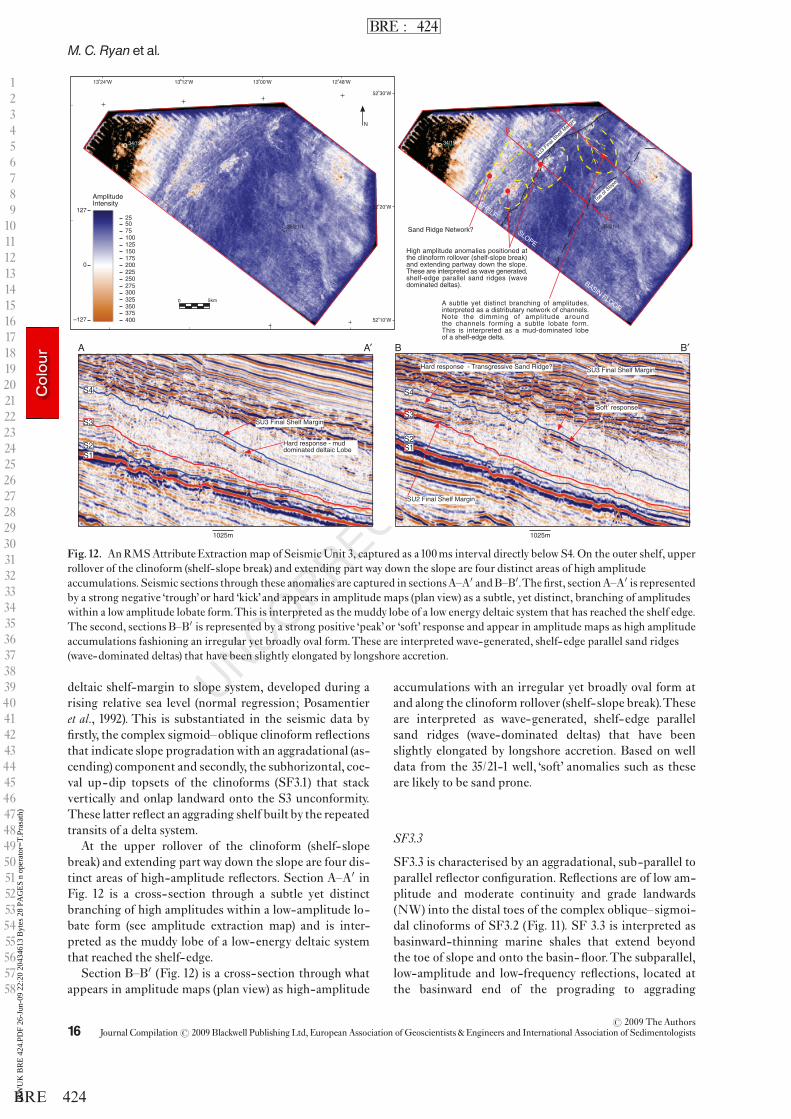
At the upper rollover of the clinoform (shelf- slopebreak) and extending part way down the slope are four dis-tinct areas of high-amplitude re£ectors. Section A^A0 inFig. 12 is a cross-section through a subtle yet distinctbranching of high amplitudes within a low-amplitude lo-bate form (see amplitude extraction map) and is inter-preted as the muddy lobe of a low-energy deltaic systemthat reached the shelf-edge.
Section B^B0 (Fig. 12) is a cross-section through whatappears in amplitude maps (plan view) as high-amplitude
accumulations with an irregular yet broadly oval form atand along the clinoform rollover (shelf- slope break).Theseare interpreted as wave-generated, shelf-edge parallelsand ridges (wave-dominated deltas) that have beenslightly elongated by longshore accretion. Based on welldata from the 35/21-1 well, ‘soft’ anomalies such as theseare likely to be sand prone.
SF3.3
SF3.3 is characterised by an aggradational, sub-parallel toparallel re£ector con¢guration. Re£ections are of low am-plitude and moderate continuity and grade landwards(NW) into the distal toes of the complex oblique^sigmoi-dal clinoforms of SF3.2 (Fig. 11). SF 3.3 is interpreted asbasinward-thinning marine shales that extend beyondthe toe of slope and onto the basin- £oor.The subparallel,low-amplitude and low-frequency re£ections, located atthe basinward end of the prograding to aggrading
12345678910111213141516171819202122232425262728293031323334353637383940414243444546474849505152535455565758
A A′ B B′
Fig.12. AnRMSAttribute Extraction map of SeismicUnit 3, captured as a100ms interval directly below S4. On the outer shelf, upperrollover of the clinoform (shelf-slope break) and extending part way down the slope are four distinct areas of high amplitudeaccumulations. Seismic sections through these anomalies are captured in sectionsA^A0 andB^B0.The ¢rst, sectionA^A0 is representedby a strong negative ‘trough’or hard ‘kick’and appears in amplitude maps (plan view) as a subtle, yet distinct, branching of amplitudeswithin a low amplitude lobate form.This is interpreted as the muddy lobe of a low energy deltaic system that has reached the shelf edge.The second, sections B^B0 is represented by a strong positive ‘peak’or ‘soft’ response and appear in amplitude maps as high amplitudeaccumulations fashioning an irregular yet broadly oval form.These are interpretedwave-generated, shelf-edge parallel sand ridges(wave-dominated deltas) that have been slightly elongated by longshore accretion.
r 2009 The AuthorsJournal Compilationr 2009 Blackwell Publishing Ltd, EuropeanAssociation of Geoscientists & Engineers and International Association of Sedimentologists16
M. C. Ryanet al.
BRE : 424
BRE 424(BW
UK
BR
E 4
24.P
DF
26-J
un-0
9 22
:20
2043
4613
Byt
es 2
8 PA
GE
S n
oper
ator
=T
.Pra
sath
)
clinoform re£ections of SF3.2 suggest a shale prone suc-cession (see also Sangree &Widmier, 1977).
S4
S4 is a moderate to high-amplitude, continuous seismicre£ector that is parallel to the shelf and acts as a downlapsurface for the overlying re£ectors of SU4 on the slope(Figs 11 and 13).The S4 re£ector is tied to the 34/19-1wellat the contact between an upward ¢ning and thinninglithological succession below and an upward coarseningand thickening succession lithological above (Fig. 2).TheS4 re£ector is interpreted as a maximum £ooding surface.
SF4.1
SF4.1 is a vertical continuation of the strongly aggrada-tional, parallel re£ector con¢guration of SF3.1 interpretedas aggrading shelf, constructed by the repeated transits ofshallow marine deltas on the shelf during a rising relativesea level (Fig. 13, Section H^H0 ). Amplitude extractionsalong these re£ections reveal well-de¢ned branched lo-bate anomalies interpreted as inner-shelf deltas (Fig. 13,Section H0^H ^ inset A). Such deltas, by their very lobate,broad distributive nature, are interpreted to have pro-graded by river domination into a relatively protected en-vironment. Re£ections merge basinwards (SE direction)into the coeval, progradational slope facies (sigmoidal) ofSF4.2 (Fig. 13). SF4.1 is the only facies in SU4 that is pre-sent in the 34/19-1well (Fig. 2).The seismic facies form aseries of coarsening-upward trending sandstones, eachcapped by a high g-ray, transgressive mudstone or heavymineral transgressive lag, accumulated by the wave-win-nowing of the transgressive process. These sandstones,containing Nummulite foraminifera, have been interpretedas prograding deltaic tongues capped by a transgressive£ooding surface (Fig. 2).
SF4.2
SF4.2 is characterised by sigmoidal clinoforms interpretedas a stacked aggradational series of shallow marine deltasdeveloped during rising relative sea level (Fig. 13). Later-ally along the dip section (seawards), the sigmoidal clino-forms are o¥apped by the oblique clinoform facies ofSF4.3. The upper rollover portion of the clinoform isslightly truncated by very low-angle discordance alongthe upper bounding surface S5 (the sigmoid form is re-tained however).
SF4.3
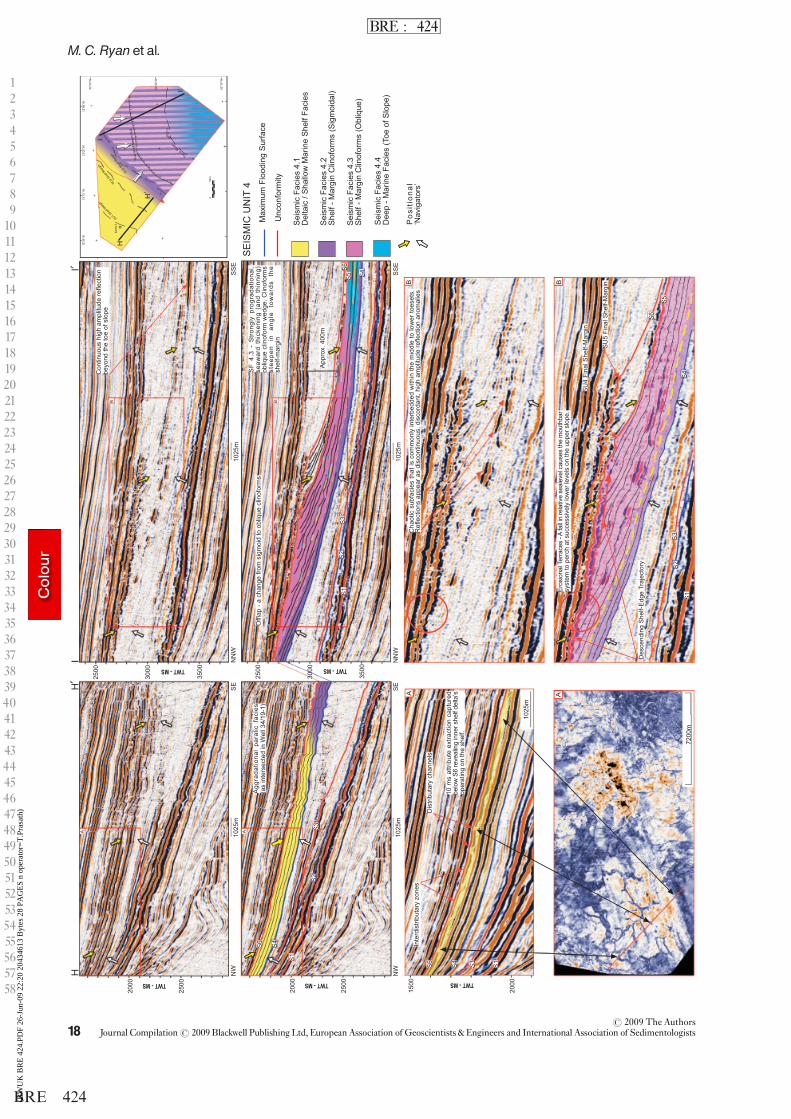
SF4.3 is characterised by oblique clinoforms, where thetoplap terminations abut against an overlying, highly irre-gular, truncation surface (S5) (Fig. 13, Section I^I0 ). Ero-sional terraces, positioned at successively lower levels atthe top of the regressive wedge are observed (Fig.13, Sec-tion I^I0 and inset B). Isochore patterns of SU4 (Fig. 5,SU4) reveal the uneven lobate nature of the shelf-edge
deltas along strike, beyond the point of initial o¥ap sug-gesting point-sourced progradation.The SF4.3 re£ectionpattern is interpreted as shelf-margin deltaic foresets con-tributing to shelf-margin accretion during relative sea-le-vel fall (forced regression of Posamentier et al., 1992;attached forced regression of Posamentier & Morris,2000).
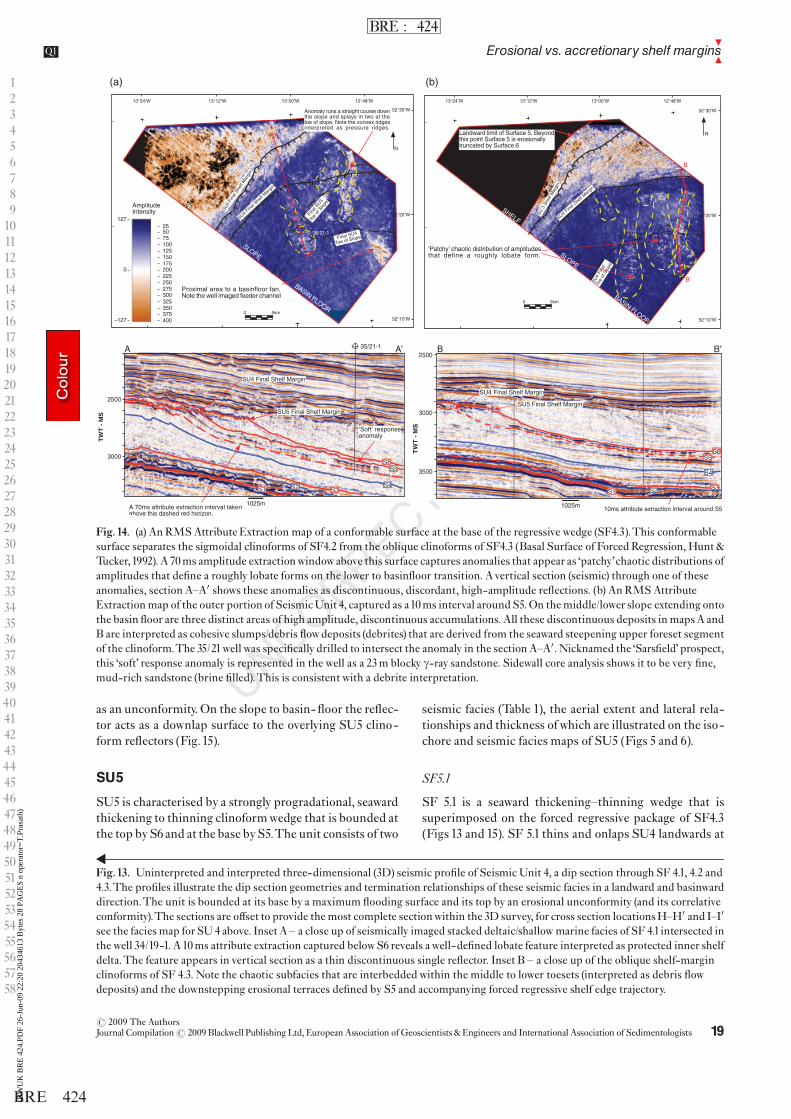
A relatively chaotic subfacies disrupting the tangentialoblique re£ections is commonly interbedded within themiddle to lower toesets (Fig. 13, Section I^I0 and inset B).Re£ections appear as discontinuous, discordant, high-amplitude anomalies and are interpreted as debris £owde-posits (see also Lehner, 1969; Sangree et al., 1978) initiatedthrough slope oversteepening and subsequent slumpingof the upper foreset segments of the clinoforms (see alsoSuter & Berryhill, 1985). Examples of this chaotic subfa-cies, illustrating geometries and positions on the toe ofslope, are imaged in plan view (two amplitude extractions)and vertical section (seismic) in Fig. 14. An alternativeinterpretation of these high-amplitude anomalies are aseries of channel and lobe complexes positioned on theslope (Johannessen & Steel, 2005). The 35/21-1 well wasspeci¢cally drilled to intersect one of the high-amplitudeanomalies positioned on the toe of slope. This ‘Sars¢eld’prospect is imaged in both plan view and dip section inFig.14.The seismic anomaly is represented by a strong po-sitive ‘peak’ or ‘soft’ response (reverse polarity zero phasewavelet) and is represented in the well as a 26-m-thick‘blocky’ sandstone. Sidewall core analysis shows it to bevery ¢ne,mud-rich sandstone (brine ¢lled).Above and be-low the sandstone in the well, there is a silty heterolithicfacies.
SF4.4
SF4.4 is characterised by an aggradational, sub-parallel toparallel re£ector con¢guration, highly variable in ampli-tude and moderate continuity, and grades landwards (NWdirection) into the distal toe of the slope progradational fa-cies (oblique) SF4.3 (Fig.13).
SF4.4 is interpreted as a mud-dominated heterolithicmarine unit that extends beyond the base of slope, relatedto a coeval prograding shelf-margin (SF4.3).The continu-ous high-amplitude re£ections beyond the toe of slope,interbedded within subparallel, low amplitude and fre-quency re£ections, are interpreted as a basin- £oor fan(Fig.14) (see also Johannessen & Steel, 2005).
S5
S5 is a distinct, high-amplitude, undulating seismic re-£ector that is characterised by angular discordance (Figs13 and15).This angular discordance is de¢ned by erosionaltruncation and toplap terminations of the underlying re-£ections. S5 is interpreted as the downcutting of a £uvialsystem over a broad area during a relative sea-level fall.The erosional irregular topography of the surface is ‘in-¢lled’ by the re£ections on SU5 (Fig.15). S5 is interpreted
12345678910111213141516171819202122232425262728293031323334353637383940414243444546474849505152535455565758
r 2009 The AuthorsJournal Compilationr 2009 Blackwell Publishing Ltd, European Association ofGeoscientists & Engineers and International Association of Sedimentologists 17
8
7Erosional vs. accretionary shelf marginsQ1
BRE : 424
BRE 424(BW
UK
BR
E 4
24.P
DF
26-J
un-0
9 22
:20
2043
4613
Byt
es 2
8 PA
GE
S n
oper
ator
=T
.Pra
sath
)
12345678910111213141516171819202122232425262728293031323334353637383940414243444546474849505152535455565758
r 2009 The AuthorsJournal Compilationr 2009 Blackwell Publishing Ltd, EuropeanAssociation of Geoscientists & Engineers and International Association of Sedimentologists18
M. C. Ryanet al.
BRE : 424
BRE 424(BW
UK
BR
E 4
24.P
DF
26-J
un-0
9 22
:20
2043
4613
Byt
es 2
8 PA
GE
S n
oper
ator
=T
.Pra
sath
)
as an unconformity. On the slope to basin- £oor the re£ec-tor acts as a downlap surface to the overlying SU5 clino-form re£ectors (Fig.15).
SU5
SU5 is characterised by a strongly progradational, seawardthickening to thinning clinoformwedge that is bounded atthe top byS6 and at the base byS5.The unit consists of two
seismic facies (Table 1), the aerial extent and lateral rela-tionships and thickness ofwhich are illustrated on the iso-chore and seismic facies maps of SU5 (Figs 5 and 6).
SF5.1
SF 5.1 is a seaward thickening^thinning wedge that issuperimposed on the forced regressive package of SF4.3(Figs 13 and 15). SF 5.1 thins and onlaps SU4 landwards at
12345678910111213141516171819202122232425262728293031323334353637383940414243444546474849505152535455565758
A A′ B B′
(a) (b)
Fig.14. (a) An RMSAttribute Extraction map of a conformable surface at the base of the regressive wedge (SF4.3).This conformablesurface separates the sigmoidal clinoforms of SF4.2 from the oblique clinoforms of SF4.3 (Basal Surface of Forced Regression, Hunt &Tucker,1992).A70ms amplitude extractionwindow above this surface captures anomalies that appear as ‘patchy’chaotic distributions ofamplitudes that de¢ne a roughly lobate forms on the lower to basin£oor transition. Avertical section (seismic) through one of theseanomalies, section A^A0 shows these anomalies as discontinuous, discordant, high-amplitude re£ections. (b) An RMSAttributeExtraction map of the outer portion of SeismicUnit 4, captured as a10ms interval aroundS5.On the middle/lower slope extending ontothe basin £oor are three distinct areas of high amplitude, discontinuous accumulations. All these discontinuous deposits in mapsA andB are interpreted as cohesive slumps/debris £owdeposits (debrites) that are derived from the seaward steepening upper foreset segmentof the clinoform.The 35/21well was speci¢cally drilled to intersect the anomaly in the section A^A0. Nicknamed the ‘Sars¢eld’prospect,this ‘soft’ response anomaly is represented in the well as a 23m blocky g-ray sandstone. Sidewall core analysis shows it to be very ¢ne,mud-rich sandstone (brine ¢lled).This is consistent with a debrite interpretation.
Fig.13. Uninterpreted and interpreted three-dimensional (3D) seismic pro¢le of Seismic Unit 4, a dip section through SF 4.1, 4.2 and4.3.The pro¢les illustrate the dip section geometries and termination relationships of these seismic facies in a landward and basinwarddirection.The unit is bounded at its base by a maximum £ooding surface and its top by an erosional unconformity (and its correlativeconformity).The sections are o¡set to provide the most complete sectionwithin the 3D survey, for cross section locationsH^H0 and I^I0
see the facies map for SU4 above. Inset A ^ a close up of seismically imaged stacked deltaic/shallow marine facies of SF4.1intersected inthe well 34/19-1. A10ms attribute extraction captured belowS6 reveals awell-de¢ned lobate feature interpreted as protected inner shelfdelta.The feature appears in vertical section as a thin discontinuous single re£ector. Inset B ^ a close up of the oblique shelf-marginclinoforms of SF 4.3. Note the chaotic subfacies that are interbeddedwithin the middle to lower toesets (interpreted as debris £owdeposits) and the downstepping erosional terraces de¢ned by S5 and accompanying forced regressive shelf edge trajectory.
r 2009 The AuthorsJournal Compilationr 2009 Blackwell Publishing Ltd, European Association ofGeoscientists & Engineers and International Association of Sedimentologists 19
8
7Erosional vs. accretionary shelf marginsQ1
BRE : 424
BRE 424(BW
UK
BR
E 4
24.P
DF
26-J
un-0
9 22
:20
2043
4613
Byt
es 2
8 PA
GE
S n
oper
ator
=T
.Pra
sath
)
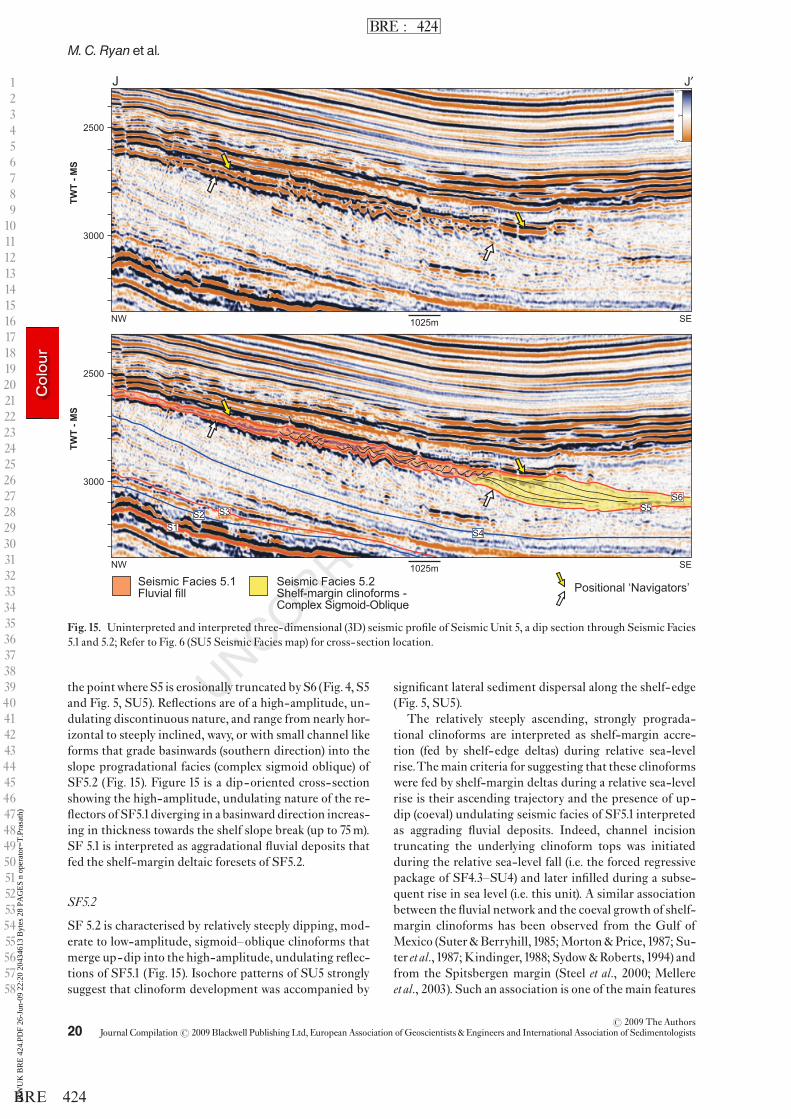
the pointwhereS5 is erosionally truncated byS6 (Fig.4, S5and Fig. 5, SU5). Re£ections are of a high-amplitude, un-dulating discontinuous nature, and range from nearly hor-izontal to steeply inclined, wavy, or with small channel likeforms that grade basinwards (southern direction) into theslope progradational facies (complex sigmoid oblique) ofSF5.2 (Fig. 15). Figure 15 is a dip-oriented cross-sectionshowing the high-amplitude, undulating nature of the re-£ectors of SF5.1diverging in a basinward direction increas-ing in thickness towards the shelf slope break (up to 75m).SF 5.1 is interpreted as aggradational £uvial deposits thatfed the shelf-margin deltaic foresets of SF5.2.
SF5.2
SF 5.2 is characterised by relatively steeply dipping, mod-erate to low-amplitude, sigmoid^oblique clinoforms thatmerge up-dip into the high-amplitude, undulating re£ec-tions of SF5.1 (Fig. 15). Isochore patterns of SU5 stronglysuggest that clinoform development was accompanied by
signi¢cant lateral sediment dispersal along the shelf-edge(Fig. 5, SU5).
The relatively steeply ascending, strongly prograda-tional clinoforms are interpreted as shelf-margin accre-tion (fed by shelf-edge deltas) during relative sea-levelrise.The main criteria for suggesting that these clinoformswere fed by shelf-margin deltas during a relative sea-levelrise is their ascending trajectory and the presence of up-dip (coeval) undulating seismic facies of SF5.1 interpretedas aggrading £uvial deposits. Indeed, channel incisiontruncating the underlying clinoform tops was initiatedduring the relative sea-level fall (i.e. the forced regressivepackage of SF4.3^SU4) and later in¢lled during a subse-quent rise in sea level (i.e. this unit). A similar associationbetween the £uvial network and the coeval growth of shelf-margin clinoforms has been observed from the Gulf ofMexico (Suter &Berryhill, 1985;Morton&Price,1987; Su-ter etal., 1987;Kindinger,1988; Sydow&Roberts,1994) andfrom the Spitsbergen margin (Steel et al., 2000; Mellereetal., 2003). Such an association is one of the main features
12345678910111213141516171819202122232425262728293031323334353637383940414243444546474849505152535455565758
Fig.15. Uninterpreted and interpreted three-dimensional (3D) seismic pro¢le of Seismic Unit 5, a dip section through Seismic Facies5.1 and 5.2; Refer to Fig. 6 (SU5 Seismic Facies map) for cross- section location.
r 2009 The AuthorsJournal Compilationr 2009 Blackwell Publishing Ltd, EuropeanAssociation of Geoscientists & Engineers and International Association of Sedimentologists20
M. C. Ryanet al.
BRE : 424
BRE 424(BW
UK
BR
E 4
24.P
DF
26-J
un-0
9 22
:20
2043
4613
Byt
es 2
8 PA
GE
S n
oper
ator
=T
.Pra
sath
)
that allow shelf-margin deltas to be distinguished fromthe other types of shelf-edge progradation during a risein relative sea level (Porebski & Steel, 2003).
SF 5.2 is represented in well 35/21-1 by a 45-m-thickheterolithic marine unit interpreted as lower slope depos-its (Fig. 3).
S6
S6 is a moderate to high-amplitude re£ector that erosion-ally truncates the underlyingS5 re£ector some5^15 kmbe-hind the shelf-break, with a shallow angular discordance(Fig. 4, S6). From this position of truncation (hinge point)and seawards S6 is positioned at the top of the £uvialin¢ll facies on the shelf and acts as a downlap surface forlater deposits on the slope. S6 is a highly diachronoussurface that is interpreted as a subaerial erosional uncon-formity on the inner shelf (landward of the hinge point),a subaqueous unconformity on the outer shelf (seawardof the hinge point) and a coeval conformable surface onthe slope.
Sequence stratigraphy and palaeo-reconstruction
The seismic facies analysis and interpretation of the indi-vidual seismic units are the basis for a tentative palaeogeo-graphic reconstruction of the various units within the3D seismic survey area. The depositional history is illu-strated through a series of cartoons (Figs16^18). Althoughinterpretative in nature, the reconstructions have beenmade to link the evolution of the seismic units to the seis-mic facies encountered, their geometry and spatial rela-tionships.
Earlymargin growth: the erosionalmargin(SU1)
During the early Palaeocene, chalk deposition dominated,blanketing the Cretaceous shelf during a relative sea levelhighstand. Uplift of the western margin (Shannon et al.,1993; Johnston et al., 2001) and down-tilting of the earlierCretaceous shelf created a steep physiographic pro¢le anda new Palaeogene shelf- slope transition that now lay farlandward and more proximal of the older Cretaceous slopebreak (Figs 4 and 7).The deposition of the Palaeogene SU1was thus superimposed on a chalk physiography and initi-ally developed on an oversteepened shelf-margin (ero-sional margin, Ross et al., 1994), triggering a dominance ofsediment bypass across the shelf at this early stage.
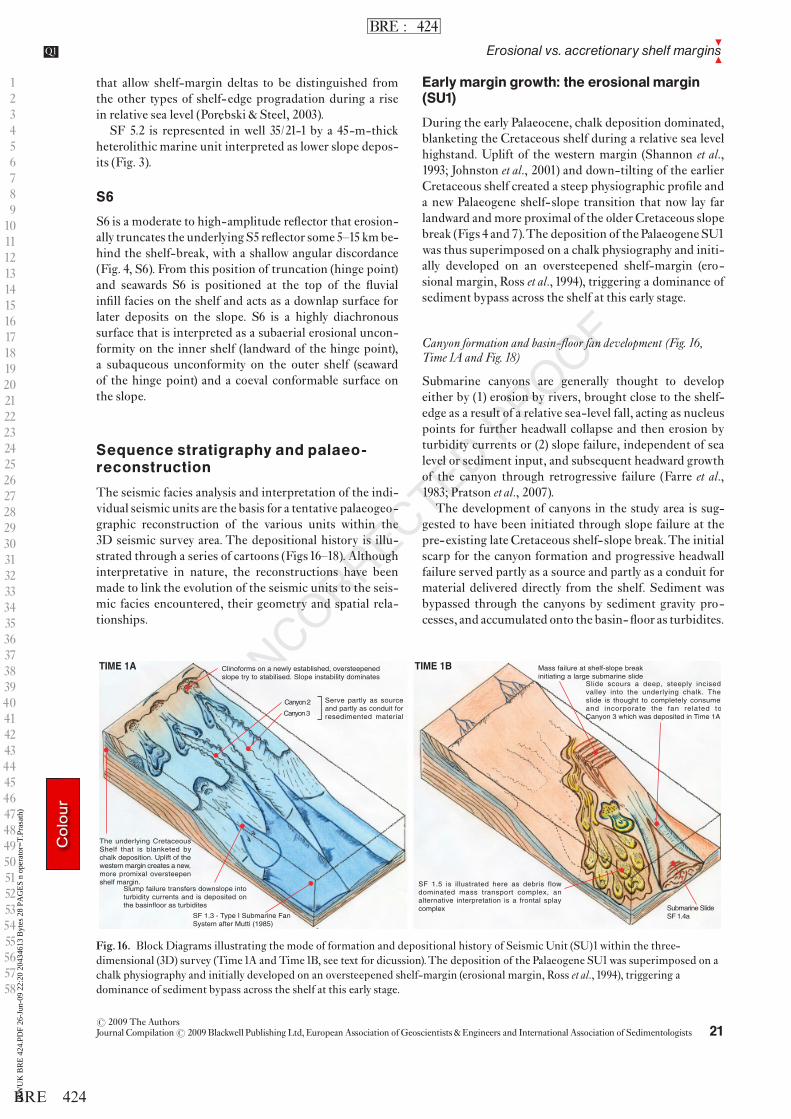
Canyon formation and basin-£oor fan development (Fig. 16,Time1A and Fig. 18)
Submarine canyons are generally thought to developeither by (1) erosion by rivers, brought close to the shelf-edge as a result of a relative sea-level fall, acting as nucleuspoints for further headwall collapse and then erosion byturbidity currents or (2) slope failure, independent of sealevel or sediment input, and subsequent headward growthof the canyon through retrogressive failure (Farre et al.,1983; Pratson et al., 2007).
The development of canyons in the study area is sug-gested to have been initiated through slope failure at thepre-existing late Cretaceous shelf- slope break.The initialscarp for the canyon formation and progressive headwallfailure served partly as a source and partly as a conduit formaterial delivered directly from the shelf. Sediment wasbypassed through the canyons by sediment gravity pro-cesses, and accumulated onto the basin- £oor as turbidites.
12345678910111213141516171819202122232425262728293031323334353637383940414243444546474849505152535455565758
Fig.16. Block Diagrams illustrating the mode of formation and depositional history of Seismic Unit (SU)1within the three-dimensional (3D) survey (Time1A and Time1B, see text for dicussion).The deposition of the Palaeogene SU1was superimposed on achalk physiography and initially developed on an oversteepened shelf-margin (erosional margin, Ross et al., 1994), triggering adominance of sediment bypass across the shelf at this early stage.
r 2009 The AuthorsJournal Compilationr 2009 Blackwell Publishing Ltd, European Association ofGeoscientists & Engineers and International Association of Sedimentologists 21
8
7Erosional vs. accretionary shelf marginsQ1
BRE : 424
BRE 424(BW
UK
BR
E 4
24.P
DF
26-J
un-0
9 22
:20
2043
4613
Byt
es 2
8 PA
GE
S n
oper
ator
=T
.Pra
sath
)
12345678910111213141516171819202122232425262728293031323334353637383940414243444546474849505152535455565758
TIME 3
TIME 4A
TIME 4B
TIME 5
TIME 2
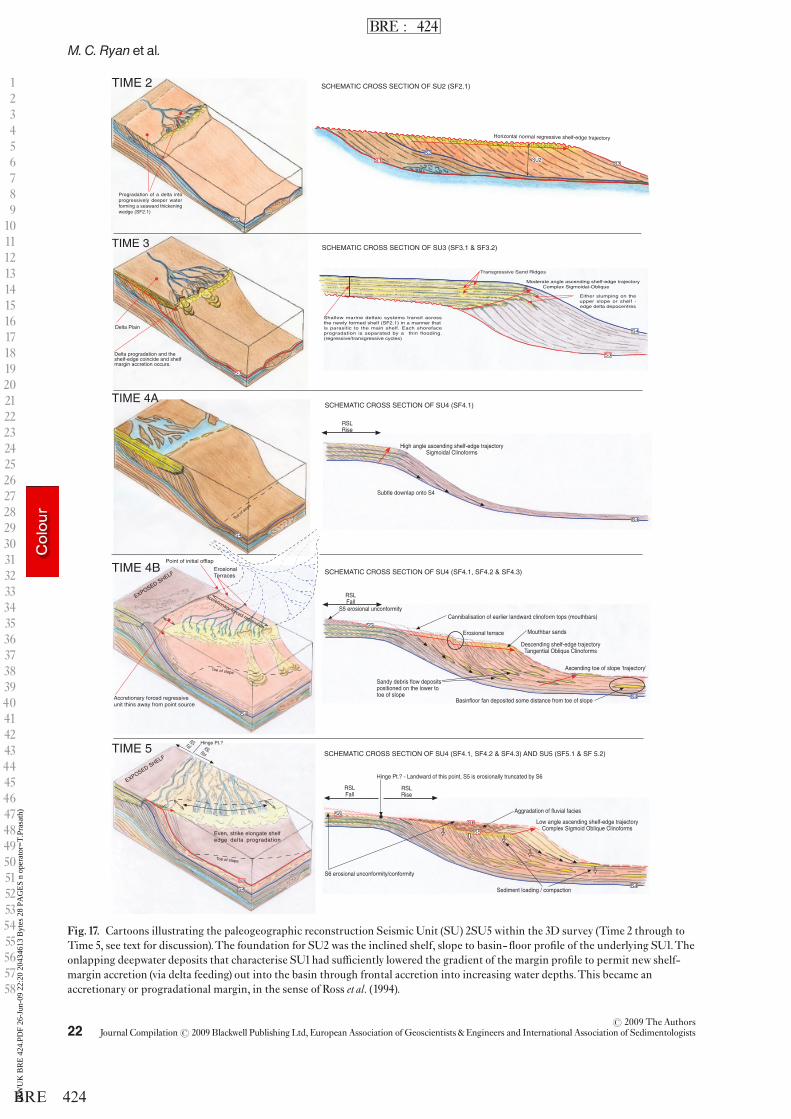
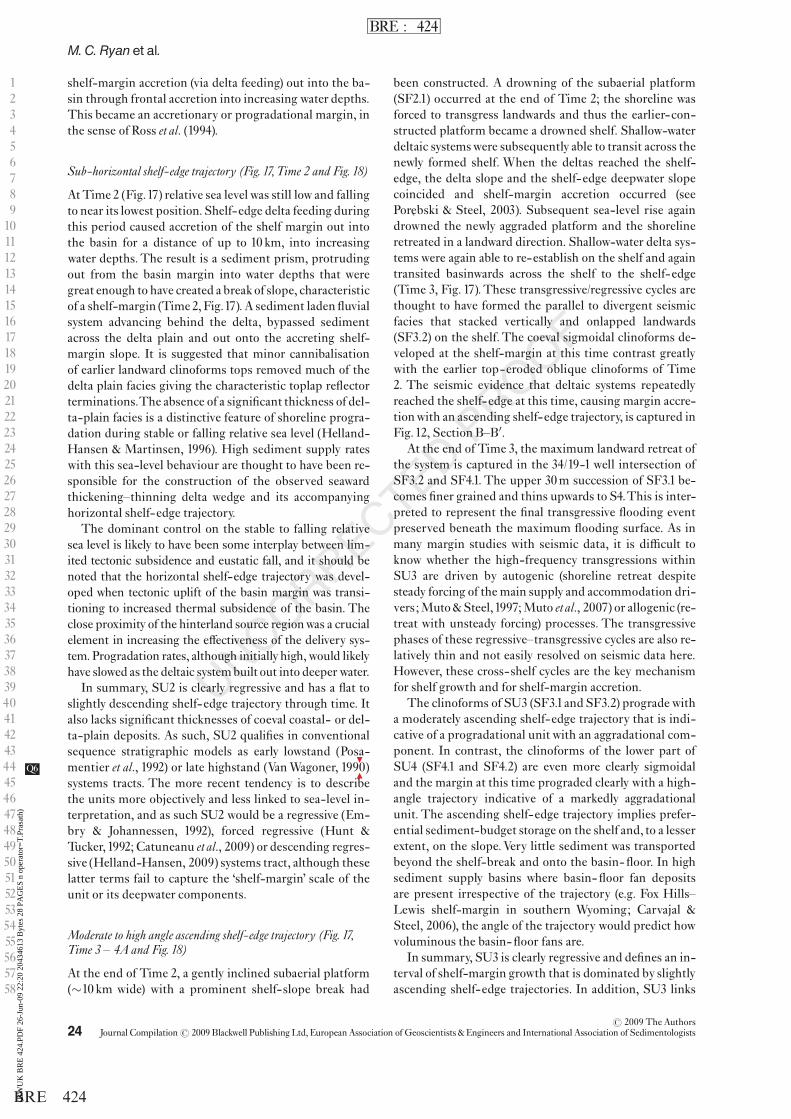
Fig.17. Cartoons illustrating the paleogeographic reconstruction Seismic Unit (SU) 2SU5within the 3D survey (Time 2 through toTime 5, see text for discussion).The foundation for SU2 was the inclined shelf, slope to basin- £oor pro¢le of the underlying SU1.Theonlapping deepwater deposits that characterise SU1had su⁄ciently lowered the gradient of the margin pro¢le to permit new shelf-margin accretion (via delta feeding) out into the basin through frontal accretion into increasing water depths.This became anaccretionary or progradational margin, in the sense of Ross et al. (1994).
r 2009 The AuthorsJournal Compilationr 2009 Blackwell Publishing Ltd, EuropeanAssociation of Geoscientists & Engineers and International Association of Sedimentologists22
M. C. Ryanet al.
BRE : 424
BRE 424(BW
UK
BR
E 4
24.P
DF
26-J
un-0
9 22
:20
2043
4613
Byt
es 2
8 PA
GE
S n
oper
ator
=T
.Pra
sath
)
8
7
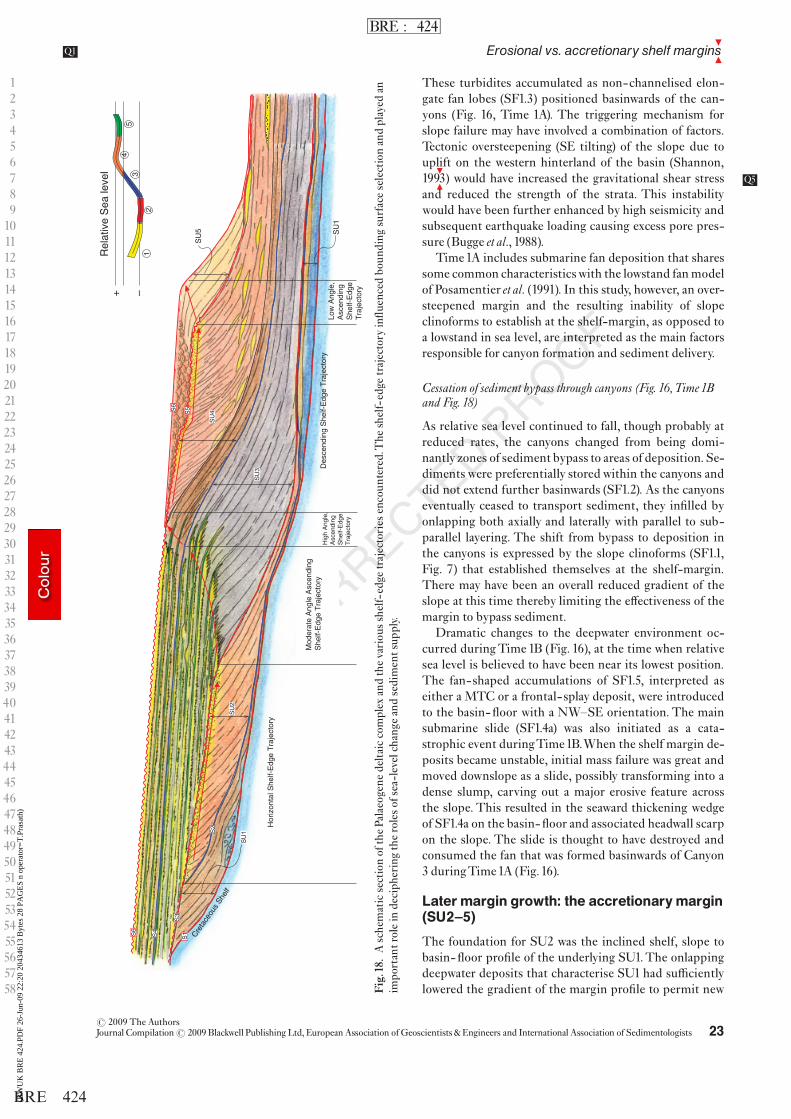
These turbidites accumulated as non-channelised elon-gate fan lobes (SF1.3) positioned basinwards of the can-yons (Fig. 16, Time 1A). The triggering mechanism forslope failure may have involved a combination of factors.Tectonic oversteepening (SE tilting) of the slope due touplift on the western hinterland of the basin (Shannon,1993 Q5) would have increased the gravitational shear stressand reduced the strength of the strata. This instabilitywould have been further enhanced by high seismicity andsubsequent earthquake loading causing excess pore pres-sure (Bugge et al., 1988).
Time1A includes submarine fan deposition that sharessome common characteristicswith the lowstand fanmodelof Posamentier et al. (1991). In this study, however, an over-steepened margin and the resulting inability of slopeclinoforms to establish at the shelf-margin, as opposed toa lowstand in sea level, are interpreted as the main factorsresponsible for canyon formation and sediment delivery.
Cessation of sediment bypass through canyons (Fig. 16,Time1Band Fig. 18)
As relative sea level continued to fall, though probably atreduced rates, the canyons changed from being domi-nantly zones of sediment bypass to areas of deposition. Se-diments were preferentially storedwithin the canyons anddid not extend further basinwards (SF1.2). As the canyonseventually ceased to transport sediment, they in¢lled byonlapping both axially and laterally with parallel to sub-parallel layering. The shift from bypass to deposition inthe canyons is expressed by the slope clinoforms (SF1.1,Fig. 7) that established themselves at the shelf-margin.There may have been an overall reduced gradient of theslope at this time thereby limiting the e¡ectiveness of themargin to bypass sediment.
Dramatic changes to the deepwater environment oc-curred duringTime 1B (Fig. 16), at the time when relativesea level is believed to have been near its lowest position.The fan-shaped accumulations of SF1.5, interpreted aseither a MTC or a frontal- splay deposit, were introducedto the basin- £oor with a NW^SE orientation. The mainsubmarine slide (SF1.4a) was also initiated as a cata-strophic event duringTime1B.When the shelf margin de-posits became unstable, initial mass failure was great andmoved downslope as a slide, possibly transforming into adense slump, carving out a major erosive feature acrossthe slope. This resulted in the seaward thickening wedgeof SF1.4a on the basin- £oor and associated headwall scarpon the slope. The slide is thought to have destroyed andconsumed the fan that was formed basinwards of Canyon3 duringTime1A (Fig.16).
Latermargin growth: the accretionarymargin(SU2^5)
The foundation for SU2 was the inclined shelf, slope tobasin- £oor pro¢le of the underlying SU1.The onlappingdeepwater deposits that characterise SU1 had su⁄cientlylowered the gradient of the margin pro¢le to permit new
12345678910111213141516171819202122232425262728293031323334353637383940414243444546474849505152535455565758
Rel
ativ
e S
ea le
vel
Fig.18.AschematicsectionofthePalaeogene
deltaiccomplex
andthevariou
sshelf-edge
trajectories
encoun
tered.The
shelf-edge
trajectory
in£u
encedboun
ding
surfaceselectionandplayed
anim
portantrolein
deciph
eringtherolesofsea-levelchang
eandsedimentsup
ply.
r 2009 The AuthorsJournal Compilationr 2009 Blackwell Publishing Ltd, European Association ofGeoscientists & Engineers and International Association of Sedimentologists 23
8
7Erosional vs. accretionary shelf marginsQ1
BRE : 424
BRE 424(BW
UK
BR
E 4
24.P
DF
26-J
un-0
9 22
:20
2043
4613
Byt
es 2
8 PA
GE
S n
oper
ator
=T
.Pra
sath
)
8
7
shelf-margin accretion (via delta feeding) out into the ba-sin through frontal accretion into increasing water depths.This became an accretionary or progradational margin, inthe sense of Ross et al. (1994).
Sub-horizontal shelf-edge trajectory (Fig. 17,Time 2 and Fig. 18)
AtTime 2 (Fig.17) relative sea levelwas still low and fallingto near its lowest position. Shelf-edge delta feeding duringthis period caused accretion of the shelf margin out intothe basin for a distance of up to 10 km, into increasingwater depths.The result is a sediment prism, protrudingout from the basin margin into water depths that weregreat enough to have created a break of slope, characteristicof a shelf-margin (Time 2,Fig.17).A sediment laden £uvialsystem advancing behind the delta, bypassed sedimentacross the delta plain and out onto the accreting shelf-margin slope. It is suggested that minor cannibalisationof earlier landward clinoforms tops removed much of thedelta plain facies giving the characteristic toplap re£ectorterminations.The absence of a signi¢cant thickness of del-ta-plain facies is a distinctive feature of shoreline progra-dation during stable or falling relative sea level (Helland-Hansen & Martinsen, 1996). High sediment supply rateswith this sea-level behaviour are thought to have been re-sponsible for the construction of the observed seawardthickening^thinning delta wedge and its accompanyinghorizontal shelf-edge trajectory.
The dominant control on the stable to falling relativesea level is likely to have been some interplay between lim-ited tectonic subsidence and eustatic fall, and it should benoted that the horizontal shelf-edge trajectory was devel-oped when tectonic uplift of the basin margin was transi-tioning to increased thermal subsidence of the basin. Theclose proximity of the hinterland source regionwas a crucialelement in increasing the e¡ectiveness of the delivery sys-tem. Progradation rates, although initiallyhigh,would likelyhave slowed as the deltaic systembuilt out into deeper water.
In summary, SU2 is clearly regressive and has a £at toslightly descending shelf-edge trajectory through time. Italso lacks signi¢cant thicknesses of coeval coastal- or del-ta-plain deposits. As such, SU2 quali¢es in conventionalsequence stratigraphic models as early lowstand (Posa-mentier et al., 1992) or late highstand (VanWagoner, 1990Q6 )systems tracts. The more recent tendency is to describethe units more objectively and less linked to sea-level in-terpretation, and as such SU2 would be a regressive (Em-bry & Johannessen, 1992), forced regressive (Hunt &Tucker,1992; Catuneanu etal., 2009) or descending regres-sive (Helland-Hansen, 2009) systems tract, although theselatter terms fail to capture the ‘shelf-margin’ scale of theunit or its deepwater components.
Moderate to high angle ascending shelf-edge trajectory (Fig. 17,Time 3 ^ 4A and Fig. 18)
At the end of Time 2, a gently inclined subaerial platform(�10 km wide) with a prominent shelf-slope break had
been constructed. A drowning of the subaerial platform(SF2.1) occurred at the end of Time 2; the shoreline wasforced to transgress landwards and thus the earlier-con-structed platform became a drowned shelf. Shallow-waterdeltaic systemswere subsequently able to transit across thenewly formed shelf. When the deltas reached the shelf-edge, the delta slope and the shelf-edge deepwater slopecoincided and shelf-margin accretion occurred (seePorebski & Steel, 2003). Subsequent sea-level rise againdrowned the newly aggraded platform and the shorelineretreated in a landward direction. Shallow-water delta sys-tems were again able to re-establish on the shelf and againtransited basinwards across the shelf to the shelf-edge(Time 3, Fig. 17).These transgressive/regressive cycles arethought to have formed the parallel to divergent seismicfacies that stacked vertically and onlapped landwards(SF3.2) on the shelf.The coeval sigmoidal clinoforms de-veloped at the shelf-margin at this time contrast greatlywith the earlier top-eroded oblique clinoforms of Time2. The seismic evidence that deltaic systems repeatedlyreached the shelf-edge at this time, causing margin accre-tionwith an ascending shelf-edge trajectory, is captured inFig.12, Section B^B0.
At the end of Time 3, the maximum landward retreat ofthe system is captured in the 34/19-1 well intersection ofSF3.2 and SF4.1. The upper 30m succession of SF3.1 be-comes ¢ner grained and thins upwards to S4.This is inter-preted to represent the ¢nal transgressive £ooding eventpreserved beneath the maximum £ooding surface. As inmany margin studies with seismic data, it is di⁄cult toknow whether the high-frequency transgressions withinSU3 are driven by autogenic (shoreline retreat despitesteady forcing of the main supply and accommodation dri-vers;Muto&Steel,1997;Muto etal., 2007) or allogenic (re-treat with unsteady forcing) processes. The transgressivephases of these regressive^transgressive cycles are also re-latively thin and not easily resolved on seismic data here.However, these cross-shelf cycles are the key mechanismfor shelf growth and for shelf-margin accretion.
The clinoforms of SU3 (SF3.1and SF3.2) prograde witha moderately ascending shelf-edge trajectory that is indi-cative of a progradational unit with an aggradational com-ponent. In contrast, the clinoforms of the lower part ofSU4 (SF4.1 and SF4.2) are even more clearly sigmoidaland the margin at this time prograded clearly with a high-angle trajectory indicative of a markedly aggradationalunit. The ascending shelf-edge trajectory implies prefer-ential sediment-budget storage on the shelf and, to a lesserextent, on the slope.Very little sediment was transportedbeyond the shelf-break and onto the basin- £oor. In highsediment supply basins where basin- £oor fan depositsare present irrespective of the trajectory (e.g. Fox Hills^Lewis shelf-margin in southern Wyoming; Carvajal &Steel, 2006), the angle of the trajectory would predict howvoluminous the basin- £oor fans are.
In summary, SU3 is clearly regressive and de¢nes an in-terval of shelf-margin growth that is dominated by slightlyascending shelf-edge trajectories. In addition, SU3 links
12345678910111213141516171819202122232425262728293031323334353637383940414243444546474849505152535455565758
r 2009 The AuthorsJournal Compilationr 2009 Blackwell Publishing Ltd, EuropeanAssociation of Geoscientists & Engineers and International Association of Sedimentologists24
M. C. Ryanet al.
BRE : 424
BRE 424(BW
UK
BR
E 4
24.P
DF
26-J
un-0
9 22
:20
2043
4613
Byt
es 2
8 PA
GE
S n
oper
ator
=T
.Pra
sath
)
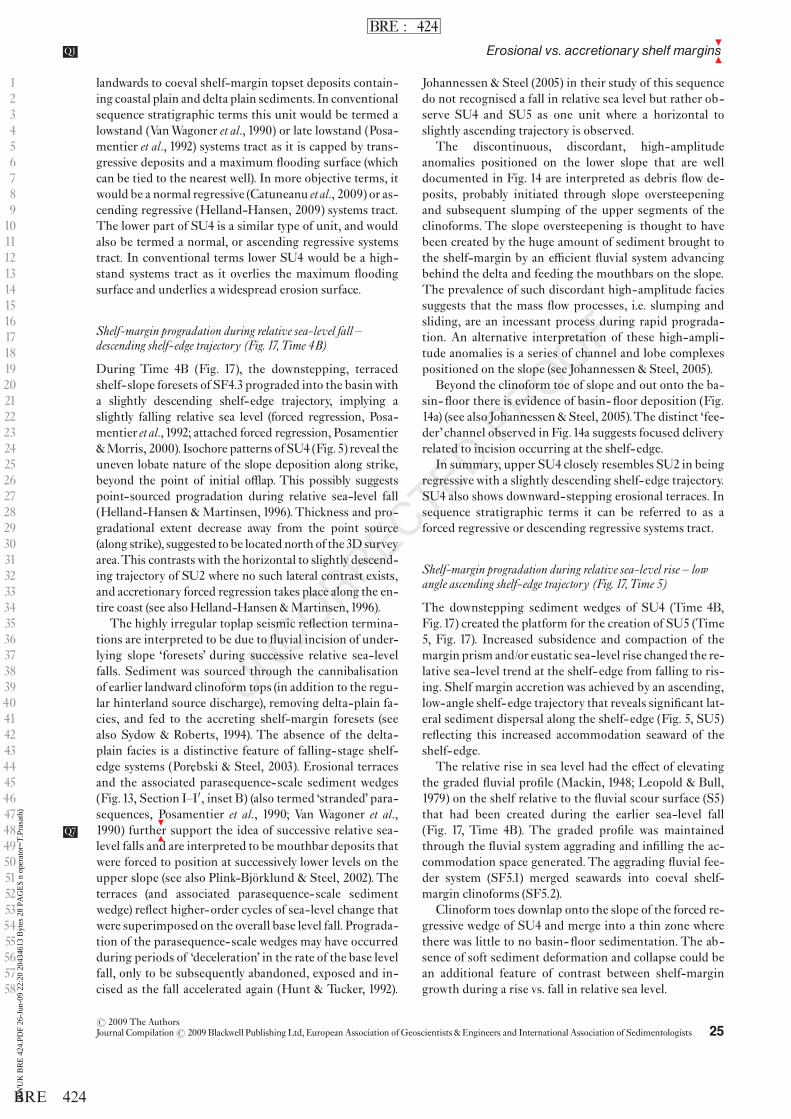
8
7
landwards to coeval shelf-margin topset deposits contain-ing coastal plain anddelta plain sediments. In conventionalsequence stratigraphic terms this unit would be termed alowstand (VanWagoner et al., 1990) or late lowstand (Posa-mentier et al., 1992) systems tract as it is capped by trans-gressive deposits and a maximum £ooding surface (whichcan be tied to the nearest well). In more objective terms, itwould be a normal regressive (Catuneanu etal., 2009) or as-cending regressive (Helland-Hansen, 2009) systems tract.The lower part of SU4 is a similar type of unit, and wouldalso be termed a normal, or ascending regressive systemstract. In conventional terms lower SU4 would be a high-stand systems tract as it overlies the maximum £oodingsurface and underlies a widespread erosion surface.
Shelf-margin progradation during relative sea-level fall ^descending shelf-edge trajectory (Fig. 17,Time 4B)
During Time 4B (Fig. 17), the downstepping, terracedshelf- slope foresets of SF4.3 prograded into the basinwitha slightly descending shelf-edge trajectory, implying aslightly falling relative sea level (forced regression, Posa-mentier etal., 1992; attached forced regression, Posamentier&Morris, 2000). Isochore patterns ofSU4 (Fig.5) reveal theuneven lobate nature of the slope deposition along strike,beyond the point of initial o¥ap. This possibly suggestspoint-sourced progradation during relative sea-level fall(Helland-Hansen &Martinsen, 1996).Thickness and pro-gradational extent decrease away from the point source(along strike), suggested to be located north of the3D surveyarea.This contrasts with the horizontal to slightly descend-ing trajectory of SU2 where no such lateral contrast exists,and accretionary forced regression takes place along the en-tire coast (see also Helland-Hansen &Martinsen,1996).
The highly irregular toplap seismic re£ection termina-tions are interpreted to be due to £uvial incision of under-lying slope ‘foresets’ during successive relative sea-levelfalls. Sediment was sourced through the cannibalisationof earlier landward clinoform tops (in addition to the regu-lar hinterland source discharge), removing delta-plain fa-cies, and fed to the accreting shelf-margin foresets (seealso Sydow & Roberts, 1994). The absence of the delta-plain facies is a distinctive feature of falling-stage shelf-edge systems (Porebski & Steel, 2003). Erosional terracesand the associated parasequence-scale sediment wedges(Fig.13, Section I^I0, inset B) (also termed ‘stranded’ para-sequences, Posamentier et al., 1990; Van Wagoner et al.,1990) furtherQ7 support the idea of successive relative sea-level falls and are interpreted to be mouthbar deposits thatwere forced to position at successively lower levels on theupper slope (see also Plink-Bj˛rklund & Steel, 2002).Theterraces (and associated parasequence-scale sedimentwedge) re£ect higher-order cycles of sea-level change thatwere superimposed on the overall base level fall. Prograda-tion of the parasequence-scale wedges may have occurredduring periods of ‘deceleration’ in the rate of the base levelfall, only to be subsequently abandoned, exposed and in-cised as the fall accelerated again (Hunt & Tucker, 1992).
Johannessen & Steel (2005) in their study of this sequencedo not recognised a fall in relative sea level but rather ob-serve SU4 and SU5 as one unit where a horizontal toslightly ascending trajectory is observed.
The discontinuous, discordant, high-amplitudeanomalies positioned on the lower slope that are welldocumented in Fig. 14 are interpreted as debris £ow de-posits, probably initiated through slope oversteepeningand subsequent slumping of the upper segments of theclinoforms. The slope oversteepening is thought to havebeen created by the huge amount of sediment brought tothe shelf-margin by an e⁄cient £uvial system advancingbehind the delta and feeding the mouthbars on the slope.The prevalence of such discordant high-amplitude faciessuggests that the mass £ow processes, i.e. slumping andsliding, are an incessant process during rapid prograda-tion. An alternative interpretation of these high-ampli-tude anomalies is a series of channel and lobe complexespositioned on the slope (see Johannessen & Steel, 2005).
Beyond the clinoform toe of slope and out onto the ba-sin- £oor there is evidence of basin- £oor deposition (Fig.14a) (see also Johannessen & Steel, 2005).The distinct ‘fee-der’channel observed in Fig.14a suggests focused deliveryrelated to incision occurring at the shelf-edge.
In summary, upper SU4 closely resembles SU2 in beingregressive with a slightly descending shelf-edge trajectory.SU4 also shows downward-stepping erosional terraces. Insequence stratigraphic terms it can be referred to as aforced regressive or descending regressive systems tract.
Shelf-margin progradation during relative sea-level rise ^ lowangle ascending shelf-edge trajectory (Fig. 17,Time 5)
The downstepping sediment wedges of SU4 (Time 4B,Fig.17) created the platform for the creation of SU5 (Time5, Fig. 17). Increased subsidence and compaction of themargin prism and/or eustatic sea-level rise changed the re-lative sea-level trend at the shelf-edge from falling to ris-ing. Shelf margin accretion was achieved by an ascending,low-angle shelf-edge trajectory that reveals signi¢cant lat-eral sediment dispersal along the shelf-edge (Fig. 5, SU5)re£ecting this increased accommodation seaward of theshelf-edge.
The relative rise in sea level had the e¡ect of elevatingthe graded £uvial pro¢le (Mackin, 1948; Leopold & Bull,1979) on the shelf relative to the £uvial scour surface (S5)that had been created during the earlier sea-level fall(Fig. 17, Time 4B). The graded pro¢le was maintainedthrough the £uvial system aggrading and in¢lling the ac-commodation space generated.The aggrading £uvial fee-der system (SF5.1) merged seawards into coeval shelf-margin clinoforms (SF5.2).
Clinoform toes downlap onto the slope of the forced re-gressive wedge of SU4 and merge into a thin zone wherethere was little to no basin- £oor sedimentation.The ab-sence of soft sediment deformation and collapse could bean additional feature of contrast between shelf-margingrowth during a rise vs. fall in relative sea level.
12345678910111213141516171819202122232425262728293031323334353637383940414243444546474849505152535455565758
r 2009 The AuthorsJournal Compilationr 2009 Blackwell Publishing Ltd, European Association ofGeoscientists & Engineers and International Association of Sedimentologists 25
8
7Erosional vs. accretionary shelf marginsQ1
BRE : 424
BRE 424(BW
UK
BR
E 4
24.P
DF
26-J
un-0
9 22
:20
2043
4613
Byt
es 2
8 PA
GE
S n
oper
ator
=T
.Pra
sath
)
In summary,SU5 is clearly normal regressive or ascend-ing regressive, somewhat like SU3. In conventional termsit would be lowstand or late lowstand systems tract.
CONCLUSIONS
The basin- ¢ll stratal architecture of the Porcupine BasinPalaeogene succession reveals two end-member basinphysiographic styles: (1) an erosional margin style and (2)an accretionary or progradational margin style, in thesense of Ross et al. (1994).
Erosionalmargin deposition (SU1)
The deposition of the Palaeogene succession initially oc-curred on an oversteepened shelf- slope to basin pro¢le(Fig.16,Time1A).Uplift of thewestern margin of the basinwas the major cause of the initially oversteepened shelf-slope erosional pro¢le and is suggested to have triggeredsediment bypass, canyon formation, and the developmentof signi¢cant submarine fan deposits (SF1.3) on the basin-£oor (Fig. 16, Time 1A). As relative sea level continued tofall, slope clinoforms better established themselves at theshelf-margin, reducing the gradient of the slope and e¡ec-tiveness of bypassing sediment. Canyons changed frombegin zones of sediment bypass to areas of deposition. Se-diments were preferentially storedwithin the canyons anddid not extend further basinwards thereby smoothing theincised topography.The erosional marginwas transformedinto a progradational margin when the gradient of theshelf- slope-basin £oor pro¢le was su⁄ciently lowered,through the in¢lling of the topographic lows by the onlap-ping submarine fan deposits. In this way, nearshore sys-tems were permitted to prograde across the deepwatersystems. At this transition between erosional margin andprogradational margin, the slope appears to have beensubjected to mass failure (Fig. 16, Time 1B). Slope failureis revealed by several MTCs (i.e. SF1.4 and SF1.5) thatcarved out major erosive features across the slope. Theuse of 3D seismic analysis techniques accurately de¢nethe size, thickness, geometry and depositional trend ofthe MTCs and provides clues to the transport mechan-isms. A seaward thickening wedge of chaotic seismic fa-cies, con¢nement to a deeply incised U-shaped valley,erosional basal scours and syn-depositional thrusting atterminus (i.e. SF1.4) are indicative of a slump and slidedominated MTC. In comparison, a thin, sheet-like geo-metry of high-amplitude discontinuous seismic facieswith an uncon¢ned lobate terminus (i.e. SF1.5) is inter-preted to represent a debris £ow-dominatedMTC.
Progradationalmargin deposition (SU2^5)
The transition from the erosional margin to the domi-nantly progradational margin in the Porcupine basin (se-diment over- ¢ll terminology of Hadler-Jacobsen et al.,2005) is suggested to be controlled by: (1)Agradual dimin-ishing of tectonic uplift along the basin margin to an
increasingly passive, thermal subsidence tectonic regime,(2) the in¢lling and healing of the topographic lows by theonlapping submarine fan and canyon- ¢ll deposits and (3)a relative sea-level rise coupledwith continued signi¢cantsediment supply. The progradational margin is charac-terised by a thick sediment prism that is composed of acomposite stack of clinoforms both at the delta (tens ofmetres) and shelf-margin scale (hundreds of metres).
Individual shelf-margin clinoforms, the focus of thisstudy, are by nature the individual building blocks for re-gressive to transgressive cycles (duration 10^100 kyr) thatallow time lines to be visualised within the rock succes-sion. The stacking pattern of the individual regressive totransgressive clinoform building blocks can also be ob-served on a larger scale through the migration and trajec-tory patterns of the shelf-edge. Trajectory paths in aprogradational margin are accretionary in an ascendingor descending manner.The descending shelf-edge trajec-tory occurswhen the relative sea level is falling at the shelf-edge (Fig. 17, Time 4B) and, in the case of su⁄cient sedi-ment supply, the shelf-edge will translate obliquely down-ward and seaward during the relative sea-level fall. In dipsection, the descending shelf-edge trajectory appears as aclinoform wedge that thickens towards the shelf-edge (upto 600m) before thinning seaward of the ¢nal shelf-marginposition and out onto the basin- £oor. The descendingshelf-edge trajectory scenario in plan view is lobate alongstrike suggestive of progradation from a point source (Fig.17,Time 4B).Key facies associations of the descending tra-jectory are steeply inclined shelf-edge delta clinoforms,a turbidite prone heterolithic slope facies fed via mouth-bars on the upper slope and slope controlled slumping in-terbeddedwithin the middle to lower toesets indicative ofrapid progradation.
The ascending shelf-edge trajectory is characterised bya shelf- slope break that migrates seawardwith a steady riseof relative sea level. The ascending geometry reveals sig-ni¢cant lateral sediment dispersal along the shelf-edge re-£ecting distributary systems that were characteristicallyless ‘¢xed’. Four variations of the ascending shelf-edge tra-jectory are recognised in this study, corresponding to theangle atwhich the shelf- slope break migrates: (1) horizon-tal (Fig.17,Time 2), (2) low (Time 5), (3) moderate (Time 3)and (4) high angle (Time 4A), ascending shelf-edge trajec-tories. Horizontal to high angle ascending shelf-edge tra-jectory corresponds to a change from dominantlyprogradational to dominantly aggradational shelf-edgetrajectory through time. In this study, the ascending pat-tern typically lacks associated basin- £oor deposits. How-ever, lowering the angle of the trajectory towardshorizontal and below increases the probability of signi¢ -cant basin- £oor deposition.
The sequence stratigraphy of the Palaeogene shelf-mar-gin complex reveals a long-term relative sea-level rise(Fig. 18).The dominant control on the long-term relativesea level rise is most likely the combined e¡ect of highthermal subsidence and an overall relatively high Eoceneeustatic sea level. Sediment was likely sourced from the
12345678910111213141516171819202122232425262728293031323334353637383940414243444546474849505152535455565758
r 2009 The AuthorsJournal Compilationr 2009 Blackwell Publishing Ltd, EuropeanAssociation of Geoscientists & Engineers and International Association of Sedimentologists26
M. C. Ryanet al.
BRE : 424
BRE 424(BW
UK
BR
E 4
24.P
DF
26-J
un-0
9 22
:20
2043
4613
Byt
es 2
8 PA
GE
S n
oper
ator
=T
.Pra
sath
)
8
7
8
7
8
7
8
7
uplifted Calondonian metamorphics of the PorcupineRidge.The extremely narrow shelf and close proximity ofthe hinterland region was crucial in increasing the e¡ec-tiveness of the delivery system that created the thick Pa-laeogene margin succession.
ACKNOWLEDGEMENTS
This research is the product of a Cand. Scient thesis at theUniversity of Bergen.
We thank Statoil ASA for their support in sponsoringthis project and permission to publish. PGS is also ac-knowledged for permission to publish sections from thePGS proprietary 3D data set MC3D Q34-98.The manu-script has bene¢ted from constructive reviews by DavidHodgson and Rodmar Ravn�s.
REFERENCES
Brami,T.R.,Pirmez,C.,Archie,C.,Heeralal,S.&Holman,K.L. (2000) Late Pleistocene deep-water stratigraphy and de-positional processes, o¡shoreTrinidad and TobagoQ8 . In: Deep-Water Reservoirs of the World (Ed. by P. Weimer, R.M. Slatt, J.Coleman, N.C. Rosen, H. Nelson, A.H. Bouma,M.J. Styzen &D.T. Lawrence),GCS-SEPMSpec. Publ., 104^115.
Bugge,T., Belderson,R.H. &Kenyon,N.H. (1988) The stor-egga slide. Philos.Trans. R. Soc. Lond., 325, 357^388.
Bullimore,S.,Henriksen,S.,Liest�l,F.&Helland-Han-
sen,W. (2005) Clinoform stacking patterns, shelf-edge trajec-tories and facies associations in the Tertiary coastal deltas,o¡shore Norway: implications for the prediction of lithologyin prograding systems.Norw. J. Geol., 85, 169^187.
Carvajal,C.R.&Steel,R.J. (2006) Thick turbidite successionsfrom supply-dominated shelves durig sea-level highstand.Geology, 34, 665^668.
Catuneanu, O., Abreu,V., Bhattacharya, J.P., Blum, M.D.,Dalrymple,R.W.,Eriksson,P.G.,Fielding,C.R.,Fisher,W.L., Galloway,W.E., Gibling, M.R., Giles, K.A., Hol-
brook, J.M., Jordan, R., Kendall, C.G.St.C., Macurda,B.,Martinsen, O.J.,Miall, A.D., Neal, J.E., Nummedal,D., Pomar, L., Posamentier,H.W., Pratt, B.R., Sarg, J.F.,Shanley, K.W., Steel, R.J., Strasser, A.,Tucker, M.E. &Winker, C. (2009) Toward the standardization of sequencestratigraphy. Earth Sci. Rev., 92, 1^33.
Embry,A.& Johannessen,E.P. (1992) T^R sequence stratigra-phy, facies analysis and reservoir distribution in the uppermostTriassic^Lower Jurassic succession,Western Sverdrup Basin,Arctic Canada. In:Arctic Geology and Petroleum Potential (Ed. byT.O. Vorren, E. Bergsager, O.A. Dahl-Stamnes, E. Holter, B.Johansen, E. Lie & T.B. Lund), Norw. Petrol. Soc. Spec. Publ.,2, 121^146.
Farre, J.A.,McGregor,B.A.,Ryan,W.B.F.&Robb, J.M. (1983)Breaching the shelf break; passage from youthful to maturephase in submarine canyon evolution. In:The Shelf Break; Cri-tical Interface on Continental Margins (Ed. by D.J. Stanley & G.T.Moore), SEPMSpec. Publ., 33, 25^39.
Hadler-Jacobsen,F., Johannessen,E.P.,Ashton,N.,Hen-
riksen, S., Johnson, S.D. & Kristensen, J.B. (2005) Sub-marine fan morphology and lithology distribution, a
predictable function of sediment delivery, gross shelf to basinrelief, slope gradient and basin topography Q9. In: PetroleumGeol-ogy: North-West Europe and Global Perspectives. Proceedings of the6th PetroleumGeology Conference (Ed. by A.G. Dore¤ & B.Vining),Geol. Soc., Lond., 1121^1145.
Helland-Hansen,W. (2009)Towards the stardardization of se-quence stratigraphy ^ discussion. Earth Sci. Rev., 94, 95^97.
Helland-Hansen,W. & Hampson,G.J. (this volume) Trajec-tory analysis ^ concepts and applications Q10.Basin Res.
Helland-Hansen,W.&Martinsen,O.J. (1996)Shoreline tra-jectories and sequences; description of variable depositional-dip scenarios. J. Sediment. Res., 66, 670^688.
Hunt, D. & Tucker, M.E. (1992) Stranded parasequences andthe forced regressive wedge systems tract: deposition duringbase-level fall. Sediment. Geol., 81, 1^9.
Jervey, M.T. (1988) Quantitative geological modeling of silici-clastic rock sequences and their seismic expression. In: Sea-Level Changes: An Integrated Approach (Ed. by C.K.Wilgus, B.S.Hastings, C.G.St.C. Kendall, H.W. Posamentier, C.A. Ross &J.C.VanWagoner), SEPMSpec. Publ., 42, 47^69.
Johannessen, E.P. & Steel, R.J. (2005) Clinoforms and theirexploration signi¢cance for deepwater sands. Basin Res., 17,521^550.
Johnston, S.,Dore¤ ,A.G.& Spencer,A.M. (2001) TheMeso-zoic evolution of the southernNorthAtlantic region and its re-lationship to basin development in theSouthPorcupineBasin,o¡shore Ireland. In:ThePetroleumExploration of Ireland’s O¡shoreBasins (Ed. byP.M. Shannon, P.D.W.Haughton&D.Corcoran),Geol. Soc. Lond. Spec. Publ., 188, 345^360.
Kindinger, J.L. (1988) Seismic stratigraphy of theMississippi^Alabama shelf and upper continental slope. Mar. Geol., 83,79^94.
Lehner, P. (1969) Salt tectonics and Pleistocene stratigraphy onthe continental slope of northern Gulf of Mexico. Am. Assoc.Petrol. Geol. Bull., 53, 2431^2479.
Leopold, L.B. & Bull,W.B. (1979) Base level, aggradation andgrade. Proc. Am. Philos. Soc., 123, 168^202.
Mackin, J.H. (1948) Concept of the graded river. Geol. Soc. Am.Bull., 59, 463^512.
McCann,T., Shannon, P.M.&Moore, J.G. (1995) Fault stylesin the Porcupine Basin, o¡shore Ireland; tectonic and sedi-mentary controls. In:The Petroleum Exploration of Ireland’s O¡-shore Basins (Ed. by P.F. Croker & P.M. Shannon), Geol. Soc.Lond. Spec. Publ., 93, 371^383.
Mellere, D., Breda, A. & Steel, R. (2003) Fluvially incisedshelf-edge deltas and linkage to upper slope channels (CentralTertiary Basin, Spitsbergen Q11). In: Shelf Margin Deltas and LinkedDown Slope PetroleumSystems, 23rdAnnual Bob F. Perkins ResearchConference (Houston) (Ed. by H.H. Roberts, N.C. Rosen, R.H.Fillon & J.B. Anderson),GCS-SEPMSpec. Publ., 231^266.
Mitchum, R.M. Jr.,Vail, P.R. & Sangree, J.B. (1977) Seismicstratigraphy and global changes of sea level; Part 6, Strati-graphic interpretation of seismic re£ection patterns in deposi-tional sequences. In: Seismic Stratigraphy; Applications toHydrocarbon Exploration (Ed. by C.E. Payton), Am. Assoc. Petrol.Geol.Mem., 26, 117^134.
Molnia, B.F., Carlson, P.R. & Bruns,T.R. (1977) Large sub-marine slide in Kayak Trough, Gulf of Alaska. Eng. Geol., 3,137^148.
Moore, J.G., Clague, D.A., Holcomb, R.T., Lipman, P.W.,Normark,W.R. & Torresan, M.E. (1989) Prodigious sub-marine slides on the Hawaiian Ridge. J. Geophys. Res., 94, 465^484.
12345678910111213141516171819202122232425262728293031323334353637383940414243444546474849505152535455565758
r 2009 The AuthorsJournal Compilationr 2009 Blackwell Publishing Ltd, European Association ofGeoscientists & Engineers and International Association of Sedimentologists 27
8
7Erosional vs. accretionary shelf marginsQ1
BRE : 424
BRE 424(BW
UK
BR
E 4
24.P
DF
26-J
un-0
9 22
:20
2043
4613
Byt
es 2
8 PA
GE
S n
oper
ator
=T
.Pra
sath
)
8
7
8
7
8
7
8
7
Morton, R.A. & Price,W.A. (1987) Late Quaternary sea-level£uctuations and sedimentary phases of the Texas coastalplain and shelf: late Quaternary sea-level £uctuations and de-positional sequences, Southwest Louisiana continental shelf.In: Sea-Level Fluctuation and Coastal Evolution (Ed. by D. Num-medal, O.H. Pilkey & J.D. Howard), SEPM Spec. Publ., 41,181^198.
Moscardelli, L. &Wood, L. (2008) New classi¢cation systemfor mass transport complexes in o¡shoreTrinidad. Basin Res.,20, 73^98.
Muto,T.&Steel,R.J. (1997) Principles of regression and trans-gression: the nature of the interplay between accommodationand sediment supply. J. Sediment. Res., 67, 994^1000.
Muto,T.,Steel,R.J.& Swenson, J.B. (2007) Autostratigraphy:a framework norm for genetic stratigraphy. J. Sediment. Res., 77,2^12.
Mutti,E. (1985)Turbidite systems and their relations to deposi-tional sequences. In: Provenance of Arenites (Ed. by G.G. Zu¡a),NATO-ASISer. C:Math. Phys. Sci., 148, 65^93.
Naylor, D., Shannon, P. & Murphy, N. (1999) Irish RockallBasin Region ^ a standard structural nomenclature system.PetroleumA¡airs Division Spec. Publ., 1/99.
Plink-Bj˛rklund, P. & Steel, R. (2002) Sea-level fall belowthe shelf edge, without basin- £oor fans.Geology, 30, 115^118.
Porebski, S.J. & Steel, R.J. (2003) Shelf-margin deltas: theirstratigraphic signi¢cance and relation to deepwater sands.Earth Sci. Rev., 62, 283^326.
Posamentier, H.W., Allen, G.P, James, D.P. & Tesson, M.
(1992) Forced regressions in a sequence stratigraphic frame-work: concepts, examples, and exploration signi¢cance. Am.Assoc. Petrol. Geol. Bull., 76, 1687^1709.
Posamentier,H.W., Erskin,R.D. &Mitchum,R.M. Jr. (1991)Models for submarine fan deposition within a sequence-stra-tigraphic frameworkQ12 . In: Seismic Facies and Sedimentary Processesof Submarine Fans and Turbidite Systems (Ed. by P. Weimer &M.H. Link), 127^136.
Posamentier,H.W.&Kolla,V. (2003) Seismic geomorphologyand stratigraphy of depositional elements in deep-water set-tings. J. Sediment. Res., 73, 367^388.
Posamentier,H.W.&Morris,W.R. (2000) Aspects of the stra-tal architecture of forced regressive deposits. In: SedimentaryResponses to Forced Regressions (Ed. by D. Hunt & R.L.Gawthorpe),Geol. Soc. Lond., 172, 19^46.
Posamentier, H.W. & Vail, P.R. (1988) Eustatic controls onclastic deposition II: sequence and system tract models. In:Sea-Level Changes; an Integrated Approach (Ed. by C.K.Wilgus,B.S. Hastings, C.G.St.C. Kendall, H.W. Posamentier, C.A.Ross & J.C.VanWagoner), SEPMSpec. Publ., 42, 125^154.
Pratson, L.F., Nittrouer, C.A., Wiberg, P.L., Steckler,M.S., Swenson, J.B., Cacchione, D.A., Karson, J.A.,Murray, A.B., Wolinsky, M.A., Gerber, T.P., Mullen-
bach, B.L., Spinelli, G.A., Fulthorpe, C.S., O’Grady,D.B., Parker, G., Driscoll, N.W., Burger, R.L., Paola,C.,Orange,D.L.,Field,M.E.,Friedrichs,C.T.&Fedele,J.J. (2007) Seascape evolution on clastic continental shelvesand slopes. In: Continental Margin Sedimentation: From SedimentTransport to Sequence Stratigraphy (Ed. by C.A. Nittrouer, J.A.Austin,M.E.Field, J.H.Kravitz, J.P.M.Syvitski &P.L.Wiberg),IASSpec. Publ., 37, 339^380.
Prior,D.B.,Bornhold,B.D.,Coleman, J.M.&Bryant,W.R.
(1982)Morphology of a submarine slide, Kitimat Arm, BritishColumbia.Geology, 10, 588^592.
Ross,W.C.,Halliwell,B.A.,May, J.A.,Watts,D.E.&Syvits-
ki, J.P.M. (1994) Slope readjustment: a new model for the de-velopment of submarine fans and aprons.Geology, 22, 511^514.
Sangree, J.B.,Waylett, D.C., Frazier, D.E., Amery, G.B. &Fennessy,W.J. (1978) Recognition of continental slope seis-mic facies, o¡shore Texas, Louisiana. In: Framework, Facies,and Oil Trapping Characteristics of the Upper Continental Margins(Ed. by A.H. Bouma, G.T. Moore & J.M. Coleman), Am. Assoc.Petrol. Geol., Geol. Stud., 7, 87^116.
Sangree, J.B. &Widmier, J.M. (1977) Seismic stratigraphy andglobal changes of sea level; Part 9, Seismic interpretation ofclastic depositional facies. In: Seismic Stratigraphy; ApplicationstoHydrocarbonExploration (Ed. byC.E.Payton),Am.Assoc. Petrol.Geol.Mem., 26, 165^184.
Shannon, P.M. (1991) The development of Irish o¡shore sedi-mentary basins. J. Geol. Soc. Lond., 148, 181^189.
Shannon, P.M.,Moore, J.G., Jacob, I.H. &Makris, J. (1993)Cretaceous and Tertiary basin development west of Ireland Q13.In: Petroleum Geology of Northwest Europe. Proceeding of the 4thConference on Petroleum Geology (Ed. by J.R. Parker), Geol. Soc.London, 1057^1066.
Steel, R., Crabaugh, J., Schellpeper, M., Mellere, D.,Plink-Bj˛rklund, P., Deibert, J. & Loeseth, T. (2000)Deltas versus rivers on a shelf edge Q14: their relative contributionsto the growth of shelf-margins and basin- £oor fans (Barre-mian and Eocene, Spitsbergen). In:Deep-Water Reservoirs of theWorld, 20th Annual Bob F. Perkins Research Conference (Houston)(Ed. by P.Weimer, R.M. Slatt, J. Coleman,N.C. Rosen,H.Nel-son, A.H. Bouma, M.J. Styzen & D.T. Lawrence), GCS-SEPMSpec. Publ., 981^1009.
Steel, R.J. & Olsen, T. (2002) Clinoforms, clinoform trajec-tories and deepwater sands Q15. In: Sequence StratigraphicModels forExploration and Production: EvolvingMethodology, EmergingMod-els and Application Histories, 22rd Annual Bob F. Perkins ResearchConference (Houston) (Ed. by J.M. Armentrout & N.C. Rosen),GCS-SEPMSpec. Publ, 367^381.
Suter, J.R.& Berryhill,H.L. Jr. (1985) Late Quaternary shelf-margin deltas, northwestGulf ofMexico.AmAssoc. Petrol.Geol.Bull., 69, 77^91.
Suter, J.R., Berryhill, H.L. Jr. & Penland, S. (1987) LateQuaternary sea level £uctuations and depositional sequences,southwest Louisiana continental shelf. In: Sea Level Changeand Coastal Evolution (Ed. by D. Nummedal, O.H. Pilkey Jr. & J.Howard), SEPMSpec. Publ., 41, 199^219.
Sydow, J. & Roberts,H.H. (1994) Stratigraphic framework of aLate Pleistocene shelf-edge delta, northeast Gulf of Mexico.Am. Assoc. Petrol. Geol. Bull., 78, 1273^1312.
Tate, M.P. (1993) Structural framework and tectono-strati-graphic evolution of the Porcupine Seabight Basin, o¡shorewestern Ireland.Mar. Petrol. Geol., 10, 95^120.
Vail, P.R.,Hardenbol, J.&Todd,R.G. (1984) Jurassic uncon-formities, chronostratigraphy, and sea-level changes fromseismic stratigraphy and biostratigraphy. In: Interregional Un-conformities and Hydrocarbon Accumulation (Ed. by J.S. Schlee),Am. Assoc. Petrol. Geol.Mem, 36, 129^144.
VanWagoner, J.C.,Mitchum,R.M.,Campion,K.M.&Rah-
manian,V.D. (1990) Siliciclastic sequence stratigraphy inwelllogs, cores, and outcrops.Am. Assoc. Petrol. Geologists Methods inExploration Series, 7, 55.
Manuscript received 7 June 2008; Manuscript accepted 22 May2009
12345678910111213141516171819202122232425262728293031323334353637383940414243444546474849505152535455565758
r 2009 The AuthorsJournal Compilationr 2009 Blackwell Publishing Ltd, EuropeanAssociation of Geoscientists & Engineers and International Association of Sedimentologists28
M. C. Ryanet al.
BRE : 424
BRE 424(BW
UK
BR
E 4
24.P
DF
26-J
un-0
9 22
:20
2043
4613
Byt
es 2
8 PA
GE
S n
oper
ator
=T
.Pra
sath
)

Author Query Form
_______________________________________________________
_______________________________________________________
Dear Author,
During the copy-editing of your paper, the following queries arose. Please respond to these by marking up your proofs with the necessary changes/additions. Please write your answers clearly on the query sheet if there is insufficient space on the page proofs. If returning the proof by fax do not write too close to the paper's edge. Please remember that illegible mark-ups may delay publication.
Journal BREArticle 424
Query No. Description Author Response
Q1
AUTHOR: A running head short title was not supplied; please check if this one is suitable and, if not, please supply a short title that can be used instead.
Q2
AUTHOR: Posamentier et al., 1988 has been changed to Posamentier & Vail, 1988 so that this citation matches the Reference List. Please confirm that this is correct.
Q3
AUTHOR: Prior et al., 1982a has been changed Prior et al., 1982 so that this citation matches the Reference List. Please confirm that this is correct.
Q4 AUTHOR: Bugge et al. (1998) has not been included in the Reference List, please supply full publication details.
Q5 AUTHOR: Shannon, (1993) has not been included in the Reference List, please supply full publication details.
Q6 AUTHOR: Van Wagoner, (1990) has not been included in the Reference List, please supply full publication details.
Q7
AUTHOR: Posamentier et al., 1990 has not been included in the Reference List, please supply full publication details.
Q8 AUTHOR: Please provide volume in Reference Brami et al. (2000).
Q9 AUTHOR: Please provide volume in Reference Hadler-Jacobsen et al. (2005).
Q10
AUTHOR: Please provide the year, page range and volume for this chapter in Reference Helland-Hansen and Hampson (this volume).
Q11 AUTHOR: Please provide volume in Reference Hadler-Mellere et al. (2003).
Q12 AUTHOR: Please provide publisher and the city location of publisher for Reference Posamentier et al. (1991).
Q13 AUTHOR: Please provide volume in Reference Shannon et al. (1993).
Q14 AUTHOR: Please provide volume in Reference Steel et al. (2000).
Q15 AUTHOR: Please provide volume in Reference Steel and Olsen (2002).
Copyright © 2022 FDOKUMEN