Equity in health care: Methodological contributions to the analysis of hospital utilization within...
12
~ Pergamon 0277-9536(94)00229-0 Soc. Sci. Med. Vol. 40, No. 9, pp. 1181 1192, 1995 Copyright © 1995 Elsevier Science Ltd Printed in Great Britain. All rights reserved 0277-9536/95 $9.50 + 0.00 EQUITY IN HEALTH CARE: METHODOLOGICAL CONTRIBUTIONS TO THE ANALYSIS OF HOSPITAL UTILIZATION WITHIN CANADA K. BRUCENEWBOLD, I'2JOHN EYLES 1'2a n d STEPHEN BIRCH 2'3 ~Department of Geography, McMaster University, 1280 Main Street West, Hamilton, Ontario, Canada L8S 4K1, :Centre for Health Economics and Policy Analysis, McMaster University, 1280 Main Street West, Hamilton, Ontario, Canada L8S 4K 1, 3Department of Clinical Epidemiology and Biostatistics, McMaster University, 1280 Main Street West, Hamilton, Ontario, Canada L8S 4K1 Abstract--The main objective of this paper is to determine whether the distribution of hospital service utilization corresponds to the distribution of needs within Canada. This is accomplished by identifying the factors affecting the relationship between the incidence and quantity of hospital services and self-assessed need for such care in Canada. The data were derived from the General Social Survey (Statistics Canada, 1987) which is a weighted random sample of the Canadian population aged 15 and over. Employing methodological extensions over previous studies, the results indicate that although variation in quantity of hospital use is largely independent of income, household income has a significant positive effect on the incidence of hospital utilization. Additionally, variations in both incidence and quantity of use of hospital services are associated with variations in need and other factors within the model. Key words--utilization, need, equity, hospital services, Canada INTRODUCTION The philosophy underlying the public funding of health care services in Canada is that resources committed to the delivery of health care should be allocated in accordance with medical necessity (the ability to benefit from health care) as opposed to willingness or ability to pay for services [1, 2]. Health care in Canada is a provincial responsibility, with each province running a public insurance program financed from general tax revenues and federal government transfers and covering the provision of a set of insured services (essentially physician and hospital bed care) without any direct patient contribution to the cost of these services. Provinces are free to cover additional programs and services (e.g. ambulatory drugs, dental care) but the extension of coverage to these services is not supported by federal transfers. This policy of full public funding of hospital and medical care services is based on the assumption that the removal of financial barriers to users of services, in the form of payment at the point of delivery, is sufficient to achieve allocations of resources in line with relative needs for these resources (or 'reasonable access to services' as used in the legislation). Under the systems of health-care funding which currently predominate in Canada (e.g. global budgets for hospitals and fee-for-service for physicians) there are few mechanisms in place to promote resource allocation in accordance with need among the population. Even though care for insured services is free at the point of delivery, other non-price related factors may differ among groups of the population and hence create barriers to reasonable access to care within the system. As a result, similar needs for care may not be met by similar levels of service (horizontal inequity) or greater needs for services may not be met by greater use (vertical inequity). Much debate within the current literature has focused on alternative approaches to equity in the organization and delivery of health care [3-7]. Mooney et al. [3] note that the distribution of utilization is commonly used to address issues of equity of access. But they argue that focusing attention on levels of utilization among population groups is "missing the target" and suggest that "equal access is best understood as being a situation when patients face equal costs of utilization" [3, p. 478]. In the context of Canadian health care policy, it is not clear why costs of use are more appropriate than utilization. As Daniels [8] points out, "What is missing... [from the argument] is the kind of moral argument ... immediately forthcoming in support of the utilization approach [to defining access[. What we need to know is why ease of access (or cost) must be roughly equal for population subgroups even when the "ease' factor does not affect utilization" [8, p. 62]. If the intention is to use health care resources in the most productive ways, in terms of the impact on population health status, as is the case in Canada, then the focus of analysis should be utilization. Analysis of health services have shown that the price at the point of delivery is just one correlate of use [9, 10]. Other studies have focused on the relationship between service use and income as a proxy for ability 1181
Transcript of Equity in health care: Methodological contributions to the analysis of hospital utilization within...

~ Pergamon 0277-9536(94)00229-0 Soc. Sci. Med. Vol. 40, No. 9, pp. 1181 1192, 1995
Copyright © 1995 Elsevier Science Ltd Printed in Great Britain. All rights reserved
0277-9536/95 $9.50 + 0.00
EQUITY IN HEALTH CARE: METHODOLOGICAL CONTRIBUTIONS TO THE ANALYSIS OF HOSPITAL
UTILIZATION WITHIN CANADA
K. BRUCE NEWBOLD, I'2 JOHN EYLES 1'2 and STEPHEN BIRCH 2'3
~Department of Geography, McMaster University, 1280 Main Street West, Hamilton, Ontario, Canada L8S 4K1, :Centre for Health Economics and Policy Analysis, McMaster University, 1280 Main Street West, Hamilton, Ontario, Canada L8S 4K 1, 3Department of Clinical Epidemiology and Biostatistics, McMaster
University, 1280 Main Street West, Hamilton, Ontario, Canada L8S 4K1
Abstract--The main objective of this paper is to determine whether the distribution of hospital service utilization corresponds to the distribution of needs within Canada. This is accomplished by identifying the factors affecting the relationship between the incidence and quantity of hospital services and self-assessed need for such care in Canada. The data were derived from the General Social Survey (Statistics Canada, 1987) which is a weighted random sample of the Canadian population aged 15 and over. Employing methodological extensions over previous studies, the results indicate that although variation in quantity of hospital use is largely independent of income, household income has a significant positive effect on the incidence of hospital utilization. Additionally, variations in both incidence and quantity of use of hospital services are associated with variations in need and other factors within the model.
Key words--utilization, need, equity, hospital services, Canada
INTRODUCTION The philosophy underlying the public funding of health care services in Canada is that resources committed to the delivery of health care should be allocated in accordance with medical necessity (the ability to benefit from health care) as opposed to willingness or ability to pay for services [1, 2]. Health care in Canada is a provincial responsibility, with each province running a public insurance program financed from general tax revenues and federal government transfers and covering the provision of a set of insured services (essentially physician and hospital bed care) without any direct patient contribution to the cost of these services. Provinces are free to cover additional programs and services (e.g. ambulatory drugs, dental care) but the extension of coverage to these services is not supported by federal transfers.
This policy of full public funding of hospital and medical care services is based on the assumption that the removal of financial barriers to users of services, in the form of payment at the point of delivery, is sufficient to achieve allocations of resources in line with relative needs for these resources (or 'reasonable access to services' as used in the legislation). Under the systems of health-care funding which currently predominate in Canada (e.g. global budgets for hospitals and fee-for-service for physicians) there are few mechanisms in place to promote resource allocation in accordance with need among the population. Even though care for insured services is free at the point of delivery, other non-price related factors may differ among groups of the population and
hence create barriers to reasonable access to care within the system. As a result, similar needs for care may not be met by similar levels of service (horizontal inequity) or greater needs for services may not be met by greater use (vertical inequity).
Much debate within the current literature has focused on alternative approaches to equity in the organization and delivery of health care [3-7]. Mooney et al. [3] note that the distribution of utilization is commonly used to address issues of equity of access. But they argue that focusing attention on levels of utilization among population groups is "missing the target" and suggest that "equal access is best understood as being a situation when patients face equal costs of utilization" [3, p. 478]. In the context of Canadian health care policy, it is not clear why costs of use are more appropriate than utilization. As Daniels [8] points out, "What is m i s s i n g . . . [from the argument] is the kind of moral argument . . . immediately forthcoming in support of the utilization approach [to defining access[. What we need to know is why ease of access (or cost) must be roughly equal for population subgroups even when the "ease' factor does not affect utilization" [8, p. 62]. If the intention is to use health care resources in the most productive ways, in terms of the impact on population health status, as is the case in Canada, then the focus of analysis should be utilization.
Analysis of health services have shown that the price at the point of delivery is just one correlate of use [9, 10]. Other studies have focused on the relationship between service use and income as a proxy for ability
1181

! 182 K. BRUCE NEWBOLD et al.
to pay for services [11-13]. In many of these studies, no attention has been paid to the effect of differences in need on the observed relationship between use and other variables. Even where need variables have been included in the analysis, additive functional forms have generally been used, which do not allow for the interrelationships between need and other variables in explaining observed variations in utilization. In other instances, use-based variables have been entered into equations as proxies for need, thus failing to allow for issues of overuse of services and unmet needs. The purpose of this paper is to determine whether the distribution of hospital service utilization (which is obtained only by physician referral) within the Canadian population corresponds to the distribution of need for care. This is accomplished by identifying the factors affecting the relationships between the incidence of and quantity of hospital care consumed and population self-assessed health status. By developing existing multivariate methods, we recognize that users of care are a self-selected group. (We report the corresponding analysis for other health-care services in Birch et al. [14].) Attention focuses upon a broad analysis of the factors which may influence utilization and the role of variations in need for health-care in explaining variations in the use of health care services, by employing measures of need which are independent of use, so that utilization does not appear as both dependent and independent variables.
HOSPITAL UTILIZATION IN CANADA
Attempts within the literature to model health-care utilization have largely focused upon the Anderson model and extensions of that model, forming the basis of discussion over the past two decades [9, 10, 15]. Anderson's model of health-care utilization proposed that the correlates of health-care utilization fall into three groups:
(1 )pred ispos ing (e.g. family composition, social structure or health beliefs);
(2) enabling (e.g. income); and (3) need (e.g. factors which generate the purpose of
utilization).
Andersen and Newman [9] argued that in addition to these factors, the organization and structure of the health-care system may prevent or limit utilization. While the Aday and Andersen model has formed the basis for much of the empirical literature in health-care utilization, the conceptual basis of the model has been questioned. For example, although "the distinction that has been drawn between need, enabling and predisposing conditions have heuristic value", the distinctions "may obfuscate the causal relationships of the model" when operationalized [16, p. 370]. Arling proceeds to argue that "the hierarchical additive approach of regressing health service use on these broad categories of predictor variables tend to obscure
the mediating effects of factors such as psychologic distress, ADL impairment, social support and economic status" [16, p. 370]. However, the Anderson model and its derivatives provide a useful analytic framework and starting point for the discussion of the utilization of health-care resources.
The Canadian literature on the utilization of hospital services focuses attention on the identification and estimation of use-income relationships [11-13], [17, 18]. Barer et al. [13], for example, estimated the relative importance of explanatory variables in the use of hospital services within Ontario. Their findings suggested that the probability of a family member experiencing at least one admission to hospital was not affected by family income. When the sample was limited to only those reporting some hospital contact, important variables in explaining variations in use were income (with individuals' from poorer families reporting greater use), family composition, physician supply and employment status.
In a similar study, Manga et al. [12] explored the determinants of hospital utilization in Canada using data derived from the Canada Health Survey. The results suggested that need was important in explaining variation in both incidence and quantity of use. Income was also significant, with the poor and middle class using significantly more hospital services than the wealthy, after controlling for proxies for need. In general, these findings were interpreted as confirming that hospital resources were being used in line with medical necessity. However, their findings should be viewed with caution, since the 'need' variables recorded in the data set tended to be related to health-care utilization (e.g. use of prescribed medications, disability days included days in hospital) and therefore might not represent underlying needs for health care independent of availability of services. Thus, the quantitative estimates of relationships produced in previous studies may be biased estimates of the underlying relationships.
The use of multiple regression analysis by Manga et al. [12] in the context of an additive model is both conceptually and empirically limited. In particular, the underlying conceptual model fails to consider conditional and/or non-additive elements of use and hence the linear assumptions implicit within the models may be restrictive [16, 19]. Collins and Klein [20] and O'Donnell and Propper [21] have demon- strated, for example, that analyzing variations in use across groups heterogeneous in need biases the estimates of use-need relationships if utilization occurs among those reporting no need (e.g. preventive services). It is therefore important to consider how need interacts with other independent variables in explaining variations in use amongst similar levels of need.
While the inclusion of interaction terms is unlikely to lead to large increases in the overall explanatory power of the model, they may be of significance in

Equity in
explaining the observed relationships especially in cases where a priori reasons exist for their inclusion [22, 23]. In studies where interaction terms have been included within the model, interactions between need and socioeconomic status were significant in explain- ing observed variations in use and improved the overall performance of the model [24, 25].
In terms of the empirical approach followed by Manga et al. [12], as well as earlier studies, use of multiple regression techniques for estimating utiliz- ation among users of care fails to recognize the selectivity-bias inherent in studying samples of users of care. That is, users of care represent a self-selected group from the populations of users and non-users which violates the normality assumptions of ordinary least squares regression. Hence, a more appropriate multivariate model must be used.
METHODS
The primary question to be addressed by this paper is whether the distribution of hospital service utilization corresponds to the distribution of needs (as proxied by self-assessed health status) for hospital care within Canada. The first stage of the analysis to answer this question considers the importance of the variation in needs to explain the distribution of the incidence and quantity (total number of nights in hospital in the past year) of utilization. The second stage considers which factors are associated with variations in the use of services in relation to needs for care. Two null hypotheses are tested:
(1) The incidence and quantity of utilization of hospital services over a fixed time period are independent of need.
(2) The relationship between the level of utilization of hospital services and need is independent of income, education, province or region of residence and social support.
Rejection of the first hypothesis would indicate that the use of hospital services is related to need. Rejection of the second hypothesis would indicate that although use might be related to need, the quantity of use given need is confounded by variables such as income, education, province of residence or social support, suggesting that barriers remain to equity in the delivery of hospital services.
The incidence and quantity of hospital service use are analyzed by univariate and multivariate tech- niques. First, comparative use of hospital services for those reporting hospitalization is analyzed by income, sex and age relationships. The primary advantage of univariate techniques is their simplicity in interpret- ation. However, the importance of looking beyond simple use-income relationships and controlling for other variables was highlighted by Birch and Eyles [26]. This showed that the relative risk of having visited a physician in the past year was independent of income but the relative risk of reporting an activity limiting
health care 1183
health problem was greater among the poor than the less poor groups. This suggests that the distribution of care may be determined, at least in part, by factors other than need for care. Age, sex and income are, lbr example, likely to be confounded and therefore a more robust modeling technique must be used to control for specific effects.
The hypotheses are tested using data from the 1985 General Social Survey (GSS), a weighted random sample of the Canadian population [27]. The GSS includes data on individuals' self-assessed health status (at the time of the survey), self-reported use of hospital services in the past 12 months, personal and behavioral attributes as well as various socioeconomic variables of the population aged 15 and over. Information was collected using personal interviews for those in the sample aged 65 or over and by telephone interviews for those aged 15-64. The elderly sample was based on households previously surveyed for the labour force survey. Respondents were randomly selected with a sample size greater than 13,000 (approx. one per two thousand) and an overall response rate of 84.2%. The main exclusions from the sample were the institutionalized, persons living in the Yukon and Northwest Territories or on Indian Reserves (elderly sample only) (see Table 1 for a list of variables and their reference categories). Phone interviewing does have its drawbacks, namely non-coverage of households (approx. 3%), which is concentrated in population groups with low- educational attainment or income. However, the sample is weighted in order to reflect these deficiencies. Because of the complex sampling design employed within the GSS, weighting of the sample data was required to allow for the differential probabilities of inclusion within the sample, ensuring that the estimated variances are meaningful. Weighting was performed using the weights developed by Statistics Canada for use in analyzing the GSS data set [27] and appropriate statistical software.
Table 1. Mean and standard deviations of variables selected for analysis
Name Reference Mean SD
Use: Hospital contacts
Need: General health Poor
Predisposing: Sex Female Age _> 75 Marital status Divorced Region Atlantic Employment Unemployed Community contact Not at all Smoking Not at all Drinking Not at all
Enabling: Household income ('O00"s) Education University
0.65 2.45
188 0.77
0.52 0.50 3.39 1.09 1.46 0.82 2.93 1.06 2.09 1.40 1,40 0.49 2.32 0.92 2.07 0.50
32.00 19.00 2.37 1,23
Where the variable is categorized for the purposes of the analysis it is represented by a series of dummy variables.

1184 K. BRUCE NEWBOLD et al.
Measures of use and need are both based upon self-reports and hence depend upon the recall and awareness of the respondents. However, unlike previous studies (e.g. Manga et al. [12]), the GSS provides information on needs independent of service use. Four proxy measures for need were selected from the data set, each being independent of current utilization. These included the individual's assess- ments of their general level of health, satisfaction with their own health, the presence or absence of long-standing limiting illness and the number of days in the last two weeks that the individual's activity was limited by their health. Given empirical support within the health-services literature, the general health measure was selected as the most preferred proxy for need for, or ability to benefit from, health care [28-38].
It could be argued that the expectation of benefit from health care might not coincide with the level of (self-assessed) health status, i.e. the expected improve- ments in health from health-care use may depend on, inter alia, the particular condition giving rise to the particular assessment of health status. In this sense, individuals in better health might have greater needs for health care than some individuals in poorer health. Similarly needs for health care might differ among individuals with the same level of self-reported health status. Nevertheless numerous studies have demon- strated statistically significant relationships, usually of moderate strength, between self-rated health and other measures of health status, among them physician assessments [29-33], number and/or type of self-re- ported health problems, diagnoses or chronic diseases [28, 32, 34, 35], number of medications [32, 35], acute symptoms [28] and composite measures of health status based on either self reports [36] or a combination of physician and self-reported conditions and health service utilization data [37].
Moreover, self-assessed health has been observed to perform better as a predictor of future mortality than other more conventional measures of health status [36-38] suggesting self assessments, although not a direct measure of health-care need, are probably as good a proxy for need for health care at the population level as alternative health measures or indicators. Finally, although Barer et al. [13] argue that hospital contacts are reported with greater accuracy than visits to a physician, it should be noted that the one-year time frame associated with the recall of hospital use versus assessment of health at the time of the survey is a limitation of cross-sectional data.
Is need important?
The first hypothesis (relating hospital use to self-assessed health) is tested using two approaches. First, the incidence of hospital utilization is estimated using probit regression, since the dependent variable (use or no-use) is dichotomous and use is assumed to be a non-linear function. The advantage of the probit model over ordinary least squares regression (OLS) is
that it constrains the probability of contact (or use) to lie between 0 and 1. The logit model could also be used in this situation, leading to similar results. Use of the probit model has two advantages. First, from a technical point of view, the probit model is more appropriate in situations where the data are concentrated in the tails of the distribution. Second, from a conceptual point of view, the probit model is more consistent with the second stage of the analysis. The probit model is defined by
Pu = F(c~ + ~X,) ( l)
where Pu is the probability of the event occurring, F(o) is the cumulative probability function, Xi is a vector of independent variables, c~ is a constant and/~ is a vector of estimated coefficients. Since the function is non-linear, a maximum-likelihood procedure is used to estimate the coefficients. Because most of the variables included within the model are categorical, bivariate or multivariate representations are created. One value of each variable was selected as the reference value and a series of dummy variables created (see Table 1). For example, the reference category for general health (the need proxy) was poor health and dummy variables were created for the levels of excellent, good and fair health. Following Aday and Andersen [10], explanatory variables are entered in blocks into an equation for use of services according to the 'need', 'predisposing' or 'enabling' categoriz- ation (see Table 1). In this stage of the analysis, variables are entered additively and are forced into the equation based on a priori expectations concerning the relationship between incidence of use and the explanatory variable.
As in ordinary least squares regression, the two-tailed t-test determines whether a particular parameter is statistically different from zero. Good- ness-of-fit of the model is evaluated in two ways. First, the likelihood ratio (LR) test (similar to the F-test in OLS) measures the overall significance of the model. The second measure, rho-squared, fulfils much the same role as R-squared in OLS. However, unlike R-squared, the score does not measure the variation explained by the model. The rho-squared has a lower bound of zero (for a very poor fit) and an upper bound (which is unknown) of substantially less than 1.
The second stage of the analysis focuses upon the quantity of hospital use (i.e. the number of nights spent as an inpatient) recorded by the subset of the sample population indicating at least one night spent in the hospital over the previous year. One approach to dealing with the analysis of data involving counts of events is to use a Poisson regression. Since counts must be non-negative integers, a discrete distribution such as the Poisson distribution provides a more appropriate basis for analysis than the normal distribution underlying OLS regression [39]. However, the observed value of the dependent variable is a count of independent events generated by a Poisson distribution. Hence, where the occurrence of one event

Equity in health care 1185
increases the probability of others, as might be the case in health-care utilization where the number of events is not necessarily independent of supply factors, the use of Poisson regression is not appropriate.
In situations where the independence assumption is violated, the negative binomial model provides a close approximation to the Poisson model [40]. However, use of the negative binomial model does not allow for self-selectivity bias within the sample. Because users of hospital services may be self-selected (i.e. differ systematically from the rest of the sample in ways not known by the researcher), any estimates of the relationship relying upon traditional OLS estimation techniques may be biased leading to false inferences about relationships. Since we focus upon that portion of the sample recording some use of hospital services in this stage of the analysis, there is a potential self-selection problem (see Duan et al. [41] and Manning et al. [23] for a discussion of appropriate transformation options). In this situation, the quantity of use equation (represented by the total number of nights spent in the hospital in the past year) is estimated using a two-stage estimation technique following Heckman [42] and Maddala [43], In the first stage, a correction factor (lambda) accounting for self-selectivity is estimated using probit analysis on the full sample (use/no-use). The correction factor is then entered into a least-squares multiple regression of the sample reporting hospital use (number of nights in hospital) on need, predisposing and enabling variables. The statistical significance of the lambda variable is an indicator of whether self-selection occurs in the use of hospital services.
The nature o f the use-need relationship
The second hypothesis is also tested in two ways. First, the sample is partitioned by level of need and the two-stage estimation procedure from above is applied to each level of need separately. If the explanatory variables are significant in explaining variations within groups homogeneous in need, then this indicates that factors other than need are associated with the distribution of utilization amongst the population with similar need levels (i.e. horizontal inequity). To further explore this relationship, and to use the variation in the need variable as part of the analysis, the model is re-estimated for the full sample with interaction terms between need and specific explana- tory variables based upon the findings of the disaggregate analysis. Although we have not tested for all possible interactions, we examined those that are of interest on a priori grounds (e.g. need and income).
RESULTS
Correlates o f hospital utilization
Based upon responses within the General Social Survey, Table 2 reports the use and need of hospital services by three sets of classifications. Of the total
Table 2. Use and need for hospital services by selected attributes: Canada, 1985
Health problem
giving rise to Mean days activity stay per
% Use limitation incidence (total sample) (%) of use
Overall mean I 1 12 6.3
HousehoM income: ('000"s p.a.) < 15 15 23 7.5 15 25 11 14 6.2 25-35 8 10 5.8 35-50 11 10 5.4 >50 10 7 5.9
F-statistic 7.9
Age: 15-19 6 4 20-24 11 5 25-44 10 7 45~4 l 1 16 65-74 16 26 75+ 22 41
F-statistic
Sex: Female 13 13 Male 9 I 1
T-statistic
5.3 4.7 5.5 6.9 7.9 8.6
19.1"
6.4 6.2
4.7
*Significant at 0.05 level.
sample of 11,200 individuals, 1231 individuals (11%) reported an incidence of hospital utilization, with a mean of 6.3 nights of hospitalization and 12% of the population reported a long-term activity limiting health problem.
Although statistically insignificant, individuals in the lowest household income quintile reported a higher incidence of hospital utilization (15%) than their better-off counterparts and a somewhat longer average length of stay once admitted to hospital (7,5 days compared to the average of 6.3). This complements Barer et al.'s [13] findings that the average length of stay per individual was observed to decline with increasing household income. That is, the poor tend to use more hospital services. The probability of experiencing an activity limiting health problem decreases with income level, suggesting that the distribution of health care may be determined, at least in part, by factors other than need for care.
The percentage of the population reporting some use generally increases with age (and is statistically significant) as does average length of stay and need, with the exception of the 20-24 age group who reported a shorter length of stay. Although females report greater use of hospital services (13%) and marginally greater lengths of stay once admitted than males (insignificant); use of hospital services during the child-bearing years is not observed to increase relative to other age groups. Individuals 75 years of age or older reported the greatest incidence of use (22% or approximately double the sample mean) and an above average length of stay (8.6 days) and the greatest need (41%).
Within the context ofa univariate analysis, it is not

1186 K. BRUCE NEWBOLD et al.
poss ib le to cons ide r h o w these obse rved re la t ionsh ip be tw e e n use a n d var ious s o c i o e c o n o m i c a n d soc iode- m o g r a p h i c var iables relates to the need for care.
Use and non-use o f hospital services: estimating an incidence o f use equation
Because the a b o v e analys is is sensi t ive to the p resence o f out l iers , we p r o c e e d e d to a mul t iva r ia te analys is to p rov ide m o r e robus t es t imates . Table 3 r ecords the resul ts o f the p rob i t regress ion o f u s e - n o n - u s e on the e x p l a n a t o r y var iables . T h e m o d e l has a r h o - s q u a r e d value o f 0.089, w h i c h is n o t a typical for c ross -sec t iona l analysis o f ut i l izat ion. M o r e o v e r , analys is based on large d a t a sets t end to decrease the u p p e r limit o f r h o - s q u a r e d by an u n - d e t e r m i n e d a m o u n t [44].
T h o s e wi th lower levels o f need have signif icantly lower probabi l i t i es o f hosp i ta l c o n t a c t ( P < 0.05) t h a n those wi th greates t needs (i.e. p o o r genera l heal th) . W h e n the var iables are en t e red by b locks (need, enab l ing and p red i spos ing) , the cumula t ive rho- s qua r e d increased f r o m 0.041 for the need var iables
en te red a lone , to 0.079 for need and p red i spos ing to 0.089 w h e n the p r ed i spos ing var iables were en te red .
Fema les are signif icantly m o r e likely to have used hosp i ta l services t h a n males , o t h e r th ings being equal . A l t h o u g h all age g roups are less likely to have use o f services t h a n the elderly, the difference is s ignif icant only for the 15-19 year olds. Such f indings may
rep resen t the failure o f the need var iable to adequa te ly represen t sex a n d age differences in the need for hosp i ta l services, i.e. in assess ing hea l th s ta tus indiv iduals migh t use their o w n age a n d sex peers as the c o m p a r a t o r g roup . H e n c e the age a n d sex var iables migh t p roxy var ia t ions in need be tween age a n d sex g roups n o t identif ied in the self-assessed hea l th var iable .
H o u s e h o l d income is posi t ively and significantly assoc ia ted wi th the inc idence o f ut i l izat ion, wh ich con t r a s t s wi th p rev ious s tudies for hosp i ta l u t i l izat ion a n d also wi th the results r epo r t ed by Birch et al. [45] where no s ignif icant r e l a t ionsh ip was f o u n d be t ween h o u s e h o l d i ncome a n d the p robab i l i ty o f hav ing used a family physic ian . As an example , the e s t ima ted coefficients in this s tudy imply tha t an increase
Table 3. Probit regression: incidence of hospital service utilization
Explanatory variables B C1
Need: General health
Predisposing: Sex Age
Marital status
Region
Employment
Community contact
Smoking
Drinking
Enabling: Household income Education
Constant LR-test Rho-squared N Overall % correct
Excellent - 1.017" ( - 1.21,-0.82 Good - 0.860* ( - 1.05,- 0.67 Fair - 0.525* ( - 0.72, - 0.33
Male - 0.209* (-0.30~- 0.12 15--19 -0.547* (-0.92,-0.17 20-24 0.200 ( - 0.04,0.44) 25-44 - 0.020 ( - 0.22,0.18) 45-64 - 0.120 ( - 0.32,0.08) 65-74 - 0.163 ( - 0.36,0.03) Married 0.113 ( - 0.08,0.31 ) Single - 0.213 ( - 0.44,0.02) Widow 0.016 ( - 0.24,0.27) Quebec -0.151 (-0.31,0.01) Ontario - 0.201 * ( - 0.36, - 0.04 Prairies - 0.042 ( - 0.21,0.13) B.C. - 0.040 ( - 0.23,0.15) Working - 0.450* ( -0 .55 , - 0.34 Sick 0.332* (0.08,0.59) Looking - 0.106 ( - 0.31,0.10) Freq. 0.686 ( - 0.26,1.64) In-freq. 0 . 7 2 3 (-0.23,1.67) Daily - 0.057 ( - 0.15,0.04) Occ. 0.108 ( - 0.08,0.30) Daily - 0.051 ( - 1.66,1.56) Occ. -0.233* (-0.32,-0.14)
C000's) 0.005* (0.003,0.008) No SSGD ~ -0.005 (-0.13,0.11) SSGD ~ -0.019 (-0.15,0.11) Some post t - 0.007 ( - 0.14,0.12)
-0.836 ( - 1.85,0.17) 430.4*
0.089 6833
88.8
* P<0.05. t SSGD, Secondary school graduation diploma; some post, some post secondary school education but no degree; No SSGD, no secondary school graduation diploma.

Equity in health care 1187
in household income from $20,000 to 25,000 for an individual with reference category values of the explanatory variables (e.g. university graduate, f ema le . . . ) is associated with a 4.1% increase in the likelihood of having been admitted to hospital in the last year. Alternatively, for a low educated [no Secondary School Graduation Diploma (SSGD)] male residing in the Atlantic provinces, an increase in household income from $20,000 to 25,000 is associated with a 2.9% increase in the likelihood of having been admitted to hospital in the past year. For the same person residing in Ontario, there is a 3.3% increase in the likelihood of having been admitted to a hospital. Similar calculations can be performed for other combinations of variables. The incidence of hospital utilization is also significantly lower amongst the employed and significantly greater amongst the sick as compared to the unemployed. But the unemployed are more likely to have poorer health than the employed. These findings may therefore represent the 'healthy worker effect' because the employment categories used in this analysis are conditional upon health (e.g. permanently unable to work or sick).
Residents of Quebec, Ontario or British Columbia have a lower likelihood of being admitted to hospital than Atlantic residents (significant in the case of Ontario only). This may be due to the lesser availability of beds in Ontario (5.63/1000 compared to 6.81 / 1000 for the Atlantic region) [46]. However, such a supposition is inconsistent with the estimated coefficient for Quebec where a greater availability of beds (8.61/1000) is associated with a lower likelihood of utilization as compared to the Atlantic region. Consequently, such findings appear to represent more than just differences in the availability of hospital beds. An alternative explanation for the regional differences may be related to the substitution of hospital care for physician care. For example, Atlantic Canada has a lower physician to population ratio (0.87/1000) than either Ontario or British Columbia (0.91 and 1.05). Hence, the greater availability of physicians in Ontario and British Columbia may be associated with a substitution at the margins of physicians for hospital care. Greater community contact (regular contact with friends and/or relatives) is associated with a greater likelihood of having been admitted to hospital, but this relationship is not significant. Similarly, education and marital status are not significant in explaining variations in the incidence of hospital utilization.
In general, with the exception of the relationship between incidence of use and income, the results support the earlier findings of Manga et al. [12] and Barer e t a / . [13] who used different statistical approaches and different data sets. Because of the level of aggregation, the results should be treated with caution but they do suggest that the incidence of hospital utilization is related to a broad range of factors, including need, but also household income.
Quantity of hospital utilization
The second stage of the model is applied to the sub-sample reporting some use of hospital services. Table 4 records the coefficients and the 95% confidence intervals for the two-stage estimation of quantity for hospital use. Better general health (i.e. lower 'need'), working and residents of Quebec are associated with significantly lower quantities of hospital use. Individuals reporting either good or fair general health spend fewer nights in hospital than those in poor health, but the difference diminishes as we move from good to fair health. Those in excellent health are estimated to spend 12.74 (CI 21.98, 3.50) fewer nights in hospital than those in poor health. The residents of all other regions spend fewer nights in hospital than their counterparts in the Atlantic region with the difference being greatest (and significant) for residents of Quebec who spend 4.44 (CI 7.90, 0.98) fewer nights per year in hospital.
Although no other significant associations were found in the analysis, there is considerable consistency in the direction of the estimated relationships. For example, all age groups spend fewer hospital nights than the very elderly with the size of the difference being greatest for the youngest age groups. This is consistent with the supposition that increasing age is associated with increasing need for care resulting in increased hospital utilization. As with the equation for incidence of use, neither education, community contact nor marital status were found to be significantly associated with the quantity of use, although the direction of the relationship differs in some cases from that which was found previously.
Since the decision to use hospital services is likely based in part on need, users are more apt to be over-represented by the needy (i.e. less healthy) individuals, biasing the estimated relationship be- tween need and use. However, the correction for self-selectivity was found to be insignificant (P = 0.05), suggesting that self-selectivity was not an issue in this instance and that there is a slightly more than 1-in-20 chance that the positive coefficient on lambda occurs by chance. The overall explanatory power of the estimated equation, as measured by the R-squared value (0.23), is fairly high as compared with other studies of this type [16].
Interactions among explanatory variables
The results presented in this section depict the findings of relaxing the additive assumptions of the simple linear model and represent a test of the second hypothesis. The first stage of the analysis partitions users of services according to level of need and re-estimates the quantity of use equations for each need group. The number of individuals having reported hospital admissions produced small sample sizes for the sub-groups. Need groups 'excellent' and 'good' were therefore grouped together as were 'fair' and 'poor'. Even then, the estimation produced

1188 K. BRUCE NEWBOLD et al.
Table 4. Two-stage estimation: quantity of hospital use
Explanatory variables B CI
Need: General health
Predisposing: Sex
Age
Marital status
Region
Employment
Community contact
Smoking
Drinking
Enabling: Household income
Education
Lambda
R-squared Adjusted R-squared F N
Excellent - 12.737" ( - 21.98,- 3.50) Good -9.870* ( - 17.34,-2.40) Fair - 6.855* ( - 11.87, - 1.84)
Male - 1 . 5 3 2 (-4.29,1.22)
15-19 -7.503 (-20.57,5.56) 20-24 - 0.407 ( - 4.81,3.99) 25--44 - 1 . 0 4 4 (-4.49,2.40) 45-64 - 1 . 0 9 9 (-4.73,2.53) 65-74 - 0.986 ( -- 4.67,2.70)
Married -0.574 (-4.80,3.65) Single - 3.085 ( - 8.91,2.74) Widow - 1.820 ( - 6.71,3.07)
Quebec - 4.440* ( - 7.90, - 0.98) Ontario - 2.795 ( - 6.45,0.86) Prairies - 2.002 ( - 5.5 l, 1.50) B.C. -2.604 ( - 6.37,1.16)
Working - 5.030" ( - 9.50, - 0.56) Sick 3.630 ( - 0.25,7.51) Looking - 1.559 ( - 6.21,3.00)
Freq. 6 .113 (-2.65,14.88) In-freq. 6.337 ( - 2.41,15.08)
Daily - 0.668 ( - 2.78, 1.44) Occ. -0.808 (-4.32,2.70)
Daily - 0.981 ( - 4.65,2.69) Oct. - 1.372 ( - 3.56,0.81)
('O00's) 0.048 ( - 0.02,0.12)
No SSGD ~ - 0.545 ( - 3.16,2.07) SSGD t 0.584 ( - 2.34,3.50) Some post * 0.325 ( - 2.67,3.32)
10.031 (-0.15,20.21)
0.227 0.202 9.127"
931
*P<O.05. LSee note Table 2.
coefficients wi th large conf idence intervals , especial ly in the exce l l en t /good sub -g roup .
Quantity o f use within need levels
Table 5 d isp lays the resul ts o f the e s t ima t ion o f qua n t i t y o f hosp i t a l use by need level. In ne i the r case is l a m b d a signif icant , ind ica t ing tha t self-selectivity
was aga in no t an issue. Desp i te the large conf idence intervals , the s igns a n d o rde r ings are obse rved to be s imilar to tha t o f the full sample . The excep t ion is c o m m u n i t y con tac t , wh ich appea r s to be assoc ia ted wi th less ut i l izat ion, o t h e r th ings being equal , for those in be t te r hea l th bu t wi th m o r e ut i l iza t ion for those in p o o r e r heal th . In the p o o r / f a i r sub -g roup , on ly two coefficients are significant . Ind iv idua ls res id ing in Quebec and those w h o d r ink occas iona l ly spend signif icantly fewer n igh ts in hospi ta l . O therwise , h igher e d u c a t i o n and i ncome have a posi t ive bu t insignif icant effect on hosp i ta l use.
Separa te analysis wi th in s u b - g r o u p s is one way o f tes t ing for in te rac t ions bu t such an analys is does no t m a k e full use o f the d a t a a n d does n o t use the va r i a t ion in need as pa r t o f the analysis . T h e inc lus ion o f
in t e rac t ion t e rms be t ween the need var iable a n d o t h e r var iables o f in teres t o v e r c o m e s this shor t fa l l . Since only s imple o rde r ings can be i m p o s e d on the coefficients o f the in t e rac t ion t e rms due to the na tu re o f the e x p l a n a t o r y var iables , the m a g n i t u d e s o f the coefficient o n the in te rac t ion t e rms are n o t meaningfu l . A n increase in the mode l s ' R - s q u a r e d value [47] o r an increase in the ad jus ted R - s q u a r e d indica tes tha t their c o n t r i b u t i o n is i m p o r t a n t in expla in ing va r ia t ions in use.
Quantity o f use with interaction effects
While h o u s e h o l d i ncome was f o u n d to be signif icant in exp la in ing va r ia t ions in the inc idence o f use, this was no t so for exp la in ing var ia t ions in the quan t i t y o f use o f hosp i t a l services. The non-s ign i f ican t coefficients on in te rac t ions for h o u s e h o l d i ncome and need indica te tha t the null h y p o t h e s i s - - t h a t the re la t ionsh ip be tween hosp i t a l u t i l izat ion and need is i n d e p e n d e n t o f i n c o m e - - - c a n n o t be re jected (Table 6), Howeve r , the add i t i on o f the in te rac t ion t e rms d id p r o d u c e a s ignif icant increase in the e x p l a n a t o r y p o w e r o f the equa t ion . T h e posi t ive coefficient on the 'excel lent
Equity in health care
Table 5. Two-stage estimation: quantity of hospital nights by need level
1189
Explanatory variables
Poor general health ~ Good general health 2
B CI B CI
Predisposing: Sex
Age
Marital status
Region
Employment
Community contact
Smoking
Drinking
Enabling: Household income
Education
Lambda
R-squared Adjusted R-squared F N
Male
15-19 20-24 25~14 45~4 65-74
Married Single Widow
Quebec Ontario Prairies B.C.
Working Sick Looking
Freq. In-freq.
Daily Occ.
Daily Occ.
('000's)
No SSGD SSGD Some post.
- 0.392
- 6.820 - 1.448 - 0.062
1.683 - 0.402
- 1.788 -3.188 - 3.296
-6.126" - 2.630 - 1 . 1 4 7
- 5.002
-8.163 4.118
- 0.305
2.994 4.029
-0.132 2.731
-4.078 -3.150"
0.041
- 2.066 0.240 0.588
10.440
0.263 0.209 4.880*
383
( - 3.07,2.29)
(-29.67,16.03) (-8.77,5.88) (-4.71,4.59) (-2.42,5.78) (-4.67,3.86)
( - 7.25,3.68) ( - 10.48,4.11) (-9.75,3.16)
( - 11.52,- 0.73) ( - 7.40,2.14) ( - 5.92,3.63) ( - 10.65,0.65)
( - 10.66,0.33) (-0.57,8.81) (-7.19,6.58)
( - 10.26,16.24) (-8.91,16.97)
( - 3.20,2.93) (-4.02,9.48)
(--9.16,1.01) ( - 5.97,-0.33)
( - 0.05,0.13 )
( - 6.25,2.12) (-4.97,5.45) (-5.31,6.48)
(-1.95,22.83)
-20.695 (-138.57,97.18)
- 50.690 ( - 334.15,232.77) -4.374 (-57.39,48.65)
-23.247 ( - 149.66,103.17) -29.830 ( - 190.35,130.70) - 25.808 ( - 176.39,124.78)
0.913 (-55.99,57.82) -25.715 ( - 174.54,123.11)
- 6.809 ( - 77.78,64.16)
- 13.456 (-82.26,55.35) -17.149 (-113.48,79.18) -9.687 (-72.16,52.78) - 5.550 ( - 55.35,44.25)
-26.887 ( - 172.64,118.87) 31.409 ( - 129.01,191.83)
-8.613 (-72.25,55.03)
-95.266 (-684.57,494.04) - 95.452 ( - 684.99,494.09)
- 1.203 (-27.41,25.00) -5.315 (-60.67,50.04)
1.522 (-48.67,51.71) -0.724 (-30.36,28.91)
0.411
- 1.409 - 3.945
1.709
83.042
0.183 0.142 4.496*
548
( - 1.90,2.70)
( - 33.88,31.07) ( - 46.29,38.40) ( - 31.94,35.35)
( - 375.89,541.98)
*P<0.05. ~Poor and fair combined. 2Excellent and good combined.
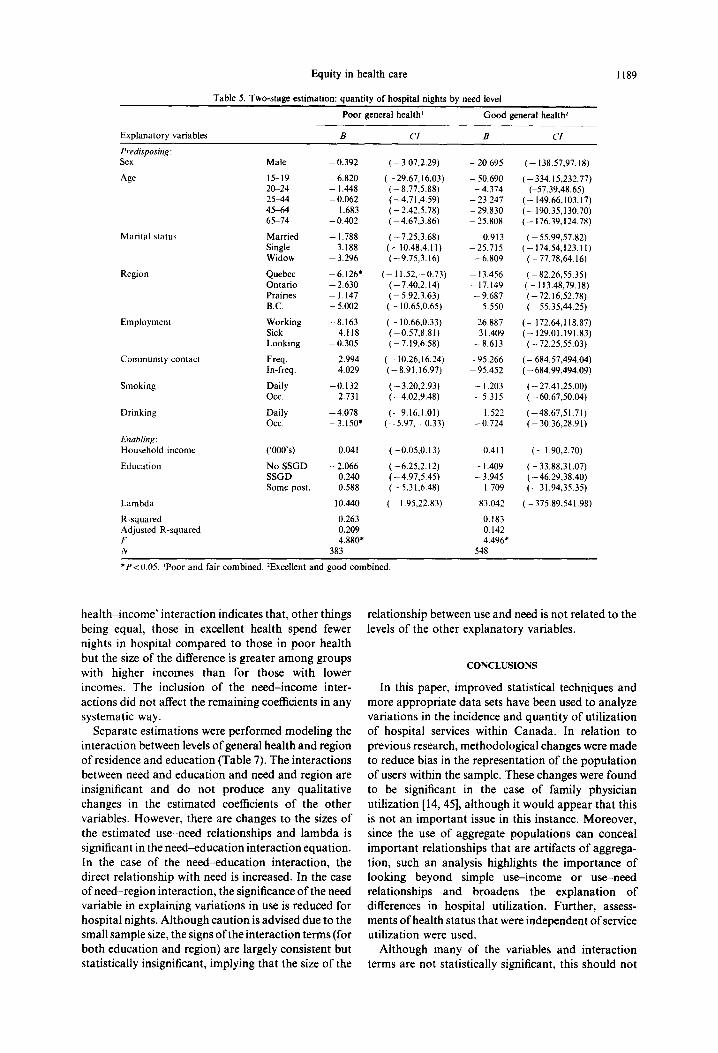
hea l th - income ' interact ion indicates that , o ther things being equal, those in excellent heal th spend fewer nights in hospi ta l compared to those in poor heal th but the size of the difference is greater among groups with higher incomes than for those with lower incomes. The inclusion of the need- income inter- act ions did not affect the remain ing coefficients in any systematic way.
Separate es t imat ions were performed model ing the interact ion between levels o f general heal th and region of residence and educat ion (Table 7). The interact ions between need and educat ion and need and region are insignificant and do not produce any quali tat ive changes in the es t imated coefficients of the other variables. However, there are changes to the sizes of the est imated use-need relat ionships and i ambda is significant in the need-educa t ion in teract ion equation. In the case of the need-educa t ion interact ion, the direct re lat ionship with need is increased. In the case of need- reg ion interact ion, the significance o f the need variable in explaining var ia t ions in use is reduced for hospi tal nights. A l though caut ion is advised due to the small sample size, the signs of the in teract ion terms (for bo th educat ion and region) are largely consis tent but statistically insignificant, implying tha t the size of the
relat ionship between use and need is not related to the levels of the other explanatory variables.
CONCLUSIONS
In this paper, improved statistical techniques and more appropr ia te da ta sets have been used to analyze var ia t ions in the incidence and quant i ty of ut i l izat ion of hospital services within Canada . In relat ion to previous research, methodological changes were made to reduce bias in the representa t ion of the popu la t ion of users within the sample. These changes were found to be significant in the case of family physician uti l ization [14, 45], a l though it would appear tha t this is not an impor t an t issue in this instance. Moreover , since the use of aggregate popula t ions can conceal impor t an t relat ionships tha t are art ifacts of aggrega- tion, such an analysis highlights the impor tance of looking beyond simple use- income or use-need relat ionships and broadens the explanat ion of differences in hospital utilization. Fur ther , assess- ments of heal th s tatus tha t were independent of service uti l ization were used.
Al though many of the variables and interact ion terms are not statistically significant, this should not

1190 K . BRUCE NEWBOLD et al.
Table 6. Two-stage est imation: quant i ty of hospital contacts with need-income interactions
Explanatory variables B CI
Need: General health Excellent - 13.785* ( - 26. I 1, - 1.46)
Good - 8 . 3 9 9 * ( - 1 6 . 2 5 , - 0 . 5 4 ) Fair - 5.496* ( - 10 .90 , - 0.09)
Sex Male - 1.423 ( - 4.06,1.22) Age 15-19 -7 .101 ( - 19.70,5.50)
20-24 - 0.367 ( - 4.63,3.90) 25~t4 - 0 . 8 5 8 ( -4 .12 ,2 .41) 45-64 - 0.937 ( -4 .37 ,2 .49) 65-74 - 0.893 ( -4 .41 ,2 .62)
Mari ta l status Marr ied - 0.597 ( - 4.64,3.44) Single - 2.970 ( - 8.51,2.57) Widow - 1.852 ( -6 .51 ,2 .81)
Region Quebec - 4 . 4 1 3 " ( - 7 . 7 6 , - 1.06) Ontar io - 2.657 ( - 6.16,0.84) Prairies - 1.956 ( - 5.31, 1.40) B.C. -2 .501 ( -6 .10 ,1 .10)
Employment Work ing - 4.854* ( - 9.23, - 0.48) Sick 3.471 ( - 0.18,7.12) Looking - 1.437 ( - 5.82,2.95)
Communi ty contact Freq. 5.974 ( - 2.49,14.43) In-freq. 6.197 ( - 2.24,14.63)
Smoking Daily - 0.737 ( - 2.77,1.30) Occ. - 0.857 ( - 4.23,2.52)
Dr ink ing Daily -- 0.998 ( - 4.54,2.54) Occ. - 1.379 ( - 3.47,0.71)
Enabling: Household income ( '000's) 0.063 ( - 0.04,0.17) Educat ion No S S G D - 0.519 ( - 3.03,1.99)
S S G D 0.693 ( - 2.14,3.52) Some post. 0.405 ( - 2.45,3.26)
Interactions: Need- income EX-income' 0.028 ( - 0.13,0.18)
Good- income - 0 . 0 4 3 ( -0 .16 ,0 .77) Fair- income - 0.051 ( - 0.19,0.04)
L a m b d a 9.574 ( - .37,19.52)
R-squared 0.229 Adjusted R-squared 0.202 F 8.361" N 931
* P < 0.05. 'EX, Excellent.
be construed as an issue. The non-significance of these variables reinforces many of our initial hypotheses. Moreover, multi-collinearity amongst the variables did not appear to be an issue--the deletion of selected variables from the analysis did not significantly alter the results. Since we were not concerned with predicting utilization, but to test for the presence of systematic relationships between factors other than need for care and incidence and quantity of use of hospital utilization, the low levels of explanatory power which are common to studies of this type are not of major concern. These conclusions must, however, be qualified in one respect. Despite the evidence supporting the use of self-assessed health as a proxy for need, it is not universally accepted as a robust measure. Further, individuals who rate their health as fair or poor may not need hospital services per se. Instead, they may require other forms of health care, such as mental health care, nursing homes or nursing care.
Our findings concerning hospital utilization are generally comparable to those of Manga et aL [ 12] and Baler et al. [13]. First, hospital utilization is positively related to the level of need, as proxied by self-assessed health status. In particular, decreasing self-assessed health status increases the likelihood of hospital
utilization. This finding is robust for both incidence and quantity of utilization. Although such a conclusion is consistent with the notion of vertical equity (greater use for greater need), other correlates of hospital use, including household income which had a small positive coefficient, were found to be statistically significant. In this sense, medical necessity is not the only determinant of hospital use.
Second, within need groups, the number of nights spent in hospital is independent of income. Although this is compatible with the notion of horizontal equity (equal use for equal need), several non-need variables were found to be significant correlates of quantity of care. These findings were supported by the results of the aggregate analysis.
One other finding worthy of further attention is the regional variation in hospital utilization. As men- tioned earlier, the use of regional variables may represent more than just proxies for the supply or provision of services at the regional level.
Although this study confirms that the quantity of hospital use in Canada is independent of household income, the significance of income in explaining variations in incidence of utilization and the presence of other significant (but not systematic) non-need

Equity in health care
Table 7. Estimated coefficients of interaction terms for quantity of service utilization
Interaction B CI
Need-region Quebec----excellent 5.809 ( - 6.54.18.16) Ontario---excellent - 1.747 ( - 13.19,9.70) Prairie--excellent 3.066 ( - 9.80,15.93) BC---excellent 5.727 ( - 8.74,20.20)
Quebec--good 3.019 ( - 6.59,12.63) Ontario---good 0.949 ( - 7.70,9.60) Prairie---good 2.957 ( - 6.64,12.56) BC--good 4.329 ( - 7.55,16.20)
Quebec--fai r 3.108 ( 1.60,4.61 ) Ontario--fair - 0.732 ( - 9.22,7.76) Prairie--fair 4 . 8 6 3 (-4.87,14.60) BC--fair 3.319 ( - 8.52,15.16)
Lambda 10.460 ( - 0.09,21.01 )
R-squared 0.247 Adjusted R-squared 0.212 F 7.116" N 931
Need~ducation No SSGD--excellent 3.666 ( - 5.88,13.21 ) SSGD--excellent - 0.450 ( - 18.16,17.26) Some post--excellent - 0.802 ( - 12.06,10.46)
No SSGD--good 6.024 ( - 1.78,13.83) SSGD--good 4.603 ( - 12.12,21.33) Some post--good 0.207 ( - 10.47,10.89)
No SSGD--fair 8.933 ( - 2.10,19.97) SSGD---fair 7.752 ( - 11.85,27.35) Some post--fair 3.561 ( - 10.21,17.34)
Lambda 21.103" (0.15,24.06)
R-squared 0.253 Adjusted R-squared 0,221 F 7,960* N 931
*P<O.05.
1191
variables weakens the conclusion tha t publicly-funded heal th care p rograms in C a n a d a has resulted in a seemingly equitable d is t r ibut ion of hospi tal resources a m o n g provincial popula t ions . It may be that income is, in some sense, represent ing a barr ier to enter ing the system (i.e. hospi tal admission). Once an individual has gained admiss ion into the system however, income is no longer a factor to receiving services in accordance with need. Such results are, however, tentat ive given the small sample size and other non-observed effects, which may cloud the picture. For example, household income may be act ing as a proxy for educat ion, knowledge or social class beyond which is measured in this analysis.
Our analysis also explored whether the use-need relat ionship is independent of o ther socioeconomic or soc iodemographic variables. The inclusion of inter- act ion terms indicates tha t users of care are a heterogeneous group and therefore any analysis of ut i l izat ion at the aggregate level may produce a biased picture of ut i l izat ion conceal ing impor t an t relation- ships. Wi th in need groups, uti l ization does not appear to vary in ways indicat ing the existence of significant barriers to ' reasonable access' to services, a l though there is var ia t ion between groups.
In conclusion, while income is not significantly associated with quant i ty of hospi tal uti l ization, there is a statistically-significant associat ion of income with
incidence of hospital utilization. Fur ther , the identification of o ther systematic and significant relat ionships involving non-need factors points to possible inadequacies of current policies as methods of achieving or a t ta in ing the b roader goal al locat ing resources in line with medical necessity. Thus, while changes in the na ture of the funding of hospi tal services over the past thir ty years might have improved access to services per se, there would still appear to be room for improvement in the dis t r ibut ion of services. Moreover , our findings suggest tha t analyses of uti l ization based on simple mul t ivar ia te techniques and aggregate da ta can produce a picture of ut i l izat ion tha t conceals impor t an t and policy relevant relation- ships while revealing other relat ionships tha t are essentially artifacts of inappropr ia te aggregation. In this way, the appl icat ion of two-stage es t imat ion procedures and non- l inear model ing techniques are impor tan t in reducing the l ikelihood of pa in t ing a false sense of achievement concerning the al locat ion of heal th care resources in Canada .
Acknowledgements--The authors wish to acknowledge three anonymous reviewers and members of the Centre for Health Economics and Policy Analysis for their comments. Funding for this research was provided by a grant from the National Health and Research Development Program of Health and Welfare Canada.

1192 K. BRUCE NEWBOLD et al.
REFERENCES
1. House of Commons, Canada. Canada Health Act. Queen's Printer, Ottawa. 1984.
2. Health and Welfare Canada. Health and Welfare in Canada. Ministry of Supply and Services, Ottawa, 1989.
3. Mooney G., Hall J., Donaldson C. and Gerard K. Utilization as a measure of equity: weighing heat? J. Hlth Econ. 10, 475, 1991.
4. Pereira J. What does equity in health mean? J. Soc. Policy 22(1), 19, 1992.
5. Whitehead M. The concepts and principles of equity and health. Int. J. Hhh Serv. 22, 429, 1992.
6. Birch S. and Abelson J. Is reasonable access what we want? Implications of and challenges to, current Canadian policy on equity in health care. Int. J. Hlth Serv. 23, 629, 1993.
7. Van Doorslaer E., Wagstaff A. and Rutten F. Equity in the Finance and Delivery of Health Care: An International Perspective. Oxford University Press, Oxford, 1993.
8. Daniels N. Equity of access to health care: some conceptual and ethical issues. Millbank Mere. Fund Q. 60, 51, 1992.
9. Andersen R. and Newman J. Societal and individual determinants of medical care utilization in the United States. Millbank Mem. Fund Q. 51, 95, 1973.
10. Aday L. and Andersen R. A framework for the study of access to medical care. Hlth Serv. Res. 9, 208, 1974.
11. Beck R.G. and Horne J.M. Economic class and risk avoidance. J. Risk Insurance 75, 493, 1976.
12. Manga P., Broyles R. and Angus D. The determinants of hospital utilization under a universal public insurance progamme in Canada. Med. Care 25, 658, 1987.
13. Barer M., Manga P. and Shillington R. Income Class and Hospital Use in Ontario. Ontario Economic Council, Toronto, 1982.
14. Birch S., Eyles J. and Newbold K.B. To Each According to Their Need: An Analysis of the Relationships Between the Use of Services and Need for Care Among Canadian Populations. McMaster University, Hamilton, Ontario (mimeo), 1992.
15. Anderson J.G. A Behavioral Model Of Families' Use Of Health Services, p.25. Center for Health Administration Studies, University of Chicago, 1968.
16. Arling G. Interaction effects in a multivariate model of physician visits by older people. Med. Care 23, 361, 1985.
17. Beck R.G. Economic class and access to physician services under public medical care insurance. Int. J. Hlth Serv. 3, 341, 1973.
18. Boulet J.A. and Henderson D.W. Distributed and Redistributional Aspects of Government Health In- surance Programs in Canada. Discussion Paper 146, Economic Council of Canada, Ottawa, 1979.
19. Rundall T. A suggestion for improving the behavioral model of physician utilization. J. Hlth Soc. Behav. 22, 103, 1981.
20. Collins E. and Klein R. Equity in the NHS: self-reported morbidity, access and primary care. Br. Med. J. 281, 1111, 1980.
21. O'Donnell O. and Propper C. Equity and the distribution of UK national health service resources. J. Hlth Econ. 10, 1, 1991.
22. Ronis D. and Harrison K. Statistical interactions in studies of physician utilization. Med. Care 26, 361, 1988.
23. Manning W.G., Newhouse J.P., Duan N., Keeler E.B., Leibowitz A. and Marquis M.S. Health insurance and the demand for medical care: evidence from a randomized experiment. Am. Econ. Rev. 77, 251, 1987.
24. Puffer F. The effect of regional class differences in the UK on access to health care. Paper presented at the Health Economics Study Group Meeting, University of Warwick, Coventry U.K., January 1987.
25. Winter D. The demand for health care revisited. Paper presented at the Health Economics Study Group Meeting, University of Warwick, Coventry U.K., January 1987.
26. Birch S. and Eyles J. Equity and efficiency in health-care delivery: the distribution of health-care resources and its relationship to needs for care. In The Challenge of Change (Edited by Chytil M.K., Duru G., Van Eimeren W. and Flagle C.), Omnipress, Prague, 1992.
27. Statistics Canada. Health and Social Support 1985. Ministry of Supply and Services, Ottawa, 1987.
28. Davis A.R. and Ware J. Measuring Health Perceptions in the Health Insurance Experiment. The Rand Corpor- ation, Santa Monica, California, 1981.
29. Friedsam H. and Martin H. A comparison of self and physicians' health ratings in an older population. J. Hlth Human Behav. 4, 179, 1963.
30. Maddox G. and Douglas E. Self-assessment of health: a longitudinal study of elderly subjects. J. Hlth Social Behav. 14, 87, 1973.
31. La Rue A., Bank L., Jarvik L. and Hetland M. Health in old age: how do physician ratings and self-ratings compare? J. Geront. 14, 687, 1979.
32. Linn B. and Linn M. Ojbective and self-assessed health in the old and very old. Soc. Sci. Med. 14A, 311, 1980.
33. Linn M., Hunter K.I. and Linn B. Self-assessed health, impairment and disability in Anglo, Black and Cuban elderly. Med. Care 18, 282, 1980.
34. Tissue T. Another look at self-rated health in the elderly. J. Geront. 27, 91, 1972.
35. Fillenbaum G. Social context and self-assessments of health among the elderly. J. Hlth Soc. Behat,. 20, 45, 1979.
36. Kaplan G. and Camacho T. Perceived health and mortality: a nine-year follow up of the human population laboratory cohort. Am. J. Epidemiol. 117, 292, 1983.
37. Mossey J. and Shapiro E. Self-rated health: a predictor of mortality among the elderly. Am. J. Publ. HIth 72, 800, 1982.
38. Idler E., Kasl S. and Lemke J. Self-evaluated health and mortality among the elderly in New Haven, Connecticut and Iowa and Washington counties, Iowa, 1982-1986. Am. J. Epidemiol. 131, 91, 1990.
39. Flowerdew R. and Lovett A. Fitting constrained poisson regression models to interurban migration flows. Geographical Analysis 8, 29, 1988.
40. Johnson N. and Kotz S. Discrete Distributions. Houghton Mifflin, Boston, 1969.
41. Duan N., Manning W.G., Morris C.N. and Newhouse J.P. Choosing between the sample selection model and the multi-part model. J. Business Econ. Stat. 2,283, 1984.
42. Heckman J. Sample bias as a specification error. Econometrica 47, 153, 1979.
43. Maddala G. Limited Dependent and Qualitative Variables in Econometrics. Cambridge University Press, Cam- bridge, MA, 1983.
44, McFadden D. Conditional logit analysis of qualitative choice behaviour. In Frontiers in Econometrics (Edited by Zarembka D.). Academic Press, New York, 1974.
45. Birch S., Eyles J. and Newbold K.B. Equitable access to health care: Methodological extensions to the analysis of physician utilization in Canada. Hlth Econ. 2, 87, 1993.
46. Statistics Canada. Hospital Statistics Annual Report, 1984-85. Ministry of Supply and Services, Ottawa, 1985.
47. Kmenta J. Elements of Econometrics, 2nd Edn. Macmillan, New York, 1988.