Equitability in Education and Health Services in Sri Lanka
37
Equitability in Education and Health Services in Sri Lanka Nisha Arunatilake and Priyanka Jayawardena Forthcoming in ”Equity in Education and Health Services in Sri Lanka”, Equity and Well-Being: Measurement and Policy Practice Eds. Hyun Hwa Son, Routledge, Oxon.
Transcript of Equitability in Education and Health Services in Sri Lanka
Equitability in Education and Health Services in Sri Lanka
Nisha Arunatilake and Priyanka Jayawardena
Forthcoming in ”Equity in Education and Health Services in Sri Lanka”, Equity and Well-Being: Measurement and Policy Practice Eds. Hyun Hwa Son, Routledge, Oxon.

1.0 Introduction
Sri Lanka has long been recognized for its achievements in human development. In
large part, this achievement is credited to the policies of successive governments that
provided widespread access to health and education services at no user charges for
over 50 years. However, the social sectors of the country are now faced with new
challenges. Recent policy debates have highlighted the need to improve the quality of
services, especially in rural areas, and modernize and make them more relevant to
current market demands. Despite a long standing separatist conflict and recurrent
exposure to external shocks, Sri Lanka’s economy has maintained growth above five per
cent in the post-1990s period. This study seeks to better understand whether growth has
improved access to services and their outcomes.
The specific questions asked in include:
1) Are opportunities for health and education services equitable in Sri Lanka and how
has their equity changed over time?
2) What factors affect the opportunities for health and education services?
3) Are the out-of-pocket contributions on health and education progressive in Sri Lanka?
The next section provides an overview of the health and education sectors. Section 3
describes the data and methodology, section 4 details the results and section 5
concludes.
1.2 Background
Sri Lanka is a small island nation (65,610 square kilometres) in the Indian Ocean. In
2008, gross domestic product (GDP) was US$40 billion, or $2,014 per capita (Central
Bank, 2008). Its population of nearly 20 million is 74% Sinhalese, 12.7% Sri Lankan

Tamil, 5.6% Indian Tamil, 7% Muslim, and the rest Burghers and others.1 According to
the 2001 census, 80 per cent of the population was rural while the rest were urban (15
per cent) and estate2 (5 per cent).3 Despite an ethnic conflict that lasted over 25 years,
recurrent natural disasters and external price shocks, the country has managed to
maintain an average growth rate above 5 per cent in the post-1990 period, while growth
from 2004 to 2008 averaged 6.4 per cent. But this rate of growth has not been sufficient
to alleviate poverty in the more disadvantaged areas of the country, reduce economic
disparities and to improve employment conditions. Further, the provincial GDPs and their
growth rates vary widely across the country . The most affluent province is the Western
Province, the location of the capital, Colombo, accounts for nearly half of GDP.
According to the Department of Census and Statistics (2008), as measured by
headcount ratio, poverty declined from 26 per cent in 1990/91 to 15 per cent in 2006/07,
albeit with variance at the sub-national level. Despite marked improvements in this ratio
in the urban and rural sectors, in the estate sector, the ratio worsened during the same
period (from 20.5 per cent to 32.0 per cent). Around a quarter of the population is living
in poverty in the poorest provinces, while in others poverty levels are significantly lower.
Interprovincial disparities in poverty have widened over time, with poverty levels in the
less poor provinces (for example, Western and Southern Provinces) declining more
sharply than in others (for example, Uva, Sabaragamuwa and Central Provinces). There
is no time series data for Eastern Province and Northern Province, but because they
were affected by the 30-year armed conflict, recently concluded, they are likely to have
performed poorly.
1 Percentages are based on 1981 Department of Census and Statistics information. Although a census was conducted in 2001 it did not cover the districts of Jaffna, Mannar, Vavunia, Mullativu, Killinochchi, Batticaloa and Trincomalee. 2 Any tea, rubber or coconut cultivation with ten or more resident workers is referred to as the estate sector. 3 These statistics should be treated with caution for several reasons. First, the 2001 Census was complete only in 18 districts. Due to the prevailing conflict situation, the census could only be partly completed in the Northern and Eastern Provinces. Second, due to changes in the administrative make-up, town councils (considered urban) were abolished and their administration given to Pradesheeya Sabhas (considered rural). As a result, the urban sector is underestimated in the 2001 census (DCS, 2006).

2.0 Overview of education and health sectors
2.1 Education
2.1.1 The Organization and the Structure of the Education System in Sri Lanka
General education, for children aged 5 to 18 years, is organized into four cycles: primary
(grades 1-5), junior secondary (grades 6-9), senior secondary (grades 10-11) and
collegiate (grades 12-13). Students face national exams in grade 5 (grade 5 scholarship
exam), at the end of grade 11 (Ordinary level exam or O-levels) and at the end of grade
13 (Advanced level exam or A-levels).
Under the 13th amendment to the constitution in 1987, education was devolved, with
more authority given to provinces in managing and supervision. The education
administration consists of five levels: The Ministry of Education at the centre, Provincial
Ministry/ Provincial Department of Education (PME), Zonal Education Offices, Divisional
Education Offices and schools. About 3 per cent of schools (324 in 2006) are denoted as
national schools, while the rest are called provincial schools. National schools are
governed directly by the Ministry of Education and provincial schools are governed by
respective PMEs.
According to the terminal, grade schools are categorized into four types: 1AB, 1C, Type
2 and Type 3. 1AB and 1C schools have classes up to A-levels. The main difference
between these two types of schools is that, at A-levels 1AB schools offer all subject
streams, while 1C schools only offer subjects in the arts and commerce streams. Type 2
schools offer classes up to O-levels, and Type 3 schools offer classes up to grade 5. In
the majority of schools the medium of instruction is either Sinhala or Tamil, the two main
languages.
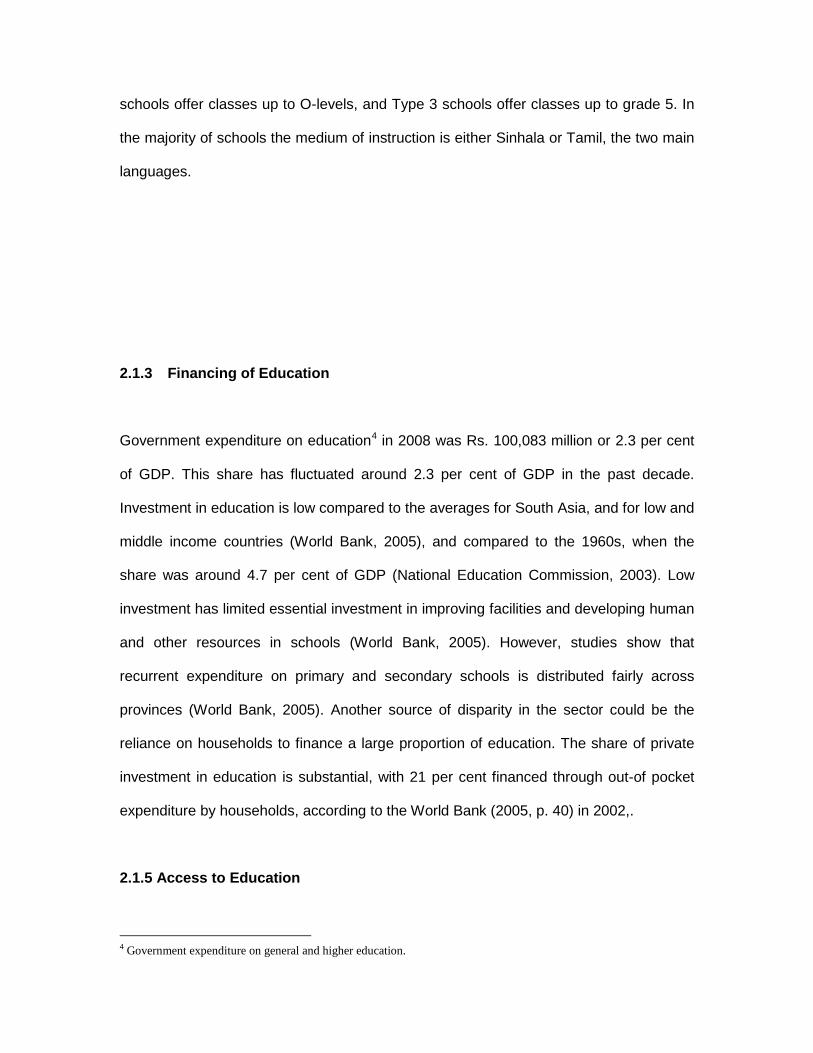
2.1.3 Financing of Education
Government expenditure on education4 in 2008 was Rs. 100,083 million or 2.3 per cent
of GDP. This share has fluctuated around 2.3 per cent of GDP in the past decade.
Investment in education is low compared to the averages for South Asia, and for low and
middle income countries (World Bank, 2005), and compared to the 1960s, when the
share was around 4.7 per cent of GDP (National Education Commission, 2003). Low
investment has limited essential investment in improving facilities and developing human
and other resources in schools (World Bank, 2005). However, studies show that
recurrent expenditure on primary and secondary schools is distributed fairly across
provinces (World Bank, 2005). Another source of disparity in the sector could be the
reliance on households to finance a large proportion of education. The share of private
investment in education is substantial, with 21 per cent financed through out-of pocket
expenditure by households, according to the World Bank (2005, p. 40) in 2002,.
2.1.5 Access to Education
4 Government expenditure on general and higher education.

Table 1 provides time trends in national enrolment rates for different education cycles.5
Given that data is not comparable it is difficult to comment on these statistics for all
years. In general, enrolment rates seem to have stagnated at the primary level and
improved initially at the junior secondary levels, while they have declined at the senior
secondary and collegiate levels. These results are of concern given that the country is
striving to achieve universal education at the compulsory education cycle (primary and
junior secondary school cycles) (Arunatilake, 2006).
Table 1. Time Trends in Net Enrolment Rates in Major Education Cycles 1996/97 2003/04 2006/07
Net primary enrolment (grades 1-5) % 97.0 96.7 96.5
Net junior secondary enrolment (grades 6-9) % 84.2 91.5 88.2
Net senior secondary enrolment (grd 10-11) % 62.6 73.6 54.5
Net collegiate level enrolment (grd 10-11) % 13.8 28.3 19.8
Note: The calculations used the following definition as used by UNESCO: Enrolment of the official age group for a given level of education expressed as a percentage of the corresponding population. Calculations using CFS 1996/97 and CFS 2003/04 are approximate values calculated using age at time of survey. HIES 2006/07 data are more accurate as in this survey information on survey dates and birthdates of children are available.
Source: Own Calculations using CFS 1996/97, CFS 2003/04 and HIES 2006/07 data.
2.1.6 Education Achievement
Despite good access to education, especially at the primary level, improving equity in
access to good quality and relevant education opportunities has been a challenge for the
sector for several decades (NEC, 2003). Several recent policy documents on education
highlight the need to upgrade quality of education. Despite high access rates,
5 As indicated in a footnote, these trends are not exactly comparable because 2006/07 data comes from HIES 2006/07, while data for the other two years come from CFS 1996/07 and CFS 2003/04. HIES is conducted by the Department of Census and Statistics , while the CFS is conducted by the Central Bank of Sri Lanka.

educational outcomes of students at all levels have room for improvement (NEC, 2003;
World Bank, 2005).
Table 2. Completion Rates1 in Major Education Cycles (2006/07) Grade 5 Grade 9 Grade 11
by class2 Poorest quintile 73.4 61.2 22.6 2nd quintile 81.3 69.2 35.4 3rd quintile 85.0 71.7 32.8 4th quintile 82.2 76.6 47.3 Richest quintile 87.4 75.4 60.6
by gender Male 81.9 67.7 35.3 Female 80.8 73.3 42.9
by sector Estate 64.2 46.1 7.9 Rural 83.3 74.5 42.7 Urban 84.9 72.0 42.3
by province Western 80.7 69.2 41.8 Central 79.4 75.3 33.1 Southern 86.3 74.8 45.5 Northern n.a. n.a. n.a. Eastern n.a. n.a. n.a. North-Western 82.8 69.9 28.8 North-Central 89.9 78.4 37.4 Uva 71.0 55.8 28.4 Sabaragamuwa 79.3 67.2 45.1 Sri Lanka 81.4 70.5 39.1 1 Completion rate is defined as follows: percentage of children in the official age group completing the education cycle. 2 Consumption quintiles. n.a. = non-availability of data. Source: Own Calculations using HIES 2006/07 data
Table 2 shows completion rates for major education cycles.6 As seen, almost a fifth of
the children do not complete primary education at the appropriate age. Further, there are
wide disparities in school completion rates across class, gender, sector and provinces,
with poor males in the estate sector performing worst. Completion rates are lower for
higher school cycles, and their disparities are also wider. The data suggests that
6 It is not possible to examine time trends in these indicators as earlier household survey data do not contain the necessary information for accurate calculations.

particular attention should be given to improving school cycle completion amongst
poorer groups, males and those in the estate sector. These disparities in school cycle
completion rates, especially at higher education cycles, are reflected in the O-level and
A-level success rates. While more than two-thirds of children in the richest quintile pass
O-levels, a similar proportion in the poorest quintile either never takes the exam or does
not pass. Similar disparities are seen in A-level success rates.
2.2 Health
2.2.1 Organization, Structure, and Decentralization7
The public health sector is managed at two levels: (i) the Ministry of Health (MOH) at the
center; and, (ii) by the Provincial Ministries of Health (PMOHs) at the provinces. Initially,
all teaching hospitals and hospitals established for special purposes (for example, a
cancer hospital) came under the MOH and the rest, including provincial hospitals, came
under PMOHs. In the past ten years, however, the MOH took over management of
several provincial hospitals and district general hospitals, thereby re-centralizing
management. In 1992, divisional secretariats and divisional directors of health services
(DDHS) were introduced as an organizational framework for implementing provincial
functions. The PMOHs establish and maintain hospitals and dispensaries other than
those under the MOH. However, some vital functions such as manpower management
are still largely in the hands of the MOH. In general, lack of capacity is a central issue in
the provincial system with respect to planning and management.
2.2.2 Main Sources of Financing
7 This section borrows heavily from Arunatilake et al. (2009)

Total national expenditure on health in 2008 was Rs.176, 982 million or 4 per cent of
GDP and has increased steadily over the past decade. The government contribution in
that time has fluctuated around 45 per cent, while the rest came from private sources.8
In 2008, 7.6 per cent of government expenditure was spent on health. 9 Nearly 90 per
cent of private contributions are out-of-pocket; the remainder comprises insurance
schemes and non-government organizations (Arunatilake, et al. 2009).
2.3 Health Outcome Indicators
2.3.1 General Trends in Health Outcome Indicators
According to traditional indicators for measuring health, health status has improved. The
infant mortality rate per thousand live births dropped substantially from 17.7 in 1991 to
11.3 in 2003 (Department of Census and Statistics, 2008), and life expectancy at birth
improved to 71.7 for males and to 76.4 for females (Central Bank of Sri Lanka, 2008).
The prevalence of some communicable diseases has also been reduced, although other
communicable diseases such as dengue hemorrhagic fever and HIV/AIDS continue to
trouble the system (Arunatilake, et al., 2009). Health status at present is gradually
moving toward an era in which non-communicable diseases are dominant. For example,
the prevalence of diabetes, hypertensive disease, ischaemic heart disease and asthma
has steadily increased since 2000 (Arunatilake, et al., 2009). Another area of concern for
policy makers is malnutrition. Jayawardena (2009) finds that malnutrition affects one out
of five under-five year olds and one out of six reproductive age females.
8 Based on data from www.who.int/nha/en/ assessed 27 September 2010. 9 Ibid.

But systematically collected information on non-communicable diseases is not available,
and hence we intend to concentrate on child and maternity related health outcomes in
this analysis. The next section provides general trends in these health outcomes.
2.3.2 Child and Maternity Related Health Outcome Indicators
Table 3 gives health related outcome indicators (these are described in detail in section
3.3.1). As seen, for the country as a whole, outcomes related to child nutrition (that is,
height-for-age, weight-for-age and weight-for-height) has increased only marginally over
the two years for which data is available. The number of newborns with minimum birth-
weight has declined marginally over the years. These health outcomes are in general
better in urban areas, but relative to the other two sectors have deteriorated more in
urban areas over the two years. In contrast to trends in child health outcomes, maternal
health outcome indicators have improved over time. Both child and maternal health
outcomes are worst in the estate sector, although they have improved for most
indicators.
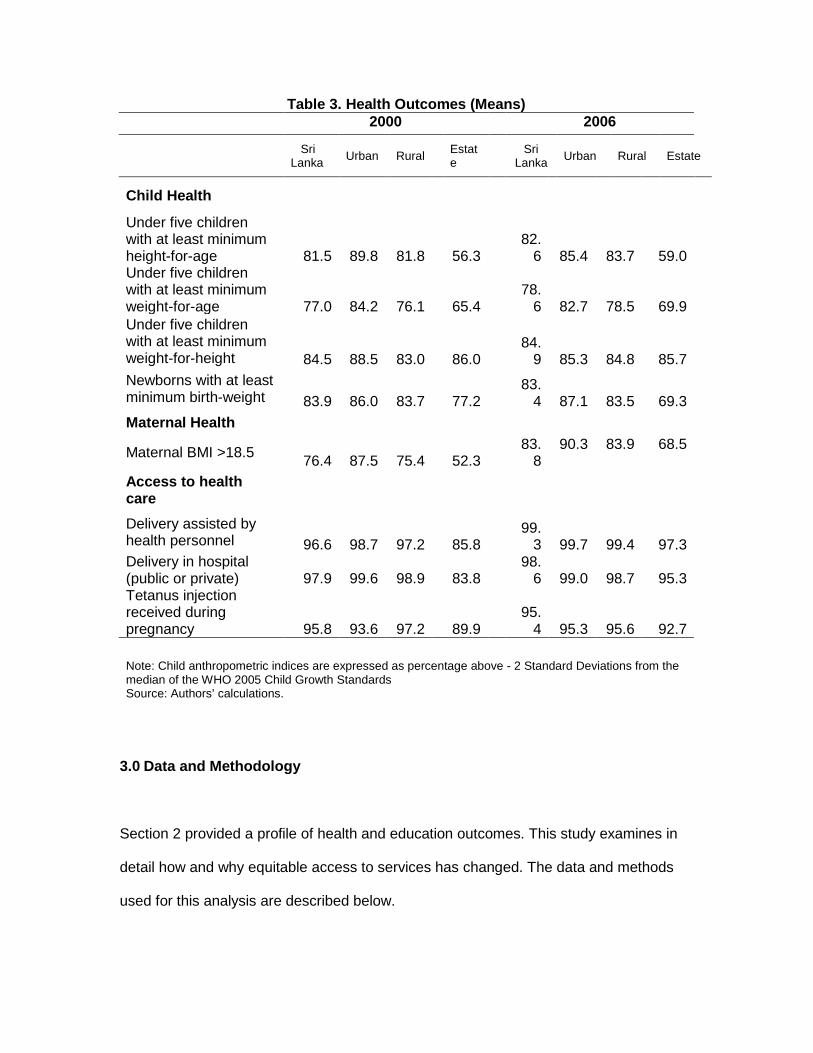
Table 3. Health Outcomes (Means) 2000 2006 Sri
Lanka Urban Rural Estate Sri
Lanka Urban Rural Estate
Child Health
Under five children with at least minimum height-for-age 81.5 89.8 81.8 56.3
82.6 85.4 83.7 59.0
Under five children with at least minimum weight-for-age 77.0 84.2 76.1 65.4
78.6 82.7 78.5 69.9
Under five children with at least minimum weight-for-height 84.5 88.5 83.0 86.0
84.9 85.3 84.8 85.7
Newborns with at least minimum birth-weight 83.9 86.0 83.7 77.2
83.4 87.1 83.5 69.3
Maternal Health
Maternal BMI >18.5 76.4 87.5 75.4 52.3 83.
8 90.3 83.9 68.5
Access to health care Delivery assisted by health personnel 96.6 98.7 97.2 85.8
99.3 99.7 99.4 97.3
Delivery in hospital (public or private) 97.9 99.6 98.9 83.8
98.6 99.0 98.7 95.3
Tetanus injection received during pregnancy 95.8 93.6 97.2 89.9
95.4 95.3 95.6 92.7
Note: Child anthropometric indices are expressed as percentage above - 2 Standard Deviations from the median of the WHO 2005 Child Growth Standards Source: Authors’ calculations.
3.0 Data and Methodology
Section 2 provided a profile of health and education outcomes. This study examines in
detail how and why equitable access to services has changed. The data and methods
used for this analysis are described below.

3.1 Data
The methodology we adopted requires information on income and expenditure of
households along with access to services and education and health outcomes across
time. Since such data is not available from one source, we had to use several sources of
data.
The data for the education sector analysis come mainly from two household level
surveys: 1) Consumer Finance and Socio Economic Survey carried out by the
Central Bank of Sri Lanka (CBSL) during 1996/97 (CFS 1996/97) and 2003/04
(CFS 2003/04) and, 2) The Household Income and Expenditure Survey (HIES
2006/07) carried out by the Department of Census and Statistics (DCS). Using two
sources of data makes it difficult to compare results across time. However, as the latest
CFS data is for 2003/04 period and as the earlier versions of HIES did not contain
detailed information on education, we are compelled to use these two sources of data for
the analysis.
The information for the health sector analysis comes form the Demographic and Health
Survey (DHS 2000 and 2006/7) conducted by the DCS. This survey focuses on
collecting nationally representative information on maternal and child health issues. One
shortcoming in this survey for our purposes is its lack of income and expenditure data.
Thus, for the health sector analysis we have used an asset index using principal
component analysis to rank households. Details on how this was constructed are given
in Jayawardena (2010). Expenditure on health care is obtained from HIES data.
3.3 Methodology

3.3.1 Definitions and indicators used in the analysis
The concept of equity assumes that households have the same opportunities, whatever
their socio-economic status. This is still a broad definition as the level of opportunity can
be measured by a variety of indicators and the socio-economic status can be measured
along several dimensions.
This study will specifically consider the equity of opportunity in resources, access and
outcomes as described below. Indicators used for education include:
a) Access to education (school enrolments at different cycles of schooling).
b) Education outcomes (completion of school cycles).
c) The progressivity of out-of-pocket expenditure on education.
Access to school was measured by net enrolment for different education cycles. The net
enrolment rate is defined as the percentage of children of the official age group in school
for a given level of education (UNESCO, 2010). The official age groups for primary and
junior secondary are 5-10 and 11-14, respectively. Quality of education was measured
using completion of different school cycles by the official age group. Following MOE
(2008), school completion is the proportion of children in the corresponding age group
completing the relevant school cycle by official age. For example, officially, children who
complete 10 years by end of January in a particular year should have completed their
primary education by the end of previous year.
Indicators used for health include:

a) Access to health care (delivery in a medical institution, delivery assisted by a
health personnel, receiving a tetanus injection during pregnancy).
b) Health outcomes of mothers (body mass index of mothers).
c) Health outcomes of children (Anthropometric measures of children under five
(that is, height-for-age, weight-for-age and weight-for-height and birth weight).
d) The progressivity of out-of-pocket expenditure on health.
Although there are a variety of important health indicators, we have narrowed our
analysis to child and mother-related health indicators given data availability. In our
analysis access to health institutions is measured by the ability to access a health
institution for delivering a child. A health institute is considered to be any kind of
government or private hospital or maternity home. Access to a qualified ‘health person’
is measured by the receipt of assistance by health personnel during delivery. Doctors,
nurses, midwives and assistant midwives are considered qualified health persons
(Gwatkin et. al., 2000). Receiving a tetanus injection during pregnancy is considered an
important means of prenatal care, as it prevents infections during delivery. We use this
as an indicator of access to prenatal care. The indicator gives the proportion of women
receiving the tetanus injection during the most recent birth as a percentage of all women
who have given birth in the last five years. In addition to these access related indicators,
we use several indicators to measure the nutritional levels of mother and children. The
nutritional level of mothers is measured by their body mass index10 and of children by
the anthropometric measures of children under five: height-for-age, weight-for-age and
weight-for-height (International Food Policy Research Institution, 2003; Jayawardena,
10 BMI, an indicator commonly used in health, is the weight in kilograms divided by the square of the height in meters (km/m2). An adult with BMI below 18.5 is considered acutely undernourished (Jayawardena, 2009).
2009). Birth weight of new-born babies is also used as a measure of prenatal care
received.11
Given data availability, the equity in access to opportunity will be measured across class
(income levels) and provinces for education and across sectors (urban, rural, estate) for
health.
3.3.2 Analysis of equity in education and health outcomes and change over time
Following Ali and Son (2007), the study constructs opportunity curves for the population
for the years where data is available to assess the equity-impacts of access to education
and health opportunities. In order to quantify the precise magnitude of the change, again
following Ali and Son (2007), we also calculate the opportunity index (OI) and the equity
index of opportunity (EIO).12 The study will focus on assessing the equity in opportunities
using the access and outcome indicators described above. We then use probit analysis
to assess the reasons for disparities in access to services.
3.3.3 Incidence of out-of-pocket expenditure on education
Households incur out-of-pocket costs when using a service. The benefits from public
education can be greater for those households able to complement these services by
out-of-pocket spending. Examining out-of-pocket spending per student in different
income groups can reveal whether there are other types of inequalities in the system
that affect health and education outcomes. The data on household expenditures on
education are available with the household surveys described above.
11 A new-born weighing at least 2,500 grams is considered to have an adequate birth-weight. 12 When everyone in the population enjoys the same opportunity OI is equal to y . Then the ratio between OI for a
particular opportunity curve and y provides an estimation of how opportunities are distributed across the population.
We examine the progressivity of out-of-pocket payments using information provided in
the HIES 2006/07 data. The government and other charitable sources also provide
education related welfare items to households (such as text books and uniforms); the
values of these items are excluded from the calculations.
4.0 Results
4.1 Results for Education Sector
4.1.1 Equity in Education Outcomes and Change Over Time
As stated earlier, the estimates for 2006/07 are not comparable with those for 1996/97
and 2003/04, as the data comes from different sources. For this reason, the
comparisons over time were only done for CFS 1996/97 and CFS 2003/04 data sets.
Figure 1a shows the opportunity curve for access to primary schooling. This suggests
that, although average opportunity has declined over time, the equity in access to
primary education may have increased (the 2003/04 curve is above the 1996/97 curve
for poorer households). The average opportunity for access to education has improved
for all other education cycles considered, over the 1996/97 to 2003/04 period (see
Figures 1b to 1d). Further, as seen by the opportunity curves, these improvements were
at all levels of income. The upward slope of the opportunity curve indicates that the
children from lower income groups have lower access to education at all levels of
education.
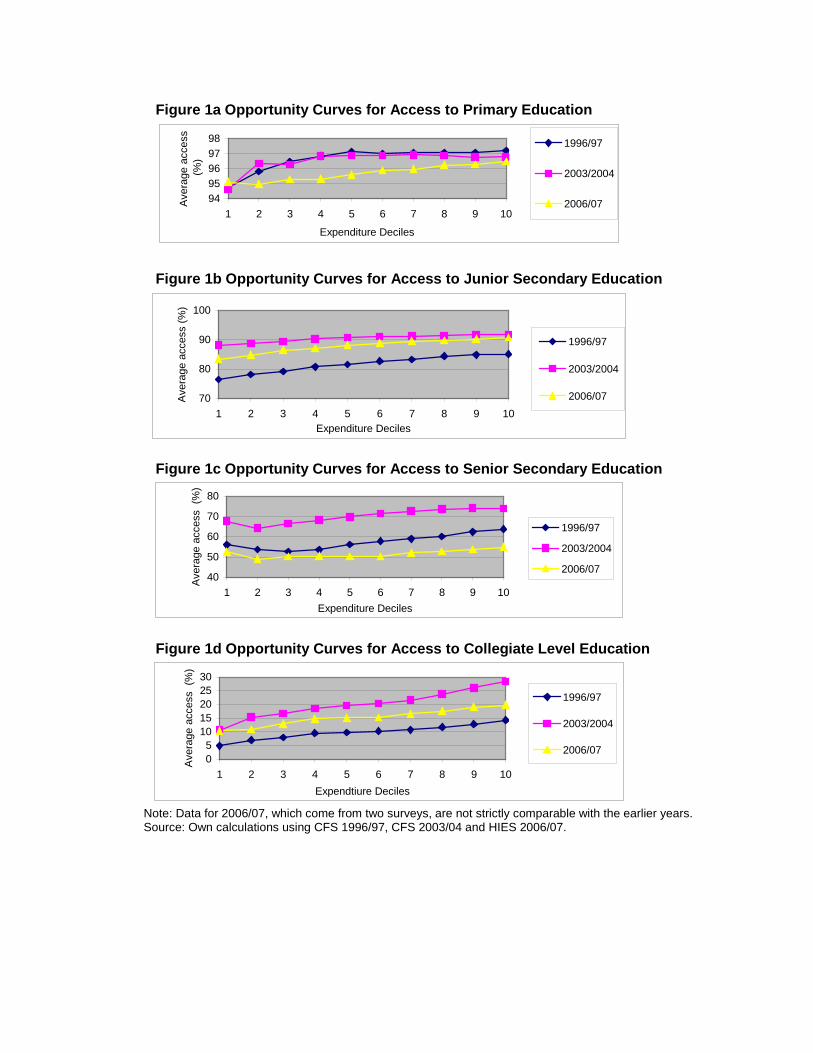
Figure 1a Opportunity Curves for Access to Primary Education
9495969798
1 2 3 4 5 6 7 8 9 10
Expenditure Deciles
Ave
rage
acc
ess
(%)
1996/97
2003/2004
2006/07
Figure 1b Opportunity Curves for Access to Junior Secondary Education
70
80
90
100
1 2 3 4 5 6 7 8 9 10Expenditure Deciles
Ave
rage
acc
ess
(%)
1996/97
2003/2004
2006/07
Figure 1c Opportunity Curves for Access to Senior Secondary Education
40
50
60
70
80
1 2 3 4 5 6 7 8 9 10Expenditure Deciles
Ave
rage
acc
ess
(%)
1996/97
2003/2004
2006/07
Figure 1d Opportunity Curves for Access to Collegiate Level Education
05
1015202530
1 2 3 4 5 6 7 8 9 10Expendtiure Deciles
Ave
rage
acc
ess
(%)
1996/97
2003/2004
2006/07
Note: Data for 2006/07, which come from two surveys, are not strictly comparable with the earlier years. Source: Own calculations using CFS 1996/97, CFS 2003/04 and HIES 2006/07.

Overall, the equity of opportunity index (EOI) for school access is below one for all
school cycles in 2006/07, indicating that equity can be further improved at all levels.
However, on the positive side, the EOI improved over the 1996/97 to 2003/04 period,
indicating that growth has been equitable during this period. The improvements in equity
are largest for the senior secondary level followed by the junior secondary level (Table
4). As shown in Table 4, school completion rates are also not equitable for all school
cycles, and the equitability of school completion decreases for higher school cycles. It is
particularly low for the senior secondary level.
Table 5 shows the equity indices for different provinces. Uva and Sabaragamuwa
Provinces are the worst performing in terms of equity in school participation.13 The
opportunity for school participation is equitable only in the North Central Province. This is
true for both primary and junior secondary levels. Equity in opportunity for school
participation is worst in the Sabaragamuwa Province at both the primary and the junior
secondary levels. An interesting finding of this analysis is that even in Western Province,
the wealthiest, equity in opportunity is lower than the national average at the junior
secondary level (the EOI is 0.943 for the Western Province compared to 0.963 for the
country).
For 2006/07 the EOI in school completion is below one for all school cycles and equity in
school completion decreases with higher school cycles. The opportunity index (OI) for
school completion is also far below hundred and this decreases sharply with higher
school cycles. The OI of school completion is at 70.49 at the primary cycle while it drops
to 21.63 at the senior secondary cycles. These statistics show that although growth in 13 The province level values for various equity indices are calculated using provincial level expenditure deciles for each province.

access to education has been equitable, the opportunity for school completion is low,
especially at higher school cycles.14
14 Although an attempt was made to calculate various equity indices at the provincial level for school completion, the results are not reliable as the sample sizes at the provincial level are very small.
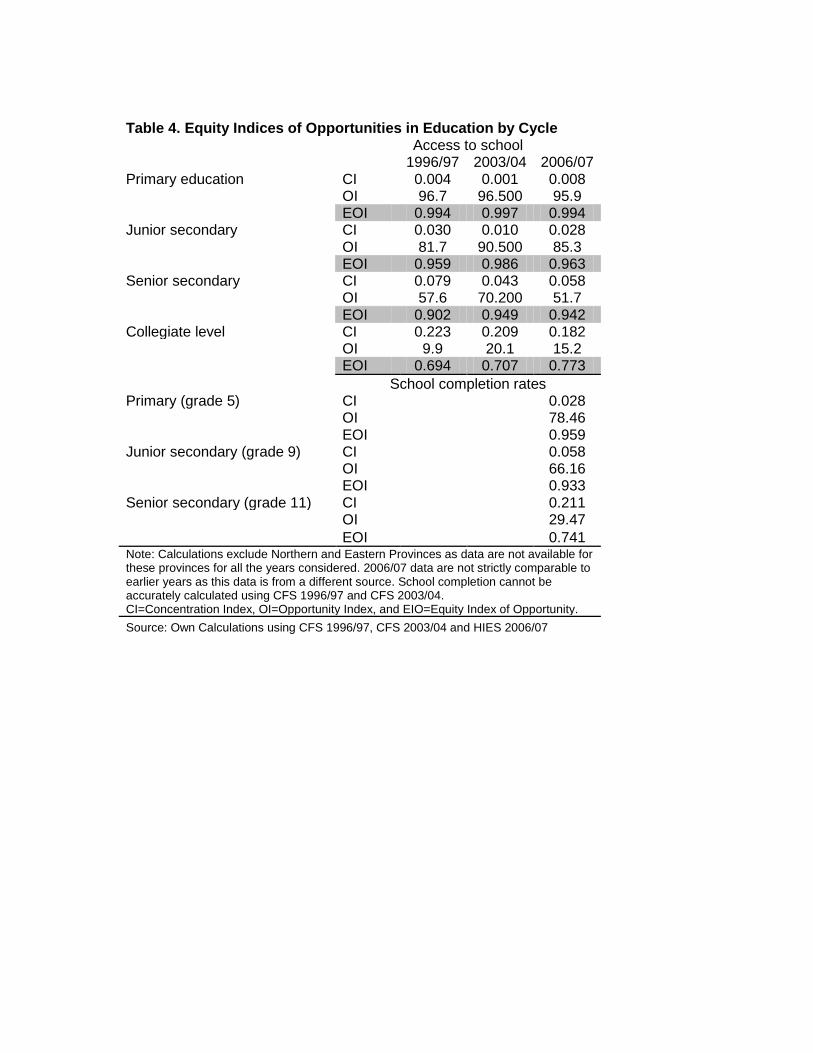
Table 4. Equity Indices of Opportunities in Education by Cycle Access to school 1996/97 2003/04 2006/07 Primary education CI 0.004 0.001 0.008 OI 96.7 96.500 95.9 EOI 0.994 0.997 0.994 Junior secondary CI 0.030 0.010 0.028 OI 81.7 90.500 85.3 EOI 0.959 0.986 0.963 Senior secondary CI 0.079 0.043 0.058 OI 57.6 70.200 51.7 EOI 0.902 0.949 0.942 Collegiate level CI 0.223 0.209 0.182 OI 9.9 20.1 15.2 EOI 0.694 0.707 0.773 School completion rates Primary (grade 5) CI 0.028 OI 78.46 EOI 0.959 Junior secondary (grade 9) CI 0.058 OI 66.16 EOI 0.933 Senior secondary (grade 11) CI 0.211 OI 29.47 EOI 0.741 Note: Calculations exclude Northern and Eastern Provinces as data are not available for these provinces for all the years considered. 2006/07 data are not strictly comparable to earlier years as this data is from a different source. School completion cannot be accurately calculated using CFS 1996/97 and CFS 2003/04. CI=Concentration Index, OI=Opportunity Index, and EIO=Equity Index of Opportunity. Source: Own Calculations using CFS 1996/97, CFS 2003/04 and HIES 2006/07
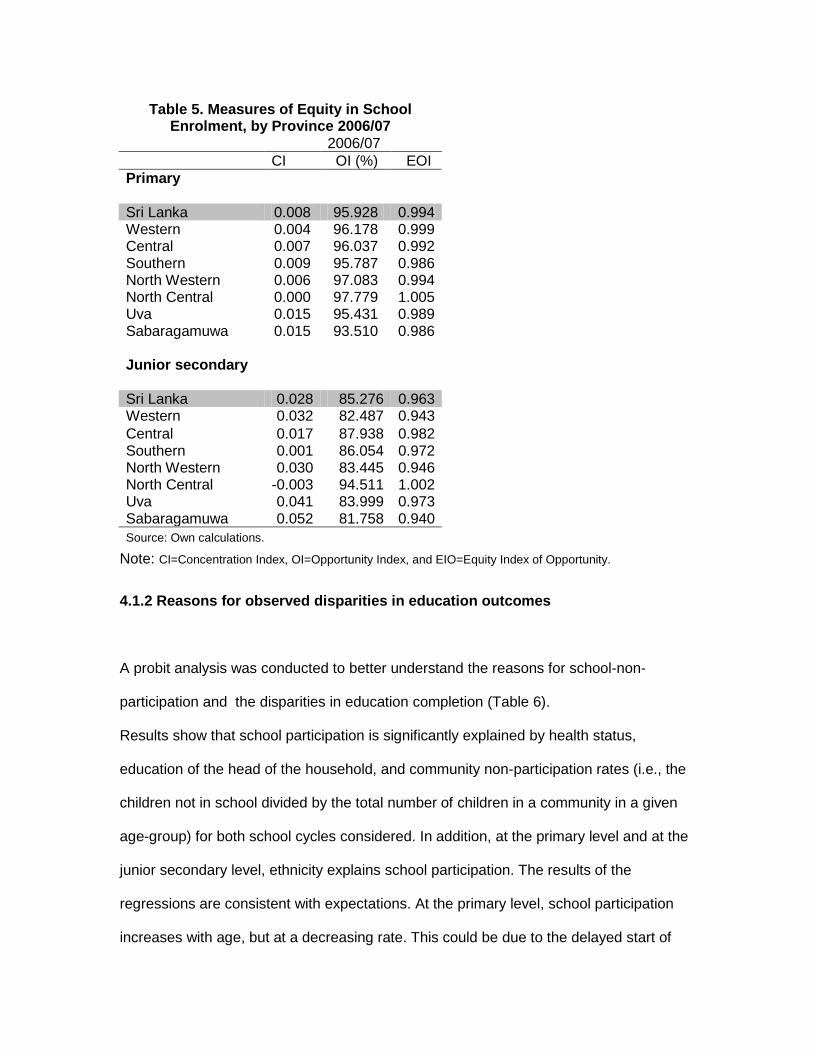
Table 5. Measures of Equity in School Enrolment, by Province 2006/07
2006/07 CI OI (%) EOI Primary Sri Lanka 0.008 95.928 0.994 Western 0.004 96.178 0.999 Central 0.007 96.037 0.992 Southern 0.009 95.787 0.986 North Western 0.006 97.083 0.994 North Central 0.000 97.779 1.005 Uva 0.015 95.431 0.989 Sabaragamuwa 0.015 93.510 0.986 Junior secondary Sri Lanka 0.028 85.276 0.963 Western 0.032 82.487 0.943 Central 0.017 87.938 0.982 Southern 0.001 86.054 0.972 North Western 0.030 83.445 0.946 North Central -0.003 94.511 1.002 Uva 0.041 83.999 0.973 Sabaragamuwa 0.052 81.758 0.940 Source: Own calculations.
Note: CI=Concentration Index, OI=Opportunity Index, and EIO=Equity Index of Opportunity.
4.1.2 Reasons for observed disparities in education outcomes
A probit analysis was conducted to better understand the reasons for school-non-
participation and the disparities in education completion (Table 6).
Results show that school participation is significantly explained by health status,
education of the head of the household, and community non-participation rates (i.e., the
children not in school divided by the total number of children in a community in a given
age-group) for both school cycles considered. In addition, at the primary level and at the
junior secondary level, ethnicity explains school participation. The results of the
regressions are consistent with expectations. At the primary level, school participation
increases with age, but at a decreasing rate. This could be due to the delayed start of

schooling. As expected, disability and chronic illnesses are significant reasons for school
non-participation in both school cycles. The marginal effects15 for this variable were
relatively large for both age groups considered. School participation was lower for
children of all other ethnic groups relative to that of Sinhalese at 11-14 years old. School
participation did not vary across different income levels. The education level of parents
has a significant effect on school participation, especially at higher school cycles. This
indicates that more than income, the lower know-how and interest of parents may be
affecting school participation. Lastly, other than for individual and household level
factors, children from communities with high dropout rates were significantly more likely
to not participate in schooling.16 As shown by marginal effects, this effect is relatively
large, indicating that special attention should be given to improve school participation in
communities with low participation rates.
The results for school completion show that ethnicity and living in a community with low
school participation rate affects school completion at both the primary and the junior
secondary levels. In addition health and being poor negatively affected school
completion at the primary level, and being male, and not living in a household headed by
a public servant negatively affected school completion at the junior secondary level.
These results indicate in general that community related factors that affect both the
demand (for example, remoteness, alcoholism, violence, poverty, etc.) and the quality of
supply (for example, availability of teachers, school facilities, etc.) of education and the
opportunity cost of schooling are factors affecting school completion.
15 Not reported, available upon request. 16 In calculating community drop-out rates, leave-out means were used (following a method adopted by Lanjouw and Ravallion, 1999) to avoid biases caused by implicitly including the dependent variable to calculate an independent variable.

Table 6. Factors Affecting School Participation for Different Age Groups (Probit Regressions) 4 School participation School completion Age 5-10 Age 11-14 Grade 5 Grade 9
Male 0.03 -0.02 0.10 -0.24 ** Age 2.60 *** 0.83 Age2 -0.16 *** -0.05 Disabled/Chronic illness -1.11 *** -1.08 *** -0.57 ** -0.27
Ethnicity (Sinhalese)1 Tamil -0.26 -0.76 *** -0.80 *** -0.72 *** Moor and other -0.10 -0.67 *** -0.42 ** -0.29 *
Expenditure quintile (richest) Poorest quintile -0.06 -0.22 -0.50 ** 0.21 2nd quintile -0.06 -0.02 -0.19 0.26 * 3rd quintile -0.06 -0.06 -0.02 0.17 4th quintile -0.16 0.09 -0.18 0.13
Employment of head of hh (Public) Private -0.03 -0.07 0.14 -0.39 ** Self employed 0.07 0.02 -0.04 -0.36 ** Not working -0.09 -0.07 0.09 -0.33 *
Education of head of hh (Above secondary) Less than primary -0.31 * -1.00 *** -0.10 -0.22 Less than secondary -0.10 -0.60 ** 0.20 0.01
Community Characteristics Direct cost (monthly 100s of rupees) 0.00 0.00 -0.01 0.01 Indirect cost (monthly 100s rupees) -0.02 0.02 0.03 -0.01 Time to primary school3 -0.07 -0.05 Time to secondary school3 -0.03 -0.04 Not in school rate2 -2.88 *** -2.10 *** -1.53 ** -2.32 ***
N 7,996 5,552 1,355 1,457 Pseudo R2 0.27 0.29 0.08 0.09 1 Base category given in parentheses. 2 Community level drop-out rate is adjusted for drop-outs, such that leave-out means are used in the calculation. Rates are calculated for relevant age groups separately. 3 In tens of minutes. 4 Controls for residence at province level and sector level were included in the regression. Statistical significance at 1,5 and 10 percent confidence levels are indicated by '***', '**' and *. Note: hh=Household Source: Own Calculations using HIES 2006/07 data.

4.1.3 Results - Incidence of Out-of-pocket Expenditure on Education
Table 7. Household Out-of-pocket Expenditure (monthly) on Education and Health
Household Consumption /Expenditure (Rs.) (A)
Out-of-Pocket Payments on Education (Rs.) (B)
Out-of-Pocket Payments on Health (Rs.) (C )
Exp on Education as a per cent of total hh exp
Exp on Health as a per cent of total hh exp
Poorest 10% 9,797 280 270 2.9 2.8 2 11,867 354 364 3 3.1 3 13,503 398 451 2.9 3.3 4 15,889 489 548 3.1 3.4 5 17,590 574 537 3.3 3.1 6 20,559 673 728 3.3 3.5 7 24,192 820 708 3.4 2.9 8 29,016 950 913 3.3 3.1 9 36,626 1,337 1,155 3.7 3.2 Richest 10% 66,039 2,050 1,692 3.1 2.6 All 24,019.59 775.59 723.91 3.2 3.0
Source: Own calculations using HIES 2006/07 data.
Note: hh=household , exp=expenditure, Rs.=Rupees.
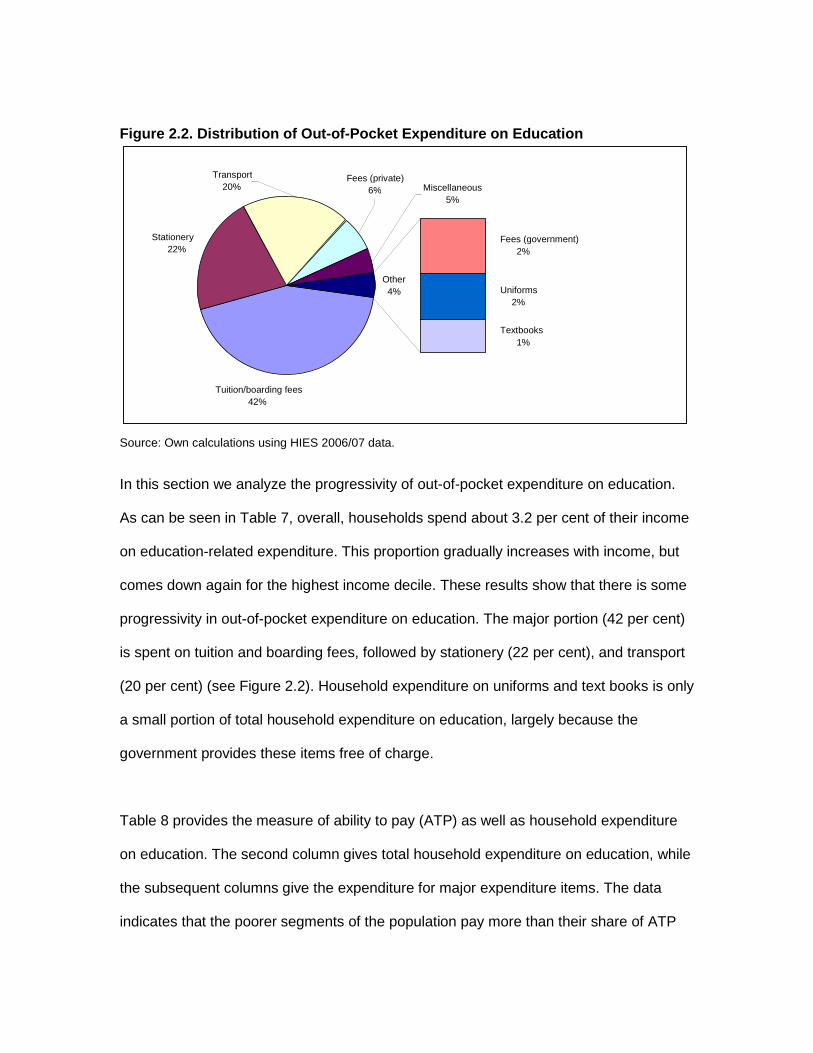
Figure 2.2. Distribution of Out-of-Pocket Expenditure on Education
Source: Own calculations using HIES 2006/07 data.
In this section we analyze the progressivity of out-of-pocket expenditure on education.
As can be seen in Table 7, overall, households spend about 3.2 per cent of their income
on education-related expenditure. This proportion gradually increases with income, but
comes down again for the highest income decile. These results show that there is some
progressivity in out-of-pocket expenditure on education. The major portion (42 per cent)
is spent on tuition and boarding fees, followed by stationery (22 per cent), and transport
(20 per cent) (see Figure 2.2). Household expenditure on uniforms and text books is only
a small portion of total household expenditure on education, largely because the
government provides these items free of charge.
Table 8 provides the measure of ability to pay (ATP) as well as household expenditure
on education. The second column gives total household expenditure on education, while
the subsequent columns give the expenditure for major expenditure items. The data
indicates that the poorer segments of the population pay more than their share of ATP
Stationery 22% Fees (government)
2%
Uniforms 2%
Textbooks 1%
Transport 20%
Tuition/boarding fees 42%
Miscellaneous 5%
Other 4%
Fees (private) 6%
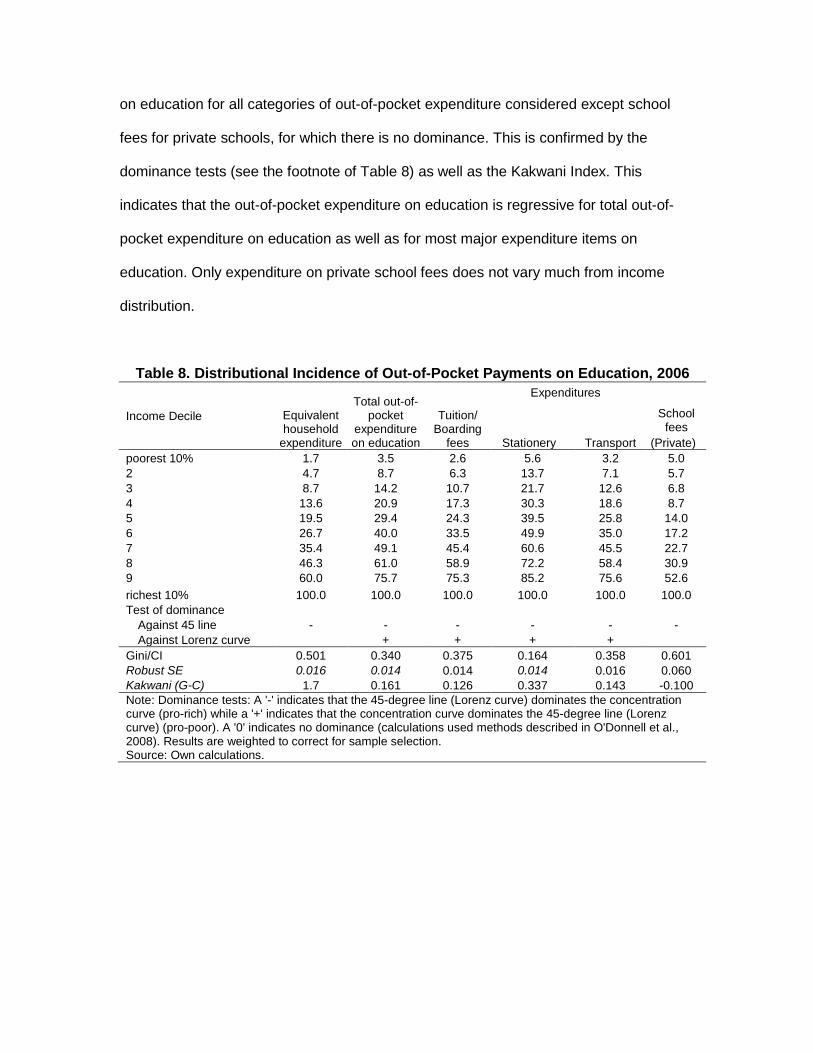
on education for all categories of out-of-pocket expenditure considered except school
fees for private schools, for which there is no dominance. This is confirmed by the
dominance tests (see the footnote of Table 8) as well as the Kakwani Index. This
indicates that the out-of-pocket expenditure on education is regressive for total out-of-
pocket expenditure on education as well as for most major expenditure items on
education. Only expenditure on private school fees does not vary much from income
distribution.
Table 8. Distributional Incidence of Out-of-Pocket Payments on Education, 2006
Income Decile Equivalent household
expenditure
Total out-of-pocket
expenditure on education
Expenditures
Tuition/ Boarding
fees
Stationery Transport
School fees
(Private) poorest 10% 1.7 3.5 2.6 5.6 3.2 5.0 2 4.7 8.7 6.3 13.7 7.1 5.7 3 8.7 14.2 10.7 21.7 12.6 6.8 4 13.6 20.9 17.3 30.3 18.6 8.7 5 19.5 29.4 24.3 39.5 25.8 14.0 6 26.7 40.0 33.5 49.9 35.0 17.2 7 35.4 49.1 45.4 60.6 45.5 22.7 8 46.3 61.0 58.9 72.2 58.4 30.9 9 60.0 75.7 75.3 85.2 75.6 52.6 richest 10% 100.0 100.0 100.0 100.0 100.0 100.0 Test of dominance
Against 45 line - - - - - - Against Lorenz curve + + + +
Gini/CI 0.501 0.340 0.375 0.164 0.358 0.601 Robust SE 0.016 0.014 0.014 0.014 0.016 0.060 Kakwani (G-C) 1.7 0.161 0.126 0.337 0.143 -0.100 Note: Dominance tests: A '-' indicates that the 45-degree line (Lorenz curve) dominates the concentration curve (pro-rich) while a '+' indicates that the concentration curve dominates the 45-degree line (Lorenz curve) (pro-poor). A '0' indicates no dominance (calculations used methods described in O'Donnell et al., 2008). Results are weighted to correct for sample selection. Source: Own calculations.

4.2 Results for the Health Sector
4.2.1 Equity in Health Outcomes and Change Over time
4.2.1.1. Access to Health Services
Opportunity for access to medical institutions and for medical personnel is high, and has
improved. The opportunity to receive a tetanus injection at pregnancy is also high,
although less than for the earlier two indicators considered. Moreover, it has declined
marginally over time, mainly due to a decline in the access to this service in rural areas.
Access to health services was found to be inequitable for all indicators considered.
However, equity in access to health personnel and health facilities has improved. In
contrast, at the national level, equity in access to a tetanus injection has declined, mainly
due the decline in the equitable access to this service in the rural and estate sectors.
4.2.1.2 Child and maternal nutrition
Child and maternal nutrition was assessed using several indicators as described before.
The results for opportunity index shows that the nutritional levels amongst under five
children, new born babies and mothers have a lot of room for improvement.
At the national level equity in opportunities for nutrition has improved, except for a
marginal decline in the birth weight of newborns. However, at the sector level equity in
opportunity for different indicators has not improved for all indicators (see table 9). Some
indicators, such weight-for-age i in the estate sector, show large improvements, while
others such as newborn babies with minimum birth weight in the estate sector, show
large declines.
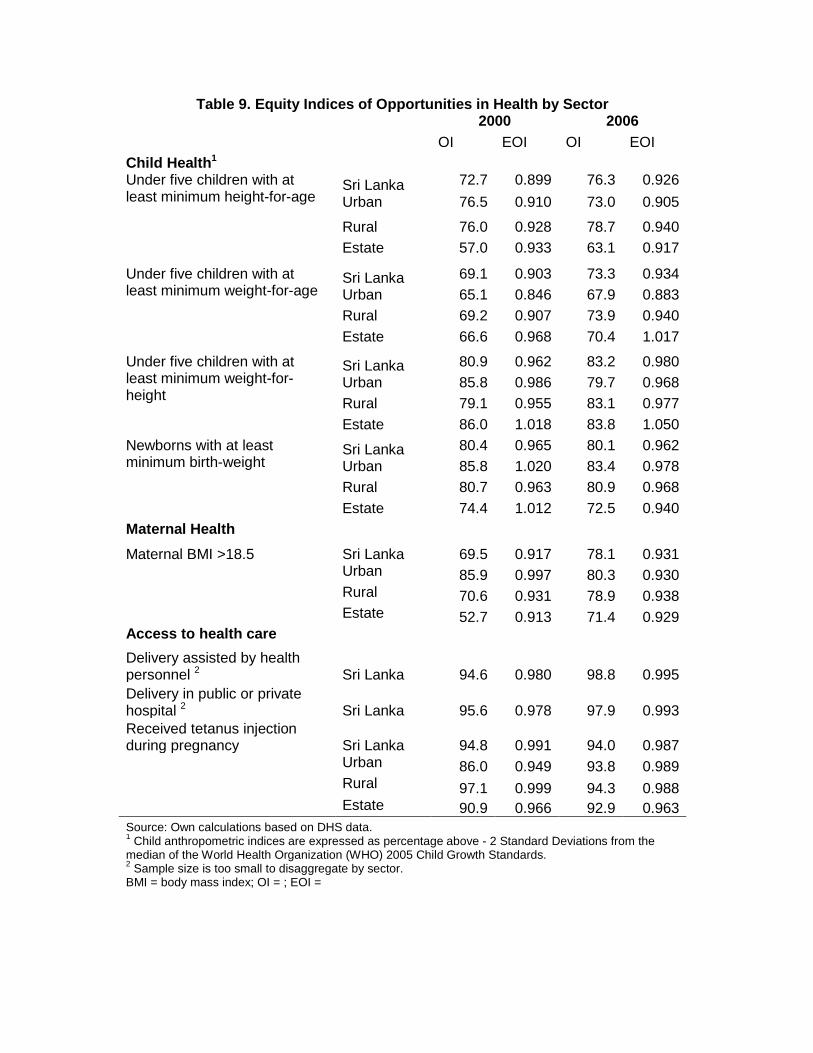
Table 9. Equity Indices of Opportunities in Health by Sector 2000 2006 OI EOI OI EOI Child Health1 Under five children with at least minimum height-for-age
Sri Lanka 72.7 0.899 76.3 0.926 Urban 76.5 0.910 73.0 0.905
Rural 76.0 0.928 78.7 0.940 Estate 57.0 0.933 63.1 0.917
Under five children with at least minimum weight-for-age
Sri Lanka 69.1 0.903 73.3 0.934 Urban 65.1 0.846 67.9 0.883 Rural 69.2 0.907 73.9 0.940 Estate 66.6 0.968 70.4 1.017
Under five children with at least minimum weight-for-height
Sri Lanka 80.9 0.962 83.2 0.980 Urban 85.8 0.986 79.7 0.968 Rural 79.1 0.955 83.1 0.977 Estate 86.0 1.018 83.8 1.050
Newborns with at least minimum birth-weight
Sri Lanka 80.4 0.965 80.1 0.962 Urban 85.8 1.020 83.4 0.978 Rural 80.7 0.963 80.9 0.968 Estate 74.4 1.012 72.5 0.940
Maternal Health
Maternal BMI >18.5 Sri Lanka 69.5 0.917 78.1 0.931 Urban 85.9 0.997 80.3 0.930 Rural 70.6 0.931 78.9 0.938 Estate 52.7 0.913 71.4 0.929 Access to health care Delivery assisted by health personnel 2 Sri Lanka
94.6
0.980
98.8
0.995
Delivery in public or private hospital 2 Sri Lanka 95.6 0.978 97.9 0.993 Received tetanus injection during pregnancy Sri Lanka 94.8 0.991 94.0 0.987 Urban 86.0 0.949 93.8 0.989 Rural 97.1 0.999 94.3 0.988 Estate 90.9 0.966 92.9 0.963 Source: Own calculations based on DHS data. 1 Child anthropometric indices are expressed as percentage above - 2 Standard Deviations from the median of the World Health Organization (WHO) 2005 Child Growth Standards. 2 Sample size is too small to disaggregate by sector. BMI = body mass index; OI = ; EOI =

4.2.2 Reasons for observed disparities in health outcomes
Table 10, reports the results of a probit regression looking at the determinants of the
malnutrition and low birth weight of children. As can be seen from statistically significant
results, with a large marginal effect, children of very poor and poor families are less likely
to have adequate nutrition. Children with low birth weight are more likely to have
nutritional deficiencies. The mother’s nutritional status has a negative effect on child
nourishment, while similar factors affect birth weight. Children whose mothers read
newspapers regularly also tended have better nutrition, indicating better awareness.
Results also indicate, meanwhile, that the education level of the mother and income
status are significant factors affecting access to health services (Table 11). In particular
poorer families had less access to qualified health personnel during delivery of a child.
Table 10. Factors Affecting Child Nutrition Status2
Variables Not-
Stunted
Not- Under weight
Not-Wasted
Adequate Birth
Weight Childs characteristics Child age (in months) -0.01 -0.10 *** -0.05 *** Male child -0.09 ** -0.06 -0.13 ** 0.16 *** Birth order of child -0.08 *** -0.06 ** -0.02 Low birth weight child -0.57 *** -0.71 *** -0.49 *** Child sick recently1 -0.01 -0.08 * -0.06 Twin birth -1.96 *** Mother's characteristics
Mother's education (Secondary completed) Primary schooling -0.17 * -0.12 -0.11 -0.12 Secondary schooling -0.08 -0.05 -0.01 0.03
Mother reads newspaper regularly 0.11 * 0.19 *** 0.09 0.14 ** Mother engage in an economic activity -0.08 -0.06 0.08 0.08 Mother's age at 1st child’s birth (25-34)
15-24 -0.07 0.00 0.05 -0.18 ***

35-49 0.07 -0.04 -0.27 ** -0.02 Mothers height (in cm) 0.05 *** 0.04 *** 0.00 0.03 *** Mother underweight (BMI) -0.09 -0.24 *** -0.30 *** -0.35 *** Household characteristics Number of people in the household -0.01 0.01 0.01 0.01 Number of children between 0 and 5 -0.01 0.04 0.02 0.13 *** Sector of residence (Urban)
Rural 0.10 0.01 0.06 -0.09 Estate -0.28 ** 0.06 0.19 * -0.48 ***
Safe drinking water 0.00 0.00 0.10 0.06 Water sealed separate toilet -0.04 -0.07 0.00 -0.01 Wealth quintiles (wealthiest quintile)
Poorest quintile -0.46 *** -0.34 *** -0.17 * -0.13 Second poorest quintile -0.39 *** -0.38 *** -0.10 -0.09 Middle quintile -0.27 ** -0.25 ** -0.18 ** 0.00 Second wealthiest quintile -0.25 ** -0.23 ** -0.25 *** -0.11
N 5,678 5,678 5,678 6,079 Pseudo R2 0.12 0.11 0.04 0.09 Source : Authors calculations based on DHS 2006/07 1 Whether child had diarrhea, fever, or cough in the past two weeks. 2 Statistical significance at 1,5 and 10 percent confidence levels are indicated by '***', '**' and *. Not stunted=adequate height-for-age, Not under weight=adequate weight-for-age, and Not wasted = adequate weight-for-height.
Table 11. Access to Health Services1
Getting Tetanus injection
Delivery Assistance
Place of delivery Variables
Mother's age (25-34) 15-24 0.30 ** 0.11 0.10 35-49 -0.31 *** 0.08 -0.18 *
Lives with partner 0.08 -0.07 -0.28 Mother's education (secondary completed)
Primary schooling -0.74 *** -0.98 *** -0.81 *** Secondary schooling -0.27 ** -0.41 ** -0.32 **
Reads newspaper regularly -0.01 -0.10 0.01 Mother’s economic activity 0.14 * -0.07 0.06 Household characteristics Household size -0.04 ** 0.01 -0.01

Number of children between 0 and 5 -0.29 *** -0.26 *** -0.21 *** Sector of residence (urban)
Rural -0.01 -0.13 -0.08 Estate 0.04 -0.22 -0.33 **
Safe drinking water 0.00 0.25 * 0.11 Water sealed separate toilet 0.19 ** 0.16 0.15 Wealth quintiles (wealthiest)
Poorest quintile 0.11 -3.39 *** 0.11 Second poorest quintile 0.11 -3.27 *** 0.12 Middle quintile 0.31 ** -3.27 *** 0.39 ** Second wealthiest quintile 0.22 * -3.29 *** 0.10
Sample size 5,874 6,850 6,864 Pseudo R2 0.0891 0.1466 0.0932
Source:Own calculations.
Note: 1. Statistical significance at 1,5 and 10 percent confidence levels are indicated by '***', '**' and *.
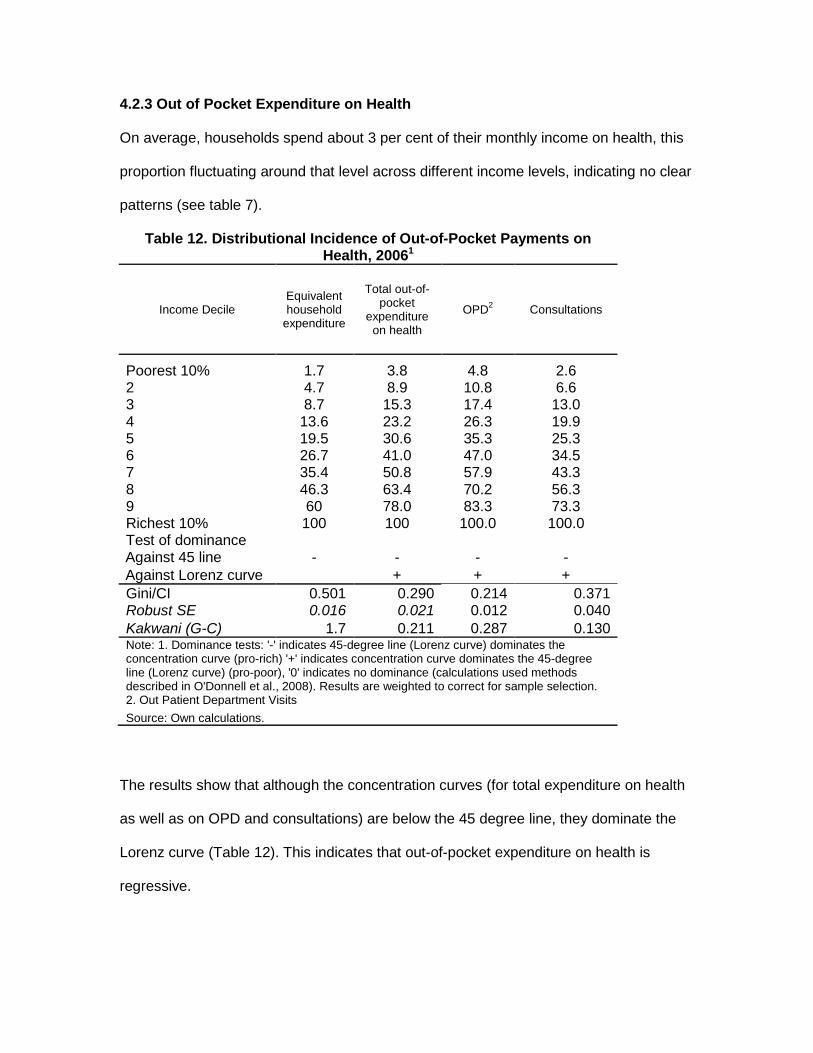
4.2.3 Out of Pocket Expenditure on Health
On average, households spend about 3 per cent of their monthly income on health, this
proportion fluctuating around that level across different income levels, indicating no clear
patterns (see table 7).
Table 12. Distributional Incidence of Out-of-Pocket Payments on Health, 20061
Income Decile Equivalent household
expenditure
Total out-of-pocket
expenditure on health
OPD2 Consultations
Poorest 10% 1.7 3.8 4.8 2.6 2 4.7 8.9 10.8 6.6 3 8.7 15.3 17.4 13.0 4 13.6 23.2 26.3 19.9 5 19.5 30.6 35.3 25.3 6 26.7 41.0 47.0 34.5 7 35.4 50.8 57.9 43.3 8 46.3 63.4 70.2 56.3 9 60 78.0 83.3 73.3 Richest 10% 100 100 100.0 100.0 Test of dominance Against 45 line - - - - Against Lorenz curve + + + Gini/CI 0.501 0.290 0.214 0.371 Robust SE 0.016 0.021 0.012 0.040 Kakwani (G-C) 1.7 0.211 0.287 0.130 Note: 1. Dominance tests: '-' indicates 45-degree line (Lorenz curve) dominates the concentration curve (pro-rich) '+' indicates concentration curve dominates the 45-degree line (Lorenz curve) (pro-poor), '0' indicates no dominance (calculations used methods described in O'Donnell et al., 2008). Results are weighted to correct for sample selection. 2. Out Patient Department Visits Source: Own calculations.
The results show that although the concentration curves (for total expenditure on health
as well as on OPD and consultations) are below the 45 degree line, they dominate the
Lorenz curve (Table 12). This indicates that out-of-pocket expenditure on health is
regressive.
5.0 Conclusions and Policy Implications
5.1 Education Sector
The results show that, the access to education is fairly high, but not equitable at all
levels of education. However, equity has improved over time, particularly for the senior
and junior secondary levels of education. The opportunity for school completion is
inequitable for all school cycles considered. Further, equity in access decreases for
higher school cycles. These results indicate the need to improve access to higher levels
of school cycles and policies to ensure that children complete them. More attention is
also need to improve the equity in education outcomes, especially at the higher school
cycles.
The regression results give some inclination to the existing gaps. They indicate the need
to develop systems to accommodate children with health issues such that they do not
drop out of school. Results also indicate that community level programmes for improving
school participation and programmes for counselling and mentoring children with less
educated mothers can improve access and completion of school cycles. Further studies
are needed to assess lower school participation of children from minority ethnic groups.
Improving the quality of the teaching/learning process in Tamil medium schools may
help in this regard. More effort is also needed to ensure that children enrol in school at
the correct age.
The results also indicate that the high out-of-pocket expenditure component may
contribute to observed inequities, although government provision of tuition and text
books free of charge seems to have lessened the out-of-pocket expenditure on those
items. And improving geographical access to quality schools and subsidizing transport
may lessen household expenditure on transport and boarding fees. This may in turn
improve the progressivity of household expenditure on education. In addition, the need
for private tuition should be minimized through improving the quality of education at the
collegiate level. Also, reducing the competitiveness of the A/Level exam would reduce
the need for extensive private tuition.
5.2 Health Sector
Access to qualified medical personnel and health facilities for child delivery is high, as
are opportunities for receiving tetanus injections, although less than that for the earlier
mentioned indicators. But such opportunity is inequitable. Equity of access to health
institutions and health personnel has increased, but equity in access to tetanus injection
has declined. The equity in opportunity has especially declined in the rural and estate
sectors. Recent anecdotal evidence suggests issues in distributing medicines to medical
care facilities in the periphery. This decline may have resulted from these deficiencies in
the system. Regression analysis indicates that poverty and low education are the main
factors affecting access to medical personnel and institutions.
There is considerable room for improvement in the nutritional level of children and
mothers. Results indicate that nearly one-fifth of children and mothers do not have
adequate levels of nutrition, measured by a variety of indicators. Although these
indicators have in general improved, the improvements are only marginal. Overall the
equity in opportunity for adequate nutrition has improved and for some sectors nutritional
outcomes are equitable across households (that is, EOI is more than one). However, for
some sectors and for certain indicators the equity in opportunity for proper nutrition has
declined, suggesting a need to improve policies and their implementation in these areas.

Regression results indicate that poverty is the main factor affecting low levels of
nutrition, but increasing awareness could improve the nutritional status of children.
In general households spent about 3 per cent of their income on health and the poor pay
a relatively higher proportion of this expenditure. This is true for total out-pocket-
expenditure and expenditure on consultations and out-patient-department visits. These
results are somewhat unexpected, given that health care is provided free of charge at
government hospitals. These results may reflect the poor quality of services, the longer
time taken to receive treatment or the unavailability of different types of services at
government hospitals and suggest a need to improve the quality of care in government
hospitals.
References Ali, I. and Son, H.H. (2007). Measuring Inclusive Growth. Asian Development Review 24 (1), 11-31. Arunatilake, N., N. Attanayake and P. Jayawardena, (2009), “Equitability in Education and Health Services in Sri Lanka”, Report produced for ADB. Arunatilake, Nisha, (2006), Education Participation in Sri Lanka – Why all are not in school, International Journal of Education Research 45,137-152. Arunatilake, Nisha and Priyanka Jayawardena (2010), Formula Funding and Decentralized Management of Schools – Has it Improved Resource Allocation in Schools in Sri Lanka?, International Journal of Educational Development 30 (1), 44-53 Central Bank of Sri Lanka, (various issues) Annual Report, Central Bank of Sri Lanka: Colombo. Department of Census and Statistics (DCS), (2006) A brief analysis of population and housing characteristics” http://www.statistics.gov.lk/PopHouSat/PDF/p7%20population%20and%20Housing%20Text-11-12-06.pdf [accessed, 13th July, 2009].

Gwatkin, D. R., S. Rustein, K. Johnson, R. Pande, A. Wagstaff, (2000) Socio-Economic Differences in Health Nutrition and Population in Nepal, Wold Bank HNP/Poverty Thematic Group, World Bank, Washington DC, USA. International Food Policy Research Institution, (2003) The Importance of Women’s Status for Child Nutrition in Developing Countries’, Research Report 131, International Food Policy Research Institution, Washington DC, USA. Jayawardena, Priyanka, (2010) Socio-economic determinants and inequalities in maternal and childhood malnutrition, Masters Thesis, University of Colombo. Ministry of Education (2008), School Census – 2008, Ministry of Education, Battaramulla, Sri Lanka. National Education Commission (2003), Proposals for a National Policy Framework on General Education in Sri Lanka, National Education Commission, Colombo, Sri Lanka. UNESCO, (2010) http://www.uis.unesco.org/ev.php?ID=2867_201&ID2=DO_TOPIC, accessed 4th October, 2010. World Bank, (2005) Treasures of the Education system in Sri Lanka: Resorting Performance, Expanding Opportunities and Enhancing Prospects, World Bank, Sri Lanka.