
Equipment Turn-In and Transfer Process Modeling
8
Equipment Turn-In and Transfer Process Modeling Rebecca Morel and Vikram Mittal United States Military Academy Department of Systems Engineering West Point, NY Corresponding author's Email: [email protected] Author Note: We would like to thank the 13 th Expeditionary Sustainment Command (ESC) for giving us support and the opportunity to work on their project. We would also like to recognize LTC John Turner and MAJ John Burns from 13 th ESC for their continued sponsorship and guidance through the process of model-building and analysis. Abstract: In military bases across the country, there is excess equipment that costs money to store while it is going unused. When this excess grows large enough, there is an obvious need to turn it in or transfer it to a location where it will be used, but there is not currently a process in the military to handle large stocks like Fort Hood, Texas. This research examines the possibilities of what this turn-in process can look like and how to create a modernized and synchronized method that can be employed across the Army. Modeling this proposed process in ProModel should highlight issues with the current flow and recommend system improvements. Although the process has just been implemented at Fort Hood, there are several system improvements that have been identified by backlogs in the discrete-event simulation including reducing process times, allowing workers to perform tasks in parallel, and reducing time needed to order and install parts. These improvements will make the equipment turn-in process more manageable for Army-wide implementation and success. Keywords: Equipment Turn-In, Discrete-Event Simulation 1. Introduction Within the United States Army, the 13th Expeditionary Sustainment Command (ESC) oversees all sustainment and distribution operations for units stationed in the western portion of the United States, including III Corps. III Corps includes the 1 st Infantry Division, 1 st Armored Division, 1 st Cavalry Division, and numerous support units. It currently has over 42,000 pieces of equipment that needs to be turned-in for either disposal or transfer to other units. Fort Hood, Texas has been designated as the III Corps consolidation location where the turn-in process is set to occur. The first phase of this turn-in was scheduled to occur between November 2020 and March 2021. The 407 th Army Field Support Brigade (AFSB) is the unit under the 13 th ESC that has been tasked with overseeing this turn-in operation. This study sets out to model and analyze the overall efficiency of the operation to support the 13th ESC and the 407th AFSB improve the equipment turn-in process for III Corps. This analysis started with an in-depth stakeholder analysis, data collection, and research into the current processes. This information allowed for the creation of a discrete-event simulation of the turn-in process, allowing for the identification of capability gaps and opportunities for optimization. This paper discusses the steps of building the model and analysis of improvements to the system that will allow it to be widely implemented across the Army. 2. Background 2.1 Problem Introduction Equipment turn-in is a process that is often overlooked in the Army due to the perception that excess equipment will not effect the overall readiness of a unit or their likelihood to complete a mission. However, storing unused equipment removes resources, including funding and maintenance, that could be used for ensuring that troops are getting the proper new equipment and training that they need to be successful in their mission. Therefore, as the Army has been modernizing and rapidly gaining new equipment over the past twenty years, this outdated and unused equipment has been piling up and creating one of the largest equipment backups than the Army has ever seen. Thus, the current procedure that is meant to handle small numbers of equipment cannot keep up with the modernization and acquisition efforts across the Army. A new method is needed to efficiently hold and process a larger amount of equipment than has ever been seen (Department of the Amy [DA], 2016). Proceedings of the Annual General Donald R. Keith Memorial Conference West Point, New York, USA April 29, 2021 ISBN: 97819384962-0-2 144 A Regional Conference of the Society for Industrial and Systems Engineering
-
Upload
khangminh22 -
Category
Documents
-
view
0 -
download
0
Transcript of Equipment Turn-In and Transfer Process Modeling

Equipment Turn-In and Transfer Process Modeling
Rebecca Morel and Vikram Mittal
United States Military Academy
Department of Systems Engineering
West Point, NY
Corresponding author's Email: [email protected]
Author Note: We would like to thank the 13th Expeditionary Sustainment Command (ESC) for giving us support and the
opportunity to work on their project. We would also like to recognize LTC John Turner and MAJ John Burns from 13th ESC
for their continued sponsorship and guidance through the process of model-building and analysis.
Abstract: In military bases across the country, there is excess equipment that costs money to store while it is going unused.
When this excess grows large enough, there is an obvious need to turn it in or transfer it to a location where it will be used, but
there is not currently a process in the military to handle large stocks like Fort Hood, Texas. This research examines the
possibilities of what this turn-in process can look like and how to create a modernized and synchronized method that can be
employed across the Army. Modeling this proposed process in ProModel should highlight issues with the current flow and
recommend system improvements. Although the process has just been implemented at Fort Hood, there are several system
improvements that have been identified by backlogs in the discrete-event simulation including reducing process times, allowing
workers to perform tasks in parallel, and reducing time needed to order and install parts. These improvements will make the
equipment turn-in process more manageable for Army-wide implementation and success.
Keywords: Equipment Turn-In, Discrete-Event Simulation
1. Introduction
Within the United States Army, the 13th Expeditionary Sustainment Command (ESC) oversees all sustainment and
distribution operations for units stationed in the western portion of the United States, including III Corps. III Corps includes
the 1st Infantry Division, 1st Armored Division, 1st Cavalry Division, and numerous support units. It currently has over 42,000
pieces of equipment that needs to be turned-in for either disposal or transfer to other units. Fort Hood, Texas has been designated
as the III Corps consolidation location where the turn-in process is set to occur. The first phase of this turn-in was scheduled to
occur between November 2020 and March 2021. The 407th Army Field Support Brigade (AFSB) is the unit under the 13th ESC
that has been tasked with overseeing this turn-in operation.
This study sets out to model and analyze the overall efficiency of the operation to support the 13th ESC and the 407th
AFSB improve the equipment turn-in process for III Corps. This analysis started with an in-depth stakeholder analysis, data
collection, and research into the current processes. This information allowed for the creation of a discrete-event simulation of
the turn-in process, allowing for the identification of capability gaps and opportunities for optimization. This paper discusses
the steps of building the model and analysis of improvements to the system that will allow it to be widely implemented across
the Army.
2. Background
2.1 Problem Introduction
Equipment turn-in is a process that is often overlooked in the Army due to the perception that excess equipment will
not effect the overall readiness of a unit or their likelihood to complete a mission. However, storing unused equipment removes
resources, including funding and maintenance, that could be used for ensuring that troops are getting the proper new equipment
and training that they need to be successful in their mission. Therefore, as the Army has been modernizing and rapidly gaining
new equipment over the past twenty years, this outdated and unused equipment has been piling up and creating one of the
largest equipment backups than the Army has ever seen. Thus, the current procedure that is meant to handle small numbers of
equipment cannot keep up with the modernization and acquisition efforts across the Army. A new method is needed to
efficiently hold and process a larger amount of equipment than has ever been seen (Department of the Amy [DA], 2016).
Proceedings of the Annual General Donald R. Keith Memorial Conference West Point, New York, USA April 29, 2021
ISBN: 97819384962-0-2 144
A Regional Conference of the Society for Industrial and Systems Engineering

The most recent comparison to the current process was done by the 1st Air Calvary Brigade (1 ACB) in July 2020 and
was known as “Operation Pegasus Harvest.” This operation only looked at the turn-in of a limited number of excess pieces of
equipment but created a framework to build upon and use as a reference. According to this operation, the large amounts of
excess equipment cause issues with supply availability, supply chain efficiencies, and supply chain velocity (Torres, 2020).
This operation transitioned an unused motor pool into an operations headquarters where logisticians and the sustainment
brigades would solely focus on turning in equipment. This focus on a singular mission enables the turn-in to occur all at once
and allows the units to drop off their equipment quickly so they can focus on modernization rather than navigating a complex
turn-in process. Operation Pegasus Harvest laid the framework for the future of bulk turn-in for III Corps and potentially the
Army and the concept of having large consolidation points for streamlined turn-in.
Some key recommendations gained from this project include planning out specific staffing requirements beforehand,
streamlining the maintenance operation stage, and increasing the pace of the Proposed Sourcing Decisions (PSD) (Dennis,
2020). PSDs help keep track of equipment inflow and outflow as well as approve movement and ensure that the excess
equipment is replaced. Ensuring that the staff has access to and is competent in Global Combat Support System – Army (GCCS-
A) is a key requirement to ensuring that the entire turn-in process flows well. GCCS-A is an online database to help organize
property management, supply operations, maintenance, and logistical support. For the maintenance operations phase, having
the proper maintenance equipment on-site beforehand is one suggestion that ensures timely repairs to keep the process moving.
Finally, the slow speed of the PSDs is a stage that all equipment requires and was an inefficiency during Operation Pegasus
Harvest.
2.2 Discrete Event Simulation
Discrete event simulation (DES) is commonly used for analyzing and optimizing many manufacturing and service-
based problems because of the ease of modeling processes (McCarthy & Razon, 2021). DES has been further used for a range
of military applications including modeling the officer accession process, analyzing mobilization procedures, and optimizing
the flow of soldiers through a physical fitness test (McCarthy et al, 2021).
Unique components of DES that make them applicable to modeling the equipment turn-in process include having
distinct entities moving in the system, state changes occur at discrete points of time, the system can be viewed as a network of
activities and lines, and activity durations can be estimated and analyzed using statistics (McCarthy et al, 2021). In the
equipment turn-in process, the entities moving through the system are distinct pieces of equipment with unique traits and
process requirements. Additionally, the state changes of these entities occur at set points within the path of movement. The
equipment turn-in process is modeled as a combination of several activities in a set order with wait times and holding areas
depending on the flow of other units through the system. Finally, the durations for the activities in the equipment turn-in process
can be estimated from previous data and experience but are also able to contain stochasticity based on the uncertainty associated
with the activities.
3. Process Overview
3.1 Observations of Current Process Plan
With no doctrinal answer to this problem, leaders at the 13th ESC have developed a process plan that is being
implemented as a guide for the initial stages of large-scale turn-in. This process places the equipment into categories based on
the destination of the equipment. There are five possible locations as represented by the categories in Figure 1 including:
Defense Logistics Agency Directive (DLAD-S): disposes of equipment no longer required.
Depot: transfers equipment to a more consolidated supply point for issue and storage.
Inter-Army Command (ACOM): transfers equipment to a different ACOM based on location.
Intra-ACOM: transfers the equipment within the same ACOM.
Intra-Post: transfers equipment within the same Army post.
At each of these locations, there are different steps and paths that the equipment follows until it makes it to the destination or
output location.
In addition to being split up by location, the equipment is also categorized by type. The four broad equipment types
that are used include rolling stock, non-rolling stock, hazardous material (HAZMAT), and classified. Rolling stock includes
vehicles, HAZMAT equipment includes equipment with dangerous materials or substances, classified equipment includes any
decoding materials, and non-rolling stock is all other equipment that does not fall into one of the other categories. Each of these
categories has unique process steps within each of the buckets, so differentiating them helps to ensure that all of the equipment
follows the necessary steps to complete turn-in. In Figure 1 below, the different categories are shown with the green and orange
Proceedings of the Annual General Donald R. Keith Memorial Conference West Point, New York, USA April 29, 2021
ISBN: 97819384962-0-2 145
A Regional Conference of the Society for Industrial and Systems Engineering

arrows representing administrative work that is required but occurs in parallel, while the blue arrow represents the delivery
procedure required for the equipment. The processes along the orange arrows represent steps that are required with vehicles
and no other types of equipment. Within these arrows, smaller activities are represented with labels to show necessary
subroutines within the activity.
Figure 1. Transfer/Turn-In Process Overview
3.2 Possible Opportunities for Improvement
Throughout conversations with stakeholders and additional observations gained from Operation Pegasus Harvest and
the beginnings of the III Corps turn-in, there are several areas where the process is observed to have queues develop. These
areas include the PSD process and the process of ordering and awaiting parts.
The current PSD process is scheduled to take up to 1,100 hours to complete per piece of rolling stock and 96 hours
per piece of the other types of equipment. Additionally, it can only be done by one person per turn-in site. If this process can
be streamlined in a way that allows multiple workers to collaborate at once, it could provide velocity in this area that seems to
hold up the progression.
The next area that is anticipated to hold up the process is the time awaiting parts. Even though this step is only for
equipment that requires parts to be received from other locations (which is mainly rolling stock), it takes a minimum of 28 days
for these shipments to arrive to the consolidation point. Thus, this step holds up the processes significantly and takes up space
at the consolidation point that inhibits more equipment from coming in. A separate holding area for this equipment that needs
parts is one possible way to free up space to decrease wait times and improve efficiency.
4. Model Development
Proceedings of the Annual General Donald R. Keith Memorial Conference West Point, New York, USA April 29, 2021
ISBN: 97819384962-0-2 146
A Regional Conference of the Society for Industrial and Systems Engineering

Since the processes outlined in Figure 1 all have variability involved in them and are not identical for every piece of
equipment, a discrete event simulation is most applicable to model the process. In addition, the added variability that can be
implemented into the model will develop useful insight for the analysis of the equipment turn-in problem. Using a simulation
software called ProModel, a simulation can be constructed and then replicated to conduct analysis. The model shows
efficiencies and bottlenecks in the process and highlights areas that can be improved to decrease the amount of time that
equipment turn-in takes. Simulation also enables researchers to modify inputs or adjust the process and compare results to the
status-quo.
4.1 Model Overview
A broad overview of the system architecture beginning with the Microsoft Excel input file and ending with the
ProModel simulation and Microsoft Excel output file is shown in Figure 2. The information from the input file is coded into
the ProModel file so the system data can be updated and used in the model. In addition to the Excel file feeding into the
simulation, the file can also be easily accessed and edited by the client to allow for real-time updating of times as new data is
collected. As shown in Figure 2, the input file is divided into four tabs with separate input information. The first tab includes
an array that separates the total number of pieces requiring turn-in into the different types and destination locations. The second
tab has uniform distributions that includes process type by equipment type. The third tab has an array with the proportions of
equipment requiring parts by type and the wait time for these pieces. Finally, the fourth tab contains various other inputs such
as number of available supply and maintenance workers and proportion of equipment that arrives late. Section 4.2 provides
more detail on where the assumptions for the input file were derived from.
Figure 3 below shows a screenshot of the simulation with the pieces of equipment moving through the various
locations. The user of the model can change the number of each type of equipment and run multiple iterations of the model to
determine the time for the entire turn-in process as well as the time in each of the stages. The more iterations of the data that
are run, the more accurate and realistic the results of the model are in determining how long a certain unit will take to turn-in
their excess equipment.
ProModel generates an output file that provides data on the total process time for all pieces of equipment to run
through. However, there is a subroutine in the simulation that generates an accompanying Excel file that can be sorted and
filtered to follow specific pieces of equipment through the model or different locations. This tracking provides specific
information about process length and efficiency.
Figure 2. Discrete Event Model Architecture
Proceedings of the Annual General Donald R. Keith Memorial Conference West Point, New York, USA April 29, 2021
ISBN: 97819384962-0-2 147
A Regional Conference of the Society for Industrial and Systems Engineering
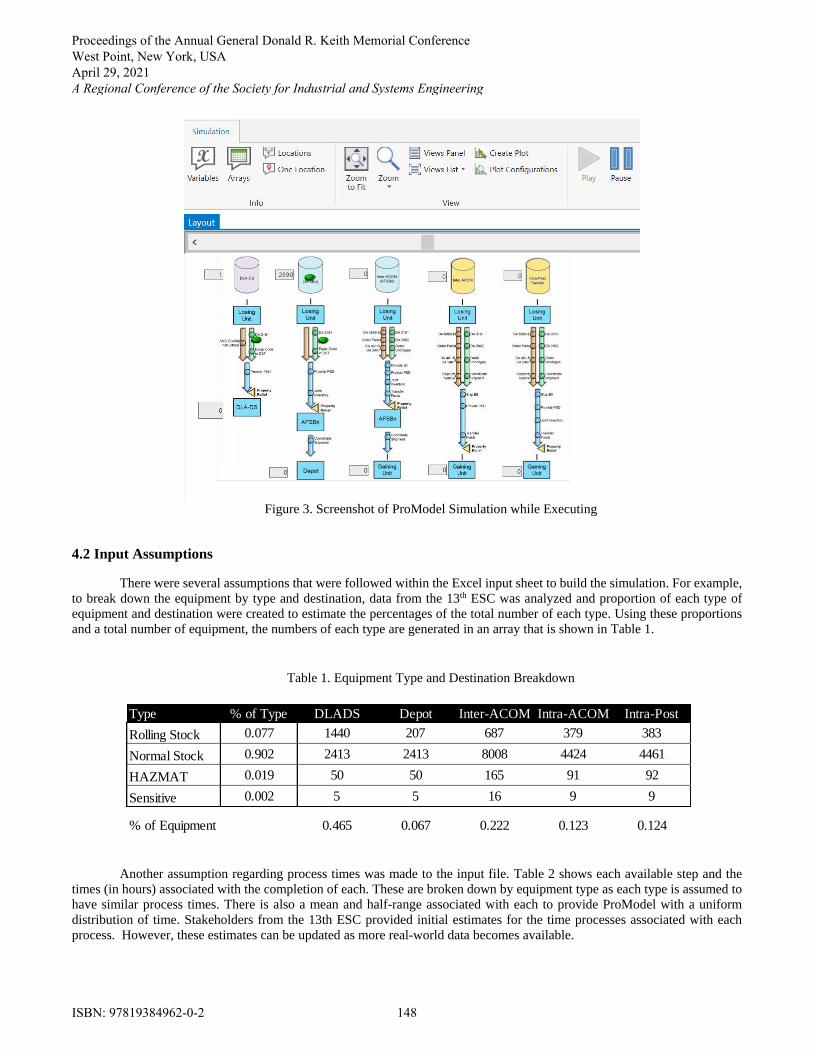
Figure 3. Screenshot of ProModel Simulation while Executing
4.2 Input Assumptions
There were several assumptions that were followed within the Excel input sheet to build the simulation. For example,
to break down the equipment by type and destination, data from the 13th ESC was analyzed and proportion of each type of
equipment and destination were created to estimate the percentages of the total number of each type. Using these proportions
and a total number of equipment, the numbers of each type are generated in an array that is shown in Table 1.
Table 1. Equipment Type and Destination Breakdown
Another assumption regarding process times was made to the input file. Table 2 shows each available step and the
times (in hours) associated with the completion of each. These are broken down by equipment type as each type is assumed to
have similar process times. There is also a mean and half-range associated with each to provide ProModel with a uniform
distribution of time. Stakeholders from the 13th ESC provided initial estimates for the time processes associated with each
process. However, these estimates can be updated as more real-world data becomes available.
Type % of Type DLADS Depot Inter-ACOM Intra-ACOM Intra-Post
Rolling Stock 0.077 1440 207 687 379 383
Normal Stock 0.902 2413 2413 8008 4424 4461
HAZMAT 0.019 50 50 165 91 92
Sensitive 0.002 5 5 16 9 9
% of Equipment 0.465 0.067 0.222 0.123 0.124
Proceedings of the Annual General Donald R. Keith Memorial Conference West Point, New York, USA April 29, 2021
ISBN: 97819384962-0-2 148
A Regional Conference of the Society for Industrial and Systems Engineering

Table 2. Process Time Input Array
4.3 Model Process Flow
The model consists of the same locations for each of the five destinations: Arrival, admin, delivery, and termination
as illustrated in Figure 4 below. In each of these locations, the equipment is routed through various subroutines that correspond
to the required tasks. The entities that flow through the system are the four types of equipment: Rolling stock, non-rolling stock,
HAZMAT, and classified. These types are visually separated in the model by using different graphics. A representation of this
is shown in Figure 3.
All equipment arrives to an origin point in the model. When space is available in each of the destination processes,
the equipment is separated based on the percentages from the input file. Next, the equipment is routed through each of the
locations and subroutines until it reaches the end point and departs the system. The only exception to this flow is if a piece of
equipment requires a part that needs to be shipped from another location. If this is the case, the equipment is routed to the
awaiting parts holding area until the parts are received, and it is sent back to normal process movement. Additionally, there is
a process built into the model that allows the steps happening in the admin phase orange and green arrows (orange and green
arrows in Figure 1) to occur simultaneously.
Figure 4. Model Process Flow
Mean HalfRange Mean HalfRange Mean HalfRange Mean HalfRange
DA 3161 Supply 2 0.5 0.25 1 0.5 0.25 1 0.5 0.25 1 0.5 0.25
DA 1348 Supply 2 0.5 0.25 1 0.5 0.25 1 0.5 0.25 1 0.5 0.25
DA 5988-E Maintenance 2 0.5 0.25 1 0.5 0.25 1 0.5 0.25 1 0.5 0.25
DA 461-5 Supply 2 0.5 0.25 1 0.5 0.25 1 0.5 0.25 1 0.5 0.25
DA 2407 Supply 2 0.5 0.25 1 0.5 0.25 1 0.5 0.25 1 0.5 0.25
Order Parts Maintenance 2 1 0.5 1 1 0.5 1 1 0.5 1 1 0.5
Dispatch Maintenance 2 0.5 0.25 0 0 0 0 0 0 0 0 0
Order Shortages Supply 2 1 0.5 1 1 0.5 1 1 0.5 1 1 0.5
Shipment Maintenance 2 4 2 1 1 0.5 1 1 0.5 1 1 0.5
AMC Instructions Supply 2 1 0.5 1 1 0.5 1 1 0.5 1 1 0.5
Equip Code Supply 2 1 0.5 1 1 0.5 1 1 0.5 1 1 0.5
Provide PSD Maintenance 2 1100 550 1 96 48 1 96 48 1 96 48
Joint Inventory Supply 2 2.5 1.25 1 1 0.5 1 1 0.5 1 1 0.5
Provide Bill Supply 2 1 0.5 1 1 0.5 1 1 0.5 1 1 0.5
Transfer Funds Supply 2 1 0.5 1 1 0.5 1 1 0.5 1 1 0.5
SF 700 Supply 0 0 0 0 0 0 1 1 0.5 0 0 0
Zero Memo Supply 0 0 0 0 0 0 0 0 0 1 1 0.5
Time
Rolling Stock NonRolling Stock Hazmat Classified
Quantity Quantity Quantity QuantityCategoryProcess Time Time Time
Equipment Arrival
Administrative Work
•Order Parts/Shortages
•Provide PSD
•Joint Inventory
Equipment Delivery
•Property Relief
•Coordinate Shipment
Process Termination
Proceedings of the Annual General Donald R. Keith Memorial Conference West Point, New York, USA April 29, 2021
ISBN: 97819384962-0-2 149
A Regional Conference of the Society for Industrial and Systems Engineering

5. Results and Analysis
5.1 Verification and Validation
Verification and validation ensures the dependability and usefulness of a model. Verification is the process of ensuring
the model meets the specifications and runs correctly. Validation is the process of ensuring the model addresses a real-world
need (Law, 2015). While building the ProModel simulation, verification was done by using an iterative model that built in
more complexity as the simulation was being constructed. This incremental process helped to debug and ensure that the model
was preforming all necessary functions correctly. To validate the model, client meetings were held to discuss the progress of
the model. Each time they were briefed on the requirements of the model, the code in ProModel, and the functioning simulation.
Their additional data and inputs helped ensure the numbers going into the model were accurate.
5.2 Process Times
After running the simulation with the distribution of parts as listed in Table 1, the time to run all pieces of equipment
through the turn-in process was 155, 496 hours. This number is extremely large and makes it seem as though the equipment
that is currently awaiting turn-in may never complete the process. However, there are improvements that can be made to the
system that drastically reduce wait times for equipment and streamline the turn-in process.
For example, the largest time for an individual subroutine in the model is 1,100 hours to provide PSDs for the
equipment. This process has a long time associated with it due to the nature of the task being in a data base. Thus, only one
supply person can work on the parts at a time. Because only one supply person can work on this task at a time, the system
becomes extremely backlogged and all other pieces of equipment are slowed down at this point. By cutting the PSD time in
half to 500 hours, the process times are reduced to 88,577 hours.
Another backlog in the original results relating to the PSD process time is the number of each type of worker. Since
there are maintenance workers and supply workers that work on different processes, there were times when some of each type
were idle during the simulation. Accordingly, by doubling the number of each type of worker from 45 to 90 and allowing them
to work on different processes when available, the time to process this equipment through the system reduced again to 39,895
hours.
5.3 Recommendations
Although the current process results in turn-in times that are large and unmanageable, there are several known
improvements that can cut down the total process time for equipment turn-in. Reducing each individual process time is one
step that will cut down overall process time. Providing PSDs accounts for 98% of overall time in the system for rolling stock
and 90% for the other equipment types. Therefore reducing the time it takes to complete this task is top priority. To do this,
13th ESC could allow simultaneous access to online systems by workers; however, many of the other processes including AMC
instructions and equipment code are also performed on computers with limited parallel work allowed.
In addition to working on computer programs concurrently, another improvement that is possible is allowing
maintenance workers to work on supply tasks and supply workers to work on maintenance tasks. This modification would
allow workers to fill in spots where backlogs occur and make idle time regarding equipment and workers much smaller.
Finally, another improvement that can be made to the system is providing a more streamlined system for ordering and
receiving new parts. Currently, if a piece of equipment requires parts before turn-in, ordering parts and receiving them at the
turn-in site takes upwards of three weeks. This delays all subsequent actions in the turn-in process, increases total times, and
decreases the space at the turn-in site to move other equipment through. Having frequently needed parts available at the site or
in the area is one way to reduce this wait time and move all equipment more smoothly through the process. Figure 5 shows a
graph of these model versions and their total output time decreasing as improvements were reflected in ProModel. Version 1
of the model has the original process times and number of workers, Version 2 has PSD process times at 500 hours, and Version
3 has the number for both supply and maintenance workers set to 90. Process time reductions by this large of a number are
reasonable for the equipment turn-in process due to the variability of the time that each task takes and the possibility of
combining tasks.
Proceedings of the Annual General Donald R. Keith Memorial Conference West Point, New York, USA April 29, 2021
ISBN: 97819384962-0-2 150
A Regional Conference of the Society for Industrial and Systems Engineering

Figure 5. Total Process Time Improvements
6. Conclusion
Backlogs of excess equipment is becoming an increasingly relevant topic at the highest echelons of the Army due to
the increased demand for acquisitions and integrating new technology into units. The buildup of older equipment not only takes
up physical space that these units could potentially use to store more updated technology, but also takes funding and resources
such as maintenance away from more modern equipment. Along with the modernization of equipment, the Army needs to
develop a more updated turn-in and transfer process for this large amount of equipment. The 13th ESC and III Corps is currently
piloting a new equipment turn-in process in Fort Hood, Texas. Using a discrete event simulation created in ProModel, this
proposed process can be analyzed based on data that can be updated as the effort continues. Areas for improvement have
already been identified including making the PSD process more user-friendly and efficient and increasing the velocity of
ordering and receiving parts for equipment that needs updates.
6. References
Dennis, M J. (2020). Pegasus Harvest Lessons Learned. Fort Hood, Texas: 1CDSB.
Department of the Army. (2016). Inventory Management: Using Unit Supply System (PAM 710-2).
Law, A. M. (2015). Simulation Modeling and Analysis. New York: Mcgraw-Hill.
McCarthy, S., & Razon, C. (2021). Modeling Human Processing Systems in Discrete Event Simulation. Proceedings of the
Error! Reference source not found. Winter Simulation Conference.
Torres, A. (2020). A Shock to the System: How 1CDSB Turns Excess to Readiness. Washington, D.C.: U.S. Army.
0
20
40
60
80
100
120
140
160
180
1 2 3
To
tal P
roce
ss T
ime
for
Mo
del
(Th
ou
san
ds
of
Ho
urs
)
Model Version
Excess Equipment Turn-In Time
Proceedings of the Annual General Donald R. Keith Memorial Conference West Point, New York, USA April 29, 2021
ISBN: 97819384962-0-2 151
A Regional Conference of the Society for Industrial and Systems Engineering