
ep>eppi0 reaction studied in the Delta(1232) mass region using polarization asymmetries
14
arXiv:nucl-ex/0307004v1 3 Jul 2003 Study of ep → epπ ◦ in the Δ(1232) mass region using polarization asymmetries A. Biselli, 1, ∗ G.S. Adams, 1 M.J. Amaryan, 37 E. Anciant, 24 M. Anghinolfi, 13 B. Asavapibhop, 28 G. Asryan, 37 G. Audit, 24 T. Auger, 24 H. Avakian, 12 S. Barrow, 10 M. Battaglieri, 13 K. Beard, 16 M. Bektasoglu, 21 W. Bertozzi, 19 N. Bianchi, 12 S. Boiarinov, 14 B.E. Bonner, 23 P. Bosted, 28 S. Bouchigny, 17 R. Bradford, 3 D. Branford, 8 W.K. Brooks, 17 S. Bueltmann, 35 V.D. Burkert, 17 J.R. Calarco, 30 D.S. Carman, 22 B. Carnahan, 4 C. Cetina, 11 L. Ciciani, 21 P.L. Cole, 34 A. Coleman, 6 J. Connelly, 11 D. Cords, 17 P. Corvisiero, 13 D. Crabb, 35 H. Crannell, 4 J. Cummings, 1 E. De Sanctis, 12 R. De Vita, 13 P.V. Degtyarenko, 17 R.A. Demirchyan, 37 H. Denizli, 31 L.C. Dennis, 10 K.V. Dharmawardane, 21 K.S. Dhuga, 11 C. Djalali, 33 G.E. Dodge, 21 J. Domingo, 17 D. Doughty, 5, 17 P. Dragovitsch, 10 M. Dugger, 2 S. Dytman, 31 M. Eckhause, 6 Y.V. Efremenko, 14 H. Egiyan, 6 K.S. Egiyan, 37 L. Elouadrhiri, 5, 17 A. Empl, 1 P. Eugenio, 10 L. Farhi, 24 R. Fatemi, 35 R.J. Feuerbach, 3 J. Ficenec, 36 K. Fissum, 19 T.A. Forest, 21 A. Freyberger, 17 V. Frolov, 1 H. Funsten, 6 S.J. Gaff, 7 M. Gai, 27 G. Gavalian, 37 V.B. Gavrilov, 14 S. Gilad, 19 G.P. Gilfoyle, 32 K.L. Giovanetti, 16 P. Girard, 33 E. Golovatch, 29 K.A. Griffioen, 6 M. Guidal, 15 M. Guillo, 33 L. Guo, 17 V. Gyurjyan, 17 D. Hancock, 6 J. Hardie, 5 D. Heddle, 5, 17 F.W. Hersman, 30 K. Hicks, 22 R.S. Hicks, 28 M. Holtrop, 30 J. Hu, 1 C.E. Hyde-Wright, 21 M.M. Ito, 17 D. Jenkins, 36 K. Joo, 35 J.H. Kelley, 7 M. Khandaker, 20, 17 K.Y. Kim, 31 K. Kim, 18 W. Kim, 18 A. Klein, 21 F.J. Klein, 17 A.V. Klimenko, 21 M. Klusman, 1 M. Kossov, 14 L.H. Kramer, 9, 17 Y. Kuang, 6 J. Kuhn, 1 S.E. Kuhn, 21 J. Lachniet, 3 J.M. Laget, 24 D. Lawrence, 28 G.A. Leksin, 14 A. Longhi, 4 K. Loukachine, 36 R.W. Major, 32 J.J. Manak, 17 C. Marchand, 24 S.K. Matthews, 4 S. McAleer, 10 J.W.C. McNabb, 3 J. McCarthy, 35 B.A. Mecking, 17 M.D. Mestayer, 17 C.A. Meyer, 3 R. Minehart, 35 M. Mirazita, 12 R. Miskimen, 28 V. Mokeev, 29 V. Muccifora, 12 J. Mueller, 31 L.Y. Murphy, 11 G.S. Mutchler, 23 J. Napolitano, 1 S.O. Nelson, 7 G. Niculescu, 22 B. Niczyporuk, 17 R.A. Niyazov, 21 M. Nozar, 17 J.T. O’Brien, 4 G.V. O’Rielly, 11 M.S. Ohandjanyan, 37 M. Osipenko, 29 K. Park, 18 Y. Patois, 33 G.A. Peterson, 28 S. Philips, 11 N. Pivnyuk, 14 D. Pocanic, 35 O. Pogorelko, 14 E. Polli, 12 B.M. Preedom, 33 J.W. Price, 26 L.M. Qin, 21 B.A. Raue, 9, 17 G. Riccardi, 10 G. Ricco, 13 M. Ripani, 13 B.G. Ritchie, 2 S. Rock, 28 F. Ronchetti, 12 P. Rossi, 12 D. Rowntree, 19 P.D. Rubin, 32 K. Sabourov, 7 C.W. Salgado, 20 V. Sapunenko, 13 M. Sargsyan, 37 R.A. Schumacher, 3 V.S. Serov, 14 Y.G. Sharabian, 37 J. Shaw, 28 S.M. Shuvalov, 14 S. Simionatto, 11 A. Skabelin, 19 E.S. Smith, 17 L.C. Smith, 35 T. Smith, 30 D.I. Sober, 4 L. Sorrell, 28 M. Spraker, 7 S. Stepanyan, 37, 21 P. Stoler, 1 I.I. Strakovsky, 11 M. Taiuti, 13 S. Taylor, 23 D. Tedeschi, 33 U. Thoma, 17 R. Thompson, 31 L. Todor, 3 T.Y. Tung, 6 C. Tur, 33 M. Ungaro, 1 M.F. Vineyard, 25 A. Vlassov, 14 K. Wang, 35 L.B. Weinstein, 21 H. Weller, 7 R. Welsh, 6 D.P. Weygand, 17 S. Whisnant, 33 M. Witkowski, 1 E. Wolin, 17 A. Yegneswaran, 17 J. Yun, 21 B. Zhang, 19 J. Zhao, 19 and Z. Zhou 19 (The CLAS Collaboration) 1 Rensselaer Polytechnic Institute, Troy, NY 12180, USA 2 Arizona State University, Tempe, AZ 85287, USA 3 Carnegie Mellon University, Pittsburgh, PA 15213, USA 4 Catholic University of America, Washington D.C., 20064, USA 5 Christopher Newport University, Newport News, VA 23606, USA 6 College of William and Mary, Williamsburg, VA 23187, USA 7 Duke University, Physics Bldg. TUNL, Durham, NC 27706, USA 8 Edinburgh University, Edinburgh EH9 3JZ, United Kingdom 9 Florida International University, Miami, FL 33199, USA 10 Florida State University,Tallahassee, FL 32306, USA 11 George Washington University, Washington D. C., 20052 USA 12 Istituto Nazionale di Fisica Nucleare, Laboratori Nazionali di Frascati, P.O. 13, 00044 Frascati, Italy 13 Istituto Nazionale di Fisica Nucleare, Sezione di Genova e Dipartimento di Fisica dell’Universita, 16146 Genova, Italy 14 Institute of Theoretical and Experimental Physics, 25 B. Cheremushkinskaya, Moscow, 117259, Russia 15 Institut de Physique Nucleaire d’Orsay, IN2P3, BP 1, 91406 Orsay, France 16 James Madison University, Department of Physics, Harrisonburg, VA 22807, USA 17 Thomas Jefferson National Accelerator Facility, 12000 Jefferson Avenue, Newport News, VA 23606, USA 18 Kyungpook National University, Taegu 702-701, South Korea 19 M.I.T.-Bates Linear Accelerator, Middleton, MA 01949, USA 20 Norfolk State University, Norfolk VA 23504, USA 21 Old Dominion University, Norfolk VA 23529, USA 22 Ohio University, Athens, OH 45701, USA 23 Rice University, Bonner Lab, Box 1892, Houston, TX 77251, USA 24 CEA Saclay, DAPNIA-SPhN, F91191 Gif-sur-Yvette Cedex, France 25 Union College, Schenectady, NY 12308, USA 26 University of California at Los Angeles, Los Angeles, CA 90095, USA
-
Upload
russian-armenian -
Category
Documents
-
view
3 -
download
0
Transcript of ep>eppi0 reaction studied in the Delta(1232) mass region using polarization asymmetries
arX
iv:n
ucl-
ex/0
3070
04v1
3 J
ul 2
003
Study of ep → epπ in the ∆(1232) mass region using polarization asymmetries
A. Biselli,1, ∗ G.S. Adams,1 M.J. Amaryan,37 E. Anciant,24 M. Anghinolfi,13 B. Asavapibhop,28 G. Asryan,37
G. Audit,24 T. Auger,24 H. Avakian,12 S. Barrow,10 M. Battaglieri,13 K. Beard,16 M. Bektasoglu,21 W. Bertozzi,19
N. Bianchi,12 S. Boiarinov,14 B.E. Bonner,23 P. Bosted,28 S. Bouchigny,17 R. Bradford,3 D. Branford,8
W.K. Brooks,17 S. Bueltmann,35 V.D. Burkert,17 J.R. Calarco,30 D.S. Carman,22 B. Carnahan,4 C. Cetina,11
L. Ciciani,21 P.L. Cole,34 A. Coleman,6 J. Connelly,11 D. Cords,17 P. Corvisiero,13 D. Crabb,35 H. Crannell,4
J. Cummings,1 E. De Sanctis,12 R. De Vita,13 P.V. Degtyarenko,17 R.A. Demirchyan,37 H. Denizli,31 L.C. Dennis,10
K.V. Dharmawardane,21 K.S. Dhuga,11 C. Djalali,33 G.E. Dodge,21 J. Domingo,17 D. Doughty,5, 17 P. Dragovitsch,10
M. Dugger,2 S. Dytman,31 M. Eckhause,6 Y.V. Efremenko,14 H. Egiyan,6 K.S. Egiyan,37 L. Elouadrhiri,5, 17
A. Empl,1 P. Eugenio,10 L. Farhi,24 R. Fatemi,35 R.J. Feuerbach,3 J. Ficenec,36 K. Fissum,19 T.A. Forest,21 A.
Freyberger,17 V. Frolov,1 H. Funsten,6 S.J. Gaff,7 M. Gai,27 G. Gavalian,37 V.B. Gavrilov,14 S. Gilad,19
G.P. Gilfoyle,32 K.L. Giovanetti,16 P. Girard,33 E. Golovatch,29 K.A. Griffioen,6 M. Guidal,15 M. Guillo,33
L. Guo,17 V. Gyurjyan,17 D. Hancock,6 J. Hardie,5 D. Heddle,5, 17 F.W. Hersman,30 K. Hicks,22 R.S. Hicks,28
M. Holtrop,30 J. Hu,1 C.E. Hyde-Wright,21 M.M. Ito,17 D. Jenkins,36 K. Joo,35 J.H. Kelley,7 M. Khandaker,20, 17
K.Y. Kim,31 K. Kim,18 W. Kim,18 A. Klein,21 F.J. Klein,17 A.V. Klimenko,21 M. Klusman,1 M. Kossov,14
L.H. Kramer,9, 17 Y. Kuang,6 J. Kuhn,1 S.E. Kuhn,21 J. Lachniet,3 J.M. Laget,24 D. Lawrence,28 G.A. Leksin,14
A. Longhi,4 K. Loukachine,36 R.W. Major,32 J.J. Manak,17 C. Marchand,24 S.K. Matthews,4 S. McAleer,10
J.W.C. McNabb,3 J. McCarthy,35 B.A. Mecking,17 M.D. Mestayer,17 C.A. Meyer,3 R. Minehart,35 M. Mirazita,12
R. Miskimen,28 V. Mokeev,29 V. Muccifora,12 J. Mueller,31 L.Y. Murphy,11 G.S. Mutchler,23 J. Napolitano,1
S.O. Nelson,7 G. Niculescu,22 B. Niczyporuk,17 R.A. Niyazov,21 M. Nozar,17 J.T. O’Brien,4 G.V. O’Rielly,11
M.S. Ohandjanyan,37 M. Osipenko,29 K. Park,18 Y. Patois,33 G.A. Peterson,28 S. Philips,11 N. Pivnyuk,14
D. Pocanic,35 O. Pogorelko,14 E. Polli,12 B.M. Preedom,33 J.W. Price,26 L.M. Qin,21 B.A. Raue,9, 17
G. Riccardi,10 G. Ricco,13 M. Ripani,13 B.G. Ritchie,2 S. Rock,28 F. Ronchetti,12 P. Rossi,12 D. Rowntree,19
P.D. Rubin,32 K. Sabourov,7 C.W. Salgado,20 V. Sapunenko,13 M. Sargsyan,37 R.A. Schumacher,3 V.S. Serov,14
Y.G. Sharabian,37 J. Shaw,28 S.M. Shuvalov,14 S. Simionatto,11 A. Skabelin,19 E.S. Smith,17 L.C. Smith,35
T. Smith,30 D.I. Sober,4 L. Sorrell,28 M. Spraker,7 S. Stepanyan,37, 21 P. Stoler,1 I.I. Strakovsky,11 M. Taiuti,13
S. Taylor,23 D. Tedeschi,33 U. Thoma,17 R. Thompson,31 L. Todor,3 T.Y. Tung,6 C. Tur,33 M. Ungaro,1
M.F. Vineyard,25 A. Vlassov,14 K. Wang,35 L.B. Weinstein,21 H. Weller,7 R. Welsh,6 D.P. Weygand,17
S. Whisnant,33 M. Witkowski,1 E. Wolin,17 A. Yegneswaran,17 J. Yun,21 B. Zhang,19 J. Zhao,19 and Z. Zhou19
(The CLAS Collaboration)1Rensselaer Polytechnic Institute, Troy, NY 12180, USA
2Arizona State University, Tempe, AZ 85287, USA3Carnegie Mellon University, Pittsburgh, PA 15213, USA
4Catholic University of America, Washington D.C., 20064, USA5Christopher Newport University, Newport News, VA 23606, USA
6College of William and Mary, Williamsburg, VA 23187, USA7Duke University, Physics Bldg. TUNL, Durham, NC 27706, USA
8Edinburgh University, Edinburgh EH9 3JZ, United Kingdom9Florida International University, Miami, FL 33199, USA
10Florida State University,Tallahassee, FL 32306, USA11George Washington University, Washington D. C., 20052 USA
12Istituto Nazionale di Fisica Nucleare, Laboratori Nazionali di Frascati, P.O. 13, 00044 Frascati, Italy13Istituto Nazionale di Fisica Nucleare, Sezione di Genova e Dipartimento di Fisica dell’Universita, 16146 Genova, Italy
14Institute of Theoretical and Experimental Physics, 25 B. Cheremushkinskaya, Moscow, 117259, Russia15Institut de Physique Nucleaire d’Orsay, IN2P3, BP 1, 91406 Orsay, France
16James Madison University, Department of Physics, Harrisonburg, VA 22807, USA17Thomas Jefferson National Accelerator Facility, 12000 Jefferson Avenue, Newport News, VA 23606, USA
18Kyungpook National University, Taegu 702-701, South Korea19M.I.T.-Bates Linear Accelerator, Middleton, MA 01949, USA
20Norfolk State University, Norfolk VA 23504, USA21Old Dominion University, Norfolk VA 23529, USA
22Ohio University, Athens, OH 45701, USA23Rice University, Bonner Lab, Box 1892, Houston, TX 77251, USA24CEA Saclay, DAPNIA-SPhN, F91191 Gif-sur-Yvette Cedex, France
25Union College, Schenectady, NY 12308, USA26University of California at Los Angeles, Los Angeles, CA 90095, USA
2
27University of Connecticut, Storrs, CT 06269, USA28University of Massachusetts, Amherst, MA 01003, USA
29University of Moscow, Moscow, 119899 Russia30University of New Hampshire, Durham, NH 03824, USA
31University of Pittsburgh, Pittsburgh, PA 15260, USA32University of Richmond, Richmond, VA 23173, USA
33University of South Carolina, Columbia, SC 29208, USA34University of Texas at El Paso, El Paso, Texas 79968, USA
35University of Virginia, Charlottesville, VA 22903, USA36Virginia Polytechnic and State University, Blacksburg, VA 24061, USA
37Yerevan Physics Institute, 375036 Yerevan, Armenia
(Dated: February 8, 2008)
Measurements of the angular distributions of target and double spin asymmetries for the ∆+(1232)in the exclusive channel ~p(~e, e′p)π0 obtained at Jefferson Lab in the Q2 range from 0.5 to 1.5GeV2/c2 are presented. Results of the asymmetries are compared with the unitary isobar model [1],dynamical models [2, 3], and the effective Lagrangian theory [4]. Sensitivity to the different modelswas observed, particularly in relation to the description of background terms on which the targetasymmetry depends significantly.
PACS numbers: 13.60.Le, 13.88.+e, 14.20.Gk
I. INTRODUCTION
The ∆(1232) resonance has been one of the most stud-ied objects in nuclear physics. As the lowest energy nu-cleon excitation it dominates the low energy cross sec-tions for pion- and electromagnetic-induced reactions,and is almost completely separated in excitation energyfrom the many broad higher mass resonances. There isextensive theoretical literature attempting to character-ize the electromagnetic excitation of the ∆(1232). Ex-amples of some approaches are: effective Lagrangianmodels [1, 2, 3, 4, 5, 6, 7], dispersion relations [8],partial-wave-analysis [9], quark models [10, 11], QCDsum-rule models [12], or the generalized parton distri-bution (GPD) approach [13, 14], and perturbative QCDwith QCD sum-rules [15]. In recent years there has beenconsiderable experimental activity using polarized realphotons at LEGS [16] and Mainz [17], unpolarized elec-trons at Bonn [18] and Jefferson Lab (JLab) [19, 20], po-larized electrons at Mainz [21] and JLab [22],and polar-ized electrons with recoil polarization at Mainz [23] andBates [24], which have focused on constraining our under-standing of the electromagnetic structure of the ∆(1232).
It has long been realized that the proper extraction ofresonance information from experimental data requiresan understanding of non-resonant contributions in thevicinity of the resonance pole. Some of the previously-mentioned theoretical approaches have been developedto obtain a more realistic description of the full pionproduction amplitude and in particular the determina-tion of the resonance contributions. It was found thatcertain polarization observables e.g. single spin asym-metries, where the polarization of only one particle is
∗Contact Author [email protected]
determined, are sensitive to interferences between reso-nant and non-resonant contributions, while double po-larization observables are more constrained by resonantcontributions. Both contain information not containedin unpolarized cross sections alone.
The main aim of this article is to present the resultsof a measurement of polarization observables in singleπ electro-production. It is expected that these results,together with other data will aid in reaching a better un-derstanding of what is the most appropriate descriptionof the complete pion production amplitude in the regionof the ∆(1232).
Among the theoretical approaches which have ap-peared during the past several years with the aim of ex-tracting resonance amplitudes from existing data is theaforementioned effective Lagrangian model [1] (MAID)and [4] (DM), in which the degrees of freedom are baryonand meson currents. These models include pion scatter-ing effects by using the K-matrix method to unitarizethe amplitude. The differences between MAID and DMarise mainly from some rather significant differences intheir starting effective Lagrangians. In particular, MAIDuses a mixture of pseudo-scalar and pseudo-vector forthe πNN coupling, while DM uses the standard pseudo-vector coupling. MAID includes some higher resonancesand hence has more freedom in fitting the data.
A major controversy which has developed is that theresonance amplitude calculated in the framework of thequark model [10] is significantly smaller than that ex-tracted from effective Lagrangian models. Such a signif-icant difference (∼30%) for the presumably best under-stood resonance points to a very serious shortcoming forthe quark model. However, it has been pointed out bythe authors of ref. [10] that the quark models - so far - arenot able to take into account the coupling of the quarksto the pion cloud, and if this were rectified, one wouldexpect better agreement with the amplitudes extractedfrom effective Lagrangian models.
3
With this in mind, an elaboration [2] of the effectiveLagrangian model, the dynamic model (SL), was devel-oped in which the primary resonant and non-resonantinteractions involving the pion cloud are treated in a con-sistent coupled channel approach to all orders. This wasfollowed by analogous dynamic formulations [7] (DMT).The SL model obtains the unitary amplitudes by solvingdynamical πN scattering equations. Thus the pion cloudeffects on the extracted ‘dressed’ N −∆ can be identifiedand an interpretation of the resulting ‘bare’ parametersin terms of constituent quark model calculations has beenestablished. The DMT model uses a chiral Lagrangianwhich includes the pion re-scattering in a coupled channelt − matrix approach.
The net result yields a bare ∆(1232) resonance ampli-tudes, stripped of its coupling with non resonant channelsdressed ∆(1232), which is smaller than obtained in themore traditional effective Lagrangian formulations, andin better agreement with that obtained obtained with thequark model. The coupling to all orders is also effectedin the dispersion relation calculation [8], and again it isfound that the bare ∆(1232) agrees better with that of thequark model. The most important constraints for thesemodels have been the high quality non-polarized crosssections which have appeared in recent years [19, 20].
The analysis of JLab unpolarized cross sectiondata [19, 20] using these various theoretical formalismsyield very different extracted non-leading amplitudesRe(E1+/M1+) and Re(S1+/M1+), depending on themodel used. This is especially true with increasing mo-mentum transfer, i.e. for Q2 in the multi GeV2/c2, wherethe relative contribution of the non-resonant amplitudesbecome more important relative to the resonant ampli-tudes. Thus, in order to obtain confident estimates of theresonant amplitudes one needs to determine which formu-lation best accounts for the overall body of the world’sdata.
In addition to the non-polarized cross sections, thesetheoretical formulations can predict interference crosssections which can only be accessed by polarization vari-ables. Of note are the enhanced sensitivities to inter-ferences between resonant and non-resonant amplitudes.Such interferences can offer strong constraints on mod-els for extracting the interplay between resonant andnon-resonant amplitudes. For example, in the case ofthe Mainz [21] single electron asymmetry data Q2 = 0.2GeV2/c2, the predictions of some of the above theoret-ical formulations [1, 2, 7] differ significantly, and nonegive fully satisfactory agreements with the data. The au-thors speculated that the treatments of the non-resonantbackgrounds may be the cause, though no quantitativecomparisons between the different predictions and exper-iment were made. The JLab data [22] obtained at higherQ2 = 0.4 and .65 GeV2/c2 were also compared with theresults of the same theory gave equally divergent results.
In the case of the Mainz [23] and Bates [24] recoilpolarization experiments at Q2 ∼ 0.1 GeV2/c2, compar-isons were made with one of the models (MAID) to ex-
tract the ∆(1232) quadrupole amplitude Re(S1+/M1+).However, since the different models are shown to yielddifferent results for non-leading amplitudes when com-pared to other data, it would seem that one would needbetter confidence in the theoretical basis.
With this background in mind, the present reportprovides independent double polarization data, whichwill be useful in testing the models, especially at previ-ously unexplored higher Q2 (0.5 to 1.5 GeV2/c2), wherenew physics may be opening up, and background ef-fects are becoming relatively more important. The re-action studied in the presently reported experiment is~e+~p → e′+p+π0, where the scattered electron and emit-ted proton were observed in coincidence, and the π0 wasidentified by the missing mass technique. Although thefeasibility of exclusive coincidence experiments involvingtarget and beam double polarization was demonstratedin the reaction ~e+ ~p → e′ +n+π+ in ref. [25], this is thefirst time such experiments are carried out in which theQ2 behavior of the target and double spin asymmetriesfor a specific resonance are explored in the GeV rangeof momentum transfer. We expect these unique polar-ization observables to give significant constraints for im-proving theories of the ∆(1232) electro-production pro-cess.
In addition, quantitative comparisons are made to thepredictions of the four theoretical approaches, MAID [1],SL [2], DMT [3] and DM [4],
II. FORMALISM
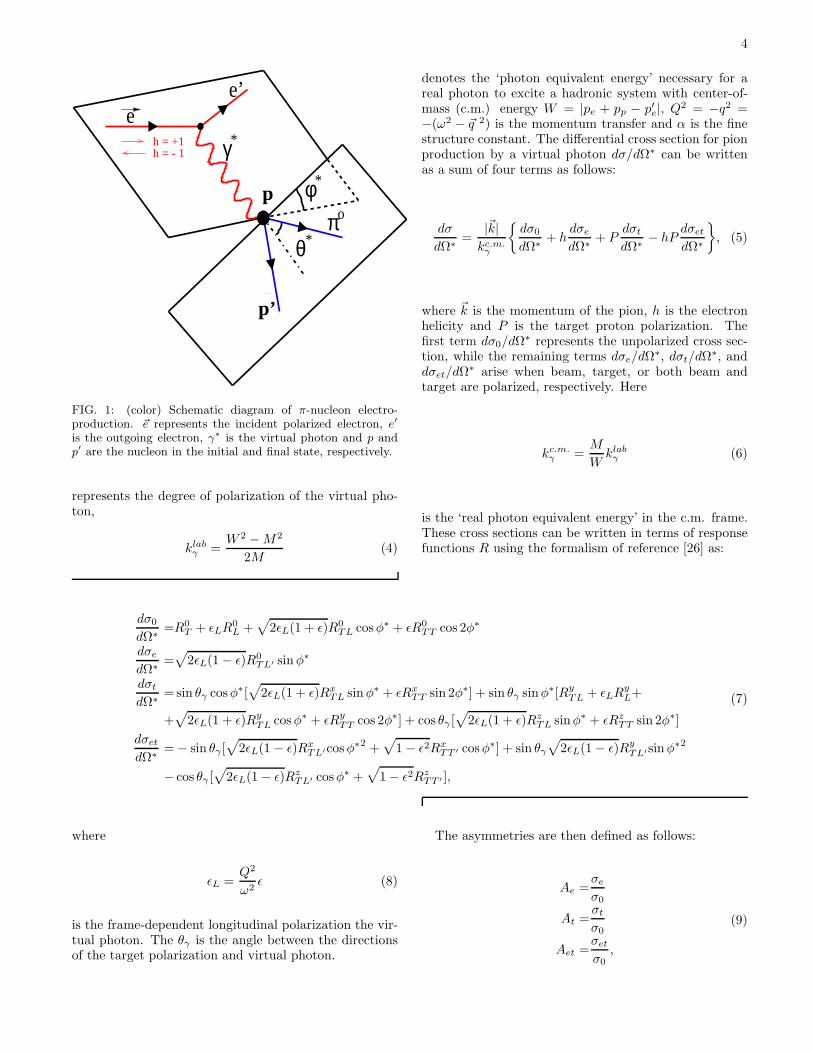
In this experiment single mesons are produced by apolarized electron beam incident on a polarized pro-ton target polarized parallel or antiparallel to the elec-tron beam direction, as schematically shown in Figure 1.The incident polarized electron is given by the 4-vectorpe = (~pe, Ei), the outgoing electron is emitted with an-gles φe, θe and 4-vector p′e = (~pe
′, Ef ), the virtual pho-ton is characterized by q = (~q, ω) where ~q = ~pe − ~pe
′ andω = Ei − Ef and the nucleon initial and final states aregiven by pp = (0, M) and p′p = (~pp, Ep), respectively. Interms of these variables the cross section can be writtenas:
dσ
dEfdΩedΩ∗= Γ
dσ
dΩ∗, (1)
where dΩe = sin θedθedφe is the electron solid angle,dΩ∗ = sin θ∗dθ∗dφ∗ is the solid angle of the meson inthe center of mass,
Γ =α
2π2
Ef
Ei
klabγ
Q2
1
1 − ǫ(2)
is the virtual photon flux,
ǫ = (1 + 2| ~q |2Q2
tan2 θe
2)−1 (3)
4
ee’
γ*
πo
p
θ*
φ*
h = +1h = - 1
p
p’
FIG. 1: (color) Schematic diagram of π-nucleon electro-production. ~e represents the incident polarized electron, e′
is the outgoing electron, γ∗ is the virtual photon and p andp′ are the nucleon in the initial and final state, respectively.
represents the degree of polarization of the virtual pho-ton,
klabγ =
W 2 − M2
2M(4)
denotes the ‘photon equivalent energy’ necessary for areal photon to excite a hadronic system with center-of-mass (c.m.) energy W = |pe + pp − p′e|, Q2 = −q2 =−(ω2 − ~q 2) is the momentum transfer and α is the finestructure constant. The differential cross section for pionproduction by a virtual photon dσ/dΩ∗ can be writtenas a sum of four terms as follows:
dσ
dΩ∗=
|~k|kc.m.
γ
dσ0
dΩ∗+ h
dσe
dΩ∗+ P
dσt
dΩ∗− hP
dσet
dΩ∗
, (5)
where ~k is the momentum of the pion, h is the electronhelicity and P is the target proton polarization. Thefirst term dσ0/dΩ∗ represents the unpolarized cross sec-tion, while the remaining terms dσe/dΩ∗, dσt/dΩ∗, anddσet/dΩ∗ arise when beam, target, or both beam andtarget are polarized, respectively. Here
kc.m.γ =
M
Wklab
γ (6)
is the ‘real photon equivalent energy’ in the c.m. frame.These cross sections can be written in terms of responsefunctions R using the formalism of reference [26] as:
dσ0
dΩ∗=R0
T + ǫLR0L +
√
2ǫL(1 + ǫ)R0TL cosφ∗ + ǫR0
TT cos 2φ∗
dσe
dΩ∗=
√
2ǫL(1 − ǫ)R0TL′ sin φ∗
dσt
dΩ∗=sin θγ cosφ∗[
√
2ǫL(1 + ǫ)RxTL sin φ∗ + ǫRx
TT sin 2φ∗] + sin θγ sinφ∗[RyTL + ǫLRy
L+
+√
2ǫL(1 + ǫ)RyTL cosφ∗ + ǫRy
TT cos 2φ∗] + cos θγ [√
2ǫL(1 + ǫ)RzTL sinφ∗ + ǫRz
TT sin 2φ∗]
dσet
dΩ∗= − sin θγ [
√
2ǫL(1 − ǫ)RxTL′cosφ∗2 +
√
1 − ǫ2RxTT ′ cosφ∗] + sin θγ
√
2ǫL(1 − ǫ)RyTL′sin φ∗2
− cos θγ [√
2ǫL(1 − ǫ)RzTL′ cosφ∗ +
√
1 − ǫ2RzTT ′ ],
(7)
where
ǫL =Q2
ω2ǫ (8)
is the frame-dependent longitudinal polarization the vir-tual photon. The θγ is the angle between the directionsof the target polarization and virtual photon.
The asymmetries are then defined as follows:
Ae =σe
σ0
At =σt
σ0
Aet =σet
σ0
,
(9)
5
where σ0 ≡ dσ0/dΩ∗, σe ≡ dσe/dΩ∗, σt ≡ dσt/dΩ∗, andσet ≡ dσet/dΩ∗.
III. EXPERIMENTAL SETUP
The experiment was carried out from September to De-cember 1998 using the CEBAF Large Acceptance Spec-trometer (CLAS) at JLAB, using a polarized electronbeam of energy E = 2.565 GeV at an average beam cur-rent of about 2 nA. Pairs of complementary helicity stateswere created pseudo-randomly by a pockel cell producingcircularly polarized laser light used to generate polarizedelectrons from a strained GaAs photocathode [27]. Eachpair of complementary helicity states had a duration of2 sec. Helicity-correlated systematic uncertainties are re-duced by selecting the first helicity of the pair pseudo-randomly. The average polarization of the beam for theentire data set, measured with a Møller polarimeter, wasPe = 0.71± 0.01. The beam was rastered in a spiral pat-tern of 1-1.2 cm diameter over the surface of the targetto avoid destroying the target polarization.
The electrons impinged on a solid ammonia (NH3) tar-get of thickness 530 mg/cm2, in which the free protonswere longitudinally polarized. The target polarizationwas changed every 2-3 weeks. Dynamic nuclear polar-
ization (DNP)[28, 29] was used to polarize this targetusing a 5 T uniform holding-field generated by a super-conducting Helmholtz-like coil placed axially around thetarget. This coil limited the available scattering anglesto less than 45 and between 70 and 110. A morecomplete description of the target and polarization tech-nique may be found in Ref. [30]. Typically, the polar-izations achieved for positive and negative polarizationswere about 39% and 55%, respectively. The effective in-stantaneous luminosity for the polarized Hydrogen wasabout 6.6 × 1032 cm−2s−1.
Scattered electrons and recoiled protons were detectedin the CLAS, which is described in detail in Ref. [31].An event was triggered when a coincidence betweenthe threshold Cherenkov counter (CC) and the elec-tromagnetic calorimeter (EC) was detected. A typicalCherenkov signal consisted of 6 to 12 photo-electrons(PE), with an average of about 10. The trigger thresholdwas set at 0.5 PE. Electron candidates were identified bya combination of time-of-flight (TOF) scintillators, CC,and EC. The TOF scintillators completely surround thedrift chambers whereas the EC and the CC subtend an-gles less than 45 with respect to the beam line. Themomenta of the detected particles were determined byfitting their measured trajectories in the toroidal field,which curves the tracks in the θ direction but leaves themnearly unaffected in the φ direction. The trajectories aredetermined by 3 sets of drift chambers (DC), the innermost having 10 layers and the other two having each 12layers of drift cells.
IV. DATA REDUCTION AND ANALYSIS
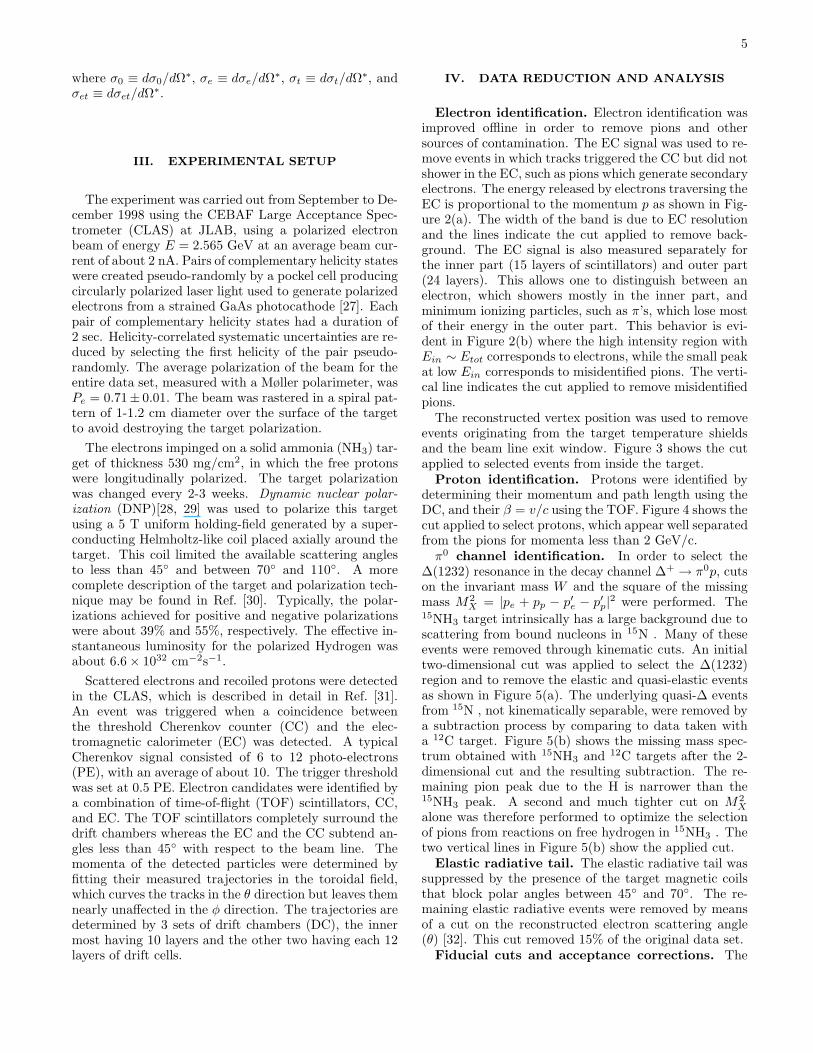
Electron identification. Electron identification wasimproved offline in order to remove pions and othersources of contamination. The EC signal was used to re-move events in which tracks triggered the CC but did notshower in the EC, such as pions which generate secondaryelectrons. The energy released by electrons traversing theEC is proportional to the momentum p as shown in Fig-ure 2(a). The width of the band is due to EC resolutionand the lines indicate the cut applied to remove back-ground. The EC signal is also measured separately forthe inner part (15 layers of scintillators) and outer part(24 layers). This allows one to distinguish between anelectron, which showers mostly in the inner part, andminimum ionizing particles, such as π’s, which lose mostof their energy in the outer part. This behavior is evi-dent in Figure 2(b) where the high intensity region withEin ∼ Etot corresponds to electrons, while the small peakat low Ein corresponds to misidentified pions. The verti-cal line indicates the cut applied to remove misidentifiedpions.
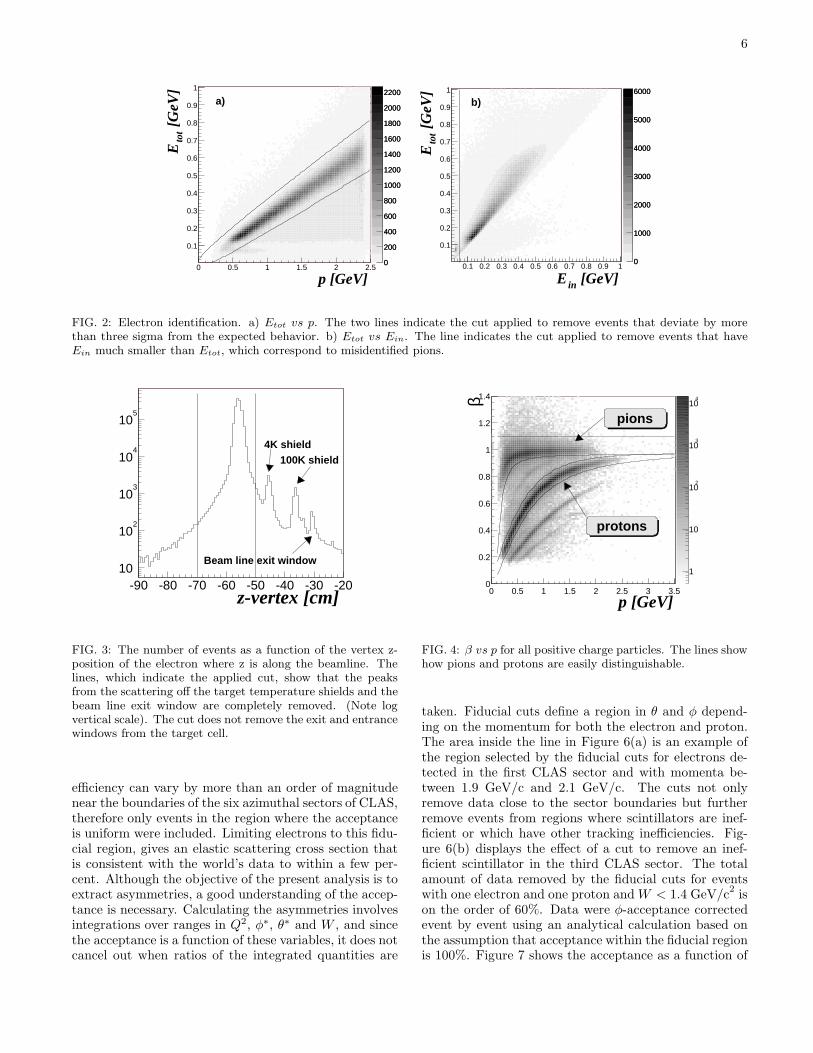
The reconstructed vertex position was used to removeevents originating from the target temperature shieldsand the beam line exit window. Figure 3 shows the cutapplied to selected events from inside the target.
Proton identification. Protons were identified bydetermining their momentum and path length using theDC, and their β = v/c using the TOF. Figure 4 shows thecut applied to select protons, which appear well separatedfrom the pions for momenta less than 2 GeV/c.
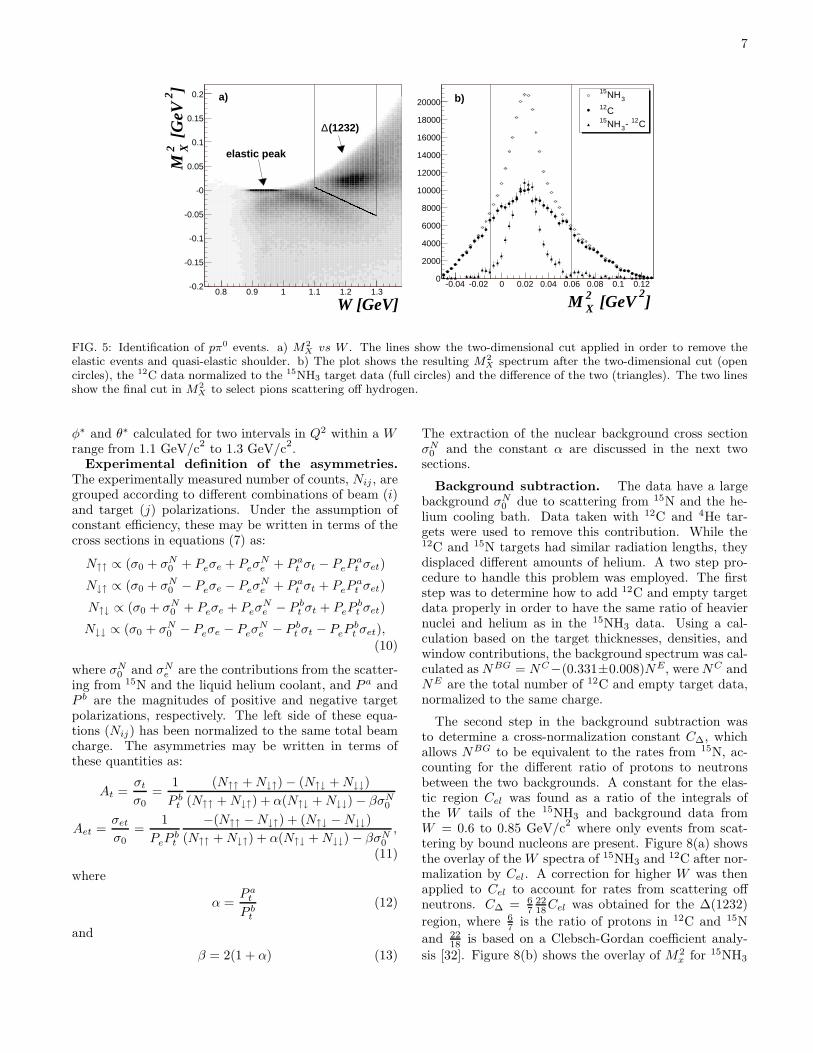
π0 channel identification. In order to select the∆(1232) resonance in the decay channel ∆+ → π0p, cutson the invariant mass W and the square of the missingmass M2
X = |pe + pp − p′e − p′p|2 were performed. The15NH3 target intrinsically has a large background due toscattering from bound nucleons in 15N . Many of theseevents were removed through kinematic cuts. An initialtwo-dimensional cut was applied to select the ∆(1232)region and to remove the elastic and quasi-elastic eventsas shown in Figure 5(a). The underlying quasi-∆ eventsfrom 15N , not kinematically separable, were removed bya subtraction process by comparing to data taken witha 12C target. Figure 5(b) shows the missing mass spec-trum obtained with 15NH3 and 12C targets after the 2-dimensional cut and the resulting subtraction. The re-maining pion peak due to the H is narrower than the15NH3 peak. A second and much tighter cut on M2
X
alone was therefore performed to optimize the selectionof pions from reactions on free hydrogen in 15NH3 . Thetwo vertical lines in Figure 5(b) show the applied cut.
Elastic radiative tail. The elastic radiative tail wassuppressed by the presence of the target magnetic coilsthat block polar angles between 45 and 70. The re-maining elastic radiative events were removed by meansof a cut on the reconstructed electron scattering angle(θ) [32]. This cut removed 15% of the original data set.
Fiducial cuts and acceptance corrections. The
6
0
200
400
600
800
1000
1200
1400
1600
1800
2000
2200
p [GeV]0 0.5 1 1.5 2 2.5
[G
eV]
tot
E
0.1
0.2
0.3
0.4
0.5
0.6
0.7
0.8
0.9
1
0
200
400
600
800
1000
1200
1400
1600
1800
2000
2200a)
0
1000
2000
3000
4000
5000
6000
[GeV]inE0.1 0.2 0.3 0.4 0.5 0.6 0.7 0.8 0.9 1
[G
eV]
tot
E
0.1
0.2
0.3
0.4
0.5
0.6
0.7
0.8
0.9
1
0
1000
2000
3000
4000
5000
6000
b)
FIG. 2: Electron identification. a) Etot vs p. The two lines indicate the cut applied to remove events that deviate by morethan three sigma from the expected behavior. b) Etot vs Ein. The line indicates the cut applied to remove events that haveEin much smaller than Etot, which correspond to misidentified pions.
z-vertex [cm]-90 -80 -70 -60 -50 -40 -30 -20
10
102
103
104
105
4K shield100K shield
Beam line exit window
FIG. 3: The number of events as a function of the vertex z-position of the electron where z is along the beamline. Thelines, which indicate the applied cut, show that the peaksfrom the scattering off the target temperature shields and thebeam line exit window are completely removed. (Note logvertical scale). The cut does not remove the exit and entrancewindows from the target cell.
efficiency can vary by more than an order of magnitudenear the boundaries of the six azimuthal sectors of CLAS,therefore only events in the region where the acceptanceis uniform were included. Limiting electrons to this fidu-cial region, gives an elastic scattering cross section thatis consistent with the world’s data to within a few per-cent. Although the objective of the present analysis is toextract asymmetries, a good understanding of the accep-tance is necessary. Calculating the asymmetries involvesintegrations over ranges in Q2, φ∗, θ∗ and W , and sincethe acceptance is a function of these variables, it does notcancel out when ratios of the integrated quantities are
1
10
102
103
104
p [GeV]0 0.5 1 1.5 2 2.5 3 3.5
β
0
0.2
0.4
0.6
0.8
1
1.2
1.4
pions
protons
FIG. 4: β vs p for all positive charge particles. The lines showhow pions and protons are easily distinguishable.
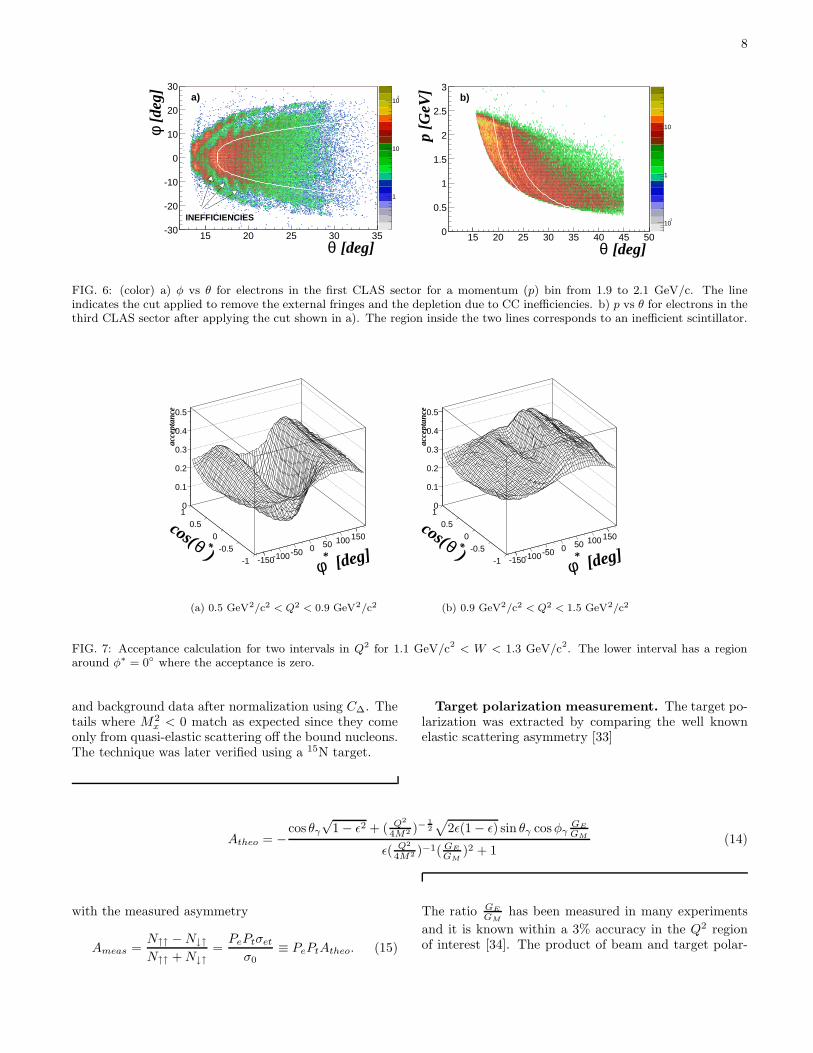
taken. Fiducial cuts define a region in θ and φ depend-ing on the momentum for both the electron and proton.The area inside the line in Figure 6(a) is an example ofthe region selected by the fiducial cuts for electrons de-tected in the first CLAS sector and with momenta be-tween 1.9 GeV/c and 2.1 GeV/c. The cuts not onlyremove data close to the sector boundaries but furtherremove events from regions where scintillators are inef-ficient or which have other tracking inefficiencies. Fig-ure 6(b) displays the effect of a cut to remove an inef-ficient scintillator in the third CLAS sector. The totalamount of data removed by the fiducial cuts for eventswith one electron and one proton and W < 1.4 GeV/c
2is
on the order of 60%. Data were φ-acceptance correctedevent by event using an analytical calculation based onthe assumption that acceptance within the fiducial regionis 100%. Figure 7 shows the acceptance as a function of
7
W [GeV]0.8 0.9 1 1.1 1.2 1.3
]2 [
GeV
2 XM
-0.2
-0.15
-0.1
-0.05
-0
0.05
0.1
0.15
0.2
(1232)∆
elastic peak
a)
]2
[GeV2XM
-0.04 -0.02 0 0.02 0.04 0.06 0.08 0.1 0.120
2000
4000
6000
8000
10000
12000
14000
16000
18000
20000 3NH15
C12 C12- 3NH15
b)
FIG. 5: Identification of pπ0 events. a) M2X vs W . The lines show the two-dimensional cut applied in order to remove the
elastic events and quasi-elastic shoulder. b) The plot shows the resulting M2X spectrum after the two-dimensional cut (open
circles), the 12C data normalized to the 15NH3 target data (full circles) and the difference of the two (triangles). The two linesshow the final cut in M2
X to select pions scattering off hydrogen.
φ∗ and θ∗ calculated for two intervals in Q2 within a Wrange from 1.1 GeV/c
2to 1.3 GeV/c
2.
Experimental definition of the asymmetries.
The experimentally measured number of counts, Nij , aregrouped according to different combinations of beam (i)and target (j) polarizations. Under the assumption ofconstant efficiency, these may be written in terms of thecross sections in equations (7) as:
N↑↑ ∝ (σ0 + σN0 + Peσe + Peσ
Ne + P a
t σt − PePat σet)
N↓↑ ∝ (σ0 + σN0 − Peσe − Peσ
Ne + P a
t σt + PePat σet)
N↑↓ ∝ (σ0 + σN0 + Peσe + Peσ
Ne − P b
t σt + PePbt σet)
N↓↓ ∝ (σ0 + σN0 − Peσe − Peσ
Ne − P b
t σt − PePbt σet),
(10)
where σN0 and σN
e are the contributions from the scatter-ing from 15N and the liquid helium coolant, and P a andP b are the magnitudes of positive and negative targetpolarizations, respectively. The left side of these equa-tions (Nij) has been normalized to the same total beamcharge. The asymmetries may be written in terms ofthese quantities as:
At =σt
σ0
=1
P bt
(N↑↑ + N↓↑) − (N↑↓ + N↓↓)
(N↑↑ + N↓↑) + α(N↑↓ + N↓↓) − βσN0
Aet =σet
σ0
=1
PePbt
−(N↑↑ − N↓↑) + (N↑↓ − N↓↓)
(N↑↑ + N↓↑) + α(N↑↓ + N↓↓) − βσN0
,
(11)
where
α =P a
t
P bt
(12)
and
β = 2(1 + α) (13)
The extraction of the nuclear background cross sectionσN
0 and the constant α are discussed in the next twosections.
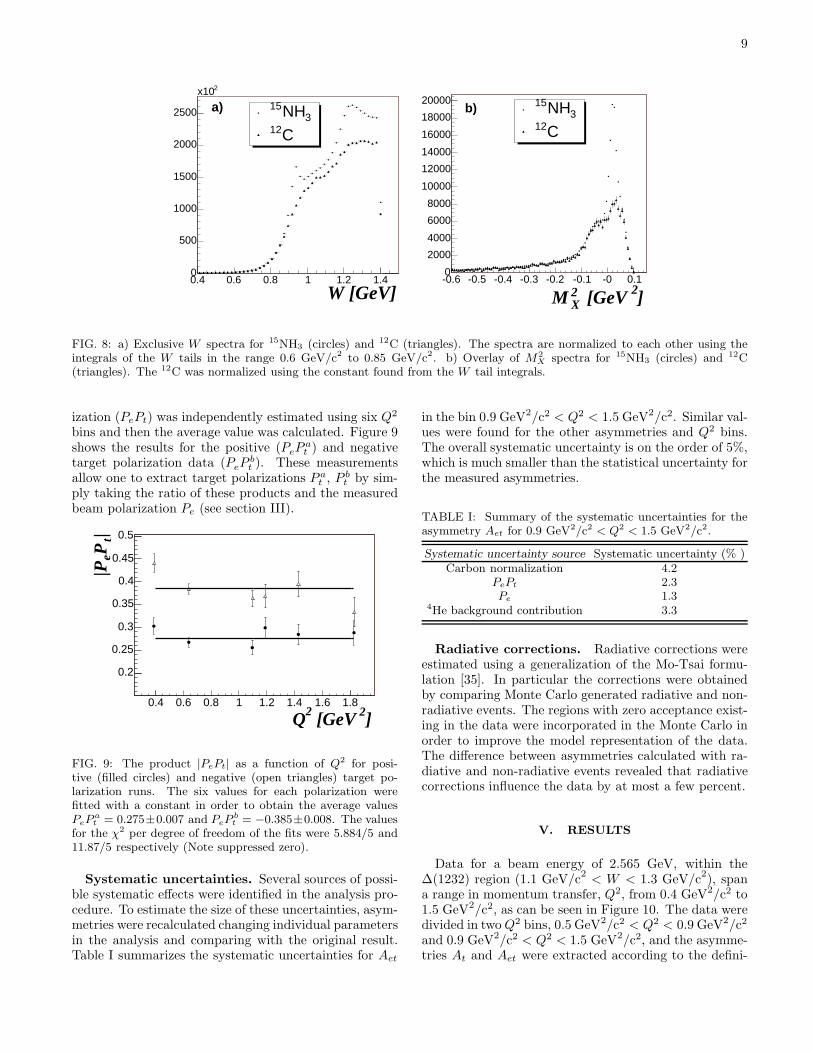
Background subtraction. The data have a largebackground σN
0 due to scattering from 15N and the he-lium cooling bath. Data taken with 12C and 4He tar-gets were used to remove this contribution. While the12C and 15N targets had similar radiation lengths, theydisplaced different amounts of helium. A two step pro-cedure to handle this problem was employed. The firststep was to determine how to add 12C and empty targetdata properly in order to have the same ratio of heaviernuclei and helium as in the 15NH3 data. Using a cal-culation based on the target thicknesses, densities, andwindow contributions, the background spectrum was cal-culated as NBG = NC−(0.331±0.008)NE, were NC andNE are the total number of 12C and empty target data,normalized to the same charge.
The second step in the background subtraction wasto determine a cross-normalization constant C∆, whichallows NBG to be equivalent to the rates from 15N, ac-counting for the different ratio of protons to neutronsbetween the two backgrounds. A constant for the elas-tic region Cel was found as a ratio of the integrals ofthe W tails of the 15NH3 and background data fromW = 0.6 to 0.85 GeV/c
2where only events from scat-
tering by bound nucleons are present. Figure 8(a) showsthe overlay of the W spectra of 15NH3 and 12C after nor-malization by Cel. A correction for higher W was thenapplied to Cel to account for rates from scattering offneutrons. C∆ = 6
72218
Cel was obtained for the ∆(1232)
region, where 67
is the ratio of protons in 12C and 15N
and 2218
is based on a Clebsch-Gordan coefficient analy-
sis [32]. Figure 8(b) shows the overlay of M2x for 15NH3
8
1
10
102
[deg]θ15 20 25 30 35
[de
g]φ
-30
-20
-10
0
10
20
30
INEFFICIENCIES
a)
10-1
1
10
[deg]θ15 20 25 30 35 40 45 50
p [G
eV]
0
0.5
1
1.5
2
2.5
3b)
FIG. 6: (color) a) φ vs θ for electrons in the first CLAS sector for a momentum (p) bin from 1.9 to 2.1 GeV/c. The lineindicates the cut applied to remove the external fringes and the depletion due to CC inefficiencies. b) p vs θ for electrons in thethird CLAS sector after applying the cut shown in a). The region inside the two lines corresponds to an inefficient scintillator.
[deg]*φ-150-100-50 0 50 100 150
)*θ
cos(-1
-0.5
0
0.5
1
acce
ptan
ce
0
0.1
0.2
0.3
0.4
0.5
(a) 0.5 GeV2/c2 < Q2 < 0.9 GeV2/c2
[deg]*φ-150-100-50 0 50 100 150
)*θ
cos(-1
-0.5
0
0.5
1
acce
ptan
ce
0
0.1
0.2
0.3
0.4
0.5
(b) 0.9 GeV2/c2 < Q2 < 1.5 GeV2/c2
FIG. 7: Acceptance calculation for two intervals in Q2 for 1.1 GeV/c2 < W < 1.3 GeV/c2. The lower interval has a regionaround φ∗ = 0 where the acceptance is zero.
and background data after normalization using C∆. Thetails where M2
x < 0 match as expected since they comeonly from quasi-elastic scattering off the bound nucleons.The technique was later verified using a 15N target.
Target polarization measurement. The target po-larization was extracted by comparing the well knownelastic scattering asymmetry [33]
Atheo = −cos θγ
√1 − ǫ2 + ( Q2
4M2 )−1
2
√
2ǫ(1 − ǫ) sin θγ cosφγGE
GM
ǫ( Q2
4M2 )−1( GE
GM
)2 + 1(14)
with the measured asymmetry
Ameas =N↑↑ − N↓↑
N↑↑ + N↓↑
=PePtσet
σ0
≡ PePtAtheo. (15)
The ratio GE
GM
has been measured in many experiments
and it is known within a 3% accuracy in the Q2 regionof interest [34]. The product of beam and target polar-
9
W [GeV]0.4 0.6 0.8 1 1.2 1.40
500
1000
1500
2000
2500
2x10
3NH15
C12
a)
]2 [GeV2XM
-0.6 -0.5 -0.4 -0.3 -0.2 -0.1 -0 0.10
2000
4000
6000
8000
10000
12000
14000
16000
18000
200003NH15
C12
b)
FIG. 8: a) Exclusive W spectra for 15NH3 (circles) and 12C (triangles). The spectra are normalized to each other using theintegrals of the W tails in the range 0.6 GeV/c2 to 0.85 GeV/c2. b) Overlay of M2
X spectra for 15NH3 (circles) and 12C(triangles). The 12C was normalized using the constant found from the W tail integrals.
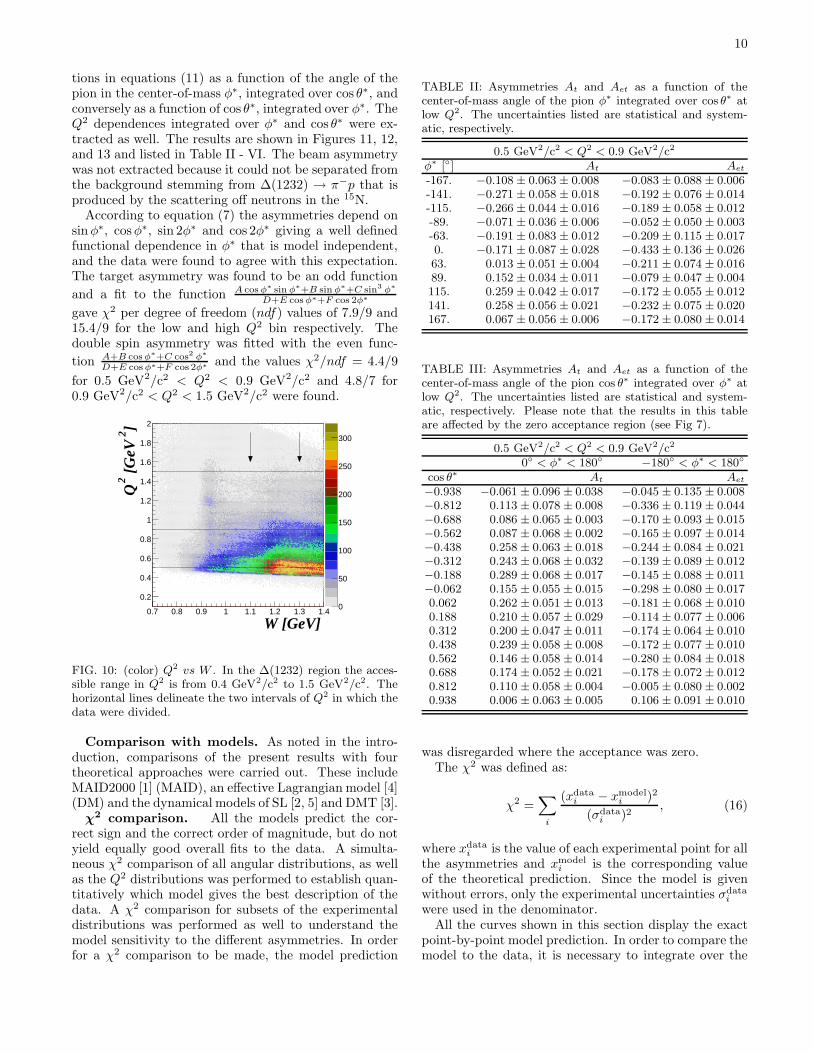
ization (PePt) was independently estimated using six Q2
bins and then the average value was calculated. Figure 9shows the results for the positive (PeP
at ) and negative
target polarization data (PePbt ). These measurements
allow one to extract target polarizations P at , P b
t by sim-ply taking the ratio of these products and the measuredbeam polarization Pe (see section III).
]2 [GeV2Q0.4 0.6 0.8 1 1.2 1.4 1.6 1.8
| tP e
|P
0.2
0.25
0.3
0.35
0.4
0.45
0.5
FIG. 9: The product |PePt| as a function of Q2 for posi-tive (filled circles) and negative (open triangles) target po-larization runs. The six values for each polarization werefitted with a constant in order to obtain the average valuesPeP
a
t = 0.275±0.007 and PePb
t = −0.385±0.008. The valuesfor the χ2 per degree of freedom of the fits were 5.884/5 and11.87/5 respectively (Note suppressed zero).
Systematic uncertainties. Several sources of possi-ble systematic effects were identified in the analysis pro-cedure. To estimate the size of these uncertainties, asym-metries were recalculated changing individual parametersin the analysis and comparing with the original result.Table I summarizes the systematic uncertainties for Aet
in the bin 0.9 GeV2/c2 < Q2 < 1.5 GeV2/c2. Similar val-ues were found for the other asymmetries and Q2 bins.The overall systematic uncertainty is on the order of 5%,which is much smaller than the statistical uncertainty forthe measured asymmetries.
TABLE I: Summary of the systematic uncertainties for theasymmetry Aet for 0.9 GeV2/c2 < Q2 < 1.5 GeV2/c2.
Systematic uncertainty source Systematic uncertainty (% )Carbon normalization 4.2
PePt 2.3Pe 1.3
4He background contribution 3.3
Radiative corrections. Radiative corrections wereestimated using a generalization of the Mo-Tsai formu-lation [35]. In particular the corrections were obtainedby comparing Monte Carlo generated radiative and non-radiative events. The regions with zero acceptance exist-ing in the data were incorporated in the Monte Carlo inorder to improve the model representation of the data.The difference between asymmetries calculated with ra-diative and non-radiative events revealed that radiativecorrections influence the data by at most a few percent.
V. RESULTS
Data for a beam energy of 2.565 GeV, within the∆(1232) region (1.1 GeV/c
2< W < 1.3 GeV/c
2), span
a range in momentum transfer, Q2, from 0.4 GeV2/c2 to1.5 GeV2/c2, as can be seen in Figure 10. The data weredivided in two Q2 bins, 0.5 GeV2/c2 < Q2 < 0.9 GeV2/c2
and 0.9 GeV2/c2 < Q2 < 1.5 GeV2/c2, and the asymme-tries At and Aet were extracted according to the defini-
10
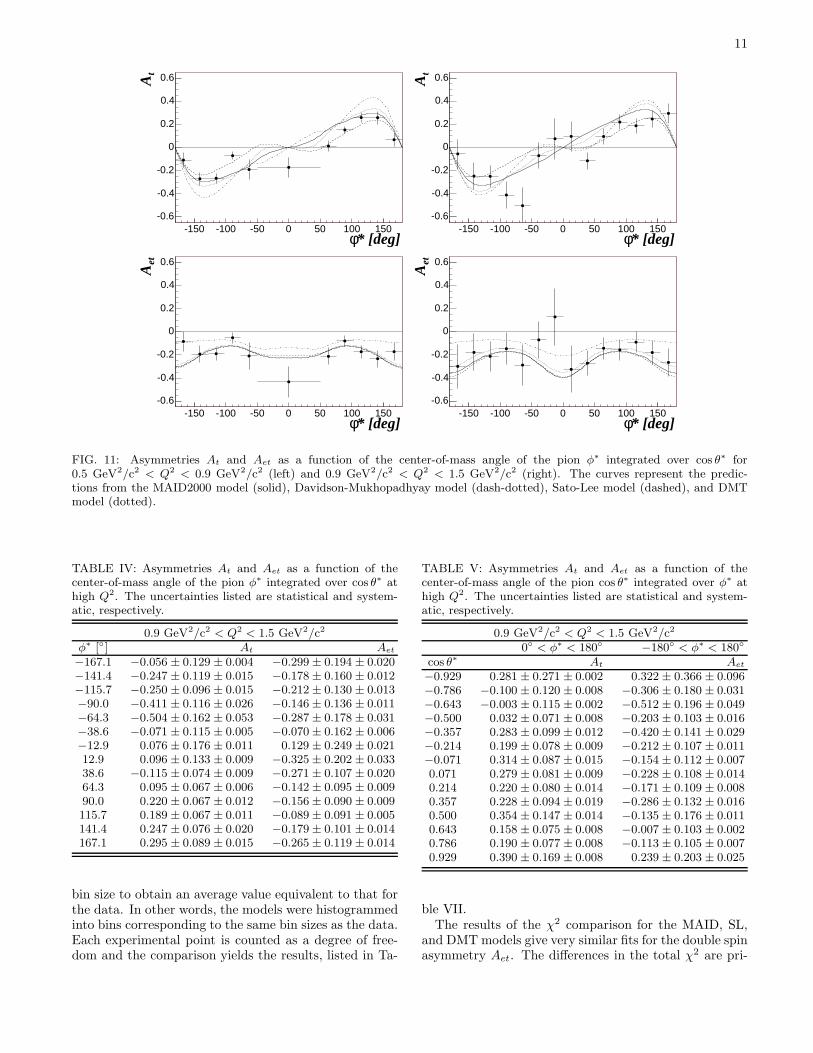
tions in equations (11) as a function of the angle of thepion in the center-of-mass φ∗, integrated over cos θ∗, andconversely as a function of cos θ∗, integrated over φ∗. TheQ2 dependences integrated over φ∗ and cos θ∗ were ex-tracted as well. The results are shown in Figures 11, 12,and 13 and listed in Table II - VI. The beam asymmetrywas not extracted because it could not be separated fromthe background stemming from ∆(1232) → π−p that isproduced by the scattering off neutrons in the 15N.
According to equation (7) the asymmetries depend onsin φ∗, cosφ∗, sin 2φ∗ and cos 2φ∗ giving a well definedfunctional dependence in φ∗ that is model independent,and the data were found to agree with this expectation.The target asymmetry was found to be an odd function
and a fit to the function A cos φ∗ sin φ∗+B sin φ∗+C sin3 φ∗
D+E cos φ∗+F cos 2φ∗
gave χ2 per degree of freedom (ndf) values of 7.9/9 and15.4/9 for the low and high Q2 bin respectively. Thedouble spin asymmetry was fitted with the even func-
tion A+B cos φ∗+C cos2 φ∗
D+E cos φ∗+F cos 2φ∗and the values χ2/ndf = 4.4/9
for 0.5 GeV2/c2 < Q2 < 0.9 GeV2/c2 and 4.8/7 for0.9 GeV2/c2 < Q2 < 1.5 GeV2/c2 were found.
0
50
100
150
200
250
300
W [GeV]0.7 0.8 0.9 1 1.1 1.2 1.3 1.4
]2 [
GeV
2Q
0.2
0.4
0.6
0.8
1
1.2
1.4
1.6
1.8
2
FIG. 10: (color) Q2 vs W . In the ∆(1232) region the acces-sible range in Q2 is from 0.4 GeV2/c2 to 1.5 GeV2/c2. Thehorizontal lines delineate the two intervals of Q2 in which thedata were divided.
Comparison with models. As noted in the intro-duction, comparisons of the present results with fourtheoretical approaches were carried out. These includeMAID2000 [1] (MAID), an effective Lagrangian model [4](DM) and the dynamical models of SL [2, 5] and DMT [3].
χ2 comparison. All the models predict the cor-
rect sign and the correct order of magnitude, but do notyield equally good overall fits to the data. A simulta-neous χ2 comparison of all angular distributions, as wellas the Q2 distributions was performed to establish quan-titatively which model gives the best description of thedata. A χ2 comparison for subsets of the experimentaldistributions was performed as well to understand themodel sensitivity to the different asymmetries. In orderfor a χ2 comparison to be made, the model prediction
TABLE II: Asymmetries At and Aet as a function of thecenter-of-mass angle of the pion φ∗ integrated over cos θ∗ atlow Q2. The uncertainties listed are statistical and system-atic, respectively.
0.5 GeV2/c2 < Q2 < 0.9 GeV2/c2
φ∗ [] At Aet
-167. −0.108 ± 0.063 ± 0.008 −0.083 ± 0.088 ± 0.006-141. −0.271 ± 0.058 ± 0.018 −0.192 ± 0.076 ± 0.014-115. −0.266 ± 0.044 ± 0.016 −0.189 ± 0.058 ± 0.012-89. −0.071 ± 0.036 ± 0.006 −0.052 ± 0.050 ± 0.003-63. −0.191 ± 0.083 ± 0.012 −0.209 ± 0.115 ± 0.0170. −0.171 ± 0.087 ± 0.028 −0.433 ± 0.136 ± 0.02663. 0.013 ± 0.051 ± 0.004 −0.211 ± 0.074 ± 0.01689. 0.152 ± 0.034 ± 0.011 −0.079 ± 0.047 ± 0.004115. 0.259 ± 0.042 ± 0.017 −0.172 ± 0.055 ± 0.012141. 0.258 ± 0.056 ± 0.021 −0.232 ± 0.075 ± 0.020167. 0.067 ± 0.056 ± 0.006 −0.172 ± 0.080 ± 0.014
TABLE III: Asymmetries At and Aet as a function of thecenter-of-mass angle of the pion cos θ∗ integrated over φ∗ atlow Q2. The uncertainties listed are statistical and system-atic, respectively. Please note that the results in this tableare affected by the zero acceptance region (see Fig 7).
0.5 GeV2/c2 < Q2 < 0.9 GeV2/c2
0 < φ∗ < 180 −180 < φ∗ < 180
cos θ∗ At Aet
−0.938 −0.061 ± 0.096 ± 0.038 −0.045 ± 0.135 ± 0.008−0.812 0.113 ± 0.078 ± 0.008 −0.336 ± 0.119 ± 0.044−0.688 0.086 ± 0.065 ± 0.003 −0.170 ± 0.093 ± 0.015−0.562 0.087 ± 0.068 ± 0.002 −0.165 ± 0.097 ± 0.014−0.438 0.258 ± 0.063 ± 0.018 −0.244 ± 0.084 ± 0.021−0.312 0.243 ± 0.068 ± 0.032 −0.139 ± 0.089 ± 0.012−0.188 0.289 ± 0.068 ± 0.017 −0.145 ± 0.088 ± 0.011−0.062 0.155 ± 0.055 ± 0.015 −0.298 ± 0.080 ± 0.0170.062 0.262 ± 0.051 ± 0.013 −0.181 ± 0.068 ± 0.0100.188 0.210 ± 0.057 ± 0.029 −0.114 ± 0.077 ± 0.0060.312 0.200 ± 0.047 ± 0.011 −0.174 ± 0.064 ± 0.0100.438 0.239 ± 0.058 ± 0.008 −0.172 ± 0.077 ± 0.0100.562 0.146 ± 0.058 ± 0.014 −0.280 ± 0.084 ± 0.0180.688 0.174 ± 0.052 ± 0.021 −0.178 ± 0.072 ± 0.0120.812 0.110 ± 0.058 ± 0.004 −0.005 ± 0.080 ± 0.0020.938 0.006 ± 0.063 ± 0.005 0.106 ± 0.091 ± 0.010
was disregarded where the acceptance was zero.The χ2 was defined as:
χ2 =∑
i
(xdatai − xmodel
i )2
(σdatai )2
, (16)
where xdatai is the value of each experimental point for all
the asymmetries and xmodeli is the corresponding value
of the theoretical prediction. Since the model is givenwithout errors, only the experimental uncertainties σdata
i
were used in the denominator.All the curves shown in this section display the exact
point-by-point model prediction. In order to compare themodel to the data, it is necessary to integrate over the
11
* [deg]φ-150 -100 -50 0 50 100 150
tA
-0.6
-0.4
-0.2
0
0.2
0.4
0.6
* [deg]φ-150 -100 -50 0 50 100 150
tA
-0.6
-0.4
-0.2
0
0.2
0.4
0.6
* [deg]φ-150 -100 -50 0 50 100 150
etA
-0.6
-0.4
-0.2
0
0.2
0.4
0.6
* [deg]φ-150 -100 -50 0 50 100 150
etA
-0.6
-0.4
-0.2
0
0.2
0.4
0.6
FIG. 11: Asymmetries At and Aet as a function of the center-of-mass angle of the pion φ∗ integrated over cos θ∗ for0.5 GeV2/c2 < Q2 < 0.9 GeV2/c2 (left) and 0.9 GeV2/c2 < Q2 < 1.5 GeV2/c2 (right). The curves represent the predic-tions from the MAID2000 model (solid), Davidson-Mukhopadhyay model (dash-dotted), Sato-Lee model (dashed), and DMTmodel (dotted).
TABLE IV: Asymmetries At and Aet as a function of thecenter-of-mass angle of the pion φ∗ integrated over cos θ∗ athigh Q2. The uncertainties listed are statistical and system-atic, respectively.
0.9 GeV2/c2 < Q2 < 1.5 GeV2/c2
φ∗ [] At Aet
−167.1 −0.056 ± 0.129 ± 0.004 −0.299 ± 0.194 ± 0.020−141.4 −0.247 ± 0.119 ± 0.015 −0.178 ± 0.160 ± 0.012−115.7 −0.250 ± 0.096 ± 0.015 −0.212 ± 0.130 ± 0.013−90.0 −0.411 ± 0.116 ± 0.026 −0.146 ± 0.136 ± 0.011−64.3 −0.504 ± 0.162 ± 0.053 −0.287 ± 0.178 ± 0.031−38.6 −0.071 ± 0.115 ± 0.005 −0.070 ± 0.162 ± 0.006−12.9 0.076 ± 0.176 ± 0.011 0.129 ± 0.249 ± 0.02112.9 0.096 ± 0.133 ± 0.009 −0.325 ± 0.202 ± 0.03338.6 −0.115 ± 0.074 ± 0.009 −0.271 ± 0.107 ± 0.02064.3 0.095 ± 0.067 ± 0.006 −0.142 ± 0.095 ± 0.00990.0 0.220 ± 0.067 ± 0.012 −0.156 ± 0.090 ± 0.009115.7 0.189 ± 0.067 ± 0.011 −0.089 ± 0.091 ± 0.005141.4 0.247 ± 0.076 ± 0.020 −0.179 ± 0.101 ± 0.014167.1 0.295 ± 0.089 ± 0.015 −0.265 ± 0.119 ± 0.014
bin size to obtain an average value equivalent to that forthe data. In other words, the models were histogrammedinto bins corresponding to the same bin sizes as the data.Each experimental point is counted as a degree of free-dom and the comparison yields the results, listed in Ta-
TABLE V: Asymmetries At and Aet as a function of thecenter-of-mass angle of the pion cos θ∗ integrated over φ∗ athigh Q2. The uncertainties listed are statistical and system-atic, respectively.
0.9 GeV2/c2 < Q2 < 1.5 GeV2/c2
0 < φ∗ < 180 −180 < φ∗ < 180
cos θ∗ At Aet
−0.929 0.281 ± 0.271 ± 0.002 0.322 ± 0.366 ± 0.096−0.786 −0.100 ± 0.120 ± 0.008 −0.306 ± 0.180 ± 0.031−0.643 −0.003 ± 0.115 ± 0.002 −0.512 ± 0.196 ± 0.049−0.500 0.032 ± 0.071 ± 0.008 −0.203 ± 0.103 ± 0.016−0.357 0.283 ± 0.099 ± 0.012 −0.420 ± 0.141 ± 0.029−0.214 0.199 ± 0.078 ± 0.009 −0.212 ± 0.107 ± 0.011−0.071 0.314 ± 0.087 ± 0.015 −0.154 ± 0.112 ± 0.0070.071 0.279 ± 0.081 ± 0.009 −0.228 ± 0.108 ± 0.0140.214 0.220 ± 0.080 ± 0.014 −0.171 ± 0.109 ± 0.0080.357 0.228 ± 0.094 ± 0.019 −0.286 ± 0.132 ± 0.0160.500 0.354 ± 0.147 ± 0.014 −0.135 ± 0.176 ± 0.0110.643 0.158 ± 0.075 ± 0.008 −0.007 ± 0.103 ± 0.0020.786 0.190 ± 0.077 ± 0.008 −0.113 ± 0.105 ± 0.0070.929 0.390 ± 0.169 ± 0.008 0.239 ± 0.203 ± 0.025
ble VII.The results of the χ2 comparison for the MAID, SL,
and DMT models give very similar fits for the double spinasymmetry Aet. The differences in the total χ2 are pri-
12
*θcos-1 -0.8 -0.6 -0.4 -0.2 -0 0.2 0.4 0.6 0.8 1
tA
-0.4
-0.2
0
0.2
0.4
0.6
*θcos-1 -0.8 -0.6 -0.4 -0.2 -0 0.2 0.4 0.6 0.8 1
tA
-0.4
-0.2
0
0.2
0.4
0.6
*θcos-1 -0.8 -0.6 -0.4 -0.2 -0 0.2 0.4 0.6 0.8 1
etA
-0.6
-0.4
-0.2
0
0.2
0.4
0.6
*θcos-1 -0.8 -0.6 -0.4 -0.2 -0 0.2 0.4 0.6 0.8 1
etA
-0.6
-0.4
-0.2
0
0.2
0.4
0.6
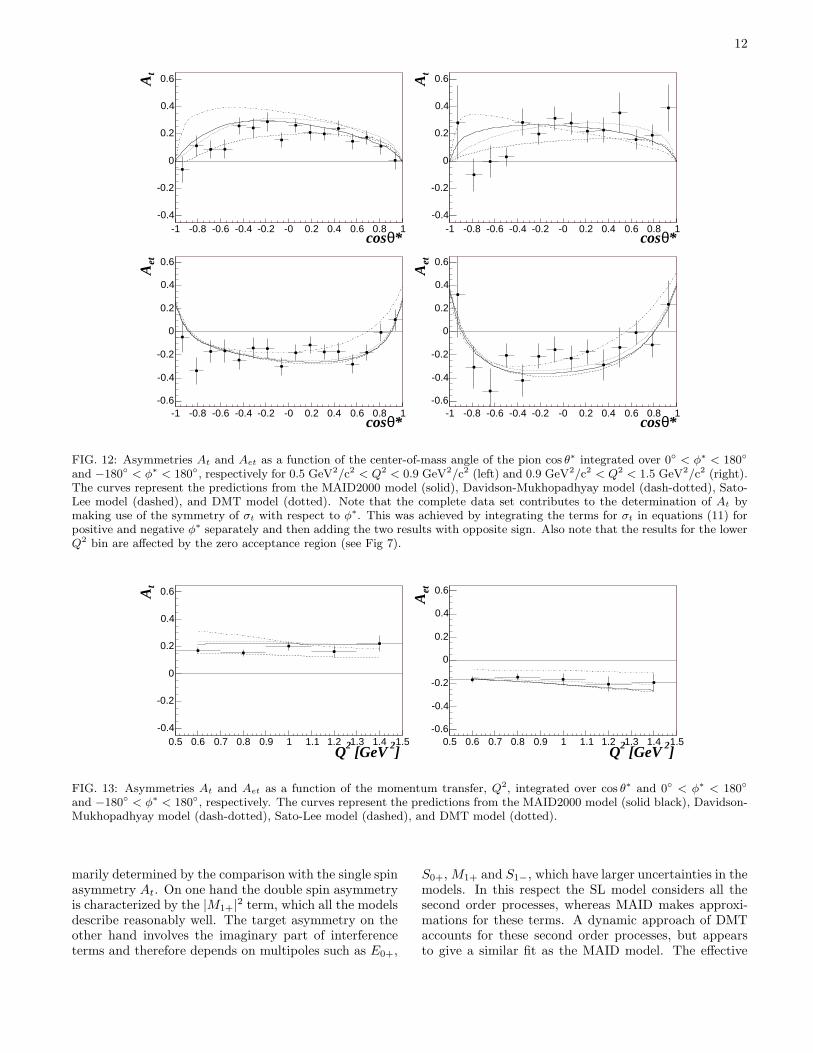
FIG. 12: Asymmetries At and Aet as a function of the center-of-mass angle of the pion cos θ∗ integrated over 0 < φ∗ < 180
and −180 < φ∗ < 180, respectively for 0.5 GeV2/c2 < Q2 < 0.9 GeV2/c2 (left) and 0.9 GeV2/c2 < Q2 < 1.5 GeV2/c2 (right).The curves represent the predictions from the MAID2000 model (solid), Davidson-Mukhopadhyay model (dash-dotted), Sato-Lee model (dashed), and DMT model (dotted). Note that the complete data set contributes to the determination of At bymaking use of the symmetry of σt with respect to φ∗. This was achieved by integrating the terms for σt in equations (11) forpositive and negative φ∗ separately and then adding the two results with opposite sign. Also note that the results for the lowerQ2 bin are affected by the zero acceptance region (see Fig 7).
]2 [GeV2Q0.5 0.6 0.7 0.8 0.9 1 1.1 1.2 1.3 1.4 1.5
tA
-0.4
-0.2
0
0.2
0.4
0.6
]2 [GeV2Q0.5 0.6 0.7 0.8 0.9 1 1.1 1.2 1.3 1.4 1.5
etA
-0.6
-0.4
-0.2
0
0.2
0.4
0.6
FIG. 13: Asymmetries At and Aet as a function of the momentum transfer, Q2, integrated over cos θ∗ and 0 < φ∗ < 180
and −180 < φ∗ < 180, respectively. The curves represent the predictions from the MAID2000 model (solid black), Davidson-Mukhopadhyay model (dash-dotted), Sato-Lee model (dashed), and DMT model (dotted).
marily determined by the comparison with the single spinasymmetry At. On one hand the double spin asymmetryis characterized by the |M1+|2 term, which all the modelsdescribe reasonably well. The target asymmetry on theother hand involves the imaginary part of interferenceterms and therefore depends on multipoles such as E0+,
S0+, M1+ and S1−, which have larger uncertainties in themodels. In this respect the SL model considers all thesecond order processes, whereas MAID makes approxi-mations for these terms. A dynamic approach of DMTaccounts for these second order processes, but appearsto give a similar fit as the MAID model. The effective
13
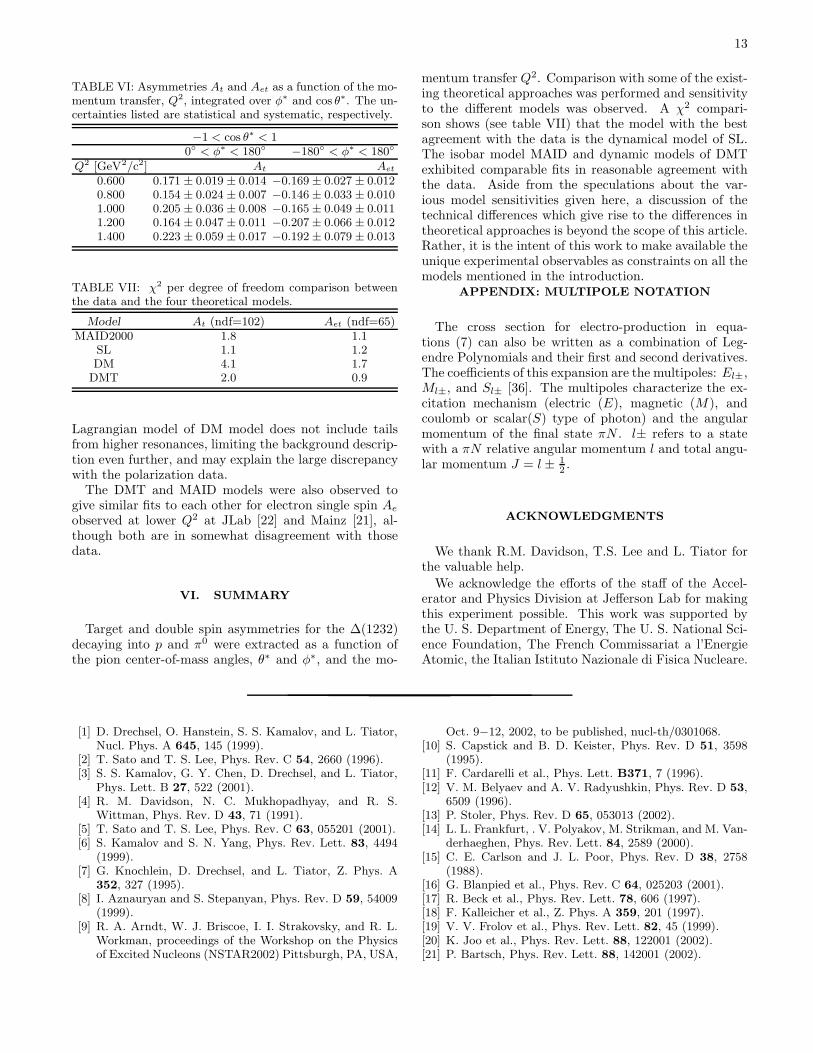
TABLE VI: Asymmetries At and Aet as a function of the mo-mentum transfer, Q2, integrated over φ∗ and cos θ∗. The un-certainties listed are statistical and systematic, respectively.
−1 < cos θ∗ < 10 < φ∗ < 180 −180 < φ∗ < 180
Q2 [GeV2/c2] At Aet
0.600 0.171 ± 0.019 ± 0.014 −0.169 ± 0.027 ± 0.0120.800 0.154 ± 0.024 ± 0.007 −0.146 ± 0.033 ± 0.0101.000 0.205 ± 0.036 ± 0.008 −0.165 ± 0.049 ± 0.0111.200 0.164 ± 0.047 ± 0.011 −0.207 ± 0.066 ± 0.0121.400 0.223 ± 0.059 ± 0.017 −0.192 ± 0.079 ± 0.013
TABLE VII: χ2 per degree of freedom comparison betweenthe data and the four theoretical models.
Model At (ndf=102) Aet (ndf=65)MAID2000 1.8 1.1
SL 1.1 1.2DM 4.1 1.7
DMT 2.0 0.9
Lagrangian model of DM model does not include tailsfrom higher resonances, limiting the background descrip-tion even further, and may explain the large discrepancywith the polarization data.
The DMT and MAID models were also observed togive similar fits to each other for electron single spin Ae
observed at lower Q2 at JLab [22] and Mainz [21], al-though both are in somewhat disagreement with thosedata.
VI. SUMMARY
Target and double spin asymmetries for the ∆(1232)decaying into p and π0 were extracted as a function ofthe pion center-of-mass angles, θ∗ and φ∗, and the mo-
mentum transfer Q2. Comparison with some of the exist-ing theoretical approaches was performed and sensitivityto the different models was observed. A χ2 compari-son shows (see table VII) that the model with the bestagreement with the data is the dynamical model of SL.The isobar model MAID and dynamic models of DMTexhibited comparable fits in reasonable agreement withthe data. Aside from the speculations about the var-ious model sensitivities given here, a discussion of thetechnical differences which give rise to the differences intheoretical approaches is beyond the scope of this article.Rather, it is the intent of this work to make available theunique experimental observables as constraints on all themodels mentioned in the introduction.
APPENDIX: MULTIPOLE NOTATION
The cross section for electro-production in equa-tions (7) can also be written as a combination of Leg-endre Polynomials and their first and second derivatives.The coefficients of this expansion are the multipoles: El±,Ml±, and Sl± [36]. The multipoles characterize the ex-citation mechanism (electric (E), magnetic (M), andcoulomb or scalar(S) type of photon) and the angularmomentum of the final state πN . l± refers to a statewith a πN relative angular momentum l and total angu-lar momentum J = l ± 1
2.
ACKNOWLEDGMENTS
We thank R.M. Davidson, T.S. Lee and L. Tiator forthe valuable help.
We acknowledge the efforts of the staff of the Accel-erator and Physics Division at Jefferson Lab for makingthis experiment possible. This work was supported bythe U. S. Department of Energy, The U. S. National Sci-ence Foundation, The French Commissariat a l’EnergieAtomic, the Italian Istituto Nazionale di Fisica Nucleare.
[1] D. Drechsel, O. Hanstein, S. S. Kamalov, and L. Tiator,Nucl. Phys. A 645, 145 (1999).
[2] T. Sato and T. S. Lee, Phys. Rev. C 54, 2660 (1996).[3] S. S. Kamalov, G. Y. Chen, D. Drechsel, and L. Tiator,
Phys. Lett. B 27, 522 (2001).[4] R. M. Davidson, N. C. Mukhopadhyay, and R. S.
Wittman, Phys. Rev. D 43, 71 (1991).[5] T. Sato and T. S. Lee, Phys. Rev. C 63, 055201 (2001).[6] S. Kamalov and S. N. Yang, Phys. Rev. Lett. 83, 4494
(1999).[7] G. Knochlein, D. Drechsel, and L. Tiator, Z. Phys. A
352, 327 (1995).[8] I. Aznauryan and S. Stepanyan, Phys. Rev. D 59, 54009
(1999).[9] R. A. Arndt, W. J. Briscoe, I. I. Strakovsky, and R. L.
Workman, proceedings of the Workshop on the Physicsof Excited Nucleons (NSTAR2002) Pittsburgh, PA, USA,
Oct. 9−12, 2002, to be published, nucl-th/0301068.[10] S. Capstick and B. D. Keister, Phys. Rev. D 51, 3598
(1995).[11] F. Cardarelli et al., Phys. Lett. B371, 7 (1996).[12] V. M. Belyaev and A. V. Radyushkin, Phys. Rev. D 53,
6509 (1996).[13] P. Stoler, Phys. Rev. D 65, 053013 (2002).[14] L. L. Frankfurt, . V. Polyakov, M. Strikman, and M. Van-
derhaeghen, Phys. Rev. Lett. 84, 2589 (2000).[15] C. E. Carlson and J. L. Poor, Phys. Rev. D 38, 2758
(1988).[16] G. Blanpied et al., Phys. Rev. C 64, 025203 (2001).[17] R. Beck et al., Phys. Rev. Lett. 78, 606 (1997).[18] F. Kalleicher et al., Z. Phys. A 359, 201 (1997).[19] V. V. Frolov et al., Phys. Rev. Lett. 82, 45 (1999).[20] K. Joo et al., Phys. Rev. Lett. 88, 122001 (2002).[21] P. Bartsch, Phys. Rev. Lett. 88, 142001 (2002).
14
[22] K. Joo et al. (2003), nucl-ex/0301012.[23] T. Pospischil et al., Phys. Rev. Lett. 86, 2959 (2001),
nucl-ex/0010020.[24] C. Mertz et al., Phys. Rev. Lett. 86, 2963 (2001).[25] R. De Vita et al. (CLAS), Phys. Rev. Lett. 88, 082001
(2002), hep-ex/0111074.[26] D. Drechsel and L. Tiator, J. Phys. G 18, 449 (1992).[27] C. K. Sinclair, CEBAF-PR-89-002.[28] M. Borghini, CERN-68-32, CERN Yellow report (1968).[29] A. Abragam, The principle of nuclear magnetism (Ox-
ford Claredon Press, 1961).[30] C. Keith et al., accepted by Nucl. Instr. Meth.
[31] B. Mecking et al., The CLAS detector, accepted by Nucl.Instr. and Meth.
[32] A. Biselli, Ph.D. thesis, Rensselaer Polytechnic Institute(2002).
[33] T. W. Donnelly and A. S. Raskin, Annals Phys. 169, 247(1986).
[34] M. K. Jones, Phys. Rev. Lett. 84, 1398 (2000).[35] L. W. Mo and Y. S. Tsai, Rev. Mod. Phys. 41, 205
(1969).[36] G. F. Chew, M. L. Goldberger, F. E. Low, and Y. Nambu,
Phys. Rev. 106, 1345 (1957).