Environmental Statement Volume 2-B May 2016
316
Environmental Statement Volume 2-B May 2016
-
Upload
khangminh22 -
Category
Documents
-
view
0 -
download
0
Transcript of Environmental Statement Volume 2-B May 2016

Environmental Statement
Volume 2-B
May 2016

Environmental Statement
Brims Tidal Array
Page 2 of 316
Table of Contents
Table of Contents .............................................................................................................................................................. 2
Table of Figures ................................................................................................................................................................ 8
Table of Tables .................................................................................................................................................................. 9
Acronyms ......................................................................................................................................................................... 14
10 Coastal and Terrestrial Ecology ............................................................................................................................ 23
10.1 Introduction ........................................................................................................................................................ 23
10.2 Study Area ......................................................................................................................................................... 23
10.3 Design Envelope Considerations ....................................................................................................................... 24
10.4 Legislative Framework and Policy Context ........................................................................................................ 25
10.5 Supporting Surveys and Studies ....................................................................................................................... 26
10.5.1 Sheep Skerry ............................................................................................................................................. 27
10.5.2 Moodies Eddy and Aith Hope ..................................................................................................................... 27
10.6 Data Gaps and Uncertainties............................................................................................................................. 27
10.6.1 Sheep Skerry ............................................................................................................................................. 27
10.6.2 Moodies Eddy and Aith Hope ..................................................................................................................... 27
10.7 Consultations ..................................................................................................................................................... 28
10.8 Assessment Methodology ................................................................................................................................. 29
10.8.1 Assessment Criteria ................................................................................................................................... 29
10.9 Baseline Description .......................................................................................................................................... 30
10.9.1 Introduction ................................................................................................................................................ 30
10.9.2 Designated Sites ........................................................................................................................................ 31
10.9.3 Terrestrial Habitats ..................................................................................................................................... 33
10.9.4 Intertidal Habitats ....................................................................................................................................... 37
10.9.5 Protected Fauna ......................................................................................................................................... 43
10.9.6 Birds ........................................................................................................................................................... 44
10.9.7 Local Biodiversity Action Plan .................................................................................................................... 49
10.9.8 Summary .................................................................................................................................................... 51
10.10 Potential Impacts ............................................................................................................................................. 52
10.10.1 Construction and Installation .................................................................................................................... 52

Environmental Statement
Brims Tidal Array
Page 3 of 316
10.10.2 Operation and Maintenance ..................................................................................................................... 52
10.10.3 Decommissioning ..................................................................................................................................... 52
10.11 Mitigation Measures ........................................................................................................................................ 52
10.11.1 Project Design and General Mitigation Measures .................................................................................... 52
10.11.2 Specific Mitigation .................................................................................................................................... 52
10.12 Residual Effects ............................................................................................................................................... 53
10.12.1 Construction and Installation .................................................................................................................... 53
10.12.2 Operation and Maintenance ..................................................................................................................... 61
10.13 Accidental and Unplanned Events ................................................................................................................... 61
10.13.1 Accidental Release of Chemical Contaminants from Devices or Vessels ................................................ 61
10.13.2 Accidental Introduction of Invasive Species from Vessel Operations ....................................................... 62
10.14 Summary ......................................................................................................................................................... 62
10.15 References ...................................................................................................................................................... 64
11 Benthic Ecology ..................................................................................................................................................... 66
11.1 Introduction ........................................................................................................................................................ 66
11.2 Study Area ......................................................................................................................................................... 66
11.3 Design Envelope Considerations ....................................................................................................................... 66
11.4 Legislative Framework and Policy Context ........................................................................................................ 68
11.5 Supporting Surveys and Studies ....................................................................................................................... 68
11.6 Data Gaps and Uncertainties............................................................................................................................. 69
11.7 Consultations ..................................................................................................................................................... 69
11.8 Assessment Methodology ................................................................................................................................. 70
11.8.1 Assessment Criteria ................................................................................................................................... 70
11.9 Baseline Description .......................................................................................................................................... 72
11.9.1 Introduction ................................................................................................................................................ 72
11.9.2 General Description of Current Baseline Conditions .................................................................................. 73
11.9.3 Assessment of Habitats and Species of Conservation Interest .................................................................. 75
11.10 Potential Impacts ............................................................................................................................................. 77
11.10.1 Construction and Installation .................................................................................................................... 77
11.10.2 Operation and Maintenance ..................................................................................................................... 77
11.10.3 Decommissioning ..................................................................................................................................... 77
11.11 Mitigation Measures ........................................................................................................................................ 77

Environmental Statement
Brims Tidal Array
Page 4 of 316
11.11.1 Project Design and General Mitigation Measures .................................................................................... 77
11.11.2 Specific Mitigation .................................................................................................................................... 77
11.12 Residual Effects ............................................................................................................................................... 78
11.12.1 Construction and Installation .................................................................................................................... 78
11.12.2 Operation and Maintenance ..................................................................................................................... 80
11.12.3 Decommissioning ..................................................................................................................................... 87
11.13 Accidental and Unplanned Events ................................................................................................................... 87
11.14 Summary ......................................................................................................................................................... 88
11.15 References ...................................................................................................................................................... 90
12 Fish Ecology ........................................................................................................................................................... 93
12.1 Introduction ........................................................................................................................................................ 93
12.2 Study Area ......................................................................................................................................................... 93
12.3 Design Envelope Considerations ....................................................................................................................... 94
12.4 Legislative Framework and Policy Context ........................................................................................................ 97
12.5 Supporting Surveys and Studies ....................................................................................................................... 98
12.6 Data Gaps and Uncertainties............................................................................................................................. 99
12.6.1 Distribution of Spawning and Nursery Grounds ......................................................................................... 99
12.6.2 Knowledge Gaps ...................................................................................................................................... 100
12.7 Consultations ................................................................................................................................................... 100
12.8 Assessment Methodology ............................................................................................................................... 103
12.8.1 Assessment Criteria ................................................................................................................................. 103
12.9 Baseline Description ........................................................................................................................................ 106
12.9.1 Introduction .............................................................................................................................................. 106
12.9.2 Benthic Environment ................................................................................................................................ 106
12.9.3 Pelagic Fish Species ................................................................................................................................ 106
12.9.4 Demersal Fish Species ............................................................................................................................ 110
12.9.5 Elasmobranch Species............................................................................................................................. 114
12.9.6 Diadromous Migratory Species ................................................................................................................ 117
12.9.7 Other Relevant PMF or Annex II Species................................................................................................. 123
12.9.8 Summary .................................................................................................................................................. 126
12.10 Potential Impacts ........................................................................................................................................... 127
12.10.1 Construction and Installation .................................................................................................................. 127

Environmental Statement
Brims Tidal Array
Page 5 of 316
12.10.2 Operation and Maintenance ................................................................................................................... 127
12.10.3 Decommissioning ................................................................................................................................... 127
12.11 Mitigation Measures ...................................................................................................................................... 127
12.11.1 Project Design and General Mitigation Measures .................................................................................. 127
12.11.2 Specific Mitigation .................................................................................................................................. 127
12.12 Residual Effects ............................................................................................................................................. 128
12.12.1 Construction and Installation .................................................................................................................. 128
12.12.2 Impacts during Operation and Maintenance ........................................................................................... 132
12.12.3 Impacts during Decommissioning .......................................................................................................... 140
12.13 Accidental and Unplanned Events ................................................................................................................. 140
12.14 Habitats Regulations Appraisal (HRA) ........................................................................................................... 141
12.15 Summary ....................................................................................................................................................... 141
12.16 References .................................................................................................................................................... 143
13 Marine Mammals and Basking Shark ................................................................................................................. 151
13.1 Introduction ...................................................................................................................................................... 151
13.2 Study Area ....................................................................................................................................................... 151
13.3 Design Envelope Considerations ..................................................................................................................... 152
13.3.1 Collision/ Encounter Rate Worst Case Scenario ...................................................................................... 152
13.3.2 Vessel Collision Risk Worst Case Scenario ............................................................................................. 152
13.3.3 Underwater Noise Worst Case Scenario .................................................................................................. 154
13.3.4 Changes to Prey Resource Worst Case Scenario ................................................................................... 154
13.3.5 Overview of Design Envelope Parameters ............................................................................................... 154
13.4 Legislative Framework and Policy Context ...................................................................................................... 156
13.4.1 Survey Guidance ...................................................................................................................................... 157
13.5 Supporting Surveys and Studies ..................................................................................................................... 158
13.6 Data Gaps and Uncertainties........................................................................................................................... 159
13.7 Consultations ................................................................................................................................................... 159
13.8 Assessment Methodology ............................................................................................................................... 172
13.9 Baseline Description ........................................................................................................................................ 177
13.9.1 Introduction .............................................................................................................................................. 177
13.9.2 Pinnipeds ................................................................................................................................................. 178
13.9.3 Cetaceans ................................................................................................................................................ 193

Environmental Statement
Brims Tidal Array
Page 6 of 316
13.9.4 Other Species of Cetacean ...................................................................................................................... 203
13.9.5 Basking Shark .......................................................................................................................................... 204
13.9.6 Summary .................................................................................................................................................. 206
13.10 Potential Impacts ........................................................................................................................................... 206
13.10.1 Construction and Installation .................................................................................................................. 206
13.10.2 Operation and Maintenance ................................................................................................................... 207
13.10.3 Decommissioning ................................................................................................................................... 207
13.10.4 Accidental and Unplanned Events ......................................................................................................... 207
13.11 Mitigation Measures ...................................................................................................................................... 207
13.11.1 Project Design and General Mitigation Measures .................................................................................. 207
13.11.2 Specific Mitigation .................................................................................................................................. 207
13.12 Residual Effects ............................................................................................................................................. 208
13.12.1 Impacts during Construction and Installation .......................................................................................... 208
13.12.2 Impacts during Operation and Maintenance ........................................................................................... 217
13.12.3 Impacts during Decommissioning .......................................................................................................... 232
13.13 Accidental and Unplanned Events ................................................................................................................. 235
13.14 Summary ....................................................................................................................................................... 237
13.15 References .................................................................................................................................................... 238
14 Ornithology ........................................................................................................................................................... 255
14.1 Introduction ...................................................................................................................................................... 255
14.1.1 Study Area ............................................................................................................................................... 255
14.2 Design Envelope Considerations ..................................................................................................................... 256
14.2.1 Project Design Envelope .......................................................................................................................... 256
14.3 Legislative Framework and Policy Context ...................................................................................................... 259
14.3.1 Legislation ................................................................................................................................................ 259
14.3.2 Guidance .................................................................................................................................................. 261
14.4 Supporting Surveys and Studies ..................................................................................................................... 261
14.4.1 Desk Study ............................................................................................................................................... 261
14.4.2 Seabird Surveys ....................................................................................................................................... 261
14.5 Consultations ................................................................................................................................................... 262
14.6 Data Gaps and Uncertainties........................................................................................................................... 270
14.6.1 Seabird Breeding Population Estimates ................................................................................................... 270

Environmental Statement
Brims Tidal Array
Page 7 of 316
14.6.2 Uncertainty around Estimates .................................................................................................................. 270
14.6.3 Seasonal Survey Gaps............................................................................................................................. 271
14.7 Anticipated Impact Footprint ............................................................................................................................ 271
14.8 Assessment Methodology ............................................................................................................................... 273
14.8.1 Approach to Assessment ......................................................................................................................... 273
14.8.2 Assessment Criteria ................................................................................................................................. 273
14.9 Baseline Description ........................................................................................................................................ 279
14.9.1 Introduction .............................................................................................................................................. 279
14.9.2 Summary .................................................................................................................................................. 281
14.9.3 Species Accounts ..................................................................................................................................... 285
14.10 Potential Impacts ........................................................................................................................................... 291
14.10.1 Construction and Installation .................................................................................................................. 292
14.10.2 Operation and Maintenance ................................................................................................................... 292
14.10.3 Decommissioning ................................................................................................................................... 293
14.11 Mitigation Measures ...................................................................................................................................... 293
14.11.1 Project Design and General Mitigation Measures .................................................................................. 293
14.11.2 Specific Mitigation .................................................................................................................................. 293
14.12 Residual Effects ............................................................................................................................................. 293
14.12.1 Construction and Installation .................................................................................................................. 293
14.12.2 Operation and Maintenance ................................................................................................................... 297
14.12.3 Decommissioning ................................................................................................................................... 307
14.13 Accidental and Unplanned Events ................................................................................................................. 308
14.14 Summary ....................................................................................................................................................... 312
14.15 References .................................................................................................................................................... 313

Environmental Statement
Brims Tidal Array
Page 8 of 316
Table of Figures
Figure 10.1: Study area for coastal ecology showing designated sites ............................................................................. 24
Figure 10.2: Coastline at Brims Ness viewed to the west of Duncan’s Geo towards Moodies Eddy with Melsetter in the
distance ............................................................................................................................................................................. 34
Figure 10.3: Vegetated shingle habitat at Aith Hope ......................................................................................................... 36
Figure 10.4: Vegetated shingle habitat at Aith Hope ......................................................................................................... 36
Figure 10.5: Sheep Skerry (facing east) ............................................................................................................................ 38
Figure 10.6: Boulder beach ............................................................................................................................................... 38
Figure 10.7 UK BAP habitats recorded within the potential cable landfall Areas of Search during the intertidal surveys . 40
Figure 10.8: Moodies Eddy viewed from the west ............................................................................................................. 41
Figure 10.9: View down Long Geo .................................................................................................................................... 41
Figure 10.10: View down the shore from apex of Aith Hope ............................................................................................. 42
Figure 10.11: Sand-dominated biotopes in the upper shore of the apex of Aith Hope ...................................................... 42
Figure 10.12: Bird survey results for Sheep Skerry cable landfall AoS ............................................................................. 46
Figure 10.13: Bird survey results for Moodies Eddy cable landfall AoS ............................................................................ 47
Figure 10.14: Bird survey results for Aith Hope cable landfall AoS ................................................................................... 48
Figure 10.15: Wintering barnacle goose field usage 2013/2014 ....................................................................................... 49
Figure 11.1: Designated biotopes in AfL and cable corridors ............................................................................................ 74
Figure 12.1: Spawning and nursery grounds of pelagic fish, including herring larvae abundance 2008-2012 ................ 108
Figure 12.2: Spawning and nursery grounds of demersal fish ........................................................................................ 112
Figure 12.3: Spawning and nursery grounds of other fish species .................................................................................. 115
Figure 12.4: Diadromous fish rivers ................................................................................................................................ 121
Figure 13.1: Examples of turbine types ........................................................................................................................... 152
Figure 13.2: Seal Management Units (IAMMWG 2013) .................................................................................................. 180
Figure 13.3: Grey seals tagged with SMRU Argos and SMRU GSM/GPS tags which at least once entered the Pentland
Firth and Orkney Strategic Area (excludes the grey seals tagged at North Rona) (SMRU Limited 2011) ....................... 181
Figure 13.4: Grey seal mean at sea density (Jones et al. 2013) ..................................................................................... 183
Figure 13.5: AfL and the Orkney designated seal haul out sites ..................................................................................... 185
Figure 13.6: Harbour seal counts in Orkney in 2013 (red) compared with the highest previous count in 1997 (pink) (SCOS
2014) ............................................................................................................................................................................... 187
Figure 13.7: Harbour seal telemetry (SMRU Limited 2011) ............................................................................................. 189
Figure 13.8: Harbour seal mean at sea density (Jones et al. 2013) ................................................................................ 191
Figure 13.9: Harbour porpoise Management Units (IAMMWG 2015) .............................................................................. 194
Figure 13.10: SCANS II survey blocks (SCANS II 2008)................................................................................................. 195
Figure 13.11: Distribution of sightings of harbour porpoise, 1980-2010 (Evans et al. 2011b) ......................................... 196
Figure 13.12: White-beaked dolphin Management Units (IAMMWG 2015) ..................................................................... 198
Figure 13.13: Distribution of sightings of white-beaked dolphin, 1980-2010 (Evans et al. 2011b) .................................. 199
Figure 13.14: Minke whale Management Units (IAMMWG 2015) ................................................................................... 201
Figure 13.15: Distribution of sightings of minke whale, 1980-2010 (Evans et al. 2011a). ............................................... 202
Figure 13.16: Distribution of sightings of basking shark, 1980-2010 (Evans et al. 2011a) .............................................. 205
Figure 14.1: Project Survey Area and transect layout ..................................................................................................... 256

Environmental Statement
Brims Tidal Array
Page 9 of 316
Table of Tables
Table 10.1: Design envelope parameters for assessment of coastal and terrestrial ecology ............................................ 25
Table 10.2: Key issues raised by stakeholder during consultation .................................................................................... 28
Table 10.3: Definitions for sensitivity of coastal and terrestrial ecology ............................................................................ 29
Table 10.4: Definitions for magnitude of effect for coastal and terrestrial ecology ............................................................ 30
Table 10.5: Assignment of impact significance for coastal and terrestrial ecology based on sensitivity of receptor and
magnitude of effect ............................................................................................................................................................ 30
Table 10.6: Statutory designated sites relevant to the coastal environment ..................................................................... 32
Table 10.7: Non-statutory designated sites ....................................................................................................................... 33
Table 10.8: Summary of terrestrial habitats within the potential landfall options ............................................................... 36
Table 10.9: Intertidal biotopes of conservation importance recorded at the potential landfall options ............................... 42
Table 10.10: Species recorded breeding within the Study Area during shoreline and breeding bird surveys ................... 44
Table 10.11: Species associated with coastal sand dunes in Orkney ............................................................................... 50
Table 10.12: Species associated with vegetated shingle habitats in Orkney .................................................................... 50
Table 10.13: Mitigation measures specific to coastal and terrestrial ecology .................................................................... 53
Table 10.14: Physical disturbance of terrestrial habitats during cable landfall installation ................................................ 54
Table 10.15: Physical disturbance of intertidal habitats during cable landfall installation .................................................. 56
Table 10.16: Disturbance of otters during landfall installation ........................................................................................... 57
Table 10.17: Disturbance to breeding birds due to cable landfall installation activities ..................................................... 59
Table 10.18 Disturbance to foraging barnacle geese due to cable landfall installation activities....................................... 61
Table 10.19: Accidental release of chemical contaminants from devices or vessels - impact assessment summary ....... 62
Table 10.20: Accidental introduction of invasive species - impact assessment summary ................................................. 62
Table 11.1: Design envelope parameters for benthic ecology assessment....................................................................... 67
Table 11.2: Key issues raised by stakeholder during consultation .................................................................................... 70
Table 11.3: Definitions for sensitivity of benthic ecology ................................................................................................... 71
Table 11.4: Definitions for magnitude of effect for benthic ecology ................................................................................... 72
Table 11.5: Assignment of impact significance for benthic ecology based on sensitivity of receptor and magnitude of effect
.......................................................................................................................................................................................... 72
Table 11.6 Mitigation measures specific to benthic ecology.............................................................................................. 77
Table 11.7: Increased suspended sediment and turbidity from installation - impact assessment summary ...................... 79
Table 11.8: Cable landfall installation - impact assessment summary .............................................................................. 80
Table 11.9: Maximum, worst case scenario, seabed footprint of project infrastructure for full Project .............................. 80
Table 11.10: Substrate/habitat loss/damage - impact assessment summary.................................................................... 82
Table 11.11: Seabed scour - impact assessment summary .............................................................................................. 83
Table 11.12: Colonisation of subsea infrastructure - impact assessment summary .......................................................... 84
Table 11.13: EMF and thermal load - impact assessment summary ................................................................................. 85
Table 11.14: Changes in water flow rates – impact assessment summary ....................................................................... 86
Table 11.15: Accidental release of chemical contaminants from devices or vessels - impact assessment summary ....... 88
Table 11.16: Accidental introduction of invasive species - impact assessment summary ................................................. 88
Table 12.1: Design envelope parameters for fish ecology assessment............................................................................. 94
Table 12.2: Supporting studies .......................................................................................................................................... 98

Environmental Statement
Brims Tidal Array
Page 10 of 316
Table 12.3: Key issues raised by stakeholder during consultation .................................................................................. 101
Table 12.4: Definitions for sensitivity of fish ecology ....................................................................................................... 104
Table 12.5: Definitions for magnitude of effect for fish ecology ....................................................................................... 105
Table 12.6: Assignment of impact significance for fish ecology based on sensitivity of receptor and magnitude of effect
........................................................................................................................................................................................ 105
Table 12.7: Pelagic species with defined spawning and nursery grounds within the Project site (Coull et al. 1998; Ellis et
al. 2012) .......................................................................................................................................................................... 109
Table 12.8: Sandeel sediment preference and categorisation of the seabed sediments (Greenstreet et al., 2010) ........ 111
Table 12.9: Demersal species with defined spawning and nursery grounds within the Project site (Coull et al. 1998; Ellis et
al. 2012) .......................................................................................................................................................................... 113
Table 12.10: Elasmobranch species with defined spawning and nursery grounds within the Project site (Coull et al. 1998;
Ellis et al. 2012) ............................................................................................................................................................... 117
Table 12.11: Atlantic salmon and sea trout life histories ................................................................................................. 118
Table 12.12: Scottish salmon population size (ICES, 2015b; Xodus Group, 2012) ......................................................... 119
Table 12.13: Sensitive periods and conservation status of the key diadromous species likely to be present in the area
(based on SNH website) ................................................................................................................................................. 123
Table 12.14: SACs designated for fish and freshwater pearl mussel connected to the Project ....................................... 124
Table 12.15: Summary of residual effects of the substratum loss on fish ecology .......................................................... 129
Table 12.16: Summary of residual effects of the smothering on fish ecology.................................................................. 130
Table 12.17: Summary of residual effects of noise and vibration on fish ecology ........................................................... 132
Table 12.18: Summary of residual effects of EMF on fish ecology .................................................................................. 134
Table 12.19: Summary of residual effects of collision risk (turbines) on fish ecology ...................................................... 135
Table 12.20: Summary of residual effects of the changes to available habitat on fish ecology ....................................... 136
Table 12.21: Percentage area of Pentland Firth taken up by the tidal array ................................................................... 137
Table 12.22: Summary of residual effects of barrier to movement on fish ecology ......................................................... 139
Table 12.23: Summary of residual effects of the effects of noise and vibration on fish ecology ...................................... 140
Table 12.24: Summary of residual effects of the accidental release of contaminants on fish ecology ............................ 141
Table 13.1: Supporting studies ........................................................................................................................................ 151
Table 13.2: Design envelope parameters for the marine mammals and basking assessment ........................................ 154
Table 13.3: Consultation activities undertaken in relation to marine mammals and basking sharks ............................... 160
Table 13.4: Scoping (August 2013) comments relevant to marine mammals and basking sharks .................................. 169
Table 13.5: Definitions for sensitivity of marine mammals and basking sharks ............................................................... 172
Table 13.6: Definitions for magnitude of effect for marine mammals and basking sharks ............................................... 173
Table 13.7: Assignment of impact significance for marine mammals and basking shark based on sensitivity of receptor and
magnitude of effect .......................................................................................................................................................... 174
Table 13.8: Harbour porpoise management unit and key demographic rates ................................................................. 176
Table 13.9: Harbour seal management unit and key demographic rates ........................................................................ 176
Table 13.10: Grey seal management unit and key demographic rates ........................................................................... 176
Table 13.11: Minke whale management unit and key demographic rates ....................................................................... 177
Table 13.12: FCS assessment for common cetacean species in Annex IV of the Habitats Directive occurring in Orkney and
Pentland Firth waters (JNCC 2013) ................................................................................................................................ 178

Environmental Statement
Brims Tidal Array
Page 11 of 316
Table 13.13: Grey seal at sea usage (density) estimates (number of individuals per 25km2) for the two grid cells covering
the AfL area (Jones et al. 2013) ...................................................................................................................................... 183
Table 13.14: Harbour seal at sea usage (density) estimates (number of individuals per 25km2) for the two grid cells covering
the AfL area (Jones et al. 2013) ...................................................................................................................................... 190
Table 13.15: Summary of density estimates and reference populations taken forward in the assessment ..................... 206
Table 13.16: Mitigation Measures Specific to Marine Mammals and Basking Sharks ..................................................... 207
Table 13.17: Estimated disturbance ranges for marine mammals during construction ................................................... 209
Table 13.18: Underwater noise impact areas and estimated number of animals disturbed based on greatest area of
potential disturbance during construction ........................................................................................................................ 211
Table 13.19: Potential percentage of the reference population disturbed by underwater noise during construction of the
proposed Project ............................................................................................................................................................. 211
Table 13.20: Underwater noise impact significance during construction ......................................................................... 212
Table 13.21: Collision with vessels impact significance during construction ................................................................... 214
Table 13.22: Disturbance to haul out sites impact significance during construction ........................................................ 215
Table 13.23: Changes to prey resource impact significance during construction ............................................................ 217
Table 13.24: Underwater noise impact areas and estimated number of animals disturbed for Stage 1 .......................... 218
Table 13.25: Underwater noise impact areas and estimated number of animals disturbed for Stage 1 and 2 ................ 218
Table 13.26: Potential percentage of the reference population disturbed by underwater noise for Stages 1 and 2 combined
........................................................................................................................................................................................ 219
Table 13.27: Underwater noise impact significance during operation ............................................................................. 219
Table 13.28: Species avoidance rates ............................................................................................................................ 220
Table 13.29: Species parameters used in the ERM and CRM (Appendices 2 and 3) ..................................................... 221
Table 13.30: Estimated annual encounter rates (using the ERM) (individuals/year) with and without avoidance for a single
three-blade device (unshrouded) .................................................................................................................................... 222
Table 13.31: Summary of estimated annual encounter rate (using the ERM) (individuals/year) with avoidance for three-
blade unshrouded turbines .............................................................................................................................................. 223
Table 13.32: Estimated annual encounter rate (individuals/year) with and without avoidance for single open-centre turbine
........................................................................................................................................................................................ 224
Table 13.33: Summary of estimated annual encounter rate (ERM) (individuals/year) with avoidance for shrouded turbines
open centre turbines (OCT) ............................................................................................................................................. 224
Table 13.34: Predicted additional risk of population decline of Stage 1: 30 three-blade unshrouded devices and Stage 1
and 2: 200 three-blade unshrouded devices ................................................................................................................... 225
Table 13.35: Predicted additional risk of population decline of Stage 1: 30 OCT devices and Stage 1 and 2: 200 OCT
devices ............................................................................................................................................................................ 226
Table 13.36: Collision with devices impact significance during operation ....................................................................... 227
Table 13.37: Collision with vessels impact significance during operation ....................................................................... 228
Table 13.38: EMF impact significance during operation .................................................................................................. 230
Table 13.39: Disturbance to haul out sites impact significance during operation ............................................................ 230
Table 13.40: Changes to prey resource impact significance during operation ................................................................ 232
Table 13.41: Underwater noise impact areas and estimated number of animals disturbed based on greatest area of
potential disturbance during decommissioning ................................................................................................................ 233
Table 13.42: Potential percentage of the reference population disturbed by underwater noise ...................................... 233

Environmental Statement
Brims Tidal Array
Page 12 of 316
Table 13.43 Underwater noise impact significance during decommissioning.................................................................. 234
Table 13.44: Collision with vessels impact significance during decommissioning ........................................................... 235
Table 13.45: Accidental contamination impact significance during construction, O&M and decommissioning ............... 236
Table 13.46: Accidental contamination from devices during operation impact significance ............................................ 237
Table 13.47: Estimated annual collision risk (using the ERM) (individuals / year) with and without avoidance for a single
three-blade device (unshrouded) .................................................................................................................................... 246
Table 13.48: Summary of estimated annual collision risk (using the CRM) (individuals / year) with avoidance for three-
blade unshrouded turbines .............................................................................................................................................. 246
Table 13.49: Estimated annual collision risk (using the CRM) (individuals / year) with and without avoidance for a single
three-blade device (unshrouded) .................................................................................................................................... 247
Table 13.50: Summary of estimated annual collision risk (using the CRM) (individuals / year) with avoidance for three-
blade unshrouded turbines .............................................................................................................................................. 247
Table 13.51: Estimated annual collision risk (using the CRM) (individuals / year) with and without avoidance for a single
three-blade device (unshrouded) .................................................................................................................................... 248
Table 13.52: Summary of estimated annual collision risk (using the CRM) (individuals / year) with avoidance for three-
blade unshrouded turbines .............................................................................................................................................. 248
Table 13.53: Estimated annual collision risk (using the ERM) (individuals / year) with and without avoidance for a single
three-blade device (unshrouded) .................................................................................................................................... 249
Table 13.54: Summary of estimated annual collision risk (using the CRM) (individuals / year) with avoidance for three-
blade unshrouded turbines .............................................................................................................................................. 249
Table 13.55: Predicted probabilities of population decline for undisturbed populations and disturbed populations based on
Phase 1 of 30 three-blade unshrouded devices (on a probability scale of 0 to 1) ........................................................... 250
Table 13.56: Predicted probabilities of population decline for undisturbed populations and disturbed populations based on
Phase 1 and 2 of 200 three-blade unshrouded devices (on a probability scale of 0 to 1) ............................................... 251
Table 13.57: Predicted probabilities of population decline for undisturbed populations and disturbed populations based on
Phase 1 of 30 shrouded OCT devices (on a probability scale of 0 to 1) .......................................................................... 252
Table 13.58: Predicted probabilities of population decline for undisturbed populations and disturbed populations based on
Phase 1 and 2 of 200 shrouded OCT devices (on a probability scale of 0 to 1) .............................................................. 253
Table 14.1: Design envelope parameters for ornithological assessment ........................................................................ 257
Table 14.2: Key consultation items and timeline for the Project. ..................................................................................... 263
Table 14.3: Key issues raised by stakeholder during consultation .................................................................................. 264
Table 14.4: Anticipated impact footprint in relation to potential impact sources and spatial parameters used. ............... 272
Table 14.5: Ranked species-specific generic vulnerability to overall tidal device impacts, disturbance, displacement (after
Furness et al. 2012) and surface pollutants (Wiens et al. 1995) ..................................................................................... 275
Table 14.6: Definitions for sensitivity of ornithological receptors ..................................................................................... 276
Table 14.7: Definitions of the nature conservation importance (value) levels for ornithological receptors ...................... 277
Table 14.8: Definition of spatial scale of magnitude for impacts affecting ornithological receptors ................................. 277
Table 14.9: Assignment of impact significance for ornithological receptors based on sensitivity of receptor and magnitude
of effect ........................................................................................................................................................................... 278
Table 14.10: Definitions of impact significance for ornithological receptors .................................................................... 278
Table 14.11: Criteria used to categorise species priority for EIA ..................................................................................... 279

Environmental Statement
Brims Tidal Array
Page 13 of 316
Table 14.12: Summary of the importance of the AfL+1km to regional receptor populations of seabirds based on the
95%UCL of the seasonal mean ....................................................................................................................................... 282
Table 14.13: Mitigation Measures Specific to Ornithology............................................................................................... 293
Table 14.14: Summary of residual effects of the direct disturbance from construction and installation ........................... 296
Table 14.15: Summary of residual effects of direct disturbance from operation and maintenance ................................. 298
Table 14.16: Summary of residual effects of indirect effects through habitats and prey species from operation and
maintenance .................................................................................................................................................................... 299
Table 14.17: Summary of residual effects of direct habitat loss from operation and maintenance .................................. 301
Table 14.18: The mean seasonal surface density of receptors vulnerable to potential collision risk used to examine collision
risk within the AfL area. ................................................................................................................................................... 304
Table 14.19: Annual baseline adult mortality rates and the proportion of adults from the regional breeding population used
in collision risk modelling. ................................................................................................................................................ 305
Table 14.20: Worst case encounter rate model results and predicted indicative changes to annual baseline adult mortality
rate of the regional breeding population at different avoidance rates for Stage 1 and Stage 1 & 2 for OpenHydro shrouded
turbines. .......................................................................................................................................................................... 306
Table 14.21: Summary of residual effects of collision risk to diving birds from operation and maintenance ................... 307
Table 14.22: Summary of residual effects of direct disturbance from decommissioning ................................................. 308
Table 14.23: Summary of residual effects of accidental contamination from construction and installation ..................... 310
Table 14.24: Summary of residual effects of accidental contamination from operation and maintenance ...................... 311
Table 14.25: Summary of residual effects of accidental contamination from decommissioning ...................................... 311

Environmental Statement
Brims Tidal Array
Page 14 of 316
Acronyms
AA Appropriate Assessment
AC Alternating Current
ADBA Archaeological desk-based assessment
ADCP Acoustic Doppler Current Profiler
AfL Agreement for Lease
AIF Anticipated Impact Footprint
AIS Automatic Identification System
AoS Area of Search
ASCOBANS Agreement on Conservation of Small Cetaceans of the Baltic and North Seas
ATBA Area to be Avoided
B.P. Before Present
BATNEEC Best Available Technology Not Entailing Excessive Costs
BDMPS Biologically Defined Minimum Population Size
BOCC Birds of Conservation Concern
BPI Burial Protection Index
BTAL Brims Tidal Array Limited
BTO British Trust for Ornithology
CAP Common Agricultural Policy
CCGT Combine Cycle Gas Turbine
CD Chart Datum
CEMD Construction Environmental Management Document
CfD Contract for Difference
CHTDL Cantick Head Tidal Development Limited
CIA Cumulative Impact Assessment
CIRIA Construction Industry Research and Information Association
CITES Convention on International Trade in Endangered Species
CO2 Carbon Dioxide
Environmental Statement
Brims Tidal Array
Page 15 of 316
COWRIE Collaborative Offshore Wind Research into the Environment
CPA Coastal Protection Act
CRM Collision Rate Model
CWMTA Cape Wrath Military Training Area
DBA Desk-based Assessment
DECC Department of Energy and Climate Change
DfT Department for Transport
DIO Defence Infrastructure Organisation
DP Dynamic Positioning
DP (vessel) Dynamic Positioning (vessel)
DTI Department of Trade and Industry
EC European Commission
ECoW Ecological Clerk of Works
EEA European Environment Agency
EEZ Exclusive Economic Zone
EGA Expert Geomorphological Assessment
EIA Environmental Impact Assessment
EMD Environmental Management Document
EMEC European Marine Energy Centre
EMF Electro-Magnetic Field
EMMP Environmental Mitigation Monitoring Plan
EMR Electricity Market Reform
EPS European Protected Species
ERCoP Emergency Response Cooperation Plan
ERM Encounter Rate Model
ES Environmental Statement
ESAS European Seabirds at Sea
ETA Engineering Technology Applications Limited

Environmental Statement
Brims Tidal Array
Page 16 of 316
ETI Energy Technologies Institute
ETV Emergency Towing Vehicle
EU European Union
FAD Fish Aggregation Device
FAO Food and Agricultural Organisation
FCS Favourable Conservation Status
FEPA Food and Environment Protection Act
FRS Fisheries Research Services
FSA Formal Safety Assessment
GBS Gravity Base Structure
GCR Geological Conservation Review
GDP Gross Domestic Product
GHG Greenhouse Gas
GIS Geographic Information System
GVA Gross Value Added
GW Gigawatt (power)
GWDTE Ground Water Dependent Terrestrial Ecosystem
HAT Horizontal Axis Turbine
HDD Horizontal Directional Drilling
HIE Highlands and Islands Enterprise
HRA Habitats Regulations Appraisal
HSE Health and Safety Executive
HVAC High Voltage Alternating Current
IAMMWG Inter-Agency Marine Mammal Working Group
ICES International Council for Exploration of the Sea
ICIT International Centre for Island Technologies
IEEM Institute of Ecology and Environment Management
IHO International Hydrographic Organisation

Environmental Statement
Brims Tidal Array
Page 17 of 316
IMO International Maritime Organisation
IPCC Intergovernmental Panel on Climate Change
IROPI Imperative Reasons of Overriding Public Interest
IUCN International Union for Conservation of Nature
IWC International Whaling Convention
JNCC Joint Nature Conservation Committee
LAT Lowest Astronomical Tide
LBAP Local Biodiversity Action Plan
LCCA Local Coastal Character Areas
LNCS Local Nature Conservation Site
LSE Likely Significant Effect
MAIB Marine Accident Investigation Branch
MBES Multibeam Echo-Sounder
MCA Maritime and Coastguard Agency
MCAA Marine and Coastal Access Act
MCZ Marine Conservation Zone
MDA Military Danger Area
MEG Marine Energy Group
MEHRA Marine Environmental High Risk Area
MESH Mapping European Seabed Habitats
MGN Marine Guidance Notice
MHWS Mean High Water Springs
MLWS Mean Low Water Spring
MMEA Marine Modelling Enabling Action
MMFR Mean Maximum Foraging Range
MMMP Marine Mammals Management Plan
MNCR Marine Nature Conservation Review
MoD Ministry of Defence

Environmental Statement
Brims Tidal Array
Page 18 of 316
MPAs Marine Protected Areas
MRESF Marine Renewable Energy Strategic Framework
MS Marine Scotland
MSI Maritime Safety Information
MSL Mean Sea Level
MS-LOT Marine Scotland Licensing Operations Team
MU Management Units
MW Megawatt (power)
NBN National Biodiversity Network
NCI Nature Conservation Importance
NCMPA Nature Conservation Marine Protected Area
NGET National Grid Electricity Transmission
NLB Northern Lighthouse Board
NMR National Monuments Records
NPF National Planning Framework
NPPG National Planning Policy Guidance
NPS National Policy Statement
NRA Navigational Risk Assessment
NREAP National Renewable Energy Action Plan
NSA National Scenic Area
NSIP National Significant Infrastructure Projects
NSP Noise Sensitive Property
NTU Normal Turbidity Unit
OBRC Orkney Biodiversity Records Centre
OCT Open Cut Trench
ODBOA Orkney Dive Boat Owners Association
OFA Orkney Fisheries Association
OFS Orkney Fisherman’s Society

Environmental Statement
Brims Tidal Array
Page 19 of 316
OIC Orkney Islands Council
ORCA Orkney Research Centre for Archaeology
OREI Offshore Renewable Energy Installations
OS Ordnance Survey
OSF Orkney Sustainable Fisheries
PAC Pre Application Consultation
PAM Passive Acoustic Monitoring
PAT Pop-up Archival Tags
PBD Project Briefing Document
PBR Potential Biological Removal
PEMP Project Environmental Management Plan
PFOW Pentland Firth and Orkney Waters
PHA Preliminary Hazard Analysis
RAF Royal Air Force
RCAHMS Royal Commission on the Ancient and Historical Monuments of Scotland
REE Roving Eye Enterprises
REZ Renewable Energy Zone
RIB Rigid Inflatable Boat
RLG Regional Locational Guidance
RNLI Royal National Lifeboat Institution
ROV Remotely Operated Vehicle
RSPB Royal Society for the Protection of Birds
RYA Royal Yachting Association
SAC Special Area of Conservation
SAMS Scottish Association of Marine Science
SAR Search and Rescue
SCADA Supervisory Control And Data Acquisition
SEA Strategic Environmental Assessment

Environmental Statement
Brims Tidal Array
Page 20 of 316
SEPA Scottish Environment Protection Agency
SFF Scottish Fishermen’s Federation
SHEPD Scottish Hydro Electric Power Distribution
SHE-T Scottish Hydro Electric Transmission PLC
SLVIA Seascape, Landscape and Visual Impact Assessment
SMRU Sea Mammal Research Unit
SMS Safety Management System
SNH Scottish Natural Heritage
SOPEP Shipboard Oil Pollution Emergency Plans
SPA Special Protection Area
SPFA Scottish Pelagic Fisherman's Association
SPP Scottish Planning Policy
SSB Subsea Base
SSC Suspended Sediment Concentrations
SSSI Sites of Special Scientific Interest
STW Scottish Territorial Waters
T Tonnes
TCE The Crown Estate
TEC Tidal Energy Converters
THC The Highland Council
TSS Turbine Support Structure
TWh Terawatt Hour
UFEN UK Fisheries Economics Network
UKBAP UK Biodiversity Action Plan
UNCLOS United Nations Convention of the Law of the Sea
VMP Vessel Management Plan
VMS Vessel Monitoring System
VTS Vessel Traffic Service

Environmental Statement
Brims Tidal Array
Page 21 of 316
WANE Wildlife and Natural Environment Licences
WCA Wildlife and Countryside Act
WDC Whale and Dolphin Conservation
WHS World Heritage Site
ZTV Zone of Theoretical Visibility
Environmental Statement
Brims Tidal Array
Page 22 of 316
Coastal and Terrestrial Ecology
Chapter 10

Environmental Statement
Brims Tidal Array
Page 23 of 316
10 COASTAL AND TERRESTRIAL ECOLOGY
10.1 INTRODUCTION
This chapter of the Environmental Statement (ES) considers the potential effects of the proposed Brims Tidal Array Project
(the Project) on the coastal and onshore environment including intertidal habitats, terrestrial habitats, protected fauna and
terrestrial birds. This assessment covers the potential impacts associated with the cable landfall construction, operation
and decommissioning on the coastal and onshore environment up to and above Mean High Water Spring (MHWS).
All other impacts associated with the cable landfall and substation installation activities including onshore access,
equipment laydown, working areas and construction compounds and all other onshore infrastructure will be assessed as
part of a separate ES and planning application (see Chapter 21 Overview of Onshore Impacts).
This chapter is supported by ecological surveys conducted by Royal Haskoning and Aquatera, and a desk-based report
on wintering barnacle geese (see Section 10.5). Related chapters include Chapter 11 Benthic Ecology, which addresses
offshore habitats, and Chapter 14 Ornithology, which covers marine bird interests.
10.2 STUDY AREA
The geographical focus of this assessment includes the onshore Areas of Search for export cable corridor up to MHWS
and the terrestrial habitats immediately adjacent that could potentially be affected by the cable landfall installation activities.
The study area includes the following three cable landfall areas of search: Sheep Skerry, Moodies Eddy and Aith Hope
(see Figure 10.1).

Environmental Statement
Brims Tidal Array
Page 24 of 316
Figure 10.1: Study area for coastal ecology showing designated sites
10.3 DESIGN ENVELOPE CONSIDERATIONS
The Project has taken a design envelope approach. The basis of the design envelope is to apply a “worst case” approach
to the assessment of the different impacts associated with the Project. With this in mind the maximum “worst case” project
parameters considered for the assessment of coastal and terrestrial ecology are presented in Table 10.1. The Project is
considering three different potential landfalls as described above. Each of these landfalls is assessed separately, in line
with this approach.

Environmental Statement
Brims Tidal Array
Page 25 of 316
Table 10.1: Design envelope parameters for assessment of coastal and terrestrial ecology
Project parameters relevant to the
assessment
Maximum Project parameters for
the impact assessment
Explanation of maximum Project
parameters
Location of cable landfall Sheep Skerry
Moodies Eddy
Aith Hope
Three separate landfalls are being
considered and each is assessed
separately.
Method to be used to bring cables
ashore at landfall
Open Cut Trench or Horizontal
Directional Drill (HDD)
Assume land-based long HDD would
have greatest capacity for potential
disturbance to breeding/wintering
birds in fields.
Long HDD would avoid impacts on
intertidal species.
Open cut trenching would have
greatest capacity for potential
disturbance to cliff-nesting bird
species.
Open cut trench and short HDD
would affect intertidal habitats.
Width of cable corridor at landfall Stage 1: maximum 20m (maximum
affected area for 4 cables)
Stage 2: maximum 85m (maximum
affected area for 16 cables)
Stage 1: 5m per cable for 4 cables
Stage 2: 5m per cable for 16 cables
Duration of works Stage 1: 4 cables in 2019/2020
Stage 2: 12 cables in 2021/2022
Two cables laid per installation
operation
Assume construction activities occur
throughout the year.
10.4 LEGISLATIVE FRAMEWORK AND POLICY CONTEXT
The following legislation relevant to the assessment of coastal and terrestrial ecology has been considered in this
assessment:
The Habitats Directive (Council Directive 92/43/EEC on the Conservation of natural habitats and of wild fauna and flora) -
promotes the maintenance of biodiversity by requiring Member States to take measures to maintain or restore natural
habitats and wild species listed on the Annexes to the Directive at a favourable conservation status, introducing robust
protection for those habitats and species of European importance. Member states are required to contribute to a coherent
European ecological network of protected sites by designating Special Areas of Conservation (SACs) for habitats listed on
Annex I and for species listed on Annex II;
The Birds Directive (The Council Directive on the Conservation of Wild Birds (2009/147/EC)) – provides measures for the
identification and classification of Special Protection Areas (SPAs) for rare or vulnerable species listed in Annex I of the
Directive, as well as for all regularly occurring migratory species;

Environmental Statement
Brims Tidal Array
Page 26 of 316
The Habitats Regulations (Conservation (Natural Habitats, &c) Regulations 1994 (as amended)) form the implementation
of the Habitats and Birds Directives in terrestrial areas and in territorial waters out to 12 nautical miles. The Habitats
Regulations also underpin the protection afforded to European Protected Species (EPS), i.e. those species listed in Annex
IV of the Habitats Directive whose natural range includes Great Britain, including otter. Under these regulations, otters and
otter shelters are legally protected whether or not an otter is present;
The Wildlife and Countryside Act 1981 (as amended) - The Act makes it an offence (with exception to species listed in
Schedule 2) to intentionally: kill, injure, or take any wild bird, take, damage or destroy the nest of any wild bird while that
nest is in use or being built or take or destroy an egg of any wild bird. The Act also makes it an offence (subject to
exceptions) to intentionally or recklessly kill, injure or take any wild animal listed on Schedule 5, and prohibits interference
with places used for shelter or protection, or intentionally disturbing animals occupying such places. The Act also prohibits
certain methods of killing, injuring, or taking wild animals;
UK Biodiversity Action Plan - The UK BAP defines a number of priority species and habitats that have been identified as
being the most threatened and in need of conservation action at a national level using the application of criteria based on
international importance, rapid decline and high risk (Biodiversity Reporting and Information Group, 2007);
The Scottish Biodiversity List (Biodiversity Scotland, 2013) - a list of animals, plants and habitats that Scottish Ministers
consider to be of principal importance for biodiversity conservation in Scotland; and
Orkney Local Biodiversity Action Plan (LBAP) 2013 – 2016 – this plan is the means by which the UK BAP and the Scottish
Biodiversity Strategy are implemented at the local level. Targets set nationally for species and habitats of conservation
concern are translated into actions which are achievable in a local context. This plan also provides a focus for the
conservation of locally valued species and habitats.
10.5 SUPPORTING SURVEYS AND STUDIES
Coastal ecology desk studies undertaken to date include:
A review of designated sites within 5km of the Project study area, including statutory sites obtained from Scottish
Natural Heritage (SNH)’s Sitelink (gateway.snh.gov.uk/sitelink) website;
Review of information on non-statutory, locally designated sites within 1km of the proposed Project site, obtained from
the OIC website (www.orkney.gov.uk);
A biological records search using information from National Biodiversity Network (NBN) (http://www.nbn.org.uk/);
A specially commissioned biological records search undertaken by the Orkney Biodiversity Records Centre (OBRC)
in 2012; and
A desk-based assessment of the use of fields by wintering Greenland barnacle geese in South Walls (14b).
The following field studies undertaken to date for Sheep Skerry, Moodies Eddy and Aith Hope.

Environmental Statement
Brims Tidal Array
Page 27 of 316
10.5.1 Sheep Skerry
Phase 1 habitat survey and otter survey conducted by Aquatera on 25 June 2015 (Supporting Document: Crossley,
2015);
Phase 1 Intertidal habitat survey conducted by Aquatera on 19 June 2015 (Supporting Document: Aquatera, 2015a);
and
Breeding bird surveys and shoreline survey undertaken by Aquatera; two visits: 23 June and 6 July 2015 (Supporting
Document: Aquatera, 2015d).
10.5.2 Moodies Eddy and Aith Hope
Extended Phase 1 habitat survey conducted by Royal Haskoning, 21-25 August 2012 (Supporting Document: RHDHV,
2012);
Intertidal survey conducted by Royal Haskoning, 21-23 August 2012 (Supporting Document: RHDHV, 2014a);
Otter survey conducted by Royal Haskoning, 21-24 August 2012 (Supporting Document: RHDHV, 2014b); and,
Breeding bird surveys (three visits between 24 May and 5 July 2012) and Shoreline surveys (Moodies Eddy was
surveyed on 25 May 2012 and Aith Hope was surveyed on the 29 May 2012) undertaken by Aquatera (Supporting
Document: Aquatera, 2012a).
10.6 DATA GAPS AND UNCERTAINTIES
10.6.1 Sheep Skerry
The Brown and Shepherd (1993) method for surveying breeding waders requires a minimum of two visits, one early in the
season (early April to mid-May) and the second, mid-May to late June. The O’Brien and Smith (1992) method requires
three visits between 15 April and 19 June. Due to the timing at which the Sheep Skerry site first became an option as a
possible cable landfall location, the early part of the breeding season had already passed. However due to the exceptionally
wet and cold spring in 2015, it is likely that the cold weather delayed the onset of the breeding season for most species.
The findings recorded during the two visits that were undertaken are considered sufficient to provide representative data
on the number and distribution of the species breeding in the area taking into consideration the possibility that a few
breeding attempts that had already fledged or failed may have been missed.
10.6.2 Moodies Eddy and Aith Hope
Access for the intertidal habitat survey at Moodies Eddy was restricted due to the presence of high, steep-sided cliffs which
made some sections of the coastline inaccessible with no safe access to the shore. Where possible, these areas were
surveyed from the cliff top where the biotopes were assigned based on what could be viewed through binoculars and
experience from other parts of the nearby survey area.
It was not possible to survey Moodies Eddy or sections of Aith Hope cable landfall for otters due to the inaccessible nature
of the shoreline (see Figure 1.1 in Supporting Document: RHDHV, 2014b). As rain had occurred overnight, it is also
possible that some recent field signs of otter may have been washed away and thus some field signs went undetected.
These limitations aside, the results of the field surveys are considered to allow a sufficient evaluation of potential constraints
and the potential for negative impacts from the proposed Project.

Environmental Statement
Brims Tidal Array
Page 28 of 316
10.7 CONSULTATIONS
A list of feedback from all consultees is summarised in Chapter 6 Consultation Process. The key points raised by
stakeholders regarding coastal and terrestrial ecology are presented in Table 10.2.
Table 10.2: Key issues raised by stakeholder during consultation
Topic Stakeholder Comment Response/Action
taken
Section
cross-
reference
Scoping
Wintering
Greenland
barnacle geese
from Switha
SPA
SNH Wintering Greenland barnacle geese from
Switha SPA use fields in South Walls. Given
its location in respect to feeding and buffer
zones for barnacle geese under the South
Walls Goose Management Scheme, we
consider that the south west section of
South Walls (Aith Hope cable landfall) is less
suitable for cable landfall. SNH hold data of
recent goose counts in South Walls.
The most recent
data on goose
counts was
requested from
SNH. These data
have been used in
this assessment.
See Section
10.9.6.3
Disturbance to
birds
SNH Disturbance due to installation activities
should be considered, as some activities
may disturb birds.
Noted. See Section
10.12.1.4
Mitigation Orkney
Islands
Council
(OIC)
It will be important to consider the timing of
each stage of the Project in order to avoid
disturbance to bird species during their
breeding season.
Mitigation
measures to avoid
disturbance to
breeding birds
have been
considered.
See Sections
10.11.2 and
10.12.1.4
Orkney LBAP OIC The most recent and up to date Orkney
LBAP should be used. This is
LBAP 2013-2016 and can be found at:
http://www.orkney.gov.uk/Service-
Directory/L/Local-Biodiversity-Plan.htm
This plan has
been referred to
and considered in
this assessment.
See Section
10.9
Post-Scoping
Mitigation for
wintering
Greenland
barnacle geese
from Switha
SPA
SNH The fields around Aithsdale are preferred
traditional feeding grounds for barnacle
geese.
The works are likely to disturb barnacle
geese feeding on nearby fields and our
advice would be that construction activities
should be timed to avoid the wintering
season (October –April). The geese
generally arrive about 16 October and leave
around 16 April.
Mitigation
measures to avoid
disturbance to
Greenland
barnacle geese
have been
considered.
See Sections
10.11.2 and
10.12.1.5

Environmental Statement
Brims Tidal Array
Page 29 of 316
10.8 ASSESSMENT METHODOLOGY
10.8.1 Assessment Criteria
The methodology used to assess the significance of potential effects on ecological receptors has considered guidelines
produced by the Institute of Ecology and Environmental Management (IEEM, 2006; 2010). The appraisal of predicted
effects on ecological receptors is based on both the value of a receptor and the nature and magnitude of the effect that the
Project will have on it. This has been deduced through consultation with key stakeholders and professional judgement.
Table 10.3 defines the sensitivity for the various environmental receptors considered in this chapter.
The IEEM guidance recommends that the predicted impacts on the receptors be described and quantified, giving
consideration to the following parameters: confidence in predictions, positive or negative, extent, magnitude, duration,
reversibility and timing and frequency. Professional judgement has been used to assign the impacts on the receptors to
one of four levels of magnitude, defined in Table 10.4. Finally, Table 10.5 provides the overall classification scheme for
impacts on ecology and nature conservation, considering the sensitivity of the receptor and the magnitude of the impact.
Table 10.3: Definitions for sensitivity of coastal and terrestrial ecology
Sensitivity of
receptor
Criteria
High A qualifying feature of an SAC, SPA or Ramsar site or notified feature of a SSSI
A regularly occurring substantial population of an internationally important species (listed on Annex I
of the Birds Directive or Annex II or IV of the Habitats Directive)
The species/habitat affected has no or very limited capacity to avoid, adapt to, accommodate or
recover from the impact.
Medium A nationally important designated site e.g. MPA, SSSI, or a site considered worthy of such
designation
A viable area of a habitat type listed in Annex I of the Habitats Directive or of smaller areas of such
habitat which are essential to maintain the viability of a larger whole
A regularly occurring substantial population of a nationally important species, e.g. listed on
Schedules 1, 5 and 8 of the Wildlife and Countryside Act (1981) (as amended), including species
listed on UK BAP priority lists
The species/habitat affected has a limited capacity to avoid, adapt to, accommodate or recover from
the impact.
Low Areas of internationally or nationally important habitats which are degraded but are considered
readily restored
A regularly occurring, regionally significant population of a species listed as being nationally scarce
The species/habitat affected has some tolerance to avoid, adapt to, accommodate or recover from
the impact.
Negligible Areas of internationally or nationally important habitats which are degraded and have little or no
potential for restoration
A good example of a common or widespread habitat in the local area, e.g. those listed as broad
habitats on the Local BAP
Species of national or local importance, but which are only present very infrequently or in very low
numbers within the subject area
Areas of heavily modified or managed vegetation of low species diversity or low value as habitat to
species of nature conservation interest; common and widespread species
Species/habitats generally tolerant of the impact and can accommodate or recover from the impact.

Environmental Statement
Brims Tidal Array
Page 30 of 316
Table 10.4: Definitions for magnitude of effect for coastal and terrestrial ecology
Magnitude of
effect
Criteria
High An irreversible (permanent) impact on a habitat, species assemblage/community, population or
group from which recovery is not possible within a reasonable timescale
Major loss or major alteration to key elements of the baseline (pre-development) conditions such
that the post-development character/composition/attributes will be fundamentally changed
Medium A reversible (temporary) impact on a habitat, species assemblage/community, population or group
from which recovery is possible within a reasonable timescale
Loss or alteration to one or more key elements/features of the baseline conditions such that post-
development character/composition/attributes will be partially changed
Low A reversible (temporary) impact on a habitat, species assemblage/community, population or group
from which spontaneous recovery is possible or that is within the range of variation normally
experienced between years
Minor shift away from baseline conditions; change arising from the loss/alteration will be discernible
but underlying character/composition/attributes of the baseline condition will be similar to the pre-
development situation
Negligible Very slight change to the baseline condition; change barely distinguishable, approximating the ‘no
change’ situation
A short-term but reversible effect on a habitat, species assemblage/community, population or group
that is within the normal range of annual variation
Positive The creation of new habitat or restoration of a degraded habitat
Table 10.5: Assignment of impact significance for coastal and terrestrial ecology based on sensitivity of receptor and magnitude of effect
Sensitivity of
Receptor
Magnitude of effect
High Medium Low Negligible
High MAJOR MAJOR MODERATE MINOR
Medium MAJOR MODERATE MINOR MINOR
Low MODERATE MINOR NEGLIGIBLE NEGLIGIBLE
Negligible MINOR NEGLIGIBLE NEGLIGIBLE NEGLIGIBLE
For the purposes of the EIA, any impacts classified as ‘major’ or ‘moderate’ are deemed to be significant.
10.9 BASELINE DESCRIPTION
10.9.1 Introduction
This section describes the ecology of each of the potential landfalls. The Sheep Skerry landfall area of search extends
approximately 510m. The Moodies Eddy landfall area of search extends approximately 690m and the Aith Hope landfall
area of search includes a much larger area, extending some 3,830m from Geo of Rottenloch on the Brims peninsula in the
west to The Knave on South Walls in the east (see Figure 10.1).

Environmental Statement
Brims Tidal Array
Page 31 of 316
10.9.2 Designated Sites
There are several sites designated for their nature conservation interests at European and national levels that could
potentially be affected by the proposed Project (Table 10.6 and Figure 10.1). There are no Marine Protected Areas (MPAs),
National Nature Reserves or Local Nature Reserves within the vicinity that could be affected by the proposed Project.
Local Nature Conservation Sites (LNCSs) are listed in the Orkney Local Development Plan which has been accepted by
the Council and is currently awaiting the Scottish Government’s examination process. LNCSs that could potentially be
affected by proposed Project are shown in Figure 10.1 and listed in Table 10.7.
Designated sites relevant to each of the cable landfall options are described below.
10.9.2.1 Sheep Skerry
The Sheep Skerry potential landfall location is adjacent to the eastern edge of the Hoy SPA/SAC/SSSI designated for
important habitats, geological features and populations of breeding birds (Table 10.6). The AoS for the export cable corridor
partially overlaps with the marine component of Hoy SPA which supports populations of European importance of breeding
seabirds. Sheep Skerry AoS also partially overlaps with Pentland Firth and Scapa Flow draft SPA which is an extensive
marine area that supports populations of European importance of breeding and wintering season marine bird interests
(Table 10.6). These sites are of relevance to the marine environment only therefore potential impacts are assessed in
Chapter 14 Ornithology.
There are no LNCSs with habitat or wildlife interests near the Sheep Skerry landfall that could be affected by the cable
landfall installation activities. Melsetter Coast LNCS is within the Sheep Skerry landfall however this site is listed for
geological interests; therefore any potential impacts are assessed in Chapter 8 Geology and Hydrology.
10.9.2.2 Moodies Eddy
The AoS for the export cable corridor partially overlaps with the marine component of Hoy SPA which is designated for
populations of European importance of breeding seabirds. The AoS for the export cable corridor also overlaps with
Pentland Firth and Scapa Flow draft SPA which is of importance to breeding and wintering season marine bird interests
(Table 10.6). These sites are of relevance to the marine environment only therefore potential impacts are assessed in
Chapter 14 Ornithology. Hoy SAC/SSSI and the terrestrial component of Hoy SPA is 1,090m to the west.
There are no LNCSs near this landfall that could be affected by the cable landfall installation activities at Moodies Eddy.
10.9.2.3 Aith Hope
The AoS for the export cable corridor for Aith Hope landfall location is outside the marine component of Hoy SPA however
lies partially within Pentland Firth and Scapa Flow draft SPA which is of importance to breeding and wintering season
marine bird interests (Table 10.6). These sites are of relevance to the marine environment only therefore potential impacts
are assessed in Chapter 14 Ornithology. Hoy SAC/SSSI and the terrestrial component of Hoy SPA is 1,680m to the west.
The Aith Hope cable landfall location is adjacent to fields used by wintering Greenland barnacle geese Branta leucopsis
from Switha SPA/SSSI; see Figure 10.15 and Supporting Document: Aquatera, 2012b.

Environmental Statement
Brims Tidal Array
Page 32 of 316
Aith Hope AoS export cable corridor lies partially within Aith Head LNCS which is listed for important habitats, a hawkweed
and breeding birds of prey. Aith Hope AoS export cable corridor is also adjacent to Brims LNCS which is listed for important
habitats and breeding birds (Table 10.7).
Table 10.6: Statutory designated sites relevant to the coastal environment
Name Qualifying interests/Notified features Distance (km)
European Sheep
Skerry
Moodies
Eddy
Aith
Hope
Hoy SAC Alkaline fens, alpine and boreal heaths, blanket bogs*, calcareous
rocky slopes with chasmophytic vegetation European dry heaths,
natural dystrophic lakes and ponds Northern Atlantic wet heaths
with Erica tetralix, petrifying springs with tufa formation
(Cratoneurion)*, vegetated sea cliffs of the Atlantic and Baltic
coasts
*priority habitat
70m 1,090m 1,680m
Hoy SPA Annex 1 species: red-throated diver Gavia stellata, breeding,
peregrine Falco peregrinus, breeding
Migratory: great skua Stercorarius skua, breeding,
Atlantic puffin Fratercula arctica, breeding, Arctic skua Stercorarius
parasiticus, breeding, black-legged kittiwake Rissa tridactyla,
breeding, Northern fulmar Fulmarus glacialis, breeding, great
black-backed gull Larus marinus, breeding, common guillemot Uria
aalge, breeding
0m 0m 720m
Switha SPA Non-breeding birds: Greenland barnacle goose Branta leucopsis 9,530m 8,110m 5,980m
Pentland
Firth and
Scapa Flow
draft SPA1
Annex 1 species: Great northern diver Gavia arctica, red-throated
diver Gavia stellata, black-throated diver Gavia immer, Slavonian
grebe Podiceps auritus, Arctic tern Sterna paradisaea
Migratory: European shag Phalacrocorax aristotelis, common
guillemot Uria aalge, common eider Somateria mollissima, long-
tailed duck Clangula hyemalis, common goldeneye Bucephala
clangula, red-breasted merganser Mergus serrator
370m 0m 0m
National
Hoy SSSI Habitats: Bogs: Blanket bog, freshwater habitats: dystrophic loch,
uplands: upland assemblage, woodland: upland oak woodland
Birds: breeding bird assemblage, seabird colony breeding, Arctic
skua, breeding, Northern fulmar, breeding, great black-backed gull,
breeding, great skua, breeding, common guillemot, breeding,
peregrine, breeding, red-throated diver, breeding
0m 1,060m 1,680m
Switha
SSSI
Non-breeding birds: Greenland barnacle goose 9,530m 8,110m 5,980m
1 The current status of a draft SPA does not afford policy protection however the progression of the application to a
proposed SPA may occur by the time of submission therefore is included for completeness

Environmental Statement
Brims Tidal Array
Page 33 of 316
Table 10.7: Non-statutory designated sites
Name of site Special features Distance from
cable landfall (m)
Habitats Wildlife
Aith Head LNCS Upland heath*
Maritime heath
Maritime cliff and slope*
Maritime grassland
Breeding birds of prey*
Hieracium maritimum (a
hawkweed)
Partially within (Aith Hope
AoS export cable corridor)
Brims LNCS Lowland meadow*
Maritime heath
Lowland fens*
Maritime cliff and slope*
Maritime grassland
Curlew Numenius arquata*
Lapwing Vanellus vanellus*
Redshank Tringa totanus
Common gull Larus canus
Skylark Alauda arvensis*
Adjacent to (Aith Hope
AoS export cable corridor)
*nationally important habitats and species
10.9.3 Terrestrial Habitats
Phase 1 habitats recorded at Sheep Skerry have been mapped; see Annex 2a in Supporting Document: Crossley, 2015.
The Extended Phase 1 habitat survey for Moodies Eddy and Aith Hope covered the accessible terrestrial habitats from
Sands Geo near Melsetter in the west to between The Knave and Aith Head in the east: Phase 1 habitats have been
mapped; see Figures A.1 and A.2 in Supporting Document: RHDHV, 2012. An overview of some of the coastline in this
area is shown in Figure 10.2.

Environmental Statement
Brims Tidal Array
Page 34 of 316
Figure 10.2: Coastline at Brims Ness viewed to the west of Duncan’s Geo towards Moodies Eddy with Melsetter in the distance
Table 10.8 provides a summary of the adjacent terrestrial habitats found at the potential cable landfall sites during the
Phase 1 habitat surveys along with information concerning their importance with regard to national and local biodiversity
lists (UK Biodiversity Action Plan (UK BAP) and Orkney LBAP).
10.9.3.1 Sheep Skerry
The area of sand dunes at Sheep Skerry is categorised as ‘Open dune’ and ‘Dune grassland’ which form the ‘Fixed dunes
with herbaceous vegetation’ habitat listed in Annex I of the EC Habitats Directive and the ‘Coastal Sand Dune’ habitat
which is a UK BAP and Orkney LBAP priority habitat. Most of the sand dunes are a worked-out sand quarry however there
is a remnant of semi-natural habitat in the form of a narrow band of fixed open dune along much of the seaward edge,
although this is badly eroded in places. The steep banks named Melberry are in a more favourable condition than the rest
of this habitat at this site. The dune grassland is mostly semi-improved, retaining some of the quality of typical dune
grassland with abundant red fescue Festuca rubra but with only occasional presence of characteristic species such as
lady’s-bedstraw Galium vernum; it is generally species-poor and includes improved grassland species such as ryegrass
Lolium perenne, meadow-grass Poa spp. and weeds. Given that this area is worked for constructional sand, and is not
specifically mentioned in the Orkney LBAP, it is not considered to be a highly valued example of this type of habitat in
Orkney.
The western end of the site is peatland (wet dwarf shrub heath) and blanket bog which is heavily grazed but is not otherwise
modified or damaged. For a short distance along the western shore there is a 3m-wide strip of coastal grassland with spring
squill Scilla verna and sea plantain Plantago maritima which has been grazed short but is in favourable condition. These
three habitat types are listed in Annex I, UK BAP and the Orkney LBAP however they are small fragments of habitats of

Environmental Statement
Brims Tidal Array
Page 35 of 316
which there are extensive areas, in more favourable condition elsewhere in Hoy and Orkney. An acid/neutral flush (a UK
BAP priority habitat) is present in the wet dwarf shrub heath. This is considered a minor feature on the site.
Other Annex I/UK BAP/Orkney LBAP habitats present at the site include dune slack of which there are two small patches
in hollows in the sand substrate which have some of the character of dune slack, with sedges Carex spp. and northern
marsh orchids Dactylorhiza purpurella however these areas show signs of eutrophication which is apparent in the lush
growth of competitive plants including marsh horsetail Equisetum palustre and watercress Nasturtium officinale. Water
draining from the central dune slack issues onto the sand beach via a break in the dune ridge; this running water is listed
as priority habitat in the Orkney LBAP. A notable species, whorl-grass Catabrosa aquatica was recorded growing at the
mouth of the burn where it emerges onto the sandy beach. This species is listed as ‘Locally scarce’ with less than 11
recorded sites in Orkney, but has no higher conservation designation.
Towards the western end of the site there is a 200m section of the shore with boulders up to 1m in diameter that have
been cast above HWM. This habitat is also listed in the Orkney LBAP.
10.9.3.2 Moodies Eddy
The Moodies Eddy landfall is adjacent to improved grassland fields2; see Figure A.1 in Supporting Document: RHDHV,
2012. No notable species were found in this area.
10.9.3.3 Aith Hope
The Aith Hope potential landfall area extends from Geo of Rottenloch in the west to The Knave in the east. Aith Hope is a
narrow isthmus connecting Hoy to South Walls with a road separating Aith Hope from North Bay. A small linear stretch of
strandline vegetation runs from east to west along the north and south of the Ayre (and adjacent to the causeway; see
Figure 10.3 and Figure 10.4). The substrate consists of pebbles and sand. Typical species included lyme grass Leymus
arenarius, false-oat grass Arrhenatherum elatius, curled dock Rumex crispus and broad-leaved dock, hawksbeard
Hieracium sp, orache Atriplex prostrate agg, mayweed Tripleurospermum sp. and sea plantain. This habitat is considered
to fall within the description for Vegetated Shingle, a UK BAP priority habitat, and also a priority habitat in the Orkney LBAP.
It is not known what species of hawksbeard Hieracium spp. was encountered during the survey; however it should be
noted that Hieracium orcadense or hawkweed is a priority species in the Orkney LBAP (although not listed in the UK BAP
or Scottish Biodiversity List).
2 Coded as Arable fields on map, but Target Note states as improved grassland in the process of being cut for silage.

Environmental Statement
Brims Tidal Array
Page 36 of 316
Figure 10.3: Vegetated shingle habitat at Aith Hope
Figure 10.4: Vegetated shingle habitat at Aith Hope
This isthmus is adjacent to a patch of marshy grassland lying to the east that is characterised by a high proportion of
swamp vegetation including yellow-flag iris pseudocorus, common reed Phragmites communis, reed canary-grass Phalaris
arundinacea and false-oat grass.
At the south eastern tip of the Brims Ness peninsula, there is a patch of neutral grassland/semi-improved along the cliffs
at the entrance to the bay. This habitat is associated with the lowland meadows UK BAP habitat. However, it is unlikely
that there will be a landfall along the cliffs at this location.
Other UK BAP priority habitats can be found in small patches between the Geo of Rottenloch and Langi Geo in the west
(Wet heathland acid grassland) and between The Clevies and The Knave in the east (Coastal dry heath) which is within
Aith Head LNCS.
In addition, arable field margins are a UK BAP habitat; however they are not a priority habitat in the Orkney LBAP. However,
the margins of these fields, which are separated by fences, are not managed for wildlife habitat.
Table 10.8: Summary of terrestrial habitats within the potential landfall options
Phase 1 classification
(JNCC, 2010)
EC Habitats Directive UK Interest
features (Jackson & MacLeod, 2000)
UK BAP Priority
Habitat (Brig, 2007)
Orkney LBAP
Priority Habitat
Sheep Skerry (west to east)
Coastal grassland Vegetated sea cliffs of the Atlantic and
Baltic coasts
Maritime cliff and
slope
Yes
Wet dwarf shrub heath Northern Atlantic wet heaths with Erica
tetralix
Upland heathland Yes
Blanket bog Blanket bogs Blanket bog Yes
Boulders/rocks above
high water mark
N/A N/A Storm beach
Marshy/marshy grassland N/A N/A Wet meadow

Environmental Statement
Brims Tidal Array
Page 37 of 316
Phase 1 classification
(JNCC, 2010)
EC Habitats Directive UK Interest
features (Jackson & MacLeod, 2000)
UK BAP Priority
Habitat (Brig, 2007)
Orkney LBAP
Priority Habitat
Acid/neutral flush N/A Upland flushes, fens
and swamps
Yes
Semi-improved acid
grassland
N/A N/A No
Running water N/A N/A Burns and
canalised burns
Dune grassland Fixed dunes with herbaceous vegetation Coastal sand dunes Yes
Open dune
Dune Slack Humid dune slacks Coastal sand dunes Yes
Moodies Eddy
Improved grassland N/A N/A No
Aith Hope (west to east)
Improved grassland N/A N/A No
Wet heathland/acid
grassland
N/A Lowland heathland No
Neutral grassland – semi-
improved
N/A Lowland meadows No
Arable fields N/A Arable field margins No
Poor semi-improved
grassland
N/A N/A No
Improved grassland N/A N/A No
Strandline vegetation N/A Vegetated shingle Yes
Marshy grassland N/A N/A No
Improved grassland N/A N/A No
Dry dwarf shrub heath –
acid
European dry heath Coastal dry heath No
Poor semi-improved
grassland
N/A N/A No
10.9.4 Intertidal Habitats
The intertidal zone within the study area is composed of a number of different substrates, ranging from solid bedrock in
the more exposed locations, through to cobbles and sand in the more sheltered environments of Aith Hope. This variety of
habitats supports a number of biotopes, some of which support very few species (for example, barren shingle and sand),

Environmental Statement
Brims Tidal Array
Page 38 of 316
while others (for example, bedrock and boulder biotopes) support a large number of species. Table 10.9 provides a
summary of the intertidal habitats of conservation importance found at the potential landfall locations during the dedicated
surveys. A full description of all of the habitats and species recorded is presented in the Survey Reports (see (Supporting
Document: RHDHV, 2014a) and (Supporting Document: Aquatera, 2015a)).
10.9.4.1 Sheep Skerry
The area surveyed for the Sheep Skerry AoS cable corridor extended from Tor Ness in the west to Sands Geo in the east.
The coastline at Sheep Skerry is backed by dunes with small cliffs rising from the high splash zone further to the east and
west (Figure 10.5). To the west of the beach at Sheep Skerry, the beach is characterised by large boulders showing typical
zonation as you move from high to low water (Figure 10.6). The upper shore here is characterised by lichens moving into
green seaweeds and then fucoids, primarily spiral wrack Fucus spiralis, before reaching the kelp zone, dominated by kelps
and thong weed Himanthalia elongata, at low water.
The beach at Sheep Skerry is backed by high dunes, with a freshwater source emanating at the foot of the dunes. The
upper shore is fairly barren with the only observed fauna being sandhoppers Amphipoda spp. Lower down the shore
occasional boulders are found partially covered by sand providing a habitat for sand scoured red seaweeds. Evidence of
lugworms Arenicola marina is also found on the lower shore.
Figure 10.5: Sheep Skerry (facing east)
Figure 10.6: Boulder beach
To the east of this beach the shore again becomes rock, but this time is characterised by ledges rather than boulders.
Again evidence of classical zonation can be found, with a wide Verrucaria spp. zone found in the splash zone followed by
barnacle Semibalanis balanoides covered rocks with occasional limpets Patella vulgata. In areas channel wrack Pelvetia
canaliculata is also observed at the upper end of the mid-shore. Below the mid-shore similar species are evident again to
the boulder shore to the west with fucoids and kelps dominating. The structure of the ledges provides habitats for beadlet
anemones Actinia equina in crevices and shallow rockpools. Sections of the ledges are also covered with shallow rockpools
dominated by green seaweeds and large wide gullies further down the shore retain water at low tide creating permanent
kelp dominated rock pools. To the east of the rocky ledges is another sandy beach at Sands Geo. Here there appears to
be less infauna possibly due a black anoxic layer close to the surface.
The dog whelk Nucella lapillus was the only species of importance found in the study area, observed in the barnacle zone

Environmental Statement
Brims Tidal Array
Page 39 of 316
on the rocky ledges between the two beaches. The dog whelk is an OSPAR3 species, but is common throughout the UK
and is not protected under any other legislation.
Five biotopes were recorded that are listed under EC Habitats Directive as they may form part of an Annex I habitat (see
Table 10.9). Two of these, LR.MLR.BF.Fser.Bo and LR.FLR.Rkp.G are also UK BAP habitats (Figure 10.7). However, all
of these habitats are widespread or common around the UK coasts and are not thought to be of particular conservation
importance in the area.
3 On a list of threatened and/or declining species and habitats in the north-east Atlantic, created under the OSPAR
Convention for the protection of the marine environment of the north-east Atlantic.

Environmental Statement
Brims Tidal Array
Page 40 of 316
Figure 10.7 UK BAP habitats recorded within the potential cable landfall Areas of Search during the intertidal surveys
10.9.4.2 Moodies Eddy and Long Geo
Moodies Eddy is a wide open bay with an intertidal area extending some 20m (Figure 10.8). Although access to the
intertidal area was not possible during the survey due to the presence of cliffs, habitats were observed through binoculars.
The substrate consists of a mixture of bedrock and boulder. A wide Verrucaria spp. zone in the upper shore leads to a
narrow and broken bank of spiral wrack. The mid shore is dominated by barnacles and few other species, gutweed Ulva
intestinalis was present on the sheltered side of boulders but a lot of bare rock was present. The low shore appears to
support dabberlocks Alaria esculenta and thong weed Himanthalia elongata, however this was difficult to confirm from
distance.
In the middle of Moodies Eddy, Long Geo cuts back further inland (Figure 10.9). This is a long narrow boulder-filled geo
and although the view was obstructed, it was thought that the intertidal area does not extend far into the geo.
There were no habitats of conservation importance identified at this landfall area of search.

Environmental Statement
Brims Tidal Array
Page 41 of 316
Figure 10.8: Moodies Eddy viewed from the west
Figure 10.9: View down Long Geo
10.9.4.3 Aith Hope
The south eastern coast of the Brims peninsula was characterised by exposed bedrock, much of it vertical or close to in
nature. Here the barnacles Semibalanus balanoides and Chthamalus montagui dominated with the only seaweed present
in the upper and mid-shore being stunted channel wrack Pelvetia canaliculata. In the very low shore dabberlocks Alaria
esculenta and oarweed Laminaria digitata were present. These biotopes persisted in an easterly direction until Brims Ness.
The south western side of Aith Hope from approximately 200m north west of Brims Ness to Aith View was more
homogenous than the more exposed coastline to the west. The zonation in this section of the shore was very clear with
five biotopes present running along the shore in consecutive bands (see Figure 3.5 in Supporting Document: RHDHV,
2014a).
There were a few exceptions to the general pattern of biotopes recorded, and these occurred where small embayments
broke the uniform nature of the surrounding area. These small bays were characterised by a low number of species and
different biotopes and supported the following “Littoral mixed sediment” LS.LMx, “High energy littoral rock” LR.HLR and
“Barren littoral coarse sand” LS.LSa.MoSa.BarSa consecutively.
There are a number of different sediment type biotopes at the apex of Aith Hope (Figure 10.10). The upper shore is
approximately 8m wide and substrate is dominated by sand and mixed sediment biotopes; there is a very scattered
strandline across much of the upper shore but no obvious mega flora or fauna growing (Figure 10.11). Below this is a 15m
wide sandy zone, with deep sand. This is bare of fauna and flora apart from scattered strand. The substrate on the lower
shore consists of small boulders and cobbles in a sandy matrix; toothed wrack and gutweed Ulva intestinalis cling to
boulders. Between the boulders is a mass of brown filamentous algae, which is not attached. Within the kelp zone, small
stunted dabberlocks and sea lace Chorda filum are also present on cobbles and boulders. The sandy substrate continues
seaward as far as visible.

Environmental Statement
Brims Tidal Array
Page 42 of 316
Figure 10.10: View down the shore from apex of Aith Hope
Figure 10.11: Sand-dominated biotopes in the upper shore of the apex of Aith Hope
Further to the east, rock slabs and ledges supported a more diverse range of biotopes; here the intertidal area covers a
much larger area than in any other part of the survey area. The fucoid zone is extensive, and unlike that recorded on the
western side of Aith Hope, the zonation is less clear. However, barren sediment dominated biotopes were still recorded in
the very upper shore such as “shingle (pebble) and gravel shores” LS.LCS.Sh.
Few species of conservation importance were identified within the intertidal study area (Table 10.9). The dog whelk Nucella
lapillus, an OSPAR4 species, was found throughout the survey area. Dog whelk is a common species in the UK and is not
protected under any other legislation.
Two UK BAP habitats were identified; the biotope LR.FLR.Rkp.G was recorded to the west of Geo of Rottenloch, and
therefore falls just outside of the study area. The biotope LR.MLR.BF.Fser.Bo was found at four locations, near Langi Geo,
at Maggie Mouat’s Geo, on the western extent of The Ayre, and at the Neive on the eastern side of Aith Hope (see Figure
10.7). Although these biotopes can form part of the Annex I ‘Reefs’ habitat, both of these biotopes are very common in the
UK and are not considered to be of particular conservation importance in the area.
Table 10.9: Intertidal biotopes of conservation importance recorded at the potential landfall options
Biotope Description Conservation status
Sheep Skerry
LR.MLR.BF.Fser.Bo Fucus serratus and under-boulder fauna
on lower eulittoral boulders
Part of ‘Reefs’ in Annex I of EC
Habitats Directive
UK BAP
LR.LLR.F.Asc Ascophyllum nodosum on very sheltered
mid eulittoral rock
Part of ‘Reefs’ in Annex I of EC
Habitats Directive
4 On a list of threatened and/or declining species and habitats in the north-east Atlantic, created under the OSPAR
Convention for the protection of the marine environment of the north-east Atlantic.

Environmental Statement
Brims Tidal Array
Page 43 of 316
Biotope Description Conservation status
LR.FLR.Rkp.FK Fucoids and kelp in deep eulittoral
rockpools
Part of ‘Reefs’ in Annex I of EC
Habitats Directive
LR.FLR.Rkp.G Green seaweeds (Ulva spp. and
Cladophora spp.) in upper shore rockpools
Part of ‘Reefs’ in Annex I of EC
Habitats Directive
UK BAP
LS.LSa.MoSa.BarSa Barren littoral coarse sand Part of ‘Mudflats and sandflats not
covered by seawater at low tide’ in
Annex I of EC Habitats Directive
Moodies Eddy
None No habitats of conservation importance
were identified however direct access to
the intertidal area was not possible due to
the presence of large cliffs
None
Aith Hope
LR.HLR.FR.Him Himanthalia elongata and red seaweeds
on exposed to moderately exposed lower
eulittoral rock
Part of ‘Reefs’ in Annex I of EC
Habitats Directive
LR.LLR.F.Fves.X Fucus vesiculosus on mid eulittoral mixed
substrata
Part of ‘Reefs’ in Annex I of EC
Habitats Directive
LR.MLR.BF.Fser.Bo Fucus serratus and under-boulder fauna
on exposed to moderately exposed lower
eulittoral boulders
Part of ‘Reefs’ in Annex I of EC
Habitats Directive
UK BAP
LS.LSa.MoSa.BarSa Barren littoral coarse sand Part of ‘Mudflats and sandflats not
covered by seawater at low tide’ in
Annex I of EC Habitats Directive
10.9.5 Protected Fauna
The European otter Lutra is a semi-aquatic mammal, which is common around the freshwater and coastal areas of
Scotland. UK populations are internationally important, especially since their widespread decline across much of their
western European range (JNCC, 2004), and this species is designated as a European Protected Species (EPS). Otter is
also listed as priority species for conservation on the UK Biodiversity Action Plan (UKBAP) and is listed on the Orkney
Local Biodiversity Action Plan and places of shelter are legally protected whether or not an otter is present. Populations in
coastal areas utilise shallow, inshore marine areas for feeding and require fresh water for bathing and terrestrial areas for
resting and breeding holts (JNCC, 2004). Where otters live in coastal areas (particularly in Scotland) they tend to have a
largely diurnal habit, live in group territories, and have home ranges below 5km (Kruuk, 1996).
Records provided by the NBN indicated the presence of otter is widespread across Orkney; however there are no existing
records for the study area. Three records for otter in South Walls were provided by OBRC however these records date
from 1965-1985.
No otters or signs of otter were recorded during the survey at Sheep Skerry (see Supporting Document: Crossley, 2015).
Direct access to the shoreline at Moodies Eddy was not possible due to the inaccessible nature of the coastline therefore
this area was surveyed where possible from the cliff top. At Aith Hope, the field survey was limited to the area of Aith Hope

Environmental Statement
Brims Tidal Array
Page 44 of 316
roughly between Brims Ness itself to the west and Inner Head to the east due to the presence of steep cliffs (see Figure
1.1 in Supporting Document: RHDHV, 2014b). The results of the otter survey can be seen in Figure A.1 in Supporting
Document: RHDHV, 2014b. Otter spraints were recorded at six locations. In addition, two potential pathways were located,
just to the west of The Ayre and two potential lie-ups were found, one on either side of The Ayre. No otter holts were found.
In general, given the widespread presence of otter in Orkney, and the location of the study area along the coast, it is likely
that all landfall options could receive some use by otter.
10.9.6 Birds
This section lists the ornithological interests present in the terrestrial environment within the three cable corridors and the
land immediately adjacent. All ornithological interests present in the marine environment are described in Chapter 14
Ornithology. All species recorded breeding in the Study Area during the shoreline and breeding bird surveys are shown in
Table 10.10. As Sheep Skerry AoS is adjacent to Hoy SPA, all qualifying features of Hoy SPA recorded breeding within a
surrounding buffer area of at least 500m have also been considered.
Table 10.10: Species recorded breeding within the Study Area during shoreline and breeding bird surveys
Landfall Species Conservation status
(highest level only)
Number
Sheep Skerry
AoS
Lapwing UK BAP 4 birds (2 pairs)
Black-headed gull Scottish Biodiversity List 9 pair
Oystercatcher none 4 pair
Wheatear none 1 pair
Common gull none 10 pair
Moodies Eddy
AoS
Herring gull UK BAP 144 birds (24 nests observed)
Oystercatcher none 4 pair
Ringed plover none 1 pair
Northern fulmar none 400 AONs
Raven none 1 pair
Razorbill none 12 birds on cliff, 4 birds close
inshore
Aith Hope AoS Arctic tern EC Birds Directive - Annex I 8 birds Brims LNCS
Lapwing UK BAP 6 birds Brims LNCS
Curlew UK BAP 6 birds South Walls
6 birds Brims
2 birds Brims LNCS

Environmental Statement
Brims Tidal Array
Page 45 of 316
Landfall Species Conservation status
(highest level only)
Number
Oystercatcher none 8 pair South Walls
4 pair Brims
6 pair Brims LNCS
Redshank none 7 birds Brims LNCS
Snipe none 1 pair Brims LNCS
Northern fulmar none 37 AONs Brims
6 AONs South Walls
Shelduck none 1 pair
10.9.6.1 Sheep Skerry
No breeding birds were recorded within the shoreline section of the Study Area (see Figure 10.12). The enclosed field
boundary immediately adjacent to the Sheep Skerry cable landfall AoS is of low ornithological interest with two pairs of
lapwing Vanellus (a UK BAP priority species) the only species of any conservation importance recorded breeding in the
area (Table 10.10). A small mixed colony of black-headed gulls Chroicocephalus ridibundus and common gulls Larus
canus, four pairs of oystercatcher Haematopus ostralegus and one pair of wheatear Oenanthe were also present.
Sheep Skerry cable landfall AoS is adjacent to Hoy SPA which supports populations of European importance of breeding
seabirds. Great skua Stercorarius skua was the only Hoy SPA qualifying feature recorded breeding within a surrounding
buffer area of at least 500m (Figure 10.12). Three apparently occupied territories (AOTs) were recorded. Two red-throated
divers Gavia stellata (another Hoy SPA qualifying feature) were recorded just outside the 500m buffer area however these
birds were non-breeders with no signs of breeding recorded. All other breeding birds recorded within the Study Area are
shown in Figure 3.1 in Supporting Document: (Aquatera, 2015d).
There is no suitable foraging habitat for wintering Greenland barnacle geese at Sheep Skerry potential cable landfall site.

Environmental Statement
Brims Tidal Array
Page 46 of 316
Figure 10.12: Bird survey results for Sheep Skerry cable landfall AoS
10.9.6.2 Moodies Eddy
Within the shoreline section of the Study Area 400 Northern fulmar Apparently Occupied Nests (AONs), one pair of raven
and 16 razorbills Alca torda were recorded (Figure 10.13 and Table 10.10). Northern fulmar is an abundant and common
breeding species in Orkney with an estimated population of approximately 91,000 AONs in Orkney recorded during the
Seabird 200 census (Mitchell et al. 2004). A small herring gull colony (144 birds) was located approximately 100m to the
east: herring gull is a UK BAP priority species. The fields contiguous to Moodies Eddy cable landfall AoS are of little
ornithological interest holding four pairs of breeding oystercatcher and one pair of ringed plover Charadrius hiaticula.
There is no suitable foraging habitat for wintering Greenland barnacle geese at Moodies Eddy potential cable landfall site.

Environmental Statement
Brims Tidal Array
Page 47 of 316
Figure 10.13: Bird survey results for Moodies Eddy cable landfall AoS
10.9.6.3 Aith Hope
On the Brims coastline within the Aith Hope export cable corridor AoS, the shoreline survey recorded 37 Northern fulmar
AONs (Figure 10.14 and Table 10.10). On the South Walls coastline, six Northern fulmar AONs and one shelduck Tadorna
nest were recorded.
No breeding birds were recorded within the area of Aith Head LNCS that overlaps with the Aith Hope export cable corridor
AoS. On South Walls, the coastal fields adjacent to the Aith Hope export cable corridor AoS held low numbers of breeding
waders including eight pairs of oystercatcher and six curlew Numenius arquata. On the Brims side, the coastal fields
adjacent to the Aith Hope export cable corridor AoS held four pairs of oystercatcher and six curlew. Brims LNCS which is
adjacent to the Aith Hope export cable corridor AoS is the area of highest ornithological interest in the Melsetter/Brims area
with a small colony (eight birds) of Arctic tern Sterna paradisaea (an Annex I species), six pairs of oystercatcher, one pair

Environmental Statement
Brims Tidal Array
Page 48 of 316
of common snipe Gallinago, two curlew, six lapwing Vanellus (a UK BAP species) and seven common redshank Tringa
totanus.
Figure 10.14: Bird survey results for Aith Hope cable landfall AoS
During the winter months (October to April), many fields in South Walls including those adjacent to the potential Aith Hope
cable landfall site are regularly used by foraging Greenland barnacle geese from Switha SPA (see Figure 10.15 and
Supporting Document: Aquatera, 2012b).

Environmental Statement
Brims Tidal Array
Page 49 of 316
Figure 10.15: Wintering barnacle goose field usage 2013/2014
10.9.7 Local Biodiversity Action Plan
The Orkney Local Biodiversity Action Plan (OLBAP; OIC, 2013) includes Action Plans for the following habitats found in
the study area: Coastal Sand Dunes and Links (Sheep Skerry) and Coastal Vegetated Shingle (Aith Hope). Species
associated with coastal sand dunes in Orkney are listed in Table 10.11. The coastal sand dune habitat at Sheep Skerry is
not considered to be a particularly valued example of this habitat. Species associated with vegetated shingle habitats are
listed in Table 10.12.

Environmental Statement
Brims Tidal Array
Page 50 of 316
Table 10.11: Species associated with coastal sand dunes in Orkney
Scientific name Common name Scientific name Common name
Lutra European otter Polyommatus icarus Common blue
Alauda arvensis Skylark Diarsia mendica
orkneyensis
Ingrailed clay
Carduelis flavirostris Twite Euxoa cursoria Coast dart
Bombus distinguendus Great yellow bumblebee Nematus stichi A sawfly
Bombus muscorum Heath carder bee Chrysolina crassicornis A leaf beetle
Carex maritima, Curved sedge Ammophila arenaria Marram
Asio flammeus Short-eared owl Erodium cicutarium Common storks-bill
Primula scotica Scottish primrose Calystegia soldanella Sea bindweed
Viola tricolor ssp curtisii Dune pansy Mertensia maritima Oysterplant
Microtus arvalis orcadensis Orkney vole Juncus balticus Baltic rush
Sorex minutes Pygmy shrew Dactylorhiza purpurella Northern fen orchid
Apodemus sylvaticus Wood mouse Parnassia palustris Grass of Parnassus
Anthus pratensis Meadow pipit Gentianella amarella
subsp. septentrionalis
Autumn Gentian
Haematopus ostralegus Oystercatcher Galium sterneri Limestone bedstraw
Somateria mollissima Eider Primula vulgaris Primrose
Tadorna Shelduck Dreplanocladus
lycopodioides
A moss
Charadrius hiaticula Ringed plover Brachythecium mildeanum A moss
Oenanthe Wheatear Distichium inclinatum A moss
Agrotis vestigialis Archers dart moth Riccia cavernosa A liverwort
Argynnis aglaja scotica Dark green fritillary Geoglossum arenarium An earth tongue
Table 10.12: Species associated with vegetated shingle habitats in Orkney
Scientific name Common name
Sterna hirundo Common tern
Sterna paradisaea Arctic tern
Charadrius hiaticula Ringed plover
Haematopus ostralegus Oystercatcher
Oenanthe Wheatear
Rhamphomyia morio A fly
Aphrosylus raptor A dolichopodid fly
Mertensia maritima Oysterplant
Scutellaria galericulata Skullcap

Environmental Statement
Brims Tidal Array
Page 51 of 316
The Orkney Local Biodiversity Action Plan contains a comprehensive list of hundreds of species considered to be of
conservation concern in Orkney. While a number of these are likely to be present in the study area, it is not thought that
the Project has the potential for any significant effects on these species.
10.9.8 Summary
Sheep Skerry landfall AoS is within 100m of Hoy SPA/SAC/SSSI, which is designated for important habitats, geological
features and populations of breeding birds (Table 10.6). The only Hoy SPA qualifying feature recorded breeding within a
500m surrounding buffer area of Sheep Skerry AoS was great skua with three AOT s present. Two red-throated divers,
another Hoy SPA qualifying feature, were recorded just outside the 500m buffer area however these birds were non-
breeders with no signs of breeding recorded. Aith Hope AoS is adjacent to fields used by wintering Greenland barnacle
geese from Switha SPA/SSSI.
Both Sheep Skerry and Moodies Eddy partially overlap with the marine component of Hoy SPA and also the Pentland Firth
and Scapa Flow draft SPA, which is of importance to breeding and wintering season marine bird interests (Table 10.6).
Potential impacts on these designated sites are explored further in Chapter 14 Ornithology.
The Aith Hope AoS lies partially within Aith Head LNCS which is listed for important habitats, a hawkweed and breeding
birds of prey. Aith Hope AoS is also adjacent to Brims LNCS which is listed for important habitats and breeding birds (Table
10.7). There are no LNCSs with habitat or wildlife interests near the Sheep Skerry or Moodies Eddy landfalls that could be
affected by the cable landfall installation activities.
The area of sand dunes at Sheep Skerry is a UK BAP and Orkney LBAP priority habitat however given that this area is
worked for constructional sand, and is not specifically mentioned in the Orkney LBAP, it is not considered to be a highly
valued example of this type of habitat in Orkney. There are other small areas of UK BAP priority habitats within the study
area at Sheep Skerry and Aith Hope however these are small fragments of habitats of which there are extensive areas in
more favourable condition elsewhere in Hoy and Orkney.
In the intertidal area, UK BAP priority habitats were recorded at locations within Sheep Skerry and Aith Hope AoS however,
these biotopes are very common in the UK and are not considered to be of particular conservation importance in the area.
In addition, the dog whelk Nucella lapillus was found throughout the study area and although it is classified as an OSPAR
species, it is a common species in the UK and is not protected under any other pieces of legislation.
No otters or signs of otter were recorded during the survey at Sheep Skerry. Moodies Eddy and sections of the Aith Hope
AoS could not be surveyed due to the presence of steep cliffs restricting access due to health and safety reasons. Otter
signs were recorded at various locations at Aith Hope. No otter holts were found. In general, given the widespread presence
of otter in Orkney, it is considered likely that all landfall options could receive some use by otter.
The area of highest ornithological interest in the study area is Brims LNCS which is adjacent to the Aith Hope cable landfall
AoS. A small colony of Arctic tern (an Annex I species) was recorded breeding here along with five species of waders.
Moodies Eddy holds little of ornithological interest with the exception of 400 Northern fulmar AONs however this is a
common and abundant breeding species in Orkney. A small herring gull colony (a UK BAP priority species) was recorded
in close proximity to the Moodies Eddy cable landfall. The Sheep Skerry AoS held little of ornithological interest with only

Environmental Statement
Brims Tidal Array
Page 52 of 316
two pairs of lapwing (a UK BAP priority species) and a small colony of black-headed gulls the only species of conservation
interest.
Wintering Greenland barnacle geese use fields in South Walls including those adjacent to the Aith Hope potential cable
landfall area as foraging areas from October to April. There is no suitable foraging habitat for wintering Greenland barnacle
geese at Sheep Skerry or Moodies Eddy potential cable landfall areas.
10.10 POTENTIAL IMPACTS
The potential impacts identified for each phase of the Project are:
10.10.1 Construction and Installation
Physical disturbance of terrestrial habitats during cable landfall installation;
Physical disturbance of intertidal habitats during cable landfall installation;
Disturbance of otters during landfall installation;
Disturbance to breeding birds due to cable landfall installation activities; and
Disturbance to foraging barnacle geese due to cable landfall installation activities.
10.10.2 Operation and Maintenance
There are no anticipated impacts on the coastal and onshore environment during the operation and maintenance phase of
the Project. Once the landfall installation works are complete, the buried cables at the landfall site are not expected to
require any maintenance and there will be no other infrastructure in place that would require any maintenance.
10.10.3 Decommissioning
If the Project is repowered, the cables would be left in situ, thus there would be no expected impacts during
decommissioning. If the cables are removed, then impacts during decommissioning would be expected to be the same or
less as those during construction, as the decommissioning process would be the reverse of the installation procedure
requiring the same plant and machinery.
10.11 MITIGATION MEASURES
10.11.1 Project Design and General Mitigation Measures
All project design mitigation and general mitigation measures are set out in Chapter 5 Project Description, Table 5.15 and
5.16 respectively. These are standard practice measures based on specific legislation, regulations, standards, guidance
and recognised industry good practice that are put in place to ensure significant impacts do not occur.
10.11.2 Specific Mitigation
The following mitigation measures will be implemented specifically to minimise the impacts on coastal and terrestrial
ecology and is detailed in Table 10.13.

Environmental Statement
Brims Tidal Array
Page 53 of 316
Table 10.13: Mitigation measures specific to coastal and terrestrial ecology
Ref Mitigation Measure Description
CTE01 Reinstatement of sensitive habitats (UK BAP or LBAP) will be reinstated following best practice guidance.
Material removed from the terrestrial/intertidal habitat should be stored and replaced within the same
terrestrial/intertidal habitat following the cable installation works.
CTE02 A pre-construction survey for otter will be carried out 8-10 weeks prior to works commencing. If any otter
shelters are located, further protection measures will be discussed and agreed with SNH/Marine Scotland
and implemented, including the possible need for a European Protected Species (EPS) licence if there is
potential for disturbance to otter.
CTE03 Mammal exit ramps will be provided for potential hazards such as steep-sided exposed trenches or holes
when contractors are off site (i.e. at night time). Temporarily exposed pipe systems will be capped when
contractors are off site to prevent otters from gaining access.
CTE04 If works are due to take place during the bird breeding season (April to August inclusive), a pre-
construction breeding bird survey will be undertaken by a suitably qualified Ecological Clerk of Works to
ensure no nests are present on site or adjacent to the site before works commence.
CTE05 If works are likely to be required during the bird breeding season (April to August inclusive) use of
appropriate measures (to be agreed with SNH) to deter birds from breeding on site before construction
commences should be implemented at the earliest opportunity before nest building begins. Possible
deterrent measures include use of reflective tape or ribbons on posts.
CTE06 Any nesting birds will be noted and works will be programmed to avoid disturbance. An exclusion zone or
other alternative approaches to avoid damage or destruction to nests will be devised and agreed as
appropriate with SNH. Exclusion zones around active nest sites will be clearly demarcated at the earliest
opportunity to protect nesting birds from disturbance. Any nests will be monitored on a weekly basis by
the Ecological Clerk of Works to determine when the nesting bird ceases usage of the nest and therefore
when it is safe to commence works in the area.
CTE07 If a cable landfall location is chosen on South Walls, within the Aith Hope AoS, construction activities will
be timed to have commenced before the arrival of Greenland barnacle geese in mid-October.
CTE08 Where works are to be undertaken during the bird breeding season (April to August inclusive), the
Ecological Clerk of Works will be present until the works are completed or until it is clear that no breeding
birds would be adversely affected by the works.
10.12 RESIDUAL EFFECTS
10.12.1 Construction and Installation
10.12.1.1 Physical Disturbance of Terrestrial Habitats during Cable Landfall Installation
Cable landfall installation activities will result in direct disturbance to the terrestrial habitats in the immediate vicinity of the
works. All methods of cable installation activities have the potential to result in physical disturbance to terrestrial habitats.
Open cut trench would affect a larger area compared to HDD and could potentially result in permanent changes depending
on the habitat types present. The maximum width of the corridor at the landfall would be 85m.
Sheep Skerry
Habitats of conservation importance at Sheep Skerry include the sand dunes which are a UK BAP priority habitat (Coastal
Sand Dunes) and the boulders above HWM to the west of the AoS which are an LBAP habitat. A locally scarce species
(Whorl-grass) is present at the mouth of the burn where it emerges onto the sandy beach.
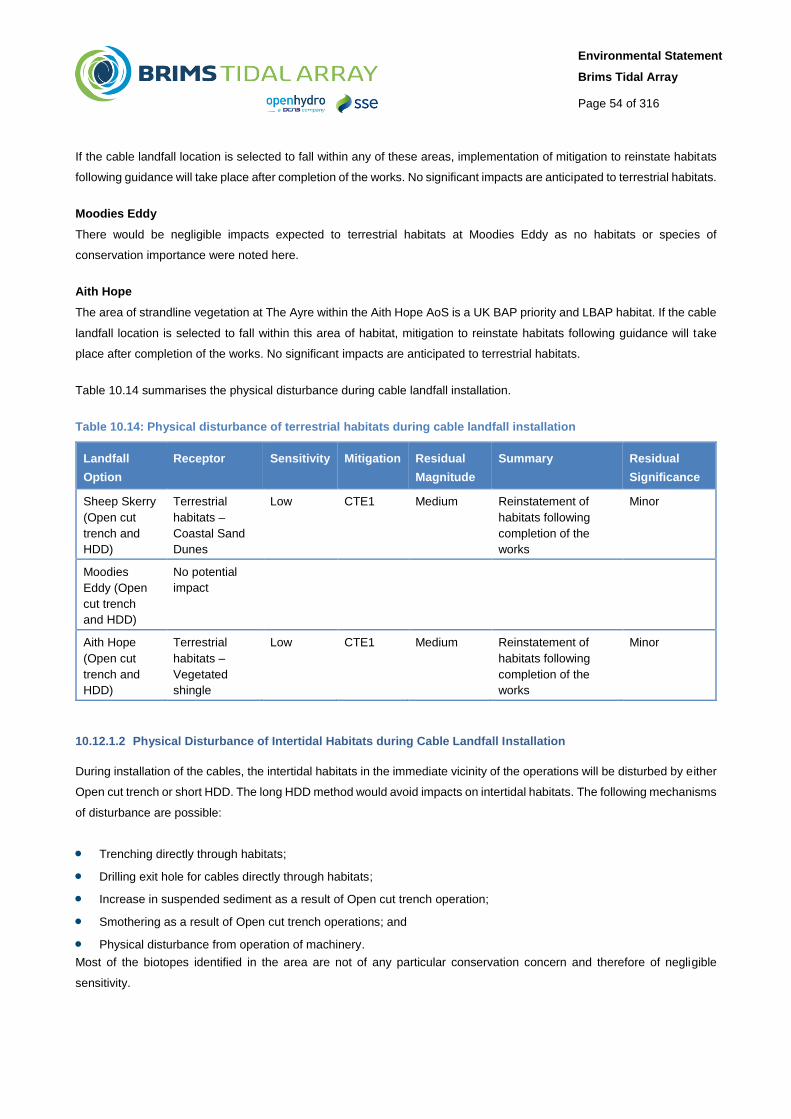
Environmental Statement
Brims Tidal Array
Page 54 of 316
If the cable landfall location is selected to fall within any of these areas, implementation of mitigation to reinstate habitats
following guidance will take place after completion of the works. No significant impacts are anticipated to terrestrial habitats.
Moodies Eddy
There would be negligible impacts expected to terrestrial habitats at Moodies Eddy as no habitats or species of
conservation importance were noted here.
Aith Hope
The area of strandline vegetation at The Ayre within the Aith Hope AoS is a UK BAP priority and LBAP habitat. If the cable
landfall location is selected to fall within this area of habitat, mitigation to reinstate habitats following guidance will take
place after completion of the works. No significant impacts are anticipated to terrestrial habitats.
Table 10.14 summarises the physical disturbance during cable landfall installation.
Table 10.14: Physical disturbance of terrestrial habitats during cable landfall installation
Landfall
Option
Receptor Sensitivity Mitigation Residual
Magnitude
Summary Residual
Significance
Sheep Skerry
(Open cut
trench and
HDD)
Terrestrial
habitats –
Coastal Sand
Dunes
Low CTE1 Medium Reinstatement of
habitats following
completion of the
works
Minor
Moodies
Eddy (Open
cut trench
and HDD)
No potential
impact
Aith Hope
(Open cut
trench and
HDD)
Terrestrial
habitats –
Vegetated
shingle
Low CTE1 Medium Reinstatement of
habitats following
completion of the
works
Minor
10.12.1.2 Physical Disturbance of Intertidal Habitats during Cable Landfall Installation
During installation of the cables, the intertidal habitats in the immediate vicinity of the operations will be disturbed by either
Open cut trench or short HDD. The long HDD method would avoid impacts on intertidal habitats. The following mechanisms
of disturbance are possible:
Trenching directly through habitats;
Drilling exit hole for cables directly through habitats;
Increase in suspended sediment as a result of Open cut trench operation;
Smothering as a result of Open cut trench operations; and
Physical disturbance from operation of machinery.
Most of the biotopes identified in the area are not of any particular conservation concern and therefore of negligible
sensitivity.

Environmental Statement
Brims Tidal Array
Page 55 of 316
Sheep Skerry
Two UK BAP habitats were recorded at single locations at Sheep Skerry AoS; these are LR.MLR.BF.Fser.Bo (under-
boulder communities) and LR.FLR.Rkp.G (green seaweeds in upper shore rockpools). Neither cable landfall installation
method is considered to have any adverse impacts on LR.FLR.Rkp.G in this location.
LR.MLR.BF.Fser.Bo is relatively common in the UK and although it is listed as a habitat of conservation concern, it is
considered of low sensitivity as it is a common and widespread habitat and not considered to be of particular conservation
importance in the area.
If the cable landfall location is selected to fall within the area of LR.MLR.BF.Fser.Bo habitat, a very localised area (maximum
width of 85m at Stage 2) would potentially be affected by cable installation activities. An increase in suspended sediment
due to the cable laying activities in the vicinity of this habitat could also have an adverse effect on these communities.
However, these communities are considered to have high recoverability relative to increases in suspended sediment, and
therefore the impact would be reversible and assessed as a medium magnitude, and the resulting effect would be classified
as minor and non-significant (Hiscock, 2005).
Implementation of mitigation to reinstate the habitats following guidance will take place after completion of the works. No
significant impacts area anticipated to intertidal habitats.
Moodies Eddy
There would be negligible impacts expected to intertidal communities at Moodies Eddy as no habitats of conservation
importance were noted here.
Aith Hope
The UK BAP-listed ‘under-boulder communities’ biotope LR.MLR.BF.Fser.Bo, was present in four locations, all within the
Aith Hope landfall AoS. This habitat is relatively common in the UK and although it is listed as a habitat of conservation
concern, it is considered of low sensitivity as it is a common and widespread habitat and not considered to be of particular
conservation importance in the area.
If the cable landfall location is selected to fall within any of these areas of LR.MLR.BF.Fser.Bo habitat, a very localised
area (maximum width of 85m at Stage 2) would be affected by cable installation activities. An increase in suspended
sediment due to the cable laying activities in the vicinity of this habitat could also have an adverse effect on these
communities. However, these communities are considered to have high recoverability relative to increases in suspended
sediment, and therefore the impact would be reversible and assessed as a medium magnitude, and the resulting effect
would be classified as minor and non-significant (Hiscock, 2005).
If the cable landfall location is selected to fall within any of these areas, implementation of mitigation to reinstate the habitats
following guidance will take place after completion of the works. No significant impacts are anticipated to intertidal habitats
(see Table 10.15).

Environmental Statement
Brims Tidal Array
Page 56 of 316
Table 10.15: Physical disturbance of intertidal habitats during cable landfall installation
Landfall
Option
Receptor Sensitivity Mitigation Residual
Magnitude
Summary Residual
Significance
Sheep Skerry
(Open cut
trench and
short HDD)
Intertidal habitats:
biotope
LR.MLR.BF.Fser.Bo
Low CTE1 Medium Reinstatement of
habitats following
completion of the
works
Minor
Moodies Eddy
(Open cut
trench and
short HDD)
No potential impact
Aith Hope
(Open cut
trench)
Intertidal habitats:
biotope
LR.MLR.BF.Fser.Bo
Low CTE1 Medium Reinstatement of
habitats following
completion of the
works
Minor
All (Long
HDD)
No potential impact
10.12.1.3 Disturbance of Otters during Landfall Installation
Otter are protected under Annex IV of the EU Habitats Directive as a European Protected Species (EPS), and therefore
are of high sensitivity. Otter are also a UK BAP and LBAP species. Otter are a common species in Orkney, and evidence
of use was found along the coastline at Aith Hope AoS including spraints and potential lie-ups and pathways. No otter holts
were found. It is considered that there is potential for otter to be present at Sheep Skerry and Moodies Eddy although no
signs of otter were found.
Noise and visual disturbance as a result of activities at the landfall location, whether through Open cut trench or HDD,
could have an adverse effect on the activities of otter in the area, particularly if they are breeding nearby. Cable installation
works would be temporary and any effects would be removed once the works are completed. Construction activity will
cease at night when otters are most active.
A pre-construction survey for otter will be carried out 8-10 weeks prior to works commencing to determine if there are any
otter shelters (holts or resting sites) present prior to commencement of works that may affect otter habitats. If any otter
shelters are located in close proximity to the proposed operations (e.g. within 250m), protection measures will be put in
place to avoid impacts on otter or its habitat. This will include discussion with SNH and agreement of further mitigation
measures including the possible need for an EPS licence from the Scottish Government.
Otter may be at risk from potential construction hazards such as steep-sided trenches or holes during cable installation
activities which could act as pit-fall traps resulting in injury or death. Implementation of the agreed mitigation measure to
provide mammal exit ramps and to cap any temporarily exposed pipe systems when contractors are off site, will reduce
any risk of adverse effects to minor.
A Species Protection Plan for otter will be developed as part of the PEMP that will address measures to be taken to
minimise impacts on otters.
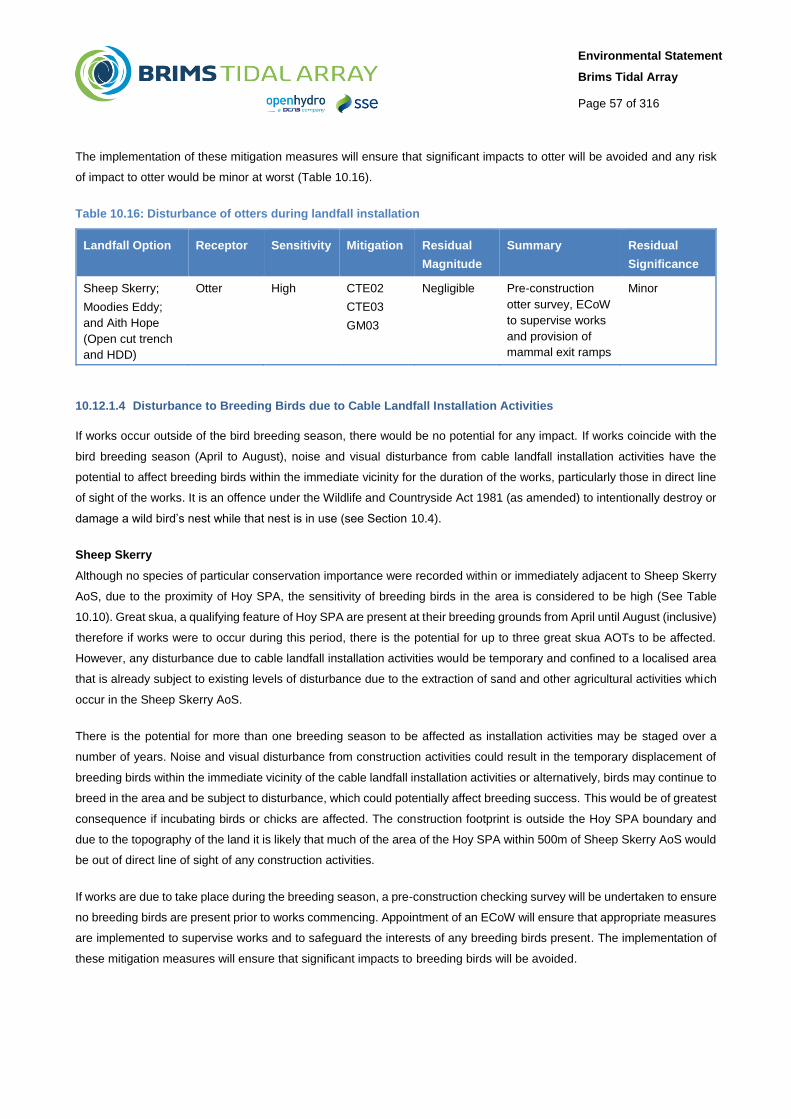
Environmental Statement
Brims Tidal Array
Page 57 of 316
The implementation of these mitigation measures will ensure that significant impacts to otter will be avoided and any risk
of impact to otter would be minor at worst (Table 10.16).
Table 10.16: Disturbance of otters during landfall installation
Landfall Option Receptor Sensitivity Mitigation Residual
Magnitude
Summary Residual
Significance
Sheep Skerry;
Moodies Eddy;
and Aith Hope
(Open cut trench
and HDD)
Otter High CTE02
CTE03
GM03
Negligible Pre-construction
otter survey, ECoW
to supervise works
and provision of
mammal exit ramps
Minor
10.12.1.4 Disturbance to Breeding Birds due to Cable Landfall Installation Activities
If works occur outside of the bird breeding season, there would be no potential for any impact. If works coincide with the
bird breeding season (April to August), noise and visual disturbance from cable landfall installation activities have the
potential to affect breeding birds within the immediate vicinity for the duration of the works, particularly those in direct line
of sight of the works. It is an offence under the Wildlife and Countryside Act 1981 (as amended) to intentionally destroy or
damage a wild bird’s nest while that nest is in use (see Section 10.4).
Sheep Skerry
Although no species of particular conservation importance were recorded within or immediately adjacent to Sheep Skerry
AoS, due to the proximity of Hoy SPA, the sensitivity of breeding birds in the area is considered to be high (See Table
10.10). Great skua, a qualifying feature of Hoy SPA are present at their breeding grounds from April until August (inclusive)
therefore if works were to occur during this period, there is the potential for up to three great skua AOTs to be affected.
However, any disturbance due to cable landfall installation activities would be temporary and confined to a localised area
that is already subject to existing levels of disturbance due to the extraction of sand and other agricultural activities which
occur in the Sheep Skerry AoS.
There is the potential for more than one breeding season to be affected as installation activities may be staged over a
number of years. Noise and visual disturbance from construction activities could result in the temporary displacement of
breeding birds within the immediate vicinity of the cable landfall installation activities or alternatively, birds may continue to
breed in the area and be subject to disturbance, which could potentially affect breeding success. This would be of greatest
consequence if incubating birds or chicks are affected. The construction footprint is outside the Hoy SPA boundary and
due to the topography of the land it is likely that much of the area of the Hoy SPA within 500m of Sheep Skerry AoS would
be out of direct line of sight of any construction activities.
If works are due to take place during the breeding season, a pre-construction checking survey will be undertaken to ensure
no breeding birds are present prior to works commencing. Appointment of an ECoW will ensure that appropriate measures
are implemented to supervise works and to safeguard the interests of any breeding birds present. The implementation of
these mitigation measures will ensure that significant impacts to breeding birds will be avoided.

Environmental Statement
Brims Tidal Array
Page 58 of 316
No long-term consequences are anticipated as a result of this effect. It is considered that construction disturbance would
have short-term adverse effects on great skuas and that any impacts would be reversible therefore this impact is considered
as negligible and non-significant.
Great skuas are absent from their breeding grounds during the autumn and winter therefore there is no potential for adverse
impacts outside the breeding season.
Moodies Eddy
Breeding birds recorded within the area include a small colony of herring gull (a UK BAP species) and 400 Northern fulmar,
a common and abundant breeding species in Orkney. Open cut trenching is considered to be the worst case method in
this location with respect to disturbance to breeding birds as birds breeding on the cliffs would be in direct line of sight of
the works. Land-based HDD activities on the cliff top would be out of the line of sight of these cliff-nesting species therefore
there would be no potential for disturbance.
Noise and visual disturbance from construction activities could result in the temporary displacement of breeding birds within
the immediate vicinity of the cable landfall installation activities or alternatively, birds may continue to breed in the area and
be subject to temporary disturbance, which could potentially affect breeding success. This would be of greatest
consequence if incubating birds or chicks are affected.
The sensitivity of breeding birds in the area is considered to be low as a small colony of herring gull, a UK BAP species,
could potentially be affected. The magnitude of impact is assessed as being low as any disturbance would be temporary
and confined to a localised area. There is the potential for more than one breeding season to be affected as installation
activities may be staged over a number of years. Repeated disturbance may cause displacement of the herring gull colony
to an alternative location however any impacts would be reversible.
If works are due to take place during the breeding season, a pre-construction checking survey will be undertaken to ensure
no breeding birds are present at Moodies Eddy before works commence. Appointment of an ECoW will ensure that
appropriate measures are implemented to supervise works and to safeguard the interests of any breeding birds present.
The implementation of these mitigation measures will ensure that significant impacts to breeding birds will be avoided. This
impact would be assessed as a low magnitude, and the resulting effect would be classified as negligible and non-significant.
Aith Hope
There are no species of conservation importance present along the coastline of South Walls or The Ayre therefore cable
landfall installation works in these areas would not result in any significant impacts to breeding birds. The only breeding
species of concern at the Aith Hope AoS is the small breeding colony of Arctic tern (an Annex I species) present within
Brims LNCS. The sensitivity of breeding birds in the area is therefore considered to be high.
Land-based HDD is considered to be the worst case method in this location with respect to disturbance to breeding terns
as works would potentially be in direct line of sight of the breeding birds. Open cut trenching activities at the base of the
cliff would be out of the line of sight therefore there would be no potential for disturbance.
Noise and visual disturbance from cable landfall activities could result in the temporary displacement of breeding birds
within the immediate vicinity of the cable landfall installation activities or alternatively, birds may continue to breed in the
area and be subject to temporary disturbance, which could potentially affect breeding success. This would be of greatest

Environmental Statement
Brims Tidal Array
Page 59 of 316
consequence if incubating birds or chicks are affected. There is the potential for more than one breeding season to be
affected as installation activities may be staged over a number of years.
The magnitude of impact is assessed as being low as any disturbance would be temporary and confined to a localised
area. Terns are fickle breeders utilising sites for short periods, both within and between years sometimes with whole
colonies moving to a different location in response to predation or habitat change (Mitchell et al. 2004). Repeated
disturbance may cause displacement of the Arctic tern colony to an alternative location however any impacts would be
reversible.
If works are due to take place during the breeding season, a pre-construction checking survey will be undertaken to ensure
no breeding birds are present at Aith Hope before works commence. Appointment of an ECoW will ensure that appropriate
measures are implemented to supervise works and to safeguard the interests of any breeding birds present. The
implementation of these mitigation measures will ensure that significant impacts to breeding birds will be avoided. This
impact would be assessed as a low magnitude, and the resulting effect would be classified as minor and non-significant.
Table 10.17 summarises the disturbance due to cable landfall installation.
Table 10.17: Disturbance to breeding birds due to cable landfall installation activities
Landfall
Option
Receptor Sensitivity Mitigation Residual
Magnitude
Summary Residual
Significance
Sheep
Skerry
(Open cut
trench and
HDD)
Breeding
birds
High CTE04
CTE05
CTE06
GM03
Negligible Pre-construction breeding
bird surveys, an ECoW to
supervise works, measures
to discourage birds from
nesting and protection
measures for nesting birds
Minor
Moodies
Eddy –
(Open cut
trench)
Breeding
birds –
Herring gull
Low CTE04
CTE05
CTE06
GM03
Low Pre-construction breeding
bird surveys, an ECoW to
supervise works, measures
to discourage birds from
nesting and protection
measures for nesting birds
Negligible
Moodies
Eddy –
(HDD)
No
potential
impact
Aith Hope –
HDD
Arctic tern High CTE04
CTE05
CTE06
GM03
Negligible Pre-construction breeding
bird surveys, an ECoW to
supervise works, measures
to discourage birds from
nesting and protection
measures for nesting birds
Minor
Aith Hope –
Open cut
trench
No
potential
impact

Environmental Statement
Brims Tidal Array
Page 60 of 316
10.12.1.5 Disturbance to Foraging Barnacle Geese due to Cable Landfall Installation Activities
Sheep Skerry and Moodies Eddy
There is no suitable foraging habitat for wintering Greenland barnacle geese at Sheep Skerry or Moodies Eddy potential
cable landfall areas therefore there is no potential for any impacts due to cable landfall installation activities.
Aith Hope
Cable landfall installation activities during the months of October to April have the potential to cause noise and visual
disturbance to Greenland barnacle geese from Switha SPA that forage in fields in South Walls immediately adjacent to the
Aith Hope export cable corridor AoS. As a qualifying feature of an SPA, Greenland barnacle geese are therefore considered
as a high sensitivity species. Both cable landfall installation methods have the potential to disturb foraging Greenland
barnacle geese. There is the potential for more than one wintering season to be affected as installation activities may be
staged over a number of years however the likelihood is that works would be scheduled to occur during the summer months
when weather is more favourable avoiding any potential impacts on wintering barnacle geese.
There are several fields that are regularly used by foraging Greenland barnacle geese present within 250m of the Aith
Hope export cable corridor AoS (see Figure 10.15 and Supporting Document: Aquatera, 2012b). The majority of fields
regularly or occasionally used by flocks of Greenland barnacle geese are more than 2km to the east of Aith Hope export
cable corridor AoS, well away from any potential construction disturbance (see Figure 10.15).
The use of any one particular field by flocks of Greenland barnacle geese is likely to be temporary during the course of a
winter as the geese are likely to move around utilising the best available food sources at the time. Any potential disturbance
due to cable landfall construction activities is therefore likely to affect Greenland barnacle geese for a limited time rather
than for the entire duration of a wintering season. Construction disturbance would affect a limited number of the regularly
used foraging areas in South Walls, the majority of which would remain free from disturbance from this Project.
If a cable landfall location on South Walls is used, construction activities will be timed to have commenced before the arrival
of Greenland barnacle geese in mid-October so that the geese are more likely to select foraging fields elsewhere in South
Walls as any noise and visual disturbance from the construction activities underway may influence the choice of foraging
fields at the beginning of the season and may influence the preferred foraging fields for the rest of the season. Construction
disturbance will involve the movement of vehicles and people and is therefore not too dissimilar to existing levels of
disturbance experienced by Greenland barnacle geese from routine agricultural activities in any other wintering season.
As there are numerous alternative foraging areas within the wider area in South Walls that would be free from disturbance
from this Project, construction disturbance affecting a small number of regularly used fields in the immediate vicinity of the
cable landfall installation works is considered to be an impact of negligible magnitude.
The implementation of this mitigation measure will ensure that significant impacts to foraging Greenland barnacle geese
will be avoided. This impact would be assessed as a negligible magnitude, and the resulting effect would be classified as
minor and non-significant (Table 10.18).

Environmental Statement
Brims Tidal Array
Page 61 of 316
Table 10.18 Disturbance to foraging barnacle geese due to cable landfall installation activities
Landfall
Option
Receptor Sensitivity Mitigation Residual
Magnitude
Summary Residual
Significance
Sheep Skerry No potential
impact
Moodies
Eddy
No potential
impact
Aith Hope
(Open cut
trench and
HDD)
Wintering
Greenland
barnacle
geese
High CTE07 Negligible Time works to have
commenced before
arrival of geese in
mid-October
Minor
10.12.2 Operation and Maintenance
Once the landfall has been reinstated, there are no anticipated impacts during the operation and maintenance phase of
the lifetime of the Project. There will be a buried cable at the landfall site which will not require maintenance and there will
be no other infrastructure in place that would require any maintenance.
10.13 ACCIDENTAL AND UNPLANNED EVENTS
Accidental and Unplanned Events are those incidents not expected to occur during the Project's normal construction,
operational or decommissioning phases which have potential impacts on the coastal environment. In the case of coastal
ecology two potential events were identified:
Release of chemical contaminants from devices or vessels; and
Introduction of alien invasive species from vessel operations.
10.13.1 Accidental Release of Chemical Contaminants from Devices or Vessels
Accidental release of chemical contaminants from devices or vessels most notable hydrocarbons (fuels and hydrocarbons)
has a potentially serious environment impact. The magnitude of this impact depends on the quantity and type or material
spilled, the tidal currents, sea state and weather conditions at the time of the spill. Each turbine may contain up to 1000
litres of lubricant and other oils.
In order to minimise the risk of an accidental release of contamination from vessels or devices, vessel management plans
and other measures in the Environmental Management Plan are designed to control the activity of vessels and the
operation of the turbines. These plans will also provide measures to manage any spillage should an incident occur. This
will minimise the environmental damage caused by such an incident.
The highly energetic environmental conditions typically encountered in the Project site will tend to rapidly disperse and
dilute any spilled material. In addition, the distance of the turbines from the coastal habitat is substantial enough that any
spilled material is likely to be highly dispersed and diluted before reaching this habitat. Taking this into account, the potential
magnitude of the impact associated with this type of event is considered to be low (Table 10.19).

Environmental Statement
Brims Tidal Array
Page 62 of 316
Table 10.19: Accidental release of chemical contaminants from devices or vessels - impact assessment summary
Infrastructure type Receptor
Sensitivity
Mitigation Residual
Magnitude
Residual Significance
Vessels Medium GM14, GM05 Low Minor
Turbines Medium GM14, GM05 Low Minor
10.13.2 Accidental Introduction of Invasive Species from Vessel Operations
Invasive species from other parts of the world may be introduced into the area via vessel ballast water or as biofouling on
hulls. These could potentially travel to the coastal habitat and impact the ecosystem. The Project shall implement vessel
management plans that will contain appropriate measures compliant with current International Maritime Organisation (IMO)
regulations to minimise the risk of the introduction of non-native species into the coastal area. The residual magnitude for
this potential impact has therefore been categorised as Low (Table 10.20).
Table 10.20: Accidental introduction of invasive species - impact assessment summary
Infrastructure type Receptor
Sensitivity
Mitigation Residual
Magnitude
Residual Significance
Vessels Medium GM09 Low Minor
10.14 SUMMARY
The potential impacts associated with the cable landfall construction, operation and decommissioning on the coastal and
onshore environment including intertidal habitats and terrestrial habitats, protected fauna and terrestrial birds have been
assessed. Three potential cable landfalls have been assessed separately: these are Sheep Skerry, Moodies Eddy and
Aith Hope.
The Sheep Skerry landfall area of search is within 100m of the Hoy SPA/SAC/SSSI, designated for important habitats,
geological features and populations of breeding birds.
The Aith Hope cable landfall AoS is partially within Aith Head LNCS which is listed for important habitats, a hawkweed and
breeding birds of prey. This cable landfall AoS is also adjacent to Brims LNCS which is listed for important habitats and
breeding birds, and is the area of highest ornithological interest in the study area. A small colony of Arctic tern (an Annex
I species) was recorded breeding here along with five species of waders.
No significant residual effects are anticipated to any terrestrial habitats as a result of the cable landfall installation activities.
Although there are two UK BAP and Orkney LBAP priority terrestrial habitats that could be affected by the proposed Project,
neither is considered to be particularly valued examples of habitats that are present elsewhere in Orkney. Implementation
of mitigation to reinstate the habitat following guidance will take place after completion of the works therefore no significant
impacts area anticipated.
The UK BAP-listed ‘under-boulder communities’ biotope LR.MLR.BF.Fser.Bo, was recorded at a single location within the
Sheep Skerry cable landfall AoS and at four locations within the Aith Hope cable landfall AoS. If the cable landfall location
is selected to fall within any of these areas of LR.MLR.BF.Fser.Bo habitat, a very localised area would potentially be

Environmental Statement
Brims Tidal Array
Page 63 of 316
affected by cable installation activities. Implementation of mitigation to reinstate the habitat following guidance will take
place after completion of the works therefore no significant impacts are anticipated.
Otter are likely to use the entire coastline within the study area and may be impacted by disturbance resulting from
construction activities. Implementation of mitigation measures will ensure that any significant impacts on otter are avoided.
If works occur outside of the bird breeding season, there would be no potential for any impact on breeding birds. If works
are due to take place during the breeding season, a pre-construction checking survey will be undertaken to ensure no
breeding birds are present prior to works commencing. Appointment of an ECoW will ensure that appropriate measures
are implemented to supervise works and to safeguard the interests of any breeding birds present. The implementation of
these mitigation measures will ensure that significant impacts to breeding birds will be avoided.
There is no suitable foraging habitat for wintering Greenland barnacle geese at Sheep Skerry or Moodies Eddy potential
cable landfall areas therefore there is no potential for any impacts due to cable landfall installation activities.
Cable landfall installation activities during the months of October to April have the potential to cause noise and visual
disturbance to Greenland barnacle geese from Switha SPA that forage in fields in South Walls immediately adjacent to the
Aith Hope export cable corridor AoS, however the likelihood is that works would be scheduled to occur during the summer
months when weather is more favourable avoiding any potential impacts on wintering barnacle geese. If a cable landfall
location on South Walls is used, construction activities will be timed to have commenced before the arrival of Greenland
barnacle geese in mid-October so that the geese are more likely to select foraging fields elsewhere in South Walls as any
noise and visual disturbance from the construction activities underway may influence the choice of foraging fields at the
beginning of the season and may influence the preferred foraging fields for the rest of the season. The implementation of
this mitigation measure will ensure that significant impacts to foraging Greenland barnacle geese will be avoided.

Environmental Statement
Brims Tidal Array
Page 64 of 316
10.15 REFERENCES
Biodiversity Reporting and Information Group (BRIG). (2007). Report on the Species and Habitat Review. [online] Available
at: http://jncc.defra.gov.uk/pdf/UKBAP_Species-HabitatsReview-2007.pdf [accessed 08.06.2015].
Biodiversity Scotland. (2013). The Scottish Biodiversity List. [online] Available at:
http://www.biodiversityscotland.gov.uk/advice-and-resources/scottish-biodiversity-list/ [ accessed June 2015].
Hiscock, K. (2005). Underboulder communities. Marine Life Information Network: Biology and Sensitivity Key Information
Sub-programme [on-line]. Plymouth: Marine Biological Association of the United Kingdom. [cited 05/06/2015]. [online]
Available at: http://www.marlin.ac.uk/habitatimportance.php?habitatid=371&code=2004.
Institute of Ecology and Environmental Management (2006). Guidelines for Ecological Impact Assessment in the UK.
Institute of Ecology and Environmental Management. (2010). Guidelines for Ecological Impact Assessment in Britain and
Ireland: Marine and Coastal.
Jackson, D.L. & McLeod, C.R. (Editors). (2000). ARCHIVED Handbook on the UK status of EC Habitats Directive interest
features: provisional data on the UK distribution and extent of Annex I habitats and the UK distribution and population size
of Annex II species. Revised 2002. Superceded 2008., JNCC Report 312, 180 pages, ISSN 0963 8091. Updated 2008.
[online] Available at: http://jncc.defra.gov.uk/Publications/JNCC312/UK_habitat_list.asp.
Joint Nature Conservation Committee (JNCC). (2004). Vertebrate species mammals: Otter. [online] Available at:
http://www.jncc.gov.uk/ProtectedSites/SACselection/species.asp?FeatureIntCode=S1355 [accessed November 2012].
Joint Nature Conservation Committee (JNCC), (2010). Handbook for Phase 1 habitat survey. A technique for environmental
audit. [online] Available at: http://jncc.defra.gov.uk/PDF/pub10_handbookforphase1habitatsurvey.pdf.
Kruuk, H. (1996). Wild Otters, Predation and Populations, Oxford University Press, Oxford, England.
Mitchell, I.P., Newton, S.F., Ratcliffe, N., & Dunn, T.E., (2004). Seabird Populations of Britain and Ireland. T & A D Poyser,
London.
Orkney Islands Council, (2015). Orkney Local Biodiversity Action Plan (LBAP). [online] Available at:
http://www.orkney.gov.uk/Service-Directory/L/Local-Biodiversity-Plan.htm. [Accessed June 2015].

Environmental Statement
Brims Tidal Array
Page 65 of 316
Benthic Ecology
Chapter 11

Environmental Statement
Brims Tidal Array
Page 66 of 316
11 BENTHIC ECOLOGY
11.1 INTRODUCTION
This chapter of the Environmental Statement (ES) considers the potential effects of the proposed Brims Tidal Array Project
(the Project) on marine habitats and benthic communities which includes animals and plants living on or in the seabed,
and the habitats in which they live. It therefore includes shellfish, however all fish are covered in Chapter 12 Fish Ecology.
The spatial scope of the assessment is described in Section 11.2.
Related information on commercial shellfish fisheries is provided in Chapter 16 Commercial Fisheries; and seabed
sediments and the physical processes acting upon them is discussed in Chapter 9 Physical Processes.
This chapter was produced by Aquatera on behalf of BTAL and incorporates results of site-specific benthic surveys
conducted in the area (Supporting Document: Aquatera, 2015b) and information from other contributors, including Osiris
Projects and Partrac (geophysical and hydrographic survey specialists) and strategic studies conducted on behalf of
Scottish Natural Heritage (SNH) to inform the baseline assessment for this chapter (See Section 11.5 for details). These
studies, alongside reference to the assessments undertaken for the Fish Ecology, Commercial Fisheries and Physical
Processes, have been utilised to inform the production of this impact assessment.
11.2 STUDY AREA
The geographical focus for the assessment includes all of the offshore components of the Project, which consists of the
Agreement for Lease (AfL) area where the devices, inter-array cables and subsea hubs will be located; and the Area of
Search (AoS) for the three proposed export cable corridors, Sheep Skerry, Moodies Eddy and Aith Hope, within which the
marine habitats and benthic communities found are described. The Project boundaries were deemed an appropriate extent
to conduct the impact assessment, given that the majority of impacts relate directly to the Project footprint. The Project
boundaries therefore represent the Project study area for this receptor.
11.3 DESIGN ENVELOPE CONSIDERATIONS
The exact project specifications are in the process of being developed. To allow the preparation of a robust impact
assessment a ‘worst case’ scenario approach has been applied. The design envelope described in Table 11.1 sets out the
technological, engineering and design options that have the highest possible potential for benthic ecology impacts and
thus form the basis of the assessment.

Environmental Statement
Brims Tidal Array
Page 67 of 316
Table 11.1: Design envelope parameters for benthic ecology assessment
Project parameter
relevant to the
assessment
Maximum Project parameter for impact
assessment
Explanation of maximum Project parameters
Turbine numbers Stage 1: up to maximum of 30
Stage 2: up to maximum of 170
Full Project: Stage 1 and 2 used for assessment =
200 turbines
Turbine support
structure (TSS)
Dimensions: 30 x 40m
Seabed footprint: 1,200m2 per device
Total seabed footprint for full Project:
0.24km2 (2% of AfL area(1))
(1) AfL area = 11.1km2
Flat base GBS TSS has the largest seabed
footprint of all of the potential options under
consideration:
Flat base GBS: 1,200m2
Three point GBS: 37.5m2
Drilled pin pile tripod 154m2
Monopile 20m2
Cuttings discharge
quantity
Maximum of 200 TSS
Volume drilled: 2.8m2 diameter x 12m deep
Drill cuttings: 74m3 per monopile
Total drill cuttings for full Project:
14,771m3
Monopile option creates the maximum quantity of
drill cuttings per TSS:
Monopile 74m3
Drilled pin pile tripod 20m3
Inter-array cables Maximum of 208 33kV cables
Cross-sectional area: 500mm2
Assuming cable protection with footprint
width of 5m
Total cable footprint:
0.36km2 (3% of total AfL area)
Worst case based on one cable per turbine for full
Project: Stage 1 and 2 used for assessment.
Subsea hubs Maximum of 8 subsea hubs
length: 15m diameter: 7m
Seabed footprint: 37.5m2 per hub
Total seabed footprint: 300m2
Full Project: Stage 1 and 2 used for assessment
Export cables Maximum of 16 cables
Diameter: 500mm (cross-sectional area:
0.2m2)
Assuming cable protection with footprint
width of 5m along 100% of length
Total seabed footprint:
Aith Hope route: 6.5km length, 0.52km2 (5%
of total AfL area)
Worst case export cable parameters are
associated with subsea cable connecting hubs
coming to shore via the Aith Hope cable route:
Aith Hope: 6.5km length, 0.52km2 Moodies Eddy:
2.6km length, 0.2km2
Sheep Skerry: 2.5km length, 0.2km2
Cable landfall
installation
Open cut trench method
Maximum trench width:
80m (maximum affected area for 16 cables)
Open cut trench considered as the worst case
scenario for benthic ecology when compared with
the Horizontal Directional Drill options

Environmental Statement
Brims Tidal Array
Page 68 of 316
11.4 LEGISLATIVE FRAMEWORK AND POLICY CONTEXT
The Conservation of Habitats and Species Regulations 2010 and the EC Habitats and Species Directive (Council Directive
92/43/EEC on the Conservation of natural habitats and of wild fauna and flora): Special Areas of Conservation (SACs) are
designated under these legislative frameworks to protect qualifying species and habitats of European importance and
together with Special Protection Areas (SPAs) form Natura Sites. The Habitats Regulations require that a Habitats
Regulations Appraisal, and in some cases an ‘appropriate assessment’, be carried out to ensure that any aspect of the
Project does not have a significant impact on the conservation objectives of the site, should there be any connectivity.
Marine and Coastal Access Act (2009) and Marine (Scotland) Act (2010): Designated sites with qualifying marine habitats
or species (including SACs, SPAs, SSSIs) form part of an ecologically coherent network of Marine Protected Areas (MPAs)
under the UK’s international commitments to the Convention on Biological Diversity and the OSPAR Convention. A list of
Priority Marine Features (PMFs), many of which are characteristic of the Scottish marine environment, was adopted 24th
July 2014 as part of Scottish Government’s Marine Nature Conservation Strategy to support advice from SNH and JNCC
in delivery of the new marine planning licensing system as set out in the Marine (Scotland) Act 2010 and to help target
future conservation work in Scotland.
UK Biodiversity Action Plan (UK BAP) – the UK has established a framework and criteria for identifying species and habitats
of conservation concern to define a list of priority species and habitats and provide detailed plans for conservation of these
resources under its obligations of the Convention on Biological Diversity. Priority Marine Features (PMFs) were identified
through the UKBAP review by the Marine Working Group of the Scottish Biodiversity Forum and a draft list produced which
includes those for which MPAs will be designated under the Marine (Scotland) Act 2010. Natura Sites (SACs, SPAs) and
MPAs are the current mechanisms which enable protection of marine habitats and species, with UKBAP habitats and
species serving to identify and focus management and research effort.
Species and habitats of conservation importance relevant to the Project are discussed in detail in Section 11.9.3.
11.5 SUPPORTING SURVEYS AND STUDIES
A comprehensive desk-based review was undertaken to establish a baseline for the Project study area. The following site-
specific studies were undertaken to inform the assessment:
Brims Tidal Array Project. May 2014 Benthic Survey Report. Seabed ROV survey conducted by Aquatera, Roving Eye
and Triscom on behalf of BTAL (Supporting Document: Aquatera, 2014).
Brims Preliminary seabed habitat assessment - April 2009. Seabed ROV survey conducted by Aquatera and Roving
Eye on behalf of BTAL.
Seabed video snapshots collected during various ADCP deployments to assess tidal regime in the Brims area.
Collected by Partrac on behalf of BTAL.
Bathymetry, shallow geology and seabed features: Multi-beam echo sounder, side scan sonar, sub-bottom profiling
and magnetometer survey by Osiris Projects 2014 (Supporting Document: Osiris, 2014).
The following strategic studies undertaken or commissioned were consulted to inform the assessment:

Environmental Statement
Brims Tidal Array
Page 69 of 316
Moore, C.G. (2009) Preliminary assessment of the conservation importance of benthic epifaunal species and habitats
of the Pentland Firth and Orkney Islands in relation to the Project of renewable energy schemes. Scottish Natural
Heritage Commissioned Report No. 319. Marine Scotland.
11.6 DATA GAPS AND UNCERTAINTIES
The findings of the survey work conducted in 2014 in conjunction with the previously collected seabed footage forms an
extensive baseline seabed habitat dataset that support a robust environmental impact assessment for the benthic
communities present in the study area. The study area encompasses the entire proposed Project site, with transects
selected and surveys undertaken by experienced practitioners, experts in their field. The scope of the baseline assessment
and all survey methodologies and results were verified and approved in consultation with SNH and MSS.
The most significant uncertainty is around the coverage of the seabed surveys with the potential for biotopes to be missed.
It is not practical to survey the entire seabed area therefore a series of transects, informed by available bathymetry and
other geophysical data, are selected to capture representative data across different water gradients and within any
apparent seabed features that may exhibit different biotopes or species of interest. As is standard practice for this type of
seabed study, the data gathered from these transects are then extrapolated across the wider area according to various
environmental factors including seabed type, seabed features and water depth to generate a biotope map for the area.
The mapping results present discrete areas of biotope which in reality would likely exhibit a gradual transmission into a
new assemblage of species and habitat with some overlap between.
The sensitivities of species associated with benthic habitats are not well understood. Environmental effects of marine
renewables deployments in terms of direct impacts such as habitat loss, scour and suspended sediments are recognised;
however there are uncertainties around the impacts relating to the effects of some pollutants and electromagnetic fields
(EMF). There are limited data available concerning the effect of EMFs on any particular benthic invertebrate species
(potential impacts on fish are discussed in Chapter 12 Fish Ecology), particularly as levels of emission are likely to be
significantly lower than those administered during laboratory experiments; however the limited benthic-EMF research
places benthic species in a category of least concern (discussed further in Section 11.12.2.4) and this has been taken into
account when conducting the impact assessment. A precautionary approach is taken with regards to the release of
potential pollutants and the use of chemicals, oils and lubricants is limited and strictly controlled (discussed in Section
11.13 Accidental and Unplanned Events).
11.7 CONSULTATIONS
A list of feedback from all consultees is summarised in Chapter 6 Consultation Process. The key points raised by
stakeholders regarding benthic ecology are presented in Table 11.2.

Environmental Statement
Brims Tidal Array
Page 70 of 316
Table 11.2: Key issues raised by stakeholder during consultation
Topic Stakeholder Comment Response/Action taken Section cross-
reference
Baseline
survey SNH
Concern that a targeted
approach may miss areas
of seabed.
Robust baseline survey data
gathered and confident in results
which have been approved by
consultees – SNH/MSS.
Section 11.5 and
Section 11.9
ES contents SNH
The ES is to present clear
information on the
biotopes present within
the proposed Project site.
The full range of biotopes found
within the Project study area has
been described in the baseline
description, presented in the
biotopes map and supporting
benthic survey report (see
Supporting Documentation).
Section 11.9
Array layout SNH
Habitat/biotope map
should be used to inform
the final array layout.
A biotopes map has been
produced. No biotopes of high
sensitivity identified, all
widespread and abundant.
Therefore, no restrictions posed
by sensitive habitat/biotopes
when designing array layout.
Section 11.9
Impact
assessment SNH
The impact of settling
suspended sediment and
drill cuttings on shellfish
should be included in the
impact assessment.
An assessment of the potential
impacts of sediments has been
undertaken with reference to
associated chapters where
necessary i.e. Physical
Processes, Fish Ecology.
Section 11.12.1.1
Baseline
survey
SNH and
MSS
The habitat in the
proposed Project site is
likely to be appropriate for
European Spiny Lobster,
baseline surveys should
seek to record any
sightings of the species.
The baseline surveys were
designed such that any
observations of these species
would be recorded as part of the
seabed video review process. No
lobsters were observed in any of
the footage collected.
Section 11.9.3.5
11.8 ASSESSMENT METHODOLOGY
11.8.1 Assessment Criteria
The methodology used to assess the significance of potential effects on ecological receptors has considered guidelines
produced by the Institute of Ecology and Environmental Management (IEEM5 2006; 2010). The appraisal of predicted
effects on ecological receptors is based on both the value of a receptor and the nature and magnitude of the effect that the
Project will have on it. Effects on biodiversity may be direct (e.g. the loss of species or habitats), or indirect (e.g. effects
due to noise or disturbance, on receptors located within or outside the Project site). For the marine habitats and benthos
5 Now Chartered Institute of Ecology and Environmental Management (CIEEM)

Environmental Statement
Brims Tidal Array
Page 71 of 316
considered in this chapter, sensitivity is defined by measures of conservation importance and their response to a potential
change as shown in Table 11.3.
The IEEM guidance recommends that the predicted impacts on the receptors be described and quantified, giving
consideration to the following parameters: confidence in predictions, positive or negative, extent, magnitude, duration,
reversibility and timing and frequency. Professional judgement has been used to assign the impacts on the receptors to
one of four levels of magnitude, defined in Table 11.4. Finally, Table 11.5 provides the overall classification scheme for
impacts on marine habitats and benthos, considering the sensitivity of the receptor and the magnitude of the impact.
Table 11.3: Definitions for sensitivity of benthic ecology
Sensitivity Criteria
High Species/habitats that are qualifying interests of a SAC or MPA, rare species or habitats of national
importance with very restricted distribution, limited range or threatened populations;
Species listed under Annex II of the EC habitat directive or IUCN red list of threatened species;
A viable area of a habitat type listed in Annex I of the EC Habitats Directive or smaller areas of such
habitat which are essential to maintain the viability of a large whole;
The species/habitat affected has no or very limited capacity to avoid, adapt to, accommodate or
recover from the impact.
Medium Habitats listed as Priority Marine Features or listed under the UK BAP;
A regularly occurring, substantial population of a nationally important species (a Priority Marine
Feature species or UK BAP priority species);
Areas of internationally important habitats that are degraded but are considered readily restored;
Species of international importance but which are only present very infrequently or in very low
numbers;
The species/habitat affected has a limited capacity to avoid, adapt to, accommodate or recover from
the impact.
Low Species of national importance, but which are only present very infrequently or in very low numbers;
Viable areas of UK BAP Priority Habitats or smaller areas of such habitat which are essential to
maintain the viability of a larger whole; and
Species or habitats of local importance e.g. those that are considered rare, uncommon or threatened
in a wider context, on the edge of their range, and those that are endemic; and
The species/habitat affected has some tolerance to avoid, adapt to, accommodate or recover from the
impact.
Negligible Species/habitats with little or no local importance; and
Species/habitats generally tolerant of the impact and can accommodate or recover from the impact.

Environmental Statement
Brims Tidal Array
Page 72 of 316
Table 11.4: Definitions for magnitude of effect for benthic ecology
Sensitivity Criteria
High An irreversible (permanent) impact on a habitat, species assemblage/community, population or
group from which recovery is not possible within a reasonable timescale.
Major loss or major alteration to key elements of the baseline (pre-development) conditions such
that the post-development character/composition/attributes will be fundamentally changed.
Medium A reversible (temporary) impact on a habitat, species assemblage/community, population or group
from which recovery is possible within a reasonable timescale.
Loss or alteration to one or more key elements/features of the baseline conditions such that post-
development character/composition/attributes will be partially changed.
Low A reversible (temporary) impact on a habitat, species assemblage/community, population or group
from which spontaneous recovery is possible or that is within the range of variation normally
experienced between years.
Minor shift away from baseline conditions; change arising from the loss/alteration will be
discernible but underlying character/composition/attributes of the baseline condition will be similar
to the pre-development situation.
Negligible Very slight change to the baseline condition; change barely distinguishable, approximating the ‘no
change’ situation.
A short-term but reversible effect on a habitat, species assemblage/community, population or
group that is within the normal range of annual variation.
Positive A change to baseline conditions deemed as being favourable for the benthic environment/
community.
Table 11.5: Assignment of impact significance for benthic ecology based on sensitivity of receptor and magnitude of effect
Sensitivity of
Receptor
Magnitude of effect
High Medium Low Negligible Positive
High MAJOR MAJOR MODERATE MINOR POSITIVE
Medium MAJOR MODERATE MINOR MINOR POSITIVE
Low MODERATE MINOR NEGLIGIBLE NEGLIGIBLE POSITIVE
Negligible MINOR NEGLIGIBLE NEGLIGIBLE NEGLIGIBLE POSITIVE
Effects that are assessed as moderate or major are considered to be significant in this assessment.
11.9 BASELINE DESCRIPTION
11.9.1 Introduction
The Study Area is located in the Pentland Firth in the north of Scotland just off the south coast of Hoy, Orkney. Due to the
strong tidal regime (in some cases exceeding 12 knots locally) the offshore AfL area is characterised by hard and rocky
seabed types with occasional veneers of gravel and coarse sandy sediments in sheltered areas, such as in rock crevices
and between boulders (Moore, 2009). Devices located within the AfL area will be connected by cable(s) to a number of
subsea hubs before export to a terrestrial substation located on Hoy. Three potential cable routes were investigated, to the

Environmental Statement
Brims Tidal Array
Page 73 of 316
west and east of Brims Head. The seabed conditions present in the cable corridor areas will be more variable primarily
due to variations in water depth and the influence of coastal features and processes.
11.9.2 General Description of Current Baseline Conditions
11.9.2.1 AfL Area
Seabed surveys of the area show that the dominant seabed type in the AfL is tidally swept circalittoral rock. The rocky
substrate is covered with a range of algae, bryozoans, hydroids, sea anemones, tube building bristle worms, soft corals
and sponges. The sessile epifaunal communities support a range of motile epifauna including starfish, urchins and crabs.
Species recorded in this area included Balanus sp, Flustra foliacea, Nemertesia antennina, Sertularia argentea,
Pomatoceros triqueter, Urticina felina and Alcyonium digitatum. Motile fauna included Crossaster papposus, Asterias
Rubens and Echinus esculentus.
These data suggest that there are two biotopes present within the AfL area which are representative of their exposure to
tidal flow. More exposed areas conform to the biotope CR.HCR.FaT.BalTub, however no evidence of Tubularia indivisa
was observed. Fauna present in this biotope were dominated by the barnacles (mostly Balanus crenatus), especially in
the most tidally exposed areas. Alcyonium digitatum and the anemone Urticina felina were sparsely present in this biotope.
The second biotope was characteristic of more sheltered surfaces, in crevices or between boulders and was classed as
CR.HCR.FaT.CTub. This biotope is similar to CR.HCR.FaT.BalTub, however cushion sponges, U. felina, and A. digitatum
became much more abundant. Bryozoans also appeared to be abundant in this biotope.
The variability between the two biotopes appears to be mainly driven by changes in small-scale differences in seabed
topography i.e. barnacles dominating in areas where bedrock is fully exposed to the tide and anemones/sponges colonising
crevices and gaps between boulders. Therefore the different biotopes recorded in the AfL area are likely to be present as
a mosaic rather than extensive discrete areas. The biotopes recorded are typical of tide swept areas that occur widely
throughout the Pentland Firth area (Moore, 2009).
The Old Head to Tor Ness water body (WB ID 200222) has been identified as overlapping with the BTAL AfL and has been
classified by SEPA as having an overall status of Good with High confidence in 2013 with overall ecological status of Good
and overall chemical status of Pass. SEPA set environmental objectives for this water body over future river basin planning
cycles in order that sustainable improvements to its status can be made over time, or alternatively that no deterioration in
status occurs, unless caused by a new activity providing significant specified benefits to society or the wider environment
(SEPA 2016).
11.9.2.2 Cable Corridors
In shallow areas of the cable route corridors (less than 20m depth) the dominant biotope is characterised by medium to
fine sand with bedrock outcrops and with varying densities of kelp and other seaweed. Kelp (Laminaria hyperborea) is
most abundant in areas of exposed bedrock in the shallow water areas surveyed (e.g. close to the Melsetter coast on the
west side of Brims Head) and in these areas large numbers of Echinus esculentus can be observed. Decreasing seaweed
coverage is observed as water depth and the proportion of sandy sediment increase.

Environmental Statement
Brims Tidal Array
Page 74 of 316
The seabed observed in moderate water depths of around 20-40m is dominated by gravelly sands with frequent bedrock
outcrops and boulders. The rocky substrate supports a range of biota including Flustra foliacea, Pomatoceros triqueter,
Urticina felina and Alcyonium digitatum. The burrowing polychaete Lanice conchilega is also observed in the sandy areas
and a range of echinoderms are present including Crossaster papposus, Asterias rubens and Echinus esculentus. In
deeper water areas (greater than 50m) in the southern parts of the cable routes the seabed biotopes are more typical of
tidally-swept rocky areas. Two distinct areas of sand waves are present in the vicinity of the Melsetter and Sheep Skerry
corridors. These features are composed of sandy sediments and are likely formed by eddies generated by the physical
interaction between tidal currents and the Brims Ness and Tor Ness headlands.
11.9.2.3 Summary
In summary, each of cable corridors show a progression from kelp/seaweed communities on bedrock and/or areas of
medium to fine sediment in shallow water to circalittoral mixed sediment dominated by robust fauna in deeper water. The
AfL area is dominated by hard and rocky seabed types. The likely distribution of the various biotopes present in the area,
estimated using a combination of seabed video and bathymetric survey data, is shown in Figure 11.1.
Figure 11.1: Designated biotopes in AfL and cable corridors

Environmental Statement
Brims Tidal Array
Page 75 of 316
11.9.3 Assessment of Habitats and Species of Conservation Interest
Special Areas of Conservation (SACs) and Marine Protected Areas (MPAs) are the current mechanisms applied in
Scotland which enable the management and protection of marine habitats and species in line with the requirements of the
EU Habitats Directive. The Scottish Government has also developed a list of Priority Marine Features (PMFs), including
both species and habitats, as part of a nature conservation strategy to be used as a tool to aid in the identification of
potential MPAs. Independently, a series of priority habitats and species have also been designated as part of the UK
Biodiversity Action Plan (UK BAP) to help identify and focus management and research effort throughout the UK. Special
Protection Areas (SPAs) are focussed on the conservation of bird species in line with the EU Birds Directive and may cover
the marine environment (note that any indirect impacts on birds from direct impacts on seabed habitats shall be addressed
in Chapter 14 Ornithology). Sites of Special Scientific Interest (SSSI) are used to designate areas of significant natural
heritage but extend only to Low Water Spring Tide (LWST) and are not relevant to the sublittoral benthos.
11.9.3.1 SACs
The AfL area and potential cable corridors do not overlap with any currently designated or proposed SACs. An area of Hoy
is designated as a SAC due to the presence of a number of terrestrial habitats and vegetated cliffs. None of these features
have any relevance to the benthic environment.
11.9.3.2 MPAs and SPAs
There are no MPAs that could be affected by the proposed Project. The closest MPA is North-west Orkney (NWO),
recommended for its importance for biodiversity (sandeels) and geodiversity (marine geomorphology of the Scottish Shelf
Seabed including sand banks, and sand and sediment wave fields), approximately 50km to the north west of the AfL area.
A section of the marine environment covering the north, west and southern coast of Hoy is protected by a SPA. This
however does not have any relevance to the benthic environment.
11.9.3.3 EU Habitats Directive: Annex I Habitats
There are no designated Annex I habitats in the Project study area. However the JNCC interactive predictive habitat map
suggests that the AfL area, both cable route corridors and most of the Pentland Firth area is a potential Annex I habitat
due to the presence of rocky reefs. Survey data indicated that the cable route corridors do not possess a rocky reef habitat
in water depths less than 60m. The biotopes CR.HCR.FaT.CTub and CR.HCR.FaT.BalTub were however observed in
deeper parts of the cable route corridors (where water depths were greater than approximately 60m) and across the entire
AfL area, confirming that the seabed exhibits the characteristics of a rocky reef habitat. It should be noted that the seabed
communities found within the AfL area are widespread throughout the Pentland Firth area and around the coast of the UK;
it is therefore considered unlikely that this particular area would be formally designated as an area of Annex I habitat.
11.9.3.4 Priority Marine Features (PMFs)
PMFs based on rock substratum are focussed on the following species: blue mussel, cold water corals, horse mussel,
calcified anemones such as Caryophyllia smithii, sea fans e.g. Swiftia pallida, deep sea sponges, turfs of hydroids and
large ascidians. The tidal currents present in the AfL area are too strong to allow for the presence of large communities of
these species. As a result there is no evidence to suggest that these PMF species are present within the AfL area, potential
cable corridors or wider Pentland Firth area.

Environmental Statement
Brims Tidal Array
Page 76 of 316
The biotope SS.SMp.KSwSS (kelp and seaweed communities on sublittoral sediment) is classified as a PMF and was
present in the cable corridors between depths of approximately 7 and 23m. No other PMF habitats were identified. The
only PMF species residing in sedimentary habitats possibly to be found in the cable corridors is the ocean quahog Arctica
islandica - a long-lived and large burrowing bivalve living in medium to fine sands and mud from the extreme lower shore
down to the circalittoral. No evidence of the presence of this species was observed in the seabed video collected in the
sandy areas of the cable routes, however, since this organism lives buried in the sediment it is not possible to conclusively
rule out its presence in the area.
11.9.3.5 UK BAP Habitats and Species
The Pentland Firth can be classified as a ‘Tide Swept Channel’ priority habitat specified in the UK Biodiversity Action Plan
(http://jncc.defra.gov.uk/page-5155).
Although the habitat present is suitable for the European spiny lobster (Palinurus elephas), a priority species for the UK
Biodiversity Action Plan, no individuals of this species were recorded during benthic surveys of the area.
11.9.3.6 Benthic Species of Commercial Interest
The predominantly rocky habitats present in the AfL make it unlikely that large numbers of sediment dwelling shellfish will
be present. The commercial benthic shellfish found in this area will be dominated by mobile crustaceans such as crab
(edible brown Cancer pagurus; velvet Liocarcinus puber) and the common lobster (Hommarus gammarus).
The mixed sediments found in the parts of the cable route corridors may provide a suitable habitat for commercial species
such as whelk (Buccinum undatum), scallops (queenies, Aquipecten opercularis; king, Pecten maximum) and razor shells
(Ensis siliqua; Solen marginatus). These organisms live either completely or partially buried in the sediment therefore it is
not possible to confirm presence/absence based on seabed video. Further consideration is given to shellfish in the Chapter
16 Commercial Fisheries.
11.9.3.7 Summary
The seabed habitats and species present in the AfL area are typical of strong tidally swept areas, consisting of a hard rocky
substrate colonised by a range of algae, bryozoans, hydroids, soft corals and sponges. The seabed in the cable corridors
exhibits a progression from kelp/seaweed communities on bedrock and/or medium to fine sediment communities in shallow
water to circalittoral mixed sediment dominated by robust fauna in deeper water.
There are currently no protected areas located within 50km of the AfL area or cable corridors. The seabed present in the
AfL area and the deeper sections of the cable corridors could be classified according to the EU Habitats Directive Annex I
as a Rocky Reef habitat. However, the common species making up the community present and its widespread occurrence
across the Pentland Firth makes it unlikely that the AfL area would be formally designated as a protected area. The cable
corridors contain kelp and seaweed communities on sublittoral sediment, a biotope that is classified as a PMF by the
Scottish Government and the AfL area can be classified as a Tide Swept Channel priority habitat under the UK BAP.
The commercially important benthic species present in the area (primarily the AfL) are crabs and lobsters and these are
discussed further in the Chapter 16 Commercial Fisheries.

Environmental Statement
Brims Tidal Array
Page 77 of 316
11.10 POTENTIAL IMPACTS
A list of potential impacts that the proposed Project may have upon the benthic environment were identified during the
scoping process. No revisions of the potential impact list were provided by key stakeholders during consultation.
The potential impacts identified for each phase of the Project are:
11.10.1 Construction and Installation
Increased suspended sediment and turbidity from installation of subsea infrastructure; and
Substrate/habitat loss/damage from cable landfall installation.
11.10.2 Operation and Maintenance
Substrate/habitat loss/damage from placement of devices, cable hubs and cables on the seabed;
Seabed scour around devices, cable hubs and inter-array cables and vessel mooring cables;
Colonisation of subsea infrastructure;
Impact to benthic communities from EMF and thermal load arising from the cables during operation; and
Changes in water flow rates leading to changes in benthic habitat.
11.10.3 Decommissioning
Increased suspended sediment and turbidity from removal of seabed infrastructure; and
Substrate/habitat loss/damage from removal of cable landfall.
11.11 MITIGATION MEASURES
11.11.1 Project Design and General Mitigation Measures
All Project Design Mitigation and General Mitigation measures are set out in Chapter 5 Project Description, Table 5.15 and
5.16 respectively. These are standard practice measures based on specific legislation, regulations, standards, guidance
and recognised industry good practice that are put in place to ensure significant impacts do not occur.
11.11.2 Specific Mitigation
The following mitigation measures will be implemented specifically to minimise the impacts on the benthic ecology (Table
11.6).
Table 11.6 Mitigation measures specific to benthic ecology
Ref Mitigation Measure Description
BE01
Pre-construction cable route surveys will be conducted prior to determining the final cable route option and
will confirm whether any sensitive habitats are present. BTAL will take all necessary actions to avoid any
sensitive habitats identified (e.g. alteration of cable routes). Should disturbance of the habitat be
unavoidable BTAL shall undertake consultation with key stakeholders, SNH and MSS, to assess the
potential impact significance and agree the best practicable options to minimise impacts to the habitat.
BE02 Cable protection management measures will be in place to ensure that any rock placement that is required
will be kept to a minimum to reduce seabed disturbance.

Environmental Statement
Brims Tidal Array
Page 78 of 316
BE03 Marine standard anti-fouling coatings on turbines and associated infrastructure will only be used where
necessary.
11.12 RESIDUAL EFFECTS
This section provides a description of each impact and presents relevant Project-specific information in order to
demonstrate the magnitude/scale of the impact. Any mitigation that has been incorporated into the design of the Project to
remove/reduce the likelihood of significant impacts occurring is also included.
For the purpose of this assessment the benthic communities present within the AfL and cable corridor areas are designated
as having medium sensitivity due to the presence of designated PMF and UK BAP priority habitats (see Table 11.3).
11.12.1 Construction and Installation
11.12.1.1 Increased Suspended Sediment and Turbidity from Installation of Subsea Infrastructure
Suspended sediment falling through the water column as a result of installation activities has the potential to smother
benthic organisms by blocking feeding and respiratory apparatus or by burying them beyond a level from which they can
recover. It therefore has the potential consequence of temporarily reducing the biodiversity of the affected area.
Given the widespread absence of surface sediments in the AfL area, the deployment of gravity base TSSs and subsea
hubs will not give rise to the suspension of large quantities of sediment. This will also be the case for the surface laid inter-
array connection cables. Some discharge of rock cuttings into the water column, and subsequent settlement on the seabed,
will occur if monopile or drilled pin options are selected as TSS. The installation of monopiles will generate the highest
volume of rock cuttings (estimated as 74m3 per TSS, making a total of around 14,771m3 if the maximum number are
installed). The technique that will be used to drill the necessary holes in the seabed is not known at present but it is
expected that each hole will be drilled sequentially. The timing between drilling activities at each monopile location will
result in smaller volumes of drill cuttings being released at any one time, enabling the rapid and wide dispersal of any drill
cuttings during peak tidal velocities before further activities resume. The physical properties of the drill cuttings released
from installation activities will depend on the technique used and the properties of the subsurface rock formations but they
are likely to be generally finer than natural surface sediments and therefore susceptible to transportation by tidal currents.
Due to the relatively high current velocities typically present in the AfL area no long-term deposits of resettled drill cuttings
material would be expected to occur and the overall magnitude of this impact has therefore been assessed as negligible.
Cable laying activities are likely to cause only local, short-term increases in turbidity, however they are unlikely to suspend
large amounts of sediment over wide areas. The seabed in both cable corridor routes is composed of variable proportions
of sandy gravels with outcrops of rock and irregular patches of finer sand. The dominance of coarser sediments further
reduces the probability of large amounts of suspended particles and any sediment that is suspended is likely to settle out
of the water column relatively quickly. There is therefore a limited potential for sediment suspension and as a result it is
unlikely that benthic organisms will be significantly affected by smothering or burial. Export cable installation will involve
the deployment of cable protection (the options under consideration are rock dump, mattresses or grout bags). Periods of
increased suspended sediments will occur during the installation of the export cable protection but any potential impacts
are likely to be minor, relatively localised and short lived therefore the magnitude of this impact can be considered as being
low.

Environmental Statement
Brims Tidal Array
Page 79 of 316
The installation of the cable landfall (described in Section 11.12.1.2) will generate relatively large increases in suspended
sediments in the area around the selected location during operations. As was the case for export cable laying, the potential
impacts are likely to be minor, relatively localised and short lived therefore the magnitude of this impact can be considered
as being low. Through implementation of the mitigation measures listed in Section 11.11 any residual impacts on the
ecological status of the Old Head to Tor Ness water body are considered to be not significant (Table 11.7).
Table 11.7: Increased suspended sediment and turbidity from installation - impact assessment summary
Installation Activity Receptor
Sensitivity
Mitigation Residual
Magnitude
Residual
Significance
Seabed drilling for monopiles
and drilled pin TSS
Medium
GM14, PD12 Negligible Minor
Cable installation on seabed
including cable protection
GM13, GM14, PD01,
BE01, BE02
Low Minor
Cable landfall installation GM17, PD01 Low Minor
Overall Low Minor
11.12.1.2 Substrate/Habitat Loss/Damage from Cable Landfall Installation
Under the worst case scenario it is assumed that the export cables landfall will be achieved by preparing an open cut
trench in the intertidal zone into which the cables will be placed. The exact methodology that would be used is not specified
at this time, however based on current worst case assumptions the maximum width of the required trench would be in the
order of 80m.
The near-shore benthic habitats present in the potential cable corridors under consideration differ. In Aith Hope and Sheep
Skerry the near-shore seabed primarily consists of rippled sands in contrast to the dense kelp communities on bedrock
and mixed sediment present near the potential Moodies Eddy landfall. The habitat present within the Aith Hope/Sheep
Skerry near-shore zone is categorised as having low sensitivity, while the kelp-dominated community at Moodies Eddy has
medium sensitivity based on the criteria presented in Table 11.3.
The scale of habitat loss would be similar in both areas although the impact would be expected to be temporary. In Aith
Hope/Sheep Skerry the re-establishment of native benthic communities within the disturbed area would be expected to
begin immediately following completion of the cable laying operations and infill of the trench. The near-shore kelp-
dominated community present at Moodies Eddy is a widespread habitat of Scottish coastlines (covering approximately
3,600km2 (MacLeod et al. 2014)) and the proportion potentially impacted during the installation of the export cables landfall
is not likely to be significantly above beyond natural disturbance occurring during storm events every year. Kelp forests
can typically recover to original canopy height and cover within 2-5 years of a disturbance event and associated understorey
flora and fauna within 1-6 years (Christie et al. 1998, Kain 1975 in MacLeod et al. 2014)). The magnitude of the potential
impact of cable landfall construction activities can be classified as low. Through implementation of the mitigation measures
listed in Section 11.11 any residual impacts on the ecological status of the Old Head to Tor Ness water body are considered
to be not significant (Table 11.8).

Environmental Statement
Brims Tidal Array
Page 80 of 316
Table 11.8: Cable landfall installation - impact assessment summary
Cable corridor option Receptor
Sensitivity
Mitigation Residual
Magnitude
Residual
Significance
Aith Hope/Sheep Skerry Medium GM17, PD01 Low Minor
Moodies Eddy Low GM17, PD01 Low Negligible
11.12.2 Operation and Maintenance
11.12.2.1 Substrate/Habitat Loss/Damage from Installation of Devices, Cable Hubs and Cables on the Seabed
This impact will begin at the initial construction stages and continue throughout the lifetime of the array. For the purposes
of this assessment it is assumed that the placement of any equipment on the seabed will result in an initial loss of the
existing natural habitat within the footprint of the infrastructure being deployed. A summary of the maximum likely seabed
footprints of the various infrastructure to be deployed (expressed as area and as a percentage of the AfL) is provided in
Table 11.9.
Table 11.9: Maximum, worst case scenario, seabed footprint of project infrastructure for full Project
Infrastructure type Maximum footprint (km2) Maximum footprint (expressed as % of
AfL)
TSS (flat bottomed GBS) 0.24 2
Inter-array cables (including protection) 0.36 3
Subsea hubs <0.001 <0.01
Export Cables (including protection) 0.52 5
Total 1.02 10
All of the TSS structures will be placed within the AfL area which is characterised by hard substrate supporting a wide
range of sessile and mobile epifauna typical of strong tidally swept areas across the UK (see Section 11.9.2). The flat
bottomed GBS TSS have the largest seabed footprint of the options under consideration for the Project and the placement
of these structures on the seabed will result in a minor shift in these baseline conditions and a temporary loss in habitat
that is common to the wider Pentland Firth (initially impacting approximately 2% of the AfL area). Spontaneous recovery
of seabed communities is likely to occur to some degree within the Project lifetime as a result of colonisation of seabed
structures (discussed in Section 11.12.2.3) and following the decommissioning of the Project. The magnitude of the
potential impact due to the presence of TSS devices is therefore assessed as Low.
Inter-array cables will be surface laid and anchored to the seabed to hold them in position during operation. The cables
may include armour protection to provide mechanical protection and add additional weight to the cables which will help to
hold the cables in position. Given that the final configuration for inter-array cables is not yet known, it has been assumed
for the purpose of this assessment that as a worst case (making allowance for complete cable protection with footprint
width of 5m if required) inter-array cables will occupy approximately 0.36km2 of the seabed (3% of the AfL). As was the
case for the TSS there is some scope for colonisation of the cables (and protection) during the Project lifetime and recovery
back to typical baseline conditions following decommissioning would be expected. The magnitude of the potential impact
due to the presence of the inter-array cables is therefore assessed as Low.

Environmental Statement
Brims Tidal Array
Page 81 of 316
The potential seabed footprint of the subsea cable hubs is relatively small compared to the other project infrastructure and
consequently, although a proportion of the organisms directly beneath the infrastructure will be lost initially, it will occur on
a scale that is unlikely to have a detrimental effect on the habitat or species. The magnitude of the potential impact due to
the presence of the cable hubs (subsea or surface piercing) is therefore assessed as Negligible.
Under the worst case scenario it was assumed that the export cables will be surface laid along the entire length of the
cable route and since the range of habitats present within each of the potential cable corridors is broadly similar, the longest
export cable route was selected (Aith Hope option). In this case it is also assumed that cable protection may be required
along the full length of the export cables. The total maximum area of seabed occupied by export cable infrastructure
(including protection) has been estimated as 0.52km2 for the full Project using subsea hubs (requiring 16 cables).
In the offshore areas (the AfL and deep water sections of the cable corridors) the export cables will run through areas of
hard substrate typical of strong tidally swept areas of the Pentland Firth. Further inshore the seabed becomes more variable
transitioning from areas of mixed sediment with rocky outcrops through to mixed and sandy sediments with associated
kelp/seaweed communities. The kelp/seaweed habitat is classed as a PMF and it is present in the shallower waters of both
cable route corridors (typically in water depths of less than 20m). The various habitats present within the cable routes are
all considered to have medium sensitivity based on the criteria presented in Table 11.3.
In the areas of cable corridor characterised by hard substrate and mixed sediments the recovery of seabed communities
is likely to occur to some degree within the Project lifetime as a result of colonisation of deployed infrastructure (discussed
in Section 11.12.2.3) and recovery back to baseline conditions would be expected following the decommissioning of the
Project. As described in Section 11.12.1.2, kelp communities would be expected to recover from any disturbance event
within 2-5 years.
The scale of the habitat loss due to the presence of the export cables and associated cable protection within the cable
corridors is reversible and would only be expected to cause a minor shift away from current baseline conditions. The
magnitude of this potential impact has therefore been assessed as Low.
The overall scale of the benthic habitat loss due to the presence of all of the infrastructure required for full Project assuming
worst case scenario values for estimation of seabed footprints is assessed as being Low since the impacts are reversible
and would only be expected to cause a minor shift away from current baseline conditions in the area. In addition,
spontaneous recovery of the seabed communities would be expected to occur via colonisation of the deployed
infrastructure (Table 11.10).

Environmental Statement
Brims Tidal Array
Page 82 of 316
Table 11.10: Substrate/habitat loss/damage - impact assessment summary
Infrastructure type Receptor
Sensitivity
Mitigation Residual
Magnitude
Residual
Significance
TSS (flat bottomed GBS)
Medium
GM14 Low Minor
Inter-array cables (including
protection) GM13, GM14, PD01
Low Minor
Subsea hubs GM14
Negligible Minor
Export Cables (including
protection) GM13, GM14, BE01,
BE02, PD01
Low Minor
Overall Low Minor
11.12.2.2 Seabed Scour around Devices, Cable Hubs, Inter-array Cables and Vessel Moorings
Scour is caused by turbulent flow induced by the presence of structures on the seabed; this has the potential to change
habitats by selecting for scour resistant species surrounding the structure.
In areas of sediment cover scour suspends and redistributes sediment in the area immediately adjacent to the structure.
Resultant scour pits are formed and any benthic fauna previously inhabiting the area are likely to be displaced. In areas of
little or no sediment cover, such as the AfL, the turbulent flow causes the loss of the more delicate species, selecting for
more resilient organisms such as barnacles.
The placement of support structures and subsea hubs on the seabed are likely to result in some scour from water
turbulence, however, due to the lack of sediment cover in the AfL area, any current scour caused by the presence of the
subsea infrastructure is unlikely to cause a major change in the physical environment. The impact of scour processes on
the physical environment around a prototype turbine deployed using a tripod gravity base support structure in the Bay of
Fundy area showed only minor changes to the seabed. In this case the only observable change was the apparent erosion
of small (approximately 1m in diameter) depressions in the bedrock where two of the gravity platforms were located. No
other changes in the morphology or gravel distributions of the seabed were detected (Fader, G., 2011).
Any such phenomenon is likely to result in changes to the benthic species composition of the affected area. Species
selection based on small scale changes in exposure to tidal currents is something that occurs naturally in the area. More
tidally-exposed areas are dominated by barnacles, whereas more sheltered areas host sponges, bryozoans, anemones
and hydroids (see Section 11.9.2.1). These localised changes in sessile benthic fauna may in turn influence the distribution
of mobile omnivore and predatory species present in the area around the structures (Broadhurst & Orme, 2014). Hence,
current induced scour around the TSSs and inter-array cables installed in the AfL area will influence the benthic
communities present in the vicinity of seabed structures but it is unlikely to have an effect outside the limits of natural

Environmental Statement
Brims Tidal Array
Page 83 of 316
variation in the area and the magnitude of the impact is negligible. No scour protection measures are proposed due to the
seabed types present within the AfL area, which consists of cobbles, boulders and exposed rocks.
Scour can also be caused by the movement of structures placed on the seabed; in this case all organisms exposed to the
abrasive movement of the structure are likely to be lost. Cables are the only piece of equipment that are present on the
seafloor that may move. Scour induced by this movement is therefore unlikely to occur on a large scale and will be reduced
by the placement of protection on top of the cable and the magnitude of this potential impact can therefore be considered
as being Negligible.
In areas of sediment cover (such as the shallower sections of the cable corridors) scour suspends and redistributes
sediment in the area immediately adjacent to the structure. Resultant scour pits are formed and any benthic fauna
previously inhabiting the area are likely to be displaced. Scour pits may be formed in the cable corridor due to the presence
of sediment, making the effects of scour much more visible. The tidal velocity in the cable corridor where sediment is
present, however, is likely to be much less than in the AfL, and may not be high enough to induce large amounts of
sediment suspension and cause scour. In addition the potential effect will only occur until a ramp of sediment forms to
enable ‘bypassing’ over the obstruction. If any scouring does occur, it is likely to have only a minor and reversible effect
upon the benthic community and the potential impact is therefore Low.
The temporary deployment of anchors and moorings by vessels operating in the area may also lead to some disturbance
of benthic communities via the motion of cables on the seabed caused by the actions of tides and waves. The spatial extent
of any scouring from this source is likely to be highly localised and will occur only for relatively short periods of time therefore
the magnitude of this potential impact is considered as being Negligible (Table 11.11).
Table 11.11: Seabed scour - impact assessment summary
Infrastructure type Receptor
Sensitivity
Mitigation Residual
Magnitude
Residual Significance
Support structures and subsea hubs
Medium
- Negligible Minor
Inter-array cables (including protection) BE01, BE02,
PD01
Negligible Minor
Export Cables (including protection) BE01, BE02,
PD01
Low Minor
Vessel moorings GM07, PD12 Negligible Minor
Overall Low Minor
11.12.2.3 Colonisation of Subsea Infrastructure
Throughout the lifespan of the Project, the presence of TSSs, subsea cable hubs and cables (with or without cable
protection) positioned on the seabed have the potential to provide new hard surfaces for colonisation by benthic species.
In the AfL and deeper parts of the cable corridors, the introduction of new hard surfaces onto existing natural substrate is
unlikely to alter the local benthic community structure as the organisms that will colonise the infrastructure are likely to be
very similar to those inhabiting the natural environment. The placement of such structures on the seabed in these areas

Environmental Statement
Brims Tidal Array
Page 84 of 316
will, to some extent, mitigate the substrate lost directly beneath the infrastructure as the new surfaces are colonised over
time. It is possible that some of the surfaces of the seabed deployed equipment will be treated with antifouling coatings
therefore the likely scale of any colonisation is difficult to determine accurately but the overall magnitude of this potentially
positive impact would be expected to be Negligible. Placement of the cable and associated protection measures in the
cable corridors may have a slightly larger effect. The placement of hard structures in an area of sediment (such as the
shallow water/more sheltered areas of the cable corridors) will introduce a new habitat potentially leading to a change in
the local benthic community structure. It is possible that such a change would increase biodiversity in the area but again
the magnitude of this potential impact is considered as being Negligible (Table 11.12).
Table 11.12: Colonisation of subsea infrastructure - impact assessment summary
Infrastructure type Receptor
Sensitivity
Mitigation Residual
Magnitude(1)
Residual Significance
Support structures and subsea hubs
Medium
BE03 Negligible Minor
Inter-array cables (including protection) - Negligible Minor
Export cables (including protection) - Negligible Minor
Overall Negligible Minor
(1) Potentially positive impact
11.12.2.4 Impact to Benthic Communities from EMF and Thermal Load Arising from the Cables during Operation
The electricity produced by each tidal turbine will be transmitted to shore along seabed-laid AC inter-array and export
cables. The electric current that is carried by these cables will generate electro-magnetic fields (EMF) that have the
potential to interact with marine species and affect their behaviour, since magnetic cues are relied upon by many marine
organisms for a number of reasons e.g. migratory navigation, orientation, prey detection and mate detection. EMFs are
emitted by cables that carry electricity and consist of two component parts, an electric field (E field) and a magnetic field
(B field). Industry standard cables contain shielding to stop the emission of E fields outside the cable. It is not currently
commercially viable to incorporate magnetic shielding into cables; hence the magnetic component of the EMF is emitted
when the cable is operational. Movement of water or organisms through the emitted magnetic field can produce an induced
electrical field (iE field) which may be detected and alter the behaviour of marine organisms. There is also the potential for
the operational cables to emit heat into the surrounding environment.
Throughout the operational life of the array electricity will be transferring constantly along the export and inter-array cables.
A maximum of sixteen export cables will be used to connect the array to the onshore substation and will be in contact with
the seafloor for a maximum length of 6.5km. Each cable will have a voltage of at least 33kV, but potentially up to 132kV.
Spacing between the cables of 2-3 times the water depth may be applied. Cables may be installed in pairs to decrease the
width of the required cable corridor value by 50%. Due to the lack of sediment in most of the AfL and deeper parts of the
cable corridor, it is expected that the cable will not be buried along any of its length, except for when being brought to
landfall near-shore. In addition, up to 200 33kV inter-array cables will also be laid on the seabed within the AfL area. The
configuration and degree of cable protection for both types of cable has not yet been confirmed but the maximum seabed
footprint for all surface laid cables assuming full protection will be 0.9km2.

Environmental Statement
Brims Tidal Array
Page 85 of 316
The cables will conform to the industry standard specifications which include shielding technology to prevent the direct
emission of E fields. The magnetic component B field of the EMF however will not be contained and will penetrate the
surrounding environment. Previous studies suggest that the magnitude of these emissions in a 33kV cable is in the order
of 1.5 T, a value much lower than the 30 to 70T range that is produced naturally by the earth (Gill et al. 2005). Despite
this low value emission, the movement of water and organisms through the B field cause the production of an induced
electric field (iE field). A 33kV cable carrying a current load of 530A buried 1.5m below the surface in clean sand has been
modelled to produce an iE field which has the maximum strength of 40 µVm-1 in the seabed (Gill, 2005). EMFs are not
affected by clean sand, and therefore travel through them unhindered. As the cables in the proposed Project are not to be
buried, it can be assumed that a very similar strength of field will be emitted into the adjacent seabed and water column.
Both iE and B fields dissipate rapidly from the source; therefore effects are confined to a local area of water or seabed.
Inter-array cables are likely to be surface laid within in the AfL area where the substrate is scoured rock, hence epifauna
are the only group of benthic organisms likely to be exposed to EMFs from these cables. Infauna are likely to be present
in the parts of the cable corridors where there is sediment cover and export cables laid on the sediment surface may
expose these organisms to EMFs. If the protection placed on top of the export cable extends beyond the limits of the
generated EMF epifauna are likely to be less exposed than those resulting from the unprotected inter-array cables. Since
the cables will be predominately laid on the seabed surface any heat generated by the cables during operation will be
rapidly dispersed into the water column and therefore unlikely to significantly influence benthic communities.
There are very few data relating to the effect of EMFs benthic invertebrate species; some limited experimental work has
been carried out with conflicting outcomes. Detrimental effects upon sea urchin and barnacle larvae exposed to high
frequency static B fields have been observed in laboratory studies. Tested fields were in the order of 10µT - 1T (Levin &
Ernst 1994; Leya et al. 1999), magnitudes at least eight times greater than the EMF expected to be reached by the planned
deployment. Bochert & Zettler (2004) concluded from experimental investigations that static magnetic fields from power
cables do not influence the orientation movement or physiology of benthic species. By contrast, a study by Rosario &
Martin (2010) suggests that some species, such as the freshwater crab Barytelphusa cunicularsis, do show sensitivity to
low frequency magnetic fields, causing increased aggregation and aggressive behaviour. Overall, there is insufficient data
to reach a firm conclusion on the effect of EMFs on any particular benthic invertebrate species but the outcome of limited
benthic-EMF research appears to place benthic species in a category of least concern. The literature indicates that the
greatest effect will be upon fish species that use electroreception for benthic prey detection (discussed in Chapter 12 Fish
Ecology).
The magnitude of EMF and heat generated by operational cables has the potential to cause a minor and reversible effect
on a small proportion of the benthic fauna present in the Project site therefore the magnitude of this potential impact has
been classified as Low (Table 11.13).
Table 11.13: EMF and thermal load - impact assessment summary
Infrastructure type Receptor
Sensitivity
Mitigation Residual
Magnitude
Residual
Significance
Inter-array cables (including protection)
Medium
BE01, PD09 Low Minor
Export Cables (including protection) BE01,PD09 Low Minor
Overall Low Minor

Environmental Statement
Brims Tidal Array
Page 86 of 316
11.12.2.5 Changes in Water Flow Rates Leading to Downstream Change in Benthic Habitat
The benthic communities found in tidally swept areas such as that seen in the AfL are adapted to living in highly energetic
conditions and many of the species are dependent upon the high tidal velocities for oxygen supply, food supply and/or
reduction of competition. The installation of devices that are designed to extract energy from the water column therefore
has the potential to alter the benthic community structure in the vicinity of the array and associated seabed infrastructure.
It is possible that energy extraction by the array may reduce tidal velocities to levels lower than the tolerances of the current
benthic community and drive a shift to a community representative of less severe tidal flows. The magnitude of reductions
in baseline currents would be expected to be greatest for the full Project of Stages 1 and 2 combined. Hydrodynamic
modelling conducted as part of the assessment of physical processes (Chapter 9) indicated that despite some localised
higher reductions in baseline currents immediately adjacent to some individual turbines (e.g. of the order of 0.5m/s locally),
the magnitude of the extent of the wake of decreased current velocity derived from the turbines (typically <0.3m/s) remains
largely within the boundaries of the AfL and dissipates to baseline conditions within 3km of the boundary. This change
represents a relatively small percentage reduction in the generally high baseline flow conditions present in the area where
peak tidal flows of 2-4m/s are encountered throughout the AfL.
The modelling results also show that there is an associated acceleration of flow around the edges of the arrays. The
magnitude of change in baseline currents is relatively small compared to baseline values (with accelerations typically of
0.1 – 0.2m/s). At the time of peak ebb, the zone affected by these changes approach the shoreline between The Mares
(west of Brims Ness) and Tor Ness (and the near-shore zone further west of Tor Ness), while at the time of peak flood the
zone affected by these changes extends from around Tor Ness further east, past Brims Ness.
The current benthic environment in the AfL is predominantly made up of a patchwork of two biotopes; CR.HCR.FaT.BalTub
is characteristic of more tidally-exposed areas and dominated by barnacles, whereas CR.HCR.FaT.CTub is dominated by
sponges, anemones and hydroids and is characteristic of sheltered cracks, crevices and in and around boulders. These
habitats are typical of the extensive tidal rapids habitat that is seen throughout the Pentland Firth and are likely to be
tolerant to minor changes in current speed hence it is unlikely that the presence of the array will cause a large scale change
in benthic community structure. If any change were to occur it is likely to be characterised by areas of the highly-exposed
CR.HCR.FaT.BalTub habitat shifting towards a habitat more representative of CR.HCR.FaT.CTub currently found in more
sheltered areas.
The changes in hydrodynamic regime in and around the AfL would not be expected to significantly alter the overall
characteristics of the benthic communities present in the Project site and cable corridors therefore the magnitude of this
potential impact has been assessed as Negligible (Table 11.14).
Table 11.14: Changes in water flow rates – impact assessment summary
Infrastructure type Receptor
Sensitivity
Mitigation Residual
Magnitude
Residual
Significance
Turbine Array Medium PD06 Negligible Minor

Environmental Statement
Brims Tidal Array
Page 87 of 316
11.12.3 Decommissioning
11.12.3.1 Increased Suspended Sediment and Turbidity from Decommissioning of Subsea Infrastructure
The mechanism and scale of the potential impacts associated with the recovery and decommissioning of seabed cables
will be similar to those discussed previously in Section 11.12.1 (Construction and Installation). Potential impacts arising
from the removal of monopiles and drilled pin TSSs are likely to be smaller than those related to installation since there
will be no seabed drilling required.
11.13 ACCIDENTAL AND UNPLANNED EVENTS
In addition to the potential impacts identified during the scoping process there may be additional impacts resulting from
accidental or unplanned events occurring during operations at the site. In the case of benthic ecology two potential events
were identified:
Accidental release of chemical contaminants from devices or vessels; and
Accidental introduction of alien invasive species from vessel operations.
11.13.1 Accidental Release of Chemical Contaminants from Devices or Vessels
There is potential for accidental release of contaminants from vessels in all phases of the Project, although it should be
noted that vessel management plans are designed to limit the potential for this impact occurring, and provide measures
for managing any spillage should an incident occur.
Accidents on and between vessels can lead to the release of large quantities of chemicals, most notably hydrocarbons
(fuels and lubricants). The magnitude of any potential impacts to benthic ecology will depend on a range of factors including
the quantity and type of material spilled, the tidal currents, sea state and weather conditions at the time of the spill. The
highly energetic environmental conditions typically encountered in the area will tend to rapidly disperse and dilute spilled
materials prior to any interactions with benthic communities thus reducing potential impacts to some extent; however the
scale of potential impacts may be major. As noted above the risk of such a spill occurring shall be strictly controlled through
the application of vessel management and environmental management plans and therefore the potential magnitude of this
impact taking into account these procedures is considered to be Low.
Each turbine may contain up to 1000 litres of lubricant and other oils therefore potentially harmful releases may occur
during device failure incidents. As is the case for vessel operations, the operation of the turbines will be controlled and
monitored as part of the Environmental Management Plan for the Project and, taking this into account, the potential
magnitude of the impact associated with this type of event is also considered as being Low. Through implementation of
the mitigation measures referenced in Section 11.11 any residual impacts on WFD objectives, will be not significant (Table
11.5).

Environmental Statement
Brims Tidal Array
Page 88 of 316
Table 11.15: Accidental release of chemical contaminants from devices or vessels - impact assessment summary
Infrastructure
type
Receptor
Sensitivity
Mitigation Residual
Magnitude
Residual
Significance
Vessels Medium GM05, GM07,
GM11
Low Minor
Turbines Medium PD02, PD15 Low Minor
11.13.2 Accidental Introduction of Invasive Species from Vessel Operations
Invasive species from other parts of the world may be introduced into the area via vessel ballast water or as biofouling on
hulls. The project shall implement vessel management plans that will contain appropriate measures compliant with current
International Maritime Organisation (IMO) regulations to minimise the risk of the introduction of non-native species into the
Project site. The residual magnitude for this potential impact has therefore been categorised as Low (Table 11.16).
Table 11.16: Accidental introduction of invasive species - impact assessment summary
Infrastructure type Receptor Sensitivity Mitigation Residual Magnitude Residual Significance
Vessels Medium GM09 Low Minor
11.14 SUMMARY
For the purposes of this assessment the benthic communities present within the AfL and cable corridor areas are
designated as having medium sensitivity due to the presence of designated PMF (kelp and seaweed communities on
sublittoral sediment) and UK BAP (Tide Swept Channel) priority habitats.
Rock cuttings created during the installation of monopile or drilled pin TSS will disperse rapidly. The magnitude of this
potential impact on benthic communities is therefore considered negligible. Installation of cables (seabed installation and
landfall construction) will generate relatively localised, short-lived plumes of suspended sediments; the magnitude of this
impact is low.
The maximum area of seabed potentially impacted by the full Project is approximately 1km2 accounting for around 10% of
AfL area. The magnitude of this impact is therefore considered Low.
Seabed scour in the bedrock-dominated AfL area will be very localised around the seabed infrastructure therefore the
magnitude of this impact is Negligible. The magnitude of potential seabed scour impacts around export cables routed
through areas of mobile surface sediments is considered as having a Low magnitude.
Colonisation of seabed infrastructure will occur on non-treated surfaces and the magnitude of this potentially positive
impact was considered low.
Based on the current understanding of effects from EMFs and heat generated by operational cables the potential impact
on benthic communities is considered to be Low.
Decommissioning impacts are likely to be of similar scale to that of installation activities i.e. Negligible-Low.

Environmental Statement
Brims Tidal Array
Page 89 of 316
In summary, based on the worst case scenario, the significance of the potential impacts to benthic ecology arising from
the proposed Project is considered as being Minor.
The potential for accidental incidents involving vessels and turbines will be carefully controlled though the application of
appropriate project management systems. The residual impact significance associated with these events is considered
Minor.
No cumulative impacts on benthic ecology from other nearby projects are anticipated.

Environmental Statement
Brims Tidal Array
Page 90 of 316
11.15 REFERENCES
Bochert, R. & Zettler, M.L. (2004). Long-term exposure of several marine benthic animals to static magnetic fields.
Bioelectromagnetics, 25, 498-502.
Broadhurst M, Orme CDL, (2014). Spatial and temporal benthic species assemblage responses with a deployed marine
tidal energy device: A small scaled study. Marine Environmental Research, Vol: 99 (2014), Pages: 76-84.
Christie, H., Fredriksen, S. & Rinde, E. (1998). Regrowth of kelp and colonization of epiphyte and fauna community after
kelp trawling at the coast of Norway. Hydrobiologia, 375/376, 49-58.
Fader G, (2011). Environmental Monitoring of Seabed Sediment Stability, Transport and Benthic Habitat at the Reference
Site and the Vicinity of the NSPI TISEC Location in the Minas Passage. Report prepared by Gordon Fader, Atlantic Marine
Geological Consulting Limited on Behalf of Fundy Ocean Research Center for Energy (FORCE). March 2011.
Gill, A.B. (2005). Offshore renewable energy - ecological implications of generating electricity in the coastal zone. Journal
of Applied Ecology, 42, 605-615.
Gill, A.B., Gloyne-Phillips, I., Neal, K.J. & Kimber, J.A. (2005). The potential effects of electromagnetic fields generated by
sub-sea power cables associated with offshore wind farm developments on electrically and magnetically sensitive marine
organisms – a review. Report to Collaborative Offshore Wind Research into the Environment (COWRIE) group, Crown
Estates.
Institute of Ecology and Environmental Management. (2006). Guidelines for Ecological Impact Assessment in the United
Kingdom.
Institute of Ecology and Environmental Management. (2010). Guidelines for ecological impact assessment in Britain and
Ireland. [online] Available at:
http://www.cieem.net/data/files/Resource_Library/Technical_Guidance_Series/EcIA_Guidelines/Final_EcIA_Marine_01_
Dec_2010.pdf.
Kain, J.M. (1975). Algal recolonization of some cleared subtidal areas. Journal of Ecology, 63, 739-765.
Levin, M. & S. Ernst. (1994). Applied AC and DC Magnetic Fields Cause Alterations in the Mitotic Cycle of Early Sea Urchin
Embryos. Bioelectro-magnetics 16(4):231 – 240.
Leya, T., A. Rother, T. Müller, G. Fuhr, M. Gropius, & B. Watermann. (1999). Electromagnetic Antifouling Shield (EMAS)
– A Promising Novel Antifouling Technique for Optical Systems, 10th International Congress on Marine Corrosion and
Fouling. University of Melbourne, Australia.
MacLeod, A.K., Orr, K.K., Greenhill, L., & Burrows, M. (2014). Understanding the potential effects of wave energy devices
on kelp biotopes. Scottish Natural Heritage Commissioned Report No. 783.
Rosario, J.C & Martin, E.R. (2010). Behavioral Changes in Freshwater Crab, Barytelphusa cunicularis after exposure to
low frequency electromagnetic fields. World Journal of Fish and Marine Sciences. 2.6, 488-492.

Environmental Statement
Brims Tidal Array
Page 91 of 316
SEPA Water body information sheet for water body 200222 in Orkney and Shetland (Accessed via
http://www.environment.scotland.gov.uk/get-interactive/data/water-body-classification/ February 2016)

Environmental Statement
Brims Tidal Array
Page 92 of 316
Fish Ecology
Chapter 12

Environmental Statement
Brims Tidal Array
Page 93 of 316
12 FISH ECOLOGY
12.1 INTRODUCTION
This chapter of the Environmental Statement (ES) considers the potential effects of the proposed Brims Tidal Array Project
(the Project) on fish ecology. Potential impacts on basking sharks are covered in Chapter 13 Marine Mammals and are not
assessed here.
In order to provide context to the baseline and to quantify the spatial and temporal variation of fish population, populations
are described at both the local and wider regional level. Key stages in the life cycle of both commercial and non-commercial
species, such as spawning and the juvenile nursery stages are given particular prominence due to higher sensitivity to
environmental changes. By characterising the existing environment the potential ecological impacts arising from the Project
can be identified and assessed.
A number of different specialists have contributed to this assessment:
Aquatera – Benthic survey, video footage analysis, biotope mapping, seabed survey reporting; and
Xodus Group – Baseline description, underwater noise technical assessment and collision risk modelling for Atlantic
salmon (the latter two studies are provided on the supporting documents DVD).
To gain a better overall understanding of the baseline and potential impacts associated with fish ecology, consideration
should also be given to the following chapters in the Environmental Statement (ES); Chapter 11 Benthic Ecology, Chapter
13 Marine Mammals, and Chapter 16 Commercial Fisheries.
12.2 STUDY AREA
The focus of the impact assessment is potential impacts on any fish ecology using the Project site and adjacent waters.
The area over which an impact may occur can vary significantly between species based on their ecology and the range
over which their populations can be found. Therefore, potential impacts have been set in the context of a wider study area
over which the fish encountered in the Project site are thought to range (e.g. spawning grounds, migration routes).
The following areas are referred to in this impact assessment:
Project study area (see Chapter 4 Figure 4.9), which comprises:
The Brims Agreement for Lease (AfL) area; and
Three export cable corridor options:
o Sheep Skerry;
o Moodie’s Eddy; and
o Aith Hope.

Environmental Statement
Brims Tidal Array
Page 94 of 316
12.3 DESIGN ENVELOPE CONSIDERATIONS
In line with the design envelope approach, this assessment considers the maximum (‘worst case’) Project parameters. The
identification of the worst case scenario for each receptor (i.e. fish ecology) ensures that impacts of greater adverse
significance would not arise should any other development scenario be taken forward in the final scheme design. With
regards to the assessment of impacts on fish ecology, the assessment parameters are detailed in Table 12.1:
Table 12.1: Design envelope parameters for fish ecology assessment
Project parameters relevant
to the assessment
Maximum Project parameters for the
impact assessment
Explanation of maximum
Project parameters
TSS and turbines
Agreement for Lease area 11.1km2 -
Number of turbines Up to 30 turbines for Stage I and up to 200
turbines with a total capacity of 200MW for
Stage II
Turbine number dependent upon
which technology is selected.
Noise output 200 turbines Assessment based on the
maximum number of turbines
using the maximum output from
the most powerful device.
Minimum clearance between
sea surface at LAT and turbine
tip
30m minimum clearance Subject to NRA consultation but
30m minimum should be
considered the worst case.
Minimum clearance between
seabed and turbine tip
4m Clearance may be more
depending on turbine and support
structure configuration.
Number of blades 3 or 10 -
Rotor diameter 23m (3 bladed turbine) or 12.8m (10 bladed
turbine)
-
Maximum blade width 1.8m (3 bladed turbine) or 1.9m (10 bladed
turbine)
-
Blade pitch 0degrees (3 bladed turbine) or 30degrees
(10 bladed turbine)6
-
Rotation speed 10rpm (3 bladed turbine) or 8rpm (10 bladed
turbine)
-
% time not operational 14.4 The proportion of time the turbine
is not operational (e.g. current
speeds too high or low or for
maintenance reasons)
Total Swept area per turbine 415m2 Unshrouded device.
Number of turbines per row 15 turbines per row. This will depend on selected
turbine type and rating, resource
6 ‘Worst case’ refers to the worst case for collision risk modelling carried out for Atlantic salmon (Xodus Group, 2016)

Environmental Statement
Brims Tidal Array
Page 95 of 316
Project parameters relevant
to the assessment
Maximum Project parameters for the
impact assessment
Explanation of maximum
Project parameters
availability within the AfL area and
seabed conditions.
Number of turbines per row will
vary on a row by row basis.
Total number of rows 40 rows Depends on turbine type and
rating, resource availability and
seabed conditions.
Turbine Support Structures
(TSSs)
Gravity Base Structures (GBSs) and drilled
monopile foundations.
Gravity bases have been used as
worst case for habitat loss, drilled
monopile with regards to
smothering and monopile
foundations with regards to noise
impacts on fish and shellfish.
Gravity base structures (GBSs)
combination of steel and
concrete with a flat bottomed
GBS that sits on the seabed
The footprint of the flat bottomed GBSs is
30m by 40m and therefore will have a
maximum footprint of 1,200m2 per gravity
base.
-
Total Project footprint for
200MW
240,000m2
(30m x 40m = 1,200m2 x 200)
Based on 200 devices using flat
bottomed gravity bases.
Volume of drill cuttings based
on drilled monopile TSS
Maximum total of 16,964m3 drill cuttings for
200 monopile TSS.
Based on 84.82m3 per monopile
assuming 3m diameter 12m deep.
Maximum fuel inventory 800 to 1,000 litres Volumes (per device) are
approximate covering range of
liquids including mineral oil,
grease, hydraulic fluid, low toxicity
biodegradable oil, biodegradable
ethanol.
Maximum number of inter-array
cables.
32 (Stage 1), 208 (Stage 1 & 2) Worst case based on one cable
per turbine.
Footprint of inter-array cables Stage 1 - 0.07km2 (approximately 0.6% of
total AfL area)
Stage 1 & 2 - 0.36km2 (approximately 3% of
total AfL area)
-
Maximum number of export
cables
Maximum of 16. -
Maximum export cable corridor
width
Maximum affected seabed width of 80m (5m
for each cable including protection).
Maximum width of corridor in which cables
will be installed is 4,840m
Cable protection may be required
along the full length of the export
cable. This will be in the form of
rock placement, concrete
mattresses and/or grout bags. The
total width of seabed directly
affected by the 16 cables is
estimated at 80m (5m per cable).
Allowing for a spacing of 2-3 times
water depth between each cable.
Maximum depth is 100m therefore

Environmental Statement
Brims Tidal Array
Page 96 of 316
Project parameters relevant
to the assessment
Maximum Project parameters for the
impact assessment
Explanation of maximum
Project parameters
the maximum width of corridor in
which cables will be installed is
4,840m (80m + (16 x 300m)).
Maximum export cable corridor
length
Maximum length to Aith Hope 6.5km Sheep Skerry 2.5km
Moodies Eddy 2.6km
Cable protection methods Rock placement
Concrete mattresses
Grout bags
Burial where possible 1m depth (minimum)
by 2m width.
Cable burial will only be feasible in
areas of softer sediment.
Channel depth 70m The average depth in the area in
which the turbines will be located
Mean current speed 1.82ms-1 The average current speed in the
turbine deployment site
Channel width 13,180m Distance from the most southerly
point of the Brims area to East
Mey
Vessel requirements
Vessels required for installation
of the TSSs and turbines.
DP construction vessel with 250 to 400 tonne
crane lift capacity plus DP construction
vessel with 150 tonne crane lift capacity;
Purpose built twin hulled three point heavy
lift deployment barge; and/or
Jack-up barge/moored barge depending on
site conditions and selected TSS.
Support vessels: small DP vessels with ROV
on board, crew transfer vessels (RIBS), dive
vessels (RIBS), tug boats.
This applies to GBSs, monopiles
and pin pile tripods.
Vessel fuel inventory For the purpose of the assessment vessel
fuel inventory is based on the amount of
marine diesel carried on board a standard
large DP installation vessel.
Large DP vessels carry between 6,000,000
and 8,000,000 litres of marine diesel in a
number of separate tanks.
The worst case scenario for assessing
accidental spillages of fuel from vessels is to
assume leakage of one tank (approximately
600,000 litres of marine diesel).
Vessels likely to be on site from
2024 for maintenance duties.
Method to be used to bring
cables ashore at landfall
Open Cut Trench or Horizontal Directional
Drill (HDD).
-
Vessels required during
decommissioning
Requirements will be similar to those used
during installation.
-
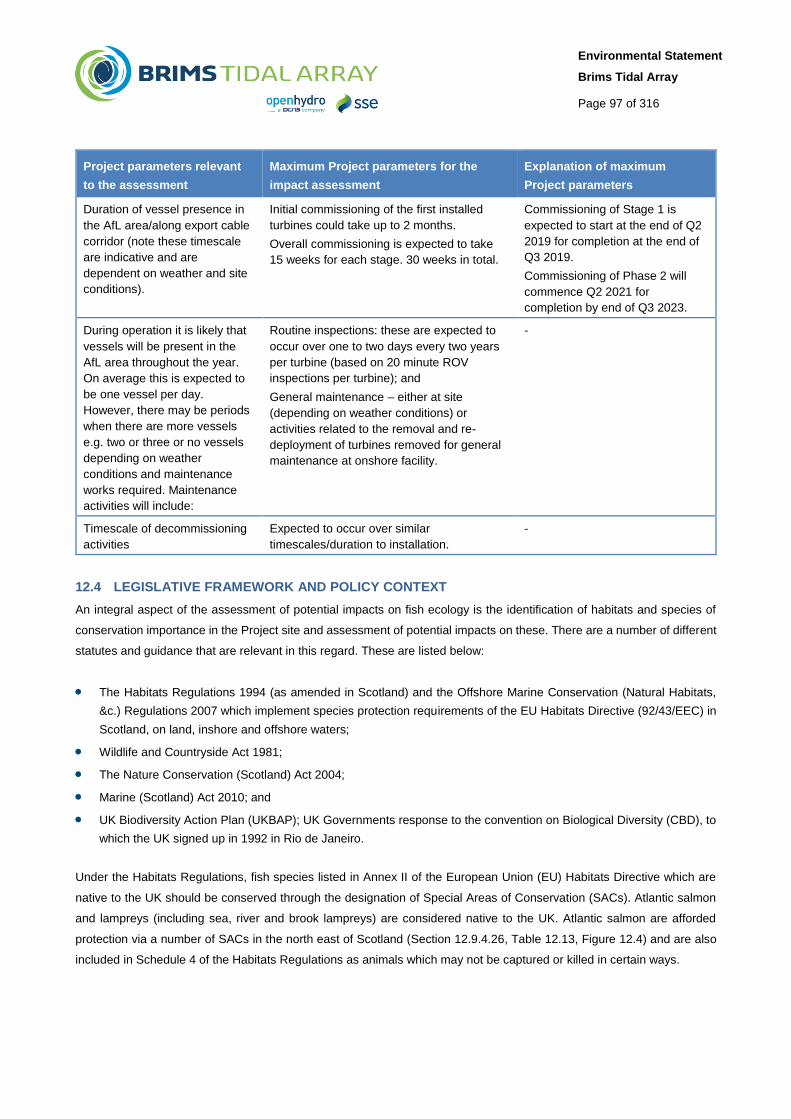
Environmental Statement
Brims Tidal Array
Page 97 of 316
Project parameters relevant
to the assessment
Maximum Project parameters for the
impact assessment
Explanation of maximum
Project parameters
Duration of vessel presence in
the AfL area/along export cable
corridor (note these timescale
are indicative and are
dependent on weather and site
conditions).
Initial commissioning of the first installed
turbines could take up to 2 months.
Overall commissioning is expected to take
15 weeks for each stage. 30 weeks in total.
Commissioning of Stage 1 is
expected to start at the end of Q2
2019 for completion at the end of
Q3 2019.
Commissioning of Phase 2 will
commence Q2 2021 for
completion by end of Q3 2023.
During operation it is likely that
vessels will be present in the
AfL area throughout the year.
On average this is expected to
be one vessel per day.
However, there may be periods
when there are more vessels
e.g. two or three or no vessels
depending on weather
conditions and maintenance
works required. Maintenance
activities will include:
Routine inspections: these are expected to
occur over one to two days every two years
per turbine (based on 20 minute ROV
inspections per turbine); and
General maintenance – either at site
(depending on weather conditions) or
activities related to the removal and re-
deployment of turbines removed for general
maintenance at onshore facility.
-
Timescale of decommissioning
activities
Expected to occur over similar
timescales/duration to installation.
-
12.4 LEGISLATIVE FRAMEWORK AND POLICY CONTEXT
An integral aspect of the assessment of potential impacts on fish ecology is the identification of habitats and species of
conservation importance in the Project site and assessment of potential impacts on these. There are a number of different
statutes and guidance that are relevant in this regard. These are listed below:
The Habitats Regulations 1994 (as amended in Scotland) and the Offshore Marine Conservation (Natural Habitats,
&c.) Regulations 2007 which implement species protection requirements of the EU Habitats Directive (92/43/EEC) in
Scotland, on land, inshore and offshore waters;
Wildlife and Countryside Act 1981;
The Nature Conservation (Scotland) Act 2004;
Marine (Scotland) Act 2010; and
UK Biodiversity Action Plan (UKBAP); UK Governments response to the convention on Biological Diversity (CBD), to
which the UK signed up in 1992 in Rio de Janeiro.
Under the Habitats Regulations, fish species listed in Annex II of the European Union (EU) Habitats Directive which are
native to the UK should be conserved through the designation of Special Areas of Conservation (SACs). Atlantic salmon
and lampreys (including sea, river and brook lampreys) are considered native to the UK. Atlantic salmon are afforded
protection via a number of SACs in the north east of Scotland (Section 12.9.4.26, Table 12.13, Figure 12.4) and are also
included in Schedule 4 of the Habitats Regulations as animals which may not be captured or killed in certain ways.

Environmental Statement
Brims Tidal Array
Page 98 of 316
A list of Priority Marine Features (PMF) in inshore waters adjacent to Scotland, including those for which future Marine
Protected Areas (MPA) will be designated under the Marine (Scotland) Act 2010, has been drawn up and circulated for
consultation (Scottish Natural Heritage, 2014). The list includes a number of fish species that may be present in the Project
site, such as those detailed in Table 12.7, Table 12.9 and Table 12.10.
In addition to the legislative protection detailed above:
The UK Biodiversity Action Plan (UKBAP) identifies a list of species of conservation concern in response to the
Convention on Biological Diversity. There are a number of sea fish species listed in the UKBAP that have the potential
to be present in the Project site as detailed in Table 12.7, Table 12.8, Table 12.9 and Table 12.10.
The International Union for Conservation of Nature (IUCN) has compiled a Red list of threatened species that are
facing a high risk of global extinction. The list (IUCN, 2014) includes fish species that are potentially or known to
present in the Project site and identifies their conservation status, as detailed in Table 12.7, Table 12.8, Table 12.9
and Table 12.10.
A list of marine habitats and species considered to be under threat or in decline within the north east Atlantic has been
produced by OSPAR (2008). A number of fish species on the list may be present in the Project site, as detailed in
Table 12.7, Table 12.8, Table 12.9 and Table 12.10.
ICES has published advice on fishing opportunities, catch, and effort Greater North Sea Ecoregion. The guidance note
provides guidance towards activities that may negatively impact spawning habitat of herring (ICES, 2015).
Whilst providing no specific legal protection, inclusion on these lists ensures due consideration in impact assessments.
12.5 SUPPORTING SURVEYS AND STUDIES
To inform the impact assessment, a desk-based review of existing data sources was conducted. The ultimate aim of this
exercise was, in association with local experience of the area, to provide details of the habitats and species present in the
AfL area and wider region, including any of conservation concern. Collision Risk Modelling (CRM) was carried out to
support the impact assessment; it assessed the potential collision rates of Atlantic salmon with the tidal array. Data sources
and supporting studies which relate to the fish ecology impact assessment are detailed in Table 12.2.
Table 12.2: Supporting studies
Survey/study Date of
survey/study
Description
Results of the site specific
benthic surveys
2013 – 2014 Baseline information on the benthic communities and sediments in
and adjacent to the proposed Project.
July 2015 Benthic survey report for a third cable route option from the AfL to
Sheep Skerry (Supporting Document: Aquatera, 2015b).
Highland, Hebrides and
Orkney Marine Environment: A
GIS resource
2010 Detailed predictive mapping of the biotopes and habitats of
inshore waters around Orkney (Foster-Smith, 2010).
UKSeaMap 2010 project 2010 Predicted seabed habitats map for habitats within the UK
continental shelf classified under the European Nature Information
System (EUNIS).

Environmental Statement
Brims Tidal Array
Page 99 of 316
Survey/study Date of
survey/study
Description
Underwater noise technical
report
May 2015 Technical study undertaken by Xodus Group to assess the
impacts of underwater noise produced by the proposed Project on
fish and marine mammals. (Supporting Document: Xodus, 2015)
Migratory routes of Atlantic
salmon
2010 A study reviewing the migratory routes and behaviour of Atlantic
salmon, sea trout and European Eel in Scotland’s coastal
environment: implications for the development of marine
renewables. Scottish Marine and Freshwater Science
Depth use of
Atlantic salmon
2014 Two tagging studies were undertaken by Godfrey et al. (2014a;
2014b) which looked at the depth use and movements of Atlantic
salmon around the coast of Scotland. A modelling study was also
undertaken in 2014 by Guerin et al. (2014) which has also been
used to inform this assessment.
Review of MeyGen modelling 2013 Marine Scotland and SNH undertook a critical review of the
collision risk modelling undertaken for MeyGen. The results of this
process have been used to inform elements of this assessment.
Cefas – a GIS resource of
spawning and nursery grounds
1998; 2012 Distribution of spawning and nursery grounds as defined in Coull
et al. (1998) Fisheries Sensitivity Maps in British Waters, and in
Ellis et al. (2012) Mapping spawning and nursery areas of species
to be considered in Marine Protected Areas (Marine Conservation
Zones).
Marine Scotland Science
fisheries sensitivity maps.
2014 An update to fisheries sensitivity maps by Aires et.al. (2014),
detailing hotspots for group 0 aggregations7 of juvenile fish in UK
waters.
ICES - Results of the
International Herring Larvae
Survey (IHLS) (ICES, 2014a)
2008 – 2012 The main purpose of the programme is to provide quantitative
estimates of herring larval abundance which are used as a relative
index of changes in herring spawning stock biomass in the
assessment.
Collision Risk Modelling –
Atlantic Salmon (Xodus Group,
2016)
2016 This modelling was carried out to assess the risk associated with
the tidal development on migrating populations of Atlantic salmon,
a protected species.
12.6 DATA GAPS AND UNCERTAINTIES
12.6.1 Distribution of Spawning and Nursery Grounds
The spawning and nursery grounds described in this chapter are primarily based on the information presented in Ellis et
al. (2012) and Coull et al. (1998). The limitations of these sources of information should, however, be recognised. These
publications provide an indication of the general location of spawning and nursery grounds. They do not define precise
boundaries of spawning and nursery grounds, particularly in the context of the relatively small footprint of the Project site
(11km2). Similarly, the spawning times given in these publications represent the maximum duration of spawning on a
species/stock basis. In some cases, the duration of spawning may be much more contracted, on a site specific basis, than
7 Group 0 fish are defined as fish in the first year of their lives

Environmental Statement
Brims Tidal Array
Page 100 of 316
reported in Ellis et al. (2012) and Coull et al. (1998). Therefore, where available, additional research publications have also
been reviewed to provide site specific information. Despite the limitations, there is still sufficient data to establish a robust
baseline to inform the impact assessment.
A review of the juvenile fish data was undertaken by Aires et al. (2014) taking into account the findings of Ellis et al. (2012)
and Coull et al. (1998) together with findings from the National and International Bottom Trawl Surveys (IBTS), the Beam
Trawl Survey (BTS), International Herring Larval Surveys (IHLS) and other standalone surveys. The findings summarise
the probability of aggregations of juvenile, group 0, fish present around the UK Continental Shelf (UKCS). However, the
data does not cover the Brims AfL or cable route options. Available data in adjacent waters show that levels for group 0
aggregations of juvenile fish for all species are low (Aires et al. 2014).
12.6.2 Knowledge Gaps
It is recognised that there are gaps in the understanding of the distribution, behaviour and ecology of certain fish species.
This is particularly evident for a number of migratory species including several species of known conservation importance
(e.g. salmonids). For migratory species, the exact routes they will take on their movements to and from feeding and
spawning grounds are not always known. Where information is available it has been used to determine whether species
travel through the Project site or to make assumptions on the migratory routes taken. Where no such data are available, it
has been conservatively assumed that migration through the Project site does occur. With regards to the potential for
migratory fish to collide with the tidal turbines work undertaken in support of the MeyGen Project (both the initial Xodus
Group work (Xodus Group, 2012) and the reparameterised work by Marine Scotland Science and SNH (Marine Scotland
and SNH, 2014) indicate that impacts were unlikely to be significant. Further work with regards to understanding both
Atlantic salmon migration through the Pentland Firth and potential collision risk have been ongoing since 2012. This work
has included the development of a draft model by SNH to predict collision risk (SNH, 2015) which was released during the
period over which the Project EIA has been undertaken. As the latest development in work relating to fish collision risk, it
has been used to inform the fish ecology impact assessment.
12.7 CONSULTATIONS
A list of feedback from all consultees is summarised in Chapter 6 Consultation Process. The key points raised by
stakeholders regarding fish ecology are presented in Table 12.3.

Environmental Statement
Brims Tidal Array
Page 101 of 316
Table 12.3: Key issues raised by stakeholder during consultation
Stakeholder Comment Response/Action taken Section cross-
reference
MS-LOT The main diadromous fish species of concern and the potential impacts of the Project
on these need to be fully explored in the Environmental Statement.
This is covered in the EIA. Section 12.9.6
MS-LOT Assess the potential impacts of deployed devices on diadromous fish during
deployment, operation and decommissioning phases.
This is covered in the EIA. Sections 12.12.1,
12.12.2 and
12.12.3
MSS Additional data sources including site specific surveys and recent fisheries sensitivity
maps should be used to inform the baseline and impact assessment on fish and
elasmobranch species.
Results from the benthic
surveys used to inform the
assessment and covered in the
EIA.
Sections 12.9.2,
12.9.3, 12.9.4,
12.9.5, 12.9.6,
12.9.7
MSS There is both a clear need to consider fully the combined impact of the proposed
development along with other proposed tidal developments in the same area of
Scotland and consider more widely in-combination effects with various other types of
development which could be much further from the Project site.
This is covered in the EIA. Chapter 22
Cumulative Impacts
Assessment
MSS Some analysis of the habitat maps to determine suitable areas of sediment for both
herring and sandeels and for this analysis to be ground truthed with some of the
underwater TV work/sediment analysis where possible.
Undertaken as part of habitat
preference sections for these
species.
Sections 12.9.3.1,
12.9.4.1
SNH The study area should be clearly defined and recent findings of salmon tagging studies
should be used to inform the assessment.
This is covered in the EIA and
HRA screening note.
Sections 12.2,
12.9.6.1, 12.12.2.3
and 12.12.2.5
SNH Cumulative impacts with other renewables developments in the PFOW and Moray Firth
will be an important consideration, as may other non-renewables activities.
This will be covered in the EIA. Chapter 22
Cumulative Impacts
Assessment
SNH Swimming depths of migratory species. This will be covered in the EIA. Section 12.12.2.3
SNH Impacts on Priority Marine Features (PMF). This will be covered in the EIA. Sections 12.12.2.4

Environmental Statement
Brims Tidal Array
Page 102 of 316
Stakeholder Comment Response/Action taken Section cross-
reference
SNH The potential for the infrastructure to act as Fish Aggregating Devices (FADs). This will be covered in the EIA. Section 12.12.2.4
SNH Impacts of underwater noise on species including salmon. This will be covered in the EIA. Sections 12.12.1.3
and 12.12.2.6
SNH\MSS Collision risk modelling for fish is required This will be covered in the EIA. Section 12.12.2.3
SNH It is not possible to undertake site-specific HRA for migratory Atlantic salmon, or other
migratory fish, due to the difficulties in apportioning impacts correctly to SACs and a
lack of information on SAC populations to inform decisions on site integrity. For this
assessment we advise that potential impacts to migratory fish and freshwater pearl
mussel are considered under EIA rather than HRA.
This will be covered in the EIA. Section 12.12

Environmental Statement
Brims Tidal Array
Page 103 of 316
12.8 ASSESSMENT METHODOLOGY
12.8.1 Assessment Criteria
The EIA process and methodology are described in detail in Chapter 7 EIA Scope and Methodology. However, each
assessment chapter is required to develop its own criteria for the sensitivity and value of receptor and magnitude of impact
aspect since the definition of these will vary between receptors. Different species are likely to be the receptor depending
on their sensitivities and vulnerabilities detailed in the baseline description (Section 12.9). The sensitivity and value of the
receptor and magnitude of impact criteria specific to fish ecology are defined in Table 12.4 and Table 12.5 respectively.
Value is presented as a component of sensitivity to allow a judgement to be made according to either a receptor’s sensitivity
to a particular effect or its value under international, national, or regional legislation. Value should therefore be applied
inherently when considering the sensitivity of a receptor to a particular effect. Where the sensitivity rating for tolerance and
designation are not in agreement, expert judgement is used to determine the most appropriate sensitivity ranking. This is
explained though the narrative of the assessment.
Mitigation is applied to the sensitivity and value of receptor to provide a residual magnitude of the impact and presented
alongside a qualitative understanding of the likelihood (using the criteria detailed in Chapter 7). The definitions for impact
significance are also presented in Chapter 7, Section 7.7. The residual significance of the impact is then considered by
reference to the relevant criteria in the EIA Regulations. Definitions for impact significance are presented in Chapter 7,
Section 7.7.

Environmental Statement
Brims Tidal Array
Page 104 of 316
Table 12.4: Definitions for sensitivity of fish ecology
Sensitivity Criteria
High Sensitivity: Receptor with little or no capacity to accommodate a particular effect with no ability to recover or adapt.
Value: Fish species affected are designated under international legislation (e.g. IUCN red list, EU Habitats Directive).
In the context of a particular impact, species which are considered highly sensitive to the impact1
Medium Sensitivity: Receptor with very low capacity to accommodate a particular effect with low ability to recover or adapt
Value: Fish species affected are designated under UK and Scottish legislation (e.g. PMF).
In the context of a particular impact, species which are moderately sensitive to the impact1.
Low Sensitivity: Receptor has some tolerance to accommodate a particular effect or will be able to recover or adapt.
Value: Fish species affected are designated under local legislation (e.g. Local BAP species) and are vulnerable to the impacts in question.
In the context of a particular impact, species which are not very sensitive to the impact1.
Negligible Sensitivity: Receptor is generally tolerant and can accommodate a particular effect without the need to recover or adapt.
Value: Fish species with little or no local importance or sensitivity to the impacts in question.
In the context of a particular impact, species which show no sensitivity to the impact1.
Note: 1 In the context of some impacts, certain species may be very sensitive to the impact (e.g. herring and noise) but are not designated under certain
legislation that would make them of very high sensitivity. In addition there may be some receptors that are very high sensitivity due to their designation under
international legislation but in the context of the particular impact they demonstrate no sensitivity to the impact and can be considered of low sensitivity. In such
cases expert judgment is used to determine the most appropriate sensitivity ranking and this is explained through the narrative of the assessment.

Environmental Statement
Brims Tidal Array
Page 105 of 316
Table 12.5: Definitions for magnitude of effect for fish ecology
Sensitivity Criteria
Major Prolonged/widespread disturbance to fish species to the baseline condition, with long-term or
permanent effects on any or all of the following: spawning grounds, nursery grounds, and migration
routes and/or feeding grounds.
These would result in long-term changes in population size.
Impact highly likely to occur.
Moderate Medium-term and localised disturbance or change to the baseline condition to fish species, with short-
term and recoverable effects on: spawning grounds, nursery grounds, migration routes and/or feeding
grounds.
Populations would recover in the medium-term.
Impact likely to occur.
Minor Short-term and localised disturbance or change to the baseline condition to fish species, with short-
term and recoverable effects on: spawning grounds, nursery grounds, migration routes and/or feeding
grounds.
Populations would show recovery in the short-term.
Impact will possibly occur.
Negligible Imperceptible or no changes to the baseline condition including to: spawning grounds, nursery
grounds; migration routes; and/or feeding grounds.
No changes experienced at the population level.
Impact highly unlikely to occur.
Positive An enhancement of an ecosystem or population parameter.
Note: Magnitude of impact is presented as a variety of parameters including duration, timing, size and scale, and
frequency. Definitions in this table may not be appropriate for all impacts, for example there may be an impact which
is over a very small area (minor or moderate) but is repeated a large number of times during a particular phase of the
Project (major or severe). In such cases expert judgment is used to determine the most appropriate magnitude
ranking and this is explained through the narrative of the assessment.
Table 12.6: Assignment of impact significance for fish ecology based on sensitivity of receptor and magnitude of effect
Sensitivity of
Receptor
Magnitude of effect
Major Moderate Minor Negligible
High MAJOR MAJOR MODERATE MINOR
Medium MAJOR MODERATE MINOR MINOR
Low MODERATE MINOR NEGLIGIBLE NEGLIGIBLE
Negligible MINOR NEGLIGIBLE NEGLIGIBLE NEGLIGIBLE

Environmental Statement
Brims Tidal Array
Page 106 of 316
12.9 BASELINE DESCRIPTION
12.9.1 Introduction
The fish ecology baseline description is based upon a comprehensive desk based study, surveys of large fish species and
consultation with relevant organisations. The main focus of the fish ecology assessment is to consider impacts on important
fish habitat, in particular key spawning and nursery grounds which are essential for sustaining fish populations and potential
impacts on individual fish species, their migration routes and their contribution to local biodiversity and wider food webs.
The assessment therefore considers impacts on the following fish groups:
Pelagic species;
Demersal species;
Elasmobranch fish species;
Diadromous fish species; and
Other relevant PMF or Annex II8 species.
12.9.2 Benthic Environment
In the shallower end of the three cable corridor options (Sheep Skerry, Moodies Eddy and Aith Hope), the sediment is
characterised by medium to fine sand with bedrock outcrops and varying densities of kelp and other seaweed. As the water
depth increases the proportion of sandy sediment increases in relatively sheltered areas and the prevalence of seaweed
decreases (Supporting Document: Aquatera, 2014).
The seabed observed in depths of 20 – 40m is classified as circalittoral mixed sediment and dominated by gravelly sands
with frequent bedrock outcrops and boulders. In the southern region of the cable route corridor, where water depths are
greater than 50m, the seabed biotopes were more typically tidally-swept rocky areas.
In the AfL area the seabed is characterised as extremely tide swept circalittoral rock consisting of primarily rocky with
occasional veneers of gravel and coarse sandy sediments in the more sheltered areas such as in rock crevices and
between boulders (Supporting Document: Aquatera, 2014).
More detail of the benthic habitats present and biotope classifications are provided in Chapter 11 Benthic Ecology.
12.9.3 Pelagic Fish Species
Pelagic fish inhabit the water column including the near-surface. Their distribution is strongly affected by hydrographic
conditions and can vary significantly from year to year. The principal pelagic species found in the region are typical of the
wider North Sea including herring Clupea harengus, sprat Sprattus sprattus and mackerel Scomber scombrus. Herring
and sprat play an important ecological role as principal prey items for several larger species, marine birds and mammals.
A brief summary of herring biology with regard to the North Sea population is presented below, with a view to identifying
species key life stages likely to be particularly sensitive to noise from construction and operation of the tidal array.
8 Species listed on Annex II of the Habitat’s Directive

Environmental Statement
Brims Tidal Array
Page 107 of 316
12.9.3.1 Herring Ecology
Data from Coull et al. (1998) indicates that herrings spawn all around the Orkney coastline and across the Pentland Firth
to the north of Scotland, coinciding with the Project site (Figure 12.1). Herring are reported to deposit their sticky demersal
eggs on a variety of substrates ranging from boulders, rock, small stones, coarse sand, shell fragments, macrophytes and
man-made structures such as lobster pots. Gravel is widely considered to be the preferred spawning substrate (Drapeau,
1973; Rogers and Stock, 2001).
Herring around the UK have been divided into sub populations based on the timing and region of spawning. Those that
spawn around the coast of Orkney are known as the Orkney/Shetland and Buchan components. The Orkney sub
population spawns in September and October (Coull et al. 1998). The survival and development of herring eggs have been
reported to be insensitive to even high concentrations of suspended sediment, but studies have concluded that smothering
is likely to be detrimental unless the material is removed rapidly by the current (Birklund and Wijsam, 2005).
After hatching, larvae are pelagic and drift with the currents and the juvenile nursery grounds tend to be close inshore. The
results from the IHLS corroborate this, as presented in Figure 12.1. After approximately one year they migrate further
offshore to join the adult population at feeding grounds before returning to spawning in their well-defined areas. Herring
play an important ecological role as principal prey items for several larger fish species, marine birds and mammals and
occur throughout Scottish waters.
Herring Habitat Preferences
Herring have very specific habitat requirements, generally requiring clean gravelly sediment in waters of less than 40m
depth (ICES, 2014b) with sediment containing less than 2% fine particles (Saetre, 1999). As a consequence, their spawning
grounds are relatively limited and potentially vulnerable to seabed disturbance and change. The gravelly sands recorded
between 20 – 40m in the three cable route corridors are not suitable herring spawning ground because of the silt/clay and
very fine sand content (JNCC, 2015). Preferred herring spawning grounds are tide-swept circalittoral coarse sands, gravel
and shingle, and probably offshore (deep) circalittoral habitats with coarse sands and gravel or shell (Personal
Communication, David Donnan and Chris Leakey, SNH, 2015). There are no habitats of this kind within the Project site
and herring spawning grounds will therefore not be impacted.

Figure 12.1: Spawning and nursery grounds of pelagic fish, including herring larvae abundance 2008-2012

Environmental Statement
Brims Tidal Array
Page 109 of 316
12.9.3.2 Pelagic Spawning and Nursery Areas
Data from Coull et al. (1998) indicate that in addition to herring, sprat spawn around all of the Orkney coastline and across
the Pentland Firth to the north of Scotland, overlapping with the Project site (Figure 12.1). Sprat spawn from May to August,
during which May and June are peak spawning periods. Mackerel do not spawn in the AfL area or any of the export cable
corridor options.
Data from Coull et al. (1998) and Ellis et al. (2012) also show that nursery grounds of herring, sprat and mackerel coincide
with the Project site as shown in Figure 12.1. Coull et al. (1998) found sprat to be ubiquitous across the region during
nursery periods; however, data for specific nursery periods are not readily available as they vary annually depending on
numerous factors (Cefas, 2001).
The IHLS (ICES, 2014) show that there are no herring larvae within the Project site (as shown in Figure 12.1).
12.9.3.3 Seasonal Sensitivities and Vulnerabilities of Key Pelagic Species
Research shows that the main issues for pelagic fish are noise and suspended sediment concentration levels (ICES, 2006).
The relative mobility of pelagic fish may allow localised avoidance of some of the above aspects, such as suspended
sediments (Birkuland and Wijsman, 2005). However, effects such as noise may be unavoidable as they can be detected
from relatively long distances.
Herring and sprat, unlike most other fish, have specialised adaptations connecting the swim bladder and oesophagus to
the inner ear. These morphological adaptations make them one of the most sensitive fish species to noise (ICES, 2006).
Herring and mackerel may also be disturbed by, and avoid, suspended sediment levels (Birkuland and Wijsman, 2005).
Table 12.7 details the key pelagic species, their conservation status and seasonality of spawning activity.
Table 12.7: Pelagic species with defined spawning and nursery grounds within the Project site (Coull et al. 1998; Ellis et al. 2012)
Species Spawning grounds Nursery grounds Conservation and commercial importance
AfL area Cable AfL area Cable
Herring Sept -
Oct
Sept -
Oct
UK BAP
IUCN Red List (Least Concern)
Priority Marine Feature
Mackerel n/a n/a UK BAP
IUCN Red List (Least Concern)
Priority Marine Feature
Sprat May-Aug May-Aug None
Key
High intensity
Low intensity
Undefined Intensity
n/a Insufficient information available

Environmental Statement
Brims Tidal Array
Page 110 of 316
12.9.4 Demersal Fish Species
Demersal fish are bottom feeders that live on or near the seabed. In coastal waters they are found on or near the continental
shelf, whereas in deep waters they are more associated with the continental slope or continental rise. Their distribution is
related to abiotic factors such as sediment type (which is usually important as a refuge in predation avoidance or for cryptic
behaviour), hydrography, biotic processes (e.g. predator prey interactions), and competition for space. Demersal species
found in the region include gadoids (soft finned fish species of the family Gadidae), flatfish, sandeel and elasmobranchs
(elasmobranchs are discussed in Section 12.9.5 and are therefore not listed here).
The following demersal species are present in the area according to Coull et al. (1998) and Ellis et al. (2012):
Anglerfish Lophius piscatorius;
Blue whiting Micromesistius poutassou;
Cod Gadus morhua;
European hake Merluccius merluccius;
Lemon sole Microstomus kitt;
Ling Molva molva;
Saithe Pollachius virens;
Sandeel Ammodytidae spp.; and
Whiting Merlangius merlangus.
12.9.4.1 Sandeel Ecology
Sandeel are major predators of zooplankton and play a key role in the North Sea food web and are the principal prey of
many top predators including other demersal fish (Collins and Pierce 1996; Greenstreet et al. 1998; Wright & Kennedy
1999; Olsen and Holst, 2001; Mills et al. 2003; Santos et al. 2005; ICES, 2006; ICES, 2008; Walters, 2010; Walters, 2011),
marine mammals (McConnell et al. 1999; Pierce et al. 2004), and birds (Wright and Bailey 1996; Furness, 1999; and
Wanless et al. 2005).
They have highly specific habitat requirements meaning that in addition to patchy spawning grounds, the distribution of
post-settled sandeel is very irregular (Wright and Kennedy, 1999; Jensen et al. 2011). Sandeel are most active in late
spring and early summer, during which time they move freely, on a diurnal basis, between the seabed and the water
column. During autumn and winter, sandeel lie dormant in the sediment except for a brief midwinter emergence to spawn
(November to February) (Greenstreet et al. 2010). Post settled sandeel are very rarely found at depths greater than 15m
and the maximum distance travelled by tagged fish displaced from grounds was 64km (Jensen et al. 2011).
Sandeel Habitat Preferences
The North-west Orkney Nature Conservation Marine Protected Area (NCMPA) which is located approximately 30km north
west of the Project site is designated for the protection of sandeels. The Project will not impact this protected area. Sandeel
are particularly sensitive because they spawn in very specific habitats. Holland et al. (2005) found that A. marinus require
a very specific substratum, favouring seabed habitats containing a high proportion of medium and coarse sand (particle
size ≥ 0.25 to < 2mm) and low silt content. Overall, sandeels are considered to be rare in sediments where the silt content
(particle size < 63μm) is greater than 4%, and absent where the silt content is greater than 10% (Holland et al. 2005). Work
by Greenstreet et al. (2010) has characterised this further into four preferences based on % of coarse sands by weight
contained within the sediment composition. Table 12.8 details the preferences based on the % of coarse sands within
sediments.

Environmental Statement
Brims Tidal Array
Page 111 of 316
Table 12.8: Sandeel sediment preference and categorisation of the seabed sediments (Greenstreet et al., 2010)
Preference Coarse sands range (% by weight) Upper limit of silt and fine sand (% by weight)
Prime 70 -100% 20%
Sub-prime 50 – 69% 30%
Suitable 20 – 49% 50%
Unsuitable < 19% > 50%
As discussed in Section 12.9.2 and in Chapter 11 – (Figure 11.1, biotope map) shallower areas of the Moodies Eddy and
Aith Hope cable landfall options were found to contain coarse sands and were consistent with the JNCC biotope of
sublittoral sediment (SS.SMp.KSwSS – See Chapter 11). JNCC (2015) criteria show that this biotope has on average 47%
coarse gravel content and 46% silt and fine sand. This therefore shows that the inshore areas of these two landfall options
are classed as ‘suitable’ habitat for sandeels. No other areas of the Project (AfL or cable corridors) were found to be within
preferential sediment content limits.
12.9.4.2 Demersal Species Spawning and Nursery Areas
Data from Coull et al. (1998) and Ellis et al. (2012) indicate that two demersal fish species spawn in the vicinity of the
Project site: sandeel and lemon sole (Figure 12.2). Spawning grounds of unknown intensity for sandeel, which spawn from
November to February, and spawning grounds of unknown intensity for lemon sole, which spawn from April to September.
Many demersal species, including lemon sole, have buoyant eggs that are released into the water column where they
remain for several weeks until the pelagic larvae emerges (van Damme et al. 2011). Sandeel eggs are laid in clumps that
stick to coarse sandy substrata until they hatch during February and March, after which the larvae are found in the water
column.
Data from Coull et al. (1998) and Ellis et al. (2012) indicate that within the Project site there are high intensity nursery
grounds of anglerfish and blue whiting and there are low intensity nursery grounds of cod, European hake, ling, sandeel
and whiting. Nursery grounds of unidentified intensity for lemon sole and saithe also overlap with the Project site (Figure
12.2).

Figure 12.2: Spawning and nursery grounds of demersal fish

Environmental Statement
Brims Tidal Array
Page 113 of 316
12.9.4.3 Seasonal Sensitivities and Vulnerabilities of Key Demersal Species
Several demersal species of fish may be sensitive and/or vulnerable to effects arising from construction, operation and
maintenance of the Project, including disturbance of spawning grounds, disturbance of habitat for demersal species, noise,
collision risk, electro-magnetic fields (EMF) and changes to existing habitat.
Sandeel are the most sensitive demersal species as described above. The pelagic spawn of lemon sole is also a key
sensitivity. Spawn in the water column may be affected by suspended sediment which could cause it to sink, thus affecting
survivability. Anglerfish and blue whiting have high intensity nursery grounds in the AfL area and surrounding area.
Juvenile stocks of demersal fish are considered to be more vulnerable than adults to some of the effects associated with
tidal array development, such as habitat loss, due to their adaptability and tolerance by way of their less mobile nature and
specialist feeding behaviour. However, adult stocks are reliant upon successful spawning, nursery and migratory phases;
therefore, loss of habitats for spawning and nursery grounds will be reflected in future adult fish populations.
Impacts from increased noise on demersal fish are similar to those for pelagic fish and range from behavioural changes
(e.g. changes in swimming speed and direction) (Mueller-Blenkle et al. 2010), to lethal effects at very close range (e.g.
haemorrhage of internal organs) (Halvorsen et al. 2011).
Table 12.9 details the sensitive periods and conservation status of the key demersal species likely to be present in the
Project site.
Table 12.9: Demersal species with defined spawning and nursery grounds within the Project site (Coull et al. 1998; Ellis et al. 2012)
Species Spawning grounds Nursery grounds Conservation and commercial importance
AfL area Cable AfL
area
Cable
Anglerfish n/a n/a UK BAP
Priority Marine Feature
Blue whiting n/a n/a Priority Marine Feature
UK BAP
Cod n/a n/a UK BAP
OSPAR Species (stock depleted and in danger of
collapse)
IUCN Red List (Vulnerable)
Priority Marine Feature
European
hake
n/a n/a UK BAP
Lemon Sole Apr –
Sep
Apr –
Sep
None
Ling n/a n/a UK BAP
Priority Marine Feature

Environmental Statement
Brims Tidal Array
Page 114 of 316
Species Spawning grounds Nursery grounds Conservation and commercial importance
AfL area Cable AfL
area
Cable
Saithe n/a n/a Priority Marine Feature
Sandeel Nov -
Feb
Nov -
Feb
UK BAP
Priority Marine Feature
Whiting n/a n/a UK BAP
Priority Marine Feature
Key
High intensity
Low intensity
Undefined Intensity
12.9.5 Elasmobranch Species
Sharks and rays are particularly sensitive to disruption because they have slow growth rates and low reproductive output
compared to other species groups (Camhi et al. 1998). This results in slow rates of stock increase and low resilience to
fishing mortality (Holden, 1974). Directed fisheries have caused stock collapse for many species (Musick and Musick,
2005), although at present mortality in mixed species fisheries and by-catch appears to be a more significant threat (Bonfil,
1994). As a result the stocks of most elasmobranch species are currently at low levels and spatial management measures
have been introduced to protect the remaining stocks (ICES, 2008).
The following demersal species are likely present in the area (Coull et al. (1998) and Ellis et al. (2012)):
Common skate complex Dipturus batis, now split
provisionally into D. cf. flossada and D. cf. intermedia;
Thornback ray Raja clavata; and
Spotted ray Raja montagui; Tope shark Galeorhinus galeus.
Spurdog Squalus acanthias;
12.9.5.1 Key Elasmobranch Species
Data from Ellis et al. (2012) indicate that no elasmobranch species spawn in the vicinity of the Project site and export cable
route (Figure 12.3). There are, however, low intensity nursery areas for the common skate complex, spotted ray, spurdog,
and tope shark which overlap with the Project site and thornback ray (~11km to the east ) (Figure 12.3).
The common skate complex occupy sandy and muddy bottom habitats from 10 to 100m deep. Younger individuals are
more often found in shallower waters than adult. Data from the Orkney Skate Trust shows that common skate can occur
within Orkney waters, and benthic habitats in the area of the Project are considered suitable for common stake. However,
no records from the Skate Trust or video analyses from the benthic survey were found within the AfL, cable route corridor
or immediate surrounding (200m). The closest record occurred within approximately 7km north east of the Project
boundary.

Figure 12.3: Spawning and nursery grounds of other fish species

Environmental Statement
Brims Tidal Array
Page 116 of 316
12.9.5.2 Seasonal Sensitivities and Vulnerabilities of Key Elasmobranch Species
Elasmobranch species may be sensitive and/or vulnerable to several effects associated with the Project such as sediment
disturbance, noise from construction and operation and electromagnetic fields generated by subsea cables.
Experimental studies have provided evidence that some elasmobranch species (the lesser spotted dogfish and the
thornback ray) can respond to the presence of electromagnetic fields that are of the type and intensity associated with sub-
sea cables (Gill et al. 2009). EMF can be detected by some species over tens of metres decreasing in intensity with
increasing distance from the source (Gill et al. 2009). The reaction of the fish was unpredictable and did not always occur.
When a reaction occurred it appeared to be species specific and, in some cases, individual specific, behavioural activity
associated with foraging (Gill et al. 2009). Thornback rays were reported to be more likely to move around within the
electromagnetic field generated by an operating cable, whereas the lesser spotted dogfish were reported to have more
restricted movements within the electromagnetic field generated by an operating cable (Gill et al. 2009).
Table 12.10 details the sensitive periods and conservation status of the key elasmobranch species likely to be present in
the area. Of key concern are the common skate complex and spurdog as they are listed as critically endangered on the
IUCN Red List (Table 12.10).

Environmental Statement
Brims Tidal Array
Page 117 of 316
Table 12.10: Elasmobranch species with defined spawning and nursery grounds within the Project site (Coull et al. 1998; Ellis et al. 2012)
Species Spawning grounds Nursery grounds Conservation and commercial importance
AfL area Cable AfL area Cable
Common
skate
complex
n/a n/a OSPAR species (stock depleted and in danger of
collapse)
IUCN Red List (critically endangered)
UK BAP
Priority Marine Feature
Scottish Nature Conservation MPA Search feature
(marine life stages)
Spotted
Ray
n/a n/a IUCN Red List (Least Concern)
OSPAR
Spurdog n/a n/a OSPAR species (stock depleted and in danger of
collapse)
IUCN Red List (critically endangered)
UK BAP
Priority Marine Feature
Scottish Nature Conservation MPA search feature
(marine life stages)
Thornback
ray
n/a n/a IUCN Red List (Near Threatened)
OSPAR species (stock depleted and in danger of
collapse)
Tope
shark
n/a n/a IUCN Red List (Vulnerable)
UK BAP
Key
High intensity
Low intensity
Undefined Intensity
n/a Insufficient data
12.9.6 Diadromous Migratory Species
The following diadromous species are expected to transit the Project site on an occasional basis:
Atlantic salmon Salmo salar;
Sea trout Salmo trutta; and
European eel Anguilla anguilla.
Several species of fish living in Scottish rivers migrate between the sea and the upper reaches of rivers during their life
cycle. Atlantic salmon and sea trout are anadromous, meaning they spend the majority of their adult lives in the oceans

Environmental Statement
Brims Tidal Array
Page 118 of 316
but return to freshwater to reproduce. European eel are also migratory diadromous fish, but their lifestyle differs from
anadromous fish; adult eels migrate out to sea to spawn and their larvae make the return journey (termed catadromous).
12.9.6.1 Atlantic Salmon and Sea Trout
Atlantic salmon are widely distributed in Scotland and salmon populations are recognised as being of national and
international importance. Sea trout are the migratory form of brown trout and have a very similar life history to Atlantic
salmon. A comparison of the life histories of the two species is detailed in Table 12.11.
Table 12.11: Atlantic salmon and sea trout life histories
Species Juvenile
stage
(smolts)
Adult
stage
Time in
fresh
water
Time at sea Location
offshore
Spawning
season
Proportion
return to sea
following
spawning
Atlantic
salmon
Fresh water Marine Up to four
years
Up to five
years
Undergoes
extensive
migrations
offshore
October to
January
20-36%
Sea trout Fresh water Marine Up to
three
years
May over
winter in
fresh water
Remains in
near-shore
areas
October to
January
75%
Data from the Orkney Biological Records Centre (presented on the NBN Gateway) contain records of Atlantic salmon at
the mouths of four burns on Hoy: Rackwick, Pegal, Ore and Burnhouse. The closest of these is the Ore burn, which is
located approximately 7.5km north of the AfL area. There are also records of Atlantic salmon at six locations on mainland
Orkney and numerous records at rivers along the north coast of mainland Scotland, the closest to the Project being the
River Thurso approximately 24.5km south west (Figure 12.4). Data from the same source contains records of sea trout at
the same burns on Hoy in addition to Greenheads, which is approximately 3.5km north of the AfL area. There are also
records of sea trout at 11 locations on mainland Orkney and numerous records at rivers along the north coast of mainland
Scotland, the closest to the Project being the River Ling approximately 290km south west.
The juvenile life stage of salmon takes place in fresh water, which typically lasts between one to four years before surviving
fish migrate to the sea as smolts. Following entry to the sea, fish are known as post-smolts until the spring of the following
year. Atlantic salmon grow rapidly by feeding at sea before returning to their native rivers to spawn. The length of time a
salmon spends in the sea before returning to their river of origin to spawn varies from one to five winters (Marine Scotland,
2011). Salmon that return after one winter are known as grilse or 1SW (1 winter at sea) whilst salmon that remain offshore
for two to five years are known as MSW (multiple winters at sea).
The adult fish may spawn in quite small headwater streams as well as in suitable areas in larger water courses. Adult fish
enter rivers from the sea at almost any time of year, but they migrate into smaller spawning streams on elevated flows
following rainfall in the autumn. Spawning takes place between late October and early January (Cefas, 2004), after which
a small proportion of the adult fish return seaward over a period of up to several months (salmon returning to the sea
following spawning are termed kelts). The proportion of adults returning to the sea following spawning is in the region of
20 to 36% (Hendry and Cragg-Hine, 2003).

Environmental Statement
Brims Tidal Array
Page 119 of 316
Atlantic salmon have been identified as a species of conservation importance as detailed in Table 12.13. In recognition of
the importance of UK salmon populations, 17 rivers have been designated SACs for Atlantic salmon in Scotland. The
nearest designated SAC salmon river to the Project site is the River Thurso, located on mainland Scotland, approximately
25km to the south west of the Project (Figure 12.4 and Table 12.14). The river supports a higher proportion of multi sea-
winter salmon than is found in many rivers further south in the species’ range. The northerly location of the river leads to
cooler ambient water temperatures than are observed in salmon rivers elsewhere, which causes slower growth in juveniles.
Consequently, they smolt at an older age and tend to return to the river to spawn as older MSW salmon.
Findings presented by Malcolm et al. (2010) suggested that up to 90% of smolts migrate from Scottish east-coast rivers
through the Pentland Firth on their way to feeding ground in the Atlantic Ocean. However, more recent research by Godfrey
et al. (2014a, 2014b) and Guerin et al. (2014) have suggested that distribution may be spread wider than just the Pentland
Firth with some fish travelling through or north of Orkney.
The review by Malcolm et al. (2010) of tagging studies of adult salmon found that as well as Atlantic salmon from the east
coast moving through the Pentland Firth in a easterly direction towards their natal rivers, movement from the east to the
north coast in a westerly direction may be relatively common for both grilse and MWS salmon. However, the numbers
involved in the westerly movement are likely to be lower than the main movement east. Some fish tagged on the east coast
of Scotland, including near Montrose and the Black Isle, have been later recaptured on the north coast of Scotland,
indicating that these fish would have passed through the Pentland Firth area. The coastal tagging studies identified by
Malcolm et al. (2010) reported very few re-captures within the Pentland Firth. For the purposes of the following assessment,
the worst case draws on the findings of Malcolm et al. (2010) and assumes most adults returning to Scotland pass through
Pentland Firth.
Table 12.12 details the likely population size of Scottish Atlantic salmon at different life stages and the numbers of fish that
are assumed to migrate through the Pentland Firth. These values were used to inform the Atlantic salmon CRM for the
Project. The number of smolts is based on the number that could come from rivers on the east coast of Scotland and half
of the north coast rivers. Smolt density form the North Esk is used to calculate the number of smolts per river based on the
area of suitable habitat. Adult salmon and grilse populations are a ten year average using salmon population’s numbers
reported by ICES (2015). It is assumed that 88% of the total salmon population returning to Scotland return to east coast
rivers. Of these it is assumed that 90% of the fish that return to the east coast rivers migrate through the Pentland Firth
with the remainder migrating through the Orkney Isles or north of Orkney (Marine Scotland, 2013).
Table 12.12: Scottish salmon population size (ICES, 2015b; Xodus Group, 2012)
Salmon life stage Population size Number of individuals migrating through Pentland Firth
Smolt 7,341,461 6,607,314
1SW 315,284 249,705
MSW 237,844 188,372
The fact that many smolts are caught in surface trawls also suggests that smolts spend most of their time in the top few
metres of the water column (Malcolm et al. 2010; Godfrey et al. 2014a & b).

Environmental Statement
Brims Tidal Array
Page 120 of 316
Whilst at sea salmon typically spend most of their time close to the surface, they do often dive, sometimes to depths of
over 250m (Malcolm et al. 2010; Godfrey et al. 2014b). The complex near-shore directional movements of salmon remain
poorly understood and their behaviour at this stage may be linked to a range of local environmental conditions such as
tidal movements, home river discharges, diurnal rhythms and other biological and physical cues.
With regard to sea trout, there is limited information on swimming depths for adult sea trout, although data from Norway
suggests shallow swimming depths (<3m) with frequent dives to approximately 30m (Malcolm et al. 2010).
Despite Malcolm et al. (2010) concluding that given the data available to date, no reliable conclusions can be drawn on
the marine distribution of adult sea trout, given the proximity of sea trout sightings to the Project site and their known
behaviour, a precautionary approach assumes that sea trout will pass through coastal areas of the Pentland Firth. It is also
assumed that Atlantic salmon pass through the Project site.

Figure 12.4: Diadromous fish rivers
Environmental Statement
Brims Tidal Array
Page 122 of 316
12.9.6.2 European Eel
There is evidence to suggest that the Pentland Firth is well used by European eel (Malcolm et al. 2010) and that this
species occurs in rivers close to the Project site. As such, it must be assumed that both juveniles and adults will transit the
Project site.
Data from the Orkney Biological Records Centre (presented on the NBN Gateway) contain records of European eel at the
mouths of five burns on Hoy: Rackwick, Pegal, Ore, Greenheads, and Summer. The closest of these, Greenheads, is
located approximately 3.5km north of the AfL area. There are also records of European eel at 11 locations on mainland
Orkney and numerous records at rivers along the north coast of mainland Scotland, the closest to the Project being the
River Ling approximately 290km south west.
The life cycle of the European eel is well known. Spawning occurs in the Sargasso Sea (in the mid-Atlantic Ocean), after
which larval eels cross the Atlantic Ocean. After the continental growth stage which can last from 30-60 years, the eels
begin the return migration to the Sargasso Sea (Malcolm et al. 2010).
Very little is known about the routes undertaken or the nature of eel migrations as juveniles and as adults. However, for
both migrations it is possible that a significant proportion of the total European population may pass through the seas
around Scotland (Malcolm et al. 2010). The timing of migration peaks in Scottish waters is poorly recorded but Malcolm et
al. (2010) inferred that glass eels pass through Scottish waters principally from September to December. In addition, glass
eels destined for Scottish rivers must remain in coastal regions until April to May before river temperatures rise sufficiently
for them to enter fresh water. The majority of return eel migration is likely to take place between September and January.
Both juvenile and adult eels can be found throughout the water column (up to depths of 300m) and the depth selected can
vary with the time of day and the state of the tide.
12.9.6.3 Seasonal Sensitivities and Vulnerabilities of Key Diadromous Species
The migratory behaviour of diadromous species means that they are likely to be sensitive to certain effects associated with
the Project, specifically noise generated during construction and operation and EMF generated by subsea cables.
Behavioural avoidance is an important consideration during migration of salmonids. In terms of onset of physiological
effects, salmon are not the most sensitive and other fish with a swim-bladder not connected to the ear have been shown
to recover.
Some species (salmonids and anguillid eels) are likely to utilise electromagnetic fields for navigation purposes during long
distances migrations, which occur at specific life stages of their life cycle (Gill et al. 2005). Table 12.13 details the sensitive
periods and conservation status of the key diadromous species likely to be present in the area.

Environmental Statement
Brims Tidal Array
Page 123 of 316
Table 12.13: Sensitive periods and conservation status of the key diadromous species likely to be present in the area (based on SNH website)
Species Time of migration to and from natal rivers Conservation and commercial importance
J F M A M J J A S O N D
Atlantic
salmon
Habitats Directive
Priority Marine Feature
UKBAP
Bern Convention
OSPAR species
IUCN Red List (Lower risk/least concern)
Sea trout • • Priority Marine Feature
UKBAP
IUCN Red List (Least concern)
European eel Priority Marine Feature
UKBAP
OSPAR species
IUCN Red List (Critically endangered)
12.9.7 Other Relevant PMF or Annex II Species
In addition to the fish species above, the following species have been included in the assessment due to their presence in
the study area and status as a PMF or Annex II species:
Spiny lobster Palinurus elephas.
Freshwater pearl mussel Margaritifera margaretifera; and
Lamprey species (Sea lamprey Petromyzon marinus, River lamprey Lampetra fluviatilis and Brook lamprey Lampetra
planeri).
12.9.7.1 Spiny Lobster
Spiny lobster typically feed on echinoderms, small gastropods and bivalves, microalgae, shrimp larvae, bryozoans and
annelids (Jackson et al. 2009). They spawn between June and October and are known to undertake migrations to deeper
water in the Atlantic and can therefore be sensitive to EMF. Females move to deeper waters during egg development and
return inshore prior to egg hatching. Males are also thought to make onshore-offshore migrations (Jackson et al. 2009).
Spiny Lobster Habitat Preferences
Spiny lobster are generally found in circalittoral/infralittoral rock/boulders on exposed coasts between 20m and 100m depth
(Personal communication, David Donnan and Chris Leakey, 2015). The rocky habitat creates crevices for their protection.
Suitable substrate for spiny lobsters is present within the AfL and the three cable route options within the biotopes
circalittoral rock and circalittoral mixed sediment (see Figure 11.1 Biotope map in Chapter 11 Benthic Ecology). No spiny
lobsters were recorded during the benthic site survey.

Environmental Statement
Brims Tidal Array
Page 124 of 316
12.9.7.2 Freshwater Pearl Mussel
The freshwater pearl mussel is an Annex II Species of the EU Habitats and Species Directive. The freshwater pearl
musselThis species typically burrows into sandy sediments, often between boulders and pebbles, in fast flowing rivers and
streams. It requires cool, well oxygenated soft water free of pollution or turbidity. They spawn in early summer with fertilised
eggs being held by the female and released in late summer or early autumn as larvae. The larvae must attach to the gills
of juvenile salmonids to survive, where they remain for up to a year (Skinner et al., 2003). The freshwater pearl mussel is
an Annex II Species of the EU Habitats and Species Directive.
PDue to the conservation status of the freshwater pearl mussel is the primary reason for the designation of eight SACs
(Table 12.14). The closest one is the River Naver, 65km to the south west of the Project site (Figure 12.4).
Although they are a freshwater species and therefore do not occur in the Project site, the reliance of the larval stage on
juvenile salmonids means the freshwater pearl mussel could be indirectly affected by the Project if it has significant impacts
on salmonid populations. The potential indirect impacts on freshwater pearl mussel are discussed in Table 12.14.
Table 12.14: SACs designated for fish and freshwater pearl mussel connected to the Project
SAC name
Distance
from Project
site
Annex II species
that are a
primary reason
for selection
(fish)
Annex II species
present as a qualifying
feature, but not a
primary reason for site
selection (fish)
Potential impact
Berridale
and Langwell
waters
(SAC)
80km Atlantic salmon -
It is theoretically possible that Atlantic
salmon from this SAC pass through the
area proposed for deployment.
Oykel (SAC) 150km Freshwater pearl
mussel Atlantic salmon
It is theoretically possible that Atlantic
salmon from this SAC pass through the
area proposed for deployment. Atlantic
Salmon are a key species in the lifecycle of
the freshwater pearl mussel.
River
Moriston
(SAC)
310km Freshwater pearl
mussel Atlantic salmon
It is theoretically possible that Atlantic
salmon from this SAC pass through the
area proposed for deployment. Atlantic
Salmon are a key species in the lifecycle of
the freshwater pearl mussel.
River Spey
(SAC) 120km
Freshwater pearl
mussel
Sea lamprey
Atlantic salmon
-
It is theoretically possible that Atlantic
salmon from this SAC pass through the
area proposed for deployment.
Scoped out for sea lamprey as no records
for sea lamprey in the Project site.

Environmental Statement
Brims Tidal Array
Page 125 of 316
SAC name
Distance
from Project
site
Annex II species
that are a
primary reason
for selection
(fish)
Annex II species
present as a qualifying
feature, but not a
primary reason for site
selection (fish)
Potential impact
River Thurso
SAC 25km Atlantic salmon -
It is theoretically possible that Atlantic
salmon from this SAC pass through the
area proposed for deployment.
Naver SAC 65km
Freshwater pearl
mussel
Atlantic salmon
-
It is theoretically possible that Atlantic
salmon from this SAC pass through the
area proposed for deployment.
River Dee
SAC 215km
Freshwater pearl
mussel
Atlantic salmon
-
It is theoretically possible that Atlantic
salmon from this SAC pass through the
area proposed for deployment.
Little
Gruinard
River SAC
200km Atlantic salmon -
It is theoretically possible that Atlantic
salmon from this SAC pass through the
area proposed for deployment.
Langavat
SAC 230km Atlantic salmon -
It is theoretically possible that Atlantic
salmon from this SAC pass through the
area proposed for deployment.
River Evelix
SAC 145km
Freshwater pearl
mussel -
It is theoretically possible that Atlantic
salmon from this SAC pass through the
area proposed for deployment. Atlantic
Salmon are a key species in the lifecycle of
the freshwater pearl mussel.
Abhainn
Clais an Eas
and Allt a'
Mhuilinn
SAC
160km Freshwater pearl
mussel -
It is theoretically possible that Atlantic
salmon from this SAC pass through the
area proposed for deployment. Atlantic
Salmon are a key species in the lifecycle of
the freshwater pearl mussel.
River South
Esk SAC 271km
Freshwater pearl
mussel
Atlantic salmon
-
It is theoretically possible that Atlantic
salmon from this SAC pass through the
area proposed for deployment.
River Tay
SAC 340km Atlantic salmon
It is theoretically possible that Atlantic
salmon from this SAC pass through the
area proposed for deployment.

Environmental Statement
Brims Tidal Array
Page 126 of 316
SAC name
Distance
from Project
site
Annex II species
that are a
primary reason
for selection
(fish)
Annex II species
present as a qualifying
feature, but not a
primary reason for site
selection (fish)
Potential impact
River Teith
SAC 409km
Sea lamprey
Brook lamprey
River lamprey
Atlantic salmon
It is theoretically possible that Atlantic
salmon from this SAC pass through the
area proposed for deployment.
Scoped out for sea, brook and river
lampreys as no records for them in the
Project site.
Endrick
Water SAC 734km
Brook lamprey
River lamprey Atlantic salmon
It is theoretically possible that Atlantic
salmon from this SAC pass through the
area proposed for deployment.
Scoped out for brook and river lampreys as
no records for them in the Project site.
River Tweed
SAC 365km Atlantic salmon
Sea lamprey
Brook lamprey
River lamprey
It is theoretically possible that Atlantic
salmon from this SAC pass through the
area proposed for deployment.
Scoped out for sea, brook and river
lampreys as no records for them in the
Project site.
12.9.7.3 Lamprey species
There are three species of lamprey present in the UK which are designated for protection as Annex II species. Brook
lamprey are non migratory freshwater species and therefore do not occur in the Project site (JNCC, 2016a). River lamprey
occurs in coastal waters, estuaries and accessible rivers. The closest river with a protected population of river lamprey is
River Tweed, 365km to the south of the Project site as detailed in Table 12.14 and Figure 12.4 (JNCC, 2016b). The sea
lamprey is the largest of the lampreys and occurs in estuaries and easily accessible rivers over much of the Atlantic coast.
The closest site designation for the sea lamprey is River Spey, 120km to the south of the Project site (Table 12.14 and
Figure 12.4). The river lamprey and the sea lamprey are not known to occur in the Project site (NBN Gateway, 2016). As
none of the lamprey species are likely to occur in the Project site as a result of the incompatible habitat they have been
scoped out of the impact assessment.
12.9.8 Summary
Based on information presented in the previous section the following fish species have been identified as requiring further
consideration as part of the impact assessment:
Atlantic salmon and sea trout and European eel (including migration through the proposed Project site);
Spawning grounds for lemon sole, sandeel and sprat;
Nursery grounds for anglerfish, blue whiting, herring, lemon sole, tope shark, spurdog, spotted ray, common skate,
cod, hake, ling, saithe, whiting and mackerel;

Environmental Statement
Brims Tidal Array
Page 127 of 316
Atlantic cod and herring (including migration through the proposed Project site);
Sandeels; and
Spiny lobster.
Commercially important species including scallops and velvet swimming crab are covered in Chapter 16 Commercial
Fisheries. Indirect effects on freshwater pearl mussel are discussed in Section 12.9.7.2
12.10 POTENTIAL IMPACTS
The following impacts have been established through scoping and the consultation process as requiring assessment as
part of the EIA:
12.10.1 Construction and Installation
Substratum loss;
Smothering; and
Effects of noise and vibration.
12.10.2 Operation and Maintenance
Smothering;
Electro Magnetic Fields (EMF);
Collision risk (turbines);
Changes to available habitat;
Barrier to movement; and
Effects of noise and vibration.
12.10.3 Decommissioning
Smothering; and
Effects of noise and vibration.
12.11 MITIGATION MEASURES
12.11.1 Project Design and General Mitigation Measures
All Project Design Mitigation and General Mitigation measures are set out in Chapter 5 Project Description, Table 5.15 and
Table 5.16 respectively. These are standard practice measures based on specific legislation, regulations, standards,
guidance and recognised industry good practice that are put in place to ensure significant impacts do not occur.
12.11.2 Specific Mitigation
No mitigation measures will be implemented specifically to minimise the impacts on fish ecology over and above those
already outlined in project design or general mitigation.

Environmental Statement
Brims Tidal Array
Page 128 of 316
12.12 RESIDUAL EFFECTS
12.12.1 Construction and Installation
12.12.1.1 Substratum Loss
Spawning Grounds
Lemon sole and sandeel have been identified as potentially having spawning grounds within the Project site. These are
demersal spawners (laying eggs on the seabed) and therefore are sensitive to substratum loss. Sprat is also known to
spawn in the area. However being a pelagic spawner (i.e. produces pelagic eggs that remain within the water column),
substratum loss in relation to spawning grounds is not relevant to this species.
The assessment has been based on the worst case scenario whereby 200 devices are secured by the flat bottomed gravity
base TSS. This would result in a direct habitat loss and potential loss of up to 0.24km2 (approximately 2% of the AfL) of
suitable spawning ground for lemon sole and sandeel. However, spawning grounds for these species are known to extend
around the Scottish north coast into the North Sea and into the Atlantic Ocean around Ireland, therefore any loss is unlikely
to result in a significant reduction of fish populations.
Lemon sole have a longer spawning window than sandeel so there may be some overlap with the installation phase but
as detailed above, no significant impact is expected.
The sensitivity of the receptor (lemon sole) has been assessed as low given they are of low commercial and ecological
value but vulnerable to the impacts in question; however, as spawning grounds for these species extend around much of
the north coast of Scotland and beyond, the residual magnitude of the impact has been assessed as negligible. No
significant impact is considered likely as a result of substratum loss under the worst case scenario for development.
Nursery Grounds
The AfL and cable route corridors overlap with high intensity nursery grounds for anglerfish, blue whiting and low intensity
grounds for herring, lemon sole, topeshark, spurdog, spotted ray, common skate, cod, hake, ling, saithe, whiting and
mackerel. Juvenile stocks of fish are considered to be less sensitive to loss of habitat than spawning fish due to their
increased adaptability and tolerance by way of their mobile nature. Although the AfL compromises part of the main nursery
ground for anglerfish and blue whiting, the area impacted is extremely small relative to the extent of the main nursery
ground which stretches from the Atlantic Ocean south west of Ireland, north to Iceland and east into the northern North
Sea towards Norway.
In comparison, shellfish are much less mobile some spending most of their time half buried in the sediment but have also
been considered to have low sensitivity to physical disturbance based on the fact that even if high numbers of individuals
are impacted as a result of direct habitat loss the whole local population is unlikely to be affected due to their widespread
nature within the wider geographical context. Therefore, any loss would likely recover quickly on cessation of disturbance.
Evidence suggests that the introduction of artificial structures or introduction of new substrate can enhance local
populations of some species. New habitats may enhance nursery grounds for species where habitat has been lost as a
result of the installation phase. The assessment of introduced substrata is discussed further in Section 12.12.2.4.
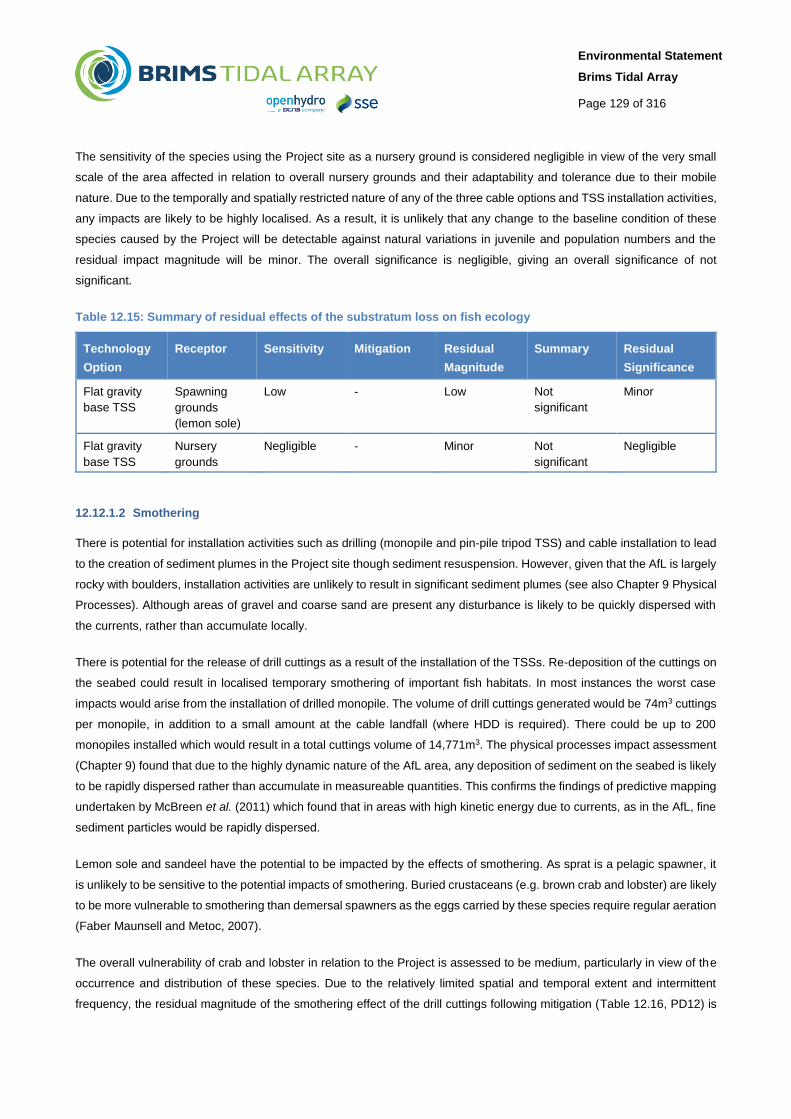
Environmental Statement
Brims Tidal Array
Page 129 of 316
The sensitivity of the species using the Project site as a nursery ground is considered negligible in view of the very small
scale of the area affected in relation to overall nursery grounds and their adaptability and tolerance due to their mobile
nature. Due to the temporally and spatially restricted nature of any of the three cable options and TSS installation activities,
any impacts are likely to be highly localised. As a result, it is unlikely that any change to the baseline condition of these
species caused by the Project will be detectable against natural variations in juvenile and population numbers and the
residual impact magnitude will be minor. The overall significance is negligible, giving an overall significance of not
significant.
Table 12.15: Summary of residual effects of the substratum loss on fish ecology
Technology
Option
Receptor Sensitivity Mitigation Residual
Magnitude
Summary Residual
Significance
Flat gravity
base TSS
Spawning
grounds
(lemon sole)
Low - Low Not
significant
Minor
Flat gravity
base TSS
Nursery
grounds
Negligible - Minor Not
significant
Negligible
12.12.1.2 Smothering
There is potential for installation activities such as drilling (monopile and pin-pile tripod TSS) and cable installation to lead
to the creation of sediment plumes in the Project site though sediment resuspension. However, given that the AfL is largely
rocky with boulders, installation activities are unlikely to result in significant sediment plumes (see also Chapter 9 Physical
Processes). Although areas of gravel and coarse sand are present any disturbance is likely to be quickly dispersed with
the currents, rather than accumulate locally.
There is potential for the release of drill cuttings as a result of the installation of the TSSs. Re-deposition of the cuttings on
the seabed could result in localised temporary smothering of important fish habitats. In most instances the worst case
impacts would arise from the installation of drilled monopile. The volume of drill cuttings generated would be 74m3 cuttings
per monopile, in addition to a small amount at the cable landfall (where HDD is required). There could be up to 200
monopiles installed which would result in a total cuttings volume of 14,771m3. The physical processes impact assessment
(Chapter 9) found that due to the highly dynamic nature of the AfL area, any deposition of sediment on the seabed is likely
to be rapidly dispersed rather than accumulate in measureable quantities. This confirms the findings of predictive mapping
undertaken by McBreen et al. (2011) which found that in areas with high kinetic energy due to currents, as in the AfL, fine
sediment particles would be rapidly dispersed.
Lemon sole and sandeel have the potential to be impacted by the effects of smothering. As sprat is a pelagic spawner, it
is unlikely to be sensitive to the potential impacts of smothering. Buried crustaceans (e.g. brown crab and lobster) are likely
to be more vulnerable to smothering than demersal spawners as the eggs carried by these species require regular aeration
(Faber Maunsell and Metoc, 2007).
The overall vulnerability of crab and lobster in relation to the Project is assessed to be medium, particularly in view of the
occurrence and distribution of these species. Due to the relatively limited spatial and temporal extent and intermittent
frequency, the residual magnitude of the smothering effect of the drill cuttings following mitigation (Table 12.16, PD12) is

Environmental Statement
Brims Tidal Array
Page 130 of 316
assessed as being negligible. Considering this medium sensitivity and negligible magnitude, the overall impact of increased
smothering is predicted to be of minor significance and overall not significant.
The impacts on sediment dynamics is covered further in Chapter 9 Physical Processes.
Table 12.16: Summary of residual effects of the smothering on fish ecology
Technology
Option
Receptor Sensitivity Mitigation Residual
Magnitude
Summary Residual
Significance
Drilled
monopile TSS
Lemon sole,
sandeel, crab
and lobster
Medium PD12 Negligible Not
significant
Minor
12.12.1.3 Effects of Noise and Vibration
The potential impact of underwater noise on fish populations within the proposed Project site and cable route is associated
with installation activities including piling and use of other specialist equipment, and vessels involved in the installation of
the export cable (trenching and protection). Many marine animals use sound during their everyday lives to track prey, avoid
predators, navigate, and communicate with one another (e.g. Hawkins and Myrberg, 1983). Even species that do not
communicate by sound use the acoustic scene (or soundscape) to learn about and exploit their environment (Fay and
Popper, 2000). Therefore, anything in the environment that may result in interference with the ability of a fish to detect and
use sounds of biological relevance, could have a substantial impact on its fitness and survival.
An underwater noise technical assessment was undertaken by (Supporting Document: Xodus, 2015) to provide an
overview of the potential impacts on fish from noise produced during construction and installation. The report detailed the
criteria for injury and behavioural responses of fish and has been used to inform this assessment. The criteria, largely
based on the Acoustical Society of America guidelines (Popper et al. 2014) are qualitative so have been supplemented
where necessary by other references. The report also provides predictions of potential injury and disturbance zones from
installation and operational phases of the Project. A full and detailed explanation of the methodology used is provided in
the underwater noise technical report (Supporting Document: Xodus, 2015).
In setting sound exposure criteria there are a number of scientific options. It has been commonplace in the past to specify
those sound levels that result in injury to animals, especially if these are likely to result in death. However, with regards to
fish, on the basis that adult fish are generally able to vacate the area and avoid physical injury, it is the effects of noise on
behaviour that are considered most relevant in terms of effects upon populations (Popper et al. 2014). Impacts on behaviour
can occur at much greater distances from the source than sound levels that can do physical harm, and they almost always
involve a lower onset threshold than tissue injury or damage to the auditory system. Significant changes in behaviour might
include abandonment of spawning behaviour or spawning sites, movement away from preferred habitats, disruption of
feeding, increased energy consumption, and diversion or delay of migrations.

Environmental Statement
Brims Tidal Array
Page 131 of 316
Lethal/Injury Effects from Noise
Interim criteria for the onset of tissue damage due to sound exposure have been recently published by the Acoustical
Society of America (Popper et. al., 2014). From this, and together with the marine noise assessment carried out to inform
this assessment which used very worst case scenario levels (200 turbines, double the output) (Supporting Document:
Xodus, 2015) it is concluded unlikely that fish mortality will occur as a direct result of noise from the Project. This is on the
basis that, although the potential zone of injury for fish with swim bladders (most sensitive to noise) is up to 10m for even
the largest construction vessel, fish would require 48 hour exposure to continuous noise for the onset of non-recoverable
injury to occur. This is highly unlikely given that most adult and juvenile fish are mobile and hence will be able to move
away from the localised areas where lethal and injury effects could occur.
Although eggs and larvae are less mobile and are likely to be exposed to noise, their sensitivity is considered low. Lethal
injuries are only likely to occur when they are in the immediate vicinity of the highest source of high energy sound such as
blasting or percussion piling, neither of which are under consideration for this Project. The main source of noise for this
Project is noise from large construction vessels or cable lay vessels. Noise from these vessels is unlikely to result in any
lethal injury to eggs or larvae even if they are present within the immediate vicinity of the vessel. The residual magnitude
of impact following mitigation (Table 12.17, PD13) is therefore considered negligible given the low potential for lethal injury
to occur due to the low level and temporary nature of potential noise sources. The overall significance is negligible, giving
an overall significance of not significant.
Behavioural Response from Noise
Although there is unlikely to be fish mortality during installation, there is potential for noise from construction vessels to
lead to behavioural avoidance. Avoidance behaviours will vary in significance depending on the resulting outcome of the
behaviour. For example, it may be significant if it causes a migratory species to be held up or prevented from reaching
areas of biological importance, e.g. spawning and feeding areas, migratory routes. In other cases, the movement of species
from one area to another may be of no consequence other than a possible increase in energetic expenditure for the fish.
The construction and installation phase may result in the exclusion of adult sprat from certain areas which could have
adverse effects on populations by reducing access to suitable spawning habitats. However, none of the notable species
detailed in Section 12.9.3 and 12.9.4 spawn exclusively in the Project site and suitable spawning grounds for each species
extend around much of the Scottish north coast, Atlantic Ocean and around the coast of Ireland. Therefore, only a small
proportion of the spawning stock will be affected and will therefore not significantly affect the adult sprat population during
construction.
As detailed in Section 12.12.1.1 (nursery grounds), the Project site overlaps with low intensity grounds for lemon sole and
cod. Juvenile stocks of fish are considered to be less sensitive than spawning stages to noise avoidance behaviours in
terms of their adaptability and tolerance by way of their mobile nature. Furthermore, based on their extensive occurrence
within the wider geographic context any potential disturbance to these areas as a consequence of construction operations
is not predicted to have a significant impact on future local fish populations.
Migratory diadromous fish species including salmon and sea trout are considered to be of medium sensitivity given their
lack of pressure receptors in the ear and the conservation status of salmon. They also exhibit strong and significant
avoidance behaviour to noise emissions particularly in tidal streams, such as the area of the Project.

Environmental Statement
Brims Tidal Array
Page 132 of 316
The Project specific underwater noise assessment was undertaken using a very worst case scenario (Supporting
Document: Xodus, 2015) and found that the potential zone of disturbance as a result of installation would be 185m based
on the noise from larger construction and installation vessels. Whilst the overall sensitivity of fish species to underwater
noise disturbance is considered to be medium, due to the small areas of effect around the installation activities, and the
temporarily and spatially restricted nature of the cable and TSS installation activities, the residual magnitude is considered
to be negligible (Table 12.17, PD13). The level of impact is therefore assessed to be negligible and not significant.
Table 12.17: Summary of residual effects of noise and vibration on fish ecology
Technology
Option
Receptor Sensitivity Mitigation Residual
Magnitude
Summary Residual
Significance
All options -
construction
vessels or cable
lay vessels
Lethal/injury
effects from
noise
Low PD13 Negligible Not
significant
Negligible
All options -
construction
vessels
Behavioural
response
from noise
Medium PD13 Negligible Not
significant
Minor
12.12.2 Impacts during Operation and Maintenance
12.12.2.1 Smothering
The impact from smothering during operation and maintenance is not considered to exceed that for the construction and
installation phase (see Section 12.12.1.2).
12.12.2.2 Electro Magnetic Fields (EMF)
Electromagnetic (EMF) field emissions are generated from the transmission of electricity through cables, such as the AC
inter-array and AC export cables proposed for this Project. The cables produce electromagnetic fields which have both
electric components (E) measured in volts per metre (V/m) detected by species at distances greater than 30cm, and
magnetic components (B) measured in tesla (T) which reduce to background levels beyond 20m from the source (Gill et
al. 2005) The direct electric field is mostly blocked with the use of conductive sheathing and therefore the magnetic field
and the resultant induced electric field are emitted into the marine environment. Impacts on ecology as a result of EMFs
are unknown but it has been suggested that they may be detected by marine organisms (Inger et al. 2009). Current
understanding in the literature suggests that the magnitude of impact on fish behaviour due to the effects of EMF as a
result of subsea cables will be closely related to the proximity of the animal to the source of the EMF.
Vision is generally limited by both limited light availability and turbidity in the underwater environment, therefore other
senses such as hearing, chemoreception and electroreception are used by animals to interpret their surroundings. Some
animals rely on natural magnetic fields for orientation or navigation and some animals may be electro-sensitive to facilitate
detection of predators/prey or for social or reproductive behaviours. Thus the introduction of anthropogenic EMFs
associated with offshore cabling may interfere with these natural behaviours.
Elasmobranchs are ten thousand times more electrosensitive than most teleost fish detecting B fields far weaker than the
earth’s magnetic field. They use their electroreceptors to detect bioelectric fields produced by their natural prey and as a

Environmental Statement
Brims Tidal Array
Page 133 of 316
result are particular sensitivity to anthropogenic sources of EMF. Gill and Taylor (2001) found that spurdog (a critically
endangered species likely to occur within the Project site) avoided electrical fields at 10μV/cm. Studies involving the spiny
lobster Panulirus argus have demonstrated they use a magnetic map for navigation (Boles and Lohmann, 2003). However,
it is uncertain if other crustaceans including commercially important lobster and edible crab are able to respond to magnetic
fields in this way.
A study published in 2011 supporting an increasing body of evidence found that marine vertebrates and invertebrates can
sense the earth’s magnetic field and can use this information for orientation, navigation and sourcing rich prey patches
(Normandeau et al. 2011). Potential impacts from development may arise where anthropogenic electric fields can attract
and disorientate animals reducing foraging time and therefore daily energy intake (Normandeau et al. 2011). Species
monitoring at the Robin Rigg Wind Farm observed no significant difference in the distribution of electrosensitive species
along the export cable corridor after two years of monitoring, however it was noted that the survey station may be too far
from the corridor to observe an effect (Malcolm et al. 2013). The vulnerability of migratory fish to the barrier effects of EMF
are assessed in Section 12.12.2.5.
Cable burial is commonly recommended to increase the distance between the cable and the electro-sensitive species
(Gill et al. 2005) and DECC recommends that cables be buried to at least 1.5m, depending on the suitability of the
substrates (DECC, 2011). For much of the Project site, burial of the inter-array and export cables is not an option due to
the nature of the seabed (hard bedrock with cobbles and boulders) therefore cable protection will be used to provide
mechanical protection and secure the cables in place to avoid movement (Table 12.18, PD09). The use of these methods
will also increase the distance between marine species sensitive to EMF and the EMF source.
At a worst case the inter-array cabling will occupy 0.36km2 of the total AfL area (approximately 3%). There will also be a
maximum of 6.5km of export cable linking the tidal array to shore (Aith Hope). The maximum transmission voltage of the
cables will be potentially up to 132kV . Therefore with the inclusion of the cable protection measures described above it is
expected that any magnetic field from the cables will be 1.6μT well below that of the Earth’s magnetic field which is between
30 and 70μT and is therefore not likely to be detectable by the fish species that are present in the area as they move across
the cables (Scottish Executive, 2007; CMACS, 2005).
For the purpose of the assessment of EMF impacts, elasmobranchs are considered to be most sensitive to EMF due to
the reliance on electric fields for a number of fundamental behaviours and are therefore assessed as being of medium
sensitivity. However, the residual magnitude of impact is considered negligible based on the highly localised nature of
potential impacts due to rapid attenuation of EMF with distance coupled with the small footprint of the Project. The overall
significance is negligible, giving an overall significance of not significant.

Environmental Statement
Brims Tidal Array
Page 134 of 316
Table 12.18: Summary of residual effects of EMF on fish ecology
Technology
Option
Receptor Sensitivity Mitigation Residual
Magnitude
Summary Residual
Significance
All options –
inter-array
and export
cables
Elasmobranchs Medium PD09 Negligible Not
significant
Minor
12.12.2.3 Collision Risk (Turbines)
Potential interactions between marine wildlife and operating turbines are still not fully understood. In relation to migratory
fish, a number of studies have been carried out to investigate the potential risk of collision between fish and marine
renewable energy technologies. These include studies by Wilson et al. (2007) as part of the Scottish Marine Renewables
SEA, ABPmer (2010) as part of the Marine Renewable Energy Strategic Framework for Wales (MRESF) and encounter
modelling carried out by Xodus as part of the MeyGen Tidal Array EIA (Xodus, 2011). CRM was carried out for the Project
using the draft model developed by SNH (SNH, 2015) which determines the collision risk associated with Atlantic salmon
and the tidal turbines under differing levels of avoidance (Xodus Group, 2016).
The studies by Wilson et al. (2007) and ABPmer (2010) focused on understanding fish avoidance reactions to operational
tidal turbines. It was found that structures in the water column tend to attract fish and their predators similar to the behaviour
found with regards to the deployment of ‘Fish Aggregation Devices’ (FAD) used in numerous countries to aid fishing (Wilson
et al. 2007; Food and Agricultural Organisation (FAO), 2014). However, for certain species, noise generated by operational
devices can have the opposite effect, eliciting an avoidance response (ABPmer, 2010). The extent to which this avoidance
response occurs depends on the hearing sensitivity of different fish species to noise. For example in hearing sensitive fish
(e.g. herring) analysis suggests that they may be able to detect and avoid individual operational tidal stream devices at
distances between 120 and 300m (depending on the depth of water) even when background noise levels are comparatively
high. However, for hearing insensitive fish (e.g. sharks and mackerel), the Projected source noise levels of tidal devices
are likely to be below levels at which these species might exhibit an avoidance reaction.
The extent to which fish might exhibit close range evasion of tidal turbines depends on a number of factors including:
Device design – e.g. shape, size, colour and position in water column;
Environmental conditions e.g. turbidity and flow rate; and
Fish characteristics - visual acuity, maximum swimming speeds, body size, social behaviour (e.g. schooling), foraging
tactics, curiosity, habitat use, underwater agility, sensory capabilities, age and experience.
Broadhurst et al. (2014) recently published a paper documenting the findings from an observational pilot study conducted
within the European Marine Energy Centre (EMEC) looking at interactions between fish and an operational tidal device.
The study used video footage and ADCP survey techniques to examine presence of fish and velocity flow rates within the
vicinity of a deployed tidal energy device. Results from the pilot trials which were carried out over two 15 day periods in
summer 2009 and 2010 observed fish (Pollock) aggregating in shoals temporarily round the deployed device with a larger
abundance in 2009 than 2010. The abundance of fish (Pollock) was significantly associated to velocity rate for both trial
years. There was increased abundance related to a reduction in velocity rate for both years, with shoals potentially using

Environmental Statement
Brims Tidal Array
Page 135 of 316
the device for temporary protection or feeding strategies. Responses to tidal velocity also differed between years. No other
species were identified from the surveys.
In order to inform the collision risk impact assessment collision modelling using the draft SNH collision risk model was
carried out. A 10 year average of the Atlantic salmon population around Scotland was used for numbers of adult salmon
(ICES, 2015b). It also utilised analysis carried out for the MeyGen Tidal Array for the likely number of smolts passing
through the Pentland Firth (Xodus Group, 2012; Xodus Group 2016). The model utilised Atlantic salmon population
alongside turbine parameters and channel depth and width to assess the likely collision risk. Full details of the modelled
Scenarios (including input data) are available in the modelling report (Xodus, 2016 on supporting documents DVD). The
worst case scenario involved the 10 bladed turbine which resulted in the greatest collision risk to Atlantic salmon. This
option concluded that 32 smolts, 3 1SW and 2 MSW Atlantic salmon would potentially collide with the tidal array per year
during Phase I. Once Phase II was deployed 211 smolts, 17 1SW and 15 MSW Atlantic salmon would potentially collide
with the tidal array per year. This represents 0.007%, of the annual number of grilse and adult fish passing through the
Pentland Firth and 0.003% of the smolts (Xodus Group, 2016). This is a very small proportion of the total Scottish salmon
population and is unlikely to have significant effects on the Atlantic salmon population.
These modelling results and the overall conclusion that impacts on Atlantic salmon will not be significant are in line with
the results found for the MeyGen development
With regard to the Project, each turbine will have a minimum clearance from the blade tip to the seabed of 4m and therefore
it is expected that demersal and benthic species will pass under the device without encountering the device. In addition
the turbines will have a minimum clearance of 30m from the blade tip to the sea surface, and species such as Atlantic
salmon, are likely to pass over the structures (impacts on basking shark are covered in Chapter 13 Marine Mammals)
(Table 12.19, PD04). As a result it is generally considered that pelagic and bentho-pelagic fish will be the most likely to be
at risk of collisions with operational turbines as their diurnal vertical migration behaviours forces them to occupy all depths
of the water column at some time during the day or night (Faber Maunsell and METOC, 2007).
Given the conservation status of Atlantic salmon combined with other pelagic and bentho-pelagic species that may be
present in the Project site including cod and sea trout, for the purpose of assessing this impact species are assessed as
medium sensitivity. However, as the AfL covers a relatively small area footprint of the Pentland Firth (11.1km2) and based
on findings of modelling undertake to estimate encounter and collision risk, the proportion of any fish population passing
through/present in the area that will potentially be affected is likely to be imperceptible, the residual magnitude of the impact
is therefore considered to be negligible. The overall significance is minor, and the impact is not significant.
Table 12.19: Summary of residual effects of collision risk (turbines) on fish ecology
Technology
Option
Receptor Sensitivity Mitigation Residual
Magnitude
Summary Residual
Significance
Operational
turbines
Pelagic and bentho-
pelagic species
including Atlantic
salmon
Medium PD04 Negligible Not
significant
Minor

Environmental Statement
Brims Tidal Array
Page 136 of 316
12.12.2.4 Changes to Available Habitat
Potential impacts on fish species in relation to the change of habitats as a result of habitat loss is covered in Section
12.12.1.1.
As mentioned in Section 12.12.2.3, tidal turbines can act as FADs resulting in a positive effect on fish populations through
fish stock recovery should certain types of fisheries be excluded from operating within the AfL. As the substrate within the
two cable route options, is unlikely to be suitable for cable burial, the introduction of novel substrata including rockdump
and concrete mattresses may be colonised by various marine organisms. Of particular concern is the colonisation of
Invasive Non-Native Species which can attach to the devices, which may offset any benefit of increasing productivity.
Commercially important species such as crab, lobster and PMF species such as the spiny lobster as well as other demersal
species are likely to utilise the artificial reefs created by the cable protection. This has been observed at wind farms off the
south eastern coast of Sweden (Wilhelmsson et al. 2006). Colonisation by fauna on the structures could result in an
increase in food availability and the physical structures of the foundations may attract some fish species as they could
provide protection against predation or the prevalent current and thus save fish energy (OSPAR, 2004).
Evidence of colonisation of tidal turbine structures and areas within a tidal array was recently reported by Broadhurst and
Orme (2014). An examination of species biodiversity, composition and habitat type was carried out surrounding a tidal
energy device installed at the EMEC test site, Orkney. Using commercial fishing and towed video camera techniques over
three temporal periods from 2009 to 2010, the examination found increased species diversity and compositional differences
within the device site compared to a control site. Both sites largely comprised crustacean species, omnivore and predatory
feeding regimes and marine tide swept EUNIS habitat types which varied over time. The study concluded that the device
could act as a localised artificial reef structure, but that further investigations are required (Broadhurst and Orme, 2014).
Artificial refuges created by cable protection or tidal devices, potentially increases localised foraging resources that
congregate around the devices which could result in increased productivity (Table 12.20, PD10). Post monitoring studies
at offshore windfarms have found that fish faunal diversity increases post construction (Leonhard & Pedersen, 2004).
However, increases in shellfish populations are expected to be imperceptible in the context of the wider population.
The sensitivity of the receptor is considered to be low to medium dependent upon the species concerned. The residual
magnitude of the impact is expected to be minor (positive) on the basis that while there is potential for the colonisation of
turbine structures, the likelihood that this will lead to significant increases in shellfish populations is considered to be low.
The significance is minor (positive), with an overall positive significance.
Table 12.20: Summary of residual effects of the changes to available habitat on fish ecology
Technology
Option
Receptor Sensitivity Mitigation Residual
Magnitude
Summary Residual
Significance
All options Shellfish
populations
Low-Medium PD10 Positive
(minor)
Positive Positive
(minor)

Environmental Statement
Brims Tidal Array
Page 137 of 316
12.12.2.5 Barrier to Movement
Arrays of tidal turbines have the potential to form a physical and/or noise barrier in the water column which could hinder
usual migration or transit patterns of marine, elasmobranch and diadromous fish species. Some fish species such as cod
utilise the energy from tidal streams to conserve energy during transit and therefore it is important to consider the potential
for the Project to form a barrier and assess the impact this may have on fish populations in the area.
Table 12.21 presents the maximum proportion of the total cross sectional area of the Pentland Firth that would be taken
up by the tidal array therefore resulting in a potential barrier to movement of migratory or transiting fish. The area occupied
by the array assumes a maximum total swept area per turbine of 415m2 and total swept area for the array of 6,225m2
based on a maximum of 15 turbines per row (on a north to south alignment). Overall the tidal array is expected to occupy
at most approximately 0.9% of the total available cross sectional area within the Pentland Firth.
Table 12.21: Percentage area of Pentland Firth taken up by the tidal array
Swept area of one
turbine
Maximum swept area of
the tidal array
Approximate area of the
Pentland Firth*
% of Pentland Firth taken
up by the tidal array
415m2 6,225m2 657,585m2 0.9%
*Area of the Pentland Firth taken from Brims Ness, Hoy to Tang Head, Caithness
Atlantic Salmon, Sea Trout and European Eel
There is limited information on the movement of sea trout. For the purpose of this assessment potential impacts on sea
trout are considered in context of potential impacts on Atlantic salmon.
Due to physical presence of turbines, noise and EMF, the Project has the potential to act as a barrier for post-smolt
migrating salmon as the move to offshore feeding grounds and return as adults to their natal rivers to breed. However, the
behaviour of salmon during the coastal phase of their migrations has been relatively sparsely documented (Guerin et al.
2014, Thorstad et al. 2012, Malcolm et al. 2010).
Post-Smolt Migration
It is thought that salmon post-smolts will use near-shore areas at the commencement of migration, but their initial
dependence on near- and off-shore areas is currently unclear (Malcolm et al. 2010). Recent studies by Godfrey et al.
(2014a, b) found that migrations through the Pentland Firth did not follow a prescribed route and studies by Thorstad et al.
(2004) tracked hatchery-reared smolts in Norway. The post-smolt migrations were not strictly linked to the coast, with pop-
up locations up to 100km offshore. Thorstad et al. (2007) also investigated potential differences in migratory behaviour of
hatchery-reared and wild salmon smolts. Both types of salmon were found to utilise the full width of the fjord, further
suggesting they are not reliant on the near-shore waters. Lacroix et al. (2005) found that fish tended to travel near to the
coast when investigating the early marine migration of wild and hatchery reared Atlantic salmon post-smolts in the Bay of
Fundy on the east coast of Canada.
Available evidence suggests that post-smolt salmon utilise water ranging from relatively close to shore up to several km
offshore. The Brims AfL area, which lies between 0.3km and 2.5km off the coast, is not likely to present a significant barrier
to movement of migratory salmon. Studies on the depth distribution of post-smolts migrating to the open sea suggest they
tend to stay very close to surface, where they would not be affected by the tidal turbines. For example, Davidsen et al.

Environmental Statement
Brims Tidal Array
Page 138 of 316
(2008) tracked Atlantic salmon post-smolts, and recorded swimming depths ranged between 0 and 6.5m. Similarly,
Plantalech Manel-La et al. (2009) tagged salmon smolts and determined that the mean swimming depth was 1.7m, with
regular vertical movements to a maximum depth of 5.6m. More recently, Godfrey et al. (2014) reports the median proportion
of time spent in the upper 5m was 80.4%.
Adult Salmon Migration
As is the case for post-smolts, there is wide variability in the distribution of adult salmon during their migratory movements,
and the Project is unlikely to represent a significant barrier. Studies have shown that adult salmon do not return from open
water directly to their natal river, but head for their coast of origin and then track along the coast using a composite of
environmental cues until they locate their destination (Guerin et al. 2014). The findings from Guerin et al. (2014) suggested
that fish returning to rivers on the east coast of mainland Scotland are more likely to follow the coast of Caithness rather
than the southern extent of Orkney where the tidal array is proposed. Hawkins et al. (1979) tagged six grilse off the coast
of Scotland at Rockhall near Montrose in 1978 and found that they tracked close to shore once close to their natal river.
Conversely, six fish tagged from coastal nets in 1979 by Smith et al. (1981) found that they primarily travelled at distances
of up to 17km offshore.
In addition, studies have shown that adult salmon spend the majority of their time at the sea surface, although in contrast
with post-smolts, this is punctuated by deep dives of up to 280m, a behaviour which persists late into the migration on
return to home waters (Malcolm et al. 2010). Starlaugsson (1995) tagged 60 salmon returning to the coast of Iceland and
determined that most of their time was spent within 4m of the surface, although frequent diving between 10 and 123m was
observed. Similarly, Holm et al. (2005) tagged fish in the Norwegian Sea, and found that they generally resided within 5 –
10m of the surface. The minimum clearance of blades and the sea surface at LAT is anticipated to be between 30m.
The Project is unlikely to represent a significant barrier to the movement of migratory salmon as the array is only occupying
a small area of the available space. In addition, depth distribution during migration suggests that adults and post-smolts
would be likely to pass over the Project without encountering any obstacles particularly for turbines situated at the lower
depths. Adults may be at slightly more risk of collision as they intermittently dive to depths that would put them within the
swept area of the turbines. The CRM carried out for the project incorporates Atlantic salmon swim depths and highlights
the low likelihood of the Project being a barrier to the movement of migrating fish, either adults (or smolts) (Xodus Group,
2016).
EMF
Adult Atlantic salmon, sea trout and European eel have been found to use the earth’s magnetic field for orientation and
direction during migrations. Responses to the earth’s magnetic field have also been found in juvenile sea trout (Gill and
Bartlett, 2010). It has also been suggested that salmonids or eels are neither attracted nor repulsed by anthropogenic EMF
in shallower waters (<20m) despite occasional change in swimming direction during migration (Gill and Bartlett, 2010).
Given that salmon, sea trout and European eel appear to only have medium sensitivity to EMF and that with the inclusion
of cable protection measures, the magnetic field from the cables (export and inter-array) will be below that of the Earth’s
magnetic field (Section 12.12.2.2), it is likely that the cables will not be detected by any salmon passing through the area,
especially given the relatively small footprint of the Project site. Potential impacts on salmon, sea trout and European eel
in terms of barriers to movement due to EMF from inter-array and export cables are expected to be negligible and not
significant.

Environmental Statement
Brims Tidal Array
Page 139 of 316
Noise
As discussed in Section 12.12.1.3, salmon are unlikely to be able to detect the array at long distances and as the expected
noise emissions from the turbines is expected to be low, it is possible that detection will only occur within 1m from the
array. Noise from the array is therefore unlikely to affect movement of salmon through other parts of the Pentland Firth.
Other Fish Species
Maturing cod may be impacted by potential physical barriers given that they use tidal streams for migrating between feeding
and spawning grounds: fish leave the seabed at slack water and remain off the bottom for most of the ensuing tide, whilst
spent fish use the opposing tidal stream to return to their feeding grounds.
Assessment
Atlantic salmon are considered to be the most sensitive species to the potential barrier effect which may be created by the
Project due to their migratory movements through the Pentland Firth to and from the north and east coasts of Scotland.
Migrating cod are also considered to be sensitive due to their use of tidal streams for migrating between feeding and
spawning grounds and due to their conservation concern status (Section 12.9.4). However, the Project site lies outside the
spawning ground for cod and is in a low intensity nursery area and has therefore been assessed as being of medium
sensitivity. The residual magnitude of impact is considered to be negligible based on the localised nature of potential
impacts and that 99.1% of the total cross sectional area of the Pentland Firth will not be taken up by the tidal array (Table
12.22, PD06). The overall significance is minor, giving an overall significance of not significant.
Table 12.22: Summary of residual effects of barrier to movement on fish ecology
Technology
Option
Receptor Sensitivity Mitigation Residual
Magnitude
Summary Residual
Significance
All options Atlantic
salmon
Medium PD06 Negligible Not
significant
Minor
12.12.2.6 Effects of Noise and Vibration
As detailed in Section 12.12.2.5 and 12.12.2.6, impacts of underwater noise on fish can result in injury, death or
disturbance. The assessment for noise impacts on fish followed the ASA guidelines (Popper et al. 2014) criterion of 170
decibels (dB) re 1µPa (rms) over a 48 hour period for 200 2.2MW turbines. The assessment found that no fish, even those
species whose swim bladders are involved in hearing, would experience injury as a result of exposure to the noise from
the turbines.
Whilst the sensitivity of the receptor is medium, the magnitude of impact remains negligible as does the significance. The
impact of noise induced injury on fish is therefore not significant.
The impact of potential disturbance to fish as a result of operational turbines and maintenance vessels was calculated
using noise levels of 150 dB re 1µPa (rms) over a 48 hour period, as laid out in criteria defined by the WSDOT. (WSDOT,
2011). The assessment found that no disturbance is anticipated for any fish species, even the most sensitive. Cod are
most sensitive to noise because of the connection of the swim bladder to the ear. The underwater noise impact assessment
(Supporting Document: Xodus, 2015) found that no behavioural disturbance is anticipated for any fish species, even the
most sensitive as maintenance vessels are much smaller than installation vessels therefore underwater noise is much

Environmental Statement
Brims Tidal Array
Page 140 of 316
lower. The sensitivity of the receptor is medium; the residual magnitude of impact after mitigation (Table 12.23, PD11) is
negligible. Therefore, the impact of noise resulting in disturbance of fish is therefore not significant.
Table 12.23: Summary of residual effects of the effects of noise and vibration on fish ecology
Technology
Option
Receptor Sensitivity Mitigation Residual
Magnitude
Summary Residual
Significance
All options –
inter-array and
export cables
Noise induced
injury
Medium PD11 Negligible Not significant Negligible
All options –
inter-array and
export cables
Disturbance
of fish
Medium PD11 Negligible Not significant Negligible
12.12.3 Impacts during Decommissioning
Impacts during decommissioning are likely to be the same or less than those identified for installation. There will potentially
be noise generated during the removal of the TSSs and turbines from vessels and potential cutting of piled structures.
However, these noise levels will be similar to those identified during installation. There will also be temporary habitat
disturbance during decommissioning. However, once the TSSs and turbines are removed, these habitats will be re-
established.
12.13 ACCIDENTAL AND UNPLANNED EVENTS
During all phases of the Project, there is the potential for accidental release of contaminants as a result of collision of
vessels, storm damage or device failure. The discussion around this impact considers the worst case scenario: the potential
impacts associated with large scale release of fuel inventory from an installation vessel. Smaller inventories of polluting
substances may potentially be released during the course of the Project, but it is considered that these substances will not
induce a toxic response in fish but rather insidious contaminant effects associated with the bioaccumulation of small
amounts over a long period of time.
Construction vessels to be used during the installation phase are likely to have an oil inventory in the region of between
6,000,000 and 8,000,000 litres of marine diesel in a number of separate tanks. The worst case scenario for assessing
accidental spillages of fuel from vessels is assumed to be the leakage of one tank (approximately 600,000 litres of marine
diesel) into the marine environment.
As oil spills can have a number of environmental impacts the actual effects will vary depending on a wide range of factors
including the volume and type of oil spilt. Environmental conditions such as the sea and weather conditions at the time of
the spill will also alter potential impacts. Effects will also be dependent on the presence of environmental sensitivities in
the path of the spill.
Adult fish are highly mobile and are able to detect pollutants therefore, even in the event that an oil spill resulted in the loss
of inventory from a large installation vessel, fish would be expected to avoid areas where pollution has occurred reducing
the risk of exposure to the population. In addition, whilst juvenile fish and benthic spawning grounds are not capable of the
same avoidance behaviour as adult fish, the likelihood of contamination reaching the benthic environment is low due to
the strong tidal currents within the Project site. This also applies to less mobile shellfish, crab and lobster, which also inhabit
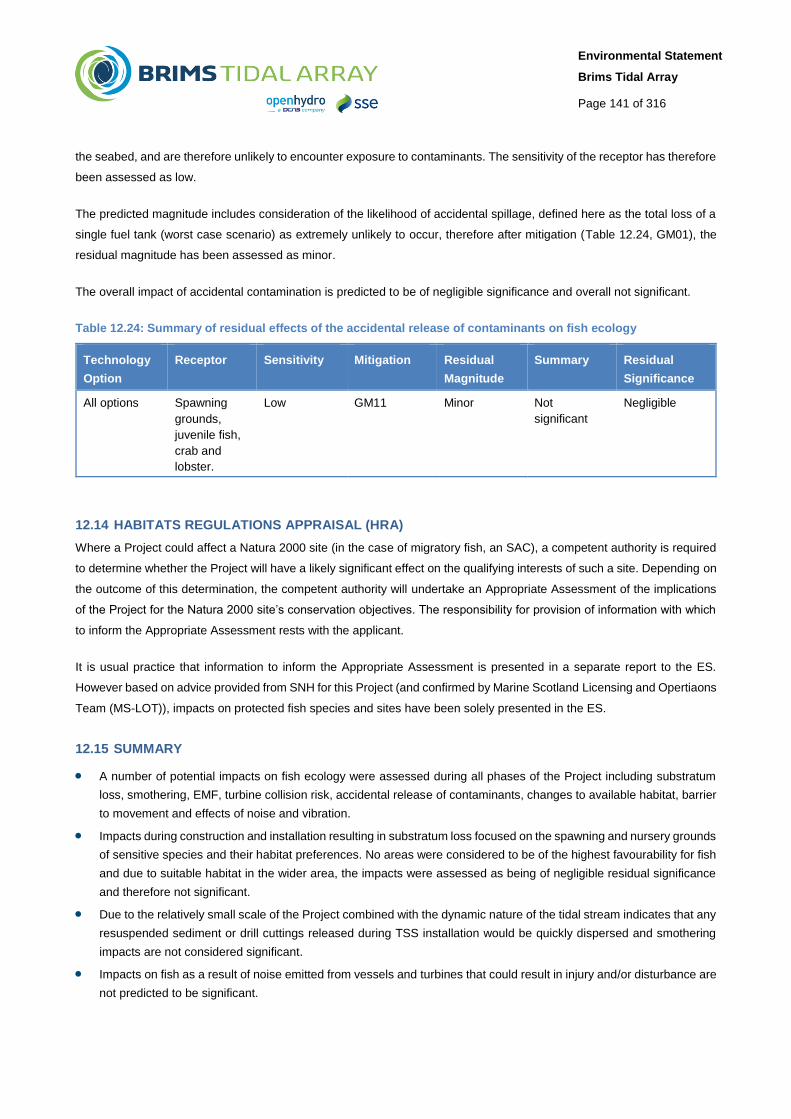
Environmental Statement
Brims Tidal Array
Page 141 of 316
the seabed, and are therefore unlikely to encounter exposure to contaminants. The sensitivity of the receptor has therefore
been assessed as low.
The predicted magnitude includes consideration of the likelihood of accidental spillage, defined here as the total loss of a
single fuel tank (worst case scenario) as extremely unlikely to occur, therefore after mitigation (Table 12.24, GM01), the
residual magnitude has been assessed as minor.
The overall impact of accidental contamination is predicted to be of negligible significance and overall not significant.
Table 12.24: Summary of residual effects of the accidental release of contaminants on fish ecology
Technology
Option
Receptor Sensitivity Mitigation Residual
Magnitude
Summary Residual
Significance
All options Spawning
grounds,
juvenile fish,
crab and
lobster.
Low GM11 Minor Not
significant
Negligible
12.14 HABITATS REGULATIONS APPRAISAL (HRA)
Where a Project could affect a Natura 2000 site (in the case of migratory fish, an SAC), a competent authority is required
to determine whether the Project will have a likely significant effect on the qualifying interests of such a site. Depending on
the outcome of this determination, the competent authority will undertake an Appropriate Assessment of the implications
of the Project for the Natura 2000 site’s conservation objectives. The responsibility for provision of information with which
to inform the Appropriate Assessment rests with the applicant.
It is usual practice that information to inform the Appropriate Assessment is presented in a separate report to the ES.
However based on advice provided from SNH for this Project (and confirmed by Marine Scotland Licensing and Opertiaons
Team (MS-LOT)), impacts on protected fish species and sites have been solely presented in the ES.
12.15 SUMMARY
A number of potential impacts on fish ecology were assessed during all phases of the Project including substratum
loss, smothering, EMF, turbine collision risk, accidental release of contaminants, changes to available habitat, barrier
to movement and effects of noise and vibration.
Impacts during construction and installation resulting in substratum loss focused on the spawning and nursery grounds
of sensitive species and their habitat preferences. No areas were considered to be of the highest favourability for fish
and due to suitable habitat in the wider area, the impacts were assessed as being of negligible residual significance
and therefore not significant.
Due to the relatively small scale of the Project combined with the dynamic nature of the tidal stream indicates that any
resuspended sediment or drill cuttings released during TSS installation would be quickly dispersed and smothering
impacts are not considered significant.
Impacts on fish as a result of noise emitted from vessels and turbines that could result in injury and/or disturbance are
not predicted to be significant.

Environmental Statement
Brims Tidal Array
Page 142 of 316
Disturbance of sensitive fish species as a result of EMF was assessed. Due to the small footprint of the Project, project
level mitigation in the form of cable protection and rapid attenuation of EMF with distance, the residual significance
was assessed as negligible and the impact was considered not significant.
The assessment of collision risk with turbines was based on project specific CRM. The assessment concluded that
the impacts would be of minor residual significance and therefore not significant.
The physical presence of the turbines resulting in a physical barrier was assessed in relation to sensitive migrating
fish species. Due to the small cross sectional area taken up by a 200 device array, coupled with swimming patterns
of migratory species from recent research, the residual significance was assessed as minor and the impact was
considered not significant.
Changes in habitat as a result of the introduction of novel substrata within the AfL and cable corridor was found to
have a potentially positive impact on fish species due to the creation of favourable habitat. The residual significance
was assessed as minor positive and the impact was considered positive.
Impacts due to accidental spillage of pollutants from either vessels or turbines, and also during drilling operations, was
assessed in relation to fish sensitivity to pollutants and the likelihood of such events. No significant impacts were
identified. Mitigation measures identified for this impact in relation to vessels include standard measures to prevent
the risk and minimise the impact should a spill occur, and in relation to turbines the use of low toxicity and
biodegradable fluids wherever possible.

Environmental Statement
Brims Tidal Array
Page 143 of 316
12.16 REFERENCES
ABPmer (2010). Collision risk of fish with wave and tidal devices. Commissioned by RPS Group plc. in behalf of the Welsh
Assembly Government. July 2010. Ref:R/3836/01 Report number: R.1516.
Aires C., Gonsalez-Irusta J. M. & Watret R. (2014). Updating fisheries sensitivity maps in British waters. Scottish Marine
and Freshwater Science Report Vol 5 No 10.
Birkuland, J. & Wijsman, J. (2005). Aggregate extraction: A review on the effects on ecological functions. Report Z3297.10
SAWDPIT Fifth Framework Project no EVK3-CT-2001-00056.
Boles & Lohmann (2003). True navigation and magnetic maps in spiny lobsters. Boles, L. and Lohmann, K. 2003. Nature
421 60-63.
Bonfil, R. (1994). Overview of world elasmobranch fisheries. FAO Fisheries technical paper 341. FAO, Rome, Italy.
Broadhurst M. & Orme C.D.L, (2014). Spatial and temporal benthic species assemblage responses with a deployed marine
tidal energy device: A small scaled study, Marine Environmental Research, Vol: 99, Pages: 76-84, ISSN: 0141-1136.
Camhi, M., Fowler, S., Musick, J., Brautigam, A. & Fordham, S. (1998). Sharks and their relatives: Ecology and
conservation. Occasional paper of the IUCN Species Survival Commission Occas. Pap. No. 20.
Cefas (2004). Offshore Windfarms: guidance note for Environmental Impact Assessment in Respect of FEPA and CPA
Requirements. Version 2 June 2004. Prepared by Centre for Environment, Fisheries and Aquaculture Science (Cefas) on
behalf of the Marine Consents and Environment Unit (MCEU).
Cefas (2001). North Sea fish and fisheries technical report TR_003. Produced for Strategic Environmental Assessment
(SEA) 2 Department of Trade and Industry.
CMACS (2005). Cowrie Phase 1.5 Report. The Potential Effects of Electromagnetic Fields Generated by Sub-sea Power
Cables associated with Offshore Wind Farm developments on Electrically and Magnetically Sensitive Marine Organisms
– A Review.
Collins, M. & Pierce, G. (1996). Size selectivity in the diet of Loligo forbesi (Cephalopoda: Loliginidae). Journal of the
Marine Biological Association of the United Kingdom 76, 1081-1090.
Coull, K., Hohnstone, R. & Rogers, S. (1998). Fishery sensitivity maps in British Waters. Published and distributed by
UKOOA Ltd. [online] Available at: http://cefas.defra.gov.uk/media/29947/sensi_maps.pdf [accessed 01/06/2015].
Davidsen et al. (2008). Changes in swimming depths of Atlantic salmon Salmo salar post-smolts relative to light intensity.
Davidsen, J. G. Plantalech Manel-la, N. Økland F. Diserud, O. H. Thorstad, E. B. Finstad, B. Sivertsgård, R. McKinley, R.
S. Rikardsen, A. H. 2008. Journal of Fish Biology, 73 (4), 1065-1074.
Department of Energy and Climate Change (DECC). (2011) National Policy Statement for renewable Energy Infrastructure
(EN-3). Presented to Parliament pursuant to section 5(9) of the Planning Act 2008).

Environmental Statement
Brims Tidal Array
Page 144 of 316
Drapeau, G. (1973). Sedimentology of herring spawning grounds on Georges Bank. Int. Comm. North west Atl. Fish.
(ICNAF) Res. Bull. 10: 151-162.
Ellis, J.R., Milligan, S.P., Readdy, L., Taylor, N. & Brown, M.J. (2012). Spawning and nursery grounds of selected fish
species in UK waters. Sci. Ser. Tech. Rep., Cefas Lowestoft, 147: 56pp.
Evans, PG.H., Baines, M.E. & Coppack, J. (2011). Abundance and behaviour of cetaceans and basking sharks in the
Pentland Firth and Orkney Waters. Report by Hebog Environmental Ltd and Sea Watch Foundation. Scottish Natural
Heritage Commissioned Report No. 419.
Faber Maunsell and METOC (2007). Marine renewables SEA environmental report. Section C7 Fish and Shellfish.
Fay and Popper (2000). Evolution of hearing in vertebrates: the inner ears and processing. Fay, R.R., and Popper, A.N.
2000. Hearing Research 149, 1-10.
Food and Agriculture Organisation (2014). Species Fact Sheet Clupea harengus. [online] available at:
http://www.fao.org/fishery/species/2886/en [Accessed 26/11/2014].
Foster-Smith (2010). The Highland, Hebrides and Orkney Marine Environment: A GIS resource. Scottish Natural Heritage
Commissioned Report No. 387.
Furness, R. (1999). Does harvesting a million metric tonnes of sand lance per year from the North Sea threaten seabird
populations? Ecosystem approaches for fisheries management. Alaska Sea Grant College program, AK-SG-99-01
University of Alaska, Fairbanks, p 407-424.
Gill, A.B., Gloyne-Phillips, I., Neal, K.J. & Kimber, J.A. (2005). Cowrie Phase 1.5 Report. The Potential Effects of
Electromagnetic Fields Generated by Subsea Power Cables associated with Offshore Wind Farm developments on
Electrically and Magnetically Sensitive Marine Organisms – A Review.
Gill, A., Huang, Y., Gloyne-Philips, I., Metcalfe, J., Quayle, V., Spencer, J. & Wearmouth, V. (2009). COWRIE 2.0
Electromagnetic Fields (EMF) Phase 2: EMF-sensitive fish response to EM emissions from sub-sea electricity cables of
the type used by the offshore renewable energy industry. Commissioned by COWRIE Ltd (project reference COWRIE-
EMF-1-06).
Gill, A. and Bartlett, M. (2010). Literature review on the potential effects of electromagnetic fields and subsea noise from
marine renewable energy developments on Atlantic salmon, sea trout and European eel. Scottish Natural Heritage,
Commissioned Report No. 401. [online] Available at:
http://www.snh.org.uk/pdfs/publications/commissioned_reports/401.pdf [Accessed 06/06/2015].
Gill & Taylor (2002). The potential effects of electromagnetic fields generated by cabling between offshore wind turbines
upon elasmobranch fishes. Gill, A. and Taylor, H. 2001. Countryside Council for Wales, Contract Science Report 488.
Greenstreet, P., McMillan, J. & Armstrog, E. (1998). Seasonal variation in the importance of pelagic fish in the diet of
piscivorous fish in the Moray Firth, NE Scotland: a response to variation in prey abundance? ICES Journal of Marine
Science, 55: 121-133.

Environmental Statement
Brims Tidal Array
Page 145 of 316
Greenstreet, P., Holland, G., Guirey, E., Armstrong, E., Fraser, H. & Gibb, I. (2010). Combining hydroacoustic seabed
survey and grab sampling techniques to assess “local” sandeel population abundance. ICES Journal of Marine Science,
67 (5), 971-984.
Godfrey, J.D., Stewart, D.C., Middlemas, S.J. & Armstrong, J.D. (2014a). Depth use and migratory behaviour of homing
Atlantic salmon (Salmo salar) in Scottish coastal waters. doi: 10.1093/icesjms/fsu118.
Godfrey, J.D., Stewart, D.C., Middlemas, S.J. & Armstrong, J.D. (2014b). Depth use and movements of homing Atlantic
salmon (Salmo salar) in Scottish coastal waters in relation to marine renewable energy development. Scottish Marine and
Freshwater Science Vol 05 No 18.
Guerin, A.J., Jackson, A.C., Bowyer, P.A. & Youngson, A.F. (2014). ‘Hydrodynamic models to understand salmon migration
in Scotland.’ The Crown Estate, 116 pages. ISBN: 978-1-906410-52-0.
Halvorsen, M., Casper, B., Woodley, C., Carlson, T., & Popper, A. (2011). Predicting and mitigating hydroacousrtic impacts
on fish from pile installations. NCHPR Research Digest 363, Project 25-28, National Cooperative Highway Research
Program, Transportation Research Board, National Academy of Sciences, Washington, D.C. [online] Available at:
http://onlinepubs.trb.org/onlinepubs/nchrp/nchrp_rrd_363.pdf [accessed 05/06/2014].
Hawkins, A.D., Smith, G.W. & Urquhart, G.G. (1979). Orientation and Energetic Efficiency in the Offshore Movements of
Reurning Atlantic Salmon. [online] Available at: http://www.gov.scot/Uploads/Documents/No%2021.pdf.
Hawkins & Myrberg (1983). Hearing and sound communication underwater. Hawkins, A.D., and Myrberg, A.A. Jr. 1983.
In: Lewis B (ed), Bioacoustics, a comparative approach. Academic Press, London, p 347–405.
Hendry, K. & Cragg-Hine, D. (2003). Ecology of the Atlantic Salmon Conserving Natura 2000 Rivers Ecology Series No.7
Life in UK Rivers Publications.
Holden, M. (1974). Problems in the rational exploitation of elasmobranch populations and some suggested solutions. Pp.
117-137 In F.R.H Jones (ed) Sea Fisheries Research, Elek Science, London.
Holland G., Greenstreet, S., Gibb, I., Fraser, H. and Robertson, M., (2005). Identifying sandeel Ammodytes marinus
sediment habitat preferences in the marine environment. Marine Ecology Progress Series, 303, 269-282.
Holm, M. Jacobsen, J.A. Sturlaugsson, J. & Holst, J.C. (2005). Preliminary results from DST tagging of salmon in the
Norwegian Sea ICES, WGNAS 2005: Working paper 13.
ICES (2014a). Data Portal. Eggs and larvae. [online] Available at: http://www.ices.dk/marine-data/data-
portals/Pages/Eggs-and-larvae.aspx [Accessed 22/11/15].
ICES (2015). ICES Advice on fishing opportunities, catch, and effort Greater North Sea Ecoregion. 6.3.12 Herring (Clupea
harengus) in Subarea IV and Divisions IIIa and VIId (autumn spawners) (North Sea, Skagerrak and Kattegat, Eastern
English Channel). Published 29 May 2015.

Environmental Statement
Brims Tidal Array
Page 146 of 316
ICES (2015b) Report of the Working Group on North Atlantic Salmon (WGNAS), 17–26 March, Moncton, Canada. ICES
CM 2015/ACOM:09. 332 pp.
Inger, R., Attrill, M.J., Bearhop, S., Broderick, A.C., Grecian, W.J., Hodgson, D.J., Mills, C., Sheehan, E., Votier, S.C., Witt,
M.J., & Godley, B.J. (2009). Marine renewable energy: potential benefits to biodiversity? An urgent call for research.
Journal of Applied Ecology, 46, 1145-1153.
Jackson, A., Marshall, C. & Wilding. C. (2009). Palinurus elephas. European spiny lobster. Marine Life Information Network:
Biology and Sensitivity Key Information Sub-programme [on-line]. Plymouth: Marine Biological Association of the United
Kingdom. [cited 25/11/2014]. [online] Available at: http://www.marlin.ac.uk/specieshabitats.php?speciesID=4022.
Jensen, H., Rindorf, A., Wright, P. & Mosegaard, H. (2011). Inferring the location and scale of mixing between habitat
areas of lesser sandeel through information from the fishery. ICES Journal of Marine Science, 68 (1), 43–51.
JNCC (2015). The Marine Habitat Classification for Britain and Ireland Version 15.03 [online]. Available at:
http://jncc.defra.gov.uk/MarineHabitatClassification [Accessed 30/06/2015].
JNCC (2016a) Vertebrate specied: fish Book lamprey Lampetra planeri available online at
http://jncc.defra.gov.uk/protectedsites/sacselection/species.asp?FeatureIntCode=S1096 [Accessed 21/03/2016]
JNCC (2016b) Vertebrate specied: fish River lamprey Lampetra fluviatilis available online at
http://jncc.defra.gov.uk/protectedsites/sacselection/species.asp?FeatureIntCode=S1099 [Accessed 21/03/2016]
JNCC (2016c) Vertebrate specied: fish Sea lamprey Petromyzon marinus available online at
http://jncc.defra.gov.uk/protectedsites/sacselection/species.asp?FeatureIntCode=S1095 [Accessed 21/03/2016]
Lacroix, G. L., Knox, D. & Stokesbury, M. J. W. (2005). Survival and behaviour of postsmolt Atlantic salmon in coastal
habitat with extreme tides. Journal of Fish Biology, 66, 485-498.
Leonhard & Pedersen (2004). Hard bottom substrate monitoring at Horns Rev Offshore Wind Farm. Annual Status Report
2003. Leonhard, S. and Pedersen, J. 2004. Elsam Engineering.
Malcolm, I.A., Godfrey, J & Youngson, A.F. (2010). Review of migratory routes and behaviour of Atlantic salmon, sea trout
and European Eel in Scotland’s coastal environment: implications for the development of marine renewables. Scottish
Marine and Freshwater Science. Vol 1 No 14.
Marine Scotland (2011). Habitats Regulations Appraisal of Draft Plan for Offshore Wind Energy in Scottish Territorial
Waters: Appropriate Assessment Information Review. March 2011. ISBN 978178045060 (Web Only).
Marine Scotland & SNH (2013). Consideration of Atlantic Salmon Collision Modelling – MeyGen – Inner Sound Pentland
Firth. [online] Available at:
http://77.68.107.10/Renewables%20Licensing/MG_Sound_of_Stroma_Offshore_Tidal_Array/June_2013_MSS_SNH_rep
ort-Consideration_of_Atlantic_Salmon_Collision_Modelling/20130607_MeyGen_Salmon_review
Final_PDF_Version_A951792.pdf [Accessed 13/05/2015].
Environmental Statement
Brims Tidal Array
Page 147 of 316
Marine Scotland (2011). Habitats Regulations Appraisal of Draft Plan for Offshore Wind Energy in Scottish Territorial
Waters: Appropriate Assessment Information Review. March 2011. ISBN 978178045060.
McBreen, F., Askew, N., Cameron, A., Connor, D., Ellwood, H. & Carter, A. (2011). UKSeaMap 2010: Predictive mapping
of seabed habitats in UK waters. JNCC Report, No. 446.
McConnell, B., Hall, A. & Fedal, M. (1999). Seal foraging and sandeel distribution In Wright, P.J. and Kenedy, F.M., (1999).
MeyGen (2013). MeyGen Environmental Statement. [online] Available at: http://www.MeyGen.com/the-company/reports-
and-documents/ [Accessed 03/07/2015].
Mills, D., Hadoke, G., Shelton, R. and Reid, J. (2003). Atlantic Salmon Facts. Atlantic Salmon Trust booklet. Prepared in
1986 revised in 2003.
Mueller-Blenkle C., McGregor, P., Gill, A., Andersson, M., Metcalfe, J., Bendall, V., Sigray, P., Wood, D. & Thomsen, F.
(2010). Effects of Pile-driving Noise on the Behaviour of Marine Fish. COWRIE Ref: Fish 06-08, Technical Report.
Musick, J. & Musick, S. (2005). Sharks FAO Fisheries and Aquaculture reviews and studies. Rome, FAO 2011 10p [online]
Available at: ftp://ftp.fao.org/fi/DOCUMENT/reviews%26studies/sharks.pdf [Accessed 17/06/2015].
NBN Gateway (2016) Recorded sightings available online at https://data.nbn.org.uk/Taxa [Accessed 21/03/2016]
Normandeau et al. (2011). Effects of EMFs from Undersea Power Cables on Elasmobranchs and Other Marine Species.
Normandeau, Exponent, Tricas, T and Gill. A., 2011. U.S. Dept. of the Interior, Bureau of Ocean Energy Management,
Regulation, and Enforcement, Pacific OCS Region, Camarillo, CA. OCS Study BOEMRE 2011-09.
Olsen, E. & Holst, J. (2001). A note on common minke whale (Balaenoptera acutorostrata) diets in the Norwegian Sea and
the North Sea. Journal of Cetacean Resource Management 3(2): 179-183.
OSPAR (2004). The Background Document on Problems and Benefits Associated with the Development of Offshore Wind
Farms identifies some of the potential advantages and disadvantages of offshore wind farms. Publication number: 214-
2004.
OSPAR 2008. List of Threatened and/or Declining Species and Habitats. OSPAR Publication 2008/358.
Pierce, G., Santos, M., Reid, R., Patterson, I. and Ross, H. (2004). Diet of minke whale (Balaenoptera acutorostrata) diets
in the Scottish (UK) waters with notes on strandings of the species in Scotland 1992-2002. Marine Biology Association UK
84: 1241-1244.
Plantalech Manel-la, N., Thorstad, E.B., Davidsen, J.G., Okland, F., Sivertsgard, R., McKinley, R.S., & Finstad, B. (2009).
Vertical movements of Atlantic salmon post- smolts relative to measures of salinity and water temperature during the first
phase of the marine migration. Fisheries Management & Ecology, 16, 147-154.
Popper, A.N., Hawkins, A.D., Fay, R.R., Mann, D.A., Bartol, S., Carlson, T.J., Coombs, S., Ellison, W.T., Gentry, R.L.,
Halvorsen, M.B., Lokkeborg, S., Rogers, P.H., Southall, B.L., Zeddies, D.G. & Tavolga, W.N. (2014). Sound exposure

Environmental Statement
Brims Tidal Array
Page 148 of 316
guidelines for fishes and sea turtles. A technical report prepared by ANSI – Accredited Standards Committee S3/SC1 and
registered with ANSI. Springer Briefs in Oceanography.
Rogers, S.I. & Stocks, R. (2001). North Sea fish and fisheries. Strategic Environmental Assessment - SEA2. Technical
Report 003 - Fish & Fisheries, 72 pp.
Saetre, R. (1999). Features of the central Norwegian shelf circulation. Continental Shelf Research, 19: 1809 – 1831.
Santos, M., Pierce, G., Ieno, E., Addick, M., Smeenk, C., Kinze, C. and Sacau, M. (2005). Harbour porpoise (Phocoena
phocoena) feeding ecology in the eastern North Sea. Marine Mammal Science. 20(1), pp. 1-27.
Scottish Executive (2007). Scottish Marine Renewables SEA. Environmental Report Section C SEA Assessment: Chapter
C18 EMF.
Skinner, A., Young, M and Hastie, L. (2003) Ecology of the Freshwater Pearl Mussel. Conserving Natura 2000 Rivers
Ecology Series No. 2 English Nature, Peterborough
Smith G.W., Hawkins A.D., Urquhart G. & Shearer W.M. (1981). Orientation and energetic efficiency in the offshore
movements of returning Atlantic salmon (Salmo salar L.). Scottish Fisheries Research Report 21. 22pp.
Sturlaugsson (1995). Migration study of homing of Atlantic salmon (Salmo salar L.) in coastal waters W- Iceland: Depth
movements and sea temperatures recorded at migration routes by data storage tags. Sturlaugsson, J. 1995. ICES. C.M.
1995/M:17. 13 p. [online] Available at: http://star-oddi.com/Home/Aquatic-Fisheries-Research/Fish-and-Marine-Animal-
Tagging/migration-study-of-homing-of-atlantic-salmon-in-coastal-waters-w-iceland/.
Thorstad, E.B. Okland, F. Finstad, B. Silvertsgard, R. Plantalech Manel-la, N. Bjorn, P.A. & McKinley, R.S. (2007). Fjord
migration and survival of wild and hatchery-reared Atlantic salmon and wild brown trout post-smolts Hydrobiologia, 582,
99-107.
van Damme, C., Hoek, R., Beare, D., Bolle, L., Bakker, C., van Barneveld, E., Lohman, M., Os-Koomen, E., Nijssen, P.,
Pennock, I. & Tribuhl, S. (2011). Shortlist Master plan Wind Monitoring fish eggs and larvae in the Southern North Sea:
Final report Part A. IMARES Wogeningenur.
Walters, M. (2010). Moray Firth Sea Trout Project. Progress Report February 2010. [online] Available at:
http://www.morayfirthtrout.org/ [Accessed at 01/06/2014].
Walters, M. (2011). Moray Firth Sea Trout Project Final Report. A summary of the Project, progress, findings and next
steps. [online] Available at: http://www.morayfirthtrout.org/ [Accessed at 01/06/2014].
Wanless, S., Wright, P.J., Harris, M.P. & Elston, D. A. (2005). Evidence for decrease in size of lesser sandeel Ammodytes
marinus in a North Sea aggregation over a 30-yr period. Mar Ecol Prog Ser Vol. 279, pp. 237–246.
Wilhelmsson, D., Malm, T. & Ohman, M.C. (2006). The influence of offshore windpower on demersal fish. [online] Available
at: http://icesjms.oxfordjournals.org/content/63/5/775.full.pdf+html.

Environmental Statement
Brims Tidal Array
Page 149 of 316
Wilson, B., Batty, R.S., Daunt, F. & Carter, C. 2007. (2007). Collision risks between marine renewable energy devices and
mammals, fish and diving birds. Report to the Scottish Executive. Scottish Association for Marine Science, Oban, Scotland,
PA37 1QA.
WSDOT, (2011). Biological Assessment Preparation for Transport Projects - Advanced Training Manual. Washington State
Department of Transport.
Wright, P.J. & Bailey, M. C. (1996). Timing of hatching in Ammodytes marinus from Shetland waters and its significance
to early growth and survivorship. Marine Biology, 126, pp.143-152. Cited in Jensen et al. 2003.
Wright, P. & Kennedy, F. (1999). Sandeel biology and its implications to management. Fisheries Research Services Report
Number 12/99 Proceedings of a workshop held at FRS Marine Laboratory Available online at
http://www.scotland.gov.uk/Uploads/Documents/Coll1299.pdf [accessed 17/06/2014].
Xodus Group (2012) Estimating the encounter rate for Atlantic salmon for the MeyGen Tidal Energy Project, Phase 1 and
potential population effects.
Xodus Group (2016) Collision Risk Modelling – Atlantic Salmon for the Project Stage I and Stage I and II

Environmental Statement
Brims Tidal Array
Page 150 of 316
Marine Mammals and Basking Shark
Chapter 13

Environmental Statement
Brims Tidal Array
Page 151 of 316
13 MARINE MAMMALS AND BASKING SHARK
13.1 INTRODUCTION
This chapter of the Environmental Statement (ES) considers the potential effects of the proposed Brims Tidal Array Project
(the Project) on marine mammals and basking sharks during the construction, operation and maintenance (O&M), and
decommissioning phases. It describes the existing environment with regard to marine mammals (pinnipeds (seals) and
cetaceans (whales, dolphin and porpoise) as well as basking shark Cetorhinus maximus. Where appropriate, mitigation
measures and residual impacts are presented.
This assessment also considers information from, and refers to, the following chapters within this ES:
Chapter 3 Planning and Legislation;
Chapter 5 Project Description;
Chapter 7 EIA Scope and Methodology;
Chapter 12 Fish Ecology; and
Chapter 15 Shipping and Navigation.
This chapter of the ES was written by Royal HaskoningDHV, and incorporates results and advice from other contributors
including Marine Ecological Research (MER), Natural Research Projects Ltd (NRP) and Xodus Group Ltd (noise
assessment). Table 13.1 outlines supporting technical reports that were used in the preparation of this chapter.
Table 13.1: Supporting studies
Details of study
Brims Tidal Array Marine Mammal and Basking Shark Boat Based Visual Survey Data Analysis (Royal HaskoningDHV
2014)
Analysis of Towed Hydrophone Data Collected at Westray South and Brims Tidal Sites Between January 2012 and
March 2014 (MER 2014)
Underwater Noise Technical Report (Xodus 2015)
13.2 STUDY AREA
Due to the mobile and transitory nature of marine mammals and basking shark, the area of assessment for these receptors,
with regard to the Project, is relatively wide; covering Orkney and Pentland Firth waters, a large portion of the northern
North Sea, and for some species, the area of interest is even wider, extending to the North Atlantic. For each species of
marine mammal this wider area has been defined based on current knowledge and understanding of the biology of each
species, and taking account of feedback received during consultation.
The proposed reference population for each relevant species is defined in Section 13.9 based on guidance from the Inter-
Agency Marine Mammal Working Group (IAMMWG 2013, 2015). In addition, the status and activity of cetaceans known to
occur within or adjacent to the Project site for Lease (AfL) is considered in the context of regional population dynamics at
the scale of the Orkney and North Coast of Scotland, northern North Sea, or North Sea depending on the data available
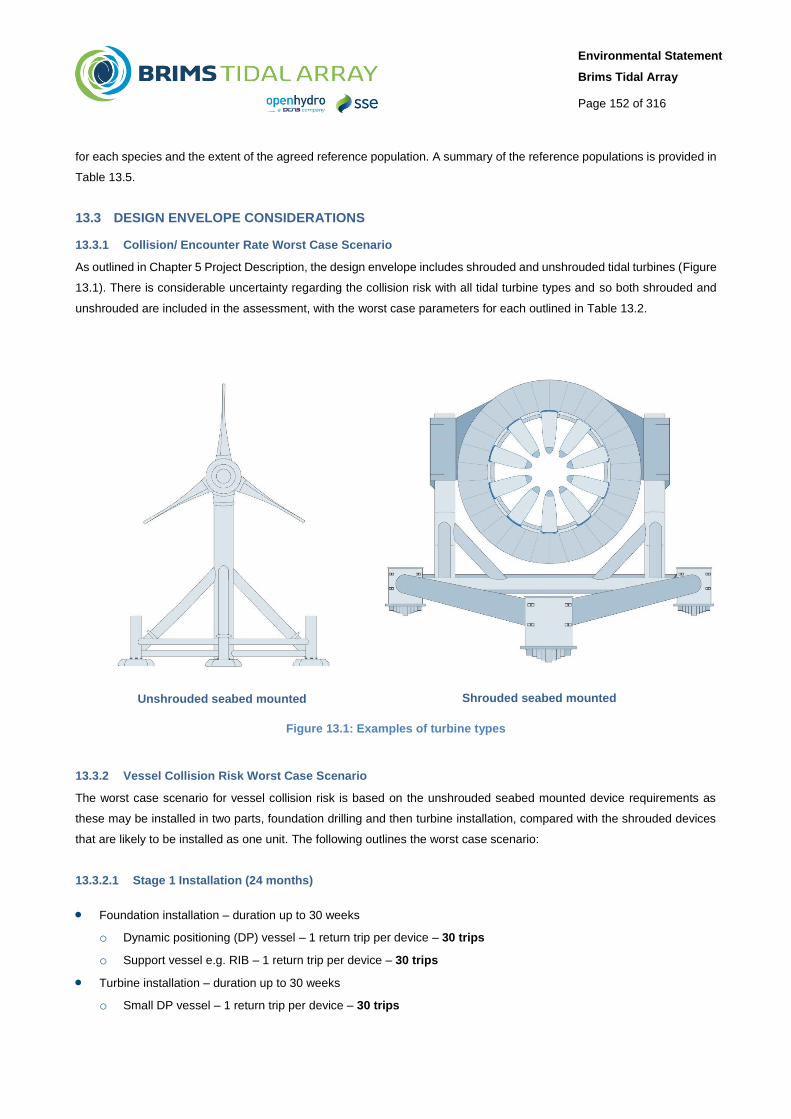
Environmental Statement
Brims Tidal Array
Page 152 of 316
for each species and the extent of the agreed reference population. A summary of the reference populations is provided in
Table 13.5.
13.3 DESIGN ENVELOPE CONSIDERATIONS
13.3.1 Collision/ Encounter Rate Worst Case Scenario
As outlined in Chapter 5 Project Description, the design envelope includes shrouded and unshrouded tidal turbines (Figure
13.1). There is considerable uncertainty regarding the collision risk with all tidal turbine types and so both shrouded and
unshrouded are included in the assessment, with the worst case parameters for each outlined in Table 13.2.
Unshrouded seabed mounted
Shrouded seabed mounted
Figure 13.1: Examples of turbine types
13.3.2 Vessel Collision Risk Worst Case Scenario
The worst case scenario for vessel collision risk is based on the unshrouded seabed mounted device requirements as
these may be installed in two parts, foundation drilling and then turbine installation, compared with the shrouded devices
that are likely to be installed as one unit. The following outlines the worst case scenario:
13.3.2.1 Stage 1 Installation (24 months)
Foundation installation – duration up to 30 weeks
o Dynamic positioning (DP) vessel – 1 return trip per device – 30 trips
o Support vessel e.g. RIB – 1 return trip per device – 30 trips
Turbine installation – duration up to 30 weeks
o Small DP vessel – 1 return trip per device – 30 trips

Environmental Statement
Brims Tidal Array
Page 153 of 316
o Support vessel – 1 return trip per device – 30 trips
o Cable connection vessel – 1 return trip per device – 30 trips
Export cable installation – duration up to 8 weeks
o Cable installation vessel – slow movement along the length of each cable – 4 trips
o Support vessel e.g. RIB – slow movement along the length of each cable – 4 trips
Export cable protection installation – duration up to 8 weeks
o 1 cable protection vessel – slow movement along the length of each cable – 2 trips
Landfall works – duration up to 4 weeks
o Jack up barge – duration up to 4 weeks– 1 trip
o Support vessel e.g. RIB – 1 trip per day – 28 trips
Total – 189 trips
13.3.2.2 Stage 2 Installation (36 months)
Foundation installation – duration up to 85 weeks
o Dynamic positioning (DP) vessel – 1 return trip per device – 170 trips
o Support vessel e.g. RIB – 1 return trip per device – 170 trips
Turbine installation – duration up to 85 weeks
o Small DP vessel – 1 return trip per device – 170 trips
o Support vessel – 1 return trip per device – 170 trips
o Cable connection vessel – 1 return trip per device – 170 trips
Export cable installation – duration up to 16 weeks
o Cable installation vessel – slow movement along the length of each cable – 12 trips
o Support vessel e.g. RIB – slow movement along the length of each cable – 12 trips
Export cable protection installation – duration up to 16 weeks
o 1 cable protection vessel – slow movement along the length of each cable – 6 trips
Landfall works – duration up to 8 weeks
o Jack up barge – duration up to 8 weeks – 1 trip
o Support vessel e.g. RIB – 1 trip per day – 56 trips
Total – 937 trips
13.3.2.3 O&M Stages 1 and 2
It is expected that there will be one vessel on site per day on average. O&M vessel types may include:
Small tug
Support vessel e.g. RIB
Large DP vessel

Environmental Statement
Brims Tidal Array
Page 154 of 316
Further information on vessel requirements is outlined in Chapter 5 Project Description and Chapter 15 Shipping and
Navigation. The level of vessel movements associated with the Project is also put into context of the existing levels of
shipping activity, described in Chapter 15 Shipping and Navigation.
13.3.3 Underwater Noise Worst Case Scenario
The worst case scenarios and modelling assumptions for underwater noise are outlined in Underwater Noise Technical
Report (Xodus 2015). An overview of the key parameters is shown in Table 13.2.
13.3.4 Changes to Prey Resource Worst Case Scenario
The worst case scenarios and modelling assumptions for indirect impacts on marine mammals as a result of changes to
prey resource are based on the worst case scenario for the impacts on prey species. These are outlined in Chapter 12
Fish Ecology.
13.3.5 Overview of Design Envelope Parameters
Table 13.2: Design envelope parameters for the marine mammals and basking assessment
Project parameter
relevant to the
assessment
Maximum Project parameter for
impact assessment
Explanation of maximum Project
parameters
Maximum number of
turbines (Stage 1)
30 Based on minimum 1MW rating
Maximum number of
turbines (Stage 2)
170 Based on minimum 1MW rating
Maximum number of
turbines (Stage 1 and 2)
200 Based on minimum 1MW rating
Maximum device power
rating
2MW Turbines could range in power between 1 –
2MW.
Rotor diameter Shrouded Open Centre Turbine
(OCT): 12.8m
Unshrouded: 23m
12.8m is the maximum rotor diameter for the
shrouded OCT and 23m for the unshrouded
devices, would be the maximum diameter
considered as part of the design envelope.
Blade length Shrouded OCT: 4.35m
Unshrouded: 11.5m
Blade width Shrouded OCT: 1.9m
Unshrouded Max: 1.8m
Blade thickness Shrouded OCT: 0.1m
Unshrouded Max: 0.3m
Average width of leading edge thickness for the
shrouded OCT is 0.1m.
0.3m used for other devices, based on EMEC
(2014b).
No. of rotors per device All devices are single rotor
No. of blades per rotor Shrouded OCT: 10
Unshrouded: 3
Shrouded OCT: 10 blades; blade tips are
retained within the outer venturi.
Unshrouded turbines have 3 blades.

Environmental Statement
Brims Tidal Array
Page 155 of 316
Project parameter
relevant to the
assessment
Maximum Project parameter for
impact assessment
Explanation of maximum Project
parameters
Pitch of the blade Shrouded OCT: 20-30o
Unshrouded: 0-10o
Some turbines with yaw function (unshrouded)
also have independent blade pitching functions.
Where blade pitching is included, this ranges
from 0-10 degrees (generating).
Total swept area Shrouded OCT:115m2
Unshrouded: 415m2
Rotor area (minus open-centre area for OCT).
Average RPM Shrouded: 8 RPM
Unshrouded: 10RPM
The rpm range is 1-21rpm. An average of
10rpm is used for 3-blade and 8rpm for OCT at
open centre. Typical inner tip speed of 1.8m/s
for OCT.
Cut-in flow speed 0.5 - 1m/s
Cut-out flow speed 3.5 – 5m/s Turbine designed to operate in all flow speeds.
Mean current speed
during device operation
Shrouded: 1.56m/s
Unshrouded: 1.82m/s
The current speed during operation for the
shrouded device has been calculated for Brims
site based on the OCT device.
The current speed during operation for the
unshrouded device is based on EMEC (2014b).
Water depth 70-90m
Min clearance between
blade tip and sea surface
at LAT
30m minimum clearance Subject to NRA consultation but 30m minimum
anticipated.
Min clearance between
blade tip and seabed
4m Clearance may be more depending on turbine
and support structure configuration.
Percentage of time not in
use
14.4%
Vessels types Potential for various vessels during
construction, maintenance and
decommissioning including:
Anchor handling vessel
Installation/construction vessel (using
DP)
Decommissioning vessel (using DP)
Support vessel
Rock placement vessel
Cable lay vessel
Misc. small vessels (e.g. tugs, vessels
carrying ROVs, crew transfer vessels,
dive boats and RIBs)
Vessel movements Stage 1 – 218 return trips (see Section
13.3.2.1)
Stage 2 – 998 return trips (see Section
13.3.2.2)
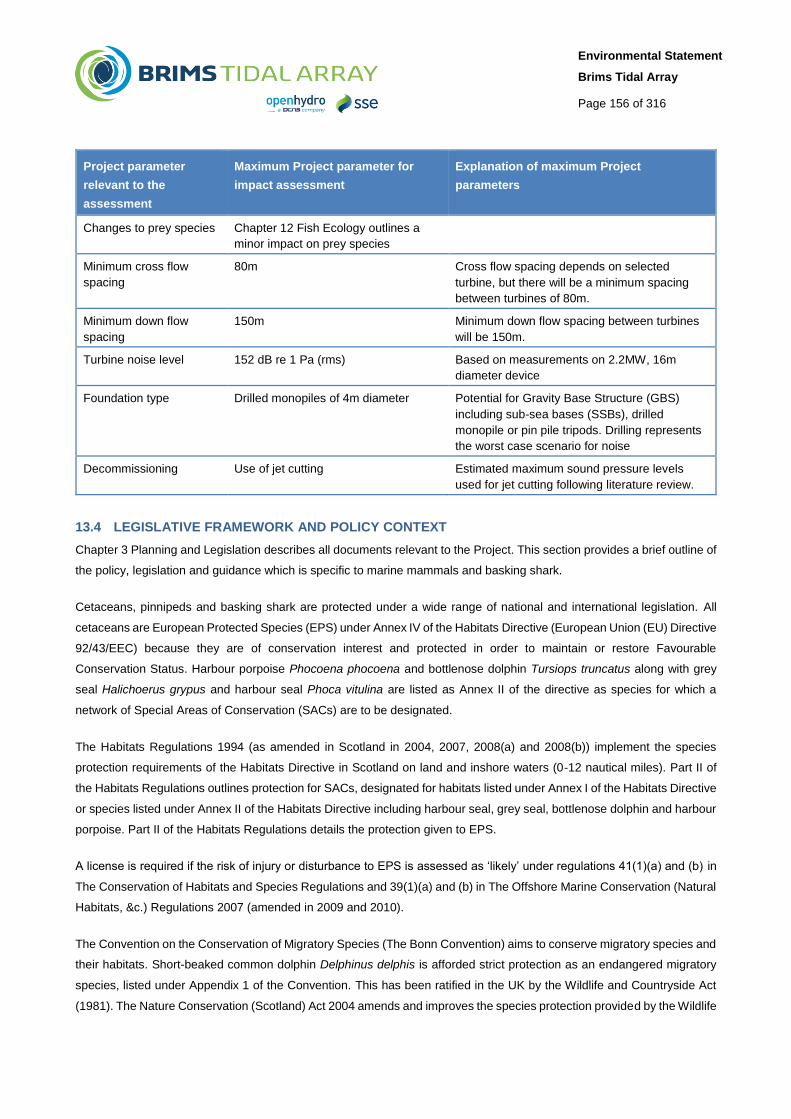
Environmental Statement
Brims Tidal Array
Page 156 of 316
Project parameter
relevant to the
assessment
Maximum Project parameter for
impact assessment
Explanation of maximum Project
parameters
Changes to prey species Chapter 12 Fish Ecology outlines a
minor impact on prey species
Minimum cross flow
spacing
80m Cross flow spacing depends on selected
turbine, but there will be a minimum spacing
between turbines of 80m.
Minimum down flow
spacing
150m Minimum down flow spacing between turbines
will be 150m.
Turbine noise level 152 dB re 1 Pa (rms) Based on measurements on 2.2MW, 16m
diameter device
Foundation type Drilled monopiles of 4m diameter Potential for Gravity Base Structure (GBS)
including sub-sea bases (SSBs), drilled
monopile or pin pile tripods. Drilling represents
the worst case scenario for noise
Decommissioning Use of jet cutting Estimated maximum sound pressure levels
used for jet cutting following literature review.
13.4 LEGISLATIVE FRAMEWORK AND POLICY CONTEXT
Chapter 3 Planning and Legislation describes all documents relevant to the Project. This section provides a brief outline of
the policy, legislation and guidance which is specific to marine mammals and basking shark.
Cetaceans, pinnipeds and basking shark are protected under a wide range of national and international legislation. All
cetaceans are European Protected Species (EPS) under Annex IV of the Habitats Directive (European Union (EU) Directive
92/43/EEC) because they are of conservation interest and protected in order to maintain or restore Favourable
Conservation Status. Harbour porpoise Phocoena phocoena and bottlenose dolphin Tursiops truncatus along with grey
seal Halichoerus grypus and harbour seal Phoca vitulina are listed as Annex II of the directive as species for which a
network of Special Areas of Conservation (SACs) are to be designated.
The Habitats Regulations 1994 (as amended in Scotland in 2004, 2007, 2008(a) and 2008(b)) implement the species
protection requirements of the Habitats Directive in Scotland on land and inshore waters (0-12 nautical miles). Part II of
the Habitats Regulations outlines protection for SACs, designated for habitats listed under Annex I of the Habitats Directive
or species listed under Annex II of the Habitats Directive including harbour seal, grey seal, bottlenose dolphin and harbour
porpoise. Part II of the Habitats Regulations details the protection given to EPS.
A license is required if the risk of injury or disturbance to EPS is assessed as ‘likely’ under regulations 41(1)(a) and (b) in
The Conservation of Habitats and Species Regulations and 39(1)(a) and (b) in The Offshore Marine Conservation (Natural
Habitats, &c.) Regulations 2007 (amended in 2009 and 2010).
The Convention on the Conservation of Migratory Species (The Bonn Convention) aims to conserve migratory species and
their habitats. Short-beaked common dolphin Delphinus delphis is afforded strict protection as an endangered migratory
species, listed under Appendix 1 of the Convention. This has been ratified in the UK by the Wildlife and Countryside Act
(1981). The Nature Conservation (Scotland) Act 2004 amends and improves the species protection provided by the Wildlife

Environmental Statement
Brims Tidal Array
Page 157 of 316
and Countryside Act 1981 to provide extension to existing protections for cetaceans from intentional disturbance to
encompass protection from reckless disturbance as an offence. Basking sharks have full protection from intentional or
reckless disturbance in Scottish waters (up to 12 miles offshore) under Section 6.
The UK has signed up to the Convention on Biological Diversity and the OSPAR Convention, and as such is committed to
establishing a network of Marine Protected Areas. Of relevance to marine mammals in Scotland, the MPA network includes
SACs, Nature Conservation Marine Protected Areas (MPAs) and Priority Marine Features (PMFs). A suite of MPAs were
identified with the aim of conserving some of Scotland's most important marine wildlife, habitats and geodiversity. The
recommendation also includes a second tranche of sites on the west coast of Scotland for basking sharks, minke whales
Balaenoptera acutorostrata and Risso's dolphins Grampus griseus which has not yet been designated. In addition, Scottish
Natural Heritage (SNH) and the Joint Nature Conservation Committee (JNCC) developed a list of 81 PMFs (habitats and
species) considered to be of conservation importance in Scotland. Of relevance to the study are minke whale, harbour
porpoise and white-beaked dolphin Lagenorhynchus albirostris.
The basking shark is currently listed by IUCN as “Vulnerable” globally and “Endangered” in the Northeast Atlantic and
North Pacific. They were listed in Appendix II of CITES in 2002, and are on Appendix 1 and II of the Convention on Migratory
Species (CMS), and Annex I of the United Nations Convention on the Law of the Sea (UNCLOS). Under the Nature
Conservation (Scotland) Act, no disturbance is allowed. Under European legislation, it is prohibited for basking sharks to
be fished for, retained on board, or landed by any community vessel.
Under the Marine (Scotland) Act 2010 it is an offence to kill, injure or take a seal at any time of year except to alleviate
suffering or where a licence has been issued to do so by the Scottish Government. It is an offence to harass seals at haul-
out sites which have been identified for protection under Section 117 of the Marine (Scotland) Act 2010. Under Section
117 of the Marine (Scotland) Act 2010, important seal haul-out sites can be designated to provide additional protection for
seals from intentional or reckless harassment
Grey seal and harbour seal are also listed on Annex V of the Habitats Directive, which requires their exploitation or removal
from the wild to be subject to management measures.
13.4.1 Survey Guidance
The site characterisation surveys undertaken to inform this EIA for the Project followed the SNH draft guidance on survey
design and methodologies in relation to marine renewables (MacLeod et al. 2011 and Sparling et al. 2011). The impact
assessment follows the latest, appropriate, guidance on Environmental Impact Assessment (EIA) and draws experience
from recent examples of similar renewable energy projects in the UK and Europe.
The principal guidance documents used to inform the assessment of potential impacts on marine mammals are as follows:
Guidance on the Assessment of Effects on the Environment and Cultural Heritage from Marine Renewable
Developments. Produced by: the Marine Management Organisation (MMO), the Joint Nature Conservation Committee
(JNCC), Natural England, the Countryside Council for Wales (CCW) and the Centre for Environment, Fisheries and
Aquaculture Science (Cefas) (MMO 2010);
The Protection of Marine EPS From Injury and Disturbance: Draft Guidance for the Marine Area in England and Wales
and the UK Offshore Marine Area (JNCC et al. 2010);

Environmental Statement
Brims Tidal Array
Page 158 of 316
The Protection of Marine European Protected Species from injury and disturbance. Guidance for Scottish Inshore
Waters. (Marine Scotland 2014);
Guidelines for Ecological Impact Assessment in Britain and Ireland, Marine and Coastal (Institute for Ecology and
Environmental Management (IEEM 2010); and
Approaches to Marine Mammal Monitoring at Marine Renewable Energy Developments Final Report (Sea Mammal
Research Unit (SMRU) Limited 2010, on behalf of the Crown Estate).
13.5 SUPPORTING SURVEYS AND STUDIES
Site specific surveys of the AfL area, completed from March 2012 to March 2014 by Natural Research Projects Ltd, provide
a key source of site characterisation data which is further supplemented by available information. These surveys consist
of boat based surveys with both visual and acoustic observations using dedicated marine mammal observers (MMOs), as
well as European Seabirds at Sea (ESAS) observers and a towed passive acoustic monitoring (PAM) hydrophone. All
surveys were undertaken in sea state 4 or less. Marine Scotland and SNH were consulted on the survey design and
methodology in November 2012 and January 2013 and interim survey findings in August 2012, February 2013, January
2014, and the final results in July 2014 (see Table 13.3). The results of the visual survey data analysis are provided in
Royal HaskoningDHV (2014). The results of the Passive Acoustic Monitoring (PAM) surveys are provided in MER (2014).
The site specific surveys are supplemented by published and other available data sources where appropriate. These
include:
SCANS and SCANS II (updated densities from Hammond et al. 2013) and CODA;
Inter-Agency Marine Mammals Working Group (IAMMWG) Management Units June 2013 (IAMMWG 2013);
IAMMWG Management Units for Cetacean in UK waters January 2015 (IAMMWG 2015)
Scientific Advice on Matters Related to the Management of Seal Populations (Special Committee on Seals (SCOS)
2014);
Jones et al. (2013) (grey and harbour seal density maps);
Reid et al. (2003) Atlas of cetacean distribution;
Evans et al, (2011) Abundance and behaviour of cetacean and basking sharks in PFOW;
SMRU Ltd (2011) Utilisation of space by grey and harbour seals in the Pentland Firth and Orkney Waters;
Habitats Directive Article 17 - 3rd Reporting Round (JNCC 2013);
Marine Evidence Group (MEG) Report: An analysis of potential broad-scale impacts on two harbour porpoise from
proposed pile driving activities in the North Sea (2013);
Interim Population Consequences of Disturbance (PCOD) report. Harwood et al. (2014);
Duck & Morris (2014) SNH commissioned report on harbour and grey seal in Orkney in August 2013;
APEM (2013) Utilisation of sea space by sea birds in the Pentland Firth;
MeyGen Tidal Energy Project Phase 1 Environmental Statement (MeyGen 2011); and
Relevant Strategic Environmental Assessments.

Environmental Statement
Brims Tidal Array
Page 159 of 316
13.6 DATA GAPS AND UNCERTAINTIES
The confidence in the predictions of the impact assessment will depend on any data gaps and uncertainties, and measures
taken to address them. The marine mammal site specific baseline surveys were constrained by poor weather in a number
of months (Royal HaskoningDHV 2014).
Table 13.3 outlines consultation with SNH and Marine Scotland on this topic and shows it was agreed that the BTAL marine
mammal surveys would be supplemented with available literature and data to characterise the existing environment for
marine mammals in the study area. This includes the use of alternative estimates of density where appropriate, with
discussion of how they relate to the Project site.
These density estimates are fed into collision risk modelling, within which, there is also additional uncertainty associated
with avoidance rates of marine mammals and basking sharks as well as the consequences of a collision. It is important to
note that given the relatively slow tip speed of the rotors, of up to 12m/s or 26.8mph (based on an open rotor device of
23m rotor diameter moving at 10RPM), a collision may not result in a fatality, however, in order to provide a conservative
assessment it is assumed that all potential collisions result in fatality.
As outlined in the Underwater Noise Technical Report (Xodus 2015), there is uncertainty in the noise modelling. There are
limited available data for operation tidal turbines and there is uncertainty in the predicted noise associated with scaling up
devices as well as use of proxies to cover all devices in the Rochdale Envelope.
Another area of uncertainty relates to the availability of suitable noise data for the vessels likely to be used during the
project construction, operation and decommissioning. Where no suitable data were available, proxy noise data were used
based on similar sized vessels. However, given that the noise signature of vessels can vary significantly, even for vessels
in the same class, it is considered likely that this is an area of uncertainty. In order to carry out a precautionary assessment,
noise levels at the upper end of the range for each vessel class were used.
Finally, there is relatively high uncertainty regarding threshold criteria for the onset of both physiological and behavioural
effects, as used in underwater noise modelling. It is considered likely that the uncertainty in criteria for onset of effects is
potentially the highest source of error in the underwater noise assessment. The noise impact zones in the Underwater
Noise Technical Report (Xodus 2015) are considered to provide a highly precautionary worst case.
13.7 CONSULTATIONS
To inform the ES, BTAL has undertaken a pre application consultation process including:
Scoping (submitted to MS-LOT August 2013);
HRA Screening (submitted to Marine Scotland August 2013); and
General ongoing consultation (including survey methods, EIA methodology and baseline characterisation).
Table 13.3 summarises general consultation activities undertaken in relation to marine mammals and basking sharks, and
Table 13.4 summarises the consultation in relation to Scoping and HRA Screening.

Environmental Statement
Brims Tidal Array
Page 160 of 316
Table 13.3: Consultation activities undertaken in relation to marine mammals and basking sharks
Topic Stakeholder Comment Response/Action taken with cross-reference
where applicable
HRA
Screening
Scottish Natural
Heritage (SNH)
02/11/12
We agree that the sites identified thus far should be taken forward
for further consideration of potential LSE, but advise that other
sites may also be appropriate to maintain under consideration at
this stage. The Dornoch Firth and Morrich More SAC may be the
most relevant of these, but SNH are also currently considering
guidance on connectivity with Natura sites by marine mammals
such as seals, particularly out-with the breeding season when they
may range more widely.
We recommend use of two recent SNH commissioned reports in
proceeding with relevant sections of the EIA & HRA: SMRU
Limited (2011) and Evans et al. (2011b).
Dornoch Firth and Morrich More SAC have been
considered further in the Information to Inform HRA
report (Supporting Document: BTAL, 2015c).
SMRU Limited (2011) and Evans et al. (2011b) have
been used in the Information to Inform HRA report
(Supporting Document: BTAL, 2015c) and Sections
13.9.1, 13.9.2, 13.9.3, 13.9.4 and 13.9.5 of this ES
chapter.
Survey
methods for
birds, marine
mammals and
basking
sharks
SNH
02/11/12
We recommend a minimum of 12 survey visits per year. These
need not necessarily be spread evenly across the year, but could
be more frequent during the most sensitive periods for relevant
taxa.
There is no suggestion of passive acoustic technologies to detect
marine mammals at the site. We suggest the applicants consider
the options available.
It is suggested that marine mammal data be combined with results
from the Westray South site to support statistical analyses for
species with particularly low encounter rates, however, before
applying such a function it will be important to be able to
demonstrate that detectability does not differ significantly between
the sites as a consequence of any ecological differences.
Furthermore, any differences in detectability arising from
differences in observers or vessels, or the season or tidal state of
observations, should be accounted for.
Consultation regarding the surveys was ongoing
throughout the two years and advice taken into
account.
Twelve surveys per year were planned and surveys
were undertaken on a total of 20 days between March
2012 and March 2014. Due to bad weather no
surveys were possible during September 2012,
October 2012, November 2012, January 2013, April
2013, August 2013, November 2013, December 2013
or January 2014. In addition surveys could not be
completed for all transects in some months (August
2012, February 2013, May 2013, October 2013 and
March 2014). Further details are provided in Royal
HaskoningDHV (2014). Consultation with SNH and
MS throughout the surveys agreed the approach to
managing data gaps by supplementing with available
information (see below, SNH consultation on
07/02/13).

Environmental Statement
Brims Tidal Array
Page 161 of 316
Topic Stakeholder Comment Response/Action taken with cross-reference
where applicable
Passive Acoustic Monitoring (PAM) was also
conducted during the surveys. Further details are
provided in Supporting Document: MER, 2013.
Survey data from the Westray South site was used to
estimate grey seal density. The same survey
methods, observers and vessels were used at both
sites. As outlined in (Supporting Document: RHDHV,
2014c) the same detection function (g(0)=22) and
analysis were conducted using data up to and
including sea-state 3, but excluding sea-states 4 and
5.
Approach to
noise
assessment
and noise
monitoring
SNH
02/11/12
The approach described, only considers seals (grey and harbour)
and bottlenose dolphins in an acoustic impact study, as these are
the qualifying features of the identified SACs. However, the noise
assessment will not only inform the HRA, but also the EIA.
Consequently, as European Protected Species, all cetacean
species that may be found in these areas should also be
considered (see Evans et al. 2011a).
We welcome the commitment to designing post-consent
monitoring in consultation with Marine ScotlandMS-LOT and SNH.
It would also be advisable for us to provide comment on a more
detailed methodology for the pre-consent monitoring.
The noise modelling considers seals, high frequency
cetaceans, mid frequency cetaceans, low frequency
cetaceans and fish, including basking shark – see
Underwater Noise Technical Report (Supporting
Document: Xodus, 2015).
SNH will be consulted during development of the
Marine Mammal Management Plan (MMMP).
Survey
methodology
Marine Scotland
Science (MSS)
21/01/13
Because the bulk of the survey effort is in the 4km buffer area
there is likely to be bias in results away from the lease area, and
the data’s ability to characterise the development area may be
lessened. Survey effort should be focused on the Project footprint
and any anticipated impact footprint. A buffer may also provide
opportunity to increase sample sizes for less frequently
encountered species.
A more appropriate approach may be a reduction in buffer size
with the addition of transects within the lease area. These
It was agreed with Marine Scotland in April 2013 that
no changes to the survey methodology should be
made (See Marine Scotland Licensing Operations
Team (MS-LOT) 16/04/13 written response to Survey
methodology below). It was agreed that a consistent
methodology was important and should be
maintained, with survey data supplemented by other
available information, which is provided in Section
13.9.

Environmental Statement
Brims Tidal Array
Page 162 of 316
Topic Stakeholder Comment Response/Action taken with cross-reference
where applicable
additional transects should be spaced as close together as is
practical without causing disturbance of birds on adjacent
transects. To be clear, the original transects through the lease
area would be retained. These additional transects could be
completed before or after the main transects, with the reduced
length of the main transects resulting from reducing the size of the
buffer ensuring that total survey time was not increased. The
advantage of zigzag transects would be that they eliminate off-
effort time transiting between transects. Analysis of all data within
the lease area would provide much tighter confidence limits.
If any changes are made to the survey design then the monthly
effort (km surveyed and number of transects) should be presented
separately for both the lease area and the buffer area.
Interim wildlife
survey reports
SNH
07/02/13 letter
26/02/13
meeting
12/03/13 written
response
The amount of rest provided to observers should be described and
quantified in future reports.
We suggest that serious consideration be given to the use of
additional observers in rotation, for both birds and mammals.
It is noteworthy that sea conditions were sometimes more than
sea state 3, the threshold generally considered to worsen
detectability issues for marine mammal surveys. Consequently, it
may be expected that abundances are underestimated from these
survey visits and data should be corrected accordingly.
It was agreed with Marine Scotland in April 2013 that
no changes to the survey methodology should be
made (See Marine Scotland Licensing Operations
Team (MS-LOT) 16/04/13 written response to Survey
methodology below). Instead, as outlined in
(Supporting Document: RHDHV, 2014c), data
analysis were conducted using data for sea-states up
to 3, but excluding sea-states 4 and 5.
Survey
methodology
Marine Scotland
Licensing
Operations
Team (MS-LOT)
16/04/13 written
response
MS-LOT advises that no change in survey methodology is
adopted at this late stage. However, due consideration must be
given within the Environmental Statement to the potential biases
that may result from the relatively limited survey effort within the
Project site and immediate surrounds.
(Also discussed 07/02/13 by letter and at a meeting on 26/02/13).
Section 13.9, Baseline description draws on a variety
of data and information sources to provide context
and avoid issues of bias.
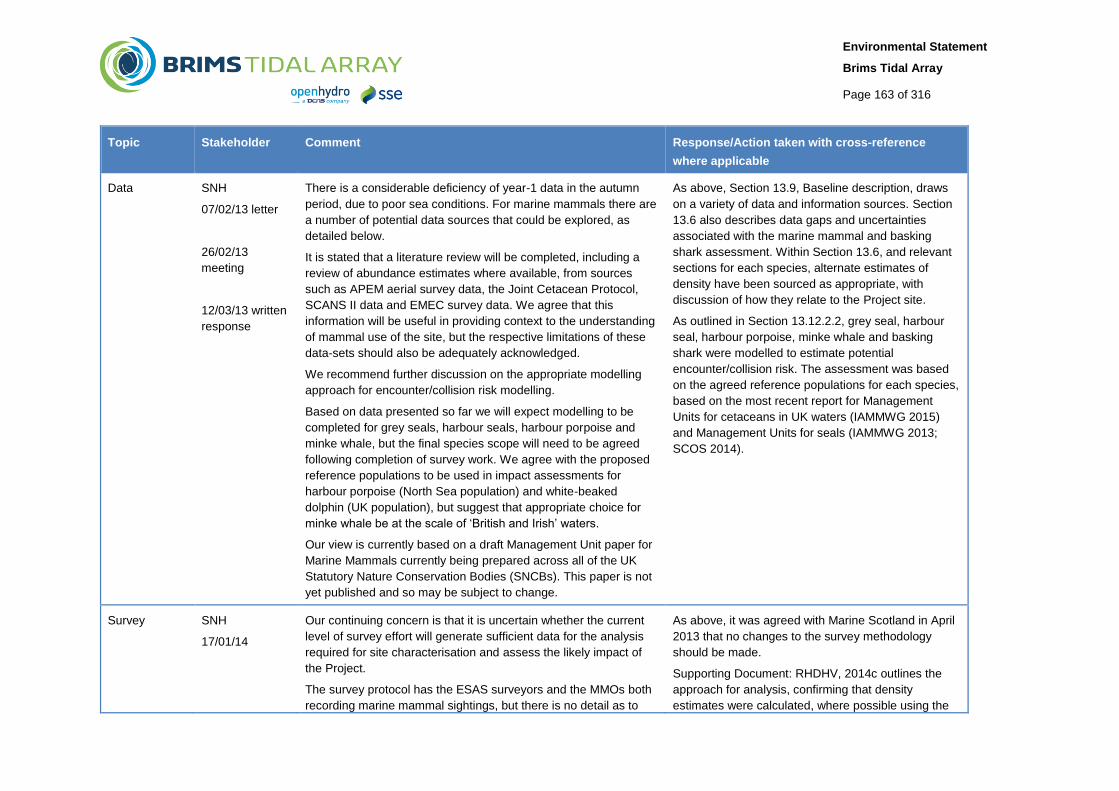
Environmental Statement
Brims Tidal Array
Page 163 of 316
Topic Stakeholder Comment Response/Action taken with cross-reference
where applicable
Data SNH
07/02/13 letter
26/02/13
meeting
12/03/13 written
response
There is a considerable deficiency of year-1 data in the autumn
period, due to poor sea conditions. For marine mammals there are
a number of potential data sources that could be explored, as
detailed below.
It is stated that a literature review will be completed, including a
review of abundance estimates where available, from sources
such as APEM aerial survey data, the Joint Cetacean Protocol,
SCANS II data and EMEC survey data. We agree that this
information will be useful in providing context to the understanding
of mammal use of the site, but the respective limitations of these
data-sets should also be adequately acknowledged.
We recommend further discussion on the appropriate modelling
approach for encounter/collision risk modelling.
Based on data presented so far we will expect modelling to be
completed for grey seals, harbour seals, harbour porpoise and
minke whale, but the final species scope will need to be agreed
following completion of survey work. We agree with the proposed
reference populations to be used in impact assessments for
harbour porpoise (North Sea population) and white-beaked
dolphin (UK population), but suggest that appropriate choice for
minke whale be at the scale of ‘British and Irish’ waters.
Our view is currently based on a draft Management Unit paper for
Marine Mammals currently being prepared across all of the UK
Statutory Nature Conservation Bodies (SNCBs). This paper is not
yet published and so may be subject to change.
As above, Section 13.9, Baseline description, draws
on a variety of data and information sources. Section
13.6 also describes data gaps and uncertainties
associated with the marine mammal and basking
shark assessment. Within Section 13.6, and relevant
sections for each species, alternate estimates of
density have been sourced as appropriate, with
discussion of how they relate to the Project site.
As outlined in Section 13.12.2.2, grey seal, harbour
seal, harbour porpoise, minke whale and basking
shark were modelled to estimate potential
encounter/collision risk. The assessment was based
on the agreed reference populations for each species,
based on the most recent report for Management
Units for cetaceans in UK waters (IAMMWG 2015)
and Management Units for seals (IAMMWG 2013;
SCOS 2014).
Survey SNH
17/01/14
Our continuing concern is that it is uncertain whether the current
level of survey effort will generate sufficient data for the analysis
required for site characterisation and assess the likely impact of
the Project.
The survey protocol has the ESAS surveyors and the MMOs both
recording marine mammal sightings, but there is no detail as to
As above, it was agreed with Marine Scotland in April
2013 that no changes to the survey methodology
should be made.
Supporting Document: RHDHV, 2014c outlines the
approach for analysis, confirming that density
estimates were calculated, where possible using the

Environmental Statement
Brims Tidal Array
Page 164 of 316
Topic Stakeholder Comment Response/Action taken with cross-reference
where applicable
how or if these data sets will be incorporated (as some may be of
the same animal). In which case, what data will be taken forward
to analysis. We recommend that the dedicated MMO observations
are considered first, with the ESAS observations as supporting.
MMO data with the ESAS marine mammal sightings
providing additional information.
Collision risk
assessment
SNH
17/01/14
In our scoping response of the 31st October 2013, we stated that
for the Project collision risk assessment the ERM was preferred.
However, considering the open-centre tidal turbine is the preferred
device, and our recent collision risk assessment for EMEC Falls of
Warness, it may be preferable to use the modified CRM as used
for the recent EMEC collision risk assessment. We welcome
further opportunity to discuss the approach taken to assess
collision risk for the proposed Brims Tidal Array and the species
that require assessment.
Section 13.12.2.2, within this chapter of the ES,
details how both of these approaches were used in
the assessment: ERM was applied to the unshrouded
devices (based on the ‘SNH (2015) underwater
collision spreadsheet and the EMEC (2014b) modified
ERM to the open centre tidal devices (OCT)
Approach to
assessment
(response to
position paper)
SNH
30/07/14
meeting
21/08/14 written
response
Additional data may include the MeyGen Environmental Statement
and APEM digital surveys of the Pentland Firth and Orkney
Waters.
North Rona SAC should be incorporated into the list of designated
sites. See recent guidance on designated haul out sites.
For cumulative assessment we advise that for all current and
planned activities in the MU to be accounted for where possible.
We agree with the use of PBR for context purposes and for
consideration in the cumulative assessment. We note that the
applicant suggest that there are alternative mechanisms to provide
context, but there is no detail included. We would welcome the
opportunity to explore this further.
We do not agree that the missing surveys are unlikely to have
affected the species composition as we do not have the
information to make that claim. We would refer you to Evans et al.
(2011b) for context.
As above, Section 13.9, Baseline description draws
on a variety of data and information sources. Section
13.6 describes data gaps and uncertainties
associated with the marine mammal and basking
shark assessment.
North Rona SAC has been included in the Information
to Inform HRA (Supporting Document: BTAL, 2015c).
The cumulative assessment has included all current
and planned activities that were confirmed with MS-
LOT and SNH (12/06/2015).
The PBR has been used for context purposes and
interim PCoD also be conducted for the Project– see
Sections 13.12.2.2
As outlined above, Section 13.9 Baseline description
draws on a variety of data and information sources,
including Evans et al. (2011b) – for example, see
Sections 13.9.4.1, 13.9.4.2, 13.9.4.3 and 13.9.5.4.

Environmental Statement
Brims Tidal Array
Page 165 of 316
Topic Stakeholder Comment Response/Action taken with cross-reference
where applicable
The Project site is almost on the boundary of two management
units for harbour porpoise. Given their wide ranging nature it
makes sense to also include the West Scotland MU in the
discussion (and for cumulative impacts).
We consider both seal species to be at risk from the corkscrew
injuries and would therefore suggest sensitivity for both should be
‘high’. Potential impacts such as corkscrew injuries and
disturbance should also be considered during maintenance
operations.
Details of the modified collision risk model (CRM), used for
considering annular turbines such as the OpenHydro turbine, can
be found in the EMEC Falls of Warness collision risk assessment
(Band, 2014).
Both MUs are included in Section 13.9, Baseline
description and taken forward as a combined
reference populations for the impact assessments.
Developments in understanding of ’corkscrew injuries’
have since been made and latest advice (SNCBs Feb
2015) is followed in the assessment: “it is considered
very likely that the use of vessels with ducted
propellers may not pose any increased risk to seals
over and above normal shipping activities and
therefore mitigation measures and monitoring may not
be necessary in this regard, although all possible care
should be taken in the vicinity of major seal breeding
and haul-out sites to avoid collisions.” – see Section
13.12.1.2.
Potential impacts assessed during operation and
maintenance include: Underwater noise; Collision with
devices; Collision with vessels; Electromagnetic
Fields; Disturbance at haul out sites; Indirect effects
on prey species; and Accidental contamination from
vessels or devices (Section 13.12.2).
As outlined above, both of these approaches were
used in the assessment (Section 13.12.2.2): ERM for
the unshrouded devices (based on the ‘2015 06 22 –
SNH underwater collision spreadsheet – June 2015
draft’) and the modified ERM for the open centre tidal
devices (OCT) (based on the ‘2014 09 05 – EMEC
FoW – tidal turbine collision assessment – sea
mammals’ spreadsheet).
SNH PVA might be more appropriate for putting the results of CRM into
context. PCoD is a quite novel approach and not yet used on tidal
sites so should be used with caution, but is a useful model. SNH
As outlined above, Section 13.12.2.2 uses the latest
advice from SNH on collision risk modelling: ‘2015 06
22 – SNH underwater collision guidance – June 2015

Environmental Statement
Brims Tidal Array
Page 166 of 316
Topic Stakeholder Comment Response/Action taken with cross-reference
where applicable
need to discuss this with MS-LOT and MSS. SNH to communicate
the results of this conversation to the BTAL team.
MS-LOT are looking to develop specific advice on collision risk
modelling for BTAL following discussions with SNH.
draft with watermark’ and ‘2015 06 22 – SNH
underwater collision spreadsheet – June 2015 draft’).
RSPB WDC should be consulted during the EIA/HRA before ES
submission.
Noted
PAM report Marine Scotland
written response
29/04/15
It would be helpful to have the PAM results incorporated into the
marine mammal survey updates and impact assessment reports
previously submitted.
The method states that the PAM operator was not dedicated to
that role.
Clarification is sought on what further work will be undertaken, and
what the conclusions mean in terms of the marine mammal impact
assessments.
The PAM results have been incorporated into site
characterisation (Section 13.9.3).
During surveys, the MMO’s monitored the system
regularly and the PAM data was recorded and
reviewed later.
Given the low detection rates, further detailed analysis
is not possible and instead the impact assessment will
draw information from other relevant sources.
Draft baseline
and approach
to impact
assessment
Marine Scotland
written response
09/07/15
Suggested altered wording regarding EPS legislation.
SNH survey guidance should be referred to as a draft.
Data sources are thorough and appropriate.
Query the use of percentages to determine magnitude.
MS confirmed that the thesis by Lindsey Wilson on harbour seal
diet is now available.
MS agrees with using SMRU at sea density estimates…..advise
that when density estimates are taken forward for further analysis,
the most precautionary one is used for a worst case estimate of
impact.
MS highlights that there are potential NC MPAs for Minke whales
and Risso's dolphins.
Wording changed regarding EPS legislation and SNH
guidance.
Percentages are used regularly in magnitude
classification e.g. for Offshore Wind EIA and are
useful when undertaking quantified impact
assessments such as has been done for BTAL
underwater noise and collision risk.
Wilson (2014) has now been incorporated.
Following submission of the draft baseline to Marine
Scotland in April 2015 a further review of all available
density estimates and which are most relevant to the
AfL. This is discussed throughout Section 13.9 with a
summary provided in Section 13.9.6.
NC MPAs are included in Section 13.4.

Environmental Statement
Brims Tidal Array
Page 167 of 316
Topic Stakeholder Comment Response/Action taken with cross-reference
where applicable
The feedback for Marine Scotland also includes comments on the
“impact assessment” however no impact assessment was
provided, rather a high level discussion of the approach. Where
applicable to this ES chapter these comments have been
incorporated.
SNH advice
on ERM and
CRM as well
as PCOD and
PBR
SNH written
response
30/10/15
Following the submission of two reports “Preliminary Assessment
of the Potential Encounter Rate and Collision Risk for Marine
Mammals and Basking Shark at the Brims Tidal Array Site” and
“Preliminary PCoD and PBR Assessment for Marine Mammals at
the Brims Tidal Array Site”. Key comments raised include:
Clarification of certain parameters e.g. surface clearance, rotor
width etc.
SNH agree with the species included in the assessment.
SNH clarified the species parameters in Band (2015) should be
used in modelling.
SNH agrees with the density estimates used but advises that
the modelling should also be run using the SMRU seals
densities and SCANS II densities for comparison.
SNH suggest that the modelling results using 0, 50, 95, 98, and
99% avoidance rates should all be presented.
SNH is content that the density estimates are correctly used in
the modelling in relation to correcting for the probability of
detecting an animal on the transect line (g(0)), included
adjustment for availability bias in the model (which should be
clearly detailed in the report and ES).
The following reference population estimates should be used:
Grey seal – 20,682 (SCOS 2014)
Harbour seal – 1,938 (SCOS 2014)
Cetaceans – used management unit population estimates
in IAMMWG (2015)
All project parameters used in the collision risk
modelling are outlined in Table 13.2.
Species parameters from Band (2015) have been used
in the final modelling (see Table 13.29).
The ERM, CRM (for unshrouded devices) and modified
ERM (for the OCT device) were run using the SCANS
cetacean density estimates and SMRU seal density
estimates and the results are provided in Appendices
1, 3 and 4, respectively.
Encounter rates (with 0% avoidance) and the collision
risk associated with a range of avoidance rates (0, 50,
95, 98 and 99%) are presented for all models (see
Section 13.12.2.2 and Appendices 1 to 4).
The density estimates presented have all been
corrected and therefore no further adjustment is made
in the model, this is outlined in Section 13.12.2.2.
The recommended reference populations have been
used and are summarised in Table 13.26.
Adult survival of 0.85 and fecundity of 0.96,
representing a stable population as suggested by SNH
has been used in the interim PCoD for harbour
porpoise as discussed in Section 13.8.2.1.
Comparison of the undisturbed populations shows the
greatest difference between comparable populations is
0.141 (based on the 2% decline scenario for the
harbour porpoise North Sea population). As this is on a
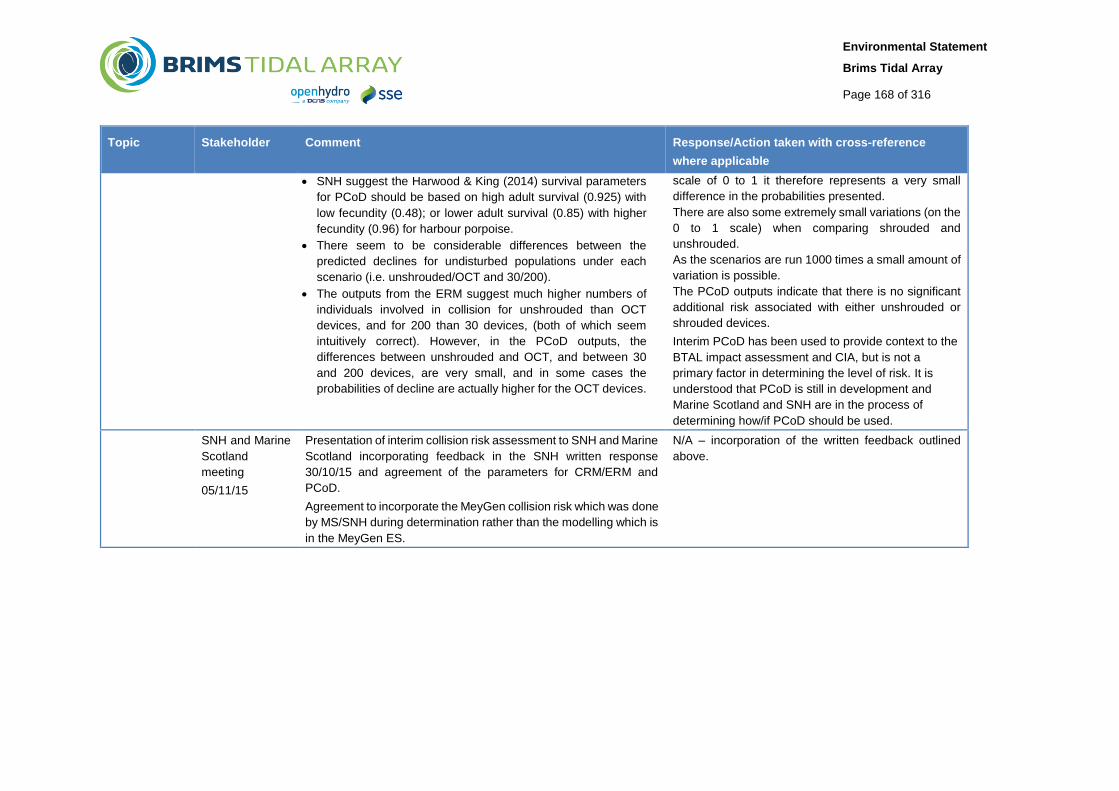
Environmental Statement
Brims Tidal Array
Page 168 of 316
Topic Stakeholder Comment Response/Action taken with cross-reference
where applicable
SNH suggest the Harwood & King (2014) survival parameters
for PCoD should be based on high adult survival (0.925) with
low fecundity (0.48); or lower adult survival (0.85) with higher
fecundity (0.96) for harbour porpoise.
There seem to be considerable differences between the
predicted declines for undisturbed populations under each
scenario (i.e. unshrouded/OCT and 30/200).
The outputs from the ERM suggest much higher numbers of
individuals involved in collision for unshrouded than OCT
devices, and for 200 than 30 devices, (both of which seem
intuitively correct). However, in the PCoD outputs, the
differences between unshrouded and OCT, and between 30
and 200 devices, are very small, and in some cases the
probabilities of decline are actually higher for the OCT devices.
scale of 0 to 1 it therefore represents a very small
difference in the probabilities presented.
There are also some extremely small variations (on the
0 to 1 scale) when comparing shrouded and
unshrouded.
As the scenarios are run 1000 times a small amount of
variation is possible.
The PCoD outputs indicate that there is no significant
additional risk associated with either unshrouded or
shrouded devices.
Interim PCoD has been used to provide context to the
BTAL impact assessment and CIA, but is not a
primary factor in determining the level of risk. It is
understood that PCoD is still in development and
Marine Scotland and SNH are in the process of
determining how/if PCoD should be used.
SNH and Marine
Scotland
meeting
05/11/15
Presentation of interim collision risk assessment to SNH and Marine
Scotland incorporating feedback in the SNH written response
30/10/15 and agreement of the parameters for CRM/ERM and
PCoD.
Agreement to incorporate the MeyGen collision risk which was done
by MS/SNH during determination rather than the modelling which is
in the MeyGen ES.
N/A – incorporation of the written feedback outlined
above.

Environmental Statement
Brims Tidal Array
Page 169 of 316
Table 13.4: Scoping (August 2013) comments relevant to marine mammals and basking sharks
Topic Stakeholders Comment Response/Action taken with cross reference where
applicable
Collision risk MSS BTAL will need to carry out a full encounter risk assessment
for marine mammals, including as a minimum harbour and
grey seals, and harbour porpoise.
This has been done and the approach developed in
consultation with SNH (see Table 13.3).
Underwater
noise
MSS Depending upon the selected methods for installation of the
devices, it may be necessary to assess the impact of
construction noise on marine mammals. We would consider
this necessary for pile driving and potentially for drilling.
Potential impacts related to fatal interactions between seals
and ducted propellers on construction and maintenance
vessels should be assessed in the application.
Marine Scotland Science is in the process of commissioning
a study of the noise produced by operational tidal turbines
and its potential impacts on marine mammals, which BTAL
may wish to refer to if it is available in a suitable time frame
(anticipated Q2/Q3 2014).
Underwater noise modelling is described in Support
Document (Xodus, 2015) and the predicted impacts on
marine mammals described in Section 13.10. The noise
modelling assesses drilling. There will be no pile driving
The impact assessment for potential collision with vessels,
provided in Section 13.12.1.2, uses the latest guidance
from the SNCBs (as discussed in Table 13.3)
Marine Scotland (2014) provides the study of noise
produced by operational tidal turbines and its potential
impacts on marine mammals. This has been taken into
consideration in terms of the required baseline information
(Section 13.9) and in defining the potential impacts
(Supporting Document: Xodus, 2015) and Section 13.10)
Underwater
noise
Orkney Islands
Council
Address construction noise, noise from all operations, noise
from onshore and offshore installations, noise from
associated works, and cumulative effects.
As above, underwater noise modelling is described in
Xodus (2015) and the predicted impacts on marine
mammals described in Section 13.12.1.
HRA Orkney Islands
Council
The information to be submitted with the EIA should also be
sufficient to enable the competent authority to make an
Appropriate Assessment of the implications for the site if
required by the regulations.
An ‘Information to Support HRA’ report is submitted with
the application which draws on information from the ES
and aims to support the competent authorities AA process.
Underwater
noise
Whale and Dolphin
Conservation
(WDC)
There is considerable scientific uncertainty surrounding the
impacts of pile driving during construction on all species,
and in this region. As a result, our preference is that pile
driving is not used at all during construction. An effective
underwater noise mitigation plan needs to be developed
within the Project Environmental Management Plan (PEMP)
The project will not include pile driving.
WDC will be involved in production of the PEMP

Environmental Statement
Brims Tidal Array
Page 170 of 316
Topic Stakeholders Comment Response/Action taken with cross reference where
applicable
for all the potential support structures. WDC requests
involvement in the Project of the PEMP.
Ducted
propellers
Whale and Dolphin
Conservation
(WDC)
Ducted propellers should not be permitted unless they are
guarded, or potential impacts can be effectively mitigated in
some other way. If ducted propellers are to be used, a
proposed Seal Corkscrew Injury Monitoring Scheme
(SCIMS) should be developed.
Developments in understanding of this issue have since
been made and latest advice (SNCAs Feb 2015) is
followed in the assessment.
HRA
Screening
Whale and Dolphin
Conservation
(WDC)
Dornoch Firth and Morrich More SAC for harbour seals
should be changed to 'Potential LSE' due to the severe
declining population of this species and also to account for
cumulative effects.
Considered within the ‘Information to Support HRA’ report.
Protected
species
Whale and Dolphin
Conservation
(WDC)
Whilst not a requirement for the HRA, the potential impact
on other cetacean species e.g. minke whale, harbour
porpoise and white-beaked dolphin, which are listed as
Priority Marine Features and minke whale and white-beaked
dolphin are drivers in the Scottish Marine Protected Areas
project, should also be given adequate consideration.
These species are assessed, where appropriate in
Section 13.12.
Marine bird
and marine
mammal
characterisat
ion surveys
SNH We note that surveys will continue for a second year and will
hopefully address the issues raised in our previous
response of the 12th March 2013, including the autumn and
winter data gaps. MS-LOT advised the applicant to continue
with the same survey methods, and stated that ‘due
consideration must be given within the Environmental
Statement to the potential biases that may result from the
relatively limited survey effort within the Project site and
immediate surrounds’.
See March 2013 consultation responses in Table 13.3
above.
Seal haul
out sites
SNH The applicant will also need to consider the proposed
designated seal haul-outs.
Assessed in Section 13.12.
Ducted
propellers
SNH We highlight that due consideration should be given to the
most recent knowledge available relating to ‘corkscrew’
injuries to seals, consistent with seals being drawn through
Developments in understanding of this issue have since
been made and latest advice (SNCAs Feb 2015) is
followed in the assessment.

Environmental Statement
Brims Tidal Array
Page 171 of 316
Topic Stakeholders Comment Response/Action taken with cross reference where
applicable
a ducted propeller such as a Kort nozzle or some types of
Azimuth thrusters. Vessels used for the proposed Project
could use such equipment.
Collision risk
modelling
SNH We recommend that collision risk modelling is undertaken
for marine mammals.
Modeling has been undertaken for the worst case scenario
for shrouded and unshrouded devices using the model
and guidance provided by SNH (2015a and 2015b) for
unshrouded devices and based on the modified ERM for
shrouded open centre devices using EMEC (2014b).
European
Protected
Species
SNH Consideration of European Protected Species must be
included as part of the application process, not as an issue
to be dealt with at a later stage. Any consent given without
due consideration to these species is likely to breach
European Directives with the possibility of consequential
delays or the Project being halted by the EC.
Section 13.4 discusses EPS, with the cetacean species
relevant to the BTAL Project discussed further in Section
13.9.3, and the impacts on cetaceans assessed in Section
13.12. A licence to disturb EPS will be applied for post
consent, if required, once the final details of the project
design are known. It is generally best to wait to apply for
the EPS Licence, if needed, once all the project details
have been agreed and finalised so that as much detail can
be included, realistic impacts assessed and what
mitigation will be put in place. The EPS licence, if required,
will draw on information provided in this ES chapter.
HRA In the scoping report, potential LSE has been concluded for
bottlenose dolphins from the Moray Firth SAC. Although this
species is wide ranging, there are limited observations of
bottlenose dolphin in the Pentland Firth and Orkney Waters.
We are considering our advice internally over this topic
[connectivity with SACs] and expect to be able to provide
guidance to the applicant in due course. Baseline surveys
during the nonbreeding season will provide further
information to inform the HRA/EIA. We currently advise,
therefore, no LSE for the Isle of May SAC and Berwickshire
and North Northumberland Coast SAC.
Considered within the ‘Information to Support HRA’ report.

Environmental Statement
Brims Tidal Array
Page 172 of 316
13.8 ASSESSMENT METHODOLOGY
13.8.1 Assessment Criteria
The overarching EIA process and methodology will follow the approach described in Chapter 7. A matrix approach will be
used as a tool to inform the impact assessment along with expert opinion and consideration of uncertainty, following best
practice, best available scientific understanding and relevant EIA guidance (e.g. IEEM 2010). The approach to assessment
is summarised below:
Receptor sensitivity for an individual from each marine mammal species or basking sharks will be independently
defined (in the impact assessment, Section 13.12) using best available scientific information following the definitions
set out in Table 13.5;
The potential magnitude of effect takes account of the duration, extent and reversibility of the effect, and will be
described for permanent and temporary outcomes, as detailed in Table 13.6;
The sensitivity of receptor and magnitude of impact are then combined to determine the consequence of the impact.
The definitions for impact consequence are presented in Table 13.7; and
Impact significance is then considered by reference to the relevant criteria in the EIA Regulations, with those impacts
defined as major and moderate considered to be significant under the EIA Regulations.
In this assessment value has not be assigned to marine mammal ecological features within the assessment matrix. Instead
the approach used here reflects the inherent value of the populations of all marine mammal species and basking shark,
which may be found in the area considered in the assessment. High value is assigned to all species assessed in this
chapter, based on the level of international and national protection afforded to these species/populations, as outlined in
Section 13.4. This inherent high value is taken forward in the impact assessment through consideration of the definitions
for magnitude of effect and receptor sensitivity, and the level at which the potential for a significant effect to occur at the
population level.
Table 13.5: Definitions for sensitivity of marine mammals and basking sharks
Sensitivity Criteria
High Individual receptor has no capacity to avoid, adapt to, accommodate or recover from
the anticipated impact.
Medium Individual receptor has limited capacity to avoid, adapt to, accommodate or recover
from the anticipated impact.
Low Individual receptor has some tolerance to avoid, adapt to, accommodate or recover
from the anticipated impact.
Negligible Individual receptor is generally tolerant to and can accommodate or recover from the
anticipated impact.

Environmental Statement
Brims Tidal Array
Page 173 of 316
Table 13.6: Definitions for magnitude of effect for marine mammals and basking sharks
Magnitude Criteria
High Permanent irreversible change to exposed receptors or feature(s) of the habitat which are of particular
importance to the receptor.
Assessment indicates that >1% of the reference population is anticipated to be exposed to the effect.
OR
Temporary effect (limited to phase of development or Project timeframe) to the exposed receptors or
feature(s) of the habitat which are of particular importance to the receptor.
Assessment indicates that >10% of the reference population is anticipated to be exposed to the effect.
Medium Permanent irreversible change to exposed receptors or feature(s) of the habitat of particular
importance to the receptor.
Assessment indicates that >0.01% or <=1% of the reference population anticipated to be exposed to
effect.
OR
Temporary effect (limited to phase of development or Project timeframe) to the exposed receptors or
feature(s) of the habitat which are of particular importance to the receptor.
Assessment indicates that >5% or <=10% of the reference population anticipated to be exposed to
effect.
Low Permanent irreversible change to exposed receptors or feature(s) of the habitat of particular
importance to the receptor.
Assessment indicates that >0.001 and <=0.01% of the reference population anticipated to be exposed
to effect.
OR
Intermittent and temporary effect (limited to phase of development or Project timeframe) to the
exposed receptors or feature(s) of the habitat which are of particular importance to the receptor.
Assessment indicates that >1% or <=5% of the reference population anticipated to be exposed to
effect.
Negligible Permanent irreversible change to exposed receptors or feature(s) of the habitat of particular
importance to the receptor.
Assessment indicates that <=0.001% of the reference population anticipated to be exposed to effect.
OR
Intermittent and temporary effect (limited to phase of development or Project timeframe) to the
exposed receptors or feature(s) of the habitat which are of particular importance to the receptor.
Assessment indicates that <=1% of the reference population anticipated to be exposed to effect.
Positive The impact is positive and to be encouraged.

Environmental Statement
Brims Tidal Array
Page 174 of 316
Table 13.7: Assignment of impact significance for marine mammals and basking shark based on sensitivity of receptor and magnitude of effect
Sensitivity of
Receptor
Magnitude of effect
High Medium Low Negligible
High MAJOR MAJOR MODERATE MINOR
Medium MAJOR MODERATE MINOR MINOR
Low MODERATE MINOR NEGLIGIBLE NEGLIGIBLE
Negligible MINOR NEGLIGIBLE NEGLIGIBLE NEGLIGIBLE
Any impact ≥ moderate is significant under EIA regulations.
13.8.2 Collision risk assessment methodology
The latest draft guidance from SNH (Band 2015) outlines the use of two models for assessing collision risk between marine
mammals and basking shark with unshrouded tidal turbines and provides template Excel spreadsheets for each model:
“Collision Risk Model” (CRM) based on the Band model used for bird collision with wind farms; and
“Encounter Rate Model” (ERM) based on the work by the Scottish Association for Marine Science (SAMS) (Wilson et
al. 2007).
Both models provide both “encounter rate” (number of animals which may encounter a turbine in the absence of avoidance
action) and “collision rate” (number of animals potentially at risk of collision taking into account likely avoidance).
Band (2014) noted that, for small animals e.g. birds, the ERM is likely to over-estimate encounter rate, as it does not take
account of the geometry of the blade and the likelihood that a small animal may pass between blades, , however this is
unlikely to be an issue for marine mammal species. For large animals like marine mammals, an encounter with more than
one successive blade is quite possible. As the ERM calculates the encounter rate with individual blades, rather than with
the turbine as a whole, it counts such events as multiple encounters. In contrast, the CRM counts such events as a single
no-avoidance collision. This is an issue, particularly for large animals such as basking shark and minke whale. Collision
risk using ERM is presented in Section 13.12.2.2 and taken forward in the assessment of the population level impacts.
Results using CRM are presented in Appendices 2 and 3.
EMEC (2014b) provides a model for the OpenHydro OCT device based on a modified version of the ERM. Annular devices
have a ring of blades, surrounding an open central core. The open core has potential to allow clear passage of animals
and so the model takes into account the area of the open core and the body-width of the animal, and therefore the potential
for the animal to pass safely either within the open core or outside the turbine (Band 2014).
13.8.2.1 PCoD methodology
The interim version of the Population Consequences of Disturbance (PCoD) has been developed as an approach for
assessing and quantifying the potential consequences for marine mammal populations of any disturbance and/or injury
that may result from offshore enerpcod developments (Harwood et al. 2014).

Environmental Statement
Brims Tidal Array
Page 175 of 316
The protocol provides estimates of the potential effects of death, injury, and behavioural disturbance associated with marine
renewable energy developments on the conservation status of the populations of marine mammal species. The interim
PCoD protocol has been used to put the ERM results into context in Section 13.12.2.2.
The Interim PCoD was run by SMRU Consulting Ltd using R and RStudio, with the necessary libraries installed. Species
files were set up for grey seal, harbour seal, harbour porpoise and minke whale for the relevant management units and
key demographic rates (see Table 13.8 to Table 13.11). Scenarios were run using the collision risk outputs from the ERM
outlined in Table 13.30 to Table 13.33. All scenarios were run for 1000 simulations, as recommended for an impact
assessment. The simulations were set to run for 25 years in line with the planned life of the Project.
The results were used to determine the median difference between the disturbed population (with devices) and undisturbed
populations (without devices) to indicate possible change in population size. The cumulative (during the life-time of the
Project, i.e. not with other projects) probability of 1%, 2%, 5% and median annual declines in the population 1 year, 6 years,
12 years and 18 years after the installation of the Project were also calculated and plotted for Stage 1 for 30 unshrouded
three-blade devices or 30 OCT devices and Stage 1 and 2 for 200 unshrouded three-blade devices or 200 OCT devices.
Probability is on a scale of 0 to 1, where 1 is 100% probability.
The marine mammal Management Units (MU) for each species (grey seal, harbour seal, harbour porpoise and minke
whale), that could potentially be affected by the Project are shown in Table 13.8 to Table 13.11. The estimates for the
current size of the population in the relevant MUs were taken from SCOS (2014) for seals and the most recent Inter-Agency
Marine Mammal Working Group reports (IAMMWG 2015) for cetaceans. The key demographic rates for each of these
populations were taken from (Harwood and King 2014), which included:
annual survival rate for pups or calves;
annual survival rate for juveniles (animals that are not yet able to give birth);
annual survival rate for adults;
average age at which females give birth for the first time; and
fecundity (probability of giving birth) for mature females for each population.
The value for the proportion of each of these populations that is likely to be vulnerable to the effects of the Project was
taken to be one, in that the entire population could be vulnerable.

Environmental Statement
Brims Tidal Array
Page 176 of 316
Table 13.8: Harbour porpoise management unit and key demographic rates
Species Harbour porpoise
Management Unit North Sea (NS) West Scotland (WS)
Population Size 227,298 21,462
Growth rate 1 1
Age2: age at first breeding 5 5
Age1: age at independence 1 1
Calf Survival Rate 0.6 0.6
Juvenile Survival Rate 0.85 0.85
Adult Survival Rate 0.85 0.85
Fecundity 0.96 0.96
Source: IAMMWG (2015), Harwood and King (2014), Hammond et al. (2013)
Note: Both NS and WS based on lower adult survival and higher fecundity
Table 13.9: Harbour seal management unit and key demographic rates
Species Harbour seal
Management Unit Orkney and North Coast
Population Size 1,938
Growth rate 0.915
Age2: age at first breeding 4
Age1: age at independence 1
Pup Survival Rate 0.6
Juvenile Survival Rate 0.56
Adult Survival Rate 0.86
Fecundity 0.88
Source: SCOS (2014), Harwood and King (2014)
Table 13.10: Grey seal management unit and key demographic rates
Species Grey seal
Management Unit Orkney and North Coast
Population Size 20,682
Growth rate 1.01
Age2: age at first breeding 5
Age1: age at independence 1
Pup Survival Rate 0.235
Juvenile Survival Rate 0.94
Adult Survival Rate 0.94
Fecundity 0.84
Source: SCOS (2014), Harwood and King (2014)

Environmental Statement
Brims Tidal Array
Page 177 of 316
Table 13.11: Minke whale management unit and key demographic rates
Species Minke whale
Management Unit Celtic and Greater North Seas (CGNS)
Population Size 23,528
Growth rate 1
Age2: age at first breeding 9
Age1: age at independence 1
Calf Survival Rate 0.70
Juvenile Survival Rate 0.77
Adult Survival Rate 0.96
Fecundity 0.91
Source: IAMMWG (2015), Harwood and King (2014), Hammond et al. (2013)
Information to conduct the interim PCoD assessment is currently not available for white-beaked dolphin, killer whale
Orcinus orca and Risso’s dolphin (Harwood and King 2014).
13.9 BASELINE DESCRIPTION
13.9.1 Introduction
In UK waters, two groups of marine mammals commonly occur: cetaceans (whales, dolphins and porpoises) and pinnipeds
(seals). Of these two groups, eleven species of cetacean may be seen regularly throughout the year including: minke
whale, fin whale Balaenoptera physalus, sperm whale Physeter macrocephalus, killer whale, humpback whale Megaptera
novaeangliae, harbour porpoise, bottlenose dolphin, short-beaked common dolphin, Risso’s dolphin, Atlantic white-sided
dolphin Lagenorhynchus acutus and white-beaked dolphin. Two seal species are common and resident in UK waters: grey
seal and harbour (or common) seal.
The cetacean data used to inform the baseline incorporates the most recent assessments of UK marine mammal
populations occurring within UK waters, as identified through the Habitats Directive 3rd UK reporting round (JNCC 2013),
whose range encompasses the AfL area and cable corridor as well as the results of site specific surveys. The Favourable
Conservation Status (FCS) assessment at the 3rd UK reporting round for the regularly occurring cetacean species are
presented in Table 13.12.
The Inter Agency Marine Mammal Working Group (IAMMWG) Management Units (MUs) for marine mammals in UK waters
have been used as appropriate reference populations for marine mammal species (IAMMWG 2013, 2015), and this
approach has been agreed informally during consultation with SNH and Marine Scotland.
The data presented by Evans et al. (2011), Reid et al. (2003), SCANS I (Hammond et al. 2002), SCANS II (Hammond et
al. 2013), SMRU Ltd (2011) and JNCC (2013) confirm that several marine mammal species occur regularly in Pentland
Firth and Orkney waters. These include grey seal, harbour seal, harbour porpoise, minke whale, white-beaked dolphin,
Risso’s dolphin, bottlenose dolphin and killer whale.
Short-beaked common dolphin, Atlantic white-sided dolphin, long-finned pilot whale Globicephala melas and sperm whale
can be considered as casual visitors, occurring more regularly in offshore waters (Evans et al. 2011). These cetacean

Environmental Statement
Brims Tidal Array
Page 178 of 316
species are not considered further in this assessment as the AfLis sited in inshore waters, and none of these species were
seen during the site specific surveys (Royal HaskoningDHV 2014).
Basking shark is also a casual visitor but was recorded during the Project site specific surveys and is given further
consideration in Section 13.9.5.
Table 13.12: FCS assessment for common cetacean species in Annex IV of the Habitats Directive occurring in Orkney and Pentland Firth waters (JNCC 2013)
Species FCS assessments
Harbour porpoise Favourable
Minke whale Favourable
White-beaked dolphin Favourable
Risso’s dolphin Unknown
Bottlenose dolphin Favourable
13.9.2 Pinnipeds
13.9.2.1 Grey Seal
Population Status
The geographical range of the grey seal is restricted to the Northern hemisphere. In the north east Atlantic, distribution is
centred on breeding colonies in the UK (predominantly Scotland), Iceland, Norway, Ireland, and the Baltic. Grey seal breed
annually when females come ashore to give birth on land or ice during which time the females fast. In the UK, the breeding
season is between September and December, conception occurs at the end of lactation, three to four weeks after giving
birth. Grey seal spend a greater proportion of their time ashore during the annual moult (four months after conception)
when delayed implantation of the fertilised egg occurs (Hall 2002).
The UK holds approximately 38% of the world’s grey seal breeding population; estimated at 111,600 individuals (95%
confidence interval (CI) 92,000-137,900) based on the most recent complete surveys from 2010 (SCOS 2014). The overall
population size is estimated through a population modelling approach to extrapolate survey derived pup production
estimates. In the UK, the major grey seal breeding colonies in Scotland are monitored using aerial surveys by the Sea
Mammal Research Unit (SMRU) to estimate pup production. The total number of pups born at colonies in 2012 in the UK
was estimated to be 56,988 (95%CI=56,317-57,683) of which 22,926 were estimated to be from Orkney colonies (SCOS
2014). Pup production in Orkney has been increasing over recent years, the 2012 estimate (SCOS, 2014) represented a
6.2% increase on the 2010 estimate, and average rate of increase between 2006 and 2012 was 3.0% per annum. Thomas
(2014) estimates that the population size of grey seal in Orkney in 2013 was 43,500 (95%CI 36,600-53,300) (provided in
the SCOS 2014 briefing paper). Thompson et al. (2014) provides a minimum population estimate of 20,682 for the Orkney
management unit which is used in the impact assessment in order to be conservative.
In addition to surveys during the breeding season, grey seals are also counted during August surveys using a thermal
imaging camera. The most recent survey was competed in 2013 (Duck & Morris 2014). A total of 8,079 grey seal were

Environmental Statement
Brims Tidal Array
Page 179 of 316
counted in the Orkney and North coats management area, with numbers being comparable to earlier surveys. The number
of grey seal counted on Hoy in 2013 was 293, or 3.6% of the total count.
Marine Scotland and The Crown Estate funded aerial surveys of the Pentland Firth and Orkney waters in 2012 and 2013
(APEM 2013). Grey seal were frequently sighted in all seasons, with peak counts during the October/November surveys.
Most of the sightings were in the near-shore areas (within 3km of the shore). Population estimates during this peak sighting
period were 22,960 (95%CI=11,722-35,726) for the near-shore areas, and 8,285 (95%CI=96-24,856) for the wider area.
The sightings were aggregated around the major breeding colonies in the region (APEM 2013).
Reference Population for Assessment
The reference populations to be used in the assessment for grey seal is based on IAMMWG Management Units (MUs)
and the most recent population estimates of these units based on updated SCOS information. The reference population
for this assessment will be the Orkney and North Coast MU shown in Figure 13.2 (IAMMWG 2013) with a population of
20,682 (SCOS 2014).
Under the Marine (Scotland) Act 2010 licences can be issued to shoot seals e.g. for fish farm protection. The management
of the maximum number of licences is controlled using the concept of Potential Biological Removal (PBR). PBR is the
number of individual seals that can be removed from the population without causing a decline in the population and is
calculated annually by SMRU using the latest seal counts. The most recent, 2015, PBR for the Orkney and North Coast
MU is 1,240 grey seals, with 220 licences granted (Scottish Government 2015).

Environmental Statement
Brims Tidal Array
Page 180 of 316
Figure 13.2: Seal Management Units (IAMMWG 2013)
Diet
The grey seal is an opportunistic predator of fish and invertebrates. Three major studies have been conducted on grey
seal diet, in 1985, 2002 and between 2010-2012 (Hammond & Grellier 2006, Wilson & Hammond 2012). The results of the
most recent study are not yet published. In 1985, the diet of grey seal in Orkney was strongly dominated by sandeel, in
2002, the diet was composed of more than 50% sandeel throughout the year and gadoids were the next most common
prey, especially in quarter 1 (Hammond & Grellier 2006). Between 1985 and 2002 there was a change in diet; dominated
by an increase in the percentage of gadoids taken (approximately 20% in 2002 versus approximately 10% in 1985) and a
decrease in the percentage of sandeel taken (approximately 60% in 2002 versus approximately 80% in 1985). A strong
feature of this difference was a large increase in the percentages of cod and haddock taken in the first quarter of the year.
Recent evidence has shown grey seal predating on other small marine mammals, including juvenile grey seal (Thompson
et al. 2015), harbour seal (van Neer et al. 2014) and harbour porpoise (Stringell et al. 2015).

Environmental Statement
Brims Tidal Array
Page 181 of 316
At Sea Distribution
SMRU Ltd (2011) compiled grey seal tagging data from deployments in the Pentland Firth and Orkney waters as part of
an SNH commissioned report. Telemetry data from 61 tagged grey seals (including four pups) that entered the area, and
17 adult grey seal tagged at North Rona SAC, were examined. Seals tagged at Abertay, the Farne Islands, Inner Hebrides,
Isle of Mat, Monach Islands, Moray Firth, Shetland, Orkney and North Rona, all entered Pentland Firth and Orkney waters.
Grey seal dived to depths of up to 100m, with a mean depth of 29.83m, mean duration of 3.82 minutes, mean time at
surface on 27.09%, and mean speed of 0.54m/s (SMRU Ltd 2011). There was a major overlap between grey seals and
high tidal current sites around Stroma and the Pentland Skerries where there are large numbers of grey seals hauled out
(Figure 13.3).
. Figure 13.3: Grey seals tagged with SMRU Argos and SMRU GSM/GPS tags which at least
once entered the Pentland Firth and Orkney Strategic Area (excludes the grey seals tagged at North Rona) (SMRU Limited 2011)
In 2010 SMRU Ltd undertook a tagging programme on recently weaned grey seal pups in Orkney (Thompson 2012). The
study was focussed on investigating the initial foraging behaviour of weaned grey seal pups from two sites; Stroma in the
Pentland Firth and Muckle Greenholm close to the EMEC site in the Falls of Warness. Highly detailed movement and dive
behaviour records have been received from 15 of the tagged seals. The seals showed wide ranging and variable
movement, some travelling to forage more than 400km from the tagging sites, others remaining within the Orkney area.
Further analysis of these data are expected which should allow data will allow estimates of the rate at which tagged grey

Environmental Statement
Brims Tidal Array
Page 182 of 316
seal pups travelled through areas of potential tidal turbine deployments, although this work is not yet published (Thompson
2012).
As part of the MeyGen ES a number of baseline studies were completed, including boat-based transect surveys (MeyGen
2011). The MeyGen AfL is approximately 15km from the AfL area. Grey seal was the most commonly sighted species
during the boat-based transect and stationary point surveys, as well as the land-based vantage point surveys. Mean density
estimates from the boat based surveys were 0.266 individuals per km2 (95% CI=0.073-0.699) with peak densities of 0.555
individuals per km2 (95%CI=0.0122-25.286, MeyGen 2011). The Inner Sound survey area at MeyGen may provide a
comparable environment to the AfL area, however, it should be noted that the MeyGen survey area included waters directly
adjacent to a major grey sea breeding and haul out site on the south west tip island of Stroma, where more than 100 grey
seal commonly haul our during the summer months, and breed during the autumn. There are no comparable haul-outs
adjacent to the AfL area, therefore average densities of grey seal in the Inner Sound are likely to be higher than at the AfL
area.
Regular surveys at the EMEC Falls of Warness tidal test site, from July 2005 to March 2014 were undertaken from a single
observation point on the island of Eday over-looking the test site, covering an area of approximately 8.75km2. Mean areal
density estimates for grey seals, were calculated at 0.028 individuals per km2 based on surface observations of 0.01
individuals per km2 (EMEC 2014a).
No estimates of density were generated from the APEM (2013) aerial surveys.
Marine Scotland commissioned SMRU to map seal density estimates based on telemetry data around the UK collected
between 1991 and 2011 (Jones et al. 2013). These density estimates provide an estimate of seal usage in an area as they
focus on the ‘at-sea’ seal numbers based on extensive telemetry deployments and population surveys. Estimates of density
are provided per 25km2 grid cells (Figure 13.4); the AfL area covers two grid cells with estimates with mean, upper 95%CI
and lower 95%CI at seas usage estimates as shown in Table 13.13. The mean estimate over the whole area (over the two
grid cells) is 2.07 individuals per km2 (upper and lower 95%CIs from the two grid cells of 6.42 and 0 individuals per km2).

Environmental Statement
Brims Tidal Array
Page 183 of 316
Figure 13.4: Grey seal mean at sea density (Jones et al. 2013)
Table 13.13: Grey seal at sea usage (density) estimates (number of individuals per 25km2) for the two grid cells covering the AfL area (Jones et al. 2013)
Mean densities Upper 95% Cl Lower 95% Cl
36.875 75.0 0
66.748 160.7 0

Environmental Statement
Brims Tidal Array
Page 184 of 316
Site Specific Surveys
During the site specific surveys (Supporting Document: RHDHV, 2014c) grey seal were seen throughout the year, with
some indication of higher sightings rates during the summer and autumn months. The average sighting rate made by the
dedicated MMOs was 0.99 grey seal individuals per hour (not corrected for availability). The ESAS surveyors recorded
fewer grey seal sightings than the dedicated MMOs.
It was possible to combine the Project survey area sightings with those made at Westray South Tidal Array to generate a
global detection function. The surveys were undertaken using the same survey method and completed over same survey
period (see Supporting Document: RHDHV, 2014c for details) and therefore visibility and availability of marine mammals
and basking shark is expected to be comparable for both sites. The data were post stratified to provide an estimate of
abundance and density for the Project survey area (including survey buffer area) and Westray South Tidal Array separately.
Density of grey seals during the Project survey was estimated to be 0.09 individuals per km2 (coefficient of variation9
(CV)=19.24).
Density Estimates for Assessment
The density estimates for grey seals calculated from the AfL area specific survey of 0.09 individuals per km2 (CV=19.24)
will be used to quantify impacts associated with the Project.
Designated Sites
The Faray & Holm of Faray SAC is located approximately 75km to the north of the AfL area. This SAC is primarily
designated for its grey seal population and the conservation objectives for this SAC (as specified in the SNH Advice under
Regulation 33(2)) are to maintain the population size structure, function and distribution of grey seals and their supporting
habitats and to ensure that no significant disturbance is suffered. This SAC is the second largest grey seal breeding site in
the UK and accounts for approximately 9% annual UK pup production. Telemetry studies in grey seals have highlighted a
level of connectivity between usage areas in the Pentland Firth and Orkney Area and North Rona SAC (155km from the
AfL area), and the Monachs SAC (approximately 240km from the AfL area, SMRU Ltd 2011). Further afield, there is also
some evidence of connectivity between the Orkney and North Coast management unit and the Isle of May SAC (320km
from the AfL area) and the Berwickshire and North Northumberland SAC (340km from the AfL area, SMRU Ltd 2011;
Russell & McConnell 2014). Telemetry from seals tagged at the Waddenzee SCI in Dutch waters show movement across
the North Sea to the Orkney and North coast MU (Brassuer et al. 2010).
There are designated haul-out sites of importance to provide additional protection for seals from intentional or reckless
harassment. A total of 194 seal haul-out sites have been designated through The Protection of Seals (Designation of Haul-
Out Sites) (Scotland) Order 2014 laid in the Scottish Parliament on 26th June 2014.
Figure 13.5 shows the designated haul out sites around Orkney. The grey seal breeding colonies included in this
designation that are approximately 15km or less from the AfL include:
BC-032 South Ronaldsay East 13.7km from the AfL
9 the percentage variation of mean value

Environmental Statement
Brims Tidal Array
Page 185 of 316
BC-041 Duncansby Head 14.5km from the AfL
BC-019 Swona 6.0km from the AfL;
BC-023 N-Flotta 9.5km from the AfL;
BC-027 South Ronaldsay West 10.6km from the AfL;
BC-029 Calf of Flotta 10.6km from the AfL;
NOO-033 Pentland Skerries 15.3km from the AfL; and
NON-001 Gills Bay 10.3km from the AfL.
In addition to SACs and designated haul out sites, there are two Sites of Special Scientific Interest (SSSIs), for which grey
seal are notified features:
Faray and Holm of Faray (also an SAC) 52km from the AfL; and
Muckle and Little Greenholm 44km from the AfL.
Figure 13.5: AfL and the Orkney designated seal haul out sites
Environmental Statement
Brims Tidal Array
Page 186 of 316
13.9.2.2 Harbour Seal
Population Status
Harbour seal have a circumpolar distribution and are widespread throughout the Northern Hemisphere. The harbour seal
is the smaller of the two UK seal species occurring along all coasts of the UK. Approximately 30% of European harbour
seals are found in the UK; this proportion has declined from approximately 40% in 2002 (SCOS 2014).
In the UK, pupping occurs in the summer (June and July) and peak moulting occurs in August. In the UK harbour seal are
surveyed during their annual moult on a three to five year cycle by SMRU using thermal imaging cameras. Using the most
recent survey data (2007-2012) the UK minimum population size is estimated at 26,290 individuals and 1,938 of these
individuals were surveyed at Orkney haul outs (based on the 2013 complete survey, SCOS 2014). The count of harbour
seals in Orkney has declined over recent years; in 1997 the minimum population size was estimated at 8,523 harbour seal
were counted, and in 2001 it was 7,752. In August 2013 Duck & Morris (2014) counted 1,865 harbour seal which is
comparable with the SCOS (2014) estimates, suggesting a decline of approximately 30% over three years; the average
annual rate of decline since 2006 is 11.5%. In August 2013 a total of 112 harbour seal were counted around the coats of
Hoy, this represents the lowest recorded count and a reduction of 79% since the peak count in 1997 of 530 individuals
(Duck & Morris 2014). Figure 13.6 shows the 2013 harbour seal counts compared with the 1997 counts.
During the APEM 2012 and 2013 aerial surveys of the Pentland Firth and Orkney waters, harbour seal were only sighted
during August and September surveys (APEM 2013). The sightings were in the near-shore areas at haul-out sites near
the Holm of Papa. Only 17 harbour seal were sighted, providing a population estimate of 523 (95%CI=17-1,568). The low
number of sightings reflects the fact that this type of survey method is not appropriate for this species due their cryptic
nature.

Environmental Statement
Brims Tidal Array
Page 187 of 316
Figure 13.6: Harbour seal counts in Orkney in 2013 (red) compared with the highest previous count in 1997 (pink) (SCOS 2014)

Environmental Statement
Brims Tidal Array
Page 188 of 316
Reference Population for Assessment
The reference populations to be used in the assessment for harbour seal is based on IAMMWG Management Units (MUs)
and the most recent population estimates of these units based on updated SCOS information (it should be noted that these
are limited to 12nm). The reference population for this assessment will be the Orkney and North Coast MU shown in Figure
13.2 (IAMMWG 2013) with a count of 1,938 harbour seal (SCOS 2014).
As described previously for grey seal, the management of harbour seal populations and the maximum number of shooting
licences is controlled using PBR. The most recent, 2015, PBR for the Orkney and North Coast MU is 11 harbour seals,
with no licences granted (Scottish Government 2015).
Diet
Harbour seal eat a wide range of prey, including sandeel, gadoids, flatfish, scorpion fish, sandy benthic fish, pelagic fish
and cephalopods (SCOS 2014).
Research into the causes of the decline in harbour seals in some areas of Scotland is ongoing. One hypothesis is that
competition with grey seals for prey is a driver, as grey seals are increasing in areas where harbour seals are declining.
Diet studies in 2010/11 show no overall consistent pattern between the prey of the two seal species which would link the
differences with observed regional changes in seal abundance (SCOS 2014). More detailed analysis is continuing but
there is currently no obvious overlap that could readily explain the decline of harbour seals (Wilson 2014; SCOS 2014).
At Sea Distribution
SMRU Limited (2011) also compiled harbour seal tagging data from deployments in the Pentland Firth and Orkney waters
as part of an SNH commissioned report. A total of 47 tagged harbour seal (including 15 pups) entered the Pentland Firth
and Orkney waters. The seals had been tagged in Orkney, the Moray Firth and Yell Sound, Shetland. Foraging was
generally within 20km of the departure haul-out sites showing site fidelity to foraging areas, and there was little movement
between haul-out regions within the Orkney Isles (Figure 13.7). Harbour seal pups showed more extensive movements
than adults, eight of the 15 tagged in Orkney relocated to Shetland (SMRU Limited 2011).

Environmental Statement
Brims Tidal Array
Page 189 of 316
Figure 13.7: Harbour seal telemetry10 (SMRU Limited 2011)
Harbour seal dive to depths of up to 100m, with a mean depth of 30.91m, mean duration of 4.14 minutes, mean time at
surface on 18.32%, and mean speed of 0.11m/s. There are insufficient telemetry data from harbour seal haul-out sites in
high tidal energy areas to examine any overlap in distribution (SMRU Ltd 2011).
A small number of harbour seal (18) were sighted during the boat-based transect and stationary point surveys, as well as
seven sightings during the land-based vantage point surveys untaken in the Inner Sound for the MeyGen development
(MeyGen 2011). MeyGen (2011) states that as these numbers were insufficient to determine at-sea density estimates and
10 17 harbour seals tagged with SMRU Argos tags, which at least once entered the PFOSA. The tracks are colour coded
by individual seal. All but two of the seals were tagged in the northern Isles (Sanday, Eynhallow, Rousay and Stronsay of
Orkney). The remaining two (show by triangles) were tagged in the Moray Firth.

Environmental Statement
Brims Tidal Array
Page 190 of 316
there are no published density estimates (in terms of animals per km2) an alternate method of using shore-based counts
was used to provide a crude estimate density of 0.202 seals per km2 (MeyGen 2011). It should be noted that this density
estimate is based on counting harbour seal and haul-out sites on the northern Caithness and southern Orkney coasts
which are directly adjacent to the Inner Sound, and MeyGen development area. There are no harbour seal haul-out sites
directly adjacent to the Project site (Duck & Morris 2014).
Regular surveys at the EMEC Falls of Warness tidal test site, from July 2005 to March 2014 provided mean areal density
estimates for harbour seals of 0.016 individuals per km2 based on surface observations of 0.004 individuals per km2 (EMEC
2014a).
Jones et al. (2013) mean density estimates of harbour seal at sea usage in the Project site along with upper and lower
95%CI are shown in Table 13.14 with the mean estimates shown in Figure 13.8. The mean estimate (over the two grid
cells) is 1.49 individuals per km2 (upper and lower 95%CIs from the two grid cells of 2.67 and 0.31 individuals per km2).
Table 13.14: Harbour seal at sea usage (density) estimates (number of individuals per 25km2) for the two grid cells covering the AfL area (Jones et al. 2013)
Mean densities Upper 95% Cl Lower 95% Cl
Grid cell one in AfL 36.72 68.88 4.56
Grid cell two in AfL 37.99 64.81 11.16
Average of grid cells
which overlap with the
AfL
37.36 66.85 7.86
Average per 1km2 1.49 2.67 0.31

Environmental Statement
Brims Tidal Array
Page 191 of 316
Figure 13.8: Harbour seal mean at sea density (Jones et al. 2013)
Site Specific Surveys
Only 13 harbour seal were seen by the dedicated MMOs while on survey effort during site specific surveys giving an
average sighting rates on 0.22 individuals per hour (not corrected for availability, Royal HaskoningDHV 2014). There were
more sightings between June and September in 2013, than in other months. The ESAS surveyors recorded a lower number
of harbour seal sightings than the dedicated MMOs. Due to the low sightings rate it was not possible to estimate density
of harbour seal from these surveys.
Density Estimates for Assessment
In the absence of density estimates from the Project surveys, due to the low number of sightings, this section provides
consideration of other available density estimates to use in the assessment.

Environmental Statement
Brims Tidal Array
Page 192 of 316
The Marine Scotland mean at sea density estimate of 1.49 (95%CI=0.18-2.76) individuals per km2 is over 9000% greater
than the EMEC Falls of Warness density estimate (0.016) and 600% greater than the MeyGen density estimate (0.202).
Likewise the Marine Scotland at sea density estimate for grey seal of 2.07 (95%CI=0-6.42) individuals per km2 is over
7000% greater than the EMEC Falls of Warness grey seal density estimate (0.028) and 600% greater than the MeyGen
grey seal density estimate (0.266).
The Marine Scotland estimates are provided at a resolution of 25km2 and, given these comparisons, are deemed to be too
crude for the localised variations across Orkney and are therefore not used in the impact assessment.
The Inner Sound survey area at MeyGen may provide a comparable environment to the AfL area, however it should be
noted that the MeyGen survey area included waters directly adjacent to harbour seal haul-out sites on the northern
Caithness and southern Orkney coasts which are directly adjacent to the Inner Sound, and MeyGen development area.
There are no harbour seal haul-out sites directly adjacent to the Project site.
The density estimates used in the EMEC Environmental Appraisal are likely to be the most comparable to the AfL, however
the Marine Scotland mean at sea density maps (Figure 13.8, Jones et al. 2013) indicates that harbour seal at sea density
may be lower at the Falls of Warness site than the AfL area and so these may be an underestimate for the Project AfL
area.
Although it was not possible to generate an estimation of harbour seal density for the AfL area from the site specific surveys,
a conservative approach, which lies between the MeyGen and EMEC density estimates and is based on estimating a
density which is proportional to the grey seal sightings rate11, assuming the ability to detect harbour seals is broadly similar
for the grey seals, giving 0.02 harbour seal per km2.
Designated Sites
Sanday SAC is designated for harbour seal and is located approximately 63km north east of the AfL area. In 2013 this site
supported approximately 6.1% of the Orkney population; at its peak in 1997 it supported approximately 19.6% of the Orkney
total count (Duck & Morris 2014). Telemetry data suggest that tagged animals using the Orkney and North Coast
management unit, also show connectivity with the Shetland and Moray Firth management units and hauled-out at the Yell
Sound Coast SAC (approximate 230km from the AfL area) and the Dornoch Firth and Morrich More SAC (125km from the
AfL area, SMRU Limited 2011). Further consideration of the SACs is given in the Information to Support HRA report.
The harbour seal haul-out sites designated through The Protection of Seals (Designation of Haul-Out Sites) (Scotland)
Order 2014 that are within approximately 15km of the AfL include:
NOO-003 Switha 5.1km from the AfL;
NOO-017 Flotta Oil Terminal 7.6km from the AfL;
NOO-030 Stroma 6.2km from the AfL;
NOO-032 North & East Fara 7.4km from the AfL;
11 Grey seal Project hourly sighting rate (0.99) divided by harbour seal hourly sighting rate (0.22) = 4.5; grey seal density
estimate (0.09/km2) divided by 4.5 = 0.02 harbour seal per km2, to give rough indication of harbour seal density at AfL area.

Environmental Statement
Brims Tidal Array
Page 193 of 316
NON-001 Gills Bay 10.3km from the AfL;
NOO-014 Cava 11.1km from the AfL; and
NOO-021 North West Water Sound 14.4km from the AfL.
In addition to SACs and designated haul out sites, there are two Sites of Special Scientific Interest (SSSIs), for which
harbour seal are notified features:
East Sanday Coast (also an SAC) 60.6km from the AfL; and
Eynhallow 41.0km from the AfL.
13.9.3 Cetaceans
13.9.3.1 Harbour Porpoise
Population Status
Harbour porpoise is the most commonly sighted cetacean in the North Sea (ASCOBANS 2012) and is the cetacean most
likely to be found in greatest numbers in Orkney and Pentland Firth waters. The IAMMWG has identified three appropriate
management units within the UK Exclusive Economic Zone (EEZ); these are the North Sea; West Scotland; and Celtic and
Irish Seas (IAMMWG 2015). The abundance of harbour porpoise in these MUs is based upon the SCANS II and CODA
surveys (Hammond et al. 2013, Macleod et al. 2009). The AfL area is located in the North Sea NS MU (IAMMWG 2015)
with an estimated abundance of 227,298 (CV=0.13; 95%CI=176,360–292,948). The estimate of abundance in SCANS-II
survey block J which includes the waters around Orkney and Shetland (see Figure 13.10), and encompasses the AfL area
is 10,254 individuals (CV=0.36; Hammond et al. 2013).
The SCANS and SCANS II surveys were a major international collaborative survey program carried out to provide baseline
data on cetacean abundance in the North Sea, Baltic and Celtic Seas. Surveys were undertaken in the summer of 1994
and 2005 and the extent of the 2005 survey was greater than in 1994. Estimated abundance in 2005 in the equivalent area
surveyed in 1994 was 323,968 (CV=0.22; 95%CI=256,300–549,700; Hammond et al. 2013), compared to 341,366
(CV=0.14; 95%CI=260,000–449,000) in 1994 (SCANS II 2008). Therefore, there was no reported change in the overall
estimated abundance in the North Sea. Despite no overall change in population size between the two surveys, large scale
changes in the distribution of porpoise were observed between 1994 and 2005, with the main concentration shifting from
north eastern UK and Denmark to the southern North Sea. Such large scale changes in the distribution of harbour porpoise
are likely the result of changes to the availability of principal prey within the North Sea (SCANS II 2008).
Surveys undertaken by APEM in 2012 and 2013 in Pentland Firth and Orkney waters recorded only two positive sightings
of harbour porpoise (in June/August 2012) in the wider area (beyond 3km from shore). These generated an abundance
estimate of 175 (95%CI=2-525). There were some sightings during the surveys which could not be identified to species,
which could be harbour porpoise, and the sightings have not been corrected for surface availability. As such this estimate
is likely to represent an underestimate of the number of harbour porpoise in the region.

Environmental Statement
Brims Tidal Array
Page 194 of 316
Reference Population for Assessment
The AfL area is located in the North Sea MU (see Figure 13.9) which will be used as the reference population for the
assessment, with an estimated abundance of 227,298 (CV=0.13; 95%CI=176,360–292,948; IAMMWG 2015). However,
the West Scotland MU (with an estimated abundance of 21,462 (CV=0.42, 95%CI=9,740-47,289; IAMMWG 2015) is
located only approximately 60km to the west of the site.
The IAMMWG management units have a transboundary nature; with the North Sea MU comprising the international Council
for the exploration of the Seas (ICES) area IV (North Sea), VIId (Eastern Channel) and Division IIIa (Skagerrak and north
Kattegat) (Figure 13.9).
Figure 13.9: Harbour porpoise Management Units (IAMMWG 2015)
Diet
The diet of harbour porpoises in Scottish waters has been determined through stomach content analysis and, although
fish from 15 taxa, cephalopods from five taxa and crustaceans from four taxa were recovered from the stomachs of harbour
porpoises between 1992 and 2003, the diet is dominated by four main prey categories: (i) whiting; (ii) sandeels
(Ammodytidae spp.); (iii) haddock/saithe/pollack and (iv) Trisopterus spp. (Norway pout and poor cod) (Santos et al., 2004).
Regional, seasonal and inter-annual differences in diet composition were identified with other small gadoids and
cephalopods along with clupeids such as herring in some years.

Environmental Statement
Brims Tidal Array
Page 195 of 316
At Sea Distribution
The mean density for the SCANS II survey block J, (Orkney and Shetland, see Figure 13.10) is 0.274 (CV=0.36) individuals
per km2 (Hammond et al. 2013), although it should be noted that this survey block includes Shetland and the Moray Firth,
as well as Orkney, and may include areas of higher porpoise density than the AfL area.
Figure 13.10: SCANS II survey blocks (SCANS II 2008)
The JNCC Cetacean Atlas (Reid et al. 2003) and Evans et al. (2011) report sightings of harbour porpoise distributed
throughout the Pentland Firth and Orkney waters. Figure 13.11 shows the sightings data from 1980-2010, presented in
Evans et al. (2011).

Environmental Statement
Brims Tidal Array
Page 196 of 316
Figure 13.11: Distribution of sightings of harbour porpoise, 1980-2010 (Evans et al. 2011b)
Harbour porpoise was the most frequently sighted cetacean species during the MeyGen boat-based transect and stationary
point surveys, as well as the land-based vantage point surveys (MeyGen 2011). Towed hydrophone surveys suggested
that acoustic detection rates were higher than visual sightings rates, as averaging at 7.03 per hour. Mean density estimates
for the Inner Sound from the boat bases surveys were 0.105 individuals per km2 (95%CI=0.055-0.202), and peak densities
were 0.6 individuals per km2 (95%CI=0.226-1.594; MeyGen 2011). SRSL (2012) undertook analysis to estimate the time
this species may be present at different water depths, the analysis indicated that harbour porpoises make many dives that
are not to the seabed which maybe when feeding on pelagic species and travelling.
The APEM (2013) aerial surveys did not provide estimates of density for harbour porpoise.
Surveys at the EMEC Falls of Warness tidal test site, from July 2005 to March 2014 provided mean areal density estimates
for harbour porpoise of 0.007 individuals per km2 based on surface observations of 0.003 individuals per km2 (EMEC 2014).
Studies conducted in Welsh waters have suggested that harbour porpoise may use high tidal energy areas for foraging,
with small scale areas of high density in areas of more turbulent waters downstream from the area of strongest flow, with
the location of these higher density areas moving to the other side of the highest current areas when the tidal stream
reversed (Gordon et al. 2011). This study also developed and tested a system for examining the use of the water column
by harbour porpoise. This is subject to ongoing work, but preliminary results suggest that harbour porpoise may use of the
entire water column in these areas, and dive to the seabed (Gordon et al. 2011).

Environmental Statement
Brims Tidal Array
Page 197 of 316
Site Specific Surveys
Harbour porpoise were the most frequently sighted species by both the dedicated MMOs and the ESAS surveyors during
the site specific surveys; average sightings rates while on effort were 1.99 individuals per hour, and 1.5 individual per hour
respectively (not corrected for availability). Harbour porpoise were seen in groups of up to six individuals, but were most
commonly seen alone. Based on the number of sightings of harbour porpoise it was possible to estimate abundance and
density at the AfL area. The most robust of density for harbour porpoise is 0.137 (CV=19.50) individuals per km2, this
estimate is based on the entire survey area, although detection probability is not known for this survey so an estimate of
g(0), the probability of detecting the animal on the track line, has been used from a different survey (Royal HaskoningDHV
2014).
The use of a towed PAM has supplemented the visual surveys for harbour porpoise (MER 2014). The majority of the
acoustic detections were in the more offshore parts of the survey area (MER 2014). The average detection rate using PAM
(1.58 unique acoustic encounters per hour) was higher than the visual sighting rate (0.68 sightings per hour) over
comparable survey periods. However, visual and acoustic detection rates did vary over the survey period, with visual
detection rates being higher in some months and vice versa.
Density Estimates for Assessment
The density estimate of 0.137 (CV=19.50) individuals per km2 calculated from the AfL area specific survey is used in the
impact assessment.
Designated Sites
The West Scotland MU also includes the Northern Ireland coast and the UKs only SAC where harbour porpoise are a
qualifying feature. The North Sea MU includes a number of Sites of Community Importance (SCIs) which are designated
for harbour porpoise in European waters. Eight draft offshore SACs (dSAC) for harbour porpoise have been proposed in
UK waters. The closest proposed dSACs to the Project site are in the Outer Moray Firth and North Minch, further
consideration is given to these sites in the Information to Inform HRA report (Supporting Document: BTAL, 2015c).
13.9.3.2 White-beaked Dolphin
Population Status
White-beaked dolphin are widespread across the northern European continental shelf. The species is the most abundant
cetacean after the harbour porpoise in the North Sea (Jansen et al. 2010) and the waters off the coast of Scotland and
north east England are one of the four global centres of peak abundance.
Scientific evidence supports the assumption that white-beaked dolphin from around the British Isles and North Sea
represent one population, with movement between Scottish waters and the Danish North Sea and Skagerrak (Banhuera-
Hinestroza et al. 2009). Sightings are common throughout the year, with peaks between June and October (Reid et al.
2003). Off northern Scotland there have been sightings in every month expect January (Evans et al. 2011). White-beaked
dolphin breed mainly between May and August, although some breeding occurs in September and October (Anderwald &
Evans 2010). The gestation period is approximately 11 months (Culik 2010).
A single management unit has been proposed by the IAMMWG (2015) for this species comprising all UK waters is shown
in Figure 13.12. The estimate of the size of the population in the Celtic and Greater North Seas MU is 15,895 individuals

Environmental Statement
Brims Tidal Array
Page 198 of 316
(CV=0.29), and is derived from the SCANS II surveys data (Hammond et al. 2013). The abundance of animals in the UK
EEZ is 11,694 (CV=0.30; 95% CI=6,578-20,790; IAMMWG 2015).
The estimate of abundance in the SCANS-II survey block J (Orkney and Shetland, see Figure 13.10) is 1,078 individuals
(CV=0.85; Hammond et al. 2013).
During the APEM (2013) surveys of the Pentland Firth and Orkney waters a total of five white-beaked dolphin were seen
in a single sighting in the wider area, to the west of mainland Orkney. This sighting during the October/November survey
provided an abundance estimate of 432 (95%CI=5-1,272).
Reference Population for Assessment
The reference population for the impact assessment is the Celtic and Greater North Seas MU (Figure 13.12) is 15,895
individuals (CV=0.29; IAMMWG 2015).
Figure 13.12: White-beaked dolphin Management Units (IAMMWG 2015)

Environmental Statement
Brims Tidal Array
Page 199 of 316
Diet
The diet of white-beaked dolphin within the North Sea is dominated by gadoids, notably whiting and cod (Jansen et al.
2010); however, in Scottish waters they also consume cephalopods (Santos et al. 1994). Stomach contents’ analysis, from
dolphins stranded mainly on the Scottish east coast, identified haddock and whiting as the predominant fish species being
taken (Canning et al. 2008).
At Sea Distribution
The species occurs mainly in waters of 50-100m in depth (Reid et al. 2003). The majority of the sightings in Pentland Firth
and Orkney water are in more offshore areas (Evans et al. 2011b). Figure 13.13 shows the sightings data from 1980-2010,
presented in Evans et al. (2011b).
Figure 13.13: Distribution of sightings of white-beaked dolphin, 1980-2010 (Evans et al. 2011b)
The estimate of density for the SCANS-II survey block J (Orkney and Shetland, see Figure 13.10) is 0.029 individuals per
km2 (CV 0.85, Hammond et al. 2013). It should be noted that this estimate is based on a summer survey, when white-
beaked dolphin occurrence may be greatest.
No sightings of white-beaked dolphin were made during the MeyGen surveys (MeyGen 2011) of the Inner Sound or the
EMEC Falls of Warness tidal test site (EMEC 2014).

Environmental Statement
Brims Tidal Array
Page 200 of 316
Site Specific Surveys
In July 2013, 13 white-beaked dolphin were recorded by the MMO while on effort, with three more sighted off effort. This
approximates to a sighting rate of 0.22 individuals per hour, but it should be noted that the animals were sighted in one
group, and an average rate of occurrence may be misleading. No estimate of density could be generated from this sighting.
White-beaked dolphin was also detected during the PAM surveys (Wittich & Gordon 2012).
Density Estimates for Assessment
Due to the low number sightings of white-beaked dolphin during the Project, MeyGen, and EMEC site specific surveys to
allow density estimates to be created, a qualitative impact assessment will be undertaken.
Designated Sites
There are no designated sites for white-beaked dolphin in UK waters.
13.9.3.3 Minke Whale
Population Status
Genetic evidence suggests a limited spatial separation of populations of minke whale within the North Atlantic (Anderwald
& Evans 2010). The International Whaling Commission (IWC) treats this as a single stock (Central and North eastern North
Atlantic), with a population estimate (between 1996 and 2001) of 174,000 (Northridge 2012).
The species is most commonly seen singly or, less commonly, in loose groups of up to three. In late summer, off the coast
of northern and north west Britain, loose feeding aggregations of up to 15 animals may form (Anderwald & Evans 2010).
In the northern hemisphere, mating is from October to March. Gestation is about 10 months, with calving occurring primarily
between December and January.
The IAMMWG has identified a single MU appropriate for minke whale in European waters (IAMMWG 2015). The
abundance of minke whales in the Celtic and Greater North Seas MU (Figure 13.14) is 23,528 animals (CV=0.27;
95%CI=13,989-39,572). The estimate was derived from SCANS-II (Hammond et al. 2013) and CODA (Macleod et al. 2009)
surveys and is likely to be underestimated because the SCANS-II estimate was not corrected for perception bias in the
aerial surveys and the CODA estimate was not corrected for perception or availability biases. The IAMMWG MUs for minke
whale is transboundary as it incorporates a number of European Exclusive Economic Zones (EEZs). The abundance o in
the UK EEZ is estimated to be 12,295 (CV=0.28; 95% CI=7,176-21,066). The estimate of abundance in the SCANS-II
survey block J (Orkney and Shetland, see Figure 13.10) for minke whale was 833 (CV=1.04; Hammond et al. 2013).
The only published information on trends in population size for minke whale in UK waters is from the North Sea, English
Channel and Celtic Sea undertaken for SCANS and SCANS –II surveys. The SCANS survey conducted in July 1994
estimated 8,445 individuals (95%CI=5,000-13,500; Hammond et al. 2002). The SCANS II survey in July 2005 gave an
estimate of 13,734 (CV=0.41; 95%CI=9,800–36,700) within an area comparable to the 1994 survey (Hammond et al. 2013).
Although these estimates were not significantly different, there were noticeable changes in distribution between the two
surveys.
Only one minke whale was sighted during the August/September 2012 survey of the Pentland Firth and Orkney waters
(APEM 2013). This near-shore sighting, off South Ronaldsay, provided a population estimate for the region of 31 individuals
(95%CI=1-92).

Environmental Statement
Brims Tidal Array
Page 201 of 316
Reference Population for Assessment
The reference population for the impact assessment is the Celtic and Greater North Seas MU is 23,528 animals (CV=0.27;
95%CI=13,989-39,572; IAMMWG 2015).
Figure 13.14: Minke whale Management Units (IAMMWG 2015)
Diet
Minke whale feed upon a variety of fish species, including herring, sandeel, cod, haddock and saithe, as well as on
invertebrates (Anderwald & Evans 2010). Feeding during the summer months is often observed in areas of upwelling or
strong currents around headlands and small islands.
At Sea Distribution
Minke whale is widely distributed along the Atlantic seaboard of Britain and Ireland and throughout the North Sea. Reid et
al. (2003) indicates that minke whale occur regularly in the North Sea to the north of Humberside and around the west
coast of Scotland. Animals are present throughout the year, but most sightings are between May and September.
Evans et al. (2011a) confirm that minke whale are also relatively common in the Pentland Firth and Orkney waters, with
sightings recorded between January and October and peaking in inshore areas in June/July/August. Figure 13.13 shows
the sightings data from 1980-2010, presented in Evans et al. (2011a).

Environmental Statement
Brims Tidal Array
Page 202 of 316
Figure 13.15: Distribution of sightings of minke whale, 1980-2010 (Evans et al. 2011a).
The estimate of density of minke whale in the SCANS-II survey block J (Orkney and Shetland, see Figure 13.10) was 0.022
individuals per km2 (CV=1.04; Hammond et al. 2013).
Three sightings of minke whale were made during the surveys of the Inner Sound undertaken in relation to the MeyGen
development (MeyGen 2011). No estimates of density could be produced from these sightings.
Surveys at the EMEC Falls of Warness tidal test site, from July 2005 to March 2014 provided mean areal density estimates
for minke whale of 0.001 individuals per km2 based on surface observations of 0.0002 individuals per km2 (EMEC 2014).
Site Specific Surveys
In July 2012, a single minke whale was sighted on effort during the site specific surveys, by both the MMO and ESAS
surveyor. No estimate of density could be generated from this sighting.

Environmental Statement
Brims Tidal Array
Page 203 of 316
Density Estimates for Assessment
The density estimate of 0.001 individuals per km2 calculated from the EMEC Falls of Warness survey (EMEC 2014) is used
in the impact assessment.
Designated Sites
There are currently no designated sites for minke whale in UK waters. However, as part of the proposed Scottish MPA
network, minke whale has been included in the Sea of Hebrides MPA proposal and the Southern Trench MPA proposal
(Cunningham et al. 2015).
13.9.4 Other Species of Cetacean
13.9.4.1 Risso’s Dolphin
Risso’s dolphin is generally associated with the deeper and warmer waters of the continental slope. As such, the majority
of UK sightings of Risso’s dolphin are made off the north west of Scotland, surrounding the Outer Hebrides (Reid et al.
2003). However, there have been a number of sightings in the Pentland Firth and Orkney waters (Evans et al. 2011a). The
status of Risso’s dolphins in the UK is currently unknown, and there are no population estimates available (Hammond et
al. 2013; IAMMWG 2015).
There were no sightings of Risso’s dolphin during the APEM (2013) surveys of the region. A single sighting of a Risso’s
dolphin was made from land-based observations of the Inner Sound in June 2010, when three animals (two adults and
one juvenile) were recorded (MeyGen 2011).
There were no confirmed sightings of Risso’s dolphin during the site specific surveys. Due to the absence of any sightings,
Risso’s dolphin is not taken forward in this impact assessment.
There are currently no designated sites for Risso’s dolphin in UK waters. However, as part of the proposed Scottish MPA
network, Risso’s dolphin has been included in the North-east Lewis MPA proposal (Cunnigham et al. 2015).
13.9.4.2 Bottlenose Dolphin
Bottlenose dolphin has been occasionally sighted in the Pentland Firth and Orkney waters (Evans et al. 2011a). Any
bottlenose dolphin occurring in the Project site are most likely to be from the Coastal East Scotland (CES) MU which has
an abundance estimate of 195 (95% CI, 162-253) (IAMMWG 2015). The abundance of bottlenose dolphin from the UK
portion of the CES MU is estimates to be 195 (95% CI, 162-253) (IAMMWG 2015).
The SCANS II survey estimated abundance in survey block J (Orkney and Shetland, see Figure 13.10) to be 412
(CV=0.87), with a density estimate of 0.011 individuals per km2 (CV=0.87; Hammond et al. 2013). There is a large amount
of uncertainty surrounding this estimate, and it should be note that survey block J also includes the Moray Firth SAC, an
area of known high bottlenose dolphin occurrence. As such is it not considered to be appropriate to apply that estimate of
density to the AfL area.
No bottlenose dolphin was sighted during the two years of site specific surveys by the dedicated MMOs or the ESAS
surveyors. Based on the lack of bottlenose dolphin sightings in the AfL area during the site specific surveys, this species
will not be included in the impact assessment or the Information to Inform HRA.

Environmental Statement
Brims Tidal Array
Page 204 of 316
SNH advised in their scoping opinion (August 2013) that although bottlenose dolphin are wide ranging there is limited
evidence of bottlenose dolphin in the Pentland Firth. This is supported by the absence of sightings during site specific
surveys and so it is unlikely that there is significant connectivity between the AfL area and bottlenose dolphin from the
Moray Firth SAC.
13.9.4.3 Killer Whale
In the UK, killer whale is often sighted off northern and western Scotland (Reid et al. 2003). Sightings are common around
the Pentland Firth, and near-shore Orkney waters, especially between May and July (Evans et al. 2011a). Photo-
identification studies suggest these animals; around 30 in number are linked to the killer whale that follow the Icelandic
summer –spawning herring (Foote et al. 2009, 2010). However, during the summer they have been observed taking
harbour seal, harbour porpoise and common eider in the coastal waters of the Northern Isles (Evans et al. 2011a).
No killer whale was sighted during the APEM (2013) surveys. Two sightings of killer whales were made during land-based
observations on the Inner Sound on consecutive days in May 2010, as part of the MeyGen survey. Both recording groups
of six to seven individuals with only one male in each (the remainder of the groups comprised females and juveniles
(MeyGen 2011).
No killer whale was sighted during the two years of site specific surveys by the dedicated MMOs or the ESAS surveyors.
Based on the lack of sightings in the AfL area during the site specific surveys, this species will not be included in the impact
assessment.
13.9.5 Basking Shark
13.9.5.1 Population Status
The basking shark is a widely distributed pelagic species, and the largest fish in British waters (second largest in the world),
growing up to approximately 10m in length. Basking shark are predominantly recorded off the west coast of Scotland. They
generally occur in open waters but migrate towards the shore in summer, when they can be seen ‘basking’, or swimming
slowly, at the surface with the mouth wide open. They are known to migrate over large distances in both offshore and
coastal waters at depths from the surface to over 750m. They are particularly associated with tidal fronts on the continental
shelf and shelf edge where they feed on plankton (Speedie et al. 2009). Tagging work has shown that they make extensive
horizontal and vertical migrations to locate feeding hotspots, often associated with frontal systems (Priede & Miller 2009).
Individual basking sharks take 11-20 years to reach maturity; females have long gestation periods (1-3 years) and give
birth to few large young.
OSPAR (2008) have reported 50-90% population wide declines in recent years although there are limited data to validate
these trends. As a result of declining numbers recorded the basking shark is listed as threatened and/or declining under
the OSPAR convention (OSPAR, 2008).
There are currently no designated sites for basking shark in UK waters. However, as part of the proposed Scottish MPA
network, basking shark has been included in the Sea of Hebrides MPA proposal (Cunnigham et al. 2015).

Environmental Statement
Brims Tidal Array
Page 205 of 316
13.9.5.2 Reference Population for Assessment
There is currently no population estimate for basking sharks within Scottish or UK waters due to the difficulties in counting
basking sharks (Drewery 2012).
13.9.5.3 Diet
Basking sharks are filter-feeders and, in order to meet their energy requirements, they must select and remain in areas of
high plankton concentrations. Basking sharks are selective foragers of zooplankton, feeding predominately on energy rich
calanoid copepods, such as Calanus finmarchicus and C. helgolandicus (Sims et al. 1997).
13.9.5.4 At Sea Distribution
Evans et al. (2011a) reported a total of 345 basking shark records (comprising 385 individuals) from North Scotland and
Orkney (Figure 13.16) which occurred in most months of the year, although rarely between November and April. Peak
records occurred between July and September (particularly August), but there was no clear spatial pattern in the
occurrence of sightings.
Figure 13.16: Distribution of sightings of basking shark, 1980-2010 (Evans et al. 2011a)
No basking sharks were reported during the APEM aerial surveys of the Pentland Firth and Orkney waters in 2012/2013
(APEM 2013).

Environmental Statement
Brims Tidal Array
Page 206 of 316
The EMEC Falls of Warness tidal test site, from July 2005 to March 2014 provided mean areal density estimates for basking
shark of 0.001 individuals per km2 based on surface observations of 0.001 individuals per km2 (EMEC 2014).
13.9.5.5 Site Specific Surveys
During the site specific surveys one basking shark was recorded by the dedicated MMOs while off survey effort on the 20 th
August 2012 (Supporting Document: RHDHV, 2014c). It is not possible to estimate density of basking shark from these
surveys.
13.9.5.6 Density Estimates for Assessment
The density estimates from the EMEC Falls of Warness survey of 0.001 individuals per km2 (EMEC 2014) will be used in
the assessment.
13.9.6 Summary
Table 13.15 provides a summary of density estimates and reference populations.
Table 13.15: Summary of density estimates and reference populations taken forward in the assessment
Species Density estimate (per km2) Reference population
Grey seal 0.090 20,682
Harbour seal 0.020 1,938
Harbour porpoise 0.137 227,298
White beaked dolphin Sightings too low 15,895
Minke whale 0.001 23,528
Basking shark 0.001 unknown
In addition, collision risk results using the SMRU seal density estimates and SCANS cetacean density estimates are
presented in Appendix 1 (using the ERM) and Appendix 3 (using the CRM).
13.10 POTENTIAL IMPACTS
The potential impacts on marine mammals and basking sharks identified for each phase of the Project are:
13.10.1 Construction and Installation
Underwater noise;
Collision with vessels12;
Accidental contamination from vessels or devices;
Disturbance at haul out sites; and
12 Following recent (February 2015) SNCB advice on the issue of corkscrew injuries in seals it is considered very likely
that vessels with ducted propellers do not pose any increased risk to seals over and above normal shipping activities.
Therefore the issue of seal collision with ducted propellers is not assessed as a standalone impact.

Environmental Statement
Brims Tidal Array
Page 207 of 316
Indirect effects on prey species.
13.10.2 Operation and Maintenance
Underwater noise;
Collision with devices;
Collision with vessels;
Electromagnetic Fields;
Disturbance at haul out sites;
Indirect effects on prey species; and
Accidental contamination from vessels or devices.
13.10.3 Decommissioning
Underwater noise;
Collision with vessels; and
Accidental contamination from vessels or devices.
13.10.4 Accidental and Unplanned Events
Accidental contamination from vessels or devices during;
o Construction/ installation
o Operation and maintenance; and
o Decommissioning
13.11 MITIGATION MEASURES
13.11.1 Project Design and General Mitigation Measures
All Project Design Mitigation and General Mitigation measures are set out in Chapter 5 Project Description, Table 5.15 and
Table 5.16 respectively. These are standard practice measures based on specific legislation, regulations, standards,
guidance and recognised industry good practice that are put in place to ensure significant impacts do not occur.
13.11.2 Specific Mitigation
The following mitigation measures will be implemented specifically to minimise the impacts on marine mammals and
basking sharks (Table 13.16).
Table 13.16: Mitigation Measures Specific to Marine Mammals and Basking Sharks
Ref Mitigation Measure Description
MM01 A vessel management plan (General Mitigation measure GM07 (Table 5.16) will be developed in consultation
with SNH and Marine Scotland which will aim to develop a standard transit route and range of vessel speeds
for traffic to and from the AfL area with the aim of minimising collision risk.

Environmental Statement
Brims Tidal Array
Page 208 of 316
13.12 RESIDUAL EFFECTS
13.12.1 Impacts during Construction and Installation
13.12.1.1 Underwater Noise
Sensitivity
Southall et al. (2007) discuss a range of likely behavioural reactions that may occur as a result of exposure to noise. These
include orientation or attraction to a noise source, increased alertness, modification of characteristics of their own sounds,
cessation of feeding or social interaction, alteration of movement/diving behaviour, temporary or permanent habitat
abandonment, and in severe cases panic, flight stampede or stranding, sometimes resulting in injury or death. Behavioural
disturbance responses may be considered likely to affect vital rates based on the potential for a severe or sustained
avoidance of an area (e.g. Harwood et al. 2014). The duration and range of any response can vary, and the time between
individuals being displaced and returning to an area is considered as part of the determination of the predicted magnitude.
Harbour porpoise have relatively high daily energy demands and need to consume between 4% and 9.5% of their body
weight in food per day (Kastelein et al. 1997). If a harbour porpoise does not capture enough prey to meet its daily energy
requirements it can rely on stored energy (primarily blubber) for three to five days, depending on body condition (Kastelein
et al. 1997). Thermoregulation has high energy costs in marine mammals. Kastelein et al. (1997) estimate that a harbour
porpoise may have a life expectancy of as little as three days in waters of 20°C under starvation conditions and in the
colder waters around Orkney this could be expected to be less. Should harbour porpoise be excluded from an area of key
prey resource, and be unable to find alternative food sources, there could be serious impacts from behavioural disturbance.
Harbour porpoise are therefore assessed as having a medium sensitivity to behavioural effects as a result of underwater
noise.
Less is known about the sensitivity of minke whale and white beaked dolphin to disturbance as a result of underwater noise
than for harbour porpoise, but it is likely that they have a comparable sensitivity to harbour porpoise (medium sensitivity)
to this type of impact.
Harbour seal and grey seal exhibit alternate periods of foraging and resting at haul out sites (during which limited or no
feeding occurs). Prolonged fasting also occurs in these species during annual breeding and moult, when there are marked
seasonal changes in body condition (Rosen & Renouf 1997; Bäcklin et al. 2011). Although adult seals may be relatively
robust to short-term (weeks rather than days compared to harbour porpoise) changes in prey availability, young and small
individuals have a more sensitive energy balance (Harding et al. 2005). Although a fleeing response in harbour or grey
seal may lead to a severe or sustained avoidance of an area, these species can be considered to have low sensitivity to
noise disturbance.
There is no literature available specifically concerning the sensitivity of basking sharks, or other plankton feeding sharks
to underwater noise. Elasmobranchs have no air-filled cavity, and are incapable of detecting sound pressure; detection is
through the inner ear and organs. Basking shark appear relatively unaware of the presence of vessels, for example most
basking sharks killed in the harpoon fishery were shot at very close range, showing little or no indication of any evasive
action (Maxwell 1952) and scientists conducting satellite tagging exercises with Pop-up Archival Tags (PAT) typically use
spear guns to attach the tags, making an approach to the shark from behind and 1m to one side and inserting the tag as
the bow of the vessel draws level with the first dorsal fin (Sims et al. 2005). During a study on disturbance in basking shark
caused by shipping in south west England (Wilson 2000), it was concluded that engine noise and the angle of approach

Environmental Statement
Brims Tidal Array
Page 209 of 316
had some limited effect on shark behaviour, but the effects were inconclusive. The study indicated that large sharks feeding
at the surface seem particularly immune to the approach of vessels, whilst younger sharks (more commonly seen on their
own) react more readily. Groups of large sharks at the surface appear to be in a “trance-like” state, especially when
courtship-like behaviour is taking place. As such the sensitivity to disturbance noise can be considered as low, after
accounting for the uncertainty and knowledge gap in this area.
Magnitude
Construction works include installation vessels, use of construction equipment, laying cables and cable protection, and
installation of turbine foundations (gravity base, drilled monopile, and/or drilled pin piles). Source noise data for these
installation components are presented in Table 9.1 of Supporting Document: Xodus (2015). It should be noted that the key
source of noise is the construction vessels with a peak source level of191dB re 1μPa @ 1m, compared with the predicted
peak source level noise of drilling of 166 dB re 1μPa @ 1m.
Noise modelling (Supporting Document: Xodus, 2015) has been undertaken for installation of the Project using the injury
and behavioural threshold criteria proposed by the following sources:
Southall et al. (2007) non pulsed sound thresholds of 230dB re 1μPa for all cetaceans – PTS criteria;
Southall et al. (2007) non pulsed sound thresholds of 218dB re 1μPa for pinnipeds in water – PTS criteria; and
NMFS (2005) Level B harassment threshold13 for all marine mammals of 120 dB re 1μPa – disturbance criteria.
The noise levels associated with the proposed Project installation works are not predicted to result in any physical injury;
Table 13.17 provides the estimated ranges of disturbance provided in Supporting Document: Xodus (2015) for various
vessel types that will be used in the construction of the Project.
Table 13.17: Estimated disturbance ranges for marine mammals during construction
Noise source/ vessel Estimated range for onset of
marine mammal disturbance
(km)
Estimated area for onset of marine
mammal disturbance (km2)
Anchor handling vessel 1.4 6
Installation/construction vessel
(using DP)
14 616
Support vessel 4 50
Rock placement vessel 14 616
13 Level B Harassment is defined as having the potential to disturb a marine mammal or marine mammal stock in the wild
by causing disruption of behavioural patterns, including, but not limited to, migration, breathing, nursing, breeding, feeding,
or sheltering but which does not have the potential to injure a marine mammal or marine mammal stock in the wild.
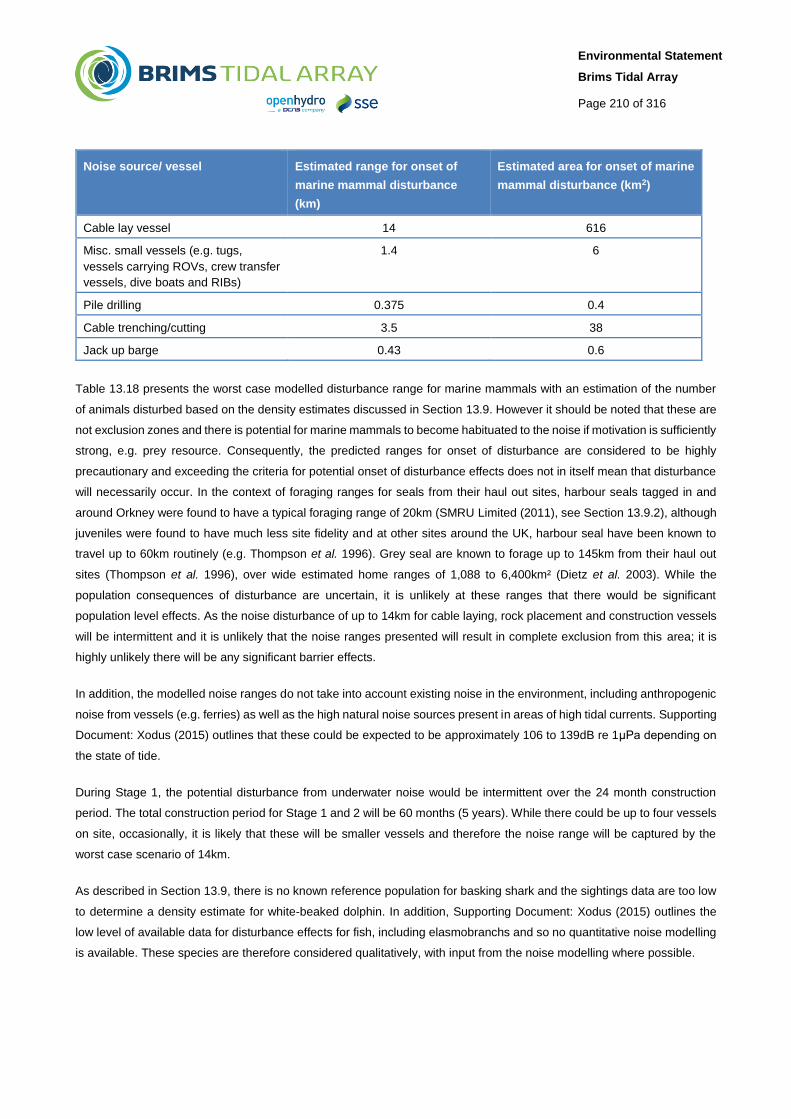
Environmental Statement
Brims Tidal Array
Page 210 of 316
Noise source/ vessel Estimated range for onset of
marine mammal disturbance
(km)
Estimated area for onset of marine
mammal disturbance (km2)
Cable lay vessel 14 616
Misc. small vessels (e.g. tugs,
vessels carrying ROVs, crew transfer
vessels, dive boats and RIBs)
1.4 6
Pile drilling 0.375 0.4
Cable trenching/cutting 3.5 38
Jack up barge 0.43 0.6
Table 13.18 presents the worst case modelled disturbance range for marine mammals with an estimation of the number
of animals disturbed based on the density estimates discussed in Section 13.9. However it should be noted that these are
not exclusion zones and there is potential for marine mammals to become habituated to the noise if motivation is sufficiently
strong, e.g. prey resource. Consequently, the predicted ranges for onset of disturbance are considered to be highly
precautionary and exceeding the criteria for potential onset of disturbance effects does not in itself mean that disturbance
will necessarily occur. In the context of foraging ranges for seals from their haul out sites, harbour seals tagged in and
around Orkney were found to have a typical foraging range of 20km (SMRU Limited (2011), see Section 13.9.2), although
juveniles were found to have much less site fidelity and at other sites around the UK, harbour seal have been known to
travel up to 60km routinely (e.g. Thompson et al. 1996). Grey seal are known to forage up to 145km from their haul out
sites (Thompson et al. 1996), over wide estimated home ranges of 1,088 to 6,400km² (Dietz et al. 2003). While the
population consequences of disturbance are uncertain, it is unlikely at these ranges that there would be significant
population level effects. As the noise disturbance of up to 14km for cable laying, rock placement and construction vessels
will be intermittent and it is unlikely that the noise ranges presented will result in complete exclusion from this area; it is
highly unlikely there will be any significant barrier effects.
In addition, the modelled noise ranges do not take into account existing noise in the environment, including anthropogenic
noise from vessels (e.g. ferries) as well as the high natural noise sources present in areas of high tidal currents. Supporting
Document: Xodus (2015) outlines that these could be expected to be approximately 106 to 139dB re 1μPa depending on
the state of tide.
During Stage 1, the potential disturbance from underwater noise would be intermittent over the 24 month construction
period. The total construction period for Stage 1 and 2 will be 60 months (5 years). While there could be up to four vessels
on site, occasionally, it is likely that these will be smaller vessels and therefore the noise range will be captured by the
worst case scenario of 14km.
As described in Section 13.9, there is no known reference population for basking shark and the sightings data are too low
to determine a density estimate for white-beaked dolphin. In addition, Supporting Document: Xodus (2015) outlines the
low level of available data for disturbance effects for fish, including elasmobranchs and so no quantitative noise modelling
is available. These species are therefore considered qualitatively, with input from the noise modelling where possible.
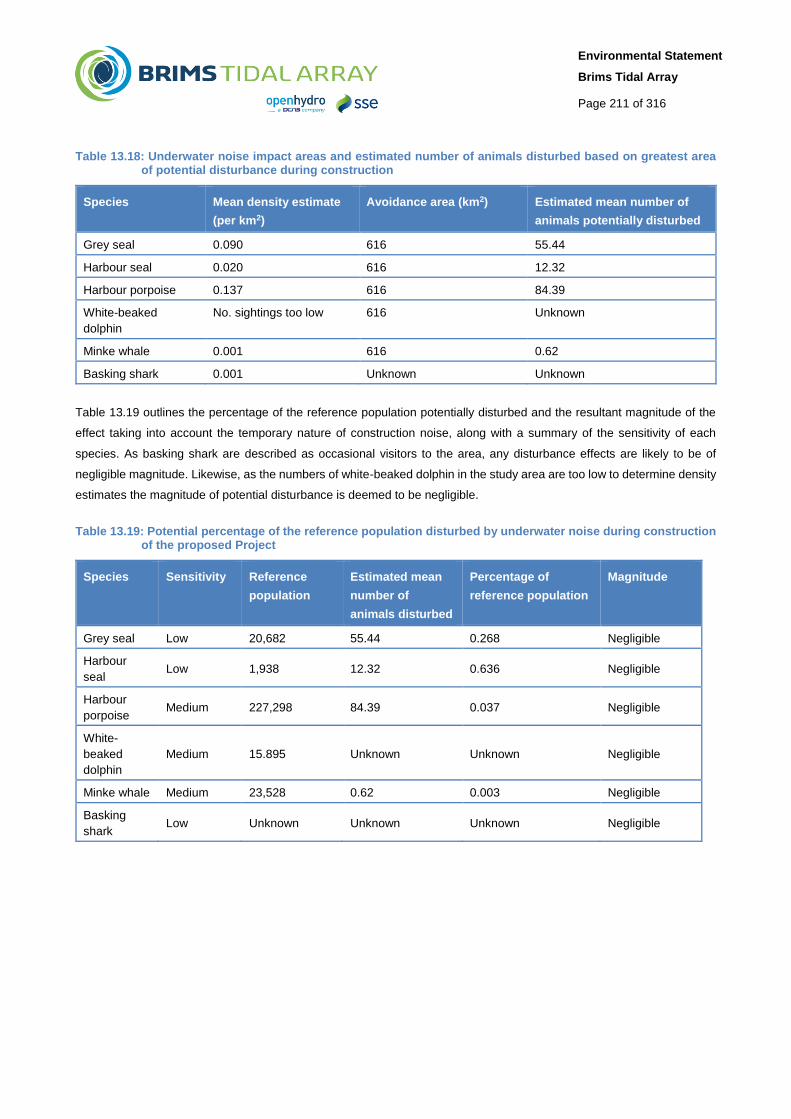
Environmental Statement
Brims Tidal Array
Page 211 of 316
Table 13.18: Underwater noise impact areas and estimated number of animals disturbed based on greatest area of potential disturbance during construction
Species Mean density estimate
(per km2)
Avoidance area (km2) Estimated mean number of
animals potentially disturbed
Grey seal 0.090 616 55.44
Harbour seal 0.020 616 12.32
Harbour porpoise 0.137 616 84.39
White-beaked
dolphin
No. sightings too low 616 Unknown
Minke whale 0.001 616 0.62
Basking shark 0.001 Unknown Unknown
Table 13.19 outlines the percentage of the reference population potentially disturbed and the resultant magnitude of the
effect taking into account the temporary nature of construction noise, along with a summary of the sensitivity of each
species. As basking shark are described as occasional visitors to the area, any disturbance effects are likely to be of
negligible magnitude. Likewise, as the numbers of white-beaked dolphin in the study area are too low to determine density
estimates the magnitude of potential disturbance is deemed to be negligible.
Table 13.19: Potential percentage of the reference population disturbed by underwater noise during construction of the proposed Project
Species Sensitivity Reference
population
Estimated mean
number of
animals disturbed
Percentage of
reference population
Magnitude
Grey seal Low 20,682 55.44 0.268 Negligible
Harbour
seal Low 1,938 12.32 0.636 Negligible
Harbour
porpoise Medium 227,298 84.39 0.037 Negligible
White-
beaked
dolphin
Medium 15.895 Unknown Unknown Negligible
Minke whale Medium 23,528 0.62 0.003 Negligible
Basking
shark Low Unknown Unknown Unknown Negligible

Environmental Statement
Brims Tidal Array
Page 212 of 316
Summary of Residual Effects
Table 13.20 summarises the residual effects.
Table 13.20: Underwater noise impact significance during construction
Technology
Option
Receptor Sensitivity Mitigation Residual
Magnitude
Residual
Significance
Installation of
unshrouded
devices –
increased
vessels
Grey seal Low None suggested Negligible Negligible
Harbour seal Low Negligible Negligible
Harbour porpoise Medium Negligible Negligible
White-beaked
dolphin
Medium Negligible Negligible
Minke whale Medium Negligible Negligible
Basking shark Low Negligible Negligible
The worst case scenario is based on the installation of unshrouded device types, which would require the greater number
of vessels during construction and therefore greatest potential disturbance from underwater noise. The installation of
shrouded devices, such as the Open Hydro device, would require fewer vessels and therefore the potential for disturbance
from underwater noise during construction would be lower.
There is a medium level of confidence in this assessment, based on the levels of predicted increased underwater noise
during construction of the proposed Project in relation to existing underwater noise in the area.
13.12.1.2 Collision with Vessels
Sensitivity
Collison with vessels can potentially result in death of the animals, or secondary infections or fitness effects which could
lead to the death of the animal. Laist et al. (2001) concluded that vessels over 80m in length cause the most severe or
lethal injuries but that serious injury rarely occurs if animals are struck by vessels travelling at speeds below 10 knots.
Due to vessel noise, it is likely that cetaceans will be able to detect the presence of vessels and may be able to avoid
collisions by taking evasive action. Despite the potential for avoidance of vessels, as discussed in Section 13.12.1.2 ship
strikes are known to occur in cetaceans and cause injury and death. Possible reasons why collisions occur include
distraction whilst undertaking other activities, such as foraging, and social interactions are (Wilson et al. 2007). Marine
mammals can also be inquisitive, which may increase the risk of collision. It is not possible to fully quantify strike rates, as
it is believed that a number go unnoticed. It is possible that collisions which are non-fatal can leave the animal vulnerable
to secondary infection, other complications or predation (Wilson et al. 2007). However, marine mammals are relatively
robust to potential collision, as they have a thick sub-dermal layer of blubber, which defends their vital organs from the
worst of the impact (Wilson et al. 2007).
Marine mammals in the study area may be habituated to the presence of vessels and therefore be expected to be able to
detect and avoid installation vessels. However, it is also possible the masking from other existing noise may limit the ability
of marine mammals to detect approaching vessels.

Environmental Statement
Brims Tidal Array
Page 213 of 316
Harbour porpoise, white-beaked dolphin, other small cetaceans, as well as grey and harbour seal are highly mobile, and
are expected to largely avoid vessel collision. However, these species have been observed with signs of physical trauma
(blunt trauma or propeller cuts) possibly indicating vessel strike (Evans et al. 2011, Onoufriou & Thompson 2014). Given
this evidence harbour porpoise, white-beaked dolphin, harbour and grey seal are considered to have medium sensitivity
to this impact as defined in Table 13.5. Ship strike is a known cause of mortality in minke whale, and this species is also
noted for their curiosity and often approach boats, and other novel items in their environment (Wilson et al. 2007). Their
size means they are less agile than the smaller species, as such they can be considered to have a high sensitivity to
collision risk with vessels.
As stated in Section 13.12.1.1, in relation to underwater noise, basking sharks appear to show no response to surface
vessels. As such there is a risk of collision, especially when vessels may be travelling at speed, which can lead to fatal
consequences. As such the sensitivity of this species to collision with vessels is considered to be high.
Magnitude
Chapter 15 Shipping and Navigation outlines the levels of existing shipping activity within a 5nm buffer around the AfL
area. There was an average of 25 unique vessels per day in winter 2013, and 21 per day in summer 2014. The largest
proportion of these was cargo vessels and tankers using the Outer Sound of the Pentland Firth and passing south of the
AfL area.
During the Project installation there could occasionally be up to four vessels on site at one time, based on concurrent
device installation (including an installation vessel with support vessel) and cable laying (including a cable laying vessel
with support vessel). While working on installation activities, vessels will be stationary or very slow moving and so pose
minimal collision risk to marine mammals and basking shark. Section 13.3 outlines the worst case scenario number of
movements for the various vessel types over the installation durations for the Project Stage 1 and Stage 2. There will be a
maximum of one return trip per device for each vessel type with a maximum of four vessel trips in a day (one return journey
for each of the four vessels that could be on site at one time). The average number of movements per day will be 0.3 during
Stage 1 and 0.9 in Stage 2 installation. In the context of the existing vessel traffic, this level of increase for a temporary
period (24 month for Stage 1 and 60 months (5 years) in total for Stage 1 and 2) would represent a negligible magnitude
for Stage 1 and Stage 1 and 2 combined, for all marine mammals and basking shark.
Corkscrew Injuries
A number of damaged seal carcasses have been washed up on beaches around Scotland and the North Norfolk English
coast (Thompson et al. 2010). The majority of seal carcasses were identified as harbour seal, but also included some
juvenile grey seal were also identified. All the seals had a characteristic wound consisting of a single smooth edged cut
starting at the head and spiralling around the body. Based on the post mortems, it was concluded that mortality was caused
by a single traumatic event involving a strong rotational shearing force (Bexton et al. 2012). The majority of seal carcasses
were identified as harbour seal, but juvenile grey seal were also identified. Initial tests indicated the wounds were consistent
with interactions between seals and ducted propellers (Onoufriou & Thompson 2014).
Recent observations, however, have indicated that such injuries can be caused by grey seal predation on weaned grey
seal pups and young harbour seals (Thompson et al. 2015). The corkscrew injuries documented were consistent with those
seen in spiral death cases and the animals targeted for predation fitted the observed age structure of known spiral death

Environmental Statement
Brims Tidal Array
Page 214 of 316
carcasses found. Although there is currently no direct evidence of grey seals predating adult harbour seals, it is reasonable
to consider that this is possible.
Based on the latest information, the SNCBs (i.e. Scottish Natural Heritage, Natural England, Natural Resources Wales,
Joint Nature Conservation Committee) advice in February 2015, is that “it is considered very likely that the use of vessels
with ducted propellers may not pose any increased risk to seals over and above normal shipping activities and therefore
mitigation measures and monitoring may not be necessary in this regard, although all possible care should be taken in the
vicinity of major seal breeding and haul-out sites to avoid collisions.”
Summary of Residual Effects
Table 13.21 summarises the residual effects.
Table 13.21: Collision with vessels impact significance during construction
Technology
Option
Receptor Sensitivity Mitigation Residual
Magnitude
Residual
Significance
Installation of
unshrouded
devices –
increased
vessels
Small cetaceans Medium Vessel
Management
Plan to
standardise
BTAL traffic
routes and
speeds to and
from the AfL area
GM07, MM01
Negligible Negligible
Grey seal Medium Negligible Negligible
Harbour seal Medium Negligible Negligible
Minke whale High Negligible Minor
Basking shark High Negligible Minor
The worst case scenario for the number of vessels movements during construction is based on the installation of
unshrouded device types. The installation process for these device types is anticipated to be in two parts, foundations and
then turbine installation. This requires more vessel movements than installing a device as one unit which is the expected
process for installation of shrouded devices, such as the Open Hydro device. The potential impact associated with this will
therefore be less in magnitude, with the impact significance remaining negligible or minor.
There is a medium level of confidence in this assessment, based on the evidence used to assess the sensitivity of marine
mammals and basking shark to this type of impact and the levels of predicted Project vessel traffic in relation to existing
vessel data.
13.12.1.3 Disturbance of Seals at Haul Out Sites
Sensitivity
Noise disturbance and visual presence of vessels, equipment and personnel during the installation works could potentially
displace seals from any nearby haul out sites.
Evidence from aerial surveys pre- and post-installation of the SeaGen tidal device in Strangford Lough showed no evidence
of significant between year changes in the seal use of haul out sites in the vicinity of that single device. It is therefore
expected that seals have some tolerance to adapt and recover from this potential impact (Royal Haskoning, 2012).
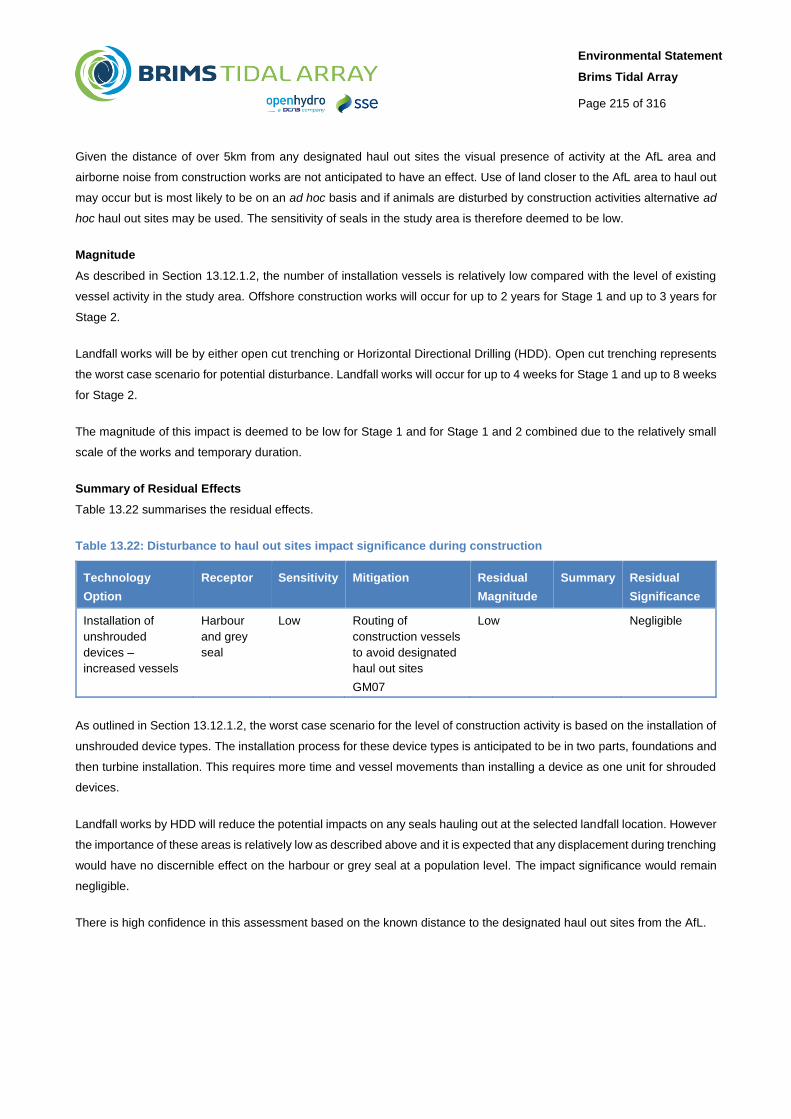
Environmental Statement
Brims Tidal Array
Page 215 of 316
Given the distance of over 5km from any designated haul out sites the visual presence of activity at the AfL area and
airborne noise from construction works are not anticipated to have an effect. Use of land closer to the AfL area to haul out
may occur but is most likely to be on an ad hoc basis and if animals are disturbed by construction activities alternative ad
hoc haul out sites may be used. The sensitivity of seals in the study area is therefore deemed to be low.
Magnitude
As described in Section 13.12.1.2, the number of installation vessels is relatively low compared with the level of existing
vessel activity in the study area. Offshore construction works will occur for up to 2 years for Stage 1 and up to 3 years for
Stage 2.
Landfall works will be by either open cut trenching or Horizontal Directional Drilling (HDD). Open cut trenching represents
the worst case scenario for potential disturbance. Landfall works will occur for up to 4 weeks for Stage 1 and up to 8 weeks
for Stage 2.
The magnitude of this impact is deemed to be low for Stage 1 and for Stage 1 and 2 combined due to the relatively small
scale of the works and temporary duration.
Summary of Residual Effects
Table 13.22 summarises the residual effects.
Table 13.22: Disturbance to haul out sites impact significance during construction
Technology
Option
Receptor Sensitivity Mitigation Residual
Magnitude
Summary Residual
Significance
Installation of
unshrouded
devices –
increased vessels
Harbour
and grey
seal
Low Routing of
construction vessels
to avoid designated
haul out sites
GM07
Low Negligible
As outlined in Section 13.12.1.2, the worst case scenario for the level of construction activity is based on the installation of
unshrouded device types. The installation process for these device types is anticipated to be in two parts, foundations and
then turbine installation. This requires more time and vessel movements than installing a device as one unit for shrouded
devices.
Landfall works by HDD will reduce the potential impacts on any seals hauling out at the selected landfall location. However
the importance of these areas is relatively low as described above and it is expected that any displacement during trenching
would have no discernible effect on the harbour or grey seal at a population level. The impact significance would remain
negligible.
There is high confidence in this assessment based on the known distance to the designated haul out sites from the AfL.

Environmental Statement
Brims Tidal Array
Page 216 of 316
13.12.1.4 Indirect Effects on Prey Species
Sensitivity
Grey and harbour seal feed on a variety of prey species, and are both considered to be opportunistic feeders with the
species in highest abundance in the area when they feed usually providing the predominant component of their diet (see
Section 13.9.2).
Due to the increasing size of grey seal population within the UK, prey availability is not considered to be limiting (SCOS,
2012) and the population is resilient to small scale changes in prey. Grey seal are therefore considered to have low
sensitivity to changes in prey resources.
Given the declining harbour seal population and the uncertainty regarding the cause(s), which could include competition
for prey (see Section13.9.2.2), this species is likely to be more sensitive to changes than grey seal. Harbour seal also
range less distance when foraging, compared with grey seal and so any localised changes may have more impact. Harbour
seal are therefore considered to have medium sensitivity.
The diet of harbour porpoise over recent years is thought to reflect changes in the composition of food resources (Section
13.9.3.1). Re-distribution of harbour porpoise between the 1995 SCANS and 2005 SCANS II surveys (Hammond et al.
2013) are thought to, in part reflect re-distribution of their major prey species, and over this time the size of the population
did not change. However, there are limited data linking prey abundance to diet trends in this species, and the diet of harbour
porpoise had large overlap with commercial fisheries catch (Santos & Pierce 2003). As discussed previously, harbour
porpoise, have relatively high daily energy demands and need to consume between 4% and 9.5% of their body weight in
food per day (Kastelein et al. 1997). If a harbour porpoise does not capture enough prey to meet its daily energy
requirements it can rely on stored energy (primarily blubber) for three to five days, depending on body condition (Kastelein
et al. 1997). Harbour porpoise are therefore considered to have medium sensitivity to this impact.
White-beaked dolphin and minke whale have a varied diet; depending on the regions (see Sections 13.9.3.2 and 13.9.3.3,
respectively). Both species can be considered more opportunistic feeders than harbour porpoise, with the major prey
species in their diet reflecting local densities of prey species, and larger body mass may mean they are more robust to
fluctuations in prey availability. As such they are considered to have low sensitivity to indirect effects on prey species.
In order to meet their energy requirements basking sharks must select foraging locations with high plankton concentrations,
such as frontal areas, and their use of these areas appears to be consistent between years (Sims & Reid 2002). Research
suggests that declines in plankton may lead to declines in occurrence of sharks in areas, but it is not clear whether they
successfully find alternate foraging locations elsewhere (Sims & Reid 2002). In this assessment basking shark are
considered to have medium sensitivity to indirect effects on prey species.
Magnitude
Chapter 12 Fish Ecology outlines a worst case scenario impact of minor consequence on species that could be prey
resource for marine mammals. Impacts on prey are anticipated to be localised around the AfL area and any small scale
spatial changes are likely to be tracked by marine mammals within the wider study area. The magnitude of the effect on
marine mammals is therefore deemed to be negligible.

Environmental Statement
Brims Tidal Array
Page 217 of 316
There is no known mechanism for the installation works to have a discernible impact on plankton and therefore there will
be no impact on basking shark prey resource.
Summary of Residual Effects
Table 13.23 summarises the residual effects.
Table 13.23: Changes to prey resource impact significance during construction
Technology
Option
Receptor Sensitivity Mitigation Residual
Magnitude
Residual
Significance
Gravity bases -
habitat loss,
Drilled pin pile
tripod
- smothering and
Drilled monopile
- noise
Harbour seal Medium No specific
suggested
mitigation (See
Chapter 12 Fish
Ecology)
Negligible Negligible
Harbour porpoise Medium Negligible Negligible
Basking shark Medium No impact No impact
Grey seal Low Negligible Negligible
Minke whale Low Negligible Negligible
White-beaked
dolphin
Low Negligible Negligible
There is a high level of confidence in this assessment based on the evidence used to assess the sensitivity of marine
mammals to this type of impact and the small scale potential impacts on prey species.
13.12.2 Impacts during Operation and Maintenance
13.12.2.1 Underwater Noise
Sensitivity
As described in Section 13.12.1.1, the sensitivity of harbour porpoise, minke whale and white beaked dolphin is assessed
as medium, and the sensitivity of harbour, grey sea and basking shark is low.
Magnitude
Supporting Document: Xodus (2015) provides noise modelling for a 16m diameter shrouded device with a source peak
sound pressure level of approximately 155 dB re 1μPa @ 1m based on existing data for the Open Hydro device. Xodus
(2015) also outlines that during periods of peak tidal flow (when turbine noise is also greatest) the ambient noise is likely
to be in the order of 120-139dB re 1μPa. The noise modelling is therefore likely to be highly conservative.
As with construction noise, operational noise is not predicted to reach thresholds which could result in fatalities or physical
injury (Supporting Document: Xodus, 2015). Modelling of behavioural disturbance, using the threshold criteria described
in Section 13.12.1.1, provides the predicted avoidance areas and numbers of animals potentially disturbed outlined in:
Table 13.24 for Stage 1; and
Table 13.25 for Stages 1 and 2 combined.

Environmental Statement
Brims Tidal Array
Page 218 of 316
As described in Section 13.9, there is no known reference population for basking shark and the sightings data are too low
to determine a density estimate for white-beaked dolphin. In addition, Supporting Document: Xodus (2015) outlines the
low level of available data for disturbance effects for fish, including elasmobranchs and so no quantitative noise modelling
is available. These species are therefore considered qualitatively, with input from the noise modelling where possible.
Table 13.24: Underwater noise impact areas and estimated number of animals disturbed for Stage 1
Species Mean density estimate
(per km2)
Avoidance area (km2) Estimated mean number of
animals potentially
disturbed
Grey seal 0.090 30 0.25
Harbour seal 0.020 30 0.06
Harbour porpoise 0.137 30 0.38
White-beaked dolphin No. sightings too low 30 Unknown
Minke whale 0.001 30 0.003
Basking shark 0.001 Unknown Unknown
Table 13.25: Underwater noise impact areas and estimated number of animals disturbed for Stage 1 and 2
Species Mean density estimate
(per km2)
Avoidance area
(km2)
Estimated mean number of
animals potentially disturbed
Grey seal 0.090 30 2.70
Harbour seal 0.020 30 0.60
Harbour porpoise 0.137 30 4.11
White-beaked dolphin No. sightings too low 30 Unknown
Minke whale 0.001 30 0.03
Basking shark 0.001 Unknown Unknown
Table 13.26 outlines the percentage of the reference population potentially disturbed and the resultant magnitude of the
effect, along with a summary of the sensitivity of each species. As basking shark are described as occasional visitors to
the area, any disturbance effects are likely to be of negligible magnitude. Likewise, as the numbers of white-beaked dolphin
in the study area are too low to determine density estimates the magnitude of potential disturbance is deemed to be
negligible.

Environmental Statement
Brims Tidal Array
Page 219 of 316
Table 13.26: Potential percentage of the reference population disturbed by underwater noise for Stages 1 and 2 combined
Species Sensitivity Reference
population
Estimated mean
number of
animals disturbed
Percentage of
reference population
Magnitude
Grey seal Low 20,682 2.70 0.013 Negligible
Harbour seal Low 1,938 0.60 0.031 Negligible
Harbour
porpoise
Medium 227,298
4.11 0.002 Negligible
White-beaked
dolphin
Medium 15.895
Unknown Unknown Negligible
Minke whale Medium 23,528 0.03 <0.001 Negligible
Basking shark Low Unknown Unknown Unknown Negligible
Summary of Residual Effects
Table 13.27 summarises the residual effects.
Table 13.27: Underwater noise impact significance during operation
Technology
Option
Receptor Sensitivity Mitigation Residual Magnitude Residual
Significance
Shrouded
device –
operational
noise
Grey seal Low None suggested
Negligible Negligible
Harbour seal Low Negligible Negligible
Harbour porpoise Medium Negligible Negligible
White-beaked
dolphin
Medium Negligible Negligible
Minke whale Medium Negligible Negligible
Basking shark Low Negligible Negligible
There is a medium level of confidence in this assessment, based on the levels of predicted increased underwater noise
from the operational devices in relation to existing underwater noise in the area.
13.12.2.2 Collision with Operational Tidal Devices
Sensitivity
Thompson (2013) undertook a telemetry study of harbour seal behaviour in an area of high tidal energy (Kyle Rhea, west
Scotland). The telemetry data collected in the summer of 2012 shows extensive use of tidal race areas, with the seals
seeming to move forwards and backwards with the tide. The seals repeatedly dived to or close to the bottom suggesting
they were using the tidal rapids for foraging.
The moving rotors of tidal energy devices pose a potential collision risk for marine mammals and basking shark. However,
there is currently limited understanding and empirical data relating interactions between marine mammals or basking shark

Environmental Statement
Brims Tidal Array
Page 220 of 316
with tidal devices. Data from telemetry studies around the SeaGen device in Strangford Lough, Northern Ireland, suggest
that harbour seal may be exhibiting a degree of avoidance, with peaks in transit approximately 250m either side of the
device (Lonergan et al. 2010). However, there are no data on how other species of marine mammal may respond to, or
interact with tidal devices.
The Brims Underwater Noise Assessment (Supporting Document: Xodus, 2015) indicates that for Stage 1, the extent of
the potential disturbance zone for marine mammals for the operational tidal array is a radius of approximately 1km from
the centre of the array, and for Stage 2, the extent of the potential disturbance zone will be 2 to 4km. These noise ranges
relate to device operation during full tidal flow, however during these periods the background noise will also be at its highest
and this is not taken into consideration in the underwater noise modelling. There is therefore potential that noise from the
turbines could be masked by ambient noise (Supporting Document: Xodus, 2015). Noise from the turbines will be less
during lower tidal velocities; however the background noise will also be reduced. Given the potential for masking of the
devices operational noise due to high background noise levels, 100% avoidance behaviour cannot be assumed to occur
in response to tidal device noise. EMEC (2014) suggests the avoidance rates shown in Table 13.28 for collision risk
modelling at the Falls of Warness tidal site. Band (2015) recommends presenting collision risk results using a range of
avoidance rates 0, 50, 95, 98 and 99%, these are presented in Table 13.30 and Table 13.32. The collision risk using the
avoidance rates in Table 13.28 are taken forward for consideration against reference populations, PBR, PCoD and in the
CIA.
Table 13.28: Species avoidance rates
Species Avoidance rate
Grey seal 98%
Harbour seal 98%
Harbour porpoise 98%
Minke whale 95-98%
White-beaked dolphin 98%
Basking shark 95-98%
There is also uncertainty associated with the potential for a collision to result in fatality, and the potential physical effect of
collision impacts on marine mammals is part of on-going Marine Scotland funded research by SMRU.
Given the uncertainties around this impact the sensitivity of all marine mammal species is assessed as medium, assuming
the individual receptor has limited capacity to avoid, adapt to, accommodate or recover from the anticipated impact.
As stated previously, basking sharks have slow movements, and may be unaware of their surrounding when feeding or
mating, as such there is a risk of collision. However, basking sharks when feeding focus on the near surface part of the
water column, as they pursue their planktonic prey. As there will be a minimum surface clearance of 30m above the rotors
within the AfL area, it is likely that basking shark, if in the area, will transit over the devices and not encounter the rotors.
As such the sensitivity of this species to this impact considered to be medium.

Environmental Statement
Brims Tidal Array
Page 221 of 316
Magnitude
As discussed in Section 13.8.2, the ERM based on work by the Scottish Association for Marine Science (SAMS) (Wilson
et al. 2007) is deemed to be most appropriate to this assessment. For three-bladed unshrouded devices the SNH guidance
(Band 2015) and spreadsheet (SNH 2015) were used for the ERM and for the shrouded Open Centre (OCT) devices a
modified ERM based on the EMEC spreadsheet (EMEC 2014b) was used. To provide context to the ERM results, the
outputs of CRM using the SNH (2015) model template are provided in Appendices 2 and 3.
The realistic worst case parameters used for each device types are outlined in Section 13.3.1 and Table 13.2. The species
size, swim speeds, dive and surface times used in the ERM are presented in Table 13.29. Species densities used in the
ERM are provided in Table 13.15. All density estimates outlined in Table 13.15 have been corrected for availability to take
account of the probability of detecting animals on the transect line (known as g(0)) and therefore no further adjustments
were made to these density estimates in the ERM or CRM.
Table 13.29: Species parameters used in the ERM and CRM (Appendices 2 and 3)
Species Size Mean swim speed Mean dive time Mean surface time
Length Effective
radius
Grey seal 1.86 0.42 1.8 (vertical swim
speed 0.61m/s) 297 165
Harbour seal 1.41 0.34 1.8 (vertical swim
speed 0.85m/s) 180 39.5
Harbour
porpoise 1.48 0.32 1.4 26.2 3.9
Minke whale 8.8 2.2 2.1 87 3.5
Basking shark 7.0 1.7 1.0 42 1
Source: Band (2015)
Table 13.30 outlines the annual collision risk for a single unshrouded device for a range of avoidance rates, using the ERM,
with the density estimates provided in Table 13.15. The ERM provides an estimate of less than one individual for each of
the species assessed, based on a 98% avoidance rate for harbour porpoise, grey seal and harbour seal and 95-98%
avoidance rate for minke whale and basking shark.
Appendix 1 provides annual encounter rates for unshrouded turbines, using the ERM, based on SCANS and SMRU seal
density estimates, as requested by SNH to provide context to the results presented in Table 13.30. As discussed in Section
13.9 the SCANS and SMRU density estimates are shown to be approximately one to two orders of magnitude greater than
the MeyGen, EMEC and BTAL site specific surveys and at a resolution of 25km2 are too crude for the localised variation
across Orkney. In addition, Appendices 2 and 3 provide annual collision risk using the CRM with density estimates provided
in Table 13.15 provides a summary of density estimates and reference populations.
Table 13.15 (Appendix 2) as well as the SCANS/ SMRU density estimates (Appendix 3). As discussed in Section 13.8.2,
ERM is deemed to be the more appropriate model for marine mammal collision risk compared with than CRM.

Environmental Statement
Brims Tidal Array
Page 222 of 316
For the proposed Stage 1 development of 30 unshrouded devices, the estimated annual encounter rates using the
avoidance rates provided in Table 13.28 are as follows (Table 13.31):
Approximately three grey seal (0.014% of the reference population);
Less than one harbour seal (0.023% of the reference population);
Three harbour porpoise (0.001% of the reference population);
Less than one minke whale (0.0006% of the reference population); and
Less than one basking shark (unknown reference population).
This represents a low magnitude for harbour porpoise, negligible magnitude for minke whale and basking shark, and
medium magnitude for grey seal and harbour seal.
For the proposed Stage 1 and Stage 2 development of 200 unshrouded devices, the estimated annual encounter rates
using the avoidance rates provided in Table 13.28 are approximately (Table 13.31):
20 grey seals (0.096% reference population);
Three harbour seals (0.151% of the reference population);
21 harbour porpoise (0.009% of the reference population);
One minke whale (0.004% of the reference population); and
Four basking shark (unknown reference population).
This represents a medium magnitude for grey seal and harbour seal, and low magnitude for harbour porpoise, minke whale
and basking shark.
Table 13.30: Estimated annual encounter rates (using the ERM) (individuals/year) with and without avoidance for a single three-blade device (unshrouded)
Species 3 blade turbine
0%
avoidance
50%
avoidance
90%
avoidance
95%
avoidance
98%
avoidance
99%
avoidance
Grey seal 4.97 2.49 0.50 0.25 0.099 0.050
Harbour seal 0.73 0.37 0.07 0.04 0.015 0.007
Harbour porpoise 5.38 2.69 0.54 0.27 0.108 0.054
Minke whale 0.10 0.05 0.01 0.005 0.002 0.001
Basking shark 0.38 0.19 0.04 0.02 0.008 0.004

Environmental Statement
Brims Tidal Array
Page 223 of 316
Table 13.31: Summary of estimated annual encounter rate (using the ERM) (individuals/year) with avoidance for three-blade unshrouded turbines
Species Avoidance 1 turbine 30 turbines 200
turbines
30 turbines 200 turbines
ERM for three-blade turbines % Reference population
Grey seal 98% 0.099 2.982 19.880 0.014% 0.096%
Harbour seal 98% 0.015 0.438 2.920 0.023% 0.151%
Harbour porpoise 98% 0.108 3.228 21.520 0.001% 0.009%
Minke whale 98-95% 0.002-0.005 0.06-0.15 0.4-1
0.0003-
0.0006% 0.002-0.004%
Basking shark 98-95% 0.0076-
0.019 0.228-0.57
1.52-3.8 N/A N/A
Table 13.32 provides the estimated annual encounter rates for the OCT device using the modified ERM. The modelling
shows that for one device, less than one individual for each of the species is predicted, based on a 98% avoidance rate
for harbour porpoise, grey seal and harbour seal and 95-98% avoidance rate for minke whale and basking shark.
For the proposed Stage 1 development of 30 OCT devices, the estimated annual encounter rates using the avoidance
rates provided in Table 13.28 are approximately (Table 13.33):
Two grey seal (0.01% of the reference population);
Less than one harbour seal (0.02% of the reference population);
Three harbour porpoise (0.001% of the reference population);
Less than one minke whale (0.0001% of the reference population); and
Less than one basking shark (unknown reference population).
This represents a low magnitude for harbour porpoise, minke whale and basking shark, and medium magnitude for grey
seal and harbour seal.
For the proposed Stage 1 and Stage 2 development of 200 OCT devices, the estimated annual encounter rates using the
avoidance rates provided in Table 13.28 are approximately (Table 13.33):
14 grey seals (0.07% of the reference population);
Two harbour seals (0.13% of the reference population);
18 harbour porpoise (0.008% of the reference population);
Less than one minke whale (0.0007% of the reference population); and
Less than one basking shark (unknown reference population).
This represents a low magnitude for harbour porpoise, minke whale and basking shark, and medium magnitude for grey
seal and harbour seal.

Environmental Statement
Brims Tidal Array
Page 224 of 316
Table 13.32: Estimated annual encounter rate (individuals/year) with and without avoidance for single open-centre turbine
Species OCT
0%
avoidance
50%
avoidance
90%
avoidance
95%
avoidance
98%
avoidance
99%
avoidance
Grey seal 3.44 1.72 0.34 0.17 0.07 0.03
Harbour seal 0.62 0.31 0.06 0.03 0.01 0.01
Harbour
porpoise 4.44 2.22 0.44 0.22 0.09 0.04
Minke whale 0.02 0.01 0.0017 0.0008 0.0003 0.0002
Basking shark 0.08 0.04 0.01 0.004 0.0017 0.0008
Table 13.33: Summary of estimated annual encounter rate (ERM) (individuals/year) with avoidance for shrouded turbines open centre turbines (OCT)
Species Avoidance 1 turbine 30 turbines 200
turbines
30 turbines 200 turbines
ERM for OCT % Reference population
Grey seal 98% 0.07 2.06 13.75 0.01% 0.07%
Harbour seal 98% 0.01 0.37 2.47 0.02% 0.13%
Harbour porpoise 98% 0.09 2.66 17.75 0.001% 0.008%
Minke whale 98-95% 0.0003-
0.0008 0.01-0.024 0.06-0.16 0.0001%
0.0002-
0.0007%
Basking shark 98-95% 0.0017-
0.004 0.05-0.13 0.33-0.83
N/A N/A
Under the Marine (Scotland) Act 2010, licences can be issued to shoot seals, e.g. for fish farm protection. The management
of the maximum number of licences is controlled using the concept of Potential Biological Removal (PBR). PBR is the
number of individual seals that can be removed from the population without causing a decline in the population and is
calculated annually by SMRU using the latest seal counts. The most recent, 2015, grey seal PBR for the Orkney and North
Coast MU is 1,240, with 220 licences granted and for harbour seal the PBR is 11, with no licences granted (Scottish
Government, 2015). The results indicate that the Project is unlikely to result in potential collision risk which exceeds the
PBR for either seal species.
There is ongoing discussion as to whether PBR is appropriate for use in potential collision risk as a strike may not result in
a fatality. As discussed in Section 13.8.2.1, the interim PCoD has been developed as an approach for assessing and
quantifying the potential consequences for marine mammal populations of any disturbance and/or injury that may result
from offshore energy developments (Harwood et al. 2014).
The Interim PCoD was run for grey seal, harbour seal, harbour porpoise and minke whale (see Section 13.8.2.1) using the
collision risk outlined in Table 13.31 and Table 13.33. Table 13.34 and Table 13.35 outline the predicted additional risk
caused by the Project, comparing the predicted undisturbed population and the disturbed population based on 30 (Stage 1)

Environmental Statement
Brims Tidal Array
Page 225 of 316
and 200 (Stage 1 and 2) unshrouded devices (Table 13.34) as well as 30 and 200 OCT devices (Table 13.35). The results
are presented as a probability (on a scale of 1 to 0, where 1 is 100% probability) of 1%, 2%, and 5% declines in the
population at 1 year, 6 years, 12 years and 18 years after the installation of Stage 1 or Stage 1 and 2. All scenarios were
run for 1000 simulations which can result in very small scale variations in the results. Appendix 5 provides the predicted
probability of declines for the undisturbed population and the disturbed populations.
The results indicate that for all species and populations assessed, the probability of the array (Stage 1 or Stage 1 and 2)
causing an additional risk of population decline is extremely low (Table 13.34 and Table 13.35).
Table 13.34: Predicted additional risk of population decline of Stage 1: 30 three-blade unshrouded devices and Stage 1 and 2: 200 three-blade unshrouded devices
Year Stage 1: 30 three-blade unshrouded devices Stage 1 and 2: 200 three-
blade unshrouded devices
Probability of 1%
decline
Probability of 2%
decline
Probability of 5%
decline
Probabilit
y of 1%
decline
Probabilit
y of 2%
decline
Probabilit
y of 5%
decline
Grey seal Orkney and North coast population
1 0.001 0 0 0.007 0.005 0
6 0.001 0 0 0.006 0.002 0
12 0 0 0 0.005 0 0
18 0.001 0 0 NA NA NA
Harbour seal Orkney and North coast population
1 0 0 0 0.001 0.005 0.004
6 0 0 0 0 0 0.002
12 0 0 0 0 0 0
18 0 0 0 0 0 0
Harbour porpoise North Sea population
1 0 0 0 0.001 0 0
6 0.001 0 0 0.002 0.002 0
12 0 0 0 0.001 0 0
18 0.001 0.001 0 0.002 0 0
Harbour porpoise West Scotland population
1 0.001 0.001 0 0.005 0.008 0
6 0.001 0.003 0 0.021 0.013 0.001
12 0.005 0.005 0 0.018 0.013 0
18 0.005 0.002 0 0.029 0.01 0
Minke whale Celtic and Greater North Seas population
1 0 0 0 0 0 0.001
6 0 0 0 0 0.001 0
12 0 0 0 0.001 0.001 0

Environmental Statement
Brims Tidal Array
Page 226 of 316
Year Stage 1: 30 three-blade unshrouded devices Stage 1 and 2: 200 three-
blade unshrouded devices
Probability of 1%
decline
Probability of 2%
decline
Probability of 5%
decline
Probabilit
y of 1%
decline
Probabilit
y of 2%
decline
Probabilit
y of 5%
decline
18 0 0 0 0 0 0
Table 13.35: Predicted additional risk of population decline of Stage 1: 30 OCT devices and Stage 1 and 2: 200 OCT devices
Year Stage 1: 30 OCT devices Stage 1 and 2: 200 OCT devices
Probability
of 1%
decline
Probability of
2% decline
Probability of
5% decline
Probability of
1% decline
Probability of
2% decline
Probability
of 5%
decline
Grey seal Orkney and North coast population
1 0.001 0.001 0 0.005 0 0
6 0 0.001 0 0.006 0 0
12 0 0 0 0.005 0 0
18 0 0 0 0 0 0
Harbour seal Orkney and North coast population
1 0 0 0 0.001 0.006 0.003
6 0 0 0 0 0 0.003
12 0 0 0 0 0 0
18 0 0 0 0 0 0
Harbour porpoise North Sea population
1 0 0 0 0.002 0.001 0
6 0 0 0 0.001 0.001 0
12 0.001 0 0 0.002 0 0
18 0 0 0 0.002 0 0
Harbour porpoise West Scotland population
1 0 0 0 0.002 0.004 0.001
6 0 0.001 0 0.018 0.007 0
12 0.003 0.001 0 0.023 0.013 0
18 0.002 0 0 0.027 0.011 0
Minke whale Celtic and Greater North Seas population
1 0 0 0 0 0 0
6 0 0 0 0 0 0
12 0 0 0 0 0 0
18 0 0 0 0 0 0

Environmental Statement
Brims Tidal Array
Page 227 of 316
Summary of Residual Effects
Table 13.36 summarises the residual effects.
Table 13.36: Collision with devices impact significance during operation
Technology Option Receptor Sensitivity Mitigation Residual
Magnitude
Residual
Significance
Unshrouded 3-blade
or Shrouded OCT
Harbour
porpoise
Medium No specific
mitigation
suggested. A
monitoring
programme will be
agreed with SNH
and MS. This will
form an adaptive
management plan
allowing mitigation to
be implemented if
required.
GM04
GM14
Low for Stage 1 and
Stage 1 & 2
Minor for Stage 1
and Stage 1 & 2
Unshrouded 3-blade
or Shrouded OCT
Grey seal Medium Medium for Stage 1
and Stage 1 & 2
Moderate for
Stage 1 and
Stage 1 & 2
Unshrouded 3-blade
or Shrouded OCT
Harbour
seal
Medium Medium for Stage 1
and Stage 1 & 2
Moderate for
Stage 1 and
Stage 1 & 2
Unshrouded 3-blade
or Shrouded OCT
Minke
whale
Medium Negligible for Stage
1 And Low for Stage
1 & 2
Minor for Stage 1
and Stage 1 & 2
Unshrouded 3-blade
or Shrouded OCT
Basking
shark
Medium Negligible for Stage
1 and Low for Stage
1 & 2
Minor for Stage 1
and Stage 1 & 2
There is a medium to low level of confidence in this assessment based on the lack of available evidence which shows an
understanding of the potential physical interactions between marine mammals and operational rotors. The approach taken
is deemed to be conservative.
13.12.2.3 Collision with Vessels
Sensitivity
As described in Section 13.12.1.2, cetaceans, grey seal and harbour seal in the study area are assessed as having medium
sensitivity to the potential risk of collision with vessels, basking shark are deemed to have high sensitivity.
Magnitude
As described in Section 13.3 and in Chapter 15 Shipping and Navigation, the Project shipping survey shows levels of
existing shipping activity of 25 unique vessels per day in winter 2013, and 21 per day in summer 2014 on average. The
largest proportion of these was cargo vessels and tankers using the Outer Sound of the Pentland Firth and passing south
of the AfL area.

Environmental Statement
Brims Tidal Array
Page 228 of 316
During the Project O&M there is likely to be one vessel on site each day, on average. While working on maintenance
activities, vessels will be stationary or very slow moving and so pose minimal collision risk to marine mammals and basking
shark. During O&M one return trip between the selected port and the AfL area is expected per day. In the context of the
existing vessel traffic, this level of increase would represent a negligible magnitude of effect for marine mammals and
basking shark.
Summary of Residual Effects
Table 13.37 summarises the residual effects.
Table 13.37: Collision with vessels impact significance during operation
Technology
Option
Receptor Sensitivity Mitigation Residual
Magnitude
Residual
Significance
Maintenance
of all devices
and hubs
Small
cetaceans
Medium Vessel Management
Plan to standardise
BTAL traffic routes
and speeds to and
from the AfL area
GM07
Negligible Negligible
Grey and
harbour seal
Medium Negligible Negligible
Minke whale
High Negligible Minor
Basking shark High Negligible Minor
There is a medium level of confidence in this assessment, based on the evidence used to assess the sensitivity of marine
mammals and basking shark to this type of impact and the levels of predicted Project vessel traffic in relation to existing
vessel data.
13.12.2.4 Electromagnetic Fields
Sensitivity
It has been hypothesised that the Earth’s magnetic fields are used in the navigation system of some marine species,
therefore there may be potential for marine mammals to exhibit behavioural changes, including displacement due to the
presence of electromagnetic fields (EMF) around subsea cables (Gill et al. 2005). There is currently limited information on
this effect but it is widely believed that marine mammals use the geomagnetic field of the earth to navigate during long
distance migrations (Kirschvink et al. 1986, Klinowska 1985, Normandeau et al. 2011).
Buchanan et al. (2011) report that cetaceans appear able to use geomagnetic cues for navigation, citing several studies
that have correlated mass strandings with anomalies originating from solar storms. However, they also highlight other
studies which show no consistent pattern in geomagnetic anomalies and mass strandings. Murphy et al. (2012) summarise
the state of understanding as there being no evidence to suggest that seals are sensitive to electromagnetic fields but that
some large whale species appear to use variations in the geomagnetic field to navigate.
Gill et al. (2005) report the harbour porpoise, bottlenose dolphin and other small dolphins are potentially responsive to
fields from subsea electrical transmission cabling, however there is also, at present, little evidence to suggest that existing
subsea cables have significantly influenced cetacean movements. Harbour porpoise move in and out of the Baltic Sea,
with several crossings over operating subsea high voltage direct current cables in the Skagerrak and western Baltic Sea

Environmental Statement
Brims Tidal Array
Page 229 of 316
without any apparent effect on their migration pattern. While it is possible that some of the species found at the site may
make some limited use of magnetic fields for navigation, even if only to a limited degree, Buchanan et al. (2011) comment
that it is highly likely that these fields would be one of only a range of cues used to navigate (e.g. sun angle, olfactory,
current strength). There is no evidence that pinnipeds respond to EMF and, therefore, marine mammal sensitivity is
deemed to be low.
Elasmobranchs are the species group that is considered to be the most electro-sensitive. These species naturally detect
bioelectric emissions from prey, conspecifics and potential predators and competitors (Gill et al. 2005). They are also
known to detect magnetic fields. Laboratory and field experiments using AC cables of the type used by the offshore
renewable energy industry showed that EMF emitted was within the range of detection by electro sensitive species such
as elasmobranchs. It was not possible to determine whether the EMF emitted from the power cables had a direct impact
on the species used (Gill & Taylor 2001, Gill et al. 2005, Gill et al. 2009, CMACS 2004).
It has been speculated that elasmobranchs may be confused by anthropogenic E field sources that lie within similar ranges
to natural bioelectric fields. Laboratory behavioural studies have demonstrated both AC and DC artificial electric fields
stimulating feeding responses in elasmobranchs (Kalmijn 1982, Tricas & Sisneros 2004, Kimber et al. 2011). Information
gathered as part of the monitoring programme at the Burbo Bank offshore wind farm suggested that certain elasmobranch
species feed inside the windfarm and demonstrated that they are not excluded during periods of low power generation
(Cefas 2009). Monitoring at the Kentish Flats offshore wind farm found an increase in elasmobranchs during post-
construction surveys in comparison to surveys before construction. There appeared to be no discernible difference
however, between the data for the windfarm and reference areas in terms of changes to population structure and it was
concluded that the population increase observed was unlikely to be related to the operation of the windfarm (Cefas 2009).
At worst, any EMF-related effects are therefore only expected to result in very small scale behavioural reactions rather
than to cause a barrier to migration or result in impacts upon feeding or confusion in elasmobranch species and so basking
shark sensitivity is deemed to be low.
Magnitude
As described in Chapter 5 Project Description the inter-array cabling will have a voltage of 33kV with up to 208 inter-array
cables between the devices covering an area of approximately 0.36km2 (width 0.0005km (0.5m) and length 720km). This
represents around 3% of the AfL area for the Stage 1 and 2 combined. The cables will be shielded to meet industry
standards.
In addition to the inter-array cables, it is anticipated that up to 16 export cables (four for Stage 1 and 12 for Phase 2) may
be required to connect the tidal array to shore. Each cable will have a voltage of up to 132kV. The export cables will be
surface laid as much of the seabed within the AfL area and along proposed export cable routes comprises hard rock
substrate limiting cable burial. The subsea export cables will be shielded to meet industry standards. The maximum cable
route (to the Aith Hope landfall option) is approximately 6.5km.
For AC cables rated between 33kV and 132kV iE fields which could cause avoidance in electro-sensitive species are not
expected. Such iE fields are only expected to occur up to a maximum of 1m from the cable surface of 220kV and 275kV
HVAC cables and will therefore not impact on marine mammals and basking shark transiting in the water column (Gill et

Environmental Statement
Brims Tidal Array
Page 230 of 316
al. (2005). The EMF levels emitting into the water column from these low voltage cables over relatively short distances are
therefore likely to be of negligible magnitude.
Summary of Residual Effects
Table 13.38 summarises the residual effects.
Table 13.38: EMF impact significance during operation
Technology
Option
Receptor Sensitivity Mitigation Residual
Magnitude
Summary Residual
Significance
1MW devices
x 200 and
subsea hubs
Marine
mammals
Negligible None
suggested
Negligible Negligible
Basking shark Medium Negligible Minor
There is a high level of confidence in this assessment based on the evidence used to assess the sensitivity of marine
mammals and basking shark to the type of cables which may be used at the Project site.
13.12.2.5 Disturbance at Haul Out Sites
Sensitivity
As described in Section 13.10.1, the sensitivity of seals in the study area is deemed to be low, due to the absence of
important haul out sites in close proximity to the site.
Magnitude
The works associated with O&M will be more limited compared with the construction phase, with low level vessel activity
(approximately one vessel on site each day).
Due to the low levels of activity and predicted noise, the magnitude is predicted to be negligible.
Summary of Residual Effects
Table 13.39 summarises the residual effects.
Table 13.39: Disturbance to haul out sites impact significance during operation
Technology
Option
Receptor Sensitivity Mitigation Residual
Magnitude
Summary Residual
Significance
All devices
and hubs
Harbour and
grey seal
Low Routing of
maintenance
vessels to
avoid
designated
haul out sites
GM07
Negligible Negligible

Environmental Statement
Brims Tidal Array
Page 231 of 316
There is high confidence in this assessment based on the known distance to the designated haul out sites from the AfL.
13.12.2.6 Indirect Effects on Prey Species
Sensitivity
As described in Section 13.12.1.4, harbour porpoise, harbour seal and basking shark are assessed as having medium
sensitivity to the potential indirect impact associated with changes to prey availability, grey seal, white-beaked dolphin and
minke whale are deemed to have low sensitivity.
Magnitude
Chapter 12 Fish Ecology outlines a worst case scenario impact of minor consequence on species that could be prey for
marine mammals. This impact is anticipated to be localised around the AfL area and is likely to be primarily displacement
which marine mammals can track rather than a decline in prey availability within the wider study area. The magnitude of
the effect on marine mammals is therefore deemed to be negligible.
There is no known mechanism for the installation works to have a discernible impact on plankton and therefore there will
be no impact on basking shark prey resource.
Summary of Residual Effects
Table 13.40 summarises the residual effects.

Environmental Statement
Brims Tidal Array
Page 232 of 316
Table 13.40: Changes to prey resource impact significance during operation
Technology
Option
Receptor Sensitivity Mitigation Residual
Magnitude
Summary Residual
Significance
Gravity bases
- habitat loss,
Drilled pin pile
tripod
- smothering
and
Drilled
monopile
- noise
Harbour seal Medium No specific
suggested
mitigation
Negligible Minor
Harbour
porpoise
Medium Negligible Minor
Basking shark Medium Negligible Minor
Grey seal Low Negligible Negligible
Minke whale Low Negligible Negligible
White-beaked
dolphin
Low Negligible Negligible
There is a high level of confidence in this assessment based on the evidence used to assess the sensitivity of marine
mammals to this type of impact and the small scale potential impacts on prey species.
13.12.3 Impacts during Decommissioning
13.12.3.1 Underwater Noise
Sensitivity
As described in Section 13.12.1.1, the sensitivity of harbour porpoise, minke whale and white beaked dolphin is assessed
as medium, and the sensitivity of harbour, grey sea and basking shark is low.
Magnitude
Supporting Document: Xodus (2015) provides noise modelling for predicted noise sources during decommissioning. This
includes the vessels associated with decommissioning.
As described previously, the modelled noise ranges do not take into account existing noise in the environment, including
anthropogenic noise from vessels (e.g. ferries) as well as the high natural noise sources present in areas of high tidal
currents. Consequently, the predicted ranges for onset of disturbance during operation are considered to be highly
precautionary and exceeding the criteria for potential onset of disturbance effects does not in itself mean that disturbance
will necessarily occur.
As described previously, there is no known reference population for basking shark and the sightings data are too low to
determine a density estimate for white-beaked dolphin. In addition, Supporting Document: Xodus (2015) outlines the low
level of available data for disturbance effects for fish, including elasmobranchs and so no quantitative noise modelling is
available. These species are therefore considered qualitatively, with input from the noise modelling where possible.

Environmental Statement
Brims Tidal Array
Page 233 of 316
Table 13.41: Underwater noise impact areas and estimated number of animals disturbed based on greatest area of potential disturbance during decommissioning
Species Mean density
estimate (per km2)
Avoidance area (km2) Estimated mean number of
animals potentially disturbed
Grey seal 0.090 616 55.44
Harbour seal 0.020 616 12.32
Harbour porpoise 0.137 616 84.39
White-beaked dolphin No. sightings too low 616 Unknown
Minke whale 0.001 616 0.62
Basking shark 0.001 Unknown Unknown
Table 13.41 estimates the number of animals disturbed by noise based on the greatest area of potential disturbance and
Table 13.42 outlines the percentage of the reference population potentially disturbed and the resultant magnitude of the
effect, along with a summary of the sensitivity of each species. As basking shark are described as occasional visitors to
the area, any disturbance effects are likely to be of negligible magnitude. Likewise, as the numbers of white-beaked dolphin
in the study area are too low to determine density estimates the magnitude of potential disturbance is deemed to be
negligible.
Table 13.42: Potential percentage of the reference population disturbed by underwater noise
Species Sensitivity Reference
population
Estimated mean
number of animals
disturbed
Percentage of
reference
population
Magnitude
Grey seal Low 20,682 55.44 0.268 Negligible
Harbour seal Low 1,938 12.32 0.636 Negligible
Harbour porpoise Medium 227,298 84.39 0.037 Negligible
White-beaked dolphin Medium 15.895 Unknown Unknown Negligible
Minke whale Medium 0.62 0.003 Negligible
Basking shark Low Unknown Unknown Unknown Negligible
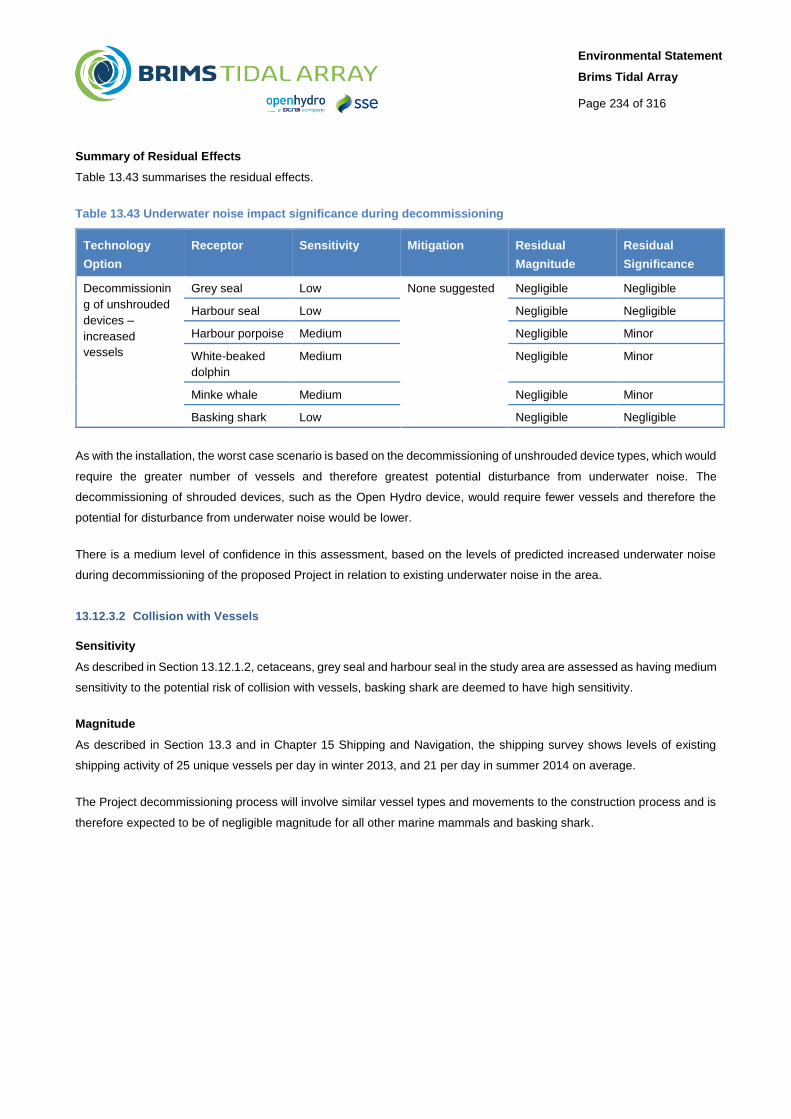
Environmental Statement
Brims Tidal Array
Page 234 of 316
Summary of Residual Effects
Table 13.43 summarises the residual effects.
Table 13.43 Underwater noise impact significance during decommissioning
Technology
Option
Receptor Sensitivity Mitigation Residual
Magnitude
Residual
Significance
Decommissionin
g of unshrouded
devices –
increased
vessels
Grey seal Low None suggested Negligible Negligible
Harbour seal Low Negligible Negligible
Harbour porpoise Medium Negligible Minor
White-beaked
dolphin
Medium Negligible Minor
Minke whale Medium Negligible Minor
Basking shark Low Negligible Negligible
As with the installation, the worst case scenario is based on the decommissioning of unshrouded device types, which would
require the greater number of vessels and therefore greatest potential disturbance from underwater noise. The
decommissioning of shrouded devices, such as the Open Hydro device, would require fewer vessels and therefore the
potential for disturbance from underwater noise would be lower.
There is a medium level of confidence in this assessment, based on the levels of predicted increased underwater noise
during decommissioning of the proposed Project in relation to existing underwater noise in the area.
13.12.3.2 Collision with Vessels
Sensitivity
As described in Section 13.12.1.2, cetaceans, grey seal and harbour seal in the study area are assessed as having medium
sensitivity to the potential risk of collision with vessels, basking shark are deemed to have high sensitivity.
Magnitude
As described in Section 13.3 and in Chapter 15 Shipping and Navigation, the shipping survey shows levels of existing
shipping activity of 25 unique vessels per day in winter 2013, and 21 per day in summer 2014 on average.
The Project decommissioning process will involve similar vessel types and movements to the construction process and is
therefore expected to be of negligible magnitude for all other marine mammals and basking shark.

Environmental Statement
Brims Tidal Array
Page 235 of 316
Summary of Residual Effects
Table 13.44 summarises the residual effects.
Table 13.44: Collision with vessels impact significance during decommissioning
Technology
Option
Receptor Sensitivity Mitigation Residual
Magnitude
Residual
Significance
Unshrouded
devices
Cetaceans Medium Vessel
Management
Plan to
standardise
BTAL traffic
routes and
speeds to and
from the AfL area
GM07
Negligible Minor
Unshrouded
devices
Grey seal Medium Negligible Minor
Unshrouded
devices
Harbour seal Medium Negligible Minor
Unshrouded
devices
Basking shark High Negligible Minor
As with the installation, the decommissioning worst case scenario for the number of vessels movements during construction
is based on the unshrouded device types. The decommissioning process for these device types is anticipated to be in two
parts, foundations and then turbine. This requires more vessel movements than installing a device as one unit which is the
expected process for installation of shrouded devices, such as the Open Hydro device. The potential impact associated
with this will therefore be less magnitude, with the impact significance remaining minor.
There is a medium level of confidence in this assessment, based on the evidence used to assess the sensitivity of marine
mammals and basking shark to this type of impact and the levels of predicted vessel traffic in relation to existing vessel
data.
13.13 ACCIDENTAL AND UNPLANNED EVENTS
13.13.1 Accidental Contamination from Vessels during Construction, O&M, and Decommissioning
13.13.1.1 Sensitivity
There is potential for accidental release of contaminates in all phases of the Project, although it should be noted that vessel
management plans and other measures in the Project Environmental Management Plan (PEMP) are designed to limit the
potential for this impact occurring, and provide measures for managing any spillage should an incident occur.
Should an incident occur, the mobile nature of marine mammal and basking shark means that they are likely to be able to
avoid the area, and contaminants may be rapidly dispersed in the high energy environment. Accumulation of contamination,
such as oil may occur on beaches, provides a greater risk to hauled-out and breeding seals. As such harbour and grey
seal are assessed as having medium sensitivity to this impact, and cetaceans and basking shark are assessed as having
low sensitivity.
13.13.1.2 Magnitude
For the purpose of the assessment, vessel fuel inventory is based on the amount of marine diesel carried on board a
standard large DP installation vessel. Large DP vessels carry between 6,000,000 and 8,000,000 litres of marine diesel in

Environmental Statement
Brims Tidal Array
Page 236 of 316
a number of separate tanks. The worst case scenario for assessing accidental spillages of fuel from vessels is to assume
leakage of one tank of approximately 600,000 litres of marine diesel. Hydrocarbon based spills can have a range of
environmental impacts which will vary depending on a factors such as, the volume, tidal currents, sea state and weather
conditions at the time of the spill. Any spill would be rapidly dispersed and the risk of such a spill occurring is considered
to be very low due to the safety procedures in place to avoid such an incident (see Chapter 15 Shipping and Navigation),
therefore the magnitude of this potential impact is considered to be low.
13.13.1.3 Summary of Residual Effects
Table 13.45 summarises the residual effects.
Table 13.45: Accidental contamination impact significance during construction, O&M and decommissioning
Technology
Option
Receptor Sensitivity Mitigation Residual
Magnitude
Summary Residual
Significance
All devices
Harbour and
grey seal
Medium General
mitigation
vessel
management
and pollution
prevention
GM07, GM05
Low Minor
Cetaceans
and basking
shark
Low Low Negligible
13.13.2 Accidental Contamination from Devices
13.13.2.1 Sensitivity
As described in Section 13.13.1, cetaceans and basking shark are assessed as having low sensitivity due to their mobile
and likely ability to avoid the area. Harbour and grey seal are assessed as having medium sensitivity to this impact due to
potential that haul out sites could become contaminated.
13.13.2.2 Magnitude
Lubricants, oils and other liquids used in the device operation include mineral oil, grease, hydraulic fluid, low toxicity
biodegradable oil, and biodegradable ethanol. The total volume of liquids could be up to 1,000 litres per device. Under
normal operation there is no pathway for these substances to enter the marine environment and so any spillage would be
the result of a serious incident involving a tidal device. Chapter 15 Shipping and Navigation describes the safety procedures
that will be in place to avoid any incidents and therefore the likelihood of accidental contamination is very low and the
magnitude is assessed as low.

Environmental Statement
Brims Tidal Array
Page 237 of 316
13.13.2.3 Summary of Residual Effects
Table 13.46 summarises the residual effects.
Table 13.46: Accidental contamination from devices during operation impact significance
Technology
Option
Receptor Sensitivity Mitigation Residual
Magnitude
Summary Residual
Significance
All devices
Harbour and grey seal Medium Low Minor
Cetaceans and basking
shark
Low Low Negligible
13.14 SUMMARY
Key species that occur in the study area and have been included in the impact assessment are:
o Grey seal;
o Harbour (common) seal;
o Harbour porpoise;
o White beaked dolphin;
o Minke whale; and
o Basking shark.
The existing environment for these species was characterised by two years of boat based surveys, supplemented with
additional, available information.
The following potential impacts have been assessed:
o Underwater noise during construction, O&M, and decommissioning;
o Collision with vessels during construction, O&M, and decommissioning;
o Collision with tidal devices during operation;
o Disturbance at haul out sites during construction, O&M, and decommissioning;
o Indirect effect as a result of changes to prey resource during construction, O&M, and decommissioning;
o Accidental contamination from vessels or devices during construction, O&M, and decommissioning; and
o Disturbance to navigation from Electromagnetic Fields emitted from the export or inter-array cables.
The following impacts were found to be potentially significant with all others deemed to be non-significant:
o Grey seal and harbour seal potential collision risk with tidal turbines for Stage 1 (interim total of 30 turbines) as
well as Stages 1 & 2 (combined total of 200 turbines); and
BTAL will agree mitigation and monitoring measures with relevant stakeholders pre-construction once the final details
of the Project design are known. This will be done through the development of a Project Environmental Management
Plan (PEMP) which is likely to include the following components, of relevance to marine mammals:
o Marine Mammal Management Plan (MMMP);
o Pollution Control Plan; and
o Vessel Management Plan (VMP).

Environmental Statement
Brims Tidal Array
Page 238 of 316
13.15 REFERENCES
Anderwald, P. & Evans, G.H. (2010). Cetaceans of East Grampian Region. SeaWatch Foundation.
APEM. (2013). Year 2: Investigation of the utilisation of sea space by sea birds in the Pentland Firth and Orkney area
2012/13. Final Report. APEM Scientific Report 511639. Report to Marine Scotland.
ASCOBANS. (2012). Convention on Migratory Species. [online] Available at:
http://www.cms.int/species/ascobans/asc_bkrd.htm.
Bäcklin, B-M., Moraeus, C., Roos, A., Eklof, E. & Lind, Y. (2011). Health and age and sex distributions of Baltic grey seals
(Halichoerus grypus) collected from by-catch and hunt in the Gulf of Bothnia. ICES Journal of Marine Science, 68(1); 183–
188.
Band, B. (2014). Annex 3: Detailed Collision Risk Assessment: Marine mammals, Basking Shark, and Diving Birds. In:
EMEC Fall of Warness Test site Environmental Appraisal. September 2014.
Banhuera-Hinestroza, E., Galatius Jørgensen, G., Kinze, C., Rasmussen M. & Evan, P. (2009). White-beaked dolphin. In
Report of ASCOBANS/HELCOM Small Cetacean population structure workshop Held 8-10 October 2007. ASCOBANS,
Bonn, Germany.
Benjamins, S., Harnois, V., Smith, H.C.M., Johanning, L., Greenhill, L., Carter, C. & Wilson, B. (2014). Understanding the
potential for marine megafauna entanglement risk from renewable marine energy developments. Scottish Natural Heritage
Commissioned Report No. 791.
Bexton S., Thompson D., Brownlow A., Barley J., Milne R. & Bidewell C. (2012). Unusual Mortality of Pinnipeds in the
United Kingdom Associated with Helical (Corkscrew) Injuries of Anthropogenic Origin. Aquatic Mammals 2012, 38(3), 229-
240, DOI 10.1578/AM.38.3.2012.229.
Brasseur, S., van Polanen Petel, T., Aarts, G., Meesters, E., Dijkman, E. & Reijnders, P. (2010). Grey seals (Halichoerus
grypus) in the Dutch North Sea: population ecology and effects of windfarms. In: we@sea (Ed.), IMARES Report number
C137/10. [online] Available at: http://www.we-at-sea.org/leden/docs/reports/RL2-2 2005-006 Effect of windfarms on grey
seals in the Dutch North Sea.pdf.
Buchanan, R.A., Fechhelm, R., Abgrall, P. & Lang, A.L. (2011). Environmental Impact Assessment of Electromagnetic
Techniques Used for Oil & Gas Exploration & Production.. LGL Rep. SA1084. Rep. by LGL Limited, St. John’s, NL, for
International Association of Geophysical Contractors, Houston, Texas. 132 p. + app.
Canning, S.J., Santos, M.B., Robert, J..R.,Evans, P.G.H., Sabin, R.C. Bailey, N. & Pierce, G.J. (2008). Seasonal
distribution of white-beaked dolphins (Lagenorhynchus albirostris) in UK waters with new information on diet and habitat
use. Journal of the Marine Biological Association of the United Kingdom, 88, 1159-1166.
Carlson T.J., Watson B.E., Elster J.L., Copping A.E., Jones M.E., Watkins M., Jepsen R., & Metzinger K. (2012).
Assessment of strike of adult killer whales by an OpenHydro tidal turbine blade. Prepared for the U.S. Department of
Energy under contract DE-AC05_76RL01860.

Environmental Statement
Brims Tidal Array
Page 239 of 316
Cefas (2009). Strategic Review of Offshore Wind Farm Monitoring Data Associated with FEPA Licence Conditions; Fish.
[online] Available at: http://www.cefas.defra.gov.uk/media/393525/annex-2-fish.pdf.
CMACS, (2004). Kentish Flats Offshore Wind Farm. EMF Modelling and Interpretation for Electrosensitive Fish Species.
CMACS Report J3025/v1.2/10-04.
Culik, B. (2010) Odontocetes: The toothed whales: Lagenorhynchus albirostris. UNEP/CMS Secretariat, Bonn, Germany.
[online] Available at: http://www.cms.int/reports/small_cetaceans/index.htm.
Cunningham, S., Chaniotis, P.D., Gillham, K. & James, B. (2015). Assessment of the adequacy of the Scottish MPA
network for MPA search features: summary of the application of stage 5 of the MPA Selection Guidelines post consultation.
Assessing risk to Scottish MPA search features at the MPA regional scale. Final report produced by the Joint Nature
Conservation Committee, Scottish Natural Heritage and Marine Scotland for the Scottish Marine Protected Areas Project.
Dietz, R., Teilmann, J., Henrisksen, O.D. & Laidre. K. (2003). Movements of seals from Rodsand sanctuary monitored by
satellite telemetry. Relative importance of the Nysted Offshore Wind Farm are to seals. NERI, Denmark. Report No. 429:
Page 44.
Drewery, H. M. (2012). Basking shark (Cetorhinus maximus) literature review, current research and new research ideas.
Marine Scotland Science Report No 24/12.
Duck, C.D. and Morris, C.D. (2014). Surveys of harbour and grey seals on the east, north and north west coast of Scotland
and in Orkney, including the Moray Firth and the Firth of Tay, in August 2013. Scottish Natural Heritage Commissioned
Report No. 759.
EMEC (2014). Fall of Warness Test Site: Environmental Appraisal, August 2014.
EMEC (2014b). ‘2014 09 05 – EMEC FoW – tidal turbine collision assessment – sea mammals’ spreadsheet.
Evans, P.G.H., Baines, M.E. & Coppock, J. (2011a). Abundance and behaviour of cetaceans and basking sharks in the
Pentland Firth and Orkney Waters. Report by Hebog Environmental Limited & Sea Watch Foundation. Scottish Natural
Heritage Commissioned Report No.419.
Evans, P. G., Mick E. Baines. & Pia Anderwald. (2011b). Risk Assessment of Potential Conflicts between Shipping and
Cetaceans in the ASCOBANS Region. 18th ASCOBANS Advisory Committee Meeting AC18/Doc.6-04 (S) rev.1 UN
Campus, Bonn, Germany, 4-6 May 2011 Dist. 2 May 2011.
Foote, A.D., Newton, J., Piertney, S.B., Willerslev, E., & Gilbert, M.T. (2009). Ecological morphological and genetic
divergence of sympatric North Atlantic killer whale populations. Molecular Ecology, 18 (24): 5207-5217.
Foote, A.D., Similä, T., Vikingsson, G.A., & Stevick, P.T. (2010). Movement, site fidelity and connectivity in a top marine
predator, the killer whale. Evolutionary Ecology, 24(4): 803-814.
Gill A. & Taylor H. (2002). The potential effects of electromagnetic fields generated by cabling between offshore wind
turbines upon elasmobranch fishes. Report to the Countryside Council for Wales. CCW Contract Science Report No 488.

Environmental Statement
Brims Tidal Array
Page 240 of 316
Gill A., Gloyne-Phillips, I., Neal, K. & Kimber, J. (2005). The potential effects of electromagnetic fields generated by sub-
sea power cables associated with offshore wind farm developments on electrically and magnetically sensitive marine
organisms – a review. Report to Collaborative Offshore Wind Research into the Environment (COWRIE) group, Crown
Estates.
Gill, A., Huang, Y. Gloyne-Phillips, I., Metcalfe, J., Quayle, V., Spencer, J. & Wearmouth, V. (2009) COWRIE 2.0
Electromagnetic Fields (EMF) Phase 2: EMF-sensitive fish response to EM emissions from sub-sea electricity cables of
the type used by the offshore renewable energy industry. Commissioned by COWRIE Ltd. Project reference COWRIE-
EMF-1-06.
Gordon, J., Thompson, D., Leaper, R., Gillespie, D., Pierpoint, C., Calderan, S., Macauley, J. & Gordon, T. (2011).
Assessment of Risk to Marine Mammals from Underwater Marine Renewable Devices in Welsh Waters. Phase 2 - Studies
of Marine Mammals in Welsh Highly Tidal Waters. On Behalf of the Welsh Assembly Government. Doc. Ref.
JER3688R100707JG. Ecologic UK. 126.
Hall, A.J. (2002). Grey seal In: The Encyclopedia of Marine Mammals. Eds C.A. Perrin, W. F., B. G. Wursig, and J. G. M.
Thewissen Academic Press: San Diego.
Hammond, P.S. & Grellier, K. (2006). Grey seal diet composition and prey consumption in the North Sea. Final report to
Department for Environment Food and Rural Affairs on project MF0319.
Hammond, P. S., Benke, H., Borchers, D.L., Buckand, S.T., Collet, A., Heide-Jørgensen, M-P., Heimlich-Boran, S., Hiby,
A.R., Leopold, M. F., & Øien, N. (2002). Distribution and abundance of the harbour porpoise and other small cetaceans in
the North Sea and Adjacent Waters. Journal of Applied Ecology, 39(2); 361-376.
Hammond P.S., Macleod K., Berggren P., Borchers D.L., Burt L., Cañadas A., Desportes G., Donovan G.P., Gilles A.,
Gillespie D., Gordon J., Hiby L., Kuklik I., Leaper R., Lehnert K, Leopold M., Lovell P., Øien N., Paxton C.G.M., Ridoux V.,
Rogano E., Samarraa F., Scheidatg M., Sequeirap M., Siebertg U., Skovq H., Swifta R., Tasker M.L., Teilmann J., Canneyt
O.V. & Vázquez J.A. (2013) – draft. Cetacean abundance and distribution in European Atlantic shelf waters to inform
conservation and management.
Harding, K.C., Fujiwara, Härkönen, M. T., & Axberg, Y. (2005). Mass dependent energetics and survival in harbour seal
pups. Functional Ecology, 19; 129-135.
Harwood, J. & King, S.L. (2014). The Sensitivity of UK Marine Mammal Populations to Marine Renewables Developments.
Report number SMRUL-‐NER-‐2012-‐027. (unpublished).
Harwood, J., King, S., Schick, R., Donovan, C. & Booth, C. (2014). A Protocol for Implementing The Interim Population
Consequences Of Disturbance (PCoD) Approach: Quantifying And Assessing the effects of UK Offshore Renewable
Energy Developments On Marine Mammal Populations. Scottish Marine And Freshwater Science, 5(2).
IAMMWG (2013). Management Units for marine mammals in UK waters (June 2013).
IAMMWG (2015). Management Units for cetaceans in UK waters (January 2015).

Environmental Statement
Brims Tidal Array
Page 241 of 316
IEEM, (2010). Guidelines for ecological impact assessment in Britain and Ireland, Marine and Coastal, August 2010.
Jansen O.E., Leopold M.F., Meesters E.H.W.G. and Smeenk C. (2010). Are white-beaked dolphins Lagenorhynchus
albirostris food specialists? Their diet in the southern North Sea. Journal of the Marine Biological Association of the United
Kingdom 90, 1501–1508.
JNCC, CCW. & NE., (2010). Draft EPS Guidance -the Protection of marine European Protected Species from injury and
disturbance. JNCC, CCW and NE.
JNCC. (2013). Individual Species Reports – 3rd UK Habitats Directive Reporting 2013. [online] Available at:
http://jncc.defra.gov.uk/page-6391.
Jones, E., McConnell, B., Sparling, C. & Matthiopolous, J. (2013). Grey and harbour seal density maps. Marine Mammal
Scientific Support Research Programme MMSS/001/11. [online] Available at:
http://www.scotland.gov.uk/Resource/0041/00416981.pdf
Kalmijn A.J. (1982). Electric and magnetic field detection in elasmobranch fishes. Science 218:916-918.
Kastelein, R.A., Hardemann, J. & Boer, H. (1997). Food consumption and body weight of harbour porpoises (Phocoena
phocoena). In The biology of the harbour porpoise Read, A.J, WiepkemaP.R, Nachtigall P.E 1997pp. 217–234. Eds.
Woerden, The Netherlands:De Spil Publishers.
Kastelein, R.A., Gransier, R., Hoek, L. & Macleod, A. (2012). Hearing threshold shifts and recovery in harbor seals (Phoca
vitulina) after octave-band noise exposure at 4 kHz. Journal of the Acoustical Society of America, 132, 2745-2761.
Kimber J.A., Sims D.W., Bellamy P.H. & Gill A.B. (2011). The ability of a benthic elasmobranch to discriminate between
biological and artifical electric fields. Marine Biology 158:1-8.
Klinowskam (1985). Cetacean live stranding sites relate to geomagnetic topography. Aquatic Mammals 1 I (1):27-32.
Laist D.W., Knowlton A.R., Mead J.G., Collet A.S., Podesta M., (2001). Collisions between ships and whales. Marine
Mammal Science 17:35-75.
Lonergan, M., Sparling, C., Isojunno, S. & McConnell, B (2010), unpublished) Using telemetry to investigate the effect of
SeaGen on harbour seal behaviour and movement at Strangford Lough, Northern Ireland.
Macleod,K., Burt, M.L., Cañadas, A., Rogan, E., Santos, B., Uriarte, A., Van Canneyt, O., Vázquez, J. A. & Hammond, P.
S. (2009). Design-based estimates of cetacean abundance in offshore European Atlantic waters. Appendix I in the Final
Report of the Cetacean Offshore Distribution and Abundance in the European Atlantic. 16pp.
Macleod, K., Lacey, C., Quick, N., Hastie, G. & Wilson J. (2011). Guidance on survey and monitoring in relation to marine
renewables deployments in Scotland. Volume 2. Cetaceans and Basking Sharks. Unpublished draft report to Scottish
Natural Heritage and Marine Scotland.

Environmental Statement
Brims Tidal Array
Page 242 of 316
Marine Management Organisation, Joint Nature Conservation Committee, Natural England, Countryside Council for Wales,
(2010). Guidance on the Assessment of Effects on the Environment and Cultural Heritage from Marine Renewable
Developments. December 2010.
Marine Scotland, (2014). The protection of Marine European Protected Species from injury and disturbance Guidance for
Scottish Inshore Waters. March 2014.
Maxwell, G. (1952). Harpoon at a venture. Rupert Hart-Davis, London, 272 pp.
MeyGen. (2011). MeyGen Tidal Energy Project Phase 1 Environmental Statement.
Murphy, S., Tougaard, J., Wilson, B., Benjamins, S., Haelters, J., Lucke, K., Werner, S., Brensing, K., Thompson, D.,
Hastie, G., Geelhoed, S., Braeger, S., Lees, G., Davies, I., Graw, K-U. & Pinn, E. (2012). Assessment of the marine
renewables industry in relation to marine mammals: synthesis of work undertaken by the ICES Working Group on Marine
Mammal Ecology (WGMME).
Natural Research Projects. (2013a). Cantick Head Marine Wildlife Surveys March to August 2012 Interim report.
Natural Research Projects. (2013b). Cantick Head Marine Wildlife Surveys September 2012 to March 2013 Interim report.
Normandeau et al. (2011). Effects of EMFs from Undersea Power Cables on Elasmobranchs and Other Marine Species.
Normandeau, Exponent, Tricas, T and Gill. A., 2011. U.S. Dept. of the Interior, Bureau of Ocean Energy Management,
Regulation, and Enforcement, Pacific OCS Region, Camarillo, CA. OCS Study BOEMRE 2011-09.
Northridge, S. (2012). MS Offshore Renewables Research: Work Package C2: Request for advice on the populations of
cetaceans that might be involved in significant interactions with marine renewable energy developments in Scottish marine
waters.
Onoufriou, J. & Thompson, D. (2014). Testing the hypothetical link between shipping and unexplained seal deaths: Final
report. Marine Scotland Marine Mammal Scientific Support Research Programme MMSS/001/11, Task USD2.
OSPAR (2008). List of Threatened and/or Declining Species and Habitats. OSPAR Publication 2008/358.
Priede, I.G. & Miller, P.I. (2009). A basking shark (Cetorhinus maximus) tracked by satellite together with simultaneous
remote sensing II: New analysis reveals orientation to a thermal front. Fisheries Research,, 95, 370-372.
Reid. J.B., Evans., P.G.H & Northridge.,S.P. (2003). Atlas of Cetacean distribution in north west European waters.
Robinson, S.P and Lepper, P.A. (2013). Scoping study: Review of current knowledge of underwater noise emissions from
wave and tidal stream energy devices. The Crown Estate, 2013.
Rosen, D.A. & Renouf, D. (1997). Seasonal changes in the blubber distribution in Atlantic harbor seals: indications of
thermodynamic considerations. Marine Mammal Science 13, 229–240.

Environmental Statement
Brims Tidal Array
Page 243 of 316
Royal Haskoning (2012). SeaGen Environmental Monitoring Programme, Final Report. Available at:
http://seageneration.co.uk/files/SeaGen-Environmental-Monitoring-Programme-Final-Report.pdf.
Santos M. B. & G. J. Pierce. (2003). The diet of harbour porpoise (Phoceona phoceona) in the North east Atlantic.
Oceanography and Marine Biology: an Annual Review 2003, 41, 355–390.
Santos, M.B., Pierce, G.J., Ross, H.M., Reid, R.J., & Wilson, B. (1994). Diets of small cetaceans from the Scottish coast.
Journal of the Fisheries Research Board of Canada, 20: 83-115.
Santos, M.B., Pierce, G.J., Learmonth, J.A., Reid, R.J., Ross, H.M., Patterson, I.A.P., Reid, D.G. & Beare, D. (2004).
Variability in the diet of harbour porpoises (Phocoena phocoena) in Scottish waters 1992-2003. Marine Mammal Science
20(1): 1-27.
SCANS-II. (2008). Small cetaceans in the European Atlantic and North Sea. Final Report submitted to the European
Commission under project LIFE04NAT/GB/000245, SMRU, St Andrews.
SCOS. (2012). SCOS Report. Scientific Advice on Matters Related to the Management of Seal Populations: 2012. [online]
Available at: www.smru.st-and.ac.uk.
SCOS. (2013). SCOS Report. Scientific Advice on Matters Related to the Management of Seal Populations: 2013. [online]
Available at: www.smru.st-and.ac.uk.
SCOS. (2014). SCOS Report. Scientific Advice on Matters Related to the Management of Seal Populations: 2014. [online]
Available at: www.smru.st-and.ac.uk.
Scotrenewables Tidal Power Ltd (2014). Lashy Sound Tidal Array Scoping Report. [online] Available at:
http://www.gov.scot/Resource/0045/00456955.pdf.
Scottish Government. (2015). Seal Licensing numbers (2015). [online] Available at:
http://www.scotland.gov.uk/Topics/marine/Licensing/SealLicensing.
Sims, D.W. & Reid, P.C. (2002). Congruent trends in long-term zooplankton decline in the north east Atlantic and basking
shark (Cetorhinus maximus) fishery catches off west Ireland. Fisheries Oceanography, 11:1, 59-63.
Sims, D. W., Southall, E. J., Metcalfe, J. D. & Pawson, M. G. (2005). Basking shark population assessment. Final Report
for Global Wildlife Division. Department for Environment, Food and Rural Affairs, London.
SMRU Ltd. 2010). Approaches to Marine Mammal Monitoring at Marine Renewable Energy Developments Final Report.
Report by SMRU Ltd on behalf of The Crown Estate. August 2010.
SMRU Ltd. (2011). Utilisation of space by grey and harbour seals in the Pentland Firth and Orkney waters. Scottish Natural
Heritage Commissioned Report No. 441.
SNH (2015a). ‘2015 06 22 – SNH underwater collision spreadsheet – June 2015 draft’.

Environmental Statement
Brims Tidal Array
Page 244 of 316
SNH (2015b). ‘2015 06 22 – SNH underwater collision guidance – June 2015 draft with watermark’.
Southall, B. L., Bowles, A. E., Ellison, W. T., Finneran, J. J., Gentry, R. L., Greene Jr., C. R., Kastak, David, Ketten, D. R.,
Miller, J. H., Nachtigall, P. E., Richardson, W. J., Thomas, J. A., & Tyack, P. L. (2007). Marine Mammal Noise Exposure
Criteria: Initial Scientific Recommendations. Aquatic Mammals, 33 (4), pp. 411-509.Sparling, C., Grellier, K., Philpott, E.,
Macleod, K., and Wilson, J. 2011. Guidance on survey and monitoring in relation to marine renewables deployments in
Scotland. Volume 3. Seals. Unpublished draft report to Scottish Natural Heritage and Marine Scotland.
Speedie, C.D., Johnson, L. A., & Witt, M.J. (2009). Report title. Basking Shark Hotspots on the West Coast of Scotland:
Key sites, threats and implications for conservation of the species. Commissioned Report No.339.
SRSL (2012). MeyGen tidal stream turbine array environmental impact assessment - modelling encounter rate between
turbines and marine mammals. Report by the Scottish Association for Marine Science, ResearchServices Limited, Oban,
to MeyGen Ltd, London.
SSE Renewables, (2011). Environmental Scoping Report, Westray South Tidal Array. [online] Available at:
http://77.68.107.10/Renewables%20Licensing/SSE_Westray_Firth_Offshore_Tidal_Array/SSE_Westray_South_Scoping
_Report.pdf.
Stringell T., Hill D.,Rees D., Rees F., Rees P., Morgan G., Morgan L. & Morris C. (2015). Predation of harbour porpoise
(Phocoena phocoena) by grey seals (Halichoerus grypus) in Wales. [online] Available at:
http://www.researchgate.net/publication/277881548_Short_Note_Predation_of_Harbour_Porpoises_%28Phocoena_pho
coena%29_by_Grey_Seals_%28Halichoerus_grypus%29_in_Wales.
Thomas, L. (2014). Estimating the size of the UK grey seal population between 1984 and 2013, using established and draft
revised priors. SCOS 2014 Briefing Paper 14/02.
Thompson, D. (2012). Movements of recently weaned grey seal pups in Orkney: preliminary results from telemetry studies
In SCOS Report. Scientific Advice on Matters Related to the Management of Seal Populations: 2012. [online] Available at:
www.smru.st-and.ac.uk.
Thompson D (2013). Studies of harbour seal behaviour in areas of high tidal energy. Part 1. Movements and diving
behaviour of harbour seals in Kyle Rhea.
Thompson P.M., McConnell B.J., Tollit D.J., Mackay A., Hunter C. & Racey P.A. (1996). Comparative distribution,
movements and diet of harbour and grey seals from the Moray Firth, NE Scotland. Journal of Applied Ecology 33 1572-
1584.
Thompson D., Bexton S., Brownlow A., Wood D., Patterson T., Pye K., Lonergan M. & Milne R. (2010). Report on recent
seal mortalities in UK waters caused by extensive lacerations October 2010. [online] Available at: http://www.smru.st-
and.ac.uk/documents/366.pdf.

Environmental Statement
Brims Tidal Array
Page 245 of 316
Thompson, P. T., Gordon, D., Hastie, J. N., Barham, R. & Brookes, K. L. , Line S. Cordes, Helen Bailey, Nancy McLean.
(2013). Framework for assessing impacts of pile-driving noise from offshore wind farm construction on a harbour seal
population. Environmental Impact Assessment Review 43 (2013) 73–85.
Thompson D., Onoufriou J., Brownlow A., & Bishop A. (2015). Preliminary report on predation by adult grey seals on grey
seal pups as a possible explanation for corkscrew injury patterns in the unexplained seal deaths.
Tricas T.C. & Sisneros J.A. (2004). Ecological functions and adaptations of the elasmobranch electrosense. The Senses
of Fish pp308-329 Von der Emde G. Mogdans J. Kapoor BG (eds).
van Neer, A., Fast Jensen, L. & Siebert, U. (2014). Grey seal (Halichoerus grypus) predation on harbour seals (Phoca
vitulina) on the island of Helgoland, Germany Journal of Sea Research.
Wilson, B. Batty, R. S., Daunt, F. & Carter, C. (2007). Collision risks between marine renewable energy devices and
mammals, fish and diving birds. Report to the Scottish Executive. Scottish Association for Marine Science, Oban, Scotland,
PA37 1QA.
Wilson, E. (2000). Determination of boat disturbance on the surface feeding behaviour of basking sharks Cetorhinus
maximus. Unpublished MSc thesis. University of Plymouth, U.K.
Wilson, L. J. & Hammond, P. S.H. (2012). The diet of harbour and grey seals around Scotland: update on progress. In
SCOS Report. Scientific Advice on Matters Related to the Management of Seal Populations: 2012. [online] Available at:
www.smru.st-and.ac.uk.
Wilson L.J. (2014). The diet and feeding ecology of harbour seals around Britain. [online] Available at: https://research-
repository.st-andrews.ac.uk/handle/10023/6554.
Wittich, A. & Gordon, J. (2012). Analysis of towed hydrophone data collected at Costa Head, Westray South and Cantick
Head sites. Unpublished report to SSER. Marine Ecological Research.
Xodus (2011). MeyGen Tidal Energy Project – Phase 1. Environmental Statement.

Environmental Statement
Brims Tidal Array
Page 246 of 316
APPENDIX 1 – ERM RESULTS INCORPORATING THE SMRU SEAL DENSITY ESTIMATES
AND SCANS CETACEAN DENSITY ESTIMATES
This appendix provides the collision risk results for a single 3-bladed unshrouded device using ERM based on contextual
marine mammal density estimates
Table 13.47: Estimated annual collision risk (using the ERM) (individuals / year) with and without avoidance for a single three-blade device (unshrouded)
Species 3 blade turbine
0%
avoidance
50%
avoidance
90%
avoidance
95%
avoidance
98%
avoidance
99%
avoidance
Grey seal 114.40 57.20 11.44 5.72 2.288 1.144
Harbour seal 54.25 27.13 5.43 2.71 1.085 0.543
Harbour
porpoise 10.75 5.38 1.08 0.54 0.215 0.108
Minke whale 10.27 5.14 1.03 0.51 0.205 0.103
*There are no contextual density estimates available for basking shark and therefore these are not included.
Table 13.48: Summary of estimated annual collision risk (using the CRM) (individuals / year) with avoidance for
three-blade unshrouded turbines
Species Avoidance 1 turbine 30 turbines 200 turbines 30 turbines 200 turbines
ERM for three-blade turbines % Reference population
Grey seal 98% 2.288 68.64 457.6 0.33% 2.21%
Harbour seal 98% 1.085 32.55 217.0 1.68% 11.20%
Harbour porpoise 98% 0.215 6.45 43.0 0.003% 0.019%
Minke whale 98-95% 0.205-0.51 6.16-15.41 41.08-102.7 0.026-0.065% 0.175-0.437%
*There are no contextual density estimates available for basking shark and therefore these are not included.

Environmental Statement
Brims Tidal Array
Page 247 of 316
APPENDIX 2 – CRM RESULTS USING THE DENSITY ESTIMATES PROVIDED IN TABLE 13.5
Table 13.49: Estimated annual collision risk (using the CRM) (individuals / year) with and without avoidance for a single three-blade device (unshrouded)
Species 3 blade turbine
0%
avoidance
50%
avoidance
90%
avoidance
95%
avoidance
98%
avoidance
99%
avoidance
Grey seal 7.80 3.90 0.78 0.39 0.156 0.078
Harbour seal 1.09 0.55 0.11 0.05 0.022 0.011
Harbour
porpoise 8.18 4.09 0.82 0.41 0.164 0.082
Minke whale 0.10 0.05 0.01 0.005 0.002 0.001
Basking shark 0.40 0.20 0.04 0.02 0.008 0.004
Table 13.50: Summary of estimated annual collision risk (using the CRM) (individuals / year) with avoidance for
three-blade unshrouded turbines
Species Avoidance 1 turbine 30 turbines 200 turbines 30 turbines 200 turbines
ERM for three-blade turbines % Reference population
Grey seal 98% 0.156 4.68 31.20 0.02% 0.15%
Harbour seal 98% 0.022 0.65 4.36 0.03% 0.23%
Harbour porpoise 98% 0.164 4.91 32.72 0.002% 0.014%
Minke whale 98-95% 0.002-0.005 0.06-0.15 0.4-1 0.0003-
0.0006%
0.0017-
0.004%
Basking shark 98-95% 0.008-0.02 0.24-0.6 1.6-4 N/A N/A

Environmental Statement
Brims Tidal Array
Page 248 of 316
APPENDIX 3 – CRM RESULTS INCORPORATING THE SMRU SEAL DENSITY ESTIMATES
AND SCANS CETACEAN DENSITY ESTIMATES
Table 13.51: Estimated annual collision risk (using the CRM) (individuals / year) with and without avoidance for a single three-blade device (unshrouded)
Species 3 blade turbine
0%
avoidance
50%
avoidance
90%
avoidance
95%
avoidance
98%
avoidance
99%
avoidance
Grey seal 179.70 89.85 17.97 8.99 3.594 1.797
Harbour seal 81.00 40.50 8.10 4.05 1.620 0.810
Harbour
porpoise 16.35 8.18 1.64 0.82 0.327 0.164
Minke whale 7.70 3.85 0.77 0.39 0.154 0.077
*There are no contextual density estimates available for basking shark and therefore these are not included.
Table 13.52: Summary of estimated annual collision risk (using the CRM) (individuals / year) with avoidance for
three-blade unshrouded turbines
Species Avoidance 1 turbine 30 turbines 200 turbines 30 turbines 200 turbines
ERM for three-blade turbines % Reference population
Grey seal 98% 3.59 107.82 718.8 0.521% 3.476%
Harbour seal 98% 1.62 48.60 324.0 2.507% 16.718%
Harbour porpoise 98% 0.33 9.81 65.4 0.004% 0.029%
Minke whale 98-95% 0.154-0.39 4.62-11.55 30.8-77.0 0.02-0.05% 0.131-0.327%
*There are no contextual density estimates available for basking shark and therefore these are not included.

Environmental Statement
Brims Tidal Array
Page 249 of 316
APPENDIX 4 – OCT MODIFIED ERM RESULTS INCORPORATING THE SMRU SEAL DENSITY
ESTIMATES AND SCANS CETACEAN DENSITY ESTIMATES
Table 13.53: Estimated annual collision risk (using the ERM) (individuals / year) with and without avoidance for a single three-blade device (unshrouded)
Species 3 blade turbine
0%
avoidance
50%
avoidance
90%
avoidance
95%
avoidance
98%
avoidance
99%
avoidance
Grey seal 79.04 39.52 7.90 3.95 1.581 0.790
Harbour seal 45.96 22.98 4.60 2.30 0.919 0.460
Harbour
porpoise 8.87 4.44 0.89 0.44 0.177 0.089
Minke whale 1.70 0.85 0.17 0.09 0.034 0.017
*There are no contextual density estimates available for basking shark and therefore these are not included.
Table 13.54: Summary of estimated annual collision risk (using the CRM) (individuals / year) with avoidance for
three-blade unshrouded turbines
Species Avoidance 1 turbine 30 turbines 200 turbines 30 turbines 200 turbines
ERM for three-blade turbines % Reference population
Grey seal 98% 1.581 47.424 316.160 0.229% 1.529%
Harbour seal 98% 0.919 27.576 183.840 1.423% 9.486%
Harbour porpoise 98% 0.177 5.322 35.480 0.002% 0.016%
Minke whale 98-95% 0.034-0.09 1.02-2.55 6.8-17 0.004-0.011% 0.029-0.072%
*There are no contextual density estimates available for basking shark and therefore these are not included.

Environmental Statement
Brims Tidal Array
Page 250 of 316
APPENDIX 5 – INTERIM PCOD PREDICTED RISK OF POPULATION DECLINE FOR
UNDISTURBED AND DISTURBED POPULATIONS
This appendix provides the predicted probabilities of population declines for undisturbed populations and disturbed
populations based on the following scenarios:
Phase 1: 3-blade unshrouded devices Table 13.55
Phase 1 and 2: 3-blade unshrouded devices Table 13.56
Phase 1: Shrouded OCT devices Table 13.57
Phase 1 and 2: Shrouded OCT devices Table 13.58
Table 13.55: Predicted probabilities of population decline for undisturbed populations and disturbed populations based on Phase 1 of 30 three-blade unshrouded devices (on a probability scale of 0 to 1)
Year
Undisturbed Disturbed
Probability of
1% decline
Probability
of 2%
decline
Probability
of 5%
decline
Probability of
1% decline
Probability of
2% decline
Probability of
5% decline
Grey seal Orkney and North coast population
1 0.187 0.107 0.012 0.188 0.107 0.012
6 0.047 0.01 0 0.048 0.01 0
12 0.009 0 0 0.009 0 0
18 0.003 0 0 0.004 0 0
Harbour seal Orkney and North coast population
1 0.929 0.82 0.364 0.929 0.82 0.364
6 1 1 0.954 1 1 0.954
12 1 1 1 1 1 1
18 1 1 1 1 1 1
Harbour porpoise North Sea population
1 0.313 0.188 0.043 0.313 0.188 0.043
6 0.262 0.121 0.004 0.263 0.121 0.004
12 0.227 0.059 0 0.227 0.059 0
18 0.213 0.039 0 0.214 0.04 0
Harbour porpoise West Scotland population
1 0.273 0.183 0.048 0.274 0.184 0.048
6 0.283 0.135 0.006 0.284 0.138 0.006
12 0.242 0.094 0.002 0.247 0.099 0.002
18 0.211 0.047 0 0.216 0.049 0
Minke whale Celtic and Greater North Seas population
1 0.32 0.216 0.038 0.32 0.216 0.038
6 0.251 0.064 0 0.251 0.064 0
12 0.152 0.013 0 0.152 0.013 0
18 0.11 0.003 0 0.11 0.003 0

Environmental Statement
Brims Tidal Array
Page 251 of 316
Table 13.56: Predicted probabilities of population decline for undisturbed populations and disturbed populations based on Phase 1 and 2 of 200 three-blade unshrouded devices (on a probability scale of 0 to 1)
Year
Undisturbed Disturbed
Probability of
1% decline
Probability
of 2%
decline
Probability
of 5%
decline
Probability of
1% decline
Probability of
2% decline
Probability of
5% decline
Grey seal Orkney and North coast population
1 0.178 0.097 0.007 0.185 0.102 0.007
6 0.051 0.006 0 0.057 0.008 0
12 0.015 0.002 0 0.02 0.002 0
18 NA NA NA 0.008 0 0
Harbour seal Orkney and North coast population
1 0.931 0.819 0.336 0.932 0.824 0.34
6 1 1 0.962 1 1 0.964
12 1 1 1 1 1 1
Harbour porpoise North Sea population
1 0.316 0.209 0.047 0.317 0.209 0.047
6 0.275 0.131 0.002 0.277 0.133 0.002
12 0.235 0.066 0 0.236 0.066 0
18 0.2 0.039 0 0.202 0.039 0
Harbour porpoise West Scotland population
1 0.309 0.205 0.046 0.314 0.213 0.046
6 0.265 0.124 0.005 0.286 0.137 0.006
12 0.23 0.062 0 0.248 0.075 0
18 0.19 0.041 0 0.219 0.051 0
Minke whale Celtic and Greater North Seas population
1 0.329 0.199 0.036 0.329 0.199 0.037
6 0.243 0.075 0 0.243 0.076 0
12 0.16 0.017 0 0.161 0.018 0
18 0.119 0 0 0.119 0 0
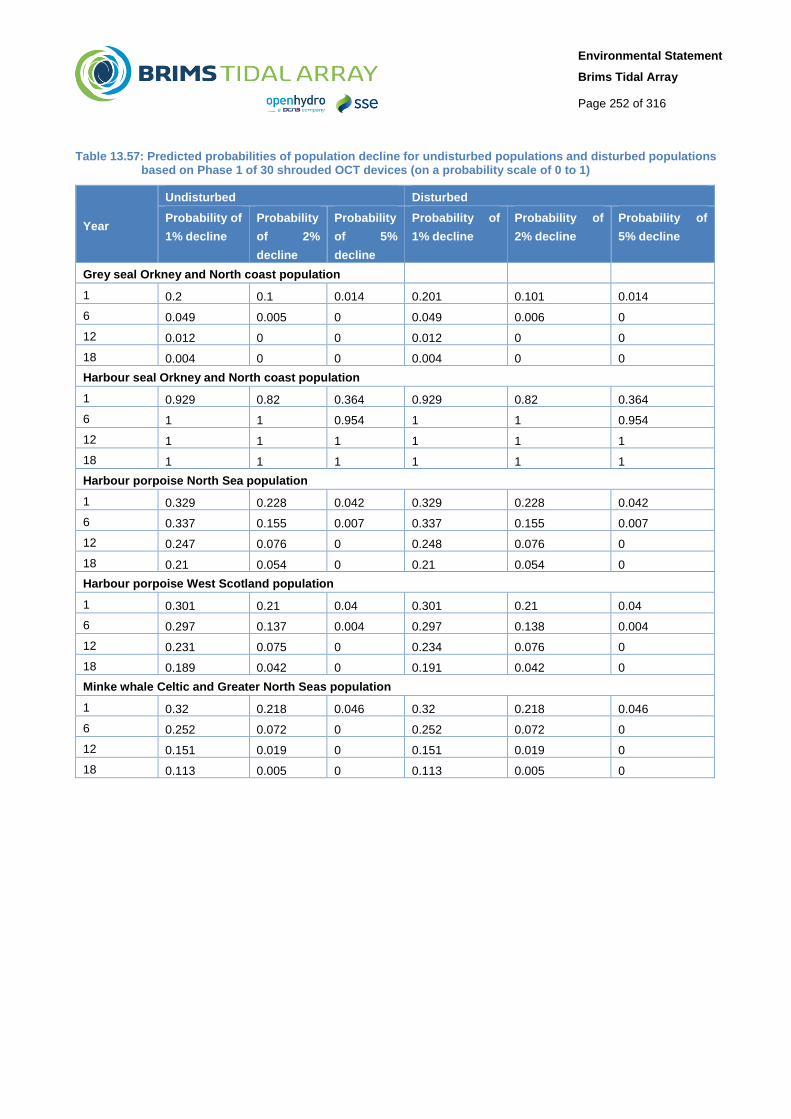
Environmental Statement
Brims Tidal Array
Page 252 of 316
Table 13.57: Predicted probabilities of population decline for undisturbed populations and disturbed populations based on Phase 1 of 30 shrouded OCT devices (on a probability scale of 0 to 1)
Year
Undisturbed Disturbed
Probability of
1% decline
Probability
of 2%
decline
Probability
of 5%
decline
Probability of
1% decline
Probability of
2% decline
Probability of
5% decline
Grey seal Orkney and North coast population
1 0.2 0.1 0.014 0.201 0.101 0.014
6 0.049 0.005 0 0.049 0.006 0
12 0.012 0 0 0.012 0 0
18 0.004 0 0 0.004 0 0
Harbour seal Orkney and North coast population
1 0.929 0.82 0.364 0.929 0.82 0.364
6 1 1 0.954 1 1 0.954
12 1 1 1 1 1 1
18 1 1 1 1 1 1
Harbour porpoise North Sea population
1 0.329 0.228 0.042 0.329 0.228 0.042
6 0.337 0.155 0.007 0.337 0.155 0.007
12 0.247 0.076 0 0.248 0.076 0
18 0.21 0.054 0 0.21 0.054 0
Harbour porpoise West Scotland population
1 0.301 0.21 0.04 0.301 0.21 0.04
6 0.297 0.137 0.004 0.297 0.138 0.004
12 0.231 0.075 0 0.234 0.076 0
18 0.189 0.042 0 0.191 0.042 0
Minke whale Celtic and Greater North Seas population
1 0.32 0.218 0.046 0.32 0.218 0.046
6 0.252 0.072 0 0.252 0.072 0
12 0.151 0.019 0 0.151 0.019 0
18 0.113 0.005 0 0.113 0.005 0

Environmental Statement
Brims Tidal Array
Page 253 of 316
Table 13.58: Predicted probabilities of population decline for undisturbed populations and disturbed populations based on Phase 1 and 2 of 200 shrouded OCT devices (on a probability scale of 0 to 1)
Year
Undisturbed Disturbed
Probability of
1% decline
Probability
of 2%
decline
Probability
of 5%
decline
Probability of
1% decline
Probability of
2% decline
Probability of
5% decline
Grey seal Orkney and North coast population
1 0.2 0.107 0.012 0.195 0.107 0.012
6 0.06 0.012 0 0.054 0.012 0
12 0.022 0.002 0 0.017 0.002 0
18 0.006 0.001 0 0.006 0.001 0
Harbour seal Orkney and North coast population
1 0.93 0.817 0.341 0.931 0.823 0.344
6 1 1 0.959 1 1 0.962
12 1 1 1 1 1 1
18 1 1 1 1 1 1
Harbour porpoise North Sea population
1 0.307 0.198 0.04 0.309 0.199 0.04
6 0.263 0.113 0.001 0.264 0.114 0.001
12 0.221 0.06 0 0.223 0.06 0
18 0.176 0.035 0 0.178 0.035 0
Harbour porpoise West Scotland population
1 0.315 0.208 0.038 0.317 0.212 0.039
6 0.322 0.155 0.003 0.34 0.162 0.003
12 0.26 0.081 0 0.283 0.094 0
18 0.217 0.055 0 0.244 0.066 0
Minke whale Celtic and Greater North Seas population
1 0.32 0.218 0.046 0.32 0.218 0.046
6 0.252 0.072 0 0.252 0.072 0
12 0.151 0.019 0 0.151 0.019 0
18 0.113 0.005 0 0.113 0.005 0

Environmental Statement
Brims Tidal Array
Page 254 of 316
Ornithology
Chapter 14

Environmental Statement
Brims Tidal Array
Page 255 of 316
14 ORNITHOLOGY
14.1 INTRODUCTION
This chapter of the Environmental Statement (ES) considers the potential effects of the proposed Brims Tidal Array Project
(the Project) on seabird populations that are predicted to occur through the construction & installation, operation &
maintenance (O&M), and decommissioning phases.This technical chapter has been completed by Natural Research
(Projects) Limited (NRP) and complements the separate evaluation of potential ecological effects in Chapter 11 Coastal
and Terrestrial Ecology, Chapter 12 Fish Ecology, Chapter 11 Benthic Ecology and Chapter 13 Marine Mammals.
The chapter set outs the methods that are used and summarises the baseline conditions as determined by a two-year
programme of commissioned boat-based surveys. The types of potential impacts on birds arising from the Project are
described and their magnitude and significance under the EIA regulations are evaluated. An assessment of the cumulative
impacts resulting from the Project acting together with the impacts from other developments that potentially affect the same
bird receptor populations is also presented. The chapter will cover all components of the Project seaward of the Mean High
Water Spring (MHWS).
The chapter is informed by three Supporting Documents:
Seabirds Technical Report (Supporting Document: NRP, 2015a);
Collision Risk to Diving Seabirds (Supporting Document: NRP, 2015b); and,
Distance sampling analyses of ESAS survey results for the Project (Supporting Document: Caloo, 2015).
The results of Habitats Regulations Assessment in which the impacts on Natura 2000 and Ramsar sites designated for
birds are presented separately in the ‘Information to Support the HRA’ Report. References to SPAs in the EIA are used for
context only.
14.1.1 Study Area
The Project survey area, directly to the south of the island of Hoy in the Pentland Firth, consists of the area surveyed during
the two-year programme of baseline seabird surveys, encompassing the Agreement for Lease area (AfL, 11.1km2) plus a
surrounding 4km buffer, though in parts the extent of the buffer was clipped by the coast of Hoy and South Walls (Figure
14.1).
The survey design is in line with the recommendations of Jackson and Whitfield (2011) that for sites of 5 – 10km2 in area
in open sea situations the surveyed buffer should extend to at least 2km. The total surface area of the Project survey area
is 112.9km2. Water depths in the AfL range from 70m - 90m.
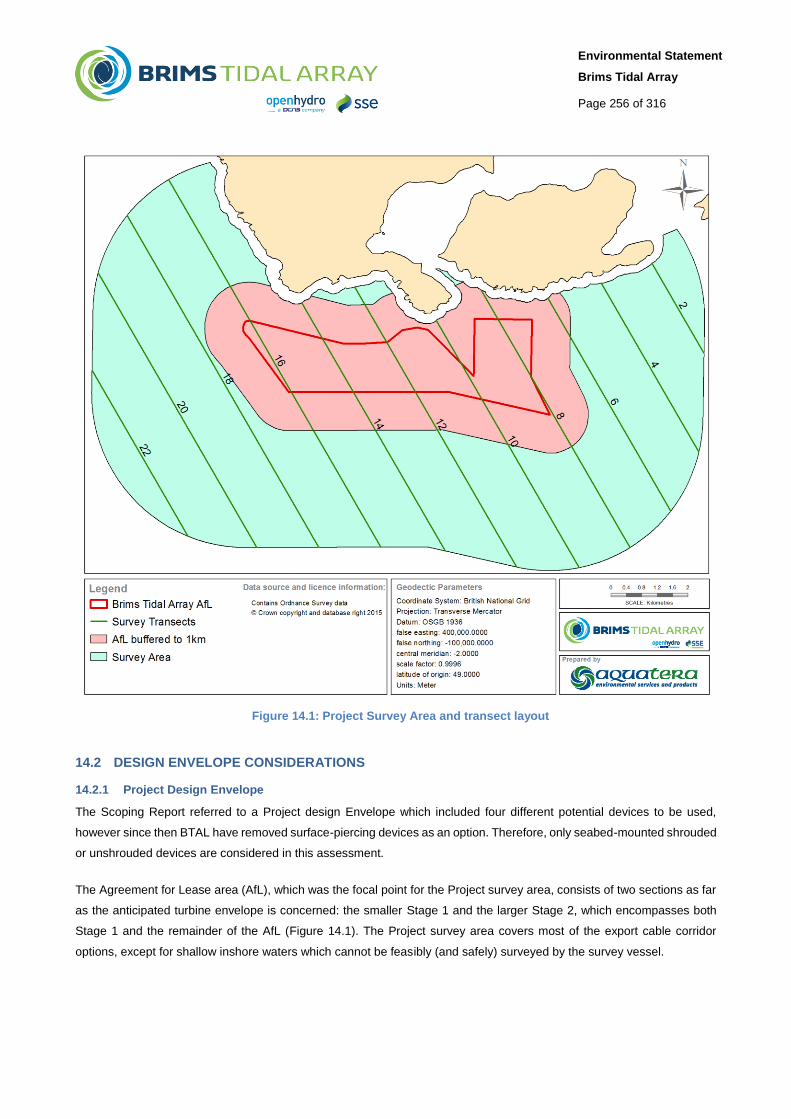
Environmental Statement
Brims Tidal Array
Page 256 of 316
Figure 14.1: Project Survey Area and transect layout
14.2 DESIGN ENVELOPE CONSIDERATIONS
14.2.1 Project Design Envelope
The Scoping Report referred to a Project design Envelope which included four different potential devices to be used,
however since then BTAL have removed surface-piercing devices as an option. Therefore, only seabed-mounted shrouded
or unshrouded devices are considered in this assessment.
The Agreement for Lease area (AfL), which was the focal point for the Project survey area, consists of two sections as far
as the anticipated turbine envelope is concerned: the smaller Stage 1 and the larger Stage 2, which encompasses both
Stage 1 and the remainder of the AfL (Figure 14.1). The Project survey area covers most of the export cable corridor
options, except for shallow inshore waters which cannot be feasibly (and safely) surveyed by the survey vessel.

Environmental Statement
Brims Tidal Array
Page 257 of 316
A detailed project description, including all worst case parameters, is presented in Chapter 5 Project Description. Technical
details relevant to underwater collision risk modelling are provided in the Supporting Document: NRP, 2015b. A summary
of parameters relevant to this assessment is presented in Table 14.1. The maximum extent of project parameters in relation
to physical footprint on the seabed within the AfL area is 0.11km2 for Stage 1 and 0.6km2 for Stage 1 & 2.
Table 14.1: Design envelope parameters for ornithological assessment
Project parameters
relevant to the assessment
Maximum Project parameters for
the impact assessment
Explanation of maximum Project
parameters
Stage 1
Number of turbines 30 Worst case assumption of 1MW turbines
Area of turbine deployment
within AfL area
2.9km2 Size of search area for Stage 1 turbines within
AfL
Device type 1. Shrouded turbine (12.8m device
diameter, 4.4m blade length, 10
blades, open-centred) and
2. unshrouded turbine device (23m
device diameter, 11.5m blade
length, 3 blades)
n/a
Minimum surface clearance
LAT
30m n/a
Minimum seabed clearance 4m n/a
Device footprint Up to 0.036km2 or 0.3% of the AfL
area
Steel structure with flat rock bottom that sits
on seabed. Total footprint is 30m x 40m per
device = 1,200m2
Inventory of lubricants/oils
and other liquids
30,000 litres Volumes (maximum 1000 litres per device)
are approximate covering range of liquids
including mineral oil, grease, hydraulic fluid,
low toxicity biodegradable oil, bio-degradable
ethanol.
Footprint of inter-array
cables
Up to 0.07km2 or 0.6% of the AfL
area
Assuming worst case of cable protection with
corridor of 5m on all inter-array cables within
AfL
Subsea cable connection
hub footprint
0.00004km2 Assuming requirement for 1 hub, at -37.5m2
per hub
Subsea cable corridor 0.13km2 Assuming worst case of longest cable route
(6.5km) and affected corridor width of 20m (4
cables in total).
Vessels (construction) 6-10 vessels Possible need for two construction vessels, a
heavy-lifting barge, workboat, RIBs, tugs, 2-3
cable-laying and cable protection vessels.
Construction/Installation
duration
15 months Q2 2019-Q3 2020, overlap with two breeding
seasons.
Vessels (O&M) Average 1 vessel/day, year-round, at
times 2-3 vessels required
Inspections, minor maintenance. Major
maintenance only expected every 5-10 years.

Environmental Statement
Brims Tidal Array
Page 258 of 316
Project parameters
relevant to the assessment
Maximum Project parameters for
the impact assessment
Explanation of maximum Project
parameters
Stage 1 & 2
Number of turbines 200 (Including Stage 1 & 2; Stage 2
170MW, total 200MW)
Worst case assumption of 1MW turbines
Area of turbine deployment
within AfL area
11.1km2 5.6km2 (including Stage 1 &
2; Stage 2 additional 5.6km2)
Size of search area for Stage 1 & 2 turbines
within AfL
Device type 1. Shrouded turbine (12.8m device
diameter, 4.4m blade length, 10
blades, open-centred) and
2. unshrouded turbine device (23m
device diameter, 11.5m blade
length, 3 blades)
n/a
Minimum clearance LAT 30m n/a
Minimum seabed clearance 4m n/a
Device footprint Up to 0.24km2(200 x 1200)or 2.2%
of the AfL
Steel structure with flat rock bottom that sits
on seabed. Total footprint is 1200m2 per
device
Inventory of lubricants/oils
and other liquids
200,000 litres Volumes (at 1000 litres per device) are
approximate covering range of liquids
including mineral oil, grease, hydraulic fluid,
low toxicity biodegradable oil, and
biodegradable ethanol.
Footprint of inter-array
cables
Up to 0.36km2 or 3% of the AfL area Assuming worst case of cable protection with
maximum of 208 33kV cables, cross-sectional
area: 500mm2
Assuming cable protection with footprint width
of 5m
Subsea cable connection
hub footprint
Total 0.0003km2 Assuming requirement for 8 hubs, at 37.5m2
per hub.
Subsea cable corridor Total 0.52km2 Assuming worst case of longest cable route
(6.5km) and affected Aith Hope route corridor
width of 80m (16 cables in total).
Vessels (construction) 6-10 vessels Possible need for two construction vessels, a
heavy-lifting barge, workboat, RIBs, tugs, 2-3
cable-laying and cable protection vessels.
Construction/Installation
duration
39 months Q2 2021-Q2 2023, overlap with up to three
breeding seasons.
Vessels (O&M) Average 1 vessel/day, year-round, at
times 2-3 vessels required
Inspections, minor maintenance. Major
maintenance only expected every 5 years for
each turbine.
Decommissioning activities As per installation/construction n/a

Environmental Statement
Brims Tidal Array
Page 259 of 316
14.3 LEGISLATIVE FRAMEWORK AND POLICY CONTEXT
14.3.1 Legislation
In addition to the ‘Marine Works (Environmental Impact Assessment) Regulations 2007’ (the EIA Regulations), key
legislation in relation to birds includes:
EU Birds Directive 79/409/EEC codified by directive 2009/147/EC;
The Council Directive on the Conservation of Natural Habitats and of Wild Fauna and Flora 1992/43/EEC (EU Habitats
Directive);
OSPAR - Convention for the Protection of the Marine Environment of the North east Atlantic;
The Nature Conservation (Scotland) Act 2004 (as amended);
Wildlife and Natural Environment (Scotland) Act 2011;
Conservation (Natural Habitats, etc.) Regulations 1994 (as amended);
The Electricity Works (Environmental Impact Assessment) (Scotland) Regulations 2000 as amended in 2008;
Conservation of Habitats and Species Regulations 2010;
The Offshore Marine Conservation (Natural Habitats, & c.) Regulations 2007 (as amended);
UKBAP; and
RAMSAR Convention.
14.3.1.1 EU Birds Directive
The European Union (EU) meets its obligations for birds through Directive 2009/147/EC (EC Birds Directive) on the
conservation of wild birds (codified version of the European Council Directive 79/409/EEC as amended). This legislation
was adopted in 1979 in response to increasing concern about declines in Europe's wild bird populations. The Directive
emphasises the protection of habitat for endangered and vulnerable bird species listed on Annex I and migratory birds
through a network of SPAs.
14.3.1.2 EU Habitats Directive
European Council Directive 92/43/EEC on the Conservation of Natural Habitats and of Wild Fauna and Flora (EC Habitats
Directive) was adopted in response to the Bern Convention. This Directive is transposed into UK law by the Conservation
of Habitats and Species Regulations 2010 (together with the Conservation (Natural Habitats, &c.) Regulations 1994). The
Directive requires Member States to maintain habitats and species at a favourable conservation status across their full
range, as well as through a network of protected sites (Natura 2000) - comprising Special Areas of Conservation (SACs)
and Special Protection Areas (SPAs).
14.3.1.3 OSPAR
OSPAR – or the Convention for the Protection of the Marine Environment of the North east Atlantic - is the current legal
instrument by which European governments, together with the European Union, cooperate to protect the marine
environment of the North east Atlantic. Instigated in 1972 with the Oslo Convention against marine pollution it was
broadened to cover land-based sources and the offshore industry by the Paris Convention of 1974. These two conventions

Environmental Statement
Brims Tidal Array
Page 260 of 316
were unified, up-dated and extended by the 1992 OSPAR Convention. The latest annex on biodiversity and ecosystems
was adopted in 1998 to cover non-polluting human activities that can adversely affect the sea.
14.3.1.4 Nature Conservation Act 2004
The Nature Conservation (Scotland) Act 2004 places a duty on public bodies to further the conservation of biodiversity. It
requires Scottish Ministers to designate one or more strategies for the conservation of biodiversity as the Scottish
Biodiversity Strategy, and to publish lists of species and habitats of importance. Chapter 1 of Part 2, and Schedules 1 and
5, of the Act, repeal the Sites of Special Scientific Interest (SSSI) provisions of the Wildlife and Countryside Act 1981 (as
amended), enhancing the protection of SSSIs. Part 3 and Schedule 6 of the Act amend the Wildlife and Countryside Act
1981, strengthening the legal protection for wild bird species.
14.3.1.5 Wildlife and Natural Environment (Scotland) Act 2011
The Act amends the Wildlife and Countryside Act 1981 (among others) and consolidates existing national legislation to
implement the Bern Convention and Birds Directive in the UK. It protects native species, controls the release of non-native
species, enhances the protection of SSSIs and builds upon rights of way rules. Special penalties are available for offences
related to rare and endangered bird species listed on Schedule 1.
14.3.1.6 Conservation (Natural Habitats, etc.) Regulations 1994 (as amended), Conservation of Habitats and
Species Regulations 2010
In Scotland, the Conservation of Habitats and Species Regulations 1994, as amended, most notably in 2004 and 2007,
transpose the EC Habitats Directive into domestic law. The Regulations protect sites, species and habitats identified by
the Habitats Directive. The Conservation of Habitats and Species Regulations 2010 apply in Scotland in relation to certain
specific activities, including consents granted under Sections 36 and 37 of the Electricity Act 1989. The 2010 Regulations
are very similar to the 1994 Regulations (as amended in Scotland) in the protection they give to Natura sites, so in practice
proposals are assessed in exactly the same way.
14.3.1.7 The Offshore Marine Conservation (Natural Habitats, etc.) Regulations 2007 (as amended)
These regulations transpose Council Directive 92/43/EEC on the conservation of natural habitats and of wild fauna and
flora (Habitats Directive) and Council Directive 79/409/EEC on the conservation of wild birds (Wild Birds Directive) into
national law. They came into force on 21 August 2007. These regulations apply to the UK’s offshore marine area which
covers waters beyond 12 nautical miles, within British Fishery Limits and the seabed within the UK Continental Shelf
Designated Area.
14.3.1.8 UKBAP
The UK Biodiversity Action Plan (UK BAP) was published in 1994, and was the UK Government’s response to the
Convention on Biological Diversity, which the UK signed in 1992. The ‘UK Post-2010 Biodiversity Framework’, published
in July 2012, succeeds the UK BAP. The Framework demonstrates how the UK contributes to achieving biodiversity
targets, and identifies the activities required to complement the country biodiversity strategies in achieving the targets.
Species relevant to the assessment and listed on the original UKBAP are herring gull and Arctic skua.

Environmental Statement
Brims Tidal Array
Page 261 of 316
14.3.2 Guidance
Guidance on ornithological assessments for tidal energy developments was derived from the following sources:
Guidelines for ecological impact assessment in Britain and Ireland – Marine and Coastal (IEEM 2010);
The Crown Estate (2012) Pentland Firth and Orkney Waters – Enabling Actions Report.
14.4 SUPPORTING SURVEYS AND STUDIES
14.4.1 Desk Study
Background information on seabird distributions within the bio-geographic region and the North Sea in particular was
taken from Stone et al. (1995), Furness (2014), Forrester et al. (2007), Mitchell et al. (2004), Kober et al. (2010),
Thaxter et al. (2012) and other sources as appropriate;
Colony counts were derived from the JNCC Seabird Monitoring Programme Database (SMP Database) unless
specified otherwise. These sources were used to determine regional breeding, passage and non-breeding or wintering
numbers and distributions for each species;
Much of the generic information on bird behaviour and ecology has been taken from Birds of the Western Palearctic
(Snow and Perrins 1998 and Forrester et al. (2007), which provide comprehensive information on each species; and
Extensive use has also been made of Marine Scotland commissioned reports on the vulnerability of Scottish seabirds
to tidal energy developments (Furness et al. 2012).
14.4.2 Seabird Surveys
The ornithological community of the Project survey area was characterised by undertaking a two-year programme of
commissioned boat-based surveys following European Seabirds at Sea (ESAS) protocols. The surveys were conducted
by Natural Research (Projects) Limited between March 2012 and March 2014 and the methodology was discussed and
agreed prior to commencement with SNH.
14.4.2.1 Design and Methods
A brief account of the survey programme is provided below. Full details of the programme of survey work, including survey
design and methods, survey effort, survey results and supporting contextual information are presented in Supporting
Document: NRP, 2015a. The study design was consulted upon and agreed with Marine Scotland (letter, 16 April 2014).
The Project survey area comprised the AfL and a surrounding 4km buffer as well as the majority of the export cable corridor
options, except where those are too close to Hoy for safe operation of the survey vessel. The survey design comprised 11
parallel transects spaced 1.6km apart covering the entire Project survey area and with a total length of 79.5km. Data on
both seabirds and marine mammals were collected during the ESAS surveys, following standard survey protocols as set
out in Camphuysen et al. (2004).
The majority of survey work was conducted from the MV Karin, with a single survey undertaken on the MV Scotia. These
vessels comply with ESAS recommended survey standards. Recording was undertaken from one side of the vessel only,
whichever side presented the best conditions for detecting birds at the time. Surveyors have a ranging stick to facilitate
accurate determination of distance bands.

Environmental Statement
Brims Tidal Array
Page 262 of 316
All birds and marine mammals seen were recorded. For each bird record, surveyors recorded the species, number in the
group, age, plumage, activity, together with information on environmental conditions at the time of each sighting in terms
of sea state, swell, wind force and direction, and sun glare intensity.
For birds on the sea, the perpendicular distance from the transect line was recorded as one of five distance bands (0-50m,
50-100m, 100-200m, 200-300m, >300m) (Camphuysen et al. 2004).
Flying birds that passed through the survey corridor were recorded and assigned as being in-transect or not-in-transect
according to whether they are inside a 300m x 300m box at the time of snapshots taken at regular intervals (Camphuysen
et al. 2004). The snapshot interval is the time taken for the vessel to travel 300m; at 10 knots, in this case the interval was
one minute.
14.4.2.2 Survey Effort
A total of 18 surveys visits (approximating 135 hours of survey effort) were undertaken between March 2012 and March
2014. On the majority of survey dates conditions were good or sufficient for survey work and well within ESAS guidelines
for seabird surveys (up to sea state 4). However on two of the winter survey visits conditions of sea state 5 were temporally
experienced. Full details of sea state, wind direction, swell and survey times for each transect are presented in Supporting
Document: NRP, 2015a.
Eleven survey visits were made in the period between late March and mid-August, encompassing the entire breeding
season for most seabird species. This is one visit more than was planned for at the start of the survey programme. Virtually
all transects were surveyed in these months and sea conditions at the time of surveys were generally very good in 2013
(predominantly sea state 1 to 3) yet merely good in 2012 (predominantly sea states 3 and 4, but never exceeding sea
state 4).
Eight autumn/winter survey visits were made in the months September to early March. Unsuitable sea conditions prevented
any survey visits in November and January, whereas September and October were only sampled in 2013. Despite the
weather related problems, all of the winter survey effort was conducted in sea conditions that complied with ESAS
guidance. The potential effect of lower survey coverage during autumn and winter on the baseline dataset is considered in
Section 14.6.3.
14.5 CONSULTATIONS
A list of feedback from all consultees is summarised in Chapter 6 Consultation Process. An extensive consultation process
was undertaken up to submission of the EIA. An overview of the key consultation items and the associated timeline is
presented in Table 14.2. The key points raised by stakeholders regarding ornithological receptors are presented in Table
14.3.

Environmental Statement
Brims Tidal Array
Page 263 of 316
Table 14.2: Key consultation items and timeline for the Project.
Consultation item Stakeholders involved Medium and date
Project initiation OpenHydro, SNH, Marine Scotland
(MS), Royal Haskoning and Scottish
and Southern Energy
Meeting, 28 May 2012
Bird, marine mammal and basking
shark survey methodology
Marine Scotland Letter to MS, 29 August 2012
Project meeting OpenHydro, SNH, Marine Scotland Meeting, 26 February 2013
Interim survey reports and EIA
strategies
SNH Letter to MS, 12 March 2013
Survey design, interim survey reports
and EIA strategies
Marine Scotland Letter, 16 April 2013
Scoping report and initial HRA
screening
Marine Scotland, SNH Submitted, 23 August 2013
Scoping Opinion SNH Letter to MS, 31 October 2013
Project meeting Marine Scotland, OpenHydro Meeting, 22 November 2013
Bird, marine mammal and basking
shark survey methodology
Marine Scotland Letter, post-meeting 22 November
2013
2nd Interim survey report Marine Scotland, SNH Submitted, 28 November 2013
Interim survey report, collision risk
assessment
SNH Letter to MS, 17 January 2014
Scoping Opinion (final) Marine Scotland Letter, 23 April 2014
Survey update, approach to EIA
assessment
SNH Letter to MS, 21 August 2014
EIA Ornithology Methodology Marine Scotland, SNH Submitted, 10 April 2015
Project long list for inclusion in
cumulative impact assessment
Marine Scotland Letter, 18 June 2015
EIA Ornithology Methodology Marine Scotland Letter, 9 July 2015
Information to Inform HRA SNH Letter, 14 December 2015

Environmental Statement
Brims Tidal Array
Page 264 of 316
Table 14.3: Key issues raised by stakeholder during consultation
Topic Stakeholder Comment Response/Action taken Section cross-
reference
Study
design/analysis
SNH,
02/11/2012
“Analyses should not only aim to support an
assessment of impacts upon species at different
times of year, but also at different stages of the
tidal cycle. Consequently, surveys should be
timed, where possible, to provide data that gives
representation across the tidal cycle. If practical
limitations make boat-based survey during
maximum tidal velocities difficult, it may be
pertinent for the land-based vantage point
surveyor to cover these periods.”
Within existing tidal and navigational constraints
present every attempt was made to cover different
tidal cycles. Note however that the Project survey
area is regularly subject to very challenging weather
conditions, being in direct connection with the
Atlantic Ocean. Survey windows with suitable (and
safe) conditions for survey are therefore limited.
Some land-based work was undertaken during the
breeding season to assess whether auk behaviour
on the sea surface was limited to loafing or whether
foraging behaviour occurred as well (both types of
behaviour were recorded). Full scale land-based
surveys to fill in for boat-based surveys would have
had to cope with similar poor weather conditions,
likely affecting bird detection. Regardless, such
surveys were not considered feasible as the
distance to the Study Area is too far to allow for
meaningful data collection for baseline purposes.
Supporting Document
Technical Report –
Seabirds (Supporting
Document: NRP,
2015a);
Section 14.4.2
Study
design/analysis
MSS,
22/11/2012 &
13/04/2013
[Paraphrased]: Increasing survey effort within
the lease area by reducing the size of the buffer
and reducing the spacing between transect to
1km or a reduction in buffer size with the
addition of transects within the lease area.
Potential of zig zag transect design to be
considered.
Using boat-based transect methods for relatively
small marine sites inevitably leads to problems
meeting the ideal requirements for distance
sampling, and there is a limit to which these can be
resolved by reducing transect interval (if these are
too narrow, one runs the risk of disturbing animals
on the next line), larger buffers (potential for
n/a

Environmental Statement
Brims Tidal Array
Page 265 of 316
Topic Stakeholder Comment Response/Action taken Section cross-
reference
sampling the wrong place) or more frequent visits
(extra disturbance of animals).
Although it is acknowledged that there can be small
potential benefits from a zig zag layout and this was
duly considered during the design process. For
practical reasons it is considered such a design
would not be of benefit at this site, particularly in
relation to potential for double-counting where
transect lines meet and to on-site navigation.
Assessment by the vessel’s skipper considered the
zig zag layout not feasible to achieve in the
conditions likely to be encountered, ignoring
prevailing conditions would have affected the
standard of data collection.
ESAS
surveyor’s
fatigue
SNH “For bird surveys, two ESAS surveyors is the
minimum requirement, with recording only being
undertaken from one side (which ever provides
the best conditions). We understand the surveys
should take approximately 7 hours, including
short breaks between transects. If surveys
continue for longer periods (or the 7 hours
doesn’t include breaks) we advise the need for a
relief observer to prevent observer fatigue.”
The nature of the implemented survey design
means that surveyors get up to a 10 minute break
between transects, when the vessel traverses to the
next transect and has to be manoeuvred into a
starting position. Across a given survey day this
provides surveyors with ample time ‘off effort’ to
avoid fatigue. On average, survey days did not last
much longer than 7 hours at a time.
n/a
Accounting for
autumn/winter
data gap
SNH,
12/03/2013
“The deficiencies in the autumn and winter year-
1 data [..] Also apply to bird species. While this is
not an uncommon problem when working in
locations with difficult sea conditions, it does not
Every effort was made to launch monthly boat-
based surveys and utilize appropriate weather
windows. Throughout autumn and winter the vessel
and the team were continuously available, ready to
Supporting Document
Technical Report –
Seabirds (Supporting

Environmental Statement
Brims Tidal Array
Page 266 of 316
Topic Stakeholder Comment Response/Action taken Section cross-
reference
preclude the necessity for the applicants to fill
this data gap. APEM is the primary potential data
source which is proposed for this purpose.
Nevertheless, it remains important that
considerable effort is applied to securing site
survey data during autumn 2013, perhaps by
increasing flexibility and opportunism for
capitalising on good weather windows.”
use viable weather windows. Sea conditions were
extremely challenging, with prolonged poor weather
in autumn/winter 2012-13 and again in winter 2013-
14, with a succession of major winter storms
moving across the UK during December and
January. After such events - given the location of
the Project survey area, which lies in open
connection with the Atlantic – it takes substantial
additional time for sea conditions to decrease to a
point which falls within ESAS requirements.
Consideration of APEM data led to the conclusion
that it has very limited value for the purpose of filling
the winter data gap, particularly in relation to the
large number of observations of birds which are not
identified to species level and the lack of
differentiation between the different auk species.
Instead a comparison of relative abundance was
made with results from the nearby MeyGen Inner
Sound (tidal array) baseline surveys, which was
recommended by SNH as an option to address the
issue (letter, 21 August 2014).
Document: NRP,
2015a)
Section 14.6.3
Collision risk
modelling
SNH,
17/01/2014
Considering the location of the proposed tidal
array within the Pentland Firth and partially
within the Hoy SPA, and the species numbers
presented so far from the 1st year of surveys, we
recommend that collision risk modelling is
Noted, all species mentioned were initially
considered for inclusion in the collision risk
modelling process. Shag and black guillemot were
screened out as neither species was recorded
within the AfL area, which is largely deeper than the
Section 14.12.2.6

Environmental Statement
Brims Tidal Array
Page 267 of 316
Topic Stakeholder Comment Response/Action taken Section cross-
reference
undertaken for the key species recorded at the
site. Once survey results provide further
information on species densities, we will be able
to provide further advice on which species
should be assessed for collision risk. However,
such an assessment is likely to include the key
diving bird species (i.e. common guillemot,
razorbill, puffin, shag, and black guillemot)
known maximum diving range for both species,
rendering the benthic habitat out of reach. The
other three auk species were included in the
modelling.
Collision risk
modelling
SNH,
17/01/2014
In our scoping response of the 31st October
2013, we stated that for the Project collision risk
assessment the ERM was preferred. However,
considering the open-centre tidal turbine is the
preferred device, and our recent collision risk
assessment for EMEC Fall of Warness, it may
be preferable to use the modified CRM as used
for the recent EMEC collision risk assessment.
Both the CRM and the ERM model were used for
the purpose of the Project EIA.
Supporting Document
Collision risk to diving
seabirds (Supporting
Document: NRP,
2015b)
Anticipated
impact footprint
(disturbance)
MSS,
09/07/2015
For disturbance we agree that the disturbance
scores created by Furness et al. (2012) may be
used as a basis for appropriate levels of effect of
disturbance on birds. We note that none of the
disturbance information used in that assessment
comes from tidal renewable devices, so care and
judgement must be exercised when translating
these scores to levels of disturbance and
displacement. For boat traffic, more sensitive
species flush at more than 1000m (see table 7 of
Advice on disturbance distances in relation to the
anticipated impact footprint has been fully
implemented in the assessment.
Section 14.7, Table
14.4

Environmental Statement
Brims Tidal Array
Page 268 of 316
Topic Stakeholder Comment Response/Action taken Section cross-
reference
Furness et al. (2012) We advise a 2km buffer for
sensitive species, which is consistent with advice
for the Westray South tidal array.
Some species allocated a score of 4 in Furness
et al. (2012) flush between 400 and 1000m, so
for less sensitive species a 1km buffer is
appropriate (for ship traffic). For example,
common guillemot (scoring 3 in the list) is
considered to fly when boats approach within
100s of metres. For many of the species listed
as scoring 1 or 2, for which the proposal here is
to have no buffer, we advise a buffer of 500m.
This is due to there still being a recorded
reaction when boats are close to some of these
species (termed ‘slight avoidance at short range’
in the supplementary tables of Furness et al.
(2012).
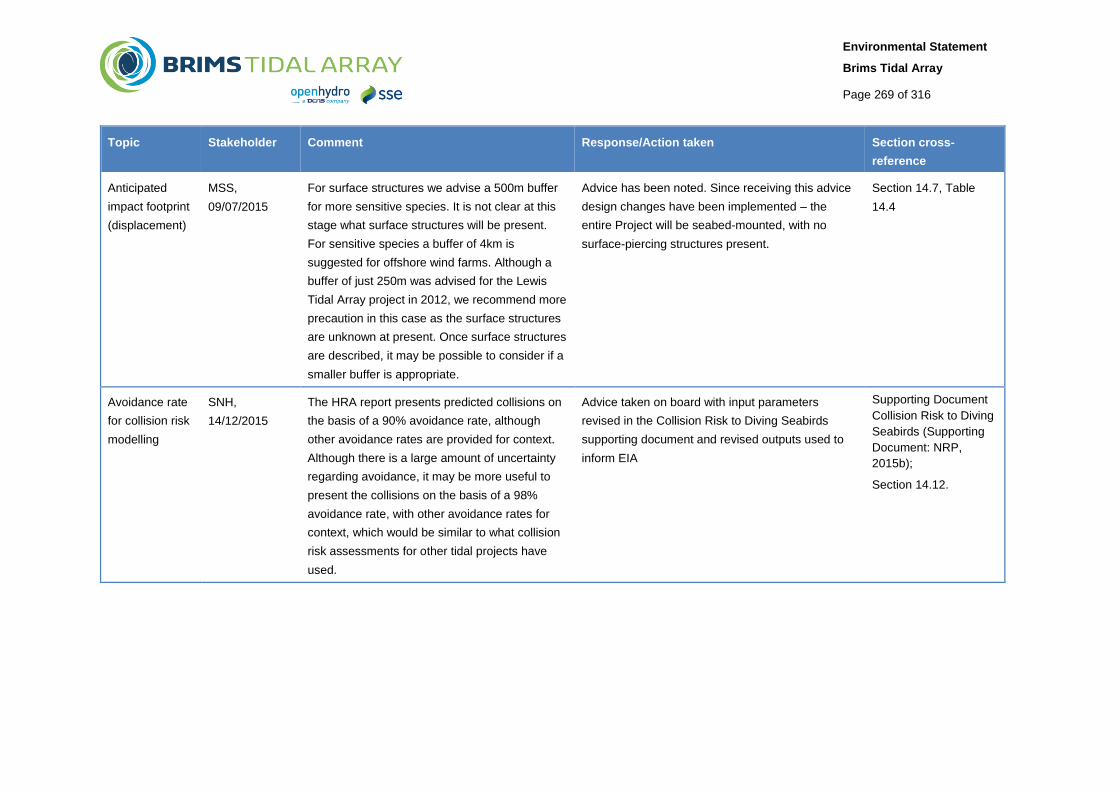
Environmental Statement
Brims Tidal Array
Page 269 of 316
Topic Stakeholder Comment Response/Action taken Section cross-
reference
Anticipated
impact footprint
(displacement)
MSS,
09/07/2015
For surface structures we advise a 500m buffer
for more sensitive species. It is not clear at this
stage what surface structures will be present.
For sensitive species a buffer of 4km is
suggested for offshore wind farms. Although a
buffer of just 250m was advised for the Lewis
Tidal Array project in 2012, we recommend more
precaution in this case as the surface structures
are unknown at present. Once surface structures
are described, it may be possible to consider if a
smaller buffer is appropriate.
Advice has been noted. Since receiving this advice
design changes have been implemented – the
entire Project will be seabed-mounted, with no
surface-piercing structures present.
Section 14.7, Table
14.4
Avoidance rate
for collision risk
modelling
SNH,
14/12/2015
The HRA report presents predicted collisions on
the basis of a 90% avoidance rate, although
other avoidance rates are provided for context.
Although there is a large amount of uncertainty
regarding avoidance, it may be more useful to
present the collisions on the basis of a 98%
avoidance rate, with other avoidance rates for
context, which would be similar to what collision
risk assessments for other tidal projects have
used.
Advice taken on board with input parameters
revised in the Collision Risk to Diving Seabirds
supporting document and revised outputs used to
inform EIA
Supporting Document
Collision Risk to Diving
Seabirds (Supporting
Document: NRP,
2015b);
Section 14.12.

Environmental Statement
Brims Tidal Array
Page 270 of 316
14.6 DATA GAPS AND UNCERTAINTIES
14.6.1 Seabird Breeding Population Estimates
A recurring issue for impact assessments relating to seabirds is the patchiness of monitoring data as well as the time lapse
since the last national census was undertaken (approximately 15 years ago, Mitchell et al. 2004). In certain parts of the
UK long–running monitoring at large colonies has provided invaluable information on population trends, as well as survival
and productivity rates. Away from these areas (including the Pentland Firth for a range of species) monitoring data is often
sparse or non-existent, meaning that an assessment has to rely on information ‘foreign’ to the region under consideration.
Where possible this assessment has used region-specific data on survival and productivity data.
Furthermore, some seabird populations have undergone or are suspected to have undergone substantial changes in the
past 15 years, mostly involving declines. As limited information is available at a regional level for most species, the validity
of adjusting regional breeding population size using a national population trend is uncertain. Using a mix of older and more
recent colony data has drawbacks as well, mainly of compatibility and uncertainty regarding trends between colonies.
Using the national census data has the disadvantage that the information is dated, but the advantage that it provides the
last comprehensive, nationwide count data. Therefore this assessment has adopted the use of national census data as
per Mitchell et al. (2004).
For gannet sufficient recent information is available to base current regional population size on, whereas for kittiwake
declines in northern Scotland have been of such a magnitude that a trend adjustment was considered a necessity - despite
acknowledged drawbacks – so as to avoid substantially underestimating potential Project impacts. A decline of 45% was
applied to Seabird 2000 data, based on the trend for Scotland since 2000 (SNH, 2012).
The assessment acknowledges the difficulties involved in relation to these data sources and has incorporated a
conservative approach to assessing impacts, in particular by taking into account likely population trend and conservation
status when considering effects on populations of uncertain size.
14.6.2 Uncertainty around Estimates
The implemented survey design is a robust, industry-standard approach to data collection and population estimates. For
the purpose of maintaining a conservative assessment, the 95% upper confidence limit of the mean number of birds
estimated to be present in a given season and area (e.g. the AfL+1km) is used when determining potential impact levels.
For particularly abundant (or rare) receptors this value provides a solid indication of a likely upper range of numbers present
as estimates will be based on a large sample size (or at least a sample with many zero counts). For regularly observed yet
relatively scarce species however, confidence intervals around mean seasonal density estimates can be quite large. This
is particularly prevalent in estimates for shag and black guillemot, where UCLs indicate the presence of relatively large bird
numbers, immediately triggering regional importance levels.
To maintain consistency in approach to each receptor, 95% UCLs of seasonal means have been used as the initial focal
point for impacts on all receptors, including shag and black guillemot. To deal with the uncertainty involved in estimates for
these two receptors, assessment conclusions take into account that said estimates represent a particularly conservative
benchmark.

Environmental Statement
Brims Tidal Array
Page 271 of 316
14.6.3 Seasonal Survey Gaps
The autumn/winter gap in the survey programme due to poor weather conditions was extensively considered during
consultation with SNH/MS (Table 14.3). SNH (letter, 21 August 2014) recommended that a comparison with other data
sources, including information from the nearby MeyGen Inner Sound tidal energy development could be used to show that
the existing Project autumn/winter dataset is sufficient to allow for a robust impact assessment.
Therefore an effort was made to compare data from the Project Survey Area with alternative data sources. Sources
considered were: older ESAS information (e.g. Stone et al. 1995), APEM aerial survey data for the wider Pentland Firth,
MeyGen baseline survey data and more informal information (e.g. Forrester et al. 2007).
Ultimately it was considered that the MeyGen data would provide the best benchmark for comparison. Firstly, the site is
situated within the Pentland Firth at just 11km distance from the Project Survey Area. ESAS boat-based surveys for this
site were undertaken between 2009 and 2011. Although it is acknowledged that any comparison will be limited by inherent
differences between usage patterns of tidal passes by diving birds across Scotland (e.g. Waggitt et al. in prep) it is
considered that the type of data available from the MeyGen surveys has several advantages compared to other available
data sources:
The proximity of the MeyGen survey area to the Project survey area, maximising the likelihood for at least similar
patterns to occur;
Identical methods of data collection and survey effort (comparing like with like). ESAS boat-based surveys were
deployed for both projects;
No compatibility issues regarding species identification, available digital aerial data from APEM is not considered to
be of sufficient quality or scope to allow for a sensible comparison of (autumn/winter) datasets, in particular in relation
to species identification and its inability to distinguish between different auk species;
Available MeyGen data is very recent (as opposed to older ESAS data); and
Spatial units, MeyGen project area and the Project AfL+1km area are roughly the same size.
A detailed examination of seasonal densities and patterns is presented in Supporting Document: NRP, 2015a. In each
species account a quantitative comparison is made of average monthly densities of birds on the sea surface (the reported
unit in the MeyGen Ornithological Chapter) for the AfL+1km and the MeyGen project area. In summary, it is concluded that
for the majority of species seasonal patterns and autumn/winter monthly densities (where surveys covered the same
month) are very similar. Although densities for shag and black guillemot at MeyGen are consistently higher than the
AfL+1km throughout the year, this is easily explained by the more favourable bathymetry and foraging conditions at the
MeyGen site as well its proximity to the large numbers of breeding birds of both species on the nearby island of Stroma.
Given the strong similarity between both sites in terms of seasonal patterns and estimated densities, including during the
autumn/winter period, as well as the clear reasons for those species where consistent differences do exist, it is concluded
that the existing Project survey dataset is entirely fit for purpose and forms the basis for a robust impact assessment.
14.7 ANTICIPATED IMPACT FOOTPRINT
The assessment considers the geographical area over which impacts from the Project may affect birds, i.e. the anticipated
impact footprint (AIF). The definition of the AIF for a particular impact is based on a combination of the best information
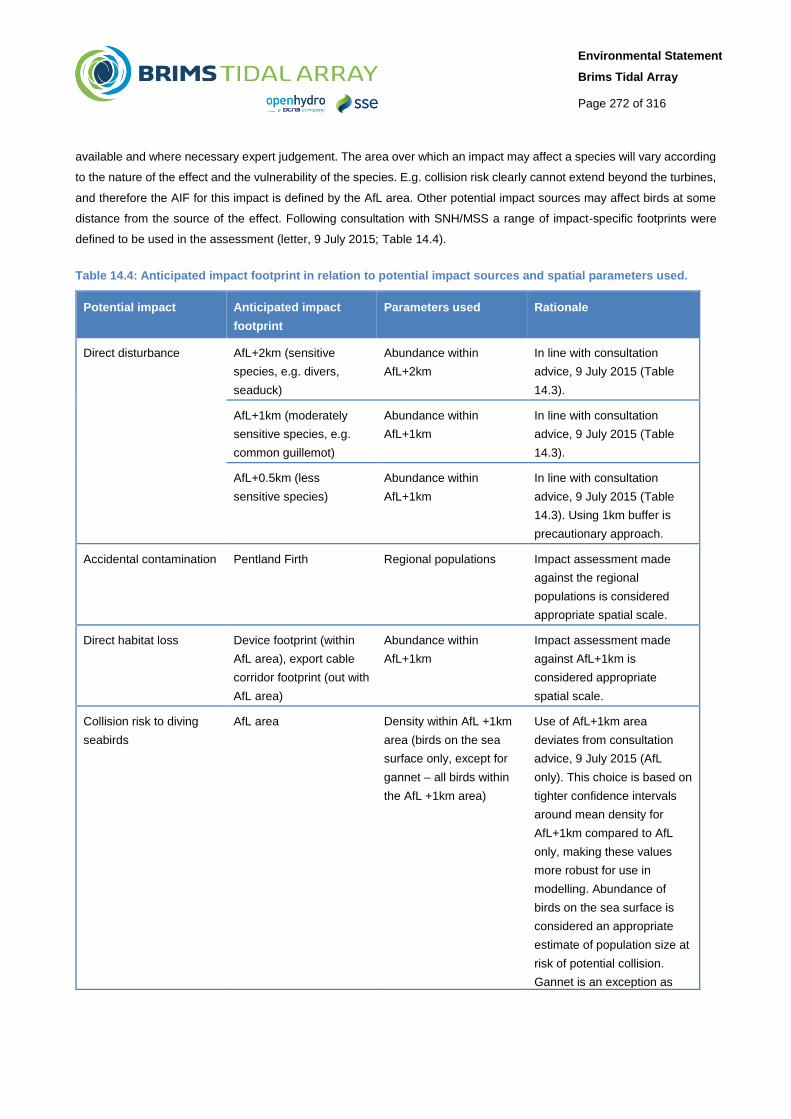
Environmental Statement
Brims Tidal Array
Page 272 of 316
available and where necessary expert judgement. The area over which an impact may affect a species will vary according
to the nature of the effect and the vulnerability of the species. E.g. collision risk clearly cannot extend beyond the turbines,
and therefore the AIF for this impact is defined by the AfL area. Other potential impact sources may affect birds at some
distance from the source of the effect. Following consultation with SNH/MSS a range of impact-specific footprints were
defined to be used in the assessment (letter, 9 July 2015; Table 14.4).
Table 14.4: Anticipated impact footprint in relation to potential impact sources and spatial parameters used.
Potential impact Anticipated impact
footprint
Parameters used Rationale
Direct disturbance AfL+2km (sensitive
species, e.g. divers,
seaduck)
Abundance within
AfL+2km
In line with consultation
advice, 9 July 2015 (Table
14.3).
AfL+1km (moderately
sensitive species, e.g.
common guillemot)
Abundance within
AfL+1km
In line with consultation
advice, 9 July 2015 (Table
14.3).
AfL+0.5km (less
sensitive species)
Abundance within
AfL+1km
In line with consultation
advice, 9 July 2015 (Table
14.3). Using 1km buffer is
precautionary approach.
Accidental contamination Pentland Firth Regional populations Impact assessment made
against the regional
populations is considered
appropriate spatial scale.
Direct habitat loss Device footprint (within
AfL area), export cable
corridor footprint (out with
AfL area)
Abundance within
AfL+1km
Impact assessment made
against AfL+1km is
considered appropriate
spatial scale.
Collision risk to diving
seabirds
AfL area Density within AfL +1km
area (birds on the sea
surface only, except for
gannet – all birds within
the AfL +1km area)
Use of AfL+1km area
deviates from consultation
advice, 9 July 2015 (AfL
only). This choice is based on
tighter confidence intervals
around mean density for
AfL+1km compared to AfL
only, making these values
more robust for use in
modelling. Abundance of
birds on the sea surface is
considered an appropriate
estimate of population size at
risk of potential collision.
Gannet is an exception as

Environmental Statement
Brims Tidal Array
Page 273 of 316
Potential impact Anticipated impact
footprint
Parameters used Rationale
diving movements are
initiated in flight.
Indirect impacts through
habitats and prey species
AfL+3km area Abundance within
AfL+3km
Choice of area is in line with
impact zone used in ES
Chapters 9. Physical
Processes and 11. Benthic
Ecology
Note: consultation advice from MSS/SNH received on 9 July 2015 supersedes any previous advice in relation to
impact footprints (which differed in advice on several parameters)
14.8 ASSESSMENT METHODOLOGY
14.8.1 Approach to Assessment
The approach to impact assessment was not agreed in advance with SNH/MSS and was submitted on (10 April 2015) for
consideration. A formal response was received on 9 July 2015 from MSS (Supporting Document: BTAL, 2015c).
Recommendations were incorporated into the assessment where feasible. Where project specific guidance was not
available, BTAL adopted the approach of using feedback on the proposed Westray South tidal energy development to
inform the approach.
In doing so the assessment incorporates the most relevant approach based on the latest advice to a project of a similar
size and nature, situated in the same region, where project specific guidance is not available.
The approach to the assessment of ornithological impacts has drawn on published guidance on Environmental Impact
Assessment in Scotland (SNH 2009; Scottish Government 1999), as well as advice provided by SNH and MSS in
discussions over the approach to impact assessment for tidal developments in the Pentland Firth area (in particular
Westray South (see Table 14.3).
14.8.2 Assessment Criteria
Impact is defined as a change in the population of bird species as a result of the Project in isolation. Where the response
of a population has varying degrees of likelihood, the probability of these differing outcomes is considered. Note that
impacts can be adverse, neutral or beneficial.
Judgement is made against the general expectation that the Project would not have a significant adverse effect on the
overall receptor population, range or distribution of bird species considered. In assessing the impacts, consideration is
given to the relevant populations of the species. Trivial or inconsequential impacts are excluded.
For breeding seabird species, the appropriate regional ecological unit is defined according to the likely connectivity of
seabird colonies with the proposed Project, in turn based on species-specific foraging ranges (e.g. Thaxter et al. 2012).
Thus the regional breeding populations of a species is determined to be the sum of the birds breeding within an area
defined around the development area by the species’ foraging range (mean maximum or maximum) plus a case by case
margin (and associated rationale) to include or exclude colonies on or near the range edge. Regional non-breeding

Environmental Statement
Brims Tidal Array
Page 274 of 316
population sizes were based on the boundaries used to define the biologically defined minimum population size (BDMPS)
for the non-breeding period of the year (Furness 2014).
The assessment determines the potential impacts of the Project and the likelihood of their occurrence. In judging whether
a potential impact is significant or not, several factors are taken into account:
The sensitivity of the receptor to the impact;
The spatial magnitude of the likely impact;
The temporal magnitude of the likely impact; and
The nature conservation importance (NCI) value of the species involved.
The significance of potential impacts is determined by integrating the assessments of magnitude, sensitivity and nature
conservation importance in a reasoned way (IEEM 2010). In judging significance, consideration is also given to the
population status and trend of the potentially affected species. If a potential impact is determined to have greater than
negligible significance, mitigation measures to avoid, reduce or remedy the impact are suggested wherever possible. Best
practice measures are also suggested for impacts of negligible significance but which are nonetheless undesirable.
14.8.2.1 Sensitivity and Vulnerability
Sensitivity and vulnerability are related but different concepts. Sensitivity as used here is a characteristic of the receptor
population under consideration and is a measure of how sensitive it is to a particular impact. Sensitivity is a measure of
likely size of change to a population in terms of its size, reproductive output or geographical range that would result as a
consequence of it experiencing a given impact. It can also be thought of as a measure of the capacity of a population to
absorb an impact. The term vulnerability as used here is a characteristic of a species, and is a measure of how likely
individuals of a species are to experience a given impact or a collection of impacts.
The question of how vulnerable seabird species are to impacts caused by tidal devices has recently been reviewed by
Furness et al. (2012). As part of this review species were rated on a number of criteria and the scores combined to give
an overall vulnerability score, with a higher score indicating a greater level of vulnerability. These scores were then used
to produce an overall score and this is used as a basis for categorising each species into one of five generic vulnerability
categories ranging from very low to very high. The criteria used included the potential for collision with tidal devices (based
on dive depth), response to vessel disturbance and displacement response to fixed structures. The scores for these criteria
and a species overall generic vulnerability score are summarised in Table 14.5. Note that these scores include several
other factors not presented, namely: drowning risk, benthic foraging, use of tidal races for foraging, feeding range, and
habitat specialization.
The methods used by Furness et al. (2012) and their resulting generic vulnerability scores are considered to be appropriate
with respect to the Project and are therefore adopted. However, it should be noted that these are scores of generic
vulnerability to tidal devices and the actual vulnerability of a species to the proposed devices may be lower. For example,
if a species has a high generic vulnerability score but does not use the development area, then its vulnerability to the tidal
devices of the Project will be negligible.

Environmental Statement
Brims Tidal Array
Page 275 of 316
Table 14.5: Ranked species-specific generic vulnerability to overall tidal device impacts, disturbance, displacement (after Furness et al. 2012) and surface pollutants (Wiens et al. 1995)
Species Vulnerability
to surface
pollutants
Vulnerability (score1 out of 5) Diving
depth
Generic vulnerability to
potential tidal device
impacts
Vessel
disturbance
Displacement
by structures
(score1
out of 5)
Overall
score
Category
Black guillemot Very high 3 2 4 9.9 High
Shag Very high 4 2 4 9.6 High
Razorbill High 3 2 5 9.6 High
Guillemot High 3 1 5 9 High
Cormorant High 4 2 4 7 High
Great northern
diver
Very high 5 3 3 4.1 Moderate
Red-throated
diver
Very high 5 2 3 3.8 Moderate
Puffin High 2 2 4 3.8 Moderate
Black-throated
diver
Very high 5 3 3 3.6 Moderate
Arctic tern Medium 2 2 1 1.9 Low
Manx shearwater Medium 1 1 3 1.5 Low
Eider Medium 3 1 3 1.5 Low
Gannet High 2 2 3 1.4 Low
Great black-
backed gull
High 2 1 1 1 Very low
Kittiwake Medium 2 1 1 0.9 Very low
Herring gull Medium 2 1 1 0.8 Very low
Great skua Very high 1 1 1 0.7 Very low
Common gull Medium 2 1 1 0.7 Very low
Arctic skua Very high 1 1 1 0.6 Very low
Fulmar Medium 1 1 1 0.5 Very low
Storm petrel Medium 1 1 1 0.5 Very low
1. Score 1 is lowest vulnerability and score 5 highest.
2. Score ranges from 0 (no risk) to 9.9 (highest risk) and is derived from species-specific information on e.g. diving
behaviour, habitat flexibility, sensitivity to disturbance etcetera (Furness et al. 2012). Note, the overall score cannot
be derived solely from scores for disturbance and displacement presented in this table. These are included to
provide impact-specific context.
In determining the significance of impacts, the sensitivity and ability to recover from temporary adverse conditions is
considered in respect of each potentially affected population. Sensitivity is determined according to each receptor

Environmental Statement
Brims Tidal Array
Page 276 of 316
populations’ conservation status (Eaton et al. 2009; JNCC 2014) and its ability to tolerate the impact and/or recover from
the effect of an impact, using the broad criteria set out in Table 14.6.
The assessment of sensitivity takes account of information on the responses of seabirds to potential impacts from marine
developments (e.g. collision, noise and disturbance by human activities). Note, however, that behavioural sensitivity can
differ even between similar species (Garthe and Hüppop 2004) and that, within a particular species, some populations may
be more sensitive than others, and that sensitivity may change over time, for example due to habituation and changing
conservation status. Sensitivity also depends on the type of activity of the bird, with, for example, a species likely to be
more sensitive to disturbance whilst breeding than at other times in its life, especially when in the vicinity of nests or young.
Table 14.6: Definitions for sensitivity of ornithological receptors
Sensitivity Criteria
High Receptor population has very limited tolerance of effect.
Example; likely to have no capacity to absorb change, so a population level effect likely.
Likely to be limited to populations with poor existing conservation status
Medium Receptor population has limited tolerance of effect.
Example; very minor capacity to absorb change so a population level effect possible.
Likely to include but not be limited to populations with poor existing conservation status
Low Receptor population has some tolerance of effect.
Example; likely to have minor capacity to absorb additional mortality or reduction in productivity or
habitat loss, so a population level effect unlikely.
Negligible Receptor population generally tolerant of effect.
Example; likely to have moderate capacity to absorb additional mortality or reduction in
productivity or habitat loss, so a population level effect very unlikely.
The nature conservation importance of the bird species potentially affected by the Project is defined according to Table
14.7. It should be noted that high nature conservation importance and high sensitivity are not necessarily linked within a
particular impact.

Environmental Statement
Brims Tidal Array
Page 277 of 316
Table 14.7: Definitions of the nature conservation importance (value) levels for ornithological receptors
Value Definition
High Species listed in Annex 1 of the EU Birds Directive
Species listed on the IUCN threatened list
Breeding species listed on Schedule 1 of the Wildlife and Countryside Act (WCA)
Species making use of the area in nationally important numbers (>1% national population)
Medium Other species listed on the Birds of Conservation Concern (BOCC) ‘Red’ list
Regularly occurring migratory species, which are either rare or vulnerable, or warrant special
consideration on account of the proximity of migration routes, or breeding, moulting, wintering or staging
areas in relation to the Project
Species making use of the area in regionally important numbers (>1 of the regional population)
Low Other species listed on the Birds of Conservation Concern (BOCC) ‘Amber’ list
Species making use of the area in numbers equating to 0.1-1% of the regional population
Negligible All other species
Species making use of the area in numbers equating to <0.1% of the regional population or otherwise
so scarce as to amount to the same
14.8.2.2 Magnitude
Impacts on receptor populations are categorised in terms of their spatial and temporal magnitude as detailed in Table 14.8.
Table 14.8: Definition of spatial scale of magnitude for impacts affecting ornithological receptors
Magnitude Criteria
High Major reduction in the status or productivity of a bird population due to mortality or
displacement or disturbance.
Guide: >20% of population affected, >20% change in mortality or productivity rate.
Medium Partial reduction in the status or productivity of a bird population due to mortality or
displacement or disturbance.
Guide: >5-20% of population affected, >5-20% change in mortality or productivity rate.
Low Small but discernible reduction in the status or productivity of a bird population due to
mortality or displacement or disturbance.
Guide: 1-5% of population affected, 1-5% change in mortality or productivity rate.
Negligible Very slight reduction in the status or productivity of a bird population due to mortality or
displacement or disturbance. Reduction barely discernible, approximating to the “no
change” situation.
Guide: <1% population affected, <1% change in mortality or productivity rate.

Environmental Statement
Brims Tidal Array
Page 278 of 316
14.8.2.3 Impact Significance
The matrix presented in Table 14.9 is used as a starting point for determining the significance of impacts, combining
(spatial) magnitude (Table 14.8) and receptor sensitivity (Table 14.6). Nature conservation importance (Table 14.7),
information on a receptor’s population conservation status, and the extent of any uncertainty are also taken into
consideration where appropriate in reaching a judgement on impact significance. Any impact determined to be moderate
or above is considered significant under EIA regulations. Significance definitions are presented in Table 14.10.
Table 14.9: Assignment of impact significance for ornithological receptors based on sensitivity of receptor and magnitude of effect
Sensitivity of
Receptor
Magnitude of effect
High Medium Low Negligible
High MAJOR MAJOR MODERATE MINOR
Medium MAJOR MODERATE MINOR MINOR
Low MODERATE MINOR NEGLIGIBLE NEGLIGIBLE
Negligible MINOR NEGLIGIBLE NEGLIGIBLE NEGLIGIBLE
Table 14.10: Definitions of impact significance for ornithological receptors
Impact significance Criteria
Major Very large or large change in receptor condition, both adverse or beneficial, which are likely
to be important considerations at a regional level because they contribute to achieving
national, regional or local objectives, or, could result in exceeding of statutory objectives
and/or breaches of legislation.
Moderate Intermediate change in receptor condition, which are likely to be important considerations at
a regional or local level.
Minor Small change in receptor condition, which may be raised as local issues but are unlikely to
be important in the decision making process.
Negligible No discernible change in receptor condition.
No change No impact, therefore no change in receptor condition.
14.8.2.4 Site Importance and Receptor Priority
The ornithological importance of the Project survey area, in particular the AfL+1km, is evaluated by comparing seasonal
estimates of 95%UCL of seasonal mean abundance with regional receptor population sizes. The importance of the
AfL+1km to a receptor population was defined on the basis on the mean percentage of a population present, as follows:
High importance, >5% of the population;
Medium importance, 1 - 5% of the population;
Low importance, 0.1 - <1% of the population; and
Negligible, <0.1% of the population.

Environmental Statement
Brims Tidal Array
Page 279 of 316
To maximise focus on relevant seabird receptors and associated issues in the EIA process, a system of prioritisation was
used. Each species was rated as high, medium or low priority for the EIA, as detailed in Table 14.11. If there was uncertainty
as to which category was most appropriate for a species a more precautionary (higher) category was chosen.
Low priority species receptor populations are those that could not plausibly be subject to adverse impacts beyond a
negligible significance level from the Project due to a combination of very low to low vulnerability and the Area for Lease
having negligible importance as a habitat for sustaining that population. Prioritisation criteria do not take into account nature
conservation importance value and conservation status as these do not affect the likelihood of an impact occurring.
All receptor populations of species rated as having low or very low generic vulnerability to tidal devices (Table 14.5; Furness
et al. 2012) and for which the AfL+1km has negligible importance for the regional population (defined as 95% UCL of the
seasonal mean using the AIF that corresponds to below 0.1% of the population) are rated as low priority. In addition, all
species, irrespective of their generic vulnerability rating, for which baseline surveys found no evidence of them using the
ecological resources of the AIF are also categorised as low priority (e.g., overflying migrants/passage birds). Low priority
species receptor populations are not individually considered in the impact assessment, but instead are grouped into a
single community.
Table 14.11: Criteria used to categorise species priority for EIA
Priority
Category
Species Criteria
High >1% of the regional receptor population at times uses the Area for Lease (High or Medium site
importance).
And at least moderate generic vulnerability to the impacts of tidal devices.
Medium Between 0.1% and 1% of the regional receptor population at times uses the Area for Lease (Low
site importance).
And at least moderate generic vulnerability to the impacts of tidal devices.
Or
>1% of the regional receptor population at times uses the Area for Lease (High or Medium site
importance).
And, low or very low generic vulnerability to the impacts of tidal devices.
Low Between 0.1% and 1% of the regional receptor population at times uses the Anticipated Impact
Footprint (Low site importance).
And low or very low generic vulnerability to the impacts of tidal devices.
Or
Receptor population makes no use of the Anticipated Impact Footprint (e.g. only recorded flying
over) or occurs in numbers <0.1% of the regional receptor population (Negligible site importance).
And any category of generic vulnerability to the impacts of tidal devices.
14.9 BASELINE DESCRIPTION
14.9.1 Introduction
Full details of the ESAS survey results and supporting contextual information are presented in Supporting Document: NRP,
2015a. A summary of the key results is provided in this section, focussing on the aspects that have greatest relevance to
the assessments of impacts.

Environmental Statement
Brims Tidal Array
Page 280 of 316
The surveys showed that the Project survey area, including the Area of Lease buffered to 1km (AfL+1km), generally has
low importance for seabirds, with most species present in low numbers relative to their background populations (Table
14.12). With a few exceptions, the range of species and numbers present in the Project survey area were particularly low
during the non-breeding season, reflecting seabird dispersal and migratory movements away from the Pentland Firth area.
A total of 16 seabird species were regularly recorded and very small numbers of nine other species of seabird were
recorded occasionally (on less than five occasions) (Supporting Document: NRP, 2015a). A range of waterfowl, shorebirds
and songbirds were recorded crossing the airspace over the Project survey area.
14.9.1.1 Regularly Recorded Species
Detailed information on the status of all recorded seabird species is provided in Supporting Document: NRP, 2015a. Table
14.12 provides an overview of the commonly recorded species, abundance estimates, vulnerability to tidal developments,
site importance as well as a priority categorisation based on the latter two factors.
14.9.1.2 Seabird Receptor Priority in EIA
Information on receptor priority captured in Table 14.12 is summarised for each category and season.
Low priority
The breeding receptor populations categorised as low priority are the regional breeding populations of fulmar, Manx
shearwater, storm petrel, gannet, Arctic skua, great skua, herring gull, great black-backed gull, common gull, and Arctic
tern.
The non-breeding receptor populations categorised as low priority are the regional wintering populations of red-throated
diver, fulmar, gannet, herring gull, great black-backed gull, common gull, kittiwake, common guillemot, razorbill and puffin.
Medium priority
Medium priority receptor populations are those of species that could plausibly be subject to an adverse impact from the
Project on account of a combination of at least moderate generic vulnerability to tidal devices and the AfL+1km having at
least low importance for sustaining that population (Table 14.12). These populations merit detailed consideration. Even
though the low importance of the AfL+1km for sustaining the population makes it likely that any impacts would be of
relatively small magnitude, it is desirable to identify such impacts so that they can be reduced where possible through
mitigation.
The breeding receptor populations categorised as medium priority are those of red-throated diver, kittiwake, common
guillemot and puffin. For common guillemot this includes the chicks-on-sea period, as some uncertainty exists whether the
very low densities of common guillemots recorded in the Project survey area in August 2012 are a regular feature.
Shag is the single regional species receptor population categorised as having medium priority in the non-breeding season.
High priority
High priority species receptor populations are those that could plausibly be subject to an adverse impact from the Project
on account of a combination of at least moderate generic vulnerability to tidal devices and the AfL+1km having at least
moderate importance for sustaining that population (defined as at least 1% of the population at times present in the
Environmental Statement
Brims Tidal Array
Page 281 of 316
AfL+1km). High priority receptor populations are those that merit the greatest level of scrutiny because the impacts on
these could potentially lead to significant changes to their regional population status.
The breeding receptor populations categorised as high priority are those of shag, razorbill and black guillemot. For razorbill
this includes the chicks-on-sea period, as some uncertainty exists as to whether the occurrence of very low densities of
razorbills recorded in the Project survey area in August 2012 are a regular feature.
The non-breeding receptor populations categorised as high priority are the regional wintering populations of black
guillemot.
14.9.1.3 Scarce Species
Nine seabird species were recorded in very small numbers on a few occasions only (<3 observations, with 4 or less
individuals per survey) during the entire survey programme. These include (number of observations and peak number of
individuals per survey in brackets): black-throated diver (1/1), great northern diver (1/2), sooty shearwater (1/1), cormorant
(3/3), eider (3/4), pomarine skua (1/1), black-headed gull (1/1), common tern (3/3) and little auk (1/3) (Table 7, Supporting
Document: NRP, 2015a). Although this is an arbitrary threshold and although several of these are species which are
deemed to have high to moderate vulnerability to potential impacts from tidal energy developments (cormorant, diver
species; Furness et al. 2012) the numbers involved are so small, and site importance clearly very limited that all of these
are considered to be of low priority at all times of year. For the sake of brevity these species have not been presented in
Table 14.12. Red-throated diver is similarly scarce, but has been included due to the proximity of the important breeding
population on nearby Hoy.
Migratory waterfowl, shorebirds and songbirds recorded during surveys are not considered in this assessment as these
species do not depend on or physically interact with offshore habitats and thus will not be affected by the presence of the
proposed (and wholly submerged) Project. Risk of collision for these species is therefore non-existent.
14.9.2 Summary
The AfL+1km supported shag numbers of high importance during the breeding season, while the area supported red-
throated diver, kittiwake, razorbill and black guillemot numbers of medium importance during this time of year (Table 14.12).
In the non-breeding season, with the exception of black guillemot (medium site importance), importance did not exceed
negligible or low levels for any other receptors (Table 14.12).
Note that importance levels for shag and black guillemot are exclusively a result of both species using the 1km buffer
around the AfL (and more specifically only the section of the buffer between the AfL and Hoy). Neither species was recorded
on the sea surface within the AfL (Section 14.9.3).
The importance level for red-throated diver is based on a peak survey count of a single bird. The species was only recorded
on three occasions during the 2012 and 2013 breeding seasons in the 1km buffer around the AfL. None of these
observations were ‘in-transect’ (i.e. either on the sea surface within 300m from the vessel or in flight within snapshot) and
thus no reliable density estimates could be calculated.

Environmental Statement
Brims Tidal Array
Page 282 of 316
Table 14.12: Summary of the importance of the AfL+1km to regional receptor populations of seabirds based on the 95%UCL of the seasonal mean
Species Season Nature
conservation
value
Regional population 95%UCL of mean in
AfL+1km
Importance
of AfL+1km
to RP
Vulnerability
to tidal
devices
Receptor
priority
for EIA Number Units Number % of RP
Red-throated
diver
Nest attendance High 111 adults 1
(peak
count)
0.9% Low Moderate Medium
Winter High 1,523 birds 1
(peak
count)
<0.1% Negligible Moderate Low
Fulmar Colony
attendance
Low 965,822 adults 733 0.1% Low Very low Low
Winter 568,736 birds 773 0.1% Low
Manx shearwater Summer (non-
breeding)
Low 8,507 birds 17 0.2% Low Very low Low
European storm-
petrel
Colony
attendance
Low 4,636 birds 6 0.1% Low Very low Low
Gannet Colony
attendance
Low 75,870 adults 63 0.1% Low Low Low
Winter 248,385 birds 25 <0.1% Negligible
Shag Colony
attendance
Medium 754 adults 165 21.9% High High High
Winter Low 39,468 birds 132 0.3% Low Medium
Arctic skua Colony
attendance
High 930 birds 3 0.3% Low Very low Low
Great skua Colony
attendance
Low 4,470 birds 39 0.9% Low Very low Low

Environmental Statement
Brims Tidal Array
Page 283 of 316
Species Season Nature
conservation
value
Regional population 95%UCL of mean in
AfL+1km
Importance
of AfL+1km
to RP
Vulnerability
to tidal
devices
Receptor
priority
for EIA Number Units Number % of RP
Herring gull Colony
attendance
Medium 5,294 adults 0 0% Negligible Very low Low
Winter 466,511 birds 10 <0.1% Negligible
Great black-
backed gull
Colony
attendance
Low 5,156 adults 5 0.1% Low Very low Low
Winter 91,399 birds 13 <0.1% Negligible
Common gull Colony
attendance
Low 5,930 adults 4 0.1% Low Very low Low
Winter 710,000 birds 7 <0.1% Negligible
Kittiwake Colony
attendance
Medium 62,792 adults 690 1.1% Medium Very low Medium
Winter Low 627,816 birds 34 0% Negligible Low
Arctic tern Colony
attendance
High 1,724 adults 9 0.5% Low Low Low
Common
guillemot
Colony
attendance
Low 609,250 adults 825 0.1% Negligible High Medium
Chicks on sea 609,250 adults 0 0% Negligible
Winter 1,617,306 birds 253 <0.1% Negligible Low
Razorbill Colony
attendance
Medium 10,739 adults 433 4% Medium High High
Chicks on sea 10,739 adults 369 3.4% Medium
Winter Low 218,622 birds 44 <0.1% Negligible Low
Black guillemot Colony
attendance
Medium 1,576 adults 48 3% Medium High High

Environmental Statement
Brims Tidal Array
Page 284 of 316
Species Season Nature
conservation
value
Regional population 95%UCL of mean in
AfL+1km
Importance
of AfL+1km
to RP
Vulnerability
to tidal
devices
Receptor
priority
for EIA Number Units Number % of RP
Winter 3,656 birds 46 1.3%
Puffin Colony
attendance
Low 142,670 adults 339 0.2% Low Moderate Medium
Winter 231,957 birds 7 <0.1% Negligible Low

Environmental Statement
Brims Tidal Array
Page 285 of 316
14.9.3 Species Accounts
The following species accounts outline population trends, site abundance and distribution as well as vulnerability
considerations for those receptors of medium or high priority to the EIA process. Low priority receptor populations are not
individually described in the species accounts (see Section 14.8.2.4).
14.9.3.1 Red-Throated Diver
The UK conservation status of red-throated diver is categorised as Amber UK on the birds of conservation concern criteria
(BOCC) due to its unfavourable conservation status in Europe (Eaton et al. 2009). The species is also listed on Schedule
1 of the Wildlife and Countryside Act 1981 and as an Annex 1 species on the EU Birds Directive. The entire UK breeding
population of 4,146 adult birds occurs within Scotland, where numbers increased by approximately 34% between 1994
and 2006 (Dillon et al. 2009).
Red-throated divers were very scarce in the Project survey area throughout the year, and were only recorded on eight
occasions during the entire survey programme (totalling 8 individuals), a single one of which was seen on the water. The
species has a very short foraging range of up to 9km, foraging in near-shore waters before returning to its upland breeding
lochs (Thaxter et al. 2012).
The few birds seen in the Project survey area during the breeding season are likely to be exclusively from the Hoy breeding
population of 111 adults (Dillon et al. 2009). Within the defined regional population the species is a notified feature at Hoy
SSSI (SNH Sitelink). During the winter period birds from outside the UK join the population (Wernham et al. 2002). The
NW North Sea population is estimated at 1,523 birds (Furness, 2014).
Recent work on establishing the spatial extent of important foraging areas for red-throated divers around SPAs during the
breeding season indicates that the south coast of Hoy and South Walls is very unlikely to represent important habitat for
the species (Black et al. 2015). Instead, core foraging areas are considered to lie to the east and north of Hoy, well away
from the Project survey area. This is largely explained by the species’ preference for foraging in shallow waters of less
than 20m to 30m depth, a depth range that is absent from the AfL+1km and indeed the vast majority of the Project survey
area.
Given what is known of red-throated diver distribution on Orkney, with the vast majority of birds during the non-breeding
season residing in and around Scapa Flow and northern Orkney (Dawson et al. 2009, Lawson et al. 2015), and very small
numbers along exposed coastlines elsewhere on the islands, it is clear that the Survey Area (let alone the AfL+2km) is of
very limited importance to the species during this time of year.
Red-throated divers are considered to have very high vulnerability to vessel disturbance, low vulnerability to displacement
by structures and moderate vulnerability in relation to tidal energy developments in general (Table 14.5).
14.9.3.2 Shag
The UK conservation status of shag is categorised as Amber UK on the BOCC criteria due to population declines in the
past 25 years (Eaton et al. 2009). The UK population has been in decline since the late eighties, with a 41% decrease
between 2000 and 2013 (JNCC 2014). Three colonies within 80km of the Pentland Firth have decreased by 65% since
designation (MacArthur Green 2013). It is unclear whether declines at large colonies are representative for the population

Environmental Statement
Brims Tidal Array
Page 286 of 316
as a whole as smaller colonies are less likely to be affected by density dependence processes such as competition, one
of the main drivers behind declining numbers (Furness 2014).
Using the maximum foraging range the population in the defined breeding region is 754 adults based on the Seabird 2000
census results (Mitchell et al. 2004). The actual number of shags present in the region during the breeding season is likely
to be substantially greater than this figure because of the presence of immature birds. Modelling of the age distribution
undertaken by Furness (2014) indicates that at the end of the breeding season 51% of shag populations consist of adult
birds, with the remainder made up of immature and juvenile individuals. An estimated 41,503 birds are present in the NW
North Sea region during the non-breeding period (Furness, 2014).
Shags were relatively common in the Project survey area throughout the year and were recorded on nearly every survey.
Based on the estimates for the AfL+1km, the site is considered to have medium nature conservation value for this species
as regionally important numbers occurred in the breeding season in the AfL+1km (95%UCL of the estimated mean: 165
birds or 21.9% of the population, assuming all birds are adults, Table 14.12). Note that this estimate comes with some
uncertainty as it represents a wide interval around the mean estimate (Section 14.6.2). A high proportion of birds seen
were present on the sea surface. The AfL+1km did not support regionally important numbers in the non-breeding season.
The species has a short foraging range from breeding colonies (mean maximum range: 14.5km, maximum: 17km, Thaxter
et al. 2012). Therefore, the birds seen in the Project survey area are likely to be almost exclusively from breeding colonies
in southern Orkney. Within the defined regional population shag is a notified feature at Duncansby Head SSSI and Stroma
SSSI as a component of important seabird assemblages (SNH Sitelink).
Distribution of shags across the Project survey area was heavily biased to the near-shore sections within the 1km buffer,
with no birds actually within the AfL itself (see Supporting Document: NRP, 2015a). This is explained by the species’ heavily
depending on benthic habitat for foraging as well as the substantial water depths within the AfL which, at 70-90m deep,
are essentially in excess of the known diving range of the species (see overview of source material in Furness et al. 2012).
Shags are considered to have high vulnerability to vessel disturbance and low vulnerability to displacement by structures,
as well as high vulnerability in relation to the potential impacts of tidal developments specifically, particularly as it habitually
spends a lot of time on the sea surface while foraging and dives to moderate depths (Table 14.5).
14.9.3.3 Kittiwake
Kittiwake is a species of Amber conservation concern due to substantial population declines, with the Scottish population
having an unfavourable conservation status as it has declined by approximately 66% over the past 25 years, equating to
an average decline rate of 4.2% per annum (Mitchell et al. 2004, Eaton et al. 2009, SNH 2012). The decline is linked to
food supply and sea temperature changes and is likely to continue (JNCC 2014).
Colonies in Orkney have been declining at an average rate of 12.3% per annum (JNCC 2014). No recent information is
available for the large colonies in Caithness.
Taking the average decline rate of the Scottish population into account, and using the mean maximum foraging range
(MMFR: 60km, Thaxter et al. 2012) the current regional breeding population is assumed to be the number estimated by
the Seabird 2000 census (133,528 adults) multiplied by 0.55, which is 73,440 adults. The actual number of kittiwakes

Environmental Statement
Brims Tidal Array
Page 287 of 316
present in this defined region during the breeding season is likely to be greater than this figure because of the presence of
immature birds. However, poor breeding success in recent years (a feature of the decline) means that relatively few
immature birds are to be expected, as transpired in survey results. Modelling of age distribution undertaken by Furness
(2014) indicates that at the end of the breeding season, for a stable population, 53% of kittiwake individuals in the
population would consist of adult birds, with the remainder made up of immature and juvenile individuals. An estimated
627,816 birds are present in the North Sea region during the non-breeding period (Furness, 2014).
Kittiwakes were regularly present in the Project survey area in moderate numbers in the breeding season and smaller
numbers in the non-breeding period. Based on the estimates for the AfL+1km, the site is considered to have medium
nature conservation value for this species as regionally important numbers occurred in the breeding season (95%UCL of
the estimated mean: 690 birds or 1.1% of the population, assuming all birds are adults, Table 14.12). During the breeding
season a high proportion (70%) of birds seen were present on the sea surface, with 50% of all birds seen during this time
of year displaying foraging behaviour.
The species has a moderate foraging range around breeding colonies and it is considered that birds in the Project survey
area predominantly originate from as far north as colonies on mainland Orkney and Copinsay, and as far south as the
large colonies on the Sutherland and Caithness coasts. Within the defined regional population kittiwake is a notified feature
at Rousay SSSI, Copinsay SSSI, Marwick Head SSSI, Stroma SSSI, West Westray SSSI, Duncansby Head SSSI and a
notified seabird assemblage at Hoy SSSI and Dunnet Head SSSI.
The baseline survey kittiwake distribution maps indicate that during the breeding season in 2012 and 2013 birds seen on
the sea were concentrated towards the west and east of the Project survey area respectively, with almost all such
observations on the very edge of the 1km buffer or further out and none within the AfL (Supporting Document: NRP, 2015a).
Birds in flight did range across the AfL, but the majority were observed outside this area. Statistical analysis established
that for kittiwakes on the sea surface there was only a 5% chance that the absence of birds on the surface in the AfL
(without buffer) was a chance occurrence, indicating perhaps that the AfL is relatively unattractive for foraging (Caloo
2015).
Kittiwakes are considered to have low vulnerability to vessel disturbance and displacement by structures as well as very
low vulnerability to potential impacts from tidal energy developments generally (Table 14.5). The species is not considered
vulnerable to underwater collision risk as it predominantly feeds at the sea surface.
14.9.3.4 Common Guillemot
Common guillemot is a species of Amber UK conservation concern due to 50% of the UK population occurring in fewer
than ten sites, making the population geographically vulnerable (Eaton et al. 2009). Between 2000 and 2013 the UK
population as a whole has shown a 9% increase (JNCC 2014), but this trend is not necessarily applicable at regional levels.
In fact, the Scottish population has an unfavourable conservation status, as it has shown moderate long-term decline
amounting to -26% since 1986 (SNH 2012; Mitchell et al. 2004).
Twelve SPA populations within 80km of the Pentland Firth have increased by 5% since designation (MacArthur Green
2013). However, this comparison is heavily affected by several large SPA colonies for which the most recent estimate itself
is 15 years old. Restricting the comparison to the five colonies on Orkney for which count data since 2006 are available

Environmental Statement
Brims Tidal Array
Page 288 of 316
shows that these have on average declined by approximately 20% (MacArthur Green 2013). The Orkney Bird Report
(2009) indicates that common guillemot has declined across all monitoring plots in the first decade of the 21st century.
The defined regional breeding population is based on the Seabird 2000 census results and after accounting for adults that
were not attending the colonies at the time of counting (using a correction factor of x1.34, Mitchell et al. 2004), the size of
the regional population for the colony-attendance part of the breeding season is estimated at 609,250 adults (the chicks-
on-sea period has been defined similarly). The actual number of birds present in this period is likely to be larger because
of the presence of non-breeding immature birds. A recent study into correction factors for breeding auks indicated there is
substantial variation in the correction factor between colonies depending on local conditions (Harris et al. 2015). Pending
advice from JNCC/SNH on this matter the established factor has been used in this assessment.
Modelling of the age distribution undertaken by Furness (2014) indicates that at the end of the breeding season 57% of
common guillemot populations consist of adult birds, with the remainder made up of immature and juvenile individuals. An
estimated 1,617,306 birds are present in the North Sea and Channel region during the non-breeding period (Furness,
2014).
Breeding common guillemots travel moderate distances to forage, the maximum foraging distance is reported to be 135km
and the MMFR is 84km (Thaxter et al. 2012). During the colony-attendance part of the breeding season the birds using
the Project site are most likely from colonies from most of Orkney, except possibly the far north east, Sule Skerry and Sule
Stack and on mainland Scotland as far west as Cape Wrath and as far south as the East Caithness Cliffs SPA. Large
colonies exist across the Pentland Firth on Stroma and at Dunnet Head. Within the defined regional population common
guillemot is a notified feature at Duncansby Head SSSI, Hoy SSSI, Stroma SSSI, Red Point SSSI, Dunnet Head SSSI,
Copinsay SSSI, Rousay SSSI, Marwick Head SSSI, West Westray SSSI, Cape Wrath SSSI and Sule Skerry SSSI.
Common guillemots were present in the Project survey area (including the AfL+1km) in large to very large numbers
throughout the year, with the vast majority of birds seen on the sea surface, however, at most, these numbers only
represent a small proportion of the regional populations. The distribution of common guillemot observations shows an
approximately even spread over the Project survey area (Supporting Document: NRP, 2015a). Statistical analysis did not
reveal a trend in spatial distribution across the Project survey area (Caloo 2015).
Based on the estimates for the AfL+1km, the site is considered to have low nature conservation value for the species, both
in the breeding season and non-breeding period as regionally important numbers did not occur, even if it is assumed all
birds present are adults (Table 14.12). For example, in the breeding season the 95% UCL of the estimated mean number
in the AfL + 1km was 825 birds, which represents just 0.1% of the regional breeding population (Table 14.12).
Common guillemots are considered to have moderate vulnerability to vessel disturbance and low vulnerability to
displacement by structures (Table 14.5); their vulnerability to disturbance is heightened during the chicks-on-sea part of
the breeding season due to the presence of dependent chicks and because adults undergo complete wing moult at this
time of year rendering them temporarily flightless. The species is considered to have high vulnerability to tidal energy
developments in general, largely as a result of its diving behaviour (Furness et al. 2012).

Environmental Statement
Brims Tidal Array
Page 289 of 316
14.9.3.5 Razorbill
Razorbill is a species of Amber UK conservation concern due to population declines in the past 25 years (Eaton et al.
2009). However, between 2000 and 2013 the UK population as a whole has shown a 13% increase (JNCC 2014), but this
trend is not necessarily applicable at regional levels as there is uncertainty about recent population trends for Scottish
breeding razorbill due to low monitoring effort. Between 2005 and 2010 the UK population was one of slow decline, but
since then the population appears to have increased again, although estimates come with wide confidence intervals,
requiring caution in interpretation. In recent years productivity at monitoring sites has decreased again, and this may
possibly lead to future population declines (JNCC 2014).
Five SPA populations within 80km of the Pentland Firth have decreased by 23% since designation (MacArthur Green
2013). However, this comparison is heavily affected by several large SPA colonies for which the most recent estimate itself
is 15 years old or more. When comparing three colonies on Orkney for which the latest estimates are from the last five to
eight years it turns out that these have suffered a 45% decrease. The Orkney Bird Report (2009) indicates that declines of
5-34% were found across all monitoring plots between 2006 and 2009.
The defined regional breeding population is based on the Seabird 2000 census results (Mitchell et al. 2004). After
accounting for adults that were not attending the colonies at the time of counting using a correction factor of x1.34 (Mitchell
et al. 2004), the size of the regional breeding population is estimated at 10,739 adults (the chicks-on-sea period has been
defined similarly). The actual number of razorbills present in the defined region during the breeding season is likely to be
greater than this figure because of the presence of non-breeding immature birds. A recent study into correction factors for
breeding auks indicated there is substantial variation in this factor between colonies depending on local conditions (Harris
et al. in prep.). Pending advice from JNCC/SNH on this matter the established factor has been used in this report.
Modelling of the age distribution undertaken by Furness (2014) indicates that at the end of the breeding season 57% of
razorbill populations consist of adult birds, with the remainder made up of immature and juvenile individuals. An estimated
218,622 birds are present in the North Sea and Channel region during the non-breeding period (Furness, 2014).
Breeding razorbills travel moderate distances to forage; the maximum foraging distance is reported to be 95km and the
MMFR is 48.5km (Thaxter et al. 2012). Using the latter value the regional breeding population includes mainland Orkney,
Copinsay and parts of the Caithness coast. Within the defined regional population razorbill is a notified seabird assemblage
feature at Marwick Head SSSI, Copinsay SSSI, Duncansby Head SSSI, Dunnet Head SSSI, Hoy SSSI, Red Point SSSI
and Stroma SSSI.
Razorbills were present in the Project survey area (including the AfL+1km) in moderate to large numbers throughout the
year, with the vast majority of birds seen being on the sea surface. Distribution of razorbill observations shows an
approximately evenly spread over the Project survey area, with birds on the sea surface most prevalent towards the eastern
and the north west parts of the area (see Supporting Document: NRP, 2015a). Statistical analysis did not reveal a trend in
spatial distribution across the Project survey area (Supporting Document: Caloo, 2015).
Based on the estimates for the AfL+1km, the site is considered to have medium nature conservation value for the species
as regionally important numbers occurred in the breeding and chicks-on-sea season (95%UCL of the estimated mean: 433
and 369 birds or 4% and 3.4% of the population respectively, assuming all birds are adults, Table 14.12).

Environmental Statement
Brims Tidal Array
Page 290 of 316
Razorbills are considered to have moderate vulnerability to vessel disturbance and low vulnerability to displacement by
structures (Table 14.5); their vulnerability to disturbance is heightened during the chicks-on-sea part of the breeding season
due to the presence of dependent chicks and because adults undergo complete wing moult at this time of year rendering
them temporarily flightless. The species is considered to have high vulnerability to tidal energy developments in general,
largely as a result of its diving behaviour (Furness et al. 2012).
14.9.3.6 Black Guillemot
Black guillemot is a species of Amber UK conservation concern as it is a species of European concern (Eaton et al. 2009).
The species breeds at relatively low densities at often difficult to access sites and therefore there is a limited amount of
monitoring data available. As a result no national trend is available for the UK breeding population (JNCC 2014).
No information on population trends was available for Orkney (Furness 2014). A recent survey at the East Caithness Cliffs
SPA found an apparently substantial increase since Seabird 2000: a total of 1,569 individuals in breeding plumage were
counted in 2014, compared to 939 counted in 2000 (Swann 2014). Parts of north Caithness have seen similar increases
since the national census (Swann 2013). Recent counts on Stroma (May 2015) found a total of 417 individuals, a
substantially higher number than recorded during Seabird 2000 (Mitchell et al. 2004, SMP database).
The defined regional breeding population based on the Seabird 2000 census results is 1,576 adults (Mitchell et al. 2004).
The actual number of black guillemots present in the defined region during the breeding season is likely to be greater still
because of the presence of non-breeding immature birds. Modelling of the stable age distribution undertaken by Furness
(2014) indicates that at the end of the breeding season 43% of black guillemot populations consist of adult birds, with the
remainder made up of immature and juvenile individuals. An estimated 3,656 birds are present within 20km from the Project
survey area during the non-breeding period (including immature birds, as per recommendation in Furness, 2014).
Breeding black guillemots travel short distances to forage, ranges from 0.5 to 15km have been published (BirdLife
International 2000). The species is relatively common around the Pentland Firth, breeding on Orkney and the Caithness
coast as well as smaller islands in the Firth. Within the defined regional population black guillemot is a notified seabird
assemblage feature at Stroma SSSI (SNH SiteLink).
Black guillemots were present in the Project survey area year-round in very low to low numbers. Based on the estimates
for the AfL+1km, the site is considered to have medium nature conservation value for the species as regionally important
numbers occurred in the breeding and winter season (95%UCL of the estimated mean: 48 and 46 birds or 3% and 1.3%
of the population respectively, assuming all birds are adults, Table 14.12). Note however, that although the Project survey
area is probably of some regional importance due to the relatively small background population, substantial uncertainty is
associated with the mean estimate as it is based on a small sample size (n=16) and therefore the associated 95%UCL is
rather wide (Section 14.6.2; Supporting Document 14A: Technical Report - Seabirds).
Distribution of black guillemots across the Project survey area was heavily biased to the near-shore sections within the
1km buffer, with no birds recorded within the AfL itself (see Supporting Document 14A: Technical Report - Seabirds). This
is explained by the species’ heavily depending on benthic habitat for foraging as well as the substantial water depths within
the AfL which, at 70m-90m deep, are essentially out with the known diving depth range of the species (see overview of
source material in Furness et al. 2012, and Masden et al. 2013).

Environmental Statement
Brims Tidal Array
Page 291 of 316
Black guillemots are considered to have moderate to low vulnerability to vessel disturbance and displacement by structures
respectively, and a high vulnerability to the potential impacts of tidal developments in general, largely as a result of its
diving behaviour (Table 14.5).
14.9.3.7 Puffin
Puffin is a species of Amber UK conservation concern as it is a species of European concern (Eaton et al. 2009). Between
the mid-1980s and 2000 numbers breeding in Scotland increased by 13% (Mitchell et al. 2004). No trend is available for
the period since then as insufficient monitoring data are available (JNCC 2014). Limited information on population trends
was available for Orkney and the Pentland Firth, although it is likely the population is much reduced (Furness 2014).
The defined regional breeding population based on the Seabird 2000 census results is 142,670 adults (Mitchell et al. 2004).
The actual number of puffins present in the defined region during the breeding season is likely to be greater than this figure
because of the presence of non-breeding immature birds. Modelling of the age distribution undertaken by Furness (2014)
indicates that at the end of the breeding season 55% of puffin populations consist of adult birds, with the remainder made
up of immature and juvenile individuals. An estimated 231,957 birds are present in the North Sea and Channel region
during the non-breeding period (Furness, 2014).
Breeding puffins travel large distances to forage; the maximum foraging distance is reported to be 200km and the MMFR
is 105km (Thaxter et al. 2012). Substantial numbers breed within the MMFR from the Project survey area, particularly
along the Caithness and Sutherland coast line and across Orkney. Within the defined regional population puffin is a notified
feature at Sule Skerry SSSI and a seabird assemblage feature at Duncansby Head SSSI, Dunnet Head SSSI, Hoy SSSI,
Red Point SSSI, Rousay SSSI, Stroma SSSI, Copinsay SSSI, Marwick Head SSSI, West Westray SSSI.
Puffins were present in the Project survey area (including the AfL+1km) in moderate numbers in the breeding season but
were scarce in the non-breeding period. Based on the estimates for the AfL+1km, the site is considered to have low nature
conservation value for the species as regionally important numbers did not occur in the breeding season (95%UCL of the
estimated mean: 339 birds or 0.2% of the population respectively, assuming all birds are adults, Table 14.12).
Distribution of puffin observations shows an approximately evenly spread over the Project survey area, with birds on the
sea surface possibly slightly more prevalent outside the AfL (Supporting Document 14A: Technical Report - Seabirds).
Statistical analysis did not reveal a trend in spatial distribution across the Project survey area (Caloo 2015).
Puffins are considered to have low vulnerability to vessel disturbance and displacement by structures (Table 14.5) and a
moderate vulnerability to the potential impacts of tidal developments specifically, mainly as a result of its typical diving
depth (Furness et al. 2012).
14.10 POTENTIAL IMPACTS
Ornithological interests have the potential to be affected by the following phases/activities of the Project:
Construction and installation activities;
Operational activities, including device function and maintenance works; and
Decommissioning.

Environmental Statement
Brims Tidal Array
Page 292 of 316
Potential impacts on seabird communities as a result of the proposed Project were identified and discussed in some detail
in the scoping report (BTAL 2013). Those adopted for the assessment are summarised below:
Disturbance of foraging seabirds by vessels;
Accidental release of contaminants into the marine environment, including oil;
Mortality of diving seabirds through collision with Tidal Energy Converters (TEC);
Indirect impacts caused by hydrodynamic changes to surrounding seabed habitats and associated prey species
(included on basis of Scoping Opinion, 23 April 2014); and
Direct sea-bed habitat loss and modification.
Since receipt of the Scoping Opinion several design changes have been implemented, the most important of which is the
removal of all surface-piercing structures. Therefore, the offshore component of the proposed Project will be situated
entirely below the sea surface at all times, regardless of tidal conditions. This change negates the need to assess
displacement, as no part of the Project will be visible above the sea surface. Similarly, there is no longer a need for lighting
of TECS and other infrastructure. Thus, both potential impact sources were screened out of the EIA.
Potential impacts scoped out of the EIA due to design changes:
Displacement of seabirds from foraging habitat by project infrastructure (e.g. tidal devices); and
Lighting of TECs and other infrastructure.
The potential for these impacts to affect bird populations is reviewed by e.g. Jackson and Whitfield (2011), McCluskie et
al. (2012) and Furness et al. (2012). These reviews show that seabird species differ in their vulnerability to the various
impacts, and that some species have no potential exposure to some impacts. Notably, TECs do not pose a collision risk
to species that do not dive down to the depth where the TECs will operate. For this reason potential impacts are assessed
at the species level.
The potential impacts identified for each phase of the Project are listed below:
14.10.1 Construction and Installation
Disturbance of cliff nesting seabirds during construction and installation of the export cable landfall location or near-
shore portion of the cable corridor (referred to as ‘direct disturbance’);
Disturbance of foraging or loafing seabirds by vessels and installation activities (referred to as ‘direct disturbance’);
and
Accidental release of contaminants into the environment, including oil (referred to as ‘accidental contamination’).
14.10.2 Operation and Maintenance
Disturbance of foraging or loafing seabirds by vessels (as above);
Direct seabed habitat loss and modification (referred to as ‘direct habitat loss’);
Mortality of diving seabirds through collision with Tidal Energy Converters (referred to as ‘collision risk to diving
seabirds’);

Environmental Statement
Brims Tidal Array
Page 293 of 316
Accidental release of contaminants into the environment, including oil (as above); and
Indirect impacts caused by hydrodynamic changes to surrounding seabed habitats and associated prey species
(referred to as ‘indirect impacts through habitats and prey species’).
14.10.3 Decommissioning
Disturbance of foraging or loafing seabirds by vessels (as above); and
Accidental release of contaminants into the environment, including oil (as above).
14.11 MITIGATION MEASURES
14.11.1 Project Design and General Mitigation Measures
All Project Design Mitigation and General Mitigation measures are set out in Chapter 5 Project Description, Table 5.15 and
Table 5.16 respectively. These are standard practice measures based on specific legislation, regulations, standards,
guidance and recognised industry good practice that are put in place to ensure significant impacts do not occur.
14.11.2 Specific Mitigation
The following mitigation measures will be implemented specifically to minimise the impacts on ornithology.
Table 14.13: Mitigation Measures Specific to Ornithology
Ref Mitigation Measure Description
OR01 To avoid accidental contamination (in the presence of important numbers of seabirds sensitive to sea
surface pollution), vessels associated with all Project operations will carry on-board oil and chemical spill
mop up kits.
OR02 To avoid accidental contamination (in the presence of important numbers of seabirds sensitive to sea
surface pollution), installation activities will only take place during suitable weather windows.
14.12 RESIDUAL EFFECTS
The assessment considers the potential impacts identified for each stage of the Project – Construction and Installation,
Operation and Maintenance and Decommissioning (Section 14.10). Each impact is considered in the context of Stage 1
as well as Stage 1 & 2 combined. Impact conclusions for Stage 2 (referred to as Stage 1 & 2) are therefore not additional
to those for Stage 1 but comprise the sum of the whole expected impact magnitude and significance.
14.12.1 Construction and Installation
14.12.1.1 Direct Disturbance
Construction and installation activities, especially those involving fast moving vessels, have the potential to disturb seabirds
foraging in the marine environment. Construction and installation disturbance would involve a series of temporary short-
term events over the duration of this stage. The consequences of disturbance by vessels and other activities would be to
temporarily displace birds from the vicinity of the disturbance and is thus akin to temporary habitat loss.
Construction and installation disturbance would occur throughout the AfL but at any one time will be focussed around only
those parts of the array under construction. It would also occur along the route of the subsea cable corridor. Vessels moving

Environmental Statement
Brims Tidal Array
Page 294 of 316
between their embarkation port and the development area would also have the potential to disturb seabirds, but this would
be relatively infrequent (e.g. a few vessel movements per day at most), and result in very short-term and spatially limited
disturbance as a vessel passed through an area.
14.12.1.2 Offshore Disturbance
Consultation indicated that disturbance distances of 2km for vulnerable species (divers, seaduck), 1km for moderately
vulnerable species (e.g. guillemot) and 500m for all other species would be appropriate for assessment purposes (Table
14.3; MSS/SNH, letter 9 July 2015; Table 14.4 for anticipated impact footprint).
Red-throated diver and shag are the only receptors which use the AfL or the subsea cable corridor area and which are
considered to have a very high and high vulnerability to vessel disturbance respectively (Table 14.5, Furness et al. 2012).
Common guillemot, razorbill and black guillemot have moderate vulnerability to disturbance and all other receptors
(including medium priority receptors kittiwake and puffin) have low or very low vulnerability. The receptor populations of all
six receptor species are categorised as having negligible sensitivity to disturbance (Table 14.6) as they clearly have some
tolerance to short-term, localised disturbance events in relation to available areas within their respective foraging ranges,
none of which are likely to have an effect at the population level.
For the purposes of assessment it is initially assumed that vessel disturbance causes all seabirds to leave their respective
anticipated impact footprints throughout the duration of the construction phase. This is very unlikely and therefore an
extremely cautious assumption. In reality no species would be expected to respond so severely, as physiological stress is
likely to last very short periods of time (until a bird moves away from a perceived threat) and disturbance would be restricted
to only a small portion of the AIF at any one time. Therefore it is likely that birds may re-distribute around a construction
zone, making use of non-impacted areas during periods of construction and installation activity.
It is certain that construction and installation activities will not take place across the whole of Stage 1 and Stage 1 & 2 at
the same time but that works will be spatially concentrated around device locations and along inter-array cable routes
within the AfL and along the export cable corridor outside the AfL. The majority of vessels thus engaged will be slow-
moving or possibly not moving (moored barges) as construction is undertaken sequentially across the AfL and cable
corridors.
Disturbance in the breeding season could potentially be compensated for by a large foraging range, i.e. activities which
disturb species with a restricted foraging range are likely to have a larger impact than the same activities would have on a
wide-ranging bird species. Of the species under consideration here, red-throated diver and shag are particularly restricted
in their foraging range during the breeding season, with maximum foraging ranges of 9 and 17km respectively (Thaxter et
al. 2012). Red-throated diver is not considered particularly flexible in terms of habitat use, while shag is deemed to be
moderately flexible (Furness and Wade 2012).
Distribution information based on two years of baseline surveys shows that red-throated diver and shag are absent from
the AfL area, with the former a very scarce presence in the 1km buffer and concentrations of shag exclusively present in
the 1km buffer zone between the AfL and the Hoy/South Walls coastline (Supporting Document: NRP, 2015a). For red-
throated diver this means that any disturbance up to 2km will affect very few birds whereas any realistic disturbance effect
for shag– which is known to be sensitive to disturbance to at least 500m distance (Velando and Munilla 2011) – is likely to

Environmental Statement
Brims Tidal Array
Page 295 of 316
only extend to part of the buffer zone at relatively short time intervals, whenever works are undertaken at the northern edge
of Stage 1 and Stage 1 & 2 and along export cable routes.
Even if construction and installation disturbance displaced all seabirds from using the AfL+1km, the impact on all species
receptor populations would be rated as having negligible spatial magnitude as disturbance would result in a series of very
localised, temporary events over the short-term. As all the species receptor populations affected are considered to have
low or negligible sensitivity to disturbance, this impact is judged to be of negligible significance under the terms of the EIA
Regulations.
14.12.1.3 Assessment
The assessment considered seven receptors of negligible sensitivity and (offshore) direct construction and installation
disturbance of negligible magnitude. Based on the highly localised extent over which direct disturbance is predicted to
occur, as well as its short-term nature, the reversibility of any effect and moderate habitat flexibility in the case of most
receptors, effects of construction and installation disturbance on all receptors across all seasons are evaluated as a
negligible impact. It follows that impact evaluation of receptors of low priority is similarly negligible.
14.12.1.4 Disturbance of Cliff-Nesting Birds
Several seabird species breed on the cliffs in the proximity of all three proposed export cable routes (Aquatera 2012).
These include fulmar, herring gull, great black-backed gull, razorbill and black guillemot. The presence of cable-laying
vessels could lead to disturbance of these birds, potentially affecting breeding success or chick survival. E.g. increased
alertness in breeding common guillemots in reaction to vessel disturbance has been recorded from as far away as 500m,
with 78% of vessel movements to within 50m of breeding colonies leading to disturbance or flush events (Rojek et al.
2007).
Two corridor options – Sheep’s Skerry and Moodies Eddy - make landfall within the Hoy SPA marine extension. The third
option, Aith Hope, extends east of the Brims Ness peninsula. Fulmar (100 nest sites), herring gull (144 birds) and great
black-backed gull (1 pair) breed at landfall locations in the Moodies Eddy corridor, whereas small numbers of fulmar and
Arctic tern breed at possible landfall locations within the Aith Hope corridor option (Aquatera 2012). No information was
available for Sheep’s Skerry. It is considered a reasonable assumption that the bird community within the latter corridor
option is similar to the other two options given their proximity. All three species are judged to be somewhat less susceptible
to vessel disturbance of colonies than the auk species and are here considered to have low sensitivity to this impact source.
In a worst case scenario all birds breeding near landfall locations in the Moodies Eddy corridor would fail to breed as a
result of extensive disturbance from cable-laying vessels. This would result in an effect on the regional population of fulmar
of <0.1%, of 2.7% on the herring gull population and of <0.1% on the great black-backed gull population for the duration of
a single breeding season. For herring gull this would be categorised as an effect of low magnitude, and an effect of
negligible magnitude for the two other species.
The assessment considered three cliff-breeding receptors of low sensitivity and direct construction and installation
disturbance of low magnitude (herring gull) and negligible magnitude (fulmar, great black-backed gull). Based on the
localised extent over which direct disturbance is likely to occur, as well as its short-term nature (one breeding season), and

Environmental Statement
Brims Tidal Array
Page 296 of 316
the reversibility of any impact, effects of construction and installation disturbance on all receptors are evaluated as a
negligible impact. It follows that impact evaluation of receptors of low priority is similarly negligible.
14.12.1.5 Mitigation and Good Practice
No mitigation is required for offshore disturbance although good practice would aim to minimise disturbance to seabirds
using the offshore site and along approach routes from ports by avoiding where possible the preferred feeding and resting
areas and adopting speed restrictions. Studies elsewhere indicate the severity of disturbance by vessels is related to speed
(e.g. Ronconi and Cassady St. Clair 2002). Vessel speed limits are commonly used to limit disturbance to seabirds in the
vicinity of colonies and feeding sites; however there is no accepted maximum permissible speed. Professional judgement
considers vessel speeds of up to 15km/hr (approximately 8 knots) are likely to give most seabird species time to move
away from an approaching vessel without resorting to flight.
Good practice could for example be for construction vessels to stick to defined routes (as far as feasible) between ports
and the offshore site as a means of reducing disturbance of seabirds. Studies have shown that disturbance is reduced if
birds can predict where the disturbance will occur (Schwemmer et al. 2010). Consultation with SNH and Marine Scotland
will be undertaken to establish the extent of any measures required.
Good practice may be required for disturbance of cliff-nesting seabird species, and could include safe working distances
where practical or considerations of seasonal timing. Consultation with SNH and Marine Scotland will be undertaken to
establish the extent of any measures required.
14.12.1.6 Summary of Residual Impact
Good practice measures will reduce offshore vessel disturbance; the residual impact will remain of negligible significance
for all receptors. Good practice measures in relation to cliff-breeding seabirds should aim to maintain impacts at negligible
significance levels and are to be confirmed during consultation.
Table 14.14: Summary of residual effects of the direct disturbance from construction and installation
Impact Receptor Sensitivity Mitigation/good
practice
Residual
Magnitude
Residual
Significance
Direct
disturbance,
Stage 1 and
Stage 1 & 2
Red-throated
diver
Negligible Best practice
measures in
relation to vessel
management to
be agreed with
MSS/SNH
General
Mitigation
Measure GM07
Negligible Negligible
Shag Negligible Negligible Negligible
Kittiwake Negligible Negligible Negligible
Common
guillemot
Negligible Negligible Negligible
Razorbill Negligible Negligible Negligible
Black guillemot Negligible Negligible Negligible
Puffin Negligible Negligible Negligible
All other
seabirds
Negligible Negligible Negligible

Environmental Statement
Brims Tidal Array
Page 297 of 316
Impact Receptor Sensitivity Mitigation/good
practice
Residual
Magnitude
Residual
Significance
Disturbance
(cliff-nesting
breeding birds)
(Stage 1 &
Phase 1 & 2)
Fulmar Low Best practice
measures in
relation to
disturbance of
cliff-breeders to
be agreed with
MSS/SNH
Negligible Negligible
Herring gull Low Negligible Negligible
Great black-
backed gull
Low Negligible Negligible
14.12.2 Operation and Maintenance
14.12.2.1 Direct Disturbance
Disturbance impacts from vessels during the O&M phase will be similar in nature to the construction phase (i.e. regular
vessel presence), yet occur over a much longer period of time (life span of tidal array), albeit at a much lower intensity
(fewer vessels). Depending on the timing of devices becoming operational it is possible that O&M vessel disturbance for
Stage 1 will overlap with construction activities for Stage 2 for up to three breeding seasons.
The assessment considered seven receptor species of negligible sensitivity and direct O&M disturbance rated as of
negligible magnitude in all cases. Given the nature of the disturbance events, which is short-term and localised in the
context of a breeding season (although to last over the lifetime of the array), the reversibility of any effect and the moderate
habitat flexibility of most receptors (with black guillemot, low flexibility - almost exclusively foraging at the outer edge of the
AfL+1km buffer, away from O&M activities), effects of O&M vessel disturbance on all these receptors across all seasons
are evaluated as a negligible impact for Stage 1 and Stage 1 & 2. It follows that impact evaluation of receptors of low
priority across all seasons is similarly negligible.
14.12.2.2 Mitigation and Good Practice
No mitigation is required although good practice would aim to minimise disturbance to seabirds using the offshore site and
along approach routes from ports by avoiding where possible the preferred feeding and resting areas and adopting speed
restrictions. Studies elsewhere indicate the severity of disturbance by vessels is related to speed (e.g. Ronconi and
Cassady St. Clair 2002). Vessel speed limits are commonly used to limit disturbance to seabirds in the vicinity of colonies
and feeding sites; however there is no accepted maximum permissible speed. Professional judgement considers vessel
speeds of up to 15km/hr (approximately 8 knots) are likely to give most seabird species time to move away from an
approaching vessel without resorting to flight.
Good practice could for example be for construction vessels to stick to defined routes (as far as feasible) between ports
and the offshore site as a means of reducing disturbance of seabirds. Studies have shown that disturbance is reduced if
birds can predict where the disturbance will occur (Schwemmer et al. 2010). Consultation with SNH and Marine Scotland
will be undertaken to establish the extent of any measures required.

Environmental Statement
Brims Tidal Array
Page 298 of 316
14.12.2.3 Summary of Residual Impact
Good practice measures will reduce vessel disturbance; the residual impact will remain of negligible significance for all
receptors.
Table 14.15: Summary of residual effects of direct disturbance from operation and maintenance
Impact Receptor Sensitivity Mitigation/good
practice
Residual
Magnitude
Residual
Significance
Direct
disturbance,
Stage 1 and
Stage 1 & 2
Red-throated
diver
Negligible Best practice
measures in
relation to vessel
management to
be agreed with
MSS/SNH
GM07
Negligible Negligible
Shag Negligible Negligible Negligible
Kittiwake Negligible Negligible Negligible
Common
guillemot
Negligible Negligible Negligible
Razorbill Negligible Negligible Negligible
Black guillemot Negligible Negligible Negligible
Puffin Negligible Negligible Negligible
All other
seabirds
Negligible Negligible Negligible
14.12.2.4 Indirect Impacts Caused by Hydrodynamic Changes to Surrounding Seabed Habitats and Associated
Prey Species
The benthic communities found in tidally swept areas such as that found in the AfL are adapted to living in highly energetic
conditions and many of the species are dependent upon the high tidal velocities for oxygen supply, food supply and/or
reduction of competition (Chapter 11 Benthic Ecology). The installation of TECs that are designed to extract energy from
the water column therefore has the potential to alter the benthic community structure in the vicinity of the array and
associated seabed infrastructure. If such changes are sufficiently large these could in turn affect prey species populations
upon which seabirds depend.
The magnitude of reductions in baseline currents would be expected to be greatest for the full Project of Stages 1 and 2
combined. Hydrodynamic modelling conducted as part of the assessment of physical processes (Chapter 9 Physical
Processes) indicated that despite some localised higher reductions in baseline currents immediately adjacent to some
individual turbines (e.g. of the order of 0.5m/s locally), the magnitude of the extent of the wake of decreased current velocity
derived from the turbines (typically <0.3m/s) remains largely within the boundaries of the AfL and dissipates to baseline
conditions within 3km of the boundary. This change represents a relatively small percentage reduction in the generally
high baseline flow conditions present in the area where peak tidal flows of 2-4m/s are encountered throughout the AfL.
Benthic habitats within the AfL are typical of the extensive tidal rapids habitat that is found throughout the Pentland Firth
and are likely to be tolerant to minor changes in current speed. Hence it is unlikely that the presence of the array will cause
a large scale change in benthic community structure. Overall, the changes in hydrodynamic regime in and around the AfL
would not be expected to significantly alter the overall characteristics of the benthic communities present in the Project site
and cable corridors (Chapter 11 Benthic Ecology).

Environmental Statement
Brims Tidal Array
Page 299 of 316
The extent of any habitat loss and modification would be extremely small both in the context of the total area of the AIF
and more importantly in the context of the geographic extent of the areas used for foraging by the seabird receptor
populations potentially affected. For these reasons all seabird species that use the Project site are considered to have
negligible sensitivity to the impact of indirect effects on habitats and associated prey species.
Stage 1
The two receptors which are most dependent on benthic habitat for foraging (shag, black guillemot) did not occur in the
AfL, but do forage in inshore waters within 3km from the AfL. These species could therefore potentially be affected by any
indirect effects on benthic habitats and associated prey species. However, as no significant changes are predicted for
benthic communities it is considered any impact will be of negligible magnitude for both receptors.
Stage 1 & 2
The same reasoning outlined under Stage 1 applies to Stage 1 & 2 combined.
Assessment
The assessment considered receptors of negligible sensitivity and indirect effects on habitat and prey species of negligible
magnitude for Stage 1 and Stage 1 & 2. Any changes in the benthic community are likely to be insignificant and unlikely to
cause a shift in associated prey species. Therefore, such indirect effects during the O&M on all receptors across all relevant
seasons are evaluated as long-term, irreversible (at least during the lifespan of the Project) and of negligible significance
for Stage 1 and Stage 1 & 2. It follows that impact evaluation of receptors of low priority across all seasons is similarly
negligible for both Stages.
Mitigation and Good Practice
No mitigation is required.
Summary of Residual Impact
The residual impact will remain of negligible significance for all receptors.
Table 14.16: Summary of residual effects of indirect effects through habitats and prey species from operation and maintenance
Impact Receptor Sensitivity Mitigation/good
practice
Residual
Magnitude
Residual
Significance
Indirect impacts
on habitats and
prey (Stage 1 &
Stage 1 & 2)
Red-throated
diver
Negligible n/a Negligible Negligible
Shag Negligible Negligible Negligible
Kittiwake Negligible Negligible Negligible
Common
guillemot
Negligible Negligible Negligible
Razorbill Negligible Negligible Negligible
Black guillemot Negligible Negligible Negligible
Puffin Negligible Negligible Negligible
All other
seabirds
Negligible Negligible Negligible

Environmental Statement
Brims Tidal Array
Page 300 of 316
14.12.2.5 Direct Habitat Loss
The seabed in the AfL ranges from 70m to 90m below chart datum. Therefore the seabed generally lies too deep below
the surface to be attractive to deep-diving seabird species (such as shag and black guillemot) that specialise in foraging
on or close to the seabed; something which is borne out by the baseline survey results through the total absence of both
species from the AfL area (Supporting Document 14A: Technical Report - Seabirds). Changes to the seabed habitat are
thus very unlikely to have any impacts on seabirds or affect quality of the marine resources used by seabirds. In any case,
the extent of any habitat loss and modification would be extremely small both in the context of the total area of the AIF and
more importantly in the context of the geographic extent of the areas used for foraging by the seabird receptor populations
potentially affected. For all receptor populations the foraging area extends over tens to thousands of square kilometres.
For these reasons all seabird species that use the Project site are considered to have negligible sensitivity to the impact
of seabed habitat loss and modification, at least at the scale that would be caused by the Project.
The extent of seabed habitat loss and change within the AfL would be limited to a footprint of TECs and inter-array cables
combined of approximately 0.11km2 and 0.6km2 as a result of the construction of Stage 1 and Stage 1 & 2 respectively
(Table 14.17). The maximum footprint of the export cable corridor for Stage 1 is 0.13km2, and 0.52km2 for Stage 1 & 2.
Stage 1
The two receptors which are most dependent on benthic habitat for foraging (shag, black guillemot) did not occur in the
AfL and as such will not be affected by direct habitat loss in this area. Habitat loss due to the export cable corridor is judged
to be very small in relation to available foraging habitat for both species. In both cases any impact is considered of negligible
magnitude.
Stage 1 & 2
The same reasoning outlined under Stage 1 applies to Stage 1 & 2 combined.
Assessment
The assessment considered seven receptors of negligible sensitivity and direct habitat loss impacts of negligible magnitude
for Stage 1 and Stage 1 & 2. Given the small amount of habitat loss involved in the context of available foraging habitat,
the absence of the two benthic habitat specialists from the AIF (shag, black guillemot) and the moderate habitat flexibility
of five receptors (with red-throated diver being a very scarce presence in the AIF and black guillemot, with low habitat
flexibility - almost exclusively foraging at the outer edge of the AfL+1km buffer, and thus outside the impact zone), effects
of O&M direct habitat loss on all receptors across all relevant seasons are evaluated as long-term, irreversible (at least
during the lifespan of the Project) and of negligible significance for Stage 1 and Stage 1 & 2. It follows that impact evaluation
of receptors of low priority across all seasons is similarly negligible for both Stages.
Mitigation and Good Practice
No mitigation is proposed.
Summary of Residual Impact
The impacts of habitat loss and modification will remain of negligible significance for all species.

Environmental Statement
Brims Tidal Array
Page 301 of 316
Table 14.17: Summary of residual effects of direct habitat loss from operation and maintenance
Impact Receptor Sensitivity Mitigation/good
practice
Residual
Magnitude
Residual
Significance
Direct habitat
loss, Stage 1
and Stage 1 & 2
Red-throated
diver
Negligible n/a Negligible Negligible
Shag Negligible Negligible Negligible
Kittiwake Negligible Negligible Negligible
Common
guillemot
Negligible Negligible Negligible
Razorbill Negligible Negligible Negligible
Black guillemot Negligible Negligible Negligible
Puffin Negligible Negligible Negligible
All other
seabirds
Negligible Negligible Negligible
14.12.2.6 Collision Risk to Diving Birds
The moving parts of tidal devices pose a theoretical risk to some diving bird species. The risk is theoretical because it has
yet to be empirically demonstrated. Furthermore, there is uncertainty as to whether animals of relatively small size such
as diving seabirds would be struck by a rotor blade or would be swept past by hydrodynamic flow forces, and further,
whether, if birds were to be struck, the blow force would be sufficient to cause injury or death (Wilson et al. 2007). For the
purposes of this assessment, taking a cautious approach, it is assumed that TECs do pose a collision risk and that the
force of collisions could be sufficient to cause fatal injury.
Two models have been developed and published to predict the number of occasions that swimming animals may encounter
operating TECs and thereby give rise to the potential for harmful collision events (SNH 2015). Neither model per se takes
into account avoidance or evasion behaviour by animals, nor do they consider whether the collision strike force is sufficient
to result in harm to the animal. However, these points can be accounted for, post-modelling, by applying ‘avoidance rate’
adjustment factors to model predictions.
The first model considered is the encounter rate model (ERM) developed by SAMS and CEH (Wilson et al. 2007), and
further elaborated by Band (EMEC 2014, SNH 2015), to predict the potential for swimming animals to be harmed by open
rotor tidal device types. ERM estimates the number of encounter events per unit time per device based on the relative
velocities (i.e., closing velocity) of a turbine and a swimming animal, and their sizes.
The second model is the ‘Band’ collision rate model (CRM), originally developed for wind turbines. The model has two
stages. The first stage estimates the number of transits by a species through the rotor swept area per unit time (typically a
season or a year) for the location under investigation. The second stage estimates the likelihood that a flying bird travelling
through the rotor swept area will make contact with (i.e., encounter) a rotor. The encounter risk (or collision risk as referred
to by the authors), before taking into account avoidance or evasion, is the product of the output from the two model stages.

Environmental Statement
Brims Tidal Array
Page 302 of 316
The approach used in the Band CRM can also be used to estimate collision risk to diving birds from tidal devices. However,
there are a number of differences between flying birds and swimming birds. The main difference is that for wind farms it is
assumed that a bird passing through a rotor swept area is in level flight (a reasonable assumption based on observing
flying birds) and that they pass at right angles to the plane of rotation i.e. at 90 degrees to a rotor blade (this assumption
is unlikely to be always met, however the model output has low sensitivity to varying the angle of approach). For diving
birds, swim trajectories are likely to be inclined to the horizontal or be approximately vertical, as they typically have v-
shaped or u-shaped dive paths starting at and returning to the water surface. Indeed trajectories relative to a TEC could
be orientated at any angle between horizontal and vertical.
A comparison of the outputs from the Band and ERM models for an open (i.e. unshrouded) 3-bladed turbine using the
same input parameters has recently been undertaken (EMEC 2014). This concluded that for the range of scenarios tested,
the two models gave broadly similar output values but with a relatively consistent difference, such that the average number
of encounter events predicted by the ERM exceeded the number of collisions predicted by the Band model by a factor of
approximately 1.4.
It was further agreed through consultation with MS and SNH (SNH, Scoping Opinion, 31 October 2013) that the Encounter
Rate Model (ERM) (Wilson et al. 2007, SNH 2015) was a suitable approach to investigate the potential for collision
mortality. This method has the advantage that it makes no assumptions about an animal’s swimming direction relative to
a rotor. Although ERM was initially considered to be the preferred method to examine the potential for collision to diving
birds from Brims, SNH subsequently recommended the use of CRM for the open-centred turbines (SNH, letter 21 August
2014).
Modelling was undertaken using the ERM and CRM models for two different turbine types (shrouded and unshrouded) and
three water depth scenarios of which full details are presented in Supporting Document 14B: Collision Risk to Diving
Seabirds. The aim of the modelling was to predict the annual number of encounters between adult birds and turbine blades
for the breeding and non-breeding season. Both mModels predicted ling found that the shrouded turbine type to result in
the highest theoretical collision estimates, which and this turbine type is therefore considered as the layoutassumed for
assessment of the entire technology envelope. Two of the water depth scenarios (shallow, intermediate, and deep) reflect
the upper (minimum 30m below LAT) and lower (minimum 4m above seabed) limits of the possible turbine deployment
within the water column (Table 14.20). As species have different diving behaviour potential collision risk levels differ with
water depth. The intermediate depth scenario was chosen to reflect the turbine depth range that maximally coincides with
time-at-depths utilised by common guillemot, the only species examined that spends most of its underwater time at mid
water column depths. For the assessment only the depth scenario with the highest risk of collision is considered for each
species.
It should be noted that the worst case collision risk predictions presented are for the worst possible case, in which turbines
are positioned in the water column where they would pose the greatest potential collision risk to a species assuming a
seabed depth of 65m throughout the deployment site. However, the worst possible case is unlikely to be the same as that
which will transpire for the built array. This is because in many parts of the deployment area the seabed depth is greater
than 65m and it is likely that engineering considerations will limit how far above the seabed turbines can be operated. Thus,
the actual surface clearance is likely to be substantially greater than assumed for the worst case scenarios and, as a
consequence, collision risk could be substantially lower. The ‘worst case’ approach adopted provides Open Hydro the
greatest scope in possible engineering designs (such as turbine deployment height above the seabed); as the design

Environmental Statement
Brims Tidal Array
Page 303 of 316
details are narrowed further modelling can be undertaken to examine how the predicted collision risk to diving birds
decreases.
There are several uncertainties that affect the accuracy of the model predictions, but by choosing conservative parameter
values (i.e., those that err on the side of caution) it is considered that the outputs are likely to overestimate rather than
underestimate the number of harmful collisions. Nevertheless, an obvious criticism of both the ERM and the Band CRM is
that neither has been empirically validated for diving birds. This will not be possible until tidal device arrays are built and
there are appropriate monitoring data that measure any interactions between diving birds and tidal turbines.
Aside from the uncertainty over the most appropriate avoidance rate, the model outputs are sensitive to the bird and device
parameter values and the uncertainty over some of these has potential to affect the model outputs, in particular, the
proportion of a bird’s at-sea time spent underwater at rotor depth and mean rotor velocities.
In the case of the OpenHydro open-centred shrouded turbines, the ERM makes no allowance for the beneficial effects that
might accrue from the shrouding or the open-centre design, yet common sense suggests that both of these will reduce
collision risk, possibly substantially so. One way to factor in the benefits of shrouding and the open-centre in assessments
would be to use a higher avoidance rate for turbines that have these characteristics than for turbines of a conventional
unshrouded design.
Collision estimates are presented at a range of avoidance rates of 50%, 90%, 95%, 98% and 99%, considered appropriate
for presenting and assessing diving bird collision modelling results for tidal stream arrays in Scotland (SNH, 2015). These
values are considered to be reasonable and reflect the general view of many biologists working in the field that the actual
number of harmful collisions will be substantially lower than the predicted number of encounters (EIMR Conference collision
workshop, 2 May 2014). Following advice from SNH (letter to Marine Scotland,14 December 2015), an avoidance rate of
98% is chosen as the focus for assessment.A worst case avoidance rate of 90% is used in the assessment.
Although the encounter and collision rate model outputs are quantitative, they should be regarded as only indicative of the
level of additional mortality/injury that may result. This is because the models used have not been validated empirically
and several of the model parameters are only known approximately. While actual rates of behavioural avoidance and
evasion and mortality/injury are unknown, model outputs are considered useful in terms of giving a first order and, most
likely, cautious estimate of the absolute magnitude of the potential collision risk. Model outputs are also potentially useful
for comparing different scenarios, e.g., different types and combinations of tidal devices, and in aiding the understanding
of which aspects of tidal devices and array design have greatest bearing on collision risk to diving birds. Encounter and
collision rate modelling are recommended by SNH to better understand the potential for collision risk to diving seabirds
from tidal stream turbines (SNH, 2015).
Full details of the collision risk modelling approach can be found in Supporting Document 14B: Collision Risk to Diving
Seabirds
Species Selection
The AIF for collision risk is defined as the spatial extent of the AfL area (Table 14.4). Red-throated diver, shag and black
guillemot are excluded from modelling as all species were absent from the sea surface in the AfL during the breeding and
non-breeding season. For the remaining species potentially vulnerable to collision risk, although technically birds outside
the AfL would not be exposed to collision risk, it is considered that the mean seasonal densities for the AfL+1km and

Environmental Statement
Brims Tidal Array
Page 304 of 316
(tighter) associated confidence intervals are a more robust parameter than those for the AfL alone. Mean seasonal
densities for species of moderate and high vulnerability to tidal energy developments are presented in Table 14.18. These
form the basis for the collision risk modelling undertaken for the assessment.
Table 14.18: The mean seasonal surface density of receptors vulnerable to potential collision risk used to examine collision risk within the AfL area.
Species Season Mean density (birds/km2)
Red-throated diver Breeding 0 (not recorded in AfL)
Non-breeding 0 (not recorded in AfL)
Shag Breeding 0 (not recorded in AfL)
Non-breeding 0 (not recorded in AfL)
Common guillemot Breeding 10.43
Chicks-on-sea 0
Non-breeding 2.14
Razorbill Breeding 5.70
Chicks-on-sea 1.06
Non-breeding 0.40
Black guillemot Breeding 0 (not recorded in AfL)
Non-breeding 0 (not recorded in AfL)
Puffin Breeding 4.16
Non-breeding 0.38
Sensitivity and Vulnerability
The review by Furness et al. (2012) considers the vulnerability of seabird species to underwater collision effects from TECs
and shows that seabird receptors that use the Project survey area range from high (common guillemot, razorbill), to
moderate vulnerability (puffin) to such impacts (Table 14.5).
Razorbill is deemed a receptor of low sensitivity, largely as a result of conservation status and regional declines (albeit set
off against a relatively large regional breeding population). Common guillemot and puffin are considered receptors of
negligible sensitivity, due to their very large background populations.
Correcting for Seasonal Background Population
For most species the composition of a population present in a given area changes after the breeding season as birds
disperse or migrate away from breeding colonies over often large distances. Therefore, it would be particularly conservative
to assume that collision estimates in the non-breeding season would only affect regional breeding birds. For all species it
was assumed that 50% of the birds affected during the winter season originated from the regional breeding population.
For common guillemot and razorbill during the chicks-at-sea season it was assumed that all adult birds represented
breeding birds from the regional population.

Environmental Statement
Brims Tidal Array
Page 305 of 316
For common guillemot and razorbill the model-predicted number of encounters during the non-breeding period of the year
was small compared to the number predicted for the breeding season; for common guillemot 14.3% of all encounters were
predicted to occur in the non-breeding season and for razorbill the figure was 4.6% (Supporting Document 14B).
Furthermore, the size of the BDMPS regional non-breeding populations of these species is much greater than the defined
regional breeding populations; for common guillemot it is approximately three times greater and for razorbill it is
approximately twenty times greater. For these reasons, and bearing in mind the small effect on adult mortality rates
estimated for the regional breeding populations of these species based on many more predicted collisions affecting a much
smaller population, it is not plausible that the effect of collisions on the adult mortality rate of the BDMPS regional non-
breeding populations could be anything other than negligible, and for this reason it is not examined further.
Table 14.19: Annual baseline adult mortality rates and the proportion of adults from the regional breeding population used in collision risk modelling.
Species Season Baseline adult mortality Proportion breeding adults1
Common guillemot Breeding 6.1%a 76%
Chicks-at-sea
Non-breeding 57%
Razorbill Breeding 10.5%b 75%
Chicks-at-sea
Non-breeding 57%
Puffin Breeding 9.4%c 75%
Non-breeding 57%
1: derived from Furness (2014); a. Lahoz-Monfort et al. 2011, Reynolds et al. 2011, Meade et al. 2013; b. Taylor et al.
(2010), Lahoz-Monfort et al. (2011); c. Harris et al. (2005), Lahoz-Monfort et al. (2011), Taylor et al. (2010).
Correcting for Age
Collision estimates were corrected for age to account for likely proportion breeding adults (Table 14.19). For the breeding
season this was done on the basis of a pre-breeding census, i.e. no juveniles are present during this time of year, as these
will have joined the immature age class over winter. Age distribution for the non-breeding season was based on a post-
breeding census, i.e. juveniles have joined the overall population. Information on stable age distribution was derived from
Furness (2014).
Modelling Results
All models predicted higher encounter rates for the OpenHydro shrouded turbine than for the 3-bladed unshrouded turbine
and therefore the assessment of the OpenHydro turbine can be taken to cover the impacts associated with all turbines
under consideration. An overview of the modelling results for the OpenHydro shrouded turbine device for each species
and both Stages for the ERM and the CRM models is presented in Table 14.20. Change in adult annual mortality rate at
90% avoidance and associated impact magnitude are provided as well.
Typical puffin dive depths lie outside the underwater collision risk zone, explaining the predicted collision rate equating to
zero.
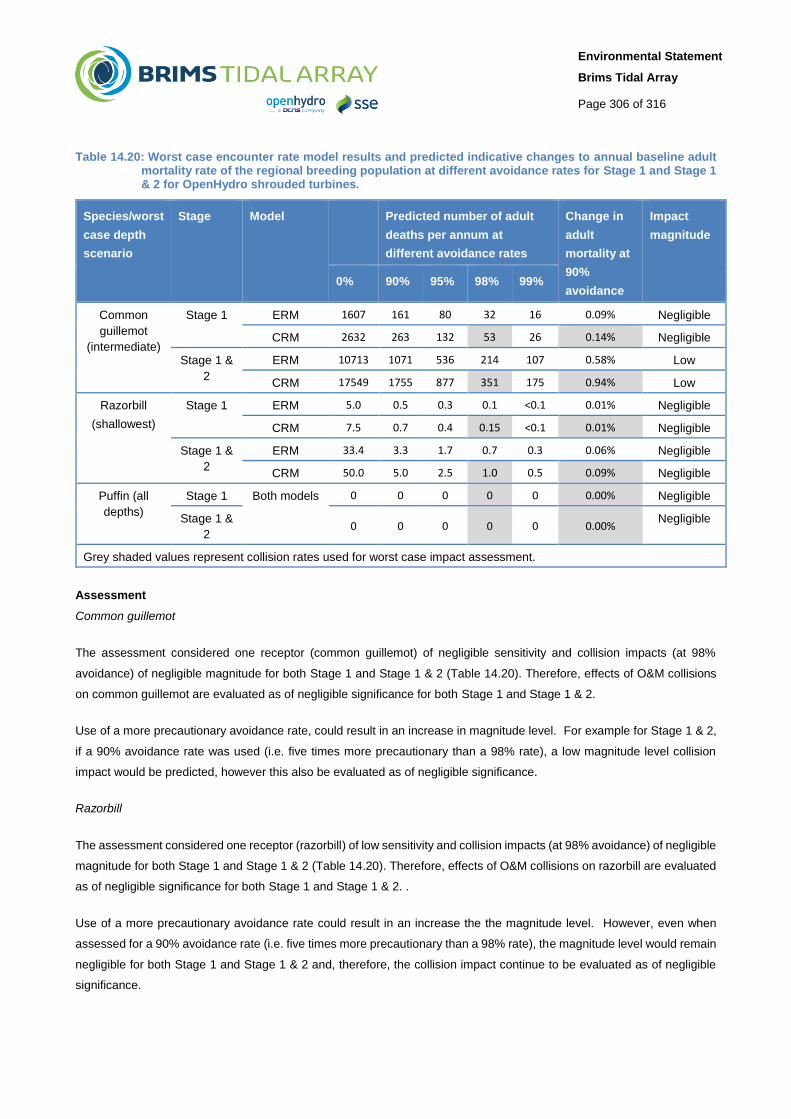
Environmental Statement
Brims Tidal Array
Page 306 of 316
Table 14.20: Worst case encounter rate model results and predicted indicative changes to annual baseline adult mortality rate of the regional breeding population at different avoidance rates for Stage 1 and Stage 1 & 2 for OpenHydro shrouded turbines.
Species/worst
case depth
scenario
Stage Model Predicted number of adult
deaths per annum at
different avoidance rates
Change in
adult
mortality at
90%
avoidance
Impact
magnitude
0% 90% 95% 98% 99%
Common
guillemot
(intermediate)
Stage 1 ERM 1607 161 80 32 16 0.09% Negligible
CRM 2632 263 132 53 26 0.14% Negligible
Stage 1 &
2
ERM 10713 1071 536 214 107 0.58% Low
CRM 17549 1755 877 351 175 0.94% Low
Razorbill
(shallowest)
Stage 1 ERM 5.0 0.5 0.3 0.1 <0.1 0.01% Negligible
CRM 7.5 0.7 0.4 0.15 <0.1 0.01% Negligible
Stage 1 &
2
ERM 33.4 3.3 1.7 0.7 0.3 0.06% Negligible
CRM 50.0 5.0 2.5 1.0 0.5 0.09% Negligible
Puffin (all
depths)
Stage 1 Both models 0 0 0 0 0 0.00% Negligible
Stage 1 &
2 0 0 0 0 0 0.00%
Negligible
Grey shaded values represent collision rates used for worst case impact assessment.
Assessment
Common guillemot
The assessment considered one receptor (common guillemot) of negligible sensitivity and collision impacts (at 98%
avoidance) of negligible magnitude for both Stage 1 and Stage 1 & 2 (Table 14.20). Therefore, effects of O&M collisions
on common guillemot are evaluated as of negligible significance for both Stage 1 and Stage 1 & 2.
Use of a more precautionary avoidance rate, could result in an increase in magnitude level. For example for Stage 1 & 2,
if a 90% avoidance rate was used (i.e. five times more precautionary than a 98% rate), a low magnitude level collision
impact would be predicted, however this also be evaluated as of negligible significance.
Razorbill
The assessment considered one receptor (razorbill) of low sensitivity and collision impacts (at 98% avoidance) of negligible
magnitude for both Stage 1 and Stage 1 & 2 (Table 14.20). Therefore, effects of O&M collisions on razorbill are evaluated
as of negligible significance for both Stage 1 and Stage 1 & 2. .
Use of a more precautionary avoidance rate could result in an increase the the magnitude level. However, even when
assessed for a 90% avoidance rate (i.e. five times more precautionary than a 98% rate), the magnitude level would remain
negligible for both Stage 1 and Stage 1 & 2 and, therefore, the collision impact continue to be evaluated as of negligible
significance.

Environmental Statement
Brims Tidal Array
Page 307 of 316
Puffin
The assessment considered one receptor (puffin) of negligible sensitivity and collision impacts (at 98% avoidance) of
negligible magnitude for both Stage 1 and Stage 1 & 2 (Table 14.20). Therefore, effects of O&M collisions on puffin are
evaluated as of negligible significance for both Stages.
Mitigation and Good Practice
No mitigation is proposed for any receptor.
Summary of Residual Impact
The residual impact will remain of the same significance for all species receptor populations as assessed above.
Table 14.21: Summary of residual effects of collision risk to diving birds from operation and maintenance
Impact Receptor Sensitivity Mitigation/good
practice
Residual
Magnitude
Residual
Significance
Collision risk to
diving seabirds
(Stage 1)
Common
guillemot
Negligible PD04 Negligible Negligible
Razorbill Low Negligible Negligible
Puffin Negligible Negligible Negligible
Collision risk to
diving seabirds
(Stage 1 & 2)
Common
guillemot
Negligible Negligible Negligible
Razorbill Low Negligible Negligible
Puffin Negligible Negligible Negligible
14.12.3 Decommissioning
14.12.3.1 Direct Disturbance
Disturbance impacts from vessels during the decommissioning phase will be similar in nature to the construction phase
(i.e. regular vessel presence), and is expected to occur over a similar period of time. It is assumed that Stage 1 and Stage
1 & 2 will be treated as a single decommissioning unit.
The assessment considered seven receptors of negligible sensitivity and direct disturbance of negligible magnitude. Given
the nature of the disturbance, which is short-term and localised, the reversibility of any effect and the moderate habitat
flexibility of most receptors (with black guillemot, low flexibility - almost exclusively foraging at the outer edge of the
AfL+1km buffer, away from decommissioning activities), effects of vessel disturbance on all these receptors across all
seasons are evaluated as a negligible impact for decommissioning of Stage 1 and Stage 1 & 2. It follows that impact
evaluation of receptors of low priority across all seasons is similarly negligible.

Environmental Statement
Brims Tidal Array
Page 308 of 316
Mitigation and Good Practice
No mitigation is required although good practice would aim to minimise disturbance to seabirds using the offshore site and
along approach routes from ports by avoiding where possible the preferred feeding and resting areas and adopting speed
restrictions. Studies elsewhere indicate the severity of disturbance by vessels is related to speed (e.g. Ronconi and
Cassady St. Clair 2002). Vessel speed limits are commonly used to limit disturbance to seabirds in the vicinity of colonies
and feeding sites; however there is no accepted maximum permissible speed. Professional judgement considers vessel
speeds of up to 15km/hr (approximately 8 knots) are likely to give most seabird species time to move away from an
approaching vessel without resorting to flight.
Good practice could for example be for construction vessels to stick to defined routes (as far as feasible) between ports
and the offshore site as a means of reducing disturbance of seabirds. Studies have shown that disturbance is reduced if
birds can predict where the disturbance will occur (Schwemmer et al. 2010). Consultation with SNH and Marine Scotland
will be undertaken to establish the extent of any measures required.
Residual Impact
Good practice measures will reduce vessel disturbance; the residual impact will remain of negligible significance for all
receptors.
Table 14.22: Summary of residual effects of direct disturbance from decommissioning
Impact Receptor Sensitivity Mitigation/good practice Residual
Magnitude
Residual
Significance
Direct
disturbance,
Stage 1 and
Stage 1 & 2
Red-throated diver Negligible Best practice measures in
relation to vessel
management to be agreed
with MSS/SNH
GM07
Negligible Negligible
Shag Negligible Negligible Negligible
Kittiwake Negligible Negligible Negligible
Common guillemot Negligible Negligible Negligible
Razorbill Negligible Negligible Negligible
Black guillemot Negligible Negligible Negligible
Puffin Negligible Negligible Negligible
All other seabirds Negligible Negligible Negligible
14.13 ACCIDENTAL AND UNPLANNED EVENTS
14.13.1 Accidental Contamination during Construction
The release of oil and other marine pollutants could have lethal and sub-lethal effects on seabirds and their prey. The
potential for seabirds to be adversely affected by oil pollution is well known. For example, the release of a relatively modest
quantity (ca 300 tonnes) of fuel oil from container ship MSC Napoli in Lyme Bay in 2007 resulted in the death or injury of
at least 3,000 seabirds (Law 2008).
A special aspect of accidental release of contaminants, especially oil, is that they can be spread by wind and currents over
very large areas and thus potentially affect birds in areas up to many tens of kilometres away from the source. For this
reason it is not possible to define an AIF, except in a very broad sense, though it is obvious that the area that might be
affected by an accidental release will depend on the magnitude of the event, the type of contaminant involved, and the

Environmental Statement
Brims Tidal Array
Page 309 of 316
prevailing weather conditions. It is also reasonable to conclude, based on the MSC Napoli incident, that even quite modest
accidental releases of oil can affect large areas. For these reasons, the emphasis is on preventing accidental release of
contaminants and having the appropriate contingency plans and equipment in place to rapidly respond and instigate
containment and clean-up operations.
The installation of tidal devices into a wider marine area – the Pentland Firth - that experiences relatively high levels of
vessel traffic, and the presence of Project vessels has the potential to increase the risk for vessel collisions or collisions
with fixed infrastructure that could result in accidental release of contaminants. These risks are assessed in detail in
Chapter 15 Shipping and Navigation. Safety zones during construction and installation will reduce the likelihood of an
incident.
Due to the high/very high sensitivity of some species, mitigation measures have been identified that will be employed to
ensure potential impacts are minimised:
An Emergency Response Cooperation Plan (ERCoP) will be prepared for the Project in line with guidance set out by
the MCA in MGN 371. This will be submitted to the MCA for comment and approval;
Notices to Mariners will be issued advising other vessels in the area of activities within the AfL area and along the
export cable corridor;
Vessels associated with all Project operations will comply with IMO/MCA codes for prevention of oil pollution and any
vessels over 400GT will have on board SOPEP’s;
Vessels associated with all Project operations will carry on-board oil and chemical spill mop up kits; and
Installation activities will only take place during suitable weather windows.
Red-throated diver, shag and black guillemot are receptor species that use the AfL or the subsea cable corridor area and
which are considered to have a very high vulnerability to accidental contamination (Table 14.5, Wiens et al. 1995). Common
guillemot, razorbill and puffin have moderate vulnerability to contamination and all other receptors (including kittiwake)
have medium vulnerability. Red-throated diver, shag and black guillemot are considered to have high sensitivity in relation
to contamination as these species are relatively sedentary year-round (with the exception of red-throated diver), have short
foraging ranges and have small regional populations. The remaining receptors are deemed to have moderate to low
sensitivity as their respective background populations are much larger as are their foraging ranges, shielding these species
somewhat from potential contamination effects.
The impact of the accidental release of contaminants from the construction phase of the Project on regional seabird
populations is assessed as short-term, unlikely to occur and negligible spatial magnitude as a result of the embedded
mitigation described above. Regional seabird populations are considered to have a low to high sensitivity to this impact for
the (small) scale of an accidental contamination event, should it occur. It is judged that this impact has negligible
significance for all seabird receptor populations under the terms of the EIA Regulations.
14.13.1.1 Mitigation and Good Practice
No further mitigation is proposed in addition to embedded pollution prevention and navigation safety mitigation, outlined
above.

Environmental Statement
Brims Tidal Array
Page 310 of 316
14.13.1.2 Residual Impact
Provided good practice guidelines are adhered to, the impacts of accidental release of contaminants on marine birds
populations will be of negligible significance for all species.
Table 14.23: Summary of residual effects of accidental contamination from construction and installation
Impact Receptor Sensitivity Mitigation/good
practice
Residual
Magnitude
Residual
Significance
Accidental
contamination,
Stage 1 and
Stage 1 & 2
Red-throated
diver
High Best practice
vessel protocols,
exclusion of non-
project vessels
from site,
contingency
plans and
specialist
facilities to deal
with incidents.
GM07, GM11,
OR01
Negligible Negligible
Shag High Negligible Negligible
Kittiwake Low Negligible Negligible
Common
guillemot
Moderate Negligible Negligible
Razorbill Moderate Negligible Negligible
Black guillemot High Negligible Negligible
Puffin Moderate Negligible Negligible
All other
seabirds
Negligible Negligible Negligible
14.13.2 Accidental Contamination during Operation and Maintenance
The potential for accidental contamination impacts to occur during the O&M phase is similar to the construction phase,
albeit the risk remains over the tidal array’s life span of 20-25 years. The assessment and embedded mitigation measures
presented above for the construction phase are therefore also applicable here. Therefore the assessment for the O&M
phase concluded that provided best practice measures are strictly adhered to, the impact of accidental contamination is of
negligible significance for all seabird receptor populations for both Stage 1 and Stage 1 & 2.
Mitigation measures have been provided as a precautionary approach to ensure this remains the case. For TECs these
include the following:
Only recognised marine standard fluids and substances will be used in the turbine hydraulic systems;
Hydraulic fluids will be mostly water based, biodegradable and be of low aquatic toxicity; and
Project specific emergency response procedures will be implemented and include contingency arrangements in the
unlikely event of a pollution incident.

Environmental Statement
Brims Tidal Array
Page 311 of 316
Table 14.24: Summary of residual effects of accidental contamination from operation and maintenance
Impact Receptor Sensitivity Mitigation/good
practice
Residual
Magnitude
Residual
Significance
Accidental
contamination,
Stage 1 and
Stage 1 & 2
Red-throated diver High Best practice
vessel protocols,
exclusion of non-
project vessels
from site,
contingency
plans and
specialist
facilities to deal
with incidents.
GM07, GM11,
GM01
Negligible Negligible
Shag High Negligible Negligible
Kittiwake Low Negligible Negligible
Common guillemot Moderate Negligible Negligible
Razorbill Moderate Negligible Negligible
Black guillemot High Negligible Negligible
Puffin Moderate Negligible Negligible
All other seabirds Negligible Negligible Negligible
14.13.3 Accidental Contamination during Decommissioning
The potential for accidental contamination impacts to occur during the decommissioning phase is similar to the construction
and O&M phases. The assessment and embedded mitigation measures presented above for both phases are therefore
also applicable here. Therefore the assessment for the decommissioning phase concluded that provided best practice
measures are strictly adhered to, the impact of accidental contamination will remain of negligible significance for all seabird
receptor populations.
Table 14.25: Summary of residual effects of accidental contamination from decommissioning
Impact Receptor Sensitivity Mitigation/good practice Residual
Magnitude
Residual
Significance
Accidental
contamination,
Stage 1 and
Stage 1 & 2
Red-throated diver High Best practice vessel
protocols, exclusion of
non-project vessels from
site, contingency plans
and specialist facilities to
deal with incidents.
GM07
GM11
OR01
Negligible Negligible
Shag High Negligible Negligible
Kittiwake Low Negligible Negligible
Common guillemot Moderate Negligible Negligible
Razorbill Moderate Negligible Negligible
Black guillemot High Negligible Negligible
Puffin Moderate Negligible Negligible
All other seabirds Negligible Negligible Negligible
Environmental Statement
Brims Tidal Array
Page 312 of 316
14.14 SUMMARY
Project design mitigation relating to the removal of surface-piercing structures of any kind removes the potential of
displacement of seabird receptors due to the presence of structures at the sea surface. Further design mitigation
involved increasing the minimum clearance distance between the rotor-swept area and LAT, substantially reducing
the potential for collision impacts on diving seabirds;
Impacts on ornithological receptors through direct habitat loss and indirect effects through changes to habitats and
associated prey species are considered to be of negligible significance due to the very minor shift away from baseline
conditions of the benthic habitat;
Disturbance and accidental contamination impacts on receptors across all Project phases are minimised through a
range of mitigation and good practice vessel management measures;
Potential collision impacts on three species of diving seabird (common guillemot, razorbill, puffin) are of sufficiently
small magnitude to avoid adverse effects at the population level.

Environmental Statement
Brims Tidal Array
Page 313 of 316
14.15 REFERENCES
BirdLife International (2000). The Development of Boundary Selection Criteria for the Extension of Breeding Seabird
Special Protection Areas into the Marine Environment. OSPAR Convention for the Protection of the Marine Environment
of the North east Atlantic. Vlissingen, The Netherlands.
Birdlife International (2011). Birdlife Seabird Foraging Database. Birdlife International. [online] Available at:
http://seabird.wikispaces.com. Accessed on 1 July 2014.
Black, J., Dean B.J., Webb A., Lewis, M., Okill D. & Reid J.B. (2015). Identification of important marine areas in the UK for
red-throated divers (Gavia stellata) during the breeding season. JNCC Report No 541.
Camphuysen, C.J., Fox, T., Leopold, M.F. & Petersen, I.K. (2004). Towards standardised seabirds at sea census
techniques in connection with environmental impact assessments for offshore wind farms in the UK. A report for COWRIE.
Dawson N., Sohle I., Wilson L.J., Dean B.J., Webb A. & Reid J.B. (2009). The numbers of inshore waterbirds using Scapa
Flow, Orkney, during the winter season; an assessment of the area's potential for qualification as a marine SPA. JNCC
Report 407.
Dillon, I.A., Smith, T.D., Williams, S.J., Haysom, S. & Eaton, M.A. (2009). Status of red-throated diver Gavia stellata in
Britain in 2006. Bird Study 56: 147-157.
Eaton, M.A., Brown, A.F., Noble, D.G., Musgrove A.J., Hearn, R., Aebischer, N.J., Gibbons, D.W., Evans, A. & Gregory,
R.D. (2009). Birds of Conservation Concern 3: the population status of birds in the United Kingdom, Channel Islands and
Isle of Man. British Birds 102: 296-341.
EMEC (2014). EMEC Fall of Warness Test Site: Environmental Appraisal. European Marine Energy Centre.
Forrester, R.W., Andrews, I.J., McInerny, C.J., Murray, R.D., McGowan, R.Y., Zonfrillo, B. & Grundy, D.S. (2007). The
Birds of Scotland. Aberlady: The Scottish Ornithologists’ Club.
Furness, R.W., Wade, H.M., Robbins, A.M.C., & Masden, E.A. (2012). Assessing the sensitivity of seabird populations to
adverse effects from tidal stream turbines and wave energy devices. - ICES Journal of Marine Science 69: 1466-1479.
Furness, R.W., Wade, H.M. & Masden, E.A. (2013). Assessing vulnerability of marine bird populations to offshore wind
farms. Journal of Environmental Management 119: 56-66.
Furness, R.W. (2014). Biologically appropriate, species-specific, geographic non-breeding season population estimates
for seabirds. MacArthur Green. MGL/RWF/23-09-2014/v3.2. 30 September 2014.
Garthe, S. & Hüppop, O. (2004). Scaling possible adverse effects of marine windfarms on seabirds: developing and
applying a vulnerability index. J. Ap. Ecol. 41: 724-734.
Harris, M.P., Anker-Nilssen, T., McCleery, R.H., Erikstad, K.E., Shaw, D.N. & Grosbois, V. (2005). Effect of wintering area
and climate on the survival of adult Atlantic puffins Fratercula arctica in the eastern Atlantic. Marine Ecology Progress
Series, 297.

Environmental Statement
Brims Tidal Array
Page 314 of 316
Harris, M.P., Heubeck, M., Newell, M.A. & Wanless, S. (2015). The need for year-specific correction factors (k values)
when converting counts of individual Common Guillemots Uria aalge to breeding pairs, Bird Study, DOI:
10.1080/00063657.2015.1017444.
Harris, M.P., Newell, M.A. & Wanless, S. (in prep) The use of k values to convert counts of individual Razorbills Alca torda
to breeding pairs.
IEEM (2010). Guidelines for ecological impact assessment in Britain and Ireland – Marine and Coastal. Institute of Ecology
and Environmental Management.
Jackson, D.J. & Whitfield, P. (2011). Guidance on survey and monitoring in relation to marine renewables deployments in
Scotland. Volume 4. Birds. Unpublished draft report to Scottish Natural Heritage and Marine Scotland.
JNCC (2014). Seabird Population Trends and Causes of Change: 1986-2013 Report (http://www.jncc.defra.gov.uk/page-
3201). Joint Nature Conservation Committee. Updated August 2014. Accessed 01 June 2015.
Kober, K., Webb, A., Win, I., Lewis, M., O’Brien, S., Wilson, L. & Reid, J.B. (2010). An analysis of the numbers and
distribution of seabirds within the British Fishery Limit aimed at identifying areas that qualify as possible marine SPAs.
JNCC Report No. 431.
Lahoz-Monfort, J.J., Morgan, B.J.T., Harris, M.P., Wanless, S. & Freeman, S.N. (2011). A capture-recapture model for
exploring multi-species synchrony in survival. Methods in Ecology and Evolution, 2, 116–124.
Law, R. (2008). Environmental monitoring conducted in Lyme Bay following the grounding of MSC Napoli in January 2007,
with an assessment of impact. Sci. Ser. Aquat. Environ.Monit. Rep., Cefas Lowestoft 61: 36pp.
Lawson, J., Kober, K., Win, I., Bingham, C., Buxton, N.E., Mudge, G., Webb, A., Reid, J.B., Black, J., Way, L. & O’Brien,
S. (2015). An assessment of numbers of wintering divers, seaduck and grebes in inshore marine areas of Scotland. JNCC
Report No 567. JNCC, Peterborough.
McCluskie, A.E., Langston R.H.W. & Wilkinson N.I. (2012). Birds and wave and tidal stream energy: an ecological review.
Meade, J., Hatchwell, B.J., Blanchard, J.L. & Birkhead, T.R. (2013). The population increase of common guillemots Uria
aalge on Skomer Island is explained by intrinsic demographic properties. Journal of Avian Biology, 44, 055–061.
Mitchell, P. I., Newton, S. F., Radcliffe, N. & Dunn, T. E. (2004). Seabird Populations of Britain and Ireland: Results of the
Seabird 2000 Census 1998-2002. T. & A. D. Poyser, London.
Reynolds, T.J., Harris, M.P., King, R., Swann, R.L., Jardine, D.C., Frederiksen, M. & Wanless, S. (2011). Among-colony
synchrony in the survival of common guillemots Uria aalge reflects shared wintering areas. Ibis, 153, 818–831.
Rojek, N.A., Parker, M.W., Carter, H.R. & McChesney G.J. (2007). Aircraft and vessel disturbances to common murres at
breeding colonies in central California 1997-1999. Marine Ornithology 35: 61-69.

Environmental Statement
Brims Tidal Array
Page 315 of 316
Ronconi, R. & Cassady St. Clair, C. (2002). Management options to reduce boat disturbance on foraging black guillemots
(Cepphus grylle) in the Bay of Fundy. Biological Conservation 108, 265-271.
Schwemmer, P., Mendel, B., Sonntag, N., Dierschke, V. & Garthe, S. (2010). Effects of ship traffic on seabirds in offshore
waters: implications for marine conservation and spatial planning. Ecological Applications.
Scottish Government (1999). EIA methods in Scotland guidance.
Scottish Natural Heritage (SNH) (2009). A Handbook on Environmental Impact Assessment; Guidance for competent
authorities, consultees and others involved in the Environmental Impact Assessment process in Scotland, 3rd Edition.
Prepared for SNH by Tyldesley, D. and Associates, Edinburgh.
Scottish Natural Heritage (2012). Seabirds in Scotland. Trend Note No. 021.
SNH (2015). Assessing collision risks between underwater turbines and marine wildlife: guidance on using three models.
Draft report and accompanying calculation spreadsheets. Scottish Natural Heritage June 2015.
Snow, D.W. & Perrins, C.M. (editors) (1998). The Birds of the Western Palaearctic, Concise Edition (Volume 2). Oxford
University Press, Oxford.
Stone, C. J., Webb, A., Barton, C., Ratcliffe, N., Reed, T. C., Tasker, M. L., Camphuysen, C. J. & Pienkowski, M. W. (1995).
An atlas of seabird distribution in north west European waters. Table 3.5, p30. Joint Nature Conservation Committee,
Peterborough, UK.
Swann, R. (2013). Marine Protected Areas and Marine Renewable - related black guillemot surveys. Scottish Natural
Heritage Commissioned Report No. 612.
Swann, R. (2014). Marine Protected Area – related black guillemot surveys 2014. Scottish Natural Heritage Commissioned
Report No. 792.
Taylor, C., Baer, J., Boyle, D. & Perrins, C.M. (2010). Seabird Monitoring on Skomer Island in 2010. Joint Nature
Conservation Committee, Peterborough.
Thaxter, C. B., Lascelles, B., Sugar, K., Cook, A. S. C. P., Roos, S., Bolton, M., Langston, R. H. W. & Burton, N. H. K.
(2012). Seabird foraging ranges as a tool for identifying candidate Marine Protected Areas. Biological Conservation. doi:
10.1016/j.biocon.2011.12.009.
The Crown Estate (2012). Pentland Firth and Orkney Waters – Enabling Actions Report. The Crown Estate, Edinburgh.
Velando, A. & Munilla, I. (2011). Disturbance to a foraging seabird by sea-based tourism: Implications for reserve
management in marine protected areas. [online] Available at:
http://www.researchgate.net/publication/223940175_Disturbance_to_a_foraging_seabird_by_sea-
based_tourism_Implications_for_reserve_management_in_marine_protected_areas.

Environmental Statement
Brims Tidal Array
Page 316 of 316
Waggitt, J.J., Allcock, Z., Furness, R.W., Jackson, A.C., Masden, E., Robbins, A.M.C., Wade, H.M. & Scott, B.E. (In Prep).
Predicting interactions between seabirds and tidal stream turbines using a meta-analysis approach.
Wernham, C.V., Toms, M.P., Marchant, J.H., Clark, J.A., Siriwardena, G.M. & Baillie, S.R. (2002). The Migration Atlas:
movements of the birds of Britain and Ireland. T. & A.D. Poyser, London.
Wiens, J.A. & Parker, K.R. (1995). Analyzing the effects of accidental environmental impacts: approaches and
assumptions. Ecological Applications 5: 1069-1083.
Wilson, B. Batty, R. S., Daunt, F. & Carter, C. (2007). Collision risks between marine renewable energy devices and
mammals, fish and diving birds. Report to the Scottish Executive. Scottish Association for Marine Science, Oban, Scotland,
PA37 1QA.