Environmental Science & Technology 1972 vol.6 no.1
103
-
Upload
khangminh22 -
Category
Documents
-
view
0 -
download
0
Transcript of Environmental Science & Technology 1972 vol.6 no.1


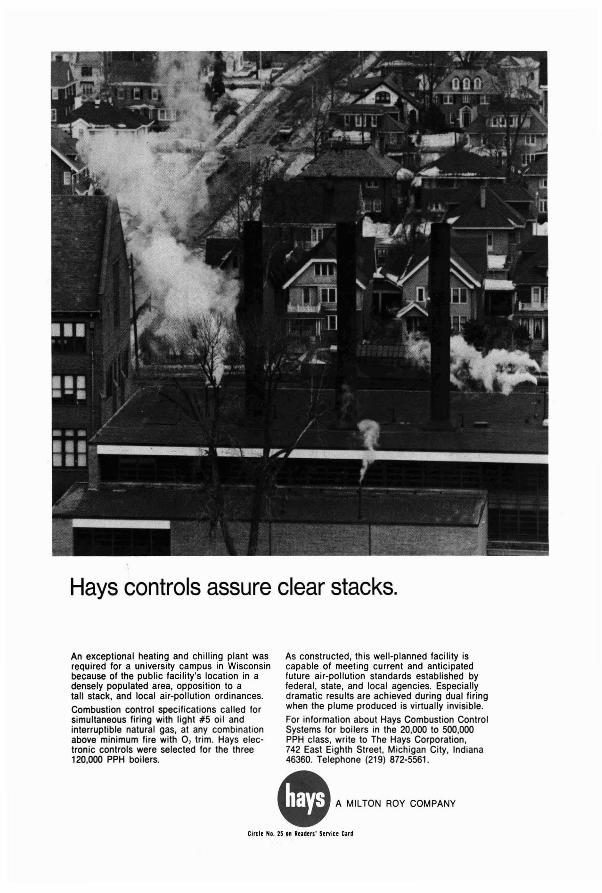
An exceptional heating and chilling plant wasrequired for a university campus in Wisconsinbecause of the public facility's location in adensely populated area, opposition to atall stack, and local air-pollution ordinances.
Combustion control specifications called forsimultaneous firing with light #5 oil andinterruptible natural gas, at any combinationabove minimum fire with 0, trim. Hays electronic controls were selected for the three120,000 PPH boilers.
Hays controls assure clear stacks.
As constructed, this well-planned facility iscapable of meeting current and anticipatedfuture air-pollution standards established byfederal, state, and local agencies. Especiallydramatic results are achieved during dual firingwhen the plume produced is virtually invisible.
For information about Hays Combustion ControlSystems for boilers in the 20,000 to 500,000PPH class, write to The Hays Corporation,742 East Eighth Street, Michigan City, Indiana46360. Telephone (219) 872-5561 .
• A MILTON ROY COMPANY
Circle No. 25 .In Readers' Service Card
EnvironmentalScience & Technology
Volume 6, Number 1January 1972ESTHAG 6(1) 1-98 (1972)
Eentor: James J. Morgan
WASHINGTON EDITORIAL STAFF
Managing Editor: D. H. Michael Bowen
Associate Editor: Stanton S. MillerAssistant Editor: H. Marlin Malin, Jr.Editorial Assistant: Carol Knapp Lewicke
MANUSCRIPT REVIEWING
Assistant Editor: Norma Yess
MANUSCRIPT EDITING
Associate Prbduction Manager:Charlotte C. Sayre
Editorial Assistant: Julie Plumslcad
ART AND PRODUCTION
Director of Design: Joseph JacobsProduction Manager: BacH GuilcyAssociate Production Manager:
Leroy L. CorcoranArt Director: Norman Favin
Layout and Production: Dawn Leland
contents
Features
30 Lead pollution and poisoning
by Stephen Hall, Southern Illinois University
36 Water uses and waste in the textile industry
by John Porter, Donald Lyons, and William Nolan
Clemson University
Interview
16 Research-Cottrell's chief executive John Schork talks about
his company's slice of the environmental management pie
Outlook
20 Turn-key plan for building sewage plants merits a test
23 Project Threshold checks validity of air pollution tests
25 Ever wonder what happens to waste lube oil? So does EPA
27 Congress wrestles with surface-mining legislation
Advisory Board: B.. F. Christman, G. F.Hidy, P. L. McCarty, J. C. Morris, DavidJenkins, P. K. Mueller, Charles R. O'Melia,J. N. Pitts, Jr., Jon W. Winchester
AMERICAN CHEMICAL SOCIETY1155 Sixteenth St., N.W.Washington, D.C. 20036Executive Director: Frederick T. Wall
Books and Journals DivisonDirector (Acting): John K Crum
Head, Business Opcf<ltions Dept.:Joseph H. Kuney
Group Manager. Publications:D. H. Michael Bowen
Assistant to the Director: Ruth Reynard
ADVERTISING MANAGEMENT
Century Communications Corp.For offices and advertisers, sec page 96.
Please send research manuscripts to Manuscript Reviewing, feature manuscripts toManaging Editor.
For author's guide and editorial policy. seeApril 1970 issue, page 303 or write Manuscript Reviewing. ]n each' paper with morethan one author, the name of the author towhom inquiries should be addressed carries anumbered footnote reference.
Departments
Letters 4
Editorial 7
Currents 9
Industry trends 82
New products 84
New literature 86
Bookshelf 88
Meeting guide 90
Professional consulting services 93
Classified section 96
IfjCopy,ight 1971 by the American Chemical SocietyES&T ON M.ICROFILM: ThiS pubhcatlon is available on
microfilm. For mformatlon, write to: MIcrofilm, SpeCial IssuesSales. ACS, 11 St., N.W., Washington, D.C. 20036
SUBSCRIPTIhandling of sOF ADORES;:;,
ma."y required for postal delivery of journal and c aim. Noc!alms allowed because of faIlure fO notify the Subscription Se..·vice Department of a change of address, or because copy,s"mlssmg from files:'
Those mterested in joining the American Chemical Societyshould write to Admissions Department at the WashingtonOffice.
Published monthly by the American Chemical Society. from20th and Northampton Sis., Easlon. Pa. 1804~. EKecutiveOff,ces. Editorial Headquarters. and Subscription ServiceDepartment, 1155 SiKteenth St., N.W., Washington. D.C.20036. Advertising Office: 142 East Ave.. Norwalk. Conn. 06851..Second·class postage paid at Washington, D.C. and at addl·tional mailing offices.
The American Chemical. S.ociety assumes no responsibility~or the statements and opmlons advanced by conttlbutors tolis publicilloons.
Current research contents 2
Volume 6, Number 1, January 19721# ... •
~fII.:l~tl~ fl'" 1,QV1U~IIl'2 6ta\.u. L~D
Current research
Measurement of suspended solids concentrations in sewageusing a depolarization method 43
J. W. Liskowitz and G. J. Franey
The concentration of suspended solids in sewage in the rangeof a few parts to 5000 ppm can be measured by this method.The degree of depolarization is unaffected by other parameterssuch as size distribution of articles, density variations, sourceof samples (industrial or municipal), color variations, and otheritems in sludge samples. Perhaps, the degree of polarizationis the result of averaging or cancellation of efforts.
Gaseous bromine and particulate lead, vanadium and bro-mine in a polluted atmosphere '68
J. L. Moyers, W. H. Zoller, R. A. Duce, and G. L. Hoffman
Atmospheric concentrations of bromine are less than sus·pected from the amounts of bromine added to ethyl gasoline.A significant portion of the bromine produced by the combus·tion of leaded gasoline can be released to the gaseous phase.But gaseous and particulate species may have different at·mospheric resident times or the collection procedure may discriminate against a particular form of atmospheric bromine.
H. W. Sidebottom, C. C. Badcock, G. E. Jackson, J. G. Calvert,G. W. Reinhardt, and E. K. Damon
The first stage of studies for removing SO, from the atmospherevia homogeneous paths is described. Theoretical maximumrates of photochemical oxidation of SO, are presented. Thesedata should be useful in determining the importance of alternative homogeneous or heterogeneous removal mechanismsfor specific atmospheric systems.
Development and validation of a generalized mechanism forphotochemical smog 47
T. A. Hecht and J. H. Seinfeld
A 15·step mechanism is proposed for the formation of photo·-chemical smog, but it is by no means a unique model. Themechanism accurately simulates the effect of carbon monoxideon smog chamber photoxidation kinetics and the inhibitory ef·feet of high initiation concentration of nitric oxide on the maximum concentration of ozone attained. The role of sulfur oxidesand the generation of photochemical aerosols are not included.
Photooxidation of sulfur dioxide 72
79
A numerical method for computing equilibria in aqueouschemical systems 58
F. M. Morel and J. J. Morgan
A computer program has been developed which covers thechemical reactions in aqueous chemical systems. The programuses the stability constant approach and the Newton-Raphsonmethod for digital computation of equilibria. An applicationof the program is presented for a system of 780 soluble species,64 possible solids, and one gas· phase component.
2 Environmental Science & Technology
Correction
Effect of peroxyacetyl nitrate (PAN) in vivo on tobacco leafpolysaccharide synthetic pathway enzymes 71
L. Ordin, M. J. Garber, J. I. Kindinger, S. A. Whitmore, L. C.Greve, and O. C. Taylor
This article appeared originally in ES&T, July 1971, P 621
Communication
Proton activation analysis for trace elements
S. Fiarman and G. Schneier
Bombarding water samples with a proton beam from a Van derGraff accelerator can be used to determine trace elementsin water samples at the ppb level. Typical measurements include phosphorus at the 28·ppb level, nitrogen at 190-ppb level,sulfur at 50·ppb level, and fluoride and sodium at the 0.1-1.0·ppb level.
Photo credits: 13, Manley; 16, 18, Bill Binzen; 30, 36, Joe Phillips.Cover: Norman Favin

i I
We'U go almost anywhereto solve your in-plant pollution problems.
In the last five years alone, we've wonover 1,000 battles against in-plantdust, vapor, fume, gas and noisepOllution,
Now we're making our servicesavailable to every other firm thathas those problems, It's JohnsManville's Industrial HygieneEngineering Services: 30 pollutioncontrol specialists, with moreexperience than you could find almostanywhere else in the world, backedup by 50 engineers, scientists andtechnicians and one of the world'sgreat industrial research centers.
You don't have to staff up to solvethe problems you're facing as a resultof the new Federal OccupationalSafety and Health Act. On a fee basis,
our staff will go almost anywherethey're needed. Here's what they canprovide:1. In-plant surveys of dusts, fibers,
vapors, fumes and gases, includingsampling and analysis;
2. In-plant noise surveys;3. Corrective recommendations,
including equipment specificationsand estimated costs;
4. Detailed designs, specificationsand bills of materials for noise orair pollution-control systems;
5. Complete, turn-key supervision ofconstruction and installation ofcontrol equipment;
6. Monitoring services;7. Organization of your own
industrial hygiene department.Cirel, NI. 17 H .,."'S· S,nice Ca'~
The accent is on services. Whateveryou need, I.H.E.S. can provide.
It won't cost you any more than aphone call or a letter to find out howJohns-Manville's I.H,E.S..can help you:write Johns-Manville, IndustrialHygiene Engineering Services,Environmental Control SystemsDivision, Box 5705-HF, Denver,Colorado 80217.
Johns-Manville !m1Volume 6, Number I, January 1972 3
lettersAdsorption of solvent vapors
DEAR, SIR:After reading your article in the
November 1971 issue of EnvironmentalScience & Technology on "Solventvapors under fire," (p 1086), we werequite disappointed that nothing wasmentioned about carbon adsorptionfor controlling hydrocarbon emissionsfrom industrial processes.
Our company has been manufacturingcarbon adsorption equipment for recovery and reuse of solvents for over20 years and has more than 10,000units installed throughout the world.We are experienced with recoveringchlorinated solvents 'and many othersused in industrial finishing and processing. We have units installed indry-cleaning plants, metal degreasing,all the way to printing operations. Mostof these solvents can be recycled andreused as they come from our system.
The Environmental Protection Agencyhas made very clear that control ofexisting solvents is more desirablethan substituting the "less reactive"
or "nonreactive solvents" mentionedin your article, because there is evidencethat no solvent is nonreactive. Theyhave stated this in the Federal Register,Volume 36, No. 158, dated August 14,1971, under Title 42, Chapter 4, Appendix B, Section 4.0, Control of OrganicCompound Emissions. Under Section4.6 they state that reduction of at least85 % can be accomplished by: (A)Incineration and (B) Carbon adsorption.
We believe your article could havehad a more positive approach to theproblem of solvent control if carbonadsorption had been mentioned.
Dennis M. LarsonVic Manufacturing Co.Minneapolis, Minn. 55413
• AI Gaber of Calgon Corp. has alsowritten us to make the same point-Ed.
Haste and waste
DEAR SIR:Dr. Abel Wolman (Viewpoint, Octo
ber 1971, ES&T, P 981) quoted PubliliusSyrus to the effect that haste (on thepart of "vociferous groups") makeswaste (in environmental improvement).
His quotation could not be more
apropos to the sewage CriSIS in theWashington, D.C. metropolitan area.However, it should be clarified thatnot all the haste is attributable tovociferous groups. Much waste indeedhas originated from such public agenciesas the Washington Suburban SanitaryCommission (wssc) of Maryland, whichhas until recently always hastened toapprove sewer hookups regardless ofthe quality of treatment available.This policy has resulted in heavyoverloading of all sewage treatmentplants in the area and the well-knownsituation on the Potomac River.
The situation has become so badthat our citizen group recently tooklegal action against this agency. I thinkit is pertinent to mention that Dr.Wolman has been the chief consultantof wssc and that he has consistentlyfavored large-volume over high-qualitytreatment. Consequently, citizens havebeen forced to attribute a certainamount of haste to his own actions.
Robert F. MuellerPrince George's (Maryland)Environment CoalitionLanham, Md. 20801
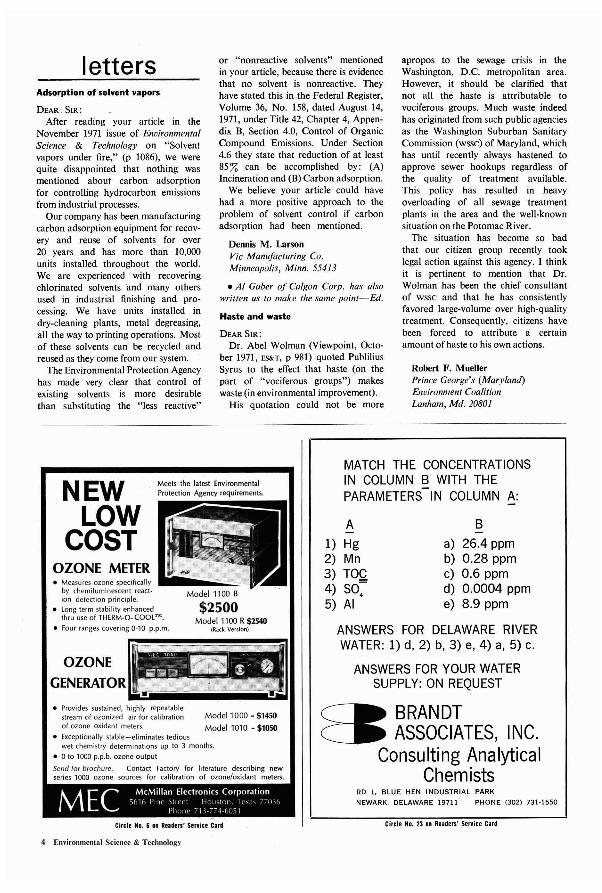
B
a) 26.4 ppmb) 0.28 ppmc) 0.6 ppmd) 0.0004 ppme) 8.9 ppm
MATCH THE CONCENTRATIONSIN COLUMN B WITH THEPARAMETERS IN COLUMN A:
A
1) Hg2) Mn3) TO~
4) SO~5) AI
ANSWERS FOR DELAWARE RIVERWATER: 1) d, 2) b, 3) e, 4) a, 5) c.
ANSWERS FOR YOUR WATER, SUPPLY: ON REQUEST
C. BRANDTC. ASSOCIATES, INC.
Consulting AnalyticalChemists
Model 1000 - $1450
Model 1010 - $1050
Meets the latest EnvironmentalProtection Agency requirements.NEW
LOWCOST
• Provides sustained, highly repeatablestream of ozonized air for calibrationof ozone oxidant meters.
• Exceptionally stable-eliminates tediouswet chemistry determinations up to 3 months.
• 0 to 1000 p.p.b. ozone output
Send for brochure. Contact Factory for literature describing newseries 1000 ozone sources for calibration of ozone/oxidant meters.
• Measures ozone specificallyby chemiluminescent reaction detection principle.
• long term stability enhancedthru use of THERM·O_COOl™.
• Four ranges covering 0-10 p,p.m.
OZONE METER
Circle No.6 on Readers' Service Card
RD I. BLUE HEN INDUSTRIAL PARK
NEWARK, DELAWARE 19711 PHONE (302) 731·1550
Circle No. 23 on Readers' Service Card
Environmental Science & Technology
Just off the press8~ x 11 EditionBound _~
.~~....~,..;,;;;;~,....-
ECO~~fJr~
ECOLOGYUSAe1971The complete authoritativeecology uews annual
Over 600 edition-bound pages about:Air Pollution, Water Pollution, Conservation, Recycling, Pesticides,Noise Pollution, Radiation, Population, Agriculture, Public Health,Housing, Energy, Solid Waste Disposal, the SST, Alaska Pipeline,Detergents, Amchitka.
This volume contains every newsworthy environmentalevent that took place in 1971 reported chronologically.
Biographical sketches of:David R. Brower, Sen. Frank Church, Edward P. Cliff, Rene Dubos,Jerome Kretchmer, Rogers C. B. Morton, Sen. Edmund S. Muskie,John N. Nassikas, Sen. Gaylord Nelson, Sen. William Proxmire,Elliot L. Richardson, George W. Romney, William D. Ruckelshaus,Ernest S. Starkman, Russell E. Train, John Volpe, Ralph R. Widnerand others.
Highlights of:President Nixon's State of the Union Message and Fiscal 1972 Budgetdealing with the environment, Second Annual Report of the Councilon Environmental Quality, National Science Board Report to thePresident, Report of the National Industrial Pollution Control Council.
Excerpts from environmental speeches by:PreSident Nixon, William D. Ruckelshaus, Dr. Glenn T. Seaborg, Dr.Barry Commoner, Dr. Bentley Glass, Stewart Udall, Dr. James R.Schlesinger, Dr. Edward Teller, John H. Chafee, John Lindsay, andmany others.
Book Reviewsof almost 100 new ecologically-oriented books published in 1971.
Complete text of such important laws as:National Environmental Policy Act, Environmental Quality Improvement Act, Federal Water Pollution Control Act, Solid Waste DisposalAct, Clean Air Act, National Emission Standards Act, Refuse Act of1899, Fish and Wildlife Coordination Act, and amendments.
Ecology meetings & seminars:The most important in 1971 and a preview of 1972.
Complete names & subjects index
Directory of companies'manufacturing products or supplying services for environmentalimprovement; listing offederal and state agencies concerned withenvironmental problems and programs.
••••••••••••••••••••••••••••••••••••••••••••••• ! ••••••••••••
Please mail to
SPECIAL REPORTS INC280 Madison Avenue New York, NY10016
Please accept our order for__copies of
ECOLOGY USA 1971 at $125.00 each.
o Payment enclosed
o Bill us
address
city/statelzip
authorized signature
Circle NI. 13 on Readers' Service Card
Volume 6, Number 1, January 1972 5
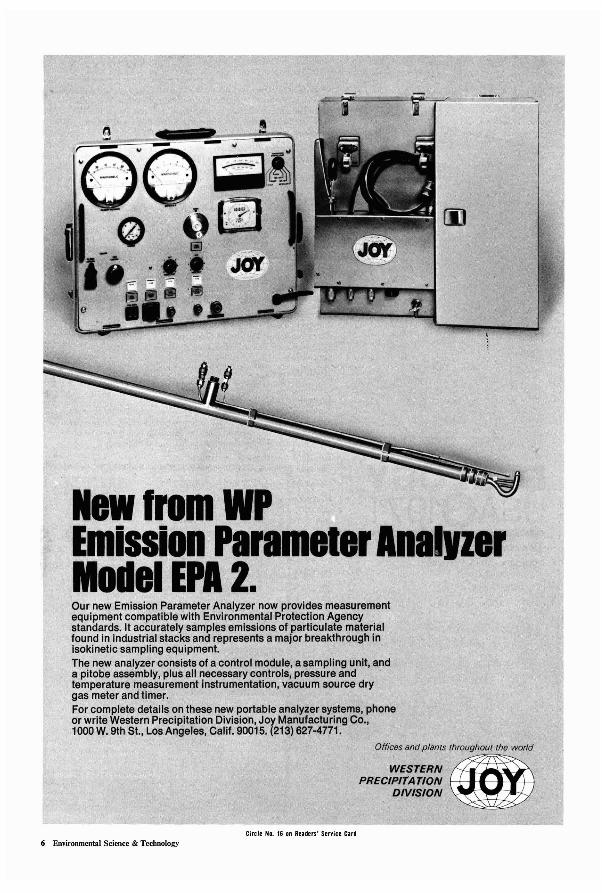
lewlroAlWPEmission Parameter AnallzerModel EPA 2.Our new Emission Parameter Analyzer now provides measurementequipment compatible with Environmental Protection Agencystandards. It accurately samples emissions of particulate materialfound In industrial stacks and represents a major breakthrough inisokinetic sampling equipment.The new analyzer consists of a control module, a sampling unit, anda pitobe assembly, plus all necessary controls, pressure and .temperature measurement instrumentation, vacuum source drygas meter and timer.For complete details on these new portable analyzer systems, phoneor write Western Precipitation Division, Joy Manufacturing Co.,1000 W. 9th St., Los Angeles, Calif. 90015. (213) 627-4771.
Offices and plants throughout the world
WESTERN.PRECIPITATION
DIVISION .
Circle No. 16 on Readers' Service Card6 Em'ironmental Science & Technology
editorial
Playing the environmental numbers game
It's time for those who make measurements and those
who use them to start communicating with one another
Le average man-in-the-street, if thereis such an animal, has a longstanding love affairwith numbers. Percent completions, games behind,yards rushing, earned run averages,' you nameit, your average man will rattle it off. And now hehas a new figure to relish-the pollution index. Locally, newspapers, radio, and TV publish an air pollution index-parts per million of oxidant (in the summer)or sulfur dioxide (in the winter) in the air for the previous day. We've often wondered what John Q. Publicthinks-if he even notices-when the index makes itstwice-yearly shift from one criterion of pollution to theother. If he doesn't notice the changing basis for theindex, then he'lis really not being much less scientificabout numbers than people who ought to know better.
For there is an awful lot of monkey businets being played with numbers, especially now tiat apenchant for being at least superficially quantitative hasarrived on the environmental scene. It used to be thatterms like "zero tolerance," "zero residue," and the likereally meant something useful. Now that the technologyof measurement has become highly refined, "zero" is anumber that can hardly be believed, let alone writteninto some sort of regulation.
Apart from the semantic mischief that canbe wreaked on even accurate numbers-a half-emptybottle can be accurately described as half full, for instance-the most dangerous aspect of numbers appearsto be that they are rarely quoted with an indication ofhow they were measured. While such qualifications arethe stock-in-trade of technical papers such as thoseES&T publishes each month, it is rarely that numbers areaired in public forums with even the slightest referenceto their accuracy or applicability. Typically, one groupmight argue that lead in the air is' on the increase whileanother maintains that it is declining. Both could be~ight, but we'll never know until we discover how each
group made its measurements, where and when. Quitecommonly we would find that neither group actuallymade any measurements but instead used someoneelse's numbers.
It is perhaps critically important that legislators and regulation setters recognize that there ismore in a number than meets the eye. The history ofregulations regarding the permissible emissions fromauto exhausts is fraught with good examples of thispoint. Practically every time the U.S. government hasrecommended a new test method for a pollutant, thestandard for that pollutant has had to change becauseevery method seemed to give different results.
That sampling and measurem~nt techniques have their drawbacks is widely recognized in"thetechnical community, of course. (See the story onASTM'S Project Threshold on page 23 of this issue, for anexample.) But it is by no means so clear that the laypublic understands the situation. As an example, consider the case of carbon monoxide alerts in Los Angeles;the number of these alerts is up sharply in 1971. Thesimple explanation is that the concentration at which analert is called has been reduced from 100 to 50 ppm. Butan impression of rapidly rising atmospheric CO levelsmay remain nonetheless.
If numbers are going to be used as thegoals of a clean environment-and promulgation ofemission limits, performance standards, and all the restof the paraphernalia of regulatory agencies indicatesthat they are-then the numbers game is too importantto be left to those with no knowledge of analysis andmeasurement. Analysts and other number-getters willhave to abandon their traditional independent stancesand start mixing it with the number-users. The conflictmay be a bruising one, but the cause is just.
~.~.~g."........
Volume 6, Number I, January 1972 7
WASHINGTON
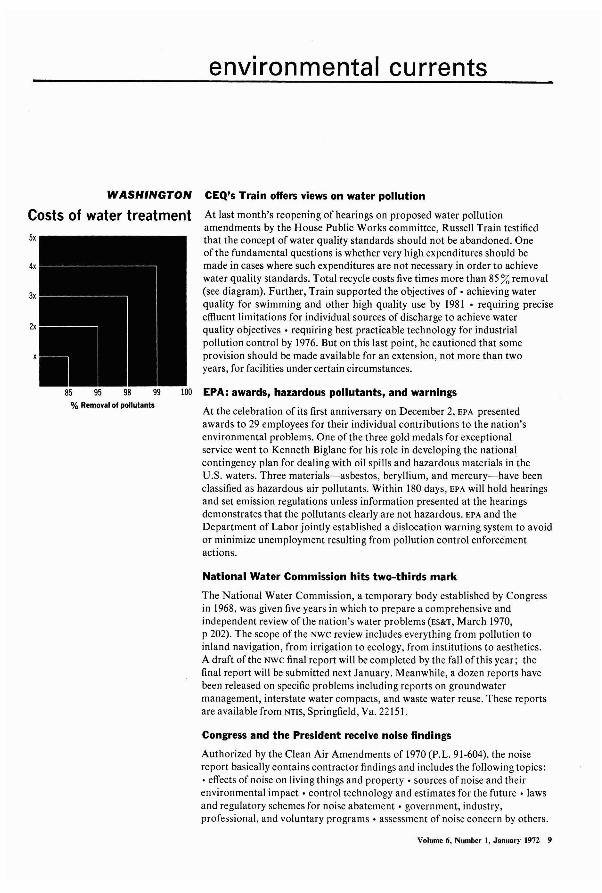
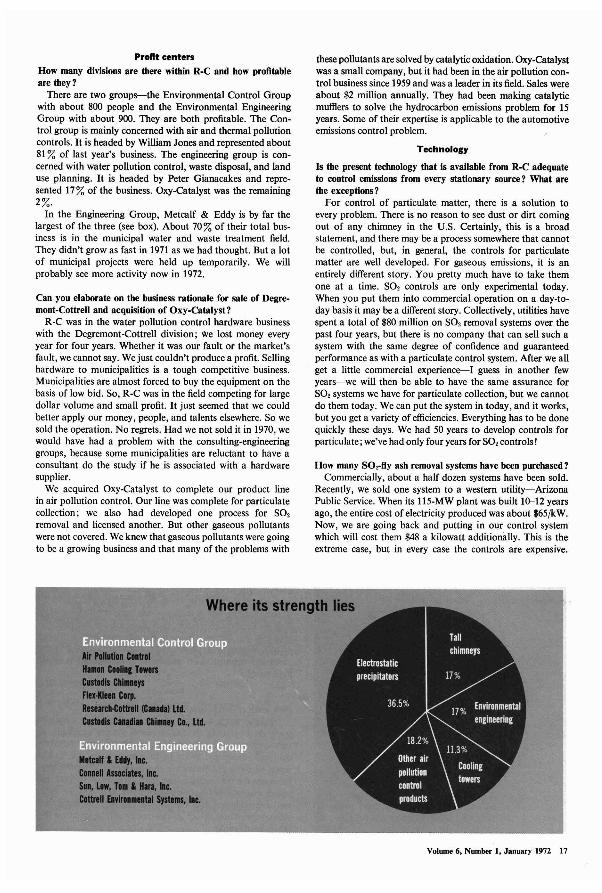
Costs of water treatment
% Remoyal of pollulanls
5x
4x
3x
2x
85 95 98 99
environmental currents
CEQ's Train offers views on water pollution
At last month's reopening of hearings on proposed water pollutionamendments by the House Public Works committee, Russell Train testifiedthat the concept of water quality standards should not be abandoned. Oneof the fundamental questions is whether very high expenditures should bemade in cases where such expenditures are not necessary in order to achievewater quality standards. Total recycle costs five times more than 85 %removal(see diagram). Further, Train supported the objectives of. achieving waterquality for swimming and other high quality use by 1981 • requiring preciseeffluent limitations for individual sources of discharge to achieve waterquality objectives. requiring best practicable technology for industrialpollution control by 1976. But on this last point, he cautioned that someprovision should be made available for an extension, not more than twoyears, for facilities under certain circumstances.
100 EPA: awards, hazardous pollutants, and warnings
At the celebration of its first anniversary on December 2, EPA presentedawards to 29 employees for their individual contributions to the nation'senvironmental problems. One of the three gold medals for exceptionalservice went to Kenneth Biglane for his role in developing the nationalcontingency plan for dealing with oil spills and hazardous materials in theU.S. waters. Three materials-asbestos, beryllium, and mercury-have beenclassified as hazardous air pollutants. Within 180 days, EPA will hold hearingsand set emission regulations unless information presented at the hearingsdemonstrates that the pollutants clearly are not hazardous. EPA and theDepartment of Labor jointly established a dislocation warning system to avoidor minimize unemployment resulting from pollution control enforcementactions.
National Water Commission hits two-thirds mark
The National Water Commission, a temporary body established by Congressin 1968, was given five years in which to prepare a comprehensive andindependent review of the nation's water problems (ES&T, March 1970,p 202). The scope of the NWC review includes everything from pollution toinland navigation, from irrigation to ecology, from institutions to aesthetics.A draft of the NWC final report will be completed by the fall of this year; thefinal report will be submitted next January. Meanwhile, a dozen reports havebeen released on specific problems including reports on groundwatermanagement, interstate water compacts, and waste water reuse. These reportsare available from NTIS, Springfield, Va. 22151.
Congress and the President receive noise findings
Authorized by the Clean Air Amendments of 1970 (P.L. 91-604), the noisereport basically contains contractor findings and includes the following topics:• effects of noise on living things and property' sources of noise and theirenvironmental impact· control technology and estimates for the future· lawsand regulatory schemes for noise abatement· government, industry,professional, and voluntary programs· assessment of noise concern by others.
Volume 6, Number I, January 1972 9

. ---- ~-~*-i :.~I ~1!~~~
• i 1)(1 =0-- aOiiiiiiii'
"-f" (!) ~n:::f0 1) -r ..:K~i::6;tal%
•are you growIngpearls?
If so, nobody's likely to accuse you ofpolluting. But can you say the same about
your process? You can with a DOHRMANNanalyzer. It lets you take a hard look at
any process that might cause environmentalproblems-before you get in trouble.
"The DOHRMANN" determines total nitrogen,sulfur, or halogen in less than 5 minutes.
It's so sensitive you can detectas little as 40 parts per billion
(1 x 10-' grams) of total nitrogenin water. Because the system
is specific for either N, S, orhalogen, it provides easily interpreted
quantitative results.
The DOHRMANN MicrocoulomemcTitrating System handles a wide
range of materials-gases, highvolatiles, liquids and solids. Natural
gas, !petals, pesticides, wastewater,seawater, or brine pose no problems.
Air contaminants? An ideal companionfor the Titrating System is the
DOHRMANN 2460 gas chromatographwhich delivers separated constituents to the MCTS
for rapid analysis. Use the two instruments together and you'llhave a system that can't be matched for sensitivity and versatility.
Prices start at $6500 for the MCTS and $2125 for the G.C. For applicationnotes, reprints, evaluation testing or ordering info contact
DOHRMANN Division, Envirotech Corporation, 1062 Linda Vista Avenue,Mountain View, CA 94040. (415) 968-9710.
DOHRMANNENVIROTECH
1M
Circle No. 21 01 Rean,s' Senice Card
10 Environmental Science & Technology
Gov. Richard Ogilvie
environmental currents
STATES N.J. pipes wastes to ocean, cites military polluters
The New Jersey Department of Environmental Protection has approved a$3,526,000 state grant for constructing an outfall pipe almost a mile into theAtlantic Ocean diverting effluent that would otherwise be discharged intoRaritan and Sandy Hook Bays. The facility will ultimately handle thecombined wastes from 12 municipalities. Nine federal military installationsCamp Charles Wood, Camp Evans, Fort Dix Military Reservation, FortHancock, Fort Monmouth, Lakehurst Naval Air Station, McGuire Air ForceBase, Pedrickstown Military Reservation, and Picatinny Arsenal-receivedwater pollution abatement orders with a compliance deadline by the end ofnext'month (see ES&T, December 1971, p 1176).
P&G loses Fla. market; III. pays 25% sewage costs
Proctor & Gamble withdrew its laundry detergents last month from themarket in Dade County, Fla. "until new product developments permit us toreturn." P&G'S action is based on a law making it illegal to sell detergentscontaining phosphates in the Miami area after December 31. Last month,Illinois Governor Richard Ogilvie released over $900,000 for full or partialpayment of the state's~5%share of eligible costs for municipal sewageimprovements. Thus far, these proceeds authorized by the Anti-PollutionAct of 1970 brings the total amount paid by the state for projects alreadycompleted or currently under construction to $8,888,611. "Clean water is anattainable resource for all residents of Illinois," emphasizes Ogilvie.
Ga. county cited; Philly fines auto owners
In a decision of state and possible national significance, a Georgia court ruledthat a county is responsible, under Georgia constitution, for the health andwell-being of the people within its jurisdictional borders. Walton Countywas made a codefendant in a civil action against a small municipality foroperating an illegal garbage dump. The matter is being appealed to the StateSupreme Court. The Philadelphia (Pa.) Municipal Court fined 22 vehicleowners for automotive air pollution. Most defendants were fined $25 pluscourt costs, but those who failed to appear were fined $100 plus court costs.Ajoint Police-Air Management Team patrols the streets for smoking autoexhausts.
Nuclear power plant under tight control in Illinois
The Illinois Pollution Control Board granted Commonwealth Edison andIowa-Illinois Gas & Electric Co. a permit to operate a new nuclear generatingstation but under extremely strict conditions. Rejecting the argument that thefederal government had preempted the field of radioactive emission control,the board ordered the companies to reduce, by December 1973, gaseousradioactive emissions by a factor of 30 times the amount the companies hadrequested to discharge. A maximum recycle system for liquid radioactivedischarges is required; the board also ordered the companies to install a diffuserpipe to distribute more equally heated wastes in the river. The companiescan only operate one of the two 809-MW boiling water reactors until adequatecontrols are installed.
Volume 6, Number I, January 1972 11
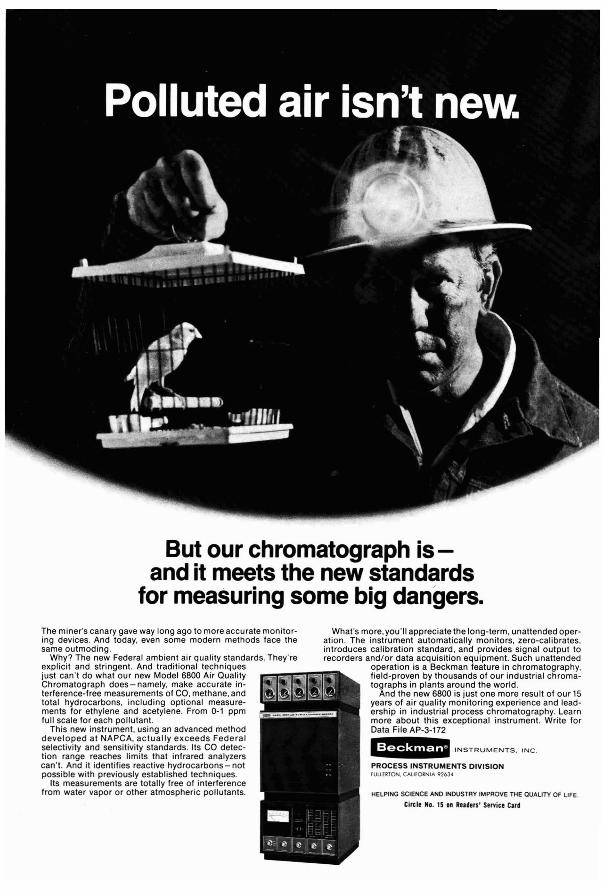
But our chromatograph isand it meets the new standards
for measuring some big dangers.The miner's canary gave way long ago to more accurate monitoring devices. And today, even some modern methods face thesame outmoding.
Why? The new Federal ambient air quality standards. They'reexplicit and stringent. And traditional techniquesjust can't do what our new Model 6800 Air QualityChromatograph does-namely, make accurate interference-free measurements of CO, methane, andtotal hydrocarbons, including optional measurements for ethylene and acetylene. From 0-1 ppmfull scale for each pollutant.
This new instrument, using an advanced methoddeveloped at NAPCA, actually exceeds Federalselectivity and sensitivity standards. Its CO detection range reaches limits that infrared analyzerscan't. And it identifies reactive hydrocarbons-notpossible with previously established techniques.
Its measurements are totally free of interferencefrom water vapor or other atmospheric pollutants.
What's more, you'll appreciate the long-term, unattended operation. The instrument automatically monitors, zero-calibrates,introduces calibration standard, and provides signal output torecorders and/or data acquisition equipment. Such unattended
operation is a Beckman feature in chromatography,field-proven by thousands of our industrial chromatographs in plants around the world.
And the new 6800 is just one more result of our 15years of air quality monitoring experience and leadership in industrial process chromatography. Learnmore about this exceptional instrument. Write forData File AP-3-172
~ INSTRUMENTS, INC.
PROCESS INSTRUMENTS DIYISIONfUllERTON, CAliFORNIA 9263"
HELPING SCIENCE AND INDUSTRY IMPROVE THE QUALITY OF LIFE.
Circle No. 15 on Readers' Service Cud
environmental currents
TECHNOLOGY Chimneys could safely store nuclear wastes
Underground chimneys, created by detonation of small nuclear devices,could be used for permanent disposal of radioactive wastes, according toscientists at the Lawrence Livermore Laboratory (Livermore, Calif.). Suchchimneys-actually cavities filled with broken rock-could be located undernuclear fuel reprocessing plants and eliminate hazardous shipping andstoring of nuclear wastes aboveground. The Livermore team suggests thatheat produced by the radioactive decay of high-level wastes would boil thesolutions dry in the chimneys. Steam given off in the process could be recycled.When capacity of the chimney is reached-in about 20 years-heat wouldmelt the rock. When radioactivity decreased sufficiently, the rock would cooland solidify, permanently trapping wastes underground.
Plastics make debut in concrete bridge
The first use of recycled plastics as a component of structural concrete willbe in a bridge connecting Elgin, 1II.'s Civic center grounds with WaltonIsland in the nearby Fox River. Residents of Elgin will collect some 25,000scrap plastic bottles which will be ground into chips and used to replace30 vol %of the normal sand aggregate in the bridge's concrete footings andspan. The 100 ft long, 7 ft wide arch will be about 9 %lighter in weight thanit would have been with conventional concrete, with insignificant loss ofstrength. Tests have shown that the plastic-concrete mixture has "zero slump"when wet-a valuable property, suggesting that the mixture might be used inslanting architectural forms where bulging due to gravity flow induced byweight of conventional concrete must be overcome.
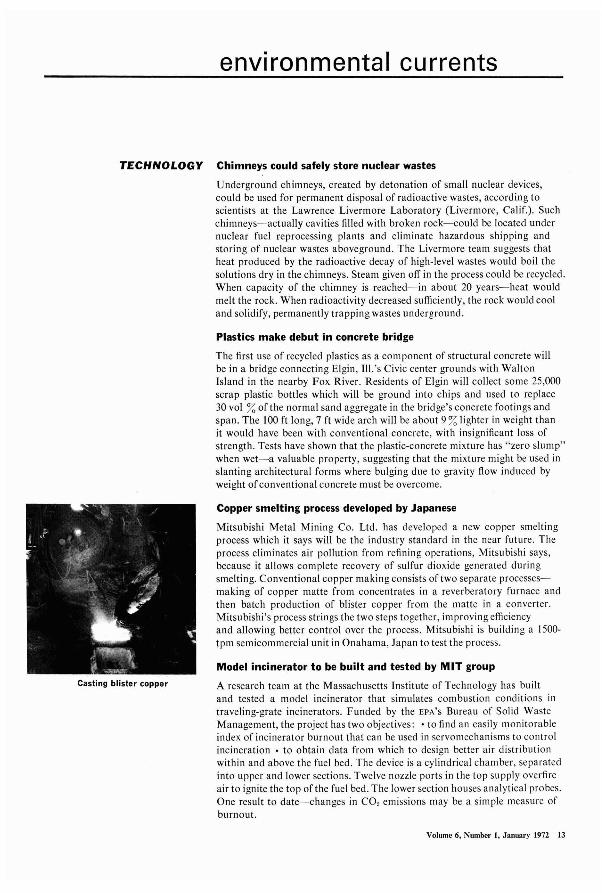
Casting blister copper
Copper smelting process developed by Japanese
Mitsubishi Metal Mining Co. Ltd. has developed a new copper smeltingprocess which it says will be the industry standard in the near future. Theprocess eliminates air pollution from refining operations, Mitsubishi says,because it allows complete recovery of sulfur dioxide generated duringsmelting. Conventional copper making consists of two separate processesmaking of copper matte from concentrates in a reverberatory furnace andthen batch production of blister copper from the matte in a converter.Mitsubishi's process strings the two steps together, improving efficiencyand allowing better control over the process. Mitsubishi is building a 1500tpm semicommercialunit in Onahama, Japan to test the process.
Model incinerator to be built and tested by MIT group
A research team at the Massachusetts Institute of Technology has builtand tested a model incinerator that simulates combustion conditions intraveling-grate incinerators. Funded by the EPA'S Bureau of Solid WasteManagement, the project has two objectives: • to find an easily monitorableindex of incinerator burnout that can be used in servomechanisms to controlincineration • to obtain data from which to design better air distributionwithin and above the fuel bed. The device is a cylindrical chamber, separatedinto upper and lower sections. Twelve nozzle ports in the top supply overfireair to ignite the top of the fuel bed. The lower section houses analytical probes.One result to date-changes in CO, emissions may be a simple measure ofburnout.
Volume 6, Number I, January 1972 13
Why pay for throwingwateraway?The Water Managers can show youhow to recycle it.It's money down the drain when you have to clean up wastewaterbefore you can dispose of it. Especially since wastewater can be restoredto better than original quality and used over and over again.
For example: a carpet mill was facing an annual outlay of$100,000 for water supply and waste disposal costs. CalgonCorporation installed a Filtrasorb® granular activated carbonsystem that now reclaims 500,000 gallons a day of heavily coloreddye rinsewater. After processing, the crystal-clear waterreturns to the plant for reuse, saving the mill more than$50,000 annually. And the carbon itself can be economicallyregenerated for repeated reuse.
Filtrasorb carbons remove many organic materials andtoxic chemicals from wastewater. Water reclamationsystems using these carbons are among the latest developments in a long series of innovative technologiesintroduced by Calgon. For more than 40 years, our watermanagers have been helping industry solve difficultwater problems.
Calgon can provide a complete wastewater treatmentsystem designed to solve your particular problem.Working with your engineering group, we will assumeresponsibility for any phase of the project up toand including a turnkey contract.
For the optimum answer to water pollutionproblems, write to W. H. Weitzel, Vice President,Water Management Division, Calgon Corporation,Calgon Center, Pittsburgh, Pa. 15230. (412) 923-2345.
The Water Managers
SUBSIDIARY OF MERCK & CO.,INC.
Circle No. 310ft Ruden' S,nice Card
environmental currents
INDUSTRY API earmarks $5 million for air, water pollution
The American Petroleum Institute will spend about $5 million in theinstitute's program to combat air and water pollution in 1972, accordingto API'S President Frank Ikard. API has added about $2.6 million to the$2.5 million previously appropriated and already largely committed toprojects which will be completed during 1972. Ikard says the bulk of themoney will be spent for research on oil spills ($1.3 million) and automobileemission control ($2.8 million). A major part of the research on autoemissions has joint sponsorship of the Automobile ManufacturersAssociation, EPA, and API. The rest of the budget will be spent on otherprograms for improving the quality of the environment.
lei claims catalyst for exhaust emissions reductions
Imperial Chemical Industries Ltd. says it has a catalytic muffler systemthat will cut levels of nitrogen oxides, carbon monoxide, and unburnedhydrocarbons in automobile exhaust sufficiently to meet the 1976 EPA
emission standards. ICI gives no details about the composition of thecatalyst, but says the dual-catalyst muffler system has worked well in limitedtests. Federal regulations require that catalytic devices be serviceable forup to 50,000 miles, and ICI will not speculate whether or not its systemwill hold up for that many miles, but the company is reportedly discussingits development with potential customers in the U.S. ICI assumes thatlead-free gasolirie will be widely available in this country by 1976.
TVA will implement stricter strip-mining controls
The Tennessee Valley Authority (TVA) will require tougher specificationsfor reclaiming strip-mined land from would-be suppliers of coal for theagency's electric generating stations. TVA is the largest domestic consumerof coal, using some 35 million tons annually to fuel steam-electric generatingplants. Roughly half the coal comes from strip or auger mining while theremaining half comes from deep mines. Although TVA has routinely requiredsome land reclamation in its contracts since 1965, future contracts willinvolve two-step bidding. Under the plan, the coal producer has to submita detailed plan of operations and rechlmation to be approved by miningand reclamation specialists before a company will be qualified to bid. Partof the awarded contract money will then be held in reserve and paid onlywhen reclamation is completed.
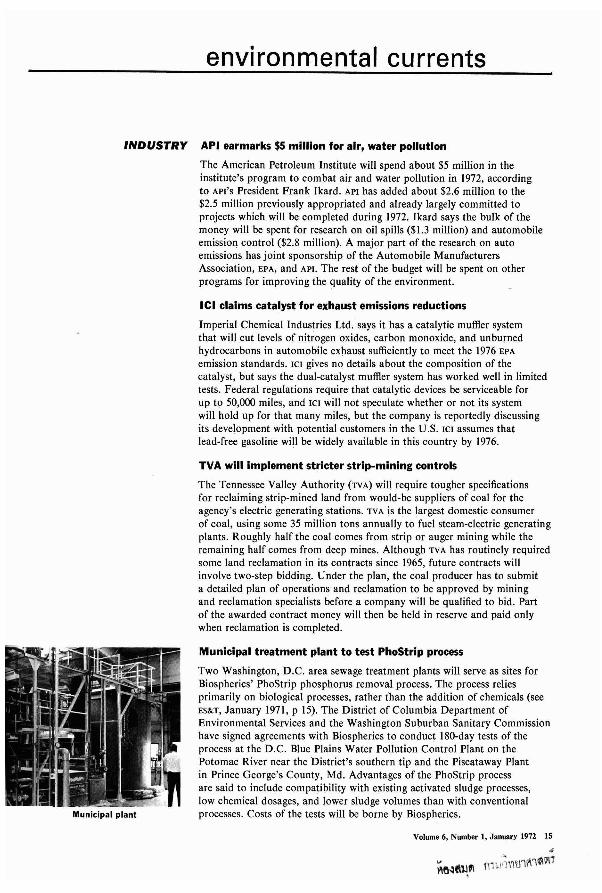
Municipal plant
Municipal treatment plant to test PhoStrip process
Two Washington, D.C. area sewage treatment plants will serve as sites forBiospherics' PhoStrip phosphorus removal process. The process reliesprimarily on biological processes, rather than the addition of chemicals (seeES&T, January 1971, p 15). The District of Columbia Department ofEnvironmental Services and the Washington SUburban Sanitary Commissionhave signed agreements with Biospherics to conduct 180-day tests of theprocess at the D.C. Blue Plains Water Pollution Control Plant on thePotomac River near the District's southern tip and the Piscataway Plantin Prince George's County, Md. Advantages of the PhoStrip processare said to include compatibility with existing activated sludge processes,low chemical dosages, and lower sludge volumes than with conventionalprocesses. Costs of the tests will be borne by Biospherics.
Volume 6, Number 1, January 1972 15
..~M(\1J.~ m).J;VlmI'l1~~1
ESST Interview
JOHNSCHORKA candid talk with Research-Cottrell's,
mild-mannered executive who has some
interesting things to say and whose
company is unique in pollution controls
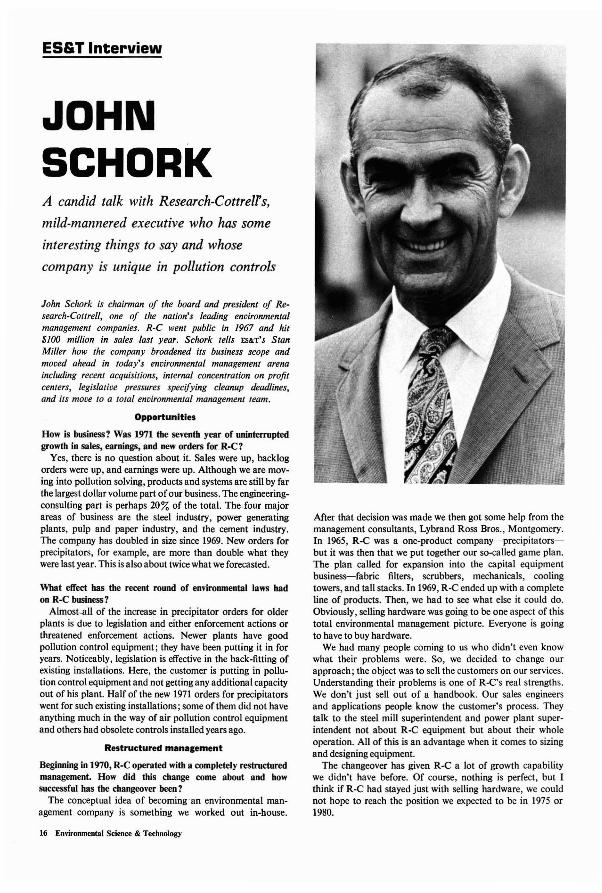
John Schork is chairman of the board and president of Research-Cottrell, one of the nation's leading environmentalmanagement companies. R-C went public in 1967 and hit$100 million in sales last year. Schork tells ES&T'S StanMiller how the company broadened its business scope andmoved ahead in today's environmental management arenaincluding recent acquisitions, internal concentration on profitcenters, legislative pressures specifying cleanup deadlines,and its move to a total environmental management team.
Opportunities
How is business? Was 1971 the seventh year of uninterruptedgrowth in sales, earnings, and new orders for R-C?
Yes, there is no question about it. Sales were up, backlogorders were up, and earnings were up. Although we are moving into pollution solving, products and systems are still by farthe largest dollar volume part ofour business. The engineeringconsulting part is perhaps 20%of the total. The four majorareas of business are the steel industry, power generatingplants, pulp and paper industry, and the cement industry.The company has doubled in size since 1969. New orders forprecipitators, for example, are more than double what theywere last year. This is also about twice what we forecasted.
What effect has the recent round of environmental laws hadon R-C business?
Almost-all of the increase in precipitator orders for olderplants is due to legislation and either enforcement actions orthreatened enforcement actions. Newer plants have goodpollution control equipment; they have been putting it in foryears. Noticeably, legislation is effective in the back-fitting ofexisting installations. Here, the customer is putting in pollution control equipment and not getting any additional capacityout of his plant. Half of the new 1971 orders for precipitatorswent for such existing installations; some of them did not haveanything much in the way of air pollution control equipmentand others had obsolete controls installed years ago.
Restructured manacement
Beginning in 1970, R·C operated with a completely restructuredmanagement. How did this change come about and howsuccessful has the changeover been?
The conceptual idea of becoming ·an environmental management company is something we worked out in-house.
16 Environmental Science & Technology
After that decision was made we then got some help from themanagement consultants, Lybrand Ross Bros., Montgomery.In 1%5, R-C was a one-product company-precipitatorsbut it was then that we put together our so-called game plan.The plan called for expansion into the capital equipmentbusiness-fabric filters, scrubbers, mechanicals, coolingtowers, and tall stacks. In 1969, R-C ended up with a completeline of products. Then, we had to see what else it could do.Obviously, selling hardware was going to be one aspect of thistotal environmental management picture. Everyone is goingto have to buy hardware.
We had many people coming to us who didn't even knowwhat their problems were. So, we decided to change ourapproach; the object was to sell the customers on our services.Understanding their problems is one of R-C's real strengths.We don't just sell out of a handbook. Our sales engineersand applications people know the customer's process. Theytalk to the steel mill superintendent and power plant superintendent not about R-C equipment but about their wholeoperation. All of this is an advantage when it comes to sizingand designing equipment.
The changeover has given R-C a lot of growth capabilitywe didn't have before. Of course, nothing is perfect, but Ithink if R-C had stayed just with selling hardware, we couldnot hope to reach the position we expected to be in 1975 or1980.
Profit centers
How many divisions are there within R·C and how profitableare they?
There are two groups-the Environmental Control Groupwith about 800 people and the Environmental EngineeringGroup with about 900. They are both profitable. The Control group is mainly concerned with air and thermal pollutioncontrols. It is headed by William Jones and represented about81 % of last year's business. The engineering group is concerned with water pollution control, waste disposal, and landuse planning. It is headed by Peter Gianacakes and represented 17 %of the business. Oxy-Catalyst was the remaining2%.
In the Engineering Group, Metcalf & Eddy is by far thelargest of the three (see box). About 70 %of their total business is in the municipal water and waste treatment field.They didn't grow as fast in 1971 as we had thought. But a lotof municipal projects were held up temporarily. We willprobably see more activity now in 1972.
Can you elaborate on the business rationale for sale of Degre.mont-Cottrell and acquisition of Oxy-Catalyst?
R-C was in the water pollution control hardware businesswith the Degremont-Cottrell division; we lost money everyyear for four years. Whether it was our fault or the market'sfault, we cannot say. We just couldn't produce a profit. Sellinghardware to municipalities is a tough competitive business.Municipalities are almost forced to buy the equipment on thebasis of low bid. So, R-C was in the field competing for largedollar volume and small profit. It just seemed that we couldbetter apply our money, people, and talents elsewhere. So wesold the operation. No regrets. Had we not sold it in 1970, wewould have had a problem with the consulting-engineeringgroups, because some municipalities are reluctant to have aconsultant do the study if he is associated with a hardwaresupplier.
We acquired Oxy-Catalyst to complete our product linein air pollution control. Our line was complete for particulatecollection; we also had developed one process for SO,removal and licensed another. But other gaseous pollutantswere not covered. We knew that gaseous pollutants were goingto be a growing business and that many of the problems with
these pollutants are solved by catalytic oxidation. Oxy-Catalystwas a small company, but it had been in the air pollution control business since 1959 and was a leader in its field. Sales wereabout $2 million annually. They had been making catalyticmufflers to solve tbe hydrocarbon emissions problem for 15years. Some of their expertise is applicable to the automotiveemissions control problem.
Technology
Is the present technology that is available from R-C adequateto control emissions from every stationary source? What arethe exceptions?
For control of particulate matter, tbere is a solution toevery problem. There is no reason to see dust or dirt comingout of any chimney in the U.S. Certainly, this is a broadstatement, and there may be a process somewhere that cannotbe controlled, but, in general, the controls for particulatematter are well developed. For gaseous emissions, it is anentirely different story. You pretty much have to take themone at a time. SO, controls are only experimental today.When you put them into commercial operation on a day-today basis it may be a different story. Collectively, utilities havespent a total of $80 million on SO, removal systems over thepast four years, but there is no company that can sell such asystem with the same degree of confidence and guaranteedperformance as with a particulate control system. After we allget a little commercial experience-I guess in another fewyears-we will then be able to have the same assurance forSO, systems we have for particulate collection, but we cannotdo them today. We can put the system in today, and it works,but you get a variety of efficiencies. Everything has to be donequickly these days. We had 50 years to develop controls forparticulate; we've had only four years for SO, controls!
How many SO,.fty ash removal systems have been purchased?Commercially, about a half dozen systems have been sold.
Recently, we sold one system to a western utility-ArizonaPublic Service. When its 115-MW plant was built 10-12 yearsago, the entire cost of electricity produced was about $65/kW.Now, we are going back and putting in our control systemwhich will cost them $48 a kilowatt additionally. This is theextreme case, but in every case the controls are expensive.
Volume 6, Number 1, January 1972 17
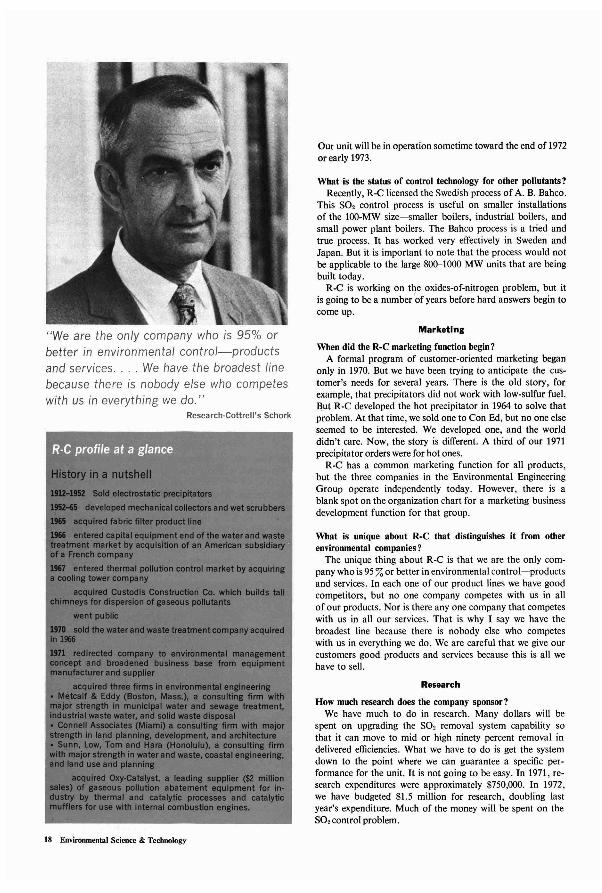
"We are the only company who is 95% orbetter in environmental control-products
and services . ... We have the broadest line
because there is nobody else who competes
with us in everything we do."Research-Cottrell's Schork
18 Environmental Science & Technology
OUt unit will be in operation sometime toward the end of 1972or early 1973.
What is the status of control technology for other pollutants?Recently, R-C licensed the Swedish process of A. B. Bahco.
This SO, control process is useful on smaller installationsof the 100-MW size-smaller boilers, industrial boilers, andsmall power plant boilers. The Bahco process is a tried andtrue process. It has worked very effectively in Sweden andJapan. But it is important to note that the process would notbe applicable to tbe large 800-1000 MW units that are beingbuilt today.
R-C is working on the oxides-of-nitrogen problem, but itis going to be a number 'of years before hard answers begin tocome up.
Marketing
When did the R-C marketing function begin?A formal program of customer-oriented marketing began
only in 1970. But we have been trying to anticipate the customer's needs for several years. There is the old story, forexample, that precipitators did not work with low-sulfur fuel.But R-C developed the hot precipitator in 1964 to solve thatproblem. At that time, we sold one to Con Ed, but no one elseseemed to be interested. We developed one, and the worlddidn't care. Now, the story is different. A third of our 1971precipitator orders were for hot ones.
R-C has a common marketing function for all products,but the three companies in the Environmental EngineeringGroup operate independently today. However, there is ablank spot on the organization chart for a marketing businessdevelopment function for that group.
What is unique about R-C that distinguishes it from otherenvironmental companies?
The unique thing about R-C is that we are the only company who is 95 %or better in environmental control-productsand services. In each one of our product lines we have goodcompetitors, but no one company competes with us in allof our products. Nor is there anyone company that competeswith us in all our services. That is why I say we have thebroadest line because there is nobody else who competeswith us in everything we do. We are careful that we give ourcustomers good products and services because this is all wehave to sell.
Research
How much research does the company sponsor?We have much to do in research. Many dollars will be
spent on upgrading the SO, removal system capability sothat it can move to mid or high ninety percent removal indelivered efficiencies. What we have to do is get the systemdown to the point where we can guarantee a specific performance for the unit. It is not going to be easy. In 1971, research expenditures were approximately $750,000. In 1972,we have budgeted $1.5 million for research, doubling lastyear's expenditure. Much of the money will be spent on theSO, control problem.
(Cleansimatic Liquid Analysis Meter)
No matter what the application (effluent,mixed liquor or just plain sludge) chances arewe have the right monitoring device for you.
OpenChannelor TankSensor
ControlUnit
MonitorSuspended SolidsWith a ClAM®
[email protected]'"=-'0 r:;r.=J ... where greater things are happening!..~ NUPRO COMPANY. 15635 saranac Road. Cleveland, Ohio 44110
Circle No. 12 on Readers' Senicl!! Card
PESTICIDAL FORMULATIONSRESEARCH
ADVANCES IN CHEMISTRYSERIES NO. 86
Fifteen papers from a symposium sponsored by the ACS Div~
sions of Agricultural and Food Chemistry and Colloid and Sur·face Chemistry chaired by J. W. Van Valkenburg.
• Self cleaning - defies dirt, slime andclogging
• Samples 4 times a minute; automatically cleaning itself with each samplingstroke.
• No sampling pumps or lines needed
• Remote location of control unit byinterconnecting cable
• Outputs provided for automatic control
The physical and colloidal chemical aspects discussed includephysicochemical principles, the role played by these principlesin the formulation and functioning of pesticides and herbi·cides, and related phenomena. Several studies on specificpests and pesticides are included.
212 pages with index Cloth (1969) $9.50
These precision engineered sensors areavailable in either pipe mounted orsubmersible versions. Other membersof our CLAM® family provide a widerange of suspended solids measurement.
Free set of L C. C:IIrds with library orders upon request
Postpaid In U.S. and Canada; plus 30 cents In PUAS and ..sewh.....
Order from:
SPECIAL ISSUES SALESAMERICAN CHEMICAL SOCIETY1155 SIXTEENTH ST., N.W.WASHINGTON, D.C. 20036
Bicii~"~cs INCORPORATED
4928 Wyaconda Road Rockville, Maryland 20852(301) 946-3300
Circle NI. 3 II Ruders' SlrYice Card
Volume 6, Number 1, January 1972 19
outlook
Turn-key turns on construction firmsConstruction of municipal waste treatment plants is a
rapidly growing business; it merits a test of the turn-key
option to get on with cleanup of the Nation's waters
Now that banks have changed theirbusiness operations, for the first timein 34 years, to a floating prime ratefrom the prime lending rate, how muchlonger can it be before the U.S. government allows turn-key construction offederally funded municipal waste treatment plants? Under the -traditionalmethod, consulting engineers prepare aplant design for a municipality. Then,contractors bid competitively for construction based on that design.
The furor touched off by the turnkey proposal that was announced bythe EPA administrator last September15 stirred the hottest environmentalconflict in years. The issue, simply,is whether or not to permit turn-keyoperations as an alternative optionthat would be open to municipalities.The EPA proposal would open theoption.
Whether turn-key operations are inthe public interest only tests and timecan tell. Judging from the sharp comments made on the EPA proposals, itmay be months before the regulationsare finalized, if indeed they are finalized 'at all. At press time, the deadline forcomments (November 29) had passed, .but it was too soon to know the fate ofthe proposal.
According to Webster's, a turn-keyjob is a job or contract in which thecontractor agrees to complete the workof building and installation to the pointof readiness or occupancy. (For a commonly accepted definition, see box.) Inany event, turn-key involves three elements-engineering, procurement, andconstruction.
The turn-key approach has beenaround for years; it's been used inthe industrial sector with much success. Although turn-key is a radicaldeparture from the traditional way ofperforming municipal waste treatmentplant construction in this country, it'scommon practice in foreign countries.
20 Environmental Science & Technology
It is used in just about every othercountry of the world except the U.S.on public works projects involvingwater and water treatment.
In the past, because of state regulatorybodies, there has been neither competition in municipal treatment constructionnor advances in process design or technology. Nor has there been a singlesource of responsibility to ensure that amunicipal plant employing traditionaltreatment methods will even operate asdesigned. This, at any rate, is what theturn-key proponents say.
The advantage most often cited as theprime consideration for turn-key is thefact that plants are built at a lower costand in a shorter time. Savings accrue
because one or more of the three elements of turn-key operations are provided concurrently. The turn-key contractor has complete control ofthe workbecause he normally employs mechanical and other workers directly, ratherthan through subcontractors. Otheradvantages, according to proponents,are that turn-key operations:
• are used in many foreign countries• promote technological competition• pinpoint one responsible manage
ment• guarantee performance after con
struction.Why EPA made the turn-key proposal
in the first place is not certain. Oneschool of thought maintains that pres-
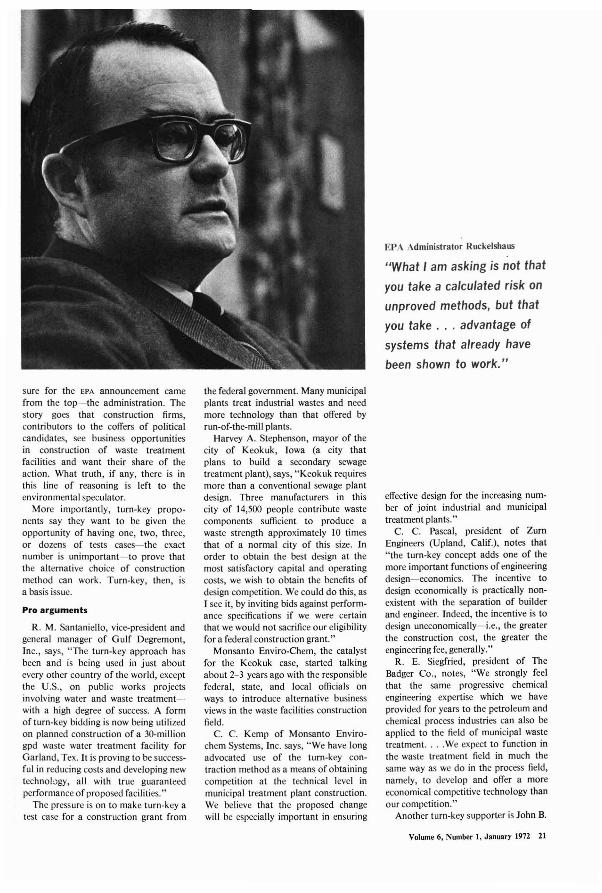
EPA Administrator Ruckelshaus
"What I am asking is not that
you take a calculated risk on
unproved methods, but that
you take ... advantage of
systems that already have
been shown to work."
sure for the EPA announcement camefrom the top-the administration. Thestory goes that construction firms,contributors to the coffers of politicalcandidates, see business opportunitiesin construction of waste treatmentfacilities and want their share of theaction. What truth, if any, there is inthis line of reasoning is left to theenvironmental speculator.
More importantly, turn-key proponents say they want to be given theopportunity of having one, two, three,or dozens of tests cases-the exactnumber is unimportant-to prove thatthe alternative choice of constructionmethod can work. Turn-key, then, isa basis issue.
Pro arguments
R. M. Santaniello, vice-president andgeneral manager of Gulf Degremont,Inc., says, "The turn-key approach hasbeen and is being used in just aboutevery other country of the world, exceptthe U.S., on public works projectsinvolving water and waste treatmentwith a high degree of success. A formof turn-key bidding is now being utilizedon planned construction of a 30-milliongpd waste water treatment facility forGarland, Tex. It is proving to be successful in reducing costs and developing newtechnology, all with true guaranteedperformance of proposed facilities."
The pressure is on to make turn-key atest case for a construction grant from
the federal government. Many municipalplants treat industrial wastes and needmore technology than that offered byrun-of-the-mill plants.
Harvey A. Stephenson, mayor of thecity of Keokuk, Iowa (a city thatplans to build a secondary sewagetreatment plant), says, "Keokuk requiresmore than a conventional sewage plantdesign. Three manufacturers in thiscity of 14,500 people contribute wastecomponents sufficient to produce awaste strength approximately 10 timesthat of a normal city of this size. Inorder to obtain the best design at themost satisfactory capital and operatingcosts, we wish to obtain the benefits ofdesign competition. We could do this, asI see it, by inviting bids against performance specifications if we were certainthat we would not sacrifice our eligibilityfor a federal construction grant."
Monsanto Enviro-Chem, the catalystfor the Keokuk case, started talkingabout 2-3 years ago with the responsiblefederal, state, and local officials onways to introduce alternative businessviews in the waste facilities constructionfield.
C. C. Kemp of Monsanto Envirochem Systems, Inc. says, "We have longadvocated use of the turn-key contraction method as a means of obtainingcompetition at the technical level inmunicipal treatment plant construction.We believe that the proposed changewill be especially important in ensuring
effective design for the increasing number of joint industrial and municipaltreatment plants."
C. C. Pascal, president of ZurnEngineers (Upland, Calif.), notes that"the turn-key concept adds one of themore important functions of engineeringdesign-economics. The incentive todesign economically is practically nonexistent with the separation of builderand engineer. Indeed, the incentive is todesign uneconomically-i.e., the greaterthe construction cost, the greater theengineering fee, generally."
R. E. Siegfried, president of TheBadger Co., notes, "We strongly feelthat the same progressive chemicalengineering expertise which we haveprovided for years to the petroleum andchemical process industries can also beapplied to the field of municipal wastetreatment. ...We expect to function inthe waste treatment field in much thesame way as we do in the process field,namely, to develop and offer a moreeconomical competitive technology thanour competition."
Another turn-key supporter is John B.
Volume 6, Number 1, January 1972 21
Dwyer, vice-president for research andengineering of The M. W. Kellogg Co.He notes that, "This (tum-key) undoubtedly reduces the burden of costs whichwill have to be borne by the public, bypermitting utilization of best availabletechnology. Furthermore, it will encourage private companies to invest inresearch and development of improvedprocesses, since business will be availableto them provided they guarantee performance. This move is certainly in thepublic interest."
John H. Robertson, manager of theenvironmental systems division of Catalytic, Inc., notes that "We (Catalytic)would strongly favor a proposal whichpermitted a design and constructapproach to municipal projects."Robertson goes further and offerssuggested language on tum-key: "Itis recommended that a qualified environmental engineer certify, in suchcases (turn-key), that alternatives havebeen considered, and the solution proposed is economically feasible as well astechnically approved."
J. D. Spink of The Rust EngineeringCo. notes that "The turn-key contractedmethod will be available to municipalities whose waste treatment facilitiesmust not only treat the domestic wastein that municipality, but also, in manycases, various industrial wastes. Thissituation alone in the past has beendetrimental to some form of traditionaltreatment processes which municipalities have had to use because of thestate regulatory bodies."
Additional support for the tum-keyproposal was received from Westinghouse Electric Corp. (Pittsburgh, Pa.);R. B. Humphreys Construction Co.,Inc. (Indianapolis, Ind.); and FluorUtah Engineers & Constructors, Inc.(Los Angeles, Calif.)
Organizations, too, are behind theturn-key proposal. The National Constructors Association (Washington, D.C.)is an association of engineering-construction firms (see box) that haveprovided turn-key operations in theindustrial sector for years. The firmshave regularly provided the engineering,procurement, and construction of plantsto deliver performance in accordancewith the design. Under the right set ofcircumstances, these firms do not seewhy they would not be interested in theconstruction of municipal waste treatment facilities.
Con a"uments
On the other side of the proposalis the consulting engineering profession.
22 Environmental Science & Technology
So too are state water pollution controlofficials. From coast to coast and inevery state, consulting engineers are nothappy with the proposal, which isputting it quite mildly. In fact, WesleyGilbertson, deputy secretary of thePennsylvania Department of Environmental Resources, says, "We havetalked with no one who has indicatedthey favor the proposal."
The fear of competition is neverso evident than in considering theircomments. "My experience in foreigntum-key projects indicates that wewould be taking a step backward ifsuch a proposal is adopted," saysPhilip Abrams of Consulting Engineers,
Turn-key: how it worksA contracting method under which allmajor activities-engineering-design,procurement of plant equipment, andconstruction-are included in a singlecontract, with the contractor havinga professional relationship with theowner or client to produce optimumend results as to the quality of work,lowest possible cost, and earliestpossible completion. Turn-key contract terms vary but may includeperformance guarantees and suchprice guarantees as lump sum orguaranteed maximums. For example,if a contract were negotiated for SIDmillion, and the actual cost exceededthat figure, then the contractorwould absorb the overrun up to anagreed amount such as all or part ofhis fee.
Inc. (Palm Springs, Calif.). "Qualityof construction and contract negotiations are subject to irregularities,which are difficult to resolve."
R. H. Albanese, a consulting civiland sanitary engineer of Port Washington, N.Y., points out, "It is our opinion,as practicing professional sanitary engineers, that such approval wouldeventually lead to contractors dictatingthe designs of treatment works toprofessional engineers (retained by thecontractor) and that the engineer wouldno longer be protecting the interests ofthe municipality, but instead his client,namely the contractor."
"Not only will the effectiveness ofthe projects suffer," he continues, "butalso the well-established competitivebidding on a well-defined design will belost. Such a loss will be detrimental tothe sanitary engineering profession as itmay lead to the substitution of sub-
standard equipment once a contractor(not a design) is selected."
One consulting engineer points out afew examples of tum-key projects whichare in operation today, and that theyare in trouble. "City of Omaha is currently undergoing problems with twowaste treatment and paunch manureplants that are of the tum-key variety,"says Raymond G. Alvine of theNebraska-based R. G. Alvine & Associates. He comments, "I know frompersonal observation and experience thattum-key contractors will cut every comerpossible on a project to increase theirprofit."
But one real concern regarding turnkey that is not easily dismissed is thatpublic bodies will be held accountablefor their choices. "The tragedy of thetum-key proposal is that public bodieswill necessarily be required to makedecisions which they are not competentto make without experience, re: costs,the adequacy and fairness of which theyare incompetent to judge, and under aplan where the acceptance of the finishedwork is by the same party that performsthe work," says R. Howson of Alvord,Burdick & Howson Engineers (Chicago,111.).
A similar theme is found in thecomments of Thomas McMahon, director of water pollution for the Commonwealth of Massachusetts, who objectsto the EPA proposal, saying that thetum-key approach might result in"marginal" construction and greatlyincrease responsibility of state andfederal agencies.
Looklnl ahead
Perhaps many of the apparentlyconflicting views on the merits oftum-key stem from the fact that theSeptember 15 announcement was notspecific enough. Presumably, the language will be more specific if and whenit is finalized.
Given the opportunity of test casesin the waste water construction field,turn-key operations may pave the wayfor construction in the future. Butit is important to note that instantanswers are not possible. For example,even if a tum-key operation wereapproved for municipal constructiontomorrow, only after several yearswhen the construction would be turnedover-would the results be available fora final decision on the merits of theapproach. But how much longer canwe continue to try and solve pressingproblems with yesterday's, if not yesteryear's, procedures? SSM
Philadelphia-based American Society for Testing and Materials
has put together a three-year program to validate analytical
methods for measuring selected atmospheric contaminants
Project Threshold: testing the tests
In the battle to clean up dirty air, regulatory officials operate on a basic assumption: that testing methods are accurate and precise. Examining thatfundamental assumption is the purposeof Project Threshold-a venture of theAmerican Society for Testing Materials(ASTM). The Philadelphia-based organization will look at some 35 differentmethods for measuring various atmospheric pollutants in a three-phase program spanning three years and costingabout $2 million.
Project Threshold was launched earlylast year, and the results of the firstphase should be available shortly. PhaseI is designed to evaluate seven test methods (see table) for measuring sulfur dioxide, nitrogen dioxide, lead, sulfationrate, and dustfall. Phases II and III willfocus on methods for some hydrocarbons, nitric oxide, hydrogen sullide,mercaptans, and certain particulate matter.
The need for a project such as Threshold is obvious when one considers thatfew if any methods for detecting atmospheric contaminants have been subjected to rigorous accuracy and precision studies, according to Walter V.Cropper, ASTM'S director of New Projectsand manager of Project Threshold."As of this time last year," Cropper says,"there was not even one good standardmethod which had been satisfactorilychecked for accuracy and reproducibility." There were, according to Cropper,some good "single-operator results"statistically valid precision experimentscarried out by single investigators-butno experiments had been done to checkvariance between laboratories or operators and thereby to establish appropriate confidence limits.
Such testing, Cropper explains, isthe bailiwick of ASTM which has some75 years of experience in standardizingtest methods by the so-called "consensusmethod." That method, ASTM'S Managing Director William T. Cavanaugh
explains, involves far more than a conclave of experts who simply agree onthe best way to do things.
The consensus system relies on expertise, but firmly resists the notion thatthere is any such thing as unbiased expert opinion. Rather, ASTM assemblesa panel of expert advocates, clearlylabels their professional biases, and thenreferees the proceedings as the panelthrashes out solutions that are, on balance, beneficial to all. The result is astandard that is arrived at voluntarilyand subscribed to voluntarily, but whichcarries enormous professional clout.
ASTM'S system, Cavanaugh insists,is the best in the world for setting measurement standards. State and federalgovernments routinely accept ASTM
standards for materials and methods asthe basis for their regulatory activities,he points out. Hopefully, the methodsused for arriving at consensus standardsfor concrete and other structural materials early in ASTM'S history will servepollution control efforts as well.
Round robin
To determine the accuracy and precision of its testing methods, ASTM
has relied on "round robin testing."It works like this: After the committeehas decided on the best procedure fora given test-say the determination ofoctane ratings for gasoline-several cooperating independent laboratories makeseparate analyses of a split sample, following the Committee's written procedure letter by letter.
By comparing results among laboratories, ASTM can determine statisticallyvalid accuracy and precision parameterswhich give some frame of reference forsubsequent test results. Laboratoriesusually sandwich the verification tests inbetween their normal duties, so thatthe testing costs ASTM nothing. Whilesuch an approach to the problems ofProject Threshold might have beendesirable, several problems unique to the
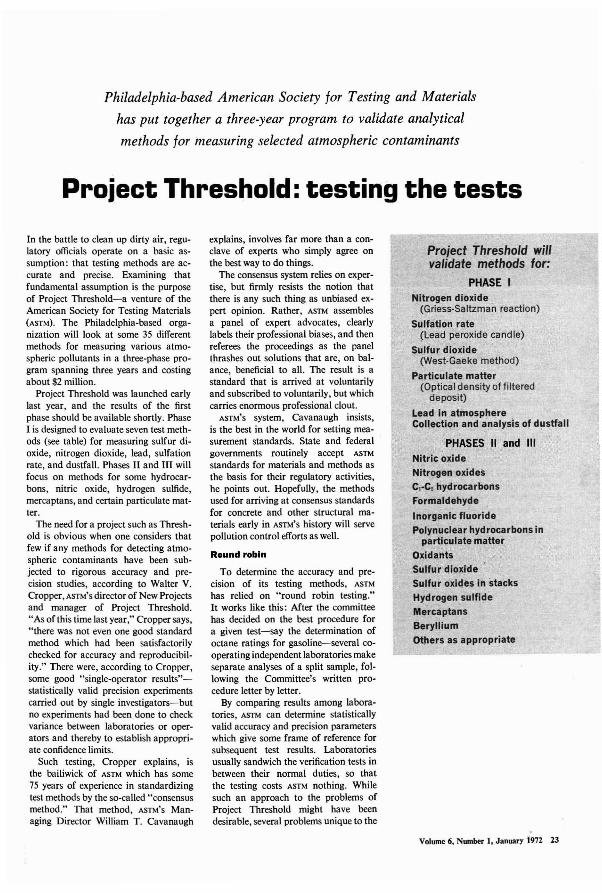
Project Threshold willvalidate methods for:
PHA~E INitrogen dioxide
(GrieSS-Saltzman reaction)
SUlfation rate(Lead peroxide candle)
Sulfur dioxide(West-Gaeke method)
Particulate matter(Optical density offiltered
deposit)
Lead in atmosphereCollection and analysis of dustfall
PHASES II and IIINitric oxide
Nitrogen oxides
CI-C, hydrocarbonsFormaldehyde
Inorganic fluoride
Polynuclear hydrocarbons inparticulate matter
Oxidahts
Suifur dioxide
Sulfur oxic!es in stacksHydrogen sulfide
Mercaptans
Beryllium
otlters as appropriate
Volume 6, Number 1, January 1972 23
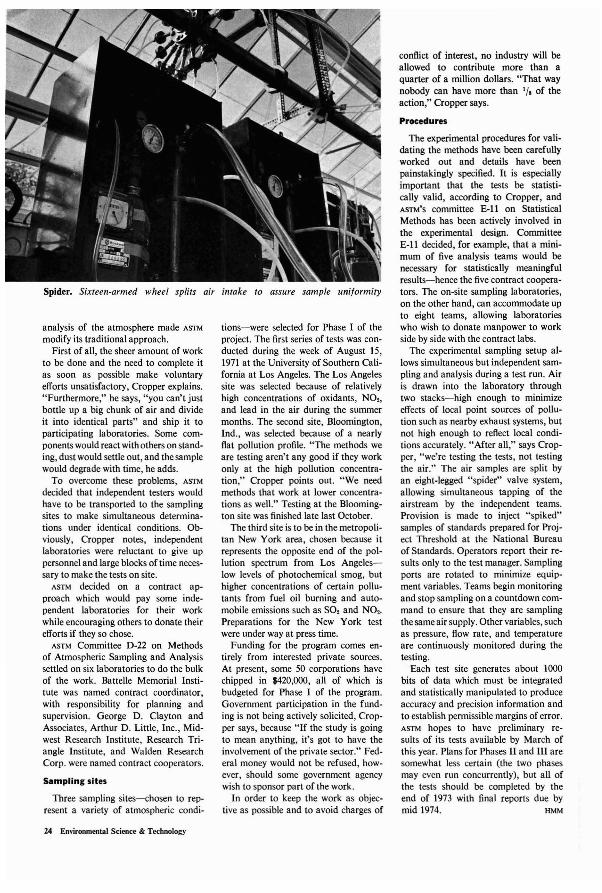
Spider. Sixteen-armed wheel splits air intake to assure sample uniformity
analysis of the atmosphere made ASTM
modify its traditional approach.First of all, the sheer amount of work
to be done and the need to complete itas soon as possible make voluntaryefforts unsatisfactory, Cropper explains."Furthermore," he says, "you can't justbottle up a big chunk of air and divideit into identical parts" and ship it toparticipating laboratories. Some components would react with others on standing, dust would settle out, and the samplewould degrade with time, he adds.
To overcome these problems, ASTM
decided that independent testers wouldhave to be transported to the samplingsites to make simultaneous determinations under identical conditions. Obviously, Cropper notes, independentlaboratories were reluctant to give uppersonnel and large blocks of time necessary to make the tests on site.
ASTM decided on a contract approach which would pay some independent laboratories for their workwhile encouraging others to donate theirefforts if they so chose.
ASTM Committee D-22 on Methodsof Atmospheric Sampling and Analysissettled on six laboratories to do the bulkof the work. Battelle Memorial Institute was named contract coordinator,with responsibility for planning andsupervision. George D. Clayton andAssociates, Arthur D. Little, Inc., Midwest Research Institute, Research Triangle Institute, and Walden ResearchCorp. were named contract cooperators.
Sampling sites
Three sampling sites-chosen to represent a variety of atmospheric condi-
24 Environmental Science & Technology
tions-were selected for Phase I of theproject. The first series of tests was conducted during the week of August 15,1971 at the University of Southern California at Los Angeles. The Los Angelessite was selected because of relativelyhigh concentrations of oxidants, NO"and lead in the air during the summermonths. The second site, Bloomington,Ind., was selected because of a nearlyflat pollution profile. "The methods weare testing aren't any good if they workonly at the high pollution concentration," Cropper points out. "We needmethods that work at lower concentrations as well." Testing at the Bloomington site was finished late last October.
The third site is to be in the metropolitan New York area, chosen because itrepresents the opposite end of the pollution spectrum from Los Angeleslow levels of photochemical smog, buthigher concentrations of certain pollutants from fuel oil burning and automobile emissions such as SO, and NO,.Preparations for the New York testwere under way at press time.
Funding for the program comes entirely from interested private sources.At present, some 50 corporations havechipped in $420,000, all of which isbudgeted for Phase I of the program.Government participation in the funding is not being actively solicited, Cropper says, because "If the study is goingto mean anything, it's got to have theinvolvement of the private sector." Federal money would not be refused, however, should some government agencywish to sponsor part of the work.
In order to keep the work as objective as possible and to avoid charges of
conflict of interest, no industry will beallowed to contribute more than aquarter of a million dollars. "That waynobody can have more than 'I. of theaction," Cropper says.
Procedures
The experimental procedures for validating the methods have been carefullyworked out and details have beenpainstakingly specified. It is especiallyimportant that the tests be statistically valid, according to Cropper, andASTM'S committee E-11 on StatisticalMethods has been actively involved inthe experimental design. CommitteeE-11 decided, for example, that a minimum of five analysis teams would benecessary for statistically meaningfulresults-hence the five contract cooperators. The on-site sampling laboratories,on the other hand, can accommodate upto eight teams, allowing laboratorieswho wish to donate manpower to workside by side with the contract labs.
The experimental sampling setup allows simultaneous but independent sampling and analysis during a test run. Airis drawn into the laboratory throughtwo stacks-high enough to minimizeeffects of local point sources of pollution such as nearby exhaust systems, butnot high enough to reflect local conditions accurately. "After all," says Cropper, "we're testing the tests, not testingthe air." The air samples are split byan eight-legged "spider" valve system,allowing simultaneous tapping of theairstream by the independent teams.Provision is made to inject "spiked"samples of standards prepared for Project Threshold at the National Bureauof Standards. Operators report their results only to the test manager. Samplingports are rotated to minimize equipment variables. Teams begin monitoringand stop sampling on a countdown command to ensure that they are samplingthe same air supply. Other variables, suchas pressure, flow rate, and temperatureare continuously monitored during thetesting.
Each test site generates about 1000bits of data which must be integratedand statistically manipulated to produceaccuracy and precision information andto establish permissible margins of error.ASTM hopes to have preliminary results of its tests available by March ofthis year. Plans for Phases II and 111 aresomewhat less certain (the two phasesmay even run concurrently), but all ofthe tests should be completed by theend of 1973 with final reports due bymid 1974. HMM

Waste lube oils pose disposal dilemma
Reprocessing seems the answer, but new technology would
add to costs in an industry already under severe pressure
Ever wonder what happens to the oildrained out of the crankcase of yourcar at the local service station? Ifyou do, you're in good company;others, including the V.S. Environmental Protection Agency (EPA) andthe American Petroleum Institute(API) are wondering too. Just howlarge amounts of used lubricatingoils in this country apparently disappear is something of a mystery,although there is a strong suspicionthat much of it ends up in the environment, usually in an unacceptablefashion.
Consider some facts:• About 1.1 billion gal of automobile
lubricants and 1.5 billion gal of industrial lube oils are bought each yearin the V.S. EPA estimates that 50%of the auto oils and 30% of the industrial oils are not consumed and aredisposed of in some way
• A study performed by A. D. Little,
Inc. for the state of Massachusettsin 1969 estimated that the ultimatefate of 18% of all automotive used oilsin the state was "unknown," thatanother 23 %was dumped on the groundat the source (presumably at or neara service station), and that a further11 %was used as road oil
• The API determined in 1966-67that 43 %of a sample of service stationsdid not know the ultimate fate ofthe oil removed from their premises,although less than 2% admitted todumping it on the ground or intoa sewer
In view of the fact that these figureslead to an estimate of at least 500mi1lion gal/year of used auto oils inneed of disposal, it is particularlystriking to note Ihat the annual capacityof the V.S. oil re-refining industry ispegged at only 100--150 million galand that, in fact, it has declined fromabout 300 million galin 1960.
Traditionally, service stations havestored their waste oils in undergroundtanks of several hundred gallons capacity and periodically have them takenaway by small trucking operations"scavengers" to the trade. Only 5%of the 1966 API sample of service stationsdid not have any such arrangement.Whereas many stations used to hepaid by scavengers for the oil, it isnow more common for the station tohave to pay a small fee-perhaps 5cents a gallon-for the service.
Precisely what some of the scavengershave been doing with the oil aftercollecting it from service stations is asubject of speculation rather than hardfact. EPA suspects that many smalloperators routinely dump oil fromtheir trucks into sewers, onto vacantground, or into the nearest convenientwaterway. Since a scavenger generallyrequires no permit for plying his tradebeyond obtaining road licenses for
Volume 6, Number 1, January 1972 2S
his vehicles, there really is no goodway to keep a check on his activities.EPA'S Hal Bernard, chief of the WaterQuality Office's Agricultural and MarinePollution branch, believes that manyscavengers sell their oil to fuel oildistributors who blend it in with regularheating oils and sell it to unsuspectingcustomers.
The recognized outlet for the wasteoil from scavengers is are-refiningplant which treats the oil so as to removeimpurities and resells it to blenderswho add virgin lube oil and sell theresulting product as "reclaimed oil"through regular wholesale and retailchannels. The re-refining industry issufficiently well organized to have atrade association-the American Association of Petroleum Re-refiners-butthe industry is going through bad timesfor several reasons. Probably the mainone is the increasing number of additives in oils and in gasolines (degradedgasoline additives reach the crankcaseby bypassing the pistons). The additiveshave been a boon to motorists byextending the mileage that can bedriven between oil changes, but theyhave increased the difficulty of treatmentat the re-refinery. The second reason forthe decline of re-refining is that theindustry has lost a tax advantage thatits product once had over virgin lubeoils; both products now bear the sameexcise tax.
The last straw for re-refiners, ironicallyenough, has been the pollution potentialof their operations. The almost universalmethod of waste oil treatment is contactwith sulfuric acid to extract most of theimpurities, followed by clay treatmentto remove color. These operationsyield, as well as the re-refined oil,mountains of acid sludge and contaminated clay: 20-40% of the wasteoil ends up either as acid sludge orspent clay. Disposal of these semisolidby-products poses real problems forthe industry which is increasingly beingprevented from landfilling leachablematerials. In addition, spills such asoccurred on the Schuylkill River abovePhiladelphia in November 1970, inwhich 3 million gal of oily waste escapedthrough a broken dike after a heavyrain, have done much to sour the reputation of the re-refiners.
Better treatment
Upgrading the technology lIsed inwaste oil treatment is being explored.The Institut Francais du Petrole, aFrench group in the business of developing and licensing technology for the
26 Environmental Science & Technology
petroleum industry, has come up withwhat it claims is a big improvementover conventional acid and clay treatment. In essence, the IFP processinvolves a technique similar to thatused in a propane deasphalting processin the petroleum industry, although theprocess conditions are completely different. Liquid propane is used to extractmost of the impurities, and this stepis followed by acid and clay treating.However, claims IFP'S Robert Dutriau,the amounts of acid and clay neededare reduced by 80-90 %, with a corresponding decrease in the amounts ofacid and clay sludges needing disposal.
The IFP process has been licensed toan Italian company which has successfully operated it for three years at aplant in Milan. Dutriau explains thatthe Italian government pays re-refinersa bounty for each gallon of wasteoil reprocessed; so in fact does thegovernment of West Germany. Significantly, perhaps, Dutriau is notparticularly optimistic about chances oflicensing the process in the U.S., wherethere is no such government bounty.However, some scavenger operationsare subsidized by cities like Baltimoreon the basis that waste oils constitute afire hazard.
EPA, too, is interested in having there-refiners upgrade their technology.But, says EPA'S Bernard, the agency hasstressed conversion of waste crankcaseoils to products other than lubricatingoil. Bernard believes that production ofdiesel oils or fuel oils from the wasteswould be preferable because theamounts produced in a year wouldbe very small fractions of the totalsales of virgin products, and so wouldbe less disruptive in the marketplace.(In contrast, the 1960 capacity of there-refining industry-300 million galprobably provided at least 25 % ofthe total market for automotive lubeoil.)
The National Oil Recovery Corp.(Bayonne, N.J.), with financial supportfrom EPA, has demonstrated that zerosulfur heating oil and diesel oil canindeed be produced from waste lubeoils through vacuum distillation.
However, burning tests using wasteoil alone indicated that the metals inthe waste oil which remained in thefuel oil product contributed to scalebuildup on heat transfer surfaces thatwould be entirely unacceptable in com·mercial, and certainly in residential,heating installations. In addition, EPA
is understandably concerned about thecomposition of the combustion gases
resulting from burning such a fuel,which contains in addition to leadthe subject of most traditional concerniron, phosphorus, zinc, and barium.
API, for its part, believes that thebest solution probably is to blendwaste lube oils directly with virginfuel oil and to burn them together.Burner tests conducted by API membercompanies in 1968-69 reportedly showedno ill effects when the fuel contained25 % waste oils, but the lead contentof the gases produced during sootblowing was almost I p.g/m', albeitnot enough to affect overall air qualityadversely. EPA'S concern about theblend-and-burn approach centersaround the difficulty of providing adequate assurance that the oil users willbe properly supervised.
According to Ray Wright, directorof marketing for API, the institute isworking on criteria that would permitwaste oils to be reprocessed by theprimary refiners (API member companies) and used as refinery feedstock.
Potential problems, however, mightbe posed by physical and chemicalproperties of waste oils that couldadversely affect refinery processes. Theoverall problem with this approach, andindeed with any approach that convertswaste oil to a product less valuablein the marketplace than lube oil, seemsto be that there is little if any room fora profit. Re-refiners presently make abare few cents per gallon on theirreprocessing operations, and any investment required to upgrade their technology would appear to require either amore valuable product or an outrightsubsidy to make it worthwhile.
The story of waste crankcase oilsis yet another case, with which theenvironmental field is replete, in whichbetter technology is only a part answerto a problem. Without control ofscavenger collecting procedures and aprofit incentive for reprocessors, it isdifficult to see progress being made.
In the meantime, things may begetting worse. API'S Wright says that35-45 %of all auto oils are now boughtat retail outlets other than servicestations. It is intriguing to wonderwhat people who buy oil at the drugstore do with the waste they drain fromthe crankcase at home.
Furthermore, points out Bernard,automotive oils represent only part ofthe waste oil problem. EPA is increasinglyconcerned about the proper disposal ofindustrial cutting oils, tank bottomsludges, and oily ballast waters fromocean-going tankers. DHMB
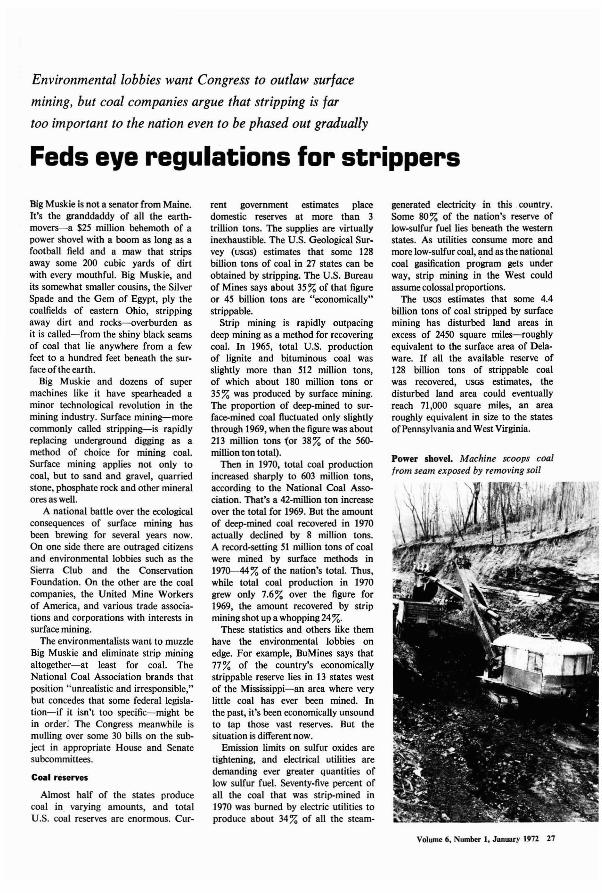
Environmental lobbies want Congress to outlaw surface
mining, but coal companies argue that stripping is far
too important to the nation even to be phased out gradually
Feds eye regulations for strippers
Big Muskie is not a senator from Maine.It's the granddaddy of all the earthmovers-a $25 million behemoth of apower shovel with a boom as long as afootball field and a maw that stripsaway some 200 cubic yards of dirtwith every mouthful. Big Muskie, andits somewhat smaller cousins, the SilverSpade and the Gem of Egypt, ply thecoalfields of eastern Ohio, strippingaway dirt and rocks-overburden asit is called-from the shiny black seamsof coal that lie anywhere from a fewfeet to a hundred feet beneath the surface of the earth.
Big Muskie and dozens of supermachines like it have spearheaded aminor technological revolution in themining industry. Surface mining-morecommonly called stripping-is rapidlyreplacing underground digging as amethod of choice for mining coal.Surface mining applies not only tocoal, but to sand and gravel, quarriedstone, phosphate rock and other mineralores as well.
A national battle over the ecologicalconsequences of surface mining hasbeen brewing for several years now.On one side there are outraged citizensand environmental lobbies such as theSierra Club and the ConservationFoundation. On the other are the coalcompanies, the United Mine Workersof America, and various trade associations and corporations with interests insurface mining.
The environmentalists want to muzzleBig Muskie and eliminate strip miningaltogether-at least for coal. TheNational Coal Association brands thatposition "unrealistic and irresponsible,"but concedes that some federal legislation-if it isn't too specific-might bein order: The Congress meanwhile ismulling over some 30 bills on the subject in appropriate House and Senatesubcommittees.
Coal reserves
Almost half of the states producecoal in varying amounts, and totalU.s. coal reserves are enormous. Cur-
rent government estimates placedomestic reserves at more than 3trillion tons. The supplies are virtuallyinexhaustible. The U.S. Geological Survey (uSGs) estimates that some 128billion tons of coal in 27 states can beobtained by stripping. The U.S. Bureauof Mines says about 35 % of that figureor 45 billion tons are "economically"strippable.
Strip mining is rapidly outpacingdeep mining as a method for recoveringcoal. In 1965, total U.S. productionof lignite and bituminous coal wasslightly more than 512 million tons,of which about 180 million tons or35 % was produced by surface mining.The proportion of deep-mined to surface-mined coal fluctuated only slightlythrough 1969, when the figure was about213 million tons {or 38% of the 560million ton total).
Then in 1970, total coal productionincreased sharply to 603 million tons,according to the National Coal Association. That's a 42-miLlion ton increaseover the total for 1969. But the amountof deep-mined coal recovered in 1970actually declined by 8 million tons.A record-setting 51 million tons of coalwere mined by surface methods in1970-44% of the nation's total. Thus,while total coal production in 1970grew only 7.6% over the figure for1969, the amount recovered by stripmining shot up a whopping 24 %.
These statistics and others like themhave the environmental lobbies onedge. For example, BuMines says that77 % of the country's economicallystrippable reserve lies in 13 states westof the Mississippi-an area where verylittle coal has ever been mined. Inthe past, it's been economically unsoundto tap those vast reserves. But thesituation is different now.
Emission limits on sulfur oxides aretightening, and electrical utilities aredemanding ever greater quantities oflow sulfur fuel. Seventy-five percent ofall the coal that was strip-mined in1970 was burned by electric utilities toproduce about 34 % of all the steam-
generated electricity in this. country.Some 80% of the nation's reserve oflow-sulfur fuel lies beneath the westernstates. As utilities consume more andmore low-sulfur coal, and as the nationalcoal gasification program gets underway, strip mining in the West couldassume colossal proportions.
The USGs estimates that some 4.4billion tons of coal stripped by surfacemining has disturbed land areas inexcess of 2450 square miles-roughlyequivalent to the surface area of Delaware. If all the available reserve of128 billion tons of strippable coalwas recovered, USGs estimates, thedisturbed land area could eventuallyreach 71,000 square miles, an arearoughly equivalent in size to the statesofPennsylvania and West Virginia.
Power shovel. Machine scoops coaltrom seam exposed by removing soil
I,
Volume 6, Number I, January 1972 27
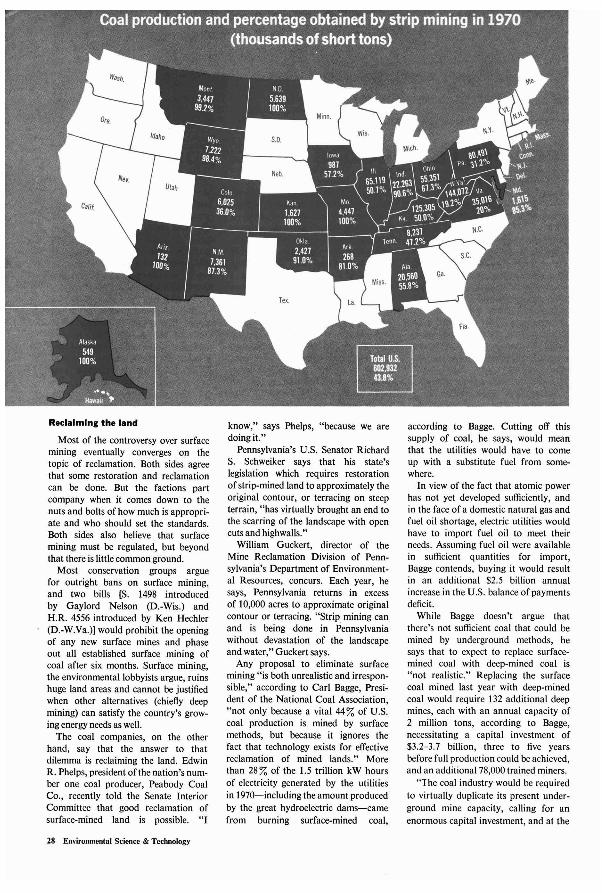
Reclaiming the land
Most of the controversy over surfacemining eventually converges on thetopic of reclamation. Both sides agreethat some restoration and reclamationcan be done. But the factions partcompany when it comes down to thenuts and bolts of how much is appropriate and who should set the standards.Both sides also believe that surfacemining must be regulated, but beyondthat there is little common ground.
Most conservation groups arguefor outright bans on surface mining,and two bills [So 1498 introducedby Gaylord Nelson (D.-Wis.) andH.R. 4556 introduced by Ken Hechler(D.-W.Va.)] would prohibit the openingof any new surface mines and phaseout all established surface mining ofcoal after six months. Surface mining,the environmental lobbyists argue, ruinshuge land areas and cannot be justifiedwhen other alternatives (chiefly deepmining) can satisfy the country's growing energy needs as well.
The coal companies, on the otherhand, say that the answer to thatdilemma is reclaiming the land. EdwinR. Phelps, president of the nation's number one coal producer, Peabody CoalCo., recently told the Senate InteriorCommittee that good reclamation ofsurface-mined land is possible. "I
28 Environmental Science & Technology
know," says Phelps, "because we aredoing it."
Pennsylvania's U.S. Senator RichardS. Schweiker says that his state'slegislation which requires restorationof strip-mined land to approximately theoriginal contour, or terracing on steepterrain, "has virtually brought an end tothe scarring of the landscape with opencuts and highwalls."
William Guckert, director of theMine Reclamation Division of Pennsylvania's Department of Environmental Resources, concurs. Each year, hesays, Pennsylvania returns in excessof 10,000 acres to approximate originalcontour or terracing. "Strip mining canand is being done in Pennsylvaniawithout devastation of the landscapeand water," Guckert says.
Any proposal to eliminate surfacemining "is both unrealistic and irresponsible," according to Carl Bagge, President of the National Coal Association,"not only because a vital 44 % of U.S.coal production is mined by surfacemethods, but because it ignores thefact that technology exists for effectivereclamation of mined lands." Morethan 28 % of the 1.5 trillion kW hoursof electricity generated by the utilitiesin 1970-including the amount producedby the great hydroelectric dams-camefrom burning surface-mined coal,
according to Bagge. Cutting off thissupply of coal, he says, would meanthat the utilities would have to comeup with a substitute fuel from somewhere.
In view of the fact that atomic powerhas not yet developed sufficiently, andin the face of a domestic natural gas andfuel oil shortage, electric utilities wouldhave to import fuel oil to meet theirneeds. Assuming fuel oil were availablein sufficient quantities for import,Bagge contends, buying it would resultin an additional $2.5 billion annualincrease in the U.S. balance of paymentsdeficit.
While Bagge doesn't argue thatthere's not sufficient coal that could bemined by underground methods, hesays that to expect to replace surfacemined coal with deep-mined coal is"not realistic." Replacing the surfacecoal mined last year with deep-minedcoal would require 132 additional deepmines, each with an annual capacity of2 million tons, according to Bagge,necessitating a capital investment of$3.2-3.7 billion, three to five yearsbefore full production could be achieved,and an additional 78,000 trained miners.
"The coal industry would be requiredto virtually duplicate its present underground mine capacity, calling for anenormous capital investment, and al the
same time be required to write offas a loss its existing investment insurface mining and reserves...· Baggewarns. "To prohibit surface miningwould have disastrous results for thenation and its constantly increasingneed for energy."
The major argument for retainingstrip mining is that it is cheaper. safer.and better than deep mining becauseit wastes less coal.
Peabody's Phelps admits that thereare vast reserves that can be minedby the underground method. but notesthere are "serious limits" on expansionof underground mining. Much of theU.S. coal reserve. Phelps says. "liesunder strata too shallow. or too unstable.to support a roof safely so they cannotbe recovered by underground methods."
In addition. according to Phelps.to open an underground mine requiresat least three years. Underground miningis generally "more costly, less efficient.and more hazardous than surface mining." About half of the coal in an underground mine must be left to supportthe roof. Phelps says. but recovery ofcoal from surface mining "approaches100%."
Real costs
The conservation groups don't quitesee it that way. Strip mining is notcheaper. they argue. it's just thatstrippers don't count the real cost.The Conservation Foundation's Malcolm Baldwin says that coal obtainedby strip mining is "extremely costly."Besides the costs to the strip operatorand the consumer. some costs "arepassed onto society as a whole,"Baldwin says. While some costs. suchas the damage to nearby homes frommudslides are measureable. accordingto Baldwin, others. such as the socialeffects of coal stripping. are impossibleto calculate. "The difficulty of measuringsuch costs should not lead to the erroneous conclusion that they are insignificant; they are merely elusive."
Among the effects of strip miningmost costly to society. Baldwin notes.are water pollution caused by acidleaching, siltation and erosion; floodingpotential that may be increased bysediment which decreases carrying ca·pacity of streams. destruction of fish andwildlife and destruction of flora; damage to personal property from bla.stingand slides, loss of aesthetic values, andmore direct economic losses caused byerosion of the long-term tax base asstripped property is devalued.
Reclamation could help. according
to Baldwin. but it is expensive. "Strippersrarely spend more than $300jacre onfilling. although the few studies onrestoring contour strip mines to theirprevious slope conditions indicate muchhigher costs." Baldwin says. One suchstudy. he adds. shows that the cost ofrestoring a natural slope was $15.73 perlinear foot of highwall or about $2700per acre.
Hard economics aside. conservationists argue that aesthetic values must be
·duly considered. "To many persons.the scars left by strip mining in theform of naked spoil banks and highwalls. choked streams. and opentrenches create mile after mile ofunrelieved ugliness." the ConservationFoundation's Baldwin says.
Most of the bills before the Congressrefer to unquantifiable considerationssuch as aesthetics and natural beauty."I recognize the good intentions behindthese terms. but they can be mischievousin effect." Peabody's Phelps says."Beauty is indeed in the eye of thebeholder and impossible to define.Nature created the Badlands of SouthDakota and they were made a nationalmonument. but if any surface minerduplicated them. even on a small scale.it would be called a national disgrace."
It seems almost certain that someform of national regulation for stripmining is in the offing. The reasonmost often given is that state regulationsimply has not worked. Twenty-sixstates have laws regulating surfacemining. Of the 23 coal-producing states.only four (Alaska. Arizona. Missouri.and New Mexico) do not regulate thecoal strippers. But even Kentucky.West Virginia. and Pennsylvania-stateswhich are often cited as models oftough regulations-still have difficultyregulating the strippers. There are twobasic reasons for the failure of stateregulations. according to the SierraClub's Peter Borrelli. The first is lack ofenforcement. "The feeble regulatoryefforts of West Virginia and Kentuckyare just no match for the immensepolitical and economic power of thecoal industry," Borrelli charges. "Lackof enforcement is less notorious inPennsylvania. though quite prevalent."
The second is that laws specify thesteps to be taken instead of results to beachieved, he says. Thus while statesmay require performance bonds.grading, contouring, and planting, it'snot good enough. Borrelli says. "Ultimately, no state holds the strip mineoperator accountable for the conditionof the land he leaves. nor requires
him to meet any proper standard ofreclamation." he adds.
Federal regulation
If the Congress will not ban stripmining altogether-and the environmental groups are under no delusionthat it will-the very least conservationists want is a series of tough federalregulations which limit the degreeof slope that can be tackled by thestrippers. restrict highwalls and thedepth of overburden that can beremoved. ban stripping near waterways.and provide for citizen suits.
The strippers. on the other hand.want no such specific regulations.They would prefer a law which wouldleave primary responsibility for regulation in the hands of the states. andwould allow the federal governmentto intervene only if states are unableor unwilling to regulate effectively.
Of all the bills currently beforeCongress. S. 1176. "The Mined AreaProtection Act of 1971," introducedby Senator Henry Jackson (D.-Wash.)and backed by the administration.would seem to be a model for thelegislation likely to come. S. 1176 wouldregulate both surface and undergroundmining. The bill sets up broad guidelines and places administrative responsibility with the Department of Interior.Primary responsibility for regulatingmining rests with the states. but provision is made for federal interventionin case states do not meet their obligations.
Just when such legislation is likely tocome into effect is anybody's guess. Butthe environmental pressure groups willnot let up in their lobbying efforts onCapitol Hill. Ironically perhaps. thestrippers too are anxious for speedycongressional action. With the growingpublic outcry against strip mining in allforms. the major coal companies andlabor unions are more anxious than everfor appropriate federal guidelines tofollow. It is the fly-by-night operator.they charge. who cuts corners to competeand does not reclaim his land. Such irresponsible practices. they maintain.threaten the posture of the whole stripping industry by rankling public opinion.Unless these operators are brought under firm control. they reason. publicoutcry for a total ban on strip miningmay be so loud that Congress will haveto listen.
And an out-and-out ban on stripmining, they maintain. could be disastrous both for business and theeconomy of the nation. HMM
Volume 6, Number I, January 1972 29

30 Environmental Science & Technology
feature
pollution and poisoningHigh lead levels are dangerous to man, and
ambient concentrations are presently rising
Stephen K. Hall, Southern Illinois University, Edswardsville, III. 62025
Lead has been mined and used byman for many years. Widespread earlyapplications of lead are readily understood in light of its many desirableproperties-relatively easily refined fromnatural ores, ductility, high resistanceto corrosion, and other properties.
In both Greek and Roman culture,lead was used for manufacturing cookingutensils of the wealthy and in the leadpipes for the extensive plumbing systemsof their homes. Studies indicate thatRoman civilization deteriorated largelyas a result of extensive lead poisoning(high incidence of infant mortality,mental retardation, and sterility) inthe ruling class. This theory is supportedby data showing a high lead concentration in the bones of their remains.
Of the nonferrous metals, lead isone of the most widely used in industryand everyday life. The annual consumption in the U.S. alone is well above onemillion tons. The storage battery industry is the largest consumer, about 40 %,and the petroleum industry consumesabout 20%, producing lead alkyls asgasoline additives. These 300,000 tons oflead are, of course, added directlyinto the ambient air. By contrast,only about 45 % of the total lead consumed is recovered from metal products and batteries.
Today lead is an ubiquitous elementpresent in food, water, and air. Leadaerosol is a common air contaminant.Dated samples of snow in northernGreenland indicate that up to 1750,there were about 20 Jlg of lead perton of ice until the Industrial Revolution. By 1860, this had increased to50 Jlg/ton. The proliferation of theautomobile since World War II alsoresulted in sharp increases-in 1940,80 Jlg; in 1950, 120 Jlg; and in 1965,210 Jlg. In the past two decades, man'scontinuing use of lead has produced an
environmental level far above thatwhich would exist naturally, and thiscould have grave consequences onhuman health.
Sources of lead
Lead is a natural constituent ofsoil, water, vegetation, animal life,and air. Significant sources of naturallyoccurring lead include dust from soilsand particles from volcanoes. In contrast to certain other metals such asmercury, lead in its elemental form isnot a major source ofpoisoning.
In medieval times, the practice of"sweeting" wine with lead or leadacetate became a serious toxicologicalproblem. Even today, alcoholic beverages of illicit origin are occasionallyincriminated as the source of leadpoisoning. Old automobile radiatorsare often used as the condenser component in illicit stills and containenough solder to cause dangerouscontamination of the "moonshine."Lead encephalopathy (disease of thebrain), nephritis (disease of the kidneys)with gout, and other lead-related conditions have been reported in moonshineconsumers.
Until the 1950's, most interior paintscontained lead pigments which were amajor source of childhood lead poisoning. Since then, lead oxide has beenreplaced by titanium dioxide. However,some old houses were painted countlesstimes with leaded paint, and thickchips of leaded paint fall off as thewalls and ceilings peel. Putty alsocontains lead and is even more likelyto be found in substandard dwellings.Since children between the ages of oneand four or five ingest nonfood particlesof all types, about 8 % of children inghetto areas suffer from some degreeoflead poisoning.
Another major lead source is earthen-
ware pottery improperly glazed withlead. Large amounts of lead may beleached out of the glaze into certainfoods. Today, man continues to pollutehis environment with lead from othersources such as manufacturing, useof pesticides, incineration of refuse,and combustion of coal and leadedgasoline. Available data indicate thatcombustion of leaded gasoline' is themajor source of atmospheric lead inurban areas.
Atmospheric lead
Antiknock agents of lead alkyls,in the form of tetraethyllead (TEL)
or tetramethyllead (TML), have beenadded to most gasoline since 1923.Their use rapidly became a cause forconcern because lead intoxication andeven death occurred among those occupationally exposed. In 1925, the U.S.Surgeon General appointed a committeeto investigate possible public healthhazards in the manufacture, distribution,or use of leaded gasoline. In the following year, the committee proposed a set ofregulations which were concerned onlywith precautions in manufacture anddistribution. The proposed regulationswere adopted voluntarily by the petroleum industry.
About 1930, an attack on the significance of lead as a hazard to the generalpublic began, but for the following 30years, there was little interest in thepotential environmental pollution problem of lead. Then in 1958, the EthylCorp. sought and was granted anincrease in the concentration of leadin gasoline by the Surgeon General.Today, the amount of TEL ranges from2 to 4 g/gal of gasoline.
A survey in 1964 indicated only 88cases of TEL poisoning reported inthe U.S. and Canada, subsequent toadoption of the regulations in 1926,
Volume 6, Number t, January t972 31
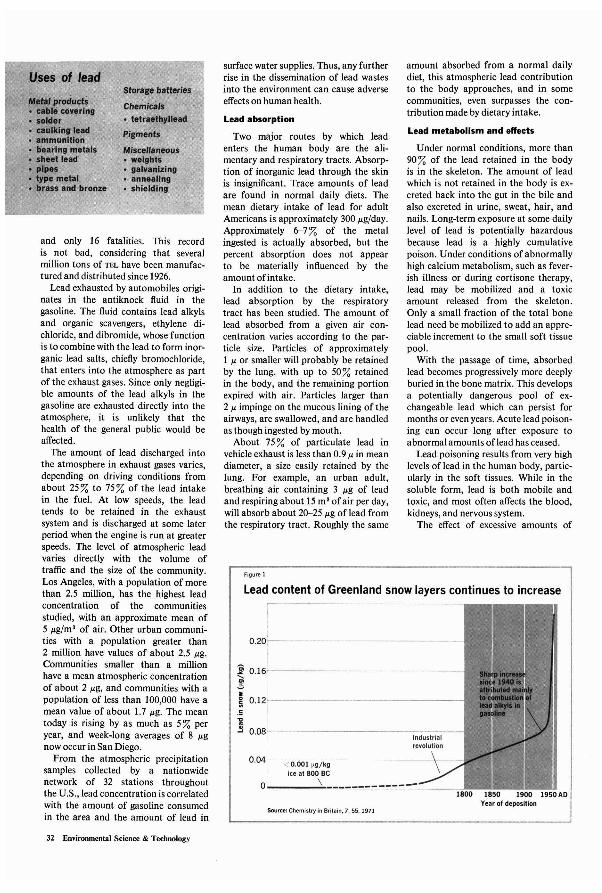
and only 16 fatalities. This recordis not bad, considering that severalmillion tons of TEL have been manufactured and distributed since 1926.
Lead exhausted by automobiles originates in the antiknock fluid in thegasoline. The fluid contains lead alkylsand organic scavengers, ethylene dichloride, and dibromide, whose functionis to combine with the lead to form inorganic lead salts, chiefly bromochloride,that enters into the atmosphere as partof the exhaust gases. Since only negligible amounts of the lead alkyls in thegasoline are exhausted directly into theatmosphere, it is unlikely that thehealth of the general public would beaffected.
The amount of lead discharged intothe atmosphere in exhaust gases varies,depending on driving conditions fromabout 25 % to 75 % of the lead intakein the fuel. At low speeds, the leadtends to be retained in the exhaustsystem and is dis'charged at some laterperiod when the engine is run at greaterspeeds. The level of atmospheric leadvaries directly with the volume oftraffic and the size of the community.Los Angeles, with a population of morethan 2.5 million, has the highest leadconcentration of the communitiesstudied, with an approximate mean of5 IJg/m' of air. Other urban communities with a population greater than2 million have values of about 2.5 IJg.Communities smaller than a millionhave a mean atmospheric concentrationof about 2 IJg, and communities with apopulation of less than 100,000 have amean value of about 1.7 IJg. The meantoday is rising by as much as 5% peryear, and week-long averages of 8 IJgnow occur in San Diego.
From the atmospheric precipitationsamples collected by a nationwidenetwork of 32 stations throughoutthe U.S., lead concentration is correlatedwith the amount of gasoline consumedin the area and the amount of lead in
Source: Chemistry in Britain, 7, 55, 1971
Lead content of Greenland snow layers continues to increase
amount absorbed from a normal dailydiet, this atmospheric lead contributionto the body approaches, and in somecommunities, even surpasses the contribution made by dietary intake.
Lead metabolism and elfects
Under normal conditions, more than90 % of the lead retained in the bodyis in the skeleton. The amount of leadwhich is not retained in the body is excreted back into the gut in the bile andalso excreted in urine, sweat, hair, andnails. Long-term exposure at some dailylevel of lead is potentially hazardousbecause lead is a highly cumulativepoison. Under conditions of abnormallyhigh calcium metabolism, such as feverish illness or during cortisone therapy,lead may be mobilized and a toxicamount released from the skeleton.Only a small fraction of the total bonelead need be mobilized to add an appreciable increment to the small soft tissuepool.
With the passage of time, absorbedlead becomes progressively more deeplyburied in the bone matrix. This developsa potentially dangerous pool of exchangeable lead which can persist formonths or even years. Acute lead poisoning can occur long after exposure toabnormal amounts oflead has ceased.
Lead poisoning results from very highlevels oflead in the human body, particularly in the soft tissues. While in thesoluble form, lead is both mobile andtoxic, and most often affects the blood,kidneys, and nervous system.
The effect of excessive amounts of
0.04f---<~0~.OO=I-"9/k9ice at 800 BC
0 ....---....;\....--~-~-""-=------------1800 1850 1900 1950AD
Year of deposition
j 0.16f-------------------"-$~ 0.12f--------------------e..,~ O.08f--..--·------------.,--,-.,-
Industrialrevolution
0.20
surface water supplies. Thus, any furtherrise in the dissemination of lead wastesinto the environment can cause adverseeffects on human health.
Lead absorption
Two major routes by which leadenters the human body are the alimentary and respiratory tracts. Absorption of inorganic lead through the skinis insignificant. Trace amounts of leadare found in normal daily diets. Themean dietary intake of lead for adultAmericans is approximately 300 IJg/day.Approximately 6-7% of the metalingested is actually absorbed, but thepercent absorption does not appearto be materially influenced by theamount of intake.
In addition to the dietary intake,lead absorption by the respiratorytract has been studied. The amount oflead absorbed from a given air concentration varies according to the particle size. Particles of approximatelyI IJ or smaller will probably be retainedby the lung, with up to 50% retainedin the body, and the remaining portionexpired with air. Particles larger than2 IJ impinge on the mucous lining of theairways, are swallowed, and are handledas though ingested by mouth.
About 75 % of particulate lead invehicle exhaust is less than 0.91J in meandiameter, a size easily retained by thelung. For example, an urban adult,breathing air containing 3 IJg of leadand respiring about 15 m' of air per day,will absorb about 20-25 IJg of lead fromthe respiratory tract. Roughly the same
Figure 1
Storage batteries
ChemlciJ/.• tetraethyllead
Pi~ments
Miscellaneous• weights• galvanizing• annealing• shielding
Uses of lead
Metal productS• cab" covering• solder• caulking lead• ammunition• .arlni metals• sheet lead• piPes• type metal• brass and bronze
32 Em'ironmental Science & Technology
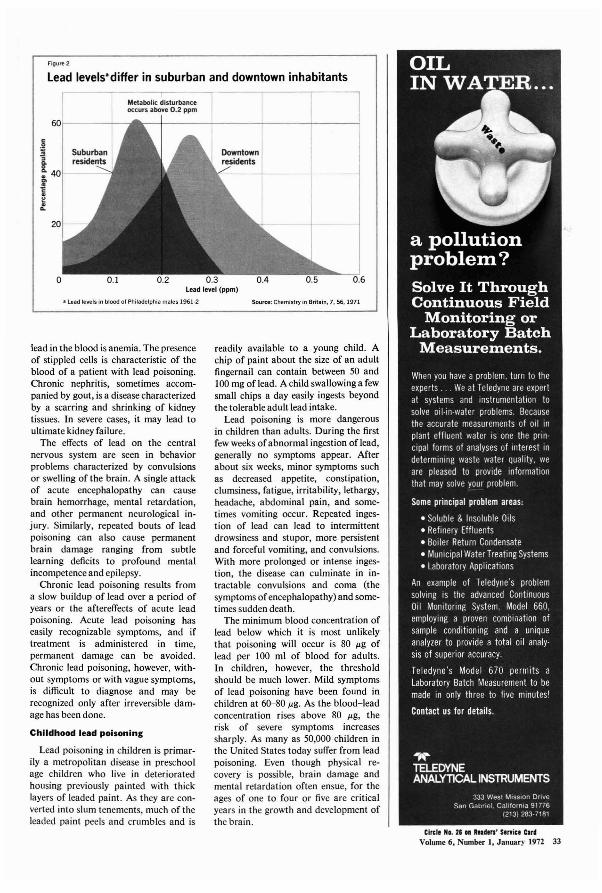
lead levels'differ in suburban and downtown inhabitants
a Lead levels in blood of Philadelphia males 1961-2
0.60.50.4
Source: Chemistry in Britain, 7. 56,1971
readily available to a young child. Achip of paint about the size of an adultfingernail can contain between 50 and100 mg of lead. A child swallowing a fewsmall chips a day easily ingests beyondthe tolerable adult lead intake.
Lead poisoning is more dangerousin children than adults. During the firstfew weeks of abnormal ingestion of lead,generally no symptoms appear. Afterabout six weeks, minor symptoms suchas decreased appetite, constipation,clumsiness, fatigue, irritability, lethargy,headache, abdominal pain, and sometimes vomiting occur. Repeated ingestion of lead can lead to intermittentdrowsiness and stupor, more persistentand forceful vomiting, and convulsions.With more prolonged or intense ingestion, the disease can culminate in intractable convulsions and coma (thesymptoms ofencephalopathy) and sometimes sudden death.
The minimum blood concentration oflead below which it is most unlikelythat poisoning will occur is 80 J,lg oflead per 100 ml of blood for adults.In children, however, the thresholdshould be much lower. Mild symptomsof lead poisoning have been found inchildren at 60-80 J,lg. As the blood-leadconcentration rises above 80 J,lg, therisk of severe symptoms increasessharply. As many as 50,000 children inthe United States today suffer from leadpoisoning. Even though physical recovery is possible, brain damage andmental retardation often ensue, for theages of one to four or five are criticalyears in the growth and development ofthe brain.
0.3Lead level (ppm)
0.20.1o
60f----.--,
lead in the blood is anemia. The presenceof stippled cells is characteristic of theblood of a patient with lead poisoning.Chronic nephritis, sometimes accompanied by gout, is a disease characterizedby a scarring and shrinking of kidneytissues. In severe cases, it may lead toultimate kidney failure.
The effects of lead on the centralnervous system are seen in behaviorproblems characterized by convulsionsor swelling of the brain. A single attackof acute encephalopathy can causebrain hemorrhage, mental retardation,and other permanent neurological injury. Similarly, repeated bouts of leadpoisoning can also cause permanentbrain damage ranging from subtlelearning deficits to profound mentalincompetence and epilepsy.
Chronic lead poisoning results froma slow buildup of lead over a period ofyears or the aftereffects of acute leadpoisoning. Acute lead poisoning haseasily recognizable symptoms, and iftreatment is administered in time,permanent damage can be avoided.Chronic lead poisoning, however, without symptoms or with vague symptoms,is difficult to diagnose and may berecognized only after irreversible damage has been done.
Childhood lead poisoning
Lead poisoning in children is primarily a metropolitan disease in preschoolage children who live in deterioratedhousing previously painted with thicklayers of leaded paint. As they are converted into slum tenements, much of theleaded paint peels and crumbles and is
Figure 2
Circle HI. 21 II Reallers' Se"ice Car'Volume 6, Number 1, January 1972 33

Circle No. 20 on Rnders' Ser,ice end
34 Environmental Science & Technology
Le.d pollonlnl control
The most frequently used lead poisoning treatment is to bind the soluble leadto chelating agents which remove leadions from soft tissues and prevent deposition of lead on the surface of the redblood cells. With chelating agents, highlead levels in tissues can be rapidly reduced to levels approaching normal, andadverse metabolic effects can be promptlysuppressed. However, if there is a largeresidue of lead in the stomach, chelatesmay encourage such rapid absorption oflead that death occurs. Chelates mayalso release lead already stored in thebones, causing further complications.Chelating agents frequently used totreat lead poisoning are calcium disodium ethylenediamine tetraacetate(EDTA), 2,3-dimercaptopropanol orBritish Anti-Lewisite (BAL), and d-penicillamine.
Before chelating agents were availableto treat lead poisoning, about twothirds of all children with lead encephalopathy died. Now the mortality rateis less than 5%. Unfortunately, treatment has not substantially reducedbrain damage and mental retardationin the survivors.
Among the various substances thatman concentrates in his immediate environment, lead wastes have been accumulating rapidly during the last century. As far as is known, lead is not atrace metal essential to nutrition.
One must remember that lead absorbed in seemingly harmless f tracequantities over a long period of timecan accumulate to exceed the thresholdlevel for potential poisoning and producedelayed toxic effects. Concentrationsof lead in soft tissues as well as in bonescontinues to rise from birth through thefourth or fifth decade of life. Furthermore, concentrations are higher in theU. S. than in other parts of the world.
Normal concentrations of lead inadults are below 40 /Lgf\OO ml of blood.The average concentration of lead inAmericans is 27 /Lg. The question iswhether this average is normal orwhether it represents a serious increasebeginning with adding TEL to gasolineand thereby reflecting documented increase in environmental lead. If this isso, then any further increase might wellbe dangerous. Unfortunately, there isno baseline with which to compare contemporary populations. Low level effectsare yet to be recognized.
Since 50 % of airborne lead can beabsorbed from diet, hopefully, theamount of airborne lead will remainconstant since automobile and oil
Underwaler 1Camera Case IWater Current Meter
i!~Turbidimeter
Conductivity-Temperature Meter
ITfi~
Salinity-Temperature Bridge
Hydrophone
INSTRUMENTS, INC.
CEDAR GROVE OPERATIONS89 COMMERCE ROADCEDAR GROve. ESSEX COUNTY, NEW JERSEY· 0700911011239·6200· TWx: 710-99.4-5781
HELPING SCIENCE AND INDUSTRY IMPROVE THE QUALITY OF LIFE
Beckman
If you think you need abig bUdgetand costly instruments to set upacomplete field curriculum inwater ecology...
...think again. Announcing ENVIROLINE - abrand new line of low cost field instruments from Beckman designed to help your students learn more about fresh and seawater environments.Priced to put a complete program in water ecology well withinthe reach of every school budget, the instruments can be orderedindividually or complete as a kit.Included with. each instrument is a comprehensive, detailedmanual.covenng theory, operation and practical experiments,suggesting numerous ways to incorporate student field experiments in current curriculums.~end for free literature. Individual data sheets fully describe eachInstrument shown above and the kinds of determinations whichcan ~e made. Use the Reader Service Page in this pUblication,or wnte:
WaterHeight Gauge
companies have started to eliminateleaded gasoline. Some states have lawsprohibiting leaded paints for interiorpainting. However, applying lead-freepaint over old leaded paint does notsolve the problem. When paint peels, theleaded paint again becomes availableto the child. Old leaded paint mustbe removed from substandard housing.Where rehabilitation is impossible, urban redevelopment projects should replace substandard housing.
Present American industrial standardsconsider 200 jJ.g/m' to be an acceptablelevel of occupational exposure. A knowneffect of chronic lead exposure amongindustrial workers is peripheral nervedisease, affecting primarily the motornerves of the extremities, while symptoms of acute lead poisoning are strikingly absent. Federal and state governments are reponsible for institutingeffective control measures in industry.
Whether or not lead concentrationsmeasured are hazardous to humanhealth, any further increase of lead in theenvironment will result in further concentration in some food chains, leadingultimately to toxic doses for man or forsome other important organisms. Leadpollution, therefore, must be controlled.
Additional reading
Danes, R. H., Motto, H., and Chilko,D. M., "Atmospheric Lead: Its Rela·tionship to Traffic Volume and Prox·imity to Highways," ES&T, 4, 318 (1970).
Chow, T. J. and Earl, J. L., "Lead Aerosolsin the Atmosphere: Increasing Concen·trations," Science, 169, 577 (1970).
Lazrus, A. L., Lorange, E., and Lodge,J. P., Jr., "Lead and Other Metal Ionsin United States Precipitation," ES&T,4, 55 (1970).
Habibi, K., "Characterization of Particu·late Lead in Vehicle Exhaust·Experimental Techniques," ES&T, 4, 239(1970).
Kehoe, R. A., "Toxicological Appraisalof Lead in Relation to the TolerableConcentration in the Ambient Air,"J. Air Pollul. Confr. Ass., 19, 690 (1%9).
Stephen K. Hallis assistant professor, SouthernIllinois University.He holds undergraduate degreesfrom Hong Kongand Tokyo andgraduate degreesfrom Toronto andPillsburgh. Dr. Hall is an ardent advocate of environmental education and hasdesigned a number of environmentalcourses at Southern Illinois University.
How to take scaleand corrosion out of
cooling water...
Containing no chromates and no phosphates, new OakiteENPROXT>1 555 is the answer to controlling corrosion, scale andsludge in industrial water systems without contributing to pollution. It lets you treat cooling water without getting into hot water.
A single additive answer to scale, sludge and corrosion, OakiteENPROX 555 requires no pretreatment of water. It is effectiveover a broad pH range and at high temperatures.
A liquid, ENPROX 555 may be metered into water systemsautomatically, using Oakite equipment. It is most effective appliedas a continuous threshold control for corrosion, scale and sludge,but may also be used as a periodic slug treatment. An added benefit, ENPROX 555 will gradually remove existing water scale.
ACT NOW. If you are faced with effluent restrictions now or,equally important, are looking to the future, Oakite ENPROX 555is a nonpolluting water treatment you should investigate. Write forliterature or ask your local Oakite Technical Service Representative.
without puttingpollutants in
ENVIRONMENTAL PRODUCTS DIVISION
62 years' experience helping industryuse water more efficiently
OAKITE PRODUCTS, INC., 50 VALLEY ROAD, BERKELEY HEIGHTS, N.J. 07922In Canada: OAKITE PRODUCTS OF CANADA. LTD., ONTARIO
Subsidiaries and Distributors World-wide Cable: OAKITE. BerkeleyHeightsCircle NO.1' an Readers' Service end
Volume 6, Number 1, January 1972 3S
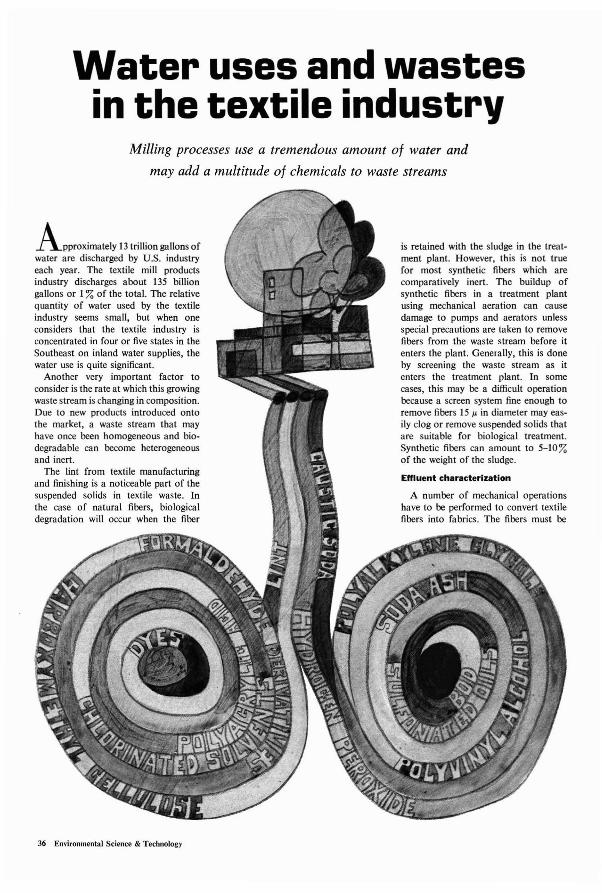
Water uses and wastesin the textile industry
Milling processes use a tremendous amount of water and
may add a multitude of chemicals to waste streams
ApproximatelY 13 trillion gallons ofwater are discharged by U.S. industryeach year. The textile mill productsindustry discharges about 135 billiongallons or 1%of the total. The relativequantity of water used by the textileindustry seems small, but when oneconsiders that the textile industry isconcentrated in four or five states in theSoutheast on inland water supplies, thewater use is quite significant.
Another very important factor toconsider is the rate at which this growingwaste stream is changing in composition.Due to new products introduced ontothe market, a waste stream that mayhave once been homogeneous and biodegradable can become heterogeneousand inert.
The lint from textile manufacturingand finishing is a noticeable part of thesuspended solids in textile waste. Inthe case of natural fibers, biologicaldegradation will occur when the fiber
36 Environmental Science & Technology
is retained with the sludge in the treatment plant. However, this is not truefor most synthetic fibers which arecomparatively inert. The buildup ofsynthetic fibers in a treatment plantusing mechanical aeration can causedamage to pumps and aerators unlessspecial precautions are taken to removefibers from the waste stream before itenters the plant. Generally, this is doneby screening the waste stream as itenters the treatment plant. In somecases, this may be a difficult operationbecause a screen system fine enough toremove fibers 15 /l in diameter may easily clog or remove suspended solids thatare suitable for biological treatment.Synthetic fibers can amount to 5-10%of the weight of the sludge.
Effluent characterization
A number of mechanical operationshave to be performed to convert textilefibers into fabrics. The fibers must be
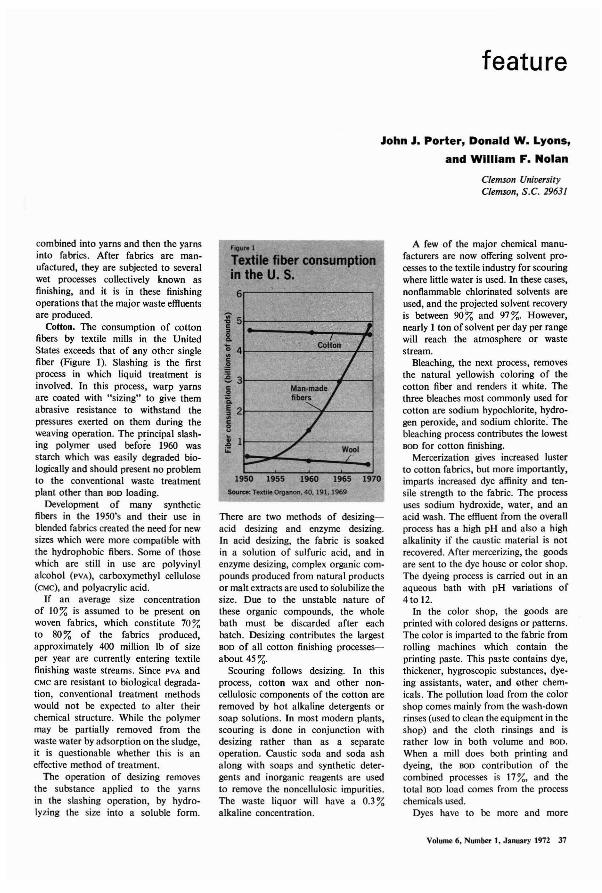
feature
John J. Porter, Donald W. Lyons,
and William F. Nolan
Clemson UniversityClemson, S.C. 29631
combined into yarns and then the yarnsinto fabrics. After fabrics are manufactured, they are subjected to severalwet processes collectively known asfinisbing, and it is in these finishingoperations that the major waste effluentsare produced.
Cotton. The consumption of cottonfibers by textile mills in the UnitedStates exceeds that of any oth~r singlefiber (Figure I). Slashing is the firstprocess in which liquid treatment isinvolved. In this process, warp yarnsare coated with "sizing" to give themabrasive resistance to withstand thepressures exerted on them during theweaving operation. The principal slashing polymer used before 1960 wasstarch which was easily degraded biologically and should present no problemto the conventional waste treatmentplant other than BOD loading.
Development of many syntheticfibers in the 1950's and their use inblended fabrics created the need for newsizes which were more compatible withthe hydrophobic fibers. Some of thosewhich are still in use are polyvinylalcohol (PVA), carboxymethyl cellulose(CMC), and polyacrylic acid.
If an average size concentrationof 10% is assumed to be present onwoven fabrics, which constitute 70%to 80 % of the fabrics produced,approximately 400 million Ib of sizeper year are currently entering textilefinishing waste streams. Since PVA andCMC are resistant to biological degradation, conventional treatment methodswould not be expected to alter theirchemical structure. While the polymermay be partially removed from thewaste water by adsorption on the sludge,it is questionable whether this is aneffective method of treatment.
The operation of desizing removesthe substance applied to the yarnsin the slashing operation, by hydrolyzing the size into a soluble form.
FIgura 1
Textile fiber consumptionin the U. s.6,...--------...,
I 5, .,..-..--'1
" 4/-----=:;;'-"-+--1
j-31---------..~-__1
t1
2
.i;0:
1950 1955 1960 1965 1970-=T_0tD0-..40.191,l969
There are two methods of desizingacid desizing and enzyme desizing.In acid desizing, the fabric is soakedin a solution of sulfuric acid, and inenzyme desizing, complex organic compounds produced from natural productsor malt extracts are used to solubilize thesize. Due to the unstable nature ofthese organic compounds, the wholebath must be discarded after eachbatch. Desizing contributes the largestBOD of all cotton finishing processesabout 45%.
Scouring follows desizing. In thisprocess, cotton wax and other noncellulosic components of the cotton areremoved by hot alkaline detergents orsoap solutions. In most modern plants,scouring is done in conjunction withdesizing rather than as a separateoperation. Caustic soda and soda ashalong with soaps and synthetic detergents and inorganic reagents are usedto remove the noncellulosic impurities.The waste liquor will have a 0.3 %alkaline concentration.
A few of the major chemical manufacturers are now offering solvent processes to the textile industry for scouringwhere little water is used. In these cases,nonflammable chlorinated solvents areused, and the projected solvent recoveryis between 90% and 97%. However,nearly I ton of solvent per day per rangewill reach the atmosphere or wastestream.
Bleaching, the next process, removesthe natural yellowish coloring of thecotton fiber and renders it white. Thethree bleaches most commonly used forcotton are sodium hypochlorite, hydrogen peroxide, and sodium chlorite: Thebleaching process contributes the lowestBOD for cotton finishing.
Mercerization gives increased lusterto cotton fabrics, but more importantly,imparts increased dye affinity and tensile strength to the fabric. The processuses sodium hydroxide, water, and anacid wash. The effluent from the overallprocess has a high pH and also a highalkalinity if the caustic material is notrecovered. After mercerizing, the goodsare sent to the dye house or color shop.The dyeing process is carried out in anaqueous bath with pH variations of4to 12.
In the color shop, the goods areprinted with colored designs or patterns.The color is imparted to the fabric fromrolling machines which contain theprinting paste. This paste contains dye,thickener, hygroscopic substances, dyeing assistants, water, and ether chemicals. The pollution load from the colorshop comes mainly from the wash-downrinses (used to clean the equipment in theshop) and the cloth rinsings and israther low in both volume and BOD.
When a mill does both printing anddyeing, the BOD contribution of thecombined processes is 17 %, and thetotal BOD load comes from the processchemicals used.
Dyes have to be more and more
Volume 6, Number I, January 1972 37
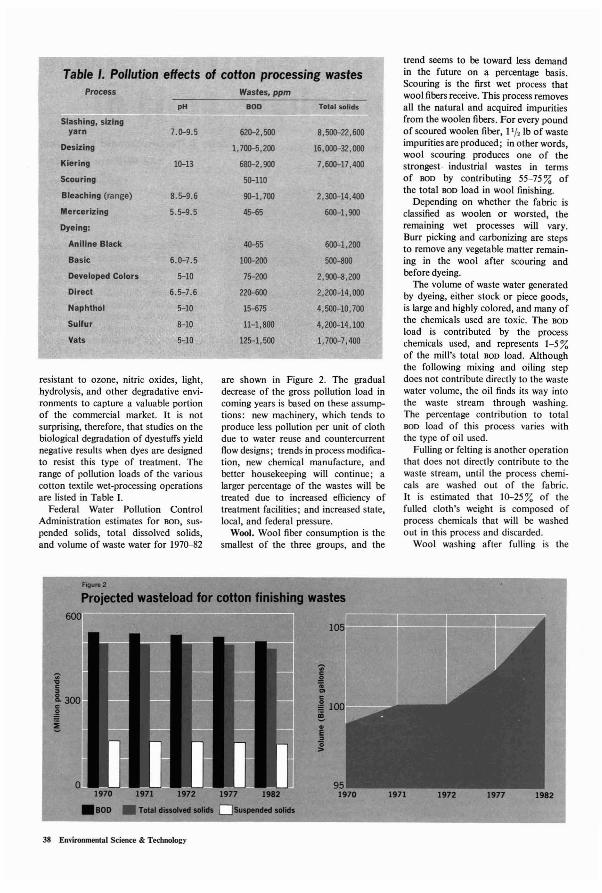
Table I. Pollution effects of cotton processing wastesProcess Wastes, ppm
pH 800 Total solids
Slashing, sizingyarn 7.0-9.5 620-2,500 8,500-22,600
Desizlng 1,700-5,200 16,000-32,000
Klerlng 10-13 680-2,900 7,600-17 ,400
Scouring 50-110
Bleaching (range) 8.5-9.6 90-1,700 2,300-14,400
Mercerizing 5.5-9.5 45-65 600-1,900
Dyeing:
Aniline Black 40-55 600-1,200
Basic 6.0-7.5 100-200 500-800
Developed Colors 5-10 75-200 2,900-8,200
Direct 6.5-7.6 220-600 2,200-14,000
Naphthol 5-10 15-675 4,500-10,700
Sulfur 8-10 11-1,800 4,200-14,100
Vats 5-10 125-1,500 1,700-7,400
resistant to ozone, nitric oxides, light,hydrolysis, and other degradative environments to capture a valuable portionof the commercial market. It is notsurprising, therefore, that studies on thebiological degradation of dyestuffs yieldnegative results when dyes are designedto resist this type of treatment. Therange of pollution loads of the variouscotton textile wet-processing operationsare listed in Table 1.
Federal Water Pollution ControlAdministration estimates for BOD, suspended solids, total dissolved solids,and volume of waste water for 1970-82
are shown in Figure 2. The gradualdecrease of the gross pollution load incoming years is based on these assumptions: new machinery, which tends toproduce less pollution per unit of clothdue to water reuse and countercurrentflow designs; trends in process modification, new chemical manufacture, andbetter housekeeping will continue; alarger percentage of the wastes will betreated due to increased efficiency oftreatment facilities; and increased state,local, and federal pressure.
Wool. Wool fiber consumption is thesmallest of the three groups, and the
trend seems to be toward less demandin the future on a percentage basis.Scouring is the first wet process thatwool fibers receive. This process removesall the natural and acquired impuritiesfrom the woolen fibers. For every poundof scoured woolen fiber, II/. Ib of wasteimpurities are produced; in other words,wool scouring produces one of thestrongest. industrial wastes in termsof BOD by contributing 55-75% ofthe total BOD load in wool finishing.
Depending on whether the fabric isclassified as woolen or worsted, theremaining wet processes will vary.Burr picking and carbonizing are stepsto remove any vegetable matter remaining in the wool after scouring andbefore dyeing.
The volume of waste water generatedby dyeing, either stock or piece goods,is large and highly colored, and many ofthe chemicals used are toxic. The BOD
load is contributed by the processchemicals used, and represents 1-5 %of the mill's total BOD load. Althoughthe following mixing and oiling stepdoes not contribute directly to the wastewater volume, the oil finds its way intothe waste stream through washing.The percentage contribution to totalBOO load of this process varies withthe type of oil used.
Fulling or felting is another operationthat does not directly contribute to thewaste stream, until the process chemicals are washed out of the fabric.It is estimated that 10-25 % of thefulled cloth's weight is composed ofprocess chemicals that will be washedout in this process and discarded.
Wool washing after fulling is the
Flgunt 2
PrOjected wasteload for cotton finishing wastes
1970 1971 1972
.80D • TotaI ....... 1lIlldI
38 Environmental Science & Technology
1977 lt82
SUIpInded IlIlldI
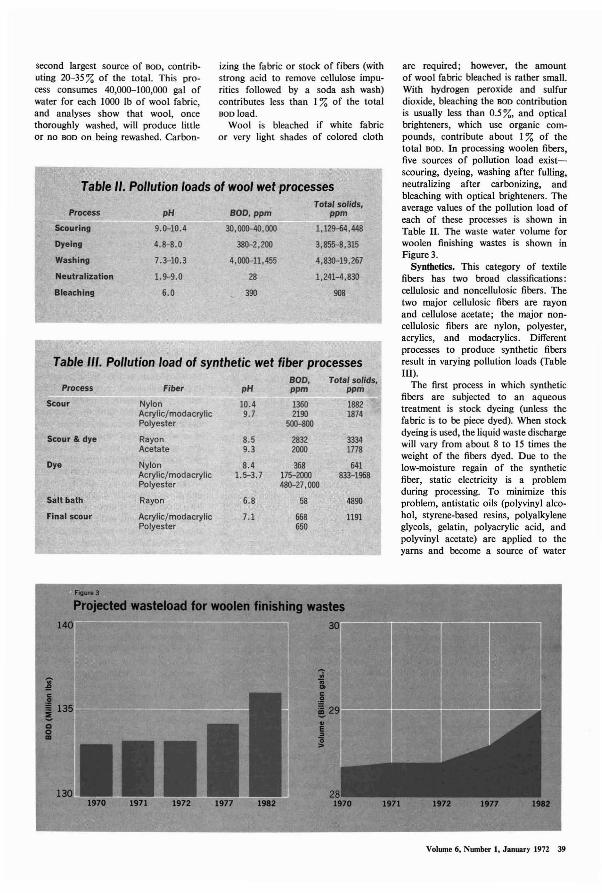
Table II. Pollution loads of wool wet processes
BOD, ppmTotal so/ids,
Process pH ppm
Scouring 9.0-10.4 30, ,o-4Oסס ()()() 1,129-64,448
Dyeing 4.8-8.0 380-2,200 3,855-8,315
Washing 7.3-10.3 4,OOO-ll,455 4,830-19,267
Neutralization 1.9-9.0 28 1,241-4,830
Bleaching 6.0 390 908
are required; however, the amountof wool fabric bleached is rather small.With hydrogen peroxide and sulfurdioxide, bleaching the BOD contributionis usually less than 0.5 %, and opticalbrighteners, which use organic compounds, contribute about 1% of thetotal BOD. In processing woolen fibers,five sources of pollution load existscouring, dyeing, washing after fulling,neutralizing after carbonizing, andbleaching with optical brighteners. Theaverage values of the pollution load ofeach of these processes is shown inTable II. The waste water volume forwoolen finishing wastes is shown inFigure 3.
Synthetics. This category of textilefibers has two broad classifications:cellulosic and noncellulosic fibers. Thetwo major cellulosic fibers are rayonand cellulose acetate; the major noncellulosic fibers are nylon, polyester,acrylics, and modacrylics. Differentprocesses to produce synthetic fibersresult in varying pollution loads (TableIII).
The first process in which syntheticfibers are subjected to an aqueoustreatment is stock dyeing (unless thefabric is to be piece dyed). When stockdyeing is used, the liquid waste dischargewill vary from about 8 to 15 times theweight of the fibers dyed. Due to thelow-moisture regain of the syntheticfiber, static electricity is a problemduring processing. To minimize thisproblem, antistatic oils (polyvinyl alcohol, styrene-based resins, polyalkyleneglycols, gelatin, polyacrylic acid, andpolyvinyl acetate) are applied to theyarns and become a source of water
izing the fabric or stock of fibers (withstrong acid to remove cellulose impurities followed by a soda ash wash)contributes less than 1% of the totalBOD load.
Wool is bleached if white fabricor very light shades of colored cloth
Table III. Pollution load of synthetic wet fiber processesBOD,
Process Fiber pH ppm
Scour Nylon 10.4 1360 1882Acrylic/modacrylic 9.7 2190 1874Polyester 500-800
Scour ~ dye Rayon 8.5 2832 3334Acetate 9.3 2000 1778
Dye Nylon 8.4 368 641Acrylic/modacrylic 1. 5-3. 7 175-2000 833-1968PolYester 480-27,000
Salt bath Rayon 6.8 58 4890
Final scour Acrylic/modacrylic 7.1 668 1191Polyester 650
second largest source of BOD, contributing 20-35% of tbe total. This process consumes 40,000-100,000 gal ofwater for each 1000 Ib of wool fabric,and analyses show that wool, oncethoroughly washed, will produce littleor no BOD on being rewashed. Carbon-
FIgIml3
Ptojected wasteload for woolen finishing
Volume 6, Number I, January 1972 39
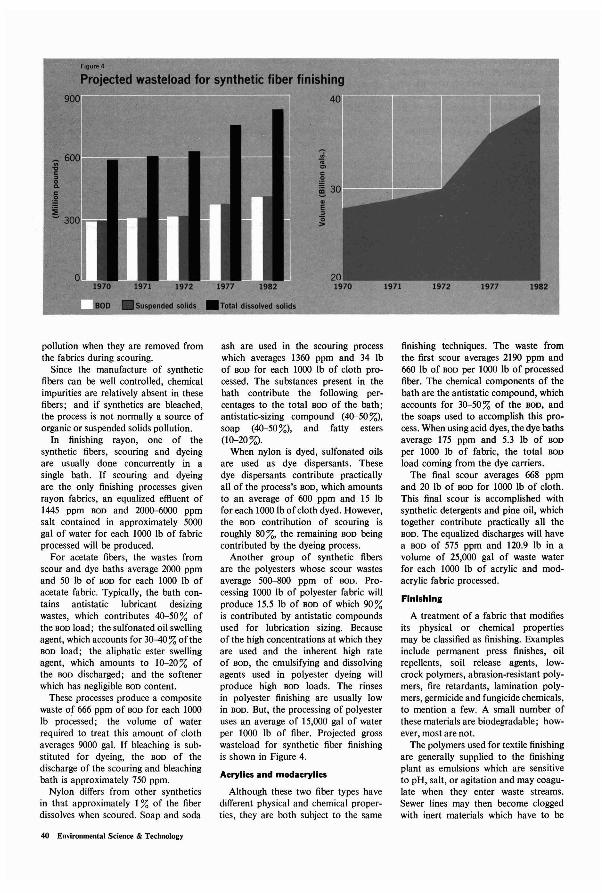
pollution when they are removed fromthe fabrics during scouring.
Since the manufacture of syntheticfibers can be well controlled, chemicalimpurities are relatively absent in thesefibers; and if synthetics are bleached,the process is not normally a source oforganic or suspended solids pollution.
In finishing rayon, one of thesynthetic fibers, scouring and dyeingare usually done concurrently in asingle bath. If scouring and dyeingare the only finishing processes givenrayon fabrics, an equalized effluent of1445 ppm BOD and 2000-6000 ppmsalt contained in approximately 5000gal of water for each 1000 lb of fabricprocessed will be produced.
For acetate fibers, the wastes fromscour and dye baths average 2000 ppmand 50 lb of BOD for each 1000 Ib ofacetate fabric. Typically, the bath contains antistatic lubricant desizingwastes, which contributes 40-50 % ofthe BOD load; the sulfonated oil swellingagent, which accounts for 30-40% of theBOD load; the aliphatic ester swellingagent, which amounts to 10-20% ofthe BOD discharged; and the softenerwhich has negligible BOD content.
These processes produce a compositewaste of 666 ppm of BOD for each 1000lb processed; the volume of waterrequired to treat this amount of clothaverages 9000 gal. If bleaching is substituted for dyeing, the BOD of thedischarge of the scouring and bleachingbath is approximately 750 ppm.
Nylon differs from other syntheticsin that approximately I % of the fiberdissolves when scoured. Soap and soda
40 Environmental Science & Technology
ash are used in the scouring processwhich averages 1360 ppm and 34 lbof BOD for each 1000 lb of cloth processed. The substances present in thebath contribute the following percentages to the total BOD of the bath;antistatic-sizing compound (40-50%),soap (40-50 %), and fatty esters(10-20%).
When nylon is dyed, sulfonated oilsare used as dye dispersants. Thesedye dispersants contribute practicallyall of the process's BOD, which amountsto an average of 600 ppm and 15 Ibfor each 1000 Ib of cloth dyed. However,the BOD contribution of scouring isroughly 80 %, the remaining BOD beingcontributed by the dyeing process.
Another group of synthetic fibersare the polyesters whose scour wastesaverage 500-800 ppm of BOD. Processing 1000 lb of polyester fabric willproduce 15.5 lb of BOD of which 90%is contributed by antistatic compoundsused for lubrication sizing. Becauseof the high concentrations at which theyare used and the inherent high rateof BOD, the emulsifying and dissolvingagents used in polyester dyeing willproduce high BOD loads. The rinsesin polyester finishing are usually lowin BOD. But, the processing of polyesteruses an average of 15,000 gal of waterper 1000 lb of fiber. Projected grosswasteload for synthetic fiber finishingis shown in Figure 4.
Acrylics and modacrylics
Although these two fiber types havedifferent physical and chemical properties, they are both subject to the same
finishing techniques. The waste fromthe first scour averages 2190 ppm and660 lb of BOD per 1000 lb of processedfiber. The chemical components of thebath are the antistatic compound, whichaccounts for 30-50 % of the BOD, andthe soaps used to accomplish this process. When using acid dyes, the dye bathsaverage 175 ppm and 5.3 Ib of BOD
per 1000 lb of fabric, the total BOD
load coming from the dye carriers.The final scour averages 668 ppm
and 20 Ib of BOD for 1000 Ib of cloth.This final scour is accomplished withsynthetic detergents and pine oil, whichtogether contribute practically all theBOD. The equalized discharges will havea BOD of 575 ppm and 120.9 lb in avolume of 25,000 gal of waste waterfor each 1000 lb of acrylic and modacrylic fabric processed.
FInishing
A treatment of a fabric that modifiesits physical or chemical propertiesmay be classified as finishing. Examplesinclude permanent press finishes, oilrepellents, soil release agents, lowcrock polymers, abrasion-resistant polymers, fire retardants, lamination polymers, germicide and fungicide chemicals,to mention a few. A small number ofthese materials are biodegradable; however, most are not.
The polymers used for textile finishingare generally supplied to the finishingplant as emulsions which are sensitiveto pH, salt, or agitation and may coagulate when they enter waste streams.Sewer lines may then become cloggedwith inert materials which have to be
Call or write today for InstrumentCatalog
To provide themost advancedinstruments for particlessampling, generating, andmonitoring.
PAPER TAPE READERAutomatically evaluates sampler tapesin percent transmission or COH units;all solid-state circuitry with BCD output: features logarithmic converterto accommodate a wide range ofsampling parameters for COH readout; processes up to 480 spots perhour; meets ASTM standards; solid·state printer available.
TAG SAMPLERCollects particles by impaction innine stages; all stainless steel con·struction; permits isokinetic samplingof velocities from 500 to 2500 feetper minute by nozzle selection; retains particles by featuring low impaction velocities; temperature up to18000Fj size ranges from 0.1 to 30microns, plus in·line filter; ideal forstack and industrial application.
FLUID ATOMIZATION AEROSOLGENERATOR MODEL 7330Size range 0.03 to 3 microns; out·put up to 1 billion particles persecond; variable dilution rates; allstainless steel contact areas. electrical·Iy neutral aerosol; liquid or solidparticles.
~f:l. ENVIRONMENTAL~r\. RESEARCH, =CORPORATION3725 North Dunlap StreetSt. Paul, Minnesota 55112 (612) 484·8591
You Can Depend on ERC
William F. Nolan received his BS intextile management and marketing(Philadelphia College of Textiles andScience) and his MS in textile science(Clemson University). His recentlycompleted thesis research covered thestate-of-the-art of water treatment intextiles. Mr. Nolan's major areas ofinterest include product management,research and development, and qualitycontrol.
Donald W. Lyons, associate professorof textiles and mechanical engineering,is also cooperating faculty memberand research advisor for the TextileResearch Institute. He received hisBS and PhD in mechanical engineering(Georgia Tech). His interests includeindustrial noise abatement, mechanicsof yarn during spinning, and applyingmicrowave heating to resin curing, amongother areas.
John J. Porter received his BS degreeIn chemical engineering and PhD inchemistry from Georgia Tech. He ispresently associate professor of textilechemistry at Clemson University. Dr.Porter's interests lie in the areas of wastewater treatment, thermodynamics ofdye adsorption, the reaction of cellulosejinishing agents, and the morphology ofjiber-[orming polymers. Address inquiriesto Dr. Porter.
removed by hand. Although the bulk ofthe polymer emulsion can be coagulatedand removed in a treatment plant,some of it remains emulsified' andis not removed by biological treatment. For complete removal of thepolymer emulsion, chemical treatmentis sometimes necessary. However, thisis an additional step which in itselfcould replace much of the need forbiological treatment.
Most of the finishes used for washand wear and permanent press fabricsare manufactured from urea, formaldehyde, melamine, and gloxal compounds. Some of these products arereadily degradable by microbial action;otbers are not. The formaldehyde derivatives can react with themselves orother chemicals in the waste stream toform insoluble products that may beremoved by sedimentation.
A class of finishing chemical thathas come into prominence in recentyears is fire retardants. Most of thecommercial fire-retardant finishes arephosphorus- and nitrogen-containingcompounds. One such compound, triaziridyl phosphine oxide (APO), couldpresent a serious problem if it gotinto a natural stream. The chemicalreactivity of APO would facilitate itshydrolysis in a waste stream and prevent the parent compound from reaching the discharge water of a treatmentplant. Whether or not these initialhydrolysis products are toxic or harmful is not known. This points to theincreasing need for the characterizationof industrial waste.
In the future, waste streams fromdifferent processing operations will haveto be isolated and treated by eitherchemical or biological methods. Thechoice of treatment will naturally dependon the composition of the stream.By using this approach, industry willhave more latitude in choosing chemicalsand processes for their inherent production advantages and not their effecton pollution.
Additional reading
"New Product Parade," Text. Cnem.Color., 1 (27), 55 (1969).
Federal Water Pollution Control Admin·istration, "Industrial Waste Profile No.4, Textile Mill Products," "The Cost ofClean Water," Vol. III, U.S. Govern·ment Printing Office, Washington D.C.(1967). '
Souther, R. H. "Textiles," IndustrialWaste Water Control, C. P. GurhamEd., Academic Press, New York N.Y.'(1965). ' ,
Evers, D., "Effluent Treatment-What IsInvolved," Int, Dyer, 143 (1), 56 (1970).
Fedor, W. S. "Textiles In the Seventies,"Chern. Eng, News, 48 (17), 64, April 20,1970.
Circle NI. 4 In Readers' Service CardVolume 6, Number 1, January 1972 41
samplestackemissionsaccurately
withtheportable
RAe TRAINTMSTAKSAMPLR
Designed and manufactured to EPAspecifications. the RAC TRAIN STAKSAMPLR system takes accurate, low costisokinetic samples of gaseous and particulate emissions from chemical andcombustion processes. This system'sefficient performance-proved by yearsof operation and hundreds of units now
Our 25th Year
in service-meets the accepted standardsfor stack sampling.
Completely portable, the RAC TRAINSTAKSAMPLR system is designed forease of installation and operation. Itincludes a nomograph that permits quickon-site calculations. For more information,write for BULLETIN 2343.
RESEARCH APPLIANCE COMPANYRoute 8. Allison Park. Pa. 15101
111I.11I1 Export Office: 1505 Race St.. Philadelphia. Pa. 19102
Environmenta//nstruments/Laboratory ProductsCircle No. 24 .n Ruders' Senin Cud
42 Enyironmental Science & Technology
currentresearch
Measurement of Suspended Solids Concentrations in
Sewage by Use of a Depolarization Method
John W. Liskowitz1 and Gerald J. Franey
American Standard Research Division, New Brunswick, N. J. 08903
.The depolarization of back-scattered polarization radiationwas used to measure the concentration of suspended solidsin sewage. The effect of such factors as variations in theparticle size of the suspended solids, solids density, color ofthe samples, refractive index of the medium, sample flow, andcoated optical windows of the sample cuvettes on the relationship between the degree of depolarization and suspendedsolid concentration was investigated. The results indicatethat this relationship is unaffected by the above factors for alimited number of meaningful samples.
Th!s investigation was undertaken to establish the feasi. bdlty of usmg depolarization of back-scattered polarIzed radIatIOn for measuring the concentration of suspendedsolids in sewage systems.
Depolarization measurements on model hydrosol systemsas described previously (Liskowitz, 1971) indicate that thedegree of depolarization is dependent on the ratio of therefractive index of the solid to that of the medium, and to thevolume concentration of particles in suspension. Correlationwith the weight concentration of suspended solids can beobtai?ed by measuring the density of the solids. ProperselectIOn of the wavelength of incident radiation, so that it iscomparable to, or smaller than, the size of the particles inthe sewage samples, will significantly reduce the effect ofparticle size on the measurement. Adaptation of the depolarization technique for monitoring the amount of suspended solids in sewage requires that the effect on the degreeof depolarization of variations in particle size of the suspended solids, solids density, color variations, and refractiveindex of the suspended medium be examined. The effects offlow rates and of coating cuvette windows with depositedsolids are also considered.
Experimental
Source Of Samples. Sewage samples from both the Middlesex County Sewerage Authority's plant (Sayreville, N. J.)(mfluent, effluent, activated-sludge pilot-plant effluent, andsludge from the clarifiers) and the Bernardsville, N. J.,
. I Present address: Dept. of Civil and Environmental Engineer.109, Newark College of Engineering, Newark, N. J. 07102. Towhom correspondence should be addressed.
plant (effluent, influent, and activated sludge) were used inthis investigation. These sources were selected to provideboth industrial and domestic sewage, and to cover a widerange of suspended solids concentration from a few partsper million to 5000 ppm.
Depolarization Measurements. Initial depolarization measurements at a scattering angle of 170°, with (polychromatic)radiation from a mercury source, were performed on nonflowing sewage samples in a sample cuvette with a diameterof 11 cm. The laboratory instrument was assembled fromcomponents taken from a Brice Phoenix light-scatteringphotometer. The complete source unit (Figure 1) consistingof a type AH-3 mercury lamp, the iris diaphragm, the cylindrical lens, and the Polaroid polarizer was mounted on anoptical bench containing two detector supports on which werefastened Brice Phoenix receiver units. The detector supportswere set at back-scattering angles of 170° and the receiverunits were directed at a point along the incident beam whichcorresponds to the center of the cylindrical sample cuvette.The width and height of the incident beam image at this pointwere 5 X 22 mm. Partitions separated the receivers and sourceunits to prevent stray source radiation from interferringwith the depolarization measurements. The degree of depolarization (EJ./En) exhibited by the sewage samples wasobtained by measuring E1. (l/2 depolarized component) andEn (polarized plus 1/2 depolarized component) simultaneouslyby use of two analyzers positioned in front of two IP21 photomultipliers. All measurements were carried out in a darkenedroom.
The supposedly matched photomultipliers used in thelaboratory suspended solids monitor were found to exhibitdifferent responses to the same light intensity. This problemwas overcome by regulating the power supplies to the photomultipliers so that they exhibited the same linear response todifferent levels of radiation.
The samples were continuously stirred during the measurement to maintain the solids in suspension. Without stirring,an immediate decrease in the degree of depolarization wasobserved as the particles settled.
A study of the rate of buildup of solids on optical surfaceswas carried out by submerging four 1000-ml pyrex beakers inan activated sludge tank at the Bernardsville sewage treatment plant. Beakers were removed from the activated sludgetank after 42 hr, 6 days, 8 days, and 1 month. Depolarizationmeasurements were performed on Middlesex influent by use ofthe surface of the beaker that contained the largest amount ofdeposited solids, and then by repeating these measurementson the same influent after the deposited solids were removed.
Volume 6, Number 1, January 1972 43
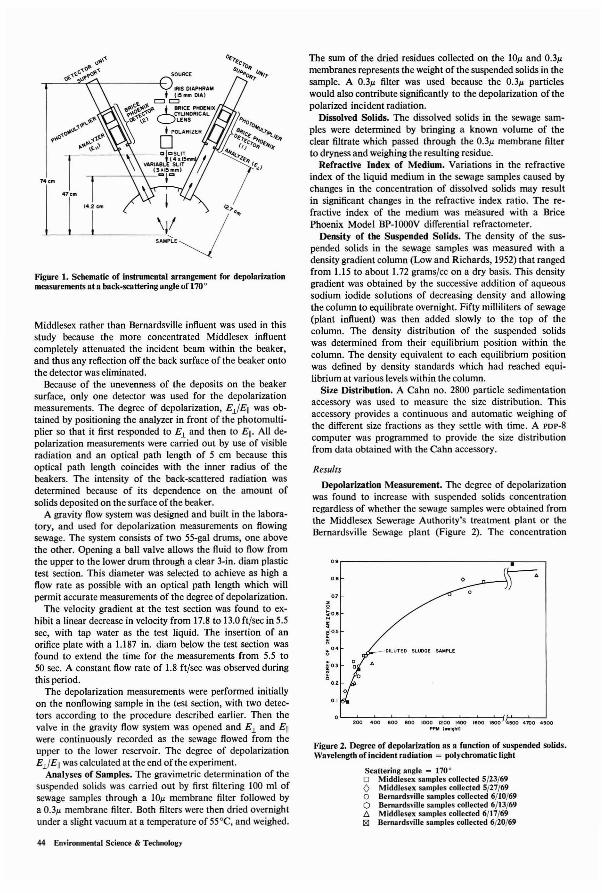
O••,--------------~--~
200 400 600 800 1000 1200 1400 1600 1800 4500 4700 4'00PPM \••191'111
or
DILUTED SLUDGE SAMPLE
~
~O.6
~
103
:5 0.4
!O.3 CC
0.2
0.1
The sum of the dried residues collected on the 101' and 0.31'membranes represents the weight of the suspended solids in thesample. A 0.31' filter was used because the 0.31' particleswould also contribute significantly to the depolarization of thepolarized incident radiation.
Dissolved Solids. The dissolved solids in the sewage samples were determined by bringing a known volume of theclear filtrate which passed through the 0.31' membrane filterto dryness and weighing the resulting residue.
Refractive Index of Medium. Variations in the refractiveindex of the liquid medium in the sewage samples caused bychanges in the concentration of dissolved solids may resultin significant changes in the refractive index ratio. The refractive index of the medium was me'asured with a BricePhoenix Model BP-lOOOV differential refractometer.
Density of the Suspended Solids. The density of the suspended solids in the sewage samples was measured with adensity gradient column (Low and Richards, 1952) that rangedfrom 1.15 to about 1.72 grams/cc on a dry basis. This densitygradient was obtained by the successive addition of aqueoussodium iodide solutions of decreasing density and allowingthe column to equilibrate overnight. Fifty milliliters of sewage(plant influent) was then added slowly to the top of thecolumn. The density distribution of the suspended solidswas determined from their equilibrium position within thecolumn. The density equivalent to each equilibrium positionwas defined by density standards which had reached equilibrium at various levels within the column.
Size Distribution. A Cahn no. 2800 particle sedimentationaccessory was used to measure the size distribution. Thisaccessory provides a continuous and automatic weighing ofthe different size fractions as they settle with time. A PDP-8
computer was programmed to provide the size distributionfrom data obtained with the Cahn accessory.
Results
Depolarization Measurement. The degree of depolarizationwas found to increase with suspended solids concentrationregardless of whether the sewage samples were obtained fromthe Middlesex Sewerage Authority's treatment plant or theBernardsville Sewage plant (Figure 2). The concentration
Figure 2. Degree of depolarization as a function of suspended solids.Wavelength of incident radiation = polychromatic light
Scattering angle = 170°o Middlesex samples collected 5/23/69o Middlesex samples collected 5/27/69o Bernardsville samples collected 6/10/69o Bernardsville samples collected 6/13/69.6 Middlesex samples collected 6/17/69181 Bernardsville samples collected 6/20/69
Figure 1. Schematic of instrumental arrangement for depolarizationmeasurements at a back-scattering angle of 170 0
Middlesex rather than Bernardsville influent was used in thisstudy because the more concentrated Middlesex influentcompletely attenuated the incident beam within the beaker,and thus any reflection off the back surface of the beaker ontothe detector was eliminated.
Because of the unevenness of the deposits on the beakersurface, only one detector was used for the depolarizationmeasurements. The degree of depolarization, El/EII was obtained by positioning the analyzer in front of the photomultiplier so that it first responded to El and then to Ell' All depolarization measurements were carried out by use of visibleradiation and an optical path length of 5 em because thisoptical path length coincides with the inner radius of thebeakers. The intensity of the back-scattered radiation wasdetermined because of its dependence on the amount ofsolids deposited on the surface of the beaker.
A gravity flow system was designed and built in the laboratory. and used for depolarization measurements on flowingsewage. The system consists of two 55-gal drums, one abovethe other. Opening a ball valve allows the fluid to flow fromthe upper to the lower drum through a clear 3-in. diam plastictest section. This diameter was selected to achieve as high aflow rate as possible with an optical path length which willpermit accurate measurements of the degree of depolarization.
The velocity gradient at the test section was found to exhibit a linear decrease in velocity from 17.8 to 13.0 ft/sec in 5.5sec, with tap water as the test liquid. The insertion of anorifice plate with a 1.187 in. diam below the test section wasfound to extend the time for the measurements from 5.5 to50 sec. A constant flow rate of 1.8 ft/sec was observed duringthis period.
The depolarization measurements were performed initiallyon the nonflowing sample in the test section, with two detectors according to the procedure described earlier. Then thevalve in the gravity flow system was opened and Eland Ellwere continuously recorded as the sewage flowed from theupper to the lower reservoir. The degree of depolarizationEl/EII was calculated at the end of the experiment.
Analyses of Samples. The gravimetric determination of thesuspended solids was carried out by first filtering 100 ml ofsewage samples through a 101' membrane filter followed bya 0.31' membrane filter. Both filters were then dried overnightunder a slight vacuum at a temperature of 55 °C, and weighed.
44 Environmental Science & Technology
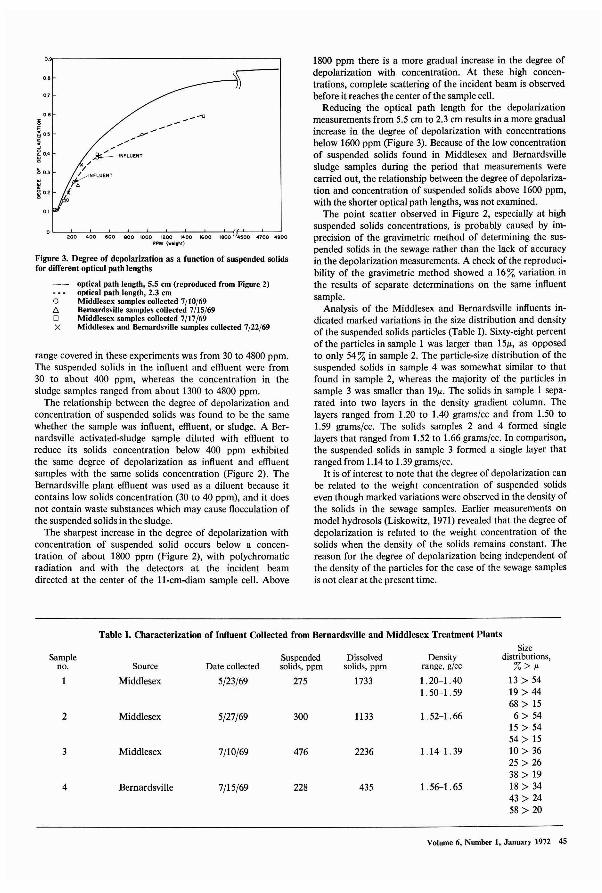
Figure 3. Degree of depolarization as a function of suspended solidsfor different optical path lengths
optical path length, 5.5 em (reproduced from Figure 2)optical path length, 2.3 em
o Middlesex samples collected 7/10/69l1 Bernardsville samples collected 7/15/69o Middlesex samples collecled 7/17/69X Middlesex and Bernardsville samples collected 7/22/69
range covered in these experiments was from 30 to 4800 ppm.The suspended solids in the influent and effluent were from30 to about 400 ppm, whereas the concentration in thesludge samples ranged from about 1300 to 4800 ppm.
The relationship between the degree of depolarization andconcentration of suspended solids was found to be the samewhether the sample was influent, effluent, or sludge. A Bernardsville activated-sludge sample diluted with effluent toreduce its solids concentration below 400 ppm exhibitedthe same degree of depolarization as influent and effluentsamples with the same solids concentration (Figure 2). TheBernardsville plant effluent was used as a diluent because itcontains low solids concentration (30 to 40 ppm), and it doesnot contain waste substances which may cause flocculation ofthe suspended solids in the sludge.
The sharpest increase in the degree of depolarization withconcentration of suspended solid occurs below a concentration of about 1800 ppm (Figure 2), with polychromaticradiation and with the detectors at the incident beamdirected at the center of the ll-cm-diam sample cell. Above
0.8
0.'
0'
00.3
"«~ 0.2
0.1
__ .-u
--"/,,,,--
%-INFLUENT
//
'KINFLUENT,/fo
200 400 600 800 1000 1200 1400 1600 1800 4500 04700 04900PPM 1••IQht)
1800 ppm there is a more gradual increase in the degree ofdepolarization with concentration. At these high concentrations, complete scattering of the incident beam is observedbefore it reaches the center of the sample cell.
Reducing the optical path length for the depolarizationmeasurements from 5.5 cm to 2.3 cm results in a more gradualincrease in the degree of depolarization with concentrationsbelow 1600 ppm (Figure 3). Because of the low concentrationof suspended solids found in Middlesex and Bernardsvillesludge samples during the period that measurements werecarried out, the relationship between the degree of depolarization and concentration of suspended solids above 1600 ppm,with the shorter optical path lengths, was not examined.
The point scatter observed in Figure 2, especially at highsuspended solids concentrations, is probably caused by imprecision of the gravimetric method of determining the suspended solids in the sewage rather than the lack of accuracyin the depolarization measurements. A check of the reproducibility of the gravimetric method showed a 16% variation inthe results of separate determinations on the same influentsample.
Analysis of the Middlesex and Bernardsville influents indicated marked variations in the size distribution and densityof the suspended solids particles (Table I). Sixty-eight percentof the particles in sample 1 was larger than 15/l, as opposedto only 54 %in sample 2. The particle-size distribution of thesuspended solids in sample 4 was somewhat similar to thatfound in sample 2, whereas the majority of the particles insample 3 was smaller than 19/1. The solids in sample 1 separated into two layers in the density gradient column. Thelayers ranged from 1.20 to lAO grams/ce and from 1.50 to1.59 grams/ceo The solids samples 2 and 4 formed singlelayers that ranged from 1.52 to 1.66 grams/ceo In comparison,the suspended solids in sample 3 formed a single layer thatranged from 1.14 to 1.39 grams/cc.
lt is of interest to note that the degree of depolarization canbe related to the weight concentration of suspended solidseven though marked variations were observed in the density ofthe solids in the sewage samples. Earlier measurements onmodel hydrosols (Liskowitz, 1971) revealed that the degree ofdepolarization is related to the weight concentration of thesolids when the density of the solids remains constant. Thereason for the degree of depolarization being independent ofthe density of the particles for the case of the sewage samplesis not clear at the present time.
Table I. Characterization of Influent Collected from Bernardsville and Middlesex Treatment Plants
Sampleno.
2
3
4
SizeSuspended Dissolved Density distributions,
Source Date collected solids, ppm solids, ppm range, g/cc %>1'Middlesex 5/23/69 275 1733 1.20-1.40 13 > 54
1. 50-1. 59 19> 4468> 15
Middlesex 5/27/69 300 1133 1. 52-1. 66 6> 5415> 5454> 15
Middlesex 7/10/69 476 2236 1.14-1.39 10 > 3625> 2638> 19
Bernardsville 7/15/69 228 435 1. 56-1. 65 18> 3443> 2458> 20
Volume 6. Number 1, January 1972 45
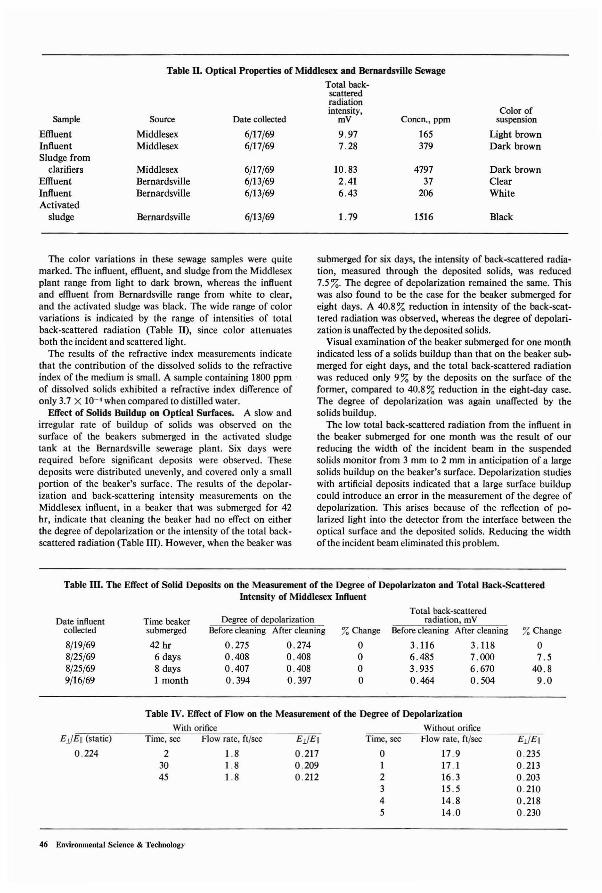
Table II. Optical Properties of Middlesex and Bernardsville Sewage
Total back-scatteredradiationintensity, Color of
Sample Source Date collected mY Concn., ppm suspension
Effluent Middlesex 6/17/69 9.97 165 Light brownInfluent Middlesex 6/17/69 7.28 379 Dark brownSludge from
clarifiers Middlesex 6/17/69 10.83 4797 Dark brownEffluent Bernardsville 6/13/69 2.41 37 ClearInfluent Bernardsville 6/13/69 6.43 206 WhiteActivated
sludge Bernardsville 6/13/69 1. 79 1516 Black
The color variations in these sewage samples were quitemarked. The influent, effluent, and sludge from the Middlesexplant range from light to dark brown, whereas the influentand effluent from Bernardsville range from white to clear,and the activated sludge was black. The wide range of colorvariations is indicated by the range of intensities of totalback-scattered radiation (Table II), since color attenuatesboth the incident and scattered light.
The results of the refractive index measurements indicatethat the contribution of the dissolved solids to the refractiveindex of the medium is small. A sample containing 1800 ppm'of dissolved solids exhibited a refractive index difference ofonly 3.7 X 10-' when compared to distilled water.
Effect of Solids Buildup on Optical Surfaces. A slow andirregular rate of buildup of solids was observed on thesurface of the beakers submerged in the activated sludgetank at the Bernardsville sewerage plant. Six days wererequired before significant deposits were observed. Thesedeposits were distributed unevenly, and covered only a smallportion of the beaker's surface. The results of the depolarization and back-scattering intensity measurements on theMiddlesex influent, in a beaker that was submerged for 42hr, indicate that cleaning the beaker had no effect on eitherthe degree of depolarization or the intensity of the total backscattered radiation (Table III). However, when the beaker was
submerged for six days, the intensity of back-scattered radiation, measured through the deposited solids, was reduced7.5 %. The degree of depolarization remained the same. Thiswas also found to be the case for the beaker submerged foreight days. A 40.8% reduction in intensity of the back-scattered radiation was observed, whereas the degree of depolarization is unaffected by the deposited solids.
Visual examination of the beaker submerged for one monthindicated less of a solids buildup than that on the beaker submerged for eight days, and the total back-scattered radiationwas reduced only 9% by the deposits on the surface of theformer, compared to 40.8 % reduction in the eight-day case.The degree of depolarization was again unaffected by thesolids buildup.
The low total back-scattered radiation from the influent inthe beaker submerged for one month was the result of ourreducing the width of the incident beam in the suspendedsolids monitor from 3 mm to 2 mm in anticipation of a largesolids buildup on the beaker's surface. Depolarization studieswith artificial deposits indicated that a large surface buildupcould introduce an error in the measurement of the degree ofdepolarization. This arises because of the reflection of polarized light into the detector from the interface between theoptical surface and the deposited solids. Reducing the widthof the incident beam eliminated this problem.
Table III. The Effect of Solid Deposits on the Measurement of the Degree of Depolarizaton and Total Back-ScatteredIntensity of Middlesex Influent
Total back-scatteredDate influent Time beaker Degree of depolarization radiation. mY
collected submerged Before cleaning After cleaning %Change Before cleaning After cleaning %Change
8/19/69 42 hr 0.275 0.274 0 3.116 3.118 08/25/69 6 days 0.408 0.408 0 6.485 7.000 7.58/25/69 8 days 0.407 0.408 0 3.935 6.670 40.89/16/69 1 month 0.394 0.397 0 0.464 0.504 9.0
EJ.1En (static)
0.224
Table IV. Effect of Flow on the Measurement of the Degree of Depolarization
With orifice Without orificeTime, sec Flow rate, ft/sec EJ.1En Time, sec Flow rate, ft/sec
2 1.8 0.217 0 17.930 1.8 0.209 1 17.145 1.8 0.212 2 16.3
3 15.54 14.85 14.0
EJ.1En0.2350.2130.2030.2100.2180.230
46 Environmental Science & Technology
Effect of Flow. A comparison of the results of depolarizationmeasurements on static and on flowing sewage samplesindicates that the degree of depolari>ation is unaffected byflow (fable IV). The slight variations in the degree of depolarization measured on the flowing samples results fromthe settling and mixing of the solids in the suspension as itflows from the upper reservoir of the gravity flow systeminto the test section.
Discussion
The depolarization method has been shown to be feasiblefor measuring suspended solid concentrations in the limitednumber of sewage samples examined. Suspended solids concentrations that range from a few parts per million to 5000ppm by weight can be measured by use of the depolarization technique. The relationship between the degree of depolarization and concentration of suspended solids in sewagesamples appears unaffected by the size distribution of theparticles, density variations, source of samples (plant effiuent,plant influent, sludge 100% domestic, or 50% industrial),color variations, and organisms and aggregates generally
found in sludge samples. It may be that the degree of depolari.zation of back-scattered polarized radiation is the result of anaveraging or cancellation of effects.
Acknowledgment
The authors wish to acknowledge the many helpful discussions with William Hodes and the assistance of R. L. Buckingham of the Bernardsville sewerage plant and R. A. Roweand Sam Capano of the Middlesex County sewage treatmentplant in collecting the sewage samples. We especially wish tothank Allyn Richardson for his guidance throughout thisinvestigation.
Literature Cited
Liskowitz, J. W., ENVIRON. SCI. TECHNOL. 5, 43 (1971).Low, B. W., Richards, F. M., J. Amer. Chem. Soc. 74, 1660
(1952).
Received for review April 17, /970. Accepted April 30, /971.Resubmit/ed Jan. 28, /97/. The research upon which this publication is based was performed pursuant to contract no./4-/2-494 with the Federal Water Quality Administration,Dept. of Interior.
Development and Validation of a Generalized Mechanism for Photochemical Smog
Thomas A. Hecht and John H. Seinfeld'
Department of Chemical Engineering, California Institute of Technology, Pasadena, Calif. 91109
• A detailed 81-step mechanism for the photooxidation kinetics of the propylene-NOr-air system, based on consideration of the possible important reactions which might beoccurring, is presented. From the detailed mechanism is deduced a general 15-step mechanism for photochemical smogformation. The flexibility of this mechanism lies in adjustablerate constants and stoichiometric coefficients, which arechosen according to the particular hydrocarbon and initialreactant ratios. The general mechanism is validated with smogchamber data on propylene, isobutylene, n-butane, and a mixture of propylene and n-butane. The general mechanism isalso shown to simulate accurately the effect of CO on smogchamber photooxidation kinetics as well as the inhibitoryeffect of high initial concentrations of nitric oxide on themaximum concentration of ozone attained.
The formation of photochemical smog occurs by a complex series of reactions which is still not thoroughly
understood. In recent years several reviews of atmosphericchemistry have appeared (Leighton, 1961; Wayne, 1962;Altshuller and Bufalini, 1965, 1971; Stephens, 1966; HaagenSmit and Wayne, 1967; Johnston et aI., 1970), and a numberof kinetic mechanisms for photochemical smog have beenproposed (Eschenroeder, 1969; Friedlander and Seinfeld,1969; Westberg and Cohen, 1969; Behar, 1970; Wayne et aI.,1970). In each case only limited success was achieved inmatching predicted concentration-time behavior from the
1 To whom correspondence should be addressed.
mechanism with experimental smog chamber data. It is clear,however, that a detailed understanding of the photochemicalsmog system will only be achieved by a combined study ofsmog chamber data and theoretical mechanisms.
In addition to elucidating the nature of the photochemicalsmog system, a kinetic mechanism will be a necessary component of an atmospheric simulation model, such as for theLos Angeles basin. Such urban atmospheric models, capableof simulating chemical reaction as well as convection anddiffusion, will play an important role in assessing the effect ofvarious emission control strategies on air quality. A kineticmechanism for use in an atmospheric simulation model mustobey some additional requirements. First, since a pollutedurban atmosphere typically contains upward of 100 hydrocarbon species, the mechanism should be general enough topredict the behavior of a complex mixture of hydrocarbons.Second, since an atmospheric simulation model may consist ofa set of partial differential equations, the kinetic mechanismmust be as compact as possible to avoid excessive computingtimes in the numerical integration of the model.
Our objective in this paper is, thus, twofold. First, as afundamental study of the photochemical smog reactions for atypical hydrocarbon species, we will formulate a detailedkinetic mechanism for the photooxidation of propylene in thepresence of air, oxides of nitrogen, carbon monoxide, andwater. Propylene was chosen because it has been widelystudied in smog chambers and it exhibits behavior similar tothe complex hydrocarbon mixture present in smog. Themechanism is deduced from a systematic analysis of the important possible reactions that could be occurring. Second, foruse with an atmospheric simulation model, we will formulate acompact mechanism that has the flexibility of representing thebehavior of a varied mixture of hydrocarbons. Both the detailed and the simplified mechanisms are integrated numerl-
Volume 6. Number I, January 1972 47

Table I. Reactions in the NOz-D,.-CO-H,O SystemNo. Reaction Rate constant Ref.
Baulch et al. (1968)
Johnston et al. (1970)
Johnston et al. (1970)
Johnston et al. (1970)Altshuller and Bufalini (1965)Johnston et al. (1970)
Ford et al. (1957)Altshuller and Bufalini (1965)Altshuller and Bufalini (1965)
Kaufman and Kelso (1967)
Clyne et al. (1964)0, + NO ---+ NO, + 0,
NO, + hv ---+ NO + °°+ 0, + M ---+ 0, + M
3
12
0.37 min- la ••
2.2 X 10-' ppm-' min- t
2.0 X 10' min-I"22.5 ± 2 ppm- I min- I
2184 0, + NO, ---+ NO, + 0, 0.049 ppm- l min- I
5 NO, + NO, ---+ N,O, 858 ppm- 1 min- l
6 N,O, ---+ NO, + NO, 2.76 min- 1
7 N,O, + H,O ---+ 2 HNO, 0.75 min- t '
8 NO, + NO, ---+ NO + 0, + NO, 0.49 ppm- I min- I
9 0+ NO, ---+ 0, + NO 5150 ppm- I min- '10 NO, + NO ---+ 2 NO, 1.40 X 10' ppm- I min- l
11 NO + NO, + H,O ---+ 2 HNO, 0.001 ppm- I min-I'12 HNO, + hv ---+ NO + OH· 0.01 min- ta
13 CO + OH· ---+ CO, + H· 196 ppm- I min- '14 H· + 0, + M---+ HO,· + M very fast15 HO,· + NO ---+ NO, + OH· 30 ppm- I min- I
16 HO,· + NO, ---+ HNO, + 0, 0.001 ppm- l min- I
17 OH· + NO, + M ---+ HNO, + M 1470 ppm- I min-I'18 OH· + NO ---+ HONO 10' ppm- I min- l
19 HO,· + HO,· ---+ H,O, + 0, 70 ppm- l min- l
(l Depends on the light intensity, The value shown is that used in the validation studies. b Pseudo~first-order value. e Pseudo-second-order value. d If noreference is cited, the values in column 2 were estimated by the authors.
cally and their predictions compared to available smogchamber data.
Rate constants for each of the possible reactions in smogformation are, unfortunately, not available. In fact, only forsome of the more widely studied reactions are there rateconstant values which have been measured. The flexibility in aproposed kinetic mechanism lies, therefore, in the adjustmentof rate constants which have not been measured experimentally. We use this procedure in attempting to matchmechanism predictions and experimental data as closely aspossible.
We will not consider the role of oxides of sulfur or'thegeneration of photochemical aerosols in this work. Theseaspects remain as topics of current investigation.
Detailed Propylene Mechanism
We now present a detailed kinetic mechanism for the photooxidation of propylene in the presence of air, NO, NO" CO,and H,O. We have divided the reactions according to classes.
Reactions in the NOz-O,-CO-H,O System. Table I presents the reactions in this class that are most important. Reactions 1-3 are the principal inorganic reactions in smog formation. However, the other reactions in Table I are importantto describe some secondary effects. As the concentration ofNO decreases, as a result of the overall oxidation of NO toNO, in the smog system, Reaction 4, even though much slowerthan 3, will convert small quantities of NO, to NO, in thelatter stages of the reaction. NO, can then react with eitherNO, or NO (Reactions 5, 8, and 10), with rates depending onthe relative abundance of NO, and NO, to form N,O, orregenerate NO, and small amounts of NO. N,O, can decompose (Reaction 6) or hydrolyze to nitric acid (Reaction 7).Reaction 7 can account for the formation of HNO, on thewalls of smog chambers, often cited as the reason for theinability to obtain a nitrogen balance on the products in smogchambers, and also for formation of HNO, vapor in the
atmosphere, which might eventually become incorporated inatmospheric aerosols in which high yields of nitrate productshave been observed (Gay and Bufalini, 1969; Campion andBlack,1969; Hidy and Friedlander, 1970).
Recent smog chamber experiments have indicated that OH·radicals playa central role in photochemical smog. Reactions11 and 12, although long recognized (Leighton, 1961), haveonly recently been suggested as a possible important sourceof OH· radicals in the smog system (Stedman et aI., 1970).The OH· radical is a highly reactive species capable of reaction with hydrocarbons, CO, and aldehydes. CO, until recently, was ignored as a possible participant in the photochemical smog system because of its assumed low reactivity.However, a newly revised estimate of the activation energy ofReaction 13 indicates that the rate constant for this reaction ishigh enough to make it a possibly important reaction (Baulchet aI., 1968; Dixon-Lewis et aI., 1966). In addition, recentexperiments reported by Holmes (1970), Westberg et aI.,(1971), and Stedman et al. (1970) have shown that CO accelerates the conversion of NO to NO, over the rate in theabsence of CO. Also, when H,O and CO are both present,the rate of conversion of NO to NO, is increased over thatwith only CO present. Although the experiments reportedby Stedman et al. involved CO concentrations higher thanthose normally found in the atmosphere, recent unpublishedwork by Holmes (1971) has shown an accelerating effect ofCO at concentrations as low as 10 ppm. Reaction 14 is veryrapid so that 13 and 14 can be combined as
CO + OH· ~ CO, + HO,·
The net effect of Reactions 13-15 is to convert NO to NO, withno net loss of OH . radicals.
An extremely important conclusion arises from examinationof Reactions 11-15, namely, that it is possible to convert NOto NO, in significant quantities in the absence of hydrocarbons(Wilson, 1971). Both CO and H,O are required for this con-
48 Environmental Science & Technology
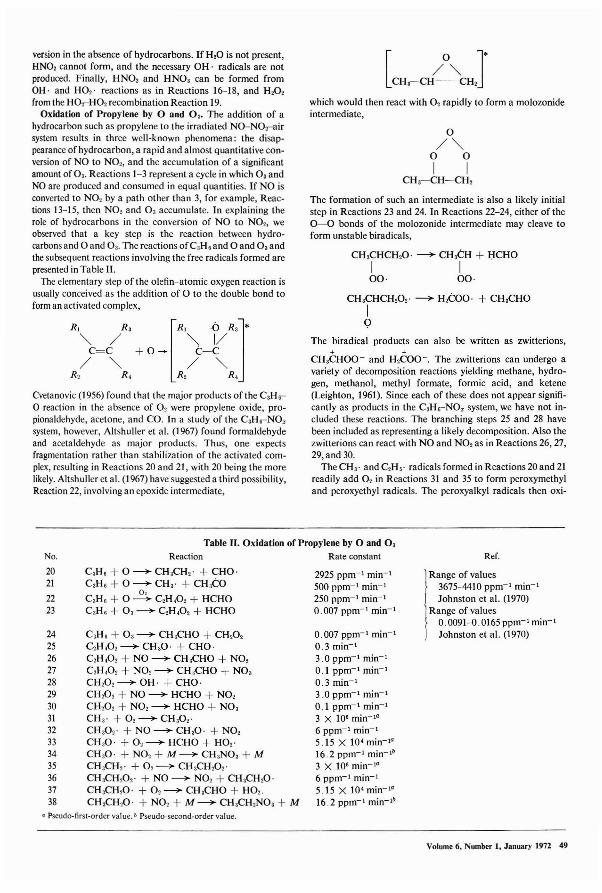
version in the absence of hydrocarbons. If H,O is not present,HNO, cannot form, and the necessary OH· radicals are notproduced. Finally, HNO, and HNO, can be formed fromOH· and HO,· reactions as in Reactions 16-18, and H,O,from the HO,-H0, recombination Reaction 19.
Oxidation of Propylene by 0 and 0,. The addition of ahydrocarbon such as propylene to the irradiated NO-NO,-airsystem results in three well-known phenomena: the disappearance of hydrocarbon, a rapid and almost quantitative conversion of NO to NO" and the accumulation of a significantamount of 0,. Reactions 1-3 represent a cycle in which 0, andNO are produced and consumed in equal quantities. If NO isconverted to NO, by a path other than 3, for example, Reactions 13-15, then NO, and 0, accumulate. In explaining therole of hydrocarbons in the conversion of NO to NO" weobserved that a key step is the reaction between hydrocarbons and 0 and 0,. The reactions ofC,H,and 0 and 0, andthe subsequent reactions involving the free radicals formed arepresented in Table II.
The elementary step of the olefin-atomic oxygen reaction isusually conceived as the addition of 0 to the double bond toform an activated complex,
Cvetanovic (1956) found that the major products of the C,H,o reaction in the absence of 0, were propylene oxide, propionaldehyde, acetone, and CO. In a study of the C,H,-NO,system, however, Altshuller et al. (1967) found formaldehydeand acetaldehyde as major products. Thus, one expectsfragmentation rather than stabilization of the activated complex, resulting in Reactions 20 and 21, with 20 being the morelikely. Altshuller et al. (1967) have suggested a third possibility,Reaction 22, involving an epoxide intermediate,
which would then react with 0, rapidly to form a molozonideintermediate,
o/~
o 0I I
CH,-CH-CH,
The formation of such an intermediate is also a likely initialstep in Reactions 23 and 24. In Reactions 22-24, either of the0-0 bonds of the molozonide intermediate may cleave toform unstable biradicals,
CH,CHCH,O·~ CH,CH + I:ICHO
I I00· 00·
CH,CHCH,O,· ~ H,COO· + CH,CHO
IQ
The biradical products can also be written as zwitterions,+ +
CH,CHOO- and H,COO-. The zwitterions can undergo avariety of decomposition reactions yielding methane, hydrogen, methanol, methyl formate, formic acid, and ketene(Leighton, 1961). Since each of these does not appear significantly as products in the C,H,-NO, system, we have not included these reactions. The branching steps 25 and 28 havebeen included as representing a likely decomposition. Also thezwitterions can react with NO and NO, as in Reactions 26, 27,29, and 30.
The CH,· and C,H,· radicals formed in Reactions 20 and 21readily add 0, in Reactions 31 and 35 to form peroxymethyland peroxyethyl radicals. The peroxyalkyl radicals then oxi-
Table II. Oxidation of Propylene by 0 and 0,Reaction Rate constantNo.
2021
2223
242526272829303132333435363738
C,H, + 0 ~ CH,CH,· + CHO·C,H, + 0 ~ CH,· + CH,CO
C,H, + 0 ~ C,H,O, + HCHOC,H, + 0,~ C,H,O, + HCHO
C,H, + 0,~ CH,CHO + CH,O,C,H,O,~ CH,O· + CHO·C,H,O, + NO~ CH,CHO + NO,C,H,O, + NO,~ CH,CHO + NO,CH,O,~OH· + CHO·CH,O, + NO~ HCHO + NO,CH,O, + NO,~ HCHO + NO,CH,· + 0,~ CH,O,·CH,O,· + NO~ CH,O· + NO,CH,O· + 0,~ HCHO + HO,·CH,O· + NO, + M~ CH,NO, + MCH,CH,· + 0,~ CH,CH,O,·CH,CH,O,· + NO~ NO, + CH,CH,O·CH,CH,O· + 0,~ CH,CHO + HO,.CH,CH,O· + NO, + M~ CH,CH,NO, + M
2925 ppm-I min-I500 ppm-I min-I250 ppm-I min-I0.007 ppm-I min- 1
0.007 ppm-I min-I0.3 min- 1
3.0 ppm-I min- 1
0.1 ppm- 1 min-I0.3 min-I3.0 ppm- 1 min- 1
0.1 ppm- I min- 1
3 X 10' min-I.6 ppm-I min-I5.15 X 10' min-I.16.2 ppm-I min-I.3 X 10' min-I.6 ppm- I min-I5.15 X 10' min-I.16.2 ppm-I min-I.
Ref.
Range of values3675-4410 ppm-I min-IJohnston et al. (1970)
Range of values0.0091-0.0165 ppm- I min-IJohnston et a1. (1970)
o Pseudo-first·order value. b Pseudo-second-order value.
Volume 6, Number 1, Jauuary 1972 49
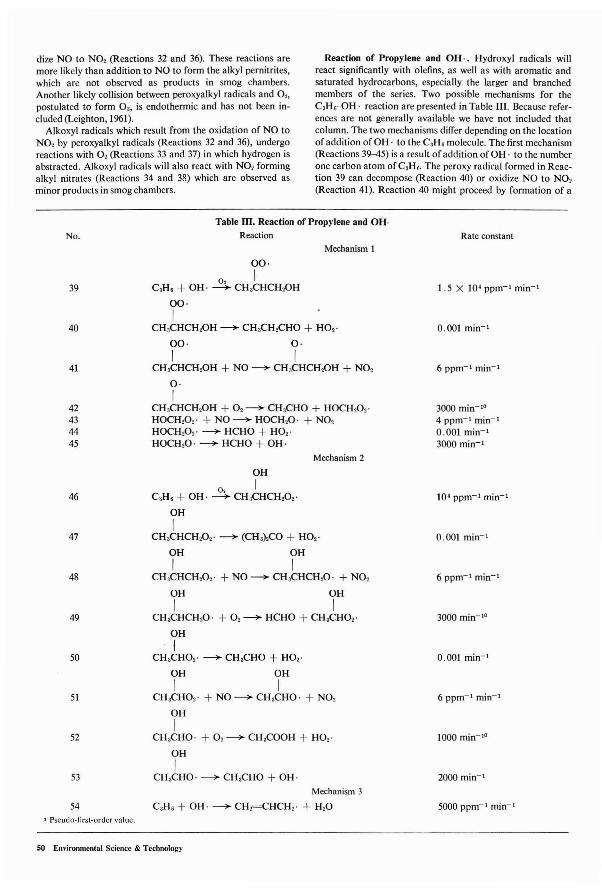
dize NO to NO, (Reactions 32 and 36). These reactions aremore likely than addition to NO to form the alkyl pernitrites,which are not observed as products in smog chambers.Another likely collision between peroxyalkyl radicals and 0"postulated to form 0" is endothermic and has not been included (Leighton,1961).
Alkoxyl radicals which result from the oxidation of NO toNO, by peroxyalkyl radicals (Reactions 32 and 36), undergoreactions with 0, (Reactions 33 and 37) in which hydrogen isabstracted. Alkoxyl radicals will also react with NO, formingalkyl nitrates (Reactions 34 and 38) which are observed asminor products in smog chambers.
Reaction of Propylene and OH·. Hydroxyl radicals willreact significantly with olefins, as well as with aromatic andsaturated hydrocarbons, especially the larger and branchedmembers of the series. Two possible mechanisms for theC,Ho-OH· reaction are presented in Table III. Because references are not generally available we have not included thatcolumn. The two mechanisms differ depending on the locationof addition of OH· to the C,H omolecule. The first mechanism(Reactions 39-45) is a result of addition of OH· to the numberone carbon atom of C,H o. The peroxy radical formed in Reaction 39 can decompose (Reaction 40) or oxidize NO to NO,(Reaction 41). Reaction 40 might proceed by formation of a
No.
39
40
41
42434445
46
47
48
49
50
51
52
53
54CI Pseudo-first-ordcr value.
Table m. Reaction of Propylene and OH·Reaction
Mechanism I
00·
0, IC,Ho + OH· __ CH,CHCH,OH
00·
ICH,CHCH,OH -- CH,CH,CHO + HO,·
00· O·I I
CH,CHCH,OH + NO -- CH,CHCH,OH + NO,
O·
ICH,CHCH,OH + 0, -- CH,CHO + HOCH,O,·HOCH,O,· + NO -- HOCH,O· + NO,HOCH,O,· -- HCHO + HO,·HOCH,O· -- HCHO + OH·
Mechanism 2
OH
0, IC,Ho+ OH· -- CH,CHCH,O,·
OH
ICH,CHCH,O,· __ (CH,),CO + HO,·
OH OH
I ICH,CHCH,O,· + NO -- CH,CHCH,O· + NO,
OH OH
I ICH,CHCH,O· + 0, -- HCHO + CH,CHO,·
OH
ICH,CHO,· __ CH,CHO + HO,·
OH OH
I ICH,CHO,· + NO -- CH,CHO· + NO,
OH
ICH,CHO· + 0, -- CH,COOH + HO,·
OH
ICH,CHO· __ CH,CHO + OH·
Mechanism 3
C,Ho+ OH· -- CH2=CHCH,· + H20
Rate constant
1.5 X 10' ppm- t min- t
0.001 min- I
6 ppm- t min- I
3000 min-Ia4 ppm- t min- t
0.001 min-I3000 min- I
10' ppm- I min- I
0.001 min- t
6 ppm- I min- t
3000 min- Ia
0.001 min- I
6 ppm- I min- t
2000 min-I
5000 ppm- I min- '
50 Environmental Science & Technology
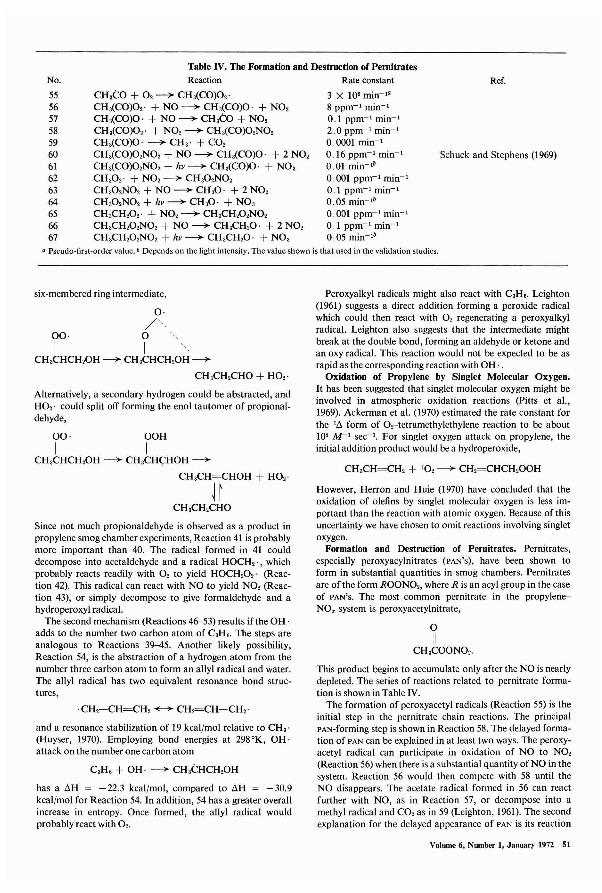
Table IV. The Formation and Destruction of PernitratesReaction Rate constantNo.
55565758596061626364656667
CH,CO + O2~ CH,(CO)02'CH,(CO)02' + NO~ CH,(CO)O· + N02CH,(CO)O· + NO~ CH,CO + N02CH,(CO)02' + N02~ CH,(CO)02N02CH,(CO)O·~ CH,· + CO,CH,(CO)02N02+ NO~ CH,(CO)O· + 2 N02CH,(CO)02N02+ hv~ CH,(CO)O· + NO,CH,02' + N02~ CH,02N02CH,02N02+ NO~ CH,O· + 2 N02CH,02N02+ hv~ CH,O· + NO,CH,CH20 2· + N02~ CH,CH20 2N02CH,CH20 2N02+ NO~ CH,CH20· + 2 N02CH,CH20 2N02+ hv~ CH,CH20· + NO,
3 X 10' min-I.8 ppm- I min- I0.1 ppm- I min- I2.0 ppm-I min-I0.0001 min- I
0.16 ppm-I min- I
0.01 min-I'0.001 ppm-I min- 1
0.1 ppm-I min-I0.05 min-I'0.001 ppm-I min- I0.1 ppm-I min-I0.05 min-I'
Ref.
Schuck and Stephens (1969)
a Pseudo-first-order value. b Depends on the light intensity. The value shown is that used in the validation studies.
six-membered ring intermediate,
O·
/"00· 0
I ICH,CHCH,OH~ CH,CHCH20H~
CH,CH2CHO + H02 •
Alternatively, a secondary hydrogen could be abstracted, andH02· could split off forming the enol tautomer of propionaldehyde,
00· OOH
I ICH,CHCH20H~ CH,CH<;:HOH~
CH,CH=CHOH + H02 •
HCH,CH2CHO
Since not much propionaldehyde is observed as a product inpropylene smog chamber experiments, Reaction 41 is probablymore important than 40. The radical formed in 41 coulddecompose into acetaldehyde and a radical HOCH2 ·, whichprobably reacts readily with O2 to yield HOCH20 2· (Reaction 42). This radical can react with NO to yield NO, (Reaction 43), or simply decompose to give formaldehyde and ahydroperoxyl radical.
The second mechanism (Reactions 46-53) results if the OH·adds to the number two carbon atom of C,H,. The steps areanalogous to Reactions 39-45. Another likely possibility,Reaction 54, is the abstraction of a hydrogen atom from thenumber three carbon atom to form an allyl radical and water.The allyl radical has two equivalent resonance bond structures,
·CH2-CH=CH, +-+ CH,=CH-CH2·
and a resonance stabilization of 19 kcal/mol relative to CH,·(Huyser, 1970). Employing bond energies at 298°K, OH·attack on the number one carbon atom
C,H, + OH· ~ CH,CHCH20H
has a llH = -22.3 kcal/mol, compared to llH = -30.9kcal/mol for Reaction 54. In addition, 54 has a greater overallincrease in entropy. Once formed, the allyl radical wouldprobably react with O2•
Peroxyalkyl radicals might also react with C,H,. Leighton(1961) suggests a direct addition forming a peroxide radicalwhich could then react with O2 regenerating a peroxyalkylradical. Leighton also suggests that the intermediate mightbreak at the double bond, forming an aldehyde or ketone andan oxy radical. This reaction would not be expected to be asrapid as the corresponding reaction with OH· .
Oxidation of Propylene by Singlet Molecular Oxygen.It has been suggested that singlet molecular oxygen might beinvolved in atmospheric oxidation reactions (Pitts et aI.,1969). Ackerman et al. (1970) estimated the rate constant forthe III form of O,-tetramethylethylene reaction to be about10' M-I sec ' . For singlet oxygen attack on propylene, theinitial addition product would be a hydroperoxide,
CH,CH=CH2+ '02~ CH2=CHCH200H
However, Herron and Huie (1970) have concluded that theoxidation of olefins by singlet molecular oxygen is less important than the reaction with atomic oxygen. Because of thisuncertainty we have chosen to omit reactions involving singletoxygen.
Formation and Destruction of Pernitrates. Pernitrates,especially peroxyacylnitrates (PAN'S), have been shown toform in substantial quantities in smog chambers. Pernitratesare of the form ROONO" where R is an acyl group in the caseof PAN'S. The most common pernitrate in the propyleneNOr system is peroxyacetylnitrate,
oII
CH,COON02•
This product begins to accumulate only after the NO is nearlydepleted. The series of reactions related to pernitrate formation is shown in Table IV.
The formation of peroxyacetyl radicals (Reaction 55) is theinitial step in the pernitrate chain reactions. The principalPAN-forming step is shown in Reaction 58. The delayed formation of PAN can be explained in at least two ways. The peroxyacetyl radical can participate in oxidation of NO to N02(Reaction 56) when there is a substantial quantity of NO in thesystem. Reaction 56 would then compete with 58 until theNO disappears. The acetate radical formed in 56 can reactfurther with NO, as in Reaction 57, or decompose into amethyl radical and CO, as in 59 (Leighton, 1961). The secondexplanation for the delayed appearance of PAN is its reaction
Volume 6, Number I, January 1972 51
68 HCHO+hv~H·+CHO· 3.3 X 10-' min-I"69 HCHO + °~ OH· + CHO· 220 ppm- I min- l
70 HCHO + 0,~ OH· + CHO· + 0, 2.45 X 10-' ppm- I min- '71 HCHO + OH·~ CHO· + H,O 2.5 X 10' ppm- I min- l
72 CH,CHO + hv~ CH,· + CHO· 0.0036 min-I"73 CH,CHO + °~ CH,CO + OH· 294 ppm- 1 min- I
74 CH,CHO + O,~ CH,CO + OH· + 0, 0.0005 ppm- 1 min- '75 CH,CHO + OH·~ CH,CO + H,O 2.5 X 10' ppm- 1 min- 1
(1 Depends on the light intensity. The value shown is that used in the validation studies.
No.Table V. Aldehyde Decomposition Reactions
Reaction Rate constant Ref.
Leighton (1961)Herron and Penzhorn (1969)Leighton (1961)
Leighton (1961)Leighton (1961)Leighton (1961)
with NO, Reaction 60 (Schuck and Stephens, 1969). The rateconstant for this reaction is high enough to preyent PAN fromaccumulating until the NO is almost completely converted toNO,. Interestingly, Reaction 60 shows another means ofconverting NO to NO,. The photolysis of PAN in Reaction 61is also a possibility. Pitts (1970) has also recently reported thatPAN reacts with water forming singlet oxygen as one of theproducts in a highly exothermic reaction. This step has notbeen included.
Although methyl and ethyl pernitrates are not reported asproducts in the propylene-NO. system, formation of traceamounts can be described by Reactions 62-67.
Aldehyde Decomposition. It has been shown how aldehydes,especially HCHO and CH,CHO, can be formed when propylene is oxidized. Reactions involving aldehyde decompositionare shown in Table V. Both HCHO and CH,CHO undergophotodecomposition (Reactions 68 and 72). Oxygen atomsreact with the aldehydes abstracting a hydrogen atom to formOH· and the corresponding acyl radical (Reactions 69 and73). 0, can also abstract hydrogen as in 70 and 74, and OH·reacts with aldehydes to give an acyl radical and water, as in71 and 75.
Other Radical Reactions. Table VI summarizes some radicalreactions which may play secondary roles in photochemicalsmog. We note that in smog chambers initially free of CO,small amounts have been observed to form. This is probablydue primarily to Reaction 76. The possible peroxyformylproduct of 76 is unstable and has not been observed in smogchambers.
Validation oj the Detailed Mechanism
The validation consists of comparing the concentrationtime results from the mechanism to those of an experimentalrun for the same initial conditions. The fit of the mechanism tothe data is achieved by varying rate constants over rangesconsistent with the expected order of magnitude for each reaction.
The experimental data used for propylene photooxidationwere obtained from the Gulf Research Co. (Strickler, 1970). Acomparison of the experimental data (solid line) and the detailed mechanism (dashed line) are presented in Figure 1 forthe validation rate constants in Tables I-VI. The mechanismcurves were generated by numerical integration of the rateequations for all of the species not in a pseudosteady state (allthe nonradical species). By use of the numerical integrationroutine of Gear (1971),3 1;' hr of reaction time were simulatedin 25 sec on an IBM 360/75.
Because of the large number of unknown rate constants, it ispossible to fit the data in Figure 1 closely. Thus, we will notpresent a large series of comparisons of model predictions vs.data for the detailed mechanism. Perhaps the most importantaspect of a detailed mechanism is to aid us in the formulationof a simplified version with far fewer steps and rate constantsthat gives comparable concentration-time predictions.
A Simplified Mechanism
As we have noted, in an urban atmospheric model it will benecessary to have a kinetic mechanism which not only describes the kinetics accurately over the concentration range ofinterest but also involves as few steps as possible to minimizecomputation time. Also, the mechanism should permit simulation of the behavior of a complex hydrocarbon mixture such asexists in the atmosphere. Therefore, it is necessary to achieve abalance between chemical detail and flexibility. In this sectionwe propose a simplified mechanism for photochemical smog.
Simulations carried out with the detailed mechanism revealthat certain reactions are much more important than others.These conclusions are based on the results obtained by systematically varying rate constants and observing the changes inthe concentration-time behavior. In addition, inspection of themechanism shows that many reactions are of the same generaltype. For example, many free radical reactions can be classedaccording to the radical type. Thus, to obtain a simplifiedmechanism we should remove reactions of lesser importance,
No.
767778798081
a Pseudo·first-order value.
Table VI. Other Radical ReactionsReaction
CHO· + O,~ CO + HO,·CHO· + OH·~ CO + H,OCH,O· + CH,O·~ HCHO + CH,OHCH,CH,O· + CH,CH,O·~ CH,CHO + CH,CH,OHCH,(CO)O· + CH,O·~ HCHO + CH,COOHCH,(CO)O· + CH,CH,O·~ CH,CHO + CH,COOH
Rate constant
5.15 X 10' min-I"3.6 X 10' ppm- 1 min- 1
3.6 X 10' ppm- I min- '3.6 X 10' ppm- l min- 1
3.6 X 10' ppm- l min- I
3.6 X 10' ppm- 1 min- 1
52 Environmental Science & Technology
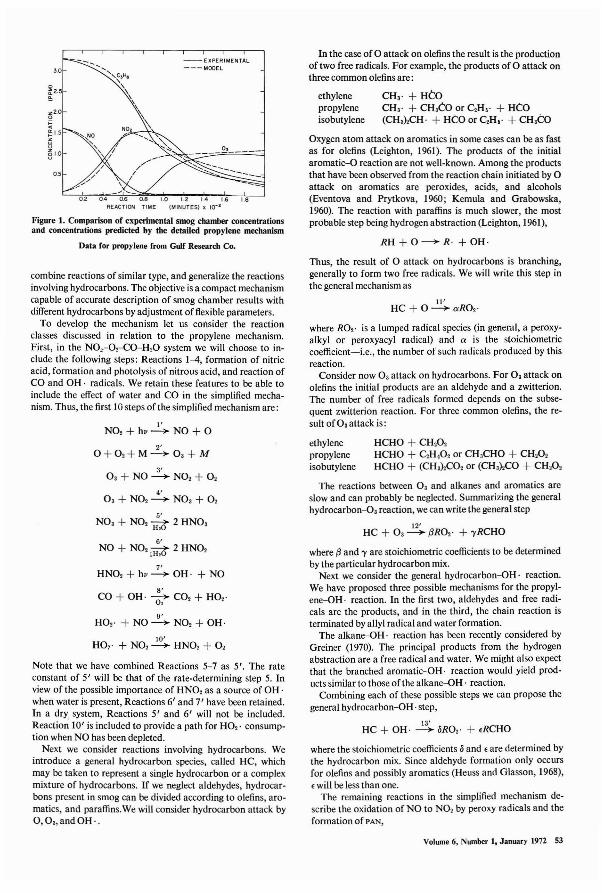
CH,· + HCOCH,· + CH,CO or C,H,· + HCO(CH,hCH· + HCO or C,H,· + CH,CO
ethylenepropyleneisobutylene
RH + O~R' + OH·
In the case of 0 attack on olefins the result is the productionoftwo free radicals. For example, the products of 0 attack onthree common olefins are:
Oxygen atom attack on aromatics in some cases can be as fastas for olefins (Leighton, 1961). The products of the initialaromatic-O reaction are not well-known. Among the productsthat have been observed from the reaction chain initiated by 0attack on aromatics are peroxides, acids, and alcohols(Eventova and Prytkova, 1960; Kemula and Grabowska,1960). The reaction with paraffins is much slower, the mostprobable step being hydrogen abstraction (Leighton, 1961),
--EXPERIMENTAL---MODEL- ........,
'~,He
\ ,,,,,\ ,
1.0 1.2 1.4 1.6(MINUTES) X 10-2
Figure 1. Comparison of experimental smog chamber concentrationsand concentrations predicted by the detailed propylene mechanism
Data for propylene from Gulf Research Co.
11'HC+O~aRO,·
12'HC + 0,~ {3RO,· + -yRCHO
Thus, the result of 0 attack on hydrocarbons is branching,generally to form two free radicals. We will write this step inthe general mechanism as
The reactions between 0, and alkanes and aromatics areslow and can probably be neglected. Summarizing the generalhydrocarbon-O, reaction, we can write the general step
HCHO + CH,O,HCHO + C,H,O, or CH,CHO + CH,O,HCHO + (CH,),CO, or (CH,),CO + CH,O,
ethylenepropyleneisobutylene
where {3 and -yare stoichiometric coefficients to be determinedby the particular hydrocarbon mix.
Next we consider the general hydrocarbon-0H· reaction.We have proposed three possible mechanisms for the propylene-0H· reaction. In the first two, aldehydes and free radicals are the products, and in the third, the chain reaction isterminated by allyl radical and water formation.
The alkane-OH· reaction has been recently considered byGreiner (1970). The principal products from the hydrogenabstraction are a free radical and water. We might also expectthat the branched aromatic-OH· reaction would yield products similar to those of the alkane-OH· reaction.
Combining each of these possible steps we can propose thegeneral hydrocarbon-OH· step,
13'HC + OH· ~ oRO,· + .RCHO
where the stoichiometric coefficients 0and. are determined bythe hydrocarbon mix. Since aldehyde formation only occursfor olefins and possibly aromatics (Heuss and Glasson, 1968),• will be less than one.
The remaining reactions in the simplified mechanism describe the oxidation of NO to NO, by peroxy radicals and theformation of PAN,
where RO,· is a lumped radical species (in general, a peroxyalkyl or peroxyacyl radical) and a is the stoichiometriccoefficient-i.e., the number of such radicals produced by thisreaction.
Consider now 0 3 attack on hydrocarbons. For 0, attack onolefins the initial products are an aldehyde and a zwitterion.The number of free radicals formed depends on the subsequent zwitterion reaction. For three common olefins, the result of0, attack is:
5'NO, + NO, fut 2 HNO,
6'NO + NO,lH.d 2 HNO,
4'0, + NO,~ NO, + 0,
3'0, + NO~ NO, + 0,
g'HO,· + NO~ NO, + OH·
7'HNO, + hv~OH' + NO
s'CO + OH· 0; CO, + HO,·
2'0+ 0, + M~ 0, + M
Note that we have combined Reactions 5-7 as 5'. The rateconstant of 5' will be that of the rate-determining step 5. Inview of the possible importance of HNO, as a source of OH .when water is present, Reactions 6' and 7' have been retained.In a dry. system, Reactions 5' and 6' will not be included.Reaction 10' is included to provide a path for HO,· consumption when NO has been depleted.
Next we consider reactions involving hydrocarbons. Weintroduce a general hydrocarbon species, called HC, whichmay be taken to represent a single hydrocarbon or a complexmixture of hydrocarbons. If we neglect aldehydes, hydrocarbons present in smog can be divided according to olefins, aromatics, and paraffins.We will consider hydrocarbon attack by0,0" and OH· .
l'NO, + hv~ NO + 0
10'HO,· + NO,~ HNO, + 0,
combine reactions of similar type, and generalize the reactionsinvolving hydrocarbons. The objective is a compact mechanismcapable of accurate description of smog chamber results withdifferent hydrocarbons by adjustment of flexible parameters.
To develop the mechanism let us consider the reactionclasses discussed in relation to the propylene mechanism.First, in the NO.-O,-CO-H,O system we will choose to include the following steps: Reactions 1--4, formation of nitricacid, formation and photolysis of nitrous acid, and reaction ofCO and OH· radicals. We retain these features to be able toinclude the effect of water and CO in the simplified mechanism. Thus, the first 10 steps of the simplified mechanism are:
Volume 6, Number 1. January 1972 S3

The initial conditions for Figures 2 and 3 are: [C,H,j. = 3.29,[NO,], = 0.088, [NOj, = 1.612 and [C,H,], = 1.0, [NO,], =
ratios apparently affect the chain length, and since", governsthe chain length directly, it is convenient to reflect this byallowing '" to depend on the NO to HC ratio as it changes withtime. This dependence should follow the general behavior of aplot of peak 0, concentration vs. initial NO to HC ratio.
The generalized coefficients 5 (RO,· from the HC-OH·reaction) and O(OH· from the RO,·-NO reaction) are important in simulating the effect of CO. Since OH· attacks bothHC and CO and since the products of both reactions areradical species capable of oxidizing one NO to NO, (HO,· inthe former case and RO,· in the latter), it is necessary that thenumber of HO,· radicals formed in the CO-OH· reaction(always equal to one) be greater than the number of RO,·radicals formed in the HC-OH· reaction in the presence ofCO. If 50 > I, CO would effectively inhibit the rate of NOoxidation because CO would be scavenging OH· radicalsfrom a reaction with HC capable of generating more radicalsable to oxidize NO than the single HO,· formed in the COOH· reaction. This can also be seen by examining the differential equation for NO. The terms governing the contributionto the NO oxidation rate from the HC-OH· and CO-OH·reaction both have the quantity (I - 50) in the denominator.If 50 > I, the sign of d[NOj/dt will be positive rather thannegative. Also, since the term governing the effect of CO has[CO] in the denominator, if 50 > I, CO will inhibit rather thanaccelerate the oxidation of NO.
Propylene Experiments. The propylene data used are shownin Figures 2 and 3. The data in Figure 2 are the same as inFigure I (Strickler, 1970). The data in Figure 3 have beenpresented by Wayne et al. (1970) from the California AirResources Board. The photolysis rate for each experiment isk l = 0.37 min-I.
Both simulations, shown by the dashed curves, were madewith the following rate constants:
14'RO,· + NO-+ NO, + OOH·
15'RO,· + NO, -+ PAN
It is important to note that if CO and H,O are present wetreat HO,· and RO,· as separate species. If CO and H,O arenot present, we consider only the single species RO,·, whichincludes HO,· within it, since Reactions 5'-10' are omitted.In that case, 0 is the fractional product of OH· from Reaction14'-i.e., the fraction of HO,· in the total lumped radicalspecies RO,·.
Many reactions have not been included, for example, theformation of organic nitrates (which can presumably beincluded in Reaction IS '), reactions involving PAN decomposition (of secondary importance), aldehyde decomposition (canbe treated by adjustment of'Y and <) and radical-radical recombination (ofsecondary importance).
The simplified mechanism consists of Reactions I '-15' andincludes the following species: NO, NO" 0" HC, 0, NO"OH·, HO,·, RO,·, HNO" HNO" RCHO, PAN. Differentialequations are required for the first four; steady-state relationsare written for the next six, and the last three represent products.
Validation oftire Simplified Mechanism
In the validation of the simplified mechanism we will consider smog chamber data for the following hydrocarbons:
• Propylene (Strickler, 1970; Wayneetal.,1969)• Isobutylene in the presence and absence of CO (Westberg
etal.,1971)• n-Butane in the presence and absence of CO (Wilson,
1971)• Propylene and n-butane (Wilson, 1971)
These experiments were selected to test the mechanism on botholefins and paraffins, on the effect of different initial reactantratios, and on the effect of CO.
Let us first discuss the generalized stoichiometric coefficientsin the mechanism. Of prime importance is "', the chainbranching factor in the HC-o reaction. In the early stages ofreaction, the HC-O reaction is critical in determining the rateof oxidation of NO to NO,. The peak 0, level will depend onhow much of the NO is oxidized before the hydrocarbon isconsumed. We have found that", should, in some cases, notbe taken as constant but rather as a function of the NO to HCratio throughout the course of the reaction. Large NO to HC
k,' = 0.37k,' = 2.76 X 10'k,' = 21.8k/ = 0.006k,' = 0.1k,' = 0.0025k, ' = 0.005k, = 200
kg'k10' =ku '
k,,/ =
k13 ' =
k1/
kls ' =
1800105 X 10'0.00751000180010
-- EXPERIMENTAl.
--- MODELc,Ha
'"'"
"""'-"'> O_'-~=:j
1.0 1.2 1.4 1.6(MINUTES) x 10-2
3.0
~2.S
0.4 0.6 0.8REACTION TIME
-- EXPERIMENTAL--- MODEL
Figure 2. Comparison of experimental smog chamber concentrationsand concentrations predicted by the simplified mechanism
Data for propylene from Gulf Research Co.
S4 Environmental Science & Technology
Figure 3. Comparison of experimental smog chamber concentrations and concentrations predicted by tbe simpli6ed mechanism
Data for propylene from the California Air Resources Board

{
2.45 [NOl/[HC] < 0.25
'" = 9.8 [NOl 0.25 < [NOl/[HC] < I[HC]
Figure 4. Comparison of experimental smog chamber concentrationsand concentrations predicted by tbe simplified mecbanism
Data for isobutylene from Westberg et aJ. (1971)Initial concentration of carbon monoxide = 0 ppm
For [NOl/[HC] < 0.25, '" = 2.45 ensures that a minimum number offree radicals are generated, even when [NOl is very low.For [NOl/[HC] > I, although we did not have validation datafor this range, we would expect", to decrease in accordancewith the peak 0, for such ratios. The values of 2.45 and 9.8have no significance other than the fact that they give goodvalidation for the experiments shown. The value of /3 was set
/3 = 19& 0.2o = 0.22
k l ' = 0.355k ll ' = 3.1 X 10'k,,' 0.017k13 ' = 10'
The model results are shown in Figures 4 and 5 by the dashedlines. In the actual experiments, the NO, peaks 32 min soonerwhen 100 ppm CO is present initially (104 min vs. 136 min).In the simulation, the NO, also peaks 32 min sooner with 100ppm CO (105 min vs. 137 min). The model also predicts themore rapid oxidation of isobutylene and accelerated accumulation of0, when CO is present.
n-Dutane Experiments. We now consider the photooxidation of n-butane in the presence and absence of CO, as reported by Wilson (1971). The experimental results in Figure 6have [C.HlOlo = 3.05 ppm, [NO,lo = 0.106 ppm, [COlo = 0,and k l ' = 0.4 min-I. For the results in Figure 7, [C.HlOlo =3.25 ppm, [NO,l, = 0.106 ppm, [NOlo = 0.50 ppm, [COlo =100 ppm, and k ,' = 0.4 min-I. In both cases the initial NOx toc.H IO ratio is about 1: 5. The rate constants and stoichiometric coefficients were the same as propylene with the following exceptions: k, ' = 0.4, k.' = 0.004, k ll ' = 2000, k,,' =
0.001, k13 ' = 6000, '" = 5, /3 = 0.5, & = 1.2, and 0 = 0.61.Note that a constant value of", was used because of the lowerreactivity of n-butane.
Although 0, does not react with n-butane, we use a nonzerok 12 ' because olefins are probably some of the first stableproducts formed after 0 and OH· attack on butane. Somepossible reaction schemes for olefin formation are
at 1.7. The values of &and 0 were set at 0.8 and 0.02, respectively. 'Y and. were not needed since we did not compute theconcentration of aldehydes.
Isobutylene Experiments. Next we consider the isobutyleneexperiments reported by Westberg et aJ. (1971) in the presenceand absence of CO. Figure 4 presents concentration-timebehavior for the following initial conditions: [C.H.l, = 3,[NO,l, = 0.04, [NOlo = 1.5, [COlo = 0, and k ,' = 0.355min-I. Figure 5 shows concentration-time behavior for thesame initial conditions except [COlo = 100 ppm. The purposeof these trials is to examine the performance of the simplifiedmodel for another hydrocarbon and for the effect of CO.
Because isobutylene and propylene are both terminal olefinsof similar reactivity, '" was kept the same as for the propyleneruns. The rate constants and stoichimetric coefficients are thesame as for propylene except:
-- EXPERIMENTAL--- MODEL
0.2 0.4 0.6
REACTION
3.0
0.5
i~2.5
z2.0oiir81.0
0.1, [NOl, = 1.0, respectively. Each 3-hr simulation wascarried out in 3 sec by use of the routine of Gear (1971).Because of the generalized nature of the IS-step mechanism,the "rate constants" for the reactions are more a quantitativeexpression of the relative importance of classes of reactionsthan a reflection of the actual rate constants. Consequently,the rate constants for the IS-step mechanism are not identicalto those in Tables 1-VI, particularly k,o'-k15 '. This feature is anecessary, if undesirable, feature of a mechanism which sacrifices details of chemical reality for conciseness. Similarly, thestoichiometric coefficients must be viewed only qualitativelyas true stoichiometric coefficients. Following the dependenceof peak 0, on the NO to HC ratio for ratios from 0.25 to Ireported by Altshuller et aJ. (1967), '" was determined as
--EXPERIMENTAL--- MODEL
0,
3.0
~ 2.5
z2.00
~~ 1.5
81.0
0.5 NO
0.4 0.8 1.2 1.6 2.0 2.4 2,8 3.2REACTION TIME (MINUTES) x 10-2
-- EXPERIMENTAL--- MODEL
LO 1.2 1.4 1,6 1.8
(MINUTES) x 10.2
~ 2.5~
0.5
30
~2.0
iir5
81.0
Figure 5. Comparison of experimental smog chamber concentrationsand concentrations predicted by tbe simplified mechanism
Data for isobutyleue from Westberg et al. (1971)Initial concentration of carbon monoxide = tOO ppm
Figure 6. Comparison of experimental smog chamber concentrationsand concentrations predicted by tbe simplified mecbanism
Data for n-butane from Wilson (1971)Initial concentration of carbon monoxide = 0 ppm
Volume 6, Number I, Jauuary 1972 55
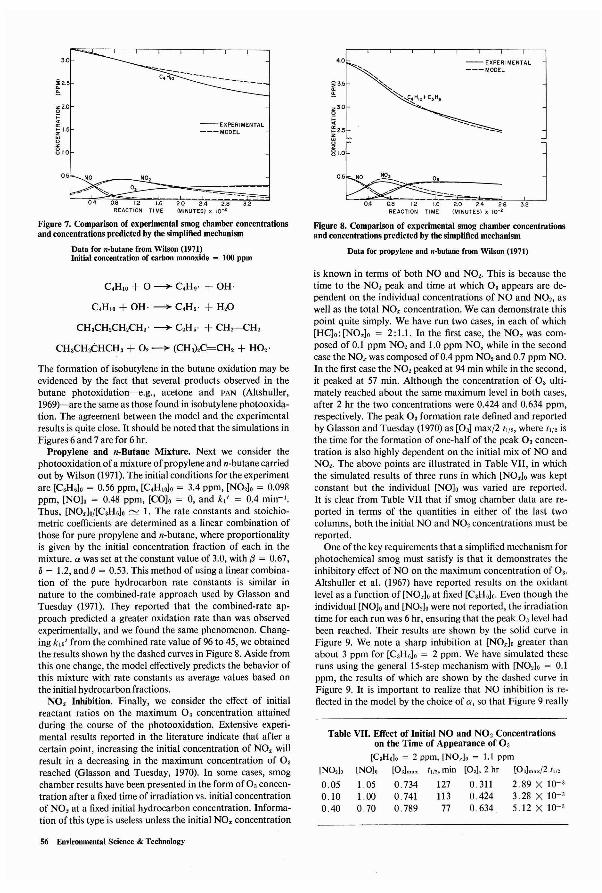
JJ
3.2
-- EXPERIMENTAL---MODEL
4.0
~3.5
z3.0o;::..~2.5
~b81.0
05 :~_~~_=~ _~---= 1
0.4 0.8 1.2 1.6 2.0 2.4 2.8REACTION TIME (MINUTES) x 10.2
--EXPERIMENTAL---MODEL
2.0 2.4 2.8 3.2(MINUTES) X 10-2
0.4 0.8 1.2 1.6REACTION TI ME
NO NOz05
~2.5
z2.0o
S~ 1.5
81,0
3.0
Figure 7. Comparison of experimental smog chamber concentrationsand concentrations predicted by the simplified mechanism
Data for n-butane from Wilson (1971)Initial concentration of carbon monoxide = 100 ppm
Figure 8. Comparison of experimental smog chamber concentrationsand concentrations predicted by the simplified mechanism
Data for propylene and n-butane from Wilson (1971)
[NOz]o
0.050.100.40
C.H lO + 0 ---+ C.H,· + OH·
C.H lO + OH· ---+ C.H,· + H20
CH,CH,CH,CH2 ' ---+ C2H,· + CH,=CH,
CH,CH,c:HCH, + 0, ---+ (CH,),C=CH2 + HO,·
The formation of isobutylene in the butane oxidation may beevidenced by the fact that several products observed in thebutane photoxidation-e.g., acetone and PAN (Altshuller,1969)-are the same as those found in isobutylene photooxidation. The agreement between the model and the experimentalresults is quite dose. It should be noted that the simulations inFigures 6 and 7 are for 6 hr.
Propylene and n-Butane Mixture. Next we consider thephotooxidation of a mixture of propylene and n-butane carriedout by Wilson (1971). The initial conditions for the experimentare [C,H,Jo = 0.56 ppm, [CoHlO]o = 3.4 ppm, [NO,lo = 0.098ppm, [NO]o = 0.48 ppm, [COlo = 0, and k1 ' = 0.4 min-I.Thus, [NOx]o/[C,H,lo "" I. The rate constants and stoichiometric coefficients are determined as a linear combination ofthose for pure propylene and n-butane, where proportionalityis given by the initial concentration fraction of each in themixture. a was set at the constant value of 3.0, with /3 = 0.67,(, = 1.2, and 0 = 0.53. This method of using a linear combination of the pure hydrocarbon rate constants is similar innature to the combined-rate approach used by Glasson andTuesday (1971). They reported that the combined-rate approach predicted a greater oxidation rate than was observedexperimentally, and we found the same phenomenon. Changing k,,' from the combined rate value of96 to 45, we obtainedthe results shown by the dashed curves in Figure 8. Aside fromthis one change, the model effectively predicts the behavior ofthis mixture with rate constants as average values based onthe initial hydrocarbon fractions.
NOx Inhibition. Finally, we consider the effect of initialreactant ratios on the maximum 0, concentration attainedduring the course of the photooxidation. Extensive experimental results reported in the literature indicate that after acertain point, increasing the initial concentration of NOx willresult in a decreasing in the maximum concentration of 0,reached (Glasson and Tuesday, 1970). In some cases, smogchamber results have been presented in the form of 0, concentration after a fixed time of irradiation vs. initial concentrationof NOx at a fixed initial hydrocarbon concentration. Information of this type is useless unless the initial NOx concentration
is known in terms of both NO and NO,. This is because thetime to the NO, peak and time at which 0, appears are dependent on the individual concentrations of NO and NO" aswell as the total NOx concentration. We can demonstrate thispoint quite simply. We have run two cases, in each of which[HClo: [NOx]o = 2: 1.1. In the first case, the NOx was composed of 0.1 ppm NO, and 1.0 ppm NO, while in the secondcase the NOx was composed of 0.4 ppm NO, and 0.7 ppm NO.In the first case the NO, peaked at 94 min while in the second,it peaked at 57 min. Although the concentration of 0, ultimately reached about the same maximum level in both cases,after 2 hr the two concentrations were 0.424 and 0.634 ppm,respectively. The peak 0, formation rate defined and reportedby Glasson and Tuesday (1970) as [0,1 max/2 (1/', where (1/2 isthe time for the formation of one-half of the peak 0, concentration is also highly dependent on the initial mix of NO andNO,. The above points are illustrated in Table VII, in whichthe simulated results of three runs in which [NOx]o was keptconstant but the individual [NO]o was varied are reported.It is dear from Table VII that if smog chamber data are reported in terms of the quantities in either of the last twocolumns, both the initial NO and NO, concentrations must bereported.
One of the key requirements that a simplified mechanism forphotochemical smog must satisfy is that it demonstrates theinhibitory effect of NO on the maximum concentration of 0,.Altshuller et al. (1967) have reported results on the oxidantlevel as a function of [NOx]o at fixed [C,H,]o. Even though theindividual [NOlo and [NO,]o were not reported, the irradiationtime for each run was 6 hr, ensuring that the peak O,level hadbeen reached. Their results are shown by the solid curve inFigure 9. We note a sharp inhibition at [NOxlo greater thanabout 3 ppm for [C,H,]o = 2 ppm. We have simulated theseruns using the general 15-step mechanism with [NO,]o = 0.1ppm, the results of which are shown by the dashed curve inFigure 9. It is important to realize that NO inhibition is reflected in the model by the choice of a, so that Figure 9 really
Table VII. Effect of Initial NO and NO, Concentrationson the Time of Appearance of 0,
[CaH,l, ~ 2 ppm, [NO.]o = 1.1 ppm
[N01, [O,lmox ("" min [0,1, 2 hr [O']mox/2 (1/2
1.05 0.734 127 0.311 289 X 10-'1.00 0.741 113 0.424 3.28 X 10-'o 70 0 .789 77 0 .634 5. 12 X 10-'
56 Environmental Science & Technology
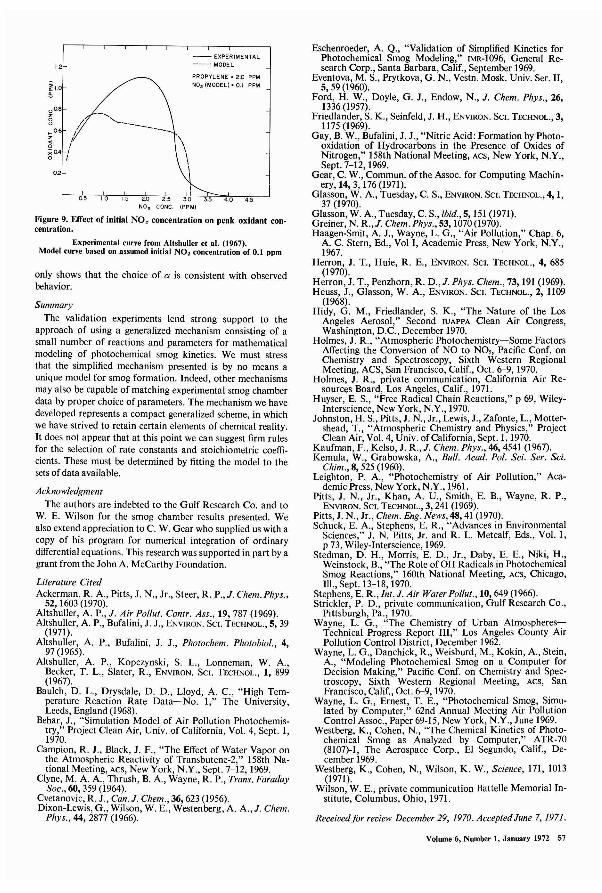
only shows that the choice of c< is consistent with observedbehavior.
0.5 1.0 1.5 2.0 2.5 3.0 3.5 4.0 4,5NOll CONe. (PPM)
Figure 9. Effect of initial NO, concentration on peak oxidant concentration.
Experimental curve from Allshuller et al. (1967).Model curve based on assumed initial N0 2 concentration of 0.1 ppm
Summary
The validation experiments lend strong support to theapproach of using a generalized mechanism consisting of asmall number of reactions and parameters for mathematicalmodeling of photochemical smog kinetics. We must stressthat the simplified mechanism presented is by no means aunique model for smog formation. Indeed, other mechanismsmay also be capable of matching experimental smog chamberdata by proper choice of parameters. The mechanism we havedeveloped represents a compact generalized scheme, in whichwe have strived to retain certain elements of chemical reality.It does not appear that at this point we can suggest firm rulesfor the selection of rate constants and stoichiometric coefficients. These must be determined by fitting the model to thesets of data available.
AcknowledgmentThe authors are indebted to the Gulf Research Co. and to
W. E. Wilson for the smog chamber results presented. Wealso extend appreciation to C. W. Gear who supplied us with acopy of his program for numerical integration of ordinarydifferential equations. This research was supported in part by agrant from the John A. McCarthy Foundation.
Literature CitedAckerman, R. A., Pitts, J. N., Jr., Steer, R. P., J. Chem. Phys.,
52,1603 (1970).Altshuller, A. P., J. Air Pollut. Contr. Ass., 19, 787 (1969).Altshuller, A. P., Bufalini, J. J., ENVIRON. SCI. TECHNOL., 5, 39
(1971).Altshuller, A. P., Bufalini, J. J., Photochem. Photobiol., 4,
97 (1965).Altshuller, A. P., Kopczynski, S. L., Lonneman, W. A.,
Becker, T. L., Slater, R., ENVIRON. SCI. TECHNOL., I, 899(1967).
Baulch, D. L., Drysdale, D. D., Lloyd, A. c., "High Temperature Reaction Rate Data-No. I," The University,Leeds, England (1968).
Behar, J., "Simulation Model of Air Pollution Photochemistry," Project Clean Air, Univ. of California, Vol. 4, Sept. I,1970.
Campion, R. J., Black, J. F., "The Effect of Water Vapor onthe Atmospheric Reactivity of Transbutene-2," 158th National Meeting, ACS, New York, N.Y., Sept. 7-12, 1969.
Clyne, M. A. A., Thrush, B. A., Wayne, R. P., Trans. FaradaySoc., 60,359 (1964).
Cvetanovic, R. J., Can. J. Chem., 36, 623 (1956).Dixon-Lewis, G., Wilson, W. E., Westenberg, A. A., J. Chem.
Phys., 44,2877 (1966).
Eschemoeder, A. Q., "Validation of Simplified Kinetics forPhotochemical Smog Modeling," IMR-I096, General Research Corp., Santa Barbara, Calif., September 1969.
Eventova, M. S., Prytkova, G. N., Vestn. Mosk. Univ. Ser. II,5,59 (1960).
Ford, H. W., Doyle, G. J., Endow, N., J. Chem. Phys., 26,1336 (1957).
Friedlander, S. K., Seinfeld, J. H., ENVIRON. SCI. TECHNOL., 3,1175 (1969).
Gay, B. W., Bufalini, J. J., "Nitric Acid: Formation by Photooxidation of Hydrocarbons in the Presence of Oxides ofNitrogen," 158th National Meeting, ACS, New York, N.Y.,Sept. 7-12, 1969.
Gear, C. W., Commun. of the Assoc. for Computing Machinery, 14, 3, 176 (1971).
Glasson, W. A., Tuesday, C. S., ENVIRON. SCI. TECHNOL.,4,1,37 (1970).
Glasson, W. A., Tuesday, C. S., ibid., 5,151 (1971).Greiner, N. R.,J. Chem. Phys., 53,1070 (1970).Haagen-Smit, A. J., Wayne, L. G., "Air Pollution," Chap. 6,
A. C. Stern, Ed., Vol I, Academic Press, New York, N.Y.,1967.
Herron, J. T., Huie, R. E., ENVIRON. SCI. TECHNOl., 4, 685(1970).
Herron, J. T., Penzhorn, R. D., J. Phys. Chem., 73,191 (1969).Heuss, J., Glasson, W. A., ENVIRON. SCI. TECHNOL., 2, 1109
(1968).Hidy, G. M., Friedlander, S. K., "The Nature of the Los
Angeles Aerosol," Second IUAPPA Clean Air Congress,Washington, D.C., December 1970.
Holmes, J. R., "Atmospheric Photochemistry-Some FactorsAffecting the Conversion of NO to NO" Pacific Conf. onChemistry and Spectroscopy, Sixth Western RegionalMeeting, ACS, San Francisco, Calif., Oct. 6-9, 1970.
Holmes, J. R., private communication, California Air Resources Board, Los Angeles, Calif., 1971.
Huyser, E. S., "Free Radical Chain Reactions," p 69, WileyInterscience, New York, N.Y., 1970.
Johnston, H. S., Pitts, J. N., Jr., Lewis, J., Zafonte, L., Mottershead, T., "Atmospheric Chemistry and Physics," ProjectClean Air, Vol. 4, Univ. of California, Sept. I, 1970.
Kaufman, F., Kelso, J. R., J. Chem. Phys., 46, 4541 (1967).Kemula, W., Grabowska, A., Bull. Acad. Pol. Sci. Ser. Sci.
Chim., 8, 525 (1960).Leighton, P. A., "Photochemistry of Air Pollution," Aca
demic Press, New York, N.Y., 1961.Pitts, J. N., Jr., Khan, A. U., Smith, E. B., Wayne, R. P.,
ENVIRON. SCI. TECHNOL., 3, 241 (1969).Pitts, J. N., Jr., Chem. Eng. News, 48, 41 (1970).Schuck, E. A., Stephens, E. R., "Advances in Environmental
Sciences," J. N. Pitts, Jr. and R. L. Metcalf, Eds., Vol. I,p 73, Wiley-Interscience, 1969.
Stedman, D. H., Morris, E. D., Jr., Daby, E. E., Niki, H.,Weinstock, B., "The Role of OH Radicals in PhotochemicalSmog Reactions," 160th National Meeting, ACS, Chicago,Ill., Sept. 13-18, 1970.
Stephens, E. R., Int. J. Air Water Pollut., 10, 649 (1966).Strickler, P. D., private communication, Gulf Research Co.,
Pittsburgh, Pa., 1970.Wayne, L. G., "The Chemistry of Urban Atmospheres
Technical Progress Report III," Los Angeles County AirPollution Control District, December 1962.
Wayne, L. G., Danchick, R., Weisburd, M., Kokin, A., Stein,A., "Modeling Photochemical Smog on a Computer forDecision Making," Pacific Conf. on Chemistry and Spectroscopy, Sixth Western Regional Meeting, ACS, SanFrancisco, Calif., Oct. 6-9,1970.
Wayne, L. G., Ernest, T. E., "Photochemical Smog, Simulated by Computer," 62nd Annual Meeting Air PollutionControl Assoc., Paper 69-15, New York, N.Y., June 1969.
Westberg, K., Cohen, N., "The Chemical Kinetics of Photochemical Smog as Analyzed by Computer," ATR-70(8107)-1, The Aerospace Corp., El Segundo, Calif., December 1969.
Westberg, K., Cohen, N., Wilson, K. W., Science, 171, 1013(1971).
Wilson, W. E., private communication Battelle Memorial Institute, Columbus, Ohio, 1971.
Received/or review December 29,1970. AcceptedJune 7, 1971.
-- EXPERIMENTAL--- MODEL
PROPYLENE" 2.0 PPMN02 (MODEL) z 0.1 PPM
0.2
1.2
i~1.0
~O.8
8 /.~0.6 /
~ Ii<OA Io I
Volume 6, Number I, January 1972 57
A Numerical Method for Computing Equilibria in Aqueous Chemical Systems
Francois Morel' and James Morgan
W. M. Keck Laboratories, California Institute of Technology, Pasadena, Calif. 91109
• A general purpose computer program especially adapted tothe study of acid-base and coordinative interactions and dissolution and precipitation in aqueous systems has been developed. The program uses the stability constant approachand the Newton-Raphson method for digital computation ofequilibria. It isable to handle numerous species and to find theequilibrium set of solids. Gas phases are considered to be atconstant partial pressures. The method is explained by use ofthe aqueous iron(I1I)-calcium--{;arbonate-phosphate systemas an example. An application of the program to a system of788 soluble species, 83 possible solids, and one gas-phase component is given as an illustration.
Equilibrium models can be very useful for understanding the various processes-dissolution and precipita
tion, oxidation and reduction, acid-base and coordinative interactions-which govern the chemical composition of naturalwaters (Stumm and Morgan, 1970). A classical example ofsuch an equilibrium model is the seawater model of Sillen(1961).
Typically, these models require the computation of equilibrium compositions for systems containing numerous speciesdistributed among an aqueous phase, a gas phase, and severalsolid phases. For any given model, the temperature and thepressure can generally be taken as constants. Exchange of matter with the surroundings being neglected and ideality beingassumed, the thermodynamic treatment of such closed systemsis straightforward (Denbigh, 1966), and the equilibrium composition is given by the minimum of the Gibbs free energyfunction or, equivalently, by the mass action laws, both subject to the constraints of the mole balance conditions.
We have been interested in developing a general purposecomputer program especially adapted to solving these types ofchemical equilibrium problems. Two main choices have to bemade in the development of such a program: First, the choiceof a notation that will allow the description of the system in algebraic terms and the setting up of the equations; second, thechoice of a method to solve the equilibrium problem.
Every possible kind of notation has been proposed in theliterature from the most particular one which identifies everychemical species under a special symbol, to the most generalone where elements of multidimensional tensors representthe species and their formulas. Because our prime interest iswith coordination processes we have chosen to differentiatebetween metals (M), ligands (L), and complexes (e). Sinceacid-base interactions are of special interest to us, the protonhas been given a special symbol (H). Gas and solid phases interact with the soluble species in a fairly similar way and theyare given a single symbolic representation (S). We feel that
1 To whom correspondence should be addressed.
S8 Environmental Science & Technology
this notation is general enough to allow the treatment of mostof the systems we are interested in and that it is particularenough to facilitate the translation of a particular chemicalproblem into a general algebraic one. The metals and the ligands are thus logically taken as the components of the systemand this division of the components into two families allows an unusually compact description of the system in a tableau form. This compactness is important in enabling a largenumber of species (up to a few thousand) to be handled.
To solve the chemical equilibrium problem, two principaltechniques can be distinguished. First, the so-called equilibrium constant approach which consists of solving the set ofnonlinear equations provided by the mass law and the molebalance equations. This method was pioneered by such workers as Brinkley (1947), and its most prominent application toaqueous systems is the Haltafall program developed by Sillenand his co-workers (Ingri et aI., 1967). The second techniquewas first proposed by Dantzig and co-workers (White et aI.,1958) and consists of directly minimizing the Gibbs free energyfunction subject to the constraints of the mole balance equations. This method was applied to large multiphasic systemsby Shapiro (1964). A fairly complete review of the two methodshas been given by Zeleznik and Gordon (1968).
We have chosen to use the equilibrium constant approach.The determining factor in choosing this method was that itallows reduction of the number of principal variables. In ourcase, for example, the concentrations of the complexes can beexpressed as a function of the free metal and free ligand concentrations by the mass law equations, and the problem is thusreduced to finding this set of free metal and free ligand concentrations that will satisfy the mole balance conditions. This isdone by use of the Newton-Raphson method for systems ofnonlinear equations.
As can be seen, our method is just the application of wellknown principles to a particular class of problems. Our goal issimply to present what we have found to be an efficient and reliable tool for solving a fairly general and important class ofchemical equilibrium problems in order to help others developsimilar tools.
By use of examples, the notation and the systematic settingup of the equations, both in the absence and in the presence ofsolids, will be presented. An iterative procedure to find theequilibrium solid phases will then be shown. An abridged description of the program will finally be given, followed by anexample demonstrating the possibilities of the method.
Description of the System
To derive a general method of computation one has tochoose some systematic notation that will describe the chemical system in algebraic terms. The notation that we have chosen differentiates metals and ligands and represents the chemical system in a tableau form. For example, the iron(III)-calcium-carbonate-phosphate system in water is represented inFigure 1. The values in parentheses are the logarithms of theconcentration stability constants for formation of aqueous
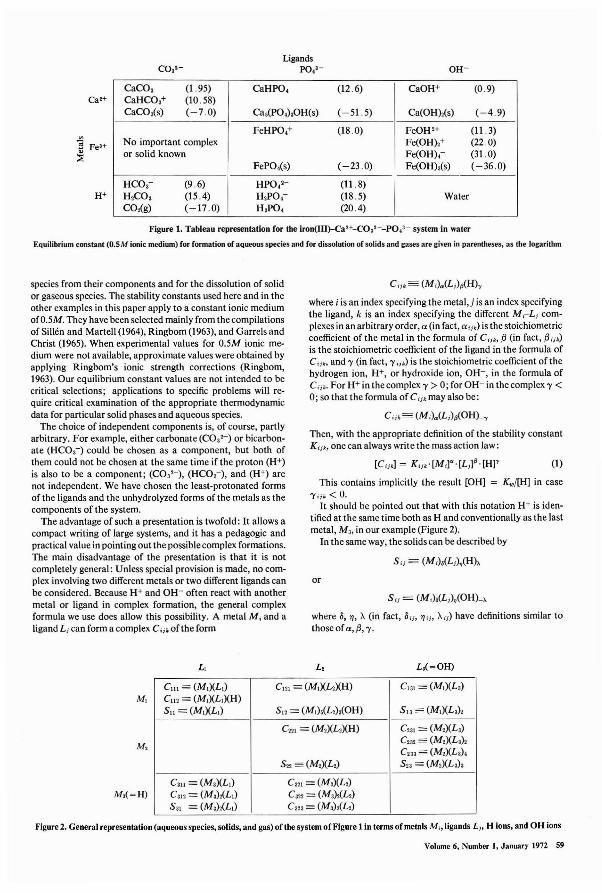
LigandsPO,'-
CaH
~ FeH
::E
H+
Caco, (1. 95) CaHPO, (12.6) CaOH+ (0.9)CaHCO,+ (10.58)CaCO,(s) (-7.0) Ca,(PO,),OH(s) ( -51.5) Ca(OH),(s) ( -4.9)
FeHPO,+ (180) FeOH H (113)No important complex Fe(OH),+ (22.0)or solid known Fe(OH),- (31.0)
FePO,(s) (-23.0) Fe(OH),(s) (-36.0)
HCO,- (9.6) HPO,'- (11 .8)H,CO, (15.4) H,PO,- (18.5) WaterCO,(g) (-17.0) H,PO, (20.4)
Figure 1. Tableau representation for the iron(lIl}-CaH-CO,'--PO,'- system in water
Equilibrium constant (O.SM ionic medium) for formation of aqueous species and for dissolution of solids and gases are given in parentheses, as the logarithm
species from their components and for the dissolution of solidor gaseous species. The stability constants used here and in theother examples in this paper apply to a constant ionic mediumofO.5M. They have been selected mainly from the compilationsof Sillen and Martell (1964), Ringbom (1963), and Garrels andChrist (1965). When experimental values for 0.5M ionic medium were not available, approximate values were obtained byapplying Ringbom's ionic strength corrections (Ringbom,1963). Our equilibrium constant values are not intended to becritical selections; applications to specific problems will require critical examination of the appropriate thermodynamicdata for particular solid phases and aqueous species.
The choice of independent components is, of course, partlyarbitrary. For example, either carbonate (CO,'-) or bicarbonate (HCO,-) could be chosen as a component, but both ofthem could not be chosen at the same time if the proton (H+)is also to be a component; (CO,'-), (HCO,-), and (H+) arenot independent. We have chosen the least-protonated formsof the ligands and the unhydrolyzed forms of the metals as thecomponents of the system.
The advantage of such a presentation is twofold: It allows acompact writing of large systems, and it has a pedagogic andpractical value in pointing out the possible complex formations.The main disadvantage of the presentation is that it is notcompletely general: Unless special provision is made, no complex involving two different metals or two different ligands canbe considered. Because H+ and OH- often react with anothermetal or ligand in complex formation, the general complexformula we use does allow this possibility. A metal M i and aligand L; can form a complex c,;. ofthe form
C i;' = (MiML;MH)y
where i is an index specifying the metal,j is an index specifyingthe ligand, k is an index specifying the different M,-L; complexes in an arbitrary order, a (in fact, au.) is the stoichiometriccoefficient of the metal in the formula of Cu., {3 (in fact, (3i;.)is the stoichiometric coefficient of the ligand in the formula ofC i;" and 'Y (in fact, 'Y i;.) is the stoichiometric coefficient of thehydrogen ion, H+, or hydroxide ion, OH-, in the formula ofc,;•. For H+ in the complex 'Y > 0; for OH- in the complex 'Y <0; so that the formula ofc,;. may also be:
c,;. "'" (MiML;MOH)-y
Then, with the appropriate definition of the stability constantKi;k, one can always write the mass action law:
(1)
This contains implicitly the result [OH] = Kw/[H] in case
'Yi;' < O.It should be pointed out that with this notation H+ is iden
tified at the same time both as H and conventionally as the lastmetal, M" in our example (Figure 2).
In the same way, the solids can be described by
or
where 0, '1> A (in fact, Oi;, ,/i;, Ai;) have definitions similar tothose of a, (3, 'Y.
L, L,(=OH)
M,
M,(=H)
Cm == (M,)(L ,) Cm == (M,XL,)(H) Cm == (M,)(L,)Cm == (M,XL,XH)SII == (M,XL,) S" == (Mt),(L,),(OH) SI3 == (M,)(L'h
C", == (M,XL,XH) Cm == (M,XL,)C,,, == (M,XL'hC", == (M,XL,),
S" == (M,XL,) S" == (M,XL,),
C311 == (M,XL,) C"I == (M,)(L,)Cm == (M,),(L,) C", == (M,),(L,)S31 == (M,),(L ,) C,,, == (M,),(L,)
Figure 2. General representation (aqueous species, solids, and gas) of tbe system of Figure 1in terms of metals Mi' ligands L;, H ions, and OH ions
Volume 6, Number 1, January 1972 59
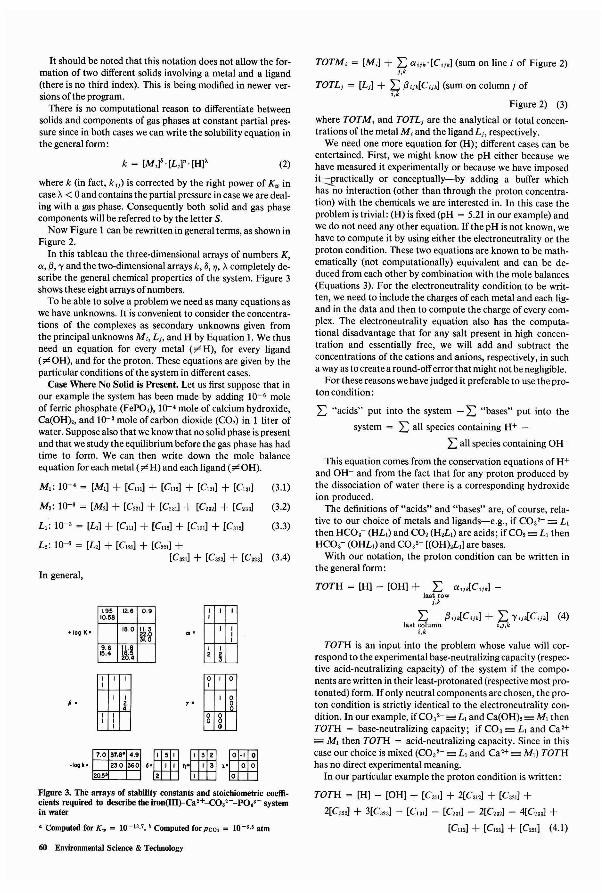
a Computed for K w = 10-13.'.' Computed for Pee, = 10-'·' atm
In general,
Figure 3. The arrays of stability constants and stoicbiometric coefficients required to describe the iron(III)-Ca2+-CO,'--PO.' - systemin water
Figure 2) (3)
where TOTM, and TOTL j are the analytical or total concentrations of the metal M, and the ligand L;, respectively.
We need one more equation for (H); different cases can beentertained. First, we might know the pH either because wehave measured it experimentally or because we have imposedit:::::£ractically or conceptually-by adding a buffer whichhas no interaction (other than through the proton concentration) with the chemicals we are interested in. In this case theproblem is trivial: (H) is fixed (pH = 5.21 in our example) andwe do not need any other equation. If the pH is not known, wehave to compute it by using either the electroneutrality or theproton condition. These two equations are known to be mathematically'(not computationally) equivalent and can be deduced from each other by combination with the mole balances(Equations 3). For the electroneutrality condition to be written, we need to include the charges of each metal and each ligand in the data and then to compute the charge of every complex. The electroneutrality equation also has the computational disadvantage that for any salt present in high concentration and essentially free, we will add and subtract theconcentrations of the cations and anions, respectively, in sucha way as to create a round-off error that might not be negligible.
For these reasons we have judged it preferable to use the proton condition:
~ "acids" put into the system - ~ "bases" put into the
system = ~ all species containing H+ -
~ all species containing OH-
This equation comes from the conservation equations of H+and OH- and from the fact that for any proton produced bythe dissociation of water there is a corresponding hydroxideion produced.
The definitions of "acids" and "bases" are, of course, relative to our choice of metals and ligands-e.g., if CO,'- "'" L,then HCO,- (HL,) and CO, (H,L,) are acids; if CO, "'" L, thenHCO,- (OHL,) and CO,'- [(OH),L,] are bases.
With our notation, the proton condition can be written inthe general form:
TOTH = [H] - [OH] + ~ Cii;'[C,;,]-last row
i,k
~ !3i;'[C,;,] + ~ 'Y ii'[C,;,] (4)last column i,j,k
i,k
TOTMi = [M;J + ~ Cii;dC,;,] (sum on line i of Figure 2)i,k
TOTL; = [L;] + ~ !3i;'[C,;,] (sum on column) ofi,k
TOTH is an input into the problem whose value will correspond to the experimental base-neutralizing capacity (respective acid-neutralizing capacity) of the system if the components are written in their least-protonated (respective most protonated) form. If only neutral components are chosen, the proton condition is strictly identical to the electroneutrality condition. In our example, ifCO,'- "'" L, and Ca(OH), "'" M, thenTOTH = base-neutralizing capacity; if CO, "'" L, and Ca 2+"'" M, then TOTH = acid-neutralizing capacity. Since in thiscase our choice is mixed (CO,'- "'" L, and Ca2+ "'" M,) TOTHhas no direct experimental meaning.
In our particular example the proton condition is written:
TOTH = [H] - [OH] + [C,"] + 2[C",] + [C"Il +2[C",l + 3[C",] - [Ct31] - [C23,] - 2[C23,] - 4[C",] +
[Cll,] + [Cm ] + [C,2I] (4.1)
(2)
1 I
1 111
010I
'"
1 01" 0
8 8o
~~~d
8 trlIJ ~.h8J 1lITTI
k = [M;]'· [L;]"· [H]'
I 1
I 12
1.95 12,6 0.910.~8
18.0 kH31.0
9.6 iU15.4
+ 109 K·
It should be noted that this notation does not allow the formation of two different solids involving a metal and a ligand(there is no third index). This is being modified in newer versions of the program.
There is no computational reason to differentiate betweensolids and components of gas phases at constant partial pressure since in both cases we can write the solubility equation inthe general form:
where k (in fact, k i;) is corrected by the right power of Kw incase A< 0 and contains the partial pressure in case we are dealing with a gas phase. Consequently both solid and gas phasecomponents will be referred to by the letter S.
Now Figure 1 can be rewritten in general terms, as shown inFigure 2.
In this tableau the three-dimensional arrays of numbers K,Ci,!3, 'Y and the two-dimensional arrays k, 0, '7, Acompletely describe the general chemical properties of the system. Figure 3shows these eight arrays of numbers.
To be able to solve a problem we need as many equations aswe have unknowns. It is convenient to consider the concentrations of the complexes as secondary unknowns given fromthe principal unknowns M i , L;, and H by Equation I. We thusneed an equation for every metal (~H), for every ligand(~OH), and for the proton. These equations are given by theparticular conditions of the system in different cases.
Case Where No Solid is Present. Let us first suppose that inour example the system has been made by adding 10-6 moleof ferric phosphate (FeP04), 10-4 mole of calcium hydroxide,Ca(OH)" and 10-' mole of carbon dioxide (CO,) in 1 liter ofwater. Suppose also that we know that no solid phase is presentand that we study the equilibrium before the gas phase has hadtime to form. We can then write down the mole balanceequation for each metal (~H) and each ligand (~OH).
M,: 10-4 = [M,] + [CllIl + [Cm] + [Cm] + [Ct,Il (3.1)
M,: 10-6 = [M,] + [C'2I] + [C23,] + [C,,,] + [Cm ] (3.2)
L,: 10-' = [L,] + [CIlI] + [Cm ] + [Ct31] + [C",] (3.3)
L,: 10-' = [L,] + [Cm ] + [C",] +[C"Il + [C,,,] + [C",] (3.4)
60 Environmental Science & Technology
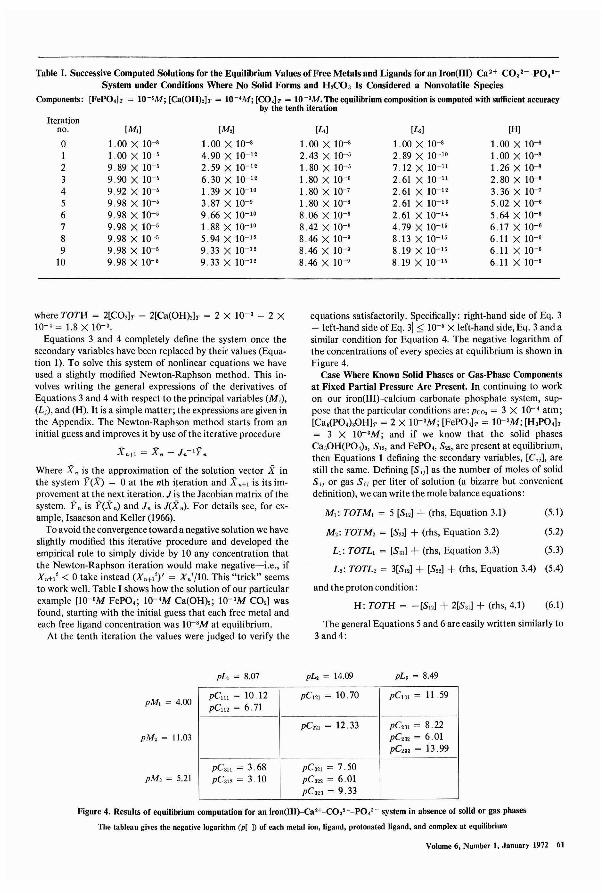
Table I. Successive Computed Solutions for the Equilibrium Values of Free Metals and Ligands for an Iron(III)-Ca 2+-CO,'--PO,'System under Conditions Where No Solid Forms and H,CO, Is Considered a Nonvolatile Species
Components: [FePO,lr = to-'M; [Ca(OH),]T = to-'M; [CO,]T = to-'M. The equilibrium composition is computed with sufficient accuracyby the tenth iteration
Iterationno. [M.] [M,l [L1l [L,l [H]
0 1.00 X 10⁻⁸ 1. 00 X 10-8 1.00 X 10⁻⁸ 1.00 X 10⁻⁸ 1.00 X 10⁻⁸
1 1.00 X 10-' 4.90 X 10⁻¹² 2.43 X 10-' 2.89 X 10⁻¹⁰ 1.00 X 10⁻⁸
2 9.89 X 10-' 2.59 X 10⁻¹² 1.80 X 10-' 7.12 X 10⁻¹¹ 1.26 X 10⁻⁸
3 9.90 X 10-' 6.30 X 10⁻¹² 1.80 X 10-' 2.61 X 10⁻¹¹ 2.80X10⁻⁸
4 9.92 X 10-' 1. 39 X 10-10 1. 80 X 10- 7 2.61 X 10⁻¹' 3.36 X 10⁻⁷
5 9.98 X 10-' 3.87 X 10-' 1.80 X 10⁻⁸ 2.61 X 10⁻¹³ 5.02 X 10-'6 9.98 X 10-' 9.66 X 10⁻¹⁰ 8.06 X 10⁻⁹ 2.61 X 10⁻¹⁴ 5.64 X 10-'7 9.98 X 10-' 1.88 X 10⁻¹⁰ 8.42 X 10⁻⁹ 4.79 X 10⁻¹⁵ 6.17 X 10-'8 998 X 10-' 5.94 X 10⁻¹² 8.46 X 10-' 8.13 X 10⁻¹⁵ 6.11 X 10-'9 9.98 X 10-' 9.33 X 10⁻¹² 8.46 X 10⁻⁹ 8.19 X 10⁻¹⁵ 6.11 X 10-'
10 9.98 X 10-' 9.33 X 10⁻¹² 8.46 X 10-' 8.19 X 10⁻¹⁵ 6.11 X 10-'
where TOTH = 2[CO,lr - 2[Ca(OH),lr = 2 X 10⁻³ - 2 X10-' = 1.8 X 10-'.
Equations 3 and 4 completely define the system once thesecondary variables have been replaced by their values (Equation 1). To solve this system of nonlinear equations we haveused a slightly modified Newton-Raphson method. This involves writing the general expressions of the derivatives ofEquations 3 and 4 with respect to the principal variables (MJ,(L;), and (H). It is a simple matter; the expressions are given inthe Appendix. The Newton-Raphson method starts from aninitial guess and improves it by use of the iterative procedure
X"+l = X" - In-lY,,
Where X. is the approximation of the solution vector X inthe system l'(X) = 0 at the nth iteration and X .+1 is its improvement at the next iteration. J is the Jacobian matrix of thesystem. Y. is Y(X.) and J. is J(X .). For details see, for example, Isaacson and Keller (1966).
To avoid the convergence toward a negative solution we haveslightly modified this iterative procedure and developed theempirical rule to simply divide by 10 any concentration thatthe Newton-Raphson iteration would make negative-i.e., if%.+1' < 0 take instead (%.+1')' = %.'/10. This "trick" seemsto work well. Table I shows how the solution of our particularexample [IO-'M FePO,; 10-'M Ca(OH),; 10- 3M CO,l wasfound, starting with the initial guess that each free metal andeach free ligand concentration was 10-8M at equilibrium.
At the tenth iteration the values were judged to verify the
equations satisfactorily. Specifically: Iright-hand side of Eq. 3- left-hand side of Eq. 3\'::; 10-' X left-hand side, Eq. 3 and asimilar condition for Equation 4. The negative logarithm ofthe concentrations of every species at equilitrium is shown inFigure 4.
Case Where Known Solid Phases or Gas-Phase Componentsat Fixed Partial Pressure Are Present. In continuing to workon our iron(III)-calcium-carbonate-phosphate system, suppose that the particular conditions are: Peo, = 3 X 10-' atm;[Ca,(PO,),OH]T = 2 X IO-'M; [FePO,]T = 10-'M; [H,PO,lr= 3 X 10-'M; and if we know that the solid phasesCa,OH(PO,)" SI', and FePO., S", are present at equilibrium,then Equations 1 defining the secondary variables, [C u], arestill the same. Defining [S,;] as the number of moles of solidSi; or gas S;; per liter of solution (a bizarre but convenientdefinition), we can write the mole balance equations:
M: TOTM I = 5 [SI'] + (rhs, Equation 3.1) (5.1)
M,: TOTM, = [S,,] + (rhs, Equation 3.2) (5.2)
LI: TOTL I = [S,.] + (rhs, Equation 3.3) (5.3)
L,: TOTL, = 3[Sd + [S,,] + (rhs, Equation 3.4) (5.4)
and the proton condition:
H: TOTH = -[SI,] + 2[S,.] + (rhs, 4.1) (6.1)
The general Equations 5 and 6 are easily written similarly to3 and 4:
pLI = 8.07 pL, = 14.09 pL, = 8.49
pMI = 4.00
pM, = 11.03
pM, = 5.21
pCllI = 10.12 pCl21 = 1070 PC'I = 1159pCll2 = 6.71
PC"I = 12.33 PC"I = 8.22pC", = 6.01pC", = 13.99
PC'II = 3.68 pC321 = 7.50PC'I' = 3.10 pC,,, = 6.01
pC", = 9.33
Figure 4. Results of equilibrium computation for an iron(III)--CaH-CO,'--PO,'- system in absence of solid or gas phases
The tableau gives the negative logarithm (pr ]) of each metal ion, ligand, protonated ligand, and complex at equilibrium
Volume 6, Number I, January 1972 61
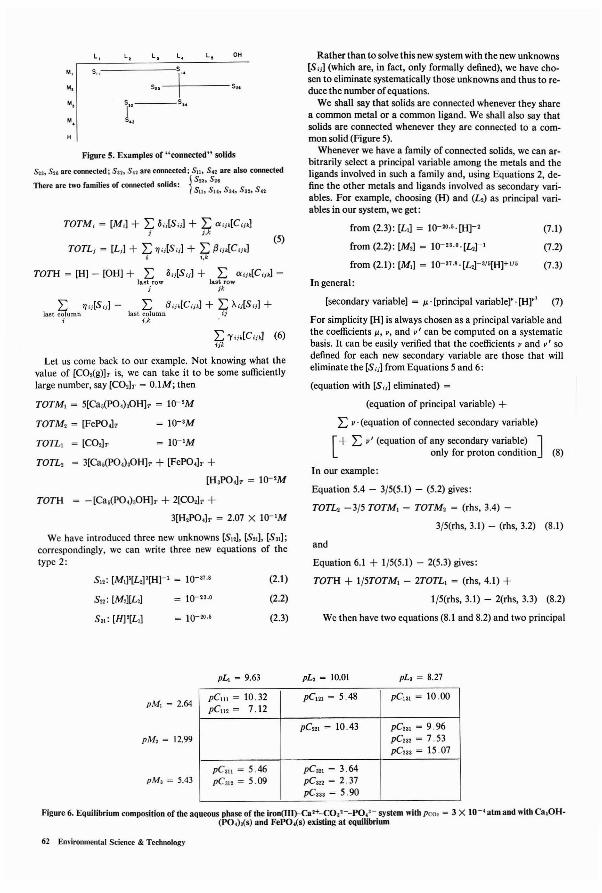
(7.1)
(7.2)
(7.3)
from (2.3): [L,] = lO-20"'[H]-'
from (2.2): [M,] = 10-23 .o.[L,]-1
from (2.1): [M,] = 10-37 "'[L,]-"'[H]+1"
In general:
[secondary variable] = /10' [principal variable]'· [H]" (7)
We then have two equations (8.1 and 8.2) and two principal
and
For simplicity [H] is always chosen as a principal variable andthe coefficients /10, v, and v' can be computed on a systematicbasis. It can be easily verified that the coefficients v and v' sodefined for each new secondary variable are those that willeliminate the [S'j] from Equations 5 and 6:
(equation with [S'j] eliminated) =
(equation of principal variable) +LV' (equation of connected secondary variable)
[+ L v' (equation of any secondary variable) ]
only for proton condition (8)
In our example:
Equation 5.4 - 3{5(5.1) - (5.2) gives:
TOTL, -3{5 TOTM, - TOTM, = (rhs, 3.4) -
3{5(rhs, 3.1) - (rhs, 3.2) (8.1)
Equation 6.1 + 1{5(5.1) - 2(5.3) gives:
TOTH + 1{5TOTM, - 2TOTL1 = (rhs, 4.1) +1{5(rhs, 3.1) - 2(rhs, 3.3) (8.2)
Rather than to solve this new system with the new unknowns[S 'j] (which are, in fact, only formally defined), we have chosen to eliminate systematically those unknowns and thus to reduce the number ofequations.
We shall say that solids are connected whenever they sharea common metal or a common ligand. We shall also say thatsolids are connected whenever they are connected to a common solid (Figure 5).
Whenever we have a family of connected solids, we can arbitrarily select a principal variable among the metals and theligands involved in such a family and, using Equations 2, define the other metals and ligands involved as secondary variables. For example, choosing (H) and (L,) as principal variables in our system, we get:
(5)
(2.1)
(2.2)
(2.3)= lO-20·'
= 10-23 •0
= 10- 1M
L l3'j,[C,j'] + L A'j[S'j] +last column i;
i,k
S,,: [M,][L,]
S'I: [H]'[L,]
-[Ca,(PO.),OHlr + 2lCO,]T +3[H,POJT = 2.07 X 10- 1M
L, L, L, L. L, OH
M, s" S
M, s..-\ S..
M, in s"
M S..
TOTM i = [M,] + L 5'j[S'j] + L aij,[C'j']i i.k
L 1)ij[S'j]-last column
i
TOTH
We have introduced three new unknowns IS,,]. [S,,]. [S,,];correspondingly, we can write three new equations of thetype 2:
TOTL, = 3[Ca,(PO.),OHlr + [FePOJT +[H,PO']T = 10-'M
TOTM, = [FePO.]T
TOTLI = lCO,]T
Let us come back to our example. Not knowing what thevalue of [CO,(g)]T is. we can take it to be some sufficientlylarge number. say [CO']T = O.lM; then
TOTMt = 5[Ca,(PO.),OH]T = lO-'M
Figure 5. Examples of "connected" solids
Suo Su are connected; Su. Su are connected; SI1. SU are also connected
There are two families of connected solids: 1Ss'" SS" S S Sit, 14. 3h 31, .n
TOTH = [H] - [OH] + L 5;;lS,,] + L a'j,[C,j']-last row last row
i jk
pL, = 9.63 pL, = 10.01 pL, = 8.27
pM, = 2.64
pM, = 12.99
pM, = 5.43
pC", = lO.32 pCl2l = 5.48 pC13l = lO.OOpC1l2 = 7.12
pC", = 10.43 pC", = 9.96pC", = 7.53pC", = 15.07
pC3Il = 5.46 pC", = 3.64pC", = 5.09 pC,,, = 2.37
pCm =5.90
Figure 6. Equilibrium composition of the aqueous phase of the iron(lIl}-CaH-CO,'--PO.'- system with peo, = 3 X 10-' atm and with Ca,OH.(PO.Ms) and FePO.(s) existing at equilibrium
62 Emironmental Science & Technology
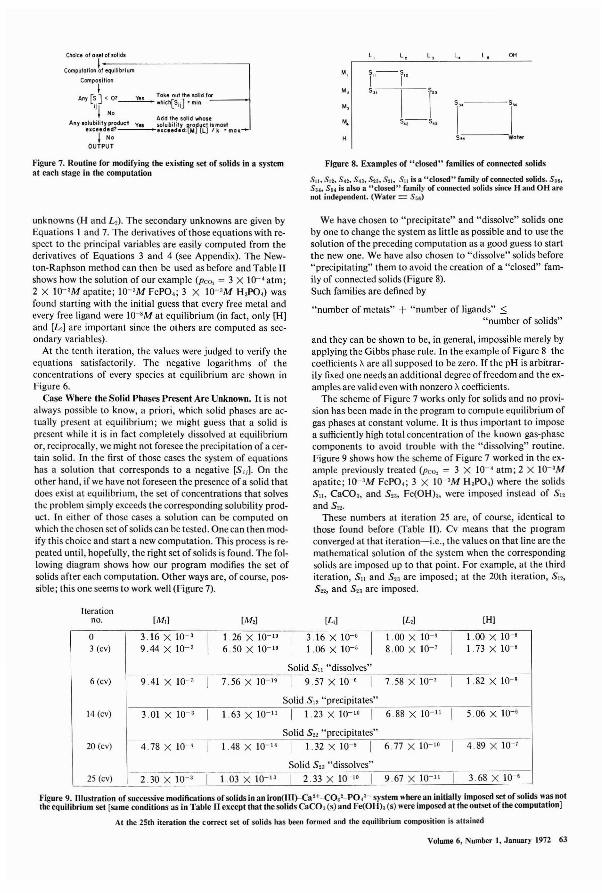
ChoIce of 0 set of solids
Compulotion t,-'-.U-ili-b,-;u-m------------,Composition
I .An [S] < 07 Yes Toke oullhe soM 101'::..-__-1
Y ij --- which[SiiJ : min
I NoAdd the solid whose
Any solubility praduc1 Yes solubility "roduct Is mostuceeded?----ncud.d:[M] (l) Ik % mOl-
I NoOUTPUT
Figure 7. Routine for modifying the existiog set of solids in a systemat each stage in the computation
unknowns (H and L,). The secondary unknowns are given byEquations I and 7. The derivatives of those equations with respect to the principal variables are easily computed from thederivatives of Equations 3 and 4 (see Appendix). The Newton-Raphson method can then be used as before and Table IIshows how the solution of our example (Peo, = 3 X 10-' atm;2 X 10⁻³M apatite; 1O-3M FePO.; 3 X 1O-3M H 3PO.) wasfound starting with the initial guess that every free metal andevery free ligand were 1O-8 M at equilibrium (in fact, only [H]and [L,] are important since the others are computed as secondary variables).
At the tenth iteration, the values were judged to verify theequations satisfactorily. The negative logarithms of theconcentrations of every species at equilibrium are shown inFigure 6.
Case Where the Solid Phases Present Are Unknown. It is notalways possible to know, a priori, which solid phases are actually present at equilibrium; we might guess that a solid ispresent while it is in fact completely dissolved at equilibriumor, reciprocally, we might not foresee the precipitation of a certain solid. In the first of those cases the system of equationshas a solution that corresponds to a negative [S ;;1. On theother hand, if we have not foreseen the presence of a solid thatdoes exist at equilibrium, the set of concentrations that solvesthe problem simply exceeds the corresponding solubility product. In either of those cases a solution can be computed onwhich the chosen set of solids can be tested. One can then modify this choice and start a new computation. This process is repeated until, hopefully, the right set of solids is found. The following diagram shows how our program modifies the set ofsolids after each computation. Other ways are, of course, possible; this one seems to work well (Figure 7).
L, L, L, L. L. 0"
M, 1"-1"M, s"
I rM. r r"'. S.-,--s.,
s~ Water
Figure 8. Examples of "closed" families of connected solids
SIl. S12. Su. S,3t SUI S21t Su is a "closed" family of connected solids. 5 36•
5 34 • 5 5( is also a "closed" family of connected solids since Hand OH arenot independent. (Water === 556)
We have chosen to "precipitate" and "dissolve" solids oneby one to change the system as little as possible and to use thesolution of the preceding computation as a good guess to startthe new one. We have also chosen to "dissolve" solids before"precipitating" them to avoid the creation of a "closed" family of connected solids (Figure 8).Such families are defined by
"number of metals" + "number of ligands" ::s:"number of solids"
and they can be shown to be, in general, impossible merely byapplying the Gibbs phase rule. In the example of Figure 8 thecoefficients A are all supposed to be zero. If the pH is arbitrarily fixed one needs an additional degree of freedom and the examples are valid even with nonzero Acoefficients.
The scheme of Figure 7 works only for solids and no provision has been made in the program to compute equilibrium ofgas phases at constant volume. It is thus important to imposea sufficiently high total concentration of the known gas-phasecomponents to avoid trouble with the "dissolving" routine.Figure 9 shows how the scheme of Figure 7 worked in the example previously treated (Peo, = 3 X 10-' atm; 2 X 1O-3Mapatite; 1(J3M FePO.; 3 X 1O-3M H3PO.) where the solidsS", CaC03, and S", Fe(OH)3' were imposed instead of S"and S2'l.
These numbers at iteration 25 are, of course, identical tothose found before (Table II). Cv means that the plogramconverged at that iteration-i.e., the values on that line are themathematical solution of the system when the correspondingsolids are imposed up to that point. For example, at the thirditeration, S" and S" are imposed; at the 20th iteration, S",S", and S" are imposed.
Iterationno. [M,l [M,J [L,l [L,l [Hl
0 3.16 X 10 3
I1.26XI019
I3.16XI0'
II.OOXIO'
I1.00 X 10 8
3 (ev) 9.44 X 10⁻³ 6.50 X 10- 19 1.06 X 10-' 8.00 X 10-' 1. 73 X 10-8
Solid S" "dissolves"6 (ev) 9.41 X 10⁻³ I 7.56 X 10- 19 I 9 57 X 10-' I 7.58 X 10 ' I 1.82 X 10-'
Solid SI' "precipitates"14 (cv) 301 X 10- 3 I 1.63 X 10- 11 I 1.23 X 10⁻¹⁰ I 6.88 X 10- 11 I 5.06XI0'
Solid S" "precipitates"20 (ev) 4.78 X 10-' I 1.48 X 10- 14 I 1.32 X 10 8 I 6.77 X 10 10 I 4.89XIO'
Solid S" "dissolves"----------
I I 9.67 X 10 11 I 3.68XI0'25 (cv) 2.30 X 10⁻³ I I .03 X 10-13 2.33 X 10 10
Figure 9. Illustration of successive modifications ofsolids in an iron(JII}-Ca>+-CO,'-PO.'- system wher.e an initially imposed set of solids wa.s notthe equilibrium set [same conditions as in Table" except that the solids CaCO, (s) and Fe(OH), (s) were Imposed at the outset of the computatIon]
At the 25th iteration the correct set of solids has been formed and the equilibrium composition is attained
Volume 6, Number 1, January 1972 63
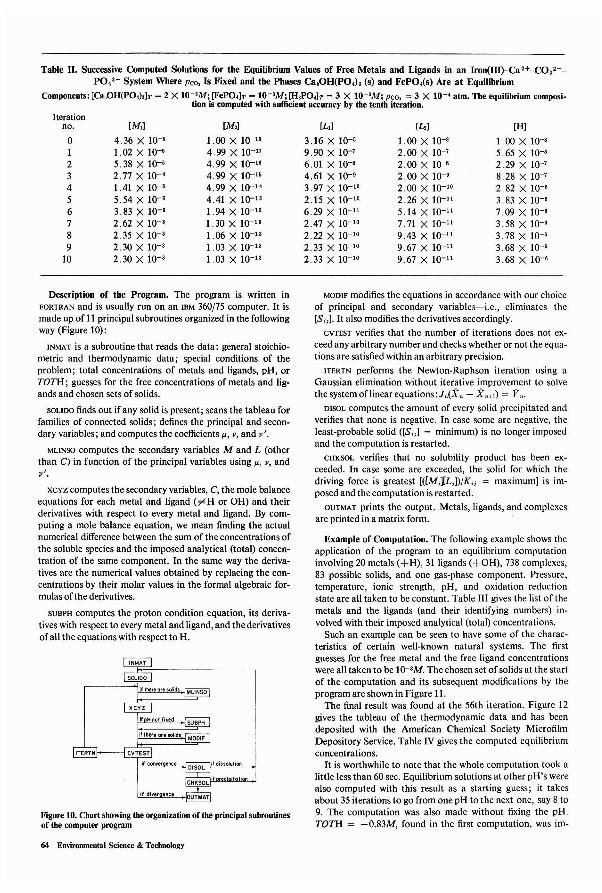
[H]
1.00 X 10-'5.65 X 10-'2.29 X 10⁻⁷
8.28 X 10⁻⁷
2.82 X 10-'3.83 X 10-'7.09 X 10-'3.58 X 10-'3.78 X 10-'3.68 X 10-'3.68 X 10-'
[L,]
1.00 X 10-'2.00 X 10⁻⁷
2.00 X 10-'2.00 X 10-'2.00 X 10⁻¹⁰
2.26 X 10⁻¹¹
5.14Xl0-11
7.71 X 10⁻¹¹
9.43 X 10⁻¹¹
9.67 X 10- 11
9.67 X 10⁻¹¹
[L,]
3.16XI0-·9.90 X 10⁻⁷
6.01 X 10-'4.61 X 10-'3.97 X 10⁻¹⁰
2.15 X 10⁻¹⁰
6.29 X 10⁻¹¹
2.47 X 10⁻¹⁰
2.22 X 10⁻¹⁰
2.33 X 10- 10
2.33 X 10⁻¹⁰
[M,]
1.00 X 10-"4.99 X 10⁻¹⁷
4.99 X 10⁻¹⁶
4.99 X 10-"4.99 X 10-"4.41 X 10⁻¹⁸
1.94 X 10⁻¹³
1. 30 X 10- 13
1.06 X 10⁻¹³
1.03 X 10⁻¹³
1.03 X 10⁻¹³
[M,]
4.36 X 10-'1.02 X 10-'5.38 X 10-'2.77 X 10-'1.41 X 10-'5.54 X 10-'3.83 X 10⁻³
2.62 X 10-'2.35 X 10-'2.30 X 10-'2.30 X 10-'
o123456789
10
Table II. Successive Computed Solutions for the Equilibrium Values of Free Metals and Ligands in an Iron(III)-Ca 2+-C032-
PO.'- System Where Peo, Is Fixed and the Phases Ca.OH(PO.), (s) and FePO.(s) Are at Equilibrium
Components: [Ca,OH(PO.)'lT = 2 X 10⁻³M; [FePO.lT = lO-'M; [H3PO.]T = 3 X 10⁻³M; Peo, = 3 X 10-' atm. The equilibrium composition is computed with sufficient accuracy by the tenth iteration.
Iterationno.
Example of Computation. The following example shows theapplication of the program to an equilibrium computationinvolving 20 metals (+H), 31 ligands (+OH), 738 complexes,83 possible solids, and one gas-phase component. Pressure,temperature, ionic strength, pH, and oxidation-reductionstate are all taken to be constant. Table III gives the list of themetals and the ligands (and their identifying numbers) involved with their imposed analytical (total) concentrations.
Such an example can be seen to have some of the characteristics of certain well-known natural systems. The firstguesses for the free metal and the free ligand concentrationswere all taken to be 10-'M. The chosen set of solids at the startof the computation and its subsequent modifications by theprogram are shown in Figure 11.
The final result was found at the 56th iteration. Figure 12gives the tableau of the thermodynamic data and has beendeposited with the American Chemical Society MicrofilmDepository Service. Table IV gives the computed equilibriumconcentrations.
It is worthwhile to note that the whole computation took alittle less than 60 sec. Equilibrium solutions at other pH's werealso computed with this result as a starting guess; it takesabout 35 iterations to go from one pH to the next one, say 8 to9. The computation was also made without fixing the pH.TOTH = -0.83M, found in the first computation, was im-
MODIF modifies the equations in accordance with our choiceof principal and secondary variables-i.e., eliminates the[Sii]' It also modifies the delivatives accordingly.
CVTEST verifies that the number of iterations does not exceed any arbitrary number and checks whether or not the equations are satisfied within an arbitrary precision.
ITERTN performs the Newton-Raphson iteration using aGaussian elimination without iterative improvement to solvethe system of linear equations: J ,(X. - X.+,) = Y•.
D1S0L computes the amount of every solid precipitated andverifies that none is negative. In case some are negative, theleast-probable solid ([S ii] = minimum) is no longer imposedand the computation is restarted.
CHKSOL verifies that no solubility product has been exceeded. In case some are exceeded, the solid for which thedriving force is greatest [([M;][Li])/K ii = maximum] is imposed and the computation is restarted.
OUTMAT prints the output. Metals, ligands, and complexesare printed in a matrix form.
CHKSOLJll;'.I!!'ll!IIJii"".m;"'-'-oJ
OUTMATif diver ence
P===-+j01SOL jf dissolulion
XCYZ computes the secondary variables, C, the mole balanceequations for each metal and ligand (;eH or OH) and theirderivatives with respect to every metal and ligand. By computing a mole balance equation, we mean finding the actualnumerical difference between the sum of the concentrations ofthe soluble species and the imposed analytical (total) concentration of the same component. In the same way the derivatives are the numerical values obtained by replacing the concentrations by their molar values in the formal algebraic formulas of the derivatives.
SUBPH computes the proton condition equation, its derivatives with respect to every metal and ligand, and the derivativesof all the equations with respect to H.
Figure 10. Chart showing the organization of the principal subroutinesof the computer program
Description of the Program. The program is written inFORTRAN and is usually run on an IBM 360/75 computer. It ismade up of 11 principal subroutines organized in the followingway (Figure 10):
INMAT is a subroutine that reads the data: general stoichiometric and thermodynamic data; special conditions of theproblem; total concentrations of metals and ligands, pH, orTOTH; guesses for the free concentrations of metals and ligands and chosen sets of solids.
SOLIDO finds out if any solid is present; scans the tableau forfamilies of connected solids; defines the principal and secondary variables; and computes the coefficients 1', v, and v'.
MUNSO computes the secondary variables M and L (otherthan C) in function of the principal variables using 1', v, andv'.
64 Environmental Science & Technology
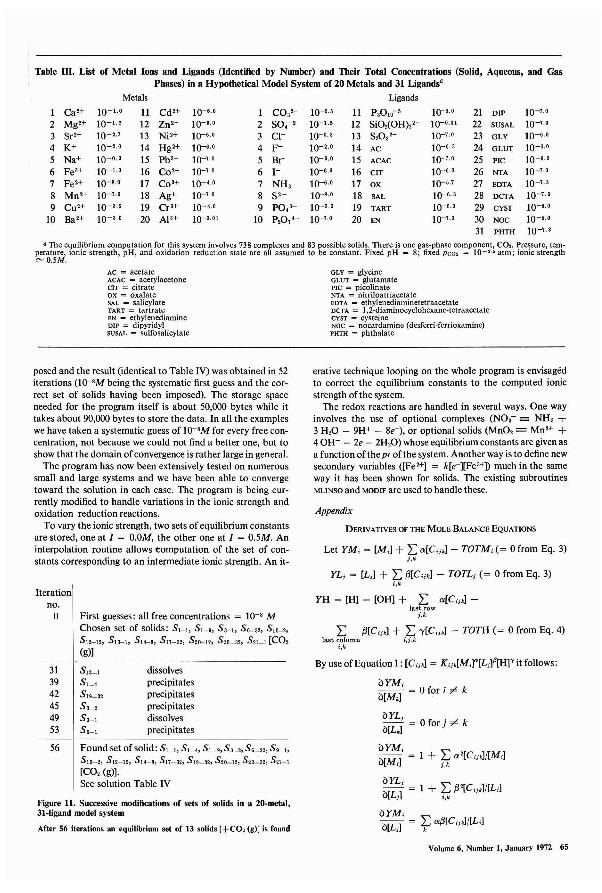
Table UI. List of Metal Ions and Ligands (Identified by Number) and Their Total Concentrations (Solid, Aqueous, and GasPhases) in a Hypothetical Model System of 20 Metals and 31 Ligands·
Metals Ligands
1 CaH 10-1.0 11 Cd'+ 10-6 .0 1 CO,'- 10-0., 11 P,OlO-' 10-6 .0 21 DIP 10-7.0
2 MgH 10-1.' 12 ZnH 10-'·0 2 SO.-' 10-1.5 12 SiO,(OH),'- 10-0.01 22 SUSAL 10-7.0
3 SrH 10-'·7 13 NiH 10-6 .0 3 Cl- 10-0., 13 S,O,'- 10-7.0 23 GLY 10-6 •0
4 K+ 10-'·0 14 HgH 10-6.0 4 F- 10-'·0 14 AC 10-6.3 24 GLUT 10-6.0
5 Na+ 10-0. , 15 Pb'+ 10-7.0 5 Br- 10-'·0 15 ACAC 10- 7.0 25 PIC 10-6.'
6 FeH 10-1.0 16 COH 10-7.0 6 1- 10-6.0 16 CIT 10-6.0 26 NTA 10-7.0
7 FeH 10-8 .0 17 COH 10- •. 0 7 NH, 10-6.0 17 ox 10-,·7 27 EDTA 10-7.8
8 MnH 10-7.0 18 Ag+ 10-7.0 8 S'- 10-8.0 18 SAL 10-6.' 28 DCTA 10-7.,
9 CuH 10- 3., 19 CrH 10-•. 0 9 PO.'- 10- 3.0 19 TART 10-6.0 29 CYST 10-8.0
10 BaH 10-3.0 20 AlH 10-0.01 10 P,07'- 10-7.0 20 EN 10-7.0 30 NOC 10-8.0
31 PHTH 10-7.3
a The equilibrium computation for this system involves 738 complexes and 83 possible solids. There is one gas-phase component, C02. Pressure, temperature, ionic strength, pH, and oxidation-reduction state are all assumed to be constant. Fixed pH = 8; fixed PC02 = 10- 3. 5 atm; ionic strength",",O.5M.
AC = acetateACAC = acetylacetoneCIT = citrateox = oxalateSAL = salicylateTART = tartrateEN = ethylenediamineDIP = dipyridylSUSAL = sulfosalicylate
GLY = glycineGLUT = glutamatePIC = picolinateNTA = nitriloatriacetateEDTA = ethylenediaminetetraacetateDCTA = l,2-diaminocyc1ohexane-tetraacetateCYST = cysteineNOC = nocardamine (desferri·ferrioxamine)PHTH = phthalate
Figure 11. Successive modifications of sets of solids in a 20-metal,31-ligand model system
After 56 iterations an equilibrium set of 13 solids [+CO, (g)] is found
56 Found set of solid: Sl-I, Sl_., Sl_9, S,_" S'_32, S9_I,5 10-2, 5 12_ 12, 514_8,517_32,519_32, S20-12, S20-32, S21_1
[CO, (g)].See solution Table IV
Iterationno.o First guesses: all free concentrations = 10-8 M
Chosen set of solids: S'-I, S'_9, S,-I, S6--32, S,o--"5 12-12, 5 13-t, 5 14_ 8, 5 17- 32, 5 20--12, 5 20-32, 5 21_ 1 [C02
(g)]
posed and the result (identical to Table IV) was obtained in 52iterations (10-3M being the systematic first guess and the correct set of solids having been imposed). The storage spaceneeded for the program itself is about 50,000 bytes while ittakes about 90,000 bytes to store the data. In all the exampleswe have taken a systematic guess of 1O-3M for every free concentration, not because we could not find a better one, but toshow that the domain of convergence is rather large in general.
The program has now been extensively tested on numeroussmall and large systems and we have been able to convergetoward the solution in each case. The program is being currently modified to handle variations in the ionic strength andoxidation-reduction reactions.
To vary the ionic strength, two sets of equilibrium constantsare stored, one at I = O.OM, the other one at I = 0.5M. Aninterpolation routine allows eomputation of the set of constants corresponding to an intermediate ionic strength. An it-
1 + ~ a'[C,;.]/[M;Jj,k
oYLO[L,] = 0 for j "" k
oYM,
o[M,]
oYL;o[L;] - 1 + tr {j'[Cij,I/[L;]
oYM,o[L;] - i= a{jlC;,]/[Lj ]
By use of Equation 1: [C,;,] = K,;,[M,nL;]~[Hp it follows:
oYM, .o[M,] = 0 for I "" k
YH = [H] - [OH] + ~ a[C,;,]-last row
i,k
~ {j[C,;,] + ~ -y[C,;,J - TOTH (= 0 from Eq. 4)last column ",i,k
i,k
Appendix
Let YM, = [M,] + ~ a[Cm]- TOTM, (= 0 from Eq. 3)j.k
YL; = [L;] + ~ J3[C,;.] - TOTL; (= 0 from Eq. 3)i,k
DERIVAnVEs OF THE MOLE BALANCE EQUAnONS
erative technique looping on the whole program is envisagedto correct the equilibrium constants to the computed ionicstrength of the system.
The redox reactions are handled in several ways. One wayinvolves the use of optional complexes (NO,- "'" NH, +3 H,O - 9H+ - 8e-), or optional solids (MnO, == MnH +40H- - 2e - 2H,O) whose equilibrium constants are given asa function ofthep. of the system. Another way is to define newsecondary variables ([Fe H] = k[e-][Fe H]) much in the sameway it has been shown for solids. The existing subroutinesMLINSO and MODIF are used to handle these.
dissolvesprecipitatesprecipitatesprecipitatesdissolvesprecipitates
S13_1S,_.519_ 32S,_,S'_lS9_1
313942454953
Volume 6, Number I, January 1972 65

Table IV. Equilibrium Composition of the
Concentrations of metals, ligands, and complexes are given as negative logarithms. The values for the complexes are the sums of the com
SiO,-Ligands CO,'- SO,'- Cl- p- Br- 1- NH, S'- PO,'- P,o,'- P,OIO'- (OH),'- 800,'- AC
Total concn 0.5 1.5 0.3 2.0 3.0 6.0 6.0 8.0 3.0 7.0 8.0 0.01 7.0 6.3
Metals Free 4.50 2.00 0.30 3.65 3.00 6.05 7.23 32.55 11.10 10.43 12.43 10.60 15.75 6.37conen
Ca!+ 1.0 2.50 4.33(s) 3.30 5. 65(s) 9.93 9.00(s) 7.93 9.53 17.45 8.37Mg!+ 1.2 1. 28 3.17 1.99 3.63 8.31 7.98 7.12 8.02 16.33 7.15
Sr!+ 2.7 4.20 (s) 10.88 11.33 12.58 19.04 10.17K+ 2.0 2.01 3.52 10.15 11. 65 17.35Na+ 0.3 0.31 4.11 2.11 8.04 9.94 15.95
FeH 1.0 18.90 18.48 18.39 16.83 22.20 23.65 20.00 23.13 15.50 32.65 21. 87
Fe!+ 8.0 8.95 9.75 8.85 14.78 12.12
Mn!+ 7.0 7.57 9.07 8.37 7.17 14.00 12.47 14.41 22.52 13.44
CuH 3.5 7.90 7.59(s) 8.70 8.50 10.75 10.40 9.23 13.40 11.63 13.03 12.57BaH 3.0 8.00 (s) 13.83 14.13 22.54 13.97Cd 2+ 6.0 8.28 10.78 9.09 6.00 11.43 9.68 11.93 12.91 17.38 11.52 12.52 21. 23 13.65Zn2+ 3.0 6.80 7.60 6.27 9.65 10.40 11.73 8.51 12.34 (s) 21.35 11.87NiH 6.0 6.34 7.15 6.84 9.39 9.44 10.77 10.98 21.09 12.01Hg2+ 6.0 20.05 20.71 6.06 22.70 8.65 8.35 17.00 32. 15(s) 18.79 7.00
Pb2+ 7.0 9.19 9.69 7.01 11. 09 13.97 24.76 19.83 13.66Co2+ 7.0 7.25 7.85 7.75 10.35 12.48 13.08 22.10 12.52Col+ 4.0 26.70 25.78 26.51Ag+ 70 14.75 16.25 9.87 13.35 7.00 18.58 30.50 22.20 20.72
Cr H 4.0 13.20 12.20 12.29Al'+ 0.01 15.30 15.86 10.84 (s)H+ 8.00 2.90(g) 8.20 8.75 6.03 27.92 7.28 9.93 12.53 4.48 22.45 9.77
• -log (moles solid per liter of solution): CaCO" 1.05; CaF" 2.32; Ca,(PO,j, OH, 3.48; SrSO" 2.72; Fe(OHj" 1.00; Cu,CO,(OHh, 3.80; BaSO., 3.00;
bYL;b[M;] = i;= al1[C,;k]f[M;]
bYM,b[H] = f.t a-y[Cm]f[H] - L al1[C,;k]f[H]
laat columnk
bYM or bYLnew b[H]
bYM or bYL [M,] bYMorbYLold [bH] + v' [H] b[M;]
bYH"[M,.] = L",k a-y[C,;k]f[M,] - L al1[C,;k]f[M;]U last column
k
bYL;b[H] = it 11-y[C,jk]flH] + I'S~W al1[C,;k]f[H]
k
Furthermore, since the equations are modified according toEquation 8; say
new YL; = old YL; + v· YM,
new YH = old YH + v'· YM,
bYHblH] = 1 + [OH]f[H] + ~ -y'[C,;k]f[H] +
L a'[C,;k]f[H] + L 11'[C,;I]f[H]last row la.st column
j,k i,k
(YM, will be discarded in the rest of the computation.)We have to modify the derivatives further:
bYH bYH bYM,new b[M] or b[L] = old b[M] or b[L] + v' b[M] or b[L]
bYH
blL;]L 11-y[C,;k]f[L;] + L al1[C,;k]f[L;]i,k last row
kbYL; bYL;
new b[M] or b[L] = old b[M] or b[L] + v·bYM,
b[M] or b[L]
Whenever a solid S '; precipitates, a new secondary variableis defined according to Equation 7; say
[M;] = JL[L;]'[HY'
Then the derivatives are modified in the following way:
bYM or bYLnew b[L;]
bYM or bYL [M i] bYM or bYLold~- + v [L;] arM;]
66 Environmental Science & Technology
It should be noted that the order in which those modifica-bYL; bYH
tions are made is not indifferent for b[L;] or b[H]; the order
shown here is the correct one.
Acknowledgment
This work was supported in part by a grant from the GulfOil Corp. We thank Russell E. McDuff for help in makingthe computations.
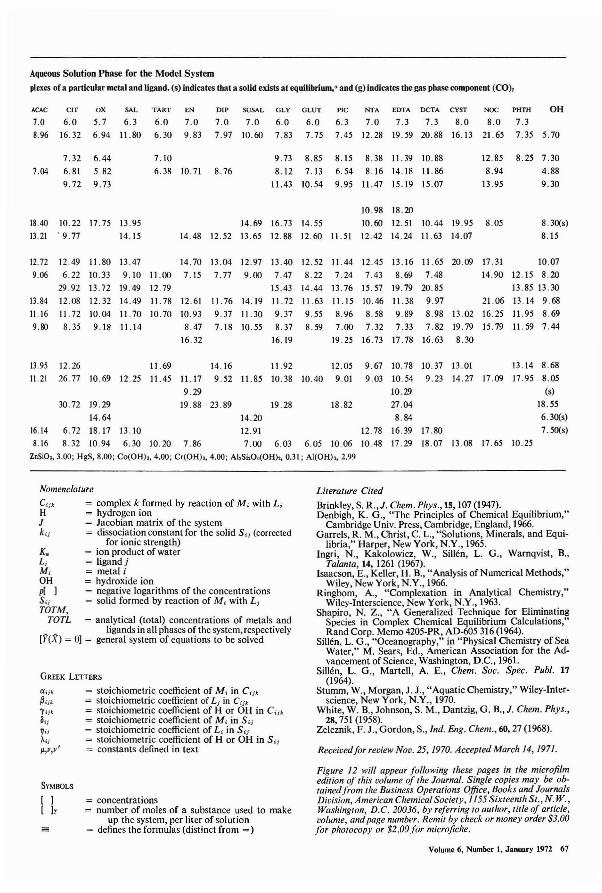
Aqueous Solution Phase for the Model System
plexes ofa particular metal and ligand. (s) indicates that a solid exists at equilibrium,a and (g) indicates the gas phase component (CO),
ACAC CIT ox SAL TART EN DIP SUSAL GLY GLUT PIC NTA EDTA DCTA CYST NOC PHTH OH7.0 6.0 5.7 6.3 6.0 7.0 7.0 7.0 6.0 6.0 6.3 7.0 7.3 7.3 8.0 8.0 7.38.96 16.32 6.94 11.80 6.30 9.83 7.97 10.60 7.83 7.75 7.45 12.28 19.59 20.88 16.13 21. 65 7.35 5.70
7.32 6.44 7.10 9.73 8.85 8.15 8.38 11.39 10.88 12.85 8.25 7.307.04 6.81 5.82 6.38 10.71 8.76 8.12 7.13 6.54 8.16 14.18 11.86 8.94 4.88
9.72 9.73 11.43 10.54 9.95 11.47 15.19 15.07 13.95 9.30
10.98 18.2018.40 10.22 17.75 13.95 14.69 16.73 14.55 10.60 12.51 10.44 19.95 8.05 8.30(s)13.21 ' 9.77 14.15 14.48 12.52 13.65 12.88 12.60 11.51 12.42 14.24 11.63 14.07 8.15
12.72 12.49 11.80 13.47 14.70 13.04 12.97 13.40 12.52 11.44 12.45 13.16 11. 65 20.09 17.31 10.079.06 6.22 10.33 9.10 11.00 7.15 7.77 9.00 7.47 8.22 7.24 7.43 8.69 7.48 14.90 12.15 8.20
29.92 13.72 19.49 12.79 15.43 14.44 13.76 15.57 19.79 20.85 13.85 13.3013.84 12.08 12.32 14.49 11.78 12.61 11.76 14.19 11.72 11. 63 11.15 10.46 11.38 9.97 21.06 13.14 9.6811.16 11.72 10.04 11.70 10.70 10.93 9.37 11. 30 9.37 9.55 8.96 8.58 9.89 8.98 13.02 16.25 11.95 8.699.80 8.35 9.18 11.14 8.47 7.18 10.55 8.37 8.59 7.00 7.32 7.33 7.82 19.79 15.79 11.59 7.44
16.32 16.19 19.25 16.73 17.78 16.63 8.30
13.95 12.26 11.69 14.16 11.92 12.05 9.67 10.78 10.37 13.01 13.14 8.6811.21 26.77 10.69 12.25 11.45 11.17 9.52 11.85 10.38 10.40 9.01 9.03 10.54 9.23 14.27 17.09 17.95 8.05
9.29 10.29 (s)
30.72 19.29 19.88 23.89 19.28 18.82 27.04 18.5514.64 14.20 8.84 6.30(s)
16.14 6.72 18.17 13.10 12.91 12.78 16.39 17.80 7.50(s)8.16 8.32 10.94 6.30 10.20 7.86 7.00 6.03 6.05 10.06 10.48 17.29 18.07 13.08 17.65 10.25
lnSiO" 3.00; HgS, 8.00; Co(OH)" 4.00; Cr(OH)" 4.00; AI,Si,O.(OHh, 0.31; AI(OH)" 2.99
SYMBOLS
[ I = concentrations[ Ir = number of moles of a substance used to make
up the system, per liter of solution= = defines the formulas (distinct from =)
GREEK LEITERS
(}:i;' = stoichiometric coefficient of M i in Co;,~i;' = stoichiometric coefficient of L j in C;;.'Y i;. = stoichiometric coefficient of H or OH in Co;,~i; = stoichiometric coefficient of M i in S i;
~i; = stoichiometric coefficient of L i in SijAi;, = stoichiometric coefficient of H or OH in S ';~,',' = constants defined in text
Literature Cited
Brinkley, S. R.,J. Chern. Phys., 15,107 (1947).Denbigh, K. G., "The Principles of Chemical Equilibrium,"
Cambridge Univ. Press, Cambridge, England,1966.Garrels, R. M., Christ, C. L., "Solutions, Minerals, and Equi
libria," Harper, New York, N.Y., 1965.Ingri, N., Kakolowicz, W., Sillen, L. G., Warnqvist, R,
Talanta, 14, 1261 (1%7).Isaacson, E., Keller, H. B., "Analysis of Numerical Methods,"
Wiley, New York, N.Y., 1966.Ringbom, A., "Complexation in Analytical Chemistry,"
Wiley-Interscience, New York, N.Y., 1963.Shapiro, N. Z., "A Generalized Technique for Eliminating
Species in Complex Chemical Equilibrium Calculations,"Rand Corp. Memo 4205-PR, AD-60S 316 (1964).
Sillen, L. G., "Oceanography," in "Physical Chemistry of SeaWater," M. Sears, Ed., American Association for the Advancement of Science, Washington, D.C., 1961.
Sillen, L. G., Martell, A. E., Chern. Soc. Spec. Publ. 17(1964).
Stumm, W., Morgan, J. J., "Aquatic Chemistry," Wiley-Interscience, New York, N.Y., 1970.
White, W. R, Johnson, S. M., Dantzig, G. R, J. Chem, Phys.,28,751 (1958).
Zeleznik, F. J., Gordon, S., Ind. Eng. Chem., 60, 27 (1968).
Receivedfor review Nov. 25,1970. Accepted March 14, 197/.
Figure 12 will appear following these pages in the microfilmedition of this volume of the Journal. Single copies may be obtained from the Business Operations Office, Books and JournalsDivision, American Chemical Society, 1155 Sixteenth St., N. W.,Washington, D.C. 20036, by referring to author, title of article,volume, and page number. Remit by check or money order $3.00for photocopy or $2.00 for microfiche.
Nomenclature
Co;, = complex k formed by reaction of M, with L;H = hydrogen ionJ = Jacobian matrix of the systemki ; = dissociation constant for the solid Sij (corrected
for ionic strength)= ion product of water= ligandj= metal i= hydroxide ion= negative logarithms of the concentrations= solid formed by reaction of M i with L;
K.L;Mi
OHPI ISi;TOTM,
TOTL = analytical (total) concentrations of metals and_ _ ligands in all phases of the system, respectively
[Y(X) = OJ = general system of equations to be solved
Volume 6, Number 1, January 1972 67
Gaseous Bromine and Particulate Lead, Vanadium, and Bromine
in a Polluted Atmosphere
Jarvis L. Moyers,' William H. Zoller,' Robert A. Duce,' and Gerald L. Hoffman'
Department of Chemistry and Hawaii Institute of Geophysics, University of Hawaii, Honolulu, Hawaii, 96822
• Atmospheric gaseous bromine and particulate lead, vanadium, and bromine were collected simultaneously in Cambridge, Mass., with activated charcoal and membrane filters.This study showed a significant fraction of bromine in thepolluted atmosphere exists in the gaseous phase. Concentrations of gaseous bromine ranged from 0.12-0.45 jJ.g/m'; particulate bromine, 0.12-0.94 jJ.g/m'; and particulate vanadium,0.08-1.32 jJ.g/m' as determined by neutron activation analysis.Lead concentrations varied from 0.4-3.7 jJ.g/m' as determinedby atomic absorption spectroscopy. All particulate speciesshowed significant correlation with each other, indicatingthat their interrelationships in the atmosphere can be explained largely by meteorological conditions. However, thecorrelation of Pb with both particulate Br and total Br wasexceptionally good since Pb and Br come from the samesource. Despite this, results indicate the atmospheric concentrations of Br are less than suspected from the amountsof Br added to gasoline in ethyl fluid. The lower atmosphericBr concentration may be explained by different residencetimes for Br and Pb or that some Br exists in a chemical formnot collected by filtration or activated charcoal adsorption.
T here is presently no information available on the concentration of gaseous bromine in a polluted atmosphere.
Concentrations of gaseous bromine have been estimated inthe marine atmosphere in Hawaii by Duce et al. (1965) with acrude potassium carbonate bubbler and filter arrangement.Their results showed a possible gaseous bromine concentration of 0.008-0.040 jJ.g/m' for the unpolluted marine atmosphere. Recent measurements of gaseous bromine in Hawaiiby Moyers (1970) are the most trustworthy for the marineatmosphere and average 0.050 ± 0.015 jJ.g/m'. The concentration of particulate bromine at the same location reported byMoyers (1970) is 0.009 ± 0.003 jJ.g/m '. In urban areas, particulate bromine is a major pollutant resulting from the combustion of ethyl fluid in gasoline. Lininger et a!. (1966),Winchester et a!. (1967), and Loucks (1969) have indicatedthe role of particulate bromine in pollution. The possibleproduction of gaseous bromine by oxidation of particulate
I To whom correspondence should be addressed. Present address: Department of Chemistry, University of Arizona, Tucson,Ariz. 85721.
'Present address: Department of Chemistry, University ofMaryland, College Park, Md. 20742.
, Present address: Graduate School of Oceanography, University of Rhode Island, Kingston, R.J. 02881.
68 Environmental Science & Technology
bromine by ozone and other chemical oxidants or by photochemical processes was suggested by Winchester et a!. (1967).Pierrard (1969) has shown that lead bromochloride particlessuspended in carbon tetrachloride do release bromine by thephotochemical oxidation of bromide. However, the quantityand importance of gaseous bromine in a polluted or unpolluted atmosphere have largely remained unknown.
The concentration of gaseous bromine is related to theconcentration of lead in the aerosols either as a source or as apossible reactive sink. The concentration of lead in pollutedair has been studied extensively by many investigators. Theextent of lead pollution, as well as the toxicity of this element,was discussed in detail by Patterson (1965). Measurements ofthe lead concentration of Cambridge, Mass., air have beenmade by the U.S. Public Health Service (1962, 1968) andother investigators.
To explain correlation of particulate lead and bromine inthe atmosphere, simultaneous measuring of a metallicelement with an entirely different source is important. Forcomparison, vanadium, whose primary source in pollutedair is the combustion of residual fuel oils in power plants(Zoller and Gordon, 1970), was also measured. Vanadiumhas been found in rather high concentrations in Cambridgeby Zoller and Gordon (1970). The vanadium concentrationin the Boston area has been shown to be among the highestin the nation by Larsen (1964). Vanadium has also beenmeasured by the U.S. Public Health Service (1962, 1968)at a few locations, although the analytical technique employed was not sensitive enough to obtain concentrationsunless the level of vanadium was extremely high. Somemeasurements of the vanadium content of polluted air inother regions were made by Stocks et al. (1961) in England,and Brar et al. (1969) in Chicago by neutron activationanalysis.
Experimental
Atmospheric particulate samples were collected on bothtype EH and HA Millipore filters (47 mm) with a vacuumpump on the roof of the Arthur A. Noyes Nuclear ChemistryCenter at the Massachusetts Institute of Technology, Cambridge, Mass., during September 1969. The filter blank correction for the elements measured (V, Pb, and Br) was less than5%for all samples. Gaseous bromine samples were collectedon clean activated charcoal during the same period as theparticulate matter. The gas collector consisted of an electrostatic precipitator, which removed the particulate matter,followed by a 2-gram bed of precleaned activated charcoal.The charcoal was precleaned by heating to 750°C for two weeksin a vacuum of approximately 10-' em Hg. This procedurereduced the Br blank in the charcoal to approximately 15 ppb.The charcoal samples were analyzed for bromine by neutronactivation analysis with the method developed by Moyers
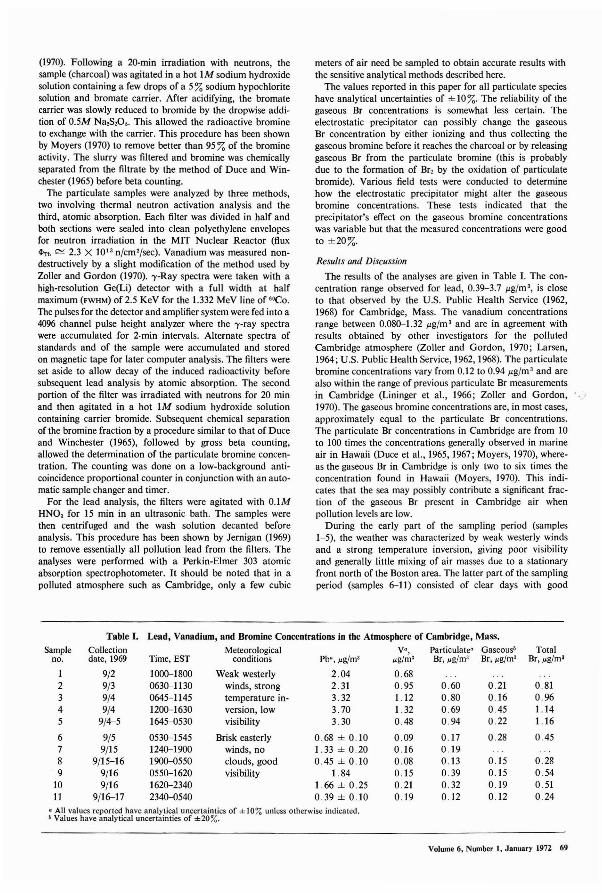
(1970). Following a 20-min irradiation with neutrons, thesample (charcoal) was agitated in a hot 1M sodium hydroxidesolution containing a few drops of a 5% sodium hypochloritesolution and bromate carrier. After acidifying, the bromatecarrier was slowly reduced to bromide by the dropwise addition of 0.5M Na,S,O,. This allowed the radioactive bromineto exchange with the carrier. This procedure has been shownby Moyers (1970) to remove better than 95 % of the bromineactivity. The slurry was filtered and bromine was chemicallyseparated from the filtrate by the method of Duce and Winchester (1965) before beta counting.
The particulate samples were analyzed by three methods,two involving thermal neutron activation analysis and thethird, atomic absorption. Each filter was divided in half andboth sections were sealed into clean polyethylene envelopesfor neutron irradiation in the MIT Nuclear Reactor (flux~b c,; 2.3 X 10" n/cm'/sec). Vanadium was measured nondestructively by a slight modification of the method used byZoller and Gordon (1970). -y-Ray spectra were taken with ahigh-resolution Ge(Li) detector with a full width at halfmaximum (FWHM) of 2.5 KeV for the 1.332 MeV line of "'Co.The pulses for the detector and amplifier system were fed into a4096 channel pulse height analyzer where the -y-ray spectrawere accumulated for 2·min intervals. Alternate spectra ofstandards and of the sample were accumulated and storedon magnetic tape for later computer analysis. The filters wereset aside to allow decay of the induced radioactivity beforesubsequent lead analysis by atomic absorption. The secondportion of the filter was irradiated with neutrons for 20 minand then agitated in a hot 1M sodium hydroxide solutioncontaining carrier bromide. Subsequent chemical separationof the bromine fraction by a procedure similar to that of Duceand Winchester (1965), followed by gross beta counting,allowed the determination of the particulate bromine concentration. The counting was done on a low-background anticoincidence proportional counter in conjunction with an automatic sample changer and timer.
For the lead analysis, the filters were agitated with 0.1 MHNO, for 15 min in an ultrasonic bath. The samples werethen centrifuged and the wash solution decanted beforeanalysis. This procedure has been shown by Jernigan (1969)to remove essentially all pollution lead from the filters. Theanalyses were performed with a Perkin-Elmer 303 atomicabsorption spectrophotometer. It should be noted that in apolluted atmosphere such as Cambridge, only a few cubic
meters of air need be sampled to obtain accurate results withthe sensitive analytical methods described here.
The values reported in this paper for all particulate specieshave analytical uncertainties of ± 10%. The reliability of thegaseous Br concentrations is somewhat less certain. Theelectrostatic precipitator can possibly change the gaseousBr concentration by either ionizing and thus collecting thegaseous bromine before it reaches the charcoal or by releasinggaseous Br from the particulate bromine (this is probablydue to the formation of Br, by the oxidation of particulatebromide). Various field tests were conducted to determinehow the electrostatic precipitator might alter the gaseousbromine concentrations. These tests indicated that theprecipitator's effect on the gaseous bromine concentrationswas variable but that the measured concentrations were goodto ±20%.
Results and Discussion
The results of the analyses are given in Table 1. The concentration range observed for lead, 0.39-3.7 Ilg/m', is closeto that observed by the V.S. Public Health Service (1962,1968) for Cambridge, Mass. The vanadium concentrationsrange between 0.080-1.32 Ilg/m' and are in agreement withresults obtained by other investigators for the pollutedCambridge atmosphere (Zoller and Gordon, 1970; Larsen,1964; V.S. Public Health Service, 1962, 1968). The particulatebromine concentrations vary from 0.12 to 0.94Ilg/m' and arealso within the range of previous particulate Br measurementsin Cambridge (Lininger et aI., 1966; Zoller and Gordon,1970). The gaseous bromine concentrations are, in most cases,approximately equal to the particulate Br concentrations.The particulate Br concentrations in Cambridge are from 10to 100 times the concentrations generally observed in marineair in Hawaii (Duce et aI., 1965,1967; Moyers, 1970), whereas the gaseous Br in Cambridge is only two to six times theconcentration found in Hawaii (Moyers, 1970). This indicates that the sea may possibly contribute a significant fraction of the gaseous Br present in Cambridge air whenpollution levels are low.
During the early part of the sampling period (samples1-5), the weather was characterized by weak westerly windsand a strong temperature inversion, giving poor visibilityand generally little mixing of air masses due to a stationaryfront north of the Boston area. The latter part of the samplingperiod (samples 6-11) consisted of clear days with good
Table I. Lead, Vanadium, and Bromine Concentrations in the Atmosphere of Cambridge, Mass.Sample Collection Meteorological V·, Particulate· Gaseous' Total
no. date, 1969 Time, EST conditions Pb·,l'g(m' I'g(m' Br,l'g(m' Br,l'g(m' Br,l'g(m'
1 9/2 1000-1800 Weak westerly 2.04 0.682 9/3 0630-1130 winds, strong 2.31 0.95 0.60 0.21 0.813 9/4 0645-1145 temperature in- 3.32 1.12 0.80 0.16 0.964 9/4 1200-1630 version, low 3.70 1.32 0.69 0.45 1.145 9/4-5 1645-{)530 visibility 3.30 0.48 094 0.22 1.16
6 9/5 0530-1545 Brisk easterly 0.68±0.1O 0.09 0.17 0.28 0.457 9/15 1240-1900 winds, no 1.33 ± 0.20 0.16 0.198 9/15-16 1900-0550 clouds, good 0.45 ± 0.10 0.08 0.13 0.15 0.289 9/16 0550-1620 visibility 1.84 0.15 0.39 0.15 0.54
10 9/16 1620-2340 1.66 ± 025 0.21 0.32 o 19 0.5111 9/16-17 2340-0540 0.39±0.10 019 0.12 o 12 0.24
o All values reported have analytical uncertainties of ± 10% unless otherwise indicated.b Values have analytical uncertainties of ±20%.
Volume 6, Number " January 1972 69
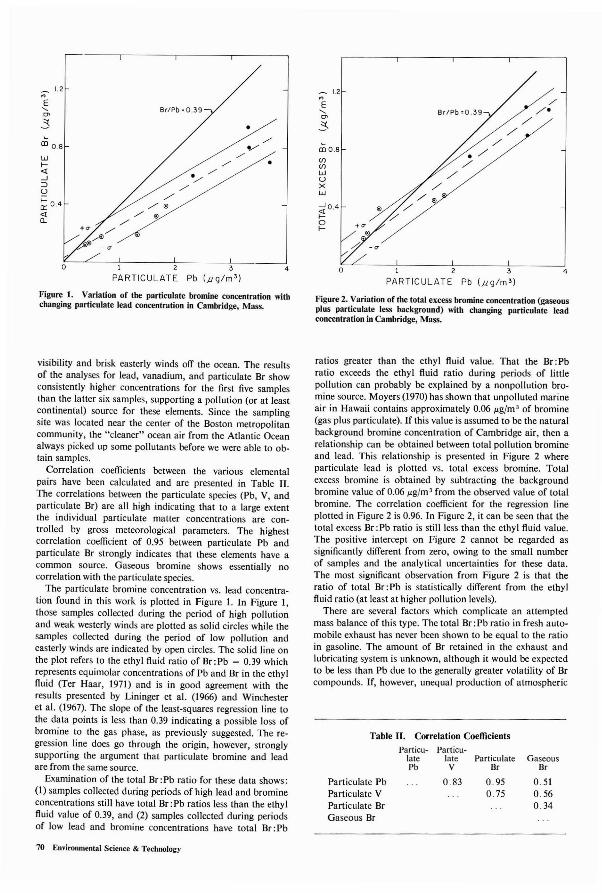
_ 1.2
'"E"0'
3<D 0.8
wI-<l...J~
U
:r OA<la.
Br/Pb, 0.39
././
./V
./
_ 1.2...E"0'
.5
<D 0.8(j)(j)
WUXW
<lOAI-oI- +CT
<il
a -CT
o
Figure 2. Variation of the total excess bromine concentration (gaseousplus particulate less background) with changing particulate leadconcentration in Cambridge, Mass.
1 2 3
PARTICULATE Pb (pg/m 3 )
Figure 1. Variation of the particulate bromine concentration withchanging particulate lead concentration in Cambridge, Mass.
o 1 2 3
PARTICULATE Pb (pg/m 3 )
ratios greater than the ethyl fluid value. That the Br:Pbratio exceeds the ethyl fluid ratio during periods of littlepollution can probably be explained by a nonpollution bromine source. Moyers (1970) has shown that unpolluted marineair in Hawaii contains approximately 0.06 Jl.g/m 3 of bromine(gas plus particulate). If this value is assumed to be the naturalbackground bromine concentration of Cambridge air, then arelationship can be obtained between total pollution bromineand lead. This relationship is presented in Figure 2 whereparticulate lead is plotted vs. total excess bromine. Totalexcess bromine is obtained by subtracting the backgroundbromine value of 0.06 Jl.g/m 3 from the observed value of totalbromine. The correlation coefficient for the regression lineplotted in Figure 2 is 0.96. In Figure 2, it can be seen that thetotal excess Br:Pb ratio is still less than the ethyl fluid value.The positive intercept on Figure 2 cannot be regarded assignificantly different from zero, owing to the small numberof samples and the analytical uncertainties for these data.The most significant observation from Figure 2 is that theratio of total Br:Pb is statistically different from the ethylfluid ratio (at least at higher pollution levels).
There are several factors which complicate an attemptedmass balance of this type. The total Br: Pb ratio in fresh automobile exhaust has never been shown to be equal to the ratioin gasoline. The amount of Br retained in the exhaust andlubricating system is unknown, although it would be expectedto be less than Pb due to the generally greater volatility of Brcompounds. If, however, unequal production of atmospheric
Table II. Correlation Coefficients
visibility and brisk easterly winds off the ocean. The resultsof the analyses for lead, vanadium, and particulate Br showconsistently higher concentrations for the first five samplesthan the latter six samples, supporting a pollution (or at leastcontinental) source for these elements. Since the samplingsite was located near the center of the Boston metropolitancommunity, the "cleaner" ocean air from the Atlantic Oceanalways picked up some pollutants before we were able to obtain samples.
Correlation coefficients between the various elementalpairs have been calculated and are presented in Table II.The correlations between the particulate species (Pb, V, andparticulate Br) are all high indicating that to a large extentthe individual particulate matter concentrations are controlled by gross meteorological parameters. The highestcorrelation coefficient of 0.95 between particulate Pb andparticulate Br strongly indicates that these elements have acommon source. Gaseous bromine shows essentially nocorrelation with the particulate species.
The particulate bromine concentration vs. lead concentration found in this work is plotted in Figure I. In Figure I,those samples collected during the period of high pollutionand weak westerly winds are plotted as solid circles while thesamples collected during the period of low pollution andeasterly winds are indicated by open circles. The solid line onthe plot refers to the ethyl fluid ratio of Br:Pb = 0.39 whichrepresents equimolar concentrations of Pb and Br in the ethylfluid (Ter Haar, 1971) and is in good agreement with theresults presented by Lininger et al. (1966) and Winchesteret al. (1967). The slope of the least-squares regression line tothe data points is less than 0.39 indicating a possible loss ofbromine to the gas phase, as previously suggested. The regression line does go through the origin, however, stronglysupporting the argument that particulate bromine and leadare from the same source.
Examination of the total Br: Pb ratio for these data shows:(I) samples collected during periods of high lead and bromineconcentrations still have total Br :Pb ratios less than the ethylfluid value of 0.39, and (2) samples collected during periodsof low lead and bromine concentrations have total Br: Pb
70 Em'ironmentaI Science & Technology
Particulate PbParticulate VParticulate BrGaseous Sr
ParticulatePb
Particu-late ParticulateV Br
083 095075
GaseousBr
0510.560.34
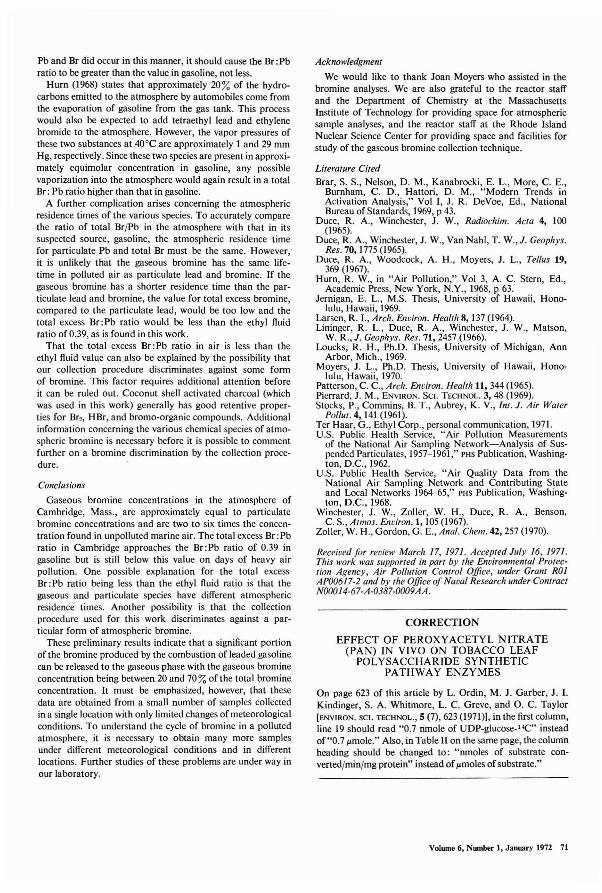
Pb and Br did occur in this manner, it should cause the Br: Pbratio to be greater than the value in gasoline, not less.
Hum (1968) states that approximately 20% of the hydrocarbons emitted to the atmosphere by automobiles come fromthe evaporation of gasoline from the gas tank. This processwould also be expected to add tetraethyl lead and ethylenebromide to the atmosphere. However, the vapor pressures ofthese two substances at 40°C are approximately 1 and 29 mmHg, respectively. Since these two species are present in approximately equimolar concentration in gasoline, any possiblevaporization into the atmosphere would again result in a totalBr: Pb ratio higher than that in gasoline.
A further complication arises concerning the atmosphericresidence times of the various species. To accurately comparethe ratio of total BrIPb in the atmosphere with that in itssuspected source, gasoline, the atmospheric residence timefor particulate Pb and total Br must be the same. However,it is unlikely that the gaseous bromine has the same lifetime in polluted air as particulate lead and bromine. If thegaseous bromine has a shorter residence time than the particulate lead and bromine, the value for total excess bromine,compared to the particulate lead, would be too low and thetotal excess Br: Pb ratio would be less than the ethyl fluidratio of 0.39, as is found in this work.
That the total excess Br: Pb ratio in air is less than theethyl fluid value can also be explained by the possibility thatour collection procedure discriminates against some formof bromine. This factor requires additional attention beforeit can be ruled out. Coconut shell activated charcoal (whichwas used in this work) generally has good retentive properties for Br" HBr, and bromo-organic compounds. Additionalinformation concerning the various chemical species of atmospheric bromine is necessary before it is possible to commentfurther on a bromine discrimination by the collection procedure.
Conclusions
Gaseous bromine concentrations in the atmosphere ofCambridge, Mass., are approximately equal to particulatebromine concentrations and are two to six times the concentration found in unpolluted marine air. The total excess Br :Pbratio in Cambridge approaches the Br:Pb ratio of 0.39 ingasoline but is still below this value on days of heavy airpollution. One possible explanation for the total excessBr :Pb ratio being less than the ethyl fluid ratio is that thegaseous and particulate species have different atmosphericresidence times. Another possibility is that the collectionprocedure used for this work discriminates against a particu.lar form of atmospheric bromine.
These preliminary results indicate that a significant portionof the bromine produced by the combustion of leaded gasolinecan be released to the gaseous phase with the gaseous bromineconcentration being between 20 and 70 % of the total bromineconcentration. It must be emphasized, however, that thesedata are obtained from a small number of samples collectedin a single location with only limited changes of meteorologicalconditions. To understand the cycle of bromine in a pollutedatmosphere, it is necessary to obtain many more samplesunder different meteorological conditions and in differentlocations. Further studies of these problems are under way inour laboratory.
Acknowledgment
We would like to thank Joan Moyers who assisted in thebromine analyses. We are also grateful to the reactor staffand the Department of Chemistry at the MassachusettsInstitute of Technology for providing space for atmosphericsample analyses, and the reactor staff at the Rhode IslandNuclear Science Center for providing space and facilities forstudy of the gaseous bromine collection technique.
Literature Cited
Brar, S. S., Nelson, D. M., Kanabrocki, E. L., More, C. E.,Burnham, C. D., Hattori, D. M., "Modern Trends inActivation Analysis," Vol I, J. R. DeVoe, Ed., NationalBureau of Standards, 1969, p 43.
Duce, R. A., Winchester, J. W., Radiochim. Acta 4, 100(1965).
Duce, R. A., Winchester, J. W., Van Nahl, T. W., J. Geophys.Res. 70, 1775 (1965).
Duce, R. A., Woodcock, A. H., Moyers, J. L., Tel/us 19,369 (1967).
Hum, R. W., in "Air Pollution," Vol 3, A. C. Stern, Ed.,Academic Press, New York, N.Y., 1968, p 63.
Jernigan, E. L., M.S. Thesis, University of Hawaii, Honolulu, Hawaii, 1969.
Larsen, R. I., Arch. Environ. Health 8, 137 (1964).Lininger, R. L., Duce, R. A., WinChester, J. W., Matson,
W. R., J. Geophys. Res. 71, 2457 (1966).Loucks, R. H., Ph.D. Thesis, University of Michigan, Ann
Arbor, Mich., 1969.Moyers, J. L., Ph.D. Thesis, University of Hawaii, Hono-
lulu, Hawaii, 1970.Patterson, C. c., Arch. Environ. Health 11, 344 (1965).Pierrard, J. M., ENVIRON. SCI. TECHNOL. 3, 48 (1969).Stocks, P., Commins, B. T., Aubrey, K. V., Int. J. Air Water
Pol/ut.4, 141 (1961).Ter Haar, G., Ethyl Corp., personal communication, 1971.U.S. Public Health Service, "Air Pollution Measurements
of the National Air Sampling Network-Analysis of Suspended Particulates, 1957-1961," PHS Publication, WaShington, D.C., 1962.
U.S. Public Health Service, "Air Quality Data from theNational Air Sampling Network and Contributing Stateand Local Networks 1964-65," PHS Publication, Washington, D.C., 1968.
Winchester, J. W., Zoller, W. H., Duce, R. A., Benson,C. S., Atmos. Environ. 1, 105 (1967).
Zoller, W. H., Gordon, G. E., Anal. Chem. 42, 257 (1970).
Received Jor review March 17, 197/. Accepted July 16, 197/.This work was supported in part by the Environmental Protection Agency, Air Pol/ution Control Office, under Grant ROJAP00617-2 and by the Office oj Naval Research under ContractNOOOJ4-67-A-0387-0009AA.
CORRECTION
EFFECT OF PEROXYACETYL NITRATE(PAN) IN VIVO ON TOBACCO LEAF
POLYSACCHARIDE SYNTHETICPATHWAY ENZYMES
On page 623 of this article by L. Ordin, M. J. Garber, J. I.Kindinger, S. A. Whitmore, L. C. Greve, and O. C. Taylor[ENVIRON. SCI. TECHNOL., 5 (7), 623 (1971)], in the first column,line 19 should read "0.7 nmole of UDP-glucose-14C" insteadof"0.7 I'mole." Also, in Table II on the same page, the columnheading should be changed to: "nmoles of substrate converted/min/mg protein" instead of I'moles of substrate."
Volume 6, Number 1, January 1972 71

Photooxidation of Sulfur Dioxide
Howard W. Sidebottom, Charles C. Badcock, George E. Jackson, and Jack G. Calvertt
Dept. of Chemistry, Ohio State University, Columbus, Ohio 43210
George W. Reinhardt and Edward K. Damon
ElectroScience Laboratory, Ohio State University, Columbus, Ohio 43212
A second, "forbidden" absorption region of SO" of muchlower extinction, extends from 4000 to 3400 A; see Figure 1b.The absorption of sunlight within this region results in thedirect excitation of SO, to an electronically excited tripletspecies, SO,('B,) (Brand et aI., 1970; Merer, 1963). We willsymbolize this state as: 'SO,.
Reactiolls o/the Excited States 0/ Su/j;tr Dioxide
During the past few years several independent quantitativestudies of the photochemistry of sulfur dioxide have appeared(Cehelnik et aI., 1971; Collier et aI., 1970; Jackson and Calvert, 1971; Mettee, 1968, 1969; Okuda et aI., 1969; Otsukaand Calvert, 1971; Rao and Calvert, 1970; Rao et aI., 1969a,1969b; Sidebottom et aI., 1971a, 1971b; Strickler and Howell,1968; Timmons, 1970). From these studies has emergednew information which relates directly to the mechanism ofthe photooxidation of SO, in the atmosphere. A brief reviewof these results is in order here.
The major sunlight absorption of sulfur dioxide occurswithin the relatively strong band which extends from 3400to 2400 A (see Figure 1a). Absorption within this band results initially in the generation of an electronically excitedsinglet state in SO,. Presumably this excited species is theSO,(' B,) state, although its spectroscopic assignment is stilluncertain (see Herzberg, 1966). In this work we symbolize thisstate as: 'SO,.
reactive metallic oxide, catalyst particles, and acid-neutralizingcompounds in many atmospheres to promote SO, removalat the observed rates. The most compelling argument whichhas favored the importance of the heterogeneous removalprocesses has been the apparent lack of alternative homogeneous reactions of sufficient rate which might be invoked.It now appears to us that there are several such possible processes which are open for sunlight-irradiated atmospheres,but these remain quantitatively unevaluated. Our approachto this problem is based on the hypothesis that it is morerealistic to evaluate the contributions from these homogeneousprocesses and arrive indirectly at the contribution of theheterogeneous modes than to establish unambiguously anddirectly the importance of heterogeneous paths in the realatmospheres.
In this report we describe the first stage of our study of thepossible homogeneous paths of SO, removal operative in theatmosphere: the photooxidation of SO,. Quantitative information on the theoretical maximum rates of photochemicaloxidation of SO, in the atmosphere is presented; we haveutilized the results of the most recent studies of SO, photochemistry and new data presented here on the rate constantsfor the quenching reactions of excited SO, with atmosphericgases. These data should prove useful in determining theimportance of alternative homogeneous or heterogeneousremoval mechanisms for specific atmospheric systems.
• Rate constants for the quenching of excited triplet sulfurdioxide molecules with the atmospheric gases were determined with the aim of delineating the mechanism of thephotooxidation of SO, in the atmosphere. The triplet specieswere excited directly by the absorption of a 3828.8 A laserlight pulse within the "forbidden" SO,(lA,) --+ SO,('B,)band. The data gave the following new estimates for thetriplet sulfur dioxide quenching rate constants (liters/molesec) at 25°C: N, (8.5 ± 1.0) X 10'; a, (9.6 ± 0.5) X 10';H,O (8.9 ± 1.2) X 108 ; Ar (5.2 ± 0.5) X 10'; He (6.8 ±0.7) X 10'; Xe (7.1 ± 1.1) X 10'; CO, (1.14 ± 0.07) X 108 ;
a, (1.10 ± 0.12) X 10 9 ; NO (7.4 ± 0.3) X 10 10. These andother recent rate data and absorption data for SO, were usedto estimate the maximum rate of homogeneous pholooxidation of sulfur dioxide in the atmosphere. At a solar zenithangle of 20° and 50% relative humidity (rR), the theoreticalmaximum rate is 1.9 % per hour.
Interest in the sulfu~ dio~ide removal mechanisms in theatmosphere remalDs hIgh among atmospheric scientists.
There is substantial evidence that health hazards are associatedwith urban atmospheres containing moderately low levelsof sulfur dioxide (above 0.2 ppm), and that these harmfuleffects are apparently enhanced when there are significantlevels of suspended particulates (U. S. Dept. Health, Education and Welfare, 1969). However, there is now little evidence as to the chemical nature of the active species responsible for these effects. The detailed mechanism of sulfurdioxide oxidation remains unclear. For examples, see therecent reviews of Altshuller and Bufalini (1965), Cadle andAllen (1970), Katz (1970), Urone and Schroeder (1969).The majority of existing evidence suggests that a majorfraction of the sulfur dioxide is ultimately converted to sulfuric acid and sulfate salts, but the intermediate species involved and the reaction paths which lead to these productsare open to question. The relatively slow rates of photooxidation of sulfur dioxide in air exposed to sunlight (Gerhardand Johnstone, 1955; Hall, 1953) and the demonstratedcatalytic inAuence of certain solids and moisture on the rateof SO, oxidation (Foster, 1969; Johnstone and Coughanowr,1958; Johnstone and Moll, 1960; Junge and Ryan, 1958;Matteson et aI., 1969; van den Heuval and Mason, 1963)have led to the common belief that heterogeneous paths forSO, oxidation probably far outweigh the homogeneous modes.Although this conclusion may prove to be true for certainatmospheric conditions, it is by no means established today.There is a real question as to the availability of sufficient
1 To whom correspondence should be addressed.
72 Environmental Science & Technology
SO, + hv(3400-29oo A) --+ 'SO, (I)
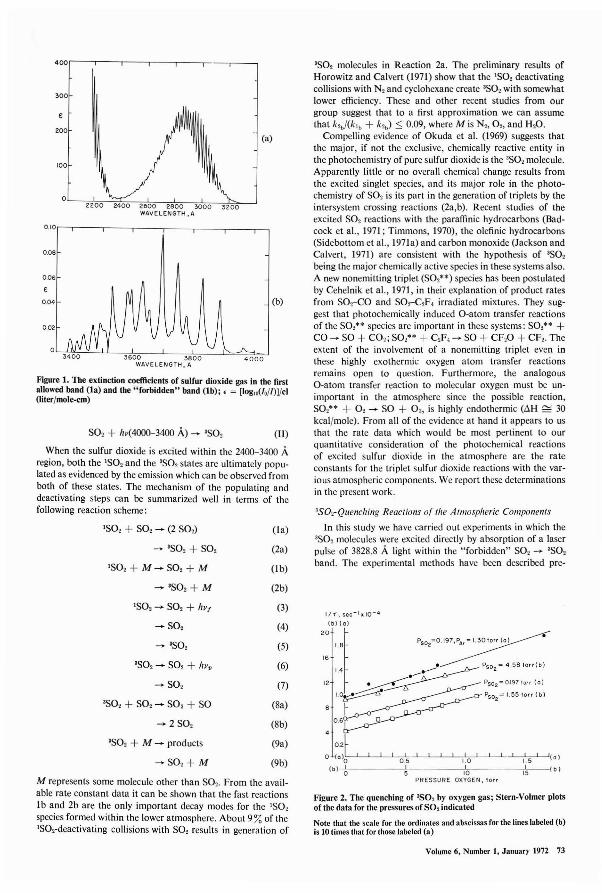
300
O.OB
0.06
Figure 2. The quenching of 'SO, by oxygen gas; Stern-Volmer plotsof the data for the pressures of SO, indicated
Note that the scale for the ordinates and abscissas for the lines labeled (b)is 10 times that for those labeled (a)
1/1'. sec-I. lo-q
(b) (ol
20 r Psoz:cO.197,PAr= 1.3010rr (a)
16 :: _.__~~PS02-4.5BIO"lbl12 ~~~PS02=O"9710"(OI1.0~PS02=,.5510"(bl
06~-
o °o~1~---'----'-----'----l-;;-0'o-'5---'----'-----'----l-'IL,~Oc-'-----'----l---'-----.,J..,l.Sc--'----'!{ a)(bl---LO-----~~-----!:;lo,-----,!.(5--(b I
PRESSURE OXYGEN. lorr
'SO, molecules in Reaction 2a. The preliminary results ofHorowitz and Calvert (1971) show that the ISO, deactivatingcollisions with N, and cyclohexane create 'SO, with somewhatlower efficiency. These and other recent studies from ourgroup suggest that to a first approximation we can assumethat k'b/(k'b + k",) ::; 0.09, where M is N" 0" and H,O.
Compelling evidence of Okuda et al. (1969) suggests thatthe major, if not the exclusive, chemically reactive entity inthe photochemistry of pure sulfur dioxide is the 'SO, molecule.Apparently little or no overall chemical change results fromthe excited singlet species, and its major role in the photochemistry of SO, is its part in the generation of triplets by theintersystem crossing reactions (2a,b). Recent studies of theexcited SO, reactions with the paraffinic hydrocarbons (Badcock et aI., 1971; Timmons, 1970), the olefinic hydrocarbons(Sidebottom et aI., 1971a) and carbon monoxide (Jackson andCalvert, 1971) are consistent with the hypothesis of 'SO,being the major chemically active species in these systems also.A new nonemitting triplet (SO,") species has been postulatedby Cehelnik et aI., 1971, in their explanation of product ratesfrom SO,-CO and SO,-C,F. irradiated mixtures. They suggest that photOChemically induced a-atom transfer reactionsof the SO," species are important in these systems: SO," +CO ...... SO + CO,; SO," + C,F....... SO + CF,O + CF,. Theextent of the involvement of a nonemitting triplet even inthese highly exothermic oxygen atom transfer reactionsremains open to question. Furthermore, the analogousa-atom transfer reaction to molecular oxygen must be unimportant in the atmosphere since the possible reaction,SO," + 0, ...... SO + a" is highly endothermic (AH ~ 30kcal/mole). From all of the evidence at hand it appears to uSthat the rate data which would be most pertinent to ourquantitative consideration of the photochemical reactionsof excited sulfur dioxide in the atmosphere are the rateconstants for the triplet sulfur dioxide reactions with the various atmospheric components. We report these determinationsin the present work.
'SO,-Quenching Reactions or the Atmospheric Components
In this study we have carried out experiments in which the'SO, molecules were excited directly by absorption of a laserpulse of 3828.8 A light within the "forbidden" SO, ...... 'SO,band. The experimental methods have been described pre-
(II)
(b)
(a)
'SO, + SO, ...... (2 SO,) (la)
...... 'SO, + SO, (2a)
'SO, + M ...... SO, + M (I b)
...... 'SO,+ M (2b)
'SO, ...... SO, + hv/ (3)
...... SO, (4)
...... 'SO, (5)
'SO, ...... SO, + hv. (6)
...... SO, (7)
'SO, + SO, ...... SO, + SO (8a)
...... 2 SO, (8b)
'SO, + M ...... products (9a)
...... SO,+M (9b)
so, + hv(4000-3400 A) ...... 'so,
200
0.10',,----.---_,-_-,,-_--,-__,-__-.--,
100
400r--.,---,--~--,--~
When the sulfur dioxide is excited within the 2400-3400 Aregion, both the 'SO, and the 'SO, states are ultimately populated as evidenced by the emission which can be observed fromboth of these states. The mechanism of the populating anddeactivating steps can be summarized well in terms of thefollowing reaction scheme:
Figure 1. The extinction coefficients of sulfur dioxide gas in the firstallowed band (10) and the "forbidden" band (Ib); • ~ [loglO(lo/I)]/cl(liter/mole-em)
M represents some molecule other than SO,. From the available rate constant data it can be shown that the fast reactionsIband 2b are the only important decay modes for the 'SO,species formed within the lower atmosphere. About 9%of the'SO,-deactivating collisions with SO, results in generation of
Volume 6, Number 1, January 1972 73
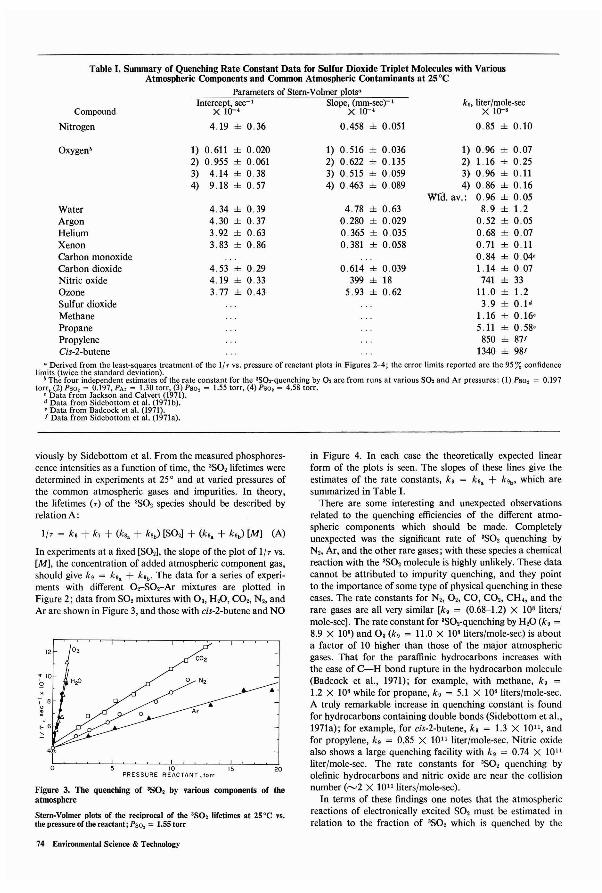
Table I. Summary of Quenching Rate Constant Data for Sulfur Dioxide Triplet Molecules with VariousAtmospheric Components and Common Atmospheric Contaminants at 25°C
Parameters of Stern-Volmer plots'
Compound
Nitrogen
Intercept, sec-I Slope, (mm-sec) 1
X 10-' X 10-'
4.19 ± 0.36 0.458 ± 0.051
k" liter/mole-secX 10-'
0.85 ± 0.10
1) 0.611 ± 0.020 1) 0.516 ± 0.036 1) 0.96 ± 0072) 0.955 ± 0.061 2) 0.622 ± 0.135 2) 1.16 ± 0.253) 4.14 ± 0.38 3) 0.515 ± 0.059 3) 0.96 ± 0.114) 9.18 ± 0.57 4) 0.463 ± 0.089 4) 0.86 ± o 16
WIll. av.: 0.96 ± 0.05434 ± 039 4.78 ± 0.63 8.9 ± 1.24.30 ± 037 0.280 ± 0.029 0.52 ± 0.053.92 ± 0.63 0365 ± 0035 0.68 ± 0.073.83 ± 0.86 0.381 ± 0.058 0.71 ± 0.11
084 ± 0.04'4.53 ± 0.29 0.614 ± 0.039 1.14 ± 0.07419 ± 0.33 399 ± 18 741 ± 333.77 ± 0.43 5.93 ± 0.62 11.0 ± 1.2
3.9 ± O.l d
1.16 ± 0.16'5.11 ± 0.58'
850 ± 8711340 ± 981
Oxygen'
WaterArgonHeliumXenonCarbon monoxideCarbon dioxideNitric oxideOzoneSulfur dioxideMethanePropanePropyleneCis-2-butene
a Derived from the least-squares treatment of the lIT VS. pressure of reactant plots in Figures 2-4; the error limits reported are the 95 %confidencelimits (twice the standard deviation),
b The fOUf independent estimates of the rate constant for the 3S01-quenching by 02 are from runs at various S02 and Ar pressures: (I) Pso 2 = 0.197torr, (2)Pso, ~ 0.197, PAc ~ 1.30 torr, (3)PBO, ~ 1.55 torr, (4)Pso, = 4.58 torr.
'Data from Jackson and Calvert (1971).d Data from Sidebottom et al. (1971 b).• Data from Badcock et al. (1971).1 Data from Sidebottom et al. (l971a).
Figure 3. The quenching of 'SO, by various components of theatmosphere
Stern-Volmer plot, of the reciprocal of the 'SO, lifetimes at 2S'C vs.the pressure ufthe reactant; PS02 = 1.55 torr
viously by Sidebottom et al. From the measured phosphorescence intensities as a function of time, the 'SO, lifetimes weredetermined in experiments at 25 ° and at varied pressures ofthe common atmospheric gases and impurities. In theory,the lifetimes (T) of the 'SO, species should be described byrelation A:
l/T = k. + k, + (k., + k'b) [SO,] + (k,. + kgb) [M] (A)
In experiments at a fixed [SO,], the slope of the plot of l/T vs.[M], the concentration of added atmospheric component gas,should give k, = kg. + kgb • The data for a series of experiments with different O,-SO,-Ar mixtures are plotted inFigure 2; data from SO, mixtures with a" H,O, CO" N" andAr are shown in Figure 3, and those with cis-2-butene and NO
in Figure 4. In each case the theoretically expected linearform of the plots is seen. The slopes of these lines give theestimates of the rate constants, kg = kg, + k'b' which aresummarized in Table I.
There are some interesting and unexpected observationsrelated to the quenching efficiencies of the different atmospheric components which should be made. Completelyunexpected was the significant rate of 'SO, quenching byN" Ar, and the other rare gases; with these species a chemicalreaction with the 'SO, molecule is highly unlikely. These datacannot be attributed to impurity quenching, and they pointto the importance of some type of physical quenching in thesecases. The rate constants for N" A" CO, CO" CH" and therare gases are all very similar [k, = (0.68-1.2) X 10' liters/mole-sec]. The rate constant for 'SO,-quenching by H,O (k, =
8.9 X 10') and a, (k, = 11.0 X 10' liters/mole-sec) is abouta factor of 10 higher than those of the major atmosphericgases. That for the paraffinic hydrocarbons increases withthe ease of C-H bond rupture in the hydrocarbon molecule(Badcock et aI., 1971); for example, with methane, k, =
1.2 X 10' while for propane, k, = 5.1 X 10' liters/mole-sec.A truly remarkable increase in quenching constant is foundfor hydrocarbons containing double bonds (Sidebottom et aI.,1971a); for example, for cis-2-butene, kg = 1.3 X lOll, andfor propylene, k, = 0.85 X lOll liter/mole-sec. Nitric oxidealso shows a large quenching facility with k, = 0.74 X lOllliter/mole-sec. The rate constants for 'SO, quenching byolefinic hydrocarbons and nitric oxide are near the collisionnumber (~2 X lOll liters/mole-sec).
In terms of these findings one notes that the atmosphericreactions of electronically excited SO, must be estimated inrelation to the fraction of 'SO, which is quenched by the
20
•
10 15PRESSURE REACTANT ,torr
o
74 Environmental Science & Technology
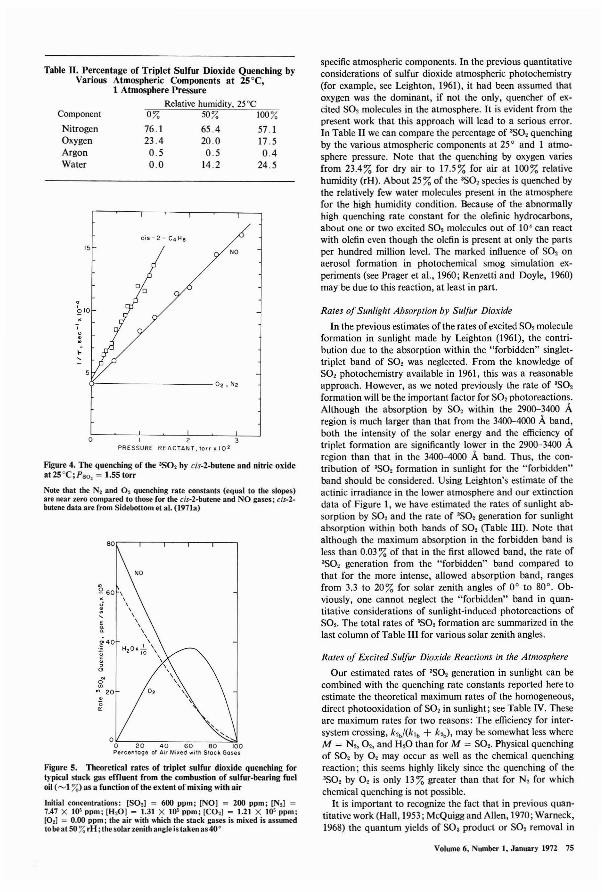
-r---------- 02, N2
012PRESSURE REACTANT. torr II 102
Rates of Excited Sulfur Dioxide Reactions in the Atmosphere
Our estimated rates of 'SO, generation in sunlight can becombined with the quenching rate constants reported here toestimate the theoretical maximum rates of the homogeneous,direct photooxidation of SO, in sunlight; see Table IV. Theseare maximum rates for two reasons: The efficiency for intersystem crossing, k'b/(k1b + k'b)' may be somewhat less whereM = N" 0" and H,O than for M = SO,. Physical quenchingof SO, by 0, may occur as well as the chemical quenchingreaction; this seems highly likely since the quenching of the'SO, by 0, is only 13 % greater than that for N, for whichchemical quenching is not possible.
It is important to recognize the fact that in previous quantitative work (Hall, 1953; McQuigg and Allen, 1970; Warneck,1968) the quantum yields of SO, product or SO, removal in
specific atmospheric components. In the previous quantitativeconsiderations of sulfur dioxide atmospheric photochemistry(for example, see Leighton, 1961), it had been assumed thatoxygen was the dominant, if not the only, quencher of excited S02 molecules in the atmosphere. It is evident from thepresent work that this approach will lead to a serious error.In Table II we can compare the percentage of 'S02 quenchingby the various atmospheric components at 25 ° and I atmosphere pressure. Note that the quenching by oxygen variesfrom 23.4% for dry air to 17.5 % for air at 100% relativehumidity (rH). About 25 % of the 'SO, species is quenched bythe relatively few water molecules present in the atmospherefor the high humidity condition. Because of the abnormallyhigh quenching rate constant for the olefinic hydrocarbons,about one or two excited SO, molecules out of 10' can reactwith olefin even though the olefin is present at only the partsper hundred million level. The marked influence of SO, onaerosol formation in photochemical smog simulation experiments (see Prager et aI., 1960; Renzetti and Doyle, 1960)may be due to this reaction, at least in part.
Rates of Sunlight Absorption by Sulfur Dioxide
In the previous estimates of the rates of excited SO, moleculeformation in sunlight made by Leighton (1961), the contribution due to the absorption within the "forbidden" singlettriplet band of SO, was neglected. From the knowledge ofSO, photochemistry available in 1961, this was a reasonableapproach. However, as we noted previously the rate of 'SO,formation will be the important factor for SO, photoreactions.Although the absorption by SO, within the 2900-3400 Aregion is much larger than that from the 3400-4000 A band,both the intensity of the solar energy and the efficiency oftriplet formation are significantly lower in the 2900-3400 Aregion than that in the 3400--4000 A band. Thus, the contribution of 'SO, formation in sunlight for the "forbidden"band should be considered. Using Leighton's estimate of theactinic irradiance in the lower atmosphere and our extinctiondata of Figure I, we have estimated the rates of sunlight absorption by SO, and the rate of 'SO, generation for sunlightabsorption within both bands of SO, (Table III). Note thatalthough the maximum absorption in the forbidden band isless than 0.03 % of that in the first allowed band, the rate of'SO, generation from the "forbidden" band compared tothat for the more intense, allowed absorption band, rangesfrom 3.3 to 20% for solar zenith angles of 0° to 80°. Obviously, one cannot neglect the "forbidden" band in quantitative considerations of sunlight-induced photoreactions ofSO,. The total rates of 'SO, formation are summarized in thelast column of Table III for various solar zenith angles.
NO
0% 50% 100%
76.1 65 .4 57. 123.4 20.0 17.50.5 0.5 0.40.0 142 24.5
15 .
..;-u.
NitrogenOxygenArgonWater
Component
g'40
1o
sf• 20.;;cr:
o0~-;2;-;0;------;C40;C--;6;-;0C---;C80;;-~'00Percentage of Air Mixed wilh Slock Gases
Table II. Percentage of Triplet Sulfur Dioxide Quenching byVarious Atmospheric Components at 25°C.
1 Atmosphere PressureRelative humidity, 25°C
Figure 5. Tbeoretical rates of triplet sulfur dioxide quenching fortypical stack gas effluent from the combustion of sulfur-bearing fueloil (~1 %) as a function of the extent of mixing with air
Initial concentrations: [SO,] = 600 ppm; [NO] = 200 ppm; [N,] ~
7.47 X to' ppm; (H,OJ = 1.31 X to' ppm; (CO,I = 1.21 X 10' ppm;[02] = 0.00 ppm; the air with which the stack gases is mixed is assumedtobeat 50 %rH i the solar zenith angle istakenas40°
Figure 4. The quenching of the 'SO, by cis-2-butene and nitric oxideaI25°C;Pso, = 1.55 torr
Note that the N2 and O2 quenching rate constants (equal to the slopes)are near zero compared to those for the cis-2-butene and NO gases i cis-2butene data are from Sidebottom et al. (l971a)
Volume 6, Number 1, January 1972 75
Total rate 'SO, formationsec I hr 1
(X 10-') (X 10-')
2.94 106266 961.87 6 70.71 2.6o 10 0 36
0.0330.0360.04400870.20
Rate 'SO,(I b)'Rate 'SO,(la)
Table m. Estimated Rates of Absorption of Solar Radiation by Sulfur Dioxide'
First allowed "Forbidden" band Total rate ofband (2900--3300 (3400- absorption, k.
A), sec-I 4000 A), sec- I sec-I
(x 10-') (X 10-') (X 10-')
3.16 0.95 3.172.86 0.91 2. 871.~ O.W 2.000.73 0.57 0.740.093 0 17 0095
Solarzenithangle,
z
a Estimates of the actinic irradiance in the lower atmosphere were taken from the Table 8 of Leighton (1961), page 29.b Estimated taking the quantum yield of intersystem crossing of excited singlet sulfur dioxide, knJ(klb + k2h) = 0.09, the value for ISOrS02 collisions.
The ratio represents the relative ratc of generation of triplet sulfur dioxide molecules by absorption which occurs within the "forbidden" triplet-singletband (Figure 1) to that generated by absorption within the first allowed absorption band (Figure la).
sec I X 10' hr I X 10'rH: 0% 50% 100% 0% 50% 100%
6.9 5.9 5.1 2.4 2.1 1.86.3 5.3 4.7 2.3 1.9 1.74.4 3.7 3.3 1.6 1.3 1.21.7 1.4 1.2 0.61 0.50 0.430.23 020 018 0.083 0.072 0065
Solar zenithangle,
z
Table IV. Estimated Theoretical Maximum Rates of DirectPhotooxidation of Sulfur Dioxide in the Atmosphere'
Theoretical maximum rate of the homogeneous,direct SO, photooxidation in sunlight'
a Estimates of the actinic irradiance in the lower atmosphere weretaken from the Table 8 of Leighton (1961), page 29.
II Calculated from the theoretical rate of triplet sulfur dioxide formation (Table HI data) and the fraction of the 3802 quenching collisionswhich occur with oxygen molecules at the level present in the atmosphere (Table II); it has been assumed that there is no oxidation whichresults from the ISOr02 quenching collisions; the maximum rate refersto the 3802 reaction with 02 only; if the H20 quenching collisions alsoresult in S02 removal, then the maximum total rate of removal of S02at 50% and 100% rH should be multiplied by 1.71 and 2.40, respeetively.
Under certain conditions in polluted atmospheres the extensive quenching of excited SO, may occur by other than a,and N,. For example, during the early stages of the dilutionof power plant stack gases by air, the photochemicallyexcited SO, species in the gases will be quenched in large partby NO and H,O vapor. Consider the case of a stack gas with acomposition typical of that observed in burning of 1% sulfurcontaining fuel oil: [SO,) = 600 ppm; [NO) = 200 ppm inthe N" H,O, CO,-exhausted mixture. Shown in Figure 5are the expected rates of 'SO, quenching by NO, H,O, anda, in the sunlight-irradiated stack gas for different compositions which result from the mixing of the stack gas with air.For simplicity we have assumed that no water condensationoccurs. Note the relatively large rates of quenching of 'SO,by H,O and NO for these conditions. Gale (1968) has observed an acceleration of the SO, removal rate with increasinghumidity in his SO, photooxidation studies. One can accountfor this effect in terms of our rate constant data if the netresult of H,O-'SO, quenching interactions results in SO,removal, and if only about 14% of the 'SO,-O, quenchinginteractions results in oxidation of SO,. It is not known nowwhat chemical effects, if any, result from the 'SO,-NO and'SO,-H20 quenching encounters. It is possible that somenew chemical species are created in these cases. If the H,Oquenching collisions with 'SO, lead to the ultimate removal ofSO" then the theoretical maximum rates of removal of SO"
SO,-O, mixture photolyses were determined by using mixtures in which the dominant quenching reaction was 8a,involving the SO, molecules, not the quenching Reaction 9involving the a, molecules. Thus in a 50% mixture of SO,in A" 80% of the 'SO, quenching is by SO, molecules. Obviously, one cannot extrapolate such quantum yield datadirectly to the real atmosphere and expect a meaningfulprediction of the SO, photooxidation rates. There are atpresent no reliable data of which we are aware that allowsan estimate of k,./(k,. + k'b) ratio. We are continuing workto evaluate this quantity.
It is instructive to compare our estimated maximum ratesof homogeneous photooxidation of SO, with those observedexperimentally in simulated and real atmospheres. Mixturesof SO, in pure air irradiated in natural sunlight show rates ofSO, photooxidation of about 0.1 % per hour (Gerhard andJohnstone, 1955; confirmed by Urone et aI., 1968). Comparison of this result with our theoretical maximum ratessuggests that chemical quenching of excited SO, (Reaction 9a)occurs in only about 5% of the total of the quenching collisions with a,. The preliminary results of McQuigg andAllen (1970) are also qualitatively consistent with this view;they found the quantum yield of SO,-removal in SO,-O,mixtures to be (7.2 ± 1.4) X 10-' at 3130 A. Our data suggestthat the theoretical maximum quantum yield of SO,-removalis about 18 X 10-l..fer O,-rich mixtures with SO, irradiatedat 3130 A. Katz (1950) estimated the rate of conversion ofSO, to SO, (and H,sO,) in the atmosphere of Sudbury,Ontario; he found a rate of about 2.1 % per hour. Althoughthis checks well with our estimated maximum theoreticalrate of photooxidation (see Table IV), the agreement isprobably fortuitous since additional reaction paths for SO,were probably operative in the polluted air employed in thesestudies. The relatively enormous rates of SO, conversion observed by Shirai et al. (1962), 11.7 % per min, found in anindustrial area near Tokyo, suggest the importance of alternative efficient paths for SO, conversion under these circumstances. Gartrell et al. (1963) reported conversions of 6 %per hour (70% rH) and 30% per hour (100% rH) in SO,emissions from a coal-burning power plant. Again, one mustinvoke other mechanisms than homogeneous photooxidationto account for these rates. Foster has rationalized wellthese rates in terms of the heterogeneous, catalytic oxidationof SO, on iron salt containing dusts in the power plant effluent.It should be noted, however, that there are alternative homogeneous reactions which may play an important part in SO,removal in NOx and NOx-RH-polluted atmospheres. Seethe discussion on next page.
76 En"ironmental Science & Technology
given in Table IV should be multiplied by 1.71 and 2.40for the conditions of 50% and 100% rH, respectively. Further work is necessary to delineate the nature of the mechanismof 350, quenching by H,O and NO molecules.
Detailed Mechanism o/SO, Photooxidation
Blacet (1952) first suggested a possible mechanism for 502photooxidation. He recognized that the photodissociationof SO, (SO, + hv .... SO + 0) was energetically possible onlyat wavelengths less than 2180 A which are absent in sunlightin the lower atmosphere. He suggested that an electronicallyexcited sulfur dioxide molecule (50,*) would react withoxygen to generate the intermediate SO, species (Reaction 10).It was proposed that in air SO, would generate SO, and ozoneby Reaction II.
350, + 0,('1:.-) so,t (12)
so,t 'SO, + 0,('1:.') (13)
.... 502 + 0,(31:.-) (14)
.... SO, + 0,(11:.+, 16..) (15)
.... SO, + O('P) (16)
so,t + M SO, + M (17)
SO, + 0, SO, + 0, (18)
(20)
(21)
(22)
(23)
0,(16..) + SO,~ SO, + O('P)
<+M)~SOI
0,(11:.+) + SO,~ 503+ 0(3P)
~S04
0,(16..) + (0" N" H,O) .... 0,('1:,-) + (0" N" H,O) (25)
The chance for a significant number of 02(11:,+)-502 encounters in the atmosphere with resultant oxidation of SO, isnegligible. Among the energy transfer mechanisms, 15, 19-23,only Reaction 23 remains as a possible source of SO, photooxidation in the atmosphere. The rate constant for the quenching of 02(16.,) by SO, is not now available, but it is a reasonable assumption that it is no larger than that of the fastestknown quenching reaction of 0,(16..), the reaction with tetramethylethylene (k = 1.8 X 10' liters/mole-sec; Hollindenand Timmons, 1970). If Reaction 23 is to be significant itmust compete successfully with 02(16.,) deactivation by themajor components of the atmosphere, Reaction 25:
Reaction 20 is energetically possible (6.H -1.4 kcal/mole)as are 21 and 23, but 22 must be unimportant for atmosphericconditions since it is highly endothermic (6.H = +13.6kcal/mole). Although 20 could be important in laboratoryexperiments at relative high SOziO, ratios, it can not be important for atmospheric conditions; the 0,(11:,+) state willbe deactivated (Reaction 24) to the 0,(16..) state within thefirst few hundred collisions with 0" N" and H,O in the diluteSO, mixture of the atmosphere:
From Clark and Waynes's data (1969) for these reactions, itcan be shown that SO, at 0.2 ppm (in an atmosphere at 50 %rH) could react with a maximum of only 1 in every 1400 ofthe 0,(16..) molecules formed. The actual efficiency of thereaction probably will be much lower than this estimatedmaximum. Although electronically excited 0, may be formedin Reaction 15 or 19 in irradiated atmospheres containingSO" one must conclude that the significant involvement ofthese molecules in SO, photooxidation seems highly improbable. The final test must await proper experimentalevidence concerning this alternative.
Only Reactions 12 and 16 remain among those we haveconsidered as potentially important mechanisms for SO,photooxidation. Alternatively, the sequence could be replacedby the equivalent O-atom transfer Reaction 26 in which theSO, species exists only as a transition state for the reaction.
This path is the analog to the organic triplet molecule generation of singlet oxygen which has been proposed by Pitts(1969) as a possible atmospheric reaction. If we attempt toexplain SO, photooxidation in the atmosphere through theoccurrence of Reaction 15 or 19, then we must require thatthe O,(I1:,+, 16.,) states encounter SO, in the environment andoxidize it efficiently. This oxidation could proceed by oneof the following paths:
photooxidation are probably not correct in detail, and alternative mechanisms should be considered.
The interaction of 'SO, and 0, may generate SO, and oneof the low-lying electronically excited states of oxygen (!1:.+,16..), either by the sequence 12 and 15 or directly by energytransfer in 19.
(10)
(11)
50,* + 0, .... SO,
SO, + 0, .... SO, + 0,
Reactions 14 and 16 require a spin inversion and would beexpected to be less important than 13 and 15. If only the sequence 12, 13, 17, and 18 were important in this system thenone would expect that the experimentally observed 'SO,quenChing constant for oxygen would be dependent on thetotal pressure of the mixture, at least in the low pressure range.We have checked for this dependence in the series of runsusing SO" 02, and Ar gas mixtures over the pressure rangefrom 0.2 to 14.8 torr. Note the data of Figure 2 and Table I.The slopes of the I/T vs. Po, plots, which are equal to thequenching rate constant, are equal within the experimentalerror for all pressures employed. Hence, the simple sequenceof reactions commonly accepted in the description of SO,
This mechanism has been rather generally employed sinceits proposal (Altshuller and Bufalini, 1965; Gerhard and Johnstone, 1955; Hall, 1953; Katz, 1970; Urone and Schroeder,1969). To our knowledge there has been no direct or indirectexperimental evidence for the occurrence of Reactions 10 and11. Specifically, SO, has not been identified as a transient inthese systems. Also, ozone formation has never been shownto accompany SO, photooxidation, although adequate testsfor this have not been made. In fact, evidence obtained in thiswork brings into serious question the occurrence of thissimple reaction scheme. In terms of our present knowledgewe would involve the triplet sulfur dioxide molecule in Reaction 10. With the conservation of electron spin, 'SO,would react with 0,('1:,-) ground-state molecules to givean energy-rich, singlet so,t species, Reaction 12. The lifetime of the very simple SO, molecule should be short since ithas few degrees of freedom in which it might share the excessvibrational energy. Unless some vibrational energy is removedin a collision with other molecules (Reaction 17), it shoulddissociate in an early vibration. There are several alternativedissociation modes which are energetically possible, Reactions13-16.
Volume 6, Number t, January 1972 77
However, the [SO,l/[O,l ratios in the stack gases remain wellabove those commonly encountered in ambient urban airuntil extensive dilution of the stack gases occurs. A significantrate of homogeneous oxidation of SO, can occur by thismechanism for certain conditions expected in stack plumes.
There are many other reactions which may be important
Reaction 26 is rather exothermic (toH = -37.6 kcal/mole),and it should have a relatively low activation energy. Ofcourse it follows the second-order kinetics demanded byour experimental observations. In terms of this mechanismthe relative smallness of the rate constant for 'SO, quenchingby a, (kg = 9.6 X 10' liters/mole-sec) could result from arelatively low preexponential factor expected in theory to beassociated with the spin forbidden character of this reaction.The spin allowed reaction, 'SO, + 0,('2:.-) ..... SO, + O('D),must be unimportant for atmospheric conditions since it isendothermic by 7.8 kcal/mole.
The dominant fate ofO('P) formed in Reaction 26 would bea, formation in the atmosphere. Thus, if our preferredmechanism is correct, then a, formation is expected to accompany the SO, photooxidation. This hypothesis, also commonto the Blacet mechanism, has not been tested adequatelyas yet. However, one must keep this possible complicationin mind in the study of the SO, photooxidation. Analyticaltechniques must be employed which allow SO" SO, (H,SO,),and a, determinations without interference from one another.Obviously, methods based on the iodide oxidation, triiodidereduction, or ultraviolet absorption do not seem to be appropriate choices. We are continuing our work to delineate betterthe detailed mechanism of the SO, photooxidation.
Alternative Homogeneous Removal Mechanisms forso, in the Polluted Atmospheres
We conclude from the present work that a maximum rateof SO, removal of about 2% per hour is expected from thehomogeneous photooxidation of SO, in the atmosphere.Of course this is much lower than the rates of SO, removalobserved in many polluted atmospheres. However, we wouldrecommend caution in the acceptance of the contention thatthe "excess" rate is entirely attributable to heterogeneous SO,reaction paths. Several investigators have reported that SO,is removed much more rapidly when irradiated in NO,containing air mixtures than when SO, alone is present in theair (for example, Gale, 1968; Katz, 1970; Renzetti and Doyle,1960; and Wilson and Levy, 1970). The importance ofheterogeneous catalytic paths for SO, removal is highly unlikelyin these cases. However, there are numerous homogeneouspaths for SO, removal which exist at least in theory when NO,NO" and hydrocarbon impurities are present with the SO,.For example, at the relatively high NO and SO, concentrationspresent in many stack gases, significant NO, levels may develop as the stack gases mix with air; this will occur throughthe reaction, 2 NO + 0, ..... 2 NO" which is usually unimportant at the low ambient levels of NO found in the atmosphere.The NO, developed will lead to the photochemical generationof a-atoms during the daylight hours (NO, + hv ..... NO + 0).At the very low levels of SO, found in the usual pollutedatmospheres, the relatively slow Reaction 27 cannot compete with the Reaction 28:
·SO, + 0, ..... so, + O('P)
a + SO, + M ..... SO, + M
a + a, + M ..... a, + M
(26)
(27)
(28)
for SO, removal in NO,-RH-containing atmospheres.Among these are the following:
NO, + SO, SO, + NO, (29)
RO, + SO, RO + SO, (30)
R(RO, RO,) + SO, RSO,(ROSO" RO,SO,) (31)
Each of these reactions is considerably exothermic: toH" =
-32; toH.. = -19 for R = H, -30 for R = CH,; toH" =-25 for R = CH, (Busfield et aI., 1961); they should be ofreasonably low activation energy and have fairly high preexponential factors. The preliminary studies of Gall et al.(1971) show that Reaction 31 is fast. In the real atmospherescontaining NO,-RH impurities, the theoretically expectedlevels of HO, RO, HO" and RO, suggest that the Reactions30 and 31 involving SO, could compete significantly withother reactions of the HO, RO, HO" and RO, species. Theevaluation of these potentially important homogeneousremoval paths for SO, is now in progress in our laboratoriesand will be reported later.
Literature Cited
Altshuller, A. P., Bufalini, J. J., Photochem. Photobiol. 4, 97(1965).
Badcock, C C, Sidebottom, H. W., Calvert, J. G., Reinhardt, G. W., Damon, E. K., J. Amer. Chem. Soc. 93 (13)(1971).
Blacet, F. E., Ind. Eng. CIlem. 44, 1339 (1952).Brand, J. CD., di Lauro, C, Jones, V. T., J. Amer. Chem.
Soc. 92, 6095 (1970).Busfield, W. K., Ivin, K. J., MackIe, H., O'Hare, P. A G.,
Trans. Faraday Soc. 57, 1064 (1961).Cadle, R. D., Allen, E. R., Science 167, 243 (1970).Cehelnik, E., Spicer, C W., Heicklen, J., J. Amer. Chem. Soc.,
93 (1971).Clark, I. D., Wayne, R. P., Proc. Roy. Soc. (London) A314,
III (1969).Collier, S. S., Morikawa, A., Slater, D. H., Calvert, J. G.,
Reinhardt, G. W., Damon, E. K., J. Amer. Chem. Soc. 92,217 (1970).
Foster, P. M., Atmos. Environ. 3, 157 (1969).Gale, S. 8., Ph.D. Dissertation, Syracuse University, Syracuse,
N. Y.,1968.Gall, J. W., Slater, D. H., Calvert, J. G., in press in "Chemical
Reactions in Urban Atmospheres," C S. Tuesday, Ed.,Elsevier, New York, N. Y., 1971.
Gartrell, F. E., Thomas, F. W., Carpenter, S. 8., Amer.Ind. Hyg. Ass. J. 24, 113 (1963).
Gerhard, E. R., Johnstone, H. F., Ind. Eng. Chem. 47, 972(1955).
Hall, T. C, Jr., Ph.D. Dissertation, University of California,Los Angeles, Calif., 1953.
Herzberg, G., "Molecular Spectra and Molecular Structure.III. Electronic Spectra and Electronic Structure of Polyatomic Molecules," Van Nostrand, Princeton, N. J., 1966,p605.
Hollinden, O. A, Timmons, R. B., J. Amer. Chem. Soc. 92,4181 (1970).
Horowitz, A, Calvert, J. G., submitted for publication, J.Amer. Chem. Soc. (1971).
Jackson, G. E., Calvert, J. G., J. Amer. Chem. Soc. 93, 2593(1971).
Johnstone, H. F., Coughanowr, D. R., indo Eng. Chem. 50,1169(1958).
Johnstone, H. F., Moll, A. J., Ibid., 52, 861 (1960).Junge, C E., Ryan, T. G., Quart. J. Roy. Meterol. Soc. 84, 46
(1958).Katz, M., Anal. Chem. 22,1040 (1950).Katz, M., Can. J. Chem. Eng. 48, 3 (1970).Leighton, P. A, "Photochemistry of Air Pollution," Academic
Press, New York, N. Y., 1961, pp 60-2.Matteson, M. J., Stober, W., Luther, H., Ind. Eng. Chem.
Fundam. 8, 677 (1969).McQuigg, R. D., Allen, E. R., "The Photooxidation of Sulfur
78 Environmental Science & Technology
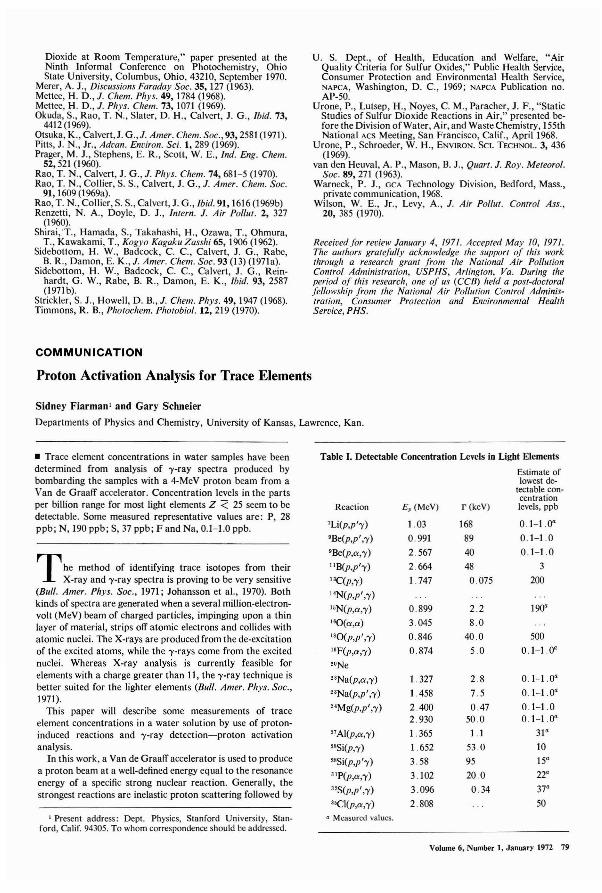
Dioxide at Room Temperature," paper presented at theNinth Informal Conference on Photochemistry, OhioState University, Columbus, Ohio, 43210, September 1970.
Merer, A. J., Discussions Faraday Soc. 35, 127 (1963).Mettee, H. D., J. Chem. Phys. 49, 1784 (1968).Mettee, H. D.,J. Phys. Chem. 73, 1071 (1969).Okuda, S., Rao, T. N., Slater, D. H., Calvert, J. G., Ibid. 73,
4412 (1969).Otsuka, K., Calvert,J. G.,}. Amer. Chem. Soc., 93, 2581 (1971).Pitts, J. N., Jr., Advan. Environ. Sci. 1,289 (1969).Prager, M. J., Stephens, E. R., Scott, W. E., Ind. Eng. Chem.
52,521 (1960).Rao, T. N., Calvert, J. G., J. Phys. Chem. 74,681-5 (1970).Rao, T. N., Collier, S. S., Calvert, J. G., J. Amer. Chem. Soc.
91, 1609 (I 969a).Rao, T. N., Collier, S. S., Calvert, J. G., Ibid. 91, 1616(1969b)Renzetti, N. A, Doyle, D. J., Intern. J. Air Pollut. 2, 327
(1960).Shirai,T., Hamada, S., Takahashi, H., Ozawa, T., Ohmura,
T., Kawakami, T., Kogyo Kagaku Zasshi 65, 1906 (1962).Sidebottom, H. W., Badcock, C C, Calvert, J. G., Rabe,
B. R., Damon, E. K., J. Amer. Chem. Soc. 93 (13) (l97Ia).Sidebottom, H. W., Badcock, C C, Calvert, J. G., Rein
hardt, G. W., Rabe, B. R., Damon, E. K., Ibid. 93, 2587(1971 b).
Strickler, S. J., Howell, D. B., J. Chem. Phys. 49, 1947 (1968).Timmons, R. B., Photochem. Photobiol. 12,219 (1970).
COMMUNICATION
Proton Activation Analysis for Trace Elements
U. S. Dept., of Health, Education and Welfare, "AirQuality Criteria for Sulfur Oxides," Public Health Service,Consumer Protection and Environmental Health Service,NAPCA, Washington, D. C, 1969; NAPCA Publication no.AP-50.
Urone, P., Lutsep, H., Noyes, eM., Paracher, J. F., "StaticStudies of Sulfur Dioxide Reactions in Air," presented before the Division ofWater, Air, and Waste Chemistry, 155thNational ACS Meeting, San Francisco, Calif., April 1968.
Urone, P., Schroeder, W. H., ENVIRON. SCI. TECHNOL. 3, 436(1969).
van den Heuval, A P., Mason, B. J., Quart. J. Roy. Meteorol.Soc. 89, 271 (1963).
Warneck, P. J., GCA Technology Division, Bedford, Mass.,private communication, 1968.
Wilson, W. E., Jr., Levy, A, J. Air Pollut. Control Ass.,20, 385 (1970).
Received Jar review January 4, 1971. Accepted May 10, 1971.The authors gralef'ully acknowledge the support oJ this workIhrough a research grant from Ihe Nalional Air PollulionControl Administration, USPHS, Arlington, Va. During theperiod or this research, one or us (CCB) held a post-doctoralfellowship from the National Air PoilU/ion Control Administration, Consumer Protection and Environmental HeallhService, PHS.
Sidney Fiarman' and Gary Schneier
Departments of Physics and Chemistry, University of Kansas, Lawrence, Kan.
• Trace element concentrations in water samples have beendetermined from analysis of 'Y-ray spectra produced bybombarding the samples with a 4-MeV proton beam from aVan de Graaff accelerator. Concentration levels in the partsper billion range for most light elements Z <: 25 seem to bedetectable. Some measured representative values are: P, 28ppb; N, 190 ppb; S, 37 ppb; F and Na, 0.1-1.0 ppb.
The method of identifying trace isotopes from theirX-ray and 'Y-ray spectra is proving to be very sensitive
(Bull. Amer. Phys. Soc., 1971; Johansson et aI., 1970). Bothkinds of spectra are generated when a several million-electronvolt (MeV) beam of charged particles, impinging upon a thinlayer of material, strips off atomic electrons and collides withatomic nuclei. The X-rays are produced from the de-excitationof the excited atoms, while the 'Y-rays come from the excitednuclei. Whereas X-ray analysis is currently feasible forelements with a charge greater than II, the 'Y-ray technique isbetter suited for the lighter elements (Bull. Amer. Phys. Soc.,1971).
This paper will describe some measurements of traceelement concentrations in a water solution by use of protoninduced reactions and 'Y-ray detection-proton activationanalysis.
In this work, a Van de Graaff accelerator is used to producea proton beam at a well-defined energy equal to the resonanceenergy of a specific strong nuclear reaction. Generally, thestrongest reactions are inelastic proton scattering followed by
'Present address: Dept. Physics, Stanford University, Stanford, Calif. 94305. To whom correspondence should be addressed.
Table I. Detectable Concentration Levels in Light Elements
Estimate oflowest de-
tectable con-centration
Reaction Ep (MeV) r (keV) levels, ppb
'Li(p,p''Y) 103 168 01-10"
'Be(p,p','Y) 0991 89 0.1-1.0
'Be(p,<>,'Y) 2567 40 0.1-1.0
IIB(p,p''Y) 2.664 48 3
13C(p,'Y) 1.747 0075 200
"N(p,p','Y)
"N(p,<>,'Y) 0.899 2.2 190"160(<>,<» 3.045 8.0
l'O(p,p','Y) 0846 40.0 500
19F(p,<>,'Y) 0.874 5.0 O.I-IOa
"Ne
23Na(p,<>,'Y) 1.327 2.8 o 1-1 .oa
23Na(p,p','Y) 1.458 7.5 0.1-1 .Oa
"Mg(p,p','Y) 2.400 047 0.1-1.02.930 500 0.1-10"
21AI(p,<>,'Y) 1365 1.1 31a
"Si(p,'Y) 1652 53.0 10
"Si(p,p''Y) 3.58 95 15a
31P(p,<>,'Y) 3.102 20.0 22"
"S(P,P','Y) 3.096 0.34 37a
"CI(p,<>,'Y) 2808 50
II. Measured values.
Volume 6, Number 1, January 1972 79
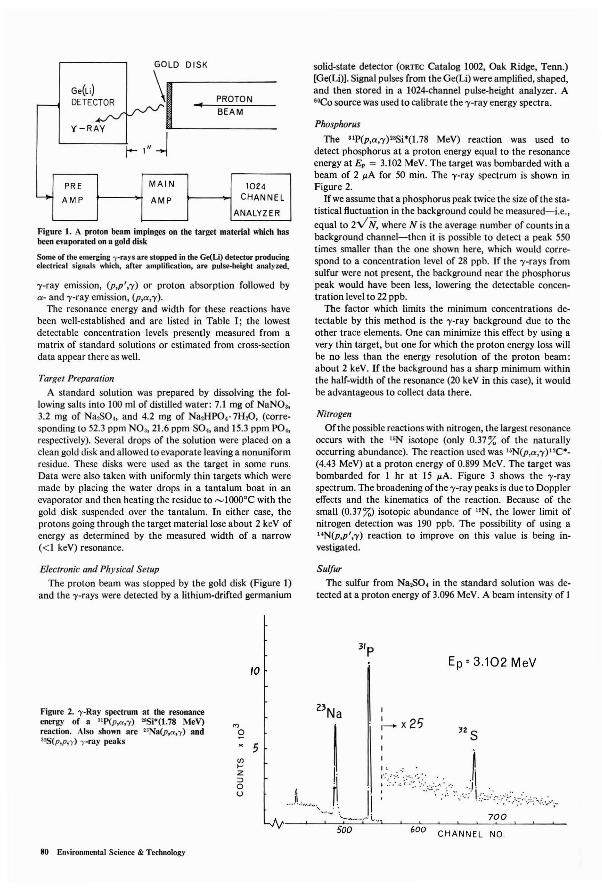
GOLD DISK
Ge(Li) \PROTON
r----< DETECTOR ~. ..,(-R~ .
BEAM
r- 1" ~
PRE MAIN 1024L+- AMP AMP CHANNEL
ANALYZER
Figure 1. A proton beam impinges on the target material which hasbeen evaporated on a gold disk
Some of the emerging l'-rays are stopped in the Ge{Li) detector producingelectrical signals which, after amplification, are pulse-height analyzed.
oy-ray emission, (p,p',oy) or proton absorption followed bya- and oy-ray emission, (p,a,oy).
The resonance energy and width for these reactions havebeen well-established and are listed in Table I; the lowestdetectable concentration levels presently measured from amatrix of standard solutions or estimated from cross-sectiondata appear there as well.
Target Preparation
A standard solution was prepared by dissolving the following salts into 100 ml of distilled water: 7.1 mg of NaNO"3.2 mg of Na,SO" and 4.2 mg of Na,HPO"7H,O, (corresponding to 52.3 ppm NO" 21.6 ppm SO" and 15.3 ppm PO.,respectively). Several drops of the solution were placed on aclean gold disk and allowed to evaporate leaving a nonuniformresidue. These disks were used as the target in some runs.Data were also taken with uniformly thin targets which weremade by placing the water drops in a tantalum boat in anevaporator and then heating the residue to ~ lO00°C with thegold disk suspended over the tantalum. In either case, theprotons going through the target material lose about 2 keV ofenergy as determined by the measured width of a narrow«I keV) resonance.
Electronic and Physical Setup
The proton beam was stopped by the gold disk (Figure I)and the oy-rays were detected by a lithium-drifted germanium
10
solid-state detector (ORTEC Catalog 1002, Oak Ridge, Tenn.)[Ge(Li»). Signal pulses from the Ge(Li) were amplified, shaped,and then stored in a 1024-channel pulse-height analyzer. A"Co source was used to calibrate the oy-ray energy spectra.
Phosphorus
The 31P(p,a,oy)"Si*(1.78 MeV) reaction was used todetect phosphorus at a proton energy equal to the resonanceenergy at E. = 3.1D2 MeV. The target was bombarded with abeam of 2 JJ.A for 5D min. The oy-ray spectrum is shown inFigure 2.
Ifwe assume that a phosphorus peak twice the size of the statistical fluctuation in the background could be measured-i.e.,
equal to 2VN, where N is the average number of counts in abackground channel-then it is possible to detect a peak 55Dtimes smaller than the one shown here, which would correspond to a concentration level of 28 ppb. If the oy-rays fromsulfur were not present, the background near the phosphoruspeak would have been less, lowering the detectable concentration level to 22 ppb.
The factor which limits the minimum concentrations detectable by this method is the oy-ray background due to theother trace elements. One can minimize this effect by using avery thin target, but one for which the proton energy loss willbe no less than the energy resolution of the proton beam:about 2 keV. If the background has a sharp minimum withinthe half-width of the resonance (2D keV in this case), it wouldbe advantageous to collect data there.
Nitrogen
Ofthe possible reactions with nitrogen, the largest resonanceoccurs with the "N isotope (only D.37% of the naturallyoccurring abundance). The reaction used was "N(p,a,oy)12C'(4.43 MeV) at a proton energy of D.899 MeV. The target wasbombarded for I hr at 15 JJ.A. Figure 3 shows the oy-rayspectrum. The broadening of the oy-ray peaks is due to Dopplereffects and the kinematics of the reaction. Because of thesmall (D.37 %) isotopic abundance of I'N, the lower limit ofnitrogen detection was 19D ppb. The possibility of using aI<N(p,p',oy) reaction to improve on this value is being investigated.
Sulfur
The sulfur from Na,sO. in the standard solution was detected at a proton energy of 3.D96 MeV. A beam intensity of I
Ep = 3.102 MeV
Figure 2. -y-Ray spectrum at the resonanceenergy of a 3lP(p,a,'Y) "Si*(1.78 MeV)reaction. Also shown are "Na(p,a,'Y) and"S(p,P,'Y) 'Y-ray peaks
80 Environmental Science & Technology
'"o>< 5(f)...Z::::loU J....~\
500 600CHANNEL NO.
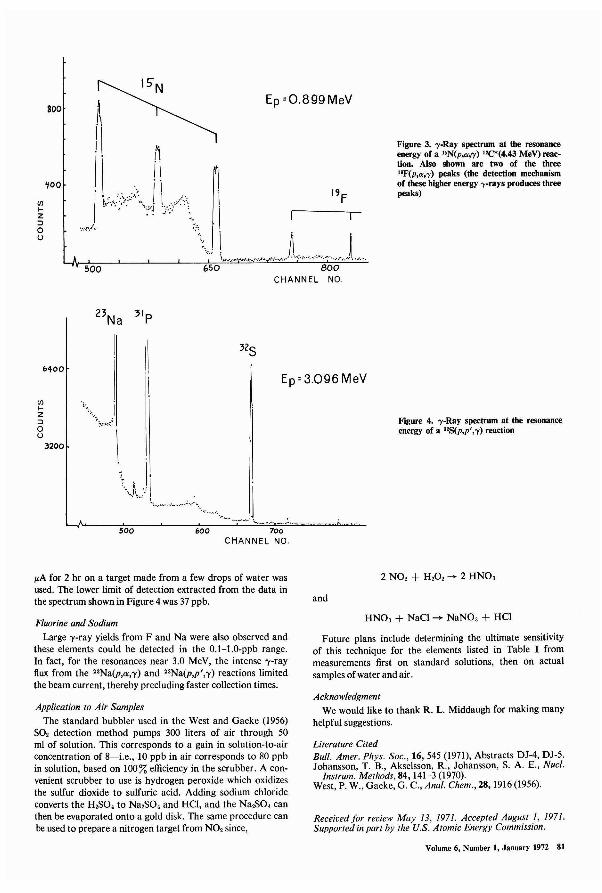
800
~oo
<fl~
z::>ou
6400
500
IIl
650
Ep =0.899 MeV
800CHANN EL NO.
Ep =3.096 MeV
Figure 3. y-Ray spectrum at the resonanceenergy of a "N(p,a,y) "C*(4.43 MeV) reaction. Also shown are two of the three"F(p,a,-y) peaks (the detection mechanismof these higher energy -y-rays produces threepeaks)
<fl~
z::>ou
3200
\ ..~.
;...
Fillure 4. y-Ray spectrum at the resonanceenergy of a "S(p,p',y) reaction
500 600 700CHANNEL NO.
p.A for 2 hr on a target made from a few drops of water wasused. The lower limit of detection extracted from the data inthe spectrum shown in Figure 4 was 37 ppb.
Fluorine and Sodium
Large y-ray yields from F and Na were also observed andthese elements could be detected in the 0.1-1.0-ppb range.In fact, for the resonances near 3.0 MeV, the intense y-rayflux from the 23Na(p,a,'y) and 23Na(p,p';y) reactions limitedthe beam current, thereby precluding faster collection times.
Application to Air Samples
The standard bubbler used in the West and Gaeke (1956)SO, detection method pumps 300 liters of air through 50ml of solution. This corresponds to a gain in solution-to-airconcentration of 8-i.e., 10 ppb in air corresponds to 80 ppbin solution, based on 100% efficiency in the scrubber. A convenient scrubber to use is hydrogen peroxide which oxidizesthe sulfur dioxide to sulfuric acid. Adding sodium chlorideconverts the H,SO. to Na,SO. and HCl, and the Na,SO. canthen be evaporated onto a gold disk. The same procedure canbe used to prepare a nitrogen target from NO, since,
2 NO, + H,O, -+ 2 HNO,
and
HNO, + NaCI ... NaNO, + HCl
Future plans include determining the ultimate sensitivityof this technique for the elements listed in Table I frommeasurements first on standard solutions, then on actualsamples of water and air.
AcknowledgmentWe would like to thank R. L. Middaugh for making many
helpful suggestions.
Literature CitedBull. Amer. Phys. Soc., 16, 545 (1971), Abstracts DJ-4, DJ-5.Johansson, T. B., Akselsson, R., Johansson, S. A. E., Nucl.
Instrum. Methods, 84,141-3 (1970).West, P. W., Gaeke, G. C, Anal. Chem., 28,1916 (1956).
Received for review May 13, 1971. Accepted August I, 197/.Supported in part by the U.S. Atomic Energy Commission.
Volume 6, Number I, January 1972 81
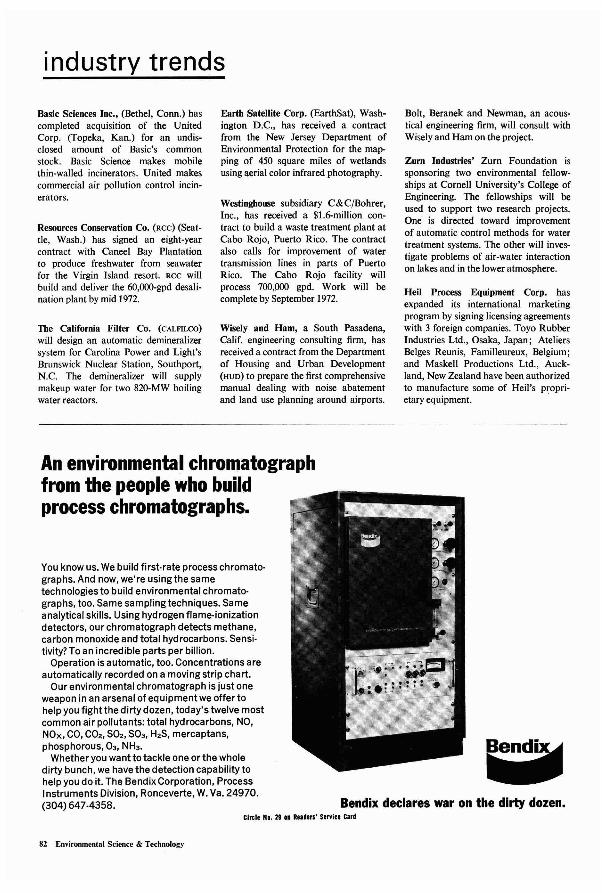
industry trends
Basic Sciences Inc., (Bethel, Conn.) hascompleted acquisition of the UnitedCorp. (Topeka, Kan.) for an undisclosed amount of Basic's commonstock. Basic Science makes mobilethin-walled incinerators. United makescommercial air pollution control incinerators.
Resources Conservation CO. (RCC) (Seattle, Wash.) has signed an eight-yearcontract with Caneel Bay Plantationto produce freshwater from seawaterfor the Virgin Island resort. RCC willbuild and deliver the 60,000-gpd desalination plant by mid 1972.
The California Filter Co. (CALFILCO)
will design an automatic demineralizersystem for Carolina Power and Light'sBrunswick Nuclear Station, Southport,N.C. The demineralizer will supplymakeup water for two 820-MW boilingwater reactors.
Earth Satellite Corp. (EarthSat), Washington D.C., has received a contractfrom the New Jersey Department ofEnvironmental Protection for the mapping of 450 square miles of wetlandsusing aerial color infrared photography.
Westinghouse subsidiary C&CjBohrer,Inc., has received a $1.6-million contract to build a waste treatment plant atCabo Rojo, Puerto Rico. The contractalso calls for improvement of watertransmission lines in parts of PuertoRico. The Cabo Rojo facility willprocess 700,000 gpd. Work will becomplete by September 1972.
Wisely and Ham, a South Pasadena,Calif. engineering consulting firm, hasreceived a contract from the Departmentof Housing and Urban Development(AVD) to prepare the first comprehensivemanual dealing with noise abatementand land use planning around airports.
Bolt, Beranek and Newman, an acoustical engineering firm, will consult withWisely and Ham on the project.
Zurn Industries' Zurn Foundation issponsoring two environmental fellowships at Cornell University's College ofEngineering. The fellowships will beused to support two research projects.One is directed toward improvementof automatic control methods for watertreatment systems. The other will investigate problems of air-water interactionon lakes and in the lower atmosphere.
Heil Process Equipment Corp. hasexpanded its international marketingprogram by signing licensing agreementswith 3 foreign companies. Toyo RubberIndustries Ltd., Osaka, Japan; AteliersBelges Reunis, Familleureux, Belgium;and Maskell Productions Ltd., Auckland, New Zealand have been authorizedto manufacture some of Heil's proprietaryequipment.
Bendix declares war on the dirty dozen.
You know us. We build first·rate process chromato·graphs. And now, we're using the sametechnologies to build environmental chromato·graphs, too. Same sampling techniques. Sameanalytical skills. Using hydrogen flame·ionizationdetectors, our chromatograph detects methane,carbon monoxide and total hydrocarbons. Sensitivity? To an incredible parts per billion.
Operation is automatic, too. Concentrations areautomatically recorded on a moving strip chart.
Our environmental chromatograph is just oneweapon in an arsenal of equipment we offer tohelp you fight the dirty dozen, today's twelve mostcommon air pollutants: total hydrocarbons, NO,NOx, CO, CO2, 502, 503, H2S, mercaptans,phosphorous, 03, NH3.
Whether you wantto tackle one or the wholedirty bunch, we have the detection capability tohelp you do it. The Bendix Corporation, ProcessInstruments Division, Ronceverte, W. Va. 24970.(304) 647-4358.
An environmental chromatographfrom the people who buildprocess chromatographs.
Circle No. 29 an Readers' Service Card
82 Environmental Science & Technology

22AQ
need
LET ENVIRONMENTAL SCIENCE & TECHNOLOGY KEEP YOU INFORMEDThere isn't a more widely discussed field than pollution control. But onlyENVIRONMENTAL SCIENCE & TECHNOLOGY magazine can roundup the hard news .. to bring you the facts on environmental control.
Each month, utiliZing the American Chemical Society's world-wide newscontacts in Government. . Education ... and Industry, ES&T willbring you the very latest news of:
current Government pollution legislation and guidelinesmore efficient engineering techniquesimportant fundamental researchmore productive equipment coming on the marketcase histories of how others are overcomingenvironmental problems you may now be facing
Moreover, as an ES&T subscriber, you'll receive theannual invaluable Fall issue of "POLLUTION CONTROLDIRECTORY" at no extra cost!
((
You'll find this "Directory" to be a constant deSk-Side))reference source! It contains hundreds of pages ofintormation on who makes what in the pollution controlmarket names and addresses of consulting serv-ices lists the products, services and supplies usedin environmental control . .. contains trade names ofthousands of items.
Get the facts on pollution control each month. Use the form below tostart your ES&T subscription-including the valuable "Pollution ControlDirectory" issue-on its way to you.
ENVIRONMENTAL SCIENCE & TECHNOLOGY 1155 Sixteenth Street, N. W., Washington, D. C. 20036
Please enter my one year subscription to ES&T at the rate checked below:US. Canada, PUAS·· All Other Nations··
•ACS members D $6.00 D $10.00 D $11.00Nonmembers D $9.00 D $13.00 D $14.00
•• Payment must be made in U.S. currency, by international money order,UNESCO coupons, or U.S. bank draft; or order through your book dealer.
D Payment enclosed (payable to American Chemical Society). D Bill me. D I am an ACS member.Name Position _
Your Company _
Address _
City State Zip, _
Nature Of Your Manufacturing orCompany's Business: D Processing D Government D Academic D Other---------If Manufacturer, Type 01 Products Produced _
• Note: Subscriptions at ACS member rates are for personal use only.
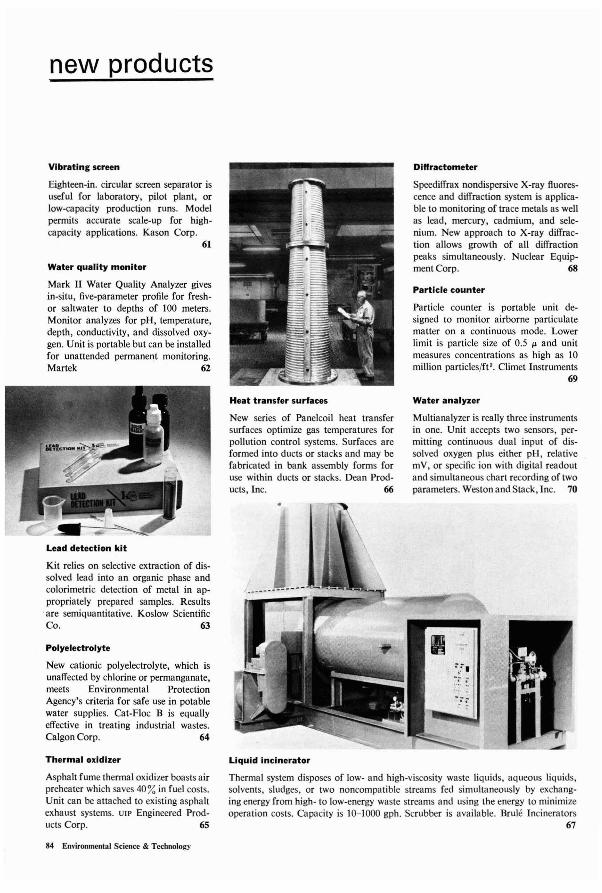
new products
Vibrating screen
Eighteen-in. circular screen separator isuseful for laboratory, pilot plant, orlow-capacity production runs. Modelpermits accurate scale-up for highcapacity applications. Kason Corp.
61
Water quality monitor
Mark II Water Quality Analyzer givesin-situ, five-parameter profile for freshor saltwater to depths of 100 meters.Monitor analyzes for pH, temperature,depth, conductivity, and dissolved oxygen. Unit is portable but can be installedfor unattended permanent monitoring.Martek 62
Lead detection kit
Kit relies on selective extraction of dissolved lead into an organic phase andcolorimetric detection of metal in appropriately prepared samples. Results
.are semiquantitative. Koslow ScientificCo. 63
Polyelectrolyte
New cationic polyelectrolyte, which isunaffected by chlorine or permanganate,meets Environmental ProtectionAgency's criteria for safe use in potablewater supplies. Cat-Floc B is equallyeffective in treating industrial wastes.Calgon Corp. 64
Heat transfer surfaces
New series of Panelcoil heat transfersurfaces optimize gas temperatures forpollution control systems. Surfaces areformed into ducts or stacks and may befabricated in bank assembly forms foruse within ducts or stacks. Dean Products, Inc. 66
Diffractometer
Speediffrax nondispersive X-ray fluorescence and diffraction system is applicable to monitoring of trace metals as wellas lead, mercury, cadmium, and selenium. New approach to X-ray diffraction allows growth of all diffractionpeaks simultaneously. Nuclear Equipment Corp. 68
Particle counter
Particle counter is portable unit designed to monitor airborne particulatematter on a continuous mode. Lowerlimit is particle size of 0.5 I'- and unitmeasures concentrations as high as 10million particles/ft'. Climet Instruments
69
Water analyzer
Multianalyzer is really three instrumentsin one. Unit accepts two sensors, permitting continuous dual input of dissolved oxygen plus either pH, relativemY, or specific ion with digital readoutand simultaneous chart recording of twoparameters. Weston and Stack, Inc. 70
Thermal oxidizer
Asphalt fume thermal oxidizer boasts airpreheater which saves 40% in fuel costs.Unit can be attached to existing asphaltexhaust systems. VIP Engineered Products Corp. 65
84 Environmental Science & Technology
Liquid Incinerator
Thermal system disposes of low- and high-viscosity waste liquids, aqueous liquids,solvents, sludges, or two noncompalible streams fed simultaneously by exchanging energy from high- to low-energy waste streams and using the energy to minimizeoperation costs. Capacity is 10-1000 gph. Scrubber is available. Brule Incinerators
67
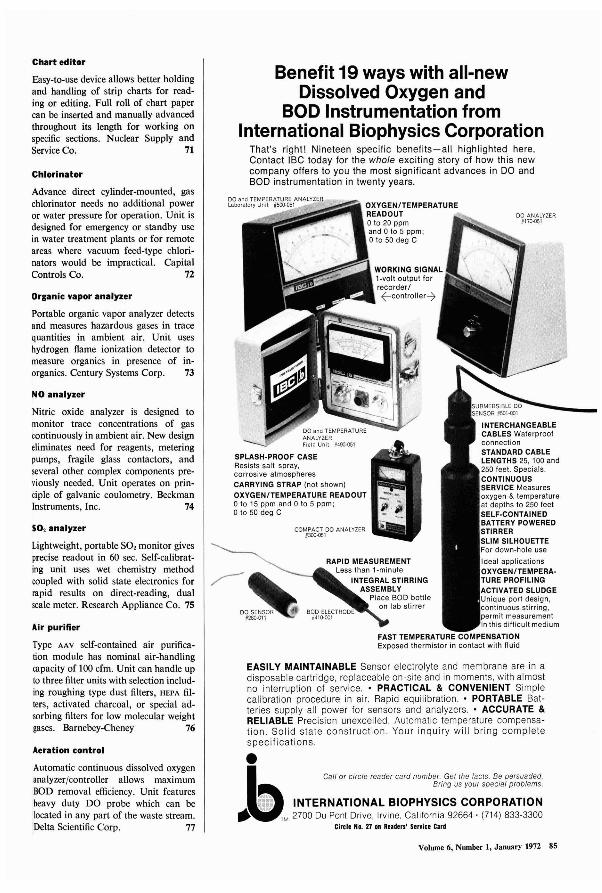
•Call or circle reader card number. Get the facts. Be persuaded.
Bring us your special problems.
INTERNATIONAL BIOPHYSICS CORPORATION1M 2700 Du Pont Drive. Irvine, California 92664· (714) 833-3300
Circl, No. 27 01 Readers' Service Card
DO ANALYZERN170·051
INTERCHANGEABLECABLES WaterproofconnectionSTANDARD CABLELENGTHS 25, 100 and250 feet. Specials.CONTINUOUSSERVICE Measuresoxygen & temperatureat depths to 250 feetSELF·CONTAINEDBATTERY POWEREDSTIRRERSLIM SILHOUETTEFor down-hole use
Ideal applicationsOXYGEN/TEMPERA·TURE PROFILINGACTIVATED SLUDGEUnique port design,continuous stirring,permit measurementin this difficult medium
FAST TEMPERATURE COMPENSATIONExposed thermistor in contact with fluid
RAPID MEASUREMENTLess than 1-minule
INTEGRAL STIRRINGASSEMBLY
Place BOD bottleon lab stirrer
COMPACT DO ANALYZER#300·051
:;;~'jiiiiiiijjiil OXYGEN/TEMPERATURE
READOUTo to 20 ppmand 0 to 5 ppm; .........:.....o to 50 deg C
EASILY MAINTAINABLE Sensor electrolyte and membrane are in adisposable cartridge, replaceable on-site and in moments, with almostno interruption of service.• PRACTICAL & CONVENIENT Simplecalibration procedure in air. Rapid equilibration.• PORTABLE Batteries supply all power for sensors and analyzers.• ACCURATE &RELIABLE Precision unexcelled. Automatic temperature compensation. Solid state construction. Your inquiry will bring completespecifications.
Benefit 19 ways with all-newDissolved Oxygen and
BOD Instrumentation fromInternational Biophysics Corporation
That's right! Nineteen specific benefits-all highlighted here.Contact IBC today for the whole exciting story of how this newcompany offers to you the most significant advances in DO andBOD instrumentation in twenty years.
SPLASH·PROOF CASEResists salt spray,corrosive atmospheresCARRYING STRAP (not shown)
OXYGEN/TEMPERATURE READOUTo to 15 ppm and 0 to 5 ppm;o to 50 deg C
SO, analyzer
Lightweight, portable SO, monitor givesprecise readout in 60 sec. Self-calibrating unit uses wet chemistry methodcoupled with solid state electronics forrapid results on direct-reading, dualscale meter. Research Appliance Co. 75
Aeration control
Automatic continuous dissolved oxygenanalyzer/controller allows maximumBOD removal efficiency. Unit featuresheavy duty DO probe which can belocated in any part of the waste stream.Delta Scientific Corp. 77
Air purifier
Type AAV self-contained air purification module has nominal air-handlingcapacity of 100 cfm. Unit can handle upto three filter units with selection including roughing type dust filters, HEPA filters, activated charcoal, or special adsorbing filters for low molecular weightgases. Barnebey-Cheney 76
NO analyzer
Nitric oxide analyzer is designed tomonitor trace concentrations of gascontinuously in ambient air. New designeliminates need for reagents, meteringpumps, fragile glass contactors, andseveral other complex components previously needed. Unit operates on principle of galvanic coulometry. BeckmanInstruments, Inc. 74
Chlorinator
Advance direct cylinder-mounted, gaschlorinator needs no additional poweror water pressure for operation. Unit isdesigned for emergency or standby usein water treatment plants or for remoteareas where vacuum feed-type chlorinators would be impractical. CapitalControls Co. 72
Chart editor
Easy-to-use device allows better holdingand handling of strip charts for reading or editing. Full roll of chart papercan be inserted and manually advancedthroughout its length for working onspecific sections. Nuclear Supply andService Co. 71
Organic vapor analyzer
Portable organic vapor analyzer detectsand measures hazardous gases in tracequantities in ambient air. Unit useshydrogen flame ionization detector tomeasure organics in presence of inorganics. Century Systems Corp. 73
Volume 6, Number 1, January 1972 85
86 Environmental Science & Technology
new literature
Sludge conditioning. New Booklet tellshow to use Dow Chemical's Puriflocto condition sludges. Applications,advantages, and laboratory evaluationsare covered as well as various sludgehandling techniques. Dow ChemicalCo. 91
Pneumatic systems. Literature describesheavy-duty, negative-pressure pneumaticwaste collection systems. Brochure describes installations and advantages inboth new and old structures. ECI AirFlyte Corp. 92
Bibliography. Collection of Rand Corp.publications on environmental questionsis available in newly compiled bibliography from West Coast think tank.Rand Corp. 93
Water standards. Technical folder tellsof research to establish absolute turbidityof pure water in Formazin TurbidityUnits. Hach Chemical Co. 94
Management guide. New Booklet describes systems available for air andwater pollution and solid waste disposal.Monsanto Enviro-Chem Systems, Inc.
95
Gas detection. Bulletin lists units foranalyzing and detecting gases, liquids,and vapors. Includes combustible gasmeters, oxygen and thermal conductivityanalyzers, nondispersive infrared, hydrogen flame ionization and process chromatographs. Mine Safety Appliance Co. 96
Reagents. Catalog/price schedule offersconcise listing of reagents, accessories,and equipment for air pollution analysis.Research Appliance Co. 97
Waste water. Booklet gives practicalsix-step approach to solving industrialwaste water pollution problems anddescribes modular solutions to a varietyof liquid waste problems such asphenols, oily water, meat packing,liquor, toxic metals, and refining wastes.Fram Corp. 98
Trace metals. Eight-page brochure describes multiple anodic stripping analyzer for detecting trace metal pollutants. Environmental Sciences Associates, Inc. 99
Sampler. Technical bulletin describessampler that can be programmed on aflow and/or time basis to provideaccurate records of fluids. BtF SaniTrol,Inc. 100
Tertiary treatment. Information on tertiary waste water treatment is containedin literature from company whichbuilt the world's first tertiary sewagetreatment plant. California Filter Co. 101
Methods guide. Comprehensive listingof more than 200 current analyticalmethods involving company's 27 sensingelectrodes. Full specs of electrode capabilities are included. Orion ResearchInc. 102
Metal finishing. "Environmental Qualityfor Metal Finishing Exhausts" is fourpage summary which defines commoncontaminant loading, and presents datatables on such topics as mist generationin various plating processes, solutionconcentrations, operating temperatures,and other parameters of interest inpollution control. Tri-Mer Corp. 103
Analysis service. Four-page bookletdescribes effluent analysis services offeredto clients in the United States. Routineanalyses include BOD, COD, heavy metals,and pesticides. Nalco Chemical Co. 104
Combined treatment. Bulletin describesRex Satellite Plants for treatment ofcombined sewer/storm water overflows.Rex Chainbelt, Inc. 105
Apparatus. Catalog lists equipmentfor analyzing environmental pollutants. Emphasis is on glassware, butchemicals and other test equipment arealso listed. Tudor Scientific Glass Co.
106
Engineering expertise. Release describesengineering capabilities, products, andservices of pollution control firm. Peabody Engineering 107
Instruments. Catalog lists instrumentsfor pollution monitoring. Includes pricelist and equipment specs. NationalEnvironmental Instruments, Inc. 108
Grit removal. Bulletin describes Hydrogritter system for grit removal and givesplant sizing methods and data tables.Envirotech 109
Sewage treatment. Brochure describespackage of plans and operational datafor manufacturing and installing extended aeration, domestic sewage treatment system for commercial use. StanleyM. Strine Design Associates, Inc. 110
Wet grinder. Literature describes compact wet grinding waste disintegratorwhich requires no accessories for installation. Available with five differentinlet fittings to suit various connectionrequirements. BIF SaniTrol, Inc. 111
Air filter. Data sheet details operatingdata on industrial air filters. Cyclonicdust separation combined with filtrationthrough felted tubes produces 99.9+ %efficiency. Hart-Carter Co. 112
Sludge disposal. Booklet describes "Solidfixation" systems which convertsludge, liquid, or semisolid pollutantsinto inert landfill. Applications are citedfor dissolved metals, tars, oils, and otherresidues as well as radioactive wastes.Conservall, Inc. 113
Reverse osmosis. Booklet describes watertreatment using reverse osmosis andgives details of company's Helical Tubular Segment which provides key to system's simplicity and efficiency. PhilcoFord Corp. 114
Controls. Bulletin describes expandedline of automatic valve controls including cage-trim-type valves, globe valves,cryogenic valves, throttling ball valves,and valve positioners. lIT HammelDahl. l1S
Need more information about anyitems? If so, just circle the appropirate numbers on one of the readerservice cards bound into the back ofthis issue and mail in the card. Nostamp is necessary.
Circle No. 21 on Readers' Senice Card
Volume 6, Number I, January 1972 87
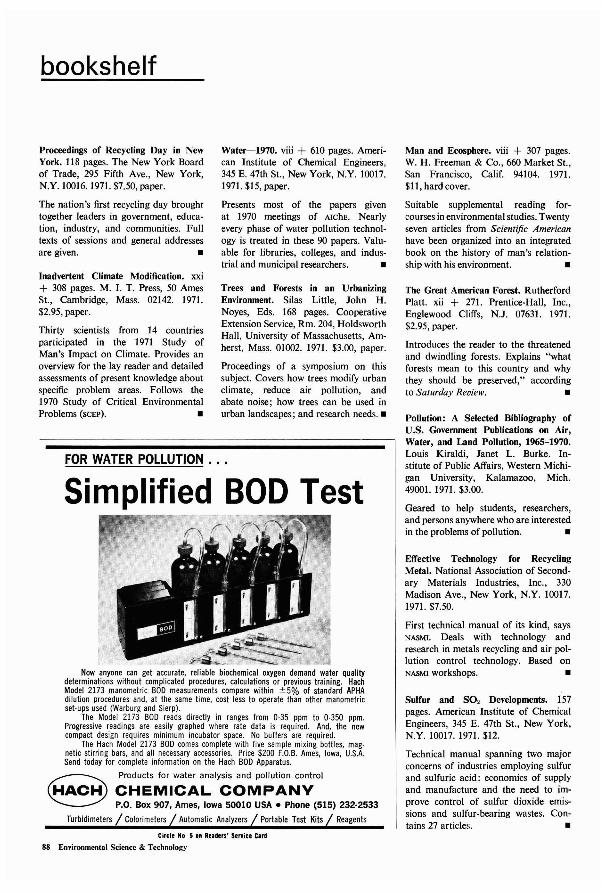
Simplified BOD Test
Now anyone can get accurate, reliable biochemical oxygen demand water qualitydeterminations without complicated procedures, calculations or previous training. HachModel 2173 manometric BOD measurements compare within ± 5% of standard APHAdilution procedures and, at the same time, cost less to operate than other manometricset-ups used (Warburg and Sierp).
The Model 2173 BOD reads directly in ranges from 0-35 ppm to 0-350 ppm.Progressive readings are easiiy graphed where rate data is required. And, the newcompact design requires minimum incubator space. No buffers are required.
The Hach Model 2173 BOD comes complete with five sample mixing bottles, magnetic stirring bars, and all necessary accessories. Price $200 F.O.B. Ames, Iowa, U.S.A.Send today for complete information on the Hach BOD Apparatus.
cEA~~ ~~~';I~~~aly~~~o;:n~o;rolP.O. Box 907, Ames, Iowa 50010 USA. Phone (515) 232-2533
Turbidimeters Automatic Analyzers Portable Test Kits Reagents
bookshelf
Proceedings of Recycling Day in NewYork. 118 pages. The New York Boardof Trade, 295 Fifth Ave., New York,N.Y. 10016. 1971. $7.50, paper.
The nation's first recycling day broughttogether leaders in government, education, industry, and communities. Fulltexts of sessions and general addressesare given. _
Inadvertent Climate Modification. xxi+ 308 pages. M. I. T. Press, 50 AmesSt., Cambridge, Mass. 02142. 1971.$2.95, paper.
Thirty scientists from 14 countriesparticipated in the 1971 Study ofMan's Impact on Climate. Provides anoverview for the lay reader and detailedassessments of present knowledge aboutspecific problem areas. Follows the1970 Study of Critical EnvironmentalProblems (SCEP). _
FOR WATER POLLUTION.
Water-1970. viii + 610 pages. American Institute of Chemical Engineers,345 E. 47th St., New York, N.Y. 10017.1971. $15, paper.
Presents most of the papers givenat 1970 meetings of AIChE. Nearlyevery phase of water pollution technology is treated in these 90 papers. Valuable for libraries, colleges, and industrial and municipal researchers. _
Trees and Forests in an UrbanizingEnvironment. Silas Little, John H.Noyes, Eds. 168 pages. CooperativeExtension Service, Rm. 204, HoldsworthHall, University of Massachusetts, Amherst, Mass. 01002. 1971. $3.00, paper.
Proceedings of a symposium on thissubject. Covers how trees modify urbanclimate, reduce air pollution, andabate noise; how trees can be used inurban landscapes; and research needs. _
Man and Ecosphere. viii + 307 pages.W. H. Freeman & Co., 660 Market St.,San Francisco, Calif. 94104. 1971.$11, hard cover.
Suitable supplemental reading forcourses in environmental studies. Twentyseven articles from Scientific Americanhave been organized into an integratedbook on the history of man's relationship with his environment. _
The Great American Forest. RutherfordPlatt. xii + 271. Prentice-Hall, Inc.,Englewood Cliffs, N.J. 07631. 1971.$2.95, paper.
Introduces the reader to the threatenedand dwindling forests. Explains "whatforests mean to this country and whythey should be preserved," accordingto Saturday Review. _
Pollution: A Selected Bihliography ofU.S. Government Publications on Air,Water, and Land Pollution, 1965-1970.Louis Kiraldi,' Janet L. Burke. Institute of Public Affairs, Western Michigan University, Kalamazoo, Mich.49001. 1971. $3.00.
Geared to help students, researchers,and persons anywhere who are interestedin the problems of pollution. -
Effective Technology for RecyclingMetal. National Association of Secondary Materials Industries, Inc., 330Madison Ave., New York, N.Y. 10017.1971. $7.50.
First technical manual of its kind, saysNASMI. Deals with technology andresearch in metals recycling and air pollution control technology. Based onNASMI workshops. -
Sulfur and S02 Developments. 157pages. American Institute of ChemicalEngineers, 345 E. 47th St., New York,N.Y. 10017. 1971. $12.
Technical manual spanning two majorconcerns of industries employing sulfurand sulfuric acid: economics of supplyand manufacture and the need to improve control of sulfur dioxide emissions and sulfur-bearing wastes. Contains 27 articles. -
Circle No 5 In Readers' Se"ice Card
88 En"ironmental Science & Technology
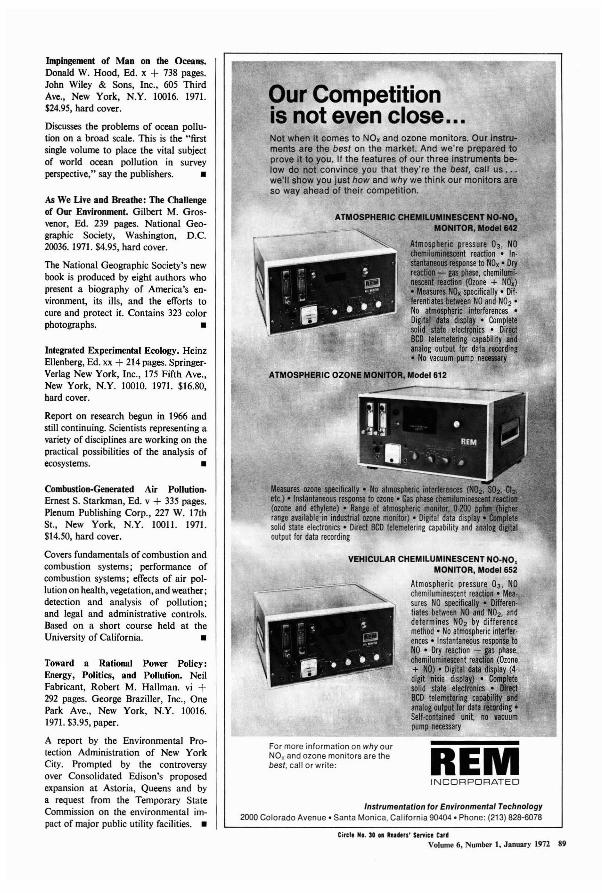
tnstrumentation for Environmental Technotogy2000 Colorado Avenue· Santa Monica, Calitornia 90404. Phone: (213) 828-6078
Our Competitionis not even close...
INCORPORATEDREM
Not when it comes to NO. and ozone monitors. Our instruments are the best on the market. And we're prepared toprove it to you. It the features of our three instruments below do not convince you that they're the best, call us •••we'll show you just how and Why we think our monitors areso way ahead of their competition.
VEHICULAR CHEMILUMINESCENT NO-NO.MONITOR, Model 652
Atmospheric pressure 03 , NOchemiluminescent reaction. Mea·sures NO specifically • Differen·tiales between NO and ND2, anddetermines ND 2 by differencemethod· No atmospheric interler·ences • Instantaneous response toNO • Dry reaction - gas phase,chemiluminescent reaction (Ozone+ NO)· Digital data display (4·digit nixie display) • Completesolid state electronics • DIrectBCD telemelarinl capability endanalog output for data recordinI.Self·contained unit, no vacuumpump necessary
For more information on why ourNO, and ozone monitors are thebest, call or write:
Measures ozone specifically • No alnlospheric; interl*Wes CNOi.etc.)' fnstantaneoos response to ozone· Gas phase dlemiIam'(ozone and ethylene) • Range of atmospheric mOllitar, O-ZIJl)range available"in industrial ozone monitor) • Digital data dispfilsolid state electronics· Direct BCD telemetering capability and analogoutput for data recording
ATMOSPHERIC CHEMILUMINESCENT NO-NO.MONITOR, Model 842
Atmospheric pressure 03 , NOchemiluRlillexent reaction • In·slantIlleouS mponse to NO•• Dryreacticlll- ... phase, chemilumi·oeacerf ieaclion (Ozone + NO.)• MeI$UIft NO. specifically· Dif·ferentiates between NO and ND2 •
No atmospheric interferences •Digital data display • Completesolid stale electronics • DirectBCD telemetering capability andanalog output for data recording• No vacuum pump necessary
ATMOSPHERIC OZONE MONITOR, Model 612
Integrated Experimental Ecology. HeinzEllenberg, Ed. xx + 214 pages. SpringerVerlag New York, Inc., 175 Fifth Ave.,New York, N.Y. 10010. 1971. $16.80,hard cover.
Impingement of Man on the Oceans.Donald W. Hood, Ed. x + 738 pages.John Wiley & Sons, Inc., 605 ThirdAve., New York, N.Y. 10016. 1971.$24.95, hard cover.
Discusses the problems of ocean pollution on a broad scale. This is the "firstsingle volume to place the vital subjectof world ocean pollution in surveyperspective," say the publishers. _
Toward a Rational Power Policy:Energy, Politics, and Pollution. NeilFabricant, Robert M. Hallman. vi +292 pages. George Braziller, Inc., OnePark Ave., New York, N.Y. 10016.1971. $3.95, paper.
A report by the Environmental Protection Administration of New YorkCity. Prompted by the controversyover Consolidated Edison's proposedexpansion at Astoria, Queens and bya request from the Temporary StateCommission on the environmental impact of major public utility facilities. _
Report on research begun in 1966 andstill continuing. Scientists representing avariety of disciplines are working on thepractical possibilities of the analysis ofecosystems. _
As We Live and Breathe: The Challengeof Our Environment. Gilbert M. Grosvenor, Ed. 239 pages. National Geographic Society, Washington, D.C.20036.1971. $4.95, hard cover.
The National Geographic Society's newbook is produced by eight authors whopresent a biography of America's environment, its ills, and the efforts tocure and protect it. Contains 323 colorphotographs. _
Combustion-Generated Air Pollution.Ernest S. Starkman, Ed. v + 335 pages.Plenum Publishing Corp., 227 W. 17thSt., New York, N.Y. 10011. 1971.$14.50, hard cover.
Covers fundamentals of combustion andcombustion systems; performance ofcombustion systems; effects of air pollution on health, vegetation, and weather;detection and analysis of pollution;and legal and administrative controls.Based on a short course held at theUniversity of California. _
Circle NI. 31 II RtaHrS' $ervice Caf'Volume 6, Number I, January 1972 89

meetingguide
January 17-21American Society for Testing andMaterialsASTM Committee Meeting
Ft. Lauderdale, Fla.Session on water. Contact: Hank Hamil·ton, ASTM, 1916 Race St., Philadelphia,Pa.19103
January 24-26Cooling Tower Institute
New Orleans, La.Deals with cooling tower operations andrelated areas. Contact: CTI, 3003 Yale,Houston, Tex. 77018
January 24-28American Society of Civil EngineersNational Water Resources EngineeringMeeting
Atlanta, Ga.Government, industry, and universityspokesmen discuss the nation's increas·ingly important water problems. Contact:American Society of Civil Engineers,United Engineering Center, 345 East 47St., New York, N.Y. 10017
January 25-27American Society of MechanicalEngineers and othersAnnual Reliability and MaintainabilitySymposium
San Francisco, Calif.Merged meeting with the Institute of En·vironmental Sciences and others. Write:C. M. Bird, Publicity Chairman, IBMCorp., Dept. 942, 8600 N. Astronaut Blvd.,Cape Kennedy, Fla. 32920
January 27American Society of Heating, Refrigerating and Air Conditioning EngineersSemiannual Meeting
New Orleans, La.Symposium on control of particulateemissions. Contact: N. A. LaCourte,Secretary, ASH RAE, 345 E. 47 St., NewYork, N.Y. 10017
January 31-February 1Southern California Chapter of theAmerican Statistical AssociationSymposium on the Application of Statistical Techniques to the Analysis of En·vironmental Problems
Los Angeles, Calif.Fee: $35-40. Attempts to solve environmental problems combining environmental expertise with statistical analysis.Contact: Max Astrachan, Departmentof Management Science, San FernandoValley State College, 18111 Nordhoff St.,Northridge, Calif. 91324
90 Environmental Science & Technology
January 31-February 2Cornell University and EPAAgricultural Waste Management Con·ference
Syracuse, N.Y.Presents latest research that can be usedto solve or alleviate environmental pollution from agricultural wastes. Contact:Department of Agricultural Engineering,207 Riley-Robb Hall, Cornell University,Ithaca, N.Y. 14850
February 5-7Water Resources Congress1972 Annual Meeting of the Water Resources Congress
St. Louis, Mo.Held in conjunction with the U.S. MarineExposition. Contact: Water ResourcesCongress, 1130 17th St., N.W., Washington,D.C. 20036
February 9-10III. EPA and Dept. of CivilEngineering, Univ. of III.14th Water Quality Conference
Urbana, III."Groundwater Quality and Treatment" isconference title. Write: V. L. Snoeyink,Assistant Professor of Sanitary Engineer·ing, 3230 Civil Engineering Bldg., Univ. ofIII., Urbana, III. 61801
February 12-17Engineering FoundationRecycle Implementation Conference
Pacific Grove, Calif.Idea exchange on the subject of recycleamong persons concerned with the solidwaste field. Fee: $150. Details: Engineering Foundation, 345 E. 47 St., New York,N.Y. 10017
February 14The Sports Foundation, Inc.Gold Metal Awards Program for WaterPollution Control
Chicago, III.Since 1968, awards are made annually tomembers of American industry who havemade outstanding achievements in pollution control. Contact: The SportsFoundation, Inc., 717 N. Michigan Ave.,Chicago, 111.60611
February 14-15MTS Coastal Zone ManagementCommitteeTools for Coastal Zone ManagementConference
Washington, D.C.Contact: Marine Technology Society, 1730M St., N.W., Washington, D.C. 20036
February 14-16Technical Association of the Pulp andPaper Industry57th Annual Meeting
New York, N.Y.Write: M. J. Williams, TAPPI, 360 LexingtonAve., New York, N.Y. 10017
February 19Gannon CollegeSystems Approach to Noise in the UrbanCommunitySeminar
Erie, Pa.Contact: Institute for Community De·velopment, Gannon College, Erie, Pa.16500
February 20-23American Institute of ChemicalEngineersAIChE 71st National Meeting
Dallas, Tex.Many sessions on various phases of pollution control. Contact: R. S. Schechter,Dept. of Chem. Eng., Univ. of Texas,Austin, Tex. 78712
February 21-22Environmental Protection Agencyand Clemson UniversityCoastal Zone Pollution ManagementSymposium
Charleston, S.C.Focuses attention of regional, state, andlocal agencies on water quality problemsin the coastal zone. Write: Billy L. Edge,Co-Director, Coastal Zone Pollution Management, Rhodes Engineering ResearchCenter, Clemson Univ., Clemson, S.C.29631
March 5-9Society of Toxicology1972 Annual Scientific Meeting
Williamsburg, Va.For additional information, Robert A.Scala, Esso Research and EngineeringCo., P.O. Box 45, Linden, N.J. 07036
March 11Gannon CollegeLiterature of the Environmental CrisesSeminar
Erie, Pa.Contact: Institute for Community Development, Gannon College, Erie, Pa.16500
March 14-15American Gas Association and othersGATE-SwRI Energy Conservation Forum
San Antonio, Tex.Will consider conservation and ways ofprod ucing more energy. Write: JackWolfe, GATE Information Center, Southwest Research Institute, 8500 Culebra Rd.,San Antonio, Tex. 78284
March 14-16U.s. Bureau of Mines and liTR_rch InstituteThird Mineral Waste Utilization Symposium
Chicago, III.Registration accepted on an as·receivedbasis. For details: Murray A. Schwartz,Symposium Chairman, liT ResearchInstitute, lOW. 35 St., Chicago, 111.60616
March 16-20National Association of SecondaryMaterials Industries59th Annual Convention
Los Angeles, Calif.Theme "National Leadership for the Recycling Industries." Contact: NASMI,330 Madison Ave., New York, N.Y. 10017
The International Associationon Water Pollution Research Announces
THE 6THINTERNATIONAL CONFERENCE
ON WATER POLLUTION RESEARCHJERUSALEM, ISRAEL
JUNE 18-23, 1972
The Conference Technical Program will consist of ninety scientific paperschosen by panels of the leading international experts on the latest researchdevelopments in the field of water pollution control. In addition, there willbe thirteen Workshop Sessions which will be of interest to the widest possible range of practising engineers, administrators and research scientists.
The Conference program will feature:1. Problems of Developing Countries and Arid Zones2. Wastewater Re-use and Reclamation3. Low Cost Wastewater Treatment Systems4. Tertiary and Advanced Treatment Methods
Included as well will be sessions on water quality management; wastewater treatment; lake and river pollution; marine disposal and pollutioncontrol; industrial wastes; sludge handling and disposal; disinfection;control of pathogenic bacteria and viruses; odor and insect nuisance control;pond systems; analytical methods and monitoring techniques; automationand water quality criteria, and the administration and mana~ement ofwater pollutIOn control programs. Authors and titles of all scientlhc paperswill be announced at a later date.
March 20-24Ohio State UniversityMidwest Workshop in EnvironmentalScience
Columbus, OhioContact: John Lindamood, Dept. of FoodScience and Nutrition, Ohio State Uni·versity, Columbus, Ohio 43210
The International Water Quality ExhibitionThe International Water Quality Exhibition will be held in Jerusalem
at the conference hall. The Exhibition will cover the following subjects:Water and Wastewater Treatment Processes; Supplies and Chemicals;Water Quality Monitoring Equipment; Scientific and Laboratory Equipment; Technical and Scientific Books and Publications; Consulting Engineering Services; International and National Agencies.
General information concerning the Conference and Exhibition may beobtained from the Israel Host Committee, P.O.B. 16271, Tel-Aviv.
. .Title or Position.
PLEASE TYPE OR PRINT
. .First Name.Surname.
Address.
Business Affiliation.
Registration fee per person:
REGISTRATION FORMPlease return the Registration Form to the Organizing Committee, The6th International Conference on Water Pollution Research, P.O.B. 16271,Tel-Aviv, Israel
Before' AfterApril 1, 1971
Participants $50.- $60.-Accompanying persons $25.- $25.-
wish to attend the 6th International Conference on Water PollutionResearch and will be accompanied by persons. I enclose $ inpayment of registration fees. Please have checks or drafts payable to the6th International Conference on Water Pollution Research. The officialbank of the Conference is the Bank Leumi Ie-Israel B.M., Kikar MalcheiIsrael Branch, Tel-Aviv.
Date. Signature ...'Only registration forms accompanied by the registration fee of $50.postmarked before April 1, 1972 will benefit from the low pre-Conferenceregistration fee rate.
APPLICATION FOR HOTEL ACCOMMODATIONI require hotel accommodation in Jerusalem from until.at the following rates (please check grade)
Double occupancy Single occupancyLuxury-grade 16.80 to 18.70 23.10 to 29.70A-grade 8.75 to 9.75 12.75 to 13.75B-grade 6.60to 7.40 9.10to10.80
These prices are in U.S. dollars, are on bed and breakfast basis and include10% service charge.
March 26-28Environmenbl Mutagen Society1972 Meeting
Cherry Hill, N.J.Write: Warren Nichols, Program Committee Chairman, Environmental Muta·gen Society, Dept. of Cytogenetics,Institute for Medical Research, Copewood St., Camden, N.J. 08103
March 21-23Envlronmenbl Protection Agency andUniversity of HoustonNational Conference on Control ofHazardous Material Spills
Houston, Tex.Write: H. Nugent Myrick, Associate Professor of Civil and Environmental Engineering, University of Houston, 3801 Cui·len Blvd., Houston, Tex. 77004
April 10-12North Carolina State University andothersFourth Annual Air Pollution Workshop
Raleigh, N.C..Program presents current and futuregoals concerning research on the effectsof air pollution on vegetation and waysof communicating these goals betweenand among scientists and programplanners at governmental levels. Contact:William A. Feder, Suburban ExperimentStation, Univ. of Massachusetts-Wal·tham, 240 Beaver St., Waltham, Mass.02154
(continued on page 92)Circle ND. 1 II Readers' Sel"lice Carll
Volume 6, Number 1, January 1972 91
In the opinion of Bond Counsel, interest on the Bonds is exempt under existing laws from aU presentFederal income taxes (except for interest on any Bond for any period during which the Bond is
held by a person who is a substantial user of tht' project or a related person). A ruling to thateffect has been received from the Internal Revenue Service. In addition, in the opinion of
Bond Counsel, interest on the Bonds is exempt from taxation in the State of Alabanw.
MEETING GUIDE (continued)
NEW ISSUE December 6,1971
$8,500,000Courses
First Mortgage Air Pollution Control Revenue BondsSeries IP·A
International Paper Company
Pripric::ci~a,n~ffi~:~t~i~~:~ ~h~eT:~i~~Th~eFj~taWali~:;ll~a~t:f t~eo:rfe~ M~I~,~~6:~~,10/:i;h:r~fnal:~IT~~~heCompany, New York, N. Y. The Bonds will be coupon bonds in denomination of $5,000 registrable as to
principal only and fully registered Bonds in the denomination of $5,000 each or in multiples thereof, and maybe interchanged. The Bonds are subject to redemption prior to maturity as more
fully described in the Official Statement.
Payable solely from and secured by a pledge of rentals, revenues and other moneys derived from theProject, including amounts to be received pursuant to a lease with International Paper EnvironmentalProtection, Inc. The payment of all amounts due under the Lease and the performance of all otherobligations of International Paper Environmental Protection, Inc. thereunder have been unconditionally guaranteed by
March 4, 11, and 14California State CollegeStatistical and Probability Analysis ofHydrologic Systems Short Course
Los Angeles, Calif.Designed for engineers, hydrologists,and geophysicists. Contact: Office ofCommunity Services, California StateCollege, 5151 State College Drive, LosAngeles, Calif. 90032
February 22-24American Water Works AssociationEmergency Planning Short Course
San Mateo, Calif.Designed to enable water utility managersto plan for disasters and minimize damage and continue utility operations. Contact: Director of Education, AWWA, 2Park Avenue, New York, N.Y. 10016
January 24-25George Washington UniversitySolid Waste Management for Hospitals
Washington, D.C.Fee: $125. For details: J. E. Mansfield, Director of Continuing Engineering Educa·tion Program, The George WashingtonUniversity, Washington, D.C. 20006
Due: December 1, as shown belowDated: December 1, 1971
The Industrial Development Board of theCity of Mobile, Alabama
Interest IntereetAmount Maturity Rate Price Amount Maturity Rate PrIce
$310,000 1974 3'12% 100% $360,000 1978 4'12% 100%320,000 1975 3% 100 375,000 1979 4.70 100330,000 1976 4 100 390,000 1980 4.80 100345,000 1977 41f, 100 410,000 1981 4.90 100
$5,660,000
5.90% Term Bonds Due December 1, 1991
Price 100%(Accrued Interest to be added)
These Bonds are offered when, as and if issued, and subject to the approval of legality by Messrs.Bradley, Arant, Rose Ct White, Bond Counsel, Birmingham, Alabama, and the approval of
certain legal matters by Messrs. Sullivan Ct CromweU, New York, N. Y., counsel for theUnderwriters and for the Board by its counsel, Messrs. Holberg Ct Tully, M obUe, Alabama.
The offering of these Bonds is made only by means of the Official Statement, copiesof which may be obtained in any State only from such of the undersigned
as nwy lawfuUy offer these securities in such State.
March 6-7USDA Graduate SchoolPolicy Issue Seminar on the Quality ofthe Environment
Washington, D.C.Will discuss environmental degradationand Why it occurs or can occur in thefuture. Nominations due before Feb. 21.Fee: $95. Write: Dee W. Henderson, Suite265, National Press Bldg., 529 14th St.,N.W., Washington, D.C. 20004
March 7-9University of California ExtensionSan Francisco Bay-Delta Water QualityShort Course.
Berkeley, Calif.Fee: $125. Focuses on research, regulations, waste management practices, andcontrol policies for water quality enhancement. Contact: Continuing Ed ucation inEngineering, University of California Ex·tension, 2223 Fulton St., Berkeley, Calif.94720
Kidder, Peabody & Co.Incorporated
The First Boston Corporation Goldman, Sachs & Co. Lehman BrothersIncorporated
Harvard School of Public HealthEnvironmental Health Graduate Training
Boston, Mass.Opportunities for master's and doctoraldegrees in environmental health sciencesand engineering. Limited number of fellowships available for the 1972-73 year.Write: Dade W. Moeller, Associate Di·rector, Kresge Center for EnvironmentalHealth, Harvard School of Public Health,665 Huntington Ave., Boston, Mass. 02115
Circle No. 22 01 leders' Service Car'
92 Environmental Science & Technology

professional consulting services directory
DAMES & MOOREBoth lonl and short termpollution problems considered
t """'riaMand u.. dud;., pwlormed
With Offices in Principal Cities Throughout the World
Consulting Engineers in Applied Earth and Life Sciences
Air Pollution, Water PollutionSolid and Liquid Waste Disposal
Environmental Studies for Nuclear Power Plants
Two Pennsylvania Plaza, New York, New York 10001
MICROANALYSISTRACE ANAYSES
Halogens, Fluorine, Sulfur. Nitrogen,Phosphorus, Selenium, Tellurium,
Arsenic, Antimony
Amos Eddy, Ph.O.318 Royal OakNorman, Oklahoma(405) 321-3375.
Joseph l. Goldman, Ph.D.
~~~lt~~l~:srei" 762171
~uliln KiniskyAlberta, Canada(403) 454-8757
ELEMENTARY ANALYSESTotal Organic Carbon
METALSAtomic Absorption, Colorimetry,
ComplexometryLow Temperature Ashing
? PROBLEMS?SCHWARZKOPF Microanalytical Lab., Inc.
56-19 31th AvenueWoodside, New York 11317Tel: 212 HA 9-6248-6223
e co'1"'" ..odoling lor digi,o' ondanalog co..""""
r ._.... "udi•• d..igned, preporedond undertohn
m anag......' program' d."gned,cOIfIputef'-programmed and operated
ENVIRONMENTAL CONSULTANTS
&RYCKMANjEDGERLEYjTOMLINSON
and ASSOCIATES.' Consultin, Engineers Specializing in Water
Solids and Air Pollution Control12161 Lackland Road. St. Louis, Mo, 63141
Phon.: (314) 434-6960W<lshington, D.C.. Memphis, Tenn. _ D<lyton, OhioChic<lgo, Illinois. Bry<ln, Tex<ls .C<lsper, Wyoming
Northumberl<lnd, Engl<lnd
THE BEN HOLT CO.521 E. Green Sireet, Pasadena, Calif. 11101
ENVIRONMENTAL• IMPACT STATEMENTS.
• ENGINEERING.
~INDUSTRIAL POLLUTION TESTING LABORATORIES, Inc.
IPTL 2907 Parnell Ave.• Fort Wayne. tnd. 4680SjTelephone484-8723 (Area Code 219)• Water & wastewater effluent evaluation by atomic absorption spectropho
tometry. autoanalyzer systems & chemical analysis• All analyses performed by college trained personnel• Precision results at nominal fees• Shipping containers furnished at no charge• Discounting available for contractural agreements
Brochure & Fee Schedule available upon request
~ 5901 OLSON MEMORIAL HIGHWAY5-~ MINNEA'OLIS, MINNESOTA 55422
En... lronm.nl.' Svst.m.G•• Turbin. Pow., Pl.nt.
Th.rm.1 .nd Superpr••sur. Proc ...PI.nt Actl....tlon.PI.nt Impro m.nt
G•• Dvn.mlc••Mod.' T.sUn9STUDIES. DESIGN _ TESTING
Noise SurveysEquipmenl LeISingDesign & Consulting
WlStewater AnalysisPilot Plant StudiesTreatability Studies
C[EJo(~D@JallTz .NVIADNM.NTAL .HClIN••••, Ina.
......... C _ITI••,9.9 _ ....._ _~....._.__ ~a__ ~w..9•• ·w " .......... ·_·__w .......
1211 Stewart Ave., Bethpage, N.Y. 1171415161 938-6622
CATALYTIC, INC.Consultants. Engineers. Constructors
Environmental Systems Division1528 Walnut Street. Philadelphia. Pa. 19102
215-KI 5-7500
laboratory andProcess OeYek>pment
Industrial WasteWatElf Control
liquid andSolid Incineration
Air Pollution Control
In-plant Control andProcess Modifications
Desalination
HElL· POLLUTION SOLUTIONSOne source -one responsibility- that's HElL for completesystems of pollutIon control - ventilatmg systems, corrosionproof components, ducts and stacks, fume scrubbers, limngs,coatmgs, plastIC pIpe.
WE DESIGN· BUILD· INSTALL
HEll PROCESS EQUIPMENT CORPORATION12909 Elm ....ood 'wenye • Cleveland, OhIO 44111
ECOLOTROL, INC.
•
_. tbwart wboratoriell, fur.820 Tulip Avenue. Knoxville, Tennessee 37921
615-525-5811• ComplBtB Water Quality Analytical SBrvices
• Pre-operational Environmental Studies • StrBam Pollution SurveysSp"illii/I/ i" TrlKl M,/lIl1 A"lIly/il ifltilldi,,& Mtnllry lind "b" HliWJ M"",/
tJj NUSConsulting Engineers
• Air & Water Pollution Control• Environmental & Ecological Analyses• Meteorological Studies• Process Evaluation & Design• Complete Laboratory Services
NUS CORPORAYION4Research Place Rockville. Maryland
20850 (301) 948-7010
Spark Source Inorganic Mass SpectrometryUltra-Trace Analysis for all Elements
From Matrix to PPB LevelSolids - Liquids - Contaminants
Isotopic Ratios - Rare Earths
ACCU-LABS RESEARCH, INC.9170 W. 44th Ave" Wheat Ridge, Colli. B0033
(303) 423·2766
~'~'~1NLABORATORIES INC.
545 Commc:rcc: $t. 201·)37·4114Fr.nll:lin L.kn, N. J. 07417
• Ato.le Abtorptlo.. • Optlcel E"d..loft• (h••lcal • X.,., Spectro••try
An.lytic<ll Se:r... ice:s for the:En... ironme:nt<ll Enginur a Industry
Volume 6, Number 1, January 1972 93

professional consulting services di rectory
profe,,;ona' con,u"ant. onmeteorological instrumentration to
government, education,indudry, and 'he public
Selection of the proper equipmentdepends on survey objectives,
techniques of analysis,and funds available.
1§Al SCIENCE,~ ASSOCIATES, INC.
ENVIRONMENTAL IMPACT REPORTS
APPLIED RESEARCH ENGINEERING CONSULTING
DIFFUSION METEOROLOGY STACK TESTING
ANALYTICAL LABORATORIES
WATER ANALYSISMetals - Pesticides - T.O.C. - Etc.
Government approved procedures.Phone or wrilefor further information.
GALBRAITH LABORATORIES,lnc., aox4187Knoxville. Tenn. 37921. (615) 546-1335
The Research Corporation of New England210 Washington Street Hartford, Connecticut 06106
(203) 527·4101
~f:~~~' :Wi~:NDDff HNTBCONSULTING ENGINEERS
• City sod Regional Planning, Transportation Studies,Urbao ReQewal
- Highways, Bridges, Airports, Public Transit, Parking- Water Supply and Treatment, Sew.age Collection and
Treatment1805 Grand Ave.• Kansas City, Mo. 64108
Offices in Other Principal Cities
REYNOLDS, SMITH AND HILLS
ENG'l:".:;,,~. ~ION
environmental engineering, iM.Offer diversified services in Pollution Abate·ment, Resource Management and Environ·mental Consultation.
Problem Evaluation • Research andDevelopment • Planning • Reports •Design • Supervision • ProgramManagement
HOME OFFICE
Box 4850. Jacksonville. Florida 32201
CAMP DRESSER & McKEE
Environmental EngineeringOne Cent.r Plaza, Bolton, Mall. 02101
283 South Lake Ave., Paladena, Cal. 91101
ENVIRONMENTAL POLLUTIONCONTROL SERVICES
Galson~~~,~~~:.~~~~
214 S. Warren St., Syracuse, N.Y, 13202 ~T.., (315) 474-4231 ............
©[X]~~~©POLLUTION ABATEMENT ANDPROCESS SYSTEM ENGINEERS
FEASIBILITY STUDIES' TESTINGDESIGN' fABRICATION' CONSTRUCTION
CHEMECPROCESS SYSTEMS
DIV. MULTI-METAL WIRE CLOTH INC_505 ROUTE 303, TAPPAN, N_Y. 10983
(914) 359-3008
RATES PER MONTH6 12
Size months months1" X 1 col. $24.00 $23.001" X 2 col. 48.00 43.001" X 3 col. 69.00 62.002" X ] col. 48.00 43.002" X 2 coL 89.00 81.00
Your card may appear in every iSSue forone year, every issue for six months (consecutive issues), or every other issue forone year. Send your copy to Joseph P.Stenz8, ENVIRONMENTAL SCIENCE&. TECHNOLOGY. 142 East Ave.,Norwalk, Coun. 0685], or call him at203-853-4488,
USE THE CONSULTANTS'DIRECTORY
THE C. W. NOFSINGER COMPANYConsulting Engineers
SINCE 1950
Pollution Abatement ThroughProcess Modification
307 EAST 63 ST.. P.O. BOX 7239KANSAS CITY, MO. 64113
PHONE: (816)·363-1460
GENERAL TESTINGLABORATORIES, INC.
Chemical and Biological Testingfor Pollution Control
Lead, Mercury and other Metalsby Atomic Absorption
Water and Air Analyses- since 1930-
1517 Walnut StreetKansas City, Mo. 64108Phone - 816·471-1205
CALIFORNIA TOXICOLOGY SERVICE, Inc.
analytical services for the indu.trlal hYilenl,t&: environmental enaineer
biologic.' m.terl.1 ••ir •••ter ••011pcsticidcs-instccicidcs-mcrals-drugs-solvcnu-al.lr:aloids
2333 W. THIRD ST.. LOS ANGELES CAL. lIOO57(213) 387-1684
CIVIL & STRUCTURAL ENGINEERSLAND PLANNERS & SURVEYORSP.o. 80X 578 (813)-649-6141
NAPLES. rLORIDA 33941
"Services to Public Works and to Industries with Emphasis on Environmental Compatibility"
~ METCALF & EDDY I ENGINEERS
Pollution Control Studies and Systems DesignLiquid Wastes • Solid Wastes • Air Pollution • Environmental Planning
Statler Building, Boston, Mass. 02116 • New York • Palo Alto • Chicago
94 Environmental Science & Technology
professional consulting services directory
P.O. BOX 322ANN ARBOR, MICHIGAN 48107313-665-3477
ENVIRONMENTAL RESEARCH GROUP INC.
TESTING LABORATORYCOMPLETELY COMPUTERIZED NEUTRON ACTIVATION ANALYSIS
YORK RESEARCH CORP.• Air & Water Pollution Control
• Complete Analytical Laboratory• Source Testing & Stack Sampling
• Industrial Plant Investigations
• Noise Level Studies
Phone or write for our brochure
One Rn.arch DriveStamford, Connecticut 06904
(203) 325-1371
er
~Atomic AbsorptionMass SpectroscopyEmission SpectroscopyIR & UV SpectroscopyAnodic Stripping VoltammetryGas Chromatography
Pesticides & HerbicidesBiological StudiesTrace Element StudiesEnvironmental SamplingWater PollutionAir Pollution
in Planl & Slack Measurement.
FABRIC RESEARCH LABORATORIES, INC.Applied Research, Development and Testing
Woven and Nonwoven Filter Media
• Waite Water Treatment. Sewerage • Air Pollution Ind Solid Wlltes• Water Treatment. Supply • Landfills • Incineration• Industrial Waste Treatment, Recovery and Reuse • Valuations • Rates • Management
Main Office: 845 Fourth Avenue, Coraopolis, Pa. 15108 • Kingston, Pa. 18704 (300 Market St.)
AIR POLLUTION• MASS SPECTROMETRY
• GAS CHROMATOGRAPHYLLDB ·C:HEMICALANALYSES
YrIeAL"RVICE COMO.
47 I,'utrial ."\.~~:Lr'iPtl. N. J. t7IZ2
ENVIRONMENTALSERVICES I SYSTEMS• AMBIENT AIR MONITORING •.SITESURVEYS • METEOROLOGiCAL ANALYSES• COOLING TOWER EFFECTS• AGENCY LIAISON AND EXPERT WITNESSES• MONITORING AND DATA SYSTEMS
ENVIRONMENTAL SYSTEMS GROUP. P.O. BOX 3001BOULOER, COLORAOO 80303 • (303) 443·0384
• WOOD~~~~~~N, INC.All • 8111 • Sill PLUIIIIC ••,Uf( • 104$(
ASYSTEJlATIC IM.JtJHJlSClPUNE APfflOM:H TOEIMROMIENTAI.. IItII'ItCT REPORTS
MIOFlElDSUIMYSun1_stlm. ClirrOi. IN JlIlSCl 01011
eli/tOll. N.). Sao CiCIO, Calif. Atlaota, Ga. New York, N.Y.101 <f,HO+I 714 UHlSl 404 Zn-9S'41 211 ~766
ASubsidilfY «Woodw~'d·aydt COnsult~nff
....----N 0 IS E-----.Advanced Acoustical Research
Corporation1211 Stewart Ave., Bethpage, N.Y. 11714
(516) 938·6640
SpecillislS in Noise Ind Vibrltion Conlrol
I· water fonnecl
deposits I lorrosion,rHUlIslt~,D;n'.Clion;Opllcilll
Eml.~nSpe<:tog'''p''
ERNEST F. FULLAM. INC.P.O. BOX 444 • SCHENECTADY, N. 1.12301TEW'IlOHE 511-715-1533
water Iwaste water
~::~~.r~~~~e f lf~~~~~~~o~~~~~~a~t~~~Solid waste ~i~p.~sal-[IectricurilitiesResearch-Feaslblllly & rate !>tudies'yracu••. N.Y. Dov.r. Del. Charlotte. N.C.
.";luding.eQUi,I!·.....U.10, ..."", Co,psolEngfl.
DlScn:o'9I!I'e<m,ts
~ O'BAIEN&GEAE.:. ENGINEERS INC.
ALPHA METALS, INC.• ANALYTICAL DIVISION5& w... TER STREET. JERSEY CITY. H J.013Ool _ (2011 ~n.
ENVIRONMENTAL ENGINEERSAND PLANNERS
DESIGN. RESEARCH· STUDIES
FIBER AND FABRIC SELECTION SIMULATED PERFORMANCE TESTINGQUALITY CONTROL TESTING FAILURE ANALYSISPREPARATION OF SAMPLE FABRICS FUNCTIONAL FINISHES
1000 provb~~~Caem~i~~~:~ 02026 A~ RO;~?e~80~:d61~'~26~51~erChange
CROBAUGH LABORATORIESSINCE 1894
AIR AND WATER POLLUTIONSampling - Measurements
Analysis - Consulting
COMPLETE LABORATORY SERVICEChemistry-Metallurgy-Spectroscopy
Particle Size Analysis-Atomic AbsorptionInfrared-Chromatography-X·Ray Diffraction
216-881-73203800 Perkins Ave.
Cleveland, Ohio 44114
~THE
CHESTERe ENGINEERS
Ambient Systems Inc.AIR p,nltiol • WATER Polluti••• SEWAGE Trtatlle.t
elnsullinc .. EllIineerillCEquipmeot, Ins.trumc~),[alion. 5Y5fc,ros Dcsi~n. Spcci6cacions up tn &. mcludmg turn-key tnuallatlons; surveys&: sampling-airborne, ~mbicnt. industrial studics;maintenance & repair services.
P.O. Box 2}4 Ha(~~~~~~;:~~~son. N.~. 10706
116 N. CAROUSel ST. ANAHEIM. CAl. 92806
_ENVIRONMENTAL IMPACT STUDIES
-SITE SELECTION -SURVEYS
~~~~3E!..R..s_!!!!!ll~f!~~ TIL. 714/630 2930
FREEMAN LABORATORIES, INC.Chicago Specialists
AIR & WATER POLLUTION SERVICES• Complete stack and ambient air surveys• Monitoring instrumentation systems• Trace metal analyses, including Mercury• Characterization of particulates and powders• Water cooling techniques• Consultation1210 E",b... AWl., R.....1Il, III. 312/111-31$0
Environmentll Research & EngineeringWater end air pollution investigations. Thermaldischarge studies. Ecological surveys. InltTu~
ment8tion consulting.
e LlMNETICS. INC.6132 WISt Food .. I.oc An.
M_. Wi•. 53218. {4141 481-9500
E. S. PRESTON ASSOCIATES, Inc,BOWSER-MaRNERTESTING LABORATORIESAIR, WATER, NOISE ANALYSISCHEMICAL, SPECTROGRAPHIC
PRODUCT EVALUAliON
P.O. Box 51 Daylon, Ohio 45401513.253·8805
Transportation PlanningSolid Waste Disposal
Water & Sanitary
Engineering Design & StudiesComputer services
Mapping
939 Goodale. Columbus, Ohio 43212221-7505
Volume 6, Number I, January 1972 9S
CLASSIFIED SECTIONINDEX TO ADVERTISERS IN THIS ISSUE
IMPORTANT NonCE
CENTCOM, LTD.
York Research Corp.. . . . . . . . . . . . . . . . 95Thomas A, Blanchard Associates
9533
93
9494
93
93
9495
59393
95
89
42
94
E. S. Preston Associates, Inc .
Advertising management for theAmerican Chemical Society Publications
VWR ScientiGc......... . . . . . . . . . .. OBCWolff Associates, Inc.
Edward P. Blanchard. President. Thomas N. J.Koerwer, Executive Vice President. 142 East~~d~ui(h~853~~k48fonnecticut 06851 (Area
Denver 80203 . . • Robert H. Heidersbach,Bud Foster, Roy McDonald Assoc., Inc.,846 Lincoln Street (Area Code 303)825·3325
Houston 77006 ..• Frank N. Vickrey, Rich.ard Clothier, Roy McDonald Assoc., Inc.3130 Southwest Freeway, (Area Code713) 529·6711
Los Ange1t's 90045 . . . Clay S. Holden,CENTCOM, LTD., Airport Arcade Bldg.,8820 S. Sepulveda Blvd., Suite 215,(Area Code 213) 776-0552
Norwalk 06851 ... Anthony J. GiamancoCENTCOl\'f, LTD., 142 East Avenue,( Ares Code 203) 853·4488
ADVERTISING SALES MANAGERThomas N. J. Koerwer
Richard Terry &: Assoc.·EnvironmentalScience &: Services .
Teledyne Analytical Instruments .S. Michelson Advertising
Term, Inc•......................••TRC-The Research Corporation of
New England .Tri·County Engineering, Inc .
Western Precipitation Div., Joy Mfg.Co•....................•....•
Brown Clark Elkus & Moses, Inc.Woodward-Envicon, Inc.... . . . . . . . . . 95
Oakite Products, Inc•............•.. 35:93Marsteller Inc.
O'Brien &: Gere Engineers, Inc.. . . . . . . 95
SALES REPRESENTATIVES
Cbic~NI~~~1, 'LTD:, ~~J.?e~ort~· 1.~r~bl~~~Avenue, (Area Code 312) 641-0890
Dallas 75207 • • . Parker Harris, GeorgeThompson, Roy McDonald Assoc., 714Stemmons Tower \Vest, (Area Code 214)637.2444
Schwarzkopf Microanalytical Lab, Inc..Ray Hawley
Science Associates, Inc .Sierra Research Corp•...............
B. P. Myer Associates, Inc.Special Reports, Inc .SpectroChem Laboratories, Inc .Stewart Laboratories, Inc .
RE~it t':k~oX~~:rti'si~g .Research Appliance Company .
W. F. Minnick &: AssociatesReynolds. Sm ith and Hills .
W. R. Hollingsworth &: AssociatesRyckman, Edgerley, Tomlinson &: Asso-
ciates, Inc .
9494949S
95
96
9385
9593959S
91
9492
938
41
9S
88
93
9394
9310
954
96
94
95
95
82
93
19
34
14
949493
87
12
93
9595
95
Galbraith Laboratories1 Inc .Galson Technical Services, Inc .General Testing Laboratories, Inc .Gollob Analytical Service .
Raymond/Nicholas Advertising
Fabric Research Laboratories, Inc .FluiDyne Engineering Corporation .Freeman Laboratories. Inc .Ernest F. Fullam, Inc .
CaiJe~~h~~:M:~t:od'&'G~~~e' i~~.· ....California Toxicology Service, Inc•....
g:~fyt?c::esls:~..~ .~~~~~: : : : : : : : : : : : :Arndt, Preston. Chapin, Lamb &: Keen,
Inc.Chemec Process Systems, Div. Multi.
Metal Wire Cloth, Inc•..........Advertising Design Associates
The Chester Engineers .
Cr~a~i~tlab~~atorie5 .
Mach Chemical Co .
He1r~~~e~sa~::?p;~·~tIC~rporation .Ashby Associates, Inc.
The Ben Holt Company.......•.....Howard Needles, Tammon &: Bergendoff
Industrial Pollution Testing Laborato·ries .
Intemational Biophysics Corporation ..Harold J. Sullivan &: Associates
International Conference on Water Pol-lution Research .
Dames At Moore .Dohnnann Div., Envirotech Corp .
Bonfield Associates
Kem.Tech Laboratories, Inc .Kidder Peabody At Co., Inc.....•...
Doremus &: Company
Johns-Manville Corp.......•...••....Rumrill-Hoyt, Inc.
Limnetics, Inc .
Lo~~be~;;dt~~~yment Service, Inc•...
Ecolotrol Environmental Laboratory ...Ehrenreich Photo·Optical Ind•........
En~~~=e~~ai~:~'a~~'Corporation ...Jack Wenger Advertisin~. Inc.
Environmental Research Group Inc....
Barnes Engineering Co•. .............Albert A. Kohler Company, Inc.
Becbnan Instruments, Inc•...........N. W. AyerlJorgensen/MacDonald,
Inc.Beclanan Instruments, Inc., Cedar Grove"
Operations .
Th;eB~;3~u~~ovr~W~~~p::~~ss Instru.ments Div .
D-Arcy-MacManus-Intennarco, Inc.Beb: Environmental Engineen, Inc.....
Betz Laboratories, Inc.Biospherics, Inc•...................
PaUace IncorporationBowser.Momer Testing Laboratories,
Inc•....................•.....Brandt Associates Inc .Burns At McDonnell Engineering Com.
pany .
GROWTH POSITIONSENVIRONMENTAL SYSTEMS
$12,000-$25,000ENGINEERING-RESEARCH-MANAGEMENT
MARKETING-MANUFACTURING APPLICATIONFees company paid. Include prescnt salary, minimum salary requirement and location flexibility with resume.Environmeotal SystC'ms Diy., Longberry Employment Set",icc, (nc., 650 Niks Bank Bldg., Niles, Ohio #446.
PROFESSIONAL ENGINEERENVIRONMENTAL CONTROL
Excellent opportunity for responsibility Bodadvancement in growlOg consulting firm. Perform studies in pollution control primarily onsLeam power plants. Need process analysis orgas cleaning experience with BSChemE. Attractive benefits and compeosation.
BURNS & McOONNELL ENGINEERING CO.4600 E. 63rd S~., Kansas City, Mo. 64141
Various state law. 4q.un1lf: dilcriminatloD aDdthe rederal CivU Riqbtl: Act of 1964 prohibitdilcriminatiOD in employment becauH of ..xunle.. ba.ed on a bonafide occupationalqualification. Help wanted and aituation.wanted ad••rtiHmenb on theM page. ate forreaden' convenience and are not to be con.trued as in.truments leading 10 unlawfuldacriminatioD.
Rate based on number of insertions usedwithin 12 months (rom date of first ineertion and not on the number of inchesused. Space in classified advertisingcannot be combined for frequency withROP advertising. Classified advertisingaccepted in inch multiples only.
CLASSIFIEDADVERTISING
RATES
POSITIONS OPEN
To ensure a high return on your ad,we recommend:
Be specific-describe the job qualifications as completely as you can.2. Sign your company name.3. Answer all inquiries from applicants
---pmprrHUNTING?
Unit l-T I-T 6-T 12-T 24-T
1 inch 541 546 545 544 542
(Check Classified Advertising Department~~r....)ates if advertisement is larger than
McMillan Electronics Corp .Ray Cooley and Associates, Inc.
Meloy Laboratories, Inc .Geardi Associates. Inc.
Metcalf &: Eddy Engineers .Milton Roy Company ............•..
Tech Communicators, Inc.
4
IBC
94IFC
Great Britain and Western Europe ... Brayton Nichols, The American MagazineGroup, 27 Maddox Street. London, 'V. I,England, Telephone-499-0180
Japan ... Sumio Oka. International MediaRepresentativt's, Ltd., 1, Shibe·Koto·hiracho, Minatoku, Tokyo
SHIPPING INSTRUCTIONS: SendsUmsl.erisl to Environ,..ntll Science & Technoloer, Clmilied Advertilinc DeplrlJlenl,142 ull Ave., Norwllk, Conn. 16151
The C. W. Nofsinger Company .Nupro Company .
Falls Advertising CompanyNUS Corporation .
Compton Jones Associates, Inc.
9419
93 PRODUCTION DIRECTORJoseph P. Stenza
96 Em,jronmental Science & Technology
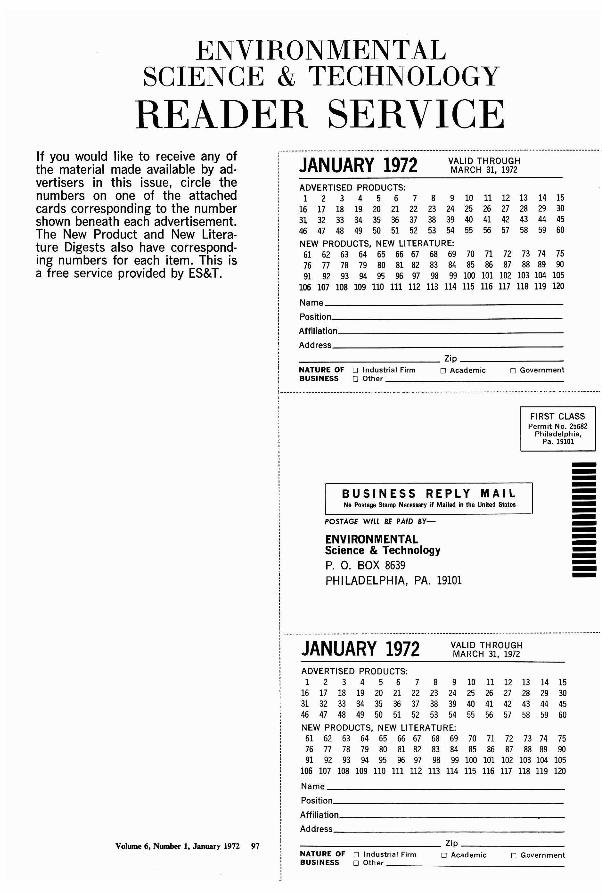
ENVIRONMENTALSCIENCE & TECHNOLOGY
READER SERVICE
ADVERTISED PRODUCTS:1 2 3 4 5 6 7 8 9 10 11 12 13 14 15
W U U ~ w n ~ n ~ ~ ~ V ~ ~ ~
n ~ D ~ § ~ ~ ~ B ~ U ~ ~ « ~
% ~ U 6 W g ~ ~ ~ ~ ~ ~ ~ ~ WNEW PRODUCTS, NEW LITERATURE:61 62 63 64 65 66 67 68 69 70 71 72 73 74 7576 77 78 79 80 81 82 83 84 85 86 87 88 89 9091 92 93 94 95 96 97 98 99 100 101 102 103 104 105
106 107 108 109 110 III 112 113 114 115 116 117 118 119 120
If you would like to receive any ofthe material made available by advertisers in this issue, circle thenumbers on one of the attachedcards corresponding to the numbershown beneath each advertisement.The New Product and New Literature Digests also have corresponding numbers for each item. This isa free service provided by ES&T.
JANUARY 1972 VALID THROUGHMARCH 31, 1972
Name _
Positionl _
Affiliation _
Address _
o Governmento Industrial Firmo Other _
NATURE OFBUSINESS
___________ Zip _
o Academic
POSTAGE Will BE PAID BY-
No Postage Stamp Necessary If Mailed in the United States
ENVIRONMENTALScience & TechnologyP. O. BOX 8639PHILADELPHIA, PA. 19101
I····················· ···········································:~i~J~
BUSINESS REPLY MAIL ==------------i --..--.-.- --------- --------.- -----.- ..- -----.iii::: JAN UARY 1972 V~}~~~H3~,O~9~~
ADVERTISED PRODUCTS:1 2 3 4 5 6 7 8 9 10 11 12 13 14 15
W U U ~ w n ~ n ~ ~ ~ V ~ ~ ~
n ~ D ~ § ~ ~ ~ B ~ U ~ ~ «~
% ~ U 6 W g ~ ~ ~ ~ ~ ~ ~ ~ WNEW PRODUCTS, NEW LITERATURE:61 62 63 64 65, 66 67 68 69 70 71 72 73 74 7576 77 78 79 80 81 82 83 84 85 86 87 88 89 9091 92 93 94 95 96 97 98 99 100 101 102 103 104 105
106 107 108 109 110 III 112 113 114 115 116 117 118 119 120Name _
Positionl _
Affiliation _
Address _
o GovernmentNATURE OF 0 Industrial FirmBUSINESS 0 Other _
___________ Zip _
o AcademicVolume 6, Number I, January 1972 97
ENVIRONMENTALSCIENCE & TECHNOLOGY
READER SERVICE
BUSINESS REPLY MAILNo Poatage Stamp NeeelSlr)' If Mailed In the United States
POSTAGE WILL BE PAID BY-
ENVIRONMENTALScience & TechnologyP. O. BOX 8639PHILADELPHIA, PA. 19101
FIRST CLASSPermit No. 25682
Philadelphia,Po. 19101
------------------
If you would like to receive any ofthe material made available by advertisers in this issue, circle thenumbers on one of the attachedcards corresponding to the numbershown beneath each advertisement.The New Product and New literature Digests also have corresponding numbers for each item. This isa free service provided by ES&T.
JANUARY 1972 VALID THROUGHMARCH 31, 1972
ADVERTISED PRODUCTS:1 2 3 4 5 6 8 9 10 11 12 13 14 15
16 17 18 19 20 21 22 23 24 25 26 27 28 29 3031 32 33 34 35 36 37 38 39 40 41 42 43 44 4546 47 48 49 50 51 52 53 54 55 56 57 58 59 60
NEW PRODUCTS, NEW LITERATURE:61 62 63 64 65 66 67 68 69 70 71 72 73 74 7576 77 78 79 80 81 82 83 84 85 86 87 88 89 9091 92 93 94 95 96 97 98 99 100 101 102 103 104 105
106 107 108 109 110 111 112 113 114 115 116 117 118 119 120Name _
Position _
Affiliation _
Address _
o GovernmentNATURE OF 0 Industrial FirmBUSINESS 0 Other _
___________ Zip _
o Academic
FIRST CLASSPermit No. 25682
Philadelphia,Po. 19101
BUSINESS REPLY MAILNo Postage Stamp Net68llr)' if Mailed in tlKl United States
POSTAGE WILL BE PAID 8Y-
ENVIRONMENTALScience & TechnologyP. O. BOX 8639PHILADELPHIA, PA. 19101
------------------98 EnYironmenllll Science & Technology
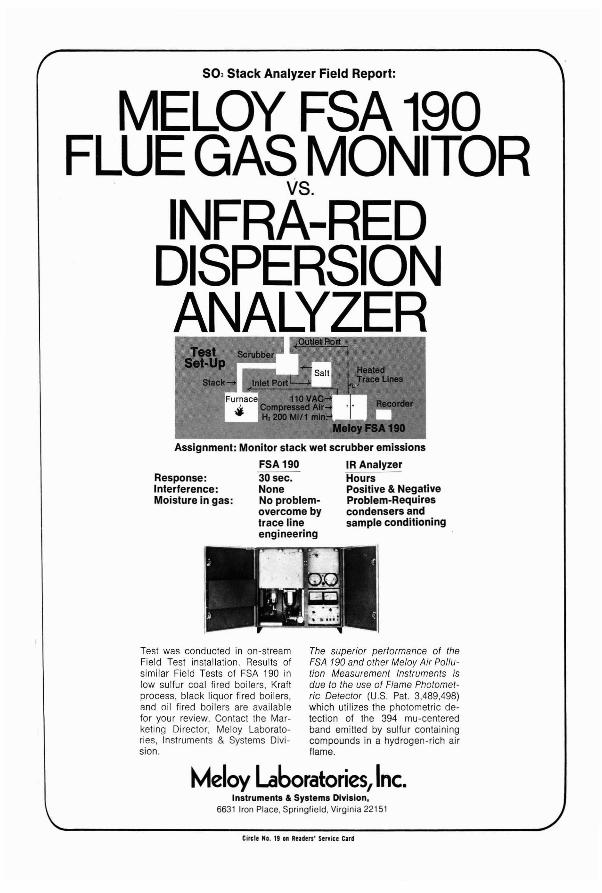
SO, Stack Analyzer Field Report:
MELOY FSA 190FLUE GAS MONITOR
vs.
INFRA-REDDISPERSIONANALYZER
Assignment: Monitor stack wet scrubber emissions
Response:Interference:Moisture in gas:
FSA 19030 sec.NoneNo problemovercome bytrace lineengineering
IR AnalyzerHoursPositive & NegativeProblem-Requirescondensers andsample conditioning
·.1'"TJiiiii
IL...i~ ..1_
~ I .. ._.-,-. ..
Test was conducted in on-streamField Test installation. Results ofsimilar Field Tests of FSA 190 inlow sulfur coal fired boilers, Kraftprocess, black liquor fired boilers,and oil fired boilers are availablefor your review. Contact the Marketing Director, Meloy Laboratories, Instruments & Systems Division.
The superior performance of theFSA 190 and other Meloy Air Pollution Measurement Instruments isdue to the use of Flame Photometric Detector (U.S. Pat. 3,489,498)which utilizes the photometric detection of the 394 mu-centeredband emitted by sulfur containingcompounds in a hydrogen-rich airflame.
Meloy Laboratories/Inc.Instruments & Systems Division,
6631 Iron Place, Springfield, Virginia 22151
Circle No. 19 on Ruden' Service Card
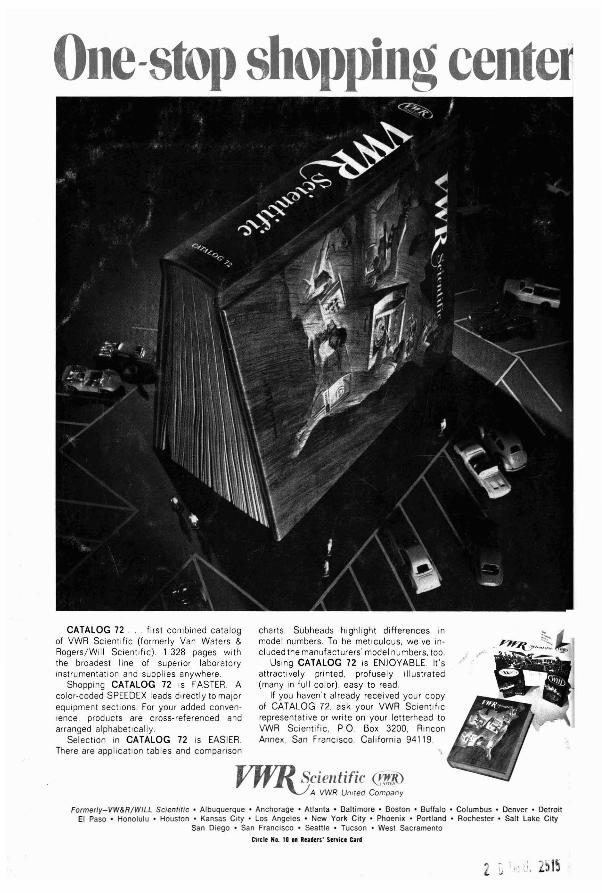
One-stop shopping center
charts Subheads highlight differences Inmodel numbers. To be meticulous, we've included the manufacturers' model numbers, too.
USing CATALOG 72 is ENJOYABLE. It'sattractively printed, profusely illustrated(many in full color), easy to read.
If you haven't already received your copyof CATALOG 72, ask your VWR Scientificrepresentative or write on your letterhead toVWR Scientific, P.O. Box 3200, RinconAnnex, San Francisco, California 94119.
I7WD Scientific (J1il{)~ y y ~V A VWR United Company
Formerly-VW&R/WILL Scientilic • Albuquerque' Anchorage' Atlanta' Baltimore' Boston' Buffalo' Columbus· Denver· DetroitEI Paso • Honolulu • Houston • Kansas City' Los Angeles' New York City' Phoenix • Portland • Rochester' Salt Lake City
San Diego • San Francisco • Seattle· Tucson • West SacramentoCircle No. 10 'I Rtilders' Senite Card
CATALOG 72. . first combined catalogof VWR Scientific (formerly Van Waters &Rogers/Will Scientific) 1.328 pages withthe broadest line of superior laboratoryInstrumentation and supplies anywhere.
Shopping CATALOG 72 is FASTER. Acolor-coded SPEEDEX leads directly to majorequipment sections For your added convenIence. produc'ts are cross-referenced andarranged alphabetically
Selection in CATALOG 72 is EASIER.There are application tables and comparison