Environmental Engineer & Scientist Vol.50 N.01 Winter2014 - 100 years of activated sludge
52
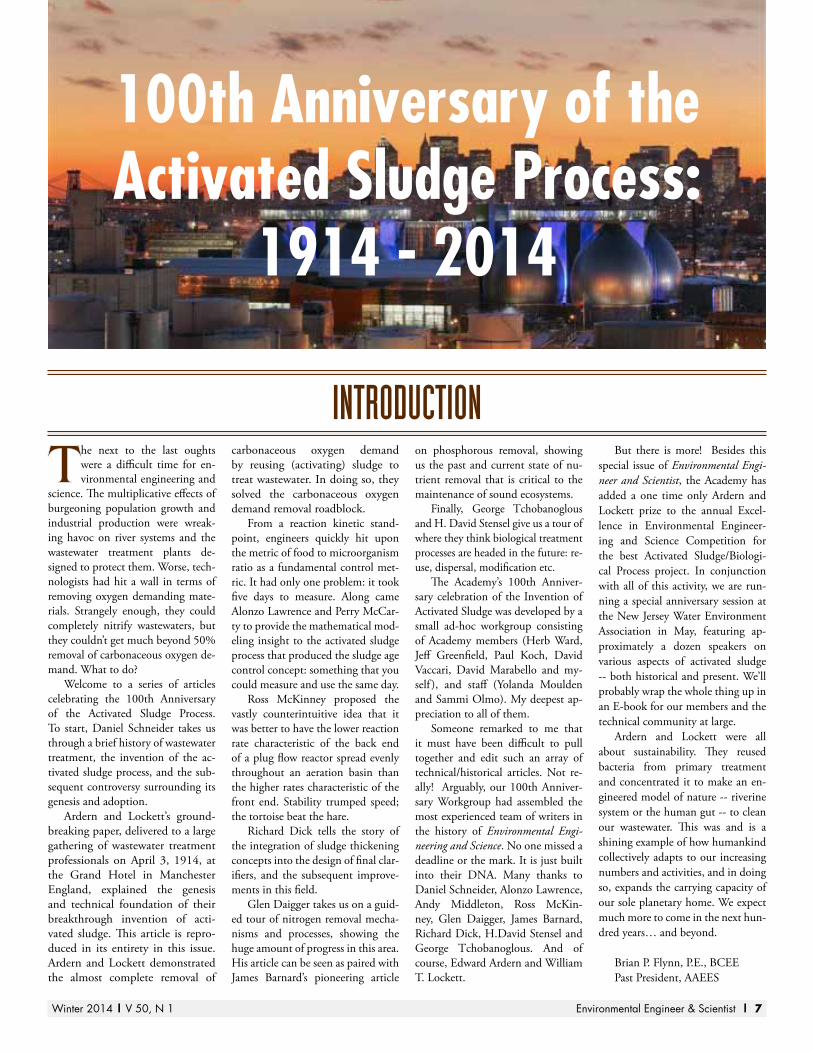
ENVIRONMENTAL E N G I N E E R & S C I E N T I S T Volume 50, Number 1 Winter 2014 AMERICAN ACADEMY OF ENVIRONMENTAL ENGINEERS AND SCIENTISTS SPECIAL ISSUE 100th Anniversary of the Activated Sludge Process: 1914 - 2014
Transcript of Environmental Engineer & Scientist Vol.50 N.01 Winter2014 - 100 years of activated sludge

ENVIRONMENTALE N G I N E E R & S C I E N T I S T
Volume 50, Number 1Winter 2014
AmericAn AcAdemy of environmentAl engineers And scientists
sPeciAl issUe
100th Anniversary of the
Activated Sludge Process:
1914 - 2014

The W. Wesley Eckenfelder Memorial Fund
A man whose passion for his field was part of everything he did, W. Wesley Eckenfelder, Jr.,was a pioneer in the field of wastewater treatment and an authority in industrial waste-water management.
Dubbed the “Godfather” of industrial wastewater management by colleagues and students, Wes’ career began in 1952 when he joined the civil engineering department at Manhattan College. His teaching career spanned more than 30 years and included positions at the University of Texas at Austin and Vanderbuilt University. He was also the founder of several environmental engineering firms, received numerous awards from professional societies, and authored more than 30 books.
His contributions to industrial waste management included the development and application of activated sludge technology. In his honor, AAEES created the new category of Industrial Waste Management as part of the Excellence in Environmental Engineering and Science Competition.
To keep his name alive and his work a part of the field for many years to come, Wes’ many students, colleagues, and friends have honored him by establishing the W. Wesley Eckenfelder Memorial Fund. Wes was involved in many aspects of environmental engineering and industrial waste management, and the Fund sponsors or co-sponsors several awards.
AwardsSPONSORED OR CO-SPONSORED by THE W. WESLEY ECKENFELDER MEMORIAL FUND
The W. Wesley Eckenfelder Outstanding Graduate Research AwardAn award co-sponsored annually by HDR. The student recipient, selected by a joint committee of AEESP and AAEES, will receive a plaque, a $1,500 award, and a stipend to attend the AAEES E3 Awards Luncheon & Conference. The supporting professor will receive a plaque and recognition.
The W. Wesley Eckenfelder Industrial Waste Management MedalAn award co-sponsored by Veolia Water Solutions & Technologies. Awarded annually to the Industrial Waste Management Grand Prize winner of the AAEES Excellence in Environmental Engineering and Science Awards Competition.
The W. Wesley Eckenfelder Distinguished Leadership Award Awarded with the cooperation of the WEF Industrial Waste Committee. This award will be given annually, and the Lecture presented in odd numbered years at the biennial WEF Industrial Wastewater Seminar Opening Ceremony, and in even-numbered years at a venue to be determined.
The W. Wesley Eckefelder University LecturesOccasional lectures offered upon request from Universities. Refinery Water Engineering & Associates (RWE) is the coordinator for the delivery of the Lecture Series to select University locations. For information on SPONSOR-SHIP PROGRAMS: please contact David Kujawski at: [email protected].
Donate now at http://www.EESFoundation.org
Contributions are held in a restricted account by the Environmental Engineering and Science Foundation, a 501(c)3 institution. All donations are tax deductible as charitable contributions.

Quarterly Periodical of The American Academy of Environmental Engineers and Scientists®
OfficersChristian Davies-Venn ............................................................. PresidentJames F. Stahl .................................................................. President-ElectHoward B. LaFever .......................................................... Vice PresidentDaniel B. Oerther .................................................................... TreasurerPasquale S. Canzano .......................................................... Past PresidentBurk Kalweit .............................................. Executive Director/Secretary
TrusteesMerlyn L. Hough ....................................................................A&WMARoland Benson Pair ......................................................................AIChERobert C. Williams ...................................................................... APHALamont “Bud” W. Curtis ..............................................................APWAKyle Edward Schilling ...................................................................ASCEKauser Jahan ................................................................................. ASEERichard S. Magee ......................................................................... ASMESteven J. Quail ............................................................................AWWAJames R. Mihelcic ........................................................................ AEESPDan Wittliff ..................................................................................NSPERobert J. Schoenberger ..............................................................SWANAJeanette A. Brown ........................................................................... WEFKristin Morico ..................................................... Trustee-at-Large 2014C. Hunter Nolen .................................................. Trustee-at-Large 2014Michael C. Kavanaugh ......................................... Trustee-at-Large 2015James W. Patterson ............................................... Trustee-at-Large 2015Sandra L. Tripp .................................................... Trustee-at-Large 2016Wendy A. Wert .................................................... Trustee-at-Large 2016
Sponsoring OrganizationsAir & Waste Management AssociationAmerican Institute of Chemical EngineersAmerican Public Health AssociationAmerican Public Works AssociationAmerican Society for Engineering EducationAmerican Society of Civil EngineersAmerican Society of Mechanical EngineersAmerican Water Works AssociationAssociation of Environmental Engineering and Science ProfessorsNational Society of Professional EngineersSolid Waste Association of North AmericaWater Environment Federation
Affiliate OrganizationsNAEM The Premier Association for EHS ManagementNational Environmental Health Association (NEHA)National Association of Clean Water Agencies (NACWA)USA Chapter of the Inter-American Association of Sanitary & Environmental Engineering (USAIDIS)
Editorial StaffC. Herb Ward, Ph.D.Editor, Applied Research & Practice
Yolanda Y. MouldenEditor, News, Currents Events & Careers
J. Sammi OlmoContent Editor, News, Current Events & Careers
Advertising, Production, and DesignYolanda Moulden
Environmental Engineer and Scientist is published quarterly by the American Academy of Environmental Engineers and Scientists®. Address all communications on editorial, business and other matters to:
Editor-in-Chief, Environmental Engineer and Scientist®
American Academy of Environmental Engineers and Scientists®147 Old Solomons Island Road, Suite 303
Annapolis, Maryland 21401410-266-3311
The American Academy of Environmental Engineers and Scientists name and logo and Environmental Engineer and Scientist are registered trademarks of the American Academy of Environmental Engineers and Scientists, Inc.
© Copyright 2014American Academy of Environmental Engineers and Scientists® Except for the Applied Research and Practice Section papers in which the authors retain copyright but grant AAEES the right and license to be the first publisher with ongoing world-wide license to reproduce the paper in print form and online.
ContentS100th Anniversary of the Activated Sludge Process: Introduction .................7Brian Flynn, P.E., BCEE
Who Invented Activated Sludge? .............................................................8Daniel W. Schneider
Experiments on the Oxidation of Sewage Without the Aid of Filters ............12Edward Ardern, M.Sc., and William T. Lockett, M.Sc.
The Sludge Age Concept and the Activated Sludge Process: A 45 Year Retrospective Commentary ....................................................28Alonzo W. Lawrence, Ph.D., P.E., BCEE, and Andrew C. Middleton, Ph.D., P.Eng., BCEE
Complete Mixing Activated Sludge .........................................................33Ross E. McKinney
Solids Separation in the Activated Sludge Process - the First 100 Years .......36Richard I. Dick, Ph.D., P.E., BCEE
Designing Activated Sludge Systems for Nitrogen Removal........................40Glen T. Daigger, Ph.D., P.E., BCEE, NAE
Phosphorus Removal in the Activated Sludge Process ................................44James L. Barnard, Ph.D., BCEE, WEF Fellow, IWA Senior Fellow, Dist. MASCE
The Future of Activated Sludge ...............................................................47George Tchobanoglous, Ph.D., P.E., BCEE, NAE, and H. David Stensel, Ph.D., P.E., BCEE
DePARtMentSPresident’s Page .....................................................................................4Christian Davies-Venn, Ph.D., P.E., BCEE
Executive Director’s Page ........................................................................5Burk Kalweit
Member News .....................................................................................50
Cover Photo: Hazen and Sawyer, 2014 Excellence in Environmental Engineering and Science Competition Honor Award Winner in Design for the project, Newtown Creek Wastewater Treatment Plant Secondary Treatment Upgrade.
Volume 50, Number 1 Winter 2014
ENVIRONMENTALE N G I N E E R & S C I E N T I S T
ISSN 2325-842X

4 | Environmental Engineer & Scientist Winter 2014 | V 50, N 1
PReSiDent’S PAge Christian Davies-Venn, Ph.D., P.e., BCee
new BeginningSI am honored and humbled by this privilege to serve as the president of
the American Academy of Environmental Engineers and Scientists. First, I want to thank the recent past presidents of the Academy, Michael Sel-
na and Pasquale Canzano, for their great service to and leadership of the Academy. The Academy just went through two recent transitions: last fall the Academy moved into a new office suite in Annapolis, Maryland; and in December we were pleased to welcome our new Executive Director, Burk Kalweit. I thank all those who worked tirelessly to ensure that these transi-tions went smoothly.
In my remarks following my inauguration as President at our fall Board of Trustees (BOT) meeting in Wilmington, Delaware, I noted that one of my main areas of focus will be to energize our membership which has remained flat or slightly retracted recently. To address this concern, the Membership Development and Outreach Committee, under the leadership of Bob Wil-liams, has launched an aggressive membership recruitment campaign. This includes referrals of new applicants by AAEES members; letters to colleagues, professors and state representatives; calls to principals of consulting firms and ranking agency officials encouraging referrals; brochure of testimonials and member savvy advertisement promoting the value and benefits of AAEES certification; and PowerPoint presentation for use by professors to promote benefits of licensure and certification. Thanks to the efforts of Hunter Nolen and Dick Pope and inputs from the BOT, a value proposition was developed that serves as a practical tool for effectively communicating the Academy’s values to our sponsors, agency leaders, members, and potential members.
We realize that the success of this membership campaign depends on the collective efforts and active involvement and participation of all AAEES members. Each of us can participate through: promoting the value of certi-fication to eligible friends and colleagues; personal contacts and encourage-ment of young professionals; sponsoring, coordinating, or participating in a technical conference, webinar, workshop, or symposium; and participating in the various programs and activities offered by the Academy. Please visit the Academy’s website at www.aaees.org for more details.
As part of our strategic planning efforts, we are exploring expanding our membership program and activities internationally to take advantage of the potential opportunities in this area. We have initiated a pilot program with India which we hope would be expanded to attract well-qualified en-vironmental professionals in other countries who value certification in en-vironmental engineering and science. This will bring greater prestige to the
Academy and serve the expanding need for certified engineers and scientists in a global economy.
I plan to devote my efforts, in concert with the Board of Trustees, towards communicating the advantages of specialty certification and Academy affili-ation with consulting firms, public agencies, industries and universities as we respond to the changing environmental marketplace while keeping our vision and priorities in focus.
Another area of focus that is of priority to me is enhancing diversity with-in the Academy. Through our Diversity Work Group, we are reaching out to various engineering and science organizations and societies to promote the benefits of AAEES board certification with the goal of broadening the diver-sity of our membership to include a wide range of nationalities, ethnicities, and minorities, as well as gender and age diverse groups.
The Academy continues to strengthen and expand its Student Chapters by providing assistance, mentoring, and recognizing student achievements. Thanks to the efforts of Dan Oerther and others, we have strengthened our partnership with the Association of Environmental Engineering and Science Professors (AEESP) which puts us in an excellent position to more effec-tively serve our student body through student development initiatives and by encouraging them to become life-long learners and guiding them through licensure and certification. The Academy continues its important role of improving environmental engineering and science education through its participation with the Accreditation Board for Engineering and Technology (ABET). The Education Committee is being re-named and re-structured to better reflect the Academy’s responsibilities to ABET.
I am grateful to our dedicated staff, our volunteers who serve on vari-ous committees, and to our State Representatives who act as liaisons to our membership. I have had the opportunity to discuss these challenges and op-portunities with many of you as well as other stake holders and based on these discussions, I am encouraged and optimistic about the future of our profession. I look forward, with your help and support, to a productive year as we strive to advance the mission and vision of the Academy and elevate the profile of the environmental profession. I wish to encourage and chal-lenge those members who have not been actively involved in the Academy to consider doing so. Please feel free to let me or the staff know if you have any ideas, concerns, or wish to volunteer or contribute in any way to the success of the Academy.
“through our Diversity work group, we are reaching out to various engineering and science organizations and societies to promote the benefits of AAeeS board certification with the goal of broadening the diversity of our membership to
include a wide range of nationalities, ethnicities, and minorities, as well as gender and age diverse groups.”

Winter 2014 | V 50, N 1 Environmental Engineer & Scientist | 5
exeCutiVe DiReCtoR’S PAge Burk Kalweit
Do you Know who theSe PeoPle ARe? One of the things that is most interesting about organizations like the
American Academy for Environmental Engineers and Scientists is that you never know what surprises are just around the corner. A
couple of weeks ago, someone left me a voicemail that was very faint and somewhat scratchy and hard to hear. Given the press of other things to worry about, I figured I would just let it go. After all, if it was really important whoever it was would call back and, hopefully, I would be around to take their call. As luck would have it, the person did call back. Unfortunately, the quality of the second call was a little worse than the first one.
However, I did manage to catch a phone number at the very end and I made a return call. This, of course, ended up being just a voice mailbox to which I left a message with my name and number asking for a call back and apologizing for the length of time that had passed before I had gotten back to them. I also suggested that they send me an email with some background so I could do a double check on what the intent of the call was.
The next morning, I found a note in my inbox asking if we could arrange a phone call with the person who had called and some friends of hers. That’s when it began to come together. The part of the message that I could not clearly make out before referred to the desire of the caller to set up a student chapter for the Academy at a local university. She was wondering what kind of program we had to offer and how she and her group of friends could be-gin to participate with us to exchanging information that would satisfy their interest in environmental engineering and science. Rather than send her the standard list of the topical areas in which the Academy offers certification, I thought I would turn the tables. I asked that the group send me a list of the things that they were interested in so that I might be able to compare it to what we cover as recognized areas of specialty within the field.
Here is the list that I got back from the student group: Ü Environmental Chemistry Ü Environmental Policy (EPA) Ü Water Management Ü Renewable/Sustainable Energy (economic policy) & Utility companies
Ü Public health Ü Remediation Ü Consulting Ü Disaster Management
I was pleasantly surprised by the interesting mix of topics and areas of specialization that appeared on the list. What struck me was the range of the listed items. It goes across the spectrum from social science and policy determination all the way over to hard science and technology development.
Which got me to thinking; is this group representative of how college stu-dents in general think these days? If so, we may be beginning to see a sig-nificant change in how we practice environmental engineering and science appearing on the horizon. This was something that I wanted to probe into a bit so I was eager to arrange the phone call with the group.
And that was my next pleasant surprise. When I got on the phone with the young lady who initially called, Carrie, she spoke of her club and how she had assembled, at the suggestion of one of her faculty members, a group of fellow students who were interested in environmental engineering and sci-ences as a career choice. Or put another way, they were interested in pursuing a career that enables them to do something that would have a positive impact on the environment. I had assumed that this meant that Carrie and perhaps three or four of her friends had gotten together and decided to initiate the club. I was wrong. The club as she defined it actually consisted of 15 to 20 students with active discussions with another 10 to 15 who are interested in finding out more about what the chapter did and how it might relate to their specific interests. There clearly was something going on there.
In the phone call, I asked about why people were interested in the en-vironmental engineering and sciences area. I got a variety of answers. Some were predictable -- students who are interested in the technology, people who had what we might characterize as hard-core environmentalist type concerns, and people who just wanted to get more familiar with environmental issues and what might be done to address them.
But there was a second thread of responses to that question and the an-swers there were far more intriguing. Several of the people on the call men-tioned their concern about climate change and global warming and the fact that they would like to be part of a solution to that problem. Others men-tioned a desire to find out more about sustainability concerns and how the earth could support another 2 billion or more people who were projected to be added to the world’s population in the next 25 years. There were also men-tions of the fact that environmental engineering and science is closely related
“i suddenly realized that listening to the students was not unlike listening to the impassioned speeches of rock stars or country music stars when they are doing a charity event. none of them claims to have all the answers. instead, the
musicians make it clear that they are doing this event because it is the best way they are able to have an impact.”

6 | Environmental Engineer & Scientist Winter 2014 | V 50, N 1
to developmental issues in the Third World. Others mentioned the need for all of us to get more concerned about our stewardship of increasingly scarce resources of all kinds.
This group more or less summarized their collective intent by stating that they were attracted to the field because it offered them a chance to make a dif-ference in how we treat the world and its people. They also mentioned their desire to help people -- not just in the United States, but around the world -- to live better, safer, healthier lives. They stated that they were interested in this field because it offers the potential to deal with the biggest challenge that mankind has ever faced. And that was said in all due seriousness. It was not platitude and it was not something that was said lightly. And if you haven’t figured it out yet, I will confirm your suspicions that the people in the picture on the previous page are the group that I talked to.
What made this such a remarkable experience was the level of excite-ment, enthusiasm, and energy concerning the issues that we discussed. The intensity level went beyond keen interest. These people are very serious about their career choice. These people were even more serious about their personal intent to become part of the solution. And finally, these people wanted to go beyond the standard educational experience offered by the University. They wanted to be a step up and a step ahead when they graduate. They want to be able to hit the ground running the first day on the job and they want to be involved in things that make a difference.
That’s when it struck me. I suddenly realized that listening to the students was not unlike listening to the impassioned speeches of rock stars or country music stars when they are doing a charity event. None of them claims to have all the answers. Instead, the musicians make it clear that they are doing this event because it is the best way they are able to have an impact. And the intrinsic truth of those impassioned pleas comes through as genuine. The performers and the organizers really do care. They see themselves as being almost morally obligated to contributing to a cause in a way that leverages their celebrity. No, they don’t get involved at the nuts and bolts level. Instead, their focus is on collecting the resources that enable building solutions by people who are the subject matter experts. And there is no disputing the
results that these kinds of events have achieved over the years.
What came through to me loud and clear in the phone call was the fact that this student group was completely sincere in their interest in the field of environmental engineering and science. They know that this is not an easy field to be successful in. However, they firmly be-lieve that they have what it takes to make the grade. That belief is rooted in a desire to be a change agent for the environment and the need to better manage our impact on the environment as the world’s population continues to grow.
Which led to another epiphany. Listening to these students talk about what they wanted to do and why they wanted to do it made me realize; these are the rock stars of environmental engineering and science. They want to have an impact. No, let me restate that. They intend to have an impact and they are going the extra mile in preparing to make a meaningful contribution to the effort. They realize that their future does not include rock star money. Instead they are looking forward to a career in a field that is doing critical work. It’s all about passion, commitment and determination.
They don’t expect to be the next Zuckerberg, Gates, or Jobs. Instead, they will be looking to stand on the shoulders of the current generation of envi-ronmental engineers and scientists as they go forward in their careers. They want to be able to combine education and passion with a solid foundation on which to build.
And that is the challenge to the Academy and its members. We are the ones with the obligation to create an environment that enables the next gen-eration to succeed. That is a considerable endeavor and a considerable re-sponsibility because the issues the next generation will address are arguably more difficult than those of the past 50 years. We at the Academy look for-ward to working with you to ensure that we live up to that responsibility.
OF ENVIRONMENTAL ENGINEERS & SCIENTISTS careers.aaees.org
While the national reinvests in its infrastructure...Are you reinvesting in the infrastructure of your organization?
The American Academy of Environmental Engineers and Scientists can help move along your
candidate search. By posting a job on the AAEES Career Center at careers.aaees.org, you will get
unparalleled exposure within the engineering and scientific communities. As a part of the
Engineering & Science Career Network, AAEES ensures that your job posting will be seen by
thousands of qualified candidates relevant to your industry. And with access to all resumes posted
to the network, you can widen your reach to find the right candidate today!
When it comes to making career connections in the Environmental Engineering and
Environmental Science industries, more and more job seekers are turning to the AAEES Career
Center to find their next position. Where better to post a job and search for qualified candidates?
Visit the AAEES Career Center to post your Environmental Engineering and Environmental Science
jobs today!
The ESCN is a strategic industry alliance formed by AAEES and other top trade and professional associations that serve companies searching for engineering and science professionals.
Winter 2014 | V 50, N 1 Environmental Engineer & Scientist | 7
intRoDuCtionThe next to the last oughts
were a difficult time for en-vironmental engineering and
science. The multiplicative effects of burgeoning population growth and industrial production were wreak-ing havoc on river systems and the wastewater treatment plants de-signed to protect them. Worse, tech-nologists had hit a wall in terms of removing oxygen demanding mate-rials. Strangely enough, they could completely nitrify wastewaters, but they couldn’t get much beyond 50% removal of carbonaceous oxygen de-mand. What to do?
Welcome to a series of articles celebrating the 100th Anniversary of the Activated Sludge Process. To start, Daniel Schneider takes us through a brief history of wastewater treatment, the invention of the ac-tivated sludge process, and the sub-sequent controversy surrounding its genesis and adoption.
Ardern and Lockett’s ground-breaking paper, delivered to a large gathering of wastewater treatment professionals on April 3, 1914, at the Grand Hotel in Manchester England, explained the genesis and technical foundation of their breakthrough invention of acti-vated sludge. This article is repro-duced in its entirety in this issue. Ardern and Lockett demonstrated the almost complete removal of
carbonaceous oxygen demand by reusing (activating) sludge to treat wastewater. In doing so, they solved the carbonaceous oxygen demand removal roadblock.
From a reaction kinetic stand-point, engineers quickly hit upon the metric of food to microorganism ratio as a fundamental control met-ric. It had only one problem: it took five days to measure. Along came Alonzo Lawrence and Perry McCar-ty to provide the mathematical mod-eling insight to the activated sludge process that produced the sludge age control concept: something that you could measure and use the same day.
Ross McKinney proposed the vastly counterintuitive idea that it was better to have the lower reaction rate characteristic of the back end of a plug flow reactor spread evenly throughout an aeration basin than the higher rates characteristic of the front end. Stability trumped speed; the tortoise beat the hare.
Richard Dick tells the story of the integration of sludge thickening concepts into the design of final clar-ifiers, and the subsequent improve-ments in this field.
Glen Daigger takes us on a guid-ed tour of nitrogen removal mecha-nisms and processes, showing the huge amount of progress in this area. His article can be seen as paired with James Barnard’s pioneering article
on phosphorous removal, showing us the past and current state of nu-trient removal that is critical to the maintenance of sound ecosystems.
Finally, George Tchobanoglous and H. David Stensel give us a tour of where they think biological treatment processes are headed in the future: re-use, dispersal, modification etc.
The Academy’s 100th Anniver-sary celebration of the Invention of Activated Sludge was developed by a small ad-hoc workgroup consisting of Academy members (Herb Ward, Jeff Greenfield, Paul Koch, David Vaccari, David Marabello and my-self ), and staff (Yolanda Moulden and Sammi Olmo). My deepest ap-preciation to all of them.
Someone remarked to me that it must have been difficult to pull together and edit such an array of technical/historical articles. Not re-ally! Arguably, our 100th Anniver-sary Workgroup had assembled the most experienced team of writers in the history of Environmental Engi-neering and Science. No one missed a deadline or the mark. It is just built into their DNA. Many thanks to Daniel Schneider, Alonzo Lawrence, Andy Middleton, Ross McKin-ney, Glen Daigger, James Barnard, Richard Dick, H.David Stensel and George Tchobanoglous. And of course, Edward Ardern and William T. Lockett.
But there is more! Besides this special issue of Environmental Engi-neer and Scientist, the Academy has added a one time only Ardern and Lockett prize to the annual Excel-lence in Environmental Engineer-ing and Science Competition for the best Activated Sludge/Biologi-cal Process project. In conjunction with all of this activity, we are run-ning a special anniversary session at the New Jersey Water Environment Association in May, featuring ap-proximately a dozen speakers on various aspects of activated sludge -- both historical and present. We’ll probably wrap the whole thing up in an E-book for our members and the technical community at large.
Ardern and Lockett were all about sustainability. They reused bacteria from primary treatment and concentrated it to make an en-gineered model of nature -- riverine system or the human gut -- to clean our wastewater. This was and is a shining example of how humankind collectively adapts to our increasing numbers and activities, and in doing so, expands the carrying capacity of our sole planetary home. We expect much more to come in the next hun-dred years… and beyond.
Brian P. Flynn, P.E., BCEEPast President, AAEES
100th Anniversary of the Activated sludge Process:
1914 - 2014
8 | Environmental Engineer & Scientist Winter 2014 | V 50, N 1
who inVenteD ACtiVAteD SluDge?Daniel W. Schneider1
In this, activated sludge’s 100th anniversary, we can ask a ques-tion that vexed the sanitary en-
gineering community for decades following the meeting of the Society of Chemical Industry in Manches-ter, England, in which the activated sludge process was first publicly described. Who invented activated sludge? Many individuals could lay claim: Gilbert Fowler, Edward Ard-ern, William Lockett, Ernest Moore Mumford, Harry Clark. From our perspective, the answer may seem obvious. Activated Sludge was invented by the scientists who conducted the ground-breaking research and first reported it in the literature, Ardern and Lockett. However, activated sludge quickly became embroiled in a decades-long fight over who invented the process and was, thus, entitled to patent rights.
Gilbert Fowler was the chemist in charge of the Manchester Rivers Committee’s sewage research. As the head of research at Manches-ter, he directed Ardern and Lock-ett in their experiments. Fowler is most commonly credited with the invention of the activated sludge process along with Ardern and Lockett. Other researchers, however, also made claims to its invention. Harry Clark, chemist at the State of Massachusetts’ ex-periment station at Lawrence, had conducted key experiments that inspired Fowler in his studies and challenged Fowler over his claims. Other scientists and engineers were involved in early studies that could potentially be credited with the process’s invention, including Er-nest Moore Mumford who worked with Fowler on early bacteriologi-cal treatment schemes.
What everyone at the time could probably agree on, however, is that Walter Jones, owner of the hydraulic engineering firm Jones and Attwood, did not invent the
activated sludge process. Yet he was the one legally credited as the single, true inventor, and held the patents on the process in his name. Finally, and perhaps most impor-tantly, many engineers of the period argued that activated sludge was not invented at all; rather, it was a natu-ral process that was “discovered” rather than “invented.” As such, it belonged to the public at large.
Debate about who invented activated sludge was propelled chiefly by early efforts to com-mercialize and profit from the in-vention (Schneider, 2011). Many sanitary engineers, primarily em-ployed by municipalities and state boards of health, saw this push as inimical to the goal of improving the health of cities and ameliorating the severe pollution of rivers, lakes, and oceans. These public engineers developed a wide-ranging critique of sewage treatment patents. As with any advance in science, acti-vated sludge grew out of previous research and ascribing credit was complex. Complicating attribution of the process was the widespread effort, funded by local governments around the world, to develop effec-tive sewage treatment technologies. There was a great degree of sharing the results of work, and scientists and engineers crossed the Atlantic to visit various cities where new technologies were being tried.
The activated sludge process developed from this trans-Atlantic exchange of scientists and infor-mation, in which several research threads in England and the United States on the industrial use of mi-croorganisms came together. Gil-bert Fowler (Figure 1), a chemist and bacteriologist at Manchester University, was working with a young bacteriologist Ernest Moore Mumford, who was investigating the clogging of a biological sewage filter by an “iron organism.” Mum-ford collected these bacteria and
began to establish the conditions in which they grew and deposited iron. Naming it M.7, he found that in the presence of iron, air and a source of organic nitrogen like pep-tone, the bacteria would precipitate iron compounds (Mumford, 1913).
In the meantime, in 1911, Harry Clark, chief chemist at the Lawrence experiment station, run by the State of Massachusetts, was investigating the impact of domestic sewage and trade wastes on the life of rivers. He and his co-workers placed fish in aquaria and began adding sewage to determine “how much sewage the fish would stand and live.” They found that, in order to keep the fish alive in more and more polluted waters, they had to bubble increas-ing amounts of air into the bottom of the aquaria. As they kept adding sewage, they noted that growths began developing on the sides of the aquaria. When they stopped blowing air, they discovered that all of the suspended and colloidal material from the sewage dropped out, turning the turbid water clear. They quickly abandoned the stud-ies on fish and concentrated on un-derstanding the clarification of the sewage. They began bubbling air into containers of sewage (Figure 2). After blowing air for several weeks, they were able to purify newly added sewage in a matter of just 24 hours (Clark, n.d.).
Fowler’s research on the M.7 bacteria and Clark’s research on aer-ation came together when Fowler visited the Massachusetts experi-ment station in 1912. Fowler was consulting to the New York Sew-erage Commission and, like many sanitary scientists, made it a point to travel to Lawrence and tour the experiment station. There, Clark showed Fowler the bottle experi-ments and explained their success in purifying sewage. Fowler had previously written that “the subject of sewage disposal is mainly a ques-tion of the separation of solids from liquids,” and began thinking about
how to “clot” out sewage particles from the water. When he returned to Manchester he and Mumford be-gan experimenting with cultures of M.7, bubbling air and using sewage instead of peptone as the nitrogen source. They found that sewage could be clarified with this organ-ism, producing a “limpid sparkling and non-putrefactive effluent.” (Fowler and Mumford, 1913) Fowler’s M.7 research proved to be impracticable, however, and it was never adopted, but the mechani-cal apparatus used to conduct the work laid the basis for the activated sludge apparatus.
At the same time Fowler and Mumford were working on the M.7 process, Fowler had instructed his assistants at the Manchester Riv-ers Committee, chemists Edward Ardern and William Lockett, to repeat the experiments of Clark that he had seen in Massachusetts. Ardern and Lockett placed sewage in a small quart bottle, and started to bubble air until all of the nitro-gen had been converted to nitrate. Complete nitrification took six weeks-too long to be useful in treat-ing sewage directly. But their next step was crucial and set their experi-ments apart from those of Clark. Instead of discarding the sludge that accumulated in the bottle, they saved it and decanted the liquid. They then added fresh sewage and began to aerate anew. This time, nitrification took only three weeks. They kept decanting the liquid, re-serving the accumulated sludge and adding fresh sewage, and with each repetition, the time to nitrification was steadily reduced, until they could completely oxidize sewage in just 24 hours. They began to refer to this sludge as “active” to distinguish it from “ordinary” sewage sludge such as might be collected in a sedi-mentation tank (Lockett n.d.).
With this active sludge process, now renamed “activated” sludge, Ardern and Lockett felt they were on the verge of a revolution in sew-
1. Department of Urban and Regional Planning, University of Illinois at Urbana-Champaign, 611 Taft Drive, Champaign, IL 61820; [email protected]

Winter 2014 | V 50, N 1 Environmental Engineer & Scientist | 9
age treatment. “Results so far ob-tained indicate that it may radically affect the whole problem of the pu-rification of sewage,” wrote Lockett in a draft of their paper (Lockett n.d.). The activated sludge process of biological sewage treatment was introduced to the world at the Soci-ety for Chemical Industry meetings held in Manchester England on April 3rd, 1914, in a paper entitled “Experiments on the Oxidation of Sewage Without the Aid of Filters.” Ardern had invited sewage work-ers from around the country, and attendees were expecting to hear of a major breakthrough in sewage treatment. It was the best-attended meeting of the section ever, with perhaps 200 scientists and engi-neers in attendance (Ardern n.d.). Later that year, the society’s journal published the first of several papers reporting Ardern and Lockett’s work and made the process widely known internationally. Within just the next year, 15 cities around the world began testing the process and building sewage works to utilize it.
The report on activated sludge, however, also initiated a decades-long fight over the invention of activated sludge. The response of
the engineering community to the activated sludge process was condi-tioned to a great extent by concerns over its patent status. Engineers, particularly in the United States, had been challenging the patent on the septic tank process in the courts for over a decade, and the septic tank patent had roiled the sanitary engineering community (Schneider, 2011). On a visit to European sew-age treatment plants late in 1914, Edward Bartow, Professor of Sani-tary Engineering at the University of Illinois, went to Manchester to meet with Fowler, where he saw the experiments with activated sludge. Bartow was tremendously excited by the results, but he expressed great concern to Fowler over the patent status of the process. “Have you made any arrangements to have the process handled by any firm in the United States?” Bartow asked. “I hope that no firm will get hold of patents on the process and cause trouble,” he continued, “such as was caused by the Cameron Septic Tank Company” (Bartow, 1915a).
Fowler replied that he was “anxious to avoid anything like the experience of the Septic Tank Syndicate” (Fowler, 1915). How-ever, despite these assurances from Fowler, Bartow’s wish that “no firm will...cause trouble” was not real-ized. For, from a very early stage in the research on activated sludge, Fowler was secretly involved in negotiations with Walter Jones of Jones & Attwood, Ltd., a sewage and hydraulic engineering firm, to establish a syndicate to develop and market the activated sludge process. At first, Fowler was not interested
in patenting activated sludge. As the commercial potential of the process became clear, however, he began to abandon his prior convictions and applied himself wholeheartedly to the business aspects of the scheme. Fowler’s business associates had ad-vised him not to take out the patent himself, as this might be a blemish on his reputation and affect the ap-pearance of scientific objectivity. Rather, he should allow the syndi-cate to take out the patents. Fowler allowed Walter Jones to patent acti-vated sludge, receiving £1000 in re-turn. In legal proceedings from that point, Jones claimed to have invent-ed activated sludge (Figure 3): “Be it known that I, WALTER JONES, a subject of the King of England, residing at Amblecote, Stourbridge, in the county of Worcester, Eng-land, have invented new and use-ful Improvements in or Connected with the Purification of Sewage and Analogous Liquids” (Jones, 1917). Activated sludge promised to be an extremely lucrative business, and sewage patents were a key compo-nent of Jones & Attwood’s business strategy. “The Sewage Work of the World is a big thing,” wrote J.A. Coombs, Jones & Attwood’s chief sewage engineer, “and the firm are by no means selfish in trying to cor-ner it”(Haworth, n.d.).
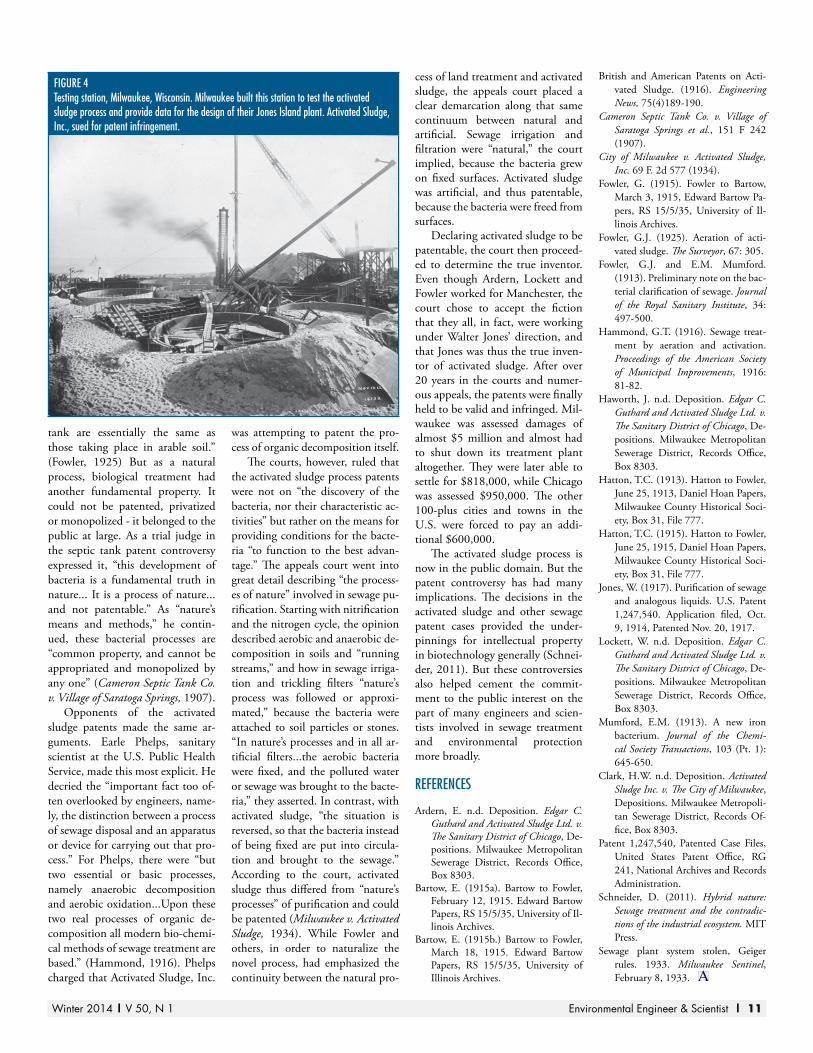
Soon after Ardern and Lock-ett’s pathbreaking paper, activated sludge was taken up by many cit-ies in both England and the U.S., where engineers established experi-mental plants to test and develop the process, the most prominent being Milwaukee, Wisconsin (Fig-ure 4). When engineers in the U.S.
first heard of activated sludge, they assumed that its use would be “free to all” since there had been “no public mention of patents on either the tank or the process.” (British and American Patents on Activated Sludge, 1916) Rather, engineers looked to the published papers of the Manchester researchers for guidance. “The papers of Ardern and Lockett describe the process so well that each engineer or chemist feels that he is capable of following along the lines described in their pa-per without additional assistance,” Bartow reported to Fowler, con-cerning Fowler’s desire to consult for American cities that might build activated sludge plants. Regarding the use of Jones & Attwood’s appli-ances for diffused air, Bartow noted that “American practice has dealt so largely with mechanical water filtra-tion that the supplying of air does not seem to them to be a difficult problem and they are going ahead with various devices of their own.” (Bartow, 1915b).
As news reached America that the original process had indeed been patented in England and that applications were pending for U.S. patents, engineers immediately thought of the septic tank and be-gan to organize against the activated sludge patents in a similar way. At the 1916 meeting of the American Society of Civil Engineers, engi-neers called for the establishment of a special committee to “to prevent, if possible, the patenting of this pro-cess by English engineers to whom Fowler has signed over his interests and rights.” (Clark, n.d.)
The acting secretary of the com-mittee was T. Chalkley Hatton, recently hired as Chief Engineer for the Milwaukee Sewerage Com-mission. Hatton was particularly incensed over the activated sludge patents, as Milwaukee had hired Fowler to consult on their activated sludge experiments, and only af-ter months of correspondence did Fowler intimate that the process was patented. Because Hatton as-sumed these patents would be on the specific apparatus that Jones and Attwood had designed, he ap-peared little concerned since he was moving forward with plans and equipment of his own, rather than Jones and Attwood’s appara-
FIGURE 2Aeration experiments of Harry Clark at the Lawrence Experiment Station. These bottle experiments were the basis for Ardern and Lockett’s experiments on activated sludge. Activated Sludge Inc. v. The City of Milwaukee, Defendant’s Book of Charts. Milwaukee Metropolitan Sewerage District, Records Office, Box 8303.
FIGURE 1Gilbert Fowler. Fowler is widely credited as the inventor of the activated sludge process. Some studies in biochemistry by some students of Dr. Gilbert J. Fowler (Bangalore: Phoenix Printing House, 1924).

10 | Environmental Engineer & Scientist Winter 2014 | V 50, N 1
tus. After further correspondence, however, Hatton began to worry. “In your last letter just received you suggest to my mind inquiring
about patents,” wrote Hatton. “I should like to know from you, what if any patent rights have been ob-tained which might govern the use
of the process with which we are experimenting.” (Hatton to Fowler, 1913) So began years of tense cor-respondence and decades of litiga-
tion. Milwaukee had designed their Jones Island treatment plant from scratch, using data from their own experimental plant, yet Jones & Attwood claimed infringement. Jones & Attwood formed a separate company, Activated Sludge Inc., and sued the Sanitary District of Chicago in 1925 and Milwaukee in 1929. In 1933, the Milwaukee case was decided first, in favor of Acti-vated Sludge. (Sewage Plant System Stolen, Geiger Rules, 1933) Armed with this initial victory in the Mil-waukee case, Activated Sludge Inc. filed suit against over 100 cities in 1933, ranging from tiny West Con-cord, Minnesota, population 613, to Los Angeles and Houston (Pat-ent 1,247,540).
Sanitary engineers disputed the patents on a number of grounds. In part, this challenge centered on a contest over credit for the inven-tion, with Harry Clark challenging Fowler’s priority. Opponents also argued that Ardern and Lockett, or even the City of Manchester, were the true inventors, not Fowler, and certainly not Jones. But per-haps most fundamentally, they challenged the idea that activated sludge was invented at all. Sanitary engineers recognized a fundamen-tal difference between the ethics of patenting apparatus and patent-ing processes in sewage treatment. Much of the apparatus used in a sewage plant-pumps, distributers, diffusers-was patented, and engi-neers organized no protests over these patents. Rather it was patents on processes themselves that created the most controversy. Hatton, on learning of the activated sludge pat-ents responded to Fowler, “I imag-ine such patent rights, if any, must have been issued on appliance rath-er than process” (Hatton, 1915). While apparatus might be patented, natural processes could not.
The most fundamental critique of the sewage patents centered on the contested position of the bac-terial processes involved in treating sewage. Proponents of bacterial processes in general considered bio-logical sewage treatment to rest on natural processes. Cameron em-phasized how his septic tank was based on “natural agencies.” Fowl-er, for instance, wrote “the changes which go on in an activated sludge
FIGURE 3The first activated sludge patent in the U.S., granted to Walter Jones as the inventor of the process. U.S. Patent 1,247,540. This patent covered both apparatus and the process.
Winter 2014 | V 50, N 1 Environmental Engineer & Scientist | 11
tank are essentially the same as those taking place in arable soil.” (Fowler, 1925) But as a natural process, biological treatment had another fundamental property. It could not be patented, privatized or monopolized - it belonged to the public at large. As a trial judge in the septic tank patent controversy expressed it, “this development of bacteria is a fundamental truth in nature... It is a process of nature...and not patentable.” As “nature’s means and methods,” he contin-ued, these bacterial processes are “common property, and cannot be appropriated and monopolized by any one” (Cameron Septic Tank Co. v. Village of Saratoga Springs, 1907).
Opponents of the activated sludge patents made the same ar-guments. Earle Phelps, sanitary scientist at the U.S. Public Health Service, made this most explicit. He decried the “important fact too of-ten overlooked by engineers, name-ly, the distinction between a process of sewage disposal and an apparatus or device for carrying out that pro-cess.” For Phelps, there were “but two essential or basic processes, namely anaerobic decomposition and aerobic oxidation...Upon these two real processes of organic de-composition all modern bio-chemi-cal methods of sewage treatment are based.” (Hammond, 1916). Phelps charged that Activated Sludge, Inc.
was attempting to patent the pro-cess of organic decomposition itself.
The courts, however, ruled that the activated sludge process patents were not on “the discovery of the bacteria, nor their characteristic ac-tivities” but rather on the means for providing conditions for the bacte-ria “to function to the best advan-tage.” The appeals court went into great detail describing “the process-es of nature” involved in sewage pu-rification. Starting with nitrification and the nitrogen cycle, the opinion described aerobic and anaerobic de-composition in soils and “running streams,” and how in sewage irriga-tion and trickling filters “nature’s process was followed or approxi-mated,” because the bacteria were attached to soil particles or stones. “In nature’s processes and in all ar-tificial filters...the aerobic bacteria were fixed, and the polluted water or sewage was brought to the bacte-ria,” they asserted. In contrast, with activated sludge, “the situation is reversed, so that the bacteria instead of being fixed are put into circula-tion and brought to the sewage.” According to the court, activated sludge thus differed from “nature’s processes” of purification and could be patented (Milwaukee v. Activated Sludge, 1934). While Fowler and others, in order to naturalize the novel process, had emphasized the continuity between the natural pro-
cess of land treatment and activated sludge, the appeals court placed a clear demarcation along that same continuum between natural and artificial. Sewage irrigation and filtration were “natural,” the court implied, because the bacteria grew on fixed surfaces. Activated sludge was artificial, and thus patentable, because the bacteria were freed from surfaces.
Declaring activated sludge to be patentable, the court then proceed-ed to determine the true inventor. Even though Ardern, Lockett and Fowler worked for Manchester, the court chose to accept the fiction that they all, in fact, were working under Walter Jones’ direction, and that Jones was thus the true inven-tor of activated sludge. After over 20 years in the courts and numer-ous appeals, the patents were finally held to be valid and infringed. Mil-waukee was assessed damages of almost $5 million and almost had to shut down its treatment plant altogether. They were later able to settle for $818,000, while Chicago was assessed $950,000. The other 100-plus cities and towns in the U.S. were forced to pay an addi-tional $600,000.
The activated sludge process is now in the public domain. But the patent controversy has had many implications. The decisions in the activated sludge and other sewage patent cases provided the under-pinnings for intellectual property in biotechnology generally (Schnei-der, 2011). But these controversies also helped cement the commit-ment to the public interest on the part of many engineers and scien-tists involved in sewage treatment and environmental protection more broadly.
REFEREnCES
Ardern, E. n.d. Deposition. Edgar C. Guthard and Activated Sludge Ltd. v. The Sanitary District of Chicago, De-positions. Milwaukee Metropolitan Sewerage District, Records Office, Box 8303.
Bartow, E. (1915a). Bartow to Fowler, February 12, 1915. Edward Bartow Papers, RS 15/5/35, University of Il-linois Archives.
Bartow, E. (1915b.) Bartow to Fowler, March 18, 1915. Edward Bartow Papers, RS 15/5/35, University of Illinois Archives.
British and American Patents on Acti-vated Sludge. (1916). Engineering News, 75(4)189-190.
Cameron Septic Tank Co. v. Village of Saratoga Springs et al., 151 F 242 (1907).
City of Milwaukee v. Activated Sludge, Inc. 69 F. 2d 577 (1934).
Fowler, G. (1915). Fowler to Bartow, March 3, 1915, Edward Bartow Pa-pers, RS 15/5/35, University of Il-linois Archives.
Fowler, G.J. (1925). Aeration of acti-vated sludge. The Surveyor, 67: 305.
Fowler, G.J. and E.M. Mumford. (1913). Preliminary note on the bac-terial clarification of sewage. Journal of the Royal Sanitary Institute, 34: 497-500.
Hammond, G.T. (1916). Sewage treat-ment by aeration and activation. Proceedings of the American Society of Municipal Improvements, 1916: 81-82.
Haworth, J. n.d. Deposition. Edgar C. Guthard and Activated Sludge Ltd. v. The Sanitary District of Chicago, De-positions. Milwaukee Metropolitan Sewerage District, Records Office, Box 8303.
Hatton, T.C. (1913). Hatton to Fowler, June 25, 1913, Daniel Hoan Papers, Milwaukee County Historical Soci-ety, Box 31, File 777.
Hatton, T.C. (1915). Hatton to Fowler, June 25, 1915, Daniel Hoan Papers, Milwaukee County Historical Soci-ety, Box 31, File 777.
Jones, W. (1917). Purification of sewage and analogous liquids. U.S. Patent 1,247,540. Application filed, Oct. 9, 1914, Patented Nov. 20, 1917.
Lockett, W. n.d. Deposition. Edgar C. Guthard and Activated Sludge Ltd. v. The Sanitary District of Chicago, De-positions. Milwaukee Metropolitan Sewerage District, Records Office, Box 8303.
Mumford, E.M. (1913). A new iron bacterium. Journal of the Chemi-cal Society Transactions, 103 (Pt. 1): 645-650.
Clark, H.W. n.d. Deposition. Activated Sludge Inc. v. The City of Milwaukee, Depositions. Milwaukee Metropoli-tan Sewerage District, Records Of-fice, Box 8303.
Patent 1,247,540, Patented Case Files, United States Patent Office, RG 241, National Archives and Records Administration.
Schneider, D. (2011). Hybrid nature: Sewage treatment and the contradic-tions of the industrial ecosystem. MIT Press.
Sewage plant system stolen, Geiger rules. 1933. Milwaukee Sentinel, February 8, 1933.
FIGURE 4Testing station, Milwaukee, Wisconsin. Milwaukee built this station to test the activated sludge process and provide data for the design of their Jones Island plant. Activated Sludge, Inc., sued for patent infringement.

12 | Environmental Engineer & Scientist Winter 2014 | V 50, N 1
exPeRiMentS on the oxiDAtion of SewAge without the AiD of filteRS
The following article is reproduced from the Journal of the Society of Chemical Industry, Volume XXXIII, No. 10,pgs. 523-539, Edward Ardern, M.Sc., and William T. Lockett, M.Sc.
MAnCHESTER SECTIOn
MEETInG HELD AT THE GRAnD HOTEL On FRIDAy, APRIL 3RD, 1914: MR. J. H. HOSEASOn In THE CHAIR
It has long been known that if sewage be exposed to the air for a suffi-cient period of time, the organic contents are gradually oxidised, with the formation of a deposit of so-called “humus” and the final production of
nitrate from the ammonium salts and the nitrogenous organic matter.This purification change of which the course of the reaction has been so
carefully studied and thoroughly worked out by Adeney in his researches on behalf of the Royal Commission of Sewage Disposal, takes place, however, comparatively slowly, and even if aided by direct aeration, by no means be-comes a practical method of sewage purification.
Numerous investigators have from time to time endeavoured to utilise aeration methods in the practical solution of the sewage problem, but until quite recently without any reasonable amount of success.
Among the earlier investigations may be mentioned those of Dupré and Dibdin1 on the aeration of London Sewage, and those of the Massachusetts State Board of Health relating to the use of aeration in the filtration of sewage through gravel and sand filters. Dr. Drown2, chemist to this Board, conclud-ed from the results of a series of experiments, that the oxidation of organic matter in water was not hastened by vigorous agitation with air.
Waring3 of the United States was one of the first to apply aeration meth-ods in the purification of sewage on a working scale.
In 1880 Hartland patented an aeration chamber for the purification of sewage or tank effluent, which Kaye Parry4 employed in experiments under-taken in 1887, while in 1892 Lowcock conducted experiments on the aera-tion of filter beds by a forced air supply.
In the latter year Mason and Hine5 published the results of a research on the aeration of mixture of sewage and water in which they concluded that aeration had but little oxidation effect on the sewage.
In 1897 Fowler6 investigated the effect of aeration on the effluent result-ing from the chemical precipitation of Manchester sewage, without any very tangible results being obtained, at any rate so far as the total of oxidation was concerned.
It would thus appear that the results of the earlier investigations on the subject of aeration of sewage, indicated that aeration per se could not be con-sidered as a practicable adjunct in the process of sewage purification.
Recently, however, the subject has been reopened by the work of Black and Phelps, Clark, Gage and Adams, and Fowler and Mumford.
In dealing with the question of the pollution of the New York Harbour, Black and Phelps7 studied the possibilities of the application of aeration to the treatment of sewage.
Their experiments dealt with the aeration of both fresh and partially sep-ticised sewage, in various types of tanks and it was shown that under certain conditions it was possible by means of a reasonable amount of aeration to remove the more readily putrescible matters from the sewage and thereby to a certain extent increase its stability.
Black and Phelps were so far convinced of the practicability of such meth-ods of treatment of sewage, as to recommend that the sewage from a certain section of the New York area should be dealt with on these lines, prior to discharge into the waters of the harbour.
In the Annual Report of the Massachusetts State Board of Health for the year 1912, published at the end of 1913, is described an investigation by Clark and Do. M. Gage on the possibilities of the use of aeration for prelimi-nary treatment of sewage prior to filtration. They found that simple aeration of sewage for 24 hours reduced the free and albuminoid ammonia to some extent and that with sewage which was both aerated and seeded with green growths - Protococcus and Scenelesmus - the albuminoid ammonia was even more noticeably reduced. Later it was found that appreciable nitrification was obtained within 24 hours in the aerated sewage containing the green growths.
Subsequently Clark and Gage found that aeration for a much shorter period, in a tank containing slabs of slate about one inch apart, covered with a compact brown growth of sewage matters, was sufficient to coagulate the sewage colloids, and thus to produce a well clarified non-nitrified effluent capable of satisfactory filtration at several times the normal rate.
Later Fowler and Mumford8 carried experiments on the action in the presence of air, of an organism designated “M7” (isolated by Mumford from ponds receiving water discharged from a colliery) on sewage containing a certain proportion of iron salts.
This organism has the property of precipitating the iron as ferric hydrox-ide from solutions of iron salts.
In the paper referred to, it is stated that sewage (in presence of a cer-tain quantity of iron salts) inoculated with this organism, can be thoroughly clarified by six hours aeration. The resultant effluent after settlement of the separated organic colloids, was quite clear and practically free from colloids. It is further stated that although the ordinary methods of analysis failed to reveal the extent of the change effected by the above treatment, the effluent after aeration was always non-putrefactive on incubation, and could be read-ily oxidised and nitrified by filtration at a high rate.
In quite a recent publication Clark and Adams9 give the results obtained during 12 months operation of the specially constructed tank used in their earlier experiments previously referred to.
It is shown that a rather better coagulation of the organic colloids and purification of the sewage generally, can be obtained by means of aeration for a period of five hours, under the conditions of experiment, than is obtained by efficient chemical precipitation, and at a considerably reduced cost.
The effluent resulting from the aeration treatment was applied to trickling filters 10 feet deep, at rates varying from 8 to 10 million gallons per acre per day, with the production of a well-nitrified and thoroughly stable filtrate.
In connection with the experiments carried out by Clark and his col-
1. Report to Royal Commission on the Metropolitan Sewage Disposal, 1884, Vol. 2.2. Clark and Adams, Engineering Record, February 7th, 1914, p. 158.3. Halter and Baker, 1984, Sewage Disposal in the United States, P. 535.4. Trans. Inst. C.E. Ireland, Vol. XX., 1888.5. Journ. Amer. Chem. Soci., Vol. 14, p. 7.6. Annual Report, 1897, Rivers Dept., Manchester Corporation7. Mass Inst. of Technology, Contributions from the Sanitary Research Laboratory,
Vol. VII., Boston, Massachusetts, 1911.8. Journal of Roy. San. Inst., November, 1913.9. Engineering Record, February 7th, 1914, p. 158.
Winter 2014 | V 50, N 1 Environmental Engineer & Scientist | 13
leagues, it should be mentioned that the sewage treated was considerably more dilute than the majority of English sewages, as will be seen from the following average analytical returns taken from the paper quoted.
Parts per 100,000
Oxygen consumed 3.52Free and saline ammonia 3.62Albuminold ammonia 0.57
The researches of Clark, Gage, and Adams, and of Fowler and Mumford show a marked advance on previous work, but it will be seen that in the case of the former investigators the idea of surface contact is retained, as evi-denced by the construction of the aeration tank, and that in order to produce a nitrified and stable effluent, further treatment in filters is still required.
With regard to the method of treatment suggested by Fowler and Mum-ford, while the clarification is effected in the absence of surface contacts, the questions of inoculation and the addition of iron salts are introduced and the provision of filters for the rapid treatment of the clarified effluent remains.
In a previous communication to this section of the Society10 in regard to the effect of the waste liquor from sulphate of ammonia plants on the oxida-tion of sewage, the present authors, in conjunction with Dr. Fowler, gave some results of the direct aeration of sewage.
It was noted that while some coagulation of the colloid matter took place in the course of twenty-four hours aeration, a period of several weeks elapsed before nitrification was complete.
In November, 1912, Dr. Fowler visited the States in connection with the question of the pollution of the New York Harbour. Shortly after his return he described to the authors a laboratory experiment which he had seen in progress at the Lawrence Experiment Station, Massachusetts, which evidently referred to the earlier work of Clark and his colleagues on the aera-tion of sewage in the presence of green organisms, as the bottle in which the sewage was aerated was coated inside with strands of algal growth. Dr. Fowler suggested that new work might with advantage be carried out on somewhat similar lines.
Acting on this suggestion, further investigations with regard to the subject of aeration of sewage, were undertaken by the authors.
An account of the results which have so far accumulated is given in the following paragraphs.
PRELIMInARy ExPERIMEnTS
In a series of preliminary experiments, samples of Manchester raw sew-age, contained in bottles of 80 oz. capacity, were aerated until complete nitrification ensued; the aeration being effected by drawing air through
the sewage by means of an ordinary filter pump.In the case of the first experiment, about five weeks’ continuous aeration
was required in order to obtain complete nitrification, as had been previously observed. At the end of this period the clear oxidised liquid was removed by decantation, and a further sample of raw sewage aerated in contact with the original deposited matter, until the sewage was again completely nitrified.
This method of treatment was repeated a number of times with the reten-tion in each case of the deposited solids.
It was found that as the amount of the deposited matter increased, the time required for each succeeding oxidation gradually diminished until even-tually it was possible to completely oxidise a fresh sample of crude sewage within twenty-four hours.
For reference purposes and failing a better term, the deposited solids re-sulting from the complete oxidation of sewage have been designated “acti-vated sludge.” Reference to its general characteristics, chemical composition and biological contents will be made later.
As a result of these preliminary experiments the following observations may be made:
(a) In order that the final nitrification change may proceed without hin-drance, it is necessary that the alkalinity or basicity of the sewage should be rather more than equal to the nitric acid resulting from nitrification of the ammonium salts. In some cases it has consequently been found necessary to add a small quantity of alkali prior to complete nitrification.
(b) It is essential that the activated sludge should be kept in intimate contact with the sewage during aeration.
This point is illustrated by an experiment, the results of which are given in Table 1 from which it will be seen that while the initial effect on the oxidis-able matters as measured by the oxygen absorption test, is not materially af-fected, on further aeration a marked improvement is shown in the case where the activated sludge is kept in intimate contact with the sewage, than where such conditions do not obtain. Further, in regard to the amount of nitrifica-
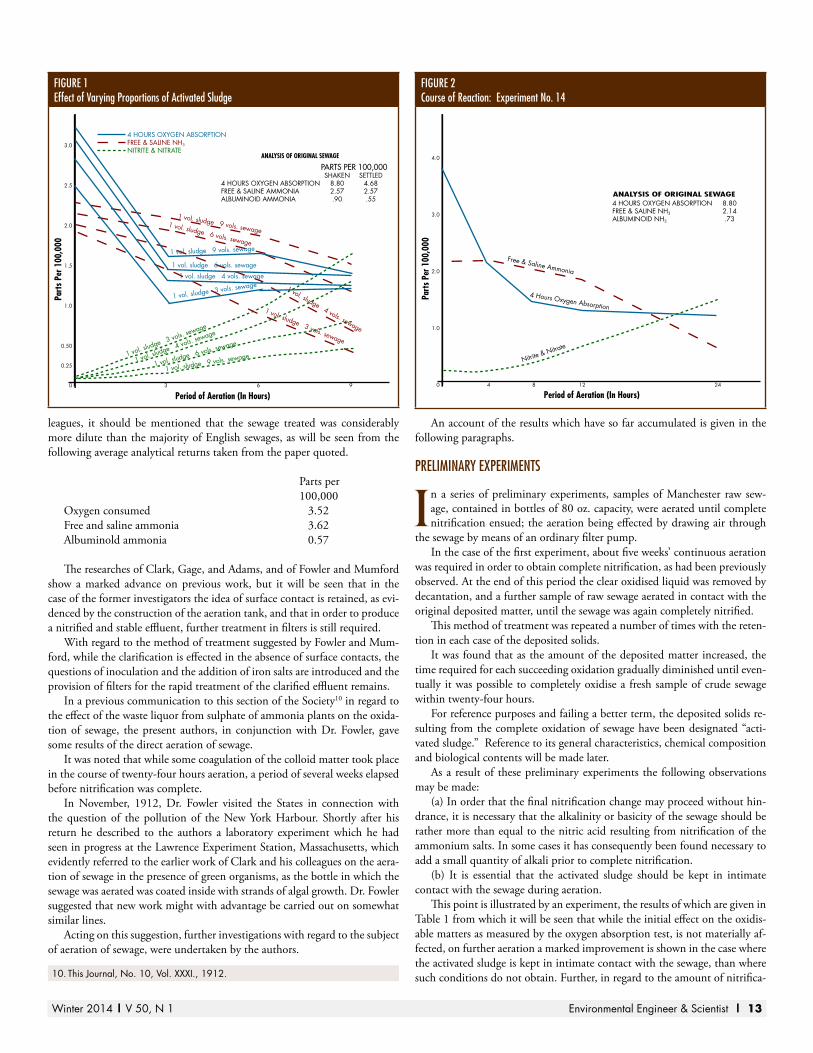
FIGURE 1Effect of Varying Proportions of Activated Sludge
Period of Aeration (In Hours)
PARTS PER 100,000 SHAKEN SETTLED4 HOURS OXYGEN ABSORPTION 8.80 4.68FREE & SALINE AMMONIA 2.57 2.57ALBUMINOID AMMONIA .90 .55
ANALYSIS OF ORIGINAL SEWAGE
3.0
2.5
2.0
1.5
1.0
0.50
0.25
0 3 6 9
4 HOURS OXYGEN ABSORPTIONFREE & SALINE NH3NITRITE & NITRATE
FIGURE 2Course of Reaction: Experiment no. 14
Period of Aeration (In Hours)
4.0
3.0
2.0
1.0
0 4 8 12 24
4 HOURS OXYGEN ABSORPTION 8.80FREE & SALINE NH3 2.14ALBUMINOID NH3 .73
10. This Journal, No. 10, Vol. XXXI., 1912.

14 | Environmental Engineer & Scientist Winter 2014 | V 50, N 1
tion very much greater differences are to be observed. This is of considerable importance, as it will be seen from later experiments that the maintenance of the activity of the sludge is considerably influenced by the extent to which the oxidation is carried.
(c) That the relation of the volume of the activated sludge to the volume of sew-age treated is of importance, more especially in regard to the rate of nitrification.
This latter point is clearly shown by the results of an experiment which was actually carried out much later on in the course of this investigation and which are given on Table 1a (p.526*) and plotted in Figure 1.
It will be seen from this table and diagram that while apart from the dilu-tion effect, the reduction in the amount of oxidisable matter is not seriously affected by the varying proportions of activated sludge, the amount and rate of nitrification are influenced in a marked degree.
OxIDATIOn OF MAnCHESTER SEWAGE
Once having accumulated a sufficient volume of activated sludge in the manner previously described, a series of determinations were made of the effect of aeration in contact with the sludge, of various
samples of Manchester sewage received at Davyhulme.
In general a proportion of one volume of activated sludge to four volumes of sewage was taken, although in the earlier experiments a much smaller proportion of sludge was employed.
A number of typical results are recorded in Table 2. In each of the experi-ments quoted the samples of sewage taken are twenty-four hours average samples.
Reference to this table will show that an extraordinarily high degree of purification can be obtained within a reasonable period of time by aeration in contact with the activated sludge.
On the average, aeration under the conditions of experiment for a period of six hours, with subsequent settlement, is sufficient to obtain a percentage purification as measured by the four hours Oxygen Absorption and Albumi-noid Ammonia Tests, quite equal to that yielded by efficient bacterial filters. In all cases the resultant effluent is non-putrefactive on incubation.
The amount of nitrification obtained during this period depends to a certain extent on the concentration or strength of the sewage dealt with. In several instances, when treating wet weather sewage, six hours’ aeration has been found sufficient to completely oxidise the ammonia present (see Table 2, Expt. No. 30). With average strength Manchester sewage the free and saline ammonia content is entirely removed in from 10 to 18 hours’ aeration.
It should be mentioned that all the experiments have been worked on the fill and draw method, and it may be reasonably anticipated that equally good results would be obtained with a less aeration period, when working on a continuous flow system.
TABLE IEffect of “Intimate” Contact
Results in parts per 100,000
Experiment (7a) Experiment 8(a) A = sludge in contact with sewage without intimate mixture.
B = intimate mixture of sewage and sludge.
In each case the samples were settled for 2 hours prior to analysis.
4 Hours oxygen absorption
Free and saline ammonia
Albuminoid ammonia nitrite and nitrate 4 Hours oxygen
absorptionFree and saline
ammoniaAlbuminoid ammonia nitrite and nitrate
A B A B A B A B A B A B A B A B
Original 3.88 4.06 2.71 2.71 .33 .33 5.20 5.31 2.43 2.36 .47 .485 .07 .07
After 4 hours aeration 2.46 1.77 2.71 2.50 .215 .145 2.90 2.90 2.36 2.28 .30 .29 .17 .15
After 24 hours aeration 1.26 .60 2.57 .15 .105 .05 nil 1.72 2.00 1.28 2.28 1.22 .215 .10 .07 .86
In this experiment a proportion of 1 vol. activated sludge to 25 vols. sewage was employed.
TABLE IARatio of Sludge to Sewage
Results in parts of 100,000
Experiment 91a
Raw sewage 1 vol. sludge to 9 vols. sewage 1 vol. sludge to 6 vols. sewage 1 vol. sludge to 4 vols. sewage 1 vol. sludge to 3 vols. sewage
Shaken Settled Original 3 Hrs. 6 Hrs. 9 Hrs. Original 3 Hrs. 6 Hrs. 9 Hrs. Original 3 Hrs. 6 Hrs. 9 Hrs. Original 3 Hrs. 6 Hrs. 9 Hrs.
4 Hours oxygen absorption (total) 8.80 4.08 3.26 1.60 1.63 1.40 3.08 1.43 1.40 1.32 2.80 1.28 1.28 1.22 2.51 1.00 1.17 1.20
Crystalloids. 2.57 1.72 .91 .80 .80 1.63 .80 .76 .76 1.37 .68 .68 .68 1.31 .63 .68 .66
Colloids, etc. 2.11 1.54 .69 .83 .60 1.46 .63 .64 .54 1.43 .60 .60 .54 1.20 .37 .49 .54
Oxidisable matter
removed
Total 1.66 1.63 1.86 1.65 1.68 1.76 1.52 1.52 1.58 1.51 1.34 1.31
Crystalloids .81 .92 .92 .83 .87 .87 .69 .69 .69 .68 .63 .65
Colloids, etc. .85 .71 .94 .83 .82 .92 .83 .83 .89 .83 .71 .66
Per cent. reduction on raw sewage -- 47 63 82 81 84 65 84 84 85 68 85 85 86 72 89 87 86
Per cent. reduction on settled sewage -- -- 30 66 65 70 34 69 70 72 40 73 73 74 46 79 75 74
Free and saline ammonia 2.57 2.57 2.28 2.07 1.86 1.50 2.14 1.93 1.64 1.14 2.00 1.71 1.28 .64 1.93 1.43 .86 .37
Reduction of free nH3 -- -- -- .21 .42 .78 -- .21 .50 1.00 -- .29 .72 1.36 -- .50 1.07 1.56
Per cent. reduction on raw sewage -- -- 11 19 28 42 17 25 36 56 22 33 50 75 25 44 67 86
Albuminoid ammonia .90 .33 .315 .16 .15 .12 .315 .15 .12 .10 .30 .13 .10 .08 .26 .10 .08 .005
Reduction in albd. nH3 .155 .165 .195 1.65 .195 .215 .17 .20 .22 .16 .18 .195
Per cent. reduction on raw sewage -- 63 65 82 83 87 65 83 87 89 67 86 89 91 74 89 91 93
Per cent. reduction on settle sewage -- -- 5 52 55 64 5 55 64 70 9 61 70 76 21 70 76 80
nitrite and nitrate (in terms of nH3) .06 .12 .32 .43 .04 .23 .54 .7 .04 .36 .74 1.28 .07 .47 .93 1.64
Amount of nH3 oxidised -- .06 .26 .37 -- .19 .50 .73 -- .32 .70 1.24 -- .40 .86 1.57
Per cent. of nH3 oxidised 2 5 12 17 2 9 21 30 2 14 29 50 2 18 36 64
Except in the case of the original shaken sample, two hours settlement was allowed prior to analysis.
* Note: Reference to page number in original published article. This artifact contin-ues throughout the article.

Winter 2014 | V 50, N 1 Environmental Engineer & Scientist | 15
Outdoor experiments are being commenced in which a continuous flow of a mixture of sewage and activated sludge will be passed through an aera-tion chamber.
COURSE OF REACTIOn
In all cases it has been noted that there is a rapid initial effect on the oxidisable matters both colloidal, etc., and crystalloidal, with the production in a period of about three hours of a well-clarified
effluent.The later stages of aeration are largely confined to the nitrification of the
ammonium compounds.In order to clearly illustrate this course of the reaction the results of an
early experiment (see Table 2, p. 527*, Exp. 14) are quoted, in which a small proportion only of activated sludge was employed, as in the later experi-ments with an increased proportion of sludge the first change occurs rapidly
and consequently nitrification is established so early as to partially mask the course of the reaction.
The results of this experiment are plotted in Fig. 2 from which it will be seen that the purification change follows on the lines demonstrated by Adeney.
In view of this fact it was thought of interest to endeavour to sectionise the purification process into (a) a carbonaceous fermentation and (b) a nitri-fication process, with the idea of comparing the results with those obtained by the original method of working.
ATTEMPT TO SECTIOnISE THE OxIDATIOn PROCESS
For the purpose of this experiment a partially activated sludge was taken, which while it was capable of effective the first change, i.e., the removal of the oxidisable matter did not actively promote ni-
trification.
TABLE IIOxidation of Manchester Sewage
Results in parts per 100,000
Experiment 14 Experiment 22 Experiment 25
Raw sewage
R.S. + sludge
After aeration in contact with sludge for:
Raw sewage R.S.* Original settled.
After aeration for Raw sewage R.S.* Original settled
After aeration for
6 hours 12 hours 6 hours 12 hours
Shaken Settled 4 hrs. 8 hrs. 12 hrs. 24 hrs. Shaken Shaken R.S.* alone
R.S. + sludge
R.S.* alone
R.S. + sludge
R.S.* alone
R.S. + sludge Shaken Shaken R.S.*
aloneR.S. + sludge
R.S.* alone
R.S. + sludge
R.S.* alone
R.S. + sludge
4 hours oxygen absorption 8.80 3.83 2.09 1.40 1.26 1.17 14.90 10.63 7.46 6.09 6.57 1.83 5.20 1.31 15.32 10.06 6.97 5.91 5.26 2.20 4.91 1.29
Per cent. reduction on raw sewage -- 56 76 84 86 87 -- 29 50 59 56 88 65 91 -- 34 55 61 66 86 68 92
Free and saline ammonia 2.14 2.14 2.14 1.93 1.80 .96 3.43 3.00 3.00 3.00 2.57 1.31 2.14 nil 2.43 2.29 2.29 2.29 2.29 1.14 2.14 nil
Per cent. reduction on raw sewage -- nil nil 10 16 55 -- 13 13 13 25 62 38 100 -- 6 6 6 6 53 12 100
Albumnoid ammonia .73 .345 .265 -- .12 .105 1.10 .82 .53 .54 .415 .16 .365 .135 1.07 .67 .36 .36 .44 .165 .305 .105
Per cent. reduction on raw sewage -- 53 64 -- 84 86 -- 25 52 51 62 85 67 88 -- 37 66 66 59 85 72 90
nitrite and nitrate (in terms of nH3)
-- .20 .20 .32 .60 1.46 -- -- nil .51 nil 1.80 nil 2.58 -- -- -- -- nil 1.50 nil 2.30
Per cent. oxidised -- 9 9 15 28 68 nil 15 nil 52 nil 75 -- -- -- -- nil 62 nil 951 vol. sludge to 12 vols. sewage 1 vol. sludge to 4 vols. sewage 1 vol sludge to 4 vols. sewage
* = Original sewage with 20 per cent. water added, to obviate dilution effect of sludge
Experiment 30 Experiment 81 Experiment 86 Experiment 89
Raw sewage Original settled After 6 hrs.
aeration Raw sewage. After aeration for Raw sewage After aeration for Raw sewage After aeration for
Shaken Alone +sludge Alone +sludge Shake Settled 3 hrs. 6 hrs. 9 hrs. Shaken Settled 3 hrs. 6 hrs. 9 hrs. Shaken Settled 3 hrs. 6 hrs. 9 hrs.
4 hours oxygen absorption (total) 11.20 7.29 4.57 6.63 2.09 13.37 9.40 2.00 1.37 1.20 14.27 9.30 2.97 1.34 1.12 14.63 10.10 2.17 1.50 1.29
Crystalloids .78 1.14 .81 .80
Colloids, etc. .34 1.03 .69 .49
Per cent. reduction on raw sewage -- 35 59 41 81 -- 30 85 90 91 -- -- 79 91 92 -- 31 85 90 91
Per cent. reduction on settled sewage -- -- -- -- -- -- -- 79 85 87 -- -- 68 86 88 -- -- 79 85 87
Free and saline ammonia 1.57 1.57 1.29 1.57 nil 3.71 3.71 2.80 2.00 1.14 3.30 3.30 2.86 2.14 1.36 4.14 4.14 3.43 2.00 1.43
Per cent. reduction on raw sewage nil 18 nil 100 -- -- 25 46 72 -- -- 13 35 59 -- -- 17 52 65
Albuminoid ammonia .50 .385 .385 .385 .15 1.36 .70 .18 .105 .08 1.19 .62 .205 .10 .08 1.43 1.04 .22 .115 .105
Per cent. reduction on raw sewage 23 23 23 70 -- 49 87 92 94 -- 48 83 92 93 -- 27 85 92 93
Per cent. reduction on settled sewage -- -- -- -- -- -- 74 85 89 -- -- 69 84 87 -- -- 79 89 90
nitrite and nitrate (in terms of nH3)
nil .07 nil 1.70 -- -- .10 .52 .92 -- -- .04 .34 .80 -- -- .04 .80 1.14
Per cent. oxidised nil 4 nil 100+ -- -- 3 14 25 -- -- 1 10 24 -- -- 1 19 281 vol. sludge to 3 vols. sewage 1 vol sludge to 4 vols. sewage 1 vol. sludge to 4 vols. sewage 1 vol. sludge to 4 vols. sewage

16 | Environmental Engineer & Scientist Winter 2014 | V 50, N 1
Three large bottles were used.(1) Containing a certain volume of this partially activated sludge (α
sludge).(2) (β sludge and (3) (αβ sludge) Containing a similar volume of thor-
oughly activated sludge which had been proved capable of vigorously pro-moting nitrification.
The experiment was carried out in the following manner. Equal vol-umes of the same sample of sewage were introduced into bottles Nos. 1 and 3 and aeration commenced. At the end of two hours’ aeration the contents of bottle No. 1 were allowed to settle for two hours and the su-pernatant liquor was decanted into bottle No. 2. Another sample of sew-age was then added to bottle No. 1 and aeration resumed. After a further two hours’ aeration the contents of each of the bottles were allowed to settle for two hours.
In this manner an effluent was obtained from bottle No. 2 which had received two hours’ aeration in contact with the partially activated (α) sludge and a further two hours’ aeration in contact with actively nitrifying (β) sludge, and from bottle No. 3 an effluent which had been aerated for six hours in contact with thoroughly activated (αβ) sludge.
This method of operation was repeated as often as was reasonably practi-cable within the twenty-four hours, with the result that the partially activated sludge and nitrifying sludge (bottles Nos. 1 and 2) dealt with three volumes of sewage each working day, as compared with the two volumes treated by the thoroughly activated sludge.
The results obtained during the course of this experiment are given in Table 3 (p. 528*).
Reference to this table will show that there was no very material difference in the effluents yielded by the two methods of working.
At the same time it will be seen that the results with the ordinary activated sludge show a marked deterioration as compared with those previously ob-tained, particularly in regard to the amount of nitrification.
In the absence of any other altered factor this decreased efficiency might reasonably have been ascribed to the fact that while in the previous experi-ments any particular sample of sewage was always aerated in contact with the activated sludge for from 20 to 24 hours to ensure complete nitrification, in the present case, at the end of first six hours’ aeration the purified liquor was replaced with a further sample of sewage.
Unfortunately, however, during the course of this series of experiments, low temperatures were experienced, not only with the sewage dealt with, but also in the laboratory, owing to trouble with the heating apparatus.
It was thus impossible to say to what extent, if any, either of these two factors influenced the results obtained, and instead of continuing sectionised experiments on these lines, attention was diverted to the study of the ques-tions involved.
Before leaving this part of the subject it may be stated that while the above experiment failed to determine the possibilities of sectionising the oxidation process the matter has not been lost sight of, and it is the intention of the authors to return to this question at an early date.
MAInTEnAnCE OF SLUDGE ACTIVITy
In order to determine how far the purification effect of the activated sludge was influenced by not carrying the oxidation process to complete nitrifi-cation the following experiment was carried out.Activated sludge of known efficiency was divided into four equal volumes
and placed into separate bottles, viz., A, B, C, and D, each of four litres ca-pacity and containing a sample of the same sewage.
The following procedure was then adopted:Bottle A. Sewage aerated for six hours in contact with activated sludge, fol-
lowed by two hours’ settlement, sample of purified effluent taken, remaining contents of bottle aerated for 14 to 16 hours longer.
Bottle B. Sewage aerated in contact with activated sludge for ten hours, sample taken at end of six hours.
This operation was repeated twice during the twenty-four hours.Bottle C. Sewage aerated in contact with activated sludge for six hours,
sample taken and purified effluent removed as in A. Sludge was then aerated for the remainder of the day.
Bottle D. Sewage aerated for six hours in contact with activated sludge, followed by two hours’ settlement and subsequent removal of purified efflu-ent by decantation.
This operation was repeated three times during the twenty-four hours.It will be seen that with similar aeration the sludge in bottle D. dealt with
three volumes of sewage to two volumes in case of bottle B. and one volume in the case of bottle A., while the sludge in bottle C. also only dealt with one volume of sewage, but the amount of air required for aeration was reduced by the fact that for from 14 to 16 hours the sludge alone was aerated.
A series of results obtained during the course of this experiment are given in Table 4 (p. 528*).
The results of the first experiment of this series (Experiment 54) are given in order to show that the activity of the sludge in each case was identical. As
TABLE IIIResults of Sectionised Experiments
Results in parts per 100,000
Experiment 40 Experiment 41 Experiment 45 Experiment 47
Raw sewage Effluent after aeration in contact with Raw sewage Effluent after aeration in
contact with Raw sewage Effluent after aeration in contact with Raw sewage Effluent after aeration in
contact with
Shaken Settled α sludge
β sludge
αβ sludge Shaken Settled α sludge β
sludgeαβ
sludge Shaken Settled α sludge β sludge αβ sludge Shaken Settled α
sludgeβ
sludgeαβ
sludge
4 Hours oxygen absorption 12.68 8.92 3.26 2.28 2.34 9.70 6.63 2.86 2.06 2.00 10.06 7.90 3.48 2.70 2.09 17.14 13.00 6.00 3.28 2.94Per cent. reduction
calculated on
Raw sewage 74 82 81 71 80 80 65 75 80 65 81 83
Settled Sewage 63 74 73 57 69 70 56 66 74 54 75 77
Free and saline ammonia 3.86 3.86 3.86 3.00 3.28 3.28 3.70 3.28 2.86 4.28 4.14 3.43
Per cent. reduction calculated on raw sewage nil nil nil nil 11 23 3 20
Albuminoid ammonia 1.70 1.04 .36 .36 1.10 .50 .25 .245 1.10 .70 .405 .35 1.61 1.02 .405 .45Per cent. reduction
calculated on
Raw sewage 79 79 77 78 63 68 75 72
Settled sewage 65 65 50 51 42 50 60 56
nitrite and nitrate (in terms of nH3) .12 .36 .11 .17 .12 .16 .04 .06
Per cent. of ammonia oxidised 3 9 4 6 3 4 1 1
Temperature 6.2°C. 5.5°C. 7.5°C. 7.5°C. 9.0°C.α Sludge = Partially activated sludge - non-nitrifying
β and αβ Sludge = Thoroughly activated sludge - capable of vigorously promoting nitrification

Winter 2014 | V 50, N 1 Environmental Engineer & Scientist | 17
the experiment proceeded, while the oxidation effect as measured by the oxy-gen absorption test differed only slightly according to the method of work-ing, a marked difference was observed in the amount of nitrification. In the case of the sludge contained in Bottle A., which only dealt with one sample of sewage per day, the nitrification was maintained as in the first experiment, but in each of the other methods of working the nitrification was seriously impaired, in fact almost inhibited.
It was observed, however, that the sludge in Bottle C. after the removal of the oxidised effluent, had not been well aerated during the period of working. Accordingly means were adopted to improve this aeration. The results obtained during the second and third week’s working, of which typical examples are given (Experiments 59-66) show that the effect of this improved aeration was to main-tain the activity of the sludge and consequently to yield similar results to those obtained when the whole of the sewage and sludge was aerated for 22 hours.
TABLE IVOxidation of Manchester Sewage Under Various ConditionsA = 1 Filling with 20 hours aeration.B = 2 Fillings with 10 hours aeration each
C = Filling with 6 hours aeration with subsequent aeration of sludge aloneD = 3 Fillings with 6 hours aeration each
FIRST WEEK
Results in parts per 100,000
Experiment 54 Experiment 55 Experiment 56 Experiment 57
Original After 6 hours aeration Original After 6 hours aeration Original After 6 hours aeration. Original After 6 hours aeration.
Shaken Settled A B C D Shaken Settled A B C D Shaken Settled A B C D Shaken Settled A B C D
4 Hours oxygen absorption 15.90 9.30 1.71 1.77 1.91 1.69 14.74 9.60 1.86 2.09 2.57 2.00 13.60 10.50 1.66 1.83 2.28 2.09 16.80 9.90 1.48 1.52 1.86 2.00
Per cent. reduction calculated
on
Raw sewage 89 89 88 89 87 86 83 86 88 87 83 85 91 91 89 88
Settled sewage 82 81 79 82 81 78 73 79 84 82 78 80 85 85 81 80
Free and saline ammonia 4.60 -- 2.86 2.86 2.86 2.70 3.60 -- 2.57 3.43 3.30 3.15 3.50 -- 1.30 2.30 2.36 2.30 3.30 -- 1.57 2.43 2.00 2.57
Per cent. reduction calculated on raw sewage
38 38 38 41 29 5 8 12 65 37 36 37 52 26 39 22
Albuminoid ammonia 1.19 .73 .25 .26 .265 .25 1.04 .73 .22 .22 .305 .205 .84 .50 .28 .205 .205 .35 .87 .47 .135 .135 .15 .18
Per cent. reduction calculated
on
Raw sewage 78 78 78 79 79 79 71 80 67 76 76 58 84 84 83 79
Settled sewage 66 64 64 66 70 70 58 72 44 59 59 30 71 71 68 62
nitrite and nitrate (in terms of nH3)
-- -- .91 .91 .86 1.00 -- -- .86 .06 .14 .06 -- -- 1.02 .12* .12 nil -- -- .71 .17 .20 .07
Per cent. of ammonia oxidised 20 20 19 22 24 2 4 2 29 3 3 nil 22 3 6 2
SECOnD WEEK THIRD WEEK
Experiment 59 Experiment 62 Experiment 65 Experiment 66
Shkn. Sttld. A B C D Shkn. Sttld. A B C D Shkn. Sttld. A B C D Shkn. Sttld. A B C D
4 Hours oxygen absorption total 15.20 10.50 2.09 1.92 2.03 2.26 16.68 11.00 1.46 2.20 1.52 3.37 14.86 10.00 1.74 2.03 1.71 2.57 15.66 11.20 1.46 1.74 1.51 2.74
Crystalloids 6.57 1.00 1.06 .94 1.34 6.63 -- -- -- -- 5.37 1.09 1.12 1.11 1.31 6.52 1.06 1.03 .97 1.71
Colloids, etc. 3.93 1.09 .86 1.09 .92 4.37 -- -- -- -- 4.63 .66 .91 .60 1.26 4.68 .40 .71 .54 1.03
Per cent. reduction calculated
on
Raw sewage 86 87 87 85 91 87 91 80 88 86 89 83 91 89 90 83
Settled sewage 80 82 81 79 87 80 86 69 83 80 83 74 87 84 87 76
Free and saline ammonia 3.57 -- 2.14 2.72 2.14 2.86 3.86 2.14 3.70 2.28 4.14 3.93 2.43 3.14 2.00 3.43 3.60 1.70 2.30 1.70 3.15
Per cent. reduction calculated on Raw sewage
40 24 40 20 45 4 41 -- 38 20 49 13 53 36 52 13
Albuminoid ammonia 1.16 .62 .18 .18 .18 .205 1.27 .79 .205 .265 .18 .39 1.10 .53 .165 .22 .15 .28 1.58 .62 .105 .165 .105 .25
Per cent. reduction calculated
on
Raw sewage 84 84 84 82 84 79 86 69 85 80 86 73 93 90 93 84
Settled sewage 71 71 71 68 74 67 77 57 69 58 72 47 83 73 83 60
nitrite and nitrate (in terms of nH3)
396 .38 .60 .09 .17 .03 .22 .04 .20 nil .19 nil .36 .03 .33 nil
Per cent. of ammonia oxidised 27 11 17 3 4 1 6 1 5 nil 5 nil 10 1 9 nil
*12 is in the original article. Believed by the editors of this publication to be 0.12.

18 | Environmental Engineer & Scientist Winter 2014 | V 50, N 1
It will be seen that the results obtained with the sludge contained in Bot-tle D. gradually deteriorate with the total inhibition of nitrification. In the case of the sludge in Bottle B. the falling off in its activity was not so marked, although the nitrification was considerably reduced.
It is evident from the results of this experiment that the activity of the sludge is gradually diminished, when working on the fill and draw method, if it is called upon to treat further samples of crude sewage, prior to the com-plete nitrification of the previous sample dealt with.
The results also show that this difficulty may be overcome by simple aera-tion of the sludge alone, until the free and saline ammonia content is removed.
InFLUEnCE OF TEMPERATURE
In order to determine the influence of temperature on the oxidation pro-cess a series of experiments extending over several weeks were carried out on the aeration of Manchester sewage in contact with activated sludge at
temperatures varying from 5°-30°C. A number of typical results are given in Tables 5, 6, and 7 (pp. 529-531*).
It should be mentioned that in all the experiments quoted in this section of the work, the activated sludge dealt with one volume only of sewage per day. Samples were taken after three, six and nine hours’ aeration respectively and then aeration was resumed until the next dose of sewage was treated.
It was found that the oxidation process could be maintained within a fairly wide range of temperature. At temperatures constantly below 10°C., a very marked deterioration in the results was observed, especially with regard to the removal of the colloidal matters. Also nitrification was practically in-hibited within a period of nine hours’ aeration. It is fairly evident that this effect would be accumulative over a prolonged period of working with the probable eventual production of inactive sludge.
At temperatures varying from 12 - 14°C., which is the usual air tempera-ture of the laboratory, the activity of the sludge was well maintained with the production at all times of a satisfactory effluent.
It was further observed that with a temperature of 20°C. equally good results were obtained as regards the removal of the oxidisable matter and clarification effect, with an increase in nitrification during the later periods of aeration.
Working with temperatures as high as 30°C. it was found that the initial clarification effect was to some extent interfered with and that the effluent resulting from subsequent settlement showed a slight deterioration as com-pared with that obtained when working at temperatures from 12 - 20°C. This effect became less marked as the aeration continued and once nitrification was established it proceeded at a slightly increased rate as compared with that obtained at temperatures below 20°C.
OxIDATIOn OF VARIOUS SEWAGES
It was thought of interest to compare the results obtained with Manchester sewage, which contains an undue proportion of a variety of trade efflu-ents, with those of more purely domestic sewage.Samples of sewage were therefore obtained from the following sewage
works:(a) Moss Side Sewage Works Urmston(b) Withington Sewage Works Chorlton(c) Gorton Sewage Works Gorton(d) Macclesfield Sewage Works PrestburyIn view of the difficulty of obtaining average representative samples of
sewage from the above works, it was decided to work with samples of maxi-mum strength, i.e., in each case the samples were taken in the after, and con-
TABLE VEffect of Temperature
Results in parts per 100,000 Temp.
Experiment 93 Experiment 94 Experiment 95 Experiment 96
Raw sewage. After aeration for Raw sewage After aeration for Raw sewage After aeration for Raw sewage After aeration for
Shaken Settled 3 Hrs. 6 Hrs. 9 Hrs. Shaken Settled 3 Hrs. 6 Hrs. 9 Hrs. Shaken Settked 3 Hrs. 6 Hrs. 9 Hrs. Shaken Settled 3 Hrs. 6 Hrs. 9 Hrs.
4 Hours oxygen absorption
Total 5° C 10.63 7.370 2.23 1.88 1.60 15.31 9.00 3.03 2.74 2.69 13.94 7.80 3.09 2.72 2.83 11.80 8.50 2.80 2.63 2.28
Crystalloids 5° C 5.26 1.16 .91 .88 5.09 1.44 1.26 1.17 4.34 1.32 1.06 1.04 4.80 1.23 1.09 1.00
Colloids, etc. 5° C 2.44 1.07 .97 .72 3.91 1.59 1.48 1.52 3.46 1.77 1.66 1.79 3.70 1.57 1.54 1.28
Total 15° C 1.57 1.37 1.29 2.29 1.48 1.49 1.97 1.40 1.17 1.77 1.37 1.17
Crystalloids 15° C .88 .83 .83 1.26 .94 .96 1.16 .83 .77 1.16 .81 .71
Colloids, etc. 15° C .69 .54 .46 1.03 .54 .53 .81 .57 .40 .61 .56 .46
Per cent. reduction
calculated on
Raw sewage 5° C 79 82 85 80 82 82 78 81 80 76 78 81
Do. 15° C 85 87 88 85 90 90 86 90 92 85 88 90
Settled sewage 5° C 71 76 79 66 70 70 60 65 64 67 69 73
Do. 15° C 80 82 83 75 84 84 75 82 85 79 84 86
Colloids, etc, removed 5° C 1.37 1.47 1.72 2.32 2.43 2.39 1.69 1.80 1.67 2.13 2.16 2.4215° C 1.75 1.90 1.98 2.88 3.37 3.38 2.65 2.89 3.06 3.09 3.14 3.24
Free and Saline ammonia 5° C 4.43 4.43 4.43 4.00 3.71 3.86 3.86 3.57 3.36 3.29 2.50 2.50 2.64 2.36 2.21 3.28 3.28 2.64 2.64 2.4315° C 3.80 3.07 2.43 3.07 2.28 1.36 1.93 1.12 .23 2.43 2.07 1.14
Per cent. reduction 5° C nil 10 16 7 13 15 nil 5 12 20 20 2615° C 14 30 45 20 41 65 23 55 91 26 37 65
Albuminoid ammonia 5° C .98 .54 .27 215 .165 1.16 .62 .335 .37 .42 1.30 .56 .40 .35 .35 .98 .46 .28 .305 .2715° C .165 .13 .065 .23 .205 .165 .215 .15 .08 .15 .17 .115
Per cent. reduction
calculated on
Raw sewage 5° C 72 78 83 71 68 64 69 73 73 71 69 72
Do. 15° C 83 87 93 80 82 86 83 88 94 85 83 88
Settled sewage 5° C 50 60 69 46 40 32 28 37 37 39 34 41
Do. 15° C 69 76 88 63 67 73 62 73 86 67 63 75
nitrite and nitrate 5° C .07 .17 .26 .04 .06 .06 .03 .04 .14 .14 .07 .12
(in terms of nH3) 15° C .07 .54 .97 .04 .40 .86 .10 .60 1.14 .04 .27 .54
Per cent of ammonia 5° C 2 4 6 1 2 2 1 2 6 4 2 4
Oxidised 15° C 2 12 22 1 10 22 4 24 46 1 8 16

Winter 2014 | V 50, N 1 Environmental Engineer & Scientist | 19
sequently this fact must be borne in mind in considering the results which are given in Tables 8 and 9.
In connection with these results attention should be drawn to the fol-lowing:
(A) MOSS SIDE SEWAGE
Experiments on this sewage were carried out in the earlier part of the investigation and consequently the proportion of activated sludge to the sewage treated was considerably less that in the later experiments.
Further in order to more clearly demonstrate the actual oxidation effect of the activated sludge in the control experiment the sewage aerated alone was diluted with a volume of tap water equal to that of the sludge employed in the experiment. The analytical figures given for the shaken sample of sewage refer to the sample actually taken plus the diluting water.
Sample A
This was a Monday afternoon sample, and obviously contained an excessive amount of soapy matter. It will be seen from the table that this soapy mat-
ter exerted a considerable emulsification or deflocculation effect as shown by the increase in the four hours’ oxygen absorption and albuminoid ammonia
of the “original” settled sample after mixing with the activated sludge, and in consequence of this effect the results obtained were not so striking as the previ-ous ones, although considerable nitrification was obtained within six hours. It would appear that in the case of sewages containing undue proportion of soapy matter, preliminary treatment with lime might be advantageously employed.
Sample B
It will be seen from the analytical returns that this was a stronger sewage than the preceding one, but contained less soap. In this case no preliminary
emulsification was observed and a much greater purification was effected in the earlier stages of aeration.
(B) WITHInGTOn SEWAGE
The sewage from the Withington works was considerably weaker than that received from the Moss Side works and consequently as would be anticipated, complete oxidation ensued within a greatly reduced
period of aeration. It may be noted that two hours’ aeration in contact with activated sludge, with subsequent settlement was sufficient to produce an ef-fluent which was non-putrefactive on incubation.
TABLE VIEffect of Temperature
Results in parts per 100,000 Temp.
Experiment 73 Experiment 74 Experiment 75 Experiment 76
Raw sewage After aeration for Raw sewage After aeration for Raw sewage After aeration for Raw sewage After aeration for
Shaken Settled 3 Hrs. 6 Hrs. 9 Hrs. Shaken Settled 3 Hrs. 6 Hrs. 9 Hrs. Shaken Settled 3 Hrs. 6 Hrs. 9 Hrs. Shaken Settled 3 Hrs. 6 Hrs. 9 Hrs.
4 Hours oxygen absorption
13°C 12.11 8.30 1.46 10.50 6.40 1.26 1.26 .91 10.30 7.40 1.51 1.31 1.09 12.10 8.80 1.66 1.37 1.3720°C 1.49 1.23 1.29 .91 1.63 1.31 1.03 1.63 1.31 1.4030°C 2.20 2.03 1.97 1.51 1.91 1.49 1.89 2.11 1.71 --
Per cent. reduction calculated
on
Raw sewage 13°C 88 88 88 91 85 87 89 86 89 89
Do. 20°C 88 88 88 91 84 87 90 87 89 88
Do. 30°C 82 81 81 86 81 86 82 83 86 80
Settled sewage 13°C 82 80 80 86 80 82 85 81 84 84
Do. 20°C 82 81 80 86 78 82 86 82 85 84
Do. 30°C 74 68 69 76 74 80 75 76 81 --
Free and saline ammonia 13°C 3.80 2.14 2.14 1.43 .71 nil 2.56 2.14 1.43 .54 2.56 2.14 1.64 .7920°C 2.43 1.29 .23 nil 2.14 1.29 .20 2.21 1.57 .3630°C 2.57 1.57 .57 nil 2.36 1.71 .29 2.29 1.93 .60
Per cent. reduction calculated on raw sewage 13°C 41 33 67 100 16 44 79 16 36 69
20°C 36 40 89 100 16 50 92 14 39 8630°C 32 27 73 100 8 33 89 11 25 77
Albuminoid ammonia 13°C .96 .61 .105 .84 .36 .13 .10 .08 .70 .44 .165 .13 .095 .96 .64 .16 .105 .0820°C .105 .10 .10 .08 .18 .115 .095 .15 .105 .0830°C .265 .22 .165 .11 .20 .165 .105 .20 .15 .12
Per cent. reduction calculated
on
Raw sewage 13°C 89 85 88 90 76 81 86 83 89 92
Do. 20°C 89 88 88 90 74 84 86 84 89 92
Do. 30°C 72 74 80 87 71 76 85 79 84 88
Settled sewage 13°C 83 64 72 78 63 70 78 75 84 88
Do. 20°C 83 72 72 78 59 74 78 77 84 88
Do. 30°C 57 39 54 69 55 63 76 69 77 81
nitrite and nitrate (in terms of nH3) 13°C .63 .10 .44 1.34 .11 .81 1.19 .10 .50 1.2120°C .21 .17 .76 1.31 .09 .56* 1.43 nil .57 1.6430°C .06 .09 .60 1.17 .03 .31 1.24 .03 .21 1.00
Per cent. of ammonia oxidised 13°C 17 5 21 63 4 32 46 4 19 47
20°C 6 8 32 61 3 20 56 nil 20 6430°C 2 4 28 55 1 12 48 1 8 39
*The original article had 56; an obvious mistake.

20 | Environmental Engineer & Scientist Winter 2014 | V 50, N 1
(C) GORTOn SEWAGE
It is evident from the analysis given in Table 9 that the sample dealt with was an exceedingly strong sewage. With three hours’ aeration a remarkable change was effected as measured by the usual tests. After
six hours’ aeration an extremely well clarified effluent was obtained, but unfortunately owing to an accident it is not possible to give the chemi-cal analysis.
Despite the highly concentrated nature of this sewage 9 hours’ aeration was sufficient to yield an entirely satisfactory effluent showing a rather higher percentage purification on the raw sewage than that which is yielded by ef-ficient bacterial filters. Within a period of 9-18 hours the whole of the free and saline ammonia was removed from the sewage.
(D) MACCLESFIELD SEWAGE
The sample of Macclesfield sewage was very turbid and was said to con-tain waste refuse of a mucilaginous character derived from silk works. With this type of sewage the oxidation proceeds satisfactorily although
the percentage purification effected is not quite so good as in the case of Gor-ton sewage. A well clarified effluent was obtained with six hours’ aeration in contact with activated sludge and subsequent settlement. The whole of the free saline ammonia was removed within a period of sixteen hours.
QUALITy OF EFFLUEnTS
It has frequently been observed that effluents obtained from the oxidation process, while having a comparatively low oxygen absorption as measured by the permanganate test and a low albuminoid ammonia content, may ab-
sorb an undue proportion of dissolved oxygen on incubation for a number of days. When once the free and saline ammonia content of an effluent is very considerably lowered even without material alteration in the four hours’ oxygen absorption and albuminoid ammonia figures, the amount of dissolved oxygen absorbed by the effluent is enormously reduced. It would thus appear that the stage to which nitrification has advanced is one of the factors governing the amount of dissolved oxygen absorbed by an effluent. Experiments are in progress with a view to throwing further light on this subject, but the data so far available is insufficient to allow of any definite conclusions. It is quite certain however, that in the effluents obtained, the amount of oxygen absorbed from permanga-nate bears no relation whatever to the amount of dissolved oxygen absorbed.
ACTIVATED SLUDGE
Activated sludge accumulated in the manner previously described is quite inoffensive, dark brown in colour and flocculent in character, and despite its low specific gravity separates from water or sewage at
a rapid rate. After prolonged settlement the activated sludge however rarely contains less than 95 per cent of water.
TABLE VIIEffect of Temperature
Results in parts per 100,000 Temp.
Experiment 79 Experiment 80 Experiment 81 Experiment 82
Raw sewage. After aeration for Raw sewage After aeration for Raw sewage After aeration for Raw sewage. After aeration for
Shaken Settled 3 Hrs. 6 Hrs. 9 Hrs. Shaken Settled 3 Hrs. 6 Hrs. 9 Hrs. Shaken Settled 3 Hrs. 6 Hrs. 9 Hrs. Shaken Settled 3 Hrs. 6 Hrs. 9 Hrs.
4 Hours oxygen absorption 13°C 11.66 8.30 1.80 1.09 1.03 11.77 8.40 2.20 1.43 1.20 13.37 9.40 2.00 1.37 1.20 13.60 8.80 1.77 1.31 1.2920°C 2.17 1.28 1.11 1.97 1.54 1.26 2.37 1.37 1.34 2.06 1.43 1.1230°C 3.26 2.06 1.43 2.60 1.77 1.40 3.26 2.06 1.71 2.51 1.69 1.66
Per cent. reduction calculated
on
Raw sewage 13°C 85 91 91 81 88 90 85 90 91 87 90 90
Do. 20°C 81 89 90 84 87 89 82 88 90 85 89 92
Do. 30°C 72 82 88 78 85 88 76 85 87 82 88 88
Settled sewage 13°C 78 87 88 74 83 86 79 85 87 80 85 85
Do. 20°C 74 85 87 77 82 85 75 83 86 77 84 87
Do. 30°C 61 75 83 69 79 83 65 78 82 72 81 81
Free and saline ammonia 13°C 2.86 2.86 1.93 1.14 .39 3.20 3.20 2.57 1.93 1.57 3.70 3.70 2.80 2.00 1.13 3.70 3.70 2.57 1.71 1.1420°C 2.00 .93 nil 2.36 1.29 nil 2.93 2.21 1.00 2.64 1.64 .6430°C 2.43 1.64 .53 2.57 1.93 .80 3.07 2.86 1.50 2.80 2.22 .60
Per cent. reduction calculated on raw sewage 13°C 33 60 86 20 40 51 24 46 69 31 54 6920°C 30 67 100 26 60 100 21 40 73 20 56 8330°C 15 42 82 20 40 75 17 23 59 24 40 84
Albuminoid ammonia 13°C .84 .50 .205 .095 .065 .98 .50 .215 .12 .10 1.36 .70 .18 .105 .08 .98 .62 .165 .105 .08520°C .23 .105 .07 .205 .13 .10 .22 .13 .08 .195 .105 .08530°C .45 .22 .12 .23 .165 .12 .405 .25 .18 .23 .12 .085
Per cent. reduction calculated
on
Raw sewage 13°C 76 80 92 78 88 90 87 92 94 73 89 91
Do. 20°C 73 87 92 79 87 90 84 91 94 80 89 91
Do. 30°C 46 74 86 77 73 88 70 82 87 77 88 91
Settled sewage. 13°C 59 81 87 57 76 80 74 85 89 73 83 86
Do. 20°C 54 79 86 59 74 80 69 81 89 69 83 86
Do. 30°C 10 56 76 54 67 76 42 64 74 63 81 86
nitrite and nitrate (in terms of nH3) 13°C .06 1.14 1.79 .06 .43 .69 .10 .51 .92 .10 .31 1.2020°C .03 1.14 1.83 .04 .69 1.83 nil .28 1.06 nil .46 1.4830°C nil .57 1.14 .03 .31 .83 nil .20 .52 nil .20 1.20
Per cent. of ammonia oxidised 13°C 2 40 63 2 14 22 3 14 25 3 8 3220°C 1 40 64 1 22 57 nil 8 29 nil 12 4030°C 0 20 40 1 10 26 nil 5 14 nil 5 32

Winter 2014 | V 50, N 1 Environmental Engineer & Scientist | 21
A remarkable separation of the water from the sludge can be readily ob-tained by treatment of fine grade strainers with the production of a sludge of the consistency of a stiff jelly.
Gelatine counts have shown a bacterial content of at least 30 million or-ganisms per cubic centimetre. In addition, the sludge by reason of its nitrify-ing power must of necessity contain a large number of nitrifying organisms.
It should also be noted that a fairly large number of a variety of protozoa are to be found and we are indebted to Mr. James Crabtree for assistance in regard to the enumeration and identification of these higher forms of life. It does not however contain any algal growths.
The chemical analysis of an average sample of the activated sludge is as follows:
PercentageOrganic matter ............................................................. 64.7Mineral matter .............................................................. 35.3Total nitrogen (N)........................................................... 4.6Phosphate (P4O3) ............................................................ 2.6Matter extracted by CCl4 ................................................ 5.8
Attention should be drawn to the abnormally high percentage of nitrogen as compared with ordinary un-oxidised sewage sludge.
TABLE VIIIOxidation of Various Sewages
Moss Side Sewage
Results in parts per 100,000
Sample A Sample B
Original After aeration for Original After aeration for
Shaken
After 2 hrs. settlement 3 Hours 6 Hours 12 Hours 24 Hours
Shaken
After 2 hrs. settlement 3 Hours 6 Hours 12 Hours 24 Hours
Alone + sludge Sewage Sewage + sludge Sewage Sewage
+ sludge Sewage Sewage + sludge Sewage Sewage
+ sludge Alone + sludge Sewage Sewage
+ sludge Sewage Sewage + sludge Sewage Sewage
+ sludge Sewage Sewage + sludge
4 Hours oxygen absorption (total) 9.83 8.57 10.88 8.71 5.55 8.88 4.00 5.76 2.16 3.60 1.49 11.66 9.00 8.10 8.50 2.74 7.60 2.34 4.16 1.54 3.43 1.51
Crystalloids 4.06 3.88 3.68 1.62 3.54 1.26 2.00 .96 -- -- 4.23 3.89 2.86 1.57 2.967 1.11 -- -- -- --
Colloids, etc. 4.51 7.00 5.03 3.93 5.34 2.74 3.76 1.20 -- -- 4.77 4.21 5.61 1.17 4.63 1.23 -- -- -- --
Per cent. reduction calculated
on
Shaken sample 13 nil 10 43 8 59 41 78 63 85 23 30 27 77 35 80 64 87 71 87
Settled sample -- nil nil 35 nil 53 33 75 58 83 -- 10 6 70 16 74 54 83 62 83
Free and saline ammonia 6.00 6.00 6.14 6.07 5.43 5.71 4.43 5.14 3.28 3.57 1.14 6.00 6.00 6.00 5.57 4.29 5.14 3.29 3.43 1.21 2.86 nil
Per cent. reduction -- nil nil 10 5 26 11 45 40 81 -- nil 7 29 14 45 43 80 52 100
Albuminoid ammonia 1.19 .96 1.36 .90 .67 .83 .33 .74 .29 .585 .15 2.20 1.27 1.26 1.09 .40 .83 .22 .79 .16 .63 .10
Per cent. reduction calculated
on
Shaken sample 19 nil 24 44 30 72 38 76 51 87 42 43 50 82 62 90 64 93 71 95
Settled sample -- nil 6 30 13 66 23 70 39 84 -- 1 11 69 35 83 38 89 50 92
nitrite and nitrate (in terms of nH3)
nil .12 nil .42 nil .98 nil 1.43 nil 3.92 nil .07 nil .50 nil 1.14 nil 2.57 nil 3.50
Per cent. of ammonia oxidised nil 2 nil 7 nil 16 nil 24 nil 65 nil 1 nil 8 nil 19 nil 43 nil 58
Withington Sewage
Original After aeration for Original After aeration for
Raw sewage 2 Hours 4 Hours 6 Hours 9 Hours Raw sewage 3 Hours 6 Hours 7 Hours
Shaken Settled Alone + sludge Alone + sludge Alone + sludge Alone + sludge Shaken Settled Alone + sludge Alone + sludge Alone + sludge
4 Hours oxygen
absorption
Total 5.12 3.77 2.86 1.28 2.17 1.03 2.06 1.00 1.71 1.00 5.60 2.92 2.29 1.53 1.88 1.20 1.88 1.26
Crystalloids 1.49 1.17 .54 .88 .56 .94 .51 -- -- -- -- .91 .69
Colloids, etc. 2.28 1.69 .74 1.29 .47 1.12 .49 -- -- -- -- .97 .57Per cent. reduction calculated
on
Shaken sample 26 44 75 58 80 60 80 67 80 -- 48 59 73 67 79 67 78
Settled sample -- 24 66 42 73 45 74 55 74 -- -- 22 48 36 59 36 57
Free and saline ammonia 2.78 2.78 2.28 1.80 2.14 1.07 2.14 .64 2.21 .09 2.29 1.86 1.36 1.29 1.40 .26 1.36 nil
Per cent. reduction -- -- 18 35 23 62 23 77 21 97 -- 19 41 44 39 89 41 100
Albuminoid ammonia .815 .50 .405 .15 .405 .08 .38 .08 .42 .07 .70 .30 .285 .15 .23 .06 .15 .05Per cent. reduction calculated
on
Shaken sample -- 39 50 82 50 90 53 90 48 91 -- 57 59 79 67 91 79 93
Settled sample -- -- 19 70 19 84 24 84 16 86 -- -- 5 50 23 80 50 83
nitrite and nitrate (in terms of nH3)
.23 .50 .215 1.31 .06 1.50 .09 1.72 nil .46 nil 1.09 nil 1.37
Per cent. of ammonia oxidised 8 18 8 47 2 54 3 62 nil 20 nil 48 nil 60

22 | Environmental Engineer & Scientist Winter 2014 | V 50, N 1
nATURE OF REACTIOn
Up to the present the authors have not seriously investigated the ac-tual mechanism of the process and consequently no attempt has been made to differentiate between the part played by physical, chemical
and biological agencies, all of which are doubtless, in varying degrees respon-sible for the total purification change. As to whether the protozoa content has any influence or not on the extent of the purification has yet to be determined, although it would appear that they rather indicate a particular condition of the activated sludge than play an important part in the changes effected.
While as previously stated no serious attempt has been made to determine to what extent bacterial agencies are concerned with the purification process, an experiment has been made on the effect produced by the aeration of sew-age in contact with activated sludge both before and after steam sterilisation.
The results of this experiment are given in Table 10, from which it will be seen that activated sludge when sterilised under these conditions had no purification effect whatever (see p. 533*).
It must be borne in mind, however, that the physical characteristics of the activated sludge may be seriously altered by the steam process and conse-quently some other method of sterilisation, e.g., by means of ultra-violet rays might yield somewhat different results.
SUMMARy AnD COnCLUSIOnS
The foregoing investigations have established:
1. That the resultant solid matter obtained by prolonged aeration of sewage, which has been termed activated sludge, has the property of enormously increasing the purification effected by simple aeration of sewage, or in other words it greatly intensifies the oxidation process.
2. The extent of the accelerating effect depends upon the intimate man-ner in which the activated sludge is brought into contact with, and upon its proportion to, the sewage treated.
3. That in order to maintain the sludge at its highest efficiency it is neces-sary that there should not be at any time an accumulation of unoxi-dised sewage solids.
It is not necessary that the sewage should be kept in contact with the activated sludge until such conditions obtain, as its activity may be maintained by suitable aeration of the activated sludge alone.
4. That temperature exerts a considerable influence on the oxidation process. The purification effected is seriously diminished at tempera-tures constantly below 10°C. Up to 20-24°C. no material difference in the clarification effect and general purification has been observed although the nitrification change proceeds more rapidly as the tem-perature rises. At higher temperatures the clarification effect is some-what interfered with during the earlier period of aeration, with a consequent delay in the establishment of nitrification. Subsequently the rate of nitrification somewhat increases.
5. That under the conditions of experiment a well oxidised effluent can be obtained by the aeration of average strength Manchester sewage in contact with activated sludge for a period of from six to nine hours. The percentage purification effected as measured by the usual tests is
TABLE IxOxidation of Various Sewages
Results in parts per 100,000
Gorton Macclesfield
Raw sewageAfter aeration for
Raw sewageAfter aeration for
3 Hours 9 Hours 3 Hours 6 Hours 9 Hours
Shaken Settled Alone + sludge Alone + sludge Shaken Settled Alone + sludge Alone + sludge Alone + sludge
4 Hours Oxygen
absorption
Total 15.43 11.70 9.49 2.57 6.86 1.28 12.57 9.10 8.50 2.72 7.30 1.66 6.50 1.37
Crystalloids 6.28 4.57 1.54 2.52 .80 4.06 3.66 1.12 2.51 .80 2.46 .74
Colloids, etc. 5.42 4.92 1.03 4.34 .48 5.04 4.84 1.60 4.70 .86 4.04 .63Per cent. reduction
calculated on
Raw sewage 24 38 83 55 92 27 32 78 42 87 48 89
Settled sewage 19 78 41 89 7 70 20 82 29 85
Colloids, etc., removed .50 4.39 1.08 4.94 .20 3.44 .25 4.18 1.00 4.41
Free and saline ammonia 5.72 5.72 5.72 4.26 4.57 1.43 3.80 3.80 3.71 3.00 3.71 2.21 3.71 1.00
Per cent. reduction 0 25 20 75 2 21 2 42 2 74
Albuminoid ammonia 2.01 1.50 1.37 .42 1.03 .15 1.62 1.16 -- .50 -- .265 -- .18Per cent. reduction
calculated on
Raw sewage 25 31 79 48 92 28 69 84 89
Settled sewage 9 72 31 90 57 77 85
nitrite and nitrate (in terms of nH3) .03 .04 .06 1.22 nil .10 nil .50 nil 1.14
Per cent. of ammonia oxidised 1 1 1 21 0 3 0 13 0 30
TABLE xEffect of Sterilisation of Sludge
Sewage (diluted)* alone Sewage + sterile sludge Sewage + active sludge
Raw sewage Diluted* raw sewage Original After aeration for Original After aeration for Original After aeration for
Shaken Settled Shaken Settled 3 Hrs. 9 Hrs. 18 Hrs. Settled 3 Hrs. 9 Hrs. 18 Hrs. Settled 3 Hrs. 9 Hrs. 18 Hrs.
4 Hours oxygen
absorption
Total 11.77 8.10 8.20 6.12 5.92 5.43 3.77 10.00 10.52 10.17 7.20 4.12 1.63 1.20 1.14
Crystalloids 3.88 4.00 3.54 2.86 5.63 5.76 5.26 3.40 2.50 .94 .77 .77
Colloids, etc. 2.24 1.92 1.89 .91 4.37 4.76 4.91 3.80 1.62 .69 .43 .37
Free and saline ammonia 3.30 3.30 2.95 2.86 2.86 2.36 2.07 2.95 2.86 2.64 2.50 2.95 2.71 1.72 .57
Albuminoid ammonia .87 .42 .61 .315 .305 .33 .26 2.50 2.23 2.04 1.81 .215 .105 .12 .105
nitrite and nitrate (in terms of nH3) .06 .06 nil .03 .12 nil nil nil .09 .12 .58 1.14
*Original sewage diluted with a volume of water equivalent to the volume of sludge employed in the experiment.
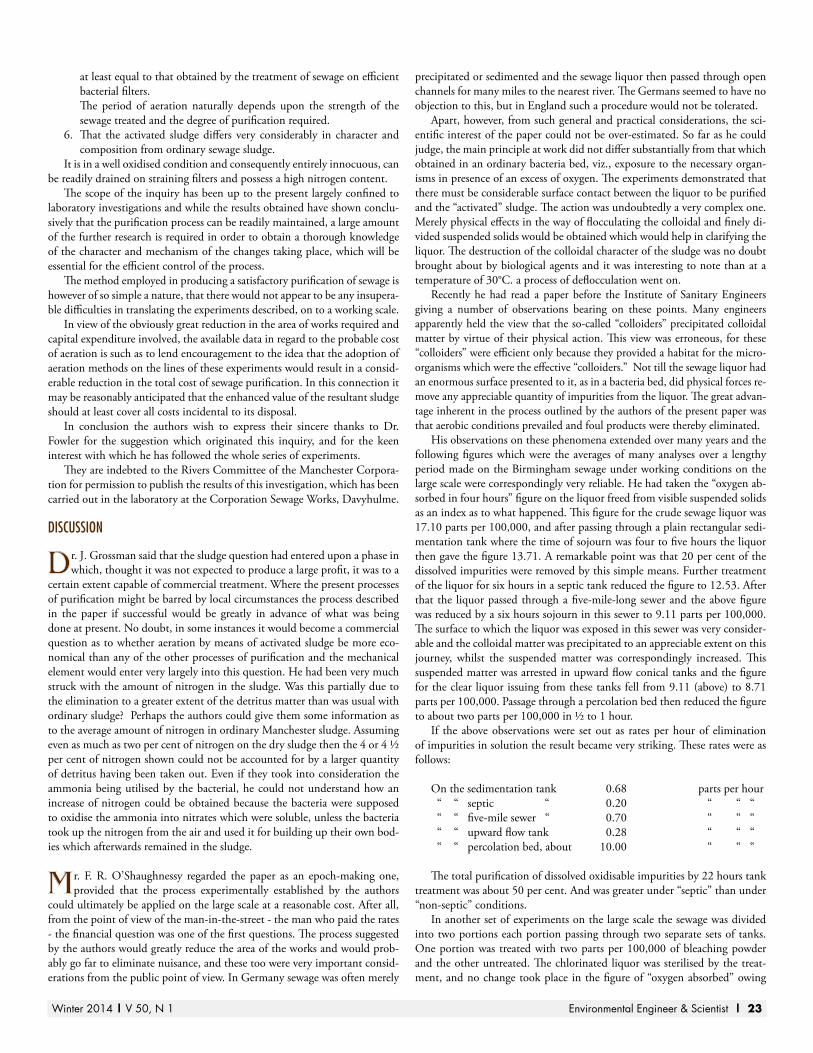
Winter 2014 | V 50, N 1 Environmental Engineer & Scientist | 23
at least equal to that obtained by the treatment of sewage on efficient bacterial filters.
The period of aeration naturally depends upon the strength of the sewage treated and the degree of purification required.
6. That the activated sludge differs very considerably in character and composition from ordinary sewage sludge.
It is in a well oxidised condition and consequently entirely innocuous, can be readily drained on straining filters and possess a high nitrogen content.
The scope of the inquiry has been up to the present largely confined to laboratory investigations and while the results obtained have shown conclu-sively that the purification process can be readily maintained, a large amount of the further research is required in order to obtain a thorough knowledge of the character and mechanism of the changes taking place, which will be essential for the efficient control of the process.
The method employed in producing a satisfactory purification of sewage is however of so simple a nature, that there would not appear to be any insupera-ble difficulties in translating the experiments described, on to a working scale.
In view of the obviously great reduction in the area of works required and capital expenditure involved, the available data in regard to the probable cost of aeration is such as to lend encouragement to the idea that the adoption of aeration methods on the lines of these experiments would result in a consid-erable reduction in the total cost of sewage purification. In this connection it may be reasonably anticipated that the enhanced value of the resultant sludge should at least cover all costs incidental to its disposal.
In conclusion the authors wish to express their sincere thanks to Dr. Fowler for the suggestion which originated this inquiry, and for the keen interest with which he has followed the whole series of experiments.
They are indebted to the Rivers Committee of the Manchester Corpora-tion for permission to publish the results of this investigation, which has been carried out in the laboratory at the Corporation Sewage Works, Davyhulme.
DISCUSSIOn
Dr. J. Grossman said that the sludge question had entered upon a phase in which, thought it was not expected to produce a large profit, it was to a
certain extent capable of commercial treatment. Where the present processes of purification might be barred by local circumstances the process described in the paper if successful would be greatly in advance of what was being done at present. No doubt, in some instances it would become a commercial question as to whether aeration by means of activated sludge be more eco-nomical than any of the other processes of purification and the mechanical element would enter very largely into this question. He had been very much struck with the amount of nitrogen in the sludge. Was this partially due to the elimination to a greater extent of the detritus matter than was usual with ordinary sludge? Perhaps the authors could give them some information as to the average amount of nitrogen in ordinary Manchester sludge. Assuming even as much as two per cent of nitrogen on the dry sludge then the 4 or 4 ½ per cent of nitrogen shown could not be accounted for by a larger quantity of detritus having been taken out. Even if they took into consideration the ammonia being utilised by the bacterial, he could not understand how an increase of nitrogen could be obtained because the bacteria were supposed to oxidise the ammonia into nitrates which were soluble, unless the bacteria took up the nitrogen from the air and used it for building up their own bod-ies which afterwards remained in the sludge.
Mr. F. R. O’Shaughnessy regarded the paper as an epoch-making one, provided that the process experimentally established by the authors
could ultimately be applied on the large scale at a reasonable cost. After all, from the point of view of the man-in-the-street - the man who paid the rates - the financial question was one of the first questions. The process suggested by the authors would greatly reduce the area of the works and would prob-ably go far to eliminate nuisance, and these too were very important consid-erations from the public point of view. In Germany sewage was often merely
precipitated or sedimented and the sewage liquor then passed through open channels for many miles to the nearest river. The Germans seemed to have no objection to this, but in England such a procedure would not be tolerated.
Apart, however, from such general and practical considerations, the sci-entific interest of the paper could not be over-estimated. So far as he could judge, the main principle at work did not differ substantially from that which obtained in an ordinary bacteria bed, viz., exposure to the necessary organ-isms in presence of an excess of oxygen. The experiments demonstrated that there must be considerable surface contact between the liquor to be purified and the “activated” sludge. The action was undoubtedly a very complex one. Merely physical effects in the way of flocculating the colloidal and finely di-vided suspended solids would be obtained which would help in clarifying the liquor. The destruction of the colloidal character of the sludge was no doubt brought about by biological agents and it was interesting to note than at a temperature of 30°C. a process of deflocculation went on.
Recently he had read a paper before the Institute of Sanitary Engineers giving a number of observations bearing on these points. Many engineers apparently held the view that the so-called “colloiders” precipitated colloidal matter by virtue of their physical action. This view was erroneous, for these “colloiders” were efficient only because they provided a habitat for the micro-organisms which were the effective “colloiders.” Not till the sewage liquor had an enormous surface presented to it, as in a bacteria bed, did physical forces re-move any appreciable quantity of impurities from the liquor. The great advan-tage inherent in the process outlined by the authors of the present paper was that aerobic conditions prevailed and foul products were thereby eliminated.
His observations on these phenomena extended over many years and the following figures which were the averages of many analyses over a lengthy period made on the Birmingham sewage under working conditions on the large scale were correspondingly very reliable. He had taken the “oxygen ab-sorbed in four hours” figure on the liquor freed from visible suspended solids as an index as to what happened. This figure for the crude sewage liquor was 17.10 parts per 100,000, and after passing through a plain rectangular sedi-mentation tank where the time of sojourn was four to five hours the liquor then gave the figure 13.71. A remarkable point was that 20 per cent of the dissolved impurities were removed by this simple means. Further treatment of the liquor for six hours in a septic tank reduced the figure to 12.53. After that the liquor passed through a five-mile-long sewer and the above figure was reduced by a six hours sojourn in this sewer to 9.11 parts per 100,000. The surface to which the liquor was exposed in this sewer was very consider-able and the colloidal matter was precipitated to an appreciable extent on this journey, whilst the suspended matter was correspondingly increased. This suspended matter was arrested in upward flow conical tanks and the figure for the clear liquor issuing from these tanks fell from 9.11 (above) to 8.71 parts per 100,000. Passage through a percolation bed then reduced the figure to about two parts per 100,000 in ½ to 1 hour.
If the above observations were set out as rates per hour of elimination of impurities in solution the result became very striking. These rates were as follows:
On the sedimentation tank 0.68 parts per hour “ “ septic “ 0.20 “ “ “ “ “ five-mile sewer “ 0.70 “ “ “ “ “ upward flow tank 0.28 “ “ “ “ “ percolation bed, about 10.00 “ “ “
The total purification of dissolved oxidisable impurities by 22 hours tank treatment was about 50 per cent. And was greater under “septic” than under “non-septic” conditions.
In another set of experiments on the large scale the sewage was divided into two portions each portion passing through two separate sets of tanks. One portion was treated with two parts per 100,000 of bleaching powder and the other untreated. The chlorinated liquor was sterilised by the treat-ment, and no change took place in the figure of “oxygen absorbed” owing
24 | Environmental Engineer & Scientist Winter 2014 | V 50, N 1
to passage through the tanks, whilst on the other hand an appreciable drop in the dissolved oxidisable impurities occurred in the liquor passing through the other set of tanks to which no bleaching powder had been added. These observations had a bearing on the process brought forward by Messrs. Ardern and Lockett, for they throw some light on the nature of the action. Broadly, his conclusions were that the grosser colloidal matters held by sewage liquors came down readily in ordinary continuous flow sedimentation tanks, that the great bulk of the colloidal matters - say 70 - 80 per cent - were held very tenaciously by the sewage liquor and were only removed by either biologi-cal agents, or physical forces suitably applied such for instance as in a well constructed and properly worked bacteria bed. In ordinary modern works practice probably the biological factors were the most potent, and the experi-ments carried out by the Authors indicated that this held good with respect to the new process they described.
One other point he wished to refer to was the part played by the nitrogen in these phenomena. He agreed with the authors that this behaviour was rather puzzling, and much work remained yet to be done on this most im-portant aspect of the question.
Mr. S. E. Melling thought the process described was ideal inasmuch as it resolved itself into a single-tank treatment. The greatest bugbear to
the sewage problem had been the question of sludge disposal. By means of the new system the sludge, activated in the manner described, became the friend rather than the enemy of the sanitary scientist. Had there been any estimation of the percentage of nitrogen during the different stages of the development of activity of the sludge it would be interesting to learn by what stages the fixation of the nitrogen took place. He observed that the carbon tetrachloride extract was put down as grease. Had any approximate examina-tion been made of that extract, as it would be distinctly against the value of the sludge as a manure if the grease was left in? The whole scheme appeared to be one of great value for communities with very small available spaces of land at their disposal. If it was possible to have the carbonaceous fermenta-tion carried out successfully in a preliminary tank, whether it was in the nature of a “roughing” tank or filter, or similar existing device, and so bring-ing the effluent to the stage where, by passing it through aerating-filters the necessary nitrification could be attained, a great saving could be effected. The filters could be fed four to six times their usual speed. An interesting point occurred in connection with the disappearance of nitrogen, where in some cases the oxidised product did not at all correspond with the free ammonia. According to one of the tables shown it would seem that the best dilution for the oxidation-cycle to proceed, regularly and completely, was 1:12. Might there not be some feasible explanation of the loss of nitrogen when the ratio of activated sludge to sewage was much higher?
Mr. Percy Gaunt said that the method of treatment suggested might offer advantages sufficient to compensate for any additional power required
for the aeration process, in view of the reduced area required, and the pos-sibility of reduction of the nuisance from smell and from flies. Under the present system, even when circumstances favoured a fairly compact scheme, an area of ten acres would usually be required for the disposal works of a town of about 40,000 inhabitants, when due allowance had been made for the selection of a site providing the fall of several feet, necessary for a filtra-tion process. The experiments described suggested the possibility of reducing the area by about eighty per cent., and the necessary fall to a few inches. A suitable site under existing conditions might be two or three miles from the town, entailing an independent power installation, whereas with the reduced area and diminished fall requirements of the suggested method, full advan-tage might be taken of any cheap power (such as a town gas, or electricity supply) in choosing the position of the works. Interesting information as to the relative importance of the physical and biological factors in purification might be obtained from comparative aeration experiments conducted (a) un-der ordinary conditions; (b) in the presence of ultra-violet rays.
Mr. Johnson inquired whether the sludge contained any ammonia, and also what quantity of air was required.
Mr. J. T. Thompson said that one striking feature of the new process was that it was aerobic from beginning to end, and it was probable that
the amount of smell would be negligible. If these laboratory results could be economically obtained on a large scale the present elaborate system of deal-ing with sewage would be simplified; the cost of pressing sludge, depositing it in the sea or in trenches on land would be avoided, for activated sludge evidently dries rapidly and would yield good manure. This process might also reduce the area of bacteria beds needed. What volume of air was it necessary to blow through the mixture, for this would be a costly item in practice? He presumed there would be some limit below which the sludge would not be sufficiently mixed with the supernatant liquid to complete the oxidation in a reasonable time. With regard to the high nitrogen figure in the activated sludge, if possible, he would like to have an analysis of ordinary Manchester sludge to compare with the sample of activated sludge.
Mr. Hart (Leeds), speaking as an engineer, thought the process would resolve itself into a question of the relative cost of manipulation of the
sludge either as liquid or solid matter. He admitted that the difficulty from the engineering side at the present time was to find a satisfactory method of manipulating the sludge for useful manurial purposes at a reasonable cost. At the moment he could not see that there was a probability of there being any great saving in costs of manipulation. The present experiments were, however, laboratory experiments, and it would be necessary to deal with sew-age and sludge in bulk before any reliable data could be furnished as to cost.
Dr. G. J. Fowler said that a considerable time ago Mr. Ardern and himself read a paper before the Society on suspended matter in sewage and ef-
fluents, which raised in a simple way a question which had found its final expression in the paper they had heard that night, that was to say the floc-culation of colloidal matter. The end had not been reached at once. There had been a number of stages, and a great many minds had been at work on the question. When he had the honour of delivering the Chairman’s address before the Section he mentioned the idea of Dr. Maclean Wilson of an en-zyme which might clot out sewage and produce the effect which now took place into a percolating filter, and ventured to suggest that it might be pos-sible to find something of the kind. An experiment was tried with some of the deposit from a filter, blowing it up in sewage, with apparently little result. Other chemists had tried the same experiment. It was only right to admit that the illuminating idea which originated the work was really due to a visit he had paid while in the United States, to the Mecca of sewage purification, namely, the experimental station at Lawrence in the State of Massachusetts, where he saw the bottle, described in the paper, in which sewage had been completely purified by 24 hours’ aeration. The idea at that time, and subse-quently in the experiments which had been published from that laboratory, involved the principle of surface. He discussed some of the possibilities of the method with the President of the New York Sewage Commission, and that gentleman was of the opinion that the idea of surface should be abandoned if possible if the matter was to be really advanced. They also discussed the question of the clarification of sewage. The problem at New York was to deal with some 1,000 million gallons of sewage per day and the idea of sprinkling such a large quantity about in the atmosphere in the hot American summer did not seem to be altogether practicable. In the intervening time other ex-periments had been made by Mr. Mumford and himself with regard to the clarification of sewage bacterially, and they had succeeded in clarifying alto-gether about 10,000 gallons by means of a process which had already been published. As Dr. Grossmann had observed, local conditions had to be taken into consideration. It was also necessary to consider the process of sewage purification on the one hand and the utilisation of the nitrogen and other constituents on the other. The process described in the paper aimed at puri-fying the sewage as rapidly and as simply as possible. He, for his own part,

Winter 2014 | V 50, N 1 Environmental Engineer & Scientist | 25
believed that the process was practicable on a large scale, and they would have some idea of what that meant when he mentioned that the settling tanks at Davyhulme were constructed to hold 21 millions gallons. The results indicated in the paper showed that some six hours’ blowing would produce an effluent equal to the final effluent at present obtainable; that was to say, complete purification in six hours. Assuming that the operation was only carried out twice in the 24 hours, allowing six hours to blow and six hours for the manipulation Mr. Hart had spoken of, aerating the sludge and so forth, it meant that in the tanks available 42 million gallons per day could be purified. The consequent saving of space and expenditure on filters would be something enormous, and would allow for quite a large expenditure on power and otherwise for the provision of air. He would not commit himself to figures that evening. It would not be a wise proceeding at that stage. The question of cost had been very carefully considered, and the whole matter had been approached from a number of points of view. Estimates had been obtained for large scale-work in blowing and so forth. He had consulted Mr. S. L. Pearce, the Chief Engineer of the Manchester Corporation Electricity Department, with reference to the amount of power required for providing a certain amount of air, estimating for the greatest quantity of air conceivable for the purpose, and recent work which had been begun showed that there had been an over-estimation in that direction. Taking everything together he was convinced that the process was a practical proposition. In order to carry it out by the most economical method possible it was, of course, necessary to call in the aid of their friends the engineers. Figures as to cost had been pub-lished by experimenters in America. In a paper by Messrs.Clark and Adams, published in the “Engineering Record” the figure for electricity was placed at 2d. per unit, which was not very cheap, and on that basis the cost of air was given at 8s. 4d. per million gallons. The American sewage was rather dilute. There was also cost of the slate surfaces. Still, if it was possible to carry on the process at the cost of 8s. 4d. per million gallons the matter appeared to be quite practicable. It was necessary to get the principle right in the first place, and on that point he had no doubt. The idea was really nothing new in a way. All that was happening was that instead of running the stream of sewage over a filter bed with imperfectly oxidised sludge one took activated sludge and moved it about with complete aeration. In the same way that a percolat-ing filter was a concentration of land treatment so the treatment described was a further concentration on the percolating filter. No really new principle was involved, and for that reason it appeared to him the thing was on right lines. Regarding the question of nitrogen which had been raised, his view was that the organisms collected a certain amount of nitrogen from the products present in solution and built up a certain amount of protoplasm thereby. He was confirmed in this opinion by experiments made at the Manches-ter University, where a deposit was obtained containing even more nitrogen than was indicated in the paper. The amount of mineral matter in activated sludge was not high. It would be necessary in order to secure success that very careful means be taken to remove the grit, and considerable engineering skill would be required to design really satisfactory grit chambers. There were no such things in existence in the world at the present time, but no doubt the problem was capable of solution. The complete removal of grit would materially assist the working of the process. The research work carried out by Messrs. Ardern and Lockett opened out possibilities which would re-awaken the public interest in the sewage problem, which, perhaps, to some of them had latterly become somewhat of a bore by being standardised to such an extent that the whole question had become one of routine. The authors of the paper had now fired a bombshell into the camp, and perhaps they would all start on new ways in the future.
Mr. Ardern, in reply, said that no means had been taken to remove the detritus from the sewage which was generally the average 24 hours’
sample. An inspection of the analysis would show that the percentage of or-ganic matter in the resulting sludge was 65 per cent. or thereabouts, wheras the usual percentage of mineral matter in sedimented sludge in the case of Manchester would be about 50 per cent., so that there was a considerable
increase in the organic content. With regard to the high percentage of nitro-gen, the figure given was the mean of several determinations. It would appear that the high nitrogen content was due to a large extent to the flocculation of the fecal emulsion. There had been no determinations of nitrogen at dif-ferent stages of the accumulation of the sludge. There were still a number of points requiring elucidation, and it was not suggested that investigation had been made into every operation that actually took place. What had been done was to endeavour to obtain results which could be readily maintained under conditions in which apparently there should be no serious difficulty in translating to a practical working scale. The scientific side of the matter had only been dealt with in a limited manner. The authors agreed with Dr. Fowler in regard to the principle of the process which he had dealt with in the course of his remarks. As stated by Mr. O’Shaughnessy, with a temperature of 30° Cent. there was apparently a slight deflocculating action on the sludge, but it was not maintained, the effect being observable in the initial stages, flocculation subsequently occurring. No examination had been made of the grease extract, as at the time the determination was made the activated sludge was rather a valuable product from the experimental point of view. He was of opinion, however, that the percentage of fatty matter present was not suf-ficient to militate against the use of the sludge as a fertiliser. It was a consider-ably lower percentage, as Dr. Grossmann would be aware, than in the case of ordinary sewage tank sludge, even counting the whole carbon tetrachloride extract as grease. It was quite common for ordinary tank sludge to contain 10 to 15 per cent. of grease extract, and possibly in some cases a greater quantity. There was no definite explanation to offer in connection with the loss of the nitrogen, and there was no doubt that with regard to the conservation of that constituent further information was required. In the earlier experiments al-most quantitative nitrification of ammonia was obtained. This did not apply to the later experiments where there was a greater loss of nitrogen. It may be mentioned that during the later experiments a greater volume of sludge was employed, and nitrification proceeded at a more rapid rate which might pos-sibly have some influence on the liability to losses of nitrogen. The question of the effect of waste liquor from sulphate of ammonia plants had not been investigated. The Manchester sewage dealt with, however, contained from 0.5 to 1.0 per cent. of this trade effluent, and in this proportion no serious retarding effect on the oxidation process was apparent. If, as appeared prob-able, the process was essentially bacterial, there was no doubt that any serious amount of inhibiting matter, of whatever type, as long as it was bactericidal, would doubtless have to some extent a deterrent effect. The volume of air required was a point which obviously was connected with the cost of the aeration process. They had not gone very deeply into the matter. As a matter of fact the laboratory experiments had been aerated without consideration of the question of cost. They had determined the volume of air used in the experiments, which was evidently much in excess of that actually required; the quantity amounting to something about one-fifth of a cubic foot per square foot of tank area per minute. While Dr. Fowler naturally refrained from giving any figures, one could say without hesitation that the quantity of air required was very much less than that allowed in any calculations he had made. In the laboratory experiment the air was used not only for aeration but also as a means of agitation, and it was quite conceivable that a combination of mechanical agitation with the use of air for aeration purposes only would be more economical. That, of course, remained to be seen. A question had been raised as to the effect of grease, concerning which he could not give any information. Whatever grease there was in the average sample was in the sewage when they treated it, and there was no apparent hindrance to the oxidation process. At no time was there an excessive quantity of grease, but he was of opinion that some simple means would be adopted for removing any actual grease from the sewage before subjecting it to any such treatment.
The main feature of the experimental work was the satisfactory purifica-tion of sewage by tank treatment alone, with the production of a sludge which, owing to its oxidised and flocculent condition, could be readily dealt with and converted into a valuable fertilising agent.
26 | Environmental Engineer & Scientist Winter 2014 | V 50, N 1
Solvay Chemicals, Inc.1.800.SOLVAY C (800.765.8292)www.solvair.us© Copyright 2014, Solvay Chemicals, Inc. All Rights Reserved
While regulations may not be a priority at the moment, as the new year progresses eventually MATS/MACT will become a fact, and Solutions enabling regulatory compliance will need to be considered.
Looking for answers to your regulatory questions? If you are considering whether to postpone a plant’s retirement, or need assistance with technology and product choices, SOLVAir Solutions’ years of practical experience in the field may be of help. From cost-effective product implementation to regulatory compliance, we offer the experience and the knowhow to assist you in finding the answers you want.
For more information on Dry Sorbent Injection, sodium sorbents and independent tests on HCl and SO2, go to www.solvair.us or call us at 800.765.8292.
MATS/MACT regulations… Some clear, straightforward answers!
SOLVAir Snow Trees 2014 2-PG Ad.indd 1 1/10/2014 2:39:27 PM

Winter 2014 | V 50, N 1 Environmental Engineer & Scientist | 27
Solvay Chemicals, Inc.1.800.SOLVAY C (800.765.8292)www.solvair.us© Copyright 2014, Solvay Chemicals, Inc. All Rights Reserved
While regulations may not be a priority at the moment, as the new year progresses eventually MATS/MACT will become a fact, and Solutions enabling regulatory compliance will need to be considered.
Looking for answers to your regulatory questions? If you are considering whether to postpone a plant’s retirement, or need assistance with technology and product choices, SOLVAir Solutions’ years of practical experience in the field may be of help. From cost-effective product implementation to regulatory compliance, we offer the experience and the knowhow to assist you in finding the answers you want.
For more information on Dry Sorbent Injection, sodium sorbents and independent tests on HCl and SO2, go to www.solvair.us or call us at 800.765.8292.
MATS/MACT regulations… Some clear, straightforward answers!
SOLVAir Snow Trees 2014 2-PG Ad.indd 1 1/10/2014 2:39:27 PM

28 | Environmental Engineer & Scientist Winter 2014 | V 50, N 1
the SluDge Age ConCePt AnD the ACtiVAteD SluDge PRoCeSS: A 45 yeAR RetRoSPeCtiVe CoMMentARy
Alonzo W. Lawrence, Ph.D., P.E., BCEE, and Andrew C. Middleton, Ph.D., P.Eng., BCEE1
InTRODUCTIOn
In 1962, when the senior au-thor of this article, Lawrence, entered the doctoral program
in sanitary engineering at Stan-ford University, the prevailing ap-proach to the design and operation of suspended-growth biological wastewater treatment processes was based on experience-based, empiri-cally-derived parameters. Foremost among these parameters were: 1) hydraulic retention time for an-aerobic digestion of sewage sludge and 2) a weight of wastewater or-ganics applied, e.g., BOD or COD, per unit volume of aeration basin capacity per unit time for the ac-tivated sludge process. There was also, evolving with respect to the activated sludge process, a research-based focus on an organic loading parameter, which became known as the food to microorganism (F/M) ratio. The F/M ratio was defined as the weight of wastewater or-ganics applied per unit weight of aeration tank mixed liquor volatile suspended solids (MLVSS) per unit time, e.g., mg BOD/mgVSS/day. The parameter was deemed to be particularly useful in the treatment of industrial wastewaters in the completely mixed activated sludge process. While the F/M param-eter was focused on the biological mechanism of waste removal, it had a number of design and operational short comings. In particular, it did not lend itself to a reaction-rate based mathematical process model of the activated sludge process, from which the entire design or operation could be calculated and optimized in a least cost design.
Also, in the summer of 1962, prior to entering Stanford, Law-rence had conducted a field study of extended aeration package sew-age treatment plants at motels and other remote locations for the New York State Department of Health. The goal of that study was to de-velop guidelines for the design of such plants. That experience fur-ther heightened his intellectual curiosity in the search for a more fundamental biokinetic-based ap-proach to the design and control of activated sludge and other biologi-cal wastewater treatment processes.
Fortunately, Lawrence was privileged to have the opportu-nity to study under Dr. Perry L. McCarty at Stanford. Lawrence’s doctoral research led to the devel-opment of a microbial based ki-netic approach to the design and control of the rate limiting step in anaerobic treatment processes, i.e. methane fermentation (Lawrence and McCarty, 1967; Lawrence and McCarty, 1969). Based on his ex-tensive review and familiarity with wastewater treatment literature and the microbiological literature on chemostat-based continuous culture of pure cultures of mi-croorganisms, Lawrence believed that the kinetic model approach could be extended to all microbial slurry-based biological waste treat-ment processes including activated sludge. Subsequently, Lawrence and McCarty developed a uni-fied basis for biological treatment design and operation (Lawrence and McCarty, 1969; Lawrence and McCarty, 1970). In this approach, biological solids retention time, or more broadly sludge age, was iden-
tified as the key independent vari-able for process design and control.
This biological kinetic model is briefly reviewed in the next sec-tion of this article. Then, research studies conducted by Lawrence and his associates designed to de-velop information on the kinetics of activated sludge are described. Next, studies describing the ap-plication of the kinetic approach to design and control of industrial waste treatment activated sludge processes are presented. The article concludes with an assessment of the current status of the sludge age concept in the design and control of the activated sludge process.
THE UnIFIED BASIS FOR BIOLOGICAL TREATMEnT AS APPLIED TO ACTIVATED SLUDGE
The information contained in the original Lawrence and McCarty 1970 “Unified
Basis” has been widely disseminat-ed in the 44 years since its original publication. The biokinetic models described in the original paper are included in the activated sludge design chapters of a widely used textbook on wastewater treatment (Metcalf and Eddy, 2003). There-fore, only a brief review of the uni-fied basis concepts and the process kinetic models are discussed here.
Lawrence and McCarty (1970) described a unified basis for design and operation of biological waste treatment systems employing sus-pensions of microorganisms based on microbial kinetic concepts and continuous culture of microor-ganisms theory. Biological Solids Retention Time (SRT), or Sludge Age or Mean Cell Residence, i.e., the average time period a unit of biological mass (and by extension associated suspended solids of non-
biological origin) is retained in the system was identified as the key independent variable for biological process design and operation. This is true because once a value of SRT is selected for a given wastewater treatment situation, all microbio-logical aspects of process design and operation are fixed, including the F/M ratio. This is shown by the kinetic relationships for the major process variables in Table 1 for the three process configurations shown in Figure 1. Operationally, the cho-sen SRT is achieved by the daily wasting of the daily production of activated sludge matrix solids (MLTSS). The parameter, Px, in Ta-ble 1 identifies the daily production of excess biosolids (MLVSS) for a soluble wastewater situation, e.g., lb/day. For completeness, it should be noted, that for a soluble waste-water, the F/M ratio used by others, is equal to the Unified Basis param-eter Specific Utilization, U, divided by the waste removal efficiency, E, when E is stated as a decimal.
In the case of the activated sludge process, the Unified Basis presented a mass balance around the aeration tank which described the mathematical steady-state rela-tionship between SRT; hydraulic retention time (HRT); clarifier un-derflow rate (q) to wastewater flow rate (Q) ratio, i.e., the recycle ratio (r); and, clarifier underflow sol-ids concentration (Xr) and mixed liquor suspended solids concen-tration (X). While the microbial aspects of the system are fixed, once a design value of SRT is selected, including the daily wasting rate of activated sludge solids (1/SRT times the system total solids), it is necessary to specify two additional system parameters to complete the overall design. While values of HRT, r, or Xr could be chosen, it is customary to choose design
1. Alonzo W. Lawrence and Andrew C. Middleton are Senior Consultant and Presi-dent, respectively, in Corporate Environmental Solutions LLC, 1348 Beulah Rd., Pittsburgh, PA 15235-5068 (Mailing address: P.O.Box 427, Cecil, PA 15321). http://www.solutions-by-ces.com/

Winter 2014 | V 50, N 1 Environmental Engineer & Scientist | 29
values for HRT and r. Then the clarifier component of the system is designed based on the uniquely determined zone settling velocity and thickening characteristics of the activated sludge mixed liquor suspended solids. Consideration of tradeoffs among HRT, r, and Xr provides an approach to determin-ing least cost design of the activat-ed sludge system. The importance of the activated sludge settling and thickening characteristics to the overall system performance is dis-cussed in the next section.
Estimates of process perfor-mance and SRT for various acti-vated sludge process options are shown here in Table 2.
BIOKInETIC BASED ACTIVATED SLUDGE RESEARCH STUDIES
During the first half of the decade of the 1970s, Law-rence and his associates
performed a number of research
studies to improve the state of the art of design and control of the activated sludge process. The per-formance of the secondary clari-fier and its ability to separate and return activated sludge solids to the aeration tank was not as well understood as the microbial waste assimilation aspect of the process. In a published discussion of the Unified Basis (Lawrence and Mc-Carty, 1970), Dick and Javaheri (1971) correctly pointed out that clarifier performance was critically important to overall process ef-ficiency and, unless properly con-trolled could make it impossible to achieve the performance specified by the biokinetic model. Settling and thickening characteristics of activated sludge mixed liquor sol-ids in the clarifier were identified as critical design information.
Bisogni and Lawrence (1971) performed a laboratory study using a synthetic wastewater to determine the relationship between SRT and activated sludge settling character-
istics. They observed that the zone settling velocity (ZSV) of the ac-tivated sludge liquors, adjusted to a common value of MLTSS, plot-ted as a straight line versus SRT (Figure 2) over a 2-12 day range of SRTs. The best zone settling characteristics occurred in the 4-9 day SRT range. The zone settling characteristics are the fundamental parameters for design of the upflow clarification and downflow thick-ening zones of the final clarifier.
Milnes (1972) conducted doc-torial research on the dynamic modeling of the completely mixed activated sludge process. His dy-namic mathematical model de-scribed a nitrifying complete-mix activated sludge reactor in series with a gravity clarifier-thickener. The biological component of the model was based on Unified Basis microbial-kinetic equations for the growth of the heterotrophic micro-bial mass and the nitrifying bacteria mass. An empirical, dynamic model was developed to describe the op-
eration of the secondary clarifier. The mathematical form of the clari-fier model was based on results of laboratory studies performed on a 150-liter, completely mixed reactor in series with an 8-foot deep, 6-inch inside diameter, Plexiglas clarifier equipped with a sludge scraper and continuous sludge underflow re-turn. The clarifier model contained four functional blocks, i.e. clari-fication, separation, zone settling and sludge blanket (Figure 3). The sludge thickening zone was mod-eled on the basis of an observed em-pirical relationship that described clarifier underflow suspended solids concentration (Xr) as a function of the weight of solids in the sludge blanket and the solids retention time in the blanket. After attaining steady state operation, the labora-tory system was subjected to a series of organic and hydraulic non-steady state loading changes. Good agree-ment was achieved between the laboratory experimental results and the simulation model predictions.
TABLE 1Summary of Steady State Relationships for Biological Waste Treatment with Suspensions of Microorganisms after Lawrence and McCarty (1969)
CharacteristicComplete-Mix System
Plug Flow System with Recycle [1]Without Recycle With Recycle
Specific EfficiencyES =
100 (S0 - S1)S0
ES =100 (S0 - S1)
S0
ES =100 (S0 - S1)
S0
Effluent Waste Concentration (M/L3)S1 =
KS (1 + b(SRT))SRT (Yk - b) - 1
S1 =KS (1 + b(SRT))SRT (Yk - b) - 1 [2]
Microorganism Conc. in Reactor (M/L3)X = Y (S0 - S1)
1 + b(SRT)X = Y (S0 - S1) ( SRT )1 + b(SRT) HRT
X = Y (S0 - S1) ( SRT )1 + b(SRT) HRT
Excess Microorganism Production Rate (M/T)PX =
YQ (S0 - S1)1 + b(SRT)
PX =YQ (S0 - S1)1 + b(SRT)
PX =YQ (S0 - S1)1 + b(SRT)
Hydraulic Retention Time (T)HRT = ( V ) = SRT
QHRT = ( V ) ≠ SRT
QHRT = ( V ) ≠ SRT
Q
Recycle Ratio not applicable r = ( q )Qr = ( q )Q
Recycle Sludge Conc. (M/L3) not applicable Xr =X (1 + r - )
r
SRT
HRT Xr =X (1 + r - )
r
SRT
HRT
Solids Retention Time (T)
GeneralSRT-1 = YkS1 - b
KS + S1
SRT-1 = YkS1 - bKS + S1
SRT-1 =Yk(S0 - S1) - b
KS ln ( S0 )S1 + (S0 - S1)
[3]Limiting Minimum SRTlim = (Yk - b)-1 SRTlim = (Yk - b)-1 [4]
[1] For a situation in which reactor microbial mass concentration (X) is assumed constant[2] No explicit solution for SRT[3] For situation in which recycle ration (r) is less than one[4] Not mathematically defined for this system
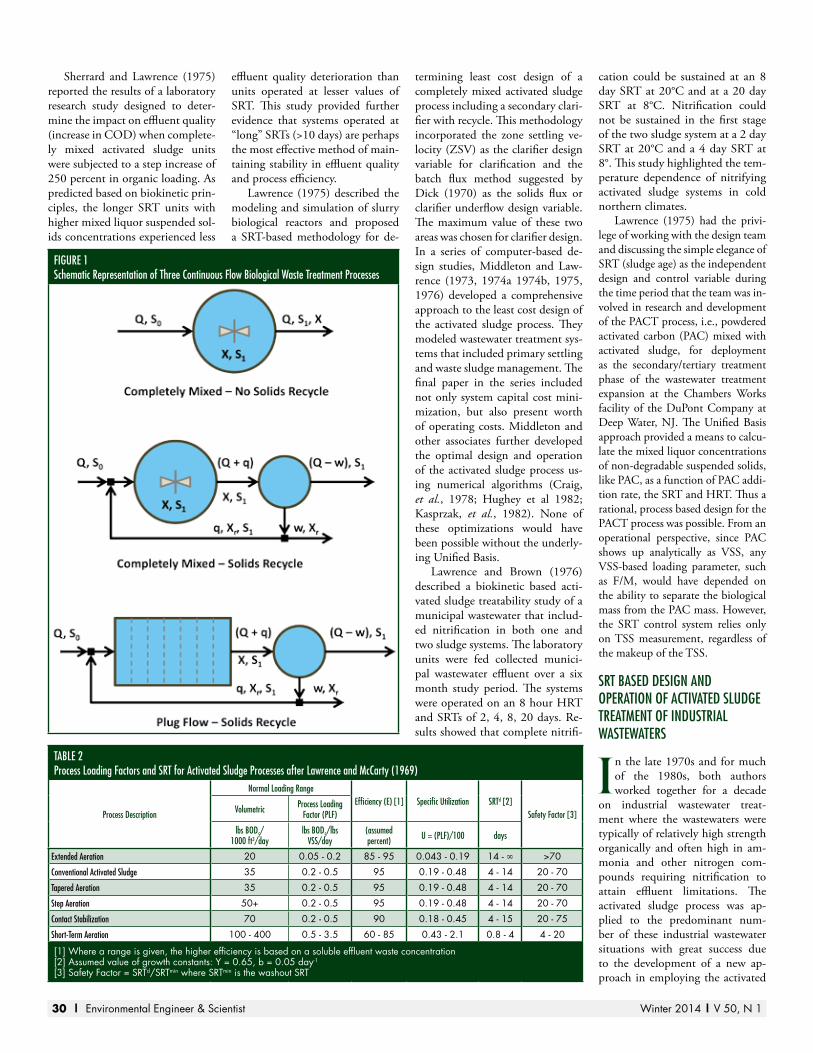
30 | Environmental Engineer & Scientist Winter 2014 | V 50, N 1
Sherrard and Lawrence (1975) reported the results of a laboratory research study designed to deter-mine the impact on effluent quality (increase in COD) when complete-ly mixed activated sludge units were subjected to a step increase of 250 percent in organic loading. As predicted based on biokinetic prin-ciples, the longer SRT units with higher mixed liquor suspended sol-ids concentrations experienced less
effluent quality deterioration than units operated at lesser values of SRT. This study provided further evidence that systems operated at “long” SRTs (>10 days) are perhaps the most effective method of main-taining stability in effluent quality and process efficiency.
Lawrence (1975) described the modeling and simulation of slurry biological reactors and proposed a SRT-based methodology for de-
termining least cost design of a completely mixed activated sludge process including a secondary clari-fier with recycle. This methodology incorporated the zone settling ve-locity (ZSV) as the clarifier design variable for clarification and the batch flux method suggested by Dick (1970) as the solids flux or clarifier underflow design variable. The maximum value of these two areas was chosen for clarifier design. In a series of computer-based de-sign studies, Middleton and Law-rence (1973, 1974a 1974b, 1975, 1976) developed a comprehensive approach to the least cost design of the activated sludge process. They modeled wastewater treatment sys-tems that included primary settling and waste sludge management. The final paper in the series included not only system capital cost mini-mization, but also present worth of operating costs. Middleton and other associates further developed the optimal design and operation of the activated sludge process us-ing numerical algorithms (Craig, et al., 1978; Hughey et al 1982; Kasprzak, et al., 1982). None of these optimizations would have been possible without the underly-ing Unified Basis.
Lawrence and Brown (1976) described a biokinetic based acti-vated sludge treatability study of a municipal wastewater that includ-ed nitrification in both one and two sludge systems. The laboratory units were fed collected munici-pal wastewater effluent over a six month study period. The systems were operated on an 8 hour HRT and SRTs of 2, 4, 8, 20 days. Re-sults showed that complete nitrifi-
cation could be sustained at an 8 day SRT at 20°C and at a 20 day SRT at 8°C. Nitrification could not be sustained in the first stage of the two sludge system at a 2 day SRT at 20°C and a 4 day SRT at 8°. This study highlighted the tem-perature dependence of nitrifying activated sludge systems in cold northern climates.
Lawrence (1975) had the privi-lege of working with the design team and discussing the simple elegance of SRT (sludge age) as the independent design and control variable during the time period that the team was in-volved in research and development of the PACT process, i.e., powdered activated carbon (PAC) mixed with activated sludge, for deployment as the secondary/tertiary treatment phase of the wastewater treatment expansion at the Chambers Works facility of the DuPont Company at Deep Water, NJ. The Unified Basis approach provided a means to calcu-late the mixed liquor concentrations of non-degradable suspended solids, like PAC, as a function of PAC addi-tion rate, the SRT and HRT. Thus a rational, process based design for the PACT process was possible. From an operational perspective, since PAC shows up analytically as VSS, any VSS-based loading parameter, such as F/M, would have depended on the ability to separate the biological mass from the PAC mass. However, the SRT control system relies only on TSS measurement, regardless of the makeup of the TSS.
SRT BASED DESIGn AnD OPERATIOn OF ACTIVATED SLUDGE TREATMEnT OF InDUSTRIAL WASTEWATERS
In the late 1970s and for much of the 1980s, both authors worked together for a decade
on industrial wastewater treat-ment where the wastewaters were typically of relatively high strength organically and often high in am-monia and other nitrogen com-pounds requiring nitrification to attain effluent limitations. The activated sludge process was ap-plied to the predominant num-ber of these industrial wastewater situations with great success due to the development of a new ap-proach in employing the activated
TABLE 2Process Loading Factors and SRT for Activated Sludge Processes after Lawrence and McCarty (1969)
Process Description
normal Loading RangeEfficiency (E) [1] Specific Utilization SRTd [2]
Safety Factor [3]Volumetric Process Loading Factor (PLF)
lbs BOD5/ 1000 ft3/day
lbs BOD5/lbs VSS/day
(assumed percent) U = (PLF)/100 days
Extended Aeration 20 0.05 - 0.2 85 - 95 0.043 - 0.19 14 - ∞ >70
Conventional Activated Sludge 35 0.2 - 0.5 95 0.19 - 0.48 4 - 14 20 - 70
Tapered Aeration 35 0.2 - 0.5 95 0.19 - 0.48 4 - 14 20 - 70
Step Aeration 50+ 0.2 - 0.5 95 0.19 - 0.48 4 - 14 20 - 70
Contact Stabilization 70 0.2 - 0.5 90 0.18 - 0.45 4 - 15 20 - 75
Short-Term Aeration 100 - 400 0.5 - 3.5 60 - 85 0.43 - 2.1 0.8 - 4 4 - 20
[1] Where a range is given, the higher efficiency is based on a soluble effluent waste concentration[2] Assumed value of growth constants: Y = 0.65, b = 0.05 day-1
[3] Safety Factor = SRTd/SRTmin where SRTmin is the washout SRT
FIGURE 1Schematic Representation of Three Continuous Flow Biological Waste Treatment Processes

Winter 2014 | V 50, N 1 Environmental Engineer & Scientist | 31
sludge process -- the use of very long SRTs, e.g., 50-500 days. The genesis of the long-SRT approach was the inability to achieve reliable nitrification of byproduct coke oven wastewaters, which typically had a relatively high concentration of phenolic compounds, ammo-nia and other nitrogen-containing compounds such as thiocyanate. By the late 1970s, BAT regulations re-quired nitrification of these waste-waters to reduce ammonia to low concentrations. The breakthrough came in the late 1970s when it was demonstrated that generally SRTs of at least 50 days were necessary to achieve reliable nitrification of these wastewaters. (Bhattacharyya and Middleton, 1979, 1980a and 1980b) Around this time, others also began considering long SRTs, e.g., Grutsch (1980). Prior to this time, long SRT’s had generally been confined to extended aeration systems and their consideration for use in industrial wastewater treat-ment was relatively new.
In Bhattacharyya and Middle-ton (1980b), the authors dem-onstrated that certain of the parameters in the Unified Basis had finite limits as the SRT approached infinity, in particular, the effluent degradable organic concentration, the bacterial concentration in the aeration tank, oxygen uptake rates and bacterial sludge production. The key parameter that did not have a limit was the aeration tank con-centration of non-degradable sus-
pended solids, which was infinite at an infinite SRT. This outcome pointed out the importance of the influent non-degradable suspended solids, e.g., fixed suspended solids, PAC or recalcitrant organic solids, and the need to consider enhanced pretreatment for their removal as a tradeoff for being able to use a long SRT system. Furthermore, this understanding provided a basis for designing “no waste” activated sludge systems where the incidental TSS in the secondary clarifier efflu-ent, provided it was within permit limitations, could maintain a long SRT activated sludge system. In the 1980s Lawrence and Middleton oversaw the design, installation and operation of a number of long SRT activated sludge systems treating industrial wastewaters.
The equations resulting from the Unified Basis for aeration tank accumulation of non-degradable suspended solids was extended in the late 1980s to evaluate accumu-lation of recalcitrant compounds adsorbed to activated sludge (Smith, et al., 1993).
All of these advances in the de-sign and operation of the activated sludge process were made possible by the publication of the Unified Basis in 1970.
Of additional interest while not directly applicable to the activated sludge process, biokinetic research studies were conducted by Middle-ton and Lawrence (1977) to eluci-date the biokinetics of microbial
sulfate reduction and by Stensel, Loehr and Lawrence (1973) to elu-cidate the heterotrophic microbial denitrification process. Biokinetics of both these processes have ap-plicability in odor prevention in sewers and equalization tanks; de-sign of pre-aeration selector tanks for control of filamentous growth in return activated sludge; and, prevention of rising sludge due to denitrification in secondary clari-fiers as well as for nitrate or sulfate removal from a wastewater.
THE SRT (SLUDGE AGE) APPROACH AnD THE ACTIVATED SLUDGE PROCESS: TODAy AnD TOMORROW
In the 45 years since Lawrence’s first hand written draft of what became the Unified Basis paper
(Lawrence and McCarty, 1970), the concepts presented in the pa-per have been widely accepted by the environmental engineering profession as the preferred meth-
odology for the cost effective de-sign and operation of the activated sludge process (Metcalf and Eddy, 2003: WEF & ASCE, 2010).
Simply stated, the idea of identi-fying microbial net specific growth rate (μ) and its reciprocal, SRT (Sludge Age) as the independent steady state design variable allows design and control of the activated sludge process by the daily wasting of the net accumulation of acti-vated sludge mix liquor suspended solids regardless of their origin: i.e., active microbial mass; microbial cell debris; PAC; or, inorganic com-ponents of the waste water.
In conclusion, we believe the Unified Basis concepts and the identification of SRT (Sludge Age) as the independent design and con-trol variable for the activated sludge process will continue to be the preferred approach employed by environmental engineers, not only today, but also tomorrow, and for many more tomorrows to come.
FIGURE 2Zone Settling Velocity as a Function of SRT after Bisogni and Lawrence (1971)
FIGURE 3Vertical Locations of Zones in the Secondary Clarifier after Milnes (1972)

32 | Environmental Engineer & Scientist Winter 2014 | V 50, N 1
REFEREnCES
Bhattacharyya, A. and Middleton, A.C. (1979). “Development of Biologi-cal Treatment System Achieving BATEA for Coke Plant Wastewa-ters,” Proceedings 11th Mid-Atlantic Industrial Waste Conference, Penn-sylvania State University, State Col-lege, Pennsylvania,1979.
Bhattacharyya, A. and Middleton, A.C. (1980a). “Solids Retention Time: A Controlling Factor in the Successful Biological Nitrification of Coke Plant Wastes,” Proceedings 12th Mid-Atlantic Industrial Waste Conference, Bucknell University, Lewisburg, Pennsylvania, 1980.
Bhattacharyya, A. and Middleton, A.C. (1980b). “Enhanced Bio-logical Treatment System for Coke Plant Wastewater Achieving Com-plete Nitrification,” Proceedings 35th Industrial Waste Conference, Purdue University, Lafayette, Indi-ana, 1980.
Bisogni, J.J. and Lawrence, A.W. (1971). “Relationships Between Biological Solids Retention Time and Settling Characteristics of Ac-tivated Sludge,” Water Research, Vol. 5, No. 9, September, 1971, p. 753-764.
Craig, E.W., Meredith, D.D. and Mid-dleton, A.C. (1978). “Cost Opti-mization of the Activated Sludge Process Using the Box-Complex Algorithm,” Journal Environmental Engineering Division, ASCE. 104, 1978, p. 1101.
Dick, R.I. (1970). “Role of activated sludge final settling tanks,” Journal of the Sanitary Engineering Division, ASCE, Vol. 96, No. SA2, April, 1970, pp.423-436.
Dick, R.I. and Javaheri (1971). A.R., Discussion, “Unified Basis for Biological Treatment Design and Operation,” Journal of the Sanitary Engineering Division, ASCE, April, 1971, pp.235-238.
Grutsch, James F. (1980). “The α-β-γ’s of Wastewater Treatment,” ES&T, 14, 3, Mar 1980, pp.276-81.
Hughey, P.W., Meredith, D.D., and Middleton, A.C. (1982). “Optimal Operation of an Activated Sludge Plant,” Journal Environmental Engi-neering Division, ASCE, 108, 1982, p. 349.
Kasprzak, P.J., Meredith, D.D., and Middleton, A.C. (1982). “Effect of Primary Settling Tank Efficiency on Cost Optimization of the Ac-tivated Sludge Process,” WREE Report, Civil Engineering, SUNY/Buffalo, Buffalo, New York.
Lawrence, A.W. (1975). “Modeling and Simulation of Slurry Biological Reactors,” Mathematical Modeling for Water Pollution Control Processes, T.M. Keinath and M.P. Wanielista, ed., Ann Arbor Science Publishers, Inc., Ann Arbor, Michigan, 1975, pp. 221-269.7
Lawrence, A.W. (1975). Environmen-tal Engineer, Environmental Con-trol Division, Chambers Works, E.I. DuPont de Nemours and Company, Sabbatical leave from Cornell University, January-July 1975.
Lawrence, A.W. and Brown, C.G. (1976). “Design and Control of Nitrifying Activated Sludge Sys-tems,” Journal Water Pollution Con-trol Federation, Vol. 48, No.7, July 1976, pp. 1779-1803.
Lawrence, A.W. and McCarty, P.L. (1967). “Kinetics of Methane Fer-mentation in Anaerobic Waste Treatment,” Technical Report No. 75, Department of Civil Engineer-ing, Stanford University, Stanford, California, February, 1967.
Lawrence, A.W. and McCarty, P.L. (1969). “Kinetics of Methane Fermentation in Anaerobic Treat-ment,” Journal Water Pollution Con-trol Federation, Vol. 41, No. 2, Part 2, February, 1969, pp. R1-R17.
Lawrence, A.W. and McCarty, P.L. (1969). “A Kinetic Approach to Biological Wastewater Treatment Design and Operation,” Technical Report No. 23, Cornell University Water Resources and Marine Sci-ences Center, Ithaca, New York, December, 1969.
Lawrence, A.W. and McCarty, P.L. (1970). “Unified Basis for Bio-logical Treatment Design and Op-eration,” Journal of the Sanitary Engineering Division, ASCE, Vol. 96, No. SA3, June, 1970, pp.757-778.
Metcalf & Eddy, Inc. (2003) Wastewa-ter Engineering, 4th, Ed., McGraw-Hill, New York, 2003.
Middleton, A.C. and Lawrence, A.W. (1973). “Cost Optimization of Activated Sludge Wastewater Treat-ment Systems,” EPM Technical Report No. 73-1, Department of Environmental Engineering, Cor-nell University, Ithaca, New York, 1973.
Middleton, A.C. and Lawrence, A.W. (1974a). “Cost Optimization of Activated Sludge Systems,” Bio-technology and Bioengineering, Vol. XVI, No. 6, June 1974, pp. 807-826.
Middleton, A.C. and Lawrence, A.W. (1974b). “Least Cost Design of Activated Sludge Wastewater Treat-ment Systems,” EPM Technical Report No. 74-1, Department of Environmental Engineering, Cor-nell University, Ithaca, New York, 1974.
Middleton, A.C. and Lawrence, A.W. (1975).”Least Cost Design of Acti-vated Sludge Wastewater Treatment Systems,” EPM Technical Report No. 75-1, Department of Environmen-tal Engineering, Cornell University, Ithaca, New York, February 1975.
Middleton, A.C. and Lawrence, A.W. (1976). “Least Cost Design of Ac-tivated Sludge Systems,” Journal Water Pollution Control Federation, Vol. 48, No. 5, May 1976, pp. 889-905.
Middleton, A.C. and Lawrence, A.W. (1977). “Kinetics of Microbial Sul-fate Reduction,” Journal Water Pol-lution Control Federation, Vol. 49 No. 7, July 1977, pp. 1659-1670.
Milnes, T.R. (1972), “Dynamic mod-eling of the completely mixed ac-tivated sludge process: laboratory and mathematical studies.” Thesis presented to Cornell University,
Ithaca, New York, in 1972 in par-tial fulfillment of the requirements for the degree of Doctor of Philoso-phy.
Sherrard, J.H. and Lawrence, A.W. (1975), “Response of Activated Sludge to Step Increase In Load-ing,” Journal Water Pollution Con-trol Federation, Vol. 47, No. 7, July, 1975, pp. 1848-1856.
Smith, J.R., Neuhauser, E.F., Middle-ton, A.C., Weightman, R.L, Linz, D.G. (1993). “Treatment of Or-ganically Contaminated Ground-waters in Municipal Activated Sludge Systems,” Water Environ-ment Research, 65, 1993.
Stensel, H.D., Loehr, R.C., and Law-rence, A.W. (1973). “Biological Kinetics of Suspended Growth Denitrification,” Journal Water Pol-lution Control Federation, Vol. 45, No. 2, February, 1973, pp. 249-261.
WEF & ASCE (2010). “Design of Municipal Wastewater Treatment Plants, MOP 8, v.2, Chapter 14, Suspended-Growth Biological Treatment,” 2010.
ACKnOWLEDGEMEnTS
The senior author, Lawrence, wishes to gratefully express ap-preciation to his Unified Basis co-author, Perry L. McCarty, for his inspiration, mentorship, profes-sional collaboration, and personal friendship over the past half cen-tury of their environmental engi-neering careers.
The authors, also gratefully ac-knowledge the many contributions of our students and professional colleagues to our work on biologi-cal waste treatment and the acti-vated sludge process over the past 40 plus years of our professional collaboration.

Winter 2014 | V 50, N 1 Environmental Engineer & Scientist | 33
CoMPlete Mixing ACtiVAteD SluDgeRoss E. McKinney1
Complete Mixing Acti-vated Sludge (CMAS) is an old modification
of conventional activated sludge systems. Anyone who has done laboratory studies on a continu-ously fed activated sludge pilot plant has already had experience with CMAS. Most people doing laboratory research on continu-ously fed activated sludge sys-tems did not realize they were studying a CMAS process. It was simply activated sludge to them.
The first record of CMAS that I found in my research was at Bury, England (Martin 1927). Mr. Joshua Bolton, Chemist and Manager of the Sewage Works at Bury, was interested in seeing if he could develop activated sludge in his small sewage treatment plant. Initially, Mr. Bolton tried diffused aeration, the same as the system used at the Manchester wastewater treatment plant. It was a bust in the small aeration tank that Mr. Bolton had avail-able. With the help of the Ames Crosta Engineering Company, the small tank was converted to a mechanical, surface aeration system with a center draft tube and a sludge settling zone with a circular baffle around the pe-riphery of the tank. A slow speed motor and centrifugal sewage pump was located at the top of the draft tube. By submerging part of the pump blades into the sewage over the center draft tube, they had created one of the first surface aerators to treat domestic sewage in a single tank, combina-tion aeration and sedimentation. The Bury CMAS treatment plant worked in 1919. Unfortunately, loss of suspended solids in the effluent resulted in a lower treat-ment efficiency than in the dif-fused aeration system of Ardern and Lockett. I was fortunate to visit Bury, England, in 1969 and
saw the original CMAS tank (Photo 1) shortly before the tank was destroyed.
All the early activated sludge plants were designed for long, diffused aeration tanks followed by sedimentations tanks to allow the activated sludge to flocculate and settle out. The clarified efflu-ent was discharged to the nearest river while the concentrated set-tled sludge was largely returned to the head end of the aeration tank to treat the incoming settled sewage. A small fraction of waste activated sludge was sent to the anaerobic digesters for further treatment with the settled pri-mary sludge before being dewa-tered and applied to agricultural soil. Small communities in the United States used trickling fil-ters rather than activated sludge plants to treat their domestic sewage. Trickling filters did not produce an effluent quality as good as activated sludge plants, but were much easier to operate.
After World War II, many communities in the United States were faced with housing booms that produced subdivi-sions beyond the city limits. Most of the subdivisions used septic tanks in the back yards for sewage disposal. As the soils be-came saturated with sewage, the subdivisions used sanitary sewers to collect the sewage from each resident and trickling filters to treat their sewage with final dis-charge of the treated effluent into a nearby creek or stream. A few equipment companies developed packaged activated sludge plants for small communities or isolated industries.
When I started my doctoral studies at M.I.T. in 1949, I was fortunate to be asked by Profes-sor Clair Sawyer to be his labo-ratory assistant for a year while I finished my classes in Sanitary
Engineering, took my language requirements in German and French, and began my minor in Chemistry. I quickly learned more Sanitary Chemistry from Professor Sawyer than I had learned when I took the origi-nal course. He was an excellent teacher and expected the best from all students in his classes. I also helped Dr. Sawyer with his laboratory research on indus-trial waste treatment by activated sludge. In my spare time, I went to the M.I.T. Library, located under the dome, to find out as much as I could about activated sludge, especially about the mi-crobiology and the biochemistry related to activated sludge.
The next year, I worked on a research grant from the National Institute of Health to study the Biology and Biochemistry of the Zooglea Producing Organisms In-volved in the Activated Sludge Pro-cess. Professor M.P. Horwood was the faculty member responsible for the N.I.H. grant. Richard S. Engelbrecht worked on the proj-ect with me as a Research Associ-ate. Our research helped us both learn more about the microor-ganisms that made up activated sludge. We isolated a number of pure culture bacteria capable of forming floc under normal activated sludge aeration condi-tions. I obtained my doctorate and left M.I.T in 1951. Richard S. Engelbrecht carried on the N.I.H. research project and re-ceived his Master of Science de-gree in 1952.
I returned to M.I.T. in the spring of 1953 and became an Assistant Professor of Sanitary Engineering. Because Professor Horwood was on leave of ab-sence, I was put in charge of the Sanitary Bacteriology courses. I changed the emphasis of the Sanitary Bacteriology courses to a broader focus on Sanitary Microbiology and Biochemistry.
Next, I worked with Richard S. Engelbrecht to complete his doctorate. He graduated in June 1954, and headed to the Univer-sity of Illinois, where he had a long and distinguished career. I was very successful in attracting good students wishing to learn more about Sanitary Microbiol-ogy and Biochemistry and to do research with me on waste treat-ment systems.
In the spring of 1955, Pro-fessor Rolf Eliassen asked me to make a quick study of the treatability of the cotton kier-ing wastes from the Dale Brook Bleachery in HoHoKus, NJ. I built a small activated sludge plant out of plastic sheets, using small fish tank aerators to supply the oxygen and mixing energy. With pH adjustment, added ni-trogen and phosphorus, it was possible to produce some acti-vated sludge from the bleachery wastes. Microscopic examina-tion of a sample of mixed liquor showed active bacteria and good free-swimming protozoa. I fed the small activated sludge system on a batch feed basis, 23 hours aeration and one hour settling. There were no problems treating the Dale Brook Bleachery wastes in that unit. Next, I needed to examine a continuous flow ac-tivated sludge unit. Continuous feeding for several days showed the development of stalked cili-ated protozoa, indicating a high degree of bio-treatment. COD data confirmed the high degree of treatment. Next, Professor Eli-assen requested that I prepare a set of plans for use in construct-ing a full-size activated sludge plant for the bleachery. His in-structions included that it should be cheap, easy to build, and very easy to operate.
I constructed a small plastic model of an activated sludge plant with 10 aeration cells in series. I did not think that I would ever 1. Professor Emeritus, University of Kansas

34 | Environmental Engineer & Scientist Winter 2014 | V 50, N 1
need a 10 cell activated sludge plant, but I wanted to see how the activated sludge responded in multiple cells. Continuous feeding of adjusted Dale Brook Bleachery effluent to a laboratory activated sludge seed in the 10 cell system showed the wastewa-ters were well treated in a 24 hour retention period. Examination of each cell showed that the wastes were undergoing stabilization in the first three cells. As a result of the laboratory study, I designed a simple treatment plant to have four units in parallel since the bleachery operated sporadically when the demand from custom-ers in New York City required it to operate. The four units would allow the system to handle vari-able waste loads.
The plant manager was not entirely convinced that my acti-vated sludge design would work. He had his men construct one unit with three cells in series. The plant wastes were added to the first cell of the first unit and the aeration equipment turned on when the waste flow filled the first cell. The waste from the first cell flowed into the second cell and finally into the third cell. When the activated sludge con-centration reached normal levels, data indicated that all of the sta-bilization of the raw wastes was occurring primarily in the first cell. The plant was then modi-fied to give three cells operating in parallel rather than in series. Since the waste flow through each cell was less with parallel op-
eration, the final sedimentation sections were made smaller and the aeration tank capacity was in-creased. Once continuous waste feeding was established to the first unit, the good effluent qual-ity convinced the plant manager to finish the other three units to complete the treatment plant as designed. It was not long before all four units were completed, operating in parallel and the wastewater treatment plant was put into full operation (Photo 2).
After the treatment plant had been in operation for about six weeks, I collected samples of the effluent and found the raw wastes had a pH of 6, a COD of 860 mg/L and a BOD5 of 420 mg/L. The treated waste sample had a pH of 7.8, a COD of 65 mf/L and a BOD5 of 3 mg/L. The plant effluent from the waste la-goon to the wastewater treatment plant averaged about 125,000 gpd. The treated effluent was dis-charged directly into HoHoKus Creek, a small stream that flowed through the residential areas of HoHoKus, NJ McKinney, et. al., 1958). As business expanded for the Dale Brook Bleachery over the years, the wastewater treat-ment facilities were expanded as needed until they ran out of space for more treatment units. As a result of the success of the CMAS system at the Dale Brook Bleachery, I received a number of requests to look at other indus-trial wastes. These requests gave me an opportunity to examine a number of different industrial
wastes and their suitability for treatment by CMAS. For the most part, I helped a number of small industrial plants that were unable to connect to a sanitary sewer system.
In 1960, I left M.I.T. and went to Kansas University in Lawrence, KS. One of my first MS students, Ramesh Doshi from India, did his MS thesis on the Mathematics of Complete Mixing Activated Sludge (Doshi, 1961). Unfortunately, his math-ematical equations were far too complex for practical use by con-sulting engineers. At least, he set me to thinking about develop-ing a simpler set of mathemati-cal equations to evaluate CMAS systems. My CMAS equations were published in the Journal of the Sanitary Engineering Division of the American Society of Civil Engineers in 1962 (McKinney, 1962). Almost immediately, my students wanted me to simplify my equations. In the next few years, I made a couple of simpli-fications. That was not enough for my students. They wanted the equations even simpler. I made the CMAS design equations as simple as I could (McKinney, 1974). One of my computer-ori-ented students put my equations for CMAS on the Department computer, making it easy for the students to work with the equa-tions. My students became the best advocates I had for CMAS designs and evaluations.
In addition to teaching and research at the University of
Kansas, I was involved in a Kan-sas Outreach program to assist small communities and individu-als with special problems. One of the most interesting problems I became involved with was to help Mr. Paul Smart with a problem he had. Mr. Smart wanted to build a pig farrowing house on his prop-erty that abutted the main road between Lawrence and Topeka, KS. Mr. Smart had travelled over Europe and England, as well as, the United States, looking for an odorless hog confinement build-ing without success. The Kansas State Health Department told Mr. Smart that I might be able to help him. Mr. Smart gave me written information on the waste production characteristics of hog manure. One of the hog build-ing manufacturers had designed a farrowing building 142 ft. long and 26 ft. wide, with windows that opened to give ventilation and some mechanical ventilation units. A farrowing house was placed on a concrete box foun-dation designed for Mr. Smart. There was a concrete wall down the middle of the box foundation with 10 ft open spaces at each end of the center concrete wall. Mr. Smart asked me to design a treatment system for his new farrowing house. I suggested a mechanical surface aerator to be located across the width of the channel at the head end of the farrowing house, to aerate and move the water in the channel around the farrowing building. The floor was a series of precast-
PHOTO 1The first CMAS unit at Bury, England, in 1919 as pictured in 1969 before plant expansion.
PHOTO 2The four cell CMAS plant at Dale Brook Bleachery, HoHoKus, nJ.

Winter 2014 | V 50, N 1 Environmental Engineer & Scientist | 35
concrete slabs with thin slots at regular intervals in each slab. The urine produced by the pigs dropped through the slots into the flowing liquid below the slab floor. The movement of the pigs in the pens forced the ma-nure through the slots into the moving water. Theory became reality when 50 pregnant sows arrived and were herded into their separate pens (Photo 3). It was not long before microorgan-isms began to grow in the rotat-ing liquid under the slotted floor. In a few days, activated sludge formed in the liquid under the pigs. Everyone visiting the hog farm was amazed that there were no obnoxious odors in or around the hog building. The success of the aerobic hog building stimu-lated Mr. Smart to build more buildings for finishing hogs. All were relatively odor free when the aeration equipment func-tioned properly. At peak produc-tion, Mr. Smart had about 6,000 hogs in buildings on his property. Eventually, Mr. Smart closed his hog farm and sold his property, ending my fear Mr. Smart might over expand on the site.
Kansas was quite different than Massachusetts, as far as wastewater treatment plants were concerned. There was plenty of land for wastewater lagoons. A few plants used aerated lagoons ahead of oxidation ponds. The isolated industrial plants were not
interested in CMAS plants for their waste disposal treatment. On the other hand, the City of Lawrence, Kansas, had a conven-tional primary wastewater treat-ment plant with discharge of the treated effluent into the adjacent Kaw River. The EPA decided all municipal wastewater plants in the 1970s should be upgraded to secondary treatment with possi-ble chlorination of the final efflu-ent. To meet EPA requirements, the Design Engineer decided to install two circular aeration tanks, 105 ft. in diameter. The inside water depth of each aera-tion tank was 14.5 ft. There were four 60 HP mechanical surface aerators and draft tubes to sup-ply oxygen to each aeration tank. The primary settled effluent from one primary tank was discharged into the corresponding aeration tank through a single pipe at the bottom of the aeration tank between the surface aerators. A surface weir was located at the surface on the opposite side of the aeration tank to allow efflu-ent discharge from the aeration tank to the final sedimentation tank. A wooden baffle was placed around the effluent weir to dampen the surface motion prior to discharge over the weir to the final sedimentation tank. The mixed liquor discharged from each aeration tank went to cor-responding final secondary set-tling tanks to separate the settled activated sludge for return to the aeration tanks. The sedimenta-tion tank effluent was discharged
to the Kaw River after chlorina-tion. The waste activated sludge was sent to two aerobic digesters in series. After aerobic digestion, the final activated sludge residues were placed on nearby agricultur-al land and turned into soil.
The EPA required the City to run a clean water aeration test to determine the maximum capabil-ity of the surface mechanical aer-ators to transfer oxygen from the air into the aerated liquid. The engineer for the project had a se-ries of continuously plotting DO probes placed at different points in the tank to see how well the water mixed in the aeration tank. The tank was filled with tap water and the recorders were turned on to obtain initial equilibrium. The City asked some of my graduate students to help pour the sodium sulfite into the aeration tank. My students and some plant opera-tors were located on the runways next to the four aerators. When the recorders were steady, a signal was given and each man began to pour large bags of sodium sulfite into the aeration tank to remove all the dissolved oxygen in the water (Photo 4). The submerged recorders showed when the dis-solved oxygen in the water was removed. It was some time be-fore the recorders began to show oxygen returning to the aeration tank. The data recordings showed the aerators transferred 3.3 lbs. oxygen/ HP-hr to the water in the tank (McKinney, et. al., 1977). Over the next year, the rest of the wastewater treatment plant was
completed. As most wastewater treatment plant operators have learned, plant expansion and re-placement of equipment is never really finished. The Lawrence wastewater treatment plant dem-onstrated that the aeration tanks were simply large CMAS units.
There is nothing unusual about complete mixing activated sludge. It is based entirely on understanding the microbiol-ogy of wastewater treatment and how to apply microbiology and biochemistry to treatment plant design. As a design engineer, you have lots of tools to design the best treatment plant possible. You will spend lots of time on tank sizes and mechanical equip-ment. Do not forget that the microorganisms living in those tanks will do their best with your design. The best advice the mi-croorganisms can give you is to keep the system simple.
REFEREnCES
Doshi, Ramesh C. (January, 1961). Mathematical Analysis of Com-pletely Mixed Activated Sludge, MS Thesis, Department of Civil Engi-neering, University of Kansas.
Martin, Arthur J. (1927). The Acti-vated Sludge Process, pp. 75-80, MacDonald and Evans, London.
McKinney, Ross E. (May, 1962). Mathematics of Complete Mix-ing Activated Sludge, pp. 87-113, J. San. Engr. Div., Amer. Soc. Civ. Engr.
McKinney, Ross E. (1974). Design and Operational Model for Com-plete Mixing Activated Sludge, Biotechnology and Bioengineering, Vol. XVI, pp. 703-722.
McKinney, Ross E., Joseph, K.T. and Vaughn, Donald. (February 2, 1977). Startup Experiences at the Lawrence Wastewater Treatment Plant, Transactions of 27th Annual Conference on Sanitary Engineer-ing, School of Engineering, Uni-versity of Kansas, Lawrence, KS.
McKinney, Ross E., Symons, James M., Shifrin, Walter G. and Vezi-na, Maurice. (1958). Design and Operation of a Completely Mixed Activated Sludge System, Sew. & Ind. Wastes, Vol. 30, No. 3, pp. 287-295.
PHOTO 4Graduate students at KU pouring sodium sulfite in clean water for oxygen transfer test.
PHOTO 3Inside Paul Smart’s farrowing house, showing slotted floor.

36 | Environmental Engineer & Scientist Winter 2014 | V 50, N 1
SoliDS SePARAtion in the ACtiVAteD SluDge PRoCeSS - the fiRSt 100 yeARS
Richard I. Dick, Ph.D., P.E., BCEE1
Those who translated Ardern and Lockett’s research into full-
scale, continuous-flow, activated sludge plants designed final clari-fiers as they had been accustomed to designing plain sedimentation tanks. Their precedent persisted throughout the first half century of use of the process. Application of thickening concepts to final set-tling tank design gave recognition to the substantial solids loading on the tank and allowed rational inte-gration of the biological and solids separation phases of the activated sludge process.
InTRODUCTIOn
Ardern and Lockett had it easy - they only had to in-vent the activated sludge
process, and did not need to deal with continuous solids separation and recycle. In their initial experi-ments Ardern and Lockett (1914a) used draw-and-fill reactors so solids settled under quiescent conditions in the biological reactor.
The second publication on their pioneering work (Ardern and Lock-ett, 1914b) included a brief descrip-tion of small-scale, continuous-flow, experiments, but they were not pleased with results. Part III (Ardern and Lockett, 1915) concerned only draw-and-fill experiments; prelimi-nary thoughts about scale-up - also involving draw-and-fill reactors - were included.
THE EARLy yEARS
The first large-scale demon-stration of the activated sludge process, at Salford,
England, mimicked the draw-and-fill procedure used by Ardern and Lockett (Melling, 1914). The many full-scale installations that quickly followed (Alleman and Prakasam, 1983), however, were continuous-
flow plants (with solids separation and recycle).
I am not aware of literature doc-umenting the strategy of designers of the first settling tanks for activated sludge mixed liquor. It appears that they were strongly influenced by past experience with raw sewage sedimentation. Such experience was extensive at the time [see, for ex-ample, Dunbar and Calvert (1908) and a book on sewage clarification by Schmeitzner (1910)]. Theoretical understanding of factors control-ling performance of settling tanks receiving dilute suspensions also was available at the time: Hazen (1904) presented basic sedimentation con-cepts that remain valid over a cen-tury later.
As design practices in early years of the activated sludge process be-came chronicled in textbooks it became clear that designers of final sedimentation tanks had, indeed, applied concepts appropriate to clarifiers for raw sewage. Metcalf and Eddy (1922) prescribed determin-ing the area of final settling tanks based on hydraulic loading. Babbitt (1925) agreed, and referred to a final settling tank as “a plain sedimenta-tion tank.” In their second edition Metcalf and Eddy (1930) wrote that “The design of settling tanks in which activated sludge is removed from the aeration tank effluent does not differ materially from the design of plain sedimentation tanks”. In the vernacular of the time, plain sedi-mentation tanks were primary clari-fiers in which sewage solids settled without the aid of added chemicals (Kinnicutt, et al., 1910).
Thus, even though the suspend-ed solid concentration of mixed liquor is roughly an order of mag-nitude higher than that of raw sew-age, and in spite of the importance of recycled sludge concentration to the efficacy of the biological process,
final clarifier design practice devel-oped without concern for thicken-ing (Dick, 1976).
EVOLUTIOn OF SLUDGE THICKEnInG COnCEPTS
Basic understanding of mech-anisms involved in thicken-ing of concentrated slurries
began to develop at about the same time as Ardern and Lockett’s work. Coe and Clevenger (1916) demon-strated that each layer in a settling suspension has an associated capac-ity for discharging its solids to un-derlying, more-concentrated, layers. They were the first to show that the rational basis for sizing a continu-ous thickener is to provide sufficient cross sectional area to assure that the rate of solids application (mass of solids per unit area and time) is equal to, or less than, the capacity of the rate-limiting layer for transmit-ting solids downward. The rate-lim-iting layer is the one with the lowest total suspended solids transmitting capacity (the sum of gravity trans-port and convective transport due to thickened sludge removal from the tank bottom).
Kynch (1952) provided insight into mechanisms involved in both batch and continuous thickening. He showed that, in batch thick-ening, layers with less capacity to transmit solids downward than the rate at which solids are received from overlying layers propagate upward at a constant velocity. Thus the shape of an interfacial subsidence curve in batch thickening is explained by an initial slope representing the settling velocity of the original suspension followed by continuously diminish-ing slopes as layers of higher con-centration propagate to the interface
and display their slower settling rates. The implication for continuous thickening is that, under fully-load-ed conditions, the layer that would limit solids transmitting capacity must be pulled down (by removal of thickened sludge) at the same rate as the layer tries to propagate upward. Kynch’s paper stimulated additional fundamental thickening work by, for example, Talmage and Fitch (1955), Yoshioka, et al. (1957), and Shan-non, et al. (1963).
Environmental engineers were slow to recognize developments in sludge thickening of importance to their field - none of the authors cited previously in this section were envi-ronmental engineers. Behn (1957) was amongst the first in our field to build upon the foundation from other disciplines. And, just before the end of the first half-century of the activated sludge process, basic thickening concepts appeared in environmental engineering texts [Rich (1961) and Eckenfelder and O’Connor (1961)].
SOLIDS FLUx In FInAL SETTLInG TAnKS
In accordance with the continu-ous thickening concepts de-scribed in the previous section,
the rate at which suspended solids can pass downward through a layer with solids concentration ci (M/L3) is
Gi = civi + ciu (1)
where Gi (M/L2T) and vi (L/T) are, respectively, the solids flux and gravity sedimentation veloc-ity of the layer and u (L/T) is the rate of bulk downward transport due to sludge removal from the tank bottom.
1. The Joseph P. Ripley Professor of Engineering Emeritus, School of Civil and Envi-ronmental Engineering, Cornell University, Ithaca, NY 14850, [email protected].

Winter 2014 | V 50, N 1 Environmental Engineer & Scientist | 37
The civi term in Equation 1 is the solids flux due only to gravity sub-sidence, and it is established by the settling characteristics of the activat-ed sludge solids. The ciu term is the additional flux caused by removing thickened sludge. It is established by the rate of thickened sludge removal, Qu (L3/T), and the cross sectional area of the tank, A (L2), or
u = Qu/A (2)
Thus, solids transport due to sludge removal is independent of sludge settling characteristics: it is established by the designer (who fixes A) and the operator (who determines Qu).
Graphical representation of Equation 1 as shown in Figure 1 is instructive (Dick, 1970). The batch
flux curve is obtained by experimen-tally determining the subsidence velocity of activated sludge solids in batch settling tests over a range of suspended solids concentrations and multiplying velocities by their corre-sponding concentration. The shape shown is typical, for flux goes to zero at zero concentration, passes through a maximum at intermediate concen-trations, and again approaches zero as settling velocity progressively diminishes at high concentrations. The linear line for solids flux caused by sludge withdrawal is established by selecting the underflow velocity, u. The point of Figure 1 is to illus-trate that the total possible solids flux as given by Equation 1 passes through a minimum value - one concentration, cL (L for limiting), has less total capacity for transmit-ting solids downward than all oth-ers2, and the corresponding limiting flux, GL, establishes the maximum rate at which solids can be applied. Any solids applied in excess of the limiting flux will accumulate above the rate-limiting layer awaiting their chance to pass through; if the condi-tion is sustained, solids in excess of the capacity of the limiting layer will propagate upward and ultimately be discharged with the “clarified” efflu-ent. The remedy for the overloaded situation is for the designer to pro-vide more area (decreasing applied flux) or for the operator to increase the thickened sludge withdrawal rate (increasing underflow flux).
The rate of thickened solids re-moval from a final settling tank is the product of the underflow rate and the underflow concentration (cu, M/L3), and, if the tank is operat-ing properly, this equals the applied solids flux (Ga, M/L2T) times the area of the tank; thus
Qucu = GaA (3)
But, from Equation 2, u = Qu/A, so
u = Ga/cu (4)
Thus, as illustrated graphically in Figure 2, a line drawn from any underflow concentration with
slope u identifies the correspond-ing applied solids flux (or a line drawn from any applied flux with slope u shows the corre-sponding underflow concentra-tion). The line characterizes how a final tank is being operated and, hence, is called the “operat-ing line”. The two terms on the right side
of Equation 1 are identified in Fig-ure 2. It may be seen that concen-trations for which the batch flux curve lies above the operating line have capacity for transmitting solids in excess of the rate at which they are applied (and, thus will not ex-ist in the tank). If the operating line is above the batch flux curve for a sustained period failure will occur, for solids are being applied at a rate faster than they can pass through some concentrations2. The operating line shown in Figure 2 illustrates the condition when the applied solids load exactly equals the limiting flux and identifies the rate limiting con-centration as the point of tangency3.
Constructing alternative oper-ating lines with differing slopes al-lows designers to evaluate effects of varying settling tank area, and plant operators to determine effects of varying thickened sludge withdrawal rates. These opportunities are ex-panded in the following section.
FInAL SETTLInG TAnK AS PROCESS COnTROL CEnTER
The applied solids loading may be expressed as
Ga = (Q/A)X + (R/A)X (5)
Where Q is the wastewater flow rate (L3/T), R is the recycle rate (L3/T), and X is the mixed liquor suspended solids concentration (M/L3). Equation 5 is depicted graphically in Figure 3. The line emanating from the origin at slope Q/A (the hydraulic loading in clarifier parlance) - called the “loading line” - shows the flux at-tributable to solids conveyed by wastewater flow, and, as before, the distance between the ap-
2. Solids concentrations to the left of cF in Figures 1 and 2 have less solids transmitting capacity than the limiting flux, but they are not of concern because such dilute concentra-tions do not exist in the thickening portion of final settling tanks. If the rate limiting layer is at a level below the inlet (as usual) incoming solids will be diluted to concentration cF in a perfectly designed tank because it has capacity for transmitting solids at the same rate they are received.
3. Kynch (1952) showed that the rate at which layers propagate upward in batch sedimentation is -dG/dc, the slope of a batch flux curve and of the operating line. Thus, under fully-loaded conditions in a continuous settling tank, the rate-limiting layer is held stationary because the rate of upward propagation equals the rate of downward convective transport.
FIGURE 1Graphical representation of Eq. 1 illustrates the limiting flux, GL, that establishes final settling tank capacity.
FIGURE 2The operating line identifies the underflow concentration and the total solids flux

38 | Environmental Engineer & Scientist Winter 2014 | V 50, N 1
plied flux and the operating line (shown here with slope R/A) de-picts the solids flux attributable to recycle flow4. As illustrated in Figure 3, the intersection of the loading line and the operat-ing line, called the “state point”, identifies the mixed liquor sus-pended solids concentration re-sulting from operation under the conditions depicted - no other concentration satisfies the rela-
tionship in Equation 5 (Dick, 1984).
Inspection of Figure 3 readily re-veals not only the manner in which the final settling tank is being oper-ated, but, also, the state of the entire activated sludge process: the final settling tank has reserve capacity (for the operating line is below the batch flux curve), and the aeration tank is operating far below its capacity (for the operating line slope could be
increased to shift the state point to the right so as to increase the con-centration of microorganisms in the biological reactor).
Figure 4 shows two extremely different operating lines and fur-ther illustrates the role of the final settling tank as the control center of the activated sludge process. Oper-ating line A maximizes the capacity of the biological part of the pro-cess (it allows the highest possible mixed liquor solids concentration and, hence, maximizes sludge age). Selecting that strategy would re-quire more recycle pumping capac-ity and energy, and increase oxygen requirements and decrease excess sludge production (both because of higher endogenous respiration). In contrast, selecting operating line B would, if aeration tank volume were adequate, reduce recycling and aeration costs, but increase waste sludge production.
A caveat: Changes in operating conditions as depicted in Figure 4 require monitoring of sludge settle-ability and any necessary adjustment of batch flux curves. Nevertheless, the analysis suggested by the figure aids in identifying optimal operating conditions. Predictive capability for estimating changes in the settling characteristics of activated sludge caused by operational adjustments remains for investigators in the sec-ond century of the process.
“RECEnT” DEVELOPMEnTS
It is difficult to identify significant improvements in activated sludge solids separation during the first
half century of the process. In addi-tion to recognition that the design of final settling tanks is guided by thickening concepts, as described herein, numerous developments oc-curred in recent decades.
Modeling of the process has been popular [for example, Henze, et al., 2008] but with limitations for solids separation: usual modeling of the biological phase of the process does not assure effective bioflocculation, and estimating settling velocities based on empirical correlation with the sludge volume index, as is com-mon, sacrifices accuracy.
Hydraulics of final settling tanks have been studied [by Zhou and McCorquodale (1992), for ex-ample], baffling arrangements have been advanced [see, for example, Tamayol, et al. (2010)], and inlets designed to promote flocculation have been introduced (Parker and Stenquist, 1986).
Some recent developments dramatically alter activated sludge solids separation as practiced dur-ing the first century of the process and as considered in this paper. The draw-and-fill configuration used by Ardern and Lockett has returned in the form of sequencing batch reac-tors (Irvine and Ketchum, 1989). Membrane separation of treated ef-fluent, eliminating the use of grav-ity separation [Meng, et al. (2012), for example], and ability to create granular aerobic sludge (de Bruin, et al., 2004)) significantly alter the activated sludge process. The volume of treated wastewater cur-rently separated by these processes is a small fraction of the enormous volume discharged globally from final settling tanks, but, perhaps, after a century of gaining some un-derstanding of final settling tanks, alternative options will emerge.
REFEREnCES
Alleman, J. and T. B. S. Prakasam (1983). “Reflections on Seven De-cades of Activated Sludge History,” Journal Water Pollution Control Fed-eration, Volume 55, Number 5, Pages 436-443.
Ardern, E. and W. T. Lockett (1914a). “Experiments on the Oxidation of Sewage without the Aid of Filters,” Journal of the Society of Chemical In-dustry, Volume 33, Issue 10, Pages 523-539.
Ardern, E. and W. T. Lockett (1914b). “The Oxidation of Sewage without the Aid of Filters. Part II,” Journal of the Society of Chemical Industry, Vol-ume 33, Issue 23, Pages 1122-1124.
Ardern, E. and W. T. Lockett (1915). “The Oxidation of Sewage without the Aid of Filters. Part III,” Journal of the Society of Chemical Industry, Volume 34, Issue 8, Pages 937-943.
Babbitt, H. E. (1925). Sewerage and Sew-age Treatment, Second Edition, John Wiley, New York, 516 Pages.
Behn, V. C. (1957). “Settling Behavior of Waste Suspensions,” Journal of the Sanitary Engineering Division, Amer-
FIGURE 3The loading line and the operating line intersect at the mixed liquor suspended solids concentration
FIGURE 4Final settling tanks can be operated under widely differing modes to accommodate optimal integration with the biological phase of the processThe operating line identifies the underflow concentration and the total solids flux
4. In previous figures the slope of the operating line has been shown, properly, as Qu/A; here, for convenience, it is taken as R/A. Qu is slightly greater than R because of sludge wastage. Under typical operating conditions, the error in ignoring sludge wastage is about 2 percent (Dick, 1984).
Winter 2014 | V 50, N 1 Environmental Engineer & Scientist | 39
ican Society of Civil Engineers, Vol-ume 83, Number SA5, Pages 1-20.
Coe, H. S. and G. H. Clevenger (1916). “Methods for Determining the Ca-pacities of Slime Settling Tanks,” Transactions American Institute of Mining Engineers, Volume 55, Pages 356-383.
de Bruin, L. M. M., M. K. de Kreuk, H. F. R. van der Roest, C. Uljter-linde, and M. C. M. van Loosdrecht (2004): “Aerobic Granular Sludge Technology: an Alternative to Ac-tivated Sludge?,” Water Science and Technology, Volume 49, Number 11-12, Pages 1-7.
Dick, R. I. (1970). “Role of Activated Sludge Final Settling Tanks,” Journal of the Sanitary Engineering Division, American Society of Civil Engineers, Volume 96, Number SA2, Pages 423-436.
Dick, R. I. (1976). “Folklore in the De-sign of Final Settling Tanks,” Journal Water Pollution Control Federation, Volume 48, Number 3, Pages 633-644.
Dick, R. I. (1984). “Activated Sludge Fi-nal Settling Tank Analysis,” Proceed-ings 7th Symposium on Wastewater Treatment, Environment Canada,
Ottawa, Pages 263-286.Dunbar, D. and H. T. Calvert (1908).
“Principles of Sewage Treatment,” Charles Griffin and Company, Lim-ited, London, 271 Pages.
Eckenfelder, W. W., Jr. and D. J. O’Connor (1961). Biological Waste-water Treatment, Pergamon, New York, 299 pages.
Hazen, A. M. (1904). “On Sedimenta-tion,” Transactions American Society of Civil Engineers, Volume 53, Pages 45-88.
Henze, M., M. C. M. van Loosdrecht, G. A. Ekama, and D. Brdjanovic (Edi-tors) (2008). Biological Wastewater Treatment Principles, Modelling and Design, IWA Publishing, London, 511 Pages.
Irvine, R. L. and L. H. Ketchum, Jr. (1989). “Sequencing Batch Re-actors for Biological Wastewater Treatment,” Critical Reviews in Envi-ronmental Control, Volume 18, Issue 4, Pages 255-294.
Kinnicutt, L. P., C.-E. A. Winslow, and R. W. Pratt (1910). Sewage Disposal, John Wiley, New York, 436 Pages.
Kynch, G. J. (1952). “A Theory of Sedi-mentation,” Transactions Faraday So-ciety, Volume 48, Pages 156-176.
Melling, S. E. (1914). “The Purification of Salford Sewage along the Lines of the Manchester Experiments,” Jour-nal of the Society of Chemical Industry, Volume 33, Issue 23, Pages 1124-1127.
Meng, F., S.-R. Chae, H.-S. Shin, F. Yang, and Z. Zhou (2012). “Recent Advances in Membrane Bioreactors: Configuration Development, Pol-lutant Elimination, and Sludge Re-duction,” Environmental Engineering Science, Volume 29, Number 3, Pages 139-160.
Metcalf, L. and H.P. Eddy (1922). Sew-erage and Sewage Disposal, First Edi-tion, McGraw Hill, New York, 598 Pages.
Metcalf, L. and H.P. Eddy (1930). Sewer-age and Sewage Disposal, Second Edi-tion, McGraw Hill, New York, 783 Pages.
Parker, D. and R. Stenquist (1986). “Flocculator-Clarifier Performance,” Journal Water Pollution Control Fed-eration, Volume 58, Number 3, Pages 214-219.
Rich, L. G. (1961). Unit Operations of Sanitary Engineering, John Wiley, New York, 308 Pages.
Shannon, P. T., E. Stroupe, and E. M.
Tory (1963). “Batch and Continuous Thickening,” Industrial and Engineer-ing Chemistry Fundamentals, Volume 2, Pages 203-211.
Schmeitzner, R. (1910). Clarification of Sewage, The Engineering News Pub-lishing Company, New York, 114 Pages.
Talmage, W. P. and E. B. Fitch (1955). “Determining Thickener Unit Ar-eas,” Industrial and Engineering Chemistry, Volume 47, Pages 38-41.
Tamayol, A., B. Firoozabadi, and M. A. Ashjari (2010). “Hydrodynam-ics of Secondary Settling Tanks and Increasing their Performance Using Baffles,” Journal of Environmental En-gineering, Volume 136, Pages 32-39.
Yoshioka, N., Y. Hotta, S. Tanaka, S. Niato, and S. Tsugami (1957). “Continuous Thickening of Homo-geneous Flocculated Slurries,” Chem-ical Engineering (Tokyo), Volume 21, Pages 66-74.
Zhou, S. and J. A. McCorquordale (1992). “Mathematical Modelling of a Circular Clarifier,” Canadian Jour-nal of Civil Engineering, Volume 19, Number 3, Pages 365-374.
Help Us Grow the Academy – Refer a Colleague for CertificationAs a member of AAEES, you are part of a growing number of environmental professionals who have gone the extra mile to become Board Certified. We all have our reasons for putting in the time and effort to achieve this milestone, but there is no doubt that we saw value in gaining Board Certified status. In addition to the personal aspects of becoming certified, many of us also think of it as a responsibility to the community we live and work in, a responsibility that encompasses optimizing the environmental solutions we develop and maximizing the benefits to be derived from our work.
Running parallel to the communities that we serve as environmental engineers and scientists is membership in the virtual and intellectual "community" that is represented by the Academy. The Academy thrives on the passion and professionalism embodied by our members. We are all in charge of building this community by continually identifying and recruiting talented individuals to join us.
We need your help in finding the right people to begin the certification process with. Think about your staff and colleagues in the context of the Academy. Are they people whose body of work, technical expertise, professional demeanor, and energy levels makes them outstanding candidates for certification?
We know they are out there. We need you to take the first step by recommending them to us. Tell us who the leading players are on your team and we will work to recognize them with the same measure of excellence that you have achieved.
The annual application deadline is March 31.
Start compiling your list of qualified candidates now. For assistance, go to: http://www.aaees.org/members-recruitment.php. OF ENVIRONMENTAL ENGINEERS & SCIENTISTS
147 Old Solomons Island Road, Suite 303 | Annapolis, MD 21401 | 410.266.3311, FAX: 410.266.7653 | http://www.aaees.org

40 | Environmental Engineer & Scientist Winter 2014 | V 50, N 1
DeSigning ACtiVAteD SluDge SySteMS foR nitRogen ReMoVAlGlen T. Daigger, Ph.D., P.E., BCEE, NAE1
Nitrogen is always present in domestic wastewater and can also be present in industrial
wastewaters. Nitrogen discharges increasingly need to be reduced to protect ambient water quality and desired uses of water resources. For-tunately, activated sludge processes can be modified to accomplish both nitrification (conversion of ammo-nia-nitrogen to nitrate-nitrogen) and nitrogen removal. Conven-tional biological nitrogen removal is accomplished through autotrophic nitrification, which converts am-monia-nitrogen to nitrate-nitrogen, and heterotrophic denitrification, which uses nitrate-nitrogen as a ter-minal electron acceptor and reduces it to nitrogen gas. The principals of these biological processes and how they can be applied practically in activated sludge systems are well understood and widely applied. A well established set of biological nitrogen removal processes, such as Modified Ludzak-Ettinger (MLE) and Four-Stage Bardenpho, are available and are routinely applied in practice. Nitrous oxide (N2O) is produced in biological nitrogen removal processes, including acti-vated sludge, and estimates suggest that this is a nationally significant greenhouse gas emission source. Research is on-going and helping to elucidate both the mechanisms of nitrous oxide production and emis-sion and control approaches. At the same time, biological metabolisms are being newly discovered and con-verted into practical activated sludge treatment processes which require significantly less oxygen and biode-gradable organic matter. These pro-cesses, which require less resource consumption to achieve biological nitrogen removal, offer the potential for achieving wastewater treatment, including biological nitrogen remov-al, in a much more environmentally sustainable fashion.
InTRODUCTIOn
Nitrogen control was an es-sential component of the activated sludge process as
originally developed 100 years ago (Alleman and Prakasam, 1983). At that time, complete nitrification was a key indicator of the comple-tion of biological stabilization of the influent wastewater. Thus the process was initially operated to achieve complete nitrification. This was relaxed over the decades as the concept of providing just sufficient treatment to protect receiving wa-ter quality was introduced. It was found that activated sludge systems could be designed and operated to remove biodegradable organic mat-ter without also converting ammo-nia-nitrogen to nitrate-nitrogen. As a consequence, when the activated sludge process was adopted as the model for secondary treatment of municipal wastewater in the United States, performance requirements specified effluent 5-day biochemical oxygen demand (BOD5) limitations but not effluent nitrogen values. Thus, for many practitioners the ac-tivated sludge process became associ-ated with the removal of BOD5 and not nitrogen.
The requirements for environ-mental protection have changed over the past 100 years. The human population has grown significantly, and even greater economic growth has occurred, with a commensurate much greater generation of waste-water. Likewise, environmental pro-tection requirements have grown significantly. In years past, the en-vironmental protection objective was simply to avoid gross pollution of water bodies, whereas today we look to restore receiving water body quality to near-natural conditions. As ambient water quality expecta-tions and requirements have become more stringent over the past several
decades, the importance of nitro-gen control, not only for ammonia-nitrogen but also total nitrogen, has become evident. In response, the activated sludge process has been adapted to provide significant nitro-gen removal.
Significant interest in and practi-cal application of biological nitrifica-tion (removal of ammonia-nitrogen by its conversion into nitrate-nitro-gen) occurred beginning in the late 1970’s and 1980’s as the adverse impacts of ammonia discharges be-came evident. Research on biological nitrogen removal was also initiated in the 1960’s but did not see signifi-cant full-scale application until the late 1980’s. The implementation of biological nitrogen removal is still continuing, especially in coastal lo-cations where discharges are to es-tuarine environments.
UnDER WHAT CIRCUMSTAnCES IS nITROGEn COnTROL WARRAnTED?
Nitrogen is present in mu-nicipal wastewater because it is in the diet of human
beings and, as it is digested, it must be excreted. It is discharged in the urine as urea (CO(NH2)2), which is hydrolyzed relatively quickly in the sewer to ammonia-nitrogen, and in the feces as organic nitrogen (Met-calf & Eddy, 2013). Some house-hold products also contain nitrogen compounds (although this is mini-mal these days). Municipal waste-water may also contain industrial wastewater which can also contain a wide variety of nitrogen-contain-ing compounds. Some nitrogen is removed through conventional wastewater treatment as suspended solids, and the associated nitrogen is removed in primary treatment, and some nitrogen is used for biomass growth during secondary treatment. Municipal wastewater contains ex-cessive quantities of nitrogen relative to biosynthesis needs however, and consequently, an effluent not treated for nitrogen removal will contain
ammonia-nitrogen and some or-ganic nitrogen. It will also contain nitrate-nitrogen if the biological treatment system is nitrifying.
Nitrogen is an essential nutrient for the growth of plant and animal life and, consequently, must be pres-ent in sufficient quantities in both terrestrial and aquatic environments. However, like most substances, there can be “too much of a good thing”, and the presence of excessive quanti-ties of nitrogen adversely impacts wa-ter quality and beneficial uses of water resources as outlined in Table 1.
Ammonia-nitrogen adversely af-fects ambient water quality in several ways. When discharged to water-ways it can be nitrified, creating an oxygen demand which can deplete the oxygen resources of the receiving stream to below levels required by the desired aquatic organisms (generally fish). Ammonia is also a weak base and is present in two forms - un-ion-ized (NH3-N) and ionized (NH4
+-N) - depending on the ambient pH. The un-ionized fraction increases as the pH increases. Un-ionized am-monia is quite toxic to aquatic or-ganisms, and ambient water quality standards limit un-ionized ammonia concentrations in receiving streams to quite low levels (generally about 0.1 mg-N/L). The pH of receiving waters is often higher than that of the treated water, leading to elevated un-ionized ammonia concentrations and the need for stringent control of total ammonia (un-ionized plus ion-ized) discharges. Ammonia-nitrogen can also interfere with water supply as it will combine with chlorine to form chloramines, which are a less effective disinfectant than free chlo-rine, and its presence in treated wa-ter distribution systems can lead to the growth of a nitrifying biofilm and the resulting deterioration in drinking water quality.
The presence of nitrate-nitrogen is also a drinking water concern as it can cause methemoglobinemia, also known as blue baby syndrome. As a result, the primary drinking water
1. Senior Vice President and Chief Technology Officer, CH2M HILL, 9191 South Jamaica Street, Englewood, CO 80112. [email protected]
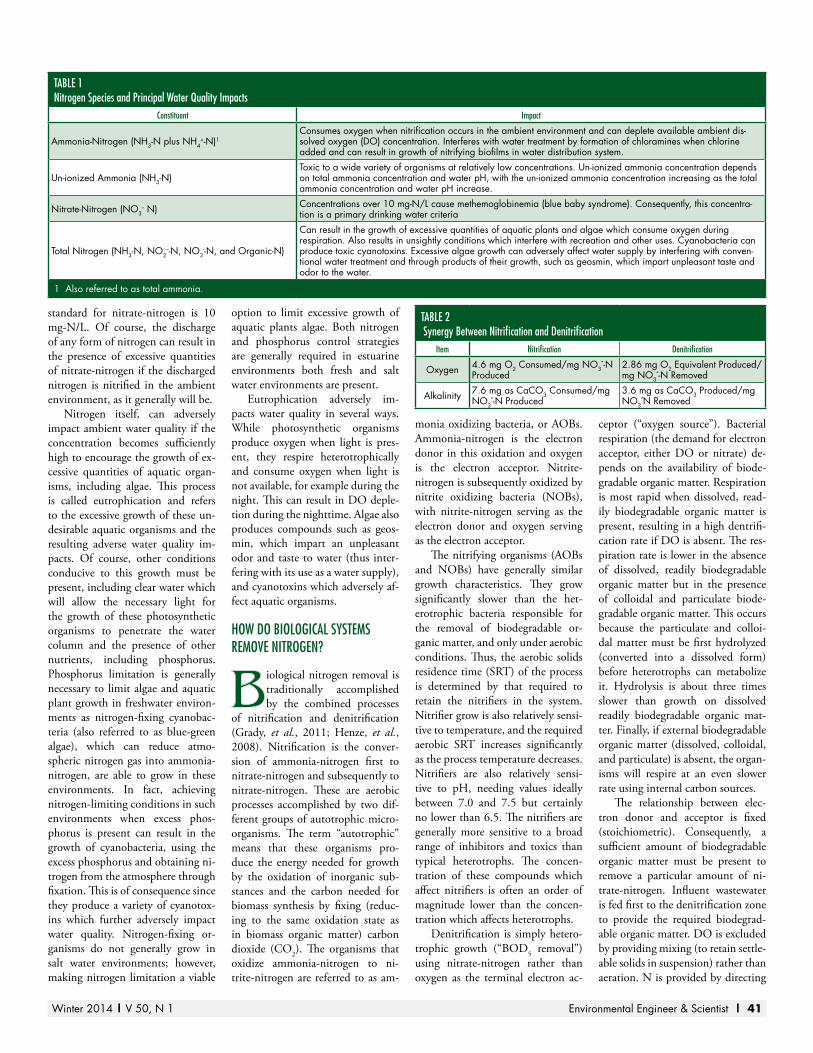
Winter 2014 | V 50, N 1 Environmental Engineer & Scientist | 41
standard for nitrate-nitrogen is 10 mg-N/L. Of course, the discharge of any form of nitrogen can result in the presence of excessive quantities of nitrate-nitrogen if the discharged nitrogen is nitrified in the ambient environment, as it generally will be.
Nitrogen itself, can adversely impact ambient water quality if the concentration becomes sufficiently high to encourage the growth of ex-cessive quantities of aquatic organ-isms, including algae. This process is called eutrophication and refers to the excessive growth of these un-desirable aquatic organisms and the resulting adverse water quality im-pacts. Of course, other conditions conducive to this growth must be present, including clear water which will allow the necessary light for the growth of these photosynthetic organisms to penetrate the water column and the presence of other nutrients, including phosphorus. Phosphorus limitation is generally necessary to limit algae and aquatic plant growth in freshwater environ-ments as nitrogen-fixing cyanobac-teria (also referred to as blue-green algae), which can reduce atmo-spheric nitrogen gas into ammonia-nitrogen, are able to grow in these environments. In fact, achieving nitrogen-limiting conditions in such environments when excess phos-phorus is present can result in the growth of cyanobacteria, using the excess phosphorus and obtaining ni-trogen from the atmosphere through fixation. This is of consequence since they produce a variety of cyanotox-ins which further adversely impact water quality. Nitrogen-fixing or-ganisms do not generally grow in salt water environments; however, making nitrogen limitation a viable
option to limit excessive growth of aquatic plants algae. Both nitrogen and phosphorus control strategies are generally required in estuarine environments both fresh and salt water environments are present.
Eutrophication adversely im-pacts water quality in several ways. While photosynthetic organisms produce oxygen when light is pres-ent, they respire heterotrophically and consume oxygen when light is not available, for example during the night. This can result in DO deple-tion during the nighttime. Algae also produces compounds such as geos-min, which impart an unpleasant odor and taste to water (thus inter-fering with its use as a water supply), and cyanotoxins which adversely af-fect aquatic organisms.
HOW DO BIOLOGICAL SySTEMS REMOVE nITROGEn?
Biological nitrogen removal is traditionally accomplished by the combined processes
of nitrification and denitrification (Grady, et al., 2011; Henze, et al., 2008). Nitrification is the conver-sion of ammonia-nitrogen first to nitrate-nitrogen and subsequently to nitrate-nitrogen. These are aerobic processes accomplished by two dif-ferent groups of autotrophic micro-organisms. The term “autotrophic” means that these organisms pro-duce the energy needed for growth by the oxidation of inorganic sub-stances and the carbon needed for biomass synthesis by fixing (reduc-ing to the same oxidation state as in biomass organic matter) carbon dioxide (CO2). The organisms that oxidize ammonia-nitrogen to ni-trite-nitrogen are referred to as am-
monia oxidizing bacteria, or AOBs. Ammonia-nitrogen is the electron donor in this oxidation and oxygen is the electron acceptor. Nitrite-nitrogen is subsequently oxidized by nitrite oxidizing bacteria (NOBs), with nitrite-nitrogen serving as the electron donor and oxygen serving as the electron acceptor.
The nitrifying organisms (AOBs and NOBs) have generally similar growth characteristics. They grow significantly slower than the het-erotrophic bacteria responsible for the removal of biodegradable or-ganic matter, and only under aerobic conditions. Thus, the aerobic solids residence time (SRT) of the process is determined by that required to retain the nitrifiers in the system. Nitrifier grow is also relatively sensi-tive to temperature, and the required aerobic SRT increases significantly as the process temperature decreases. Nitrifiers are also relatively sensi-tive to pH, needing values ideally between 7.0 and 7.5 but certainly no lower than 6.5. The nitrifiers are generally more sensitive to a broad range of inhibitors and toxics than typical heterotrophs. The concen-tration of these compounds which affect nitrifiers is often an order of magnitude lower than the concen-tration which affects heterotrophs.
Denitrification is simply hetero-trophic growth (“BOD5 removal”) using nitrate-nitrogen rather than oxygen as the terminal electron ac-
ceptor (“oxygen source”). Bacterial respiration (the demand for electron acceptor, either DO or nitrate) de-pends on the availability of biode-gradable organic matter. Respiration is most rapid when dissolved, read-ily biodegradable organic matter is present, resulting in a high dentrifi-cation rate if DO is absent. The res-piration rate is lower in the absence of dissolved, readily biodegradable organic matter but in the presence of colloidal and particulate biode-gradable organic matter. This occurs because the particulate and colloi-dal matter must be first hydrolyzed (converted into a dissolved form) before heterotrophs can metabolize it. Hydrolysis is about three times slower than growth on dissolved readily biodegradable organic mat-ter. Finally, if external biodegradable organic matter (dissolved, colloidal, and particulate) is absent, the organ-isms will respire at an even slower rate using internal carbon sources.
The relationship between elec-tron donor and acceptor is fixed (stoichiometric). Consequently, a sufficient amount of biodegradable organic matter must be present to remove a particular amount of ni-trate-nitrogen. Influent wastewater is fed first to the denitrification zone to provide the required biodegrad-able organic matter. DO is excluded by providing mixing (to retain settle-able solids in suspension) rather than aeration. N is provided by directing
TABLE 1nitrogen Species and Principal Water Quality Impacts
Constituent Impact
Ammonia-Nitrogen (NH3-N plus NH4+-N)1
Consumes oxygen when nitrification occurs in the ambient environment and can deplete available ambient dis-solved oxygen (DO) concentration. Interferes with water treatment by formation of chloramines when chlorine added and can result in growth of nitrifying biofilms in water distribution system.
Un-ionized Ammonia (NH3-N)Toxic to a wide variety of organisms at relatively low concentrations. Un-ionized ammonia concentration depends on total ammonia concentration and water pH, with the un-ionized ammonia concentration increasing as the total ammonia concentration and water pH increase.
Nitrate-Nitrogen (NO3-- N) Concentrations over 10 mg-N/L cause methemoglobinemia (blue baby syndrome). Consequently, this concentra-
tion is a primary drinking water criteria
Total Nitrogen (NH3-N, NO2---N, NO3
--N, and Organic-N)
Can result in the growth of excessive quantities of aquatic plants and algae which consume oxygen during respiration. Also results in unsightly conditions which interfere with recreation and other uses. Cyanobacteria can produce toxic cyanotoxins. Excessive algae growth can adversely affect water supply by interfering with conven-tional water treatment and through products of their growth, such as geosmin, which impart unpleasant taste and odor to the water.
1 Also referred to as total ammonia.
TABLE 2 Synergy Between nitrification and Denitrification
Item nitrification Denitrification
Oxygen 4.6 mg O2 Consumed/mg NO3--N
Produced2.86 mg O2 Equivalent Produced/mg NO3
--N Removed
Alkalinity 7.6 mg as CaCO3 Consumed/mg NO3
--N Produced3.6 mg as CaCO3 Produced/mg NO3
-N Removed

42 | Environmental Engineer & Scientist Winter 2014 | V 50, N 1
mixed liquor from an aerobic por-tion of the process, where nitrate-ni-trogen is produced by nitrification, to the denitrification zone. The de-nitrification zone is typically referred to as the anoxic zone, which refers to the condition where DO is excluded but nitrate-nitrogen is provided for heterotrophic respiration.
Nitrification and denitrification are complimentary processes. Nitri-fication requires the provision of ox-ygen (since it is an aerobic process). This requires a significant amount of energy cost since it is required to transfer oxygen into water. The produced nitrate-nitrogen is used to oxidize some of the biodegradable organic matter present in the influ-ent wastewater however, thereby re-ducing the oxygen required for this purpose and, consequently, the net process energy requirement. Like-wise, there is synergy with regard to alkalinity consumption. Alkalinity is the buffering capacity in water - the ability to resist unwanted changes in pH (remember the nitrifiers are sensitive to pH). Nitrification results in the consumption of alkalinity (buffering capacity) as the weak base ammonia is converted into nitrous (HNO2) and nitric (HNO3) acid. However, denitrification results in removal of these acids, although a base is not formed (nitrogen gas, N2 has neither acid nor base properties). Table 2 summarizes these synergies. As noted, the oxygen equivalent sav-ing and alkalinity production from denitrification are less than the oxy-gen and alkalinity consumption for nitrification, but a positive contribu-tion is still indicated.
HOW ARE BIOLOGICAL nITROGEn REMOVAL PROCESSES COnFIGURED?
Figure 1 illustrates the famil-iar Modified Ludzak-Ettinger (MLE) biological nitrogen
removal process. The initial anoxic zone is created by providing mix-ing but no aeration; introducing influent wastewater, with its biode-gradable organic matter, into it; and providing nitrate-nitrogen through the recycle of mixed liquor from the downstream aerobic nitrification zone via the nitrified recycle (NRCY) and return activated sludge (RAS) streams. Denitrification occurs in this upstream zone, thereby remov-
ing a portion of the biodegradable organic matter in the influent waste-water and producing alkalinity. The denitrified mixed liquor, still con-taining most of the nitrogen from the influent wastewater, flows into the downstream aerobic zone where the ammonia-nitrogen is converted into nitrate-nitrogen. A swing zone (where both mixing and aeration fa-cilities are provided), which can be operated either with mixing and no aeration (and thus be part of the an-oxic zone) or with aeration (and can be part of the aerobic zone), is also illustrated.
The MLE process is capable of achieving significant biological ni-trogen removal, but the extent of removal is limited because residual nitrate-nitrogen must be present at the end of the aerobic zone to be recirculated back to the aerobic zone for denitrification. Increasing NRCY recirculation increases the transport of nitrate-nitrogen back to the anoxic zone for increased de-nitrification, but with diminishing effect as the recirculation flow rate is increased. Effluent total nitrogen concentrations around 10 mg-N/L can typically be achieved with this process configuration, which repre-sents 70 to 85 percent removal from typical domestic wastewater.
When further nitrogen removal is needed, another anoxic zone can be added downstream of the initial (or primary) aerobic zone. The rate of denitrification in this zone is sig-nificantly lower than in the initial anoxic zone because of the limited supply of biodegradable organic matter. The amount of nitrate to be removed is also significantly less, however, due to the large amount removed in the upstream anoxic zone. A small polishing aerobic zone is typically provided follow-ing the second anoxic zone to strip out dissolved nitrogen gas, which can interfere with settling in the downstream secondary clarifier, and to oxidize remaining biodegradable organic matter and ammonia-nitro-gen. Supplemental biodegradable organic carbon, for example, pur-chased carbon sources like metha-nol, can be added to the second anoxic zone to accelerate the rate if needed. This process is commonly referred to as Four-Stage Barden-pho as it contains four stages (two
anoxic and two aerobic), and it was developed by James Barnard.
Numerous other activated sludge biological nitrogen removal configu-rations are possible and have been implemented as documented in nu-merous textbooks and design manu-als (WEF, 2013; Grady, et al., 2011; WEF, 2009; Henze, et al., 2008). Some typical examples include con-trolling oxygen input to oxidation ditches and step feed systems. All of these processes operate according to the principals outlined above.
IS GREEnHOUSE GAS PRODUCTIOn An ISSUE?
Nitrous oxide (N2O) is an in-termediate in heterotrophic denitrification and can be
produced by nitrifying organisms. If produced it can be subsequently metabolized by heterotrophic organ-isms, but it can also be stripped from the water phase by aeration. This is of concern because nitrous oxide is a powerful greenhouse gas with a greenhouse gas potential 310 times that of carbon dioxide. The United States Environment Protection Agency (USEPA, 2013) estimates
that nitrous oxide emissions from wastewater treatment plants were 5.2 million metric tons (MMT) of CO2 equivalents in 2011 out of a total of 356.9 MMT CO2 equiva-lents. This is further out of total greenhouse gas emissions from all sources of 6,702.3 MMT of CO2 equivalents in 2011. Consequently, controlling nitrous oxide emissions from biological nitrogen removal processes is a significant objective.
Research on the production and emission of nitrous oxide from bio-logical wastewater treatment plants is currently on-going and helping to unravel the relatively complex set of relationships involved (Chandran, 2012; GWRC, 2011). The factors that affect nitrous oxide production by heterotrophic bacteria are well known, and results to date gener-ally indicate that this is not the principal source of activated sludge process emissions. Aeration of an-oxic zones, where heterotrophs are denitrifying (and, consequently, producing nitrous acid), is limited to minimize DO transfer into the zone. Thus, stripping of formed ni-trous oxide is minimized. Moreover, released nitrous oxide can be sub-
FIGURE 1Modified Ludzak-Ettinger (MLE) Process
FIGURE 2Four-Stage Bardenpho Process

Winter 2014 | V 50, N 1 Environmental Engineer & Scientist | 43
sequently taken up by denitrifying heterotrophs when the conditions that lead to significant nitrous oxide formation are reversed. In contrast, current research suggests that ni-trous oxide production by nitrifiers is the principal source of nitrous oxide emissions. It is becoming clear that maintaining stable, consistent, and complete nitrification, even on a diurnal basis, is one of the keys to minimize biological process nitrous oxide emissions. It may be expected that research, coupled with field-scale measurements and practical experience, will lead to full elucida-tion of the factors responsible for ac-tivated sludge process nitrous oxide emissions and methods for minimiz-ing them.
WHAT ARE THE EMERGInG nITROGEn REMOVAL OPTIOnS?
Numerous historic biologi-cal nitrogen removal ob-servations occurring in the
apparent absence of sufficient bio-degradable organic matter lead to speculation about potential novel nitrogen removal pathways and their significance for biological nitrogen removal process technology. Then, in 1988, microorganisms responsible for a biological metabolism first sug-gested in 1977 (Broda, 1977) were isolated, leading a few years later to the development and full-scale im-plementation of biological processes based on this metabolism (Kuenen, 2008). It was observed that, based on thermodynamics, sufficient ener-gy is available for biological growth via the oxidation of ammonia-nitro-gen with nitrite-nitrogen serving as the terminal electron acceptor and conversion of the nitrogen to nitro-gen gas. It was further speculated that, since this is possible, it is likely that autotrophic organisms using this metabolism to produce the en-ergy necessary for growth and using carbon dioxide as the carbons source for biomass production had likely evolved. This was confirmed in 1999 with isolation of bacteria using this metabolism (Strous, et al., 1999). A small amount of nitrate-nitrogen is also produced which must be sub-sequently removed by heterotrophic denitrification if extensive nitrogen removal is required (Strous, et al., 1998). The reaction is referred to as
ANaerobic AMMonium OXidation (Anammox), and processes utilizing it are referred to as accomplishing deammonification.
The overall process requires con-version by AOBs of about half of the ammonia-nitrogen present in the subject wastewater to nitrite (referred to as partial nitritation), followed by utilization by Anammox bacte-ria of the produced nitrite-nitrogen as terminal electron acceptor with the remaining ammonia-nitrogen serving as electron donor. The net result is that the ammonia-nitrogen present in the influent wastewater is converted to nitrogen gas. Referred to partial nitritation/deammonifica-tion, this overall process can result in a significant reduction in process oxygen requirements when treating wastewaters with limited amounts of biodegradable organic matter. Pro-cess oxygen savings are provided be-cause ammonia-nitrogen only needs to be oxidized to nitrite-nitrogen, which requires only three-quarters of the oxygen required to oxidize it to nitrate-nitrogen. Furthermore, only about half of the influent am-monia-nitrogen needs to be oxidized at all. Biodegradable organic matter requirements are minimized as it is only needed to denitrify the modest amounts of nitrate formed.
The energy savings potential offered by removing nitrogen by partial nitritation/deammonifica-tion has been a key component in the concept of achieving energy neutral biological nutrient removal wastewater treatment. The greatly reduced biodegradable organic mat-ter requirement for biological nitro-gen removal using this process allows influent carbon to be captured prior to biological nitrogen removal treat-ment, for example via chemically en-hanced primary treatment (CEPT) or high-rate, non-nitrifying biologi-cal treatment. The captured carbon can subsequently be converted into energy, for example via anaerobic digestions and utilization of the produced biogas for combined heat and power production (CHP). This, coupled with the greatly reduced energy requirements for biological nitrogen removal, have proven cru-cial to achieving energy neutrality in full-scale plants.
Partial nitritation/deammoni-fication has been applied full-scale
to treat the high-strength recycle streams from solids processing sys-tems, especially those employing anaerobic digestion which produces a recycle stream which is high in am-monia-nitrogen when the digested sludge is subsequently dewatered. These are commonly referred to as sidestream applications. Significant research and demonstration work is on-going to extend this process to the main liquid stream process, which is commonly referred to as mainstream treatment (for exam-ple, see WEF/IWA, 2013 and the results of the recent workshops at the Water Environment Federation Annual Technical Exhibition and Conference - WEFTEC). It appears that partial nitritation/deammoni-fication is likely to become a much more widely used biological nitro-gen removal activated sludge process in the future.
SUMMARy
In summary, the control of nitro-gen discharges is of increasing importance and can be accom-
plished routinely and effectively us-ing modifications of the activated sludge process. The fundamental and practical basis for activated sludge processes based on heterotrophic de-nitrification and autotrophic nitrifi-cation is well established, and these processes are widely applied in prac-tice. Nitrous oxide emissions from biological nitrogen removal activated sludge processes can be a significant source of greenhouse emissions, and research is actively addressing the un-derlying mechanisms and providing an improved understanding to mini-mize these emissions. New biological nitrogen removal process technol-ogy is developing rapidly based on the Anammox biological nitrogen removal metabolism with processes commonly referred to as partial ni-tritation/deammonification. These technologies offer the potential for wastewater treatment plants to be en-ergy-neutral while also achieving ex-tensive biological nitrogen removal.
REFEREnCES
Alleman, J. E. and T. B. S. Prakasam (1983). “Reflections on Seven De-cades of Activated Sludge History,” Journal of the Water Pollution Control Federation, 55(5). 436-443.
Broda, E. (1977). “Two Kinds of Litho-trophs Missing in Nature,” Zeitschrift fur Allgemeine Mikrobiologie, 17(6). 491-493.
Chandran, K. (2012). Greenhouse Gas Emissions From Wastewater Treat-ment Operation Phase I: Molecular Level Through Whole Reactor Level Characterization, U4R07, Water Environment Research Foundation, Alexandria, VA.
Global Water Research Coalition (2011). N2O and CH4 Emission From Waste-water Collection and Treatment Systems: State of the Science Report, Report No. 29, IWA Publishing, London.
Grady, C. P. L., Jr., G. T. Daigger, N. G. Love, and C. D. M. Filipe (2011). Biological Wastewater Treatment, Third Edition, CRC Press, Boca Ra-ton, FL.
Henze, M., M. C. van Loosdrecht, G.A. Ekama, and D. Brdjanovic (2008). Biological Wastewater Treatment: Principles, Modelling and Design, IWA Publishing, London.
Kuenen, J. G. (2008). “Anammox Bacte-ria: From Discovery to Application,” Nature Reviews Microbiology 6, 320-326.
Strous, M., J. Fuerst, E. Kramer, S. Lo-gemann, G. Muyzer, K. T. van de Pas-Schoonen, R. Webb, J. G. Kue-nen, and M. S. M. Jetten (1999). “Missing Lithotroph Identified as New Planctomycete, “ Nature, 400, 446-44.
M. Strous, J. J. Heijnen, J. G. Kuenen, and M. S. M. Jetten (1998). “The Sequencing Batch Reactor as a Pow-erful Tool for the Study of Slowly Growing Anaerobic Ammonium-ox-idizing Microorganisms,” Applied Microbiology and Biotechnology, 50(5). 589-596.
Metcalf & Eddy, Inc., G. Tchobano-glous, H. D. Stensel, R. Tsuchihashi, and F. Burton (2013). Wastewater Engineering: Treatment and Resource Recovery, Fifth Edition, McGraw Hill, Boston.
United States Environmental Protection Agency (2013). Inventory of U.S. Greenhouse Emissions and Sinks: 1990 - 2011, EPA 430-R-13-001, Wash-ington, DC.
WEF/IWA (2013). Proceedings of the Conference Entitled Nutrient Removal and Recovery 2013, Vancouver, BC, USB.
Water Environment Federation (2013). Operation of Nutrient Removal Facili-ties, Manual of Practice No. 37, Alex-andria, VA.
Water Environment Federation (2009). Design of Municipal Wastewater Treat-ment Plants, Manual of Practice No. 8, Fifth Edition, Alexandria, VA.

44 | Environmental Engineer & Scientist Winter 2014 | V 50, N 1
PhoSPhoRuS ReMoVAl in the ACtiVAteD SluDge PRoCeSSJames L. Barnard, Ph.D., BCEE, WEF Fellow, IWA Senior Fellow, Dist. MASCE1
InTRODUCTIOn
Limnological studies (Vollen-weider, 1968) showed that phosphorus was the limiting
nutrient for algae growth in inland water and led to an agreement be-tween Canada and the USA to re-move phosphorus from discharges to the Great Lakes (Great Lakes Water Quality Agreement of 1972). Widespread addition of chemicals such as ferric salts and alum fol-lowed to precipitate phosphorus where it could be removed with the waste sludge. The speedy recovery of Lake Washington in Seattle when wastewater was diverted convinced researchers that eutrophication could be curbed if the phosphates (P) discharged to the water bodies could be reduced.
EARLy HISTORy OF BIOLOGICAL PHOSPHORUS REMOVAL (EBPR)
Srinath et al. (1959) noted that P was released in the under-aerated upstream
zone of a plug-flow reactor but thought of this as a problem that needed more oxygen, which the plant could not supply. Levin and Shapiro (1965) experimented in the laboratory with P uptake under aer-obic conditions and release under anaerobic conditions and devised the first practical EBPR process called PhoStrip in which the P was taken up by organisms in a plug-flow high rate plant that did not nitrify (Figure 2-A). The return ac-tivated sludge (RAS) was retained in a thickener for more than 30 hours where fermentation resulted in the release of P to the supernatant from which it was precipitated with lime. The underflow, “stripped” of P, was returned to the aeration basin where P uptake occurred. More in-cidents were reported by Vacker et al. (1967), Witherow (1970), and
Milbury et al. (1971). All of these plants were non-nitrifying plants with plug-flow configurations. Mil-bury et al. also reported problems with P release at the inlet zone be-cause of the inability of the aeration system to supply enough air and noted that this “problem” was ex-perienced at all the plug-flow plants that reported “luxury uptake” of P.
DEVELOPMEnT OF BIOLOGICAL nUTRIEnT REMOVAL (BnR)
The removal of both nitrogen and P from wastewater is re-ferred to as BNR. The water
reclamation project for the city of Windhoek, Namibia, and severe eutrophication in reservoirs around Johannesburg, South Africa, led to Barnard (1973) developing the 4-stage nitrogen (N) removal pro-cess now known as the Bardenpho process at the laboratories of the National Water Research Institute (NWRI) in Pretoria, South Africa. A 100 m3/d pilot plant consisting of anoxic/aerobic/anoxic/aerobic stages was created by partitioning an exist-ing structure using movable gates as shown in Figure 1. A “dead zone” with an incidental connection to the second anoxic zone resulted. Some mixed liquor which fermented in the “dead zone” passed back and forth to the 2nd anoxic zone where P was re-leased to 32 mg/L. While nitrogen removal in excess of 90% percent was observed, P profiles through the plant showed that the effluent or-thophosphates were consistently re-moved from about 9 mg P/L in the influent to less than 0.2 mg P/L in the filtered effluent. Noting that all plants that observed biological P up-take reported a release of P in a zone ahead of the main aeration zone, Barnard (1974a,b) postulated that for excess biological P removal to occur, it is necessary that the mixed liquor pass through an anaerobic
phase free of nitrates and dissolved oxygen (DO) where P is released, followed by an aerated zone where it will be taken up. Unaware that the inadvertent connection between the second anoxic zone and the dead zone of the pilot plant provided this condition, Barnard (1976) proposed that anaerobic conditions could best be obtained ahead of the first anoxic zone, on the assumption that the 4-stage nitrogen N removal plant would leave few nitrates in the RAS. Nicholls (1975) experimented suc-cessfully with this concept at the temporary Alexandra Wastewater Treatment Plant (WWTP) in Jo-hannesburg when switching off aerators near the inlet to create a low dissolved-oxygen (DO) condition similar to that observed in other full-scale plants, leading to the decision to add formal anaerobic stages ahead of the 750,000 population equiva-lents (PE) 4-stage Johannesburg Goudkoppies WWTP, then under construction. This rapid application of the BNR technology encouraged other authorities in the area to use the process because the need was evident, even though there was no regulation at that time that required the P removal of phosphorus.
The first application of BNR in North America was at the Palmetto, FL, plant in 1977, followed by the Kelowna plant in BC, Canada.
BIOLOGICAL MODEL
Based on the PhoStrip pro-cess, Fuhs and Chen (1975) suggested that certain bac-
teria - later collectively referred to as polyphosphate accumulating or-ganisms (PAOs) - can take up ex-cessive amounts of P in the aeration basin when supplied with acetate as feed in a preceding anaerobic zone free of nitrates and DO and store them as high energy phosphate bonds. When recycled back to the anaerobic zone, the PAOs obtain energy from these high-energy bonds to take up VFA and store it
as an intermediate product such as Poly-β-alkoalates (PHA) in the an-aerobic zone, releasing phosphorus to the liquid phase. When passing through the aerobic zone they me-tabolize the stored PHA to provide energy for the take up of all phos-phorus released plus that in the in-fluent. When sludge is wasted from the aerobic zone the accumulated P is removed. This hypothesis ex-plained why nitrate or DO in the RAS could pose a problem that required the reduction of nitrates in the RAS. The model of Fuhs & Chen was further refined by Co-meau-Wentzel model (Comeau et al., 1986; Wentzel et al., 1986), in which poly-P and PHA intracellu-lar storage polymers played a central role, and the Mino model (Mino et al., 1988), in which glycogen was identified as a third central intracel-lular polymer. Experimental work by Smolders et al. (1994) and others confirmed the role of glycogen in PAOs and opened the way to inte-grate the competition of glycogen-accumulating organisms (GAOs) that stored PHAs and glycogen but not poly-P.
PROCESS COnFIGURATIOnS FOR BnR
Barnard (1976) proposed a number of BNR process configurations, such as the
Phoredox (Figure 2B), for a non-nitrifying plant. The configurations illustrated on the other flow sheets would enable BNR by allowing for the reduction of nitrates in the return sludge to minimize inter-ference in the anaerobic zone. The Modified Bardenpho plant (Fig-ure 2C) was used for the original plant designs for the Goudkoppies WWTP in Johannesburg and the Cape Flats WWTP in Cape Town, South Africa, both of them treating 750,000 PE’s. The 3-stage Barden-pho process (Figure 2D) was used with plants having surface aerators, 1. Global Practice & Technology Leader, Black & Veatch, Kansas City

Winter 2014 | V 50, N 1 Environmental Engineer & Scientist | 45
which allowed a high degree of si-multaneous nitrification and deni-trification (SND), which reduced nitrates in the RAS (van Huyssteen et al., 1990).
The University of Cape Town (UCT) process (Figure 2E) was developed in the laboratory by Marais et al. (1983) using fine bubble aeration with little SND
and, excessive nitrates in the RAS. In the UCT process, the RAS was returned to the anoxic zone for de-nitrification, and mixed liquor was recycled from the end of the anoxic zone, where the nitrate concentra-tion could be reduced, prior to be-ing returned to the anaerobic zone. This was improved by the Modified UCT (MUCT) process shown in Figure 2F. Due to the lack read-ily biodegradable chemical oxy-gen demand (rbCOD) or volatile fatty acids (VFAs) in the influent to the Westbank (now Westside Regional Wastewater Treatment Plant [WRWTP], British Colum-bia, Canada), primary sludge was fermented and supernatant passed to the anaerobic zone. Most of the influent was passed to the anoxic zone, while 5 to 10% percent of it was used to assist in the denitrifi-cation of the RAS in a pre-anoxic zone (Figure 2G). The city of Jo-hannesburg (Nicholls et al., 1987) proposed the Johannesburg pro-cess (Figure 2H) to reduce nitrates in the RAS by using a pre-anoxic zone for the RAS ahead of the an-aerobic zone for RAS denitrification through endogenous respiration in the higher MLSS in this zone.
ACID FERMEnTATIOn FOR PRODUCTIOn OF VFAS
Fermentation of Primary Sludge
During the design of the Kelow-na B.C. Canada Wastewa-
ter Treatment Facility, an existing sludge holding tank with a solids retention time (SRT) of approxi-mately 6 days was used to ferment primary sludge to produce the nec-essary VFA. The supernatant was discharged to the anaerobic zone of the main plant where it successfully augmented the supply of VFAs. This was later referred to as a Static
Fermenter, which is shown in (Fig-ure 3A). A study by Oldham and Stevens (1984) clearly showed that without a fermenter, there would be little P phosphorus removal in this plant. Studies by Rabinowitz and Oldham (1986) examined the design needs concerning the ideal SRT to for maximizing the fermen-tation of organic solids to VFAs without conversion to methane. Barnard (1984) suggested that pri-mary sludge could be accumulated in primary tanks and allowed to fer-ment and release VFAs when some of the underflow was recycled to the influent, a concept referred to as Ac-tivated Primary tanks (Figure 3B).
Primary sludge could also be fermented in a dedicated fermen-ter, and the sludge then passed to a thickener where the sludge could be elutriated (Figure 3C). In the past 30 years, primary sludge fermenters have been used in BNR plants no-tably in Canada, the USA, Europe, South Africa, Australia, and New Zealand. At the Westside plant, in British Columbia, Canada, all of the primary effluent is passed to the anoxic zone, and only fermenter su-pernatant is passed to the anaerobic zone as shown in (Figure 2G). In the latest development at the Douglas L. Smith Middle Basin Wastewater Treatment Plant, in Overland Park, KS, USA, an upflow sludge blanket acid fermenter for primary sludge is being used with great success.
Fermentation of Mixed Liquor or RAS
Building on the model of the original pilot plant, the concept
of fermenting some of the mixed li-quor developed. This can take the form of passing mixed liquor equiv-alent to about 10% of the influent, to a fermenter with SRT of around 2 days. In some cases, a fraction of the RAS was fermented and fed to the anaerobic zone (Stroud, et al., 2001). In other plants, it was found that switching of mixers in the an-aerobic or anoxic zones for most of the time benefitted EBPR (Barnard, et al., 2011). Some thickening takes place in such a tank and the fresh mixed liquor short-circuits over the top with some contact with the fer-menting mixed liquor in the lower half. At the Henderson, NV, USA ,plant the orthophosphates was re-duced to around 0.1 mg/L by using
FIGURE 1Pilot Plant Arrangement
FIGURE 2Process Schematics
FIGURE 3Types of Primary Fermenters

46 | Environmental Engineer & Scientist Winter 2014 | V 50, N 1
this technique. The technology was applied at about 10 plants in the USA with great success. In progress is a project to apply such fermen-tation at the 35 m3/s (800 mgd) Stickney plant in Chicago which consists of a plug-flow nitrification plant, by merely switching off some aeration in the first pass.
SECOnDARy RELEASE OF PHOSPHORUS
Barnard (1984) observed that P may be released in EBPR plants for cell maintenance
in the absence of an electron accep-tor, such as nitrates or DO, and of VFAs. It was not possible to take up P thus released by further aeration. This was referred to as secondary P release. Experience showed that ad-ditional VFAs would be required to take up the P again. Secondary release may happen in the anoxic zones when there are insufficient ni-trates or when the zone is oversized relative to the required denitrifica-tion capacity or in final clarifier sludge blankets. Secondary release of phosphorus should be avoided in both design and operation of plants. Phosphorus may also be re-leased through endogenous respira-tion (Oldham and Stevens, 1984) when the uptake is completed in a plug-flow aeration zone some dis-tance before the end of the aerobic zone of the basin. This may indicate that the aerobic sludge retention time (SRT) is too long. Ideally, the uptake of P should be completed near the end of the aeration zone.
RELIABILITy OF EBPR
The reliability of the EBPR process has often been questioned. While EBPR
can reliably reduce the orthophos-phate concentration to well below 0.1 mg/L, some form of filtration with or without polymer would be required to coagulate and remove particulate and colloidal P. The reli-ability of P removal will depend on
the availability of VFAs or rbCOD that can easily be fermented to VFA in the anaerobic zone and to ab-sence of nitrates and dissolved oxy-gen in the anaerobic basin. Because of past patent issues, many plants were constructed in the USA with-out fermenters to augment VFAs and this resulted in inadequate P removal, leading to the assump-tion that the process was not reli-able. The Kalispell, MT, USA, plant has fermentation of primary sludge and, although it is in a cold climate, can achieve annual average TP val-ues of between 0.11 and 0.15 mg/L with filtration but no chemical ad-dition (Neethling, et al., 2005).
PHOSPHORUS RECOVERy
Phosphorus is a limited re-source without which there can be no life and recovery
goals are set in many European countries. EBPR allows the cost-ef-ficient recovery of as much as 50% of the phosphorus in the influent by stripping the phosphorus and mag-nesium from the surplus sludge. The struvite formed is a pure crystal containing no organic matter and is a very valuable slow release fer-tilizer. In the process 10 to 15% of the nitrogen in the influent is also captured. Even when surplus sludge is incinerated the phosphorus is not lost but is available to plants if the ash is applied to land.
REFEREnCES
Barnard, J.L. (1973). Biological denitrifi-cation. Inst. Wat. Poll. Contr. 72(6), 705-720.
Barnard J. L. (1974a). Cut P and N without chemicals. Water Wastes Eng, 11, 33-36.
Barnard J. L. (1974b). Cut P and N without chemicals. Water Wastes Eng, 11, 41-44.
Barnard J. L. (1976). A review of bio-logical phosphorous removal in ac-tivated sludge process, Water SA, 2 (3), 136-144.
Barnard, J. L. (1984). Activated primary tanks for phosphate removal. Water SA, 10 (3), 121.
Barnard J., Houweling D., Analla H. and Steichen M. (2010). Fermenta-tion of Mixed Liquor for Phosphorus Removal. Proc. 83rd Ann. Tech. Ex-hibition and Conf,. Water Environ. Fedn, New Orleans, LA.
Comeau Y., Hall K. J., Hancock R. E. W. and Oldham W. K. (1986). Bio-chemical model for enhanced bio-logical phosphorus removal. Water Res., 20, 1511-1521.
Fuhs G. W. and Chen M. (1975). Mi-crobiological basis of phosphate re-moval in the activated sludge process for the treatment of wastewater. Mi-crobial Ecol., 2(2), 119-138.
Levin G.V. and Sharpiro J. (1965). Metabolic uptake of phosphorus by wastewater organics. J. Water Pollut. Control Fedn, 37(6), 800-821.
Marais G. v. R., Loewenthal R. E. and Siebritz I. P. (1983). Review: ob-servations supporting phosphate removal by biological excess uptake. Water Sci.Technol., 15(3/4), 15-41.
Milbury W. F., McCaluley D. and Haw-thorne C. H. (1971). Operation of conventional activated sludge for maximum phosphorus removal. J. Water Pollut. Control Fedn, 43(9), 1890-1901.
Mino T., Arun V., Tsuzuki Y. and Mat-suo T. (1987). Effect of Phosphorus Accumulation on Acetate Metabo-lism in the Biological Phosphorus Removal Process.pp. 27-38 Adv. Water Pollution Control. Ramadori, R. (ed), , Pergamon Press, Oxford, UK.,
Neethling J. B., Bakke B., Benisch M., Gu A., Stephens H., Stensel H. D. and Moore R. (2005), Factors Influ-encing the Reliability of Enhanced Biological Phosphorus Removal. WERF Report 01-CTS-3.
Nicholls H. A. (1975). Full scale experi-mentation on the new Johannesburg extended aeration plants. Water SA, 1(3), 121.
Nicholls H. A. (1987). Improvement of the Stability of the Biological Phos-phorus Removal Process at the Jo-hannesburg Northern Works. Proc. IAWPRC Internl Specialized Conf. on Biological Phosphate Removal from Wastewater, Rome, Italy, pp. 261-272.
Oldham W. K. and Stevens G. M. (1984). Initial operating experiences of nutrient removal process (Modi-fied Bardenpho) at Kelowna, British Columbia. Can. J. Civil Eng., 11, 474.
Rabinowitz B. and Oldham W. K. (1986). Excess biological phospho-rus removal in the activated sludge process using primary sludge fer-mentation. Can. J. Civil Eng., 13, 345-351.
Smolders G. J., van der Meij M. J., van Loosdrecht M. C. M. and Heijnen J. J. (1994). Stoichiometric model of the aerobic metabolism of bio-logical phosphorus removal process. Biotechnol. Bioeng., 44(7), 837-848.
Srinath E. G., Sastry C. A. and Pillai S. C. (1959). Rapid removal of phos-phorus from sewage by activated sludge. Water Waste Treat., 11, 410.
Stroud, R and Martin, C. (2001) South Carey Water Reclamation Facility’s Nutrient Removal Modifications and Reduction Success, Town of Carey, NC, Proceedings of WEFTEC 2001.
Vacker P., Connell C. H. and Wells W. N. (1967). Phosphate removal through municipal wastewater treat-ment at San Antonio, Texas. J. Water Pollut. Control Fedn, 39(5), 750-771.
van Huyssteen J. A., Barnard J. L. and Hendriksz J. (1990). The Olifants-fontein nutrient removal plant. Wa-ter Sci. Technol., 22(7/8), 1.
Vollenweider R. A. (1968). Scientific Fundamentals of the Eutrophication of Lakes and Flowing Waters, with Particular Reference to Nitrogen and Phosphorus as Factors in Eu-trophication. Paris: Organization for Economic Co-Operation and De-velopment. 1968. Technical Report DAS/CS 1/68.27. 250 pp.
Wentzel M. C., Dold P. L., Ekama G. A. and Marais G.v.R. (1985). Kinet-ics of biological phosphorus release. Water Sci. Technol., 17, 57.
Witherow J. L. (1970). Phosphorus Removal in Activated Sludge. Proc. 24th Industr. Waste Conf., Purdue Univ., West Lafayette, IN, USA., 1169.
Yall I., Boughton W. H., Knudsen R. C. and Sinclair N. A. (1970). Biological uptake of phosphorus by activated sludge. Appl. Microbiol., 20(1), 145-150. Model No.2d, ASM2d. Water Sci. Technol., 39(1), 165-182.

Winter 2014 | V 50, N 1 Environmental Engineer & Scientist | 47
the futuRe of ACtiVAteD SluDgeGeorge Tchobanoglous, Ph.D., P.E., BCEE, NAE,1 and H. David Stensel, Ph.D., P.E., BCEE2
The concepts and elements involved in the general de-sign of the activated sludge
treatment process have been pre-sented and discussed in the previ-ous sections. The purpose of this section is to consider and speculate on the evolution of the various con-cepts and design elements for the activated sludge process in light of the challenges and opportuni-ties for wastewater management in the future. Topics considered in-clude: (1) a brief review of what has driven activated sludge process designs for wastewater treatment, (2) factors that will affect future ac-tivated sludge design, and (3) some thoughts on the future of the acti-vated sludge process.
OVERVIEW OF PROCESS DEVELOPMEnT
Although the history of the activated sludge process has been discussed previously,
some of the driving forces are re-peated here, as they will continue to impact future process developments and implementation.
Early Developments - 1900-1970s
For most of the first 55 years of the activated sludge process, follow-
ing its announcement in 1914 and the first large-scale continuous flow activated sludge plant at Milwaukee, WI, in 1916, treatment objectives were concerned with mitigating nuisance conditions caused by the uncontrolled discharge of munici-pal and industrial wastewaters. The primary concerns were with (1) the removal of suspended and float-able material, (2) the treatment of biodegradable organics, and (3) the elimination of pathogenic organisms (Stensel and Makinia, 2014).
RECEnT DEVELOPMEnTS - 1970-2014
The principal factors that have driven activated sludge pro-cess design and implementa-
tion since the early 1970s include: (1) effluent discharge standards and goals, (2) population growth, (3) sustainability concerns, (4) en-hanced understanding through research, and (5) environmental concerns. These factors are reviewed briefly as they will continue to influ-ence future designs (Stensel and Ma-kinia, 2014).
Effluent Discharge Standards and Goals. Since the early 1970s with the formation of the U.S. EPA in 1970, and the passage of the Clean Water Act in 1972, the early treat-ment objectives, cited above, remain valid today; however, the required degree of treatment has increased significantly, and additional treat-ment objectives and goals have been added. To deal with the additional treatment objectives, treatment pro-cesses have evolved to deal with each new constituent of concern. Unfor-tunately, the approach of waiting to respond to the next new regulation has led to step-wise incremental pro-cess developments. In the future, it is anticipated that bridging or game-changing technologies will evolve.
Impact of Population Growth. Population growth has also influ-enced the development of the AS process. In many metropolitan areas, the need to intensify treatment has been brought about by urbanization, which has encircled treatment plants once thought to be in remote areas. As the municipal and urban popu-lation continue to increase, it has become necessary to intensify the treatment capacity of most urban treatment plants, as there is often little or no space for expansion. As treatment processes become more intense, greater operation skill is re-
quired for their operation. For small treatment plants where skilled help is difficult to support and land re-quirements are not limiting simplic-ity of process design and operation is the overriding concern. This situa-tion small communities is not likely to change in the near future.
Sustainability Concerns. The need to be more efficient with the use of resources and the dispersal of anthropogenic constituents in the environment has become a central issue in nearly all aspects of society. Some notable examples of problem-atic current and past practices with respect to wastewater treatment in-clude the discharge of nutrients and trace constituents, excessive headloss and pumping as a result of poor hy-draulic design; inefficient aeration system design; lack of consideration for the importance of primary treat-ment systems; limited use of an-aerobic processes for BOD removal and energy recovery; limitations in sludge reuse and ultimate disposal options, placement of wastewater treatment facilities without regard to water reuse, life cycle pumping en-ergy implications, and the potential impacts of sea level rise.
Impact of Research Findings. The impact of research in the de-velopment of the AS process cannot be over estimated. So many research findings have changed the design of the activated sludge process to in-crease treatment capacity, stability and efficiency. Most have been dis-cussed in the previous sections, a few are listed below to highlight some of these developments.
• Selectorconceptforfilamen-tous bulking control, popula-tion selection
• Utilizationofphosphorusac-cumulating organisms
• Identification of bacteriacapable of micropollutant degradation to μg/L or ng/L concentrations
• Anammox bacteria capableof ammonia oxidation with nitrite
• Granularactivatedsludgecanbe selected and sustained
• Instrumentationandcontrolsfor use in sequencing batch reactors (SBRs) and simulta-neous nitrification-denitrifi-cation (SNdN) processes
Environmental Concerns. As research into the characteristics of wastewater has become more ex-tensive, and as the techniques for analyzing specific constituents and their potential health and environ-mental effects have become more comprehensive, the body of scien-tific knowledge has expanded signifi-cantly. New treatment methods are being developed to deal with health and environmental concerns associ-ated with findings of this research. Many of these methods will involve modifications to the conventional activated sludge process.
FACTORS THAT WILL AFFECT FUTURE ACTIVATED SLUDGE DESIGn
In most wastewater treatment plants, the activated sludge pro-cess is one component, albeit a
major one, of the overall wastewater management system. It is, therefore, important to examine what external factors will affect the future of the AS process and its implementation. Factors, in addition to those cited above, that will affect the future de-signs of the activated sludge process are summarized in Table 1. Two ad-ditional factors are highlighted in the following discussion.
new Approaches To Primary Treatment
Given the current emphasis on energy conservation and
recovery, a number of alternative technologies are being developed (1) to reduce the organic loading to the biological treatment process to reduce the energy requirement for the oxidation of the carbonaceous organic material and (2) to alter the particle size distribution of the par-ticles remaining in the pretreated
1 Professor Emeritus, Department of Civil and Environmental Engineering, University of California, Davis, California.
2 Professor, Department of Civil and Environmental Engineering, University of Wash-ington, Seattle, Washington.

48 | Environmental Engineer & Scientist Winter 2014 | V 50, N 1
wastewater to optimize treatment. Solids removed from the raw waste-water could be sent to the solids processing facility or utilized for denitrification or phosphorus re-moval. Three technologies that have been demonstrated successfully are: (1) microscreening of raw wastewa-ter, (2) charged bubble flotation of raw wastewater, and (3) primary ef-fluent filtration with various cloth and synthetic media filters (Tcho-banoglous, et al., 2014). Because the filtered primary effluent typi-cally contains a BOD concentra-tion of 50 to 70 mg/L, with altered BOD/N and BOD/P ratios, a num-ber of modified activated sludge processes can be developed. For example, a process in which the car-bonaceous oxidation step is either eliminated or significantly reduced and the BOD is used for denitrifica-tion, would result in a considerable savings in aeration energy.
Alternative Treatment Process Endpoints
For the first 100 years, the end-point of conventional waste-
water treatment has been the production of a treated wastewater effluent suitable for discharge to the environment. In the future, with the emphasis on direct pota-ble reuse, a more appropriate end point for wastewater treatment might be the production of a treat-ed effluent with chemical charac-teristics optimized for treatment with membranes, reverse osmo-sis, and advanced oxidation. The chemical characteristics of such an optimized effluent could be quite different from those required for discharge to the environment.
THE FUTURE OF ACTIVATED SLUDGE
The future of the activated sludge process design is in-tertwined with the follow-
ing 21st century paradigm shift in the view of wastewater, that is: “wastewater is renewable recoverable source of potable water, energy, and resources, and “ (Tchobanoglous et al., 2010). In light of this view of wastewater and the factors cited in Table 1, and discussed above, it is appropriate to consider briefly some challenges as well as the opportuni-ties that will become increasingly important in the future.
Utilization of Existing infrastructure
Due to the extensive infrastruc-ture now in place in most com-
munities and the fact that individual wastewater flowrates are decreasing, it is anticipated that much of ex-
isting treatment tankage it will be operating for many decades in the future and that excess capacity will be available. The challenge will be how to modify the existing tank-age to address operations/reliabil-ity, sustainability, nutrient removal, and new treatment needs, such as producing an effluent suitable for processing by other technologies to produce potable water.
Conflicting Views in the Application of Technology
Although wastewater is increas-ingly viewed as a resource and
the profession is shifting to one of sus-tainable environmental engineering, sustainability concepts are not being applied uniformly. For example, for small systems, the focus is on what do they “have to do” whereas for larger facilities the concern is with enhanced treatment and energy sustainability.
TABLE 1Factors that will influence future activated sludge process design and implementationa
Factor Possible impact on activated sludge process
Climate change
As a result of climate change areas that are wet are getting wetter and areas that are dry are getting dryer. In both areas the intensity of rainfall has increased, dramatically in some locations. In wet areas with combined collection systems, surge flows are causing washout of the biological processes. In dry areas, exfiltration is resulting in increased wastewater constituent concentra-tions. The impact of climate change on biological process design is only now becoming appreciated fully.
Water conservation
In the past, per capita wastewater flowrates greater than 450 L/capita•d (120 gal/capita•d) were common. In the not so distant future, it is reasonable to assume the per capita flowrates could decrease to below 150 L/capita•d (40 gal/capita•d). Such a decrease would have a significant impact on wastewater collection system and the biological treatment process design and opera-tion.
Source control/collection changes Impacts of urine separation on biological treatment. Greater use of satellite plants for water reuse will increase solids in wastewa-ter.
Interest in sustainable environmental engineering
WWTPs will strive to be energy self-sufficient. Conflict will develop over best use of influent organic matter (e.g., methane produc-tion, denitrification and/or phosphorus removal).
Use of existing facilities Because of the significant in place investment, most existing wastewater treatment plants will have to be modified to meet future standards and needs.
Instrumentation and automationImproved instrumentation will result in energy and chemical savings.
Smaller plants will be automated to provide greater performance and reliability.
Nutrient removal Continued interest in achieving extremely low N and P concentrations will lead to new process modifications. Extremely low not-to-exceed discharge limits may not be achievable due to inherent instability as predicted by “Chaos Theory.”
Micropollutant treatment goals Removal of endocrine disruptor compounds in WWTP effluents to better protect fish and the aquatic environment, and water reuse quality (see discussion to treatment process endpoints) will involve process changes.
Research and molecular biology tools New ideas, approaches, operational tools, and knowledge of microbial capabilities will lead to the development of new variations of the activated sludge process.
Major technology changes leading to totally different designs
New mixing and aeration technologies for existing and new tankage. Changes in membrane technology. Use of membranes in conjunction with granular sludge reactor designs may overcome persistent fouling problems.
Changes in wastewater characteristics Increased strength due to reductions in per capita water use will lead to the development of new process modifications to address higher constituent concentrations.
Solids management New methods and directions for solids reuse may affect future activated sludge process designs.
Direct potable reuse The implementation of direct potable reuse will affect future activated sludge process designs. In some cases, treatment systems for potable reuse may rely only on physical/chemical treatment.
Impact of uncontrollable events Wastewater treatment plants are subject to the effects of uncontrollable events such as natural disasters and the price of chemicals and supplies.
Impact of unintended consequences Even beyond all of the factors considered above unintended consequences must be anticipated, as resources and cost for waste-water management become more restrictive.
aAdapted in part from Tchobanoglous et al., 2014.

Winter 2014 | V 50, N 1 Environmental Engineer & Scientist | 49
Other important conflicting views are how to best utilize the organic content (e.g., BOD) of wastewater and the removal of mi-cropollutants. Should more methane be produced or is it better to utilize more BOD for enhanced biological phosphorus removal (EBPR) pro-cesses and optimize the recovery of phosphorus? Should less emphasis be placed on energy recovery versus the need to direct more BOD for the growth of heterotrophic bacteria capable of biodegrading micropol-lutants? Is the removal of nitrogen more compelling?
Can the advancements being considered in large facilities (anam-mox treatment at ambient tempera-ture, P recovery, increased methane) be used in smaller facilities and how will such treatment technologies be implemented?
Short Term View - next 10 to 20 years
For the short term, the follow-ing process modifications to the
conventional activated sludge pro-cess seem likely:
• The use of improved SNdNprocesses will be favored over N removal systems with dis-crete nitrification and anoxic denitrification zones.
• The implementation ofgranular sludge reactors will increase due to space savings and nutrient removal ability.
• TheuseofEBPRprocessforphosphorus recovery will in-crease.
• Waterreuseapplicationswillincrease and methods to re-duce cost of membranes, reduce energy demands of MBRs and better control fouling will be found.
• Advances in instrumentationand controls will be used to provide better reliability, en-ergy, and chemical savings.
• Micropollutants and en-docrine disruptors will be addressed in new process designs, especially for direct potable reuse applications and for environmental water quality stewardship.
• Greater emphasis will begiven to integrating the man-agement and utilization of community wastes with the
local WWTP sustainability and energy self sufficiency goals.
• Improved home food wastegrinders and waste collection systems will be used to deliv-er food waste to wastewater treatment plants along with other waste constituents.
• Greater incorporation of lo-cal community food waste into WWTP carbon manage-ment strategies.
• New process designs will bedeveloped to deal with higher wastewater constituent con-centrations.
• A number of new bacteriawill be identified for the treat-ment of specific constituents, which will lead to the devel-opment of new and the modi-fication of existing processes
Long Term View - Greater Than 20 years
Because no one could have pre-dicted in the 1920s the activat-
ed sludge process developments that have occurred in the last 30 years, the following speculations are of-fered for the long term.
• Direct potable reuse will becommonplace with the AS process optimized for ad-vanced treatment.
• Urine separation and re-covery will be an important element of wastewater treat-ment.
• Complete membrane treat-ment systems will replace a number of conventional acti-vated sludge processes.
• Greater population and di-minishing resources may force people to: (1) retain their own solid waste (feces and food waste) for use in home anaerobic digesters to get heat and (2) sell their urine. A portion of the waste-water may still be transported a WWTP; the wastewater could be more dilute maybe or more concentrated, de-pending on the application of onsite technologies.
• Some form of activatedsludge will still be in opera-tion.
SUMMARy
Due to the ongoing unprec-edented development of biological science and the
need to remove an ever-increasing number of constituents from waste-water, the activated sludge process will continue to evolve over the next 10 to 20 years. The need to produce
an effluent suitable for further treat-ment for the production of potable water will result in a renaissance in the development of biological treatment. The need to utilize ex-isting treatment tankage will spur the development of new treatment technologies to replace existing ac-tivated sludge process technologies. The new biological treatment tech-nologies may or may not be called activated sludge, but will trace their lineage to the original activated sludge continuous flow process put into operation by early investigators in Milwaukee, WI.
REFEREnCES
Stensel, H.D., and J. Makinia (2014). “Chapter 3 Activated Sludge Process Development,” in J. Wanner and D. Jenkins (eds.), Activated Sludge-100 Years and Counting, IWA Publishing, London, U.K.
Tchobanoglous, G. (2010). Wastewater Management in the Twenty-First Cen-tury. Presented at the College of Engi-neering Distinguished Speaker Series. University of Miami, Miami, FL.
Tchobanoglous, G., H.D. Stensel, R. Tsuchihashi, and F.L. Burton, (2014). Wastewater Engineering: Treatment and Resource Recovery, 5th ed., Metcalf and Eddy I AECOM, McGraw-Hill Book Company, New York.
MACT/MATS regulations... For clear, straightforward answers, call SOLVAir Solutions!
Solvay Chemicals, Inc.1.800.SOLVAY C (800.765.8292)www.solvair.us© Copyright 2014 Solvay Chemicals, Inc. All Rights Reserved
SOLVAir Winter 2014 EnvEng Qrt Page Horz Ad.indd 1 1/10/2014 2:40:57 PM

50 | Environmental Engineer & Scientist Winter 2014 | V 50, N 1
AWARDS AnD RECOGnITIOn
dr. Paul f. Boulos, Bceem, Hon.d.Wre, dist.d.ne, f.Asce, has assumed po-sition of President and Chairman of the Board of Trustees of the American Academy of Water Re-sources Engineers (AAWRE) of the American Society of Civil Engineers (ASCE). Dr. Boulos, President and Chief Operating Officer of In-novyze, is an expert on water re-sources and navigation engineering and has received numerous national and international scientific and en-gineering honors including the U.S. Ellis Island Medal of Honor, the Lebanese American Foundation’s Pride of Heritage Award, the Leba-nese American University Alumni of the Year Award, and induction into the University of Kentucky College of Engineering Hall of Distinction.
In addition to AAEES, Dr. Bou-los is an Honorary Diplomate of the American Academy of Water Re-sources Engineers, has Distinguished Diplomate status in Navigation En-gineering by ACOPNE, and is a Fel-low of the American Society of Civil Engineers. He has been a Board Cer-tified Environmental Engineering Member in Water Supply and Waste-water Engineering since 2011.
RobeRt HeRRick
robert A. Herrick, P.e., ciH, Bcee, was named the 2013 Linton E. Grinter Distinguished Service Award recipi-
ent. Mr. Herrick was the 36th re-cipient of the Grinter Award, ABET’s highest honor. The award was named for engineering and engi-neering technology education pio-neer Linton E. Grinter, and it recognizes ABET volunteers who follow Grinter’s example and surpass even the highest service expectations of the organization.
Mr. Herrick has served as an ABET evaluator for more than 30 years. He is a Life Member and has been a Board Certified Environmen-tal Engineer in Air Pollution Con-trol since 1966.
On THE MOVE
dr. Arijit Pakrasi, P.e., Bcee, has been named Partner of Environmen-tal Resources Management, Inc. (ERM). With over 30 years expe-rience of air quality consulting, Dr. Pakrasi will focus on the air quality practice in the power and oil and gas sectors. He has been a Board Certi-fied Environmental Engineer in Air Pollution Control since 2005.
FeRnando SaRmiento
fernando sarmiento, P.e., PmP, Bcee, has been appointed to Managing Director of Greeley and Hansen’s
Latin American Operating Group. Originally from South America, he has been instrumental in continu-ing to advance the firm’s strategy for expanding business operations in high-growth Latin American Mar-kets. Mr. Sarmiento has been a Board Certified Environmental En-gineer in Water Supply and Waste-water Engineering since 2011.
In MEMORIAM
James f. Braithwaite, P.e., Bcee, passed away April 17, 2013. Mr. Braith-waite received his BS in Mechanical Engineeering from Michigan State University and was a practicing en-gineer for more than 44 years. He most recently served as Chairman of Vector Resolutions, LLC. (Tucson, AZ). Mr. Braithwaite had been a Board Certified Environmental En-gineer in Solid Waste Management since 1987.donald e. eckmann, P.e., Bcee, passed away July 4, 2013. Mr. Eckmann, a Partner in Alvord, Burdick & Howson, received his BS in Civil Enginering from University of Il-linois. He was a Past President of the American Society of Civil En-gineers (Illinois Section) and a past Director of the National ASCE. He was a Life Member and had been a Board Certified Environ-mental Engineer in Sanitary Engi-neering since 1971.roald “ralph” Haestad, P.e., Bcee, f.Asce, passed away May 27, 2013.
Mr. Haestad was a Past President of the National Society of Professional Engineers (Connecticut Section) and a Life Member of the American Society of Civil Engineers and the American Water Works Association. He most recently served as Chair-man Emeritus of Roald Haestad, Inc. and received his BCE in Civil Engineering from City College of New York. Mr. Haestad was a Life Member and had been a Board Cer-tified Environmental Engineer in Water Supply and Wastewater Engi-neering since 1980.
francis eugene soloducha, P.e., Bcee, passed away September 21, 2012. Most recently with Greeley and Hansen, Mr. Soloducha received his BS in Civil Engineering from NJIT and his MS in Manufacturing Sys-tems from Unviersity of Maryland. He had been a Board Certified En-vironmental Engineer in Water Sup-ply and Wastewater Engineering since 2002.
MeMBeR newS

Winter 2014 | V 50, N 1 Environmental Engineer & Scientist | 51
PRofeSSionAl CARDS
Reach OuR adveRtiseRs
Company/Organization Page Telephone Website
Alaimo Group Consulting Engineers 51 609-267-8310 www.alaimogroup.com
Carollo Engineers 51 800-523-5822 www.carollo.com
CDM Smith 51 617-452-6000 cdmsmith.com
Fox Engineering 51 800-433-3469 www.foxeng.com
GMB Architects/Engineers 50 800-789-4462 www.gmbnet.com
Hatch Mott MacDonald 51 800-832-3272 www.hatchmott.com
Solvay Chemicals 26-27, 49 800-765-8292 www.solvair.us
Please support Our advertisers. it’s Good Business!
This space could be yours.
Claim it NOW!
Professional Services Card is a service for employers of Board Certified Environmental Engineers, Board Certified Environmental Engineering Members, Board Certified Environmental Scientists, and AAEES Members only. Rates start at only $140 annually. Call 410-266-3311 to take advantage of this exclusive offer.