
National Electrification Master Plan for Lesotho - Amazon AWS

RIVER RESEARCH AND APPLICATIONS
River Res. Applic. 19: 641–666 (2003)
Published online in Wiley InterScience(www.interscience.wiley.com). DOI: 10.1002/rra.728
ENVIRONMENTAL FLOW REQUIREMENTS OF FISH IN LESOTHORIVERS USING THE DRIFT METHODOLOGY
ANGELA H. ARTHINGTON,a,b* JOHAN L. RALL,c MARK J. KENNARDa and BRADLEY J. PUSEYb
aCo-operative Research Centre for Freshwater Ecology, Centre for Riverine Landscapes, Faculty of Environmental Sciences, Griffith
University, Nathan, Queensland 4111, AustraliabCo-operative Research Centre for Tropical Rainforest Ecology and Management, Centre for Riverine Landscapes, Faculty of Environmental
Sciences, Griffith University, Nathan, Queensland 4111, AustraliacECOSUN, Florida Hills, South Africa
ABSTRACT
DRIFT (Downstream Response to Imposed Flow Transformations) is a scenario-based environmental flow assessment meth-odology applied during impact studies associated with the Lesotho Highlands Water Project, Southern Africa. DRIFT offers astructured process for predicting the biophysical, social and economic consequences of altering a river’s flow regime. The fishcomponent of DRIFT provides a ten-step protocol designed to make such predictions using field data on a river’s fish faunalinked to information on flow-related aspects of fish biology drawn from the literature and the knowledge base and professionalexperience of fish ecologists. A worked example of the methodology is presented based on a study site downstream from KatseDam on the Malibamatso River, Lesotho, where the ecological consequences of four flow scenarios were evaluated. DRIFT andits fish component have emerged from studies in a semi-arid, developing region where unpredictable hydrological regimes anddata scarcity constrain the prediction of ecological responses to flow regulation. Faced with similar information constraints,scientific uncertainty and limited windows of opportunity to guide water management, other countries have employed scientificpanels to recommend environmental flows. DRIFT and its fish component compare favourably with recommended best practicefor Australian scientific panel assessments of the flow requirements of river ecosystems. The risks associated with use of scien-tific panel approaches are discussed and minimum data sets and standards are recommended for the conduct of a DRIFT fishassessment. DRIFT and related frameworks represent the second level in a three-tiered hierarchy of environmental flow meth-ods. They can provide environmental flow recommendations of far greater scientific resolution than hydrological methods byintegrating many types of information on the responses of riverine biota to flow modifications. However, DRIFT should only beapplied within an adaptive management framework where there is a genuine commitment to the generation and use of newknowledge derived from monitoring and research. Copyright # 2003 John Wiley & Sons, Ltd.
key words: environmental flows; DRIFT methodology; fish; best practice; Lesotho
INTRODUCTION
DRIFT (Downstream Response to Imposed Flow Transformations) is a scenario-based approach to environmental
flow assessments developed by Southern Waters Ecological Research and Consulting Pty (Ltd) in liaison with
SMEC (Snowy Mountains Engineering Corporation) International (Australia) and Metsi Consultants (an interna-
tional team of biophysical river scientists). These groups were brought together to give advice on the flow require-
ments of rivers affected by the Lesotho Highlands Water Project, on behalf of the Lesotho Highlands Development
Authority (LHDA). Earlier development of DRIFT in the Palmiet River, Western Cape (Brown et al., 2000) and the
Breede River, South Africa, set the scene for its refinement and application during environmental flow assessments
in the montane catchments of Lesotho.
The DRIFT framework is made up of four modules, biophysical, sociological, scenario development and eco-
nomic (Figure 1). Metsi Consultants (2000a) and King et al. (this issue) describe the DRIFT framework and the
procedures constituting the biophysical module, as well as those used to determine the social and economic
Received April 2001
Revised 30 July 2002
Copyright # 2003 John Wiley & Sons, Ltd. Accepted 6 November 2002
* Correspondence to: Angela H. Arthington, CRC for Freshwater Ecology, Centre for Riverine Landscapes, Faculty of Environmental Sciences,Griffith University, Nathan, Queensland, Australia. E-mail: [email protected]

consequences of flow-related biophysical changes. This paper is concerned with the fish component of DRIFT, a
set of procedures developed to assess the ecological consequences of flow regime change for the fish fauna of rivers
in the Lesotho Highlands.
To make these assessments in any environmental flows study requires quantitative information on the relation-
ship between river hydrology and key aspects of species biology (Pusey, 1998; Kennard et al., 2000; Metsi
Consultants, 2000b). The key information requirements are: species composition (at representative sites along
the rivers to be affected by water infrastructure developments), habitat preferences and water quality tolerances
of each species/developmental stage, patterns of movement and passage requirements, diet and foraging behaviour,
reproductive biology, spawning habitats and larval/juvenile requirements (Figure 1).
Figure 1. The four modules of the DRIFT framework showing the relationships between Module 1 (Biophysical, including the fish componentof DRIFT), Module 2 (Sociological), Module 3 (Scenario Development) and Module 4 (Economic)
642 A. H. ARTHINGTON ET AL.
Copyright # 2003 John Wiley & Sons, Ltd. River Res. Applic. 19: 641–666 (2003)

Many environmental flow assessments involving fish proceed on the basis of only a fraction of this ideal knowl-
edge base. Often, the minimum acceptable flow is based almost entirely on predictions of instream habitat avail-
ability matched against the habitat preferences of one or a few species of fish (Arthington and Pusey, 1993; Petts
and Maddock, 1996; Jowett, 1997; Pusey, 1998) using hydraulic and habitat rating methods such as in-stream
transect analysis and the habitat simulation modelling package PHABSIM (Bovee, 1982, 1986; Stalnaker et al.,
1994). Applications, strengths and limitations of PHABSIM are well-documented (King and Tharme, 1994;
Stalnaker et al., 1994; Pusey, 1998). A method linking the timing and magnitude of the low and high flow attributes
of annual flow hydrographs to instream and out-of-channel physical habitat availability and suitability for fish was
proposed by Hill et al. (1991), and there are more elaborate, data-hungry methods relating flow characteristics to
the habitat, food and spawning requirements of fish. For example, O’Brien (1987) defined the minimum stream
flow hydrograph to maintain existing habitat, food supply and spawning potential of the endangered Colorado
River squawfish (Ptychocheilus lucius) in terms of four flow characteristics. To develop this minimum hydrograph,
O’Brien (1987) combined the results of a two-year field study, a physical model, laboratory simulation of flows on
cobble substrate and a mathematical simulation model of sediment transport. Williamson et al. (1993) developed a
conceptual framework and a suite of interactive mathematical models of salmon production (SALMOD) simulat-
ing the dynamics of resident and anadromous freshwater populations.
The development of models equivalent to those applied to a single fish species by O’Brien (1987), or models
such as SALMOD, in the remote and poorly studied rivers of the Lesotho Highlands was beyond the scope, budget
and time frame (one year of field work and related studies) of the Lesotho environmental flows project. Further-
more, as an integral part of the DRIFT framework (King et al., this issue), the fish component (like all biotic com-
ponents) was required to conform to a range of generic features which existing methods such as PHABSIM and
SALMOD cannot provide. The fish component had to: (i) consider the implications, for fish, of flow-related
changes in channel morphology, sedimentary processes, physical habitat, water quality, and the spatial array, com-
position and diversity of aquatic invertebrates, aquatic macrophytes and riparian vegetation; (ii) evaluate the con-
sequences (i.e. direction and severity) of many scenarios of flow change at multiple sites involving up to seven fish
species; (iii) provide predictions about each fish species in formats that could be used by other ecologists (e.g. the
wildlife ecologist needed information on the relative change in abundance of fish species that might be consumed
by piscivorous birds); (iv) convert impacts of flow regime change on fish into social consequences for the people of
Leosotho; (v) document the ecological basis of all predictions in structured, explicit and transparent formats,
including predictions based on professional judgement; (vi) provide explicit confidence ratings for each prediction.
This paper describes the ten-step protocol forming the fish component of DRIFT and provides a worked example
based on a study site downstream from Katse Dam on the Malibamatso River.
DRIFT has been developed in a semi-arid, developing region of southern Africa where unpredictable hydrolo-
gical regimes and data scarcity can constrain scientific prediction of the ecological responses to flow regulation. In
similar circumstances, other countries have also used scientific panel approaches to give advice on environmental
flows. DRIFT and its fish component are compared with the recommended best practice for scientific panel assess-
ments in Australia. The paper concludes with a discussion of the risks associated with such methods and suggests
several ways to overcome them, ending on a precautionary note regarding the circumstances in which DRIFT and
its fish component should be applied.
METHODS
Fish component of DRIFT
The basic steps in the fish component of DRIFT are the following:
Step 1. Review of literature to produce a compilation of published flow-related information on each fish species in
the study rivers.
Step 2. Selection of study sites to characterize river reaches likely to be affected by existing and future water
resource developments.
Step 3. Seasonal field surveys at each site to determine fish species composition, abundance and habitat use in
relation to flow conditions.
FLOW REQUIREMENTS FOR FISH 643
Copyright # 2003 John Wiley & Sons, Ltd. River Res. Applic. 19: 641–666 (2003)

Step 4. Analysis of field data to generate habitat preference curves for each fish species.
Step 5. Tabulation of field data and information from literature review to produce summary of flow-related data on
each fish species.
Step 6. Development of scenarios of flow regime change for evaluation using DRIFT.
Step 7. Development of protocols to document the consequences of flow regime change for each fish species at
each study site.
Step 8. Prediction of the ecological and social consequences of flow regime change for each fish species at each
study site.
Step 9. Preparation of a monitoring strategy to assess the outcomes of environmental flow provisions.
Step 10. Implementation of monitoring programme, evaluation of ecological outcomes of any environmental flow
provisions, and adjustment of those provisions in the light of new knowledge generated by monitoring
(and research).
Steps 1–7 are described here (and in more detail in Metsi Consultants, 2000a,b). Step 8 represents the procedures
involved in assessing the consequences of various scenarios of flow regime change, and as such is described in the
worked example provided in the ‘Results’ section of this paper. Step 9, the monitoring strategy, is described in Metsi
Consultants (2000b), and step 10 will be implemented in the next phase of the Lesotho environmental flows study.
Step 1. Review of literature to produce a compilation of published flow-related information on each fish species in
the study rivers
The literature review involved preparation of a comprehensive report summarizing all information on the fish
fauna of Lesotho rivers relevant to the core issues identified above and in Figure 1. This report documented species
distributions in the study rivers, the habitat preferences and water quality tolerances of each species/developmental
stage, patterns of movement, migration and passage requirements, diet composition and foraging behaviour, repro-
ductive biology and phenology, spawning habitats and larval/juvenile requirements (Metsi Consultants, 2000b).
Step 2. Selection of study sites to characterize river reaches likely to be affected by existing and future water
resource developments
The Kingdom of Lesotho is a small, high altitude mountainous country surrounded on all borders by South
Africa. The region’s largest river, the Senqu River system, arises at high altitudes in Lesotho’s eastern highlands
and flows into South Africa from the southwest of Lesotho (Figure 2). The Lesotho Highlands Water Project was
conceived in the 1950s as a five-phase development beginning with Phase 1a, consisting of the 185 m high Katse
Dam on the Malibamatso River, a hydropower scheme for Lesotho and associated infrastructure. Phase 1b
included the 145 m Mohale Dam on the Senqunyane River and a 20 m Diversion Weir on the Matsoku River
designed to divert water into Katse reservoir. Phases 2 to 5 would consist primarily of the Mashai Dam, the
Tsoelike Dam, Ntoahae Dam and the Malatsi Dam on the Senqu River. If all of the proposed dams were to be built
they would extend almost nose-to-tail along more than 300 km of Lesotho’s mountain rivers, with the harnessed
water being pumped uphill to Katse reservoir for diversion into South Africa. In 1986, a treaty was signed between
Lesotho and South Africa committing both countries to Phase 1 of the development. Katse Dam was completed in
1998 and first spilled that year; construction of Mohale Dam and Matsoku Weir began in 2000.
The study area for the environmental flow assessments undertaken using DRIFT included Lesotho rivers
affected by Phases 1 and 2 of the Lesotho Highlands Water Project. Eight study sites were selected by Metsi Con-
sultants to represent the geomorphological, hydrological and ecological characteristics of river reaches that may be
affected by existing and future water resource developments on the Senqunyane and Senqu Rivers and their tri-
butaries (Figure 2). Procedures for site selection followed those of the well-established Building Block Methodol-
ogy (King and Louw, 1998; King et al., 2000). Study site 2, downstream from Katse Dam on the Malibamatso
River (Figure 2), is used throughout this paper to illustrate the fish component of the DRIFT methodology. This
site was representative of the reach extending from Katse Dam to the Malibamatso and Matsoku confluence. Bank
slopes at the site were moderate and the site consisted of a shallow pool, a deep pool and a riffle/rapid. The site was
already modified by the presence of Katse Dam (completed in 1998 and spilling for the first time that year), most
notably in that riparian vegetation had encroached onto previously bare sandbars.
644 A. H. ARTHINGTON ET AL.
Copyright # 2003 John Wiley & Sons, Ltd. River Res. Applic. 19: 641–666 (2003)

Step 3. Seasonal field surveys at each site to determine fish species composition, abundance and habitat use in
relation to flow conditions
Field surveys were conducted at each study site in April, July and November 1998 and in January–February
1999. The data collected were fish species composition, abundance, habitat use of each species related to flow,
and population size structure. The full range of meso- and microhabitats present at each site was sampled. Quan-
titative protocols described by Pusey et al. (2000) were used to record stream habitat characteristics (width, depth,
velocity, substrate characteristics, instream cover and bank cover). Temperature, conductivity, dissolved oxygen
and pH were also recorded at each site.
Fish were sampled using a variety of methods, including electrofishing, seine netting, gill netting and, occasion-
ally, angling, with the choice of sampling methods depending on characteristics (particularly depth and velocity) of
the sites. A portable back-pack electroshocker was the main sampling device used and electrofishing catches were
standardized to catch-per-unit effort based on 60 minutes of sampling. Seine netting was also employed, where
practicable, to collect any schooling species which electrofishing may have missed; usually three standard hauls
were made with a 30 m long, 2 m deep seine net (9 mm stretched mesh). Occasionally, gill nets (a fleet of nine
10 m� 2 m panels with stretched mesh sizes of 24–120 mm) were set in deeper pools to assess the presence of
large individuals, e.g. the rock catfish, Austroglanis sclateri (Niehaus et al., 1997). Gill nets were deployed over-
night for 12 hours and cleared periodically to prevent fish deaths.
All fish collected by electrofishing, seine netting and gill netting were identified to species, counted, measured
(fork length, to the nearest millimetre) and returned alive to the water at the point of capture (except for the occa-
sional individual inadvertently killed during capture). Samples of introduced rainbow trout were retained for ana-
lysis of diet and reproductive condition. Endangered species were never removed.
Figure 2. Major rivers of the Lesotho Highlands, showing the location of Lesotho Highlands Water Project dams, transfer tunnels, and the studysites (including site 2 at Katse) where the DRIFT methodology was applied to environmental flow assessments
FLOW REQUIREMENTS FOR FISH 645
Copyright # 2003 John Wiley & Sons, Ltd. River Res. Applic. 19: 641–666 (2003)

Methods used to collect fish microhabitat use data followed a protocol described in Kennard et al. (2000)
combined with methods used by Niehaus et al. (1997). For each individual fish collected during electrofishing,
the following data were estimated: mean water column velocity (portable flow meter), focal point velocity
(portable flow meter), total water column depth (graduated stick), focal point depth (graduated stick), proportional
substrate composition in 1 m2 immediately below the fish (i.e. mud, sand, fine gravel, coarse gravel, small cobbles,
large cobbles/boulders and bedrock), distance to nearest potential refuge (i.e. microhabitat structure), and distance
to bank. For fish less than 0.2 m from the nearest refuge, we recorded the type of cover with which each fish was
probably associated (i.e. filamentous algae, aquatic macrophytes, emergent aquatic vegetation, submerged stream
bank vegetation, submerged overhanging stream bank vegetation, leaf litter, large woody debris, small woody deb-
ris, undercut banks and root masses, substrate and rocky undercuts).
Step 4. Analysis of field data to generate habitat preference curves for each fish species
Spearman’s rank correlation analysis was used to investigate relationships between variations in fish abundance
and instream habitat variables. Habitat use curves (Category II curves of Bovee, 1986) were developed for each fish
species and developmental stage. Frequency distributions of depth, velocity, substrate and instream cover were
generated from the fish habitat use information collected during electrofishing (pooled across all sites and sampling
occasions). To ensure transferability of habitat use curves across sites with varying habitat structure, we
standardized fish microhabitat use at each site in relation to habitat availability following the methods of Groshens
and Orth (1994). For each species and developmental stage, habitat preference curves were produced from micro-
habitat data use and habitat availability data pooled from each site and sampling occasion. These data then
reflected the relative degree of preference of each species for the range of instream habitat conditions available.
Habitat suitability criteria were defined following Groshens and Orth (1994). Habitat suitability values >0.7 repre-
sented optimal conditions, values >0 to <0.7 were considered marginal and zero values represented unsuitable
habitat.
Step 5. Tabulation of field data and information from literature review to produce a summary table of flow-related
data on each fish species
This step involved the preparation of a summary of the flow-related ecological requirements of each fish species
and developmental stage known or expected to occur at each study site (Table I). This data set provided the bulk of
the biological information used to assess the consequences of modified flow regimes for the fish of Lesotho rivers.
The fish team also had access to other ecological data (e.g. distributions of riparian and instream vegetation in
relation to river stage and flow percentiles; composition and abundance of aquatic invertebrate communities asso-
ciated with particular hydraulic habitats at each river site; and water quality data).
Step 6. Development of scenarios of flow regime change for evaluation using DRIFT
The biophysical assessments involved in the DRIFT methodology (Figure 1) were conducted during a
multidisciplinary workshop held in the study area, taking a week to complete biophysical assessments for eight
study sites. The workshop process began with the definition of scenarios of flow regime change based on hydro-
logical analyses.
The DRIFT methodology takes as its starting point an analysis of the flow regime of the river based on historical
and present-day daily time series flow data (spanning 20 years). Flows are separated into wet and dry season low
flows, four classes of intra-annual floods and inter-annual floods with return periods of 1 in 2, 1 in 5, 1 in 10 and 1 in
20 years (Table II, Figure 3). Methods for distinguishing between these categories of flow are described in King
et al. (in press). For the Lesotho study, these flow components were reduced in a structured manner (low flows were
reduced in range and thus variability, and floods were reduced in number) to generate four flow scenarios (Metsi
Consultants, 2000a).
(1) Minimum Degradation was a hypothetical ‘best case’ scenario designed to maintain the rivers without mea-
surable change from their present condition, accepting that Phase 1 and 2 dams are/will be in place. Most river
flow would be left in the river to meet environmental requirements, with little water available for harvesting.
646 A. H. ARTHINGTON ET AL.
Copyright # 2003 John Wiley & Sons, Ltd. River Res. Applic. 19: 641–666 (2003)

Tab
leI.
Su
mm
ary
of
the
bio
log
yan
dfl
ow
-rel
ated
eco
log
ical
req
uir
emen
tso
ffi
shsp
ecie
so
ccu
rrin
gin
Les
oth
oH
igh
lan
ds
river
s,in
clu
din
gra
ng
eo
fle
ng
ths
for
fish
col-
lect
edd
uri
ng
this
stu
dy,
wit
hm
axim
um
kn
ow
nsi
zere
cord
edin
the
lite
ratu
reg
iven
inp
aren
thes
es.
Mic
roh
abit
suit
abil
ity
crit
eria
wer
eo
bta
ined
fro
mh
abit
atsu
itab
ilit
ycu
rves
wei
gh
ted
by
hab
itat
avai
lab
ilit
y,o
rw
ere
der
ived
fro
msi
mp
lefr
equ
ency
of
use
curv
es(g
iven
inp
aren
thes
es),
see
tex
tfo
rm
eth
od
su
sed
.C
over
var
iab
les
are
list
edin
dec
reas
ing
ord
ero
fim
po
rtan
ce
Fis
hsp
ecie
sM
alo
tim
inn
ow
Ro
ckca
tfish
SM
yel
low
fish
LM
yel
low
fish
OR
mu
dfi
shR
tro
ut
Mo
gg
elC
hu
bb
yh
ead
Fis
hle
ng
th4
.5–1
1.8
(13
.0)
3.3
–2
3.5
(30
.0)
2.1
–5
3.0
5.0
–2
4.0
(82
.5)
2.1
–4
9.0
(50
.0)
5.4
–5
6.0
(12
2.0
)(5
0.0
)(1
2.0
)
(cm
fork
len
gth
)
Mic
roh
abit
atsu
itab
ilit
ycr
iter
ia
Ad
ult
Dep
th(m
)0.2
1–0.3
(0.0
7–0.6
)0.1
5–0.3
(0.1
5–3.0
)(0
.6–2.7
)M
oder
ate-
dee
p(0
.3–1.7
1)
(0.4
–2.5
)M
oder
ate-
dee
p
Vel
oci
ty(m
/s)
0–
0.1
(0–
0.5
)0
.6–0
.8(0
–1
.2)
(0–
0.3
2)
Low
-mo
der
ate
(0–
0.0
9)
(0–
0.2
8)
Zer
o-l
ow
Subst
rate
LC
/B(S
-Br)
LC
-B(G
-Br)
(S-L
C/B
)F
ine-
moder
ate
(S-S
C)
(S-L
C/B
)
Cover
Su
bst
/Ro
ckU
C,
LL
,S
ub
st./
Ro
ckU
C,
Mac
,F
aS
ub
s,L
L,
FA
,S
ub
st,
LL
,FA
,
LW
D,
SW
D,
UC
,L
L,
SW
DM
AC
MA
C,
SV
RM
,E
V
Juven
ile
Dep
th(m
)(0
.05
–0
.7)
(0.1
–0.6
)(0
.1–
0.6
)S
hal
low
-mod
erat
e(0
.15
–0
.60
)(0
.11
–0
.30
)S
hal
low
-mod
erat
e
Vel
oci
ty(m
/s)
Gli
de-
Bac
kw
ater
(0.1
4–0.8
9)
0–0.4
Moder
ate-
hig
h(0
–0.3
9)
(0.1
4–0.6
3)
Low
-moder
ate
Subst
rate
(FG
-LC
)(L
C/B
)M
(S-L
C/B
)M
oder
ate-
coar
se(M
-LC
/B)
(FG
-LC
/B)
Cover
Su
bst
/Ro
ckU
CS
ub
s/R
ock
UC
Su
bst
/Ro
ckU
C
SW
D,
LL
,S
V,
SV
,L
L,
FA
,E
V,
LL
FA
,E
vM
AC
,S
WD
Pas
sag
ere
qu
irem
ents
Min
imu
md
epth
(m)
J¼
0.0
7J¼
0.1
5J¼
0.0
8,
A¼
0.6
J¼
0.1
,A¼
0.3
J¼
0.0
8,
A¼
0.4
Max
imu
mvel
oci
ty(m
/s)
A¼
1.6
1A¼
1.2
A¼
1.3
7J¼
0.8
,A¼
1.3
6J¼
0.8
5,
A¼
1.6
5
Rep
rod
uct
ive
requ
irem
ents
Sp
awn
ing
seas
on
Oct
.–M
arS
pri
ng
–ea
rly
Sp
rin
g—
mid
-M
id–
late
Ear
lysp
rin
g–
Win
ter–
earl
yS
um
mer
sum
mer
sum
mer
sum
mer
sum
mer
spri
ng
Sp
awn
ing
mig
rati
on
Up
stre
amL
ater
alU
pst
ream
&
(Nov
–F
eb)
(du
ring
flo
od
s)la
tera
l
Spawningcues
Incr
ease
dfl
ow
sIn
crea
sed
flow
sIn
crea
sed
Incr
ease
dIn
crea
sed
flow
flo
od
flow
sfl
ow
s???
?
Flo
ws
Mag
nit
ud
e(m
3/s
)7
0–
14
0?
<2
0
Du
rati
on
Fre
quen
cy
Tim
ing
Sp
rin
g(a
lso
late
r)W
inte
r-ea
rly
spri
ng
Continues
FLOW REQUIREMENTS FOR FISH 647
Copyright # 2003 John Wiley & Sons, Ltd. River Res. Applic. 19: 641–666 (2003)

Tab
le1
.C
on
tin
ued
Tem
per
atu
re1
4–
22
>1
8>
18
Incu
bat
ion
hab
itat
req
uir
emen
ts
Hab
itat
typ
e,S
ensi
tive
tosi
ltat
ion
Inan
do
ffch
ann
elIn
and
off
chan
nel
sen
siti
vit
yfa
cto
rs
Dep
th(m
)0
.2–0
.40
.1–0
.20
.06–
0.4
Vel
oci
ty(m
/s)
0.5
–0.5
9M
oder
ate
vel
oci
tyM
oder
ate
0.5
5–0.6
Moder
ate-
hig
h
Su
bst
rate
Co
arse
(CG
-LC
)S
C-L
CC
G-L
CF
G-C
GC
G-B
CG
CG
-B
Cover
SV
,O
HV
SV
,O
HV
SV
,OH
V,
MA
C
Tem
per
atu
re1
4–
22
18
–21
.52
1.5
Incu
bat
ion
du
rati
on
3–
8d
ays
2–
3d
ays
3–
4d
ays
4–
7w
eek
s1
–3
day
s
atte
mp
erat
ure
giv
en
Lar
val
req
uir
emen
ts
Sen
siti
ve
tosi
ltat
ion
Bac
kw
ater
pools
Rec
ruit
men
thig
her
Dep
th(m
)(0
.05
-0.4
)(0
.1-0
.35
)w
hen
spaw
nin
g
Vel
oci
ty(m
/s)
Fla
t-B
ack
wat
er0
occ
urs
on
inu
nd
ated
Su
bst
rate
(FG
-CG
)C
flo
od
pla
inh
abit
ats
CG
Tem
per
atu
re
Larvaldevelopment
Mo
bil
e4
–6
day
sM
obil
e3
–4
day
sM
obil
eat
hat
ch
duration
Die
t AA
IO
/AI/
PB
enth
icO
/D/A
PB
enth
icD
OB
enth
icD
/AM
O
or
AI
JA
IO
/AI
Ben
thic
O/D
/AA
IA
I/T
I
LM
OM
OM
O
Oth
erfl
ow
-rel
ated
issu
esH
igh
turb
idit
yC
anno
tto
lera
teJu
ven
iles
affe
cts
fora
gin
gT
emp>
25
,u
nd
erg
om
ass
DO
<3
dis
per
sal
mig
rati
on
s
Key
toco
des
:A
—ad
ult
;J—
juven
ile,
L—
lerv
aa.
Su
bst
rate
char
acte
rist
ics:
M—
mu
d,
S—
san
d,
FG
—fi
ne
gra
vel
,C
G—
coar
seg
ravel
,S
C—
smal
lco
bb
les,
LC
—la
rge
cob
ble
s,B
r—b
edro
ck.
Cover
types
:S
ubst
—su
bst
rate
,R
ock
UC
—ro
cky
un
der
cuts
,L
L—
leaf
litt
er,L
WD
—la
rge
wo
od
yd
ebri
s,S
WD
—sm
all
wo
od
yd
ebri
s,U
C—
un
der
cut
ban
ks,
UC
—u
nd
ercu
tb
ank
s,R
M—
roo
tm
asse
s,M
AC
—aq
uat
icm
acro
ph
yte
s,FA
—fi
lam
ento
us
alg
ae,
EV
—em
erg
ent
veg
.,S
V—
sub
mer
ged
mar
gin
alveg
.,O
HV
—su
bm
erg
edover
han
gin
gveg
.D
iet
cate
go
ries
:O
—o
mn
ivo
re,
MO
—m
icro
ph
agic
om
niv
ore
,D
—d
etri
tivo
re,
A—
alg
ivo
re,
AI—
aqu
atic
inse
ctiv
ore
,T
I—te
rres
tria
lin
sect
ivo
re,
P—
pis
civo
re.
648 A. H. ARTHINGTON ET AL.
Copyright # 2003 John Wiley & Sons, Ltd. River Res. Applic. 19: 641–666 (2003)

(2) Treaty was a scenario that adhered to the minimal releases of the 1986 treaty signed between Lesotho and
South Africa. It represented the opposite extreme from the Minimum Degradation scenario, with little water
remaining in the river system and a maximum amount available for export.
(3) Design Limitation was a scenario addressing the reality that, in terms of both dam-release structures and com-
mitment to a moderate level of water delivery, there were limitations on the water that could be released down-
stream from dams already in place.
(4) A fourth scenario was situated between the previous two in terms of the amount of water harvested versus that
left in the river.
The flow components and scenarios evaluated at study site 2 (downstream from Katse Dam) are given in Table II.
Under the possible Minimum Degradation scenario for site 2, the changes in flow regime would be: (i) the upper
limit of the dry-season low flows reduced from the natural flow of 16 to 9 m3 s�1, and the upper limit of the wet-
season low flows from 50 to 25 m3 s�1; (ii) for the intra-annual floods, three of the six Class 1 floods lost, one of the
three Class II lost, one of the Class III lost, and one of the Class IV floods lost; (iii) all of the inter-annual floods
would still occur except those with a five-year return interval; and (iv) 66% of the natural mean annual runoff
(MAR) would remain in the river. At the other extreme of flow change, the Treaty scenario maximized water sto-
rage, with low flows remaining at a steady year-round dam release of 0.5 mm, all small to medium floods stored by
Katse Dam, but on average one Class I flood generated per year by the downstream catchment, all large floods up to
that with a 20-year return interval harvested by the dam, and only 4% of MAR left in the river. Scenarios (3) and (4)
would provide intermediate levels of flow change, leaving 33% and 18% of MAR in the river (Metsi Consultants,
2000a).
Hydraulic models (e.g. a steady-state backwater model, Channel Flow Profile) were used to estimate the hydrau-
lic characteristics (maximum depth, stream width, wetted area, wetted perimeter and mean velocity) of selected
cross-sections at each study site (Metsi Consultants, 2000a). Table III presents the hydraulic data for one riffle/
rapid and one pool cross-section at study site 2 (Katse), matching the flow data given for each scenario in
Table II, plus data for the site during the April 1998 field trip (a benchmark situation familiar to all workshop
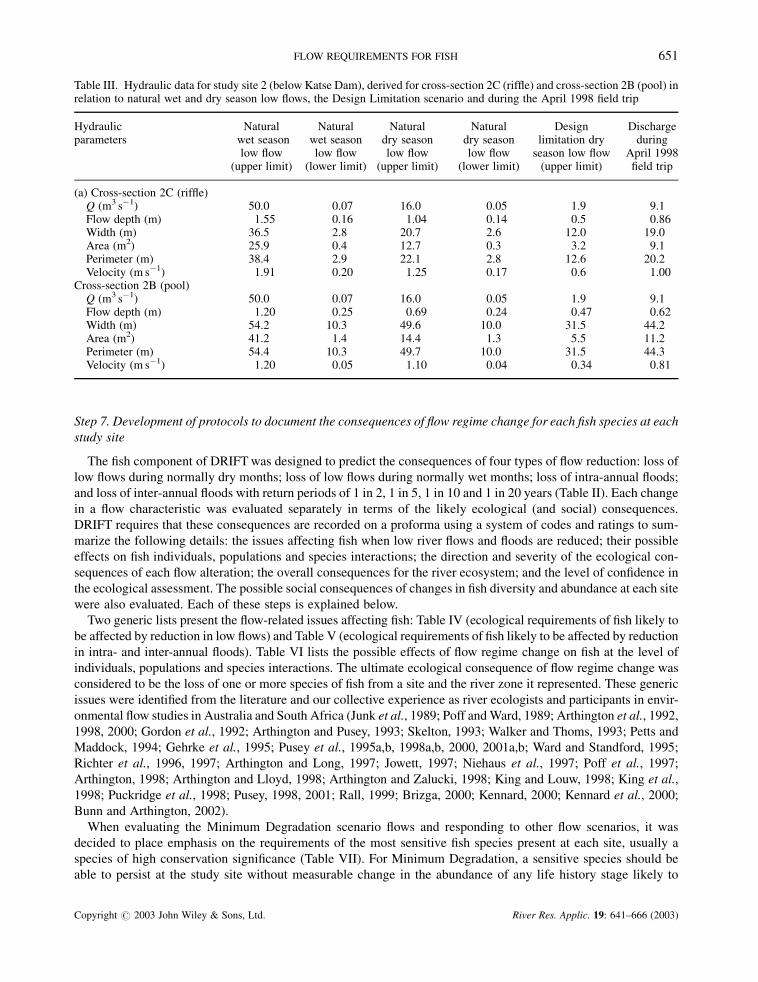
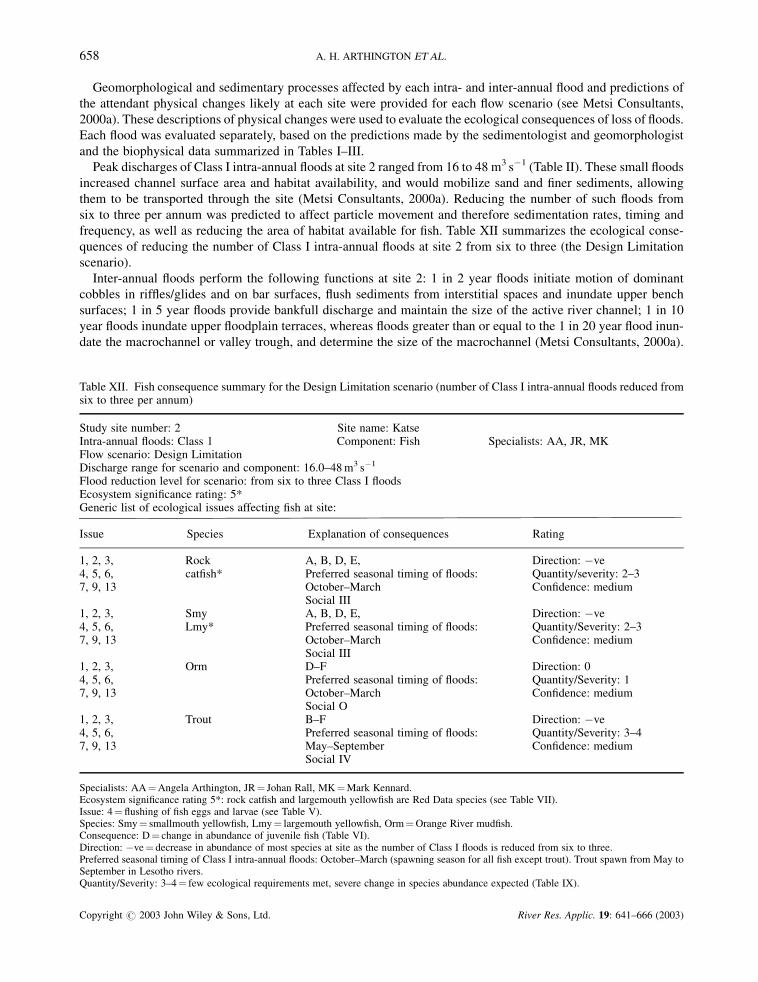
participants). Figure 3a presents maximum depth, mean velocity and wetted perimeter in relation to discharge
for the riffle/rapid cross-section at site 2, and Figure 3b depicts this cross-section showing the depth levels and
ranges of wet and dry season low flows, the four classes of intra-annual floods and the four inter-annual floods.
These discharge and hydraulic data, plus information on channel geomorphology and sedimentary processes
occurring at the discharges defining each flow scenario, as well as descriptions, maps and tabulated data represent-
ing hydraulic habitat structure (see King et al., this issue), provided the physical basis for predicting the conse-
quences of flow reductions for fish.
Table II. Statistical description of the flow regime at study site 2 (Katse) and the flow characteristics of four flow scenarios(from Metsi Consultants, 2000a)
Flow component Discharge Average number Minimum Design Fourth Treaty(m3 s�1) of events per year degradation limitation scenario
Dry season low flows 0.1–16.0 0.1–9.0 0.1–1.9 0.1–1.9 0.5Wet season low flows 0.1–50.0 0.1–25.0 0.1–1.2 0.1–1.2 0.5Intra-annual flood I 16–48 6 3 3 2 1Intra-annual flood II 49–95 3 2 1 0.5 0Intra-annual flood III 96–190 3 2 2 0.5 0Intra-annual flood IV 191–379 2 1 0 0 01:2 year flood 380 P A A A1:5 year flood 530 A A A A1:10 year flood 665 P P A A1:20 year flood 870 P P P P% MAR as environmental flow 66 33 18 4
P¼ present, A¼ absent.*Dry season¼ June to November; wet season¼December to May.
FLOW REQUIREMENTS FOR FISH 649
Copyright # 2003 John Wiley & Sons, Ltd. River Res. Applic. 19: 641–666 (2003)
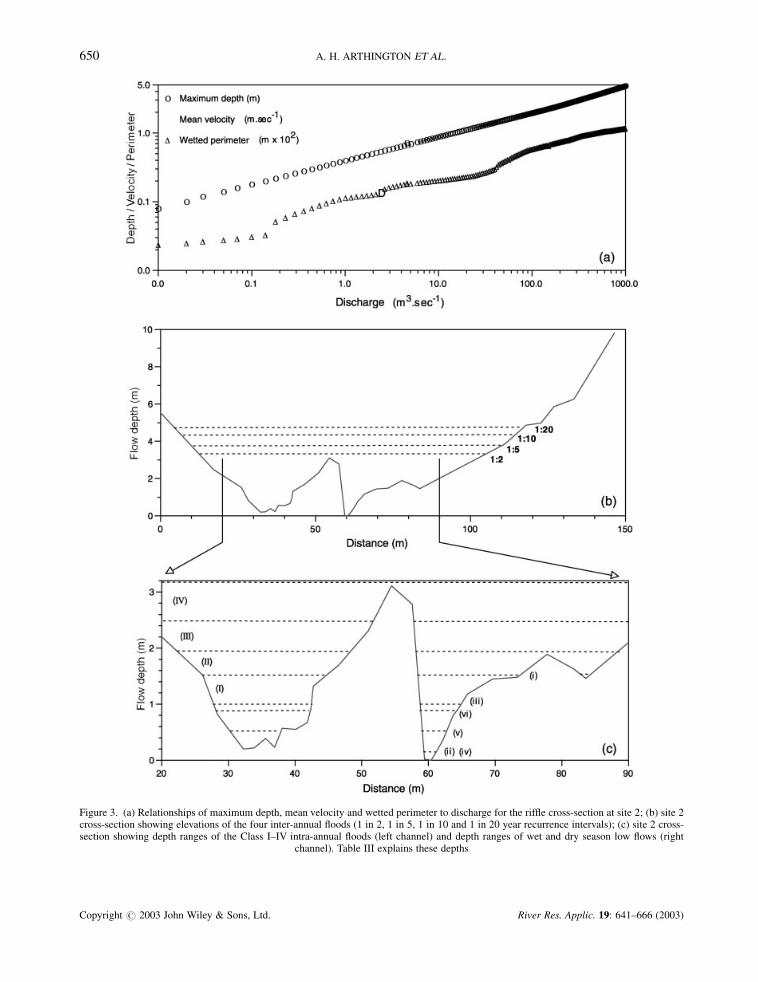
Figure 3. (a) Relationships of maximum depth, mean velocity and wetted perimeter to discharge for the riffle cross-section at site 2; (b) site 2cross-section showing elevations of the four inter-annual floods (1 in 2, 1 in 5, 1 in 10 and 1 in 20 year recurrence intervals); (c) site 2 cross-section showing depth ranges of the Class I–IV intra-annual floods (left channel) and depth ranges of wet and dry season low flows (right
channel). Table III explains these depths
650 A. H. ARTHINGTON ET AL.
Copyright # 2003 John Wiley & Sons, Ltd. River Res. Applic. 19: 641–666 (2003)
Step 7. Development of protocols to document the consequences of flow regime change for each fish species at each
study site
The fish component of DRIFT was designed to predict the consequences of four types of flow reduction: loss of
low flows during normally dry months; loss of low flows during normally wet months; loss of intra-annual floods;
and loss of inter-annual floods with return periods of 1 in 2, 1 in 5, 1 in 10 and 1 in 20 years (Table II). Each change
in a flow characteristic was evaluated separately in terms of the likely ecological (and social) consequences.
DRIFT requires that these consequences are recorded on a proforma using a system of codes and ratings to sum-
marize the following details: the issues affecting fish when low river flows and floods are reduced; their possible
effects on fish individuals, populations and species interactions; the direction and severity of the ecological con-
sequences of each flow alteration; the overall consequences for the river ecosystem; and the level of confidence in
the ecological assessment. The possible social consequences of changes in fish diversity and abundance at each site
were also evaluated. Each of these steps is explained below.
Two generic lists present the flow-related issues affecting fish: Table IV (ecological requirements of fish likely to
be affected by reduction in low flows) and Table V (ecological requirements of fish likely to be affected by reduction
in intra- and inter-annual floods). Table VI lists the possible effects of flow regime change on fish at the level of
individuals, populations and species interactions. The ultimate ecological consequence of flow regime change was
considered to be the loss of one or more species of fish from a site and the river zone it represented. These generic
issues were identified from the literature and our collective experience as river ecologists and participants in envir-
onmental flow studies in Australia and South Africa (Junk et al., 1989; Poff and Ward, 1989; Arthington et al., 1992,
1998, 2000; Gordon et al., 1992; Arthington and Pusey, 1993; Skelton, 1993; Walker and Thoms, 1993; Petts and
Maddock, 1994; Gehrke et al., 1995; Pusey et al., 1995a,b, 1998a,b, 2000, 2001a,b; Ward and Standford, 1995;
Richter et al., 1996, 1997; Arthington and Long, 1997; Jowett, 1997; Niehaus et al., 1997; Poff et al., 1997;
Arthington, 1998; Arthington and Lloyd, 1998; Arthington and Zalucki, 1998; King and Louw, 1998; King et al.,
1998; Puckridge et al., 1998; Pusey, 1998, 2001; Rall, 1999; Brizga, 2000; Kennard, 2000; Kennard et al., 2000;
Bunn and Arthington, 2002).
When evaluating the Minimum Degradation scenario flows and responding to other flow scenarios, it was
decided to place emphasis on the requirements of the most sensitive fish species present at each site, usually a
species of high conservation significance (Table VII). For Minimum Degradation, a sensitive species should be
able to persist at the study site without measurable change in the abundance of any life history stage likely to
Table III. Hydraulic data for study site 2 (below Katse Dam), derived for cross-section 2C (riffle) and cross-section 2B (pool) inrelation to natural wet and dry season low flows, the Design Limitation scenario and during the April 1998 field trip
Hydraulic Natural Natural Natural Natural Design Dischargeparameters wet season wet season dry season dry season limitation dry during
low flow low flow low flow low flow season low flow April 1998(upper limit) (lower limit) (upper limit) (lower limit) (upper limit) field trip
(a) Cross-section 2C (riffle)Q (m3 s�1) 50.0 0.07 16.0 0.05 1.9 9.1Flow depth (m) 1.55 0.16 1.04 0.14 0.5 0.86Width (m) 36.5 2.8 20.7 2.6 12.0 19.0Area (m2) 25.9 0.4 12.7 0.3 3.2 9.1Perimeter (m) 38.4 2.9 22.1 2.8 12.6 20.2Velocity (m s�1) 1.91 0.20 1.25 0.17 0.6 1.00
Cross-section 2B (pool)Q (m3 s�1) 50.0 0.07 16.0 0.05 1.9 9.1Flow depth (m) 1.20 0.25 0.69 0.24 0.47 0.62Width (m) 54.2 10.3 49.6 10.0 31.5 44.2Area (m2) 41.2 1.4 14.4 1.3 5.5 11.2Perimeter (m) 54.4 10.3 49.7 10.0 31.5 44.3Velocity (m s�1) 1.20 0.05 1.10 0.04 0.34 0.81
FLOW REQUIREMENTS FOR FISH 651
Copyright # 2003 John Wiley & Sons, Ltd. River Res. Applic. 19: 641–666 (2003)

be present in the wet or dry season, and preferably, all other species must also be able to persist without measurable
change. The social consequences of the Minimum Degradation scenario should be that there is no change in the
usual number of fish species caught by local people using their traditional fishing methods (baited lines), nor any
measurable change in the numbers caught, the body size ranges or the nutritional value of the fish. The social
values of each fish species are given in Table VIII, those of highest value to Basotho people being easily caught
and an important food resource.
The direction of the effect of each change in a flow component was assessed as positive (an increase in fish
numbers), zero (no change in fish numbers) or negative (decrease in fish numbers). The relative severity of the
Table IV. Ecological requirements of fish likely to be affected as low flows are progressively reduced in range and thus variability
Issue code Low flow issues
1 Suitability of adult habitat (depth, velocity, substrate, cover, wetted perimeter)2 Suitability of juvenile habitat (depth, velocity, substrate, cover, wetted perimeter)3 Suitability of larval habitat (depth, velocity, substrate, cover, wetted perimeter)4 Suitability of habitat for fish passage of:a Adultsb Juvenilesc Larvae5 Availability of refuge habitat for adult fish6 Availability of spawning and egg incubation habitat7 Water temperature8 Rate of fine sediment accumulation in interstitial spaces of coarse substrates9 Abundance of epiphytic algae
10 Amount of suspended colloidal matter in low flow areas11 Pool depth12 Abundance of aquatic invertebrates13 Aquatic invertebrate assemblage composition (e.g. predators versus filter feeders versus detritivores)14 Rate of input of allochthonous food resources (terrestrial insects, fruit, flowers)15 Nutrient levels and primary production16 Dissolved oxygen levels17 Turbidity levels (due to livestock trampling at river margins)18 Presence of toxic algal blooms
Table V. Ecological requirements of fish likely to be affected as intra- and inter-annual floods are progressively removed fromthe flow regime
Issue code High flow issues
1 Provision of spawning cues (discharge and water temperature)2 Provision of migration cues for adult fish3 Provision of cues for longitudinal and lateral dispersal of juveniles4 Flushing of fish eggs and larvae5 Access to lateral habitats for adults, juveniles and larvae6a Availability of spawning habitatb Quality of spawning habitat7 Maintenance of interstitial spaces utilized by fish8 Maintenance of tributary bars as spawning and larval habitat9 Maintenance of depth in pools
10 Mobilization of coarse substrates11 Maintenance of macrochannel and habitat diversity12 Maintenance of the functional significance of riparian vegetation13 Maintenance of aquatic invertebrate food supplies14 Maintenance of allochthonous food supplies (terrestrial insects, fruit, flowers etc.)15 Maintenance of nutrient inputs and primary productivity
652 A. H. ARTHINGTON ET AL.
Copyright # 2003 John Wiley & Sons, Ltd. River Res. Applic. 19: 641–666 (2003)

effect of each water level reduction on each fish species was determined using criteria given in Table IX. The over-
all ecosystem significance of each flow regulation scenario was rated independently from the social consequences.
For fish, an impact rating of 5 was assigned in every circumstance where one or more Red Data species (see
Table VII) was collected at a study site and therefore could potentially be reduced in abundance or eliminated from
Table VI. Effects of flow regime change on fish individuals, populations and species interactions
Effect code Effect on fish
A Change in fish health (due to effects of disease, parasites, toxic algae, etc.)B Change in fish body condition (size, weight)C Change in abundances of adult fishD Change in abundance of juvenile fishE Change in abundance of larval fishF Change in spawning and hatching successG Change in level of passage and dispersal for:
(i) Adults(ii) Juveniles(iii) Larvae
H Change in predation levelI Change in competitive pressureJ Change in mortality levelsK Loss of species from site
Table VII. Fish species of high conservation significance (1996 IUCN Red List) present in Lesotho rivers, presumed also to bethe most sensitive
Fish species Conservation status
Rock catfish (Austroglanis sclateri) Presently listed as Data Deficient, previously Red Data Species (endangered)Largemouth yellowfish Red Data Species (vulnerable)(Labeobarbus kimberleyensis)Maloti minnow (Pseudobarbus quathlambae) Red Data Species (critically endangered)
Table VIII. Fish species expected in Lesotho rivers and their social values for the Basotho people
Fish species Fish social values
Rock catfish (A. sclateri) Easy to catch Important food resourceCommonly caught and utilized
Smallmouth yellowfish (Labeobarbus aeneus) Easy to catch Important food resourceCommonly caught and utilized
Largemouth yellowfish (Labeobarbus kimberleyensis) Easy to catch Important food resourceNot commonly caught, less utilized
Orange River mudfish (Labeo capensis) Hard to catch Potential food resourceNot commonly caught, less utilized
Trout (Onchorhynchus mykiss) Easy to catch Important food resourceCommonly caught and utilized
Sharptooth catfish (Clarias gariepinus) Easy to catch Potential food resourceNot commonly caughtAt limit of distribution range
Moggel (Labeo umbratus) Easy to catch Potential food resourceNot commonly caughtAt limit of distribution range
Maloti minnow (Pseudobarbus quathlambae) Hard to catchNot commonly caught, not utilized
FLOW REQUIREMENTS FOR FISH 653
Copyright # 2003 John Wiley & Sons, Ltd. River Res. Applic. 19: 641–666 (2003)

the site by flow regulation. A rating of 4 was assigned when one or more Red Data species was expected at a study
site based on the known distribution of the species but not actually sampled during the present study. The rationale
for these high ecosystem ratings was that Red Data species are extremely important from a conservation perspec-
tive and any further pressure on populations could, in the long term, result in the loss of those species from a river
reach or entire tributary. Such losses can be of utmost importance when a species has a very restricted distribution
and exists primarily as small isolated populations, as does the Maloti minnow (Rall, 1999) for example.
Confidence ratings assigned by the fish team were: high (H)¼ supporting data extensive, underpinned by peer-
reviewed papers and reports on each fish species; moderate (M)¼ supporting data less extensive, underpinned by
peer-reviewed papers and reports on some fish species, unpublished data and direct observations in the study rivers;
and low (L)¼ predictions based on anecdotal information, personal experience and best professional judgment.
The direction/severity ratings assigned to the ecological consequences of each water level reduction were con-
verted to social consequence ratings. Table X gives numeric ratings proposed by the fish team to reflect possible
levels of change in fishing success, where ‘success’ was evaluated in terms of the traditional fishing methods used
by the Basotho people (i.e. baited lines). Note that a numeric increase in the abundance of Orange River mudfish
(which usually responds positively to flow reductions) was not translated into a high, positive social consequence
rating because the mudfish is relatively difficult to catch and usually does not constitute a large part of the diet
of local people (Table VIII). The mudfish is a benthic algivore/detritivore and therefore does not take bait readily,
if at all.
DESCRIPTION AND RESULTS FROM A WORKED EXAMPLE OF THE FISH COMPONENT OF DRIFT
Steps 1–7 of the fish component of DRIFT have been described above. Here we present the procedures involved in,
and a worked example of, Step 8 (prediction of the ecological and social consequences of flow regime change for
each fish species at each study site). We use study site 2 downstream from Katse Dam to demonstrate the fish
assessment methods.
Four fish species were collected at site 2 over the four sampling occasions between April 1998–early 1999
(Table I). These were the endangered rock catfish (Austroglanis sclateri), the smallmouth yellowfish (Labeobarbus
aeneus), Orange River mudfish (Labeo capensis) and introduced rainbow trout (Onchorhynchus mykiss). Although
not caught during surveys, largemouth yellowfish (Labeobarbus kimberleyensis) could be expected at this site,
Table IX. Severity rating criteria for assessing the effects of flow reduction on fish
Severity rating Criteria Consequence
0 All ecological requirements are met No change in species abundance1 Most ecological requirements are met Negligible change in species abundance2 Some ecological requirements are met Small change in species abundance3 Few ecological requirements are met Moderate change in species abundance4 Very few ecological requirements are met Severe change in species abundance5 No ecological requirements are met Loss of a species
Table X. Social consequences and ratings describing the effects of flow regulation on fishing potential
Rating Consequence Change in fishing success (%)
0 Fishing success maintained as normal 0–5I Negligible change in fishing success 6–10II Fishing success slightly reduced 11–25III Fishing success moderately reduced 26–50IV Fishing success severely reduced 51–80V Fishing success very severely reduced or no fishing success 81–100
654 A. H. ARTHINGTON ET AL.
Copyright # 2003 John Wiley & Sons, Ltd. River Res. Applic. 19: 641–666 (2003)

being present in this part of the river system (J. Rall, personal communication, 2001). Length frequency histograms
for each fish species indicated that the riffle/rapid and the shallow pool at site 2 were utilized only by smaller size
classes of each species (<10 cm fork length), such pools probably serving as nursery areas for developing young-
of-the-year fish. The larger size classes of all species were collected in the deep pool at site 2, suggesting that this
was an important refuge area for adult fish. Introduced rainbow trout were not given a high priority in our assess-
ments owing to their potential negative effects on indigenous fish species; however, the consequences of flow alter-
nations for trout were recorded, and could be rated as positive (desirable food resource for people) or negative (pest
species) in socio-economic evaluations, if so desired.
Four flow scenarios were evaluated: Minimum Degradation, Treaty, Design Limitation and a fourth scenario
(described above in Step 6). The changes in flow regime (reduction levels) for each flow scenario are given in
Table II with the matching hydraulic data summarized in Table III. The evaluation procedure has several steps
described and documented below.
Step 8a. Establish Minimum Degradation level for low flows in dry months
Determination of the Minimum Degradation scenario was an iterative process involving all workshop partici-
pants in progressive evaluations of water levels and associated river features until agreement was reached on a flow
‘having a minimal impact on present river condition’ (King et al., this issue). The Minimum Degradation scenario
agreed at the Lesotho workshop for study site 2 (Katse) resulted in an upper limit of dry season low flows of
9.0 m3 s�1, a maximum water depth of 0.86 m and mean velocity of 1 m s�1. Here we demonstrate how this sce-
nario would meet the requirements of fish collected at the site or expected there (Table I).
The most sensitive species at site 2, the rock catfish, was evaluated first, followed by the other species collected
and expected. Data collected during the Lesotho study on habitat use of the rock catfish confirmed published
reports that rock catfish live in rocky habitats in flowing water, favouring rapids (Skelton, 1993). In the Lesotho
rivers surveyed, catfish abundance was significantly correlated (Spearman’s rank correlation, p< 0.05) with mean
stream width, mean water velocity, presence of large cobble/boulder substrates and rocky undercuts, and nega-
tively correlated with sandy substrates, indicating that this species was more abundant in wide, high gradient
streams (Metsi Consultants, 2000b). Catfish were also more common in hydraulic habitats containing aquatic
macrophytes and submerged overhanging vegetation. Information about the rock catfish assembled from field sur-
veys and the literature is given in Table I.
Evaluation of the Minimum Degradation scenario began with selection of cross-sections closest to the hydraulic
habitat types surveyed during field studies. At site 2, the cross-sections selected were 2C (riffle/glide) and 2B
(pool) (Figure 3). Starting with the riffle/glide cross-section, we determined the suitability of the habitat available
when the natural flow would be at the upper limit of the dry season (June to November) low flows (i.e. the 1 per-
centile exceedence flow water level) using the hydraulic data given in Table III. The depth and velocity preferences
of each fish species/developmental stage at this site (Table I) were compared with the tabulated hydraulic data.
The preferred depth range for adult rock catfish was found to be 0.15–0.3 m, and for juveniles 0.1–0.6 m; the
preferred velocity range for adults was 0.6–0.8 m s�1, and for juveniles 0.14–0.89 m s�1 (Table I). Field surveys of
hydraulic habitat in the riffles/glide at a range of discharges over one year (data collected by geomorphologist, fish
and invertebrate ecologists) showed that adult and juvenile catfish substrate requirements and cover preferences
would be met at the riffle/rapids cross-section when flow depths were up to 0.86 m. The minimum depth required
for adult rock catfish to ensure passage is not known but juveniles move in depths of 0.15 m, well within the depth
range available at the Minimum Degradation discharge (maximum of 0.86 m). Maximum velocities for juveniles to
make passage are not known but adult catfish tolerate up to 1.2 m s�1, and their movements would not be con-
strained by Minimum Degradation velocities at the site 2 riffle/rapid. There were two rocky trenches at the rif-
fle/rapid (Figure 3) within which catfish would be able to find resting areas under rock outcrops and boulders,
and through which they should be able to pass to reach pool habitats upstream. We concluded that adult and juve-
nile habitat and passage requirements of rock catfish (and the other species present, evaluated as described here)
would be met by the Minimum Degradation scenario low flows through the riffle/rapid during the dry season.
Following the assessment of the consequences of a possible Minimum Degradation level for fish at the riffle/glide,
the implications of this discharge were considered in pools. This evaluation was focused on the functional
FLOW REQUIREMENTS FOR FISH 655
Copyright # 2003 John Wiley & Sons, Ltd. River Res. Applic. 19: 641–666 (2003)

importance of pool habitat in relation to the ecological requirements of rock catfish and other fish species inhabiting
site 2 (Table I). Larger individuals of rock catfish (and of smallmouth yellowfish, mudfish and trout) were collected
using gill nets in the deeper pool at site 2, suggesting that this habitat was an important refuge for adult fish of all four
species. This habitat may be particularly important for the rock catfish and largemouth yellowfish (not collected but
expected at this site), both being species of high conservation significance. Depths, velocities and substrates in the
site 2 pool were suitable for rock catfish adults and juveniles, both pools having areas of bedrock, boulders and cob-
bles favoured by this species.
Rock catfish are omnivorous, preying on aquatic invertebrates, primarily insect larvae and nymphs taken from
rock surfaces; larger specimens also take small fish (Skelton, 1993). These food resources were readily available in
the riffle/glide and pools areas at site 2, where potential prey species (smallmouth yellowfish and Orange River
mudfish) were relatively abundant (CPUE based on 60 minutes of electrofishing) on all sampling occasions over
one year (Metsi Consultants, 2000b) and the benthic invertebrate fauna was diverse.
Rock catfish probably spawn in spring and early summer, possibly in response to increasing discharge, therefore
spawning requirements may not be an issue during the cooler, dry season low-flow period, but rather, at the start of
the wet season when rising water temperatures, somewhat elevated low flows and within-channel floods may pro-
vide spawning cues. All indications are that this catfish spawns over cobbles and rocks in flowing water, whereas
new recruits are found in backwater pools (R. A. Jubb, Albany Museum, Grahamstown, South Africa, unpublished
report, 1970; Niehaus et al., 1997). We concluded that if spawning does sometimes occur during the latter part of
the low flow period, the habitat conditions at site 2 would be suitable for incubation of the eggs, larval development
and feeding, and the movement of new recruits into pool areas (cf. details in Table I).
Step 8b. Evaluate flow reductions below Minimum Degradation low flow level
The specific ecological consequences for each fish species resulting from the three progressive reductions in low
flow water levels were evaluated using the methods outlined above. With each of these flow reductions (Design
Limitation, fourth scenario and Treaty; see Tables II and III), rock catfish populations would be expected to decline
progressively due to loss of low flow habitat for adult and juvenile fish, especially in shallow riffles and glides,
reduced opportunities to make passage, decline of the preferred food resources (invertebrates on rock surfaces
would be exposed frequently at very low flows), and possibly, decline in water quality (e.g. decreased dissolved
oxygen concentrations), particularly in deeper pools. Any increase in turbidity at low flows could affect visually
orienting piscivores such as the yellowfish (Cambray, 1984) and possibly also the rock catfish. If catfish spawning
were to occur, the infilling of interstitial spaces in cobble substrates due to increasing settlement of colloidal mate-
rial, sediment and small particles at low flows, as well as buildup of biofilms (Metsi Consultants, 2000a), could
lead to suffocation of eggs.
Table XI provides the proforma data entries recording the ecological consequences of low flow reduction at site
2 for the Design Limitation scenario. A proforma of this type was completed for each low flow reduction level, and
the four proformas, the graphic and tabulated data describing hydraulic conditions at each cross-section and a site-
specific version of Table I (indicating the fish species and life history stages evaluated) were all submitted to the
workshop convener for input to a customized database and for use during socio-economic evaluations.
Step 8c. Establish Minimum Degradation level for low flows in wet months
Step 8d. Evaluate flow reductions below Minimum Degradation low flow level in wet months
Identical procedures were employed to agree upon Minimum Degradation flows and evaluate the consequences
of low flow reductions in wet months of the year, that is, those intervals between floods when low flows are higher
than during dry months. The particular issues of most relevance to fish at site 2 were identical to those given in
Table XI except that more emphasis was given to the reproductive requirements of catfish and other species which
commence to spawn during the early wet season (Table I). For Design Limitation (see Tables II and III), we con-
cluded that the ecological consequences of loss of low flows during the wet season should be rated 4¼ very few
ecological requirements met, severe change in species abundance expected (Table IX).
656 A. H. ARTHINGTON ET AL.
Copyright # 2003 John Wiley & Sons, Ltd. River Res. Applic. 19: 641–666 (2003)

Step 8e. Establish Minimum Degradation level for intra-annual floods
Step 8f. Evaluate reduction scenarios below Minimum Degradation for intra-annual floods
Step 8g. Establish Minimum Degradation level for inter-annual floods
Step 8h. Evaluate reduction scenarios below Minimum Degradation for inter-annual floods
The flood assessment process required an understanding of the effects of each intra- and inter-annual flood level
on geomorphological and sedimentary processes and channel hydraulics as these processes determine the physical
changes that in turn govern the distribution, quantity and quality of habitat for fish, major physical bottlenecks for
migratory species (e.g. waterfalls), and opportunities for spawning and foraging (see Table V). Changes in sedi-
mentary processes can affect not only the quantity of fish habitat but also its quality, for example, accumulations of
fine sediment in coarser substrate types may degrade fish spawning habitat or smother fish eggs and/or invertebrate
prey. In addition, the importance of the volume and timing of floods as cues for fish spawning migration, provision
of access to lateral foraging areas, and other structural and functional roles of high discharge events were consid-
ered (Table V). A marked change in the seasonal distribution (timing) of flood events may be particularly critical if
flows of a particular magnitude and timing provide cues for fish migration and spawning (as demonstrated by King
et al., 1998). In contrast, the release of high flows from a reservoir during a normally low flow period, when some
fish species are spawning, may wash away or strand incubation and larval habitat components (e.g. aquatic plants,
fine substrate particles), and any associated eggs and larval fishes, with significant implications for recruitment
(e.g. Pusey et al., 2001a,b).
Table XI. Fish consequence summary for Design Limitation scenario dry season low flows at study site 2 (Katse)
Study site number: 2 Site name: KatseLow flow season: Dry Component: Fish Specialists: AA, JR, MKFlow scenario: Design limitationDischarge range for scenario and component: 0.05–1.9 m3 s�1
Ecosystem significance rating: 5*Generic list of ecological issues affecting fish at site:
Issue Species Explanation of consequences Rating
1, 2, Rock A–D, G, H–J Direction: �ve4a,b, 5 catfish* Quantity/severity: 48–13, Social IV Confidence: medium16–181, 2, Smy A–C, G, H, J Direction: �ve4a,b, Lmy* Quantity/Severity: 48–13, Social IV Confidence: medium16–181, 2, Orm A–C, G, H, J Direction: þve8–13, Quantity/Severity: 216–18 Social 0 Confidence: medium1–6, Trout A–G Direction: �ve8–13, Quantity/Severity: 416–18 Social IV Confidence: medium
Specialists: AA¼Angela Arthington, JR¼ Johan Rall, MK¼Mark Kennard.Ecosystem significance rating 5*: rock catfish and largemouth yellowfish are Red Data species (see Table VII).Issue: 1¼ suitability of adult habitat (depth, velocity, substrate, cover, wetted perimeter (see Table IV).Species: Smy¼ smallmouth yellowfish, Lmy¼ largemouth yellowfish, Orm¼Orange River mudfish.Consequences: A¼ change in fish health (due to effects of disease, parasites, toxic algae, etc.) (see Table VI).Direction: þve¼ increase in abundance of Orange River mudfish as low flows are reduced, but social value 0 as mudfish are difficult to catchand seldom eaten by Basotho people (see Table VIII).Quantity/Severity: 4¼ very few ecological requirements met, severe change in species abundance expected (see Table IX).Social: IV¼fishing success severely reduced, % change 51–80 (see Table X).
FLOW REQUIREMENTS FOR FISH 657
Copyright # 2003 John Wiley & Sons, Ltd. River Res. Applic. 19: 641–666 (2003)
Geomorphological and sedimentary processes affected by each intra- and inter-annual flood and predictions of
the attendant physical changes likely at each site were provided for each flow scenario (see Metsi Consultants,
2000a). These descriptions of physical changes were used to evaluate the ecological consequences of loss of floods.
Each flood was evaluated separately, based on the predictions made by the sedimentologist and geomorphologist
and the biophysical data summarized in Tables I–III.
Peak discharges of Class I intra-annual floods at site 2 ranged from 16 to 48 m3 s�1 (Table II). These small floods
increased channel surface area and habitat availability, and would mobilize sand and finer sediments, allowing
them to be transported through the site (Metsi Consultants, 2000a). Reducing the number of such floods from
six to three per annum was predicted to affect particle movement and therefore sedimentation rates, timing and
frequency, as well as reducing the area of habitat available for fish. Table XII summarizes the ecological conse-
quences of reducing the number of Class I intra-annual floods at site 2 from six to three (the Design Limitation
scenario).
Inter-annual floods perform the following functions at site 2: 1 in 2 year floods initiate motion of dominant
cobbles in riffles/glides and on bar surfaces, flush sediments from interstitial spaces and inundate upper bench
surfaces; 1 in 5 year floods provide bankfull discharge and maintain the size of the active river channel; 1 in 10
year floods inundate upper floodplain terraces, whereas floods greater than or equal to the 1 in 20 year flood inun-
date the macrochannel or valley trough, and determine the size of the macrochannel (Metsi Consultants, 2000a).
Table XII. Fish consequence summary for the Design Limitation scenario (number of Class I intra-annual floods reduced fromsix to three per annum)
Study site number: 2 Site name: KatseIntra-annual floods: Class 1 Component: Fish Specialists: AA, JR, MKFlow scenario: Design LimitationDischarge range for scenario and component: 16.0–48 m3 s�1
Flood reduction level for scenario: from six to three Class I floodsEcosystem significance rating: 5*Generic list of ecological issues affecting fish at site:
Issue Species Explanation of consequences Rating
1, 2, 3, Rock A, B, D, E, Direction: �ve4, 5, 6, catfish* Preferred seasonal timing of floods: Quantity/severity: 2–37, 9, 13 October–March Confidence: medium
Social III1, 2, 3, Smy A, B, D, E, Direction: �ve4, 5, 6, Lmy* Preferred seasonal timing of floods: Quantity/Severity: 2–37, 9, 13 October–March Confidence: medium
Social III1, 2, 3, Orm D–F Direction: 04, 5, 6, Preferred seasonal timing of floods: Quantity/Severity: 17, 9, 13 October–March Confidence: medium
Social O1, 2, 3, Trout B–F Direction: �ve4, 5, 6, Preferred seasonal timing of floods: Quantity/Severity: 3–47, 9, 13 May–September Confidence: medium
Social IV
Specialists: AA¼Angela Arthington, JR¼ Johan Rall, MK¼Mark Kennard.Ecosystem significance rating 5*: rock catfish and largemouth yellowfish are Red Data species (see Table VII).Issue: 4¼ flushing of fish eggs and larvae (see Table V).Species: Smy¼ smallmouth yellowfish, Lmy¼ largemouth yellowfish, Orm¼Orange River mudfish.Consequence: D¼ change in abundance of juvenile fish (Table VI).Direction: �ve¼ decrease in abundance of most species at site as the number of Class I floods is reduced from six to three.Preferred seasonal timing of Class I intra-annual floods: October–March (spawning season for all fish except trout). Trout spawn from May toSeptember in Lesotho rivers.Quantity/Severity: 3–4¼ few ecological requirements met, severe change in species abundance expected (Table IX).
658 A. H. ARTHINGTON ET AL.
Copyright # 2003 John Wiley & Sons, Ltd. River Res. Applic. 19: 641–666 (2003)

Table XIII summarizes the ecological consequences of eliminating each of the 1 in 2, 1 in 5, 1 in 10 and 1 in 20
inter-annual floods at site 2. Note that the actual flow scenarios did not necessarily eliminate all of these floods (see
Table II). Loss of the 1 in 2 year flood was considered to have the most severe consequences at site 2 as this flood
has major implications for maintenance of habitat quantity and quality for all life stages of the fish species present.
It may also provide critical spawning cues one year in every two, possibly generating a large cohort of new recruits
of some fish species, and possibly of all species at this site. Accordingly, this flood was maintained in the Minimum
Degradation scenario (Table II), as were 1:10 and 1:20 year floods, for purposes discussed above.
Table XIII. Fish consequence summary for scenarios eliminating each of the 1 in 2, 1 in 5, 1 in 10 and 1 in 20 inter-annualfloods at site 2 (Katse)
Study site number: 2 Site name: KatseDischarge range for inter-annual floods: 380–870 m3 s�1 Component: Fish Specialists: AA, JR, MKFlood reduction level for each scenario: from 1 to 0 floodEcosystem significance rating: 5*Generic list of ecological issues affecting fish at site:
Flood frequency Issues Fish species Explanation of consequences Rating
1:2 1–15 Rc* B–G Direction: �veSmy Preferred seasonal timing Quantity/severity: 4–5Lmy* of flood: October–March Confidence: mediumOrmTrout Preferred seasonal timing
of floods: May–SeptemberSocial IV–V
1:5 1–15 Rc* B–G Direction: �veSmy Preferred seasonal timing Quantity/severity: 3–4Lmy* of flood: October–March Confidence: mediumOrmTrout Preferred seasonal timing
of floods: May–SeptemberSocial IV
1:10 1–15 Rc* B–G Direction: �veSmy Preferred seasonal timing Quantity/severity: 3Lmy* of flood: October–March Confidence: mediumOrmTrout Preferred seasonal timing
of floods: May–SeptemberSocial II–III
1:20 1–15 Rc* B–G Direction: 0Smy Preferred seasonal timin Quantity/Severity: 3Lmy* of floods: October–March Confidence: mediumOrmTrout Preferred seasonal timing
of floods: May–SeptemberSocial II–III
Specialists: AA¼Angela Arthington, JR¼ Johan Rall, MK¼Mark Kennard.Ecosystem significance rating 5*: rock catfish and largemouth yellowfish are Red Data species (see Table VII).Issues: 1–15¼ all high flow issues were considered (see Table V).Species: Rc¼ rock catfish, Smy¼ smallmouth yellowfish, Lmy¼ largemouth yellowfish, Orm¼Orange River mudfish.Consequences: B¼ change in fish body condition, i.e. size and weight (see Table VI).Direction: �ve¼ decrease in abundance of most species at site as inter-annual floods are lost.Preferred seasonal timing of inter-annual floods: October–March (spawning season for all fish except trout). Trout spawn from May toSeptember in Lesotho rivers.Quantity/Severity: 4–5¼ few ecological requirements met, severe change in species abundance expected (see Table IX).Social: IV¼fishing success severely reduced, % change 51–80 (see Table X).
FLOW REQUIREMENTS FOR FISH 659
Copyright # 2003 John Wiley & Sons, Ltd. River Res. Applic. 19: 641–666 (2003)

DISCUSSION
In the last five decades, over 200 different approaches have been described for advising on environmental flows and
they are applied in at least 50 countries (Tharme, 2003). DRIFT is a recent innovation in the category of methods
termed ‘holistic’ approaches (Arthington et al., 1992; King et al., this issue; Tharme, 2003). DRIFT is a product of
studies in a semi-arid, developing region where water supply issues are pressing and there is limited understanding
of river ecology and how rivers with highly unpredictable flow regimes are likely to respond to water resource devel-
opments and flow regulation. In such circumstances, scientists can give precautionary, interim advice on the flow
requirements of rivers and their biota using hydrological methods, or advise on the basis of limited ecological data
and information supported by general knowledge and professional experience (scientific panel methods), or decline
to give advice until more detailed field studies, or long-term research and model development have been completed.
As a guide to the selection of methods best suited to particular environmental flow studies, Tharme (1996),
Dunbar et al. (1998) and Arthington et al. (1998) suggested a hierarchical framework to accommodate the manage-
ment contexts, objectives and factors constraining environmental flow assessments. Figure 4 presents an updated
version of the three-tiered hierarchy described by Arthington et al. (1998), indicating some of the better-known
methods applicable at each level, their relative information requirements, spatial and temporal scales, and the types
of issues each level is best suited to address. The hierarchy can be entered at any level and investigations may cease
at any level; however, the intention is to provide a sequence of options of increasing analytical refinement and
scientific certainty, and hence, increasing levels of confidence in the advice provided to managers. Conversely,
the more rapid and coarse the method, the greater the risk that incorrect advice may be given and undesirable out-
comes may result from management actions.
The DRIFT methodology and its fish component lie within the second level of this hierarchy of methods. They
are essentially data-management tools allowing many types and sources of information, predictive models, theo-
retical principles and the knowledge of a panel of scientists ‘to be used to their best advantage in a structured pro-
cess’ (King et al., this issue). The use of scientific panels and ‘expert opinion’ is common practice in the medical/
health sciences and engineering to establish new industry-wide procedures and protocols (National Health and
Medical Research Council, 1994; Jones and Hunter, 1995; Anon., 1996). These methods are especially useful
in situations where medical and environmental scientists, engineers, planners and policy-makers have to make
urgent decisions about the protection of human health and the management of natural resources on the basis of
uncertain, complex and incomplete information (Roe and Van Eeten, 2001).
A dearth of ecological data and process models upon which to base environmental flow recommendations, and
political pressure to define environmental flow requirements in a relatively short time-frame (often 6–12 months),
has led to frequent use of scientific panel methods in Australia (Pusey, 1998; Cottingham et al., 2002). The DRIFT
framework shares many features with Australian scientific panel approaches but also offers several generic advan-
tages discussed by King et al. (this issue) and elaborated below.
Cottingham et al. (2002) comment that scientific panel methods have been ‘an excellent knowledge exchange
mechanism’, are rapid and inexpensive compared to empirical investigations, have the flexibility to adapt the most
appropriate and up-to-date assessment methods, and can make use of information ranging from anecdotal to the-
oretical. Their shortcomings are judged to fall into two categories: those relating to field assessments, and ‘pro-
blems with panel discussions and recommendations’.
To offset these shortcomings, Cottingham et al. (2002) conclude that scientific panel methods would be bolstered
by the development of a flexible ‘best practice’ approach suitable for wide application, and including the following
features: (1) clear processes for selecting panel members and protocols to guide the conduct of panels and the inter-
actions between members; (2) guidelines for developing a ‘vision statement’ and explicit ecological objectives, so
that any ecosystem response to environmental flow provisions can be measured against the desired outcomes in an
adaptive management framework; (3) more explicit guidelines regarding the selection of field sites and the collec-
tion of new field data; (4) procedures for recording the strengths and limitations of evidence used to make environ-
mental flow recommendations; (5) consideration of the social and economic implications of environmental flow
recommendations; (6) a standard process for presentation and documentation of findings; and (7) an opportunity
to make recommendations on the additional information required to support or improve decisions relating to water
management and, particularly, to strengthen the scientific basis of environmental flow assessments.
660 A. H. ARTHINGTON ET AL.
Copyright # 2003 John Wiley & Sons, Ltd. River Res. Applic. 19: 641–666 (2003)

Figure 4. Hierarchy of methods for the assessment of environmental flows for rivers (adapted from Arthington et al., 1998)
FLOW REQUIREMENTS FOR FISH 661
Copyright # 2003 John Wiley & Sons, Ltd. River Res. Applic. 19: 641–666 (2003)

We contend that the generic DRIFT framework and the procedures applied in the biophysical and socio-eco-
nomic components of the process address all of the criticisms of Cottingham et al. (2002) and that DRIFT com-
pares favourably with recommendations regarding a flexible and widely applicable ‘Best Practice Framework’ for
the conduct of scientific panel studies. In support of this assertion, we summarize below the strengths and advan-
tages offered by DRIFT, and particularly its fish component (for ease of reference hereafter termed DRIFT-Fish),
relative to other scientific panel methodologies and recommended best practice.
(1) Guidelines for selecting scientific panel members for DRIFT projects are based upon the well-established
protocols of the Building Block Methodology (King et al., 2000). The roles, responsibilities and interactions
of DRIFT panel members are governed by the step-by-step procedures built into the DRIFT methodology
(see King et al., this issue), and it is not possible for any one member to dominate the workshops or bias
the outcomes of the scenario evaluations.
(2) DRIFT and DRIFT-Fish address clear objectives by evaluating the geomorphological and ecological impli-
cations of alternative scenarios of water management and flow regulation. Some Australian scientific panel
studies have commenced with very general objectives or have not evaluated alternative scenarios of water
resource development, and/or flow restoration (e.g. Thoms et al., 1996; Cottingham et al., 2002). DRIFT, the
Flow Restoration Methodology (Arthington et al., 2000) and the Benchmarking Methodology (Brizga, 2000;
Brizga et al., 2002) all offer a transparent and explicit framework to consider the ecological implications of
many alternative flow scenarios.
(3) Cottingham et al. (2002) noted that many scientific panel assessments are based only on desk-top methods
and ‘best available information’ (often very limited or of ‘poor quality’), or involve little more than a rapid
field assessment and single spatial/temporal ‘snap-shot’ of the river system conducted at sites ‘assumed to be
representative of the river system under consideration’. In contrast, the site selection procedures of DRIFT
have a sound rationale documented by King et al. (this issue). DRIFT-Fish considers the core set of flow-
related aspects of fish biology/ecology outlined in Pusey (1998) and Kennard et al. (2000), and listed above.
It involves seasonal field studies at a series of representative river sites using fish survey techniques and habi-
tat assessment protocols that have been well-tested in Australia and South Africa (Kennard et al., 2000; Pusey
et al, 1998b, 2000; Rall, 1999). DRIFT-Fish assessments are based on the fish data set summarized in Table I
and discussed in more detail below.
(4) The level of confidence in DRIFT-Fish assessments is rated according to the information sources available
and their scientific quality, thus providing the water manager with an explicit means to undertake his/her own
assessment of the risks associated with management actions based on limited or low quality information. The
rating scheme applied in DRIFT-Fish closely resembles that recommended by Downes et al. (this issue) and
adapted by Cottingham et al. (2002) into ‘levels of evidence that support environmental flow assessments’. In
addition to confidence ratings, the application of DRIFT in Lesotho involved several phases of international
peer review, as also proposed by Arthington et al. (1998) in their Best Practice Framework for environmental
flow assessments.
(5) DRIFT-Fish includes a process for evaluating the social consequences of each flow scenario, and thereby a
means to estimate the economic costs of flow regulation in terms of changes in fish resources used by local rural
communities (King et al., this issue). This represents a significant advance of DRIFTover other panel methodol-
ogies, and avoids the charge that ‘scientific panels have only ‘‘green’’ value-systems, and that they are an alter-
native environmental lobby’ (Cottingham et al., 2002). The Flow Restoration Methodology (Arthington et al.,
2000) includes a process for evaluating the ‘cost’ (in terms of water that would be unavailable to other users) of
many different environmental flow scenarios generated by releasing flows from a large dam.
(6) DRIFT-Fish produces a comprehensive literature review and data report describing the study area and its fish
fauna, providing a major reference document and benchmark upon which to base the planning and design of
river restoration activities and future assessments of river condition. In this respect DRIFT and its fish com-
ponent closely resemble the comprehensive reporting procedures of the Building Block Methodology
(Arthington and Long, 1997; Arthington and Lloyd, 1998; King et al., 2000), the Flow Restoration Metho-
dology (Arthington et al., 2000) and the Benchmarking Methodology (Brizga, 2000; Brizga et al., 2002;
Kennard, 2000; Pusey, 2001).
662 A. H. ARTHINGTON ET AL.
Copyright # 2003 John Wiley & Sons, Ltd. River Res. Applic. 19: 641–666 (2003)

(7) Cottingham et al. (2002) did not recommend the incorporation of an explicit monitoring phase as part of scien-
tific panel assessments, although alluding to the principles of adaptive environmental management (Walters,
1986) which are built into most other holistic methodologies (Arthington, 1998; Arthington et al., 1998). All
biotic components of DRIFT are required to provide a detailed rationale and protocol for monitoring the eco-
logical outcomes of environmental flow allocations and water management scenarios (Metsi Consultants,
2000a,b). With regard to the DRIFT-Fish protocol, the predictions of fish responses to each environmental flow
scenario have formed the basis of hypotheses for testing by monitoring and longer-term research. Studies of
the responses of the endangered Maloti minnow to flow are now in progress based on the insights of the DRIFT
fish project and earlier research on this species in Lesotho (J. L. Rall, personal communication, 2002).
In spite of the best intentions of their proponents, there are several risks associated with the use of scientific panel
methods. The first is that frameworks and approaches like DRIFT may be used routinely and become all that is
sought and used, rather than investing in securing new knowledge of river ecology to guide sound decision-making
in the future (Cottingham et al., 2002; King et al., in press). Related to this threat is that best practice standards may
be abandoned to simplify and hasten the assessment process; at least two instances of this ‘watering down of stan-
dards’ are on record in Australia (Cottingham et al., 2002). In each case, budget cuts precluded the conduct of ori-
ginal field work in the river under study, the client perspective being that ‘use of existing information is sufficient’.
Another risk is that the employment of experienced river scientists may be deemed too expensive, or the non-avail-
ability of expertise in a particular country may weaken the application of the method, or the demands placed upon a
few scientists (or the short-cuts required by clients; or failure to implement and monitor recommended environmen-
tal flows) may discourage their further involvement (scenarios forecast in Australia by Cottingham et al., 2002).
The outcomes from application of DRIFT and its fish component, and indeed all scientific panel methods, are
obviously only as sound as their scientific foundations and the quality/quantity of the data upon which decisions
are based. DRIFT as applied to Lesotho rivers was a more intensive and comprehensive process than many docu-
mented environmental flow assessments conducted by scientific panels. DRIFT-Fish considers the core set of flow-
related issues outlined above (Tables I, IV, V and VI), derived from published environmental flow studies and river
research. We suggest that the biological information summarized in Table I represents the minimum data set for
evaluation of these issues during a DRIFT-Fish assessment. If any component of this minimum fish data set is not
available, original field work is essential in the river under study. Pusey et al. (1995a,b, 1998a,b, 2001a,b) describe
methods for the collection of such data from stream and river sites.
It is obvious that the fish component of DRIFT can be strengthened by embedding quantitative methods and
models linking the biological requirements of fish to the hydrological characteristics of rivers. Models such as
PHABSIM (Bovee, 1982; Stalnaker et al., 1994) could be applied in stable bed-rock channels, always remember-
ing that even these methods require a considerable amount of ‘expert judgement’ to interpret model outputs and to
select the most relevant and ecologically sound minimum and optimum flows (Gore et al., 1992). Multivariate
statistical models of the environmental factors and flow attributes influencing fish assemblage structure are proving
useful in the design of environmental flow regimes for fish in Australian rivers (e.g. Kennard et al., 2000; Pusey
et al., 2000). Research has been initiated to integrate a quantitative flood-pulse model of fisheries production in
floodplain rivers into the DRIFT-Fish framework (R. Welcomme, personal communication, 2002). Other research
developments are documented by King et al. (in press).
Although ‘the development of deterministic ecosystem models may be an unrealistic objective because of the
stochastic nature of the driving hydrological and ecological processes and the complexity of biological interac-
tions’ (Petts and Maddock, 1994), progress in this direction should be a fundamental goal for scientists involved
in environmental flow studies. An integrated and interactive package of deterministic biophysical models would be
a vision for the future of frameworks such as DRIFT and other holistic environmental flow methodologies.
CONCLUSIONS
The wide array of methods and frameworks applied around the world to assess the flow requirements of aquatic
biota and recommend flows to protect or restore river ecosystems can be arranged into a three-tiered hierarchy.
Each level of the hierarchy offers methods or frameworks appropriate to particular circumstances and management
FLOW REQUIREMENTS FOR FISH 663
Copyright # 2003 John Wiley & Sons, Ltd. River Res. Applic. 19: 641–666 (2003)

objectives, spatial and temporal scales of investigation, resources available, knowledge base and expertise. DRIFT
(Downstream Response to Imposed Flow Transformations) represents Level 2 in this three-tiered hierarchy of envir-
onmental flow methods, that is, a compromise between the use of hydrological methods with limited ecological
foundations (Level 1), and the provision of scientific advice based on long-term research and predictive models
(Level 3). DRIFT and similar frameworks can provide environmental flow recommendations of far greater scientific
resolution than hydrological methods, by integrating many types of information and models relating the responses
of riverine biota to flow modifications. DRIFT and its fish component compare favourably with recommended best
practice for Australian scientific panel assessments of the flow requirements of river ecosystems.
The procedures of the DRIFT methodology and its fish component are transferable and applicable to many river
systems, provided that the minimum data set describing distributions, abundance, habitat preferences, reproduction
and diet are available for the fish of the study river. If any component of this minimum fish data set is not available
in reports or publications, original field work is deemed essential.
The gravest risk associated with the use of scientific panel approaches like DRIFT is that they may be used
routinely and become all that is sought and used, rather than investing in securing new knowledge of river ecology
to guide sound decision-making in the future (i.e. moving from Level 2 to Level 3 of the methods hierarchy).
Accordingly, we caution that DRIFT and other scientific panel methods should only be used where there is a gen-
uine commitment to implement and monitor the recommended environmental flows, to support knowledge devel-
opment, and to adapt water management strategies when better information about the river’s responses to flow
modification becomes available through monitoring and research.
In other words, the use of scientific panel methods such as DRIFT may often be necessary due to knowledge
gaps and time constraints, but is not sufficient if our goal is to ensure the long-term protection of river ecosystems.
ACKNOWLEDGEMENTS
This study was funded by the Lesotho Highlands Development Authority, Lesotho, Southern Africa, and Metsi
Consultants via Lesotho Highlands Water Project Contract No. LHDA 648. We wish to thank Dr Hossein Sabet
of SMEC (Snowy Mountains Engineering Corporation) International (Australia) and Drs Jackie King and Cate
Brown of Southern Waters Ecological Research and Consulting Pty (Ltd), Cape Town, South Africa, for their lea-
dership, support and encouragement throughout the project. We also acknowledge the insights gained from col-
leagues on the biophysical study team, and from members of the Panel of Experts who advised throughout the
project. Griffith University also provided support. We thank Professor Geoff Petts, Dr Jackie King, Rebecca
Tharme, Steve Mackay and unknown reviewers, who all made helpful comments on the manuscript.
REFERENCES
Anon. 1996. Expert Panel on Air Quality Standards. Nitrogen Dioxide. Department of Environment: London.
Arthington AH. 1998. Comparative Evaluation of Environmental Flow Assessment Techniques: Review of Holistic Methodologies. Occasional
Paper 26/98. Land and Water Resources Research and Development Corporation: Canberra.
Arthington AH, Lloyd R (eds). 1998. Logan River Trial of the Building Block Methodology for Assessing Environmental Flow Requirements:
Workshop Report. Centre for Catchment and In-Stream Research and Department of Natural Resources: Brisbane.
Arthington AH, Long GC (eds). 1997. Logan River Trial of the Building Block Methodology for Assessing Environmental Flow Requirements:
Background Papers. Centre for Catchment and In-Stream Research and Department of Natural Resources: Brisbane.
Arthington AH, Pusey BJ. 1993. In-stream flow management in Australia: methods, deficiencies and future directions. Australian Biologist 6: 52–60.
Arthington AH, Zalucki JM (eds). 1998. Comparative Evaluation of Environmental Flow Assessment Techniques: Review of Methods. Occa-
sional Paper 27/98. Land and Water Resources Research and Development Corporation: Canberra.
Arthington AH, Bunn SE, Pusey BJ, Bluhdorn DR, King JM, Day JA, Tharme RE, O’Keeffe JH. 1992. Development of an holistic approach for
assessing environmental flow requirements of riverine ecosystems. In Proceedings of an International Seminar and Workshop on Water Allo-
cation for the Environment, Pigram JJ, Hooper BP (eds). Centre for Water Policy Research, University of New England: Armidale, Australia.
Arthington AH, Brizga SO, Kennard MJ. 1998. Comparative Evaluation of Environmental Flow Assessment Techniques: Best Practice Frame-
work. Occasional Paper 25/98. Land and Water Resources Research and Development Corporation: Canberra.
Arthington AH, Brizga SO, Choy SC, Kennard MJ, Mackay SJ, McCosker RO, Ruffini JL, Zalucki JM. 2000. Environmental Flow Require-
ments of the Brisbane River Downstream from Wivenhoe Dam. South East. Queensland Water Corporation and Centre for Catchment and In-
Stream Research: Brisbane.
Bovee KD. 1982. A Guide to Stream Habitat Analysis using the Instream Flow Incremental Methodology. Instream Flow Information Paper 21.
FWS/OBS-82/26. US Department of Fisheries and Wildlife Services: Washington, DC.
664 A. H. ARTHINGTON ET AL.
Copyright # 2003 John Wiley & Sons, Ltd. River Res. Applic. 19: 641–666 (2003)

Bovee KD. 1986. Development of Habitat Suitability Criteria for Use in the Instream Flow Incremental Methodology. US Fish and Wildlife
Service Biological Report 86(7). US Fish and Wildlife Service: Washington, DC.
Brizga SO. 2000. Burnett Basin Water Allocation Management Plan: Proposed Environmental Flow Performance Measures, Volumes 1 and 2.
Department of Natural Resources: Brisbane.
Brizga SO, Arthington AH, Pusey BJ, Kennard MJ, Mackay SJ, Werren GL, Craigie NM, Choy SJ. 2002. Benchmarking, a ‘top-down’ meth-
odology for assessing environmental flows in Australian rivers. ENVIRO FLOWS 2002. Proceedings of the International Conference of
Environmental Flows for River Systems, incorporating the 4th International Ecohydraulics Symposium. Southern Waters Ecological
Research & Consulting (Pty) Ltd., Cape Town: South Africa.
Brown CA, Sparks A, Howard G. 2000. Palmiet River Instream Flow Assessment: Instream Flow Requirement for the riverine ecosystem. In
Proceedings of the IFR Workshop and Determination of Associated Dam Yields. Southern Waters Report No. G400-00-0499 to the South
African Department of Water Affairs and Forestry: Pretoria, South Africa.
Bunn SE, Arthington AH. 2002. Principles and ecological consequences of altered hydrological regimes for aquatic biodiversity. Environmental
Management 30: 492–507.
Cambray JA. 1984. Early ontogeny of Labeo capensis (Pisces: Cyprinidae). South African Journal of Zoology 20: 190–196.
Cottingham P, Hannan G, Hillman T, Koehn J, Metzling L, Roberts J, Rutherford I. 1991. Report of the Ovens Scientific Panel on the Environ-
mental Condition and Flows in the Ovens River. Technical Report 9/2001. Cooperative Research Centre for Freshwater Ecology: Canberra.
Cottingham P, Thoms MC, Quinn GP. 2002. Scientific panels and their use in environmental flow assessment in Australia. Australian Journal of
Water Resources 5: 103–111.
Downes B, Barmuta L, Fairweather P, Faith DP, Keought MJ, Lake PS, Mapstone BD, Quinn GP. 2002. Monitoring Ecological Impacts:
Concepts and Practice in Flowing Waters. Cambridge University Press: Cambridge.
Dunbar MJ, Gustard A, Acreman M, Elliott CRN. 1998. Overseas Approaches to Setting River Flow Objectives. R&D Technical Report
W6B(96)4. Institute of Hydrology: Wallingford.
French TD, Chambers PA. 1997. Reducing flows in the Nechako River (British Columbia, Canada): potential response of the macrophyte com-
munity. Canadian Journal of Fisheries and Aquatic Sciences 54: 2247–2254.
Gehrke PC, Brown P, Schiller CB, Moffatt DB, Bruce AM 1995. River regulation and fish communities in the Murray-Darling River system,
Australia. Regulated Rivers: Research and Management 11: 363–375.
Gordon ND, McMahon TA, Finlayson BL. 1992. Stream Hydrology: An Introduction for Ecologists. John Wiley: Chichester.
Gore JA, Layzer JB, Russell IA. 1992. Non-traditional applications of in-stream flow techniques for conserving habitat of biota in the Sabie
River of Southern Africa. In River Conservation and Management, Boon PJ, Calow P, Petts GE (eds). John Wiley: Chichester; 161–178.
Groshens TP, Orth DJ. 1994. Transferability of habitat suitability criteria for smallmouth bass, Micropterus dolomieu. Rivers 4: 194–212.
Hill MT, Platts S, Beschta RL. 1991. Ecological and geomorphological concepts for instream and out-of-channel flow requirements.Rivers 2: 198–210.
Jones J, Hunter D. 1995. Consensus methods for medical and health services research. British Medical Journal 311: 376–380.
Jowett IG. 1997. Instream flow methods: a comparison of approaches. Regulated Rivers: Research and Management 13: 115–127.
Junk WJ, Bayley PB, Sparks RE. 1989. The flood-pulse concept in river-floodplain systems. In Proceedings of the International Large River
Symposium (LARS), Dodge DP (ed.). Canadian Journal of Fisheries and Aquatic Sciences Special Publication 106: 110–127.
Kennard MJ. 2000. Freshwater fish. In Burnett Basin WAMP: Current Environmental Conditions and Impacts of Water Resource Development,
Volume II(b). Brizga S, Arthington A, Choy S, Duivenvoorden L, Kennard M, Maynard R, Poplawski W (eds). Queensland Government
Natural Resources and Mines: Brisbane; Appendix G.
Kennard M, Arthington AH, Thompson C. 2000. Flow requirements of freshwater fish. In Environmental Flow Requirements of the Brisbane
River Downstream from Wivenhoe Dam. South East Queensland Water Corporation and Centre for Catchment and In-Stream Research:
Brisbane; 265–330.
King J, Louw D. 1998. Instream flow assessments for regulated rivers in South Africa using the Building Block Methodology. Aquatic Eco-
system Health and Management 1: 109–124.
King JM, Tharme RE. 1994. Assessment of the Instream Flow Incremental Methodology and Initial Development of Alternative Instream Flow
Methodologies for South Africa. Water Research Commission Report No. 295/1/94. Water Research Commission: Pretoria, South Africa.
King JM, Cambray JA, Dean Impson N. 1998. Linked effects of dam-released floods and water temperature on spawning of the Clanwilliam
yellowfish Barbus capensis. Hydrobiologia 384: 245–265.
King JM, Tharme RE, de Villiers MS (eds). 2000. Environmental Flow Assessments for Rivers: Manual for the Building Block Methodology.
Water Research Commission Technology Transfer Report No. TT131/00. Water Research Commission: Pretoria, South Africa.
King J, Brown C, Sabet H. 2003. A scenario-based holistic approach to environmental flow assessments for rivers. River Research and Applica-
tions 19: 619–639.
Loneragan NR, Bunn SE. 1999. River flows and estuarine ecosystems: implications for coastal fisheries from a review and a case study of the
Logan River, southeast Queensland. Australian Journal of Ecology 24: 431–440.
Metsi Consultants. 2000a. Consulting Services for the Establishment and Monitoring of the Instream Flow Requirements for River Courses
Downstream of LHWP dams. IFR Methodology Report No. 648-F-03 (Volume 2) (authors Brown C, King J). Lesotho Highlands Develop-
ment Authority Contract 648: Maseru, Lesotho.
Metsi Consultants. 2000b. Consulting Services for the Establishment and Monitoring of the Instream Flow Requirements for River Courses
Downstream of LHWP dams. Fish. Report No. 648-F-18 (authors Arthington A, Rall J, Kennard M). Lesotho Highlands Development
Authority Contract 648: Maseru, Lesotho.
National Health and Medical Research Council. 1994. General Guidelines for Medical Practitioners on Providing Information to Patients.
National Health and Medical Research Council: Canberra.
FLOW REQUIREMENTS FOR FISH 665
Copyright # 2003 John Wiley & Sons, Ltd. River Res. Applic. 19: 641–666 (2003)

Niehaus BH, Steyn GJ, Rall JL. 1997. Habitat preference and population structure of the rock catfish (Austroglanis sclateri) in the Senqunyane
River, Lesotho. Water South Africa 23: 405–410.
O’Brien JS. 1987. A case study of minimum streamflow for fishery habitat in the Yampa River. In Sediment Transport in Gravel-Bed Rivers,
Thorne CR, Bathurst JC, Hey RD (eds). John Wiley: Chichester; 921–946.
Pettit NE, Froend RH, Davies PM. 2001. Identifying the natural flow regime and the relationship with riparian vegetation for two contrasting
Western Australian rivers. Regulated Rivers: Research and Management 17: 201–215.
Petts GE, Maddock I. 1994. Flow allocation for in-river needs. In River Restoration, Petts G, Calow P (eds). Blackwell Science: Oxford; 60–79.
Poff NL, Ward JV. 1989. Implications of streamflow variability and predictability for lotic community structure: a regional analysis of stream
flow patterns. Canadian Journal of Fisheries and Aquatic Sciences 46: 1805–1818.
Poff NL, Allan JD, Bain MB, Karr JR, Prestegaard KI, Richter BD, Sparks RE, Stromberg JC. 1997. The natural flow regime a paradigm for
river conservation and restoration. BioScience 47: 769–784.
Puckridge JT, Sheldon F, Walker KF, Boulton AJ. 1998. Flow variability and the ecology of large rivers. Marine and Freshwater Research 49: 55–72.
Pusey BJ. 1998. Methods addressing the flow requirements of fish. In Comparative Evaluation of Environmental Flow Assessment Techniques:
Review of Methods, Arthington AH, Zalucki JM (eds). Occasional Paper 27/98. Land and Water Resources Research and Development Cor-
poration: Canberra; 64–103.
Pusey BJ. 2001. Fish. Pioneer Valley Water Resource Plan: Current Environmental Condition and Impacts of Existing Water Resource Devel-
opment. Volume II. Queensland Government Natural Resources and Mines: Brisbane.
Pusey BJ, Arthington AH, Read MG. 1995a. Species richness and spatial variation in fish assemblage structure in two rivers of the Wet Tropics
of Northern Queensland, Australia. Environmental Biology of Fishes 42: 181–199.
Pusey BJ, Read MG, Arthington AH. 1995b. The feeding ecology of freshwater fishes in two rivers of the Australian Wet Tropics. Environ-
mental Biology of Fishes 43: 85–103.
Pusey BJ, Arthington AH, Read MG. 1998a. Freshwater fishes of the Burdekin River, Australia: biogeography, history and spatial variation in
assemblage structure. Environmental Biology of Fishes 53: 303–318.
Pusey BJ, Kennard MJ, Arthur JM, Arthington AH. 1998b. Quantitative sampling of stream fish assemblages: single- versus multiple pass
electrofishing. Australian Journal of Ecology 23: 365–374.
Pusey BJ, Kennard MJ, Arthington AH. 2000. Discharge variability and the development of predictive models relating stream fish assemblage
structure to habitat in north-eastern Australia. Ecology of Freshwater Fishes 9: 30–50.
Pusey BJ, Arthington AH, Bird J, Close PG. 2001a. Reproduction in three species of rainbowfishes (Melanotaeniidae) from rainforest streams in
north-eastern Queensland, Australia. Ecology of Freshwater Fish 10: 75–87.
Pusey BJ, Close PG, Arthington AH, Bird J. 2001b. Larval fishes in north-eastern Australian rainforest streams: patterns of abundance and
microhabitat use. Proceedings of the Royal Society of Queensland 110: 27–46.
Rall JL. 1999. Development of a conservation program on Pseudobarbus quathlambae in the catchment area of phase 1B of the Lesotho High-
lands Water Project. PhD Thesis, Rand Afrikaans University.
Richter BD, Baumgartner JV, Powell J, Braun DP. 1996. A method for assessing hydrologic alteration within ecosystems. Conservation Biology
10: 1–12.
Richter BD, Baumgartner JV, Wigington R, Braun DP. 1997. How much water does a river need? Freshwater Biology 37: 231–249.
Roe E, Van Eeten M. 2001. Threshold-based resource management: a framework for comprehensive ecosystem management. Environmental
Management 27: 195–214.
Skelton PH. 1993. A Complete Guide to Freshwater Fishes of Southern Africa. Southern Book Publishers: Halfway House.
Stalnaker CB, Arnette SC. 1976. Methodologies for the Determination of Stream Resource Flow Requirements: An Assessment. US Fish and
Wildlife Services, Office of Biological Sciences Western Water Association.
Stalnaker C, Lamb BL, Henriksen J, Bovee K, Bartholow J. 1994. The Instream Incremental Methodology: A Primer for IFIM. Biological
Report 29. US Department of the Interior, National Biological Service: Washington, DC.
Tennant DL. 1976. Instream flow requirements for fish, wildlife, recreation and related environmental resources. Fisheries 1: 6–10.
Tharme RE. 1996. Review of the International Methodologies for the Quantification of the Instream Flow Requirements of Rivers. Report to the
South African Department of Water Affairs and Forestry. Freshwater Ecology Unit, University of Cape Town: Rondebosch.
Tharme RE. 2003. A global perspective on environmental flow assessment: emerging trends in the development and application of environ-
mental flow methodologies for rivers. River Research and Applications.
Thoms MC, Sheldon F, Roberts J, Harris J, Hillman TJ. 1996. Scientific Panel Assessment of Environmental Flows for the Barwon-Darling
River. New South Wales Department of Land and Water Conservation: Sydney.
Walker KF, Thoms MC. 1993. Environmental effects of flow regulation on the River Murray, South Australia. Regulated Rivers: Research and
Management 8: 103–119.
Walters CJ. 1986. Adaptive Management of Renewable Resources. MacMillan Publishing: New York.
Ward JV, Standford JA. 1995. Ecological connectivity in alluvial river ecosystems and its disruption by flow regulation. Regulated Rivers
Research and Management 11: 105–119.
Williamson SC, Bartholow JM, Stalnaker CB. 1993. Conceptual model for quantifying pre-smolt production from flow-dependent physical
habitat and water temperature. Regulated Rivers: Research and Management 8: 15–28.
666 A. H. ARTHINGTON ET AL.
Copyright # 2003 John Wiley & Sons, Ltd. River Res. Applic. 19: 641–666 (2003)
Copyright © 2022 FDOKUMEN