Environmental assessment of the Alaskan continental ... - ARLIS.org
680
Environmental Assessment of the Alaskan Continental Shelf Final Reports of Principal Investigators Volume 14. Biological Studies U.S. DEPARTMENT OF COMMERCE National Oceanic & Atmospheric Administration Office of Marine Pollution Assessment
-
Upload
khangminh22 -
Category
Documents
-
view
8 -
download
0
Transcript of Environmental assessment of the Alaskan continental ... - ARLIS.org
EnvironmentalAssessmentof theAlaskanContinental Shelf
Final Reports of Principal InvestigatorsVolume 14. Biological Studies
U.S. DEPARTMENT OF COMMERCENational Oceanic & Atmospheric AdministrationOffice of Marine Pollution Assessment
EnvironmentalAssessmentof theAlaskanContinental Shelf
Final Reports of Principal InvestigatorsVolume14. Biological Studies
U.S. DEPARTMENT OF COMMERCENational Oceanic & Atmospheric Administration
Office of Marine Pollution Assessment
U.S. DEPARTMENT OF INTERIORBureau of Land Management
November 1981
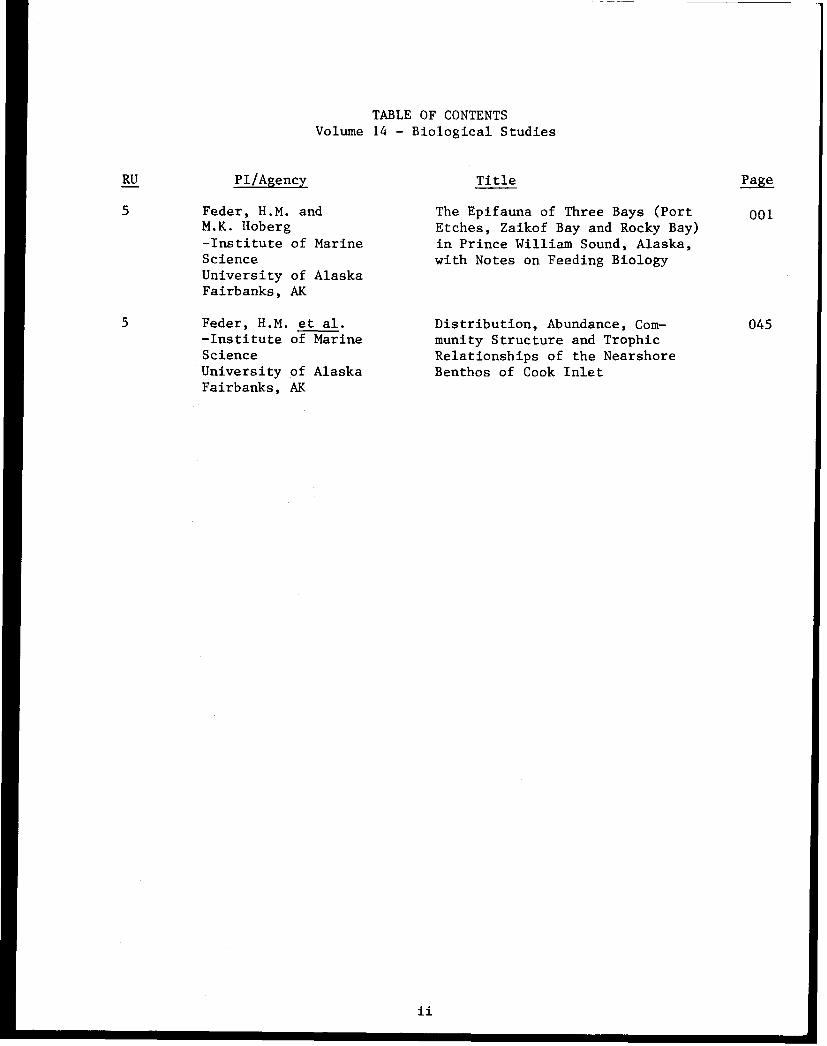
TABLE OF CONTENTSVolume 14 - Biological Studies
RU PI/Agency Title Page
5 Feder, H.M. and The Epifauna of Three Bays (Port 001M.K. Hoberg Etches, Zaikof Bay and Rocky Bay)-Institute of Marine in Prince William Sound, Alaska,Science with Notes on Feeding BiologyUniversity of AlaskaFairbanks, AK
5 Feder, H.M. et al. Distribution, Abundance, Com- 045-Institute of Marine munity Structure and TrophicScience Relationships of the NearshoreUniversity of Alaska Benthos of Cook InletFairbanks, AK
ii
The facts, conclusions and issues appearing in these reports are
based on interim results of an Alaskan environmental studies program managed
by the Outer Continental Shelf Environmental Assessment Program (OCSEAP) of
the National Oceanic amd Atmospheric Administration (NOAA), U.S. Departmentof Commerce, and primarily funded by the Bureau of Land Management (BLM),U.S. Department of Interior, through interagency agreement.
DISCLAIMER
Mention of a commercial company or product does not constitutean endorsement by National Oceanic and Atmospheric Administration. Usefor publicity or advertising purposes of information from this publicationconcerning proprietary products or the tests of such products is notauthorized.
iii
FINAL REPORT
THE EPIFAUNA OF THREE BAYS (PORT ETCHES, ZAIKOF BAY AND ROCKY BAY) INPRINCE WILLIAM SOUND, ALASKA, WITH NOTES ON FEEDING BIOLOGY
Howard M. Feder
and
Max K. Hoberg
Institute of Marine ScienceUniversity of AlaskaFairbanks, Alaska 99701
March 1980
I
ACKNOWLEDGEMENTS
We would like to thank the following for assistance during this study:Rick Rosenthal for use of the M/V Searcher, Tom Rosenthal for shipboardassistance; University of Alaska, Institute of Marine Science personnelMarcia Boyette and Robert Sutherland for assistance in data processing,Kristy McCumby and Steve McGee for assistance in food analysis, Ana LeaVincent for drafting, and Helen Stockholm and the Publications Departmentfor valuable assistance. We would also like to thank Stephen C. Jewettfor editorial comments on the manuscript. Dr. D. L. Pawson of the Smith-sonian Institution identified the holothurian material.
This study was supported under contract No. 03-5-022-56 between theUniversity of Alaska and NOAA, Department of Commerce through the OuterContinental Shelf Environmental Assessment Program to which funds wereprovided by the Bureau of Land Management, Department of Interior.
2
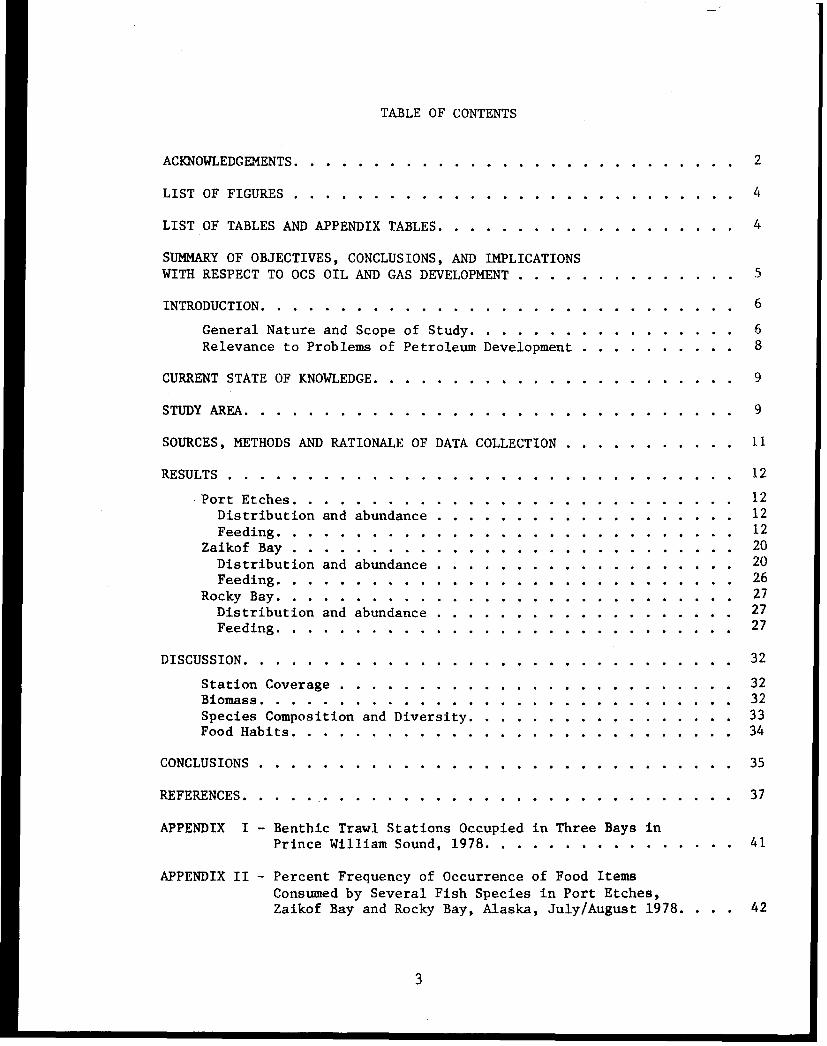
TABLE OF CONTENTS
ACKNOWLEDGEMENTS. . . . . . . . . . . . . . . . . . . . . . . . . . 2
LIST OF FIGURES . . . . . . . . . . . . . . . . ... . . . . . . . ............ 4
LIST OF TABLES AND APPENDIX TABLES. . . . . . . . . . . . . . . . . . . 4
SUMMARY OF OBJECTIVES, CONCLUSIONS, AND IMPLICATIONSWITH RESPECT TO OCS OIL AND GAS DEVELOPMENT . . . . . . . . . . . ... .5
INTRODUCTION. . . . . . . . . . . . . . . . . . . . . . . . . . ........... 6
General Nature and Scope of Study. . . . . . . . . . . . . . . . . 6Relevance to Problems of Petroleum Development . . . . . . . . . . 8
CURRENT STATE OF KNOWLEDGE. ... . . . . . . . . . . . . .. . . ... 9
STUDY AREA. . . . . . . . . . . . . . . . . ... . . . . . . . . . . ........ 9
SOURCES, METHODS AND RATIONALE OF DATA COLLECTION . . . . . . . . . . . 11
RESULTS . . . . . . . . . . . . . . . . . . . . . . . . . . . . . .. . 12
Port Etches. . . . . . . . . . . . . . . . . ... . . . . . . .. .. 12Distribution and abundance ................... . 12Feeding. . . . . . . . . . . . . . . . . ... . . . . . . .. .. 12
Zaikof Bay ............................ 20Distribution and abundance ................... . 20Feeding. . . . . . . . . . . . . . . . . ... . . . . . . .. .. 26
Rocky Bay. . . . . . . . . . . . . . . . . ... . . . . . . . .. .. 27Distribution and abundance ................... . 27Feeding. . . . . . . . . . . . . . . . . ... . . . . . . .. .. 27
DISCUSSION. . . . . . . . . . . . . . . . . ... . . . . . . . . . . . . 32
Station Coverage ................... ...... 32Biomass. . . . . . . . . . . . . . . . . ... . . . . . . . . .. .. 32Species Composition and Diversity. . . . . . . . . . . . .. ... .33Food Habits. . . . . . . . . . . . . . . . . ... . . . . . . .. .. 34
CONCLUSIONS ................... .......... . 35
REFERENCES. . . . . . . . . . . . . . . . . ... . . . . . . . . . . . . 37
APPENDIX I - Benthic Trawl Stations Occupied in Three Bays inPrince William Sound, 1978. . . . . . . . . . . . .... .41
APPENDIX II - Percent Frequency of Occurrence of Food ItemsConsumed by Several Fish Species in Port Etches,Zaikof Bay and Rocky Bay, Alaska, July/August 1978. . . . 42
3
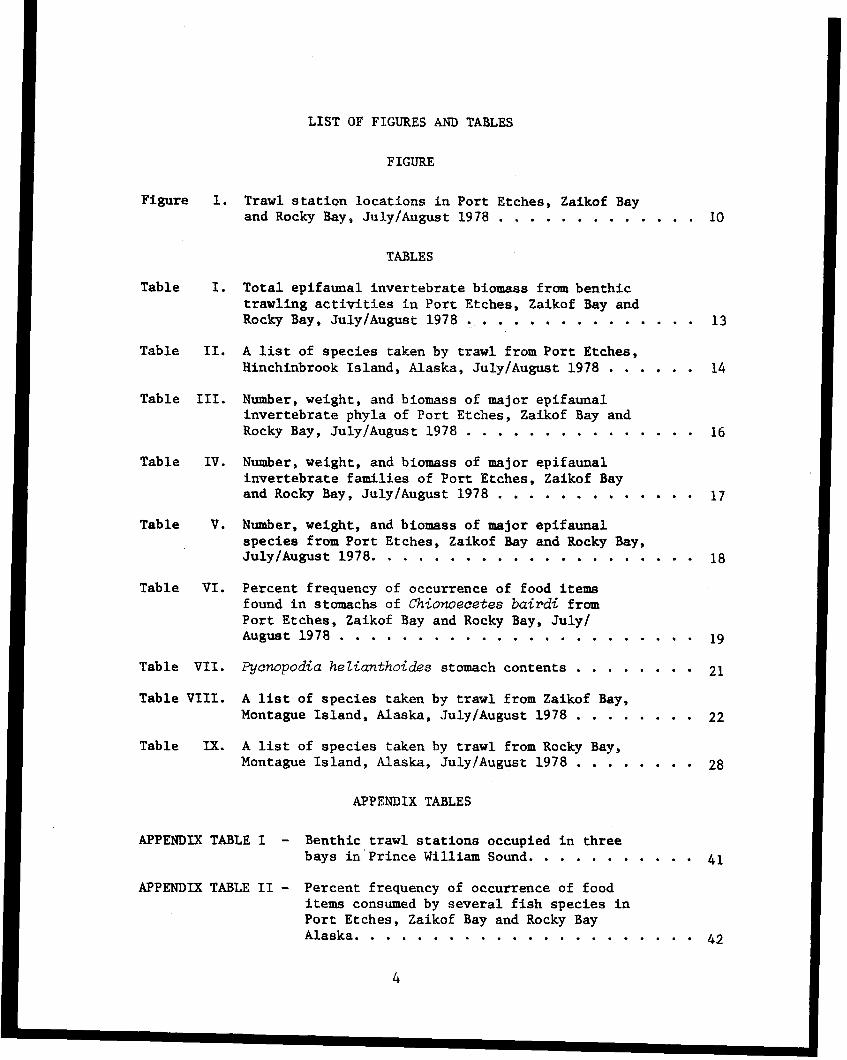
LIST OF FIGURES AND TABLES
FIGURE
Figure 1. Trawl station locations in Port Etches, Zaikof Bayand Rocky Bay, July/August 1978 . . . . . . . . . . ... .10
TABLES
Table I. Total epifaunal invertebrate biomass from benthictrawling activities in Port Etches, Zaikof Bay andRocky Bay, July/August 1978 . . . . . . . . . . . ... .13
Table II. A list of species taken by trawl from Port Etches,Hinchinbrook Island, Alaska, July/August 1978 . . . ... .14
Table III. Number, weight, and biomass of major epifaunalinvertebrate phyla of Port Etches, Zaikof Bay andRocky Bay, July/August 1978 . . . . . . . . . . .... . . 16
Table IV. Number, weight, and biomass of major epifaunalinvertebrate families of Port Etches, Zaikof Bayand Rocky Bay, July/August 1978 . . . . . . . . . . . .. 17
Table V. Number, weight, and biomass of major epifaunalspecies from Port Etches, Zaikof Bay and Rocky Bay,July/August 1978. . . . . . . . . . . . . . . ..... ... 18
Table VI. Percent frequency of occurrence of food itemsfound in stomachs of Chionoecetes bairdi fromPort Etches, Zaikof Bay and Rocky Bay, July/August 1978 . . . . . . . . . . . . . . . . . . . . . . 19
Table VII. Pycnopodia helianthoides stomach contents . . . . . . . . 21
Table VIII. A list of species taken by trawl from Zaikof Bay,Montague Island, Alaska, July/August 1978 . ....... 22
Table IX. A list of species taken by trawl from Rocky Bay,Montague Island, Alaska, July/August 1978 . ....... 28
APPENDIX TABLES
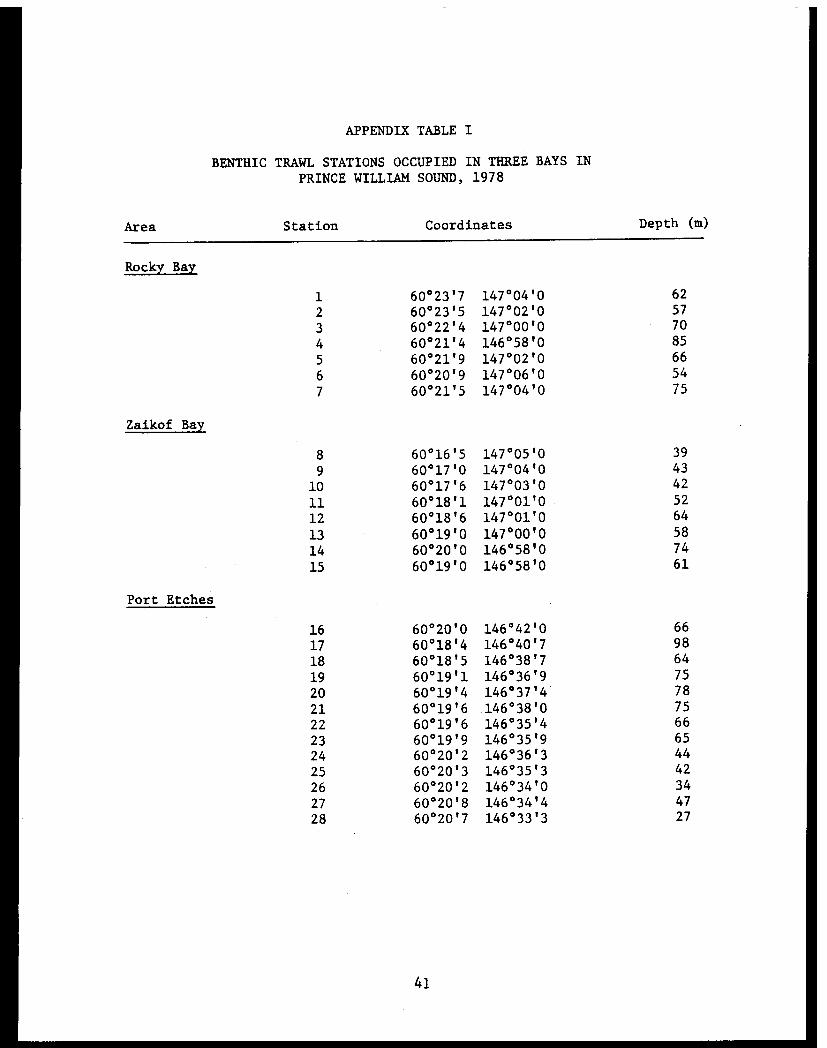
APPENDIX TABLE I - Benthic trawl stations occupied in threebays in Prince William Sound. .......... 41
APPENDIX TABLE II - Percent frequency of occurrence of fooditems consumed by several fish species inPort Etches, Zaikof Bay and Rocky BayAlaska. . .................. .. 42
4
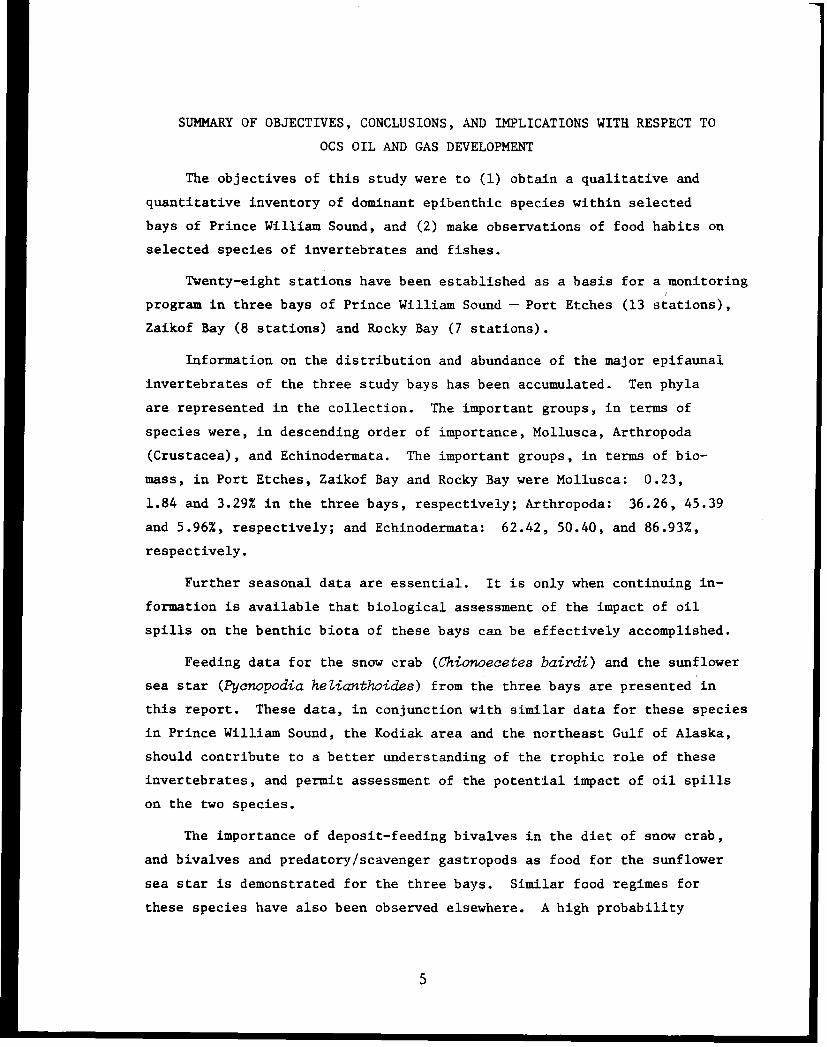
SUMMARY OF OBJECTIVES, CONCLUSIONS, AND IMPLICATIONS WITH RESPECT TO
OCS OIL AND GAS DEVELOPMENT
The objectives of this study were to (1) obtain a qualitative and
quantitative inventory of dominant epibenthic species within selected
bays of Prince William Sound, and (2) make observations of food habits on
selected species of invertebrates and fishes.
Twenty-eight stations have been established as a basis for a monitoring
program in three bays of Prince William Sound - Port Etches (13 stations),
Zaikof Bay (8 stations) and Rocky Bay (7 stations).
Information on the distribution and abundance of the major epifaunal
invertebrates of the three study bays has been accumulated. Ten phyla
are represented in the collection. The important groups, in terms of
species were, in descending order of importance, Mollusca, Arthropoda
(Crustacea), and Echinodermata. The important groups, in terms of bio-
mass, in Port Etches, Zaikof Bay and Rocky Bay were Mollusca: 0.23,
1.84 and 3.29% in the three bays, respectively; Arthropoda: 36.26, 45.39
and 5.96%, respectively; and Echinodermata: 62.42, 50.40, and 86.93%,
respectively.
Further seasonal data are essential. It is only when continuing in-
formation is available that biological assessment of the impact of oil
spills on the benthic biota of these bays can be effectively accomplished.
Feeding data for the snow crab (Chionoecetes bairdi) and the sunflower
sea star (Pyanopodia helianthoides) from the three bays are presented in
this report. These data, in conjunction with similar data for these species
in Prince William Sound, the Kodiak area and the northeast Gulf of Alaska,
should contribute to a better understanding of the trophic role of these
invertebrates, and permit assessment of the potential impact of oil spills
on the two species.
The importance of deposit-feeding bivalves in the diet of snow crab,
and bivalves and predatory/scavenger gastropods as food for the sunflower
sea star is demonstrated for the three bays. Similar food regimes for
these species have also been observed elsewhere. A high probability
5

exists that hydrocarbons will enter crabs and sea stars via deposit feed-
ing, predatory and scavenging molluscs. It is suggested that studies
which examine the relationships between sediment, oil, prey species and
predators be initiated.
The sampling of invertebrates and vertebrates using trawls, and stom-
ach analyses of some of these organisms, has made it possible to better
understand the epifaunal component of three Prince William Sound bays.
Available data indicate adequate numbers of unique, abundant, and/or
conspicuous species for monitoring environmental conditions in the three
bays. A monitoring program should be based primarily on recruitment,
growth, food habits and reproduction of the specific species.
INTRODUCTION
General Nature and Scope of Study
Activities connected with oil transport in Prince William Sound and
the possible usage of Port Etches, Zaikof Bay and Rocky Bay as emergency
anchorages for tankers, present a wide spectrum of potential dangers to
the marine environment (see Olson and Burgess, 1967, for general discus-
sion of marine pollution problems). Adverse effects on the environment
of Prince William Sound cannot be assessed, or even predicted, unless back-
ground data are recorded prior to industrial development (see Lewis, 1970;
Pearson, 1971, 1972, 1975, 1980; Nelson-Smith, 1973; Rosenberg, 1973, for
discussions). Insufficient long-term information about a particular en-
vironment and the basic biology of species present can lead to erroneous
interpretations of changes that might occur if the area becomes altered
(see Pearson, 1971, 1972; Nelson-Smith, 1973; Rosenberg, 1973, for general
discussions on benthic biological investigations in industrialized marine
areas). Populations of benthic marine species may fluctuate over a time
span of a few to as many as 30 or more years (Lewis, 1970).
Benthic organisms (primarily the infauna and sessile and slow-moving
epifauna) are useful as indicator species because they tend to remain in
place, typically react to long-range environmental changes, and by their
6
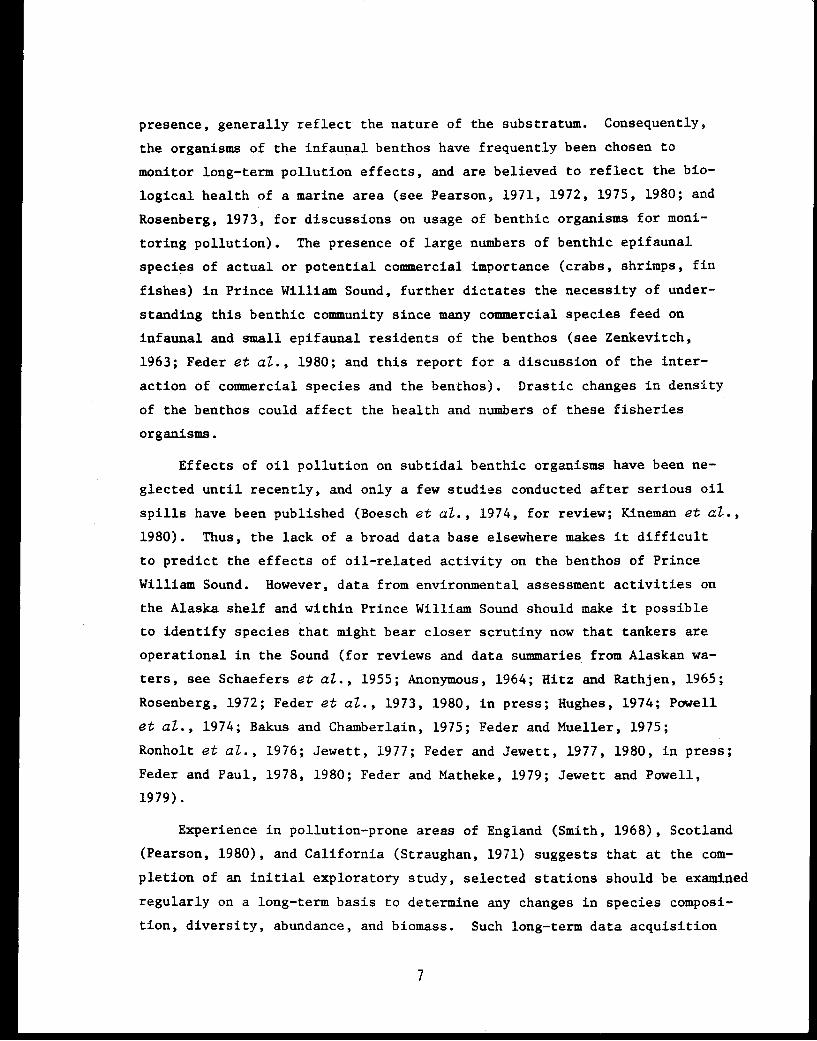
presence, generally reflect the nature of the substratum. Consequently,
the organisms of the infaunal benthos have frequently been chosen to
monitor long-term pollution effects, and are believed to reflect the bio-
logical health of a marine area (see Pearson, 1971, 1972, 1975, 1980; and
Rosenberg, 1973, for discussions on usage of benthic organisms for moni-
toring pollution). The presence of large numbers of benthic epifaunal
species of actual or potential commercial importance (crabs, shrimps, fin
fishes) in Prince William Sound, further dictates the necessity of under-
standing this benthic community since many commercial species feed on
infaunal and small epifaunal residents of the benthos (see Zenkevitch,
1963; Feder et al., 1980; and this report for a discussion of the inter-
action of commercial species and the benthos). Drastic changes in density
of the benthos could affect the health and numbers of these fisheries
organisms.
Effects of oil pollution on subtidal benthic organisms have been ne-
glected until recently, and only a few studies conducted after serious oil
spills have been published (Boesch et al., 1974, for review; Kineman et al,
1980). Thus, the lack of a broad data base elsewhere makes it difficult
to predict the effects of oil-related activity on the benthos of Prince
William Sound. However, data from environmental assessment activities on
the Alaska shelf and within Prince William Sound should make it possible
to identify species that might bear closer scrutiny now that tankers are
operational in the Sound (for reviews and data summaries from Alaskan wa-
ters, see Schaefers et al., 1955; Anonymous, 1964; Hitz and Rathjen, 1965;
Rosenberg, 1972; Feder et al., 1973, 1980, in press; Hughes, 1974; Powell
et al., 1974; Bakus and Chamberlain, 1975; Feder and Mueller, 1975;
Ronholt et al., 1976; Jewett, 1977; Feder and Jewett, 1977, 1980, in press;
Feder and Paul, 1978, 1980; Feder and Matheke, 1979; Jewett and Powell,
1979).
Experience in pollution-prone areas of England (Smith, 1968), Scotland
(Pearson, 1980), and California (Straughan, 1971) suggests that at the com-
pletion of an initial exploratory study, selected stations should be examined
regularly on a long-term basis to determine any changes in species composi-
tion, diversity, abundance, and biomass. Such long-term data acquisition
7
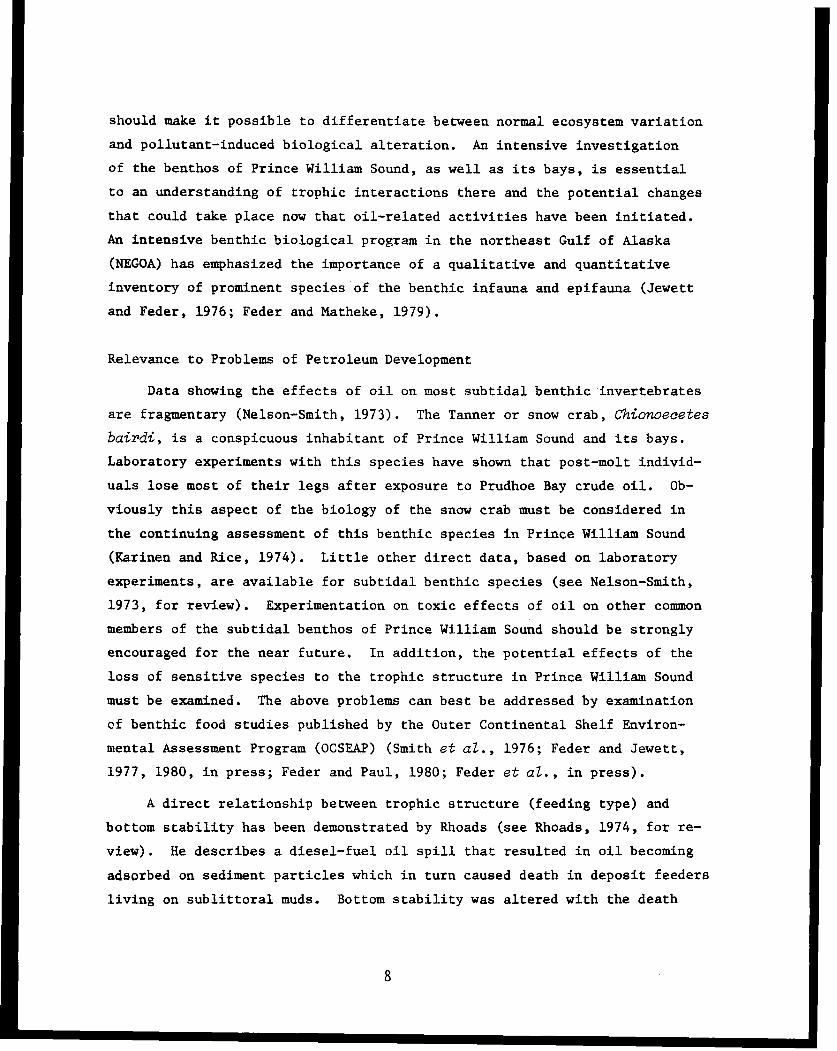
should make it possible to differentiate between normal ecosystem variation
and pollutant-induced biological alteration. An intensive investigation
of the benthos of Prince William Sound, as well as its bays, is essential
to an understanding of trophic interactions there and the potential changes
that could take place now that oil-related activities have been initiated.
An intensive benthic biological program in the northeast Gulf of Alaska
(NEGOA) has emphasized the importance of a qualitative and quantitative
inventory of prominent species of the benthic infauna and epifauna (Jewett
and Feder, 1976; Feder and Matheke, 1979).
Relevance to Problems of Petroleum Development
Data showing the effects of oil on most subtidal benthic invertebrates
are fragmentary (Nelson-Smith, 1973). The Tanner or snow crab, Chionoecetes
bairdi, is a conspicuous inhabitant of Prince William Sound and its bays.
Laboratory experiments with this species have shown that post-molt individ-
uals lose most of their legs after exposure to Prudhoe Bay crude oil. Ob-
viously this aspect of the biology of the snow crab must be considered in
the continuing assessment of this benthic species in Prince William Sound
(Karinen and Rice, 1974). Little other direct data, based on laboratory
experiments, are available for subtidal benthic species (see Nelson-Smith,
1973, for review). Experimentation on toxic effects of oil on other common
members of the subtidal benthos of Prince William Sound should be strongly
encouraged for the near future. In addition, the potential effects of the
loss of sensitive species to the trophic structure in Prince William Sound
must be examined. The above problems can best be addressed by examination
of benthic food studies published by the Outer Continental Shelf Environ-
mental Assessment Program (OCSEAP) (Smith et al., 1976; Feder and Jewett,
1977, 1980, in press; Feder and Paul, 1980; Feder et al., in press).
A direct relationship between trophic structure (feeding type) and
bottom stability has been demonstrated by Rhoads (see Rhoads, 1974, for re-
view). He describes a diesel-fuel oil spill that resulted in oil becoming
adsorbed on sediment particles which in turn caused death in deposit feeders
living on sublittoral muds. Bottom stability was altered with the death
8
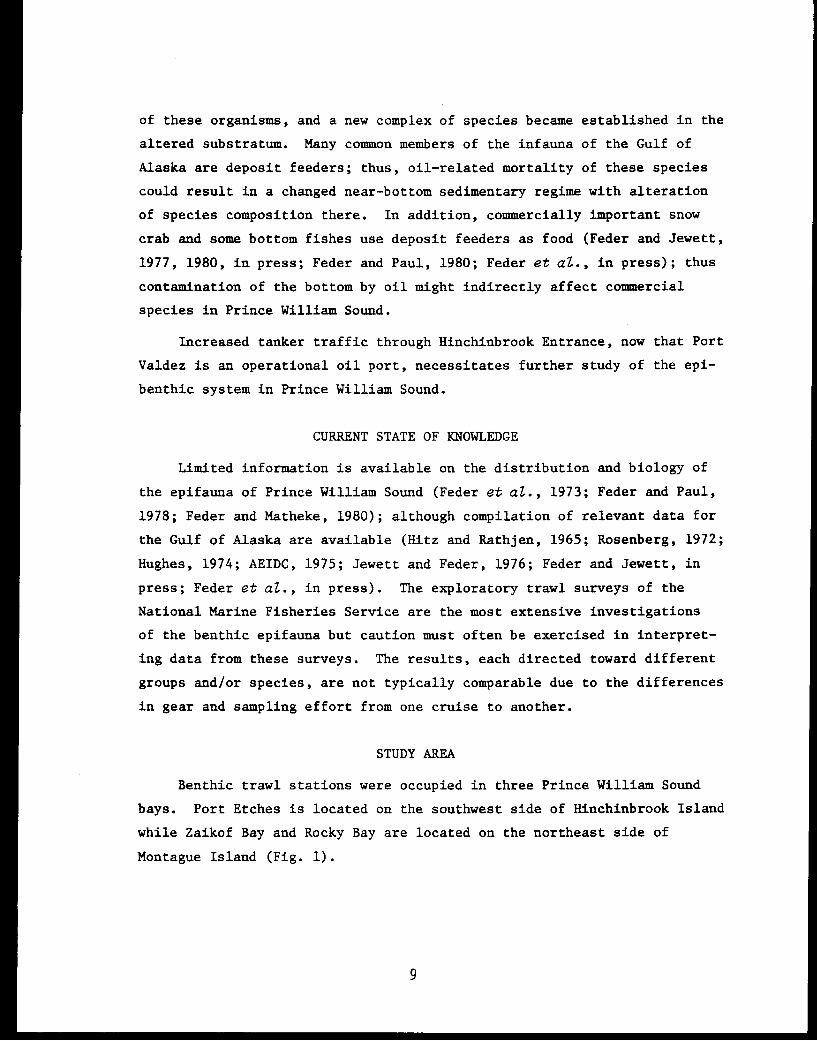
of these organisms, and a new complex of species became established in the
altered substratum. Many common members of the infauna of the Gulf of
Alaska are deposit feeders; thus, oil-related mortality of these species
could result in a changed near-bottom sedimentary regime with alteration
of species composition there. In addition, commercially important snow
crab and some bottom fishes use deposit feeders as food (Feder and Jewett,
1977, 1980, in press; Feder and Paul, 1980; Feder et al., in press); thus
contamination of the bottom by oil might indirectly affect commercial
species in Prince William Sound.
Increased tanker traffic through Hinchinbrook Entrance, now that Port
Valdez is an operational oil port, necessitates further study of the epi-
benthic system in Prince William Sound.
CURRENT STATE OF KNOWLEDGE
Limited information is available on the distribution and biology of
the epifauna of Prince William Sound (Feder et al., 1973; Feder and Paul,
1978; Feder and Matheke, 1980); although compilation of relevant data for
the Gulf of Alaska are available (Hitz and Rathjen, 1965; Rosenberg, 1972;
Hughes, 1974; AEIDC, 1975; Jewett and Feder, 1976; Feder and Jewett, in
press; Feder et al., in press). The exploratory trawl surveys of the
National Marine Fisheries Service are the most extensive investigations
of the benthic epifauna but caution must often be exercised in interpret-
ing data from these surveys. The results, each directed toward different
groups and/or species, are not typically comparable due to the differences
in gear and sampling effort from one cruise to another.
STUDY AREA
Benthic trawl stations were occupied in three Prince William Sound
bays. Port Etches is located on the southwest side of Hinchinbrook Island
while Zaikof Bay and Rocky Bay are located on the northeast side of
Montague Island (Fig. 1).
9
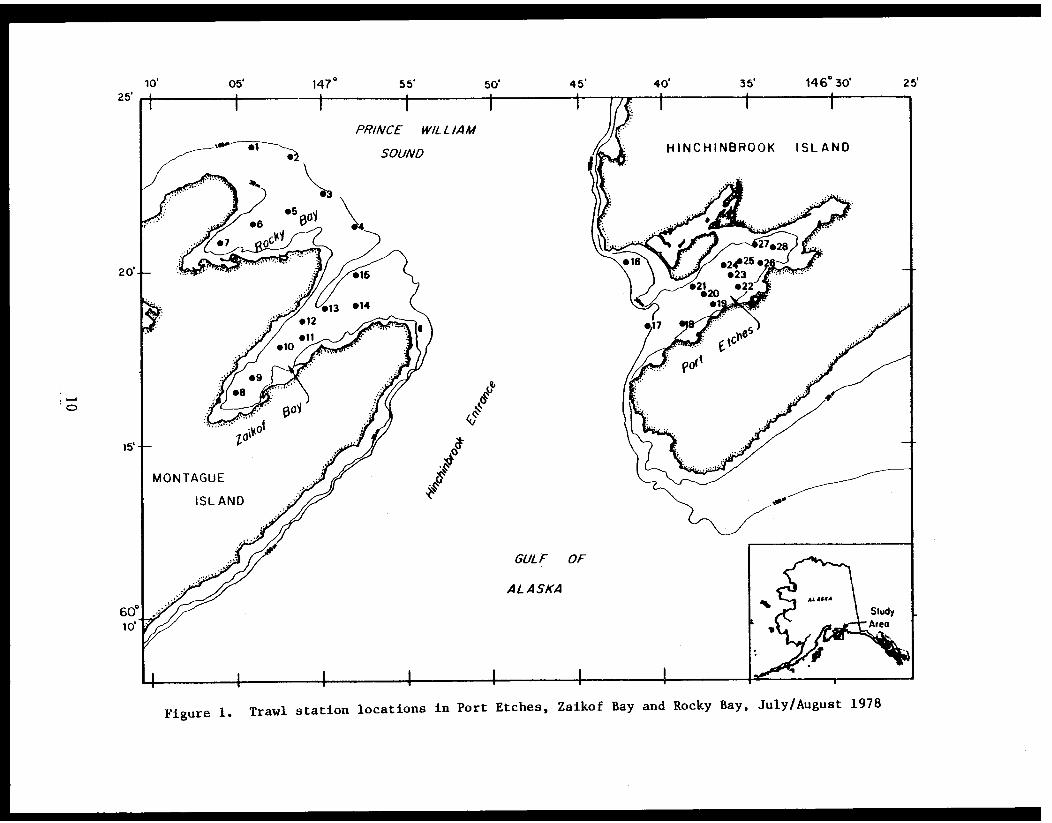
Figure 1. Trawl station locations in Port Etches, Zaikof Bay and Rocky Bay, July/August 1978

SOURCES, METHODS AND RATIONALE OF DATA COLLECTON
Stations were occupied in Port Etches, Zaikof Bay and Rocky Bay,
Prince William Sound (Fig. 1; Appendix Table I) from 28 July to 7 August
1978 on the M/V Searcher. Material was collected at 28 stations. Tows
were usually 15 minutes in duration, and made with a small otter trawl
(try net) with a 6.1-m horizontal opening. Samples were taken to a maxi-
mum depth of approximately 100 m. All organisms were sorted on shipboard,
given tentative identifications and counted. Abundant species were weighed.
Aliquot samples of individual species were preserved in buffered, 10% for-
malin, and labeled for final identification at the University of Alaska.
Biomass per unit area (g/m² is calculated as follows: W [divided by]Tw(Dx1000);
where W = weight (grams), Tw = width of trawl opening (meters), and (D)
is distance fished (kilometers x 1000). The data base for all calcula-
tions of biomass per m² in the present report have been submitted to the
National Oceanographic Data Center (NODC).
After final identification, all invertebrates were assigned code
numbers (Mueller, 1975) to facilitate data analysis by computer. Represen-
tative samples of invertebrates are stored at the Institute of Marine
Science, University of Alaska, Fairbanks, Alaska. Voucher samples are
deposited at the California Academy of Sciences.
The major limitation of the survey was that imposed by the selectivity
of the otter trawl used. In addition, rocky-bottom areas could not be
sampled since otter trawls of the type used can only be fished on rela-
tively smooth bottoms.
Stomach contents of the snow crab (Chionoecetes bairdi), the sunflower
sea star (Pycnopodia helianthoides), and several fish species were analyzed.
All stomachs were examined by the frequency of occurrence method. Seventy-
six percent of all snow crab examined were less than 40 mm in carapace
width. Since food used by crab < 40 mm, as well as crab > 40 mm were simi-
lar, all sizes were combined when reporting the data.
Exoskeletons of snow crabs were identified as (1) recently molted,
(2) newshell, (3) oldshell, and (4) very oldshell (Donaldson, 1977).
11
RESULTS
Port Etches
Distribution, biomass, and abundance
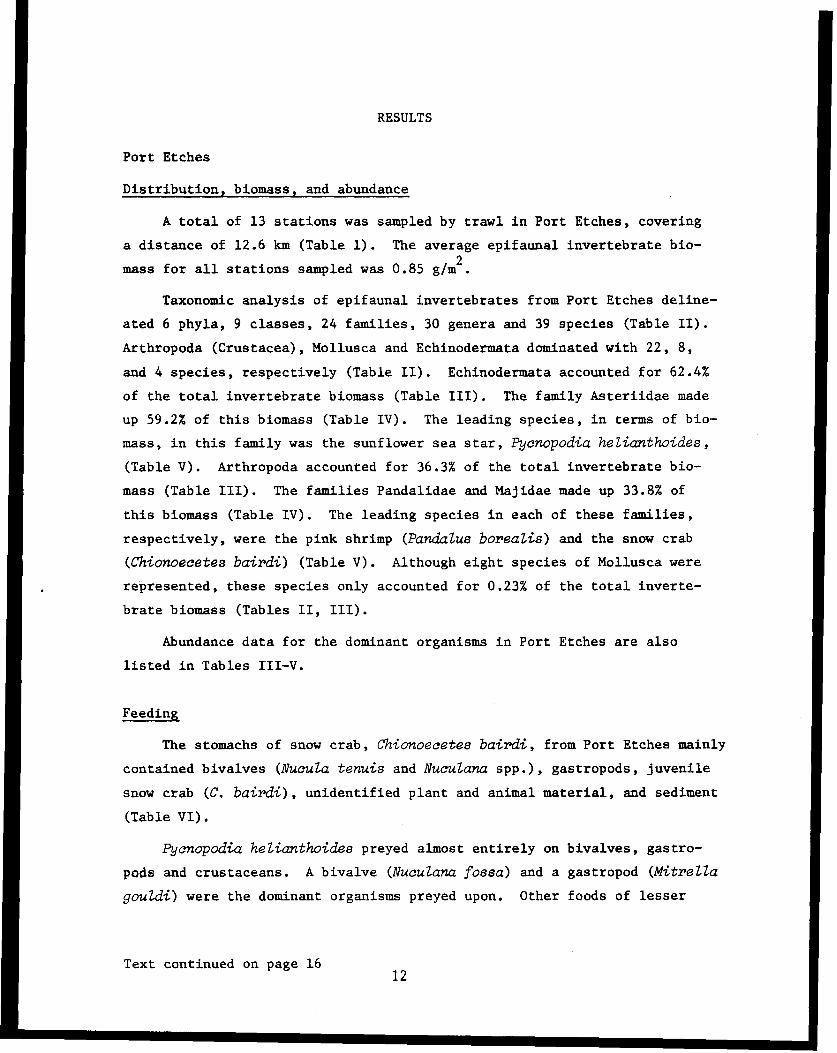
A total of 13 stations was sampled by trawl in Port Etches, covering
a distance of 12.6 km (Table 1). The average epifaunal invertebrate bio-
mass for all stations sampled was 0.85 g/m².
Taxonomic analysis of epifaunal invertebrates from Port Etches deline-
ated 6 phyla, 9 classes, 24 families, 30 genera and 39 species (Table II).
Arthropoda (Crustacea), Mollusca and Echinodermata dominated with 22, 8,
and 4 species, respectively (Table II). Echinodermata accounted for 62.4%
of the total invertebrate biomass (Table III). The family Asteriidae made
up 59.2% of this biomass (Table IV). The leading species, in terms of bio-
mass, in this family was the sunflower sea star, Pycnopodia helianthoides,
(Table V). Arthropoda accounted for 36.3% of the total invertebrate bio-
mass (Table III). The families Pandalidae and Majidae made up 33.8% of
this biomass (Table IV). The leading species in each of these families,
respectively, were the pink shrimp (Pandalus borealis) and the snow crab
(Chionoecetes bairdi) (Table V). Although eight species of Mollusca were
represented, these species only accounted for 0.23% of the total inverte-
brate biomass (Tables II, III).
Abundance data for the dominant organisms in Port Etches are also
listed in Tables III-V.
Feeding
The stomachs of snow crab, Chionoecetes bairdi, from Port Etches mainly
contained bivalves (Nucula tenuis and Nuculana spp.), gastropods, juvenile
snow crab (C. bairdi), unidentified plant and animal material, and sediment
(Table VI).
Pycnopodia helianthoides preyed almost entirely on bivalves, gastro-
pods and crustaceans. A bivalve (Nuculana fossa) and a gastropod (Mitrella
gouldi) were the dominant organisms preyed upon. Other foods of lesser
Text continued on page 1612

TABLE I
TOTAL EPIFAUNAL INVERTEBRATE BIOMASS FROM BENTHIC TRAWLING ACTIVITIES
IN PORT ETCHES, ZAIKOF BAY AND ROCKY BAY: JULY/AUGUST 1978
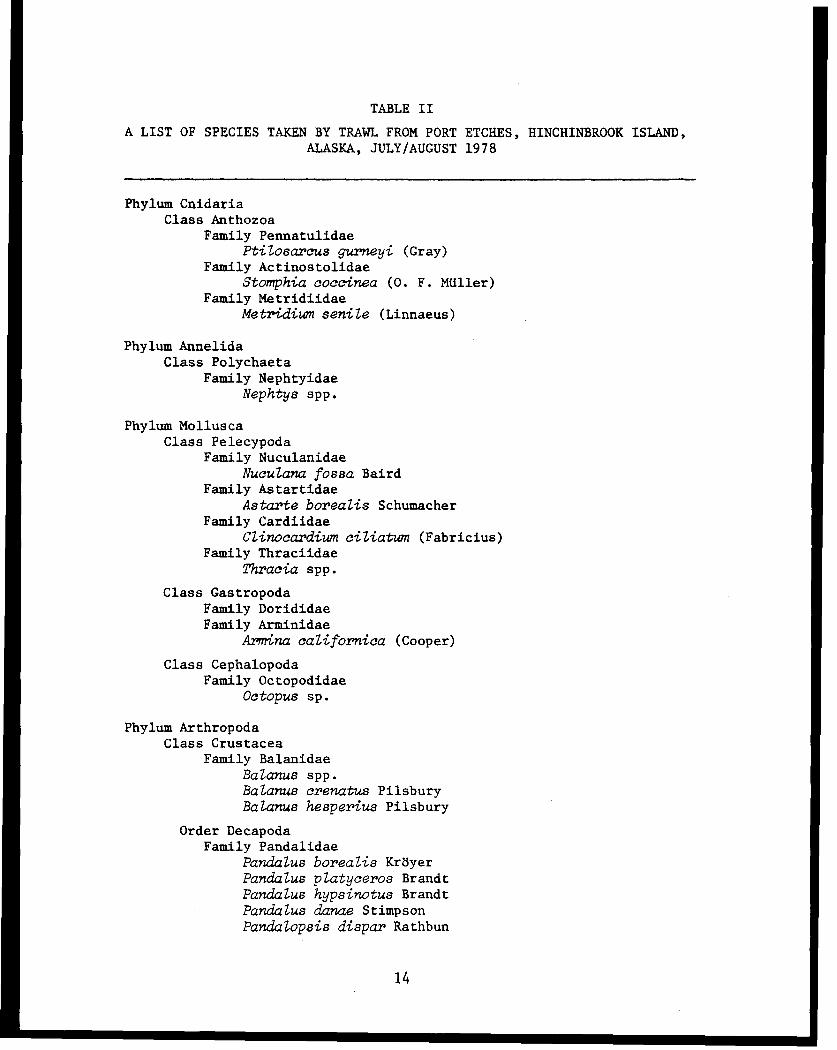
TABLE II
A LIST OF SPECIES TAKEN BY TRAWL FROM PORT ETCHES, HINCHINBROOK ISLAND,ALASKA, JULY/AUGUST 1978
Phylum CnidariaClass Anthozoa
Family PennatulidaePtilosarcus gurneyi (Gray)
Family ActinostolidaeStomphia coccinea (O. F. Müllr)
Family MetridiidaeMetridium senile (Linnaeus)
Phylum AnnelidaClass Polychaeta
Family NephtyidaeNephtys spp.
Phylum MolluscaClass Pelecypoda
Family NuculanidaeNuculana fossa Baird
Family AstartidaeAstarte borealis Schumacher
Family CardiidaeClinocardium ciliatum (Fabricius)
Family ThraciidaeThracia spp.
Class GastropodaFamily DorididaeFamily Arminidae
Armina californica (Cooper)
Class CephalopodaFamily Octopodidae
Octopus sp.
Phylum ArthropodaClass Crustacea
Family BalanidaeBalanus spp.Balanus crenatus PilsburyBalanus hesperius Pilsbury
Order DecapodaFamily Pandalidae
Pandalus borealis KröyerPandalus platyceros BrandtPandalus hypsinotus BrandtPandalus danae StimpsonPandalopsis dispar Rathbun
14
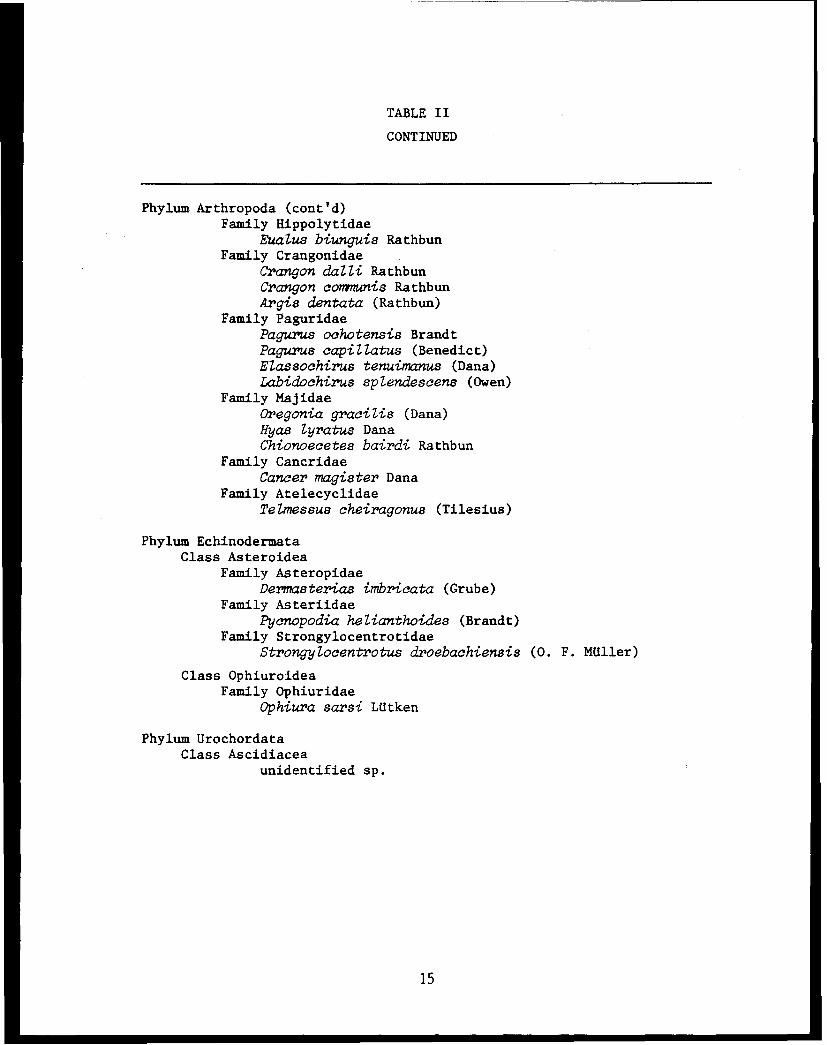
TABLE II
CONTINUED
Phylum Arthropoda (cont'd)Family Hippolytidae
Eualus biunguis RathbunFamily Crangonidae
Crangon dalli RathbunCrangon communis RathbunArgis dentata (Rathbun)
Family PaguridaePagurus ochotensis BrandtPagurus capillatus (Benedict)Elassochirus tenuimanus (Dana)Labidochirus splendescens (Owen)
Family MajidaeOregonia gracilis (Dana)Hyas lyratus DanaChionoecetes bairdi Rathbun
Family CancridaeCancer magister Dana
Family AtelecyclidaeTelmessus cheiragonus (Tilesius)
Phylum EchinodermataClass Asteroidea
Family AsteropidaeDermasterias imbricata (Grube)
Family AsteriidaePycnopodia helianthoides (Brandt)
Family StrongylocentrotidaeStrongylocentrotus droebachiensis (0. F. Müller)
Class OphiuroideaFamily Ophiuridae
Ophiura sarsi Lütken
Phylum UrochordataClass Ascidiacea
unidentified sp.
15
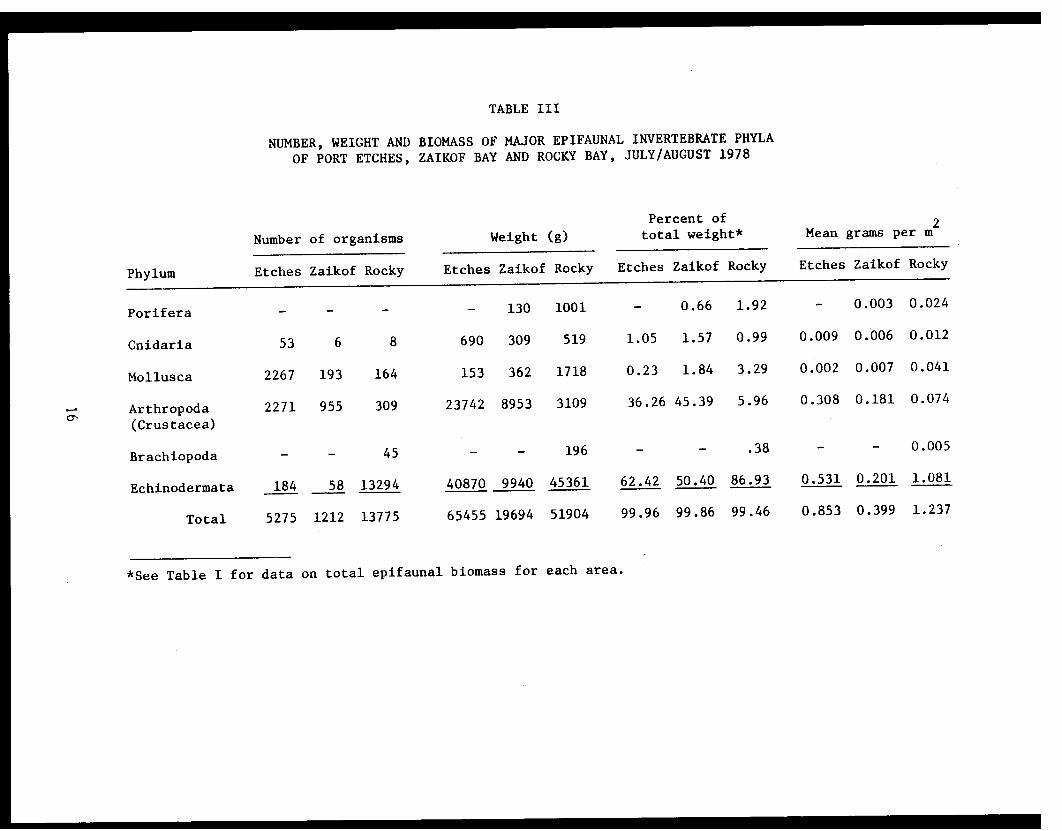
TABLE III
NUMBER, WEIGHT AND BIOMASS OF MAJOR EPIFAUNAL INVERTEBRATE PHYLA
OF PORT ETCHES, ZAIKOF BAY AND ROCKY BAY, JULY/AUGUST 1978
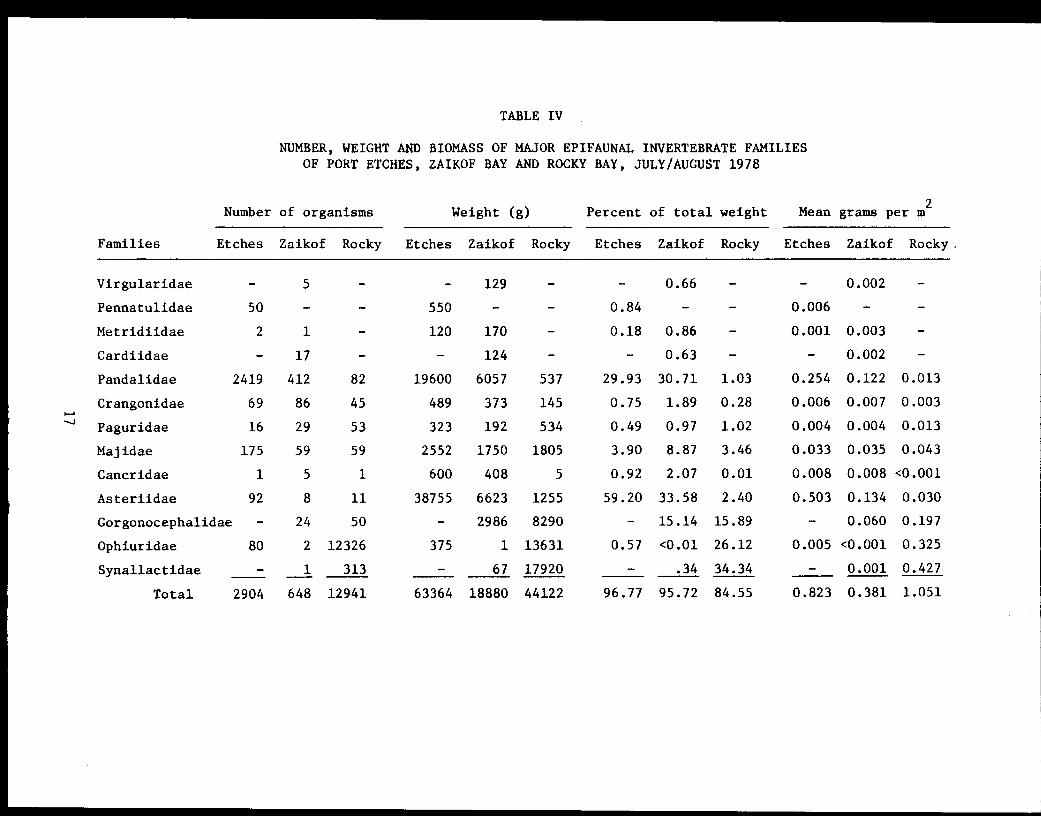
TABLE IV
NUMBER, WEIGHT AND BIOMASS OF MAJOR EPIFAUNAL INVERTEBRATE FAMILIESOF PORT ETCHES, ZAIKOF BAY AND ROCKY BAY, JULY/AUGUST 1978

TABLE V
NUMBER, WEIGHT AND BIOMASS OF MAJOR EPIFAUNAL SPECIES FROMPORT ETCHES, ZAIKOF BAY AND ROCKY BAY, JULY/AUGUST 1978

TABLE VI
PERCENT FREQUENCY OF OCCURRENCE OF FOOD ITEMS FOUND IN STOMACHS OFCHIONOECETES BAIRDI FROM PORT ETCHES, ZAIKOF BAY AND ROCKY BAY, JULY/AUGUST 1978
N = NUMBER OF STOMACHS
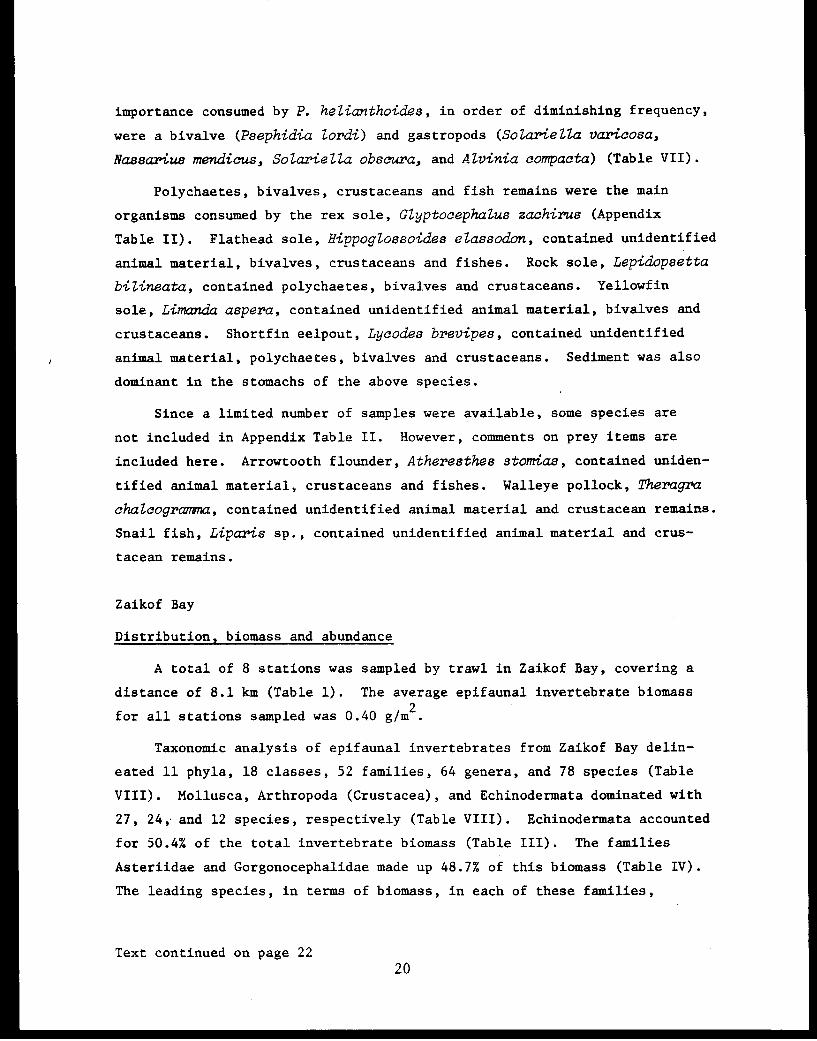
importance consumed by P. helianthoides, in order of diminishing frequency,
were a bivalve (Psephidia lordi) and gastropods (Solariella varicosa,
Nassarius mendicus, Solariella obscura, and Alvinia compacta) (Table VII).
Polychaetes, bivalves, crustaceans and fish remains were the main
organisms consumed by the rex sole, Glyptocephalus zachirus (Appendix
Table II). Flathead sole, Hippoglossoides elassodon, contained unidentified
animal material, bivalves, crustaceans and fishes. Rock sole, Lepidopsetta
bilineata, contained polychaetes, bivalves and crustaceans. Yellowfin
sole, Limanda aspera, contained unidentified animal material, bivalves and
crustaceans. Shortfin eelpout, Lycodes brevipes, contained unidentified
animal material, polychaetes, bivalves and crustaceans. Sediment was also
dominant in the stomachs of the above species.
Since a limited number of samples were available, some species are
not included in Appendix Table II. However, comments on prey items are
included here. Arrowtooth flounder, Atheresthes stomias, contained uniden-
tified animal material, crustaceans and fishes. Walleye pollock, Theragra
chalcogramma, contained unidentified animal material and crustacean remains.
Snail fish, Liparis sp., contained unidentified animal material and crus-
tacean remains.
Zaikof Bay
Distribution, biomass and abundance
A total of 8 stations was sampled by trawl in Zaikof Bay, covering a
distance of 8.1 km (Table 1). The average epifaunal invertebrate biomass
for all stations sampled was 0.40 g/m².
Taxonomic analysis of epifaunal invertebrates from Zaikof Bay delin-
eated 11 phyla, 18 classes, 52 families, 64 genera, and 78 species (Table
VIII). Mollusca, Arthropoda (Crustacea), and Echinodermata dominated with
27, 24, and 12 species, respectively (Table VIII). Echinodermata accounted
for 50.4% of the total invertebrate biomass (Table III). The families
Asteriidae and Gorgonocephalidae made up 48.7% of this biomass (Table IV).
The leading species, in terms of biomass, in each of these families,
Text continued on page 2220
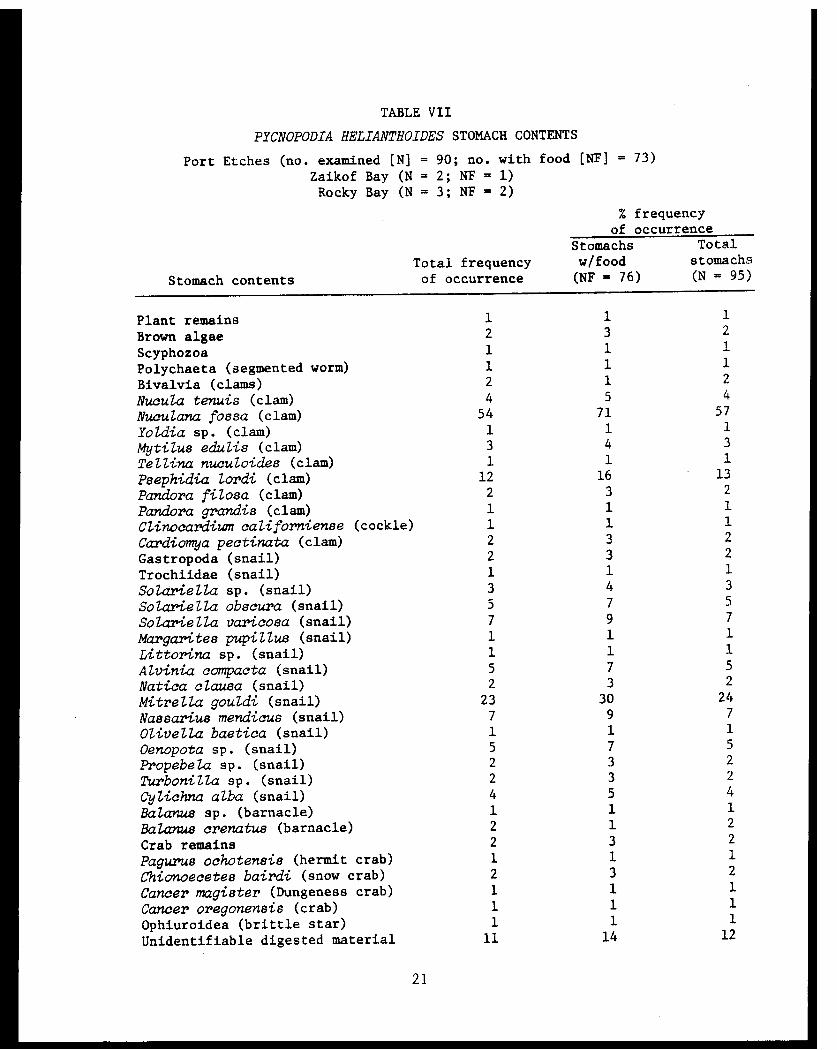
TABLE VII
PYCNOPODIA HELIANTHOIDES STOMACH CONTENTS
21

TABLE VIII
A LIST OF SPECIES TAKEN BY TRAWL FROM ZAIKOF BAY, MONTAGUE ISLAND, ALASKAJULY/AUGUST 1978
Phylum PoriferaClass Demospongia
Family SuberitidaeSuberites suberea Lambe
unidentified sp.
Phylum CnidariaClass Hydrozoa
unidentified sp.
Class AnthozoaFamily Virgularidae
Stylatula gracile (Gabb)Family Metridiidae
Metridium senile (Linnaeus)
Phylum Rhynchocoela
Phylum AnnelidaClass Polychaeta
Family PolynoidaeEunoe depressa Moore
Family MaldanidaeFamily Nereidae
Nereis sp.Family Sabellidae
Pseudopotamilla reniformis (Leuckhart)Family Serpulidae
Crucigera zygophora (Johnson)
Phylum MolluscaClass Polyplacophora
Family IschnochitonidaeIschnochiton trifidus (Berry)
Class BivalviaFamily Nuculanidae
Nuculana fossa BairdYoldia amygdalea Valenciennes
Family PectinidaeChlamys rubida Hinds
Family AnomiidaePododesmus macrochisma Deshayes
Family AstartidaeAstarte borealis SchumacherAstarte alaskensis Dall
22
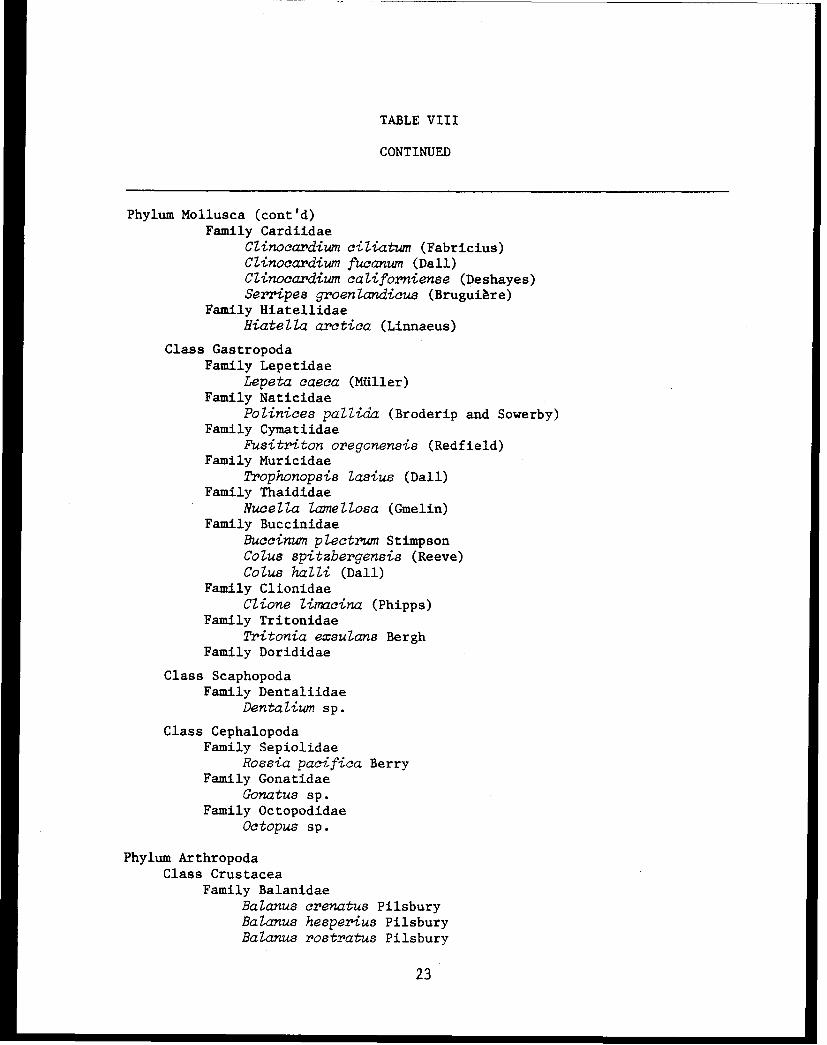
TABLE VIII
CONTINUED
Phylum Mollusca (cont'd)Family Cardiidae
Clinocardium ciliatum (Fabricius)Clinocardium fucanum (Dall)Clinocardium californiense (Deshayes)Serripes groenlandicus (Bruguière)
Family HiatellidaeHiatella arctica (Linnaeus)
Class GastropodaFamily Lepetidae
Lepeta caeca (Müller)Family Naticidae
Polinices pallida (Broderip and Sowerby)Family Cymatiidae
Fusitriton oregonensis (Redfield)Family Muricidae
Trophonopsis tasius (Dall)Family Thaididae
Nucella lamellosa (Gmelin)Family Buccinidae
Buccinum plectrum StimpsonColus spitzbergensis (Reeve)Colus halli (Dall)
Family ClionidaeClione limacina (Phipps)
Family TritonidaeTritonia exsulans Bergh
Family Dorididae
Class ScaphopodaFamily Dentaliidae
Dentaium sp.
Class CephalopodaFamily Sepiolidae
Rossia pacifica BerryFamily Gonatidae
Gonatus sp.Family Octopodidae
Octopus sp.
Phylum ArthropodaClass Crustacea
Family BalanidaeBatanus crenatus PilsburyBalanus hesperius PilsburyBalanus rostratus Pilsbury
23
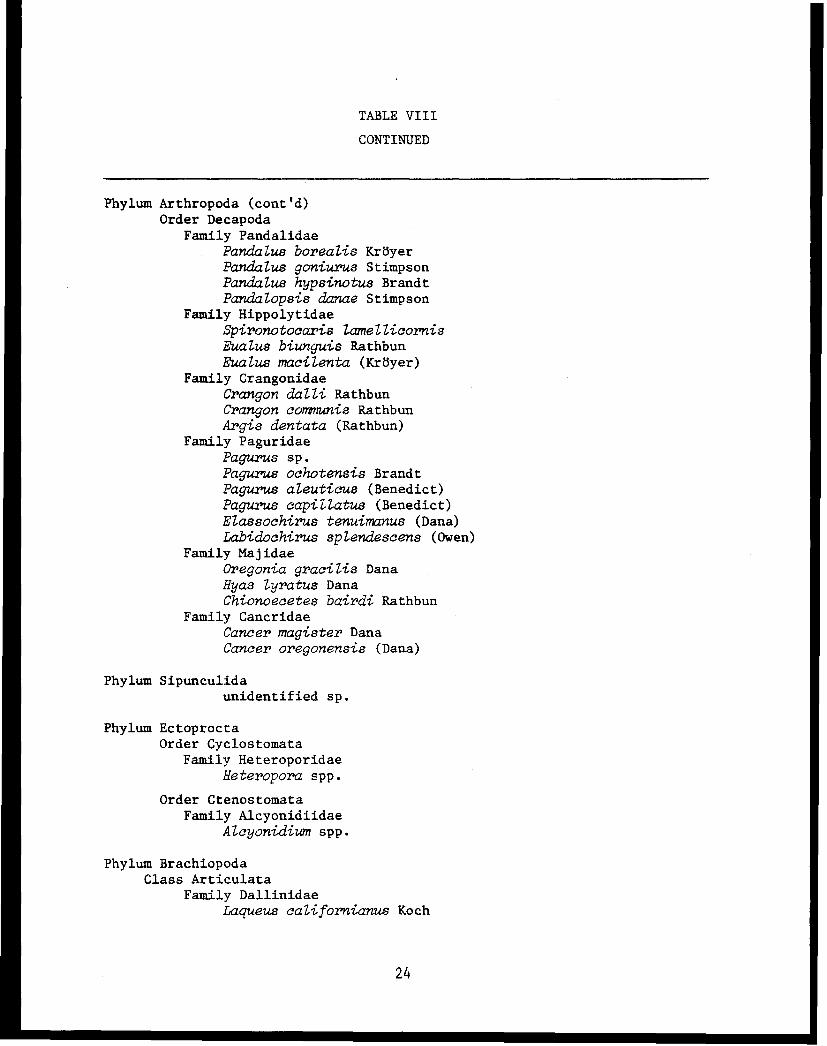
TABLE VIII
CONTINUED
Phylum Arthropoda (cont'd)Order Decapoda
Family PandalidaePandalus borealis KröyerPandalus goniurus StimpsonPandalus hypsinotus BrandtPandalopsis danae Stimpson
Family HippolytidaeSpironotocaris lamellicornisEualus biunguis RathbunEualus macilenta (Kröyer)
Family CrangonidaeCrangon dalli RathbunCrangon communis RathbunArgis dentata (Rathbun)
Family PaguridaePagurus sp.Pagurus ochotensis BrandtPagurus aleuticus (Benedict)Pagurus capillatus (Benedict)Elassochirus tenuimanus (Dana)Labidochirus splendescens (Owen)
Family MajidaeOregonia gracilis DanaHyas lyratus DanaChionoecetes bairdi Rathbun
Family CancridaeCancer magister DanaCancer oregonensis (Dana)
Phylum Sipunculidaunidentified sp.
Phylum EctoproctaOrder Cyclostomata
Family HeteroporidaeHeteropora spp.
Order CtenostomataFamily Alcyonidiidae
Alcyonidium spp.
Phylum BrachiopodaClass Articulata
Family DallinidaeLaqueus californianus Koch
24
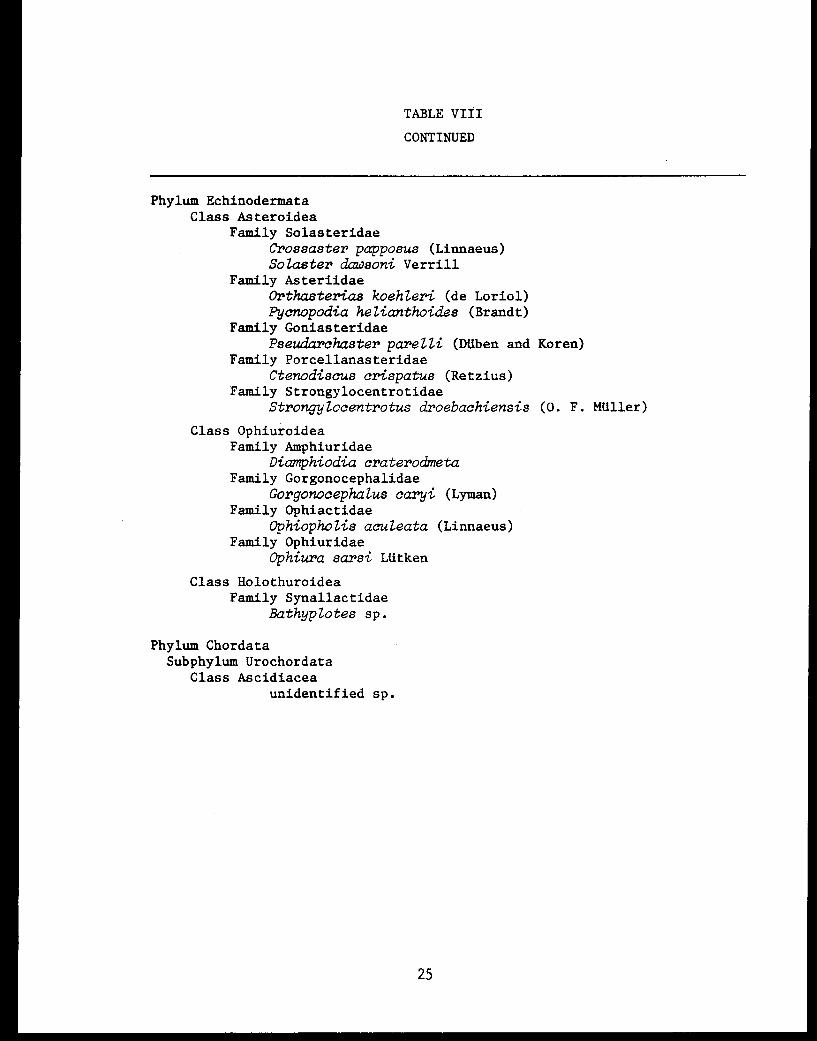
TABLE VIII
CONTINUED
Phylum EchinodermataClass Asteroidea
Family SolasteridaeCrossaster papposus (Linnaeus)Solaster dawsoni Verrill
Family AsteriidaeOrthasterias koehleri (de Loriol)Pycnopodia helianthoides (Brandt)
Family GoniasteridaePseudarchaster parelli (Düben and Koren)
Family PorcellanasteridaeCtenodiscus crispatus (Retzius)
Family StrongylocentrotidaeStrongylocentrotus droebachiensis (O. F. Müller)
Class OphiuroideaFamily Amphiuridae
Diamphiodia craterodmetaFamily Gorgonocephalidae
Gorgonocephalus caryi (Lyman)Family Ophiactidae
Ophiopholis aculeata (Linnaeus)Family Ophiuridae
Ophiura sarsi LUtken
Class HolothuroideaFamily Synallactidae
Bathyplotes sp.
Phylum ChordataSubphylum Urochordata
Class Ascidiaceaunidentified sp.
25
respectively, were the sunflower sea star (Pycnopodia helianthoides) and
the basket star (Gorgonocephalus caryi) (Table V). Arthropoda accounted
for 45.4% of the total invertebrate biomass (Table III). The families
Pandalidae and Majidae made up 38.6% of this biomass (Table IV). The
leading species in each of these families, respectively, were the coon-
stripe shrimp (Pandalus hypsinotus), the pink shrimp (P. borealis), and
the snow crab (Chionoecetes bairdi) (Table V). Although 26 species of
Mollusca were represented, these species only accounted for 1.84% of the
total invertebrate biomass (Tables III-VIII).
Abundance data for the dominant organisms in Zaikof Bay are also
listed in Tables III-V.
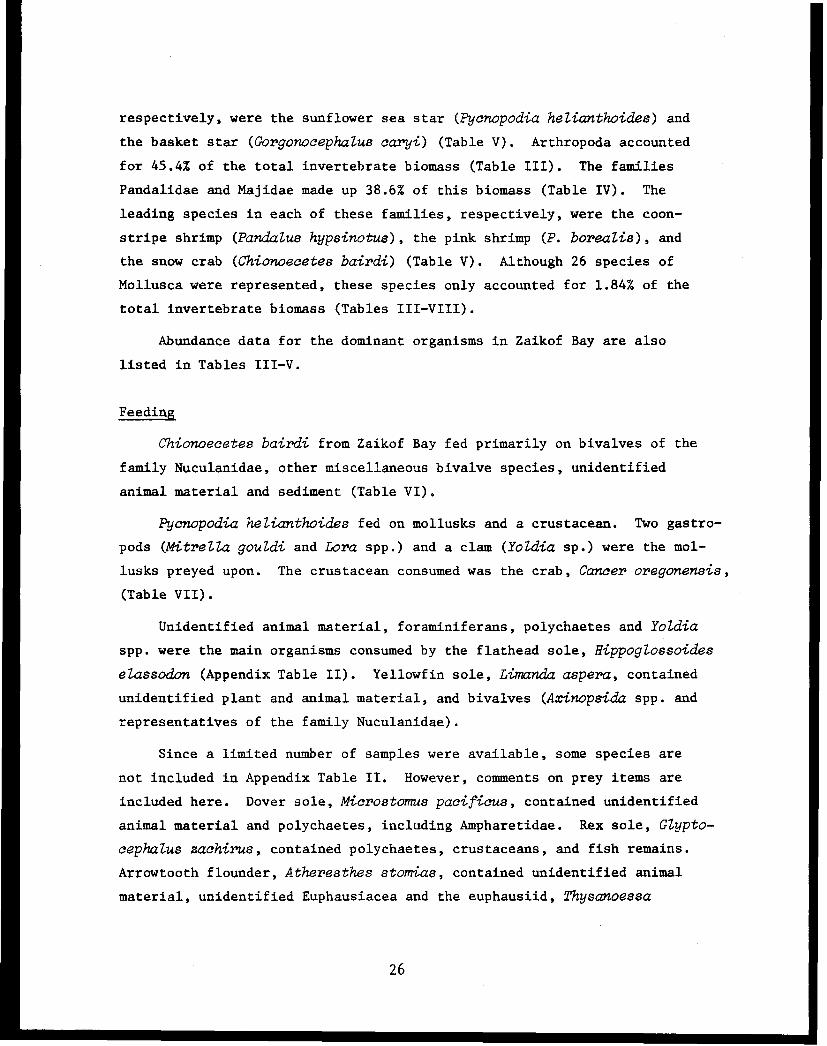
Feeding
Chionoecetes bairdi from Zaikof Bay fed primarily on bivalves of the
family Nuculanidae, other miscellaneous bivalve species, unidentified
animal material and sediment (Table VI).
Pycnopodia helianthoides fed on mollusks and a crustacean. Two gastro-
pods (Mitrella gouldi and Lora spp.) and a clam (Yoldia sp.) were the mol-
lusks preyed upon. The crustacean consumed was the crab, Cancer oregonensis,
(Table VII).
Unidentified animal material, foraminiferans, polychaetes and Yoldia
spp. were the main organisms consumed by the flathead sole, Hippoglossoides
elassodon (Appendix Table II). Yellowfin sole, Limanda aspera, contained
unidentified plant and animal material, and bivalves (Axinopsida spp. and
representatives of the family Nuculanidae).
Since a limited number of samples were available, some species are
not included in Appendix Table II. However, comments on prey items are
included here. Dover sole, Microstomus pacificus, contained unidentified
animal material and polychaetes, including Ampharetidae. Rex sole, Glypto-
cephalus zachirus, contained polychaetes, crustaceans, and fish remains.
Arrowtooth flounder, Atheresthes stomias, contained unidentified animal
material, unidentified Euphausiacea and the euphausiid, Thysanoessa
26
spinifera. Shortfin eelpout, Lycodes brevipes, contained unidentified plant
material, bivalves, crustaceans and fish remains. Sediment was also do-
minant in the stomachs of the above species.
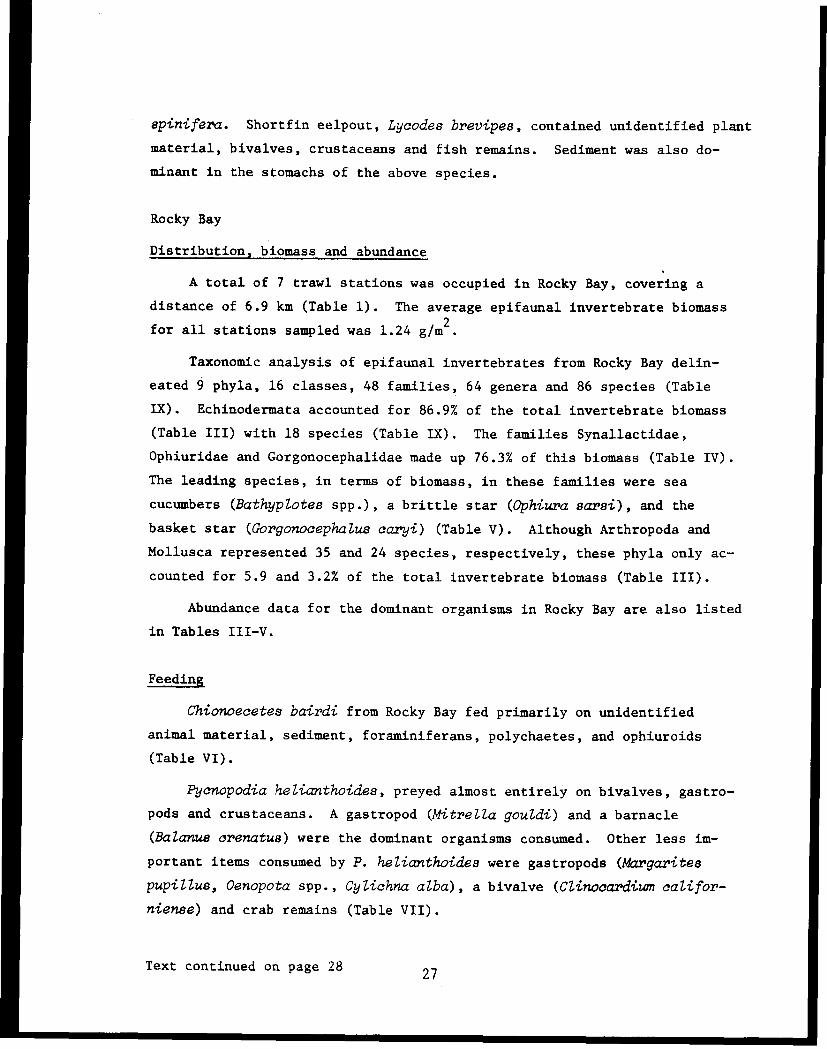
Rocky Bay
Distribution, biomass and abundance
A total of 7 trawl stations was occupied in Rocky Bay, covering a
distance of 6.9 km (Table 1). The average epifaunal invertebrate biomass
for all stations sampled was 1.24 g/m²
Taxonomic analysis of epifaunal invertebrates from Rocky Bay delin-
eated 9 phyla, 16 classes, 48 families, 64 genera and 86 species (Table
IX). Echinodermata accounted for 86.9% of the total invertebrate biomass
(Table III) with 18 species (Table IX). The families Synallactidae,
Ophiuridae and Gorgonocephalidae made up 76.3% of this biomass (Table IV).
The leading species, in terms of biomass, in these families were sea
cucumbers (Bathyplotes spp.), a brittle star (Ophiura sarsi), and the
basket star (Gorgonocephalus caryi) (Table V). Although Arthropoda and
Mollusca represented 35 and 24 species, respectively, these phyla only ac-
counted for 5.9 and 3.2% of the total invertebrate biomass (Table III).
Abundance data for the dominant organisms in Rocky Bay are also listed
in Tables III-V.
Feeding
Chionoecetes bairdi from Rocky Bay fed primarily on unidentified
animal material, sediment, foraminiferans, polychaetes, and ophiuroids
(Table VI).
Pyonopodia helianthoides, preyed almost entirely on bivalves, gastro-
pods and crustaceans. A gastropod (Mitrella gouldi) and a barnacle
(Balanus crenatus) were the dominant organisms consumed. Other less im-
portant items consumed by P. helianthoides were gastropods (Margarites
pupillus, Oenopota spp., Cylichna alba), a bivalve (Clinocardium califor-
niense) and crab remains (Table VII).
Text continued on page 28 2727
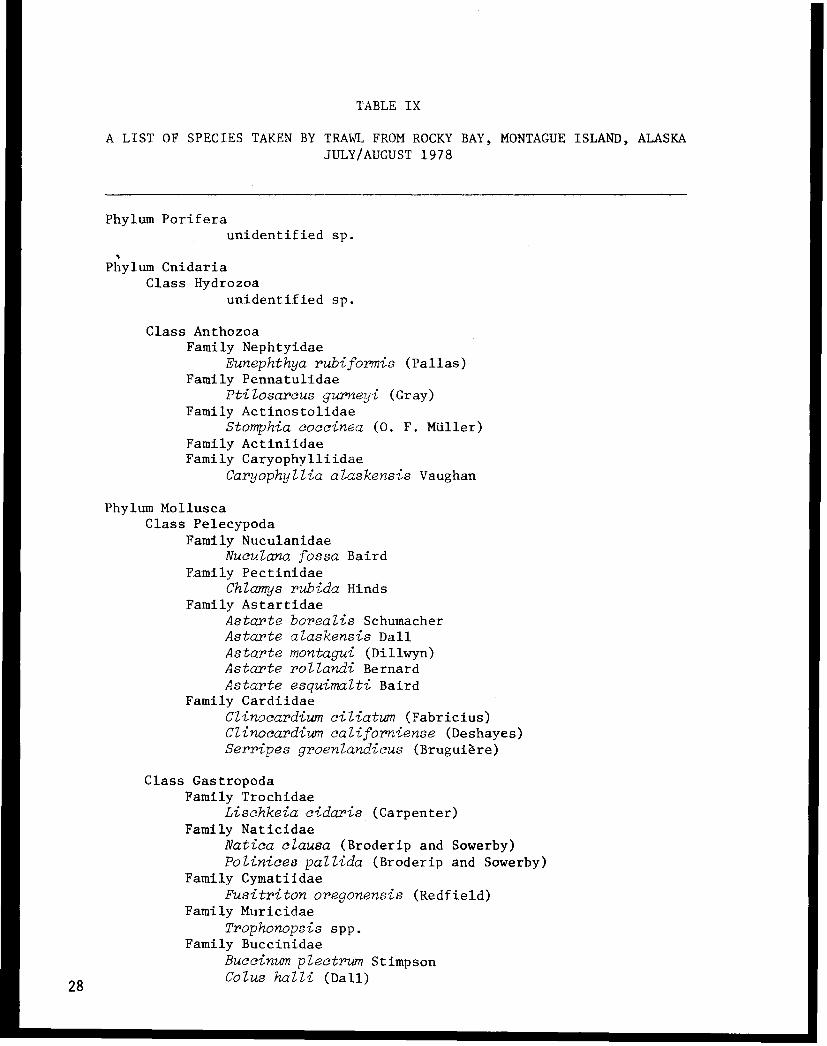
TABLE IX
A LIST OF SPECIES TAKEN BY TRAWL FROM ROCKY BAY, MONTAGUE ISLAND, ALASKAJULY/AUGUST 1978
Phylum Poriferaunidentified sp.
Phylum CnidariaClass Hydrozoa
unidentified sp.
Class AnthozoaFamily Nephtyidae
Eunephthya rubiformis (Pallas)Family Pennatulidae
Ptilosarcus gurneyi (Gray)Family Actinostolidae
Stomphia coccinea (O. F. Müller)Family ActiniidaeFamily Caryophylliidae
Caryophyllia alaskensis Vaughan
Phylum MolluscaClass Pelecypoda
Family NuculanidaeNuculana fossa Baird
Family PectinidaeChlamys rubida Hinds
Family AstartidaeAstarte borealis SchumacherAstarte alaskensis DallAstarte montagui (Dillwyn)Astarte rollandi BernardAstarte esquimalli Baird
Family CardiidaeClinocardium ciliatum (Fabricius)Clinocardium californiense (Deshayes)Serripes groenlandicus (Bruguière)
Class GastropodaFamily Trochidae
Lischkeia cidaris (Carpenter)Family Naticidae
Natica clausa (Broderip and Sowerby)Polinices pallida (Broderip and Sowerby)
Family CymatiidaeFusitriton oregonensis (Redfield)
Family MuricidaeTrophonopsis spp.
Family BuccinidaeBuccinum plectrum StimpsonColus halli (Dall)28
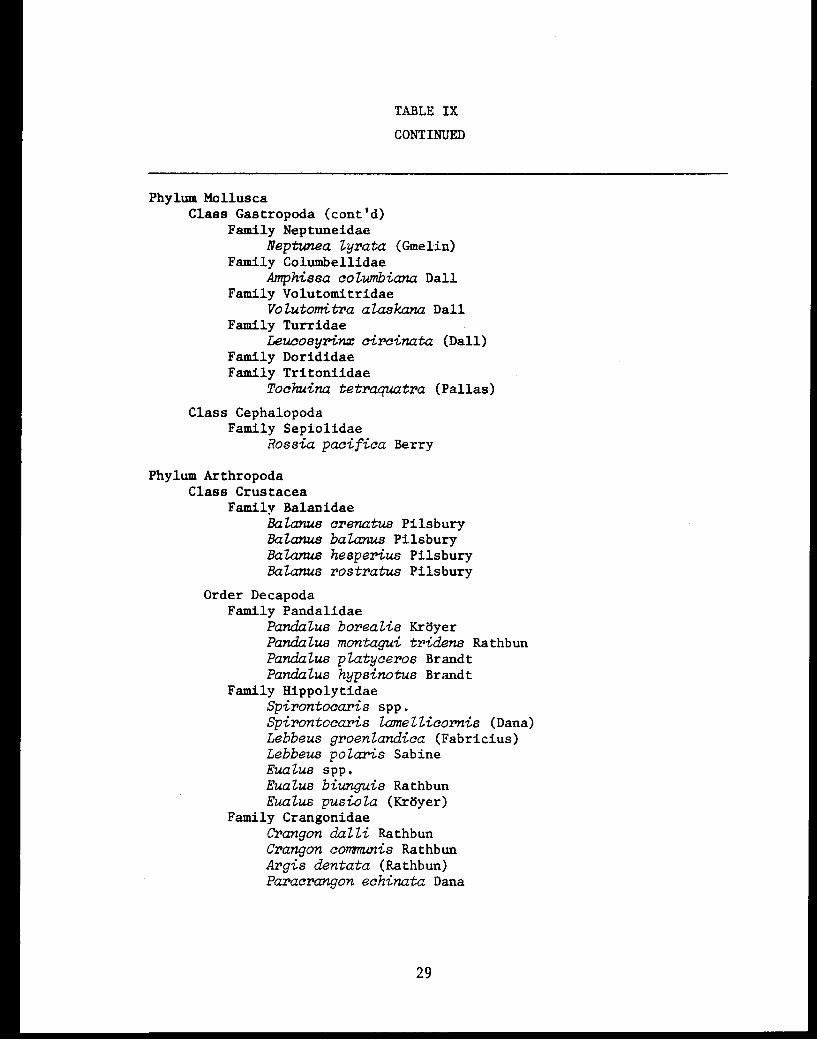
TABLE IX
CONTINUED
Phylum MolluscaClass Gastropoda (cont'd)
Family NeptuneidaeNeptunea lyrata (Gmelin)
Family ColumbellidaeAmphissa columbiana Dall
Family VolutomitridaeVolutomitra alaskana Dall
Family TurridaeLeucosyrinx circinata (Dall)
Family DorididaeFamily Tritoniidae
Tochuina tetraquatra (Pallas)
Class CephalopodaFamily Sepiolidae
Rossia pacifica Berry
Phylum ArthropodaClass Crustacea
Family BalanidaeBalanus crenatus PilsburyBalanus balanus PilsburyBalanus hesperius PilsburyBalanus rostratus Pilsbury
Order DecapodaFamily Pandalidae
Paldalus borealis KröyerPandalus montagui tridens RathbunPandalus platyceros BrandtPandalus hypsinotus Brandt
Family HippolytidaeSpirontocaris spp.Spirontocaris lamellicornis (Dana)Lebbeus groenlandica (Fabricius)Lebbeus polaris SabineEualus spp.Eualus biunguis RathbunEualus pusiola (Kröyer)
Family CrangonidaeCrangon dalli RathbunCrangon communis RathbunArgis dentata (Rathbun)Paracrangon echinata Dana
29
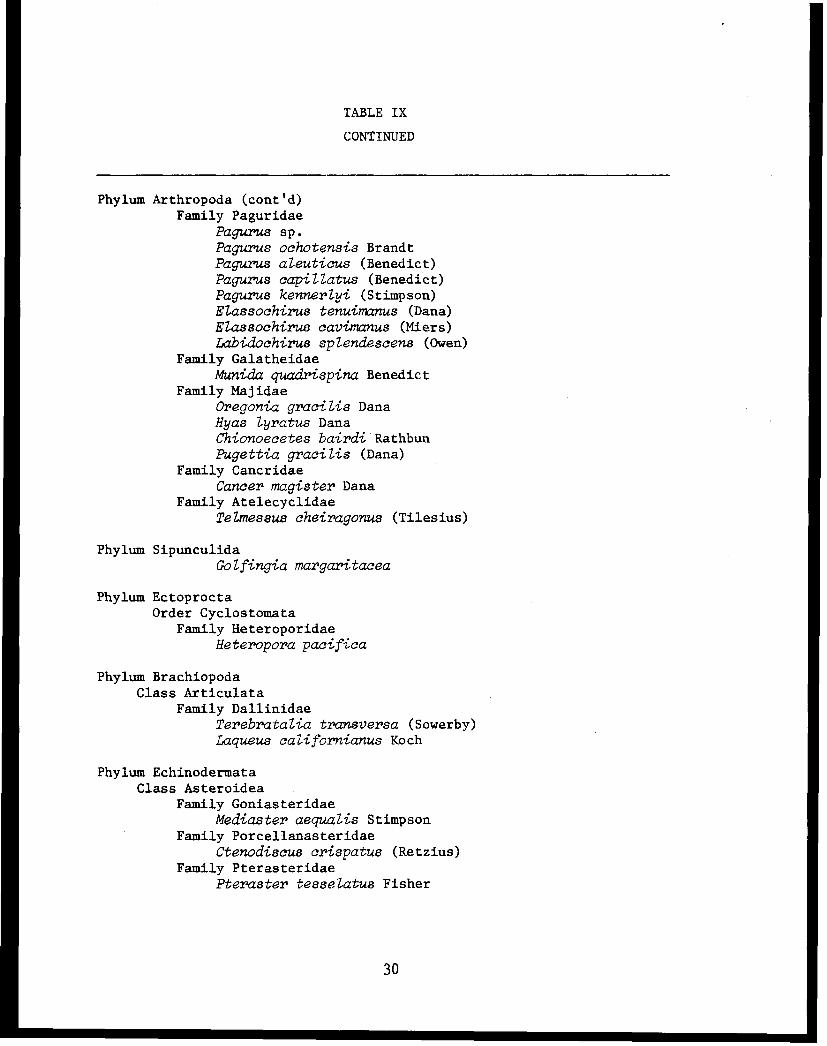
TABLE IX
CONTINUED
Phylum Arthropoda (cont'd)Family Paguridae
Pagurus sp.Pagurus ochotensis BrandtPagurus aleuticus (Benedict)Pagurus capillatus (Benedict)Pagurus kennerlyi (Stimpson)Elassochirus tenuimanus (Dana)Elassochirus cavimanus (Miers)Labidochirus splendescens (Owen)
Family GalatheidaeMunida quadrispina Benedict
Family MajidaeOregonia gracilis DanaHyas lyratus DanaChionoecetes bairdi RathbunPugettia gracilis (Dana)
Family CancridaeCancer magister Dana
Family AtelecyclidaeTelmessus cheiragonus (Tilesius)
Phylum SipunculidaGolfingia margaritacea
Phylum EctoproctaOrder Cyclostomata
Family HeteroporidaeHeteropora pacifica
Phylum BrachiopodaClass Articulata
Family DallinidaeTerebratalia transversa (Sowerby)Laqueus californianus Koch
Phylum EchinodermataClass Asteroidea
Family GoniasteridaeMediaster aequalis Stimpson
Family PorcellanasteridaeCtenodiscus crispatus (Retzius)
Family PterasteridaePteraster tesselatus Fisher
30

TABLE IX
CONTINUED
Phylum EchinodermataClass Asteriidae (cont'd)
Family SolasteridaeCrossaster papposus (Linnaeus)Solaster spp.Solaster endeca (Linnaeus)
Family AsteridaeLethasterias nanimensis (Verrill)Orthasterias koehleri (de Loriol)Stylastasterias forreri (de Loriol)Pycnopodia helianthoides (Brandt)
Family PedicellasteridaePedicellaster magister Djakonov
Family StrongylocentrotidaeStrongylocentrotus droebachiensis (O. F. Müller)
Class OphiuroideaFamily Gorgonocephalidae
Gorgonocephalus caryi (Lyman)Family Ophiuridae
Ophiura sarsi Lütken
Class HolothuroideaFamily Stichopodidae
Parastichopus californicus (Stimpson)Family Synallactidae
Bathyplotes sp.Family Psolidae
Psolus chitinoides (Clark)
Class CrinoideaHeliometra glacialis maxima Clark
Phylum ChordataClass Ascidiacea
unidentified sp.
31
Polychaetes, bivalves, crustaceans including Gnathiidae, and fish re-
mains were the main organisms consumed by the searcher, Bathymaster
signatus (Appendix Table II).
Since a limited number of samples were available, some species are
not included in Appendix Table II. However, comments on prey items are
included here. Walleye pollock, Theragra chalcogramma, contained uniden-
tified animal material and crustaceans. Flathead sole, Hippoglossoides
elassodon, contained unidentified animal material, crustaceans, and
echinoderms. Rex sole, Glyptocephalus zachirus, contained unidentified
animal material, Nephtyidae and crustaceans. Dover sole, Microstomus
pacificus, contained polychaetes and crustaceans. Arrowtooth flounder,
Atheresthes stomias, contained unidentified animal material and fish.
Sediment was also dominant in the stomachs of the above species.
DISCUSSION
Station Coverage
The trawl program described in this report represents the first inten-
sive analysis of the epifaunal invertebrates of Port Etches, Zaikof Bay,
and Rocky Bay. Thirteen stations were occupied in Port Etches with 8 and
7 stations, respectively, occupied in Zaikof Bay and Rocky Bay. The aver-
age distance fished at each station was 0.99 km. Bottom topography in
Zaikof Bay and Rocky Bay made selection of trawlable areas difficult.
Biomass
The values for epifaunal standing stocks reported in the present study
are somewhat less than standing stock estimates presented in OCSEAP ben-
thic trawl studies elsewhere, i.e., see Jewett and Feder, 1976; Feder et al.,
in press. The average biomass for all epifaunal invertebrates in the
northeast Gulf of Alaska (NEGOA) was 2.6 g/m² (Jewett and Feder, 1976).
The biomass determined for epifaunal invertebrates in the southeast Bering
Sea was 3.3 g/m² in 1975 and 5.0 g/m² in 1976 (Feder and Jewett, in press).
The epifaunal biomass for Alitak and Ugak Bays was 4.74 g/m² (Feder and
Jewett, 1977). The average epifaunal biomass for Port Etches, Zaikof Bay
and Rocky Bay, for the present sampling period was 0.82 g/m² (Table I).
32
The low average biomass for Port Etches, Zaikof Bay and Rocky Bay may be
attributed to the sampling gear used, the try net. Large epifaunal in-
vertebrates such as crabs may be able to avoid this small net, unlike
the larger otter trawls.
Russian benthic investigations (Neiman, 1963), provide biomass esti-
mates based on grab samples for infauna and small epifauna from the south-
east Bering Sea with the lowest value reported as 55 g/m². Use of a com-
mercial-size trawl results in the loss of infaunal and small epifaunal or-
ganisms that are an important part of the benthic biomass. Therefore, the
total benthic biomass value is probably best expressed by combining both
grab and trawl values. Combined infaunal and epifaunal surveys should be a
part of all future benthic invertebrate investigations (infaunal samples are
available from these three bays; analysis of these samples is in progress).
Species Composition and Diversity
Examination of the species composition of Port Etches, Zaikof Bay and
Rocky Bay revealed crustaceans, molluscs and echinoderms to be the major
epifaunal invertebrates present.
In general, the epifaunal species richness for Port Etches, Zaikof
Bay and Rocky Bay in Prince William Sound was similar to that reported
for NEGOA (Jewett and Feder, 1976) and four bays of Kodiak and Afognak
Islands in the Gulf of Alaska, i.e., Alitak and Ugak Bays (Feder and Jewett,
1977) and Izhut and Kiliuda Bays (Feder and Jewett, in press). The major
epifaunal differences between NEGOA and the Prince William Sound Bays-
Kodiak Bay fauna were the low numbers of species of annelid and echinoderms
found in the bays. The survey in NEGOA revealed 30 species of Annelida
and 36 species of Echinodermata; however, these phyla in Alitak and Ugak
Bays comprised only 5 and 12 species, in Port Etches 1 and 4 species, in
Zaikof Bay 4 and 12 species, and in Rocky Bay 0 and 17 species, respectively.
The Solasteridae and the Asteriidae were the most diverse echinoderm
families collected with 8 species represented. Pandalidae, Hippolytidae,
Crangonidae, and Paguridae were the most diverse crustacean families collect-
ed with 30 species represented. Astartidae, Cardiidae, and Buccinidae were
the most diverse molluscan families collected, with 10 species represented.
33
Food Habits
The main species examined for stomach contents were the snow crab
(Chionoecetes bairdi) and the sunflower sea star (Pycnopodia helianthoides).
Inference from the present study, as well as past snow crab food stud-
ies (Yasuda, 1967; Feder and Jewett, 1977; 1980, in press; Paul et al., 1979;
Feder and Matheke, 1980) involving prey species, suggests that items used
for food by snow crab are area specific. Most of the important items con-
sumed by snow crab in Port Etches, Zaikof Bay and Rocky Bay, (i.e., gastro-
pods, bivalves, snow crab, sediment) differed somewhat from those used by
this species in Cook Inlet and Kodiak Island (Feder and Jewett, 1977; Feder
and Paul, 1980). Paul et al. (1979) examined 715 snow crabs in Cook Inlet,
and found the main items, in order of decreasing percent frequency of oc-
currence in stomachs, were bivalves, hermit crabs (Pagurus spp.), barnacles
(Balanus spp.), and sediment. The only similar food items used by snow
crab in the present study were clams and sediment. Snow crab stomachs
examined in Port Valdez primarily contained sediment (Feder and Matheke,
1980). The role of sediment in crab feeding is not known. However,
Moriarty (1977) reported on the occurrence of sediment in the food contents
of five species of penaeid shrimps. The nutritional benefit of sediment
for these shrimps appeared to be derived from the film of organic carbon,
including bacteria, on sand grains. Yasuda (1967) found benthic diatoms
to be abundant in Chionoecetes opilio elongatus stomachs in the Bering Sea,
but postulated that diatoms were taken inadvertently with food and sediment.
Data from the present study, as well as other sunflower sea star in-
vestigations (e.g., Mauzey et al., 1968; Paul and Feder, 1975; Jewett and
Feder, 1976; Feder and Jewett, in press) suggest that food used by Pycnopodia
helianthoides is similar in different geographic locations. The important
food items (i.e., gastropods and bivalves) consumed by sunflower sea stars
in Port Etches, Zaikof and Rocky Bays confirm the food items used by this
species in four other northeastern bays of Prince William Sound (Paul and
Feder, 1975), Izhut and Kiliuda Bays of Kodiak Island (Jewett and Feder, in
press), and NEGOA (Jewett and Feder, 1976; Feder et al., in press). Paul
and Feder (1975) reported intertidal and shallow subtidal P. helianthoides
34
from Prince William Sound feeding primarily on small bivalve mollusks.
However, the sea star is also capable of excavating for large clams (Mauzey
et al., 1968; Paul and Feder, 1975; Feder and Jewett, in press) examined
sunflower sea stars from Kodiak Island and found the main items, in order
of decreasing percent frequency of occurrence, were snails (Oenopota spp.
and Solariella spp.) and bivalves (Nuculana fossa, Psephidia lordi and
Spisula polynyma). Feder et al. (in press) examined sunflower sea stars
in NEGOA, and found Ophiura sarsi, Cardiidae, Naticidae to be the dominant
food items.
One of the known predator and food competitors of P. helianthoides
is the king crab, Paralithodes camtschatica. Many P. helianthoides observed
by SCUBA diving near Kodiak Island were tightly squeezed into rock crevices
when king crab were in the vicinity. This behavior may represent an avoid-
ance response by the sea star (Feder and Jewett, in press).
CONCLUSION
Benthic trawling operations in Port Etches resulted in the collection
of six invertebrate phyla and 39 species; Zaikof Bay and Rocky Bay pro-
duced 11 and 78, and 9 and 86 phyla and species, respectively. Echinoderms
dominated the biomass in all three bays. The sea star, Pycnopodia helian-
thoides, was dominant in Port Etches and Zaikof Bay, and the basket star,
Gorgonocephalus caryi, was dominant in Rocky Bay as well as Zaikof Bay.
Species dominated each bay in the following manner: Port Etches -
Arthropoda (22 species), Mollusca (8) and Echinodermata (4); Zaikof Bay -
Mollusca (27), Arthropoda (24) and Echinodermata (12); and Rocky Bay -
Arthropoda (35), Mollusca (24) and Echinodermata (18).
Since echinoderms made up the bulk of the epifaunal invertebrate
biomass in the study areas, their biological importance cannot be over-
looked. It is suggested that these organisms do not represent relatively
immobile carbon reservoirs as has been often suggested. Instead, they
contribute pulses of high energy organic material, as gametes, into adja-
cent waters during their spawning periods. It is possible that the
gametes shed by the large populations of echinoderms in the study areas
35
represent important components generally overlooked in calculations of
secondary productivity (Feder and Paul, unpub.).
Feeding data on invertebrates and fishes in the present study, in
addition to feeding data compiled in previous OCSEAP studies, enhance
our understanding of benthic trophic relationships for the Gulf of Alaska
shelf.
There is now a satisfactory knowledge, on a station basis (for the
months sampled), of the distribution, abundance and biomass of the major
epifaunal invertebrates in the three bays studied. Additional seasonal
data are essential. It is only when continuing information is available
that a reasonable assessment of the effect of an oil spill on the benthic
biota of these areas can be accomplished.
Availability of many readily identifiable, biologically well under-
stood organisms is a preliminary to the development of monitoring programs.
Sizeable biomasses of taxonomically well-known echinoderms, crustaceans,
and molluscs were typical of most of our stations, and many species of
these phyla were sufficiently abundant to represent organisms potentially
useful as monitoring tools. The present investigation has clarified sev-
eral aspects of the biology of some of these organisms, and should aid in
the development of future monitoring programs for the Prince William Sound
areas.
36
REFERENCES
Arctic Environmental Information and Data Center. 1975. Kadyak - a back-ground for living. Univ. Alaska, AEIDC Publ. No. B-75, Sea Grant Publ.No. 75-9. 326 pp.
Anonymous. 1964. Catch records of a trawl survey conducted by the Inter-national Pacific Halibut Commission between Unimak Pass and Spencer,Alaska from May 1961 to April 1963. Report, I.P.H.C. 36:524.
Bakus, G. J. and D. W. Chamberlain. 1975. An Oceanographic and MarineBiological Study in the Gulf of Alaska. Report submitted to AtlanticRichfield Co. 57 pp.
Boesch, D. F., C. H. Hershner and J. H. Milgram. 1974. Oil Spills and theMarine Environment. Ballinger Publishing Co., Cambridge, Mass. 114 pp.
Donaldson, W. 1977. Project No. 5-35-R Commercial Fisheries Research andDevelopment Act. Kodiak, Alaska tanner crab (Chionoecetes bairdi)research. July 1, 1973 to June 30, 1976. Report to NOAA, NMFS,Washington, D.C. pp. 140.
Feder, H. M. and S. C. Jewett. 1977. The distribution, abundance, bio-mass and diversity of the epifauna of two bays (Alitak and Ugak) ofKodiak Island, Alaska. Inst. Mar. Sci. Rept. R77-3, Univ. Alaska,Fairbanks. 74 pp.
Feder, H. M. and S. C. Jewett. 1980. A survey of the invertebrates ofthe southeastern Bering Sea with notes on the feeding biology ofselected species. Inst. Mar. Sci. Rept. R78-5, Univ. Alaska,Fairbanks. 105 pp.
Feder, H. M. and S. C. Jewett. In press. Distribution, abundance, com-munity structure and trophic relationships of the nearshore benthosof the Kodiak Continental Shelf. Inst. Mar. Sci. Rept. R81-1, Univ.Alaska, Fairbanks.
Feder, H. M. and G. E. Matheke. 1979. Distribution, abundance, com-munity structure, and trophic relationships of the benthic infaunaof the northern Gulf of Alaska. Final Rept. to NOAA, R.U. #5, Inst.Mar. Sci., Univ. Alaska, Fairbanks. 247 pp.
Feder, H. M. and G. E. Matheke. 1980. Subtidal Benthos. Chapter 9.In J. M. Colonell (ed.), Environmental Studies of Port Valdez,Alaska: 1967-1979. Inst. Mar. Sci. Occas. Pub. No 5, Univ. Alaska,Fairbanks. 382 pp.
Feder, H. M. and G. Mueller. 1975. Environmental assessment of the north-east Gulf of Alaska: Benthic Biology. First Year Final Report to NOAA.Inst. Mar. Sci. 200 pp.
37

Feder, H. M. and A. J. Paul. 1978. Biological cruises of the R/V Aconain Prince William Sound, Alaska from 1970-1973. Inst. Mar. Sci.Rept. R77-4 (Sea Grant Rept. 76-6), Univ. Alaska, Fairbanks. 76 pp.
Feder, H. M. and A. J. Paul. 1980. Distribution, abundance, communitystructure and trophic relationships of the nearshore benthos of CookInlet. Final Rept. to NOAA, R.U. #5, Inst. Mar. Sci., Univ. Alaska,Fairbanks. 609 pp.
Feder, H. M., G. T. Mueller, M. H. Dick and D. B. Hawkins. 1973. Pre-liminary Benthos Survey, pp. 305-386. In D. W. Hood, W. E. Shieldsand E. J. Kelley (eds.), Environmental Studies of Port Valdez. Inst.Mar. Sci. Occas. Publ. No. 3, Univ. Alaska, Fairbanks. 495 pp.
Feder, H. M., K. Haflinger, M. Hoberg and J. McDonald. 1980. The in-faunal invertebrates of the southeastern Bering Sea. Final Rept. toNOAA, R.U. #5, Inst. Mar. Sci., Univ. Alaska, Fairbanks. 399 pp.
Feder, H. M., S. C. Jewett, S. McGee. In press. Distribution, abundance,community structure and trophic relationships of the benthos of thenortheast Gulf of Alaska extending from Icy Bay to Cape Fairweather.Final Rept. to NOAA R.U. #5, Inst. Mar. Sci., Univ. Alaska, Fairbanks.
Hitz, C. R. and W. F. Rathjen. 1965. Bottom trawling surveys of thenortheastern Gulf of Alaska. Comm. Fish. Review 27(9):1-15.
Hughes, S. E. 1974. Groundfish and crab resources in the Gulf of Alaska -based on International Pacific Halibut Commission trawl surveys, May1961 - March 1963. U.S. Dept. Commer., Natl. Oceanic Atmos. Admin.,Natl. Mar. Fish. Serv., Data Rept.
Jewett, S. C. 1977. Food of the Pacific cod, Gadus macrocephalus Tilesius,near Kodiak Island, Alaska. M.S. Thesis, Univ. Alaska, Fairbanks.23 pp.
Jewett, S. C. and H. M. Feder. 1976. Distribution and abundance of someepibenthic invertebrates of the northeast Gulf of Alaska, with noteson the feeding biology of selected species. Inst. Mar. Sci. Rept.R76-8, Univ. Alaska, Fairbanks. 61 pp.
Jewett, S. C. and G. C. Powell. 1979. Summer food of the sculpinsMyoxocephalus spp. and Hemilepidotus jordani, near Kodiak Island,Alaska. Mar. Sci. Comm. 5(4,5):315-331.
Karinen, J. F. and S. D. Rice. 1974. Effects of Prudhoe Bay crude oil onmolting Tanner crabs, Chionoecetes bairdi. Mar. Fish. Rev. (36(7):31-37.
Kineman, J. J., R. Elmgren and S. Hansson. 1980. The Tsesis Oil Spill.U.S. Dept. of Commerce. NOAA Outer Continental Shelf EnvironmentalAssessment Program. 296 pp.
38
Lewis, J. R. 1970. Problems and approaches to base-line studies in coastalcommunities. FAO Technical Conference on Marine Pollution and itsEffects on Living Resources and Fishing. FIR:MP 70/E-22. 7 pp.
Mauzey, K. P., C. Birkeland and P. K. Dayton. 1968. Feeding behavior ofasteroids and escape responses of their prey in the Puget Sound re-gion. Ecology 49:603-619.
Moriarty, D. J. W. 1977. Quantification of carbon, nitrogen and bacterialbiomass in the food of some Penaeid prawns. Aust. J. Freshwater Res.28:113-118.
Mueller, G. 1975. A preliminary taxon list and code for ADP processing.Sea Grant Proj. A/77-02. 159 pp.
Neiman, A. A. 1963. Quantitative distribution of benthos and food supplyof demersal fish in the eastern part of the Bering Sea. Tr. Vses.Nauchno-issled. Inst. Morsk. Rybn. Khoz. Okeanogr. 50:145-205.(Transl. from Russian by Israel Prog. Sci. Transl., Jerusalem, asSoviet Fish. Inv. Northeast Pacific. Part I. pp. 143-217).
Nelson-Smith, A. 1973. Oil Pollution and Marine Ecology. Paul Elek (Scien-tific Books) Ltd., London. 260 pp.
Olson, T. A. and F. J. Burgess (eds). 1967. Pollution and Marine Ecology.Interscience, New York. 364 pp.
Paul, A. J. and H. M. Feder. 1975. The food of the sea star Pyonopodiahelianthoides (Brandt) in Prince William Sound, Alaska. Ophelia14:15-22.
Paul, A. J., H. M. Feder and S. C. Jewett. 1979. Food of the snow crabChionoecetes bairdi Rathbun 1924, from Cook Inlet, Alaska. Crustaceana5:62-68.
Pearson, T. H. 1971. The benthic ecology of Loch Linnhe and Lock Eil, asea loch system on the west coast of Scotland. III. The effect onthe benthic fauna of the introduction of pulp mill effluent. J. Exp.Mar. Biol. Ecol. 6:211-233.
Pearson, T. H. 1972. The effect of industrial effluent from pulp andpaper mills on the marine benthic environment. Proc. Roy. Soc. Long.B. 130P469-485.
Pearson, T. H. 1975. The benthic ecology of Loch Linnhe and Loch Eil, asea loch system on the west coast of Scotland. IV. Changes in thebenthic fauna attributable to organic enrichment. J. Exp. Mar. Biol.Ecol. 20:1-41.
Pearson, T. H. 1980. Marine pollution effects of pulp and paperindustry wastes. Helgoländer Meeresunters 33:340-365.
39
Powell, G. C., R. Kaiser and R. Peterson. 1974. King crab study. AlaskaDepartment of Fish and Game Completion Report. Project No. 5-30-R.69 pp.
Rhoads, D. C. 1974. Organism-sediment relations on the muddy sea floor.Oceanogr. Mar. Biol. Ann. Rev. 12:263-300.
Ronholt, L. L., H. H. Shippen and E. S. Brown. 1976. An assessment ofthe demersal fish and invertebrate resources of the northeasternGulf of Alaska, Yakutat Bay to Cape Cleare, May-August 1975. Ann.Rept. U.S. Dept. Commer., Natl. Oceanic Atmos. Admin., Nat. Mar.Fish. Serv. 184 pp.
Rosenberg, D. H. (ed.). 1972. A review of the oceanography and renewableresources of the northern Gulf of Alaska. Inst. Mar. Sci. Rept.R72-23, Sea Grant Rept. 73-3. 690 pp.
Rosenberg, R. 1973. Succession in benthic macrofauna in a Swedish fjordsubsequent to the closure of a sulphite pulp mill. Oikos 24:244-258.
Schaefers, E. A., K. S. Smith, M. R. Greenwood. 1955. Bottomfish andshellfish explorations in Prince William Sound area, Alaska, 1954.Comm. Fish. Rev. 17(4):6-28 (also Sep. No. 398).
Smith, J. E. (ed.). 1968. Torrey Canyon Pollution and Marine Life.Cambridge Univ. Press, Cambridge. 196 pp.
Smith, R., A. Paulson and J. Rose. 1976. Food and feeding relationshipsin the benthic and demersal fishes of the Gulf of Alaska and BeringSea. Ann. Rept. to NOAA R.U. #284, Inst. Mar. Sci., Univ. Alaska,Fairbanks. 38 pp.
Straughan, D. 1971. Biological and Oceanographic Survey of the SantaBarbara Channel Oil Spill 1969-1970. Allan Hancock Foundation, Univ.Southern California, Los Angeles. 425 pp.
Yasuda, T. 1967. Feeding habits of the Zuwaigani, Chionoecetes opilioelongatus, in Wakasa Bay. I. Specific composition of the stomachcontents. Bull. Jap. Soc. Sci. Fish 33(4):315-319. (Transl. fromJap.-Fish. Res. Bd. Can. Transl. Ser. No. 1111).
Zenkevitch, L. A. 1963. Biology of the Seas of the USSR. George Allenand Unwin., Ltd., London. 955 pp.
40
APPENDIX TABLE I
BENTHIC TRAWL STATIONS OCCUPIED IN THREE BAYS IN
PRINCE WILLIAM SOUND, 1978
41
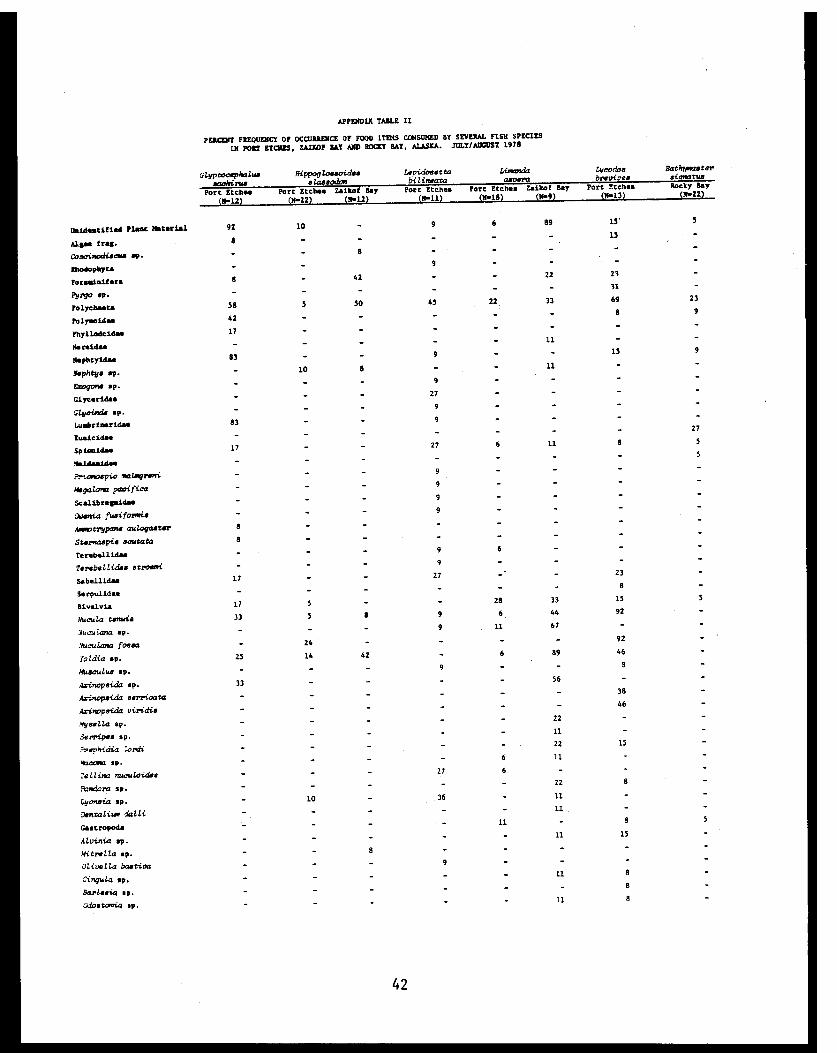
APPENDIX TABLE II
PERCENT FREQUENCY OF OCCURRENCE OF FOOD ITEMS CONSUMED BY SEVERAL FISH SPECIES
IN PORT ETCHIS, ZAIKOF BAY AND ROCKY BAY, ALASKA. JOLY/AUGUST 1978
42
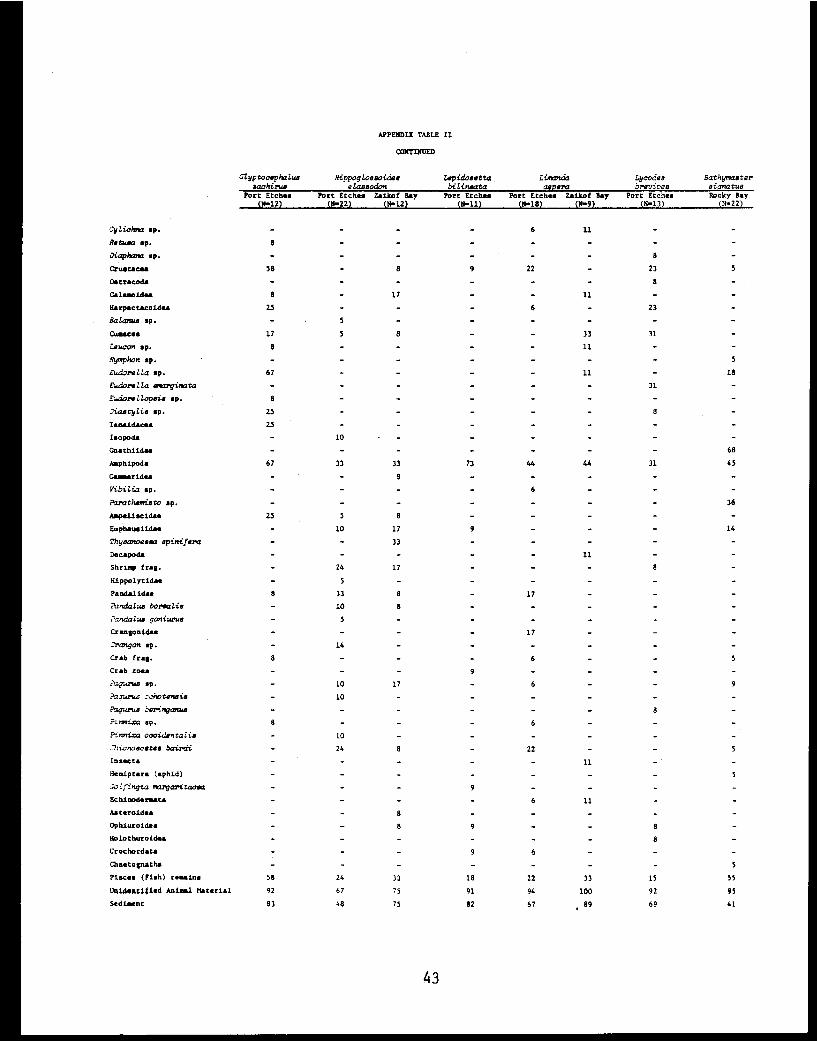
APPENDIX TABLE II
CONTINUED
43


OCSEAP FINAL REPORT
Contract: #03-5-022-56Task Order: #15Research Unit: #5Reporting Period: 1976-1978
DISTRIBUTION, ABUNDANCE, COMMUNITY STRUCTUREAND TROPHIC RELATIONSHIPS OF THE NEARSHORE BENTHOS
OF COOK INLET
Dr. H. M. Feder, Principal Investigator
Assisted by A. J. Paul
with
Max HobergStephen JewettGrant MathekeKristy McCumbyJudy McDonaldRandy Rice
Phyllis Shoemaker
Institute of Marine ScienceUniversity of Alaska
Fairbanks, Alaska 99701
March 1980
45
ACKNOWLEDGEMENTS
We would like to thank the officers and crew of the NOAA vessels
involved in sampling. We would also like to thank the following Institute
of Marine Science, University of Alaska personnel: Steve McGee for labo-
ratory assistance; James Dryden, Cydney Hansen, Rosemary Hobson, Dave
Nebert, Frank Summers and Bob Sutherland for assistance in programming
and other data processing; and Ana Lea Vincent, Helen Stockholm, Martha Fisk
and the IMS Publications staff for aid in preparation of this report.
Laboratory facilities were provided by the Institute of Marine Science at
the Seward Marine Station and the Fairbanks Campus.
Kim Sundberg of the Alaska Department of Fish and Game and Marine/
Coastal Habitat Management Group provided samples of post-larval king crab;
this group also provided clam samples used in age-growth studies.
46
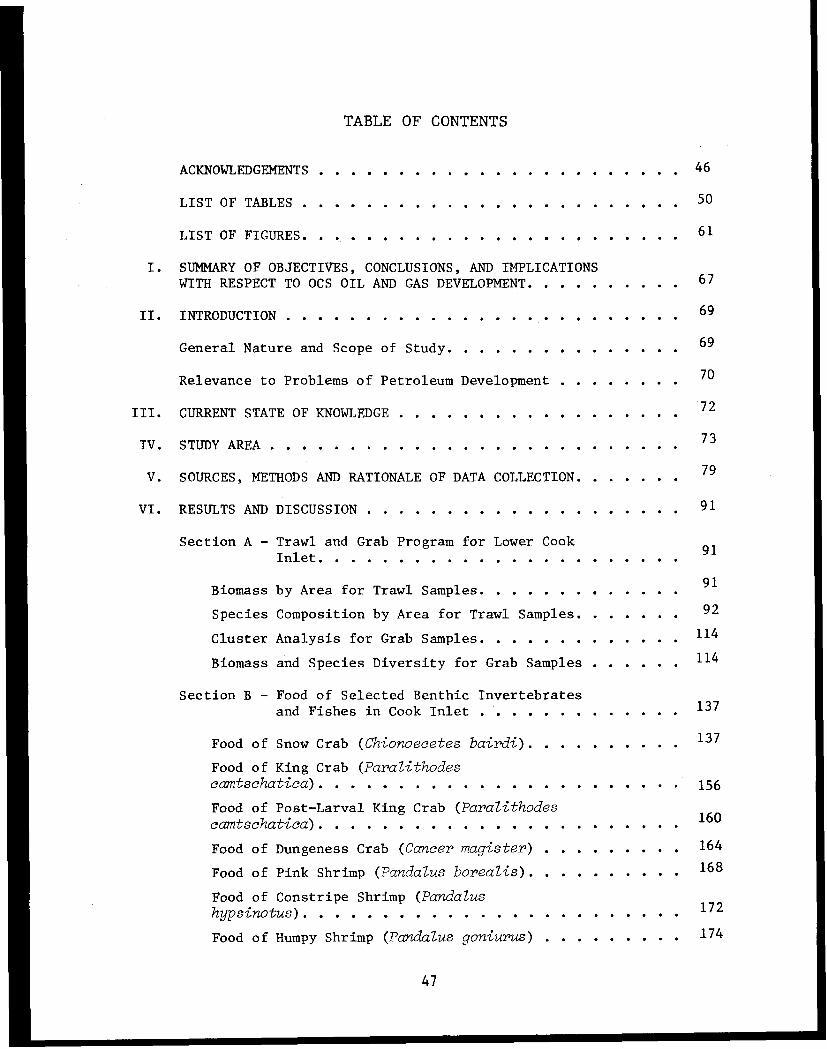
TABLE OF CONTENTS
ACKNOWLEDGEMENTS . . . . . . . . . . . . . . . . . . . . . . 46
LIST OF TABLES ........................ 50
LIST OF FIGURES. . . ..................... 61
I. SUMMARY OF OBJECTIVES, CONCLUSIONS, AND IMPLICATIONSWITH RESPECT TO OCS OIL AND GAS DEVELOPMENT . . . . . . . . . 67
II. INTRODUCTION ......................... 6 9
General Nature and Scope of Study. . ............. 69
70Relevance to Problems of Petroleum Development . . . . . . . .
72III. CURRENT STATE OF KNOWLEDGE ....................... 72
IV. STUDY AREA . . . . . . . . . . . . . . . . . . . . . . . . . . 7 3
79V. SOURCES, METHODS AND RATIONALE OF DATA COLLECTION . . . . . . 7 9
VI. RESULTS AND DISCUSSION . . . . . . . . . . . . . . . .... . .. 91
Section A - Trawl and Grab Program for Lower CookInlet . . . . . . . . . . . . . . . . .. . . . .
Biomass by Area for Trawl Samples . . . . . . . . . . . . 91
Species Composition by Area for Trawl Samples. . . . . .. . 92
Cluster Analysis for Grab Samples. . . . . . . . . . . .. .114
Biomass and Species Diversity for Grab Samples . ..... 114
Section B - Food of Selected Benthic Invertebratesand Fishes in Cook Inlet . . . . . . . . . . . 137
Food of Snow Crab (Chionoecetes bairdi). . . . . . . . .. 137
Food of King Crab (Paralithodescamtschatica). . . . . . . . . . . . . . . . .... . . . . 156
Food of Post-Larval King Crab (Paralithodescamtschatica) . . . . . . . . . . . . . . . . . .....
Food of Dungeness Crab (Cancer magister) . . . . . . ... . 164
Food of Pink Shrimp (Pandalus borealis). . . . . . . . .. 168
Food of Constripe Shrimp (Pandalus
hypsinotus) . . . . . . . . . . . . . . . . . . . . . . .
Food of Humpy Shrimp (Pandalus goniurus) . . . . . . . . . 174
47
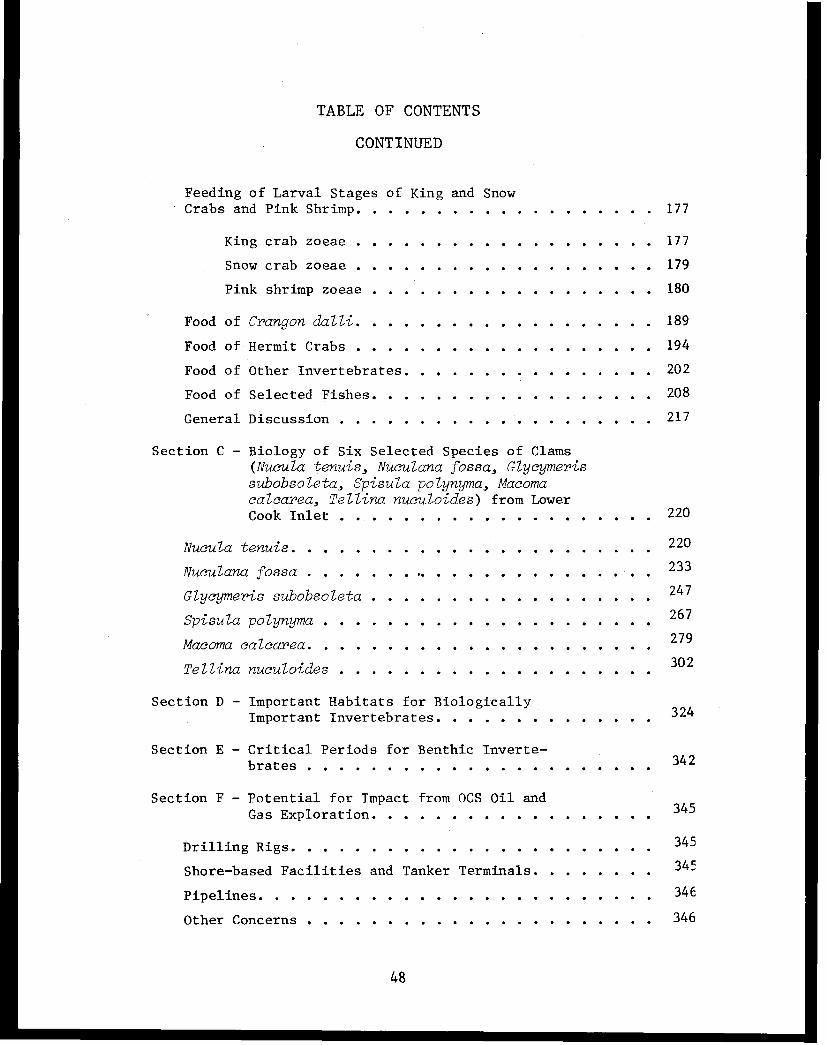
TABLE OF CONTENTS
CONTINUED
Feeding of Larval Stages of King and SnowCrabs and Pink Shrimp. . . . . . . . . . . . . . . . . . . 177
King crab zoeae ............................. 177
Snow crab zoeae . . . . . . . . . . . . . . . ..... 179
Pink shrimp zoeae .................. . 180
Food of Crangon dalli. . . . . . . . . . . . . . ..... .189
Food of Hermit Crabs ............................. 194
Food of Other Invertebrates. . . . . . . . . . . ..... .. . 202
Food of Selected Fishes . . . . . . . . . . . . . ... . . 208
General Discussion. ... . . . . . . . ..... .. . .. 217
Section C - Biology of Six Selected Species of Clams(Nucula tenuis, Nuculana fossa, Glycymerissubobsoleta, Spisula polynyma, Macomacalcarea, Tellina nuculoides) from LowerCook Inlet ................... . 220
Nucula tenuis. . . . . . . . . . . . . . . . . . ..... 220
Nuculana fossa .............. .............. 233
Glycymeris subobsoleta . . . . . . . . . . . . ...... 247
Spisula polynyma . .................. .. 267
Macoma calcarea . . . . . . . . . . ........... 279
Tellina nuculoides . . . . . . . . . .......... 302
Section D - Important Habitats for BiologicallyImportant Invertebrates . . . . . . ........ 324
Section E - Critical Periods for Benthic Inverte-brates . . . . . . . . . . . . . . . . . . . . . . 342
Section F - Potential for Impact from OCS Oil andGas Exploration. . . . . . . . . . . . . . . . . .
Drilling Rigs. . . . . . . . . . . . . .. . . . . . 3 4 5
Shore-based Facilities and Tanker Terminals. . . . . . . . 3 4 5
Pipelines. . . . . . . . . . . . . . . . . ... .. .... . 346
Other Concerns ............ .......... 346
48
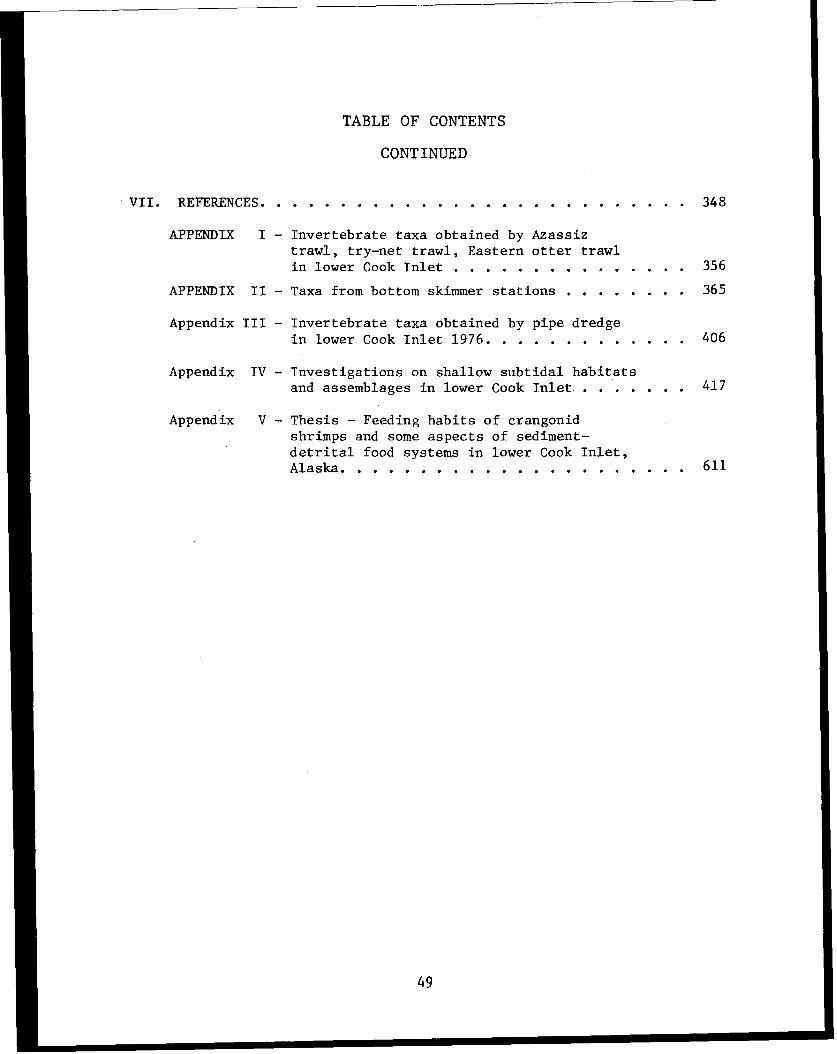
TABLE OF CONTENTS
CONTINUED
VII. REFERENCES. . . . . . . . . . . . . . . . . ... . . . . .... . 348
APPENDIX I - Invertebrate taxa obtained by Azassiztrawl, try-net trawl, Eastern otter trawlin lower Cook Inlet . . . . . . . . . . . . ... . 356
APPENDIX II - Taxa from bottom skimmer stations . . . . . .. . .365
Appendix III - Invertebrate taxa obtained by pipe dredgein lower Cook Inlet 1976. .................. 406
Appendix IV - Investigations on shallow subtidal habitatsand assemblages in lower Cook Inlet . ....... .417
Appendix V - Thesis - Feeding habits of crangonidshrimps and some aspects of sediment-detrital food systems in lower Cook Inlet,Alaska. . . . . . . . . . . . . . . . . . . . . . 611
49
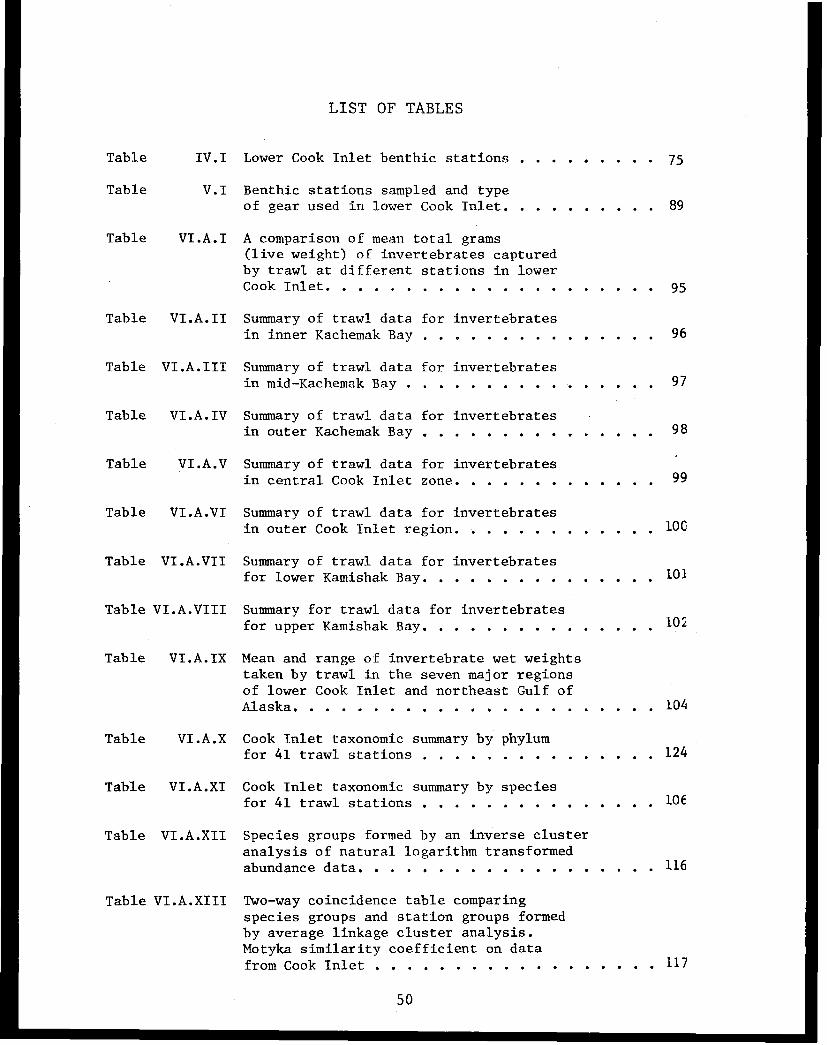
LIST OF TABLES
Table IV.I Lower Cook Inlet benthic stations . . . . . . ... . 75
Table V.I Benthic stations sampled and typeof gear used in lower Cook Inlet. . . . . . . ... . 89
Table VI.A.I A comparison of mean total grams(live weight) of invertebrates capturedby trawl at different stations in lowerCook Inlet. . . . . . . . . . . . . . . . .... ... . 95
Table VI.A.II Summary of trawl data for invertebratesin inner Kachemak Bay . . . . . . . . . . . . ... . 96
Table VI.A.III Summary of trawl data for invertebratesin mid-Kachemak Bay. .... ............ 97
Table VI.A.IV Summary of trawl data for invertebratesin outer Kachemak Bay . . . . . . . . . . . ... . .98
Table VI.A.V Summary of trawl data for invertebratesin central Cook Inlet zone. . . . . . . . . .... . 99
Table VI.A.VI Summary of trawl data for invertebratesin outer Cook Inlet region. . . . . . . . . . . .. . 100
Table VI.A.VII Summary of trawl data for invertebratesfor lower Kamishak Bay. . .. .. . . . . . . . 101
Table VI.A.VIII Summary for trawl data for invertebratesfor upper Kamishak Bay. . . . . . . . . . . . . . . 102
Table VI.A.IX Mean and range of invertebrate wet weightstaken by trawl in the seven major regionsof lower Cook Inlet and northeast Gulf ofAlaska. . . . . . . . . . . . . . . . .... ..... . 104
Table VI.A.X Cook Inlet taxonomic summary by phylumfor 41 trawl stations . . . . . . . . . . . . . . . 124
Table VI.A.XI Cook Inlet taxonomic summary by speciesfor 41 trawl stations . . . . . . . . . . . . . .. 106
Table VI.A.XII Species groups formed by an inverse clusteranalysis of natural logarithm transformedabundance data. . . . . . . . . . . . . . ..... .116
Table VI.A.XIII Two-way coincidence table comparingspecies groups and station groups formedby average linkage cluster analysis.Motyka similarity coefficient on datafrom Cook Inlet .................. 117
50
LIST OF TABLES
CONTINUED
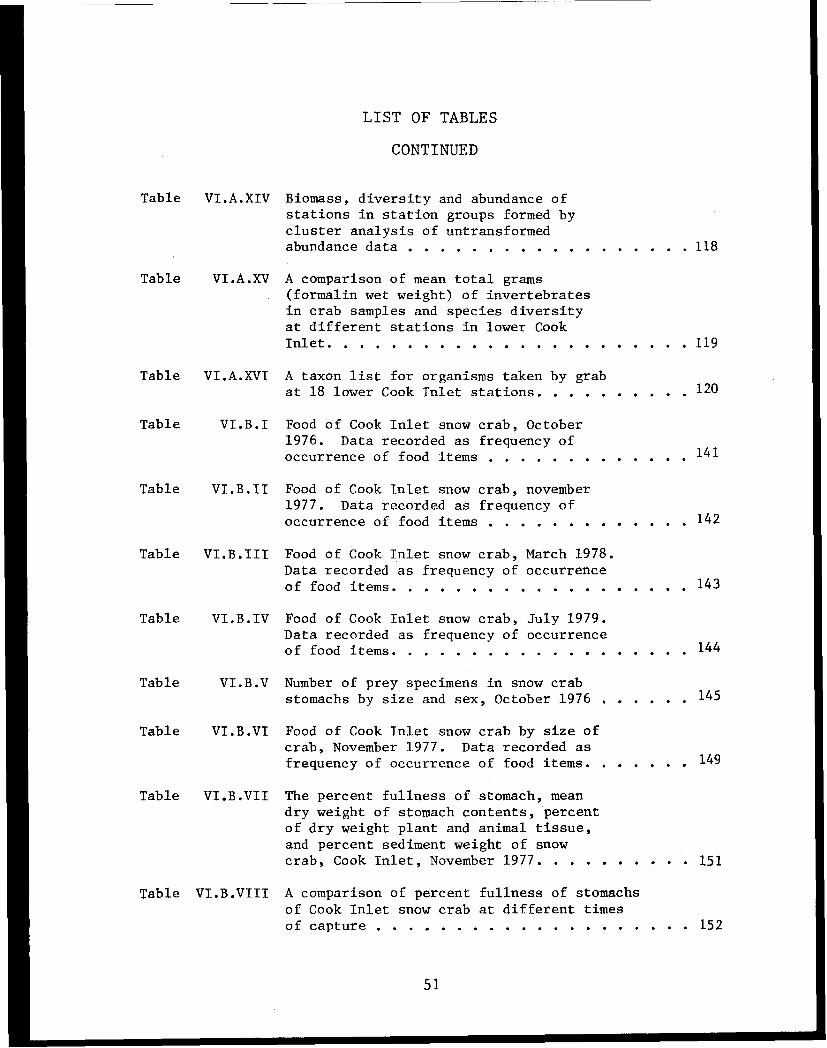
Table VI.A.XIV Biomass, diversity and abundance ofstations in station groups formed bycluster analysis of untransformedabundance data . . . . . . . . . . . . . . .... .. 118
Table VI.A.XV A comparison of mean total grams(formalin wet weight) of invertebratesin crab samples and species diversityat different stations in lower CookInlet. . . . . . . . . . . . . . . . . . .. .... .. 119
Table VI.A.XVI A taxon list for organisms taken by grabat 18 lower Cook Inlet stations. . . . . . . . .. . 120
Table VI.B.I Food of Cook Inlet snow crab, October1976. Data recorded as frequency ofoccurrence of food items . . . . . . . . . . . .. 141
Table VI.B.II Food of Cook Inlet snow crab, november1977. Data recorded as frequency ofoccurrence of food items . . . . . . . . . . . . . 142
Table VI.B.III Food of Cook Inlet snow crab, March 1978.Data recorded as frequency of occurrenceof food items. . . . . . . . . . . . . . . . . . . 143
Table VI.B.IV Food of Cook Inlet snow crab, July 1979.Data recorded as frequency of occurrenceof food items. . . . . . . . . . . . . . . . . . . 144
Table VI.B.V Number of prey specimens in snow crabstomachs by size and sex, October 1976 . . . . . . 145
Table VI.B.VI Food of Cook Inlet snow crab by size ofcrab, November 1977. Data recorded asfrequency of occurrence of food items. . . . . . . 149
Table VI.B.VII The percent fullness of stomach, meandry weight of stomach contents, percentof dry weight plant and animal tissue,and percent sediment weight of snowcrab, Cook Inlet, November 1977. . . . . . . ... . 151
Table VI.B.VIII A comparison of percent fullness of stomachsof Cook Inlet snow crab at different timesof capture ............................... 152
51

LIST OF TABLES
CONTINUED
Table VI.B.IX Percent fullness of stomachs of snowcrab after feeding in the laboratory(5°C) ... .. .... .................. 153
Table VI.B.X Consumption of Macoma balthica by snowcrab over a twenty-four hour period . . . . . ... .154
Table VI.B.XI Food of Cook Inlet snow carb less than20 mm width. Data recorded as frequencyof occurrence of food items . . . . . . . . . ... . 155
Table VI.B.XII Food of Cook Inlet king crab, KamishakBay. Data recorded as frequency ofoccurrence of food items.. .. . . . . . . . .. . . 158
Table VI.B.XIII Food of Cook Inlet king crab, KachemakBay. Data recorded ad frequency ofoccurrence of food items . . . . . . . . . . . . . 159
Table VI.B.XIV The food of Cook Inlet post-larval kingcrab, Kachemak Bay. Data recorded asfrequency of occurrence of food items . ...... . 162
Table VI.B.XV Food of Cook Inlet Dungeness crab widthsgreater than 50 mm. Data recorded asfrequency of occurrence of food items . ...... . 166
Table VI.B.XVI Food of Cook Inlet Cancer magister, carapacewidths of 22-45 mm. Data recorded asfrequency of occurrence of food items . ...... . 167
Table VI.B.XVII Food of Cook Inlet pink shrimp. Datarecorded as frequency of occurrence offood items. . . . . . . . . . . . . .. ...... .. 169
Table VI.B.XVIII Total dry weight of shrimp stomach contentsand percentage of dried stomach contentscomposed of sediment. . . . . . . . . . . . .... .170
Table VI.B.XIX Food of Cook Inlet coonstripe shrimp.Data recorded as frequency of occurrenceof food items ............................. 173
Table VI.B.XX Food of Cook Inlet humpy shrimp. Datarecorded as frequency of occurrence offood items. . . . . . . . . . . . . . . . .... ... . 176
52
LIST OF TABLES
CONTINUED
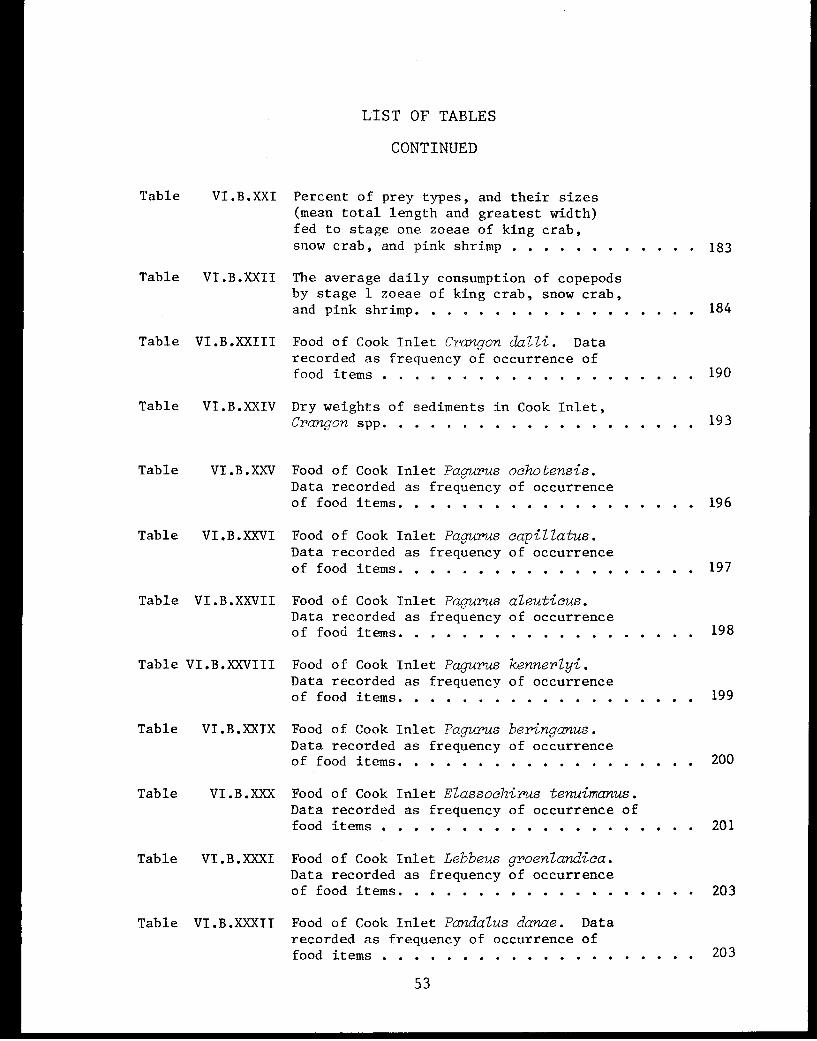
Table VI.B.XXI Percent of prey types, and their sizes(mean total length and greatest width)fed to stage one zoeae of king crab,snow crab, and pink shrimp . . . . . . . . . ... . 183
Table VI.B.XXII The average daily consumption of copepodsby stage 1 zoeae of king crab, snow crab,and pink shrimp. . . . . . . . . . . . . .. .. .184
Table VI.B.XXIII Food of Cook Inlet Crangon dalli. Datarecorded as frequency of occurrence offood items ........................... . 190
Table VI.B.XXIV Dry weights of sediments in Cook Inlet,Crangon spp. . . . . . . . . . . . . . . .... . .193
Table VI.B.XXV Food of Cook Inlet Pagurus ochotensis.Data recorded as frequency of occurrenceof food items. . . . . . . . . . . . . . ..... .196
Table VI.B.XXVI Food of Cook Inlet Pagurus capillatus.Data recorded as frequency of occurrenceof food items. . . . . . . . . . . . . ... .. .197
Table VI.B.XXVII Food of Cook Inlet Pagurus aleuticus.Data recorded as frequency of occurrenceof food items. . . . . . . . . . . . . ..... .. . . 198
Table VI.B.XXVIII Food of Cook Inlet Pagurus kennerlyi.Data recorded as frequency of occurrenceof food items. . . . . . . . . . . . . ..... . . . 199
Table VI.B.XXIX Food of Cook Inlet Pagurus beringanus.Data recorded as frequency of occurrenceof food items. . . . . . . . . . . . . . ..... .200
Table VI.B.XXX Food of Cook Inlet Elassochirus tenuimanus.Data recorded as frequency of occurrence offood items ................... . 201
Table VI.B.XXXI Food of Cook Inlet Lebbeus groenlandica.Data recorded as frequency of occurrenceof food items. . . . . . . . . . . . . ... .. .203
Table VI.B.XXXII Food of Cook Inlet Pandalus danae. Datarecorded as frequency of occurrence offood items ................... . 203
53
LIST OF TABLES
CONTINUED
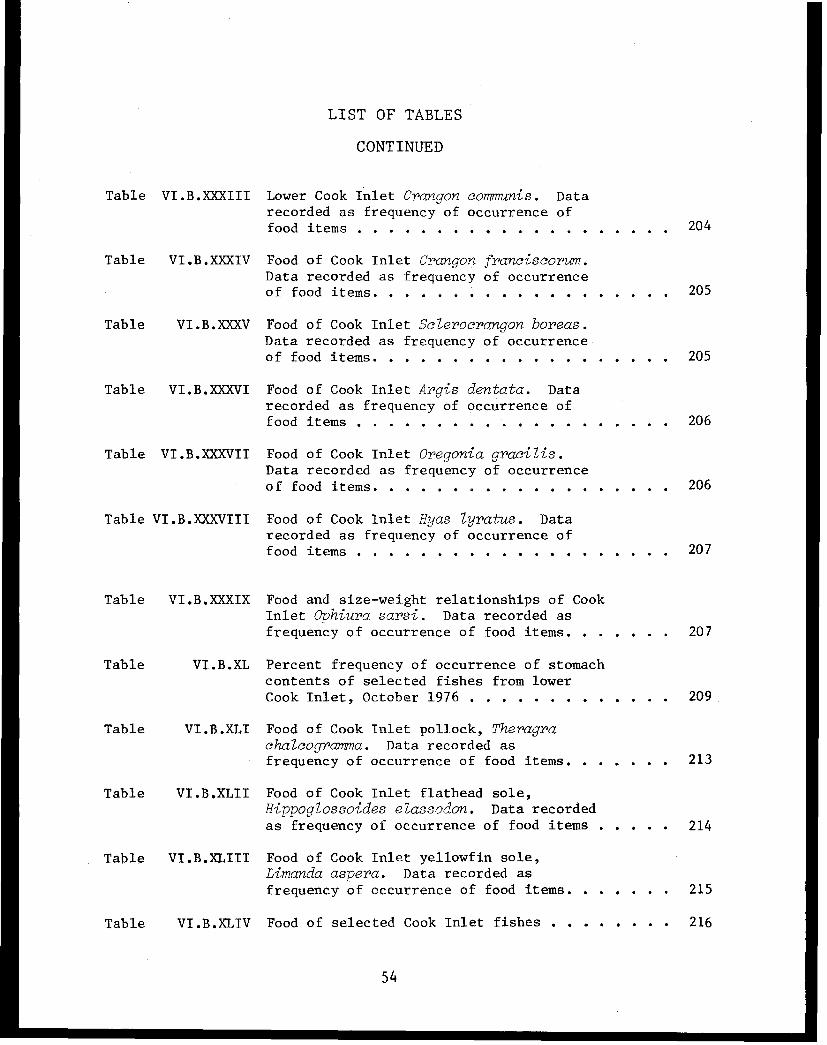
Table VI.B.XXXIII Lower Cook Inlet Crangon communis. Datarecorded as frequency of occurrence offood items ............................... 204
Table VI.B.XXXIV Food of Cook Inlet Crangon franciscorum.Data recorded as frequency of occurrenceof food items. .................... 205
Table VI.B.XXXV Food of Cook Inlet Sclerocrangon boreas.Data recorded as frequency of occurrenceof food items. .................... 205
Table VI.B.XXXVI Food of Cook Inlet Argis dentata. Datarecorded as frequency of occurrence offood items ............................... 206
Table VI.B.XXXVII Food of Cook Inlet Oregonia gracilis.Data recorded as frequency of occurrenceof food items. . . . . . . . . . . . . . . . ... 206
Table VI.B.XXXVIII Food of Cook Inlet Hyas lyratus. Datarecorded as frequency of occurrence offood items ........................ ....... 207
Table VI.B.XXXIX Food and size-weight relationships of CookInlet Ophiura sarsi. Data recorded asfrequency of occurrence of food items. ..... . 207
Table VI.B.XL Percent frequency of occurrence of stomachcontents of selected fishes from lowerCook Inlet, October 1976 . . . . . . . . . .. . .209
Table VI.B.XLI Food of Cook Inlet pollock, Theragrachalcogramma. Data recorded asfrequency of occurrence of food items. ........ 213
Table VI.B.XLII Food of Cook Inlet flathead sole,Hippoglossoides elassodon. Data recordedas frequency of occurrence of food items ..... 214
Table VI.B.XLIII Food of Cook Inlet yellowfin sole,Limanda aspera. Data recorded asfrequency of occurrence of food items. . ...... 215
Table VI.B.XLIV Food of selected Cook Inlet fishes ........ 216
54
LIST OF TABLES
CONTINUED
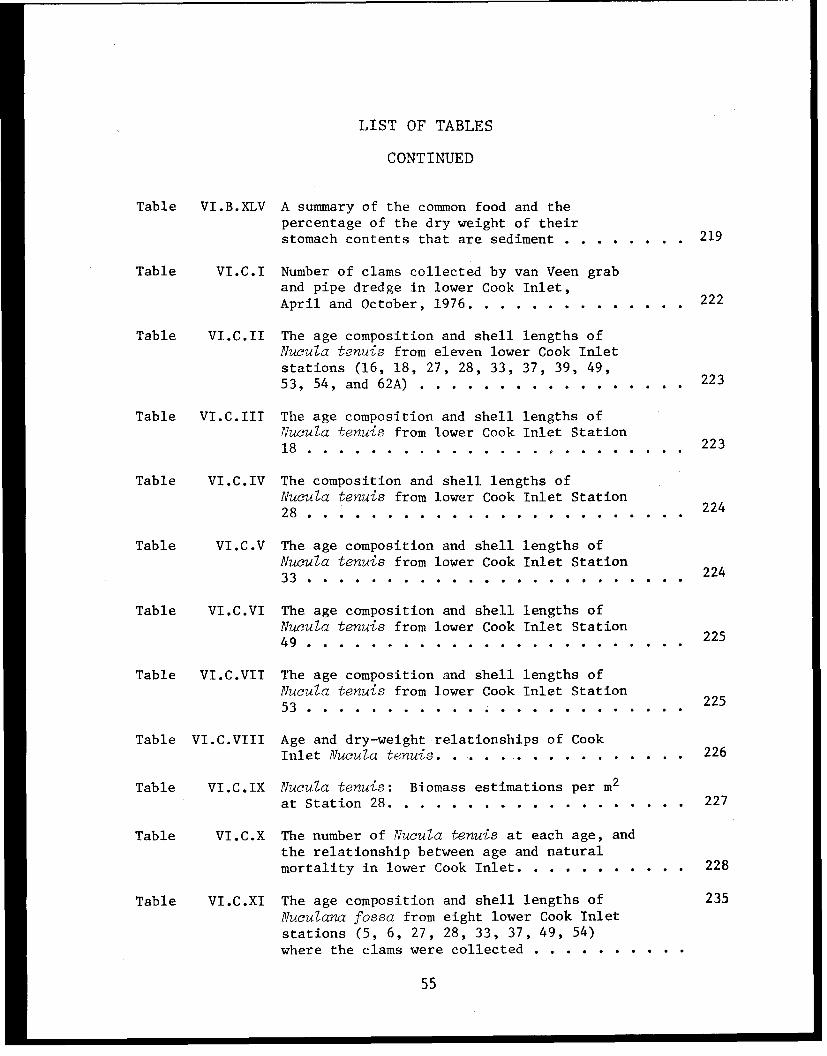
Table VI.B.XLV A summary of the common food and thepercentage of the dry weight of theirstomach contents that are sediment . . . . . ... . 219
Table VI.C.I Number of clams collected by van Veen graband pipe dredge in lower Cook Inlet,April and October, 1976. . . . . . . . . . . . . . 222
Table VI.C.II The age composition and shell lengths ofNucula tenuis from eleven lower Cook Inletstations (16, 18, 27, 28, 33, 37, 39, 49,53, 54, and 62A) . . . . . . . . . . . . . . . . . 223
Table VI.C.III The age composition and shell lengths ofNucula tenuis from lower Cook Inlet Station18 . .................. ..... . 223
Table VI.C.IV The composition and shell lengths ofNucula tenuis from lower Cook Inlet Station28 ............ ........... 224
Table VI.C.V The age composition and shell lengths ofNucula tenuis from lower Cook Inlet Station33 ......................... .......... 224
Table VI.C.VI The age composition and shell lengths ofNucula tenuis from lower Cook Inlet Station49 . . . . . . . . . . . . . . . . . . . . . . ..
Table VI.C.VII The age composition and shell lengths ofNucula tenuis from lower Cook Inlet Station53 . . . . . . . . . . . . . . . . . . . . . . ..
Table VI.C.VIII Age and dry-weight relationships of CookInlet Nucula tenuis. . .... ........... . .226
Table VI.C.IX Nucula tenuis: Biomass estimations per m²at Station 28. . . . . . . . . . . . . . . . ... .227
Table VI.C.X The number of Nucula tenuis at each age, andthe relationship between age and naturalmortality in lower Cook Inlet. . . . . . . . ... . 228
Table VI.C.XI The age composition and shell lengths of 235
Nuculana fossa from eight lower Cook Inlet
stations (5, 6, 27, 28, 33, 37, 49, 54)where the clams were collected . . . . . . . . . .
55
LIST OF TABLES
CONTINUED
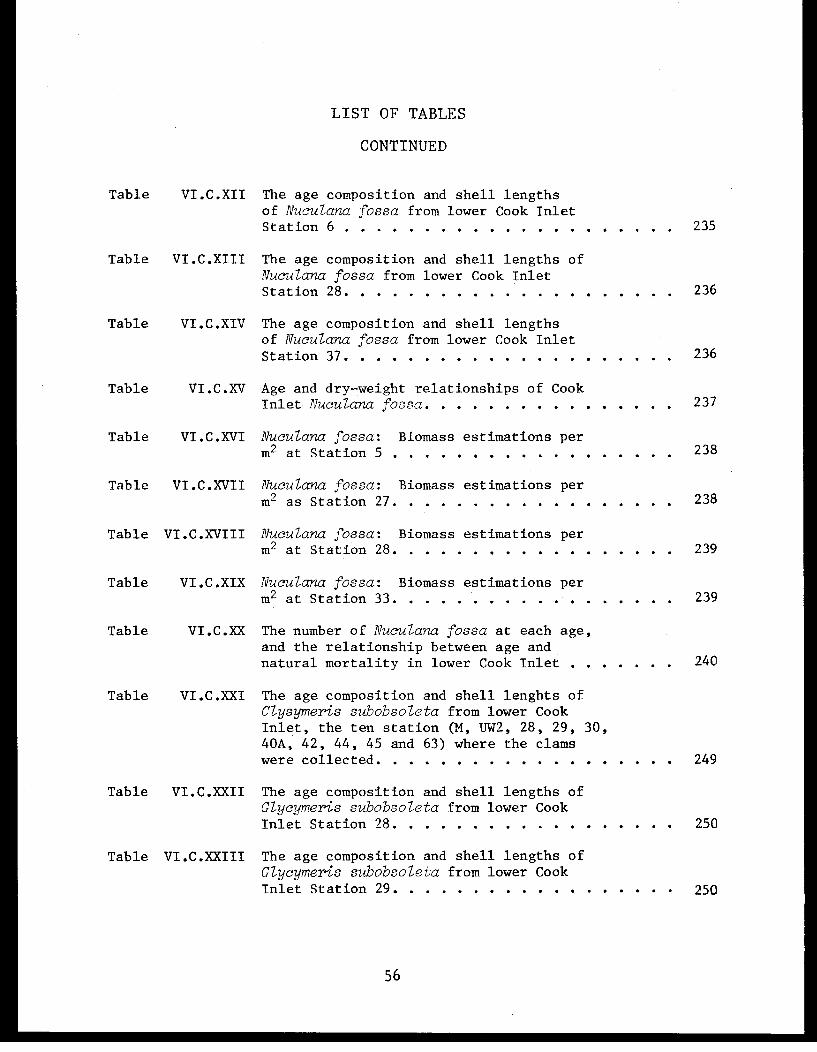
Table VI.C.XII The age composition and shell lengthsof Nuculana fossa from lower Cook InletStation 6 ................... .. . 235
Table VI.C.XIII The age composition and shell lengths ofNuculana fossa from lower Cook InletStation 28. . . . . . . . . . . . . . . . . ... . .236
Table VI.C.XIV The age composition and shell lengthsof Nuculana fossa from lower Cook InletStation 37. . . . . . . . . . . . . . . . .... ... 236
Table VI.C.XV Age and dry-weight relationships of CookInlet Nuculana fossa. . . . . . . . . . . . .... .237
Table VI.C.XVI Nuculana fossa: Biomass estimations perm² at Station 5. ....................... 238
Table VI.C.XVII Nuculana fossa: Biomass estimations perm² as Station 27. . . . . . . . . . . . . .. .. .238
Table VI.C.XVIII Nuculana fossa: Biomass estimations perm² at Station 28. ......................... .239
Table VI.C.XIX Nuculana fossa: Biomass estimations perm² at Station 33. . . . . . . . . . . . . . . . . 239
Table VI.C.XX The number of Nuculana fossa at each age,and the relationship between age andnatural mortality in lower Cook Inlet . ...... .240
Table VI.C.XXI The age composition and shell lenghts ofClysymeris subobsoleta from lower CookInlet, the ten station (M, UW2, 28, 29, 30,40A, 42, 44, 45 and 63) where the clamswere collected. . . . . . . . . . . . . . . ... . .249
Table VI.C.XXII The age composition and shell lengths ofGlycymeris subobsoleta from lower CookInlet Station 28. . . . . . . . . . . . . . . ... . 250
Table VI.C.XXIII The age composition and shell lengths ofGlycymeris subobsoleta from lower CookInlet Station 29 ................ . .250
56
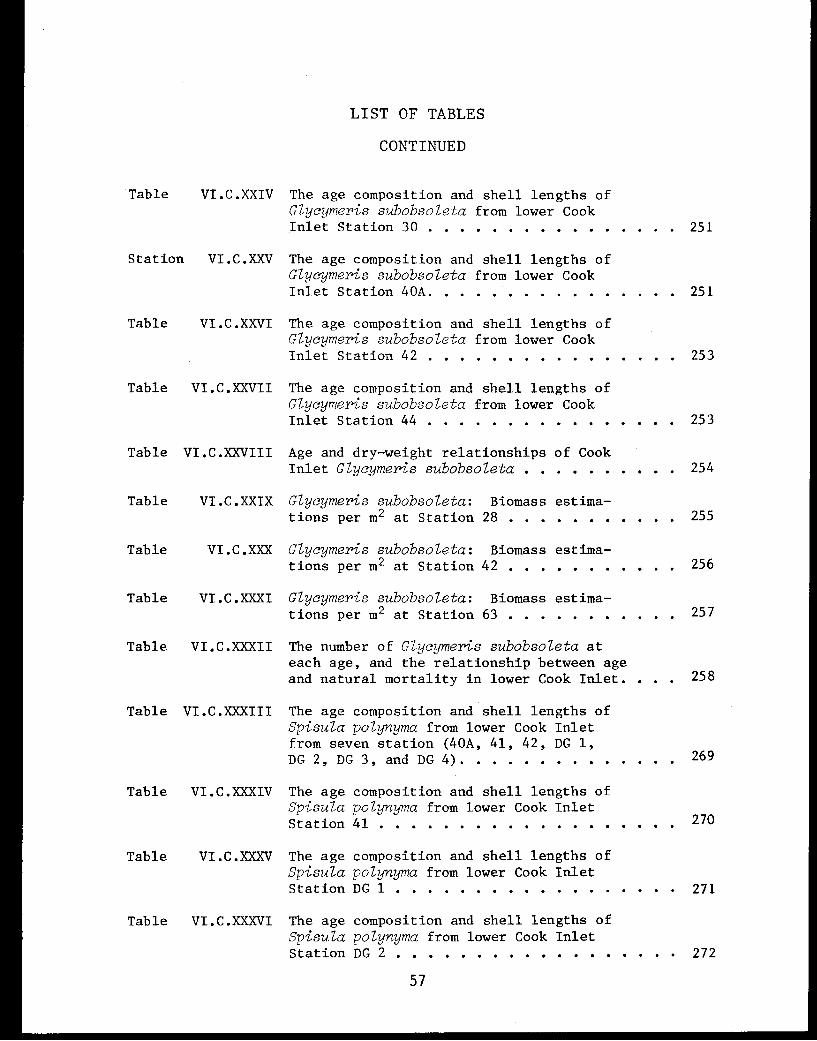
LIST OF TABLES
CONTINUED
Table VI.C.XXIV The age composition and shell lengths ofGlycymeris subobsoleta from lower CookInlet Station 30 . . . . . . . . . . . . . ... .251
Station VI.C.XXV The age composition and shell lengths ofGlycymeris subobsoleta from lower CookInlet Station 40A. ..... . . . . ...... . .. 251
Table VI.C.XXVI The age composition and shell lengths ofGlycymeris subobsoleta from lower CookInlet Station 42 ................ . 253
Table VI.C.XXVII The age composition and shell lengths ofGlycymeris subobsoleta from lower CookInlet Station 44 ................ . 253
Table VI.C.XXVIII Age and dry-weight relationships of CookInlet Glycymeris subobsoleta . . . . . . . ... . 254
Table VI.C.XXIX Glycymeris subobsoleta: Biomass estima-tions per m2 at Station 28 . . . . . . . . . . . 255
Table VI.C.XXX Glycymeris subobsoleta: Biomass estima-tions per m2 at Station 42 . . . . . . . . . . . 256
Table VI.C.XXXI Glycymeris subobsoleta: Biomass estima-tions per m² at Station 63 . . . . . . . . . . . 257
Table VI.C.XXXII The number of Glycymeris subobsoleta ateach age, and the relationship between ageand natural mortality in lower Cook Inlet. . . . 258
Table VI.C.XXXIII The age composition and shell lengths ofSpisula polynyma from lower Cook Inletfrom seven station (40A, 41, 42, DG 1,DG 2, DG 3, and DG 4). . . . . . . . . . . .. .269
Table VI.C.XXXIV The age composition and shell lengths ofSpisula polynyma from lower Cook InletStation 41 .................................... 270
Table VI.C.XXXV The age composition and shell lengths ofSpisula polynyma from lower Cook InletStation DG 1 . .................. 271
Table VI.C.XXXVI The age composition and shell lengths ofSpisula polynyma from lower Cook InletStation DG 2 .................. . 272
57
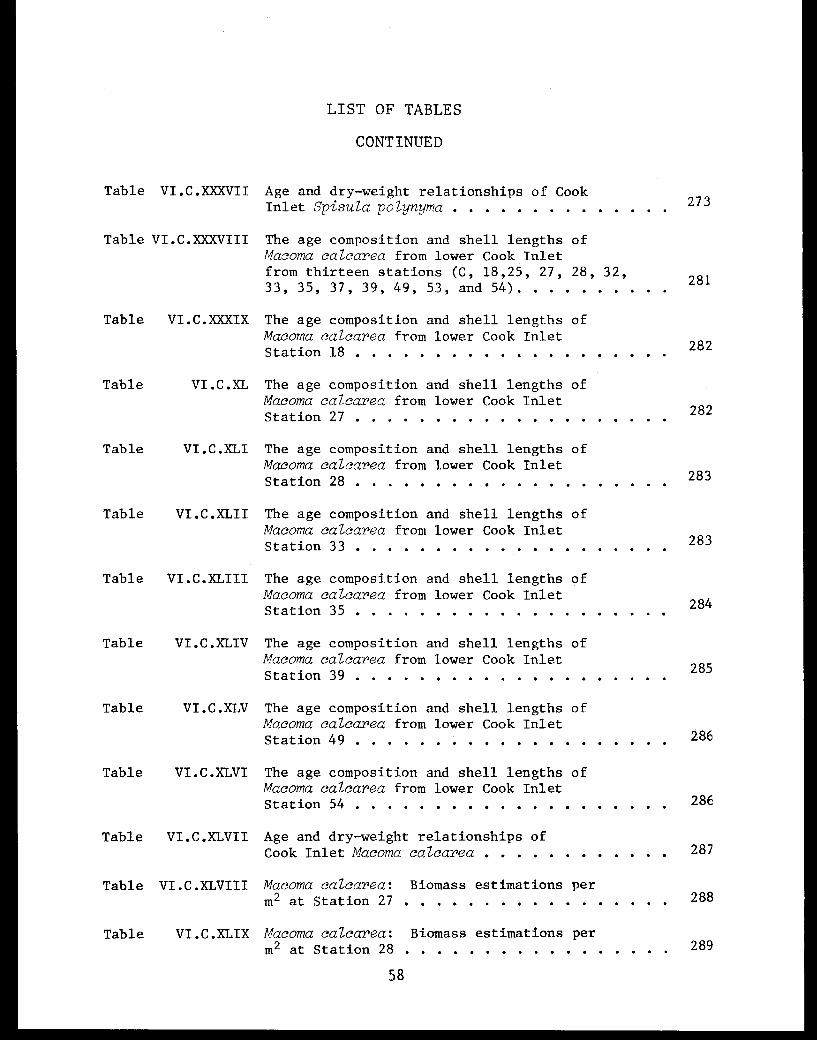
LIST OF TABLES
CONTINUED
Table VI.C.XXXVII Age and dry-weight relationships of CookInlet Spisula polynyma . . . . . . . . . . . . . .
Table VI.C.XXXVIII The age composition and shell lengths ofMacoma calcarea from lower Cook Inletfrom thirteen stations (C, 18,25, 27, 28, 32, 28133, 35, 37, 39, 49, 53, and 54) . . . . . . . . ..
Table VI.C.XXXIX The age composition and shell lengths ofMacoma calcarea from lower Cook InletStation 18 . . . . . . . . . . . . . . . . . . . .
Table VI.C.XL The age composition and shell lengths ofMacoma calcarea from lower Cook InletStation 27 . . . . . . . . . . . . . . .. . . . 282
Table VI.C.XLI The age composition and shell lengths ofMacoma calcarea from lower Cook InletStation 28 . . . . . . . . . . . . . . . . . . . . 283
Table VI.C.XLII The age composition and shell lengths ofMacoma calcarea from lower Cook InletStation 33 . . . . . . . . . . . . . . . . . . . . 283
Table VI.C.XLIII The age composition and shell lengths ofMacoma calcarea from lower Cook Inlet
284Station 35 . . . . . . . . . . . . . . . . . . . .
Table VI.C.XLIV The age composition and shell lengths ofMacoma calcarea from lower Cook InletStation 39 . . . . . . . . . . . . . . . . . . . .
Table VI.C.XLV The age composition and shell lengths ofMacoma calcarea from lower Cook InletStation 49 . . . . . . . . . . . . . . . . ... . . 286
Table VI.C.XLVI The age composition and shell lengths ofMacoma calcarea from lower Cook InletStation 54 ........................ ... 286
Table VI.C.XLVII Age and dry-weight relationships ofCook Inlet Macoma calcarea . . . . . . . . . ... . 287
Table VI.C.XLVIII Macoma calcarea: Biomass estimations perm² at Station 27 ............. . . . . 288
Table VI.C.XLIX Macoma calcarea: Biomass estimations perm² at Station 28 ................. 289
58

LIST OF TABLES
CONTINUED
Table VI.C.L Macoma calcarea: Biomass estimations perm² at Station 32 ................. ................. 290
Table VI.C.LI Macoma calcarea: Biomass estimations perm² at Station 33 .................................. 291
Table VI.C.LII The number of Macoma calcarea at each age,and the relationship between age and naturalmortality in lower Cook Inlet. . . . . . . . ... . 292
Table VI.C.LIII The age composition and shell lengths ofTellina nuculoides from lower Cook Inletfrom nine stations (UW2, 30, 31, 40A, 41,42, 44, 45, and 63). . . . . . . . . . . . .... . 304
Table VI.C.LIV The age composition and shell lengths ofTellina nuculoides from lower Cook InletStation 42 ............................... 305
Table VI.C.LV The age composition and shell lengths ofTellina nuculoides from lower Cook InletStation 44 ................... . 306
Table VI.C.LVI The age composition and shell lengths ofTellina nuculoides from lower Cook InletStation UW2. . . . . . . . . . . . . . . ..... .306
Table VI.C.LVII Age and dry-weight relationships of CookInlet Tellina nuculoides . . . . . . . . . . ... . 307
Table VI.C.LVIII Tellina nuculoides: Biomass estimations perm² at Station 30. .... ......... ....... 308
Table VI.C.LIX Tellina nuculoides: Biomass estimations perm² at Station 31 ......................... 309
Table VI.C.LX Tellina nuculoides: Biomass estimations perm² at Station 42 .......................... 310
Table VI.C.LXI Tellina nuculoides: Biomass estimations perm² at Station 44 . . . . . . . . . . . . . . .. . 311
Table VI.C.LXII Tellina nuculoides: Biomass estimations perm² at Station 63 ......................... 312
59
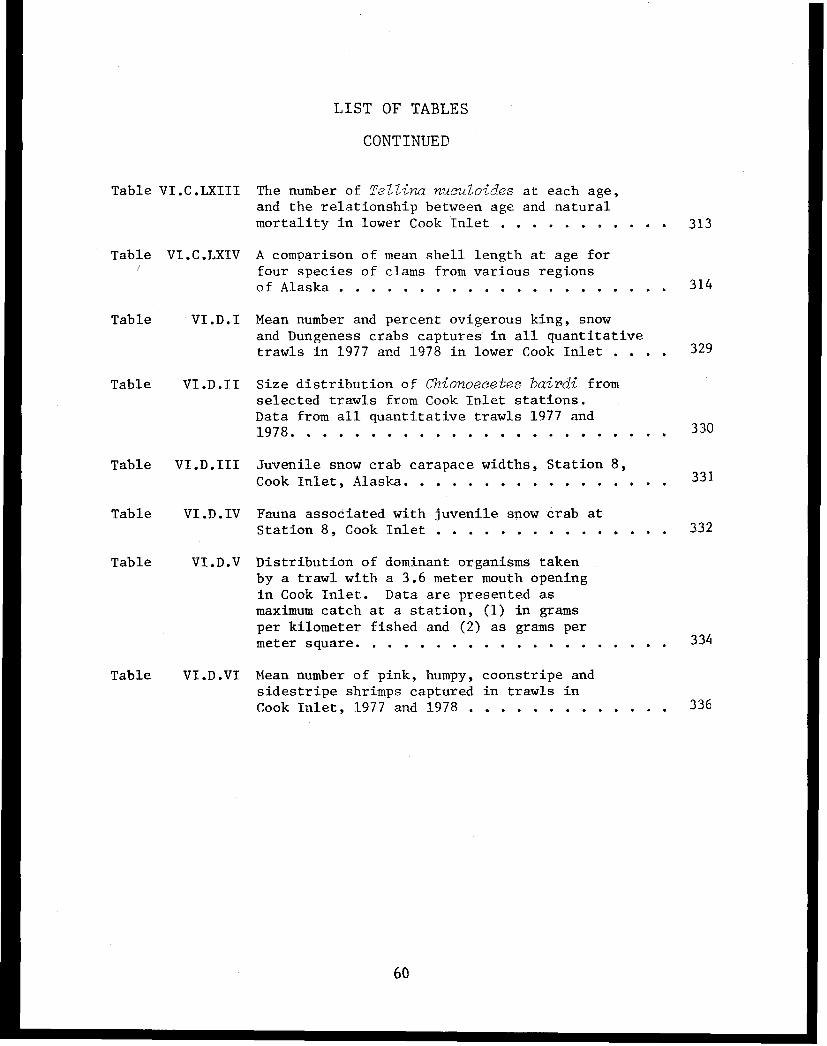
LIST OF TABLES
CONTINUED
Table VI.C.LXIII The number of Tellina nuculoides at each age,and the relationship between age and naturalmortality in lower Cook Inlet . . . . . . . . . . . 313
Table VI.C.LXIV A comparison of mean shell length at age forfour species of clams from various regionsof Alaska. . . . . . . . . . . . . . . .. . . . 314
Table VI.D.I Mean number and percent ovigerous king, snowand Dungeness crabs captures in all quantitativetrawls in 1977 and 1978 in lower Cook Inlet . . . 329
Table VI.D.II Size distribution of Chionoecetes bairdi fromselected trawls from Cook Inlet stations.Data from all quantitative trawls 1977 and1978. . . . . . . . . . . . . . . . . . . . . .. . ....330
Table VI.D.III Juvenile snow crab carapace widths, Station 8,Cook Inlet, Alaska . . . . . . . . . . . . . . . . 331
Table VI.D.IV Fauna associated with juvenile snow crab atStation 8, Cook Inlet . . . . . . . . . . . . ... . 332
Table VI.D.V Distribution of dominant organisms takenby a trawl with a 3.6 meter mouth openingin Cook Inlet. Data are presented asmaximum catch at a station, (1) in gramsper kilometer fished and (2) as grams permeter square. . . . . . . . . . . . . . . ..... . 334
Table VI.D.VI Mean number of pink, humpy, coonstripe andsidestripe shrimps captured in trawls inCook Inlet, 1977 and 1978 . . . . . . . . . . ... . 336
60

LIST OF FIGURES
Figure III.1 Diagram of spring and summer mean flow inlower Cook Inlet .......................... 74
Figure IV.I Lower Cook Inlet benthic stations and regionsfor grouping data for 1976, 1977 and 1978. . . . . . . 78
Figure VI.A.1 Cluster analysis of untransformedabundance data from benthic grabsamples in Cook Inlet. . . . . . . . . . . . .... . 133
Figure VI.A.2 Cluster analysis of natural logarithmtransformed abundance data from benthicgrab samples in Cook Inlet . . . . . . . . . . ... . . 134
Figure VI.A.3 Location of stations in station groupsdelineated by a cluster analysis of benthicgrab data. . . . . . . . . . . . . . . . . . .... . 135
Figure VI.A.4 Cluster analysis comparing taxa on the basisof untransformed abundance data from benthicgrabs in Cook Inlet. . . . . . . . . . . . . .. .. . 136
Figure VI.B.1 Location of stations where snow crab, kingcrab and Dungeness crab were captured forstomach analysis ............................ 150
Figure VI.B.2 Map of Kachemak Bay showing location ofbottom skimmer tows and suction dredgestations where post-larval king crab werecollected for stomach analysis . ........... 163
Figure VI.B.3 Lower Cook Inlet, Alaska, and stationswhere pandalid shrimp were collected forstomach analysis ................... 171
Figure VI.B.4 The number of copepods consumed by kingcrab zoeae in beakers with different preyconcentrations. .......... .... . 185
Figure VI.B.5 The number of copepods killed by king crabstage I zoeae starved for 12, 60 and 84hours and held at 2°, 4° and 6°C . ......... .. 186
Figure VI.B.6 The number of copepods consumed by snowcrab zoeae in breakers with different preyconcentrations . . . . . . . . . . . . . . . . . . .. 187
61
LIST OF FIGURES
CONTINUED
Figure VI.B. 7 The number of copepods consumed by pinkshrimp zoeae in beakers with different preyconcentrations . . . . . . . . . . . . . . . . ... .188
Figure VI.C. 1 Distribution map of all Nucula tenuis col-lected by van Veen grag and pipe dredgefrom lower Cook Inlet stations . . . . . . . . ... .229
Figure VI.C. 2 Growth history of Nucula tenuis fromeleven stations in Cook Inlet; 16, 18, 27,28, 33, 37, 39, 49, 53, 54, and 62A. . . . . . ... . 230
Figure VI.C. 3 Growth history of Nucula tenuis from CookInlet Station 28 . . . . . . . . . . . . . . .... . 230
Figure VI.C. 4 Growth history of Nucula tenuis from CookInlet Station 49 . . . . . . . . . . . . . . . .. . .230
Figure VI.C. 5 Growth curve for Nucula tenuis from elevenstations in Cook Inlet; 16, 18, 27, 28, 33,37, 39, 49, 53, 54, and 62A. . . . . . . . . .... .231
Figure VI.C. 6 Growth curve for Nucula tenuis from CookInlet Station 28 ........................ 231
Figure VI.C. 7 Graph of abundance vs. age for Nuculatenuis in Cook Inlet .................. 232
Figure VI.C. 8 Distribution map of all Nuculana fossa col-lected by van Veen grab and pipe dredge fromCook Inlet stations. . . . . . . . . . . . ..... .241
Figure VI.C. 9 Growth history of Nuculana fossa from eightCook Inlet stations; 5, 6, 27, 28, 33, 37,49, and 54 . . . . . . . . . . . . . . . . . . . .. 242
Figure VI.C.10 Growth history of Nuculana fossa from CookInlet Station 6. . . . . . . . . . . . . . . ... . .242
Figure VI.C.ll Growth history of Nuculana fossa from CookInlet Station 28 ............. ............ 243
Figure VI.C.12 Growth history of Nuculana fossa from CookInlet Station 37 . . . . . . . . . . . . . . .... . 243
62
LIST OF FIGURES
CONTINUED
Figure VI.C.13 Growth curve for Nuculana fossa from eightCook Inlet stations; 5, 6, 27, 28, 33, 37,49, and 54 . . . . . . . . . . . . . . . .. .. . .. 244
Figure VI.C.14 Growth curve for Nuculana fossa from CookInlet Station 6. . . . . . . . . . . . . ..... .244
Figure VI.C.15 Growth curve for Nuculana fossa from CookInlet Station 28 ................ . . 245
Figure VI.C.16 Growth curve for Nuculana fossa from CookInlet Station 37 . . . . . . . .. .. .. ..... . . 245
Figure VI.C.17 Graph of abundance vs. age for Nuculanafossa in Cook Inlet. .... . . . . . . . . .. .246
Figure VI.C.18 Distribution map of all Glycymeris subobsoletacollected by van Veen grab and pipe dredgefrom Cook Inlet stations . . . . . . . . . . . . . 259
Figure VI.C.19 Growth history of Glycymeris subobsoletafrom ten Cook Inlet stations; M, UW2, 28,29, 30, 40A, 42, 44, 45, and 63. . . . . . . ... .260
Figure VI.C.20 Growth history of Glycymeris subobsoletafrom Cook Inlet Station 28 . . . . . . . . . ... . 260
Figure VI.C.21 Growth history of Glycymeris subobsoletafrom Cook Inlet Station 29 . . . . . . . . . .. . .261
Figure VI.C.22 Growth history of Glycymeris subobsoletafrom Cook Inlet Station 30 . . . . . . . . . ... .261
Figure VI.C.23 Growth history of Glycymeris subobsoletafrom Cook Inlet Station 40A. . . . . . . . . . . . 262
Figure VI.C.24 Growth history of Glycymeris subobsoletafrom Cook Inlet Station 42 . . . . . . . . . ... .262
Figure VI.C.25 Growth history of Glycymeris subobsoletafrom Cook Inlet Station 44 . . . . . . . . . ... . 262
Figure VI.C.26 Growth curve for Glycymeris subobsoletafrom ten Cook Inlet stations; M, UW2, 28,29, 30, 40A, 42, 44, 45, and 63. . . . . . . ... .263
Figure VI.C.27 Growth curve for Glycymeris subobsoletafrom Cook Inlet Station 28 . . . . . . . . . ... .264
63
LIST OF FIGURES
CONTINUED
Figure VI.C.28 Growth curve for Glycymeris subobsoletafrom Cook Inlet Station 40A . . . . . . . . .... 265
Figure VI.C.29 Graph of abundance vs. age for Glycymerissubobsoleta in Cook Inlet . . . . . . . . . . . .
Figure VI.C.30 Distribution map of all Spisula polynymacollected by van Veen grab and pipe dredgefrom Cook Inlet stations . . . . . . . . . . . . .
Figure VI.C.31 Growth history of Spisula polynyma fromseven Cook Inlet Stations; 40A, 41, 42, 275DG1, DG3, and DG4 . . . . . . . . . . . . . . . .
Figure VI.C.32 Growth history of Spisula polynyma from 275Cook Inlet Station 41 . . . . . . . . . . . . . .
Figure VI.C.33 Growth history of Spisula polynyma fromCook Inlet Station DG1 . . . . . . . . . . . . . . 276
Figure VI.C.34 Growth history of Spisula polynyma fromCook Inlet Station DG2 . . . . . . . . . . . . . . 276
Figure VI.C.35 Growth curve for Spisula polynyma from sevenCook Inlet stations; 40A, 41, 42, DG1, DG2,DG3, and DG4 . . . . . . . . . . . . . . . . . . . 277
Figure VI.C.36 Growth curve for Spisula polynyma fromCook Inlet Station 41. . . . . . . . . . . . . . . 277
Figure VI.C.37 Growth curve for Spisula polynyma from
Cook Inlet Station DG1 . . . . .. . . . . . . . . 278
Figure VI.C.38 Growth curve for Spisula polynyma fromCook Inlet Station DG2 . . . . . . . . . . . . . . 278
Figure VI.C.39 Distribution map of all Macoma calcareacollected by van Veen grab and pipe dredgefrom Cook Inlet stations . . . . . . . . . . . . . 293
Figure VI.C.40 Growth history of Macoma calcarea fromthirteen Cook Inlet stations; C, 18, 25, 27,28, 32, 33, 35, 37, 39, 49, 53, and 54 . . . . . . 294
Figure VI.C.41 Growth history of Macoma calcarea fromCook Inlet Station 18. . . . . . . . . . . . . . .
64
LIST OF FIGURES
CONTINUED
Figure VI.C.42 Growth history of Macoma calcarea fromCook Inlet Station 27 . . . . . . . . . . . . ... . 295
Figure VI.C.43 Growth history of Macoma calcarea fromCook Inlet Station 28. . . . . . . . ....... . . 295
Figure VI.C.44 Growth history of Macoma calcarea fromCook Inlet Station 33 . . . . . . . . . . . ... . .296
Figure VI.C.45 Growth history of Macoma calcarea fromCook Inlet Station 39. ......... .. . . 296
Figure VI.C.46 Growth curve for Macoma calcarea fromthirteen Cook Inlet stations; C, 18, 25,27, 28, 32, 33, 35, 37, 39, 49, 53, and54. . .................. . ... 297
Figure VI.C.47 Growth curve for Macoma calcarea from CookInlet Station 27. . . . . . . . . . . . . .. .. .298
Figure VI.C.48 Growth curve for Macoma calcarea fromCook Inlet Station 28 . . . . . . . . . . . . ... .299
Figure VI.C.49 Growth curve for Macoma calcarea fromCook Inlet Station 33 . . . . . . . . . . . .... . 300
Figure VI.C.50 Graph of abundance vs. age for Macomacalcarea in Cook Inlet. . . . . . . . . . . .. . .301
Figure VI.C.51 Distribution map of all Tellina nuculoidescollected by van Veen grab and pipe dredgefrom Cook Inlet stations. . . . . . . . . . . ... . 315
Figure VI.C.52 Growth history of Tellina nuculoides fromnine Cook Inlet stations; UW2, 30, 31, 40A,41, 42, 44, 45, and 63 . . . . . . . . . . . . . . 316
Figure VI.C.53 Growth history of Tellina nuculoides fromCook Inlet Station 31 . . . . . . . . . . . . . . . 316
Figure VI.C.54 Growth history of Tellina nuculoides fromCook Inlet Station 42 . . . . . . . . . . . . . . . 317
Figure VI.C.55 Growth history of Tellina nuculoides fromCook Inlet Station 44 . . . . . . . . . . . . . . . 317
65
LIST OF FIGURES
CONTINUED
Figure VI.C.56 Growth history of Tellina nuculoides fromCook Inlet Station 63. . . . . . . . . . . . ... .318
Figure VI.C.57 Growth history of Tellina nuculoides fromCook Inlet Station UW2 . . . . . . . . . . . . ... . 318
Figure VI.C.58 Growth curve for Tellina nuculoides fromnine Cook Inlet stations; UW2, 30, 31, 40A,41, 42, 44, 45, and 63 . . . . . . . . . . . . ... . 319
Figure VI.C.59 Growth curve for Tellina nuculoides fromCook Inlet Station 42. . . . . . . . . . . . .... .320
Figure VI.C.60 Growth curve for Tellina nuculoides fromCook Inlet Station 44. . . . . . . . . . ...... . . 321
Figure VI.C.61 Growth curve for Tellina nuculoides fromCook Inlet Station UW2 . . . . . . . . . . . ... . .322
Figure VI.C.62 Graph of abundance vs. age for Tellinanuculoides in Cook Inlet . . . . . . . . . .... . . . 323
Figure VI.D. 1 Lower Cook Inlet benthic stations and regionsfor grouping data for 1976, 1977 and 1978. . ... . .337
Figure VI.D. 2 Distribution of crab stage I zoeae . . . . . . ... . 338
Figure VI.D. 3 Distribution of crab late zoea . . . . . . . . . . . 339
Figure VI.D. 4 Distribution of shrimp stage I zoeae . . . . . ... . 340
Figure VI.D. 5 Distribution of shrimp late zoeae. . . . . . . ... . 341
Figure VI.E. 1 Larval period for Cook Inlet curstaceans.Data from Alaska Department of Fish andGame . . . . . . . . . . . . . . . . . . . .... . . 344
66

I. SUMMARY OF OBJECTIVES, CONCLUSIONS AND IMPLICATIONS WITHRESPECT TO OCS OIL AND GAS DEVELOPMENT
The objectives of this study included an inventory and census of
dominant benthic species and their critical habitats. Information on
important species in the food webs supporting the commercially harvested
benthic crustaceans and their methods of feeding was also collected.
Feeding studies of the zoeae of three species of crab and shrimp were
initiated. Growth histories were determined for several species of long
lived, sedentary, small clams.
Epifaunal invertebrate biomass estimations at the ten most productive
stations of the 41 examined ranged from 14 to 3 g/m². Five of the ten most
productive stations occurred in Kachemak Bay; one in outer Kamishak Bay,
three near the mouth of the Inlet between Shaw Island and the Barren Islands,
and one in the central area of the Inlet.
Kachemak Bay, Kamishak Bay and the area between Shaw Island and the
Barren Islands were found to be important habitats for snow and king crabs.
Few adults of these species were captured in the northern half of the
oil-lease tract selection area. In the southern section of the tract
selection area approximately along 59° of latitude, adult snow crabs were
occasionally abundant. The only major nursery area for snow crabs found
in Cook Inlet was along this same latitude, extending approximately 30 km
northward into the tract selection area. Young snow crabs were also
located throughout Kamishak Bay. The only known nursery area observed
for king crabs, was found along the north shore of outer Kachemak Bay.
Dungeness crab were restricted to Kachemak Bay. With the exception of
large numbers of humpy shrimp in northern Kamishak Bay and Chinitna Bay,
inner Kachemak Bay is the area where most of the pandalid shrimps were
captured. Outer Kachemak Bay is also an important habitat of pandalids.
The large species of crab (snow, Dungeness and king crab) in Cook
Inlet prey primarily on bivalves, barnacles, hermit crabs and crangonid
shrimps. These prey organisms feed either by filtering particulate
organic material, both that settling from above and resuspended from the
sediment, or utilize a combination of sediment sorting and predation on
67

other detritivores. The pandalid shrimps feed primarily on polychaetes
and bivalves, and ingest large amounts of sediment and detritus. Post-
larval king crab feed mainly on small crustaceans, and also ingest large
amounts of sediment and detritus.
The zoeae of king crab, snow crab and pink shrimp require zooplank-
ton prey concentrations on the order of 40 to 80 organisms per liter in
order to feed successfully in the laboratory. Prey concentration was
observed to be more important in determining later feeding ability of
king crab zoeae than water temperature within the range of 2° to 6°C.
King crab zoeae can only survive starvation for 3.5 days before losing
their ability to capture zooplankton prey.
Since subtidal bivalves, like other infaunal organisms in lower Cook
Inlet, have nonrandom distributions, precise population monitoring of
these organisms is probably not feasible. Thus, growth rates of bivalves
were examined as a more useful parameter for monitoring environmental
changes within the Inlet. Size and age data were collected for six bivalve
species in the Inlet. Growth rates were found to be relatively similar
throughout lower Cook Inlet. Monitoring growth rates for environmental
changes appear to be feasible.
Oil contamination of the benthic environment in Kachemak Bay, Kamishak
Bay or the large area near the mouth of the Inlet between Shaw Island and
the Barren Islands could negatively effect the populations of crab and
shrimp. In addition to the dangers to benthic organisms resulting from the
toxic properties of oil, hydrocarbon fractions associated with subtidal
sediments or settled drilling muds could be inadvertently ingested and
assimilated by clams, pandalid and crangonid shrimps, hermit crabs, and
post-larval king crabs, all of which feed by sediment sorting. Large crab
species as well as same fishes could then be affected by feeding on these
contaminated prey organisms.
The zoeae of king crab, snow crab and pink shrimp appear to require
zooplankton prey concentrations on the order of 40 per liter. This is a
relatively high density and it is possible that a naturally limiting food
supply exists which regulates recruitment success of these larvae. Zoeae
68
are extremely sensitive to low levels of oil pollution in the laboratory,
and oil pollution would be an added stress to food limited larvae. Thus,
oil pollution could result in a reduction in the stocks of these crustaceans.
However, lack of information on the effect of oil pollution on benthic
species of Cook Inlet currently precludes quantitative estimations of the
extent or type of damage that oil contamination could cause.
II. INTRODUCTION
GENERAL NATURE AND SCOPE OF STUDY
The operations connected with oil exploration, production, and trans-
portation in Cook Inlet present a wide spectrum of potential dangers to
marine benthic organisms. Initially the benthic biological program in
Cook Inlet emphasized development of an inventory of species as part of
the examination of biological, physical and chemical components of those
portions of the shelf slated for oil exploration and drilling activity.
Very little information on the non-commercial benthic fauna of Cook Inlet
was available before this study. Experience in pollution-prone areas of
England (Smith, 1968), Scotland (Pearson, 1972, 1975; Pearson and Rosenberg,
1978) and California (Straughan, 1971) suggests that after the completion
of an initial study, selected stations should be examined regularly on a
several-year basis to determine changes in species content, diversity,
abundance and biomass. The data collected by trawls, grabs and dredges
on the eight available OCSEAP cruises in lower Cook Inlet (April 1976-
August 1978) provide a species inventory for the area. However the data
collected are insufficient to generate the data necessary for the develop-
ment of a population monitoring program. Following reduced OCSEAP funding
in 1977-78 the emphasis of the trawl program was altered from distribution
and abundance estimations to (1) identification of important species in
food webs supporting commercially important crustaceans and fishes, and
(2) examination of critical habitats of these organisms.
Long-lived infaunal benthic organisms should be useful as indicator
species for polluted or disturbed areas because they remain in place and
69
cannot escape a degraded habitat. Work on the clam, Macoma balthica, in
Port Valdez, Alaska, suggested that bivalves may be good indicators of
oil pollution (Shaw et al., 1976). Therefore, an intensive investigation
of growth rates, growth history and mortality of common subtidal clams of
Cook Inlet was included in the study. Information is available for six
species of clams from 34 OCSEAP stations in lower Cook Inlet.
The planktonic larval forms of many dominant crustaceans are extremely
sensitive to Cook Inlet crude oil. There are numerous environmental fac-
tors such as stormy conditions, water temperature, salinity, prey avail-
ability and predator densities, which affect survival rates of crustacean
larvae. However, the effects of the interactions of these variables on
recruitment successes of Cook Inlet crab and shrimp larvae are undescribed.
Therefore, studies of the benthic forms of the commercially important
crustaceans were extended to their larvae. Preliminary information on
zooplankton prey concentrations necessary for successful feeding of the
first zoeae of king crab, snow crab, and pink shrimp is available. Data
on the effects of starvation and water temperature on feeding success of
king crab zoeae are also available. This portion of the project remains
preliminary and incomplete.
RELEVANCE TO PROBLEMS OF PETROLEUM DEVELOPMENT
Oil pollution at the sea surface is a commonly observed occurrence;
however, hydrocarbons can also be transported to the sea bottom and become
associated with its sediments. Following a fuel oil spill in Buzzards Bay,
Massachusetts, bottom sediment was contaminated to a water depth of 42 feet
(Blumer et al., 1971). The oil persisted within the sediments for two
years after the spill (Blumer and Sass, 1972). Similarly a bunker C oil
spill off Nova Scotia resulted in the oil accumulating in the sediments,
and little diminution of its concentrations could be measured after 26
months following the spill (Scarratt and Zitko, 1972). Analysis of hydro-
carbons in surface sediments and the clam, Mercenaria mercenaria, of
Narragansett Bay showed that both contained hydrocarbons present in crude
oil; these hydrocarbons were not present in samples from unpolluted areas
(Farrington and Quinn, 1973).
70

Little is known concerning the effect of oil pollution on Alaskan
benthic communities. A direct relationship between trophic structure
(feeding type) and bottom stability has been demonstrated by Rhoads (see
Rhoads, 1974 for review). A diesel fuel spill resulted in oil becoming
absorbed on sediment particles with resultant mortality of many deposit
feeders on sublittoral muds. Bottom stability was altered with the death
of these organisms, and a new complex of species became established in the
altered substratum. The most common members of the infauna of Cook Inlet
are suspension or deposit feeders; thus, oil-related mortality of these
species could result in a changed near-bottom sedimentary regime with
subsequent alteration of species composition. If such a change were to
occur, the food webs supporting the existing species would likewise be
altered.
It is possible that organisms feeding on detritus, and thus ingesting
large amounts of oil contaminated sediments or on detrital feeding prey
could concentrate hydrocarbons in their tissues. Concentration of hydro-
carbons in the tissues of several bivalve species has been demonstrated.
The clam, Macoma balthica, can acquire hydrocarbons from oil contaminated
sediments (Shaw et al., 1976). Mussels, Mytilus edulis, can accumulate
hydrocarbons in excess of 1,000 times the exposure levels (Fossato and
Canzonier, 1976). Bivalve molluscs are an important component of the
infauna of lower Cook Inlet.
The importance of detrital-sediment feeding and, the potential for
ingestion of hydrocarbons by the commercially important crustaceans and
their prey, was unknown prior to the present project. Therefore, a program
of trawl, grab and dredge sampling designed to obtain specimens for stomach
analysis and information on predator and prey species abundance was initi-
ated. The amount of sediment present in stomachs of species identified as
potentially dependent on detrital feeding by microscopic analysis was
analyzed. The data identify the organisms that would be expected to ingest
significant amounts of oil contaminated sediment. The major prey species
that could transfer hydrocarbons to crab and shrimp and some fish predators
were also identified.
71
It is known that the moulting success of the snow crab decreases in
the presence of crude oil (Karinen and Rice, 1974). Snow crab are the
dominant epibenthic invertebrates in Cook Inlet.
The larvae of the commercially important crab and shrimp are killed
by low concentrations of oil pollution (Rice et al., 1976). However, in
order to separate mortality due to oil-related activities and naturally
occurring factors such as temperature and prey availability, it was neces-
sary to first examine the interactions of the factors responsible for
natural mortality. Therefore, studies of the effects of zooplankton prey
availability and seawater temperature on the feeding success of the zoeae
of king crab, snow crab and pink shrimp were initiated. The results of
this work compliments existing data on the toxicity of oil to these zoeae
(Rice et al., 1976).
Because of the ability of bivalve molluscs to accumulate hydrocarbons,
information on growth and mortality of common bivalves was collected. This
type of data, in conjunction with tissue analysis (see Shaw et al., 1976),
can provide an adequate program for monitoring environmental degradation
in areas where population monitoring is not feasible.
III. CURRENT STATE OF KNOWLEDGE
Few data concerning the biology, other than crab and shrimp surveys,
of the benthos of Cook Inlet were available until recent OCSEAP studies
were initiated. The U.S. Bureau of Commercial Fisheries (National Marine
Fisheries Service) have conducted distribution and abundance surveys in
this area on shrimps and crabs since 1958 (see references below). More
recent investigations on larval and/or adult stages of shellfish species
have been carried out (Hennick, 1973; ADF&G, 1976; Feder, 1977). A detailed
examination of the food of snow crabs from lower Cook Inlet is included in
Paul et al. (1979a). Data on non-commercial, benthic invertebrates are not
as extensive as that available for commercial species in lower Cook Inlet
(U.S. Bureau of Commercial Fisheries, 1958, 1961, 1963 cited in U.S. Dept.
Interior 1977; Feder, 1977). Publications subsequent to OCSEAP work include
information on: the distribution of crab and shrimp larvae (Haynes, 1977)
72
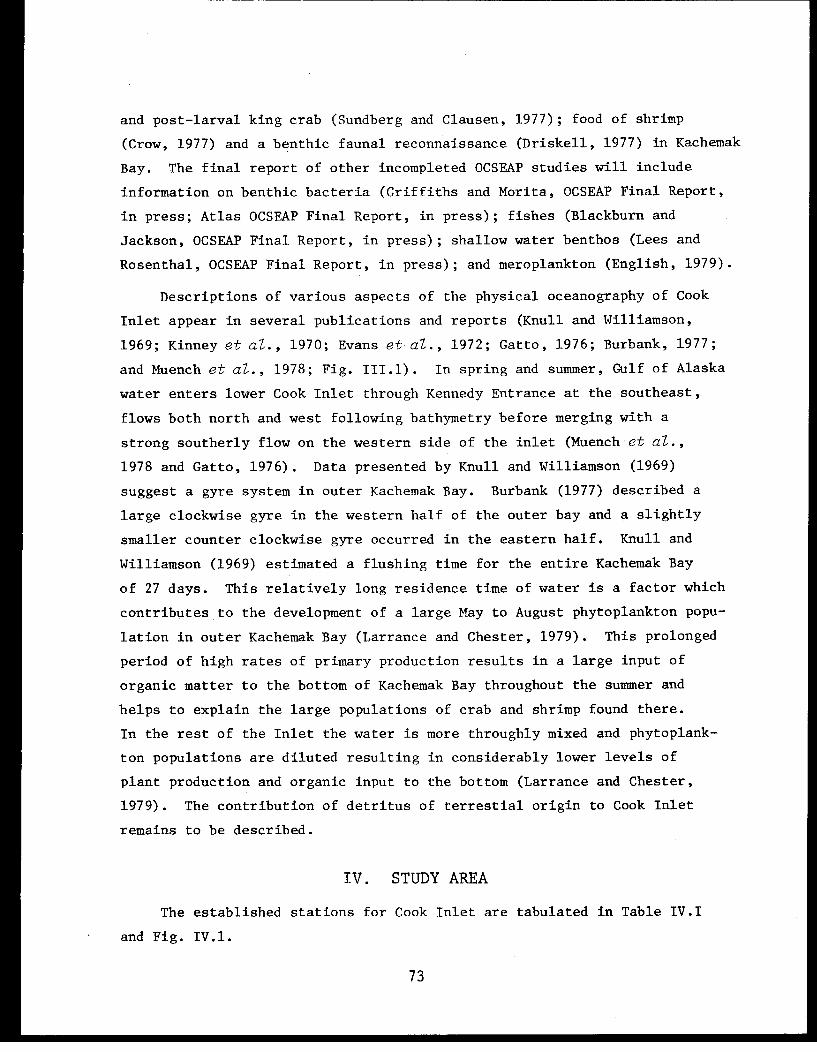
and post-larval king crab (Sundberg and Clausen, 1977); food of shrimp
(Crow, 1977) and a benthic faunal reconnaissance (Driskell, 1977) in Kachemak
Bay. The final report of other incompleted OCSEAP studies will include
information on benthic bacteria (Griffiths and Morita, OCSEAP Final Report,
in press; Atlas OCSEAP Final Report, in press); fishes (Blackburn and
Jackson, OCSEAP Final Report, in press); shallow water benthos (Lees and
Rosenthal, OCSEAP Final Report, in press); and meroplankton (English, 1979).
Descriptions of various aspects of the physical oceanography of Cook
Inlet appear in several publications and reports (Knull and Williamson,
1969; Kinney et al., 1970; Evans et al., 1972; Gatto, 1976; Burbank, 1977;
and Muench et al., 1978; Fig. III.1). In spring and summer, Gulf of Alaska
water enters lower Cook Inlet through Kennedy Entrance at the southeast,
flows both north and west following bathymetry before merging with a
strong southerly flow on the western side of the inlet (Muench et al.,
1978 and Gatto, 1976). Data presented by Knull and Williamson (1969)
suggest a gyre system in outer Kachemak Bay. Burbank (1977) described a
large clockwise gyre in the western half of the outer bay and a slightly
smaller counter clockwise gyre occurred in the eastern half. Knull and
Williamson (1969) estimated a flushing time for the entire Kachemak Bay
of 27 days. This relatively long residence time of water is a factor which
contributes to the development of a large May to August phytoplankton popu-
lation in outer Kachemak Bay (Larrance and Chester, 1979). This prolonged
period of high rates of primary production results in a large input of
organic matter to the bottom of Kachemak Bay throughout the summer and
helps to explain the large populations of crab and shrimp found there.
In the rest of the Inlet the water is more throughly mixed and phytoplank-
ton populations are diluted resulting in considerably lower levels of
plant production and organic input to the bottom (Larrance and Chester,
1979). The contribution of detritus of terrestial origin to Cook Inlet
remains to be described.
IV. STUDY AREA
The established stations for Cook Inlet are tabulated in Table IV.I
and Fig. IV.1.
73
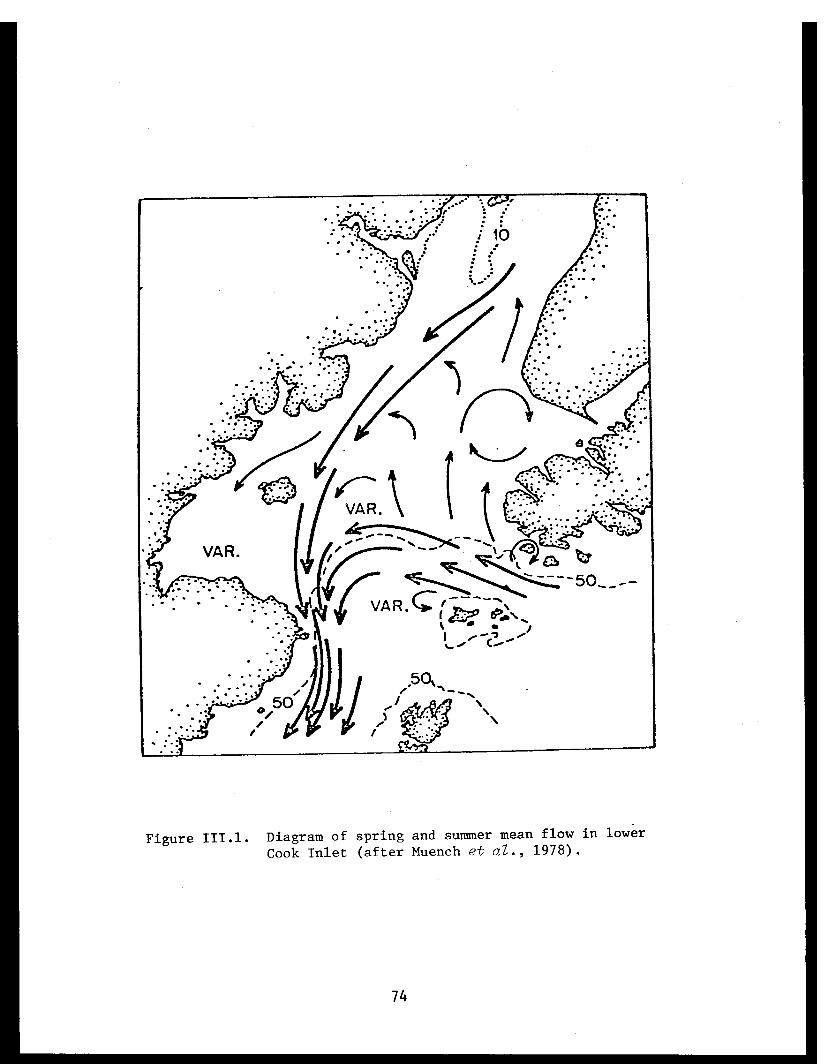
Figure III.1. Diagram of spring and summer mean flow in lower
Cook Inlet (after Muench et al., 1978).
74

TABLE IV.I
LOWER COOK INLET BENTHIC STATIONS
75
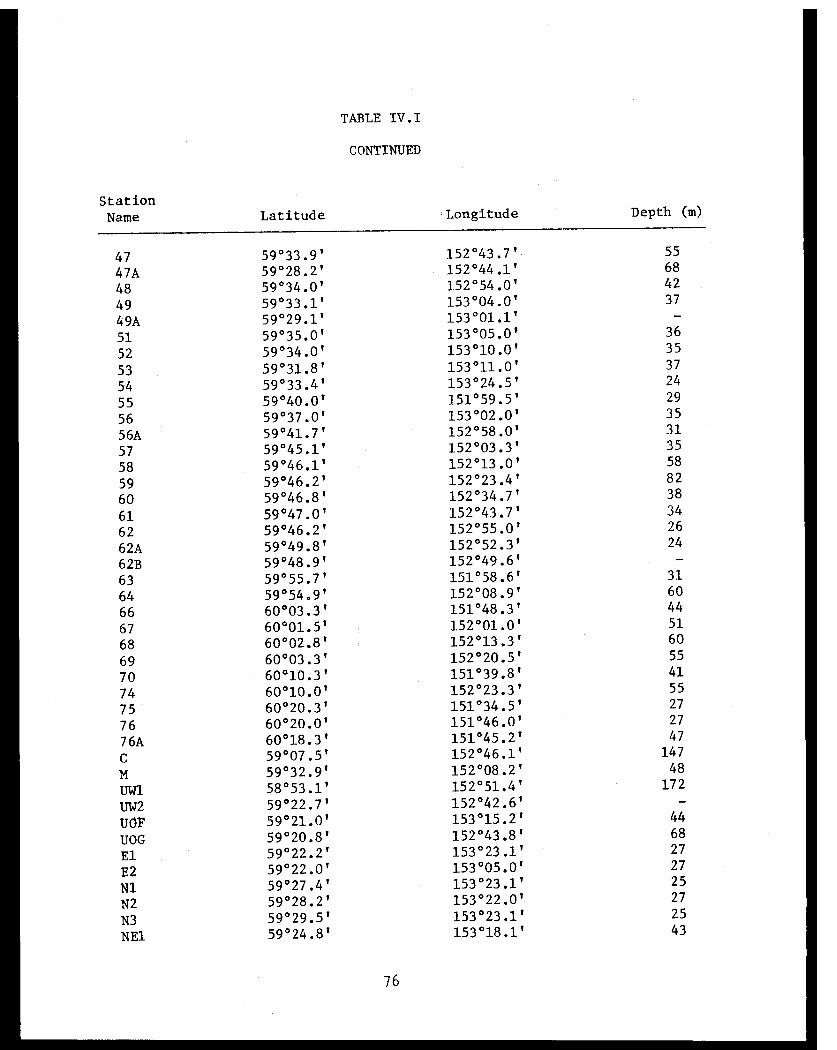
TABLE IV.I
CONTINUED
76
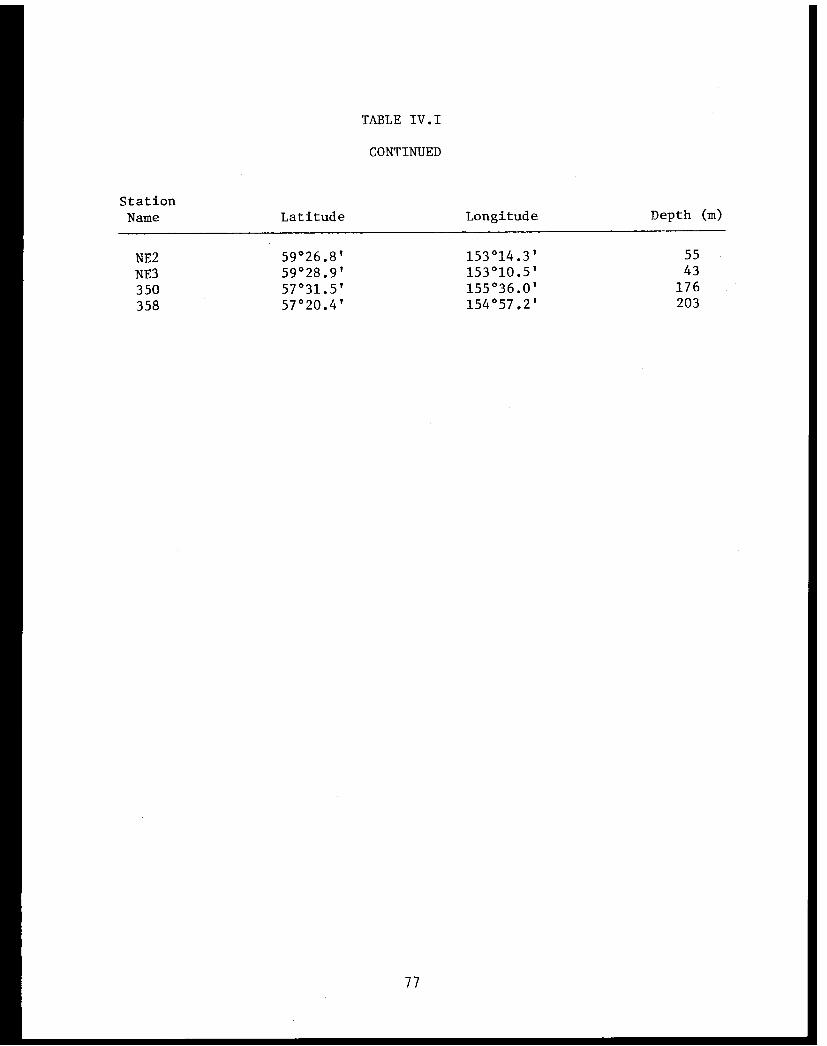
TABLE IV.I
CONTINUED
77
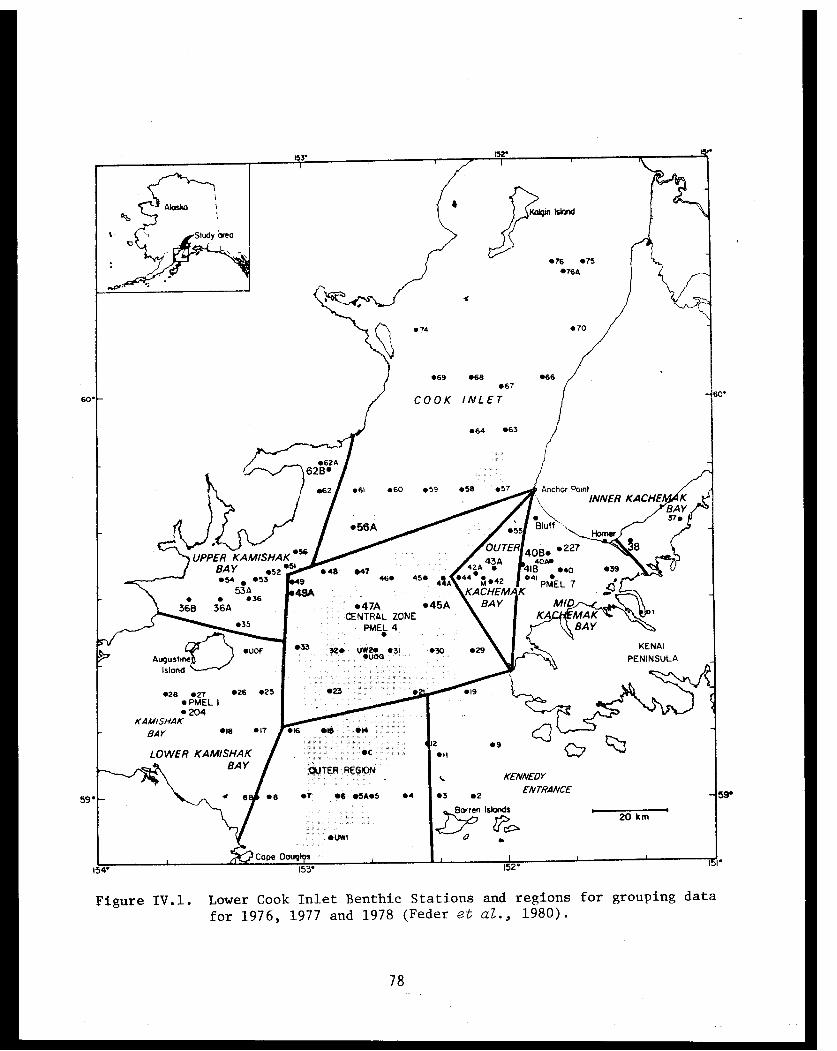
Figure IV.1. Lower Cook Inlet Benthic Stations and regions for grouping data
for 1976, 1977 and 1978 (Feder et al., 1980).
78
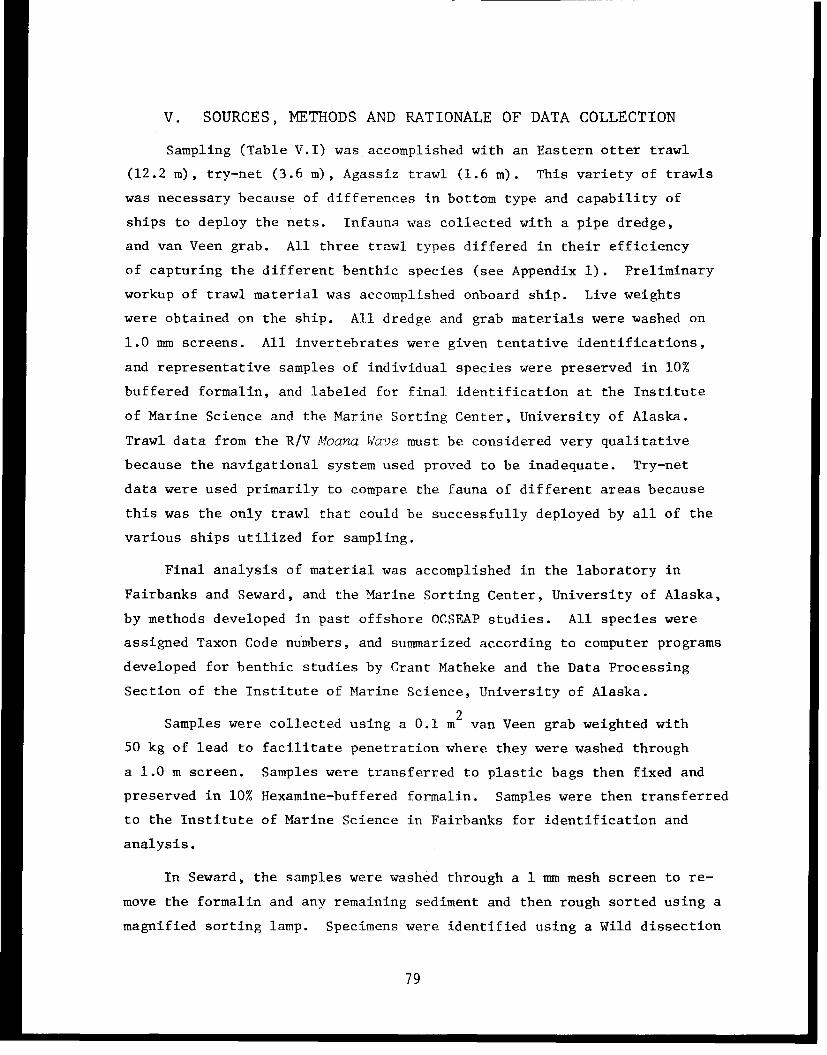
V. SOURCES, METHODS AND RATIONALE OF DATA COLLECTION
Sampling (Table V.I) was accomplished with an Eastern otter trawl
(12.2 m), try-net (3.6 m), Agassiz trawl (1.6 m). This variety of trawls
was necessary because of differences in bottom type and capability of
ships to deploy the nets. Infauna was collected with a pipe dredge,
and van Veen grab. All three trawl types differed in their efficiency
of capturing the different benthic species (see Appendix 1). Preliminary
workup of trawl material was accomplished onboard ship. Live weights
were obtained on the ship. All dredge and grab materials were washed on
1.0 mm screens. All invertebrates were given tentative identifications,
and representative samples of individual species were preserved in 10%
buffered formalin, and labeled for final identification at the Institute
of Marine Science and the Marine Sorting Center, University of Alaska.
Trawl data from the R/V Moana Wave must be considered very qualitative
because the navigational system used proved to be inadequate. Try-net
data were used primarily to compare the fauna of different areas because
this was the only trawl that could be successfully deployed by all of the
various ships utilized for sampling.
Final analysis of material was accomplished in the laboratory in
Fairbanks and Seward, and the Marine Sorting Center, University of Alaska,
by methods developed in past offshore OCSEAP studies. All species were
assigned Taxon Code numbers, and summarized according to computer programs
developed for benthic studies by Grant Matheke and the Data Processing
Section of the Institute of Marine Science, University of Alaska.
Samples were collected using a 0.1 m² van Veen grab weighted with
50 kg of lead to facilitate penetration where they were washed through
a 1.0 m screen. Samples were transferred to plastic bags then fixed and
preserved in 10% Hexamine-buffered formalin. Samples were then transferred
to the Institute of Marine Science in Fairbanks for identification and
analysis.
In Seward, the samples were washed through a 1 mm mesh screen to re-
move the formalin and any remaining sediment and then rough sorted using a
magnified sorting lamp. Specimens were identified using a Wild dissection
79
microscope of 60x to 500x magnifications. A compound microscope of lOOx
to l000x magnifications was used, as needed, to assist in the identifica-
tions. A wet weight was taken of each identified species using a Mettler
balance. Samples were recombined and catalogued for future use, should
this be necessary. A voucher collection was made, in which representatives
of each identified specimen were preserved; this collection is housed at
the Institute of Marine Science, Fairbanks.
Site groups and species assemblages were identified using cluster
analysis. Cluster analysis can be divided into three basic steps.
1. Calculation of a measure of similarity or dissimilarity
between entities to be classified.
2. Sorting through a matrix of similarity coefficients to
arrange the entities in a hierarchy or dendrogram.
3. Recognition of classes within the hierarchy.
Data reduction prior to calculation of similarity coefficients
consisted of elimination of taxa that could not be identified to genus
and all taxa which were collected at only one station and which accounted
for less than 10% of the total biomass or individuals at that station.
The coefficient used to calculate similarity matrices for cluster
analysis routines was the Czekanowski coefficient[superscript]1
Czekanowski Coefficient
Cs[subscript]1,2=2W[divided by][A+B] where A = the sum of the measures ofattributes of entity one
B = the sum of the measures ofattributes of entity two
W = the sum of the lesser measuresof attributes shared by entitiesone and two.
The Czekanowski coefficient has been used effectively in marine benthic
studies by Field and MacFarlane (1968), Field (1969, 1970 and 1971), Day
1The Czekanowski coefficient is synonymous with the Motyka (Mueller-Dombois and Ellenberg, 1974), and Bray-Curtis (Clifford and Stephenson,1975) coefficients.
80
et al. (1971), Stephenson and Williams (1971), and Stephenson et al. (1972).
This coefficient emphasizes the effect of dominant species on the classifica-
tion, and is often used with some form of transformation. The Czekanowski
coefficient was used to calculate similarity matrices for normal cluster
analysis (with sites as the entities to be classified and species as their
attributes) and inverse cluster analysis (with species as entities and
sites as attributes) using both untransformed and natural logarithm trans-
formed abundance data (individuals/m²). The natural logarithm transforma-
tion, Y = ln(X+l), reduces the influence that dominant species have on
the similarity determination.
Dendrograms were constructed from the similarity matrices using a
group-average agglomerative hierarchical cluster analysis (Lance and
Williams, 1966). Two-way coincidence tables comparing station groups
formed by normal analysis and species groups formed by inverse analysis
were constructed as an aid in the interpretation of dendrograms formed by
cluster analyses (Stephenson et al., 1972). In each table the original
species x stations data matrix was rearranged (based on the results of both
normal and inverse analysis) so that the stations or species with the
highest similarities were adjacent to each other.
Species diversity can be thought of as a measurable attribute of a
collection or a natural assemblage of species, and consists of two com-
ponents: the number of species or "species richness" and the relative
abundance of each species or "evenness". The two most widely used measures
of diversity which; include species richness and evenness are the Brillouin
(Brillouin, 1962) and Shannon (Shannon and Weaver, 1963) information mea-
sures of diversity (Nybakken, 1978). There is still disagreement of the
applicability of these indices, and the results are often difficult to
interpret (Sager and Hasler, 1969; Hurlbert, 1971; Fager, 1972; Peet, 1974;
Pielou, 1966a, b). Pielou (1966a, b, 1977) has outlined some of the con-
ditions under which these indices are appropriate.
The Shannon Function
[FORMULA]where n[subscript]i = number of individuals
in the i[superscript]th species
N = total number of individuals
81
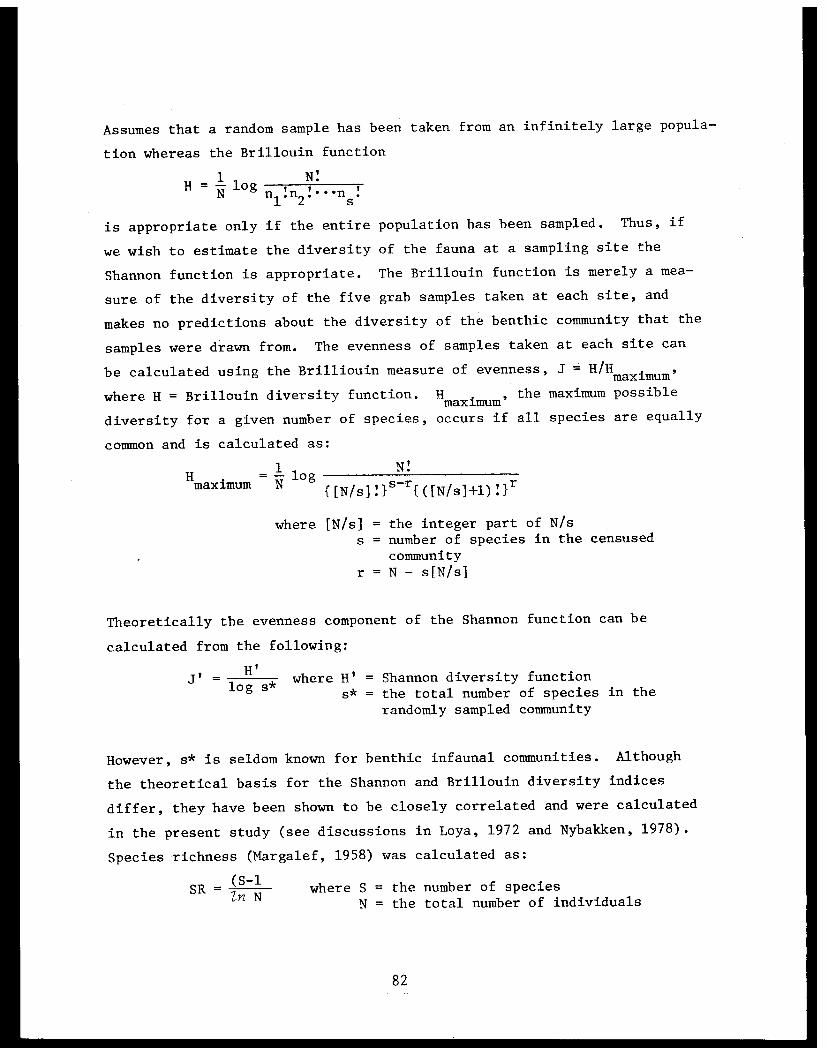
Assumes that a random sample has been taken from an infinitely large popula-
tion whereas the Brillouin function
is appropriate only if the entire population has been sampled. Thus, if
we wish to estimate the diversity of the fauna at a sampling site the
Shannon function is appropriate. The Brillouin function is merely a mea-
sure of the diversity of the five grab samples taken at each site, and
makes no predictions about the diversity of the benthic community that the
samples were drawn from. The evenness of samples taken at each site can
be calculated using the Brilliouin measure of evenness, J = H/Hmaximum'
where H = Brillouin diversity function. H the maximum possiblemaximum
diversity for a given number of species, occurs if all species are equally
common and is calculated as:
Theoretically the evenness component of the Shannon function can be
calculated from the following:
However, s* is seldom known for benthic infaunal communities. Although
the theoretical basis for the Shannon and Brillouin diversity indices
differ, they have been shown to be closely correlated and were calculated
in the present study (see discussions in Loya, 1972 and Nybakken, 1978).
Species richness (Margalef, 1958) was calculated as:
82
Crabs and shrimps, for stomach analysis, were captured with trawls during
the period of October 1976 to July 1978. Stations selected for study were
those where the species examined were abundant. The stomachs of snow, king
and dungeness crabs were removed immediately after capture and examined
with a dissection microscope on shipboard or in the laboratory. Shrimp
and hermit crabs were fixed in 10% formalin on the ship and examined in
the laboratory at a later date. A dissection microscope was used to examine
hermit crab stomachs. Both dissection and compound microscopes (100x)
were utilized to examine the shrimp, post-larval king crab and small snow
crab stomachs. The latter method facilitates identification of diatoms,
polychaete setae and small fragments. Percent frequency of occurrence
was computed based on the total number of stomachs examined. Additional
sampling at each station with dredges, grabs, and fine mesh nets captured
prey organisms, and facilitated identification of stomach contents.
Stomachs of fishes were primarily examined on shipboard, and frequency
of occurrence data tabulated.
Post-larval king crab were collected by the Alaska Department of Fish
and Game Marine and Coastal Habitat Management group with a bottom skimmer
and a diver operated suction dredge (Sundberg and Clausen, 1977). The
crabs were fixed in a solution of equal parts glycerine, isopropanol, and
water. Standard length and width measurements were taken for each post-
larval king crab. The stomachs were then dissected out, placed on a
microscope slide, opened, and the entire contents left on the slide. The
stomach contents were viewed at 100x to 400x magnifications, using a
compound microscope and the contents were identified to the lowest taxa
possible. Whole food items were counted when possible.
The percent fullness of snow crab stomachs was examined by injecting
stomachs with water until full, then emptying the contents into graduated
centrifuge tubes, centrifuging and then determining the percent of total
volume that consisted of food material.
Analysis of the gut sediment content of snow crab, shrimps and hermit
crabs was performed on a dry weight basis. The stomach contents of each
species from selected stations was dried at 60°C, weighed, digested with
83
10% potassium hydroxide, and treated with concentrated hydrochloric acid
to eliminate shell and carapace fragments. The sample was redried and
weighed. The sediment component was then calculated as the initial dry
weight of contents divided by the final dry weight and expressed as a
percentage. A control with known dry weights of sand and tissue was also
evaluated by this method. The control evaluation showed the sediment
analysis technique to be accurate to within 2%, with the error resulting
in underestimation of sediment content. Sediment weight determined by
this method is, therefore, conservative since carbonates naturally as-
sociated with the sediment are eliminated.
Concentration of zooplankton prey necessary for successful feeding
of king crab, snow crab, and pink shrimp zoeae were determined. Egg-
bearing females from Cook Inlet were held at the Seward Marine Station
on Resurrection Bay until hatching occurred. Seawater came from a depth
of 75 m. Water temperatures ranged from 5° to 6°C, and salinity from 32
to 33.5‰. Zoeae were held in containers with wild plankton (concentra-
tions 1,000 per liter) as food for three days before initiation of experi-
ments. Zoeae were placed in beakers (12.5 cm high, 9 cm diameter)
containing 500 ml filtered seawater, at concentrations of five zoeae per
beaker. The beakers were kept in a 12-hour light, 12-hour dark cycle.
During the light period prey tended to congregate, but dispersed randomly
in the dark. The beakers were kept in a 4,000 liter water bath to maintain
temperature. Zoeae were moved to new beakers each day with freshly counted
prey. Copepods which passed through a 0.5 mm² screen were isolated and
fed to the zoeae. Prey concentrations in the beakers were 0, 20, 40, 80
and 160 organisms per liter. A dissection microscope was used to count
prey. Observations of the feeding activity of king crab, snow crab, and
pink shrimp zoeae lasted 11, 10, and 13 days respectively. Experiments
were terminated when the first zoeae began to moult. If a zoea died, it
was removed but not replaced. Prey concentrations in beakers were kept
at original levels reagardless of the number of zoeae present by adding
the requisite number of prey each day. A standard one-way analysis of
variance (Snedecor, 1956) was utilized to compare feeding rates at dif-
ferent prey concentrations.
84
The effect of starvation on later ability of king crab zoeae to capture
zooplankton prey was determined. A female with hatching eggs captured
in Cook Inlet, Alaska, was placed in a tank with static water at 5:00 p.m.
Temperature was kept at 5°C. Stage one zoeae were removed for experiments
the following morning at 8:00 a.m. and hatching time was assumed to be
12:00 a.m. Zoeae were placed in beakers (125 mm high, 90 mm diameter)
containing 500 ml filtered seawater, salinity 33‰, at concentrations
of 5 zoeae per beaker. The outside of the beakers were covered with black
plastic and a light source of 350 lux maintained directly overshead 24 hours
a day. The temperature in three beakers was maintained at 2°C (standard
deviation = 0.0°C), while two similar sets of three beakers each were held
at 4°C (standard deviation = 0.0°C) and 6°C (standard deviation = 0.8°C),
respectively. The zoeae in one beaker of each temperature group received
food immediately, age assumed 12 hours and every 24 hours thereafter. The
zoeae in the second and third beakers of the three temperature groups were
first fed after 60 hours (2.5 days) and 84 hours (3.5 days) of starvation,
respectively.
The prey for zoeae studies consisted of wild copepods and copepodids
primarily of the genera Pseudocalanus, Acartia, and Oithona that passed
through a 0.5 mm² screen but were retained by a 0.35 mm² screen. The
average total length of prey organisms was 0.8 mm with a standard deviation
of 0.1 mm. Feeding was accomplished by placing the zoeae in beakers con-
taining 50 prey organisms (prey concentration = 100 per liter). There-
after, each day, the zoeae were moved to new beakers with 50 fresh prey.
A gentle flow of air which passed through an air stone at the bottom of
each beaker was utilized to keep prey randomly dispersed and to prevent
them from settling. The air flow was adjusted so it did not interfere
with the swimming of the zoeae.
Predation rates were determined by counting the number of prey remain-
ing after 24 hours of feeding. Three control beakers containing prey but
no predators were used to check the accuracy of the counting method. All
prey in control beakers were accounted for during the recount. All enumera-
tion of prey was done with a dissection microscope. Feeding observations
were continued for seven days. Regression analysis (Snedecor, 1956) was
85
used to examine the relationship between the number of hours starved before
feeding and the number of prey killed. The data used in the analysis
include all daily feeding observations for all three temperature groups.
The validity of the correlation coefficient (r) was measured using the
formula t = [square root][vr²/(l-r²)] where v = n-2.
Clams for growth studies were collected in lower Cook Inlet in April
and October 1976 mainly with a 0.1 m² van Veen grab, and pipe dredge (36 x
91 cm) on the R/V Moana Wave and NOAA ship Miller Freeman. Occasionally,
clams were obtained with a trawl or clam dredge. A try-net was used to
collect empty shells of Spisula polynyma. Alaska Department of Fish and
Game, Homer Office, supplied samples of fresh, frozen S. polynyma from four
Cook Inlet (Kachemak Bay) stations sampled with an anchor dredge2. Grab
and pipe dredge samples were washed on a 1 x 1 mm mesh screen, and bivalve
species were separated from other benthic organisms. The screen retained
all but recently settled clams.
Six relatively abundant species--Nucula tenuis, Nuculana fossa,
Glycymeris subobsoleta, Spisula polynyma, Macoma calcarea and Tellina
nuculoides--were selected for detailed study. Some of the clams collected
could not be aged due to their damaged condition. Not all stations were
used in the clam aging studies; however, all stations at which a species
was collected are included in the distribution maps. All clams used for
aging were pooled, i.e., clams from all sampling gear and all collection
dates. Aging was accomplished by the annular method (Weymouth, 1923)
using a Nikon dissection microscope and a 2x lens. Annuli, a series of
closely spaced concentric growth rings, are the result of slow growth at
low winter temperatures (Paul and Feder, 1973). The term 0 age group refers
to individuals of the settling year class that have undergone one growing
season (5 to 6 months) before forming their first winter annulus. Thus,
individuals referred to as 1 year of age are actually 17 or 18 months old,
and have lived through two growing seasons. The 0 annulus was not measured,
except on 0 age clams, because of abrasion of the umbo on most of the older
2See Alaska Department of Fish and Game, Homer, for station locations.
86
shells. Two types of measurements were made on all clams: total shell
length (in millimeters) of each specimen and length (in millimeters) at
each annulus. Growth history tables were generated from the measurements
of length at each annulus. The last annulus on all specimens in the collec-
tion was formed in the winter of 1975-1976, and length values for this
annulus were assigned to the year 1976 in growth-history tables. Selected
growth history tables for each clam species are included in this report.
Age-structure tables were generated; only stations with 10 or more
specimens of a given species are included in individual station tables.
In addition, tables are presented that include a summary of age-structure
for each species from all stations where it was collected.
All data were processed by a Honeywell 66/40 computer. Mean shell
length, range, standard deviation, and standard error of the mean were
plotted to show the relationship between shell length and age. The hori-
zontal line in the latter plot is the mean, the vertical line is the range,
the white box is the standard deviation, and the black box the standard
error of the mean. The standard error of the mean and the standard devia-
tion are not shown for age classes with a sample size of five or less.
Pipe dredge samples were collected at stations with relatively large
numbers of clams. These samples were frozen. The six species of clams
were removed from the frozen sediment and aged. Selected specimens from
each age group were dried whole at 60°C until a constant weight was reached.
Ten percent KOH was used to dissolve the tissues of these dried clams. The
shells were then rinsed in distilled water and redried at 60°C until a
constant weight was observed. Dry meat weight was calculated by subtract-
ing shell weight from total dry weight. The mean numbers of clams in each
age class present in grab samples were multiplied by the mean dry meat
weights at the appropriate age. Calculated dry meat weights of each age
class were added to obtain total clam tissue dry weight or biomass at a
station.
Mortality rates were determined by the use of Gruffydd's (1974) tech-
nique. That latter technique, developed to determine mortality in scallops,
assumes that although recruitment varies from year to year at a particular
87
station, overall recruitment to a large area is fairly constant. With this
assumption, the toal number of specimens for Nucula tenuis, Nuculana fossa,
Glycymeris subobsoleta, Macoma calcarea, and Tellina nuculoides from all
stations' samples were plotted against age. These curves eliminate the
effect of uneven recruitment apparent in individual samples. Utilizing
the number of individuals estimated from the curve rather than the actual
catch, the percent mortality (Z) is estimated using the expression,
Z = N[subscript](t+1)= N[subscript]t * e[superscript](-z(t)); where N = number of clams, t = time, t+l = time at
the next year, z = mortality coefficient, and e = 2.718. The mortality
curves were drawn by computer, a modification from Gruffydd's (1974) tech-
nique where the curves are plotted by eye on semi-log graph paper.
88
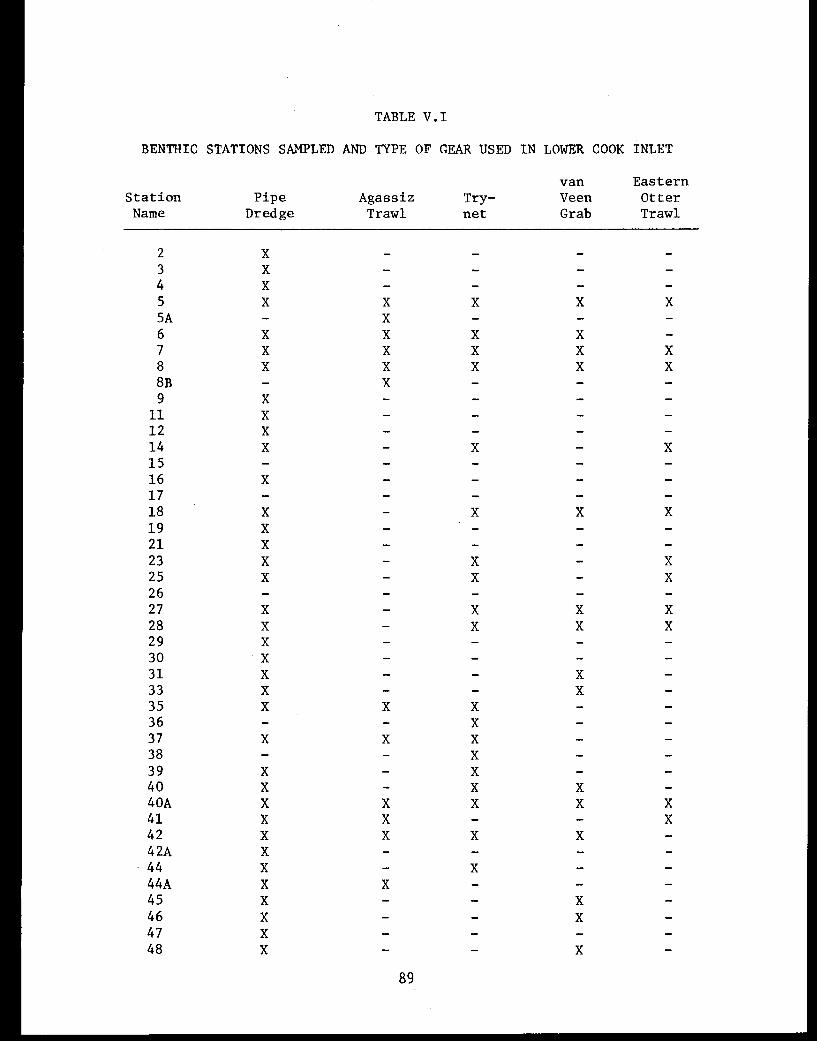
TABLE V.I
BENTHIC STATIONS SAMPLED AND TYPE OF GEAR USED IN LOWER COOK INLET
89
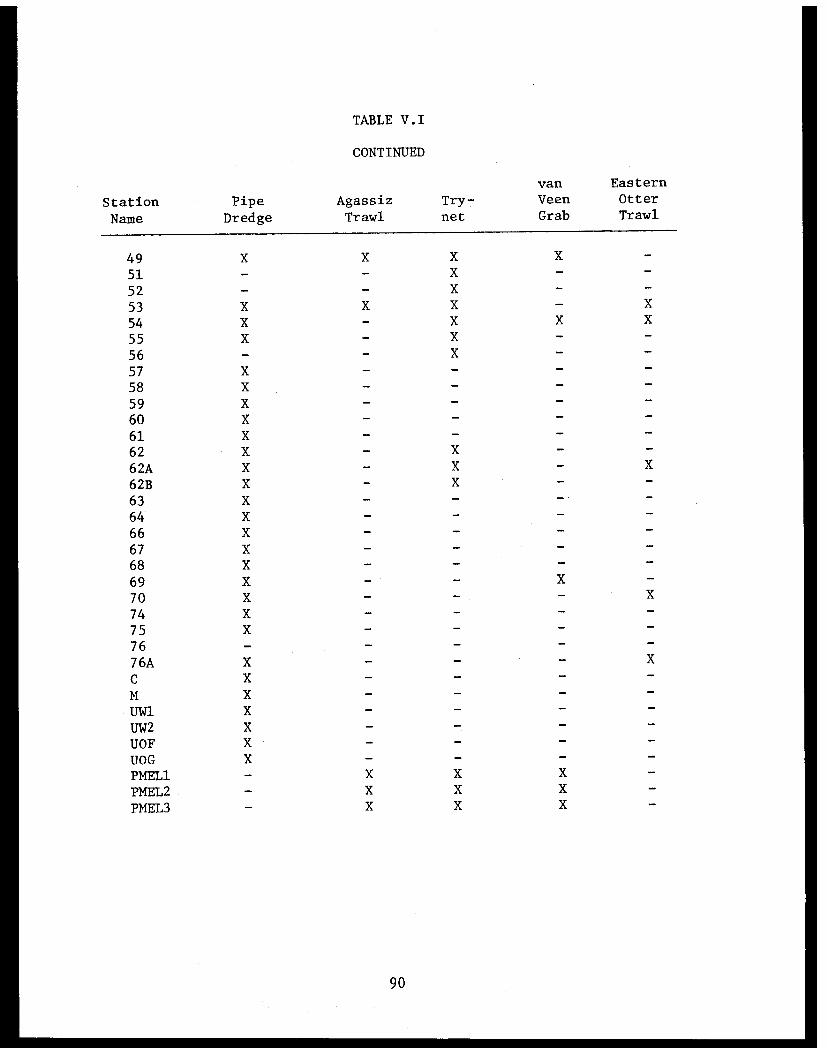
TABLE V.I
CONTINUED
90

VI. RESULTS AND DISCUSSION
SECTION A - TRAWL AND GRAB PROGRAM FOR LOWER COOK INLET
Biomass by Area for Trawl Samples
The average invertebrate epifaunal biomass values reported for lower
Cook Inlet, 2.41 g/m² (Table VI.A.I), in the present study are similar to
biomass estimations of 2.6 g/m² determined for the northeast Gulf of Alaska
(Jewett and Feder, 1976). Figure IV.1 illustrates station positions dis-
cussed in this section. (Also, see Feder et al., 1978 for biomass distribu-
tion maps of 1976 cruise data.)
Three of the ten most productive stations (5A, 6, 23) are included
in the oil-gas lease area (Fig. IV.1). The majority of the stations in the
central zone lease area had untrawlable bottoms and sampling in the area
was restricted to three stations. In a ranking from highest to lowest
weight of invertebrates (g/m²) for the 41 stations, these three stations
(23, 49 and PMEL 4) ranked 10th, 13th, and 28th (Table VI.A.I), respectively.
On a regional basis the weight of invertebrates captured by trawl in
inner Kachemak Bay averaged 0.75 g/m² (Table VI.A.II). However, due to
the large size of the ships used, sampling was restricted to three stations
and the data may not be representative of the whole area. In the remainder
of Kachemak Bay (Tables VI.A.III, VI.A.IV) invertebrate live weight averaged
2.45 g/m² and 9.13 g/m² in the middle and outer regions of the Bay, respec-
tively. The latter figure was the highest biomass estimation of all of the
regions of Cook Inlet examined (Fig. IV.1).
In the central zone of the Inlet (Fig. IV.1) the average weight of in-
vertebrates, 1.77 g/m² (Table VI.A.V), was below the average of 2.41 g/m²
(Table VI.A.I) for the whole of lower Cook Inlet and less than half that of
Kachemak Bay. The invertebrate biomass, 2.62 g/m² (Table VI.A.VI) in the
outer region (Fig. IV.1) of the Inlet was similar to the average for all of
lower Cook Inlet, 2.41 g/m². The average biomass of invertebrates, 2.11
g/m Table VI.A.VII) in lower Kamishak Bay (Fig. IV.1) was higher than upper
Kamishak Bay, 1.18 g/m (Table VI.A.VIII) and both were below the average,
91

2.41 g/m², for lower Cook Inlet. Table VI.A.IX provides a ranking of in-
vertebrates wet weights for the seven areas sampled. Weights (g/m²) and
numbers (per km fished) of selected organisms are also included in Sec-
tion D.
Species Composition by Area for Trawl Samples
Generally, three to four species dominated the invertebrate fauna
captured by trawls at individual stations in lower Cook Inlet (Tables
VI.A.II-VI.A.VIII). In twenty-three of the stations, the three most
abundant taxa accounted for more than 80% of all organisms captured (Tables
VI.A.II-VI.A.VIII). Similarly, the three most abundant taxa accounted for
over 80% of the total weight at 26% of the stations and 70% of the weight
at 17% of the stations.
In inner Kachemak Bay the pandalid shrimps Pandalus borealis (pink
shrimp), P. goniurus (humpy shrimp) and P. hypsinotus (coonstripe shrimp)
dominated the catch in terms of number (Table VI.A.II). In terms of weight,
P. borealis and P. hypsinotus were the dominant organisms.
In mid-Kachemak Bay (Fig. IV.1) Pandalus borealis, Crangon dalli and
the sea cucumber, Cucumaria fallax were numerically most abundant (Table
VI.A.III). Chionoecetes bairdi (snow crab), P. borealis, Cancer magister
(dungeness crab) and the sea pen (Ptilosarcus gurneyi) were the most
abundant organisms by weight in the area (Table VI.A.III). In outer
Kachemak Bay the echinoderms C. fallax and Strongylocentrotus droebachiensis
(sea urchin), plus the sand dollar, Echinarachnius parma, dominated both
in numbers and weight (Table VI.A.IV). King crab (Paralithodes camtschatica)
was dominant at Station 43A.
In the central zone of Cook Inlet (Fig. IV.1) each station was dominated
numerically by different organisms with C. bairdi, Crangon spp. (sand
shrimps), E. parma and P. guneyi generally important (Table VI.A.V). In
the outer Cook Inlet region between Shaw Island and the Barren Islands
C. bairdi and P. camtschatica were most abundant in terms of weight. In
this area C. bairdi and crangonid shrimps were numerically abundant
(Table VI.A.VI).
92
The crangonidae and C. bairdi were also numerically abundant in lower
Kamishak Bay. Chionoecetes bairdi was the dominant organism in terms of
weight (Table VI.A.VII). In upper Kamishak Bay Crangon dalli was the
most abundant organism at five of the ten stations sampled. Strongylocen-
trotus droebachiensis, Pandalus goniurus, and C. bairdi were dominant at
one station each. The weight composition at four stations was dominated
by C. bairdi while S. droebachiensis, P. goniurus, and C. dalli were domi-
nant at one station each (Table VI.A.VIII). A general summary of Cook
Inlet taxa captured by trawl appears in Tables (VI.A.IX, VI.A.X, and
VI.A.XI.
Further information on distribution of 14 dominant species occurs in
Section D. Data for individual stations are available from The National
Oceanographic Data Center. A taxa list for nearshore benthos captured by
a bottom skimmer appears in Appendix 2.
The dominant phyla in numbers per m², for combined data from all 41
stations, were Arthropoda (Crustacea) (91%), Mollusca (3.5%), and Echino-
dermata (3%). In terms of live weight the dominant groups were Arthropoda
(Crustacea) (74%), Echinodermata (17%), and Mollusca (5.8%). The important
species were snow crab (Chionoecetes bairdi) which accounted for 38.6% of
the live weight and averaged 1.1 g/m²; humpy shrimp (Pandalus goniurus)
with 20.7% of the weight and averaging 0.6 g/m²; king crab (Paralithodes
camtschatica) with 7.2% of the weight averaging 0.2 g/m²; sea cucumber
(Cucumaria fallax) with 4.8% of the weight averaging 0.1 g/m²; and the green
sea urchin (Strongylocentrotus droebachiensis) which was 2.3% of the weight
and averaged 0.07 g/m². The three crustacean species accounted for 66.5%
of the weight of trawl-caught banthic invertebrates and all are currently
harvested commercially. The sea cucumber and sea urchin account for an
additional 7.1% of the total weight; both species may have some commercial
potential. The preponderance of commercial, harvestable invertebrate
species in lower Cook Inlet is reflected by the profitable fisheries found
there.
Like Cook Inlet, the northeastern Gulf of Alaska invertebrate epi-
faunal biomass is also dominated by snow crab. Snow crab in the Gulf
93
account for 66.2% of the live weight of benthic epifaunal invertebrates
(Jewett and Feder, 1976). In the Gulf the other dominant epibenthic
invertebrates in terms of weight differ from those of the Inlet with the
brittle star, Ophiura sarsi (4.4%); Pandalus borealis (2.9%); Ctenodiscus
crispatus (2.9%); Brisaster townsendi (2.1%); Pycnopodia helianthoides
(2.0%); and Pecten caurinus (2.0%) accounting for an additional 16.3% of
the live weight (Jewett and Feder, 1976).
The relatively large epibenthic invertebrate biomass in Kachemak Bay
may be supported by the very high rates of primary productivity (as high
as 7.8 g C per m per day) that persists throughout spring and summer in
this bay (Larrance and Chester, 1979). This prolonged period of primary
productivity is atypical for most North Pacific areas where phytoplankton
production is characterized by a short spring bloom followed by nutrient
limited summer production. The total supplies of organic carbon contributed
to the bottom over the March to August period in 1978 were 60 g C per m at
Kachemak Bay, 17 g C per m in the central Inlet and 40 g C per m in
Kamishak Bay (Larrance and Chester, 1979). The dominant epibenthic inverte-
brates are capable of either utilizing this input of organic detritus
directly (e.g., Cucumaria fallax) or, like the large predators, by feeding
on organisms that are detrital feeders.
94

TABLE VI.A.I
A COMPARISON OF MEAN TOTAL GRAMS (LIVE WEIGHT) OF INVERTEBRATES
CAPTURED BY TRAWL AT DIFFERENT STATIONS IN LOWER COOK INLET
95
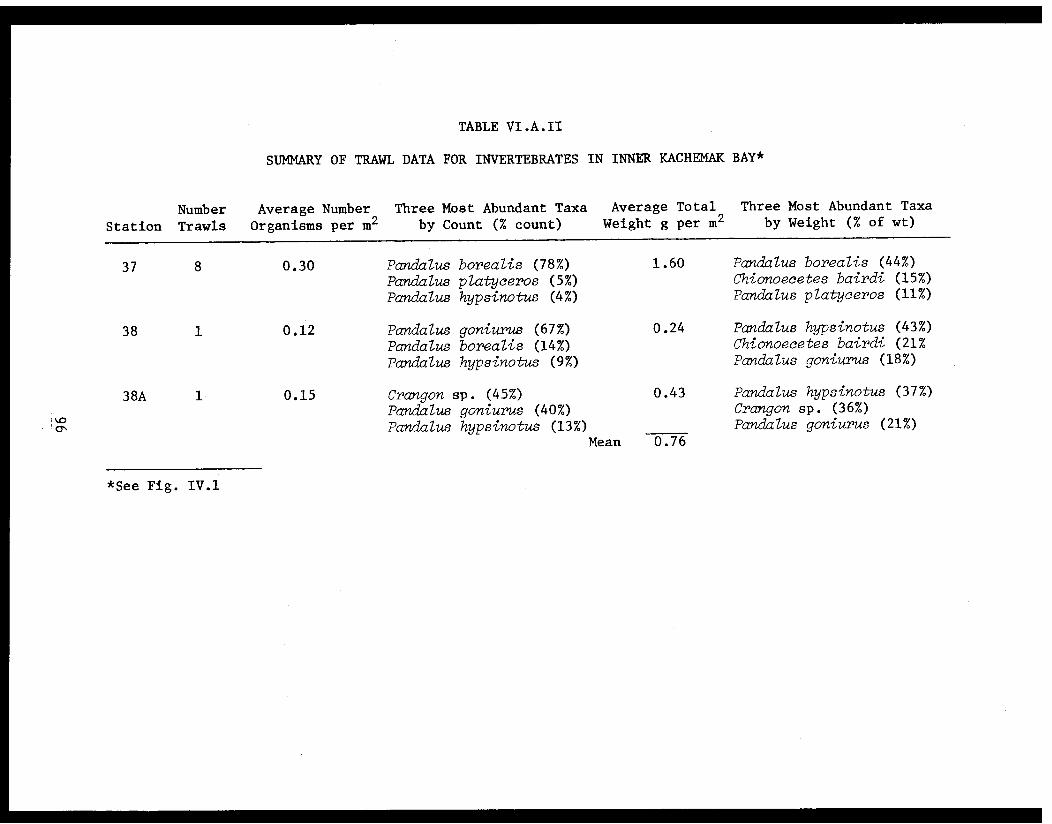
TABLE VI.A.II
SUMMARY OF TRAWL DATA FOR INVERTEBRATES IN INNER KACHEMAK BAY*
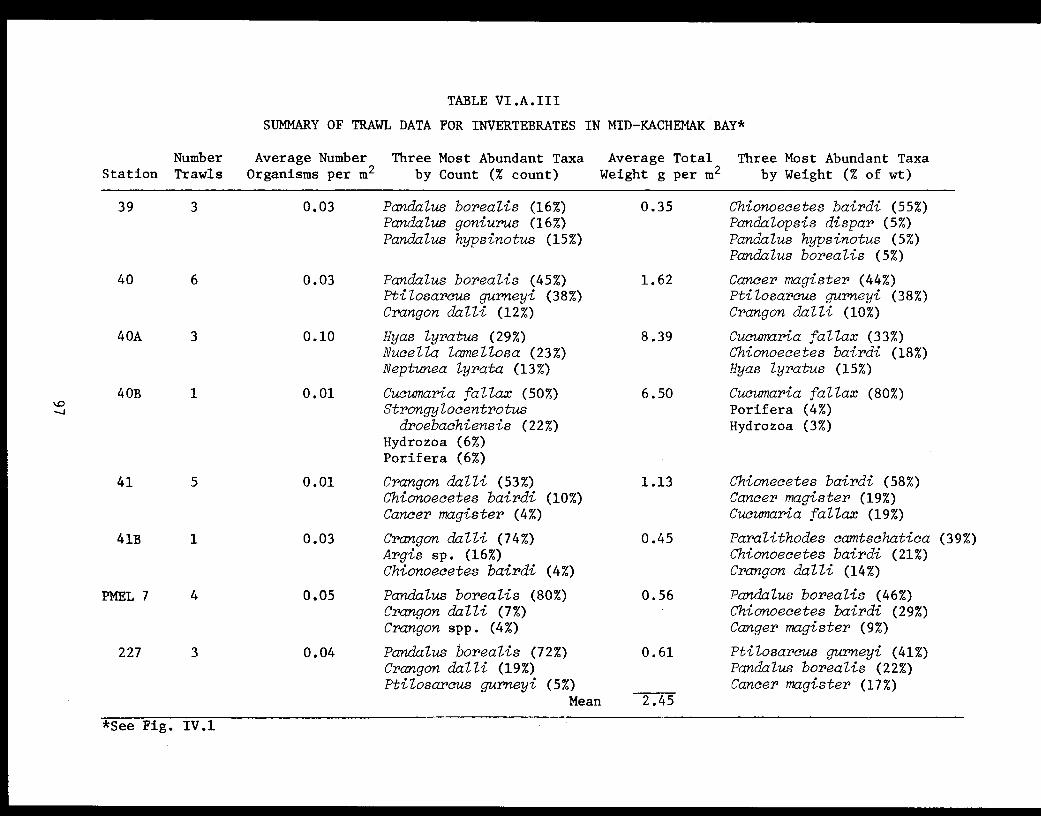
TABLE VI.A.III
SUMMARY OF TRAWL DATA FOR INVERTEBRATES IN MID-KACHEMAK BAY*
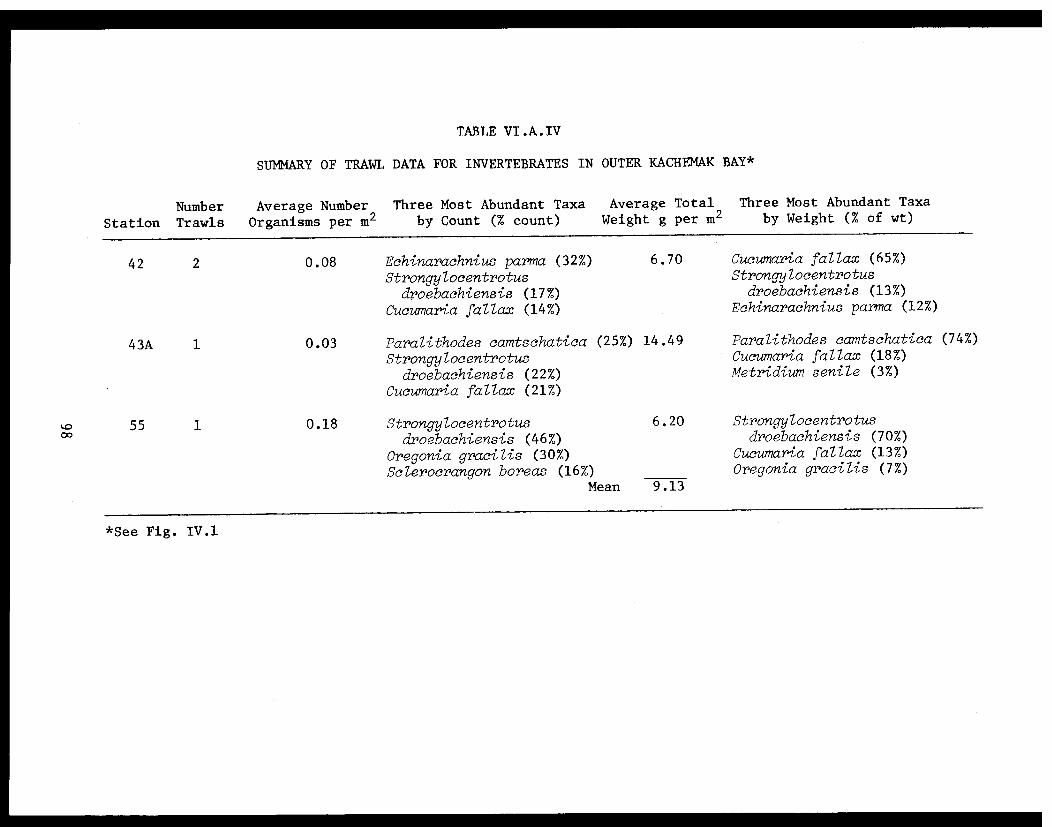
TABLE VI.A.IV
SUMMARY OF TRAWL DATA FOR INVERTEBRATES IN OUTER KACHEMAK BAY*
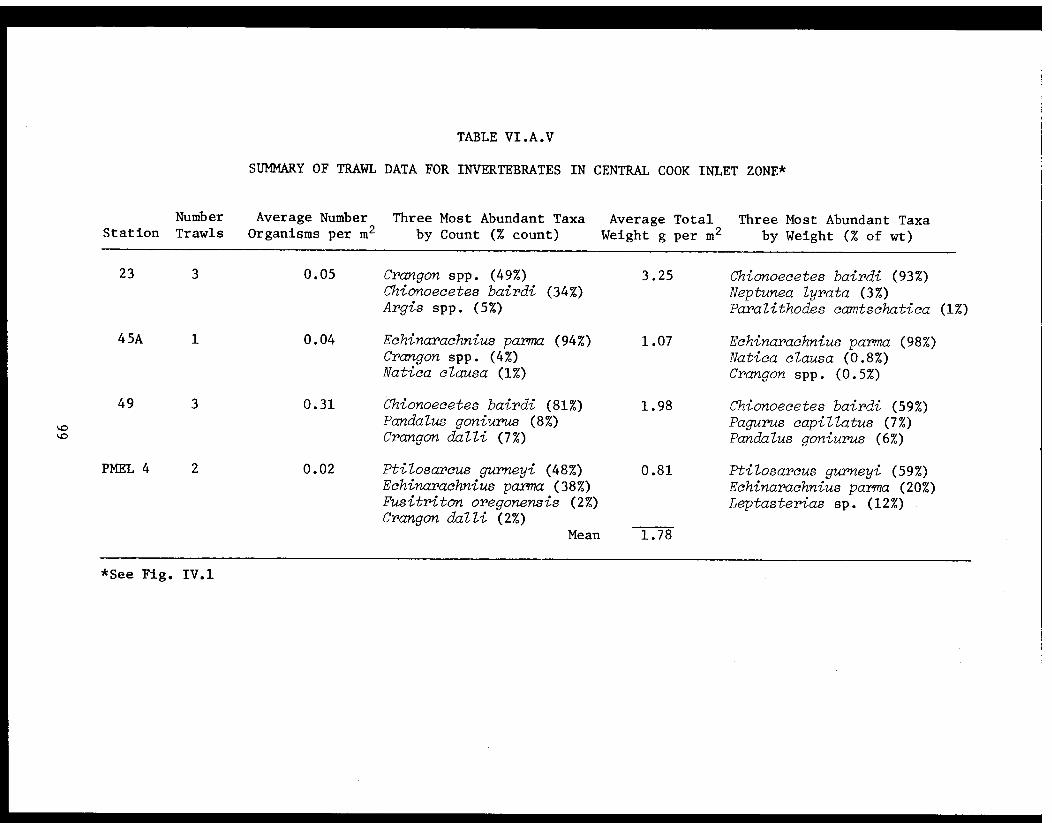
TABLE VI.A.V
SUMMARY OF TRAWL DATA FOR INVERTEBRATES IN CENTRAL COOK INLET ZONE*
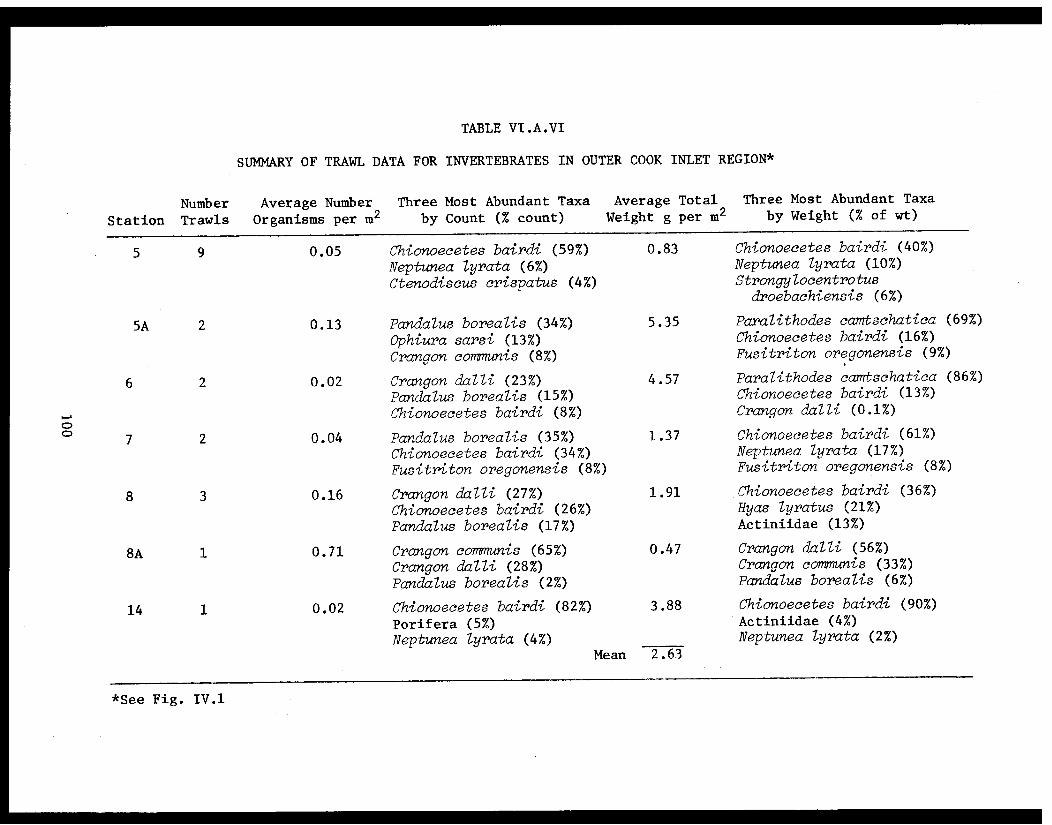
TABLE VI.A.VI
SUMMARY OF TRAWL DATA FOR INVERTEBRATES IN OUTER COOK INLET REGION*
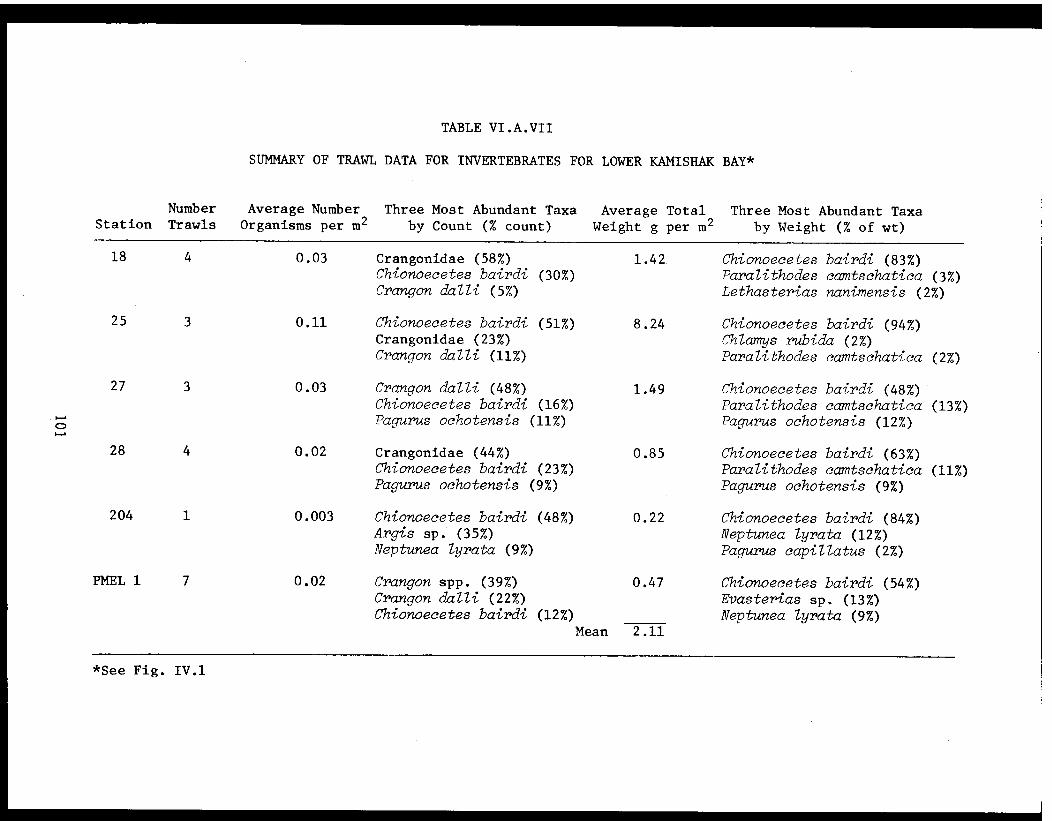
TABLE VI.A.VII
SUMMARY OF TRAWL DATA FOR INVERTEBRATES FOR LOWER KAMISHAK BAY*
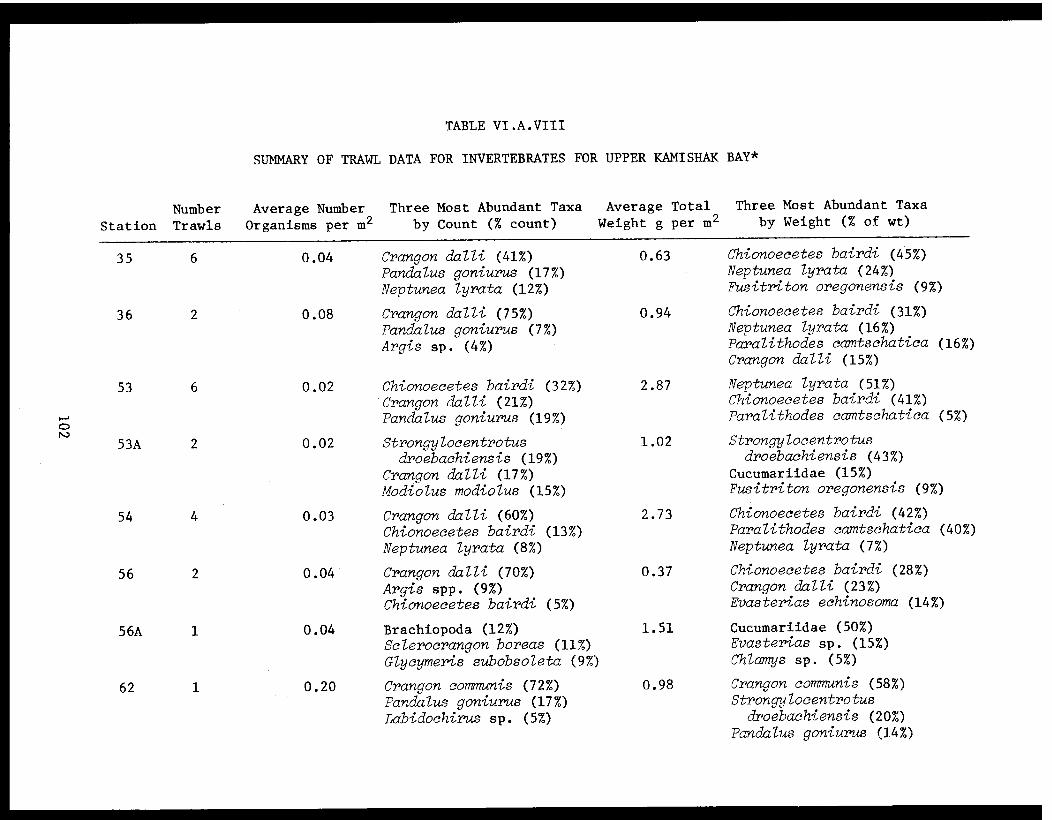
TABLE VI.A.VIII
SUMMARY OF TRAWL DATA FOR INVERTEBRATES FOR UPPER KAMISHAK BAY*
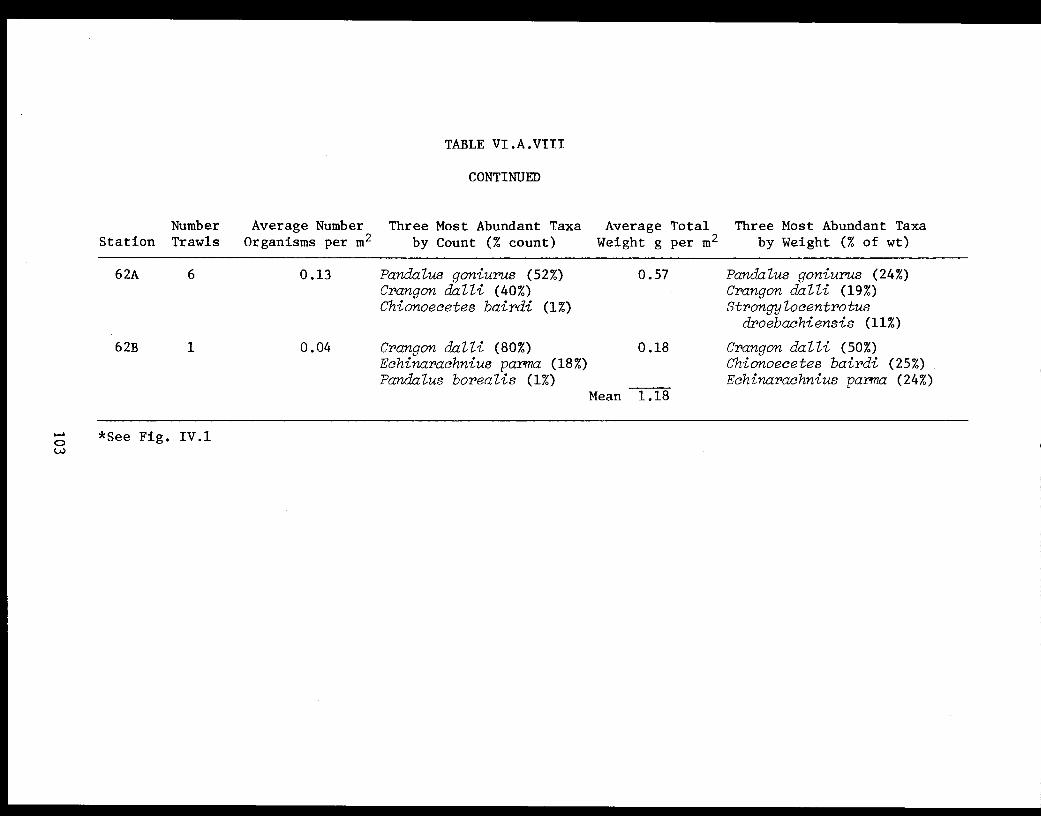
TABLE VI.A.VIII
CONTINUED
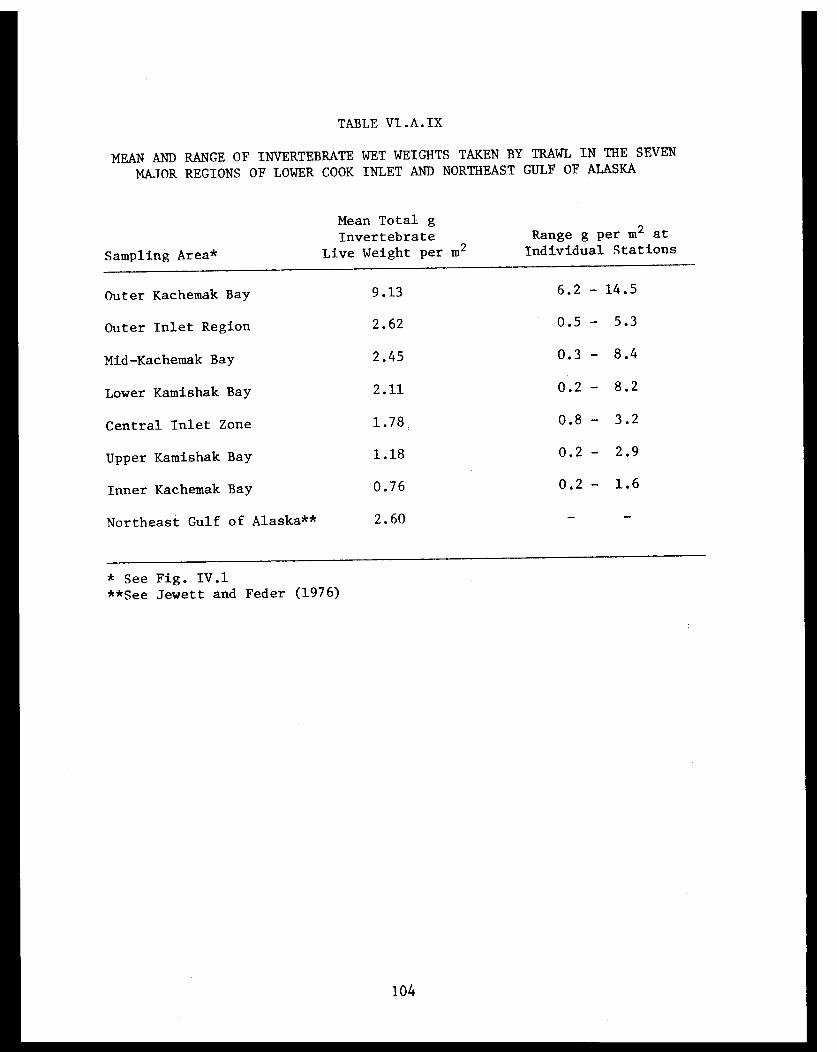
TABLE VI.A.IX
MEAN AND RANGE OF INVERTEBRATE WET WEIGHTS TAKEN BY TRAWL IN THE SEVEN
MAJOR REGIONS OF LOWER COOK INLET AND NORTHEAST GULF OF ALASKA
104

TABLE VI.A.X
COOK INLET TAXONOMIC SUMMARY BY PHYLUM FOR 41 TRAWL STATIONS
105
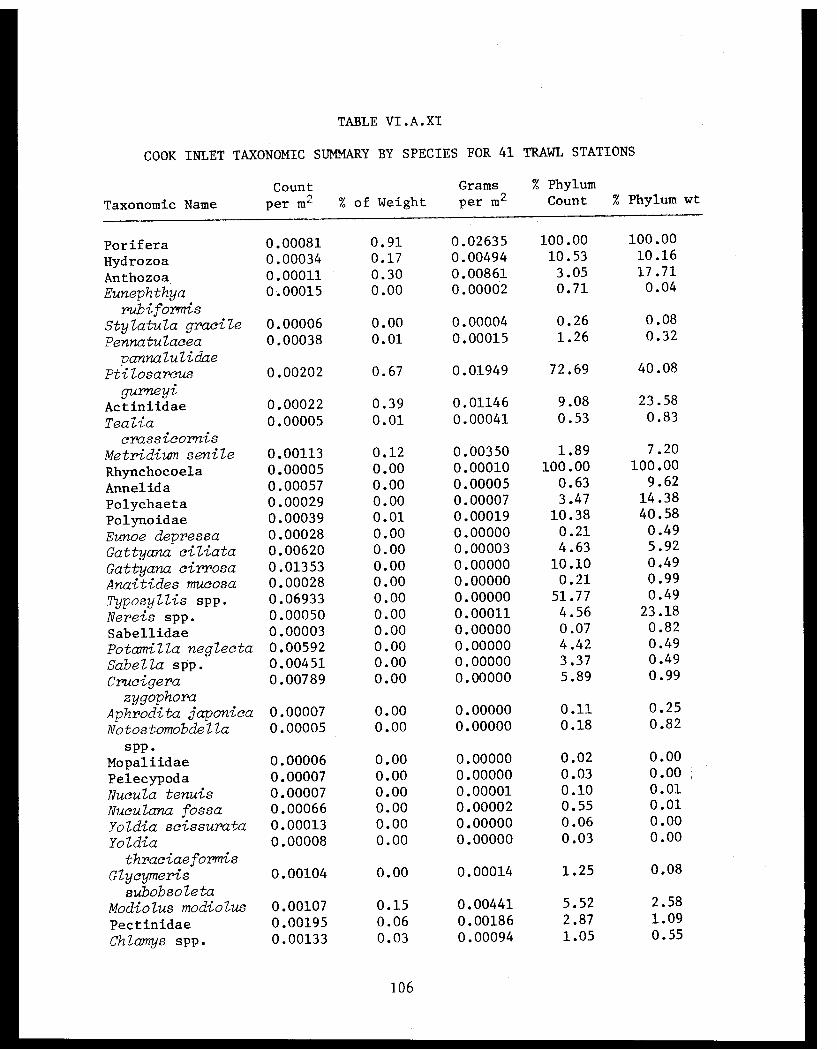
TABLE VI.A.XI
COOK INLET TAXONOMIC SUMMARY BY SPECIES FOR 41 TRAWL STATIONS
106
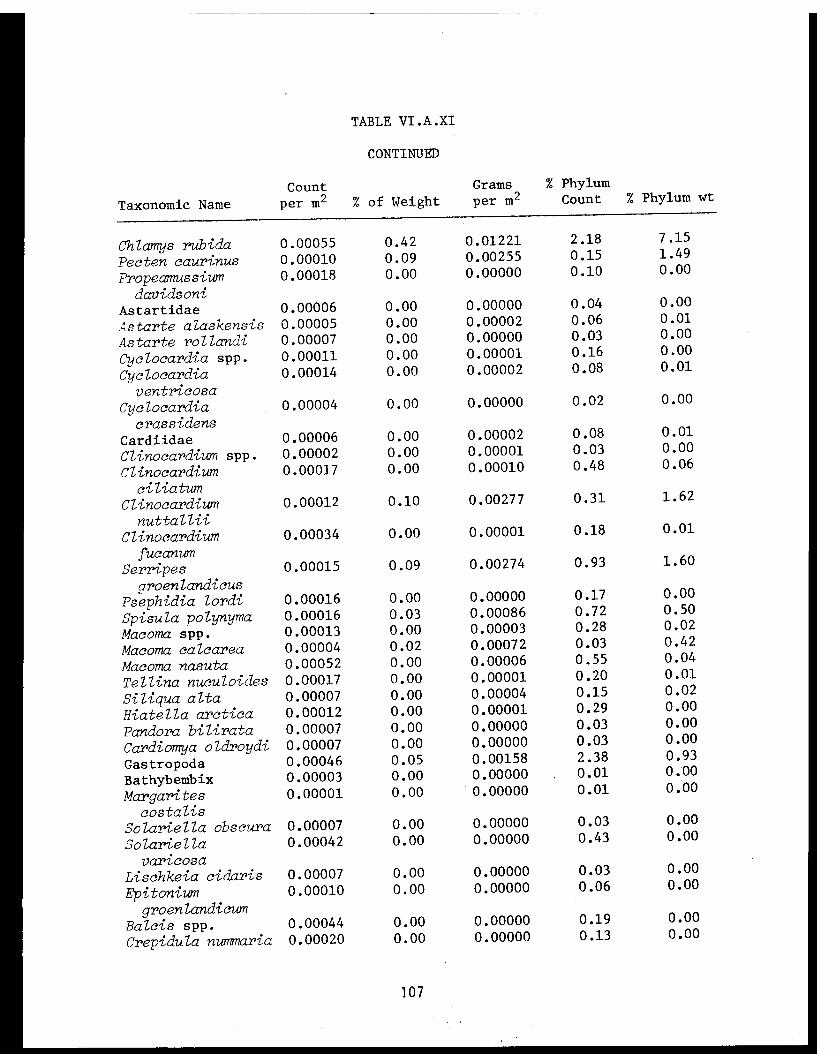
TABLE VI.A.XI
CONTINUED
107
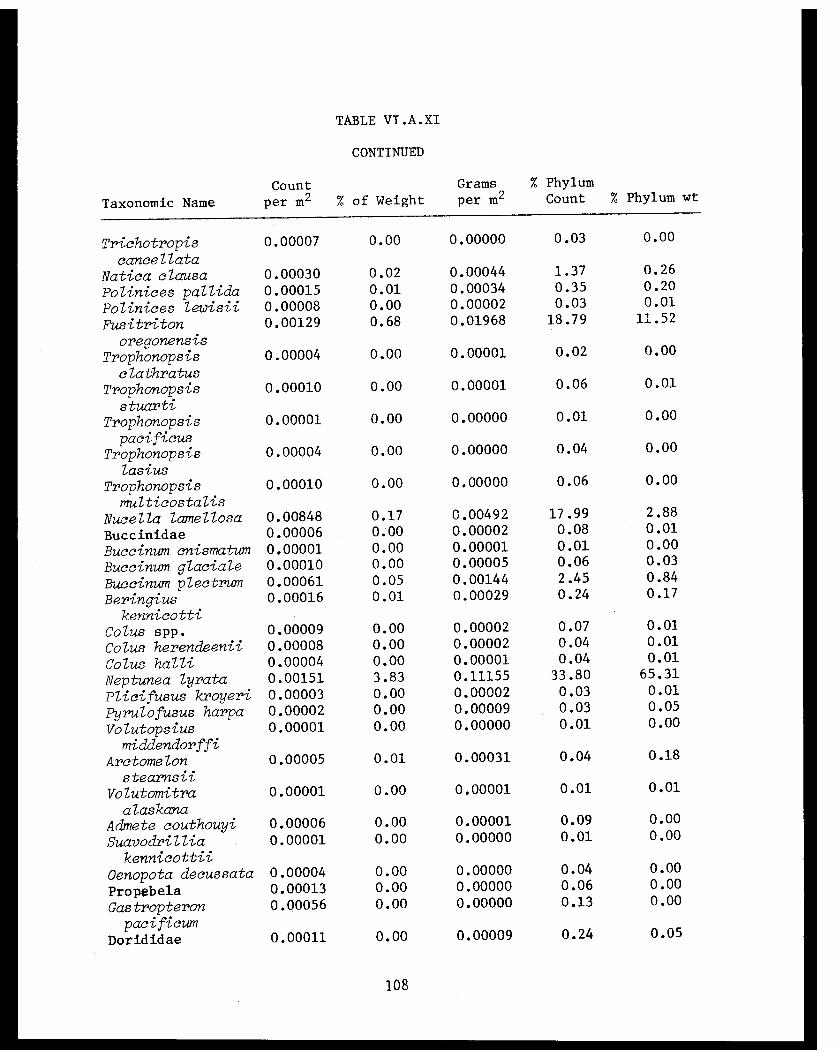
TABLE VI.A.XI
CONTINUED
108

TABLE VI.A.XI
CONTINUED
109
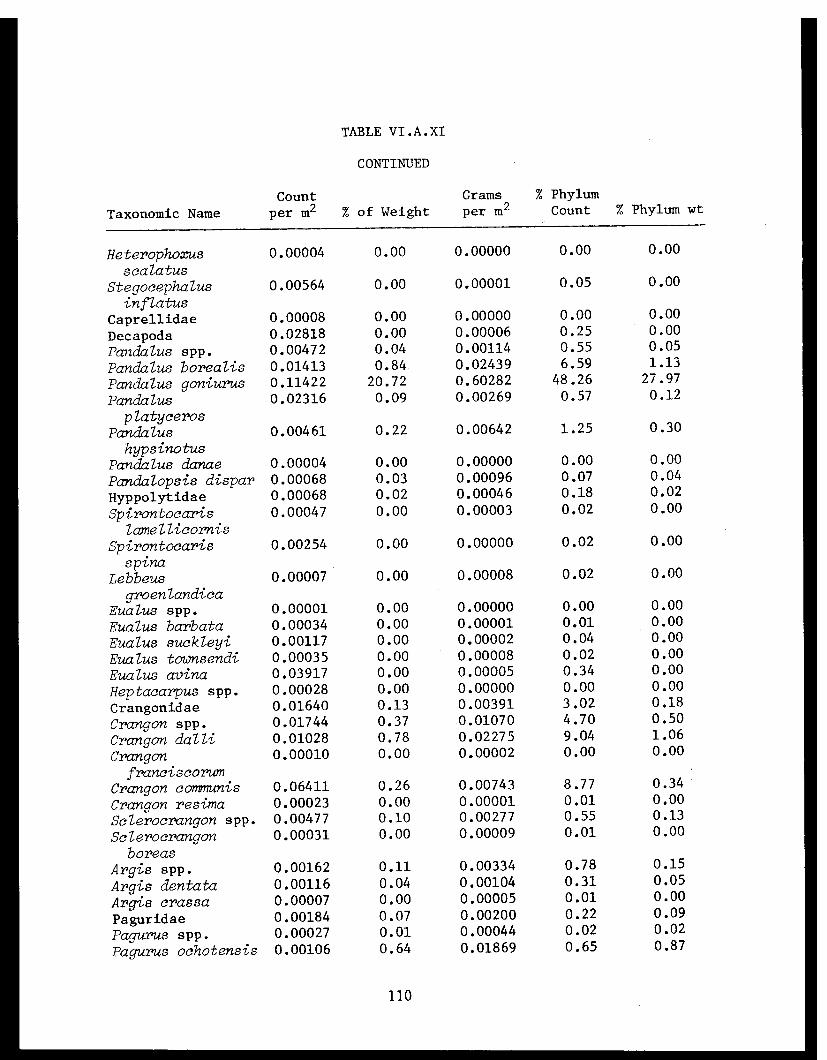
TABLE VI.A.XI
CONTINUED
110
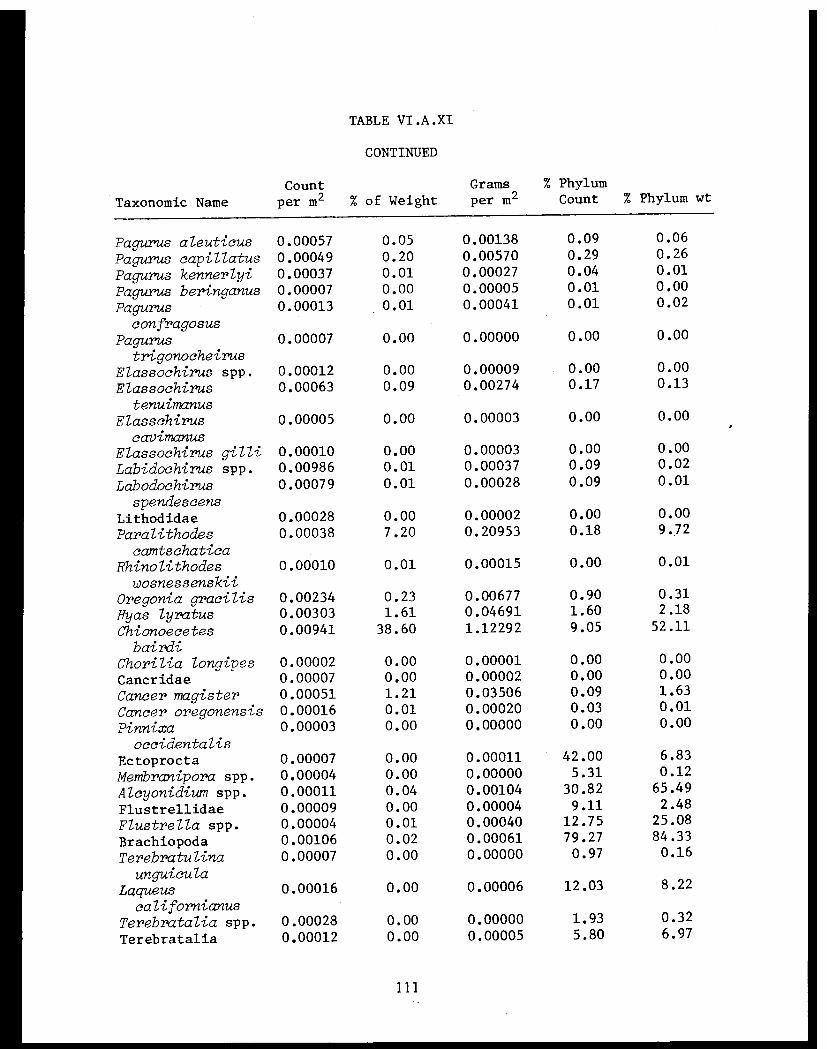
TABLE VI.A.XI
CONTINUED
111
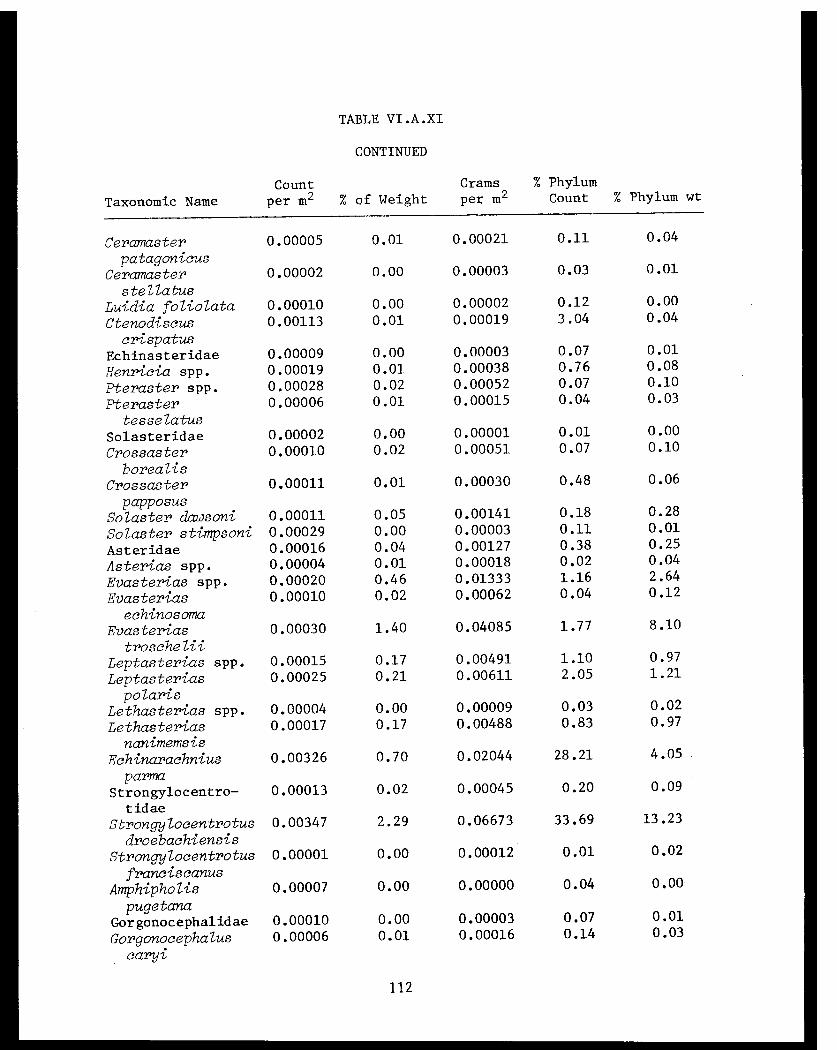
TABLE VI.A.XI
CONTINUED
112
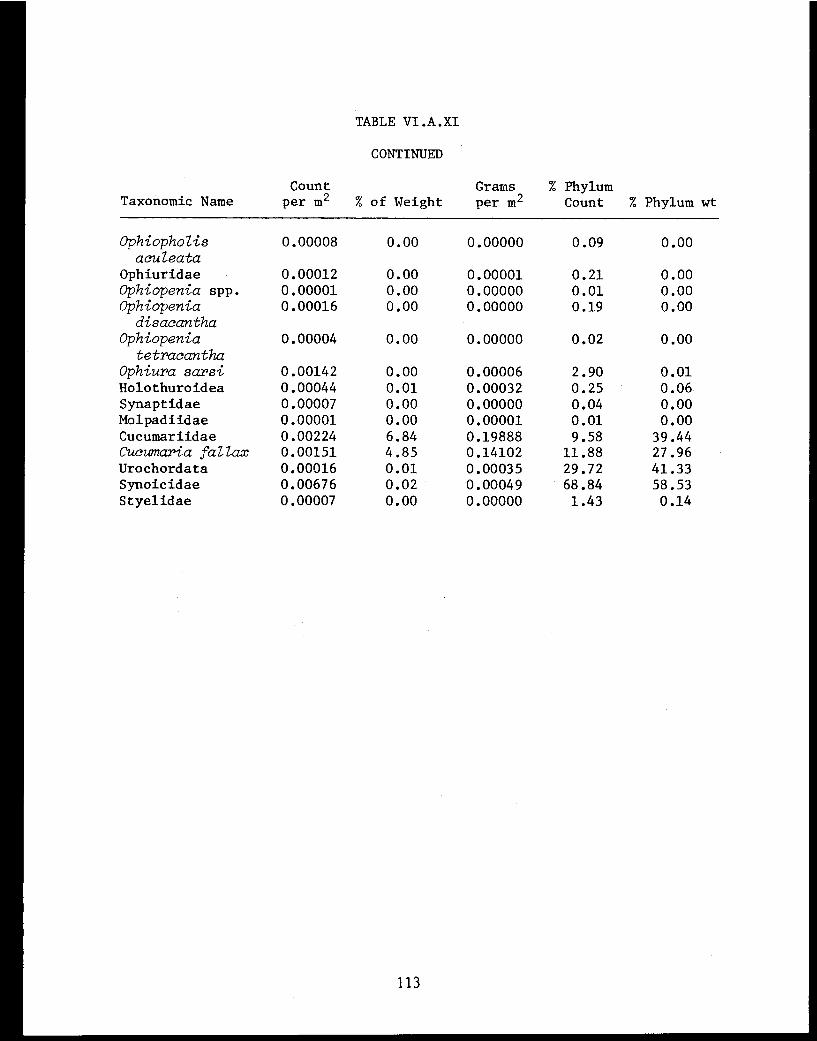
TABLE VI.A.XI
CONTINUED
113
Cluster Analysis for Grab samples
Cluster analysis of benthic grab samples using untransformed (Fig.
VI.A.1) and natural logarithm (ln) transformed abundance data (Fig. VI.A.2)
revealed the presence of two major station groups. The station groups
formed by each analysis were identical except for two stations. Station
31, classified as a member of Station Group 1 by a cluster analysis of
ln transformed abundance data (Fig. VI.A.2), was classified as a member
of Station Group 2 by a cluster analysis of untransformed data (Fig. VI.A.1).
Station 8 also classified as a member of Station Group 1 using ln trans-
formed abundance data (Fig. VI.A.2) did not join any station group when
untransformed data was used (Fig. VI.A.1). Station Group 1 consisted of
stations located in southwestern Cook Inlet and Station 40 near the entrance
to Kachemak Bay (Fig. VI.A.3). Station Group 2 consisted of stations in
the eastern part of Cook Inlet adjacent to Kachemak Bay.
An inverse cluster analysis, examining the similarities between spe-
cies indicated the presence of 39 species groups (Fig. VI.A.4; Table VI.A.XII).
A two-way coincidence table was constructed comparing the station groups and
species groups formed by a cluster analysis of ln transformed abundance
data (Table VI.A.XIII). Stations in Station Group 1 were characterized by
the presence of species in Species Group 20 (Table VI.A.XIII). An examina-
tion of the two-way table (Table VI.A.XIII) also indicated the presence of
subgroups within Station Group 1 characterized by the presence of species
in Species Groups 1, 15 and 16 (Table VI.A.XIII). Station Group 2 was
characterized by the presence of species in Species Group 35 and the low
diversity and species richness of its fauna (Table VI.A.XIV). Station 31
which was classified as a member of Station Group 2 by a cluster analysis
of untransformed abundance data was characterized by the presence of spe-
cies from both Species Groups 20 and 35 (Table VI.A.XIV) and thus, appeared
to be transitional in terms of its fauna between that of stations in Sta-
tion Groups 1 and 2.
Biomass and Species Diversity for Grab Samples
The invertebrates taken by van Veen grab at 18 stations included 99
species. Three of the five highest values for formalin wet weights occurred
114
in the central region of the Inlet (Fig. IV.1) with values of 731, 241,
and 128 g per m² at Stations 45, 31, and 33 respectively. In outer Kachemak
Bay, 558 g per m² was observed at Station 42. In the outer region of the
Inlet (Fig. IV.1) 163 g per m² were observed for Station 6. Table VI.A.XV
ranks stations in terms of weights and species diversity of invertebrates
taken by grab. Three of the five highest values for species diversity
were calculated for outer region Station (Fig. IV.1) 8, 7 and 5 (Table
VI.A.XV). High values for species diversity were also observed at Sta-
tions 31 and 45 (Table VI.A.XV) in the central zone of the Inlet (Fig. IV.1).
Table VI.A.XVI provides a taxon list for the organisms taken by grab and
information on their relative abundance. Data for individual stations is
available from the Alaska Environmental Data Center.
115
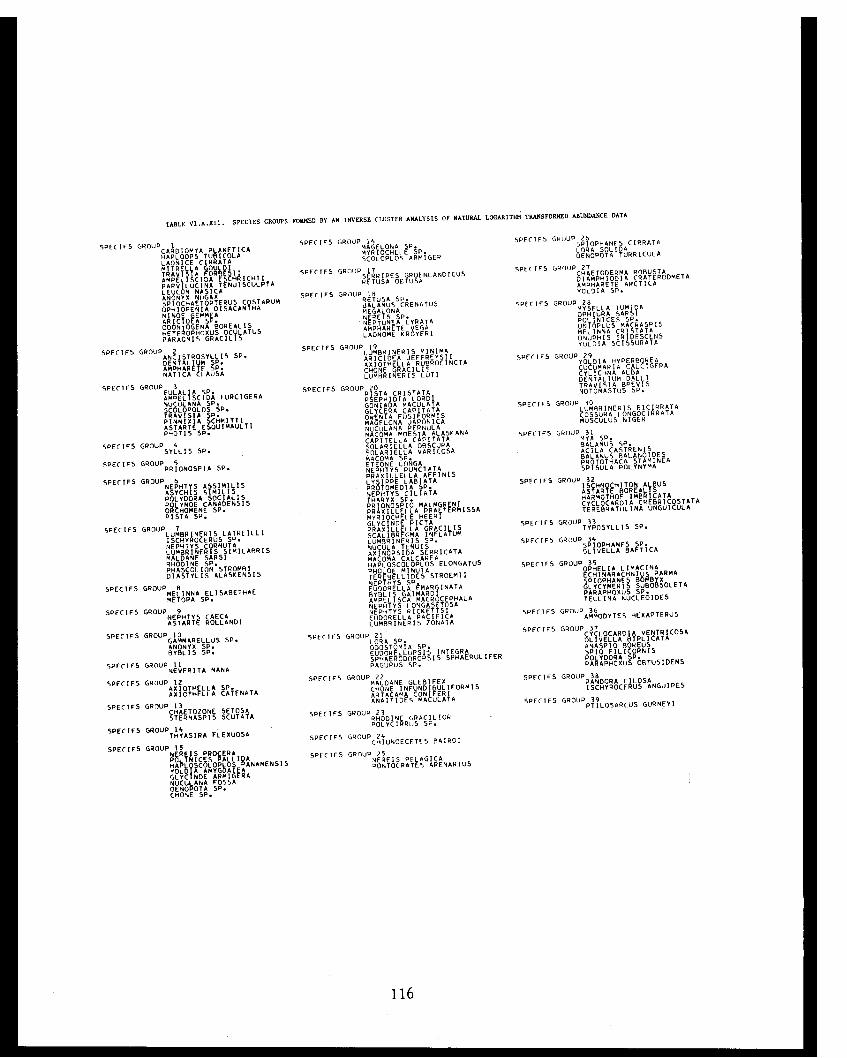
TABLE VI.A.XII. SPECIES GROUPS FORMED BY AN INVERSE CLUSTER ANALYSIS OF NATURAL LOGARITHM TRANSFORMED ABUNDANCE DATA
116
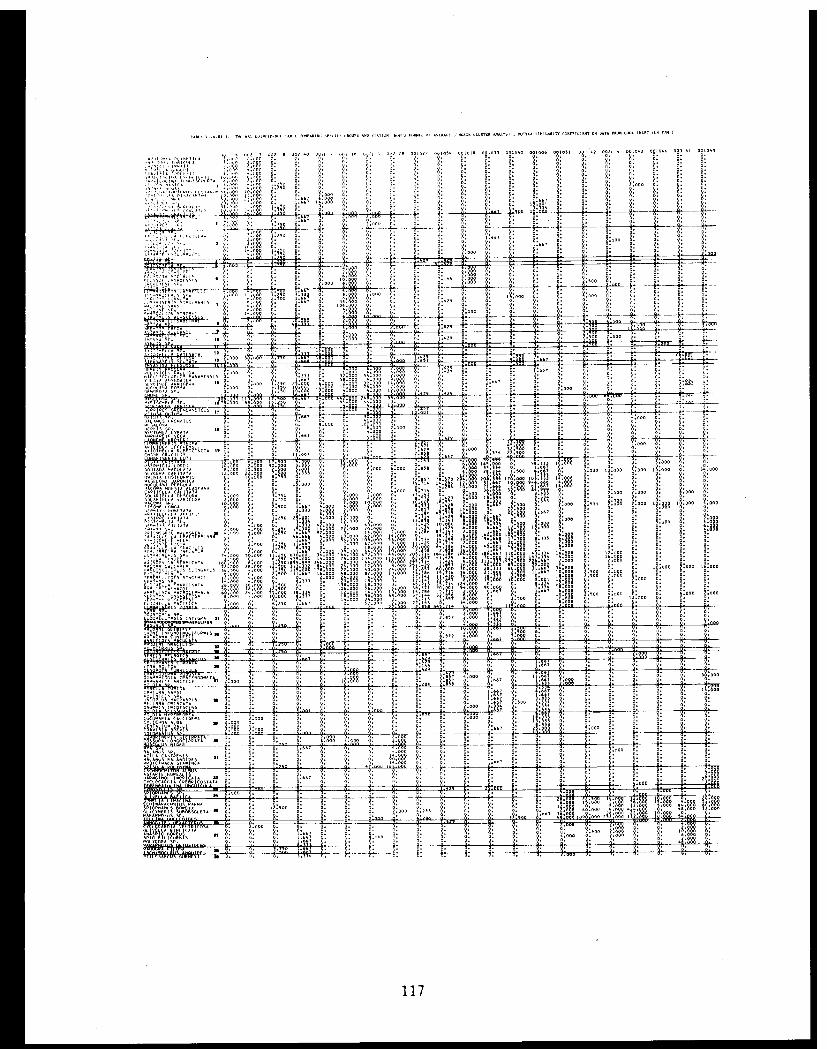
Table VII.A.XILI TWO WAY COINCIDNEC TABLE COMPARING SPECIES GROUPS AND STATIONS TROOPS FORMED BY AVERAGE LINKAGE CLUSTER ANALYSIS. MURT SIMILARITY COEFFICIENT ON DATA FROM COOK INLET
117
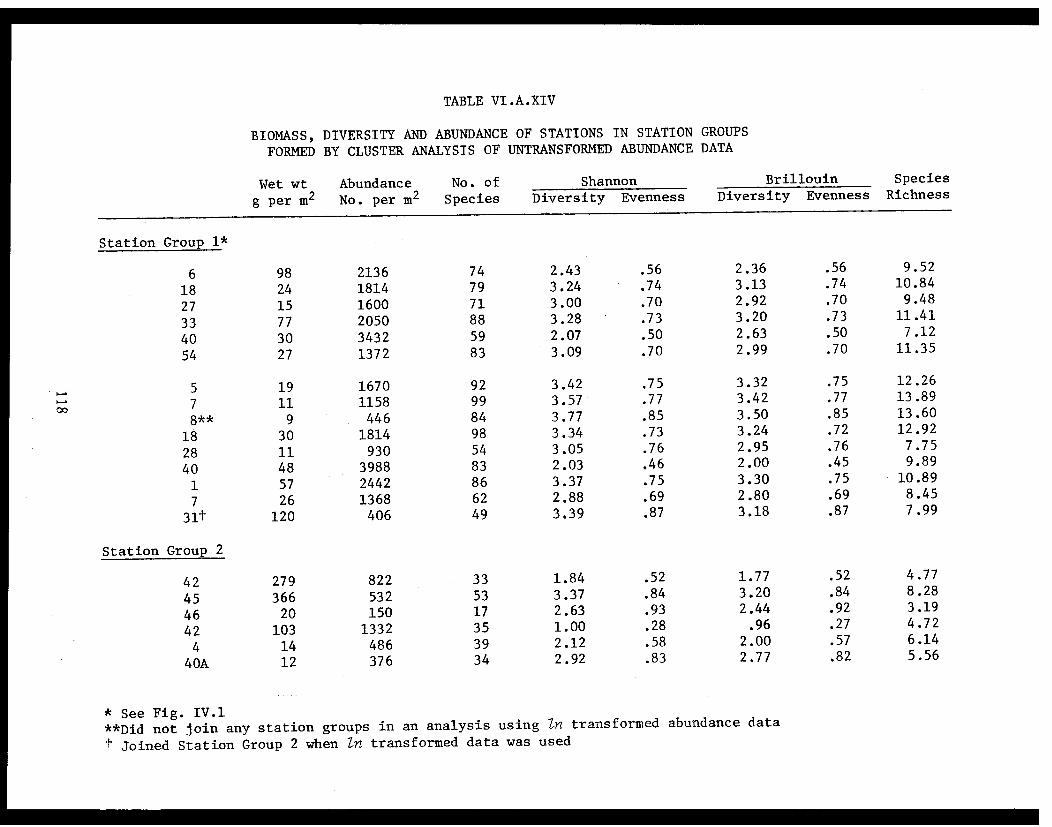
TABLE VI.A.XIV
BIOMASS, DIVERSITY AND ABUNDANCE OF STATIONS IN STATION GROUPS
FORMED BY CLUSTER ANALYSIS OF UNTRANSFORMED ABUNDANCE DATA
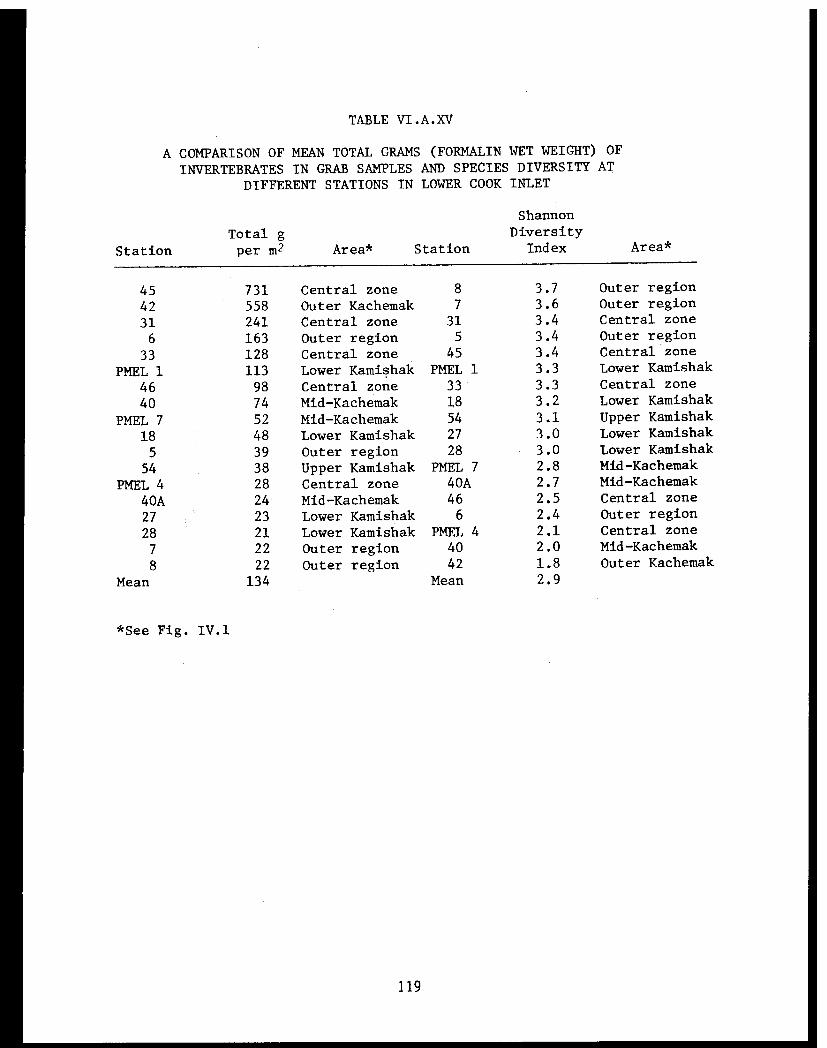
TABLE VI.A.XV
A COMPARISON OF MEAN TOTAL GRAMS (FORMALIN WET WEIGHT) OF
INVERTEBRATES IN GRAB SAMPLES AND SPECIES DIVERSITY AT
DIFFERENT STATIONS IN LOWER COOK INLET
119
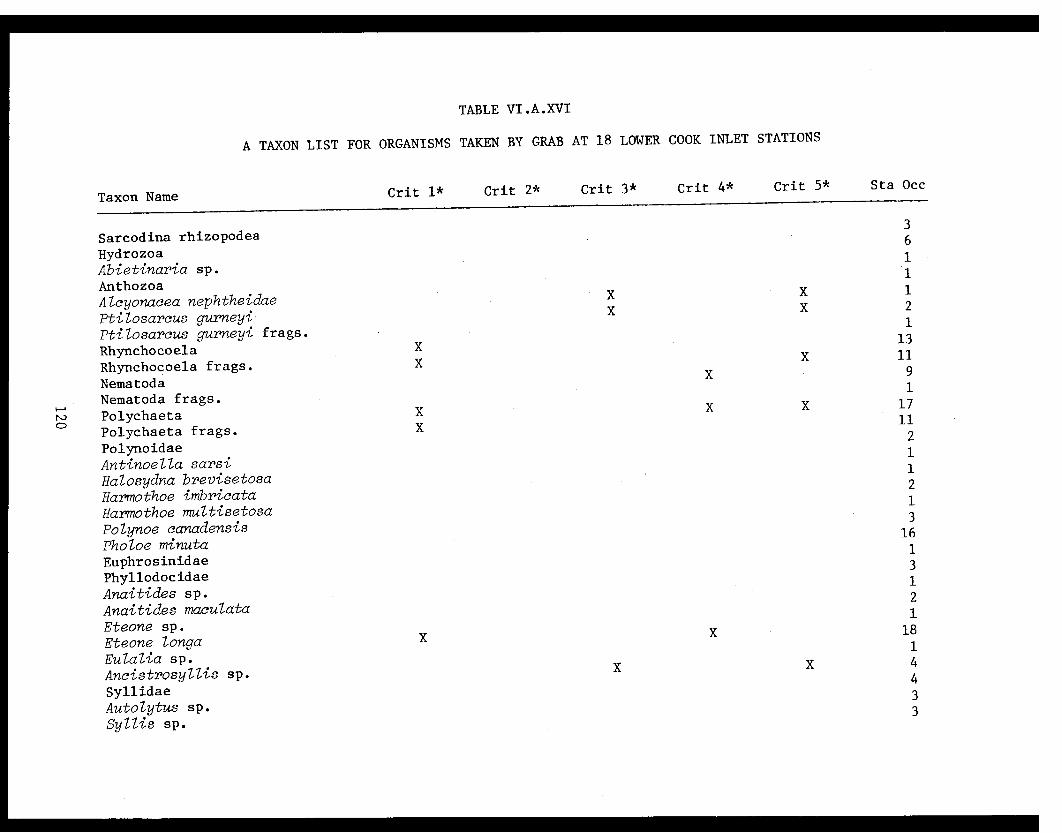
TABLE VI.A.XVI
A TAXON LIST FOR ORGANISMS TAKEN BY GRAB AT 18 LOWER COOK INLET STATIONS
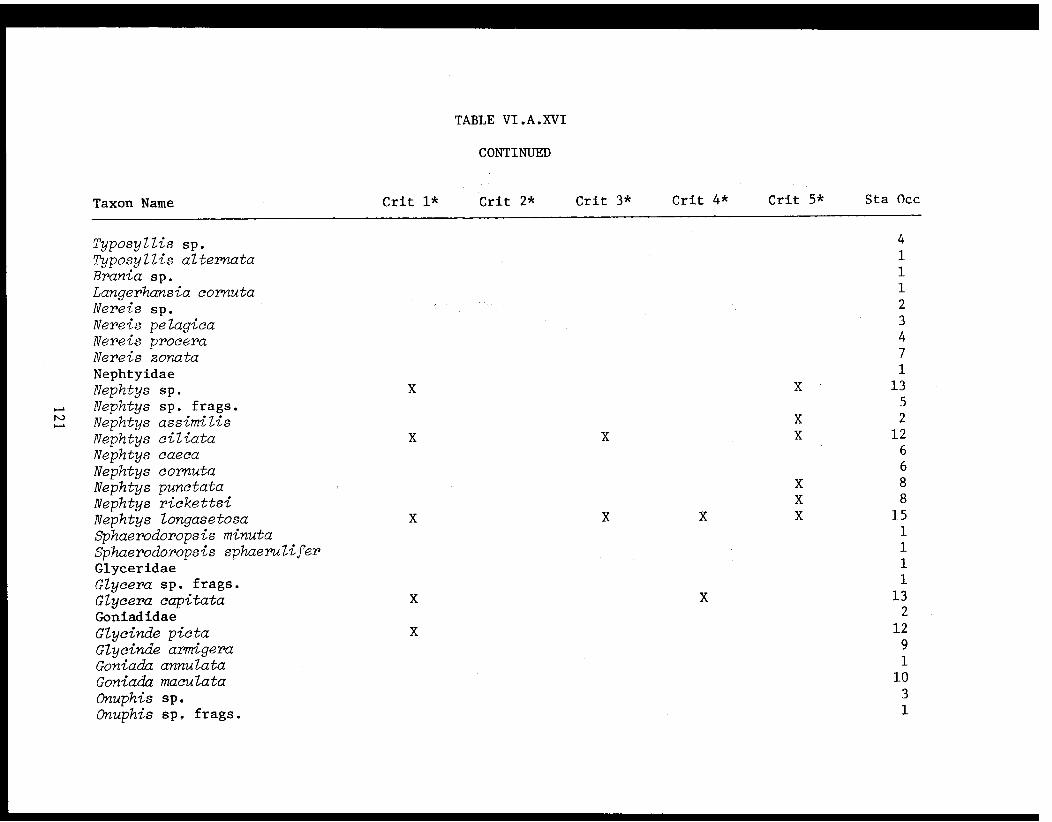
TABLE VI.A.XVI
CONTINUED
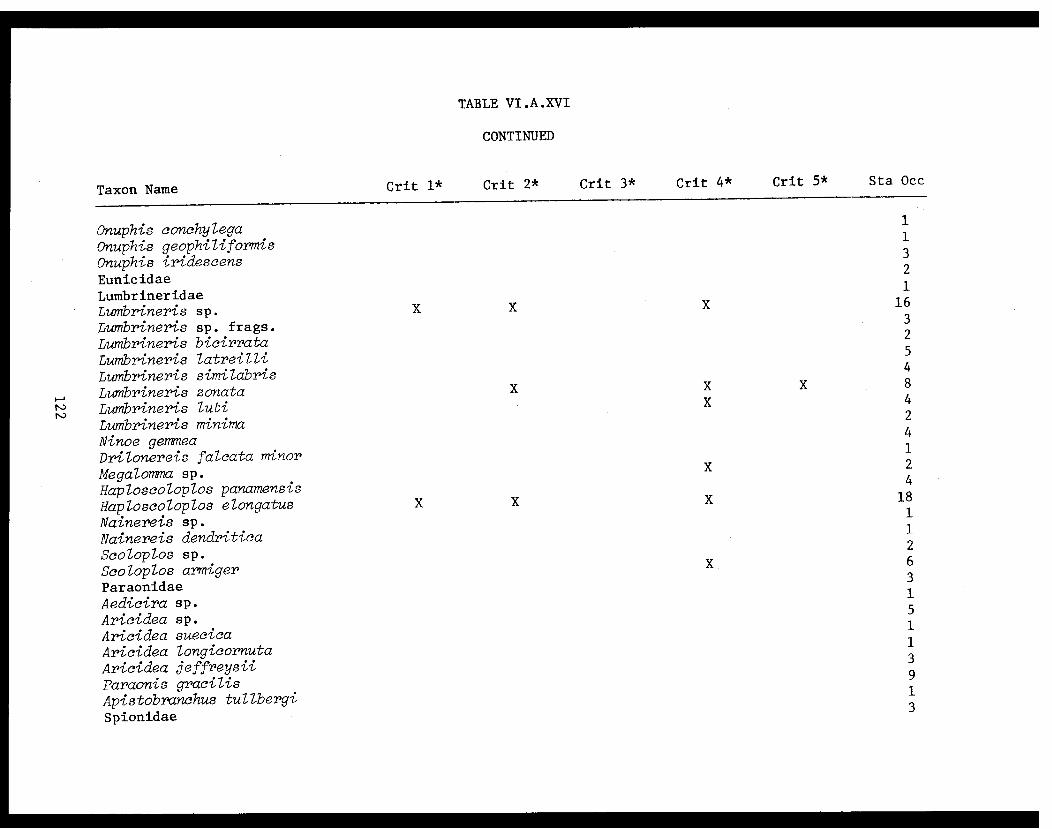
TABLE VI.A.XVI
CONTINUED

TABLE VI.A.XVI
CONTINUED
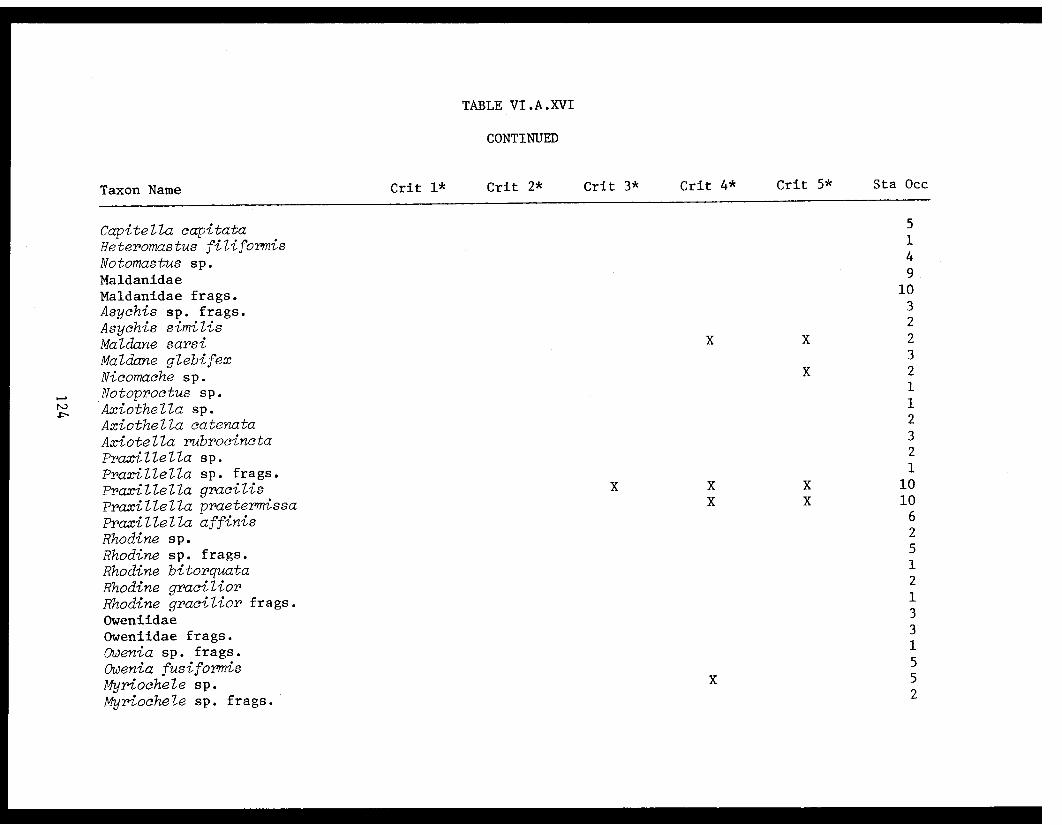
TABLE VI.A.XVI
CONTINUED

TABLE VI.A.XVI
CONTINUED

TABLE VI.A.XVI
CONTINUED
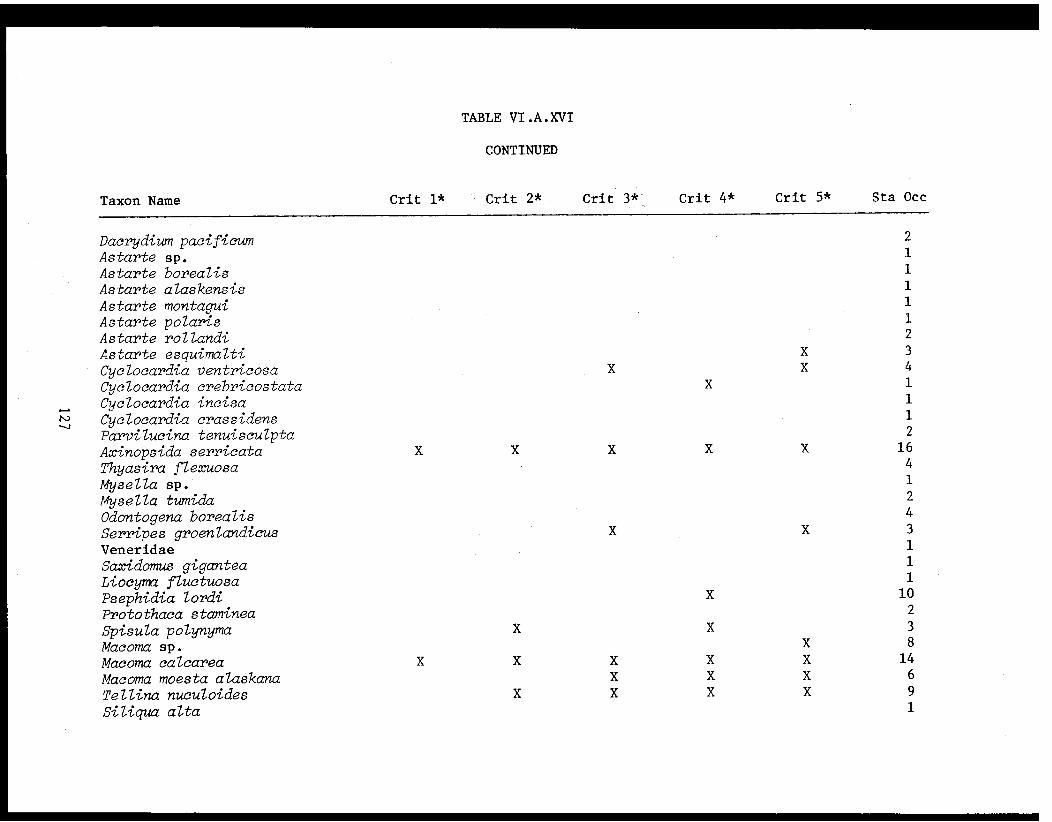
TABLE VI.A.XVI
CONTINUED
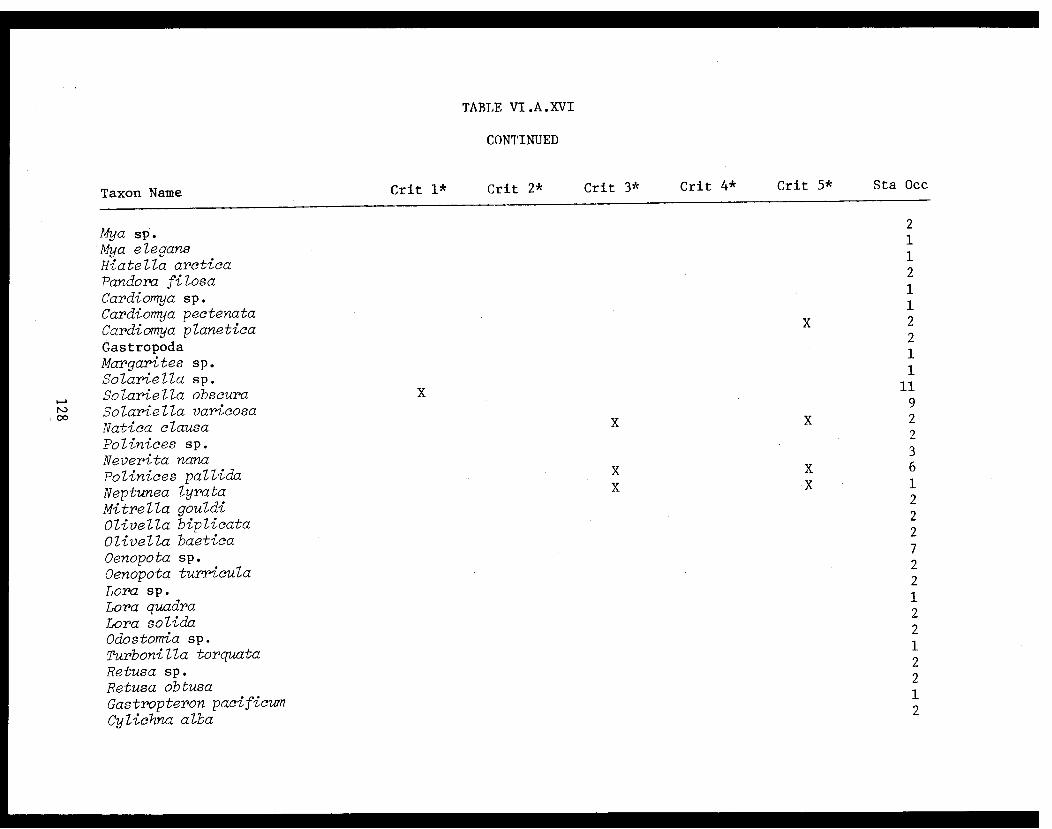
TABLE VI.A.XVI
CONTINUED
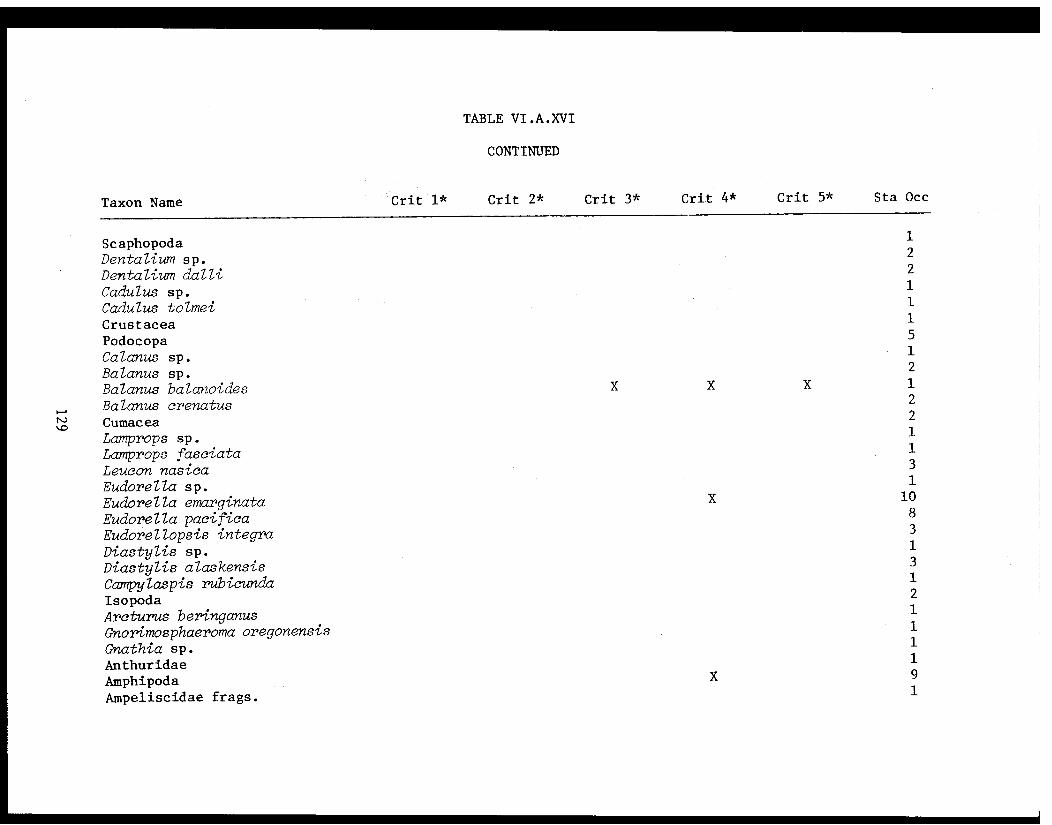
TABLE VI.A.XVI
CONTINUED
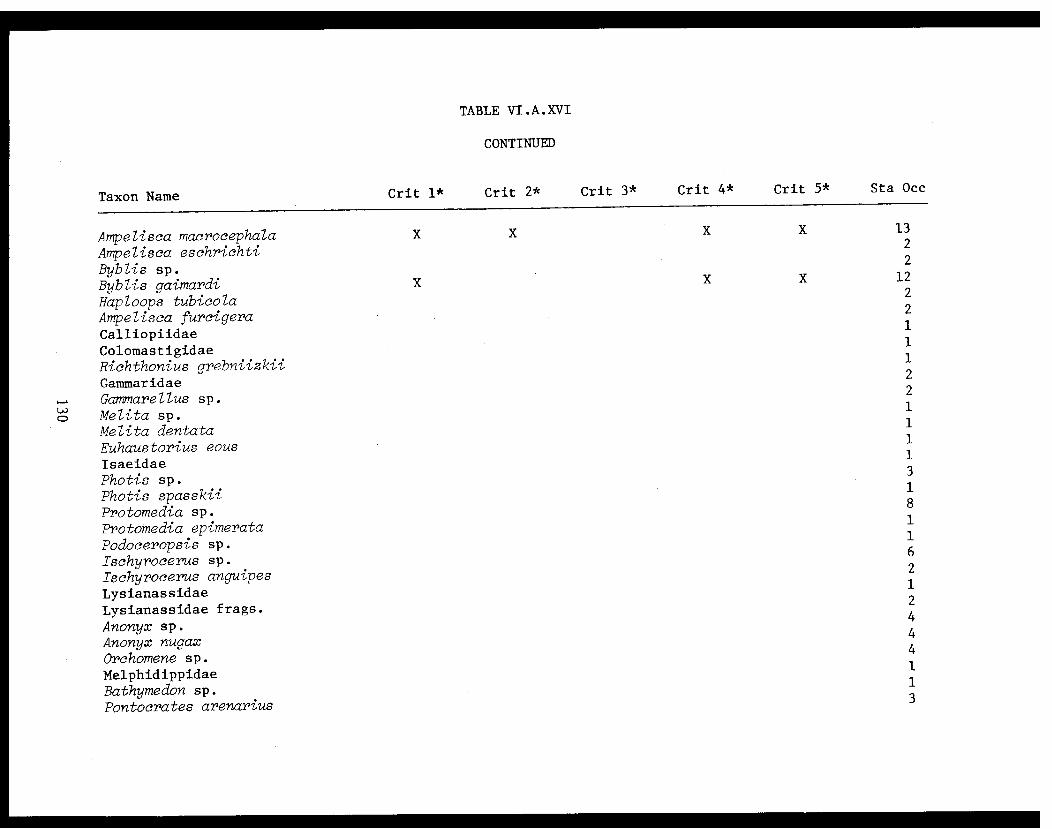
TABLE VI.A.XVI
CONTINUED
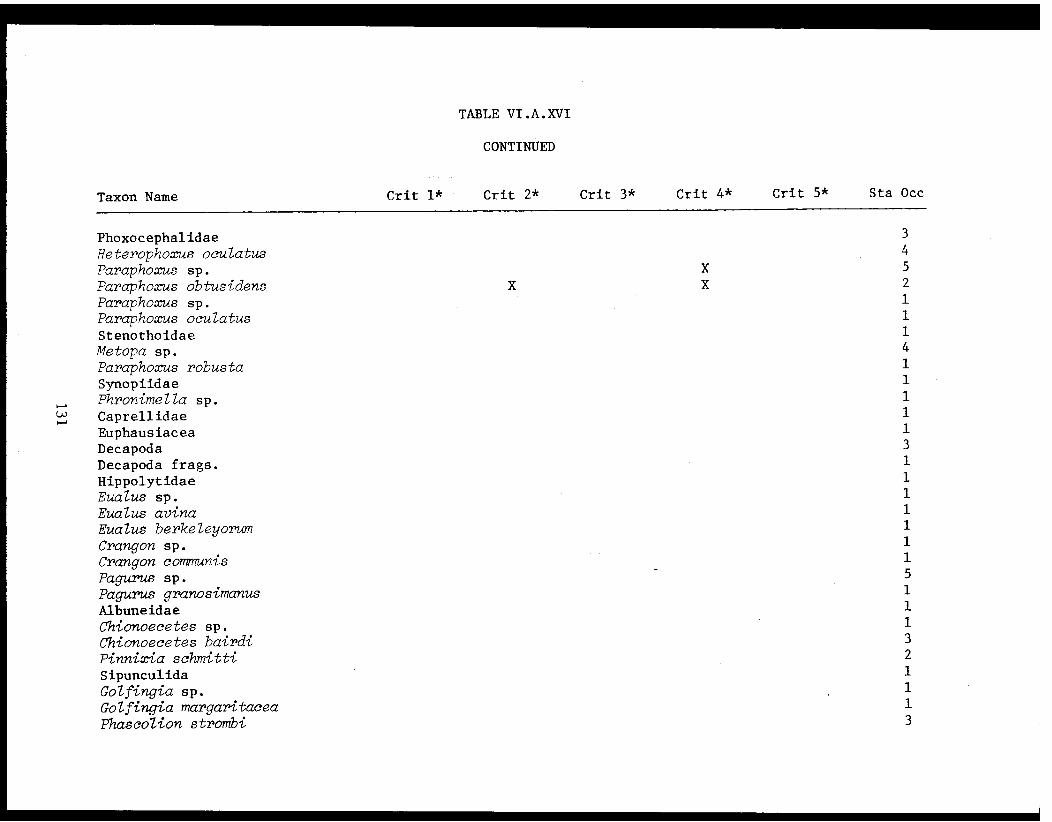
TABLE VI.A.XVI
CONTINUED
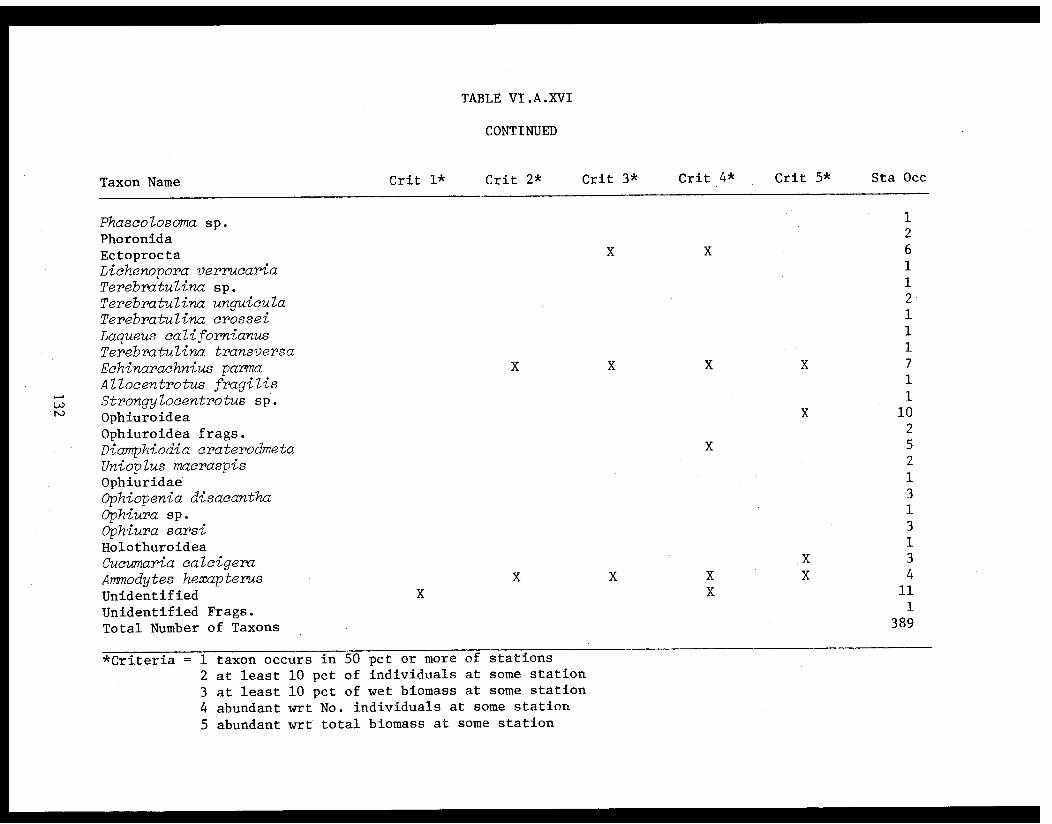
TABLE VI.A.XVI
CONTINUED
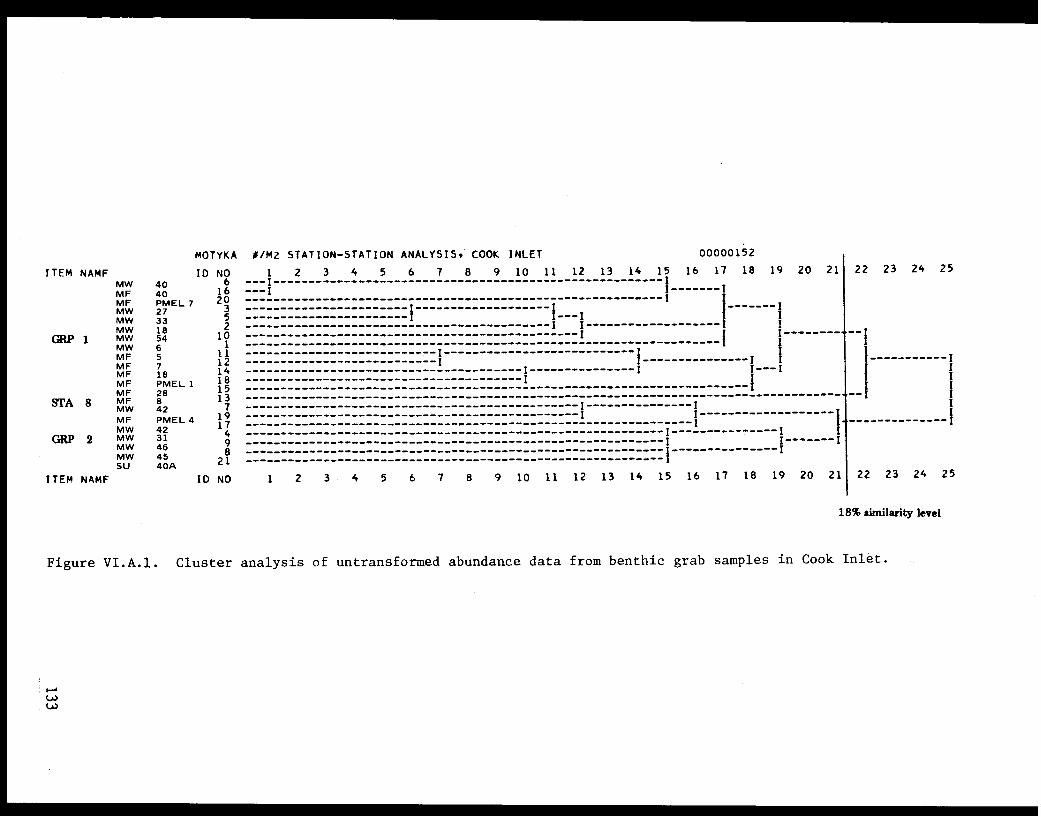
Figure VI.A.1. Cluster analysis of untransformed abundance data from benthic grab samples in Cook Inlet.
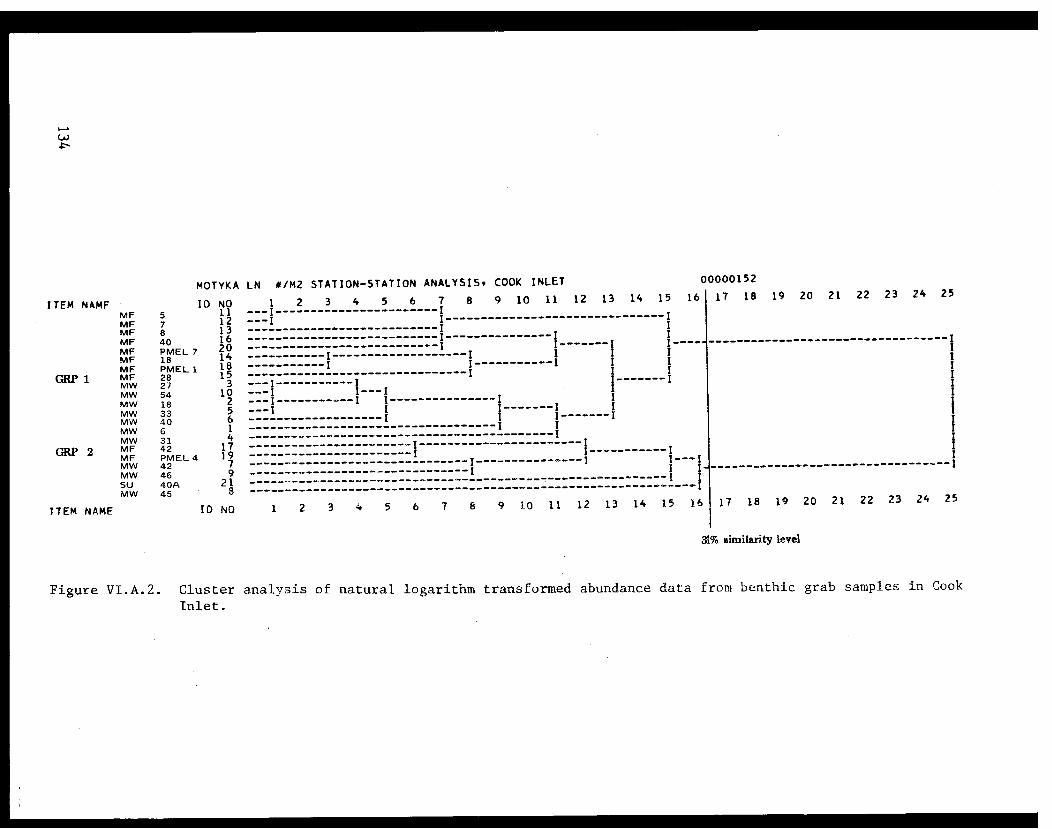
Figure VI.A.2. Cluster analysis of natural logarithm transformed abundance data from benthic grab samples in Cook
Inlet.

Figure VI.A.3. Location of stations in station groups delineated by a
cluster analysis of benthic grab data.
135

Figure VI.A.4. Cluster analysis comparing taxa on the basis of untransformedabundance data from benthic grabs in Cook Inlet.
136
SECTION B - FOOD OF SELECTED BENTHIC INVERTEBRATES AND FISHES IN COOKINLET
A detailed survey of the food of commercially important Crustacea and
two of their major prey groups, crangonid shrimps and hermit crabs, was
undertaken in order to identify key species involved in the flow of carbon
to these organisms. The animals examined were snow, king, and Dungeness
crabs; hermit crabs; pink, coonstripe, humpy, and crangonid shrimps. Data
on the food requirements of zoea larvae of snow crab, king crab, and pink
shrimp, juvenile snow crab, and post-larval king crab are included. Ad-
ditional food data for small numbers of Crangon communis, C. franciscorum,
Sclerocrangon boreas, Argis dentata, Oregonia gracilis, Hyas lyratus,
Lebbeus groenlandica and Ophiura sarsi are also included but not discussed.
These data are necessary to describe important organisms in the food web
of crab and shrimp which may be adversely affected by offshore oil and gas
development.
Food of Snow Crab (Chionoecetes bairdi)
Food occurred in 772 (64%) of 1198 Chionoecetes bairdi, larger than
20 mm, examined (Tables VI.B.I-VI.B.VI). In outer Kachemak Bay (Fig.
VI.B.1). Stations 40, 40A, and 41, small clams were the most frequently
encountered prey, occurring in 33% of the stomachs. The clams, Spisula
polynyma, Nucula tenuis, and Macoma spp. occurred in 16%, 6%, and 4% of the
stomachs, respectively. Hermit crabs were observed in 17% of the stomachs
and barnacles in 14%. All other prey categories were observed in less than
10% of the stomachs. In inner Kachemak Bay, Station 37, the dominant foods
were the clam, Nuculana fossa, which occurred in 7% of the stomachs, and
polychaetous annelids found in 5% of them.
In Kamishak Bay, Stations 18, 25, 27, 28, 35, 53, 56, PMEL 1 and E1,
small bivalves occurred in 37% of the stomachs. Macoma spp. were the most
frequently occurring clams and were found in 13% of the stomachs. Barnacles
and hermit crabs were observed in 19% and 17% of the stomachs, respectively.
All other categories of food were observed in less than 10% of the stomachs.
Juvenile Chionoecetes bairdi were found in four stomachs at Station 23
(Table VI.B.I).
137
Near the mouth of the Inlet, Stations 5, 5A, 8A, and 23, two food
types dominated. Clams of the genus Macoma and hermit crabs occurred in
45% and 12% of the stomachs, respectively.
Throughout Cook Inlet, snow crab stomachs with food commonly contained
the remains of several barnacles or clams. In one stomach, 16 recently
settled Macoma spp. were observed. Few stomachs contained more than one
large crustacean. The total number of each prey species estimated is
presented in Table VI.B.V. These data must be considered qualitative
since the estimates are made by counting shell and exoskeletal parts; soft,
easily digested tissues are underestimated. Feeding observations in the
laboratory have demonstrated that snow crabs may often eat the tissue of
small bivalves without ingesting much of the shell.
Little difference was detected in the frequency of occurrence of prey
species in Chionoecetes bairdi of different sexes or sizes examined (Tables
VI.B.V-VI.B.VI).
Barnacles, hermit crabs, crangonid shrimps, and small clams are
widely distributed throughout lower Cook Inlet (see Section A), and are
apparently fed upon by Chionoecetes bairdi in proportion to their abundance.
Other species used for food are discontinuous in their distribution in
lower Cook Inlet (see Section A). This discontinuous distribution, probably
more than their acceptability as food, explains the infrequent occurrence
of these species in snow crab stomachs.
Small amounts of sediment were observed in stomachs of crabs from
the three areas. Sediment seldom contributed to more than 16% of the dried
weight of stomach contents (Table VI.B.VII), and was probably ingested
inadvertently or came from the stomachs of prey.
In the Kodiak area the most commonly encountered snow crab stomach
contents were small clams, shrimps, plant material, and sediment (Feder
et al., 1977; Feder and Jewett, 1977). In Cook Inlet plant material, pos-
sibly eelgrass, was only observed in one stomach.
Tarverdieva (1976) found in the southeastern Bering Sea that adult
C. bairdi fed mainly on polychaetes (60-70%). Echinoderms were found
138
in less than 10% of the stomachs, and molluscs played a large role as
food of the young (63%) which live separately from the adults. Commercial-
size C. opilio fed, as C. bairdi, mainly on polychaetes (more than 50%
with respect to predominance), and the young crab fed on crustaceans (30-40%),
polychaetes (20-30%), and mollusks (20%). Feder et al. (1978) reported
polychaetes, clams and ophiuroids as important food items for C. opilio in
the southeastern Bering Sea.
Yasuda (1967) examined stomachs of Chionoecetes opilio elongatus
Rathbun from Japanese waters, and found the most frequently occurring
invertebrate prey to be brittle stars (Ophiura spp.), young C. opilio
elongatus, and protobranch clams. Polychaetes, shrimps, gastropods,
scaphopods, and fishes were also taken by C. opilio elongatus.
Polychaetes and gastropods were common in Cook Inlet but rarely preyed
upon. It is possible that polychaete fragments and setae were not observed
with the low-power dissection microscope available on shipboard; and poly-
chaetes may be used more frequently in snow crab stomachs than demonstrated
by our analysis. Brittle stars are relatively rare in lower Cook Inlet. In
Cook Inlet cannibalism was infrequent. Scaphopods and fishes were encoun-
tered in few C. bairdi stomachs.
A comparison of the percent fullness of stomachs of Cook Inlet snow
crab at different times of day (Table VI.B.VIII) indicates that there are
apparently no day-night trends in fullness of snow crab stomachs. These
data also indicate the normal degree of stomach fullness encountered in
fall, spring, and summer collections. Data on percent fullness of stomachs,
average dry weight of stomach contents, and percent tissue weight of stomach
contents is presented in Table VI.B.VII).
In the laboratory, total clearance of the stomach required 3 days
(Table VI.B.IX). In the laboratory consumption of Macoma balthica tissue
by snow crab averaged 4.2%, 3.4% and 6.5% of total live weight, total dry
weight and dry meat weight of snow crab, respectively (Table VI.B.X). These
data may be useful for indicating a change in normal feeding habits result-
ing from an environmental change, such as oil pollution.
139
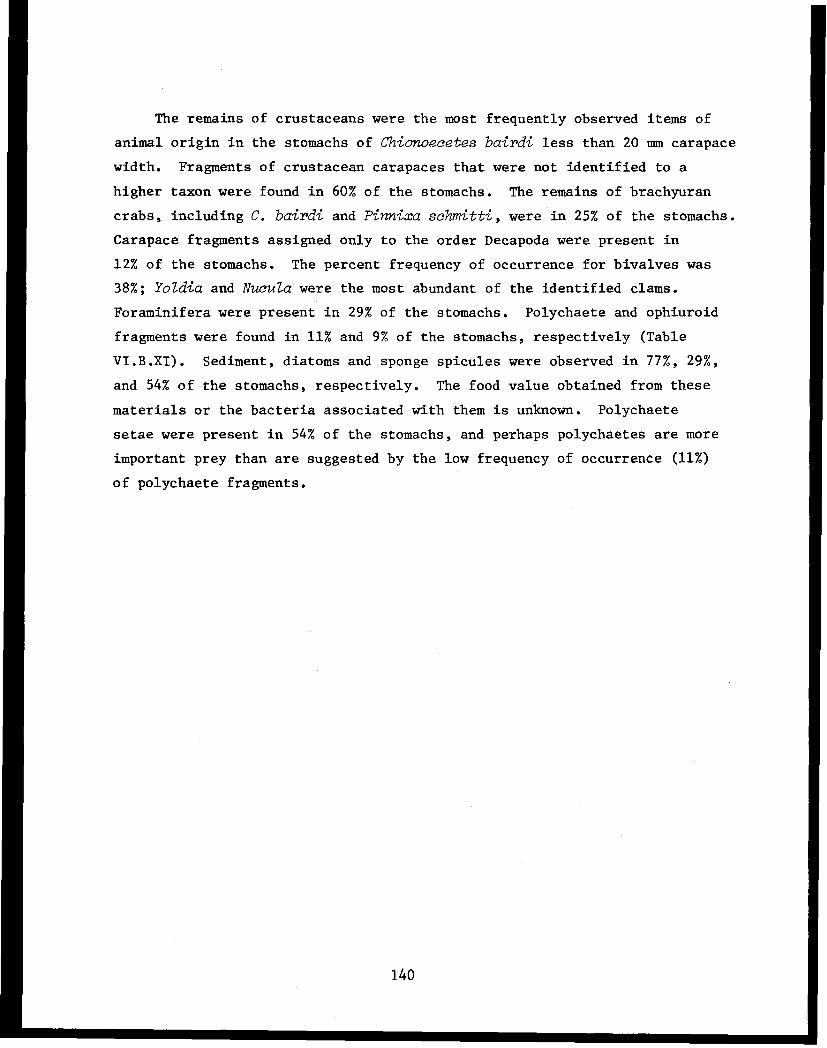
The remains of crustaceans were the most frequently observed items of
animal origin in the stomachs of Chionoecetes bairdi less than 20 mm carapace
width. Fragments of crustacean carapaces that were not identified to a
higher taxon were found in 60% of the stomachs. The remains of brachyuran
crabs, including C. bairdi and Pinnixa schmitti, were in 25% of the stomachs.
Carapace fragments assigned only to the order Decapoda were present in
12% of the stomachs. The percent frequency of occurrence for bivalves was
38%; Yoldia and Nucula were the most abundant of the identified clams.
Foraminifera were present in 29% of the stomachs. Polychaete and ophiuroid
fragments were found in 11% and 9% of the stomachs, respectively (Table
VI.B.XI). Sediment, diatoms and sponge spicules were observed in 77%, 29%,
and 54% of the stomachs, respectively. The food value obtained from these
materials or the bacteria associated with them is unknown. Polychaete
setae were present in 54% of the stomachs, and perhaps polychaetes are more
important prey than are suggested by the low frequency of occurrence (11%)
of polychaete fragments.
140
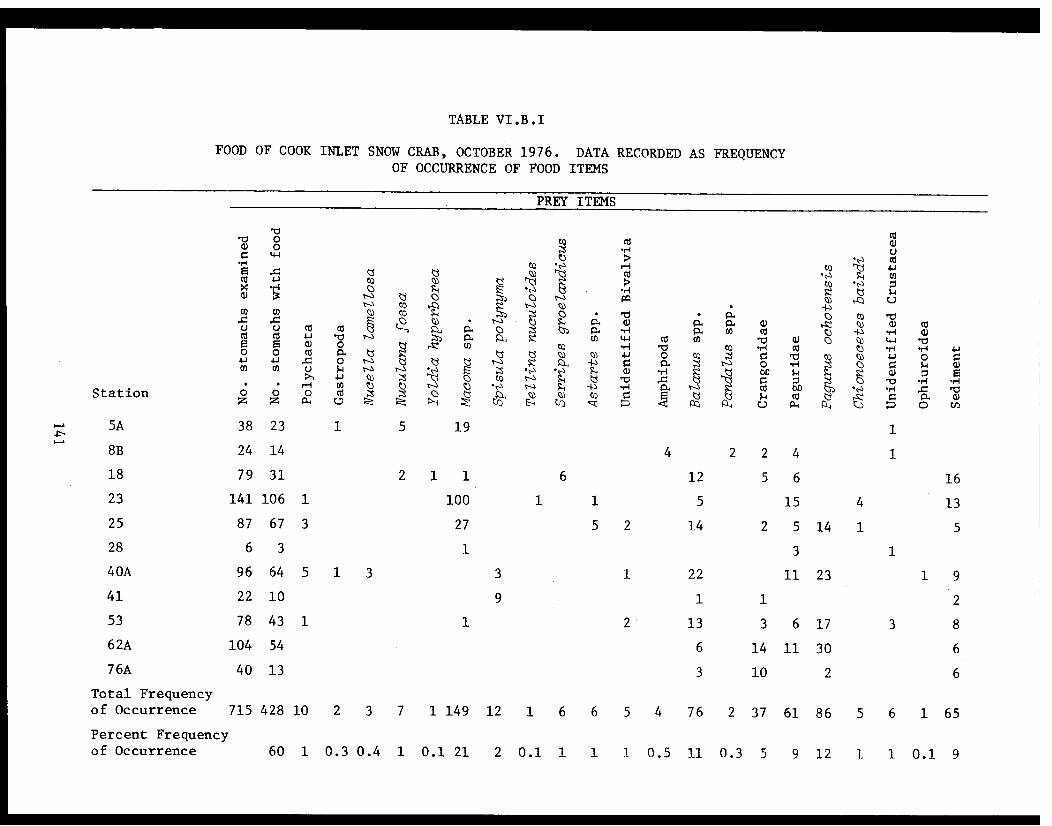
TABLE VI.B.I
FOOD OF COOK INLET SNOW CRAB, OCTOBER 1976. DATA RECORDED AS FREQUENCYOF OCCURRENCE OF FOOD ITEMS

TABLE VI.B.II
FOOD OF COOK INLET SNOW CRAB, NOVEMBER 1977. DATA RECORDED AS FREQUENCY
OF OCCURRENCE OF FOOD ITEMS

TABLE VI.B.III
FOOD OF COOK INLET SNOW CRAB, MARCH 1978. DATA RECORDED AS FREQUENCYOF OCCURRENCE OF FOOD ITEMS

TABLE VI.B.IV
FOOD OF COOK INLET SNOW CRAB, JULY 1979. DATA RECORDED AS FREQUENCYOF OCCURRENCE OF FOOD ITEMS
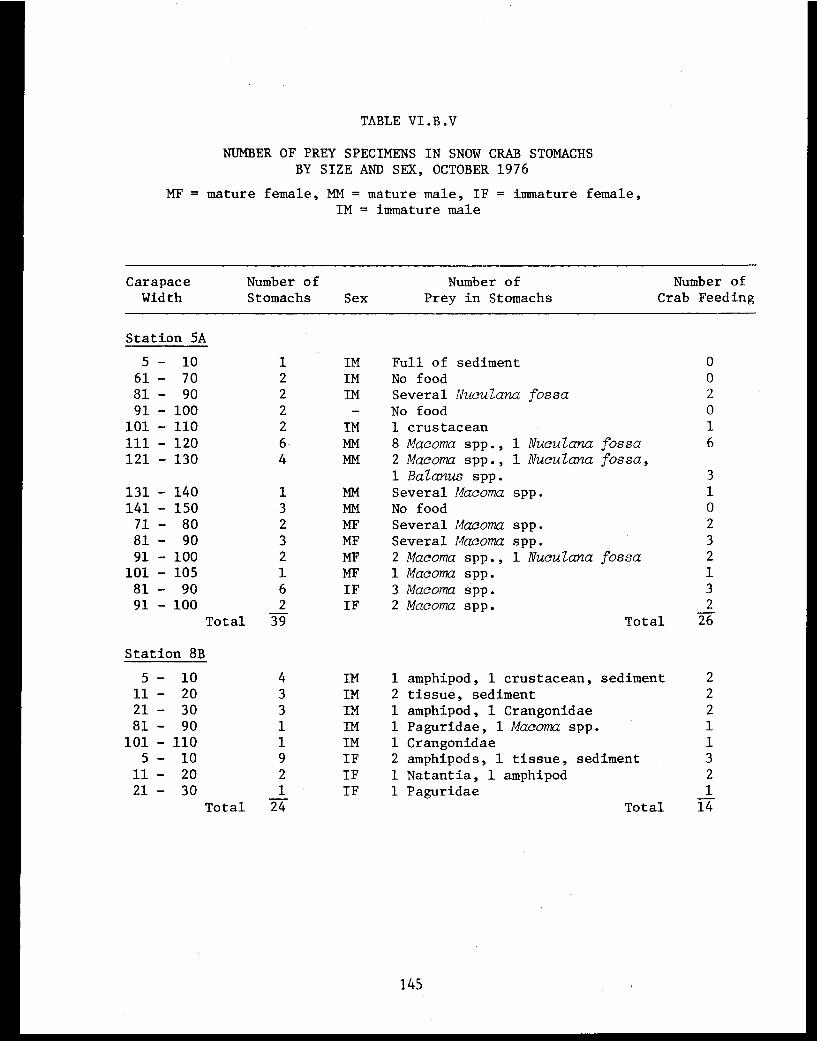
TABLE VI.B.V
NUMBER OF PREY SPECIMENS IN SNOW CRAB STOMACHSBY SIZE AND SEX, OCTOBER 1976

TABLE VI.B.V
CONTINUED
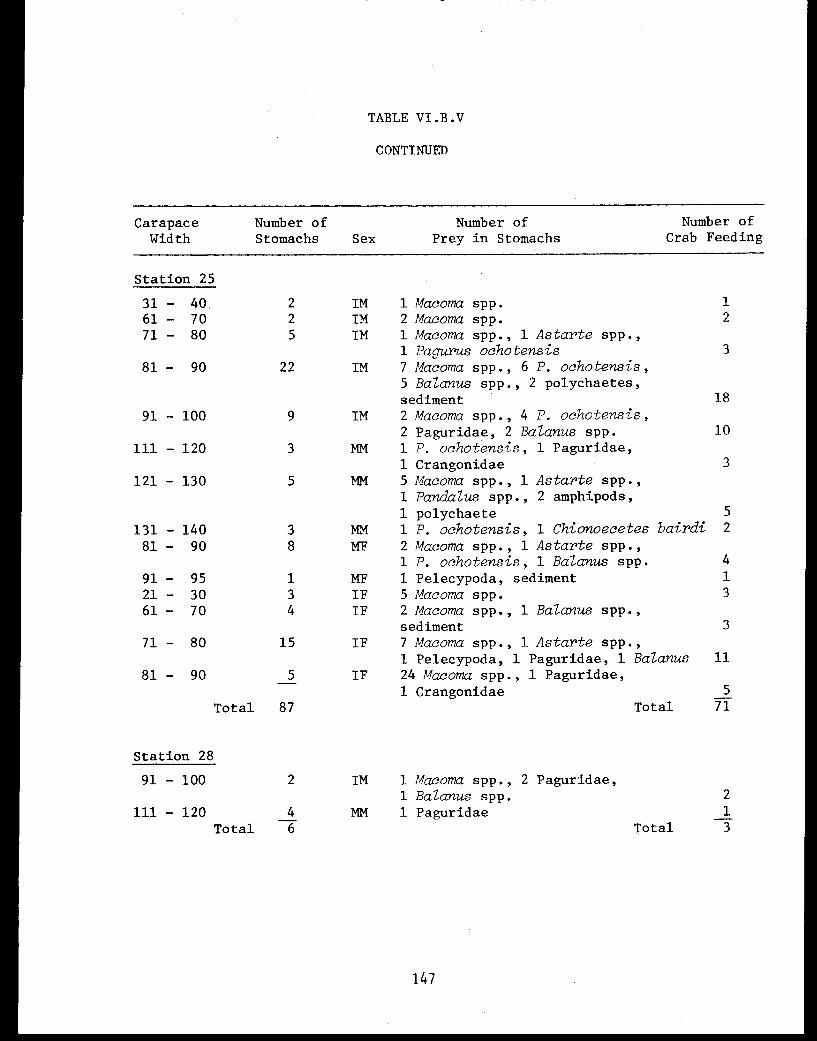
TABLE VI.B.V
CONTINUED

TABLE VI.B.V
CONTINUED

TABLE VI.B.VI
FOOD OF COOK INLET SNOW CRAB BY SIZE OF CRAB, NOVEMBER 1977.
DATA RECORDED AS FREQUENCY OF OCCURRENCE OF FOOD ITEMS
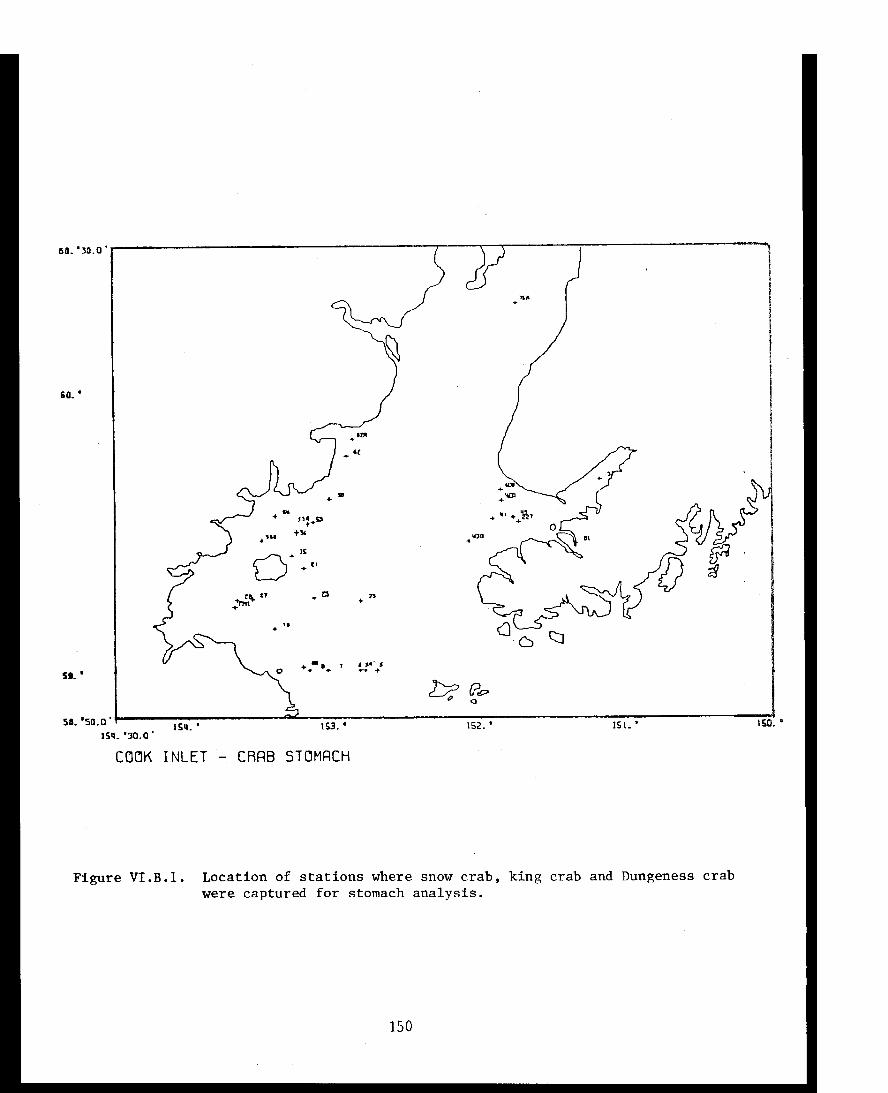
Figure VI.B.1. Location of stations where snow crab, king crab and Dungeness crab
were captured for stomach analysis.
150
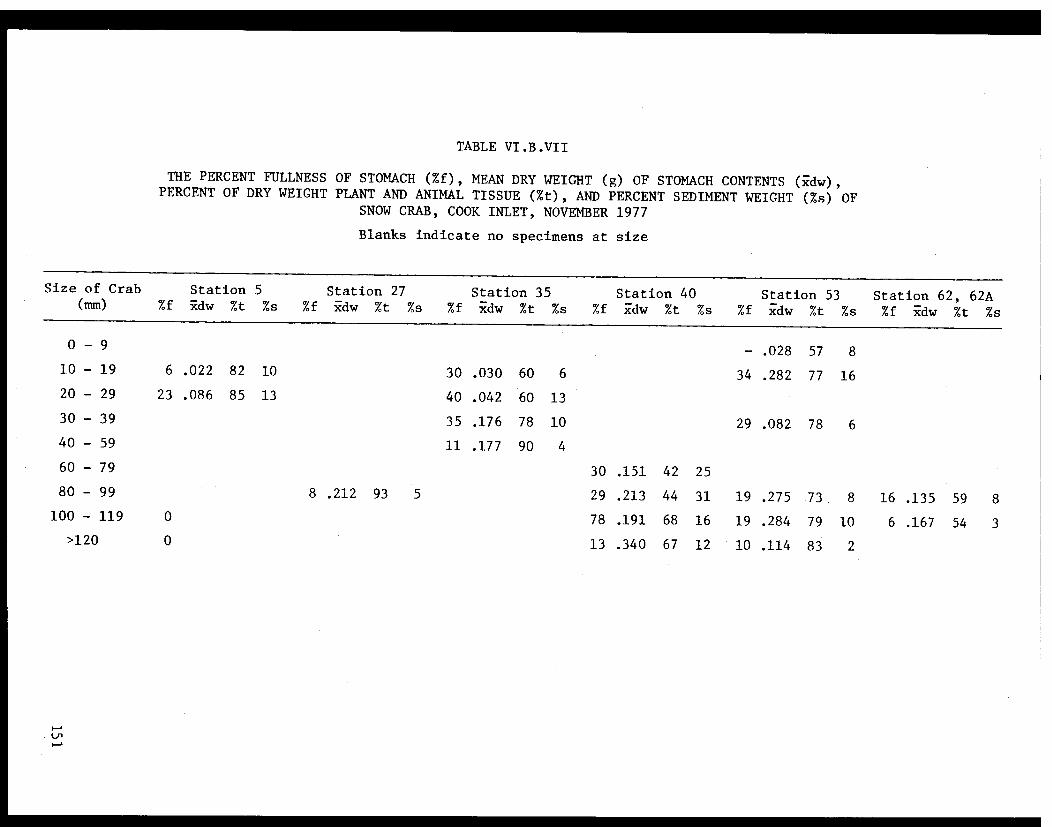
TABLE VI.B.VII
THE PERCENT FULLNESS OF STOMACH (%f), MEAN DRY WEIGHT (g) OF STOMACH CONTENTS (xdw),PERCENT OF DRY WEIGHT PLANT AND ANIMAL TISSUE (%t), AND PERCENT SEDIMENT WEIGHT (%s) OF
SNOW CRAB, COOK INLET, NOVEMBER 1977
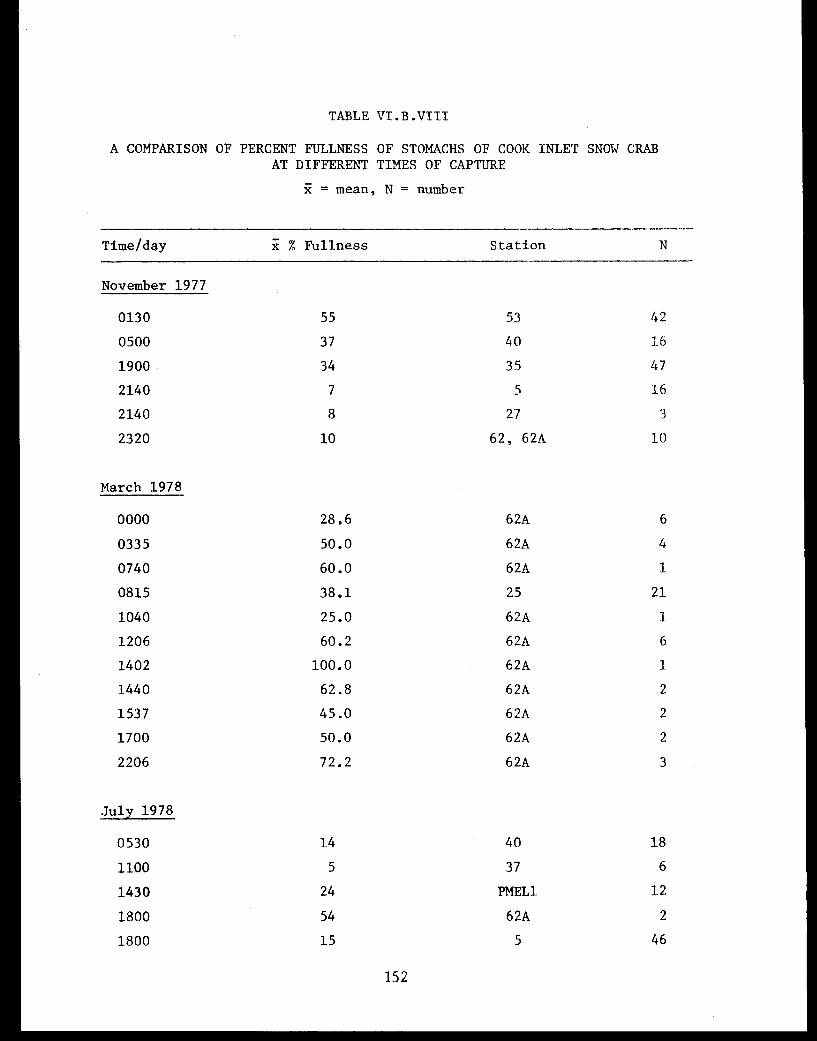
TABLE VI.B.VIII
A COMPARISON OF PERCENT FULLNESS OF STOMACHS OF COOK INLET SNOW CRABAT DIFFERENT TIMES OF CAPTURE
152
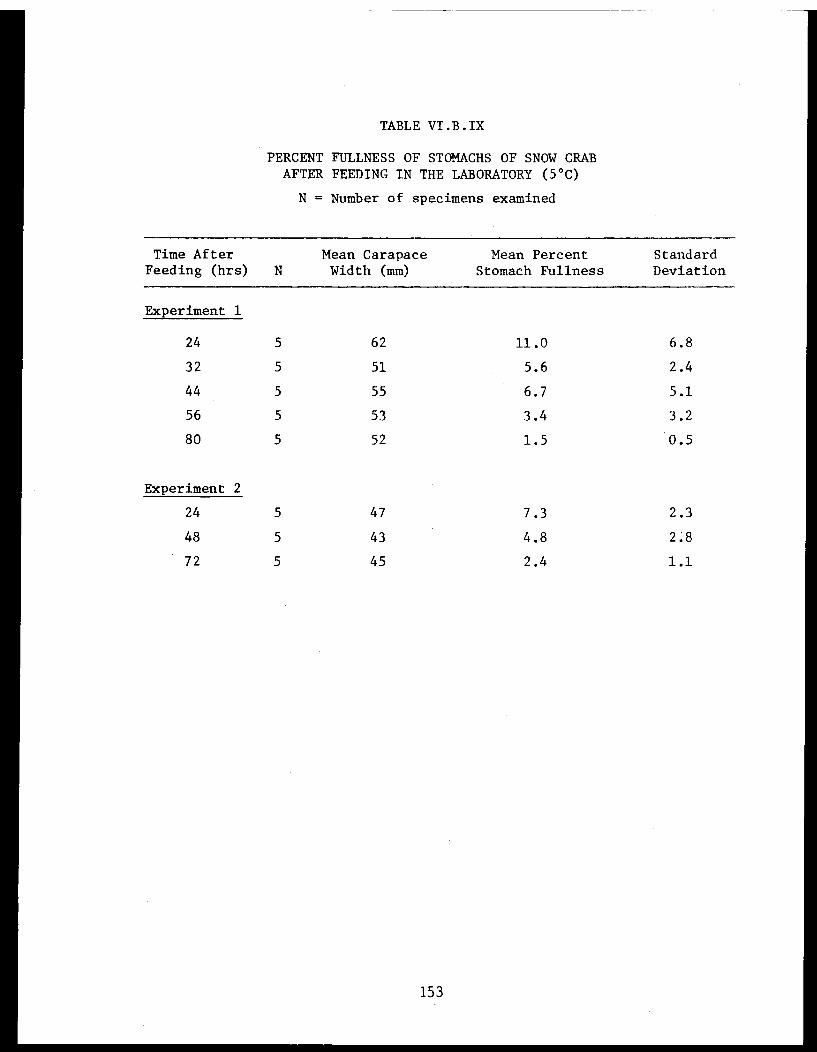
TABLE VI.B.IX
PERCENT FULLNESS OF STOMACHS OF SNOW CRABAFTER FEEDING IN THE LABORATORY (5°C)
N = Number of specimens examined
153
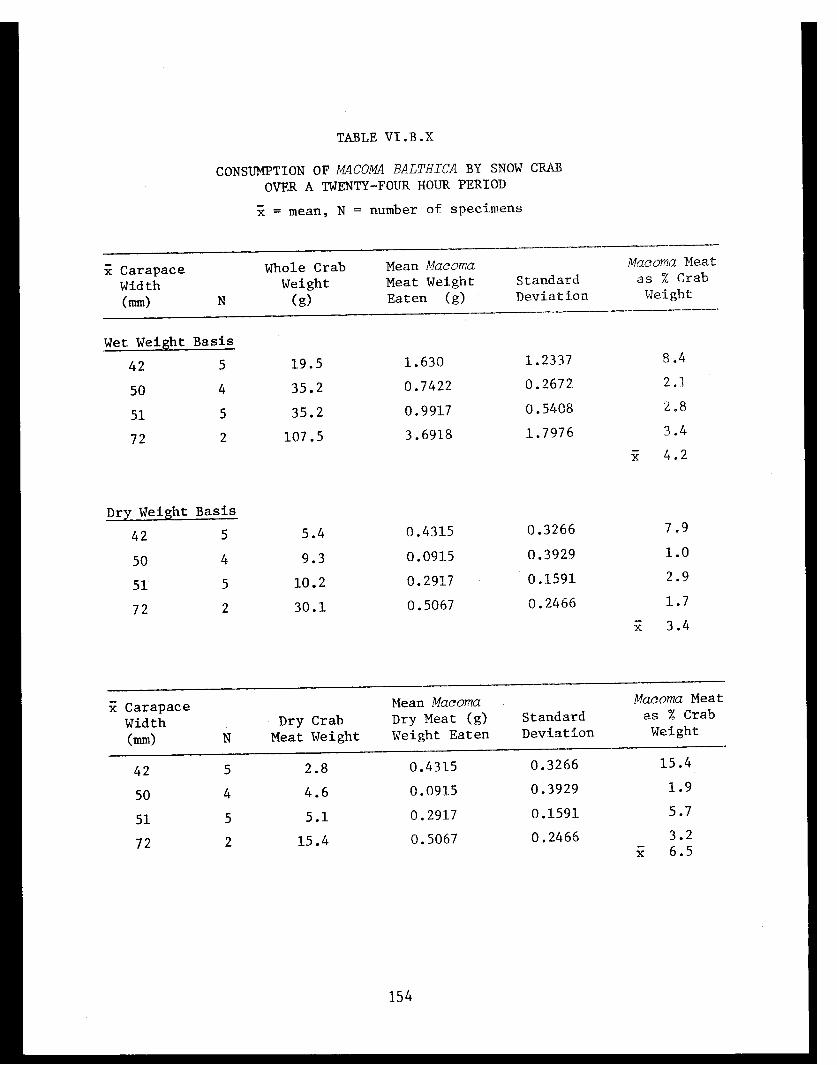
TABLE VI.B.X
CONSUMPTION OF MACOMA BALTHICA BY SNOW CRAB
OVER A TWENTY-FOUR HOUR PERIOD
154

TABLE VI.B.XI
FOOD OF COOK INLET SNOW CRAB LESS THAN 20 mm WIDTH
DATA RECORDED AS FREQUENCY OF OCCURRENCE OF FOOD ITEMS
Food of King Crab (Paralithodes camtschatica)
A total of 117 king crab stomachs were examined from Kamishak Bay
(Fig. VI.B.1), 90% contained food. The mean carapace length of all crab
examined was 105 mm with a range of 35-150 mm. The three most frequently
observed individual foods were barnacles, 81%; bivalves of the family
Mytilidae, probably Modiolus sp., 13%; and hermit crabs, 1.2%. In addition,
17 other categories of food items were observed; none occurred in more
than 6% of the stomachs. Bivalves (clams), all species combined, occurred
in 27% of the stomachs, and gastropods were found in 12% of the stomachs
(Table VI.B.XII). In May, 41% of the crabs with empty stomachs were newly
molted or molting individuals.
Stomachs from crabs in Kamishak Bay (Fig. VI.B.1) often contained
only barnacle remains. Thirty king crabs, Paralithodes camtschatica, col-
lected at Station 35 had full stomachs. All crabs had barnacles in their
stomachs; 60% of these crabs were feeding exclusively on barnacles. The
stomach contents of all king crabs feeding exclusively on barnacles were
digested in KOH, and the shell weight remaining after KOH digestion de-
termined. In addition, the average shell weights of barnacles, randomly
selected and counted on pieces of pumice taken in trawls, were determined
in a similar manner. Utilizing this data, an estimation of the average
number of barnacles in each of the king crab stomachs was made. The stom-
achs contained barnacle shells equivalent to an average of 11.2 (S.D. = 7.4)
barnacles per crab. King crabs were not present in trawl catches from
Station 35 in 1976; this suggests that this predator has been attracted by
the presence of barnacles, a new and abundant food source.
In Kachemak Bay, 113 king crabs were captured, 72% contained food
(Table VI.B.XIII). Bivalves, all species together, occurred in 60% of the
stomachs. The clam, Spisula polynyma, was the most frequently occurring
prey species, observed in 38% of the stomachs. Barnacles were found in 14%
of the stomachs. The snail, Neptunea lyrata, occurred in 11% of the stomachs.
By examining shell thickness and sizes of resilium or cardinal teeth of
Spisula polynyma shells in stomachs, it was possible to estimate sizes and
age of the clams eaten (see Section C for size and age data). In the 43
156

king crab stomachs containing S. polynyma, 13 had large clam meats and
pieces of shell 1 to 2 mm thick. Spisula polynyma with shells this thick
would exceed 80 mm in shell length and be seven years of age or older.
Shells of S. polynyma, less than 10 mm in length (young-of-the-year or
one-year-old clams) occurred in 30 stomachs. Pieces of Neptunea lyrata
opercula up to 15 mm in length were found in the stomachs of adult crabs.
In contrast to Kamishak Bay, king crab in Kachemak Bay, generally
contained the remains of a variety of organisms. For example, one specimen
contained 21 small Spisula polynyma, two Solariella sp. (snail), one
Oenopota sp. (snail), and Balanus sp. shell.
Sixteen king crabs were captured at Station 6 near the mouth of the
Inlet. In the 12 that contained food, 10 had eaten Nuculana fossa. These
stomachs contained between 10 and 25 of these small bivalves. Clams of
the genus Macoma occurred in four stomachs, and one crab had unidentifiable
crustacean remains.
Tarverdieva (1976) provides information on feeding of king crabs from
Bristol Bay, Alaska. There, echinoderms and molluscs were the predominant
food items occurring in 50% and 35% of the stomachs respectively. Feder
et al. (1978) observed Clinocardium ciliatum in 67%, Solariella spp. in 55%,
Nuculana fossa in 50%, Cistenides sp. and brittle stars of the family
Amphiuridae in 35% of 124 king crab stomachs from the southeastern Bering
Sea. Takeuchi (1968a, b) examined the food of king crabs from the Kamchatka
region of Japan, and found that molluscs, crustaceans, and echinoderms
were the main food items. Takeuchi (1968b) found that the frequency of
occurrence of the above prey groups in crab stomachs corresponded to the
relative abundance of these organisms. In Cook Inlet, barnacles, clams,
snails, and hermit crabs are widely distributed (Section A) and are fed
upon in proportion to their abundance. At the stations examined, small
echinoderms were relatively rare (Section A).
157
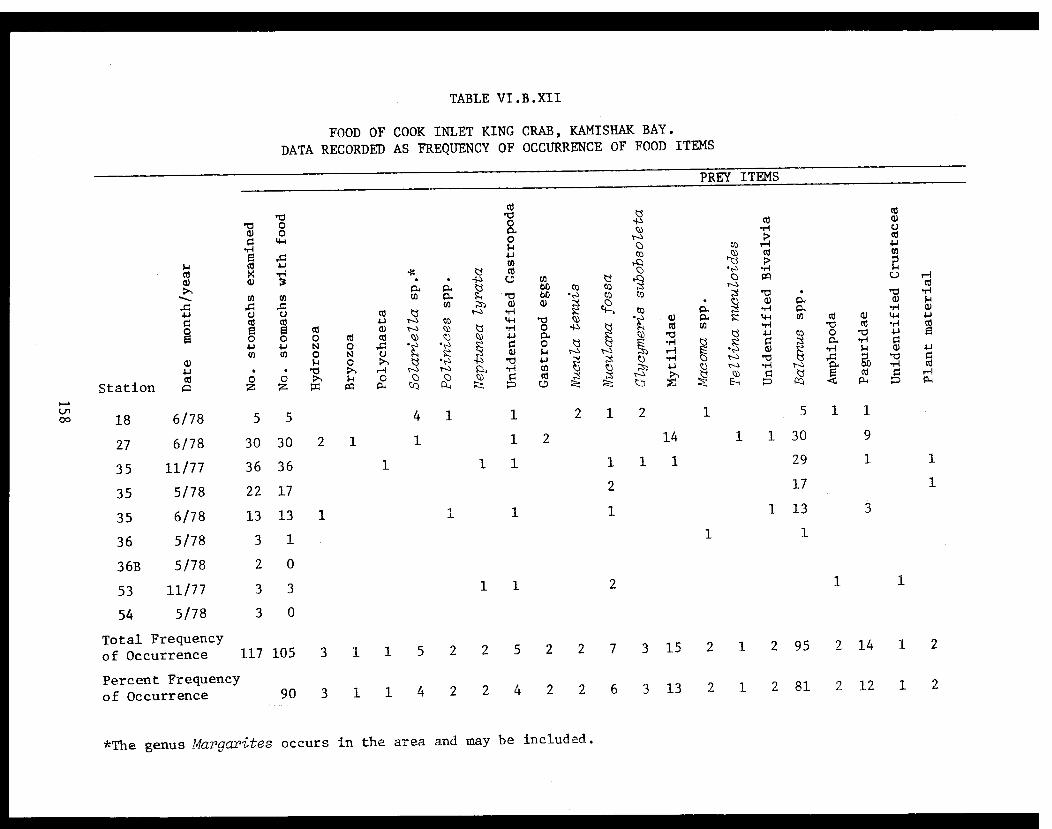
TABLE VI.B.XII
FOOD OF COOK INLET KING CRAB, KAMISHAK BAY.
DATA RECORDED AS FREQUENCY OF OCCURRENCE OF FOOD ITEMS
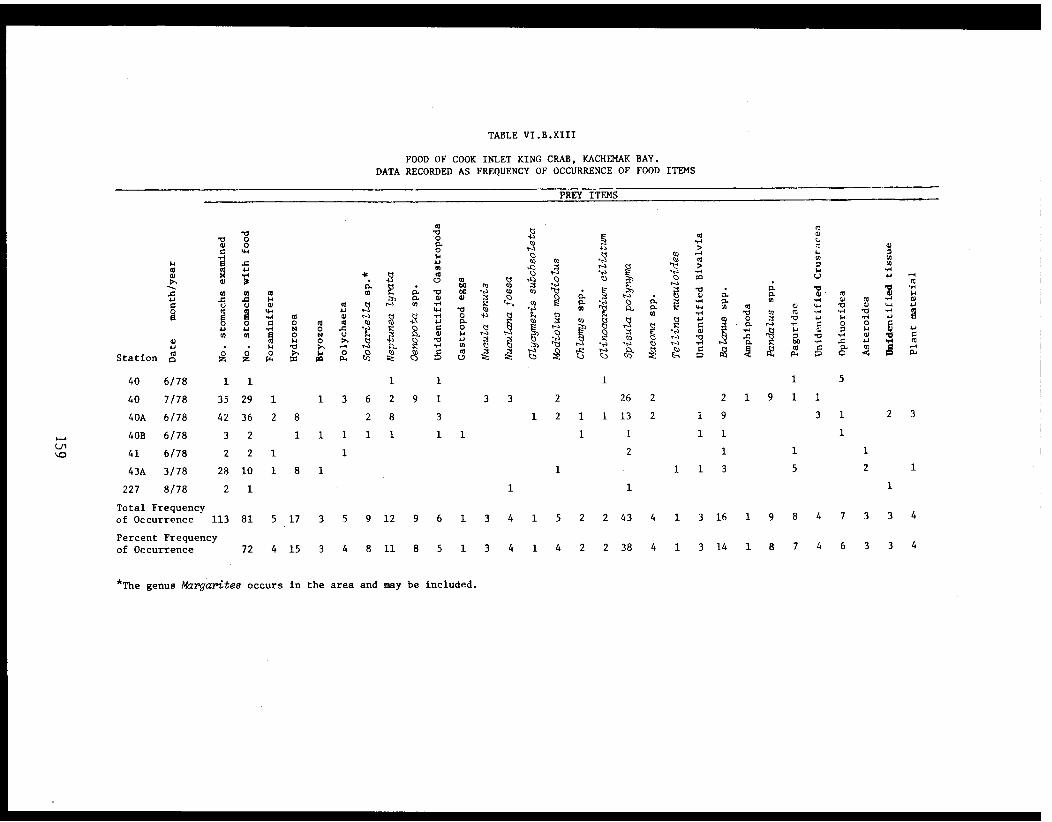
TABLE VI.B.XIII
FOOD OF COOK INLET KING CRAB, KACHEMAK BAY.
DATA RECORDED AS FREQUENCY OF OCCURRENCE OF FOOD ITEMS
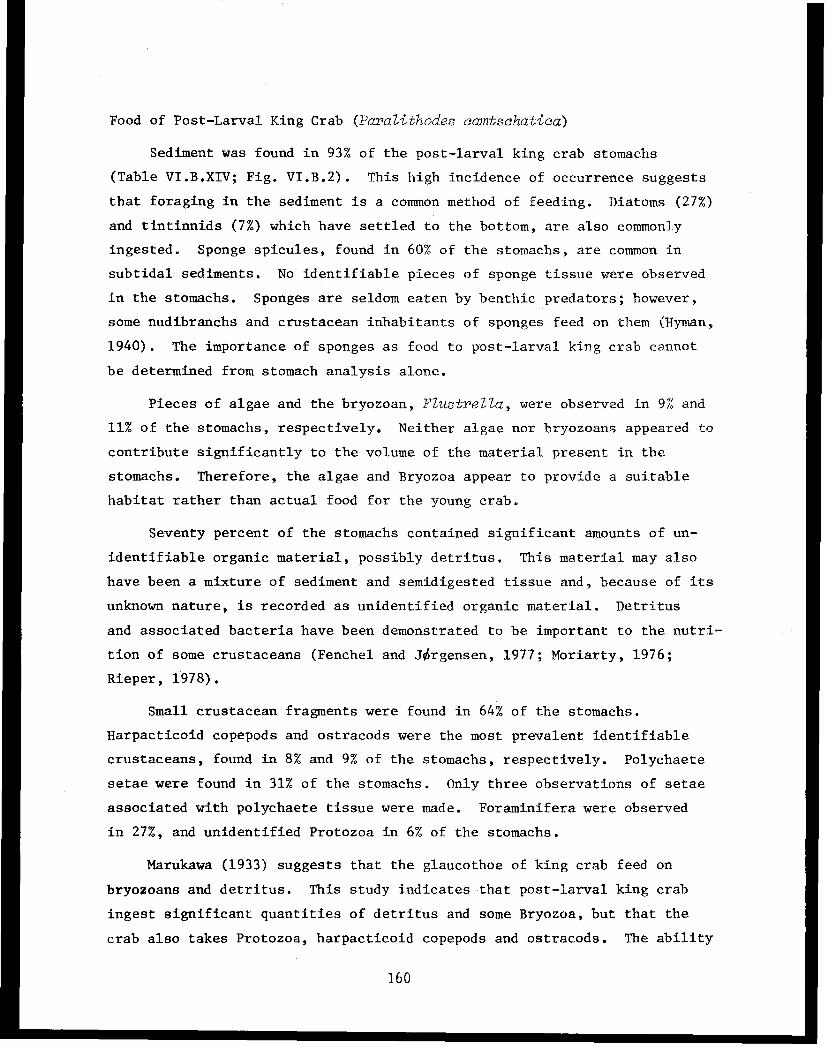
Food of Post-Larval King Crab (Paralithodes cantschatica)
Sediment was found in 93% of the post-larval king crab stomachs
(Table VI.B.XIV; Fig. VI.B.2). This high incidence of occurrence suggests
that foraging in the sediment is a common method of feeding. Diatoms (27%)
and tintinnids (7%) which have settled to the bottom, are also commonly
ingested. Sponge spicules, found in 60% of the stomachs, are common in
subtidal sediments. No identifiable pieces of sponge tissue were observed
in the stomachs. Sponges are seldom eaten by benthic predators; however,
some nudibranchs and crustacean inhabitants of sponges feed on them (Hyman,
1940). The importance of sponges as food to post-larval king crab cannot
be determined from stomach analysis alone.
Pieces of algae and the bryozoan, Flustrella, were observed in 9% and
11% of the stomachs, respectively. Neither algae nor bryozoans appeared to
contribute significantly to the volume of the material present in the
stomachs. Therefore, the algae and Bryozoa appear to provide a suitable
habitat rather than actual food for the young crab.
Seventy percent of the stomachs contained significant amounts of un-
identifiable organic material, possibly detritus. This material may also
have been a mixture of sediment and semidigested tissue and, because of its
unknown nature, is recorded as unidentified organic material. Detritus
and associated bacteria have been demonstrated to be important to the nutri-
tion of some crustaceans (Fenchel and Jørgensen, 1977; Moriarty, 1976;
Rieper, 1978).
Small crustacean fragments were found in 64% of the stomachs.
Harpacticoid copepods and ostracods were the most prevalent identifiable
crustaceans, found in 8% and 9% of the stomachs, respectively. Polychaete
setae were found in 31% of the stomachs. Only three observations of setae
associated with polychaete tissue were made. Foraminifera were observed
in 27%, and unidentified Protozoa in 6% of the stomachs.
Marukawa (1933) suggests that the glaucothoe of king crab feed on
bryozoans and detritus. This study indicates that post-larval king crab
ingest significant quantities of detritus and some Bryozoa, but that the
crab also takes Protozoa, harpacticoid copepods and ostracods. The ability
160
of post-larval king crab to utilize detritus and sediment together with
associated bacteria as food needs to be investigated.
161
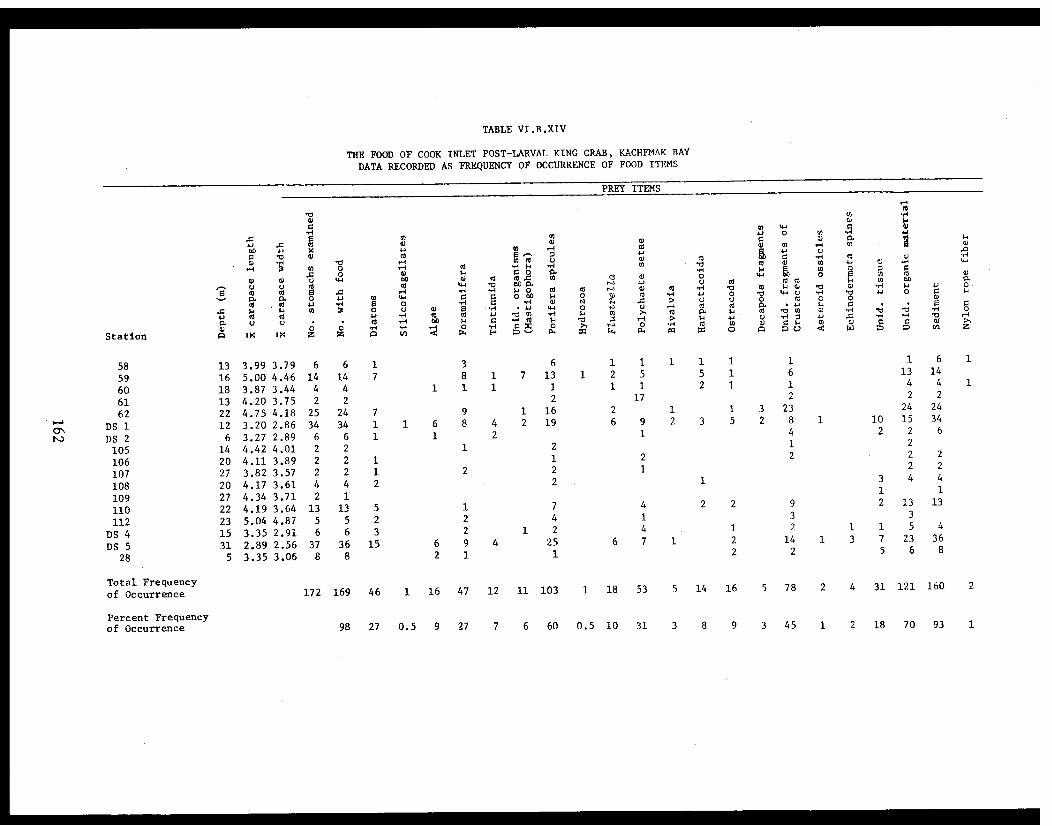
TABLE VI.B.XIV
THE FOOD OF COOK INLET POST-LARVAL KING CRAB, KACHEMAK BAY
DATA RECORDED AS FREQUENCY OF OCCURRENCE OF FOOD ITEMS
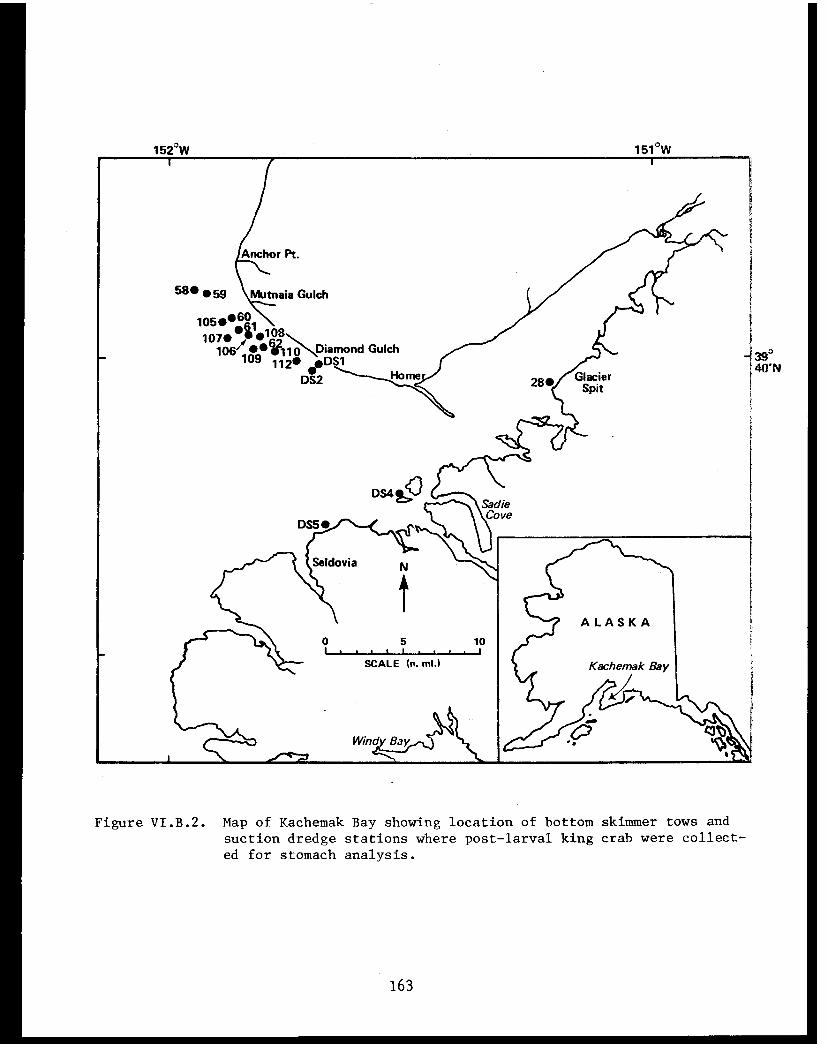
Figure VI.B.2. Map of Kachemak Bay showing location of bottom skimmer tows and
suction dredge stations where post-larval king crab were collect-
ed for stomach analysis.
163
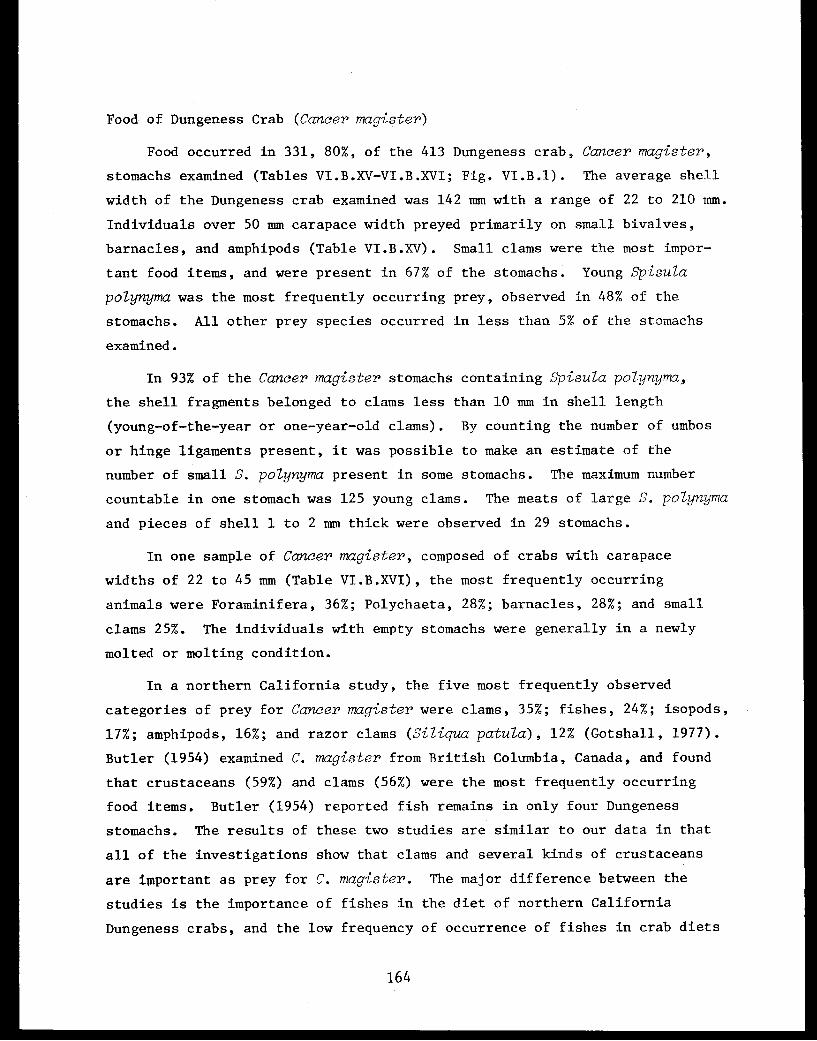
Food of Dungeness Crab (Cancer magister)
Food occurred in 331, 80%, of the 413 Dungeness crab, Cancer magister,
stomachs examined (Tables VI.B.XV-VI.B.XVI; Fig. VI.B.1). The average shell
width of the Dungeness crab examined was 142 mm with a range of 22 to 210 mm.
Individuals over 50 mm carapace width preyed primarily on small bivalves,
barnacles, and amphipods (Table VI.B.XV). Small clams were the most impor-
tant food items, and were present in 67% of the stomachs. Young Spisula
polynyma was the most frequently occurring prey, observed in 48% of the
stomachs. All other prey species occurred in less than 5% of the stomachs
examined.
In 93% of the Cancer magister stomachs containing Spisula polynyma,
the shell fragments belonged to clams less than 10 mm in shell length
(young-of-the-year or one-year-old clams). By counting the number of umbos
or hinge ligaments present, it was possible to make an estimate of the
number of small S. polynyma present in some stomachs. The maximum number
countable in one stomach was 125 young clams. The meats of large S. polynyma
and pieces of shell 1 to 2 mm thick were observed in 29 stomachs.
In one sample of Cancer magister, composed of crabs with carapace
widths of 22 to 45 mm (Table VI.B.XVI), the most frequently occurring
animals were Foraminifera, 36%; Polychaeta, 28%; barnacles, 28%; and small
clams 25%. The individuals with empty stomachs were generally in a newly
molted or molting condition.
In a northern California study, the five most frequently observed
categories of prey for Cancer magister were clams, 35%; fishes, 24%; isopods,
17%; amphipods, 16%; and razor clams (Siliqua patula), 12% (Gotshall, 1977).
Butler (1954) examined C. magister from British Columbia, Canada, and found
that crustaceans (59%) and clams (56%) were the most frequently occurring
food items. Butler (1954) reported fish remains in only four Dungeness
stomachs. The results of these two studies are similar to our data in that
all of the investigations show that clams and several kinds of crustaceans
are important as prey for C. magister. The major difference between the
studies is the importance of fishes in the diet of northern California
Dungeness crabs, and the low frequency of occurrence of fishes in crab diets
164
in British Columbia and Cook Inlet. Isopods or razor clams were rarely
encountered in grabs or dredges in Cook Inlet. The mollusc most commonly
taken by dredging, and found in the stomachs of other predators in the
study area, was Spisula polynyma. Therefore, the high incidence of pre-
dation on this species is probably a reflection of its abundance.
165
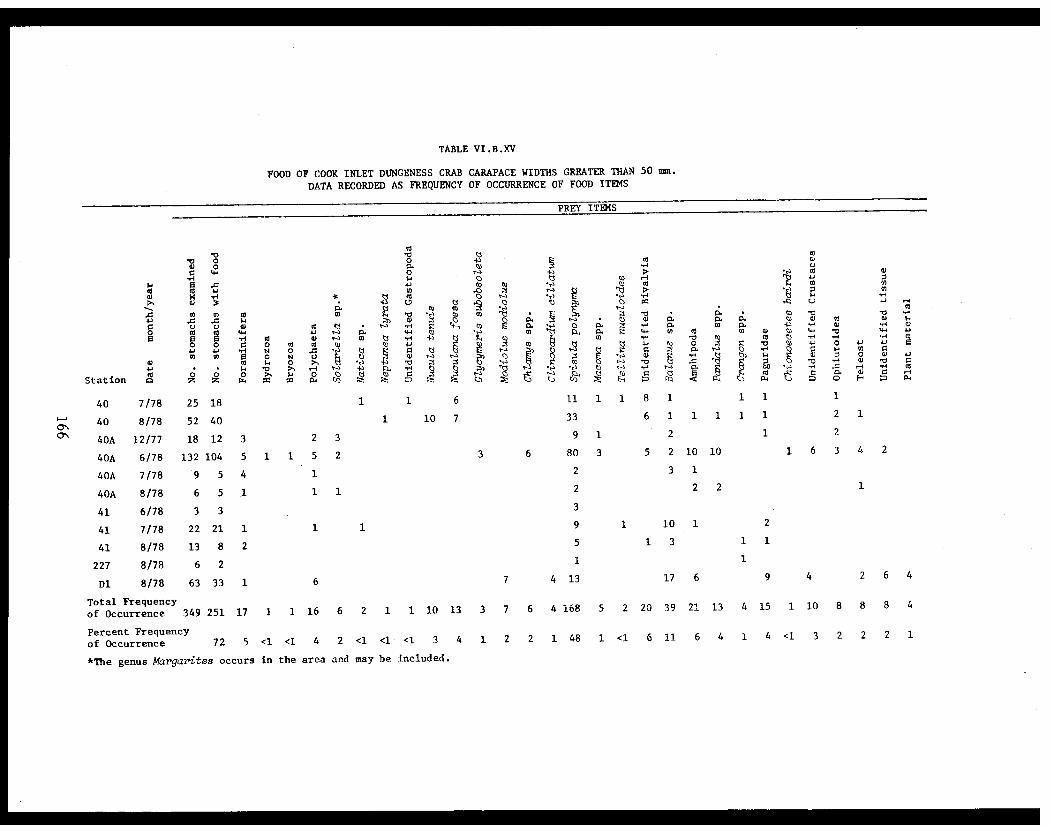
TABLE VI.B.XV
FOOD OF COOK INLET DUNGENESS CRAB CARAPACE WIDTHS GREATER THAN 50 mm.
DATA RECORDED AS FREQUENCY OF OCCURRENCE OF FOOD ITEMS
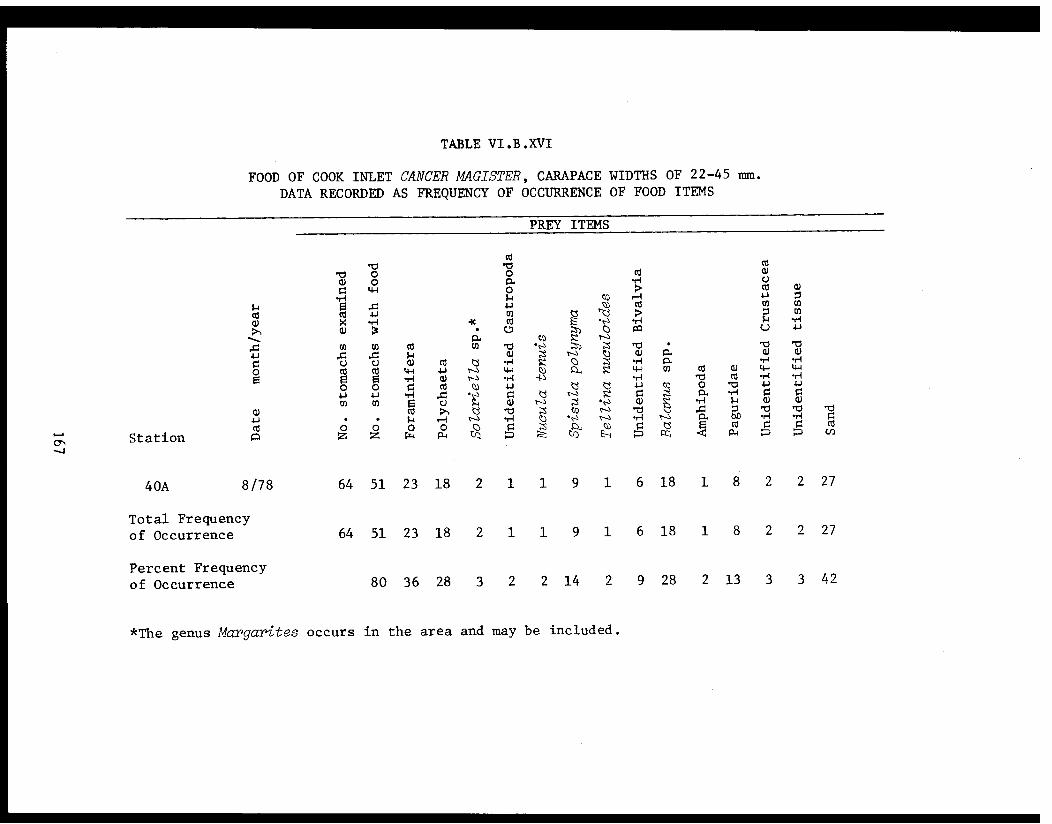
TABLE VI.B.XVI
FOOD OF COOK INLET CANCER MAGISTER, CARAPACE WIDTHS OF 22-45 mm.
DATA RECORDED AS FREQUENCY OF OCCURRENCE OF FOOD ITEMS
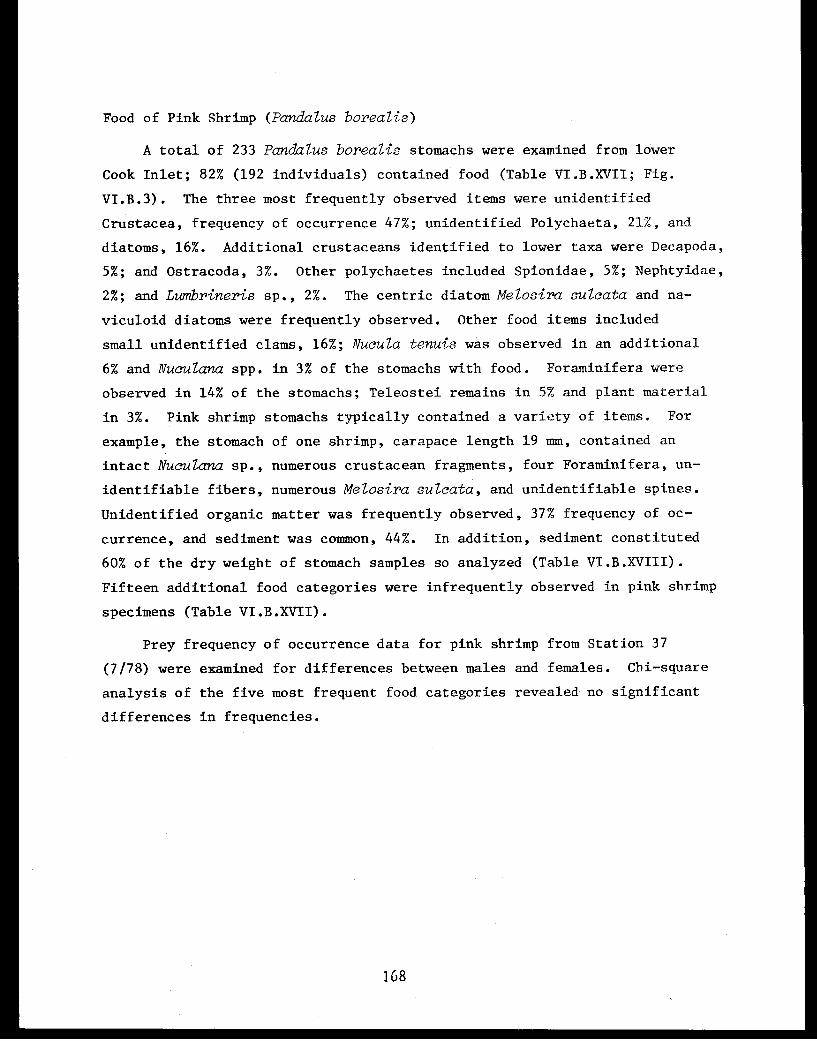
Food of Pink Shrimp (Pandalus borealis)
A total of 233 Pandalus borealis stomachs were examined from lower
Cook Inlet; 82% (192 individuals) contained food (Table VI.B.XVII; Fig.
VI.B.3). The three most frequently observed items were unidentified
Crustacea, frequency of occurrence 47%; unidentified Polychaeta, 21%, and
diatoms, 16%. Additional crustaceans identified to lower taxa were Decapoda,
5%; and Ostracoda, 3%. Other polychaetes included Spionidae, 5%; Nephtyidae,
2%; and Lumbrineris sp., 2%. The centric diatom Melosira sulcata and na-
viculoid diatoms were frequently observed. Other food items included
small unidentified clams, 16%; Nucula tenuis was observed in an additional
6% and Nuculana spp. in 3% of the stomachs with food. Foraminifera were
observed in 14% of the stomachs; Teleostei remains in 5% and plant material
in 3%. Pink shrimp stomachs typically contained a variety of items. For
example, the stomach of one shrimp, carapace length 19 mm, contained an
intact Nuculana sp., numerous crustacean fragments, four Foraminifera, un-
identifiable fibers, numerous Melosira sulcata, and unidentifiable spines.
Unidentified organic matter was frequently observed, 37% frequency of oc-
currence, and sediment was common, 44%. In addition, sediment constituted
60% of the dry weight of stomach samples so analyzed (Table VI.B.XVIII).
Fifteen additional food categories were infrequently observed in pink shrimp
specimens (Table VI.B.XVII).
Prey frequency of occurrence data for pink shrimp from Station 37
(7/78) were examined for differences between males and females. Chi-square
analysis of the five most frequent food categories revealed no significant
differences in frequencies.
168
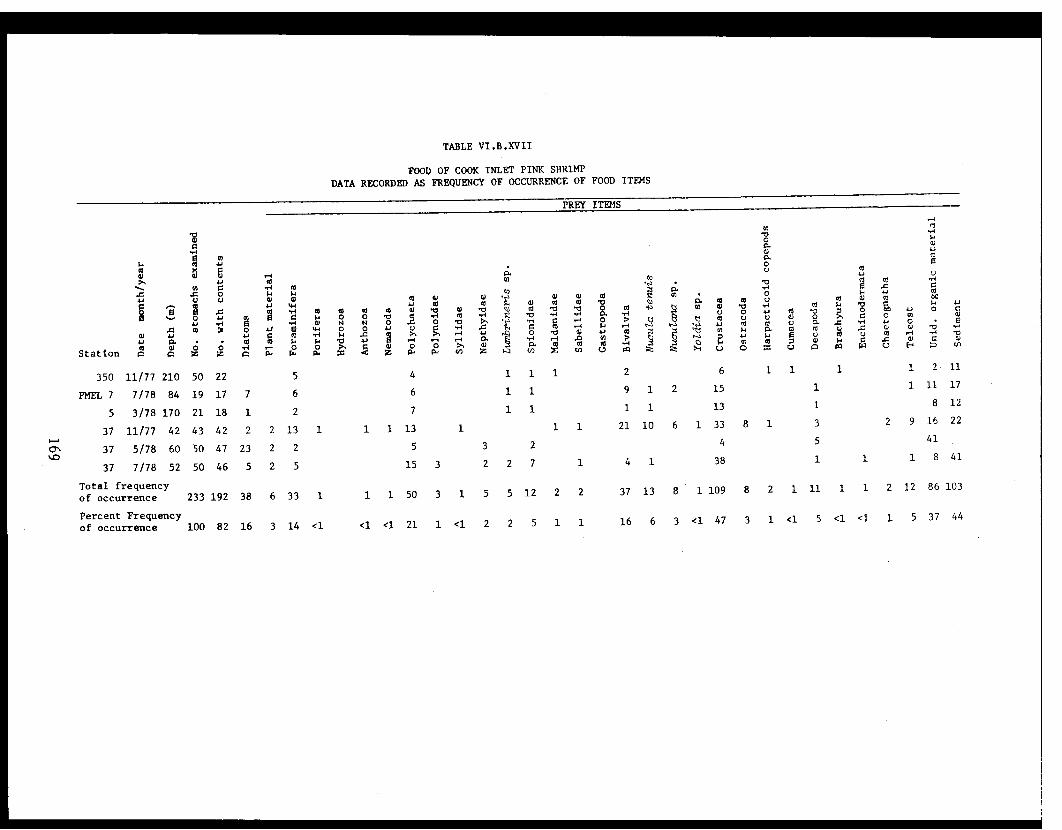
TABLE VI.B.XVII
FOOD OF COOK INLET PINK SHRIMP
DATA RECORDED AS FREQUENCY OF OCCURRENCE OF FOOD ITEMS

TABLE VI.B.XVIII
TOTAL DRY WEIGHT OF SHRIMP STOMACH CONTENTS AND PERCENTAGE OF DRIED STOMACH CONTENTS COMPOSED OF SEDIMENT
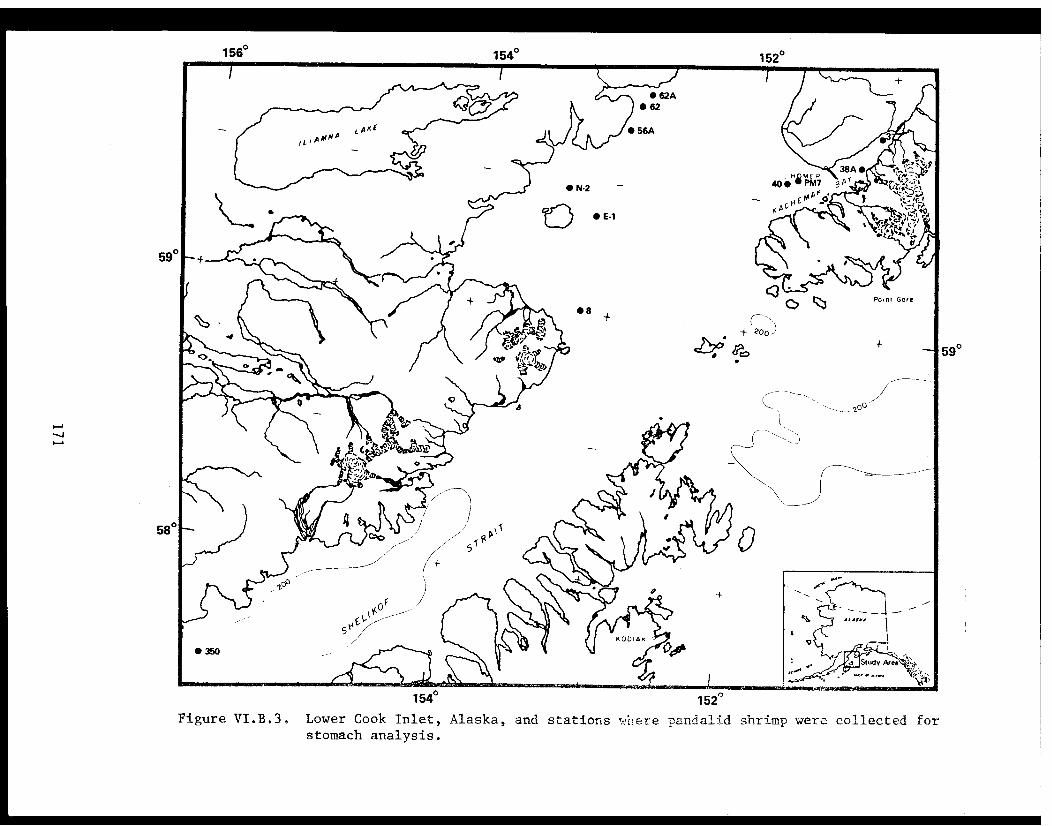
Figure VI.B.3. Lower Cook Inlet, Alaska, and stations where pandalid shrimp were collected forstomach analysis.
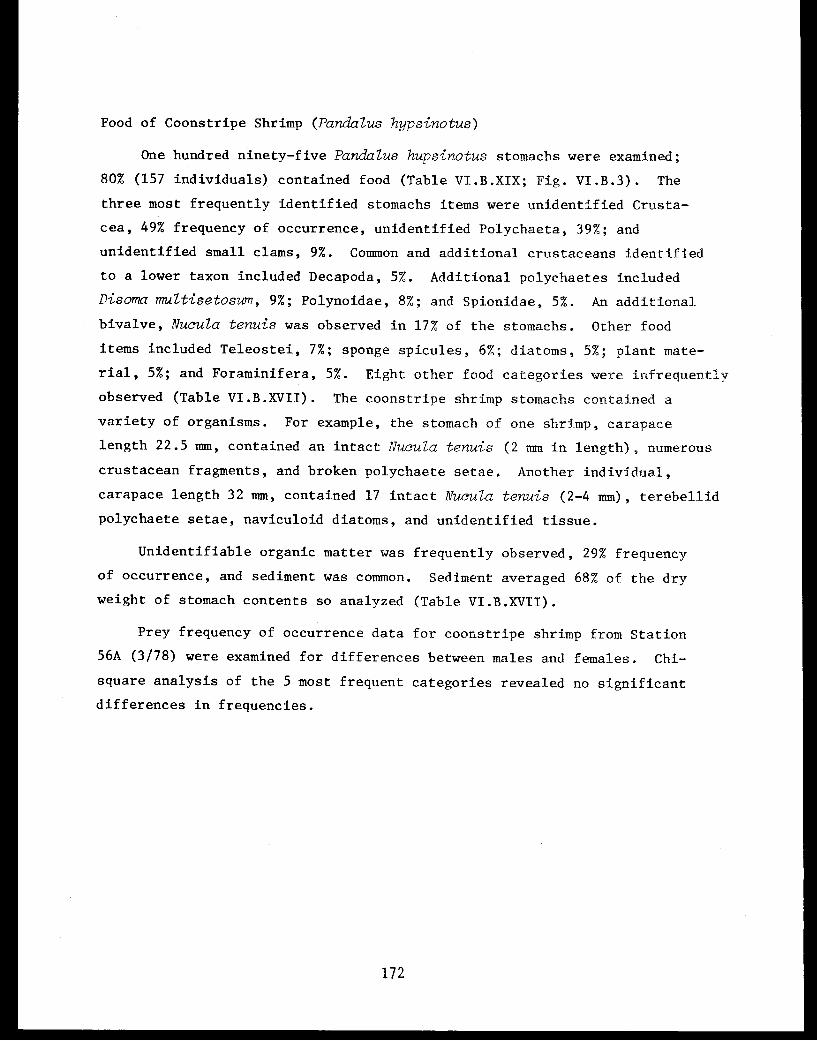
Food of Coonstripe Shrimp (Pandalus hypsinotus)
One hundred ninety-five Pandalus hupsinotus stomachs were examined;
80% (157 individuals) contained food (Table VI.B.XIX; Fig. VI.B.3). The
three most frequently identified stomachs items were unidentified Crusta-
cea, 49% frequency of occurrence, unidentified Polychaeta, 39%; and
unidentified small clams, 9%. Common and additional crustaceans identified
to a lower taxon included Decapoda, 5%. Additional polychaetes included
Disoma multisetosum, 9%; Polynoidae, 8%; and Spionidae, 5%. An additional
bivalve, Nucula tenuis was observed in 17% of the stomachs. Other food
items included Teleostei, 7%; sponge spicules, 6%; diatoms, 5%; plant mate-
rial, 5%; and Foraminifera, 5%. Eight other food categories were infrequently
observed (Table VI.B.XVII). The coonstripe shrimp stomachs contained a
variety of organisms. For example, the stomach of one shrimp, carapace
length 22.5 mm, contained an intact Nucula tenuis (2 mm in length), numerous
crustacean fragments, and broken polychaete setae. Another individual,
carapace length 32 mm, contained 17 intact Nucula tenuis (2-4 mm), terebellid
polychaete setae, naviculoid diatoms, and unidentified tissue.
Unidentifiable organic matter was frequently observed, 29% frequency
of occurrence, and sediment was common. Sediment averaged 68% of the dry
weight of stomach contents so analyzed (Table VI.B.XVII).
Prey frequency of occurrence data for coonstripe shrimp from Station
56A (3/78) were examined for differences between males and females. Chi-
square analysis of the 5 most frequent categories revealed no significant
differences in frequencies.
172
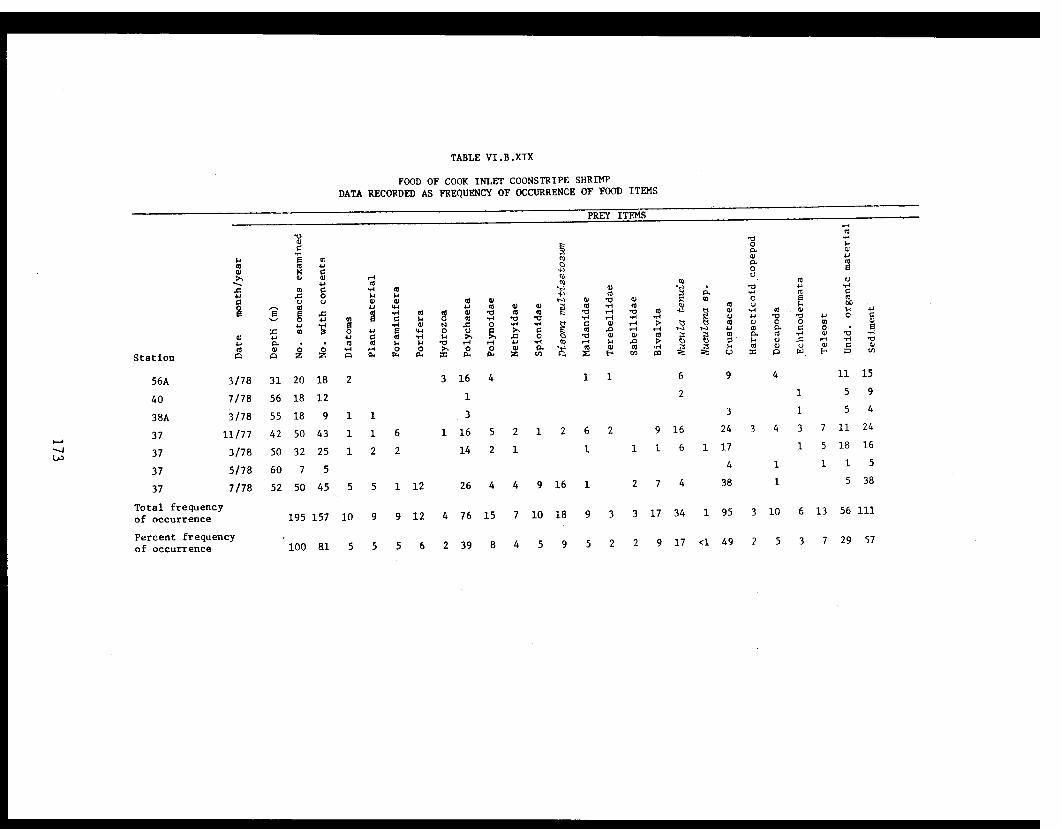
TABLE VI.B.XIX
FOOD OF COOK INLET COONSTRIPE SHRIMP
DATA RECORDED AS FREQUENCY OF OCCURRENCE OF FOOD ITEMS

Food of Humpy Shrimp (Pandalus goniurus)
Two hundred forty-one Pandalus goniurus stomachs were examined; 82%
(197 individuals) contained food (Table VI.B.XX; Fig. VI.B.3). The three
most frequently observed food items were unidentifiable Crustacea, 28%
frequency of occurrence, unidentifiable Polychaeta, 11%; and unidentifiable
small clams, 7%. Additionally, decapods, ostracods and amphipods were
observed in 7%, 2%, and 2%, respectively, of the stomachs. Other polychaetes
included Maldanidae, 4%. The clam, Nucula tenuis, was also observed in 5%
of the specimens. Other food items included Foraminifera, 8%; Teleostei,
6%; plant material, 5%; and diatoms, 4%. Ten other food categories were
infrequently observed (Table VI.B.XX). Humpy shrimp typically fed on a
variety of organisms. For example, one shrimp, carapace length 13.3 mm,
contained amphipod pieces, decapod fragments, two foraminiferans and shell
fragments of Nucula tenuis and gastropods.
Unidentifiable organic matter and sediment were observed in 37% and
63% of the stomachs, respectively (Table VI.B.XX). In addition, sediment
constituted 62% of the dry weight of the stomach contents so analyzed
(Table VI.B.XVII).
Prey frequency of occurrence data for humpy shrimp from Station El
were examined for differences between males and females. Chi-square analy-
sis of the five most frequent categories revealed no significant differences
in frequencies.
Results of the present study suggest that the three pandalids examined
are opportunistic foragers or food generalists. The shrimps examined uti-
lized a total of 32 food categories with the most common food items reflect-
ing the foods most available (see Section A). No major differences in the
most frequently observed food categories found in stomachs of the three
shrimp species were observed, i.e., Crustacea, Polychaeta, Bivalvia, and
diatoms in decreasing order of importance. Also, these species all showed
evidence of active predation as exhibited by the variety of organisms and
the type of remains observed. Additionally, this study demonstrates that
pandalid shrimps in lower Cook Inlet feed primarily on the bottom, and sug-
gests that they do a considerable amount of sediment sorting for small prey
174

and detritus. Crow (1977) reported that the principal food of pandalid
shrimps in Kachemak Bay was detritus and diatoms. The present report suggests
that active predation on infaunal invertebrates is also a common mode of feed-
ing. It is possible that sediment and detritus are ingested inadvertently
with prey. The importance of detritus and bacterial carbon associated with
the sediment as an additional carbon source for shrimp is unknown. It is
thought to be significant for some detrital-feeding organisms (Fenchel and
Jorgensen, 1977; Moriarty, 1976; Rieper, 1978). The results of this study
indicate that sediment and detritus constitute a significant portion of the
stomach contents of the shrimp examined. Hence, the importance of detrital
and bacterial carbon as food for pandalid shrimps needs to be investigated.
If oil contaminates the subtidal sediments of Kachemak Bay, all three species
of shrimps would ingest significant quantities of the pollutant.
175
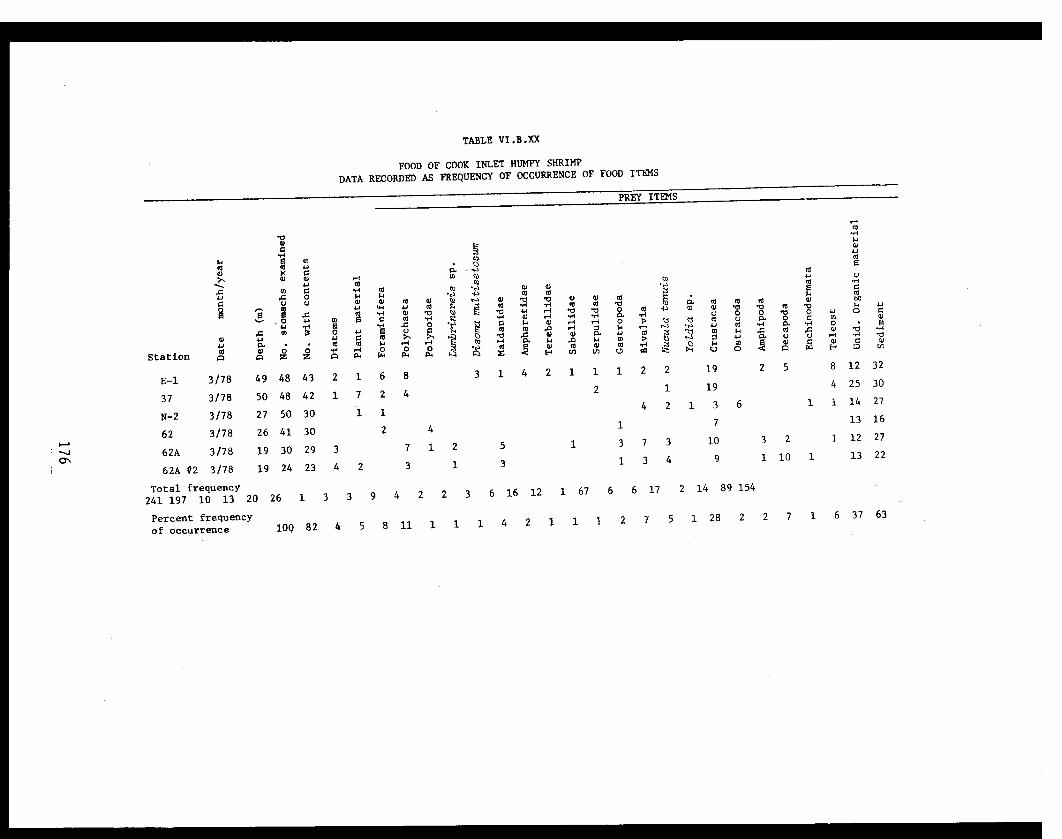
TABLE VI.B.XX
FOOD OF COOK INLET HUMPY SHRIMP
DATA RECORDED AS FREQUENCY OF OCCURRENCE OF FOOD ITEMS
Feeding of Larval Stages of King and Snow Crabs and Pink Shrimp
King crab zoeae
At population densities of 20 prey items per liter, the average number
of zooplankton prey consumed by Paralithodes camtschatica zoeae was 0.8 per
day with a range of 0 to 1 organisms (Tables VI.B.XXI-VI.B.XXII). When prey
numbers were doubled, consumption increased significantly (P = 0.95) (Table
VI.B.XXII; Fig. VI.B.4) to an average of 1.3 copepods per zoea. However,
the range, 0 to 2 prey consumed per zoea, indicated that on some days feed-
ing was unsuccessful. At prey population densities of 80 organisms per
liter the average number of copepods consumed was 2.6 per day, with a range
of 1 to 7. At the highest prey concentration examined, 160 copepods per
liter, the average number of copepods eaten was 7.6 with a range of 3 to
12 (Table VI.B.XXII; Fig. VI.B.4). The data suggest that in the test beakers,
prey population densities had to be 40 to 80 per liter before all the zoeae
were able to capture and consume at least one copepod on a daily basis
(Paul et al., 1979b).
In the beaker containing king crab zoeae without prey, the first
mortality occurred on day four, and 100% mortality occurred by day eight.
The survival rates to day eleven in the beaker having 20 prey items per
liter was 40%. The survival rate to day eleven in each of the remaining
beakers was 60%.
The king crab zoeae held at 2°C and fed first at age 12 hours, killed
a daily average of 3.8 prey organisms per zoea. Zoeae fed at the same
age, but held at 4°C and 6°C, exhibited similar rates of predation, con-
suming an average of 3.7 and 4.4 crustaceans per day (Fig. VI.B.5). The
temperature of the water in the beakers apparently caused no significant
(P = 0.95) differences in predation rates of zoeae fed at age 12 hours
(Fig. VI.B.5).
The predation rate of the zoeae first fed at age 60 hours and held at
2°C was considerably lower, 1.7 prey per day, than that of their cohorts fed
at age 12 hours and zoeae in the other temperature groups fed at age 60
hours (Fig. VI.B.5). The predation rates of zoeae first fed at age 60 hours
177

and kept at 4°C and 6°C, and their cohorts held at the same temperature
and fed at age 12 hours were similar (Fig. VI.B.5).
The zoeae starved for 84 hours, 3.5 days, and kept at 2°C and 4°C were
generally unable to capture prey; they consumed an average of 0.03 and 0.50
organisms per day respectively (Fig. VI.B.5). Zoeae starved for 84 hours and
held at 6°C retained the ability to capture prey. However, their predation
rate of 1.2 copepods per day was only one-third that of zoeae starved for
60 hours and also held at 6°C (Fig. VI.B.5).
The correlation coefficient was determined to be -0.860, this indicates
a high negative correlation between the number of hours starved and sub-
sequent ability to capture prey. The t-distribution (P = 0.95) was found
to be significant (Paul and Paul, in press).
In Cook Inlet, king crab eggs generally hatch from March through June
(A. Davis, pers. comm., Alaska Dept. Fish and Game, Homer, Alaska). During
this period monthly mean seawater temperatures are likely to range from
2° to 8°C (U.S. Dept. Commerce, 1970). Therefore, it is probable that Cook
Inlet king crab zoeae must forage for food during periods when the water
temperatures fall within the range of those examined, 2° to 6°C, in this
study. The similarity in the predation rates of stage one zoeae fed at
age 12 hours and kept at 2°C, 4°C and 6°C (Fig. VI.B.5) indicates that prey
availability when the zoeae first begin to feed is more important in de-
termining feeding success than the seawater temperature.
Paralithodes camtschatica exists as a stage one zoea for approximately
7 to 24 days depending on water temperature (Satoe, 1958). Including its
four other larval stages, king crab larva remain planktonic for 47 to 84
days (Satoe, 1958). Little is known about the feeding habits of king crab
larvae during this planktonic period. Cultured king crab zoeae will eat
phytoplankton, but will not survive unless also fed crustaceans (T. Nakanishi,
Hokkaido Regional Fisheries Research Labortory, pers. comm., 1979). In the
laboratory, king crab zoeae require copepod concentrations of 40 to 80 per
liter to feed successfully (Paul et al., 1979b). If prey concentrations
are sufficient, they will consume 12 copepods (Paul et al., 1979b) or 25
Artemia salina nauplii per day (Nakanishi, 1976). Ishimaru (1936) reported
178

reduced survival in year classes of king crab subjected to predominantly
stormy conditions during the planktonic larval period. It is possible that
mixing due to storms interferes with the feeding success of these active
zoeae.
The results of this study indicate that if the first zoeae of Cook
Inlet king crab receive food within 60 hours of hatching, the larvae are
capable of capturing crustacean prey if the prey are available at sufficient
concentrations. If feeding is delayed an additional 24 hours, their
ability to feed on copepods and probably all zooplankters will be impaired,
especially if the water temperature is 4°C or less, and their chances for
survival will be reduced. The length of the critical period for snow crab
and pink shrimp remains undescribed. The survival rate of Chionoecetes
opilio also declines if they are starved for the first three days of life
(Kon, 1971). Chionoecetes opilio zoeae are similar in size to king crab,
C. bairdi and pink shrimp zoeae, and may be found with them in the Bering
Sea.
Snow crab zoeae
The average number of copepods consumed by zoeae of Chionoecetes bairdi
at prey population densities of 20 per liter was 0.5, with a range of 0.0-
1.0, per day. The mean number of copepods eaten by zoeae increased signif-
icantly (Table VI.B.XXII; Fig. VI.B.6) with prey availability. Thus, at
copepod population densities of 40, 80, and 160 per liter, the average
number and range of copepods captured by zoeae were 1.3, 2.2, 4.8, and 0.4-
1.0, 1.0-4.0, 2.0-7.0, respectively. Copepod concentrations had to equal
80 per liter before both the mean and range indicated all zoeae successfully
captured prey each day (Table VI.B.XXII).
The larvae in the beaker with the highest concentration of copepods
exhibited no mortality during the experiment. At the other three prey
concentrations examined, zoeae suffered 20% mortality. One hundred percent
mortality occurred by day eight in the beaker without food.
179
Pink shrimp zoeae
The results of the experiment on zooplankton prey population density
and feeding response with newly hatched Pandalus borealis zoeae larvae were
similar to those observed for king crab and snow crab zoeae (Fig. VI.B.7).
With prey concentrations of 20 and 40 prey items per liter, the average
number of prey consumed was 0.7 and 1.5 organisms per day respectively. At
both of these prey population densities shrimp larvae were often unsuccess-
ful at capturing prey, and ranges of 0.0 to 1.2 and 0.6 to 2.8 organisms
consumed per day occurred, respectively. With a population density of 80
prey per liter the average number of copepods consumed per shrimp larva
increased to 2.3 with a range of 1.0 to 4.0. In chambers containing 160
copepods per liter the mean number of copepods eaten by a zoea was 5.3 and
the range increased to 2.3 to 9.6 (Table VI.B.XXII; VI.B.7). These results
indicate that in the test beakers prey population densities had to average
80 per liter before each shrimp larva was consistently able to capture at
least one prey item per day. Like the observations on king and snow crab
zoeae, the average daily consumption rates increased significantly (P = 0.95)
up to the highest prey concentrations examined (Table VI.B.XXII; Fig. VI.B.7);
therefore, it is impossible to determine maximum consumption rates for these
decapod larvae from the data.
The Pandalus borealis larvae in the beaker without prey had a 40%
mortality on day five, and 100% mortality occurred on or by the thirteenth
day. In the other test beakers larval shrimp molted successfully and
mortality was zero.
Many decapod larvae, including Chionoecetes and Pandalus, have been
reared to settling using Artemia as food (Modin and Cox, 1967; Motoh, 1973).
In these studies high mortality rates were reported. Bigford (1978) found
that, of the combinations tested, a diet of green flagellates, rotifers,
and shrimp nauplii produced the best survival to the first stage juvenile
in the spider crab, Libinia emarginata. In Cook Inlet king crab zoeae
stomachs containe diatoms (E. Haynes, National Marine Fisheries Service,
Auke Bay, Alaska, pers. comm., 1980). The nutritional adequacy of small
crustaceans as a sole source of food for the decapod larvae examined is
180

unknown. Furthermore, it is probable that prey population densities
necessary for the zoeae to obtain adequate nutrition exceed those that
allow for the capture of a single prey item. Therefore, we believe that
mortality rates of the three species of zoeae studied here cannot be
accurately related to food density at this time.
Zooplankton population density data are available for Kachemak Bay,
one of the major fishing grounds for king crab, snow crab, and pink shrimp
in Cook Inlet. Damkaer (1977) reported zooplankton population densities,
primarily copepods and cirripede larvae, ranging from 0.2-1.0 per liter
during the period when crab zoeae were present in 1976. These mean popula-
tion densities are considerably lower than the threshold concentration of
40 to 80 zooplankton per liter, necessary for successful daily feeding
response of king crab, snow crab, and pink shrimp larvae in the laboratory.
It is possible that zooplankton collected by the obliquely towed nets
(0.2 to 0.5 mm mesh) used by Damkaer (1977) do not accurately describe the
spatial distributions of the zoeae and their prey. In other areas it has
been demonstrated that oceanographic conditions and behavioral responses
of prey species cause them to disperse or to aggregate. Ellertsen et al.
(1977) showed that cod larvae feed principally on Calanus helgolandicus
nauplii which aggregate during vertical migrations and hence exceed con-
centrations necessary for successful feeding by cod larvae. Similar
behavioral mechanisms may occur in crab and shrimp larvae. Studies of the
northern anchovy larvae off California suggest that their survival depends
on weather and oceanographic conditions which affect the time of appearance
and duration of stratified layers of suitably sized food particles (Lasker,
1975, 1978). Ishimaru (1936) reported extensive mortality of king crab
zoeae when stormy conditions occurred during the 60 to 80 day planktonic
larval period. The results of the OCSEAP study reported here indicate that
if mixing from storms or any other phenomenon kept prey population densities
below 40 per liter, the zoeae studied could suffer from starvation. It is
also possible that phytoplankton are important food for these zoeae, and
their requirements for zooplankton prey are met at relatively low prey con-
centrations. Adequate assessment of prey concentrations and nutritional
requirements of the zoeae is necessary when attempting to determine the
181
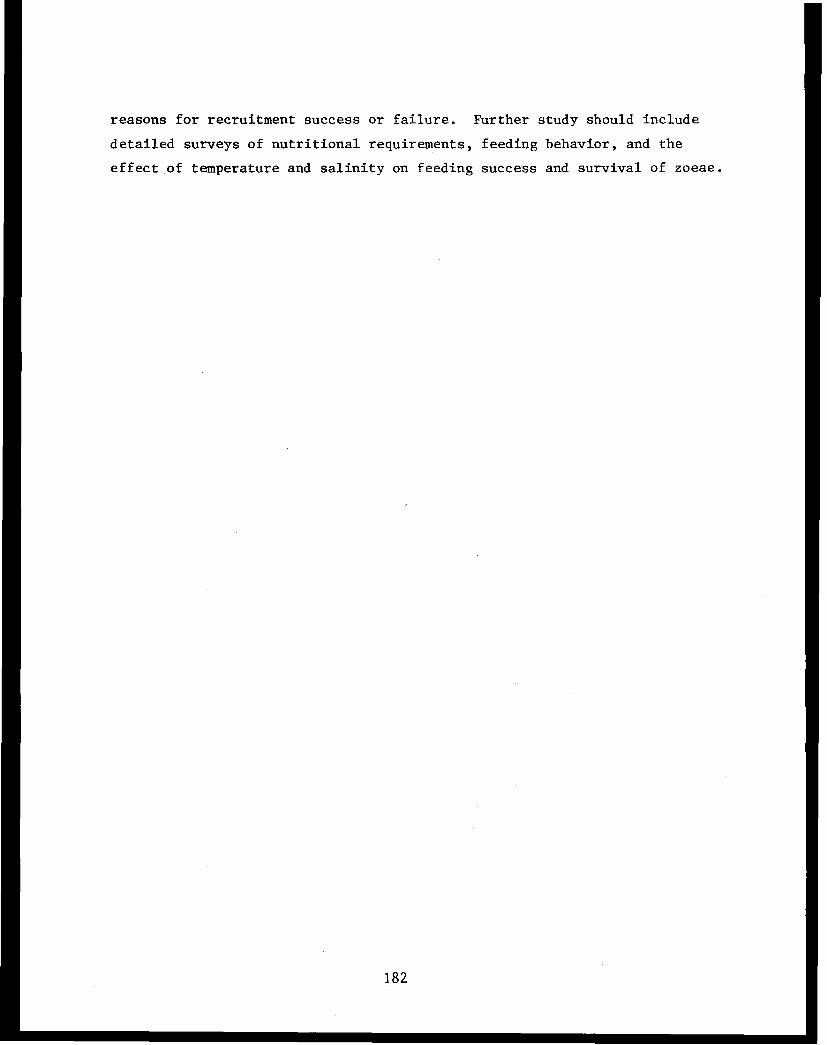
reasons for recruitment success or failure. Further study should include
detailed surveys of nutritional requirements, feeding behavior, and the
effect of temperature and salinity on feeding success and survival of zoeae.
182

TABLE VI.B.XXI
PERCENT OF PREY TYPES, AND THEIR SIZES (MEAN TOTAL LENGTH AND GREATESTWIDTH) FED TO STAGE ONE ZOEAE OF KING CRAB, SNOW CRAB, AND PINK SHRIMP
183

TABLE VI.B.XXII
THE AVERAGE DAILY CONSUMPTION OF COPEPODS BY STAGE 1 ZOEAE OFKING CRAB, SNOW CRAB, AND PINK SHRIMP
184
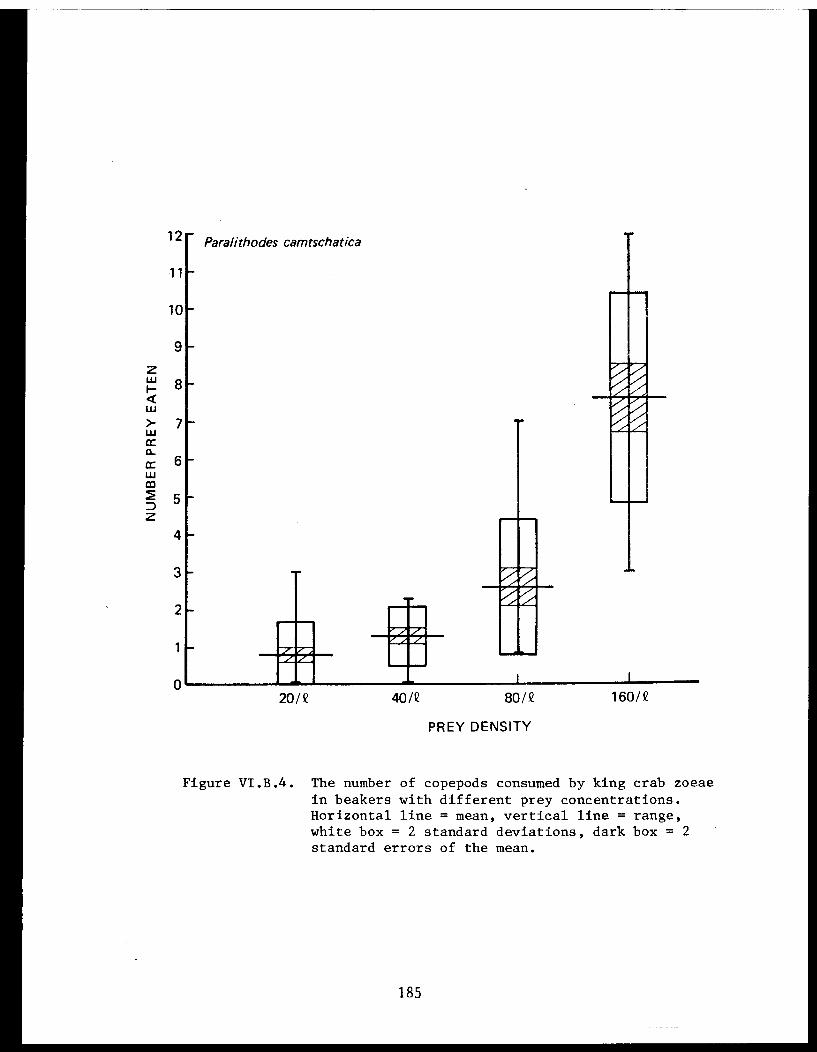
Figure VI.B.4. The number of copepods consumed by king crab zoeaein beakers with different prey concentrations.Horizontal line = mean, vertical line = range,white box = 2 standard deviations, dark box = 2standard errors of the mean.
185

Figure VI.B.5. The number of copepods killed by king crab stage I zoeae starved for 12, 60 and 84 hours
and held at 2°, 4° and 6°C. Horizontal line = mean, vertical line = range, white box = 2
standard deviations, dark box = 2 standard errors of the mean.
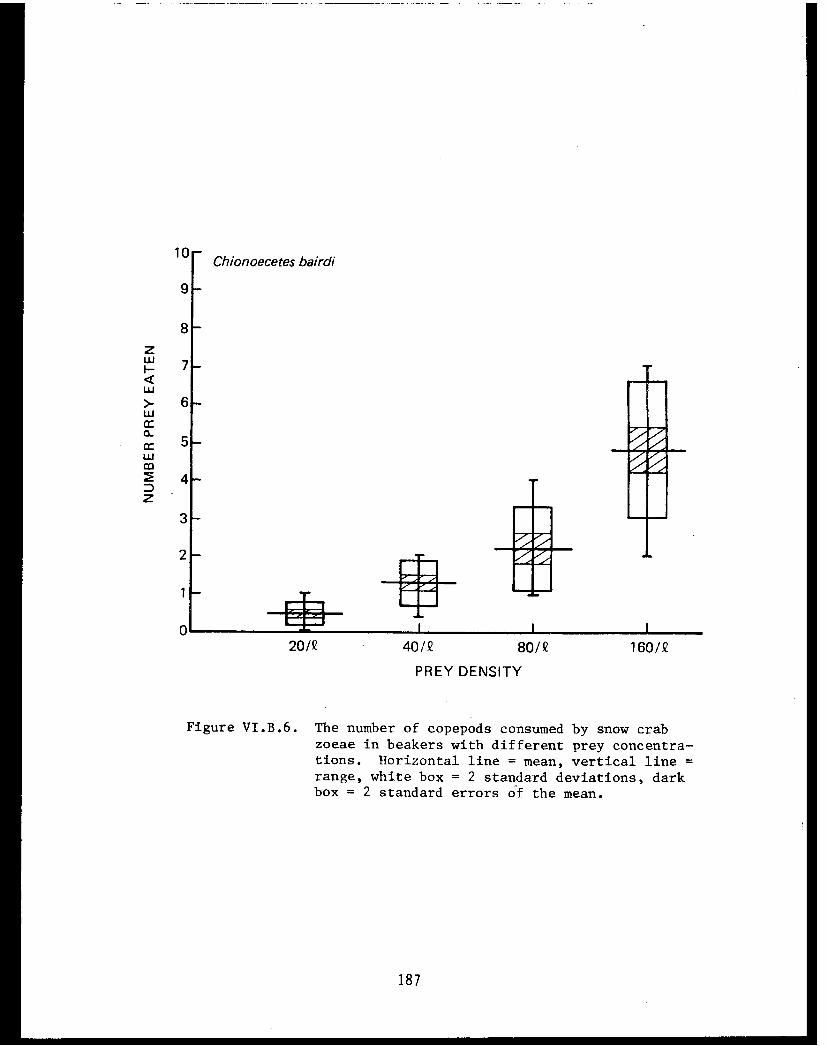
Figure VI.B.6. The number of copepods consumed by snow crabzoeae in beakers with different prey concentra-tions. Horizontal line = mean, vertical line =range, white box = 2 standard deviations, darkbox = 2 standard errors of the mean.
187
Figure VI.B.7. The number of copepods consumed by pink shrimpzoeae in beakers with different prey concentra-tions. Horizontal line = mean, vertical line =range, white box = 2 standard deviations, darkbox = 2 standard errors of the mean.
188

Food of Crangon dalli
Sediment was found in 71% of the Crangon dalli stomachs (Table
VI.B.XXIII). Crangon dalli stomachs typically contained more than 50%
sediment on a dry weight basis (Table VI.B.XXIV). Also present were large
numbers of both planktonic and benthic diatoms, and polychaete setae. Only
13% of the observations of polychaete remains in C. dalli stomachs were
based on the presence of identifiable worm tissue. The remainder of the
observations were unattached setae which are commonly present in sediment.
(Thus, the importance of polychaetes as food for C. dalli are probably
overestimated in Table VI.B.XXIV.) Unidentified organic material was ob-
served in 10% of the stomachs.
Parts of unidentified crustaceans were found in 28% of the stomachs,
while other crustaceans (ostracods, barnacles, cumaceans, amphipods and other
decapods) were found in another 15% of the stomachs. Bivalves were found
in 17% of the stomachs.
The high frequency of sediment and unidentified organic matter, possibly
detritus, in the stomachs suggests sediment sorting is a prime method of
feeding for this organism. Predation on benthic infauna is also important
as evidenced by some stomach contents. For example, one stomach contained
four intact clams, Nuculana fossa, 4 to 6 mm in shell length. See Appendix V
for more detailed report on Crangon feeding and food requirement.
189

TABLE VI.B.XXIII
FOOD OF COOK INLET CRANGON DALLI
DATA RECORDED AS FREQUENCY OF OCCURRENCE OF FOOD ITEMS
190

TABLE VI.B.XXIII
CONTINUED
191
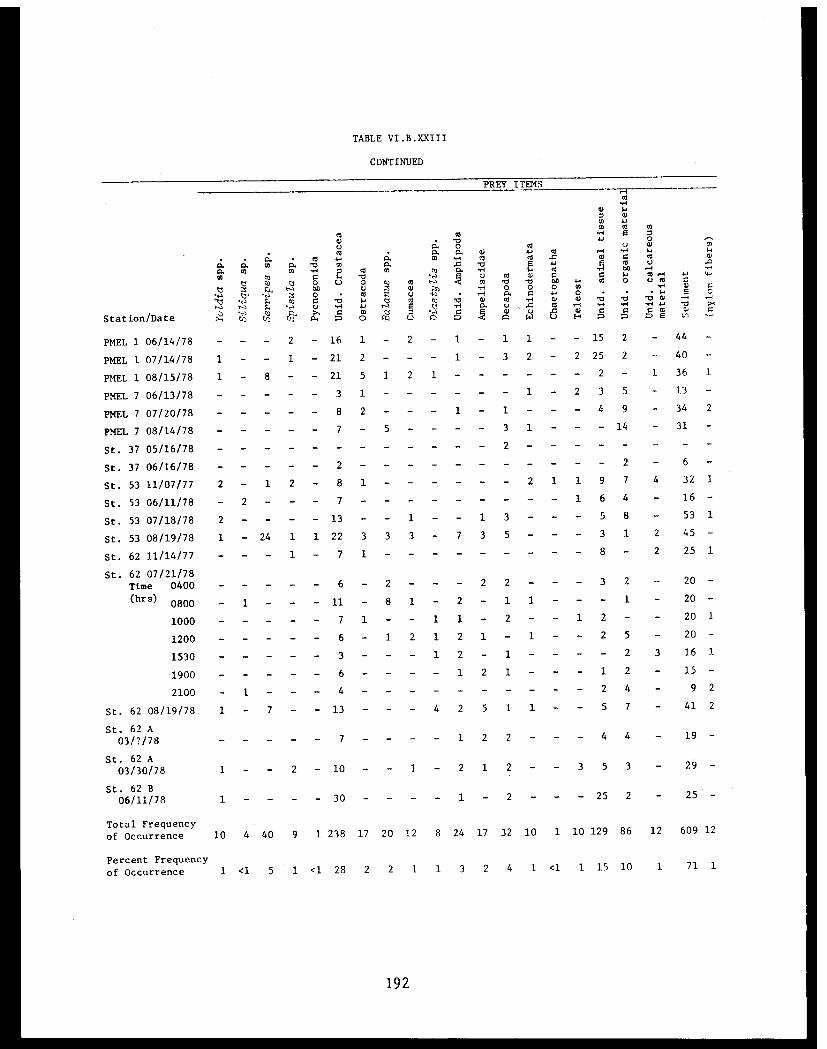
TABLE VI.B.XXIII
CONTINUED
192
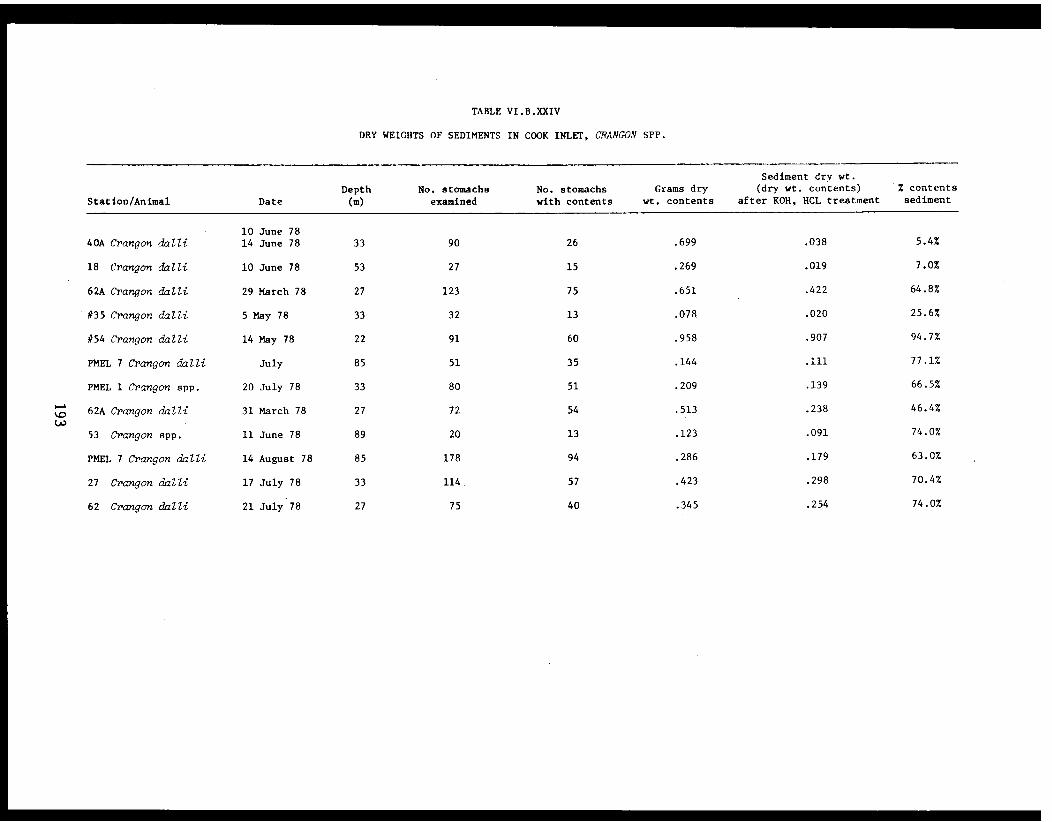
TABLE VI.B.XXIV
DRY WEIGHTS OF SEDIMENTS IN COOK INLET, CRANGON SPP.
Food of Hermit Crabs
A total of 218 Pagurus ochotensis stomachs were examined, and 21 dif-
ferent prey types were found in their stomachs (Table VI.B.XXV). The most
frequently occurring food was barnacles, in 23% of the stomachs; Foraminif-
era, 21%; plant material, 21%, and young clams of the genus Spisula, 17%.
The clam, Nucula tenuis, occurred in 10% of the stomachs. Polychaetes as
well as species of hermit crabs were both observed in 7% of the stomachs.
All other organisms were observed in less than 5% of the stomachs. Sedi-
ment was observed in 78% of the stomachs and accounted for 11 to 59% of the
dried weight of pooled stomach contents (Table VI.B.XXV).
In 38% of the stomachs of Pagurus capillatus, Foraminifera were ob-
served. Plant material occurred in 13% of the stomachs. Barnacles and the
clam, Nucula tenuis, were found in 6 and 5% of the stomachs respectively.
There were 14 additional categories of material identified in the stomachs;
however, none of them except sediment, occurred in more than 4% of the
stomachs. Sediment occurred in 71% of the stomachs and constituted an
average of 26% of the dry weight of stomach contents (Table VI.B.XXVI).
Only 17 Pagurus aleuticus were available for examination. Fragments
of sympodial Hydrozoa were the most frequently occurring item and were
found in 71% of the stomachs. Plant material was observed in 18% of the
stomachs. Sediment was observed in 76% of the stomachs, and accounted for
0.4 to 27% of the dry weight of stomach contents (Table VI.B.XXVII).
Hydrozoa and plant material appeared in 22 and 13% of the 32 Pagurus
kennerlyi stomachs respectively. Unidentified crustaceans and Foraminifera
were both observed in 6% of the stomachs. Sediment occurred in 72% of the
stomachs and accounted for 20% of the dry weight of stomach contents in
the one sample examined for sediment weight (Table VI.B.XXVIII).
The most frequently observed food of the 31 Pagurus beringanus examined
was other hermit crabs, which occurred in 19% of the stomachs. Other un-
identified crustaceans were observed in 16% of the stomachs. Plant material
was observed in 13% of the stomachs (Table VI.B.XXIX).
The most frequently occurring food of Elassochirus tenuimanus was also
other hermit crabs, found in 32% of the stomachs. Balanus spp. and other
194
unidentified crustaceans were observed in 15 and 11% of the stomachs, respec-
tively. Plant material was observed in 9% of the stomachs (Table VI.B.XXX).
The hermit crabs, Pagurus ochotensis, P. capillatus, P. aleuticus,
and P. kennerlyi, all appear to be opportunistic foragers which ingest
small organisms acquired by sorting through sediments, and swallow large
amounts of sediment in the process. They also browse on hydrozoans, pieces
of macroalgae, and sea grass detritus. Pagurus beringanus and Elassochirus
tenuimanus appear to be more active predators consuming primarily smaller
hermit crabs and other crustaceans. However, these generalizations are
based on a limited number of observations, and need to be reexamined after
further sampling. Also, the nutritional importance of bacteria associated
with the sediments and detritus ingested by these hermit crabs need to be
examined.
No other literature concerning the feeding habits of Alaskan hermit
crabs is available. Greenwood (1972) and Orton (1927) examined the mouth-
parts and feeding behavior of hermit crabs and concluded that detrital
feeding utilizing the third maxillipeds to scrape or sieve microscopic food
from bottom deposits is the general mode of feeding for these animals.
Scavenging and predation are believed to be opportunistic and accessory to
detrital feedings. The occurrence of significant amounts of sediment in
the stomachs of the common hermit crabs suggests a dependence on sediment/
detrital feeding in Cook Inlet.
195
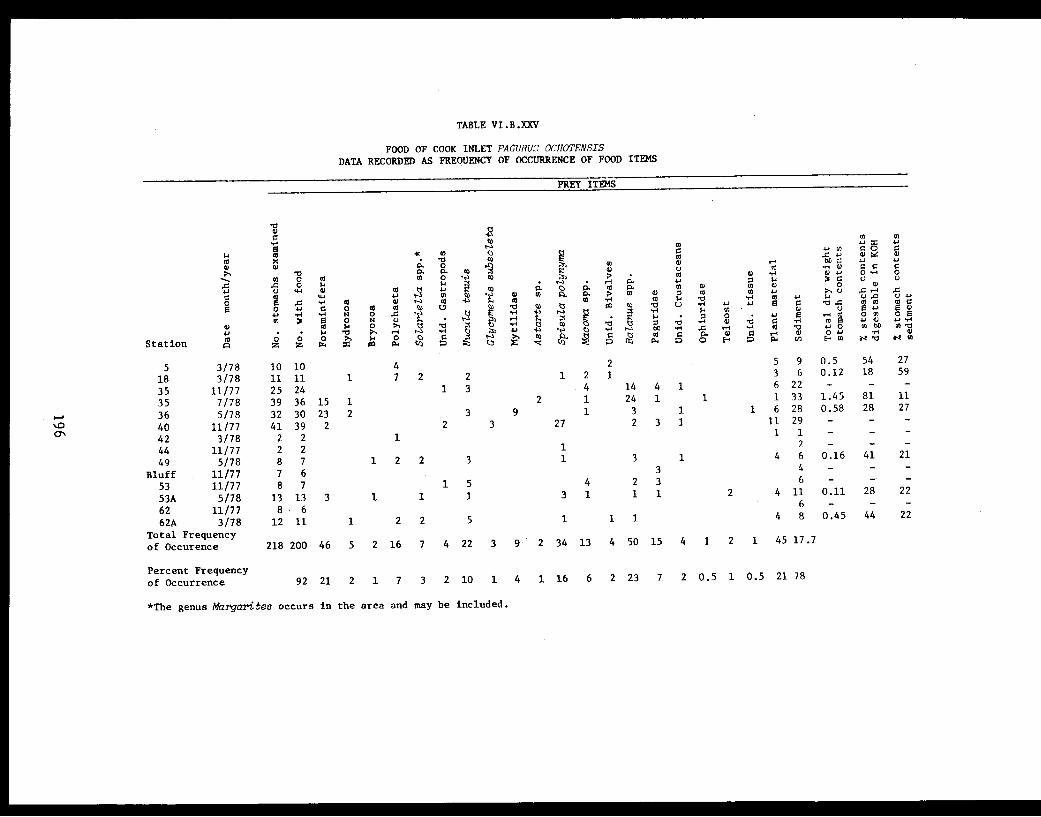
TABLE VI.B.XXV
FOOD OF COOK INLET PAGURUS OCHOTENSISDATA RECORDED AS FREQUENCY OF OCCURRENCE OF FOOD ITEMS
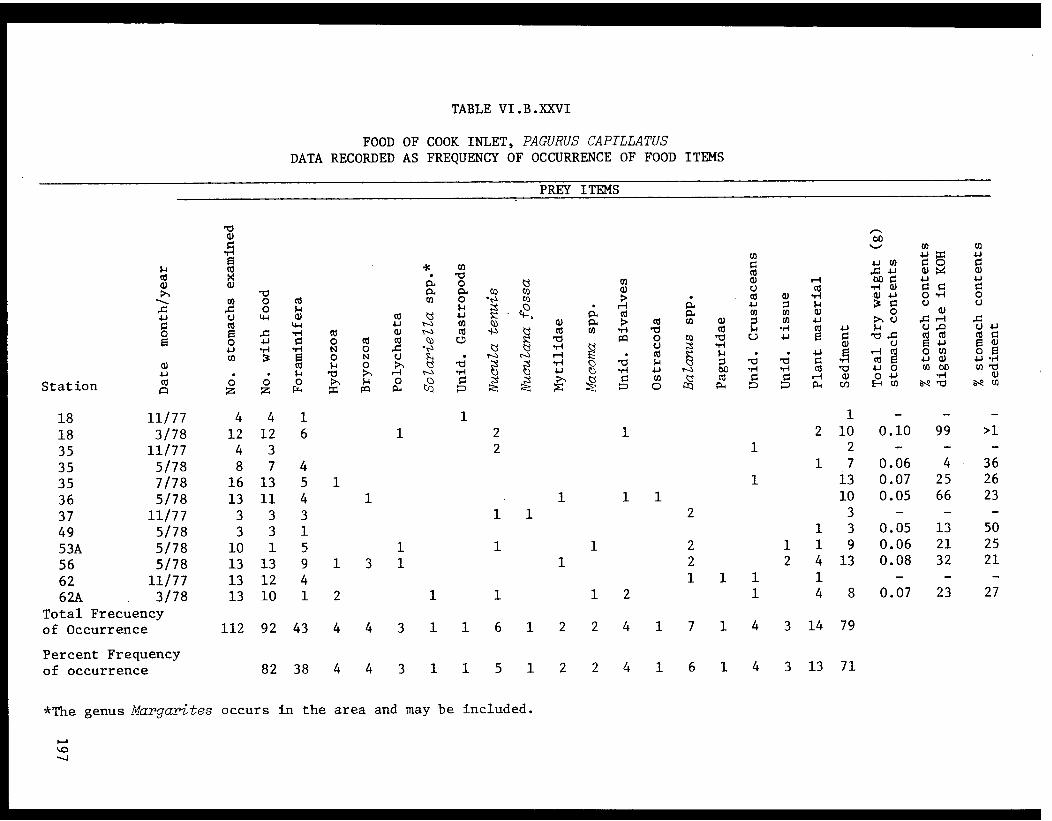
TABLE VI.B.XXVI
FOOD OF COOK INLET, PAGURUS CAPILLATUSDATA RECORDED AS FREQUENCY OF OCCURRENCE OF FOOD ITEMS

TABLE VI.B.XXVII
FOOD OF COOK INLET, PAGURUS ALEUTICUSDATA RECORDED AS FREQUENCY OF OCCURRENCE OF FOOD ITEMS
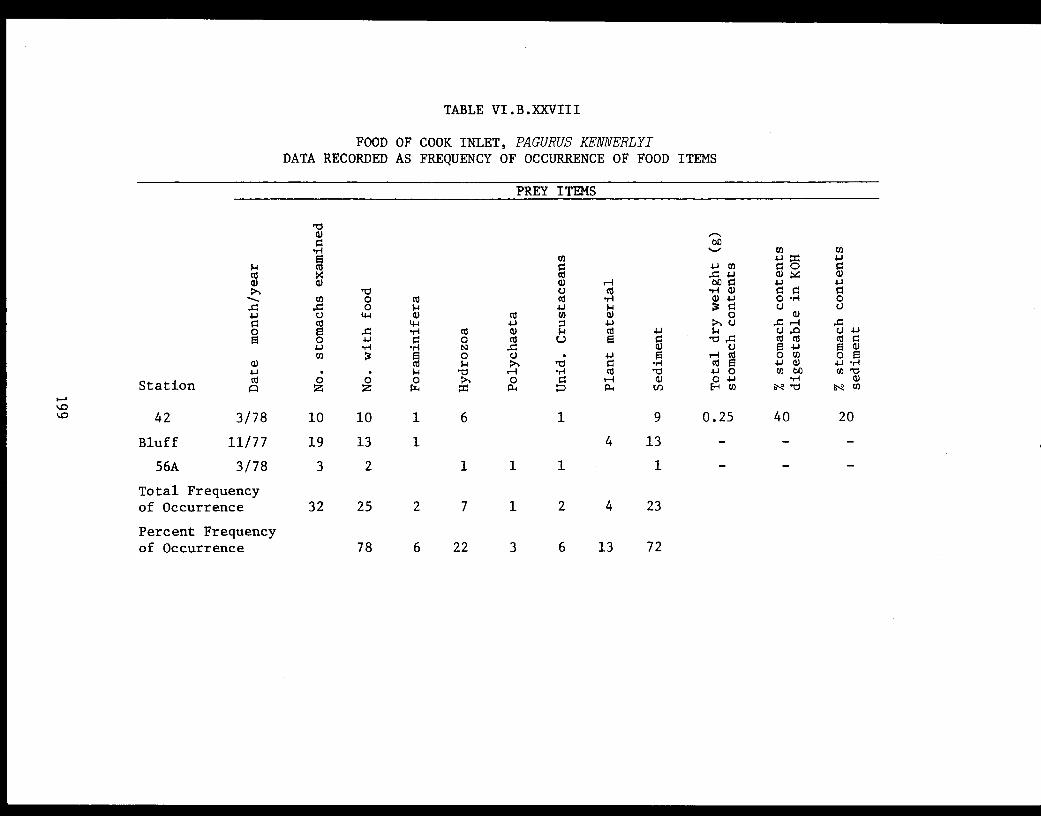
TABLE VI.B.XXVIII
FOOD OF COOK INLET, PAGURUS KENNERLYIDATA RECORDED AS FREQUENCY OF OCCURRENCE OF FOOD ITEMS
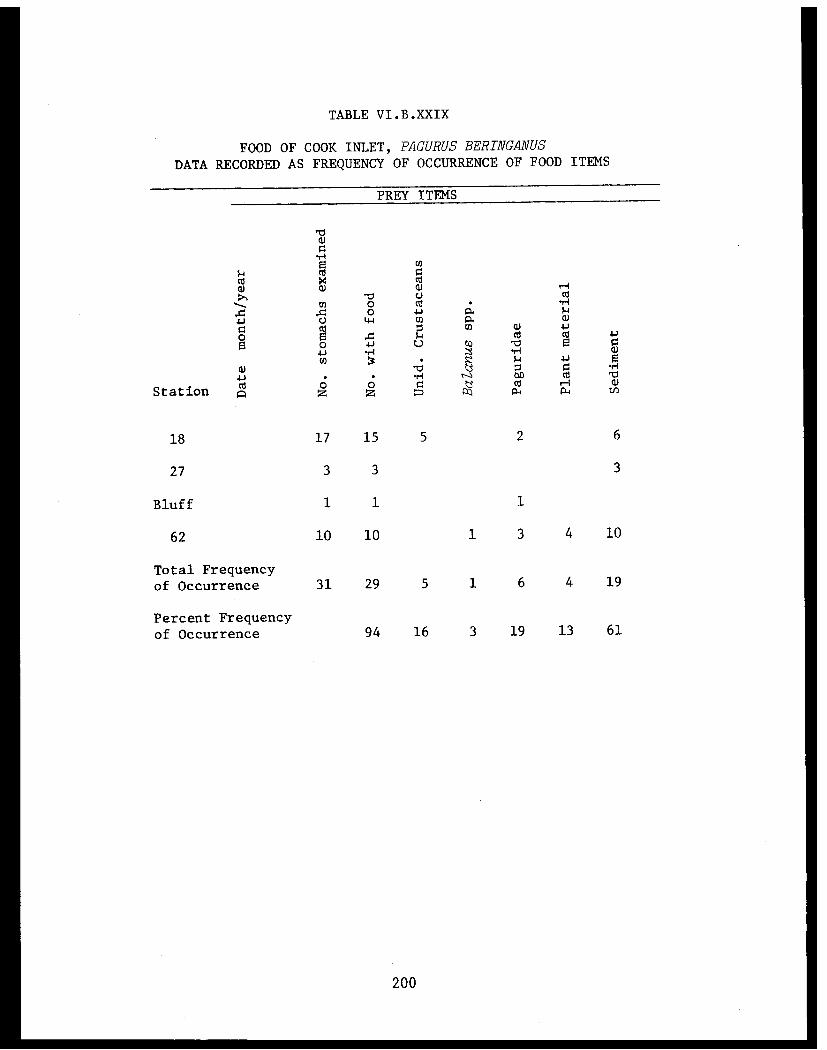
TABLE VI.B.XXIX
FOOD OF COOK INLET, PAGURUS BERINGANUS
DATA RECORDED AS FREQUENCY OF OCCURRENCE OF FOOD ITEMS
200
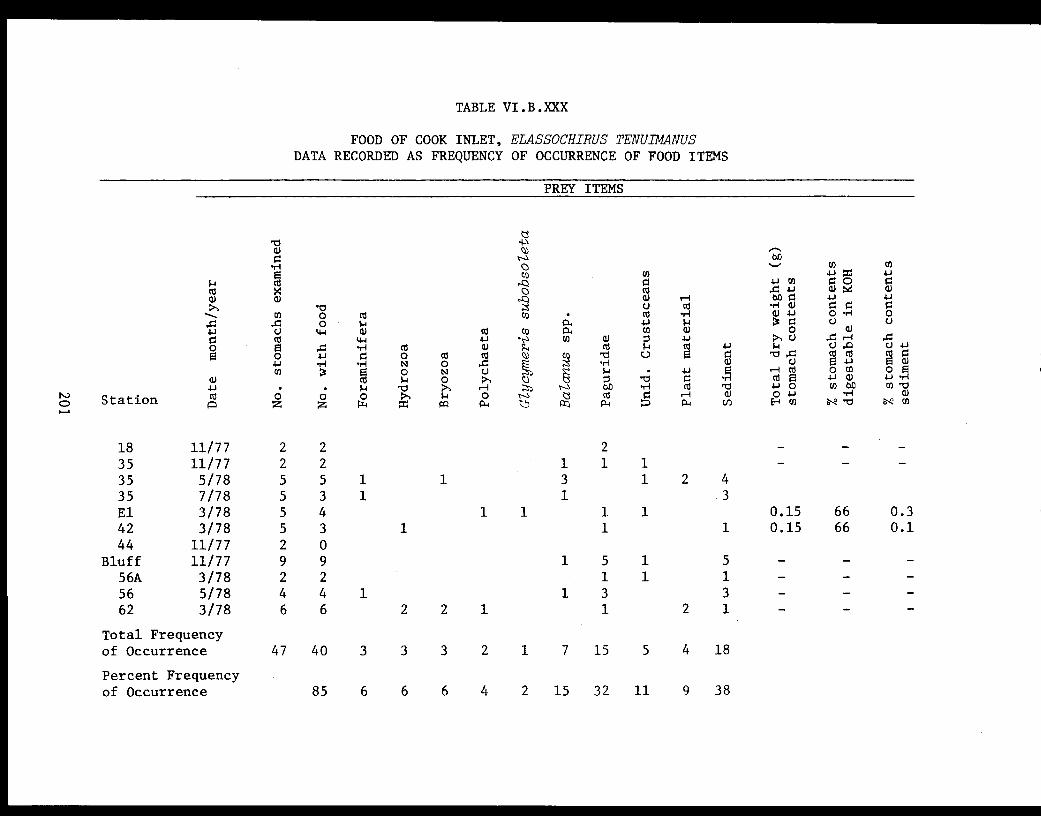
TABLE VI.B.XXX
FOOD OF COOK INLET, ELASSOCHIRUS TENUIMANUSDATA RECORDED AS FREQUENCY OF OCCURRENCE OF FOOD ITEMS
Food of Other Invertebrates
Food data for small numbers of Lebbeus groenlandica, Pandalus danae,
Crangon communis, C. franciscorum, Sclerocrangon boreas, Argis dentata,
Oregonia gracilis, Hyas lyratus, and Ophiura sarsi is presented in Tables
VI.B.XXXI-VI.B.XXXIX. The data is not discussed because the number of
stomachs examined is small.
202
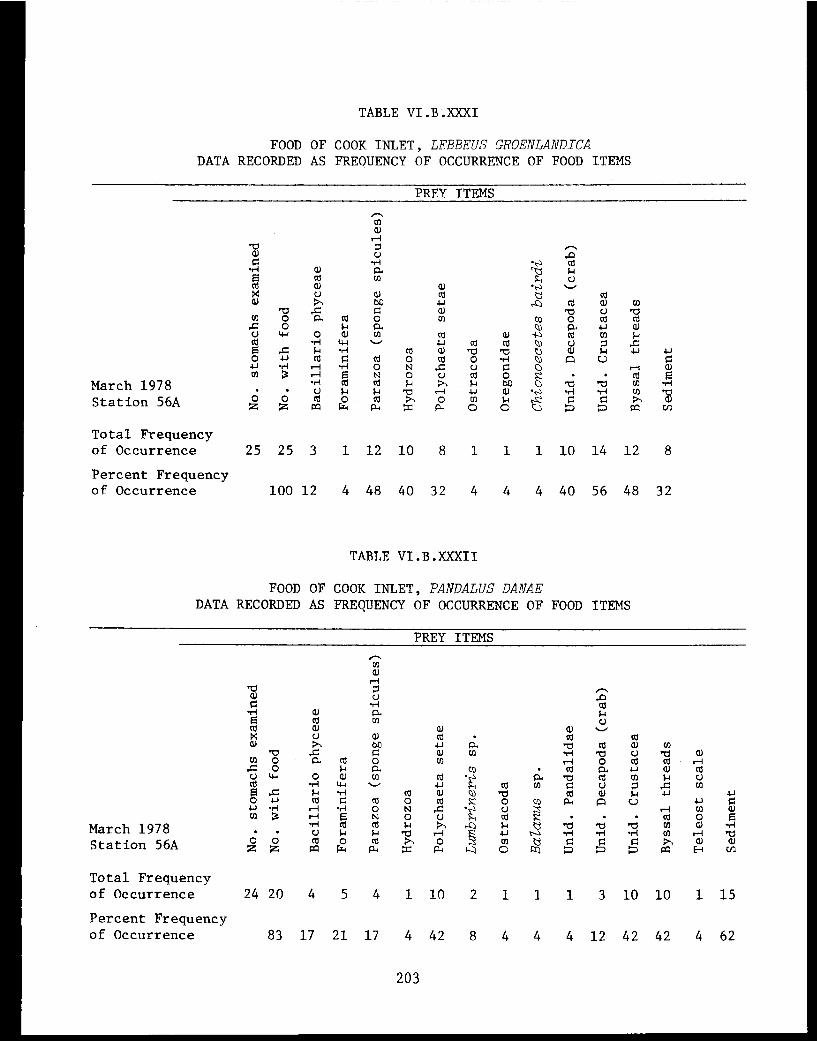
TABLE VI.B.XXXI
FOOD OF COOK INLET, LEBBEUS GROENLANDICADATA RECORDED AS FREQUENCY OF OCCURRENCE OF FOOD ITEMS
TABLE VI.B.XXXII
FOOD OF COOK INLET, PANDALUS DANAEDATA RECORDED AS FREQUENCY OF OCCURRENCE OF FOOD ITEMS
203

TABLE VI.B.XXXIII
LOWER COOK INLET, CRANGON COMMVUNIS
DATA RECORDED AS FREQUENCY OF OCCURRENCE OF FOOD ITEMS

TABLE VI.B.XXXIV
FOOD OF COOK INLET CRANGON FRANCISCORUMDATA RECORDED AS FREQUENCY OF OCCURRENCE OF FOOD ITEMS
TABLE VI.B.XXXV
FOOD OF COOK INLET SCLEROCRANGON BOREASDATA RECORDED AS FREQUENCY OF OCCURRENCE OF FOOD ITEMS
205

TABLE VI.B.XXXVI
FOOD OF COOK INLET ARGIS DENTATA
DATA RECORDED AS FREQUENCY OF OCCURRENCE OF FOOD ITEMS
TABLE VI.B.XXXVII
FOOD OF COOK INLET OREGONIA GRACILIS
DATA RECORDED AS FREQUENCY OF OCCURRENCE OF FOOD ITEMS
206

TABLE VI.B.XXXVIII
FOOD OF COOK INLET HYAS LYRATUS
DATA RECORDED AS FREQUENCY OF OCCURRENCE OF FOOD ITEMS
TABLE VI.B.XXXIX
FOOD AND SIZE-WEIGHT RELATIONSHIPS OF COOK INLET OPHIURA SARSI
DATA RECORDED AS FREQUENCY OF OCCURRENCE OF FOOD ITEMS
207

Food of Selected Fishes
In 1976, a large 400-mesh eastern otter trawl was used to collect
invertebrates and in the process several fishes were captured. The stomach
contents of selected fishes captured by this trawl were examined for food
(Table VI.B.XL). The species most commonly captured and examined were the
starry flounder, rock sole, Pacific halibut, and Pacific cod. The three
most common prey species of Platichthys stellatus (starry flounder) were
Spisula polynyma (40%), Crangon dalli (12%), and Chionoecetes bairdi (7%).
Rock sole, Lepidopsetta bitineata, fed most frequently on amphipods (22%).
Halibut, Hippoglossus stenolepis, preyed primarily on C. bairdi (33%),
Crangon spp. (23%), and fishes of the genera Lumpenus and Trichodon (14%).
The four most frequently occurring prey types found in Pacific cod, Gadus
macrocephalus, were young C. bairdi (63%), Crangon spp. (51%), unidentified
fishes and polychaetes 23 and 18% respectively. Small numbers of other
species of fishes were also examined (Table VI.B.XL). An additional trawl
survey in 1978 provided additional data on the food of fishes. The primary
prey of pollock, Theragra chalcogramma were Crangonidae (31%) and Pandalus
goniurus (8%) (see Table VI.B.XLI). The flathead sole, Hippoglossoides
elassodon, fed on Crangonidae (16%), C. bairdi (9%) and Pandalus borealis
(8%) (Table VI.B.XLII). Yellowfin sole, Limanda aspera, fed on S. polynyma
(57%) and Macoma spp. (5%) (Table VI.B.XLIII). The food of other species
captured in small numbers is presented in Table VI.B.XLIV).
208
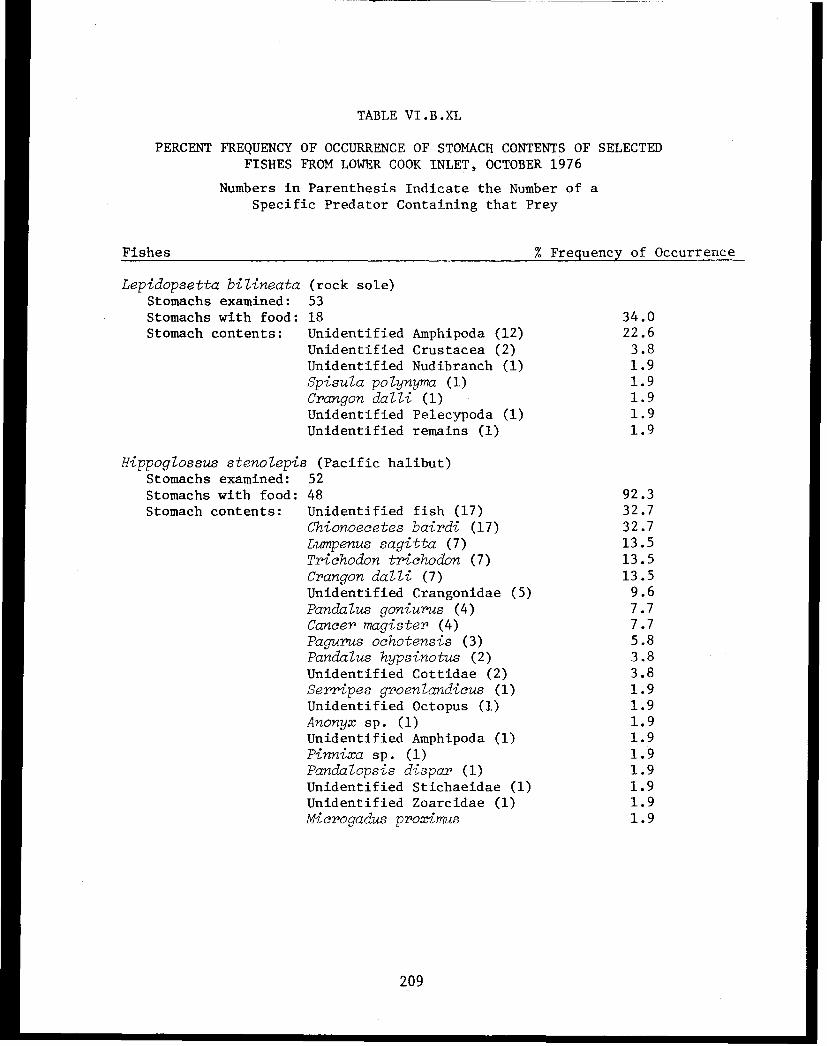
TABLE VI.B.XL
PERCENT FREQUENCY OF OCCURRENCE OF STOMACH CONTENTS OF SELECTEDFISHES FROM LOWER COOK INLET, OCTOBER 1976
Numbers in Parenthesis Indicate the Number of aSpecific Predator Containing that Prey
Fishes % Frequency of Occurrence
Lepidopsetta bilineata (rock sole)Stomachs examined: 53Stomachs with food: 18 34.0Stomach contents: Unidentified Amphipoda (12) 22.6
Unidentified Crustacea (2) 3.8Unidentified Nudibranch (1) 1.9Spisula polynyma (1) 1.9Crangon dalli (1) 1.9Unidentified Pelecypoda (1) 1.9Unidentified remains (1) 1.9
Hippoglossus stenolepis (Pacific halibut)Stomachs examined: 52Stomachs with food: 48 92.3Stomach contents: Unidentified fish (17) 32.7
Chionoecetes bairdi (17) 32.7Lumpenus sagitta (7) 13.5Trichodon trichodon (7) 13.5Crangon dalli (7) 13.5Unidentified Crangonidae (5) 9.6Pandalus goniurus (4) 7.7Cancer magister (4) 7.7Pagurus ochotensis (3) 5.8Pandalus hypsinotus (2) 3.8Unidentified Cottidae (2) 3.8Serripes groenlandicus (1) 1.9Unidentified Octopus (1) 1.9Anonyx sp. (1) 1.9Unidentified Amphipoda (1) 1.9Pinnixa sp. (1) 1.9Pandalopsis dispar (1) 1.9Unidentified Stichaeidae (1) 1.9Unidentified Zoarcidae (1) 1.9Microgadus proximus 1.9
209

TABLE VI.B.XL
CONTINUED
Fishes % Frequency of Occurrence
Platichthys stellatus (starry flounder)Stomachs examined: 55Stomachs with food: 31 56.4Stomach contents: Spisula polynyma (22) 40.0
Crangon dalli (7) 12.7Chionoecetes bairdi (4) 7.3Crangon sp. (2) 3.6Pandalus borealis (1) 1.8Unidentified Pelecypoda (1) 1.8
Hippoglossoides elassodon (flathead sole)Stomachs examined: 6Stomachs with food: 6 100.0Stomach contents: Unidentified Ophiuroidea (3) 50.0
Unidentified Crangonidae (3) 50.0Nuculana fossa (2) 33.4Unidentified Polynoidae (1) 16.7Macoma sp. (1) 16.7
Atheresthes stomias (turbot)Stomachs examined: 10Stomachs with food: 0 0
Glyptocephalus zachirus (rex sole)Stomachs examined: 6Stomachs with food: 0 0
Limanda aspera (yellowfin sole)Stomachs examined: 1Stomachs with food: 1 100.0Stomach contents: Unidentified Pelecypoda 100.0
Gadus macrocephalus (Pacific cod)Stomachs examined: 43Stomachs with food: 41 95.3Stomach contents: Chionoecetes bairdi (27) 62.8
Unidentified Crangonidae (22) 51.1Unidentified fishes (10) 23.2Unidentified Polychaeta (5) 17.6Pandalus borealis (4) 9.3Crangon sp. (4) 9.3Crangon dalli (2) 4.7Unidentified Isopoda (2) 4.7Unidentified Amphipoda (2) 4.7Pandalus sp. (1) 2.3Hyas lyratus (1) 2.3
210
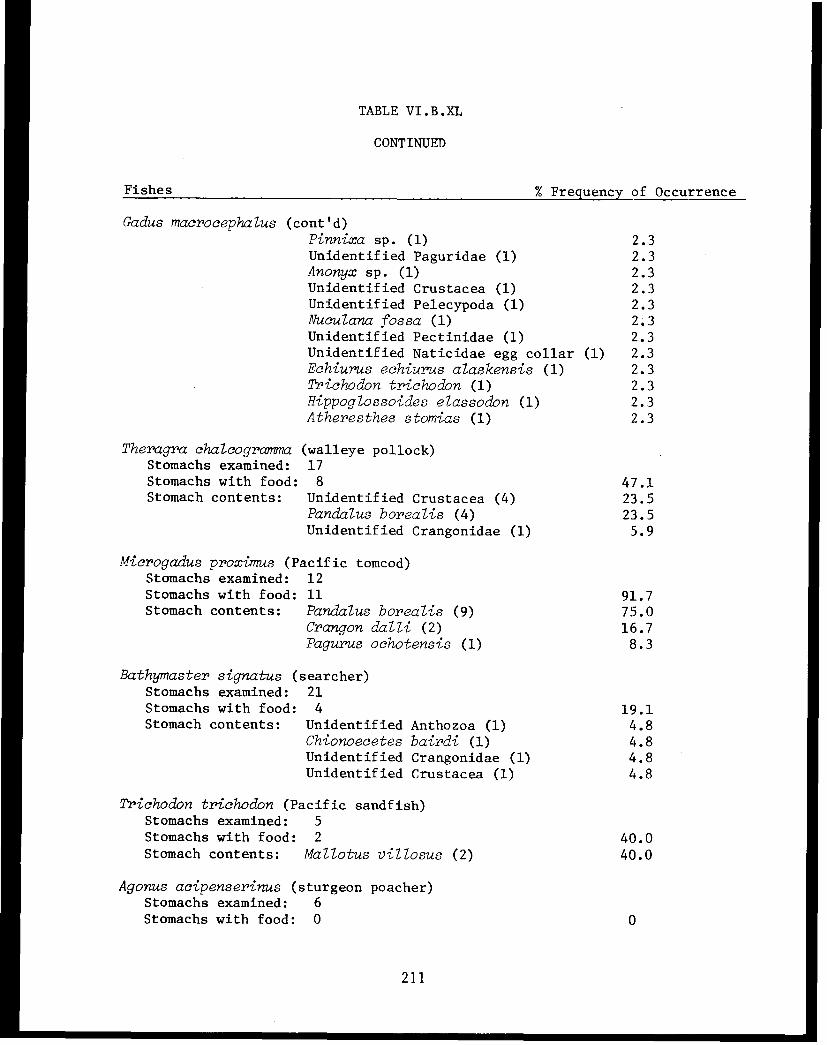
TABLE VI.B.XL
CONTINUED
Fishes % Frequency of Occurrence
Gadus macrocephalus (cont'd)Pinnixa sp. (1) 2.3Unidentified Paguridae (1) 2.3Anonyx sp. (1) 2.3Unidentified Crustacea (1) 2.3Unidentified Pelecypoda (1) 2.3Nuculana fossa (1) 2.3Unidentified Pectinidae (1) 2.3Unidentified Naticidae egg collar (1) 2.3Echiurus echiurus alaskensis (1) 2.3Trichodon trichodon (1) 2.3Hippoglossoides elassodon (1) 2.3Atheresthes stomias (1) 2.3
Theragra chalcogramma (walleye pollock)Stomachs examined: 17Stomachs with food: 8 47.1Stomach contents: Unidentified Crustacea (4) 23.5
Pandalus borealis (4) 23.5Unidentified Crangonidae (1) 5.9
Microgadus proximus (Pacific tomcod)Stomachs examined: 12Stomachs with food: 11 91.7Stomach contents: Pandalus borealis (9) 75.0
Crangon dalli (2) 16.7Pagurus ochotensis (1) 8.3
Bathymaster signatus (searcher)Stomachs examined: 21Stomachs with food: 4 19.1Stomach contents: Unidentified Anthozoa (1) 4.8
Chionoecetes bairdi (1) 4.8Unidentified Crangonidae (1) 4.8Unidentified Crustacea (1) 4.8
Trichodon trichodon (Pacific sandfish)Stomachs examined: 5Stomachs with food: 2 40.0Stomach contents: Mallotus villosus (2) 40.0
Agonus acipenserinus (sturgeon poacher)Stomachs examined: 6Stomachs with food: 0 0
211

TABLE VI.B.XL
CONTINUED
Fishes % Frequency of Occurrence
Lycodes palearis (wattled eelpout)Stomachs examined: 2Stomachs with food: 2 100.0Stomach contents: Crangon dalli (2) 100.0
Lycodes sp. (eelpout)Stomachs examined: 1Stomachs with food: 1 100.0Stomach contents: Macoma sp. 100.0
Unidentified Crangonidae 100.0
Myoxocephalus polyacanthocephalus (great sculpin)Stomachs examined: 26Stomachs with food: 22 84.6Stomach contents: Chionoecetes bairdi (8) 30.8
Crangon dalli (6) 23.1Hyas lyratus (4) 15.4Unidentified fish (2) 7.6Unidentified Cyclopteridae (2) 7.6Unidentified Cottidae (1) 3.8Lumpenus sagitta (1) 3.8Unidentified shrimp (1) 3.8Cancer oregonensis (1) 3.8Cancer magister (1) 3.8Pagurus ochotensis (1) 3.8Oregonia gracilis (1) 3.8
Cottidae (sculpin)Stomachs examined: 3Stomachs with food: 3 100.0Stomach contents: Chionoecetes bairdi (3) 100.0
Cyclopteridae (snailfish)Stomachs examined: 4Stomachs with food: 4 100.0Stomach contents: Crangon dalli (4) 100.0
Squalus sp. (dogfish shark)Stomachs examined: 1Stomachs with food: 1 100.0Stomach contents: Unidentified fish 100.0
Unidentified leech 100.0
212
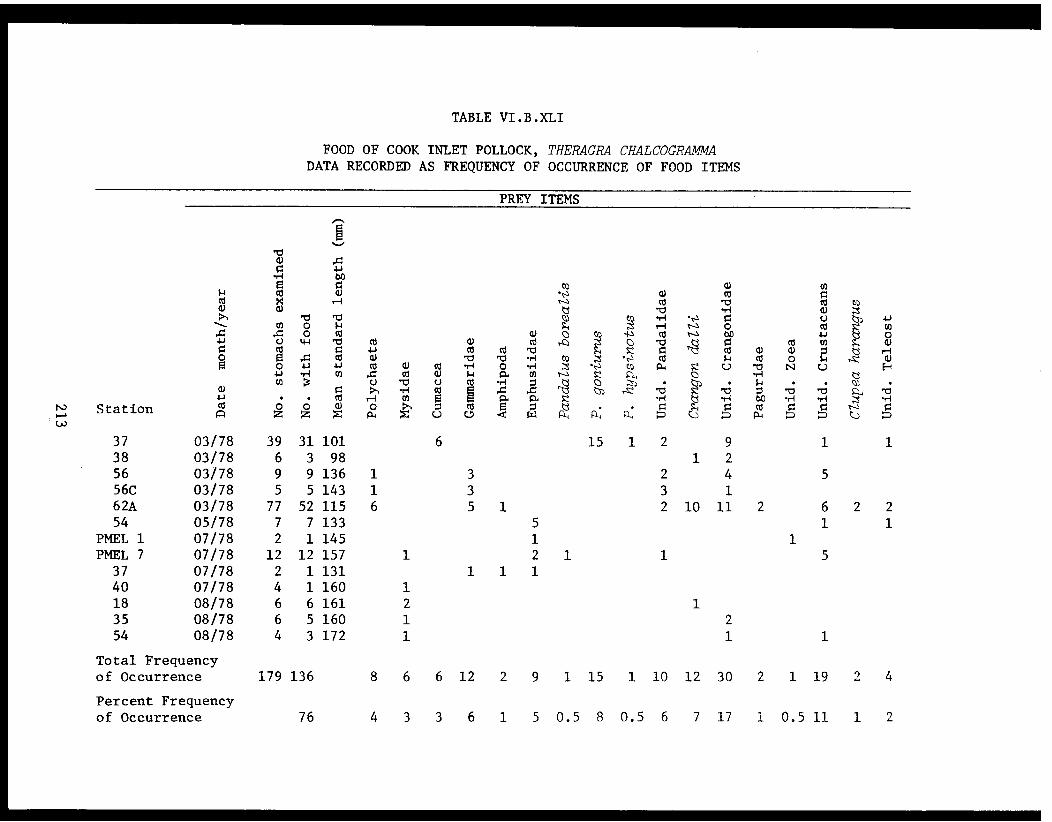
TABLE VI.B.XLI
FOOD OF COOK INLET POLLOCK, THERAGRA CHALCOGRAMMADATA RECORDED AS FREQUENCY OF OCCURRENCE OF FOOD ITEMS
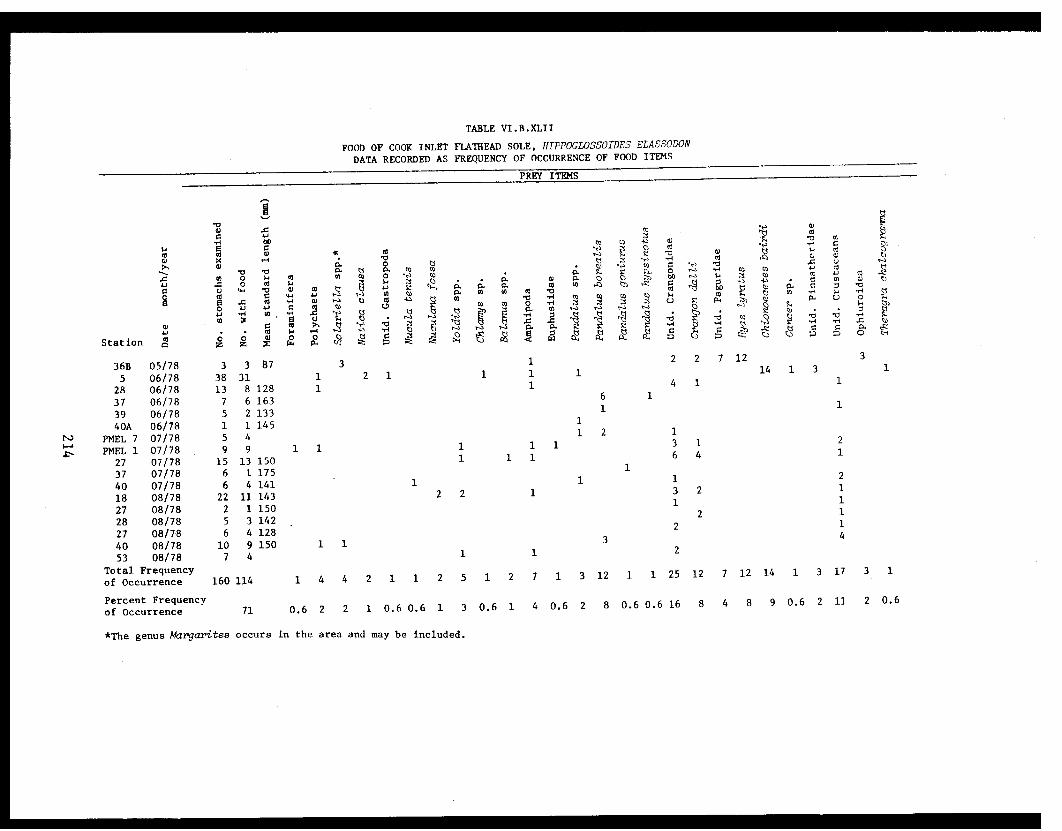
TABLE VI.B.XLII
FOOD OF COOK INLET FLATHEAD SOLE, HIPPOGLOSSOIDES ELASSODON
DATA RECORDED AS FREQUENCY OF OCCURRENCE OF FOOD ITEMS

TABLE VI.B.XLIII
FOOD OF COOK INLET YELLOWFIN SOLE, LIMANDA ASPERA
DATA RECORDED AS FREQUENCY OF OCCURRENCE OF FOOD ITEMS
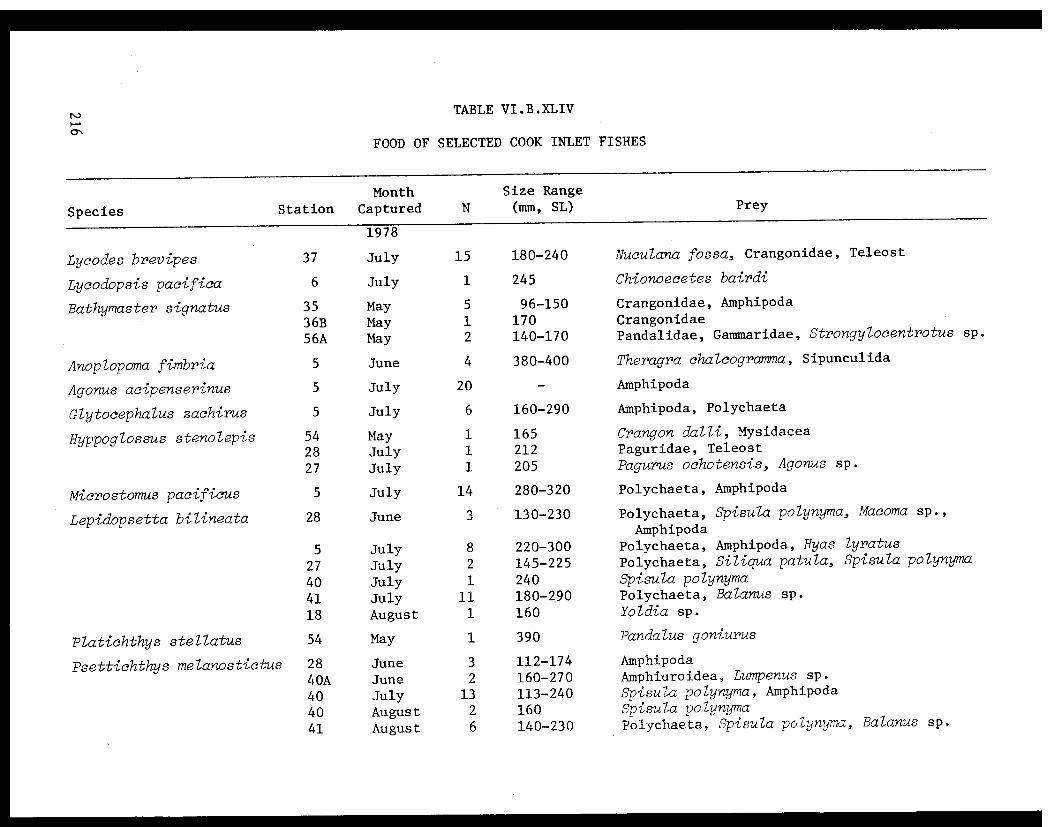
TABLE VI.B.XLIV
FOOD OF SELECTED COOK INLET FISHES
General Discussion
The results of stomach analysis of Cook Inlet benthic invertebrates
indicate that the commercially important crab, shrimp and the fishes
examined prey directly on sediment-detrital feeding organisms (Table
VI.B.XLV). Furthermore, pink shrimp, coonstripe shrimp and humpy shrimp
stomachs contain over 50% sediment on a dry weight basis (Table VI.B.XLV)
suggesting that they feed on detritus themselves. Post-larval king crabs
and snow crab stomachs also contain sediment, suggesting that these crus-
taceans ingest large amounts of sediment while feeding (Table VI.B.XLV).
Crangonid shrimps, hermit crabs (Table VI.B.XLV), detrital feeding clams
and polychaetes, all of which are important prey organisms of these crabs,
shrimps, and fishes, also ingest large quantities of sediment. Other prey
organisms, such as barnacles and filter feeding clams, probably also in-
advertently ingest sediment while feeding on resuspended material. There-
fore, if oil were to complex with subtidal sediments in lower Cook Inlet,
the commercially important crustaceans and the fishes examined would ingest
these hydrocarbons both directly while feeding, and through the consumption
of contaminated prey. A similar situation would occur if drilling muds
were allowed to settle on feeding areas. Currently, no information on the
effect of oil or drilling mud contaminated food on crabs, shrimps or the
fishes examined is available.
The most important prey types of the adult stages of the commercially
important crabs, shrimps, and fishes examined in Cook Inlet are polychaetes,
bivalves, barnacles, crangonid shrimps, and hermit crabs. If oil pollu-
tion negatively effected population sizes of these prey organisms, food
supplies of the crabs and shrimp species of Cook Inlet would be limited.
The studies on the effect of prey concentration on the feeding success
of the zoeae of king crab, snow crab and pink shrimp show that feeding success
is impaired if prey concentrations are below 40 per liter. King crab zoeae
lose the ability to feed after 3.5 days from hatching if prey concentrations
are too low for successful feeding, especially if the water temperature is
below 4°C. Survival rates of these larvae are known to be reduced by crude
oil pollution (Rice et al., 1976). If oil pollution occurred during a
217
period of low prey availability or negatively affected prey availability,
high mortality rates could be expected.
218
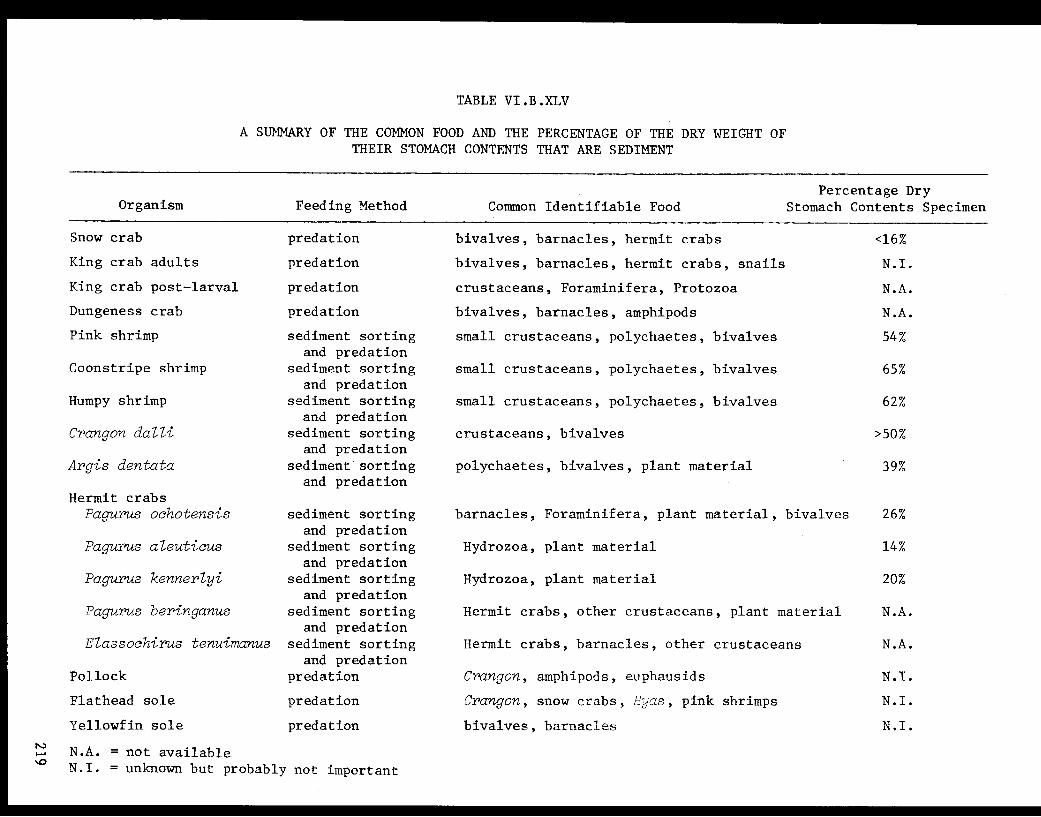
TABLE VI.B.XLV
A SUMMARY OF THE COMMON FOOD AND THE PERCENTAGE OF THE DRY WEIGHT OFTHEIR STOMACH CONTENTS THAT ARE SEDIMENT
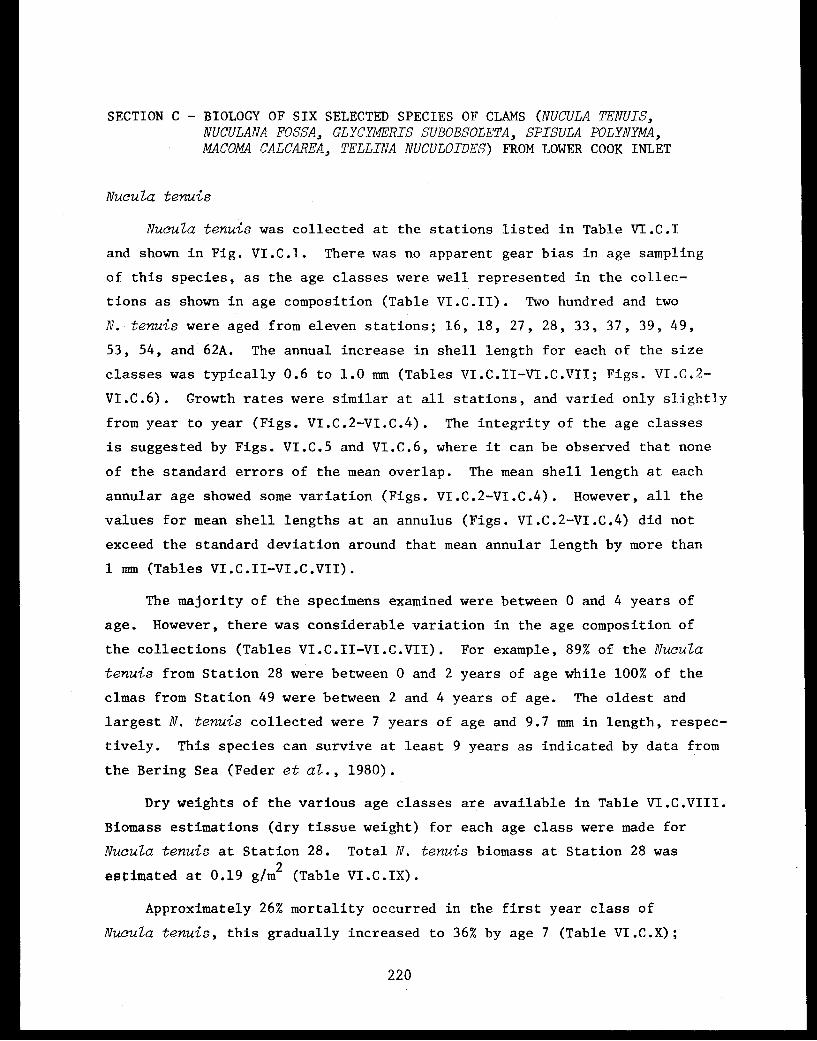
SECTION C - BIOLOGY OF SIX SELECTED SPECIES OF CLAMS (NUCULA TENUIS,NUCULANA FOSSA, GLYCYMERIS SUBOBSOLETA, SPISULA POLYNYMA,MACOMA CALCAREA, TELLINA NUCULOIDES) FROM LOWER COOK INLET
Nucula tenuis
Nucula tenuis was collected at the stations listed in Table VI.C.I
and shown in Fig. VI.C.1. There was no apparent gear bias in age sampling
of this species, as the age classes were well represented in the collec-
tions as shown in age composition (Table VI.C.II). Two hundred and two
N. tenuis were aged from eleven stations; 16, 18, 27, 28, 33, 37, 39, 49,
53, 54, and 62A. The annual increase in shell length for each of the size
classes was typically 0.6 to 1.0 mm (Tables VI.C.II-VI.C.VII; Figs. VI.C.2-
VI.C.6). Growth rates were similar at all stations, and varied only slightly
from year to year (Figs. VI.C.2-VI.C.4). The integrity of the age classes
is suggested by Figs. VI.C.5 and VI.C.6, where it can be observed that none
of the standard errors of the mean overlap. The mean shell length at each
annular age showed some variation (Figs. VI.C.2-VI.C.4). However, all the
values for mean shell lengths at an annulus (Figs. VI.C.2-VI.C.4) did not
exceed the standard deviation around that mean annular length by more than
1 mm (Tables VI.C.II-VI.C.VII).
The majority of the specimens examined were between 0 and 4 years of
age. However, there was considerable variation in the age composition of
the collections (Tables VI.C.II-VI.C.VII). For example, 89% of the Nucula
tenuis from Station 28 were between 0 and 2 years of age while 100% of the
clmas from Station 49 were between 2 and 4 years of age. The oldest and
largest N. tenuis collected were 7 years of age and 9.7 mm in length, respec-
tively. This species can survive at least 9 years as indicated by data from
the Bering Sea (Feder et al., 1980).
Dry weights of the various age classes are available in Table VI.C.VIII.
Biomass estimations (dry tissue weight) for each age class were made for
Nucula tenuis at Station 28. Total N. tenuis biomass at Station 28 was
estimated at 0.19 g/m² (Table VI.C.IX).
Approximately 26% mortality occurred in the first year class of
Nucula tenuis, this gradually increased to 36% by age 7 (Table VI.C.X);
220
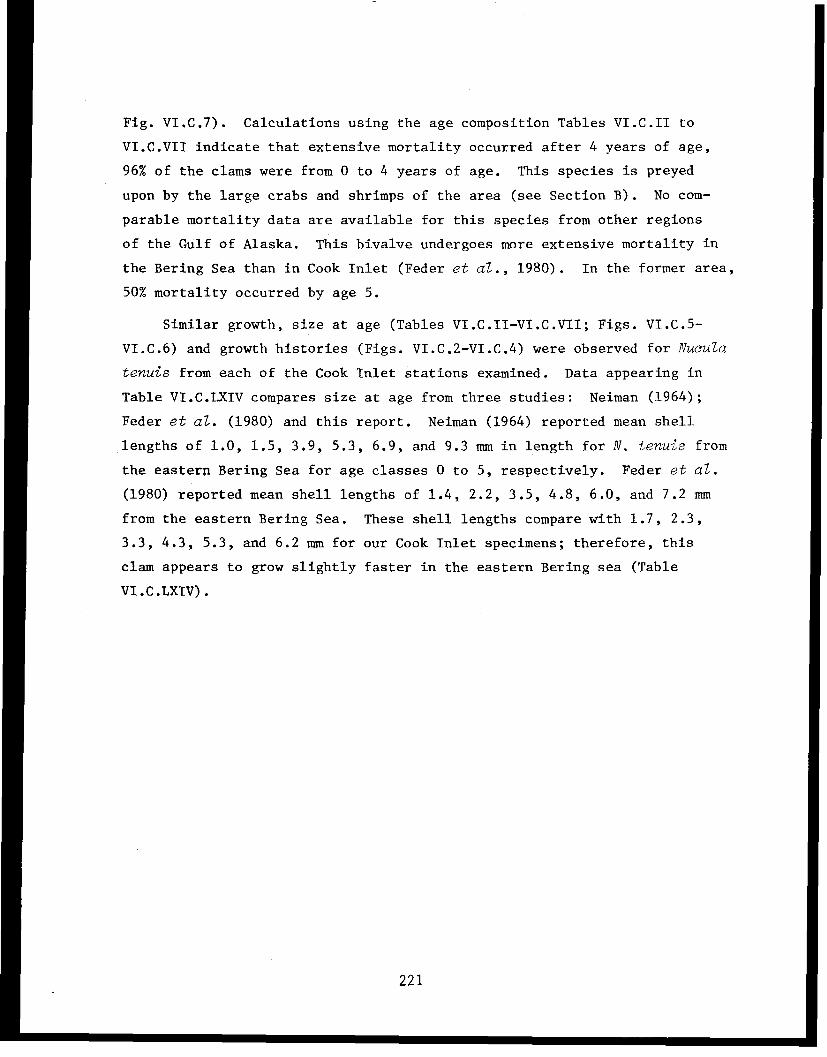
Fig. VI.C.7). Calculations using the age composition Tables VI.C.II to
VI.C.VII indicate that extensive mortality occurred after 4 years of age,
96% of the clams were from 0 to 4 years of age. This species is preyed
upon by the large crabs and shrimps of the area (see Section B). No com-
parable mortality data are available for this species from other regions
of the Gulf of Alaska. This bivalve undergoes more extensive mortality in
the Bering Sea than in Cook Inlet (Feder et al., 1980). In the former area,
50% mortality occurred by age 5.
Similar growth, size at age (Tables VI.C.II-VI.C.VII; Figs. VI.C.5-
VI.C.6) and growth histories (Figs. VI.C.2-VI.C.4) were observed for Nucula
tenuis from each of the Cook Inlet stations examined. Data appearing in
Table VI.C.LXIV compares size at age from three studies: Neiman (1964);
Feder et al. (1980) and this report. Neiman (1964) reported mean shell
lengths of 1.0, 1.5, 3.9, 5.3, 6.9, and 9.3 mm in length for N. tenuis from
the eastern Bering Sea for age classes 0 to 5, respectively. Feder et al.
(1980) reported mean shell lengths of 1.4, 2.2, 3.5, 4.8, 6.0, and 7.2 mm
from the eastern Bering Sea. These shell lengths compare with 1.7, 2.3,
3.3, 4.3, 5.3, and 6.2 mm for our Cook Inlet specimens; therefore, this
clam appears to grow slightly faster in the eastern Bering sea (Table
VI.C.LXIV).
221
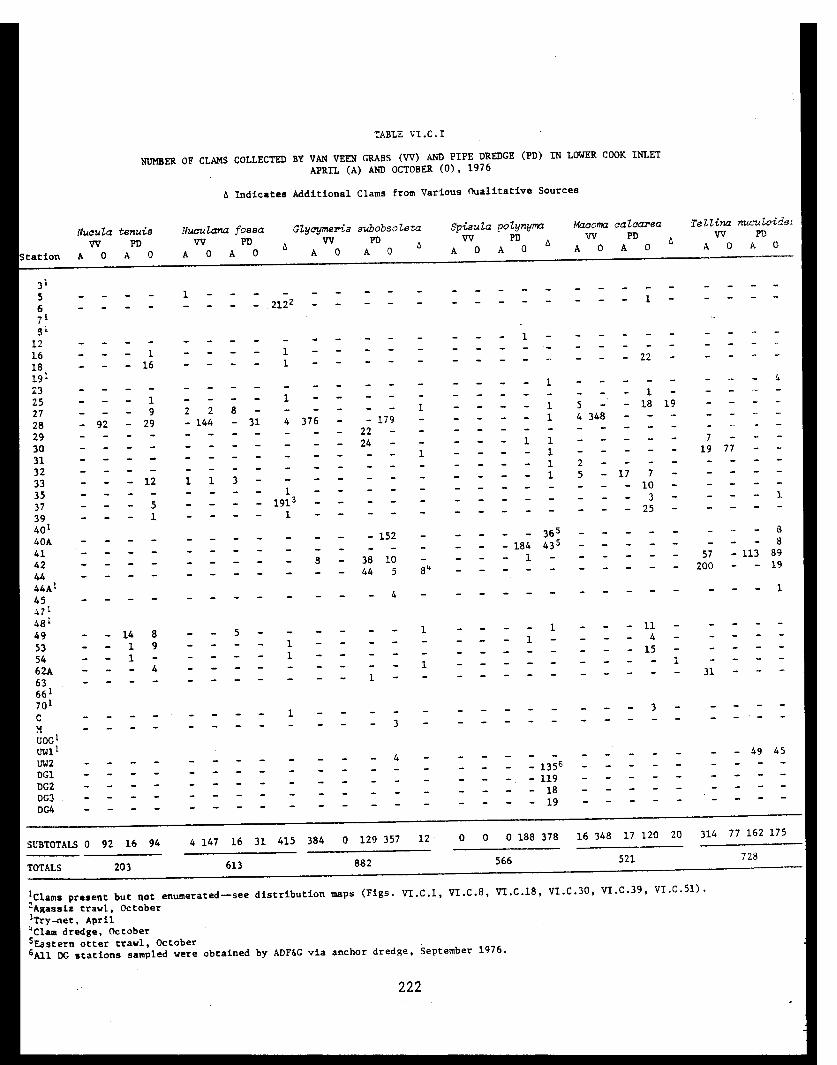
TABLE VI.C.I
NUMBER OF CLAMS COLLECTED BY VAN VEEN GRABS (VV) AND PIPE DREDGE (PD) IN LOWER COOK INLET
APRIL (A) AND OCTOBER (0), 1976
222
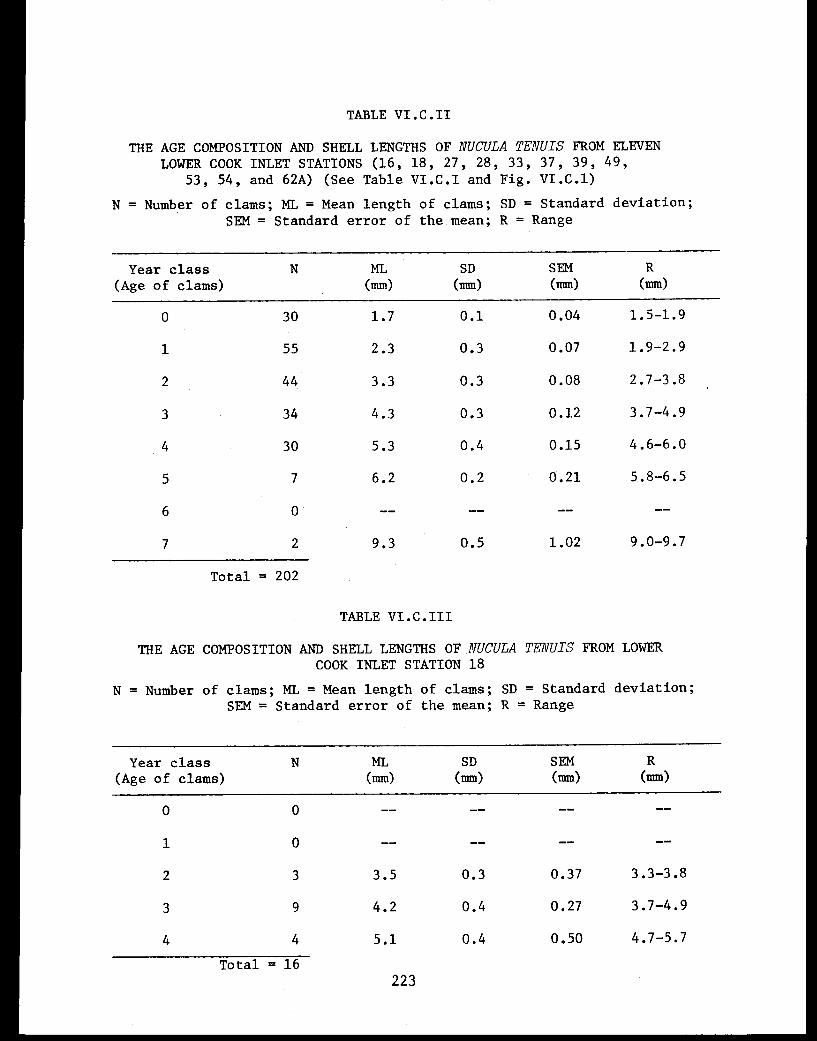
TABLE VI.C.II
THE AGE COMPOSITION AND SHELL LENGTHS OF NUCULA TENUIS FROM ELEVEN
LOWER COOK INLET STATIONS (16, 18, 27, 28, 33, 37, 39, 49,
53, 54, and 62A) (See Table VI.C.I and Fig. VI.C.1)
223
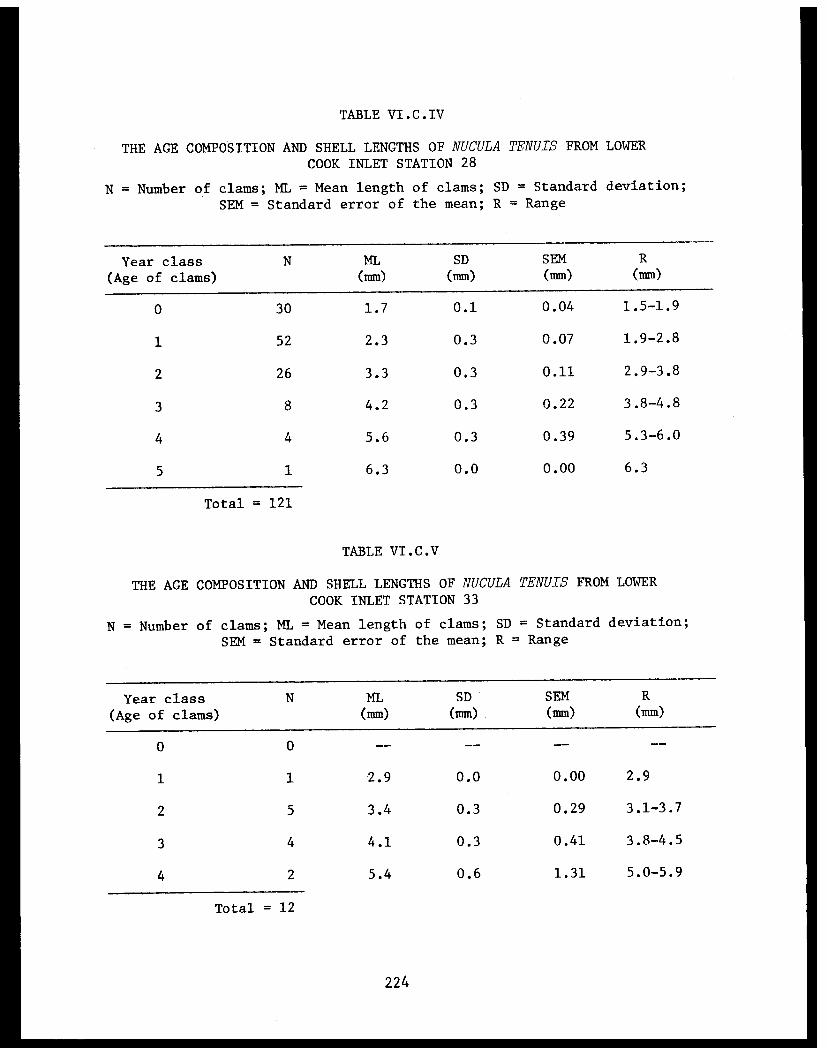
TABLE VI.C.IV
THE AGE COMPOSITION AND SHELL LENGTHS OF NUCULA TENUIS FROM LOWER
COOK INLET STATION 28
224
TABLE VI.C.V
THE AGE COMPOSITION AND SHELL LENGTHS OF NUCULA TENUIS FROM LOWER
COOK INLET STATION 33
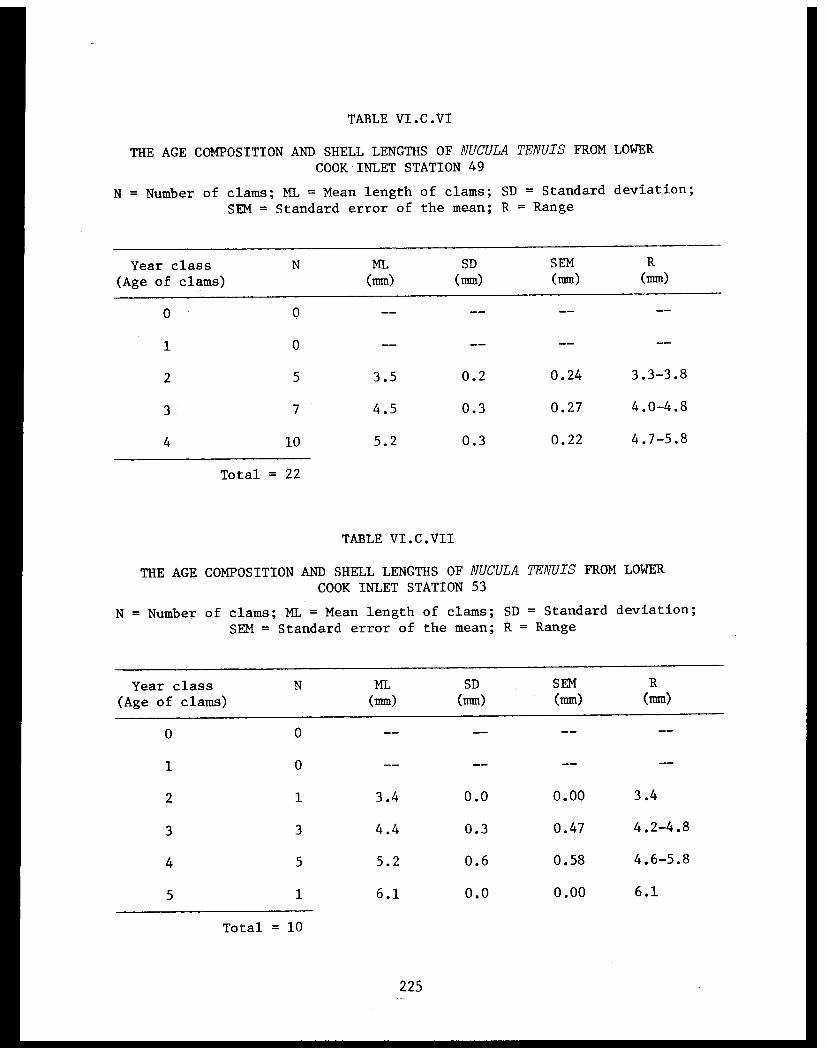
TABLE VI.C.VI
THE AGE COMPOSITION AND SHELL LENGTHS OF NUCULA TENUIS FROM LOWER
COOK INLET STATION 49
TABLE VI.C.VII
THE AGE COMPOSITION AND SHELL LENGTHS OF NUCULA TENUIS FROM LOWER
COOK INLET STATION 53
225

TABLE VI.C.VIII
AGE AND DRY-WEIGHT RELATIONSHIPS OF COOK INLET NUCULA TENUIS
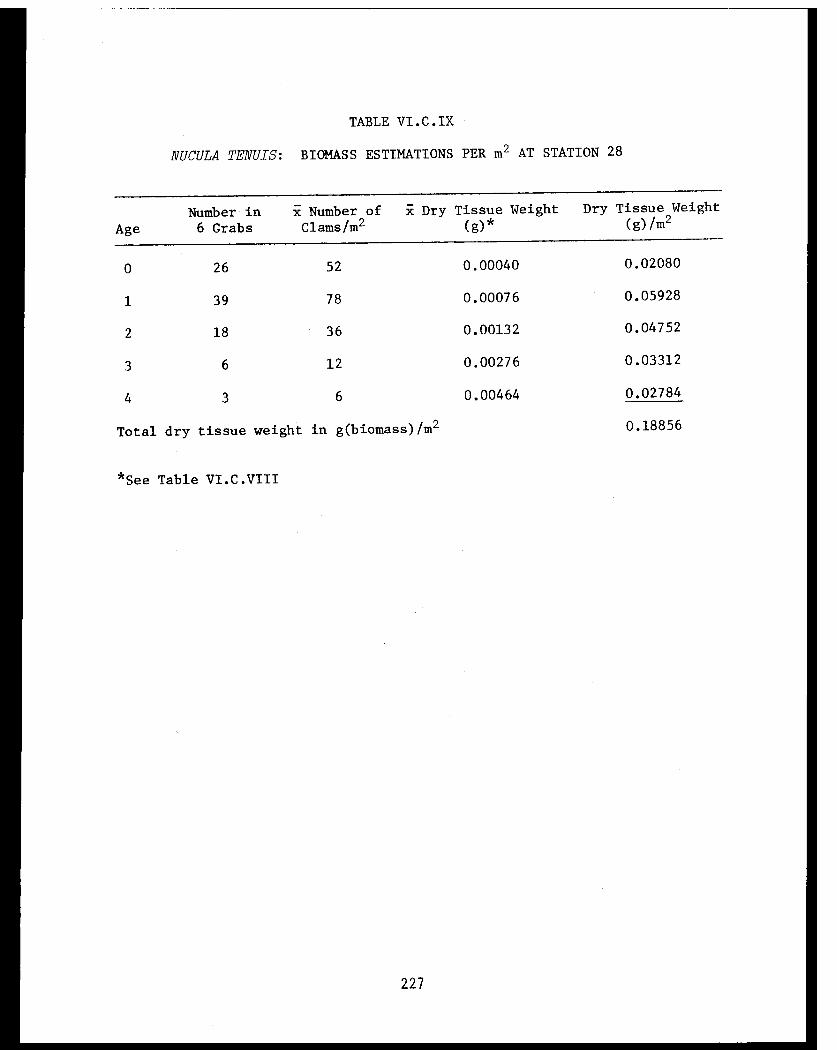
TABLE VI.C.IX
NUCULA TENUIS: BIOMASS ESTIMATIONS PER m2 AT STATION 28
227
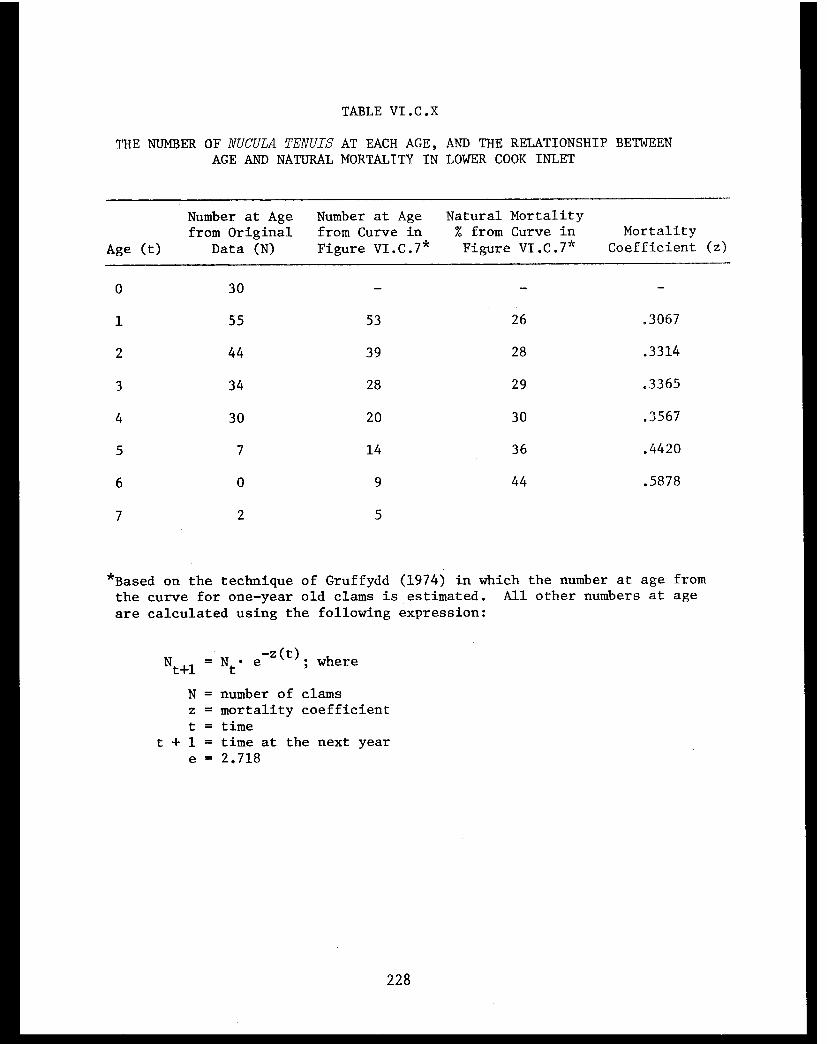
TABLE VI.C.X
THE NUMBER OF NUCULA TENUIS AT EACH AGE, AND THE RELATIONSHIP BETWEENAGE AND NATURAL MORTALITY IN LOWER COOK INLET
228
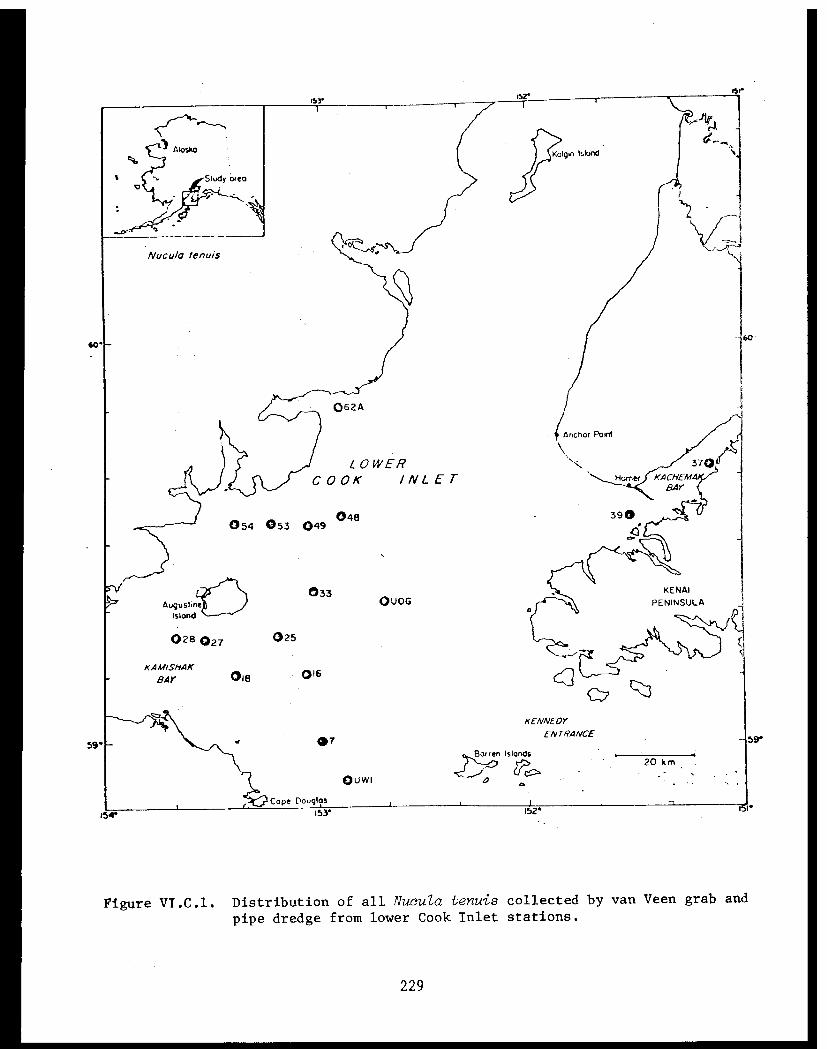
Figure VI.C.1. Distribution of all Nucula tenuis collected by van Veen grab and
pipe dredge from lower Cook Inlet stations.
229
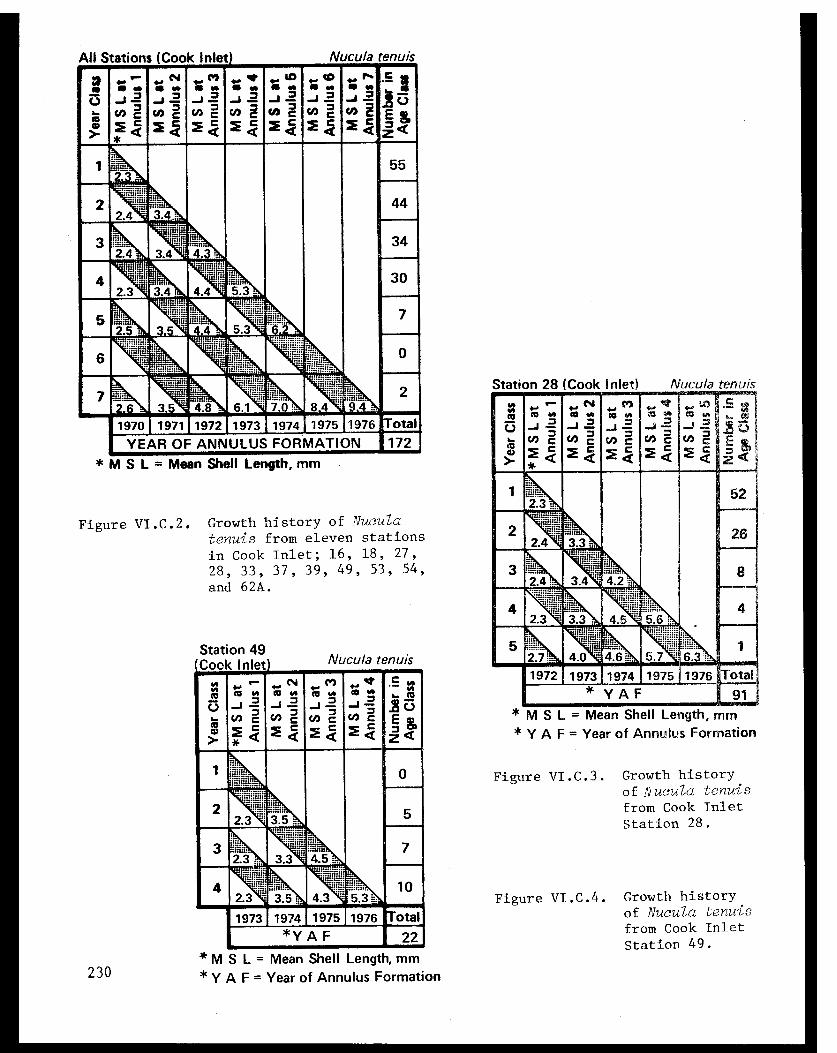
Figure VI.C.2. Growth history of Nucula
tenuis from eleven stations
in Cook Inlet; 16, 18, 27,
28, 33, 37, 39, 49, 53, 54,
and 62A.
Figure VI.C.3. Growth historyof Nucula tenuisfrom Cook InletStation 28.
Figure VI.C.4. Growth historyof Nucula tenuisfrom Cook InletStation 49.
230
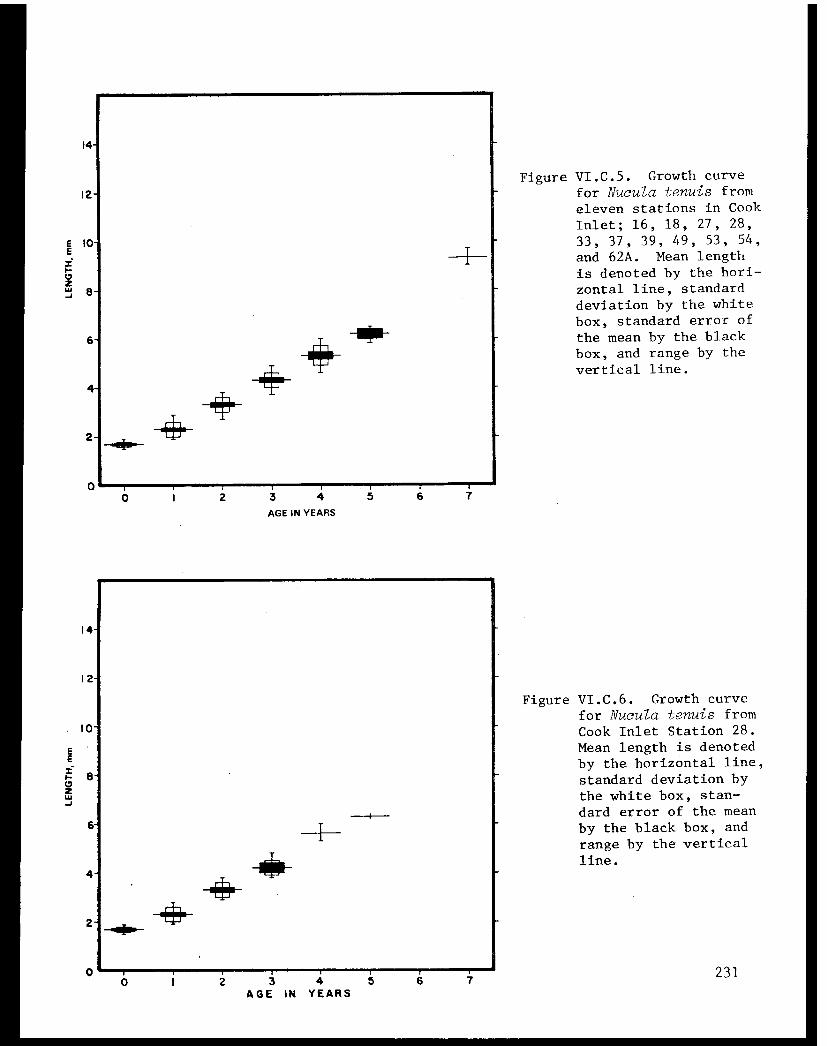
Figure VI.C.5. Growth curvefor Nucula tenuis fromeleven stations in Cook
Inlet; 16, 18, 27, 28,
33, 37, 39, 49, 53, 54,and 62A. Mean lengthis denoted by the hori-zontal line, standarddeviation by the white
box, standard error of
the mean by the blackbox, and range by the
vertical line.
Figure VI.C.6. Growth curvefor Nucula tenuis fromCook Inlet Station 28.Mean length is denotedby the horizontal line,
standard deviation bythe white box, stan-dard error of the meanby the black box, andrange by the verticalline.
231
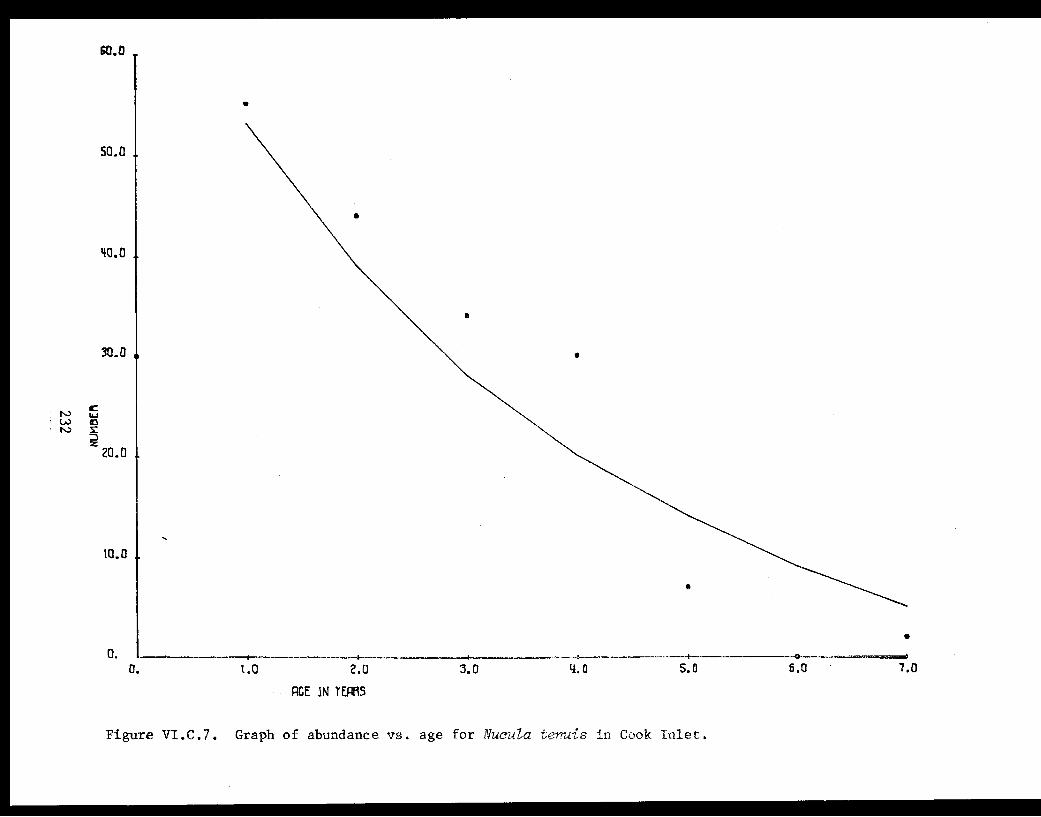
Figure VI.C.7. Graph of abundance vs. age for Nucula tenuis in Cook inlet.
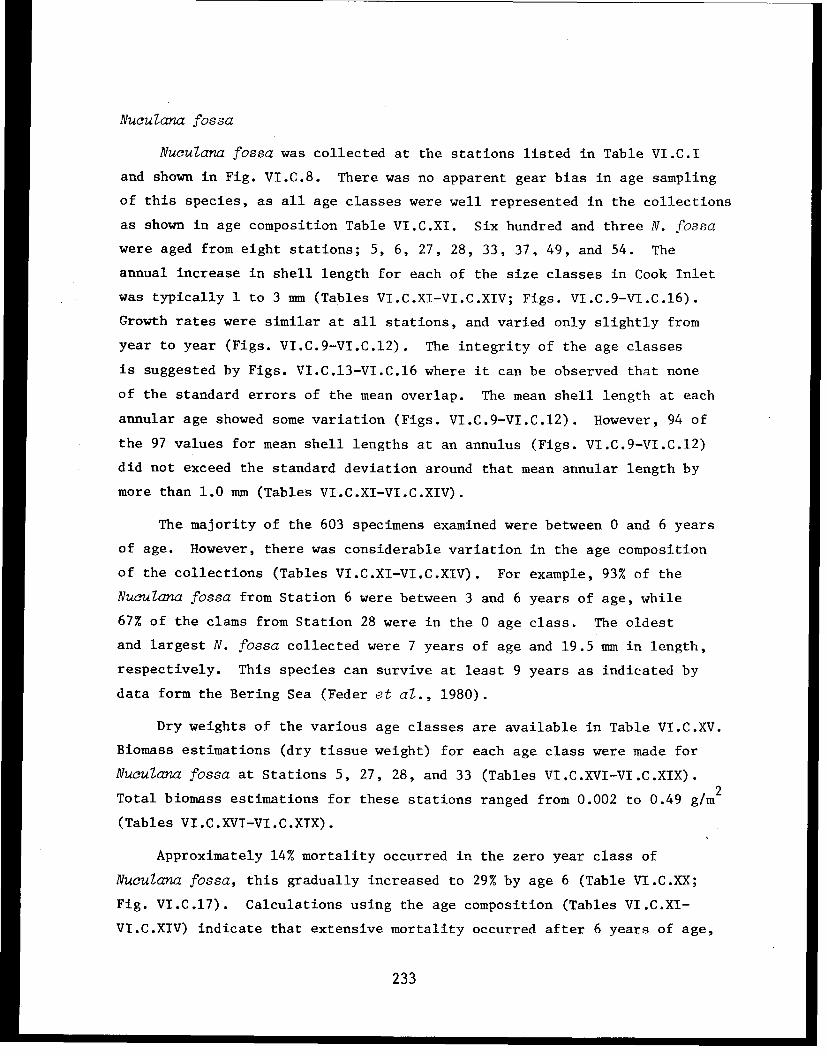
Nuculana fossa
Nuculana fossa was collected at the stations listed in Table VI.C.I
and shown in Fig. VI.C.8. There was no apparent gear bias in age sampling
of this species, as all age classes were well represented in the collections
as shown in age composition Table VI.C.XI. Six hundred and three N. fossa
were aged from eight stations; 5, 6, 27, 28, 33, 37, 49, and 54. The
annual increase in shell length for each of the size classes in Cook Inlet
was typically 1 to 3 mm (Tables VI.C.XI-VI.C.XIV; Figs. VI.C.9-VI.C.16).
Growth rates were similar at all stations, and varied only slightly from
year to year (Figs. VI.C.9-VI.C.12). The integrity of the age classes
is suggested by Figs. VI.C.13-VI.C.16 where it can be observed that none
of the standard errors of the mean overlap. The mean shell length at each
annular age showed some variation (Figs. VI.C.9-VI.C.12). However, 94 of
the 97 values for mean shell lengths at an annulus (Figs. VI.C.9-VI.C.12)
did not exceed the standard deviation around that mean annular length by
more than 1.0 mm (Tables VI.C.XI-VI.C.XIV).
The majority of the 603 specimens examined were between 0 and 6 years
of age. However, there was considerable variation in the age composition
of the collections (Tables VI.C.XI-VI.C.XIV). For example, 93% of the
Nuculana fossa from Station 6 were between 3 and 6 years of age, while
67% of the clams from Station 28 were in the 0 age class. The oldest
and largest N. fossa collected were 7 years of age and 19.5 mm in length,
respectively. This species can survive at least 9 years as indicated by
data form the Bering Sea (Feder et al., 1980).
Dry weights of the various age classes are available in Table VI.C.XV.
Biomass estimations (dry tissue weight) for each age class were made for
Nuculana fossa at Stations 5, 27, 28, and 33 (Tables VI.C.XVI-VI.C.XIX).
Total biomass estimations for these stations ranged from 0.002 to 0.49 g/m²
(Tables VI.C.XVI-VI.C.XIX).
Approximately 14% mortality occurred in the zero year class of
Nuculana fossa, this gradually increased to 29% by age 6 (Table VI.C.XX;
Fig. VI.C.17). Calculations using the age composition (Tables VI.C.XI-
VI.C.XIV) indicate that extensive mortality occurred after 6 years of age,
233

99% of the clams were between 0 and 6 years of age. The mortality curve
(Fig. VI.C.17) and age composition (Table VI.C.XI) of the N. fossa collec-
tion indicates that this species has years when recruitment is considerably
more successful than other years. The relatively high number of 5-year-old
clams compared to later year classes best illustrates this trend. Therefore,
the mortality calculations, which are based on the assumption that annual
recruitment is stable throughout a large area, for this species may be in-
accurate. Further collections are necessary to validate these calculations.
Nuculana fossa are preyed upon by large crabs, especially king crab (see
Section B). No comparable mortality data are available for this species
from other regions of the Gulf of Alaska. This bivalve undergoes similar
mortality in the Bering Sea as in Cook Inlet (Feder et al., 1980). In the
former area, 50% mortality occurred by age 6; Bering Sea king and snow crabs
also prey on N. fossa.
Similar growth, size at age (Tables VI.C.XI-VI.C.XIV; Figs. VI.C.13-
VI.C.16), and growth histories (Figs. VI.C.9-VI.C.12) were observed for
Nuculana fossa from each of the Cook Inlet stations examined. Data appear-
ing in Table VI.C.LXIV compares size at age from three studies; Neiman (1964),
Feder et al. (1980) and this report. Neiman (1964) reported mean shell
lengths of 1.3, 4.4, 6.8, 9.1, 12.4, and 16.1 mm for N. fossa (called Leda
pernula by the author; see Abbott, 1974) from the eastern Bering Sea for
age classes 0 through 5, respectively. Feder et al. (1980) reported mean
shell lenghths of 2.5, 4.0, 6.0, 8.6, 10.9, and 12.8 mm from the eastern
Bering Sea. These shell lengths compare with 2.1, 3.7, 6.7, 9.0, 10.9, and
12.9 mm for our Cook Inlet specimens; therefore, this clam appears to grow
slightly faster in the eastern Bering Sea (Table VI.C.LXIV).
234
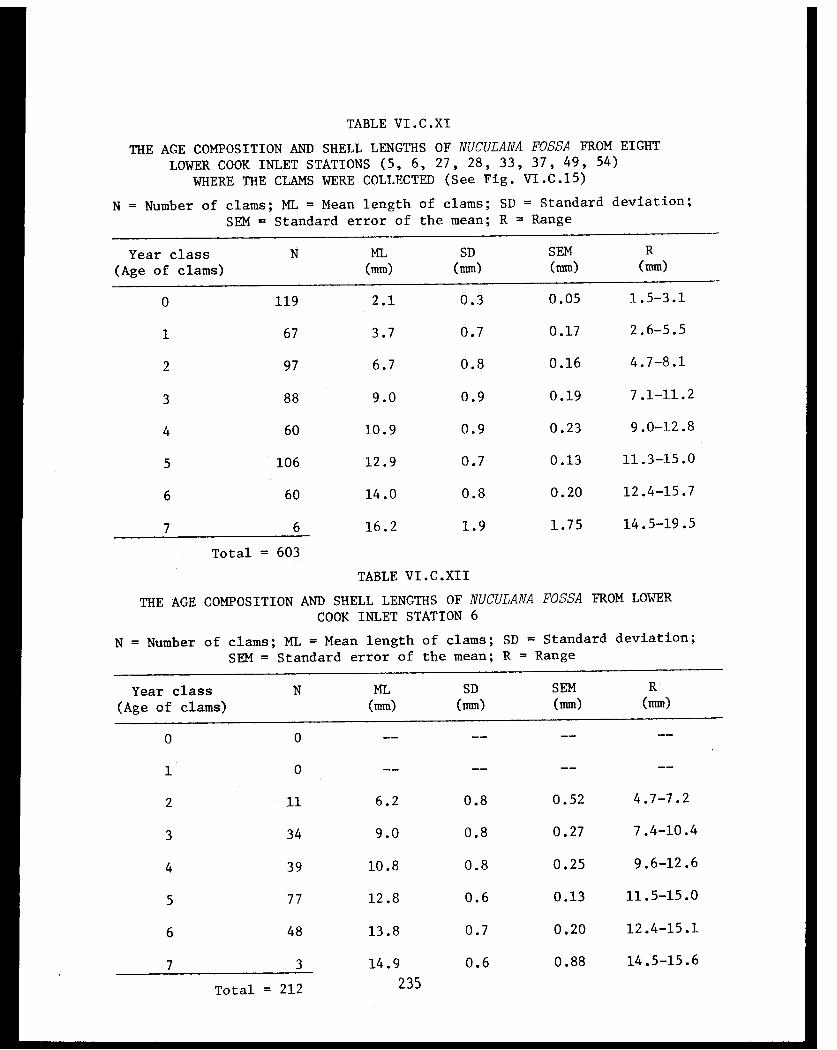
TABLE VI.C.XI
THE AGE COMPOSITION AND SHELL LENGTHS OF NUCULANA FOSSA FROM EIGHT
LOWER COOK INLET STATIONS (5, 6, 27, 28, 33, 37, 49, 54)
WHERE THE CLAMS WERE COLLECTED (See Fig. VI.C.15)
TABLE VI.C.XII
THE AGE COMPOSITION AND SHELL LENGTHS OF NUCULANA FOSSA FROM LOWER
COOK INLET STATION 6
235
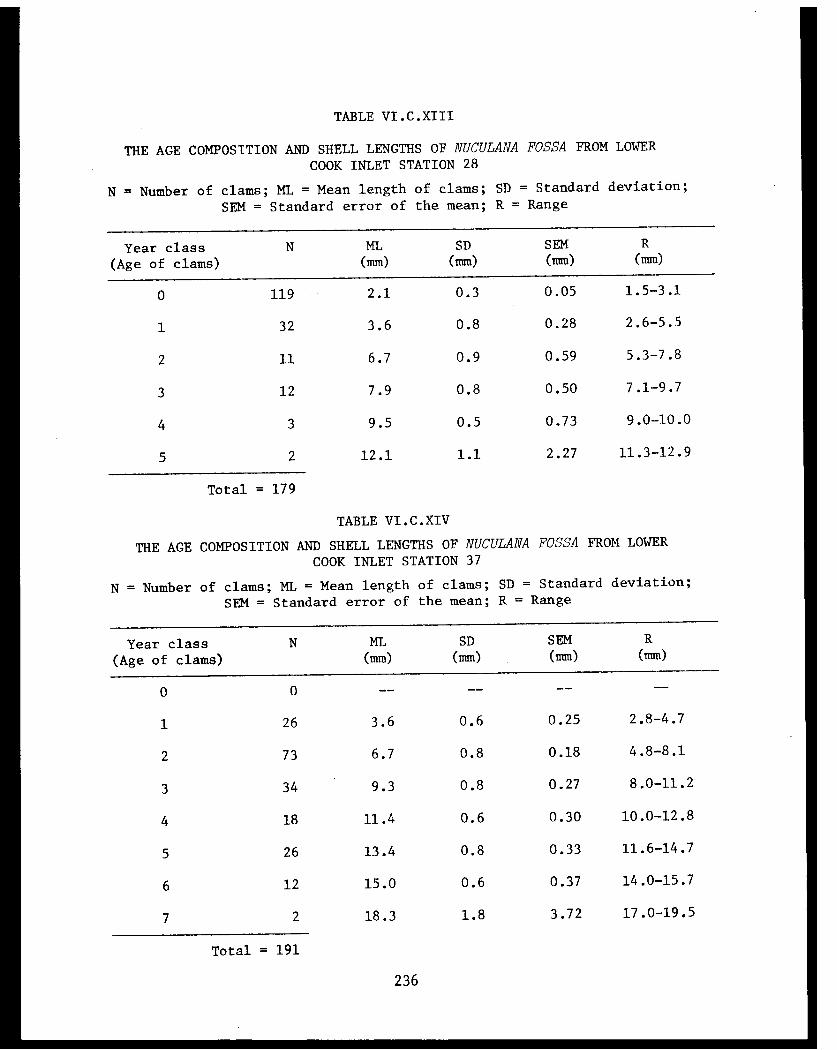
TABLE VI.C.XIII
THE AGE COMPOSITION AND SHELL LENGTHS OF NUCULANA FOSSA FROM LOWER
COOK INLET STATION 28
TABLE VI.C.XIV
THE AGE COMPOSITION AND SHELL LENGTHS OF NUCULANA FOSSA FROM LOWER
COOK INLET STATION 37
236
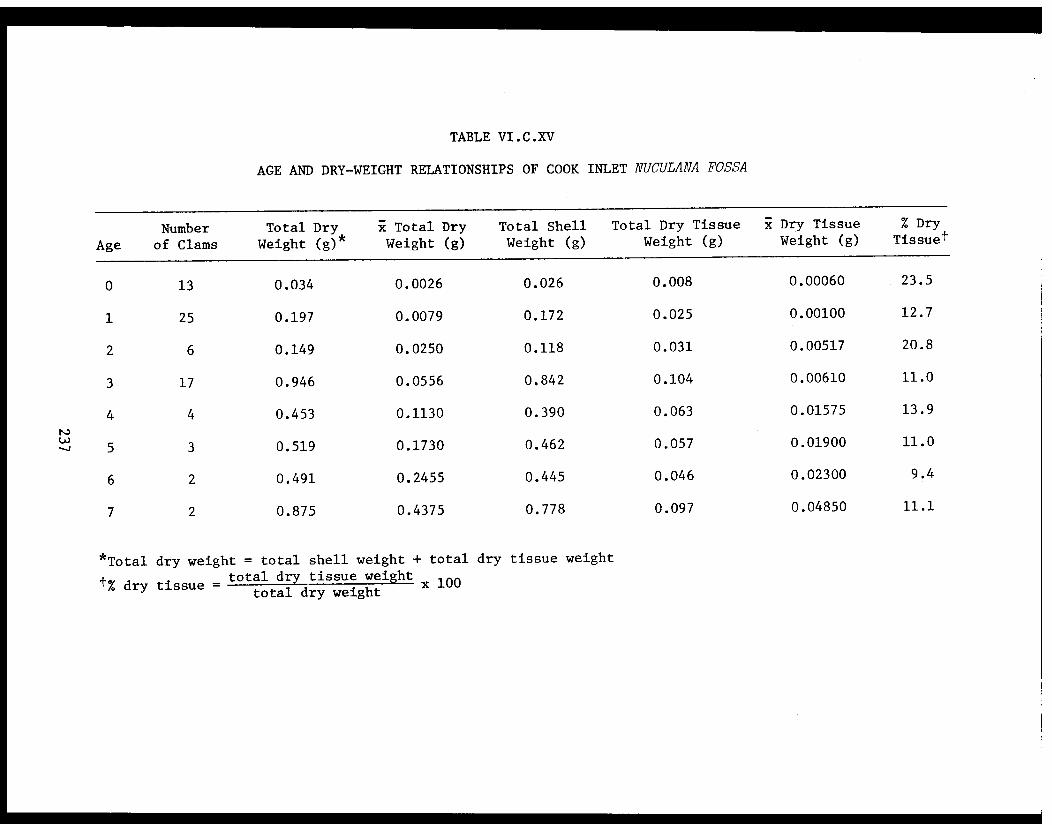
TABLE VI.C.XV
AGE AND DRY-WEIGHT RELATIONSHIPS OF COOK INLET NUCULANA FOSSA
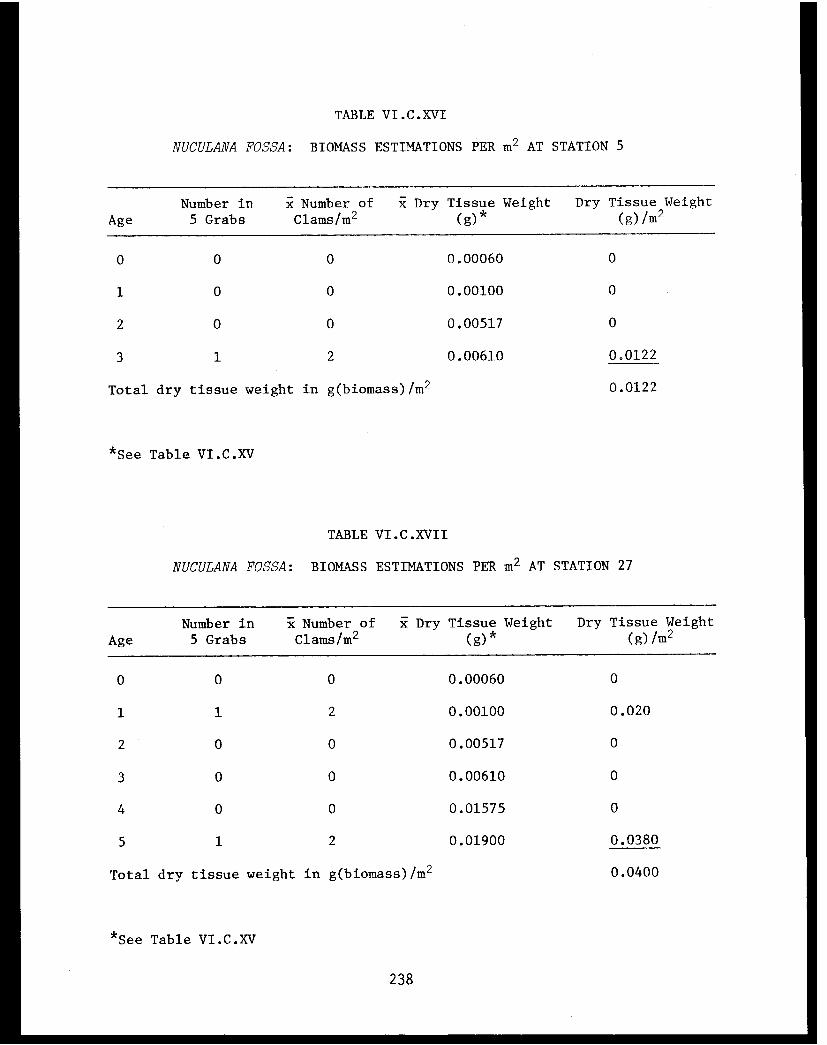
TABLE VI.C.XVI
NUCULANA FOSSA: BIOMASS ESTIMATIONS PER m2 AT STATION 5
TABLE VI.C.XVII
NUCULANA FOSSA: BIOMASS ESTIMATIONS PER m 2 AT STATION 27
238
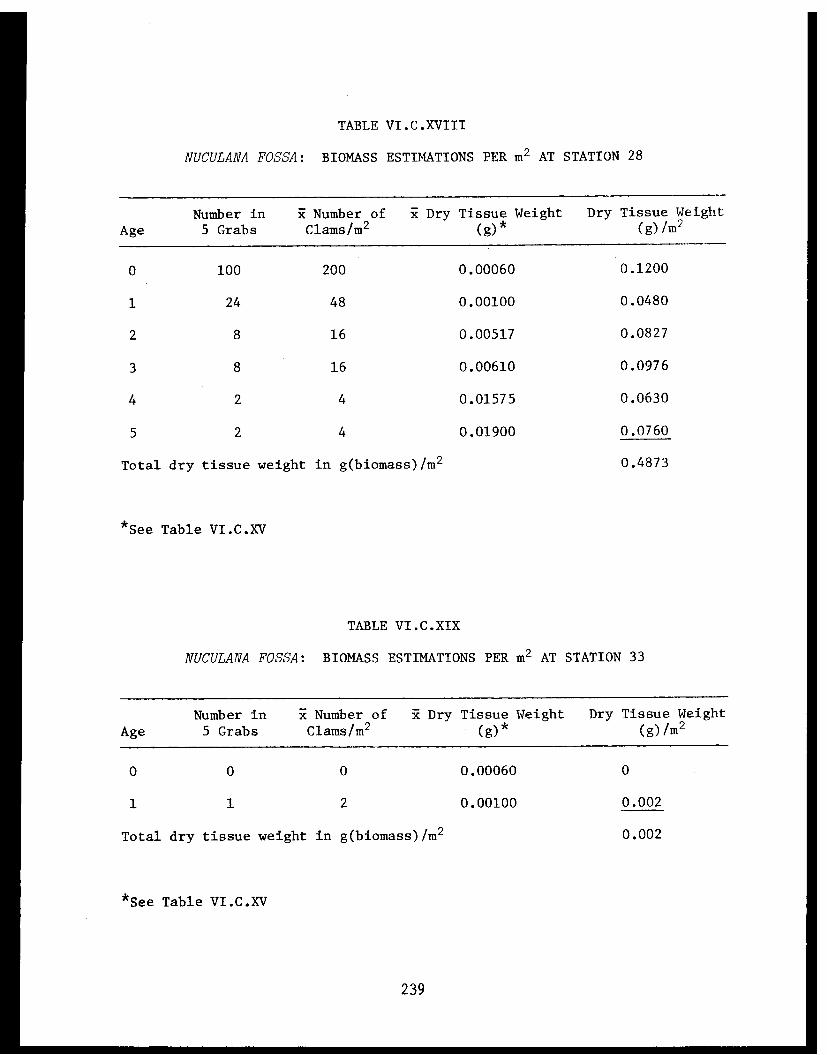
TABLE VI.C.XVIII
NUCULANA FOSSA: BIOMASS ESTIMATIONS PER m2 AT STATION 28
TABLE VI.C.XIX
NUCULANA FOSSA: BIOMASS ESTIMATIONS PER m2 AT STATION 33
239
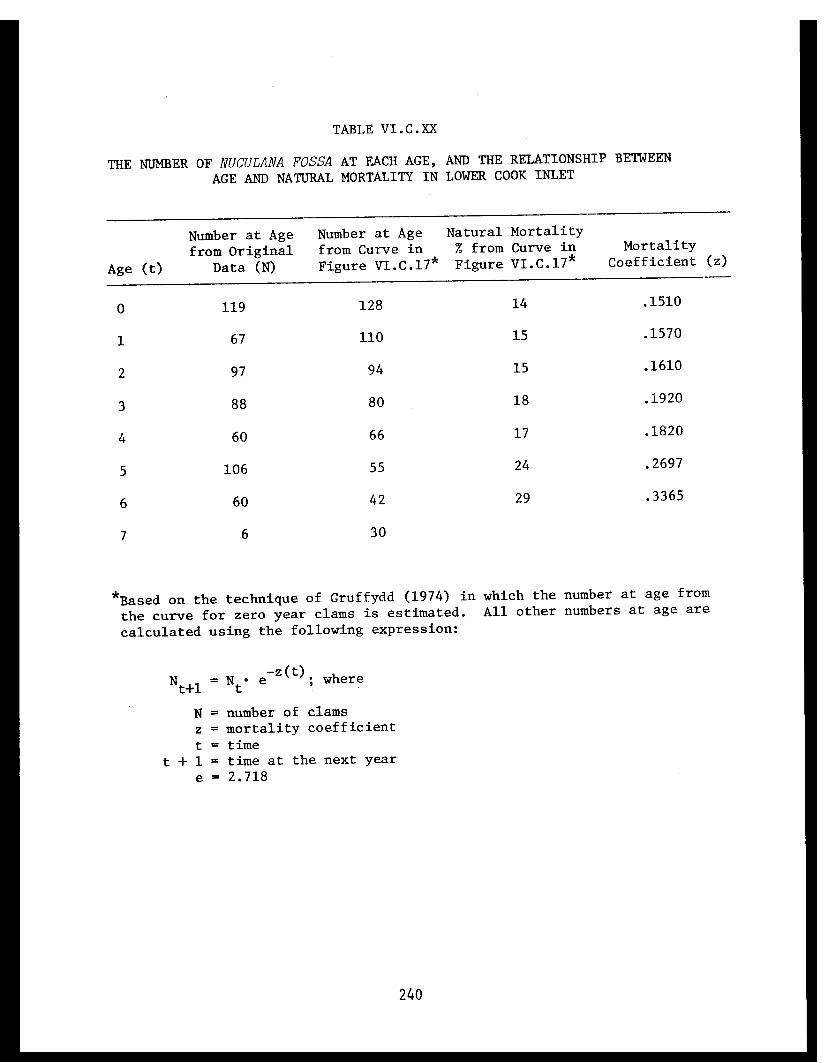
TABLE VI.C.XX
THE NUMBER OF NUCULANA FOSSA AT EACH AGE, AND THE RELATIONSHIP BETWEEN
AGE AND NATURAL MORTALITY IN LOWER COOK INLET
240
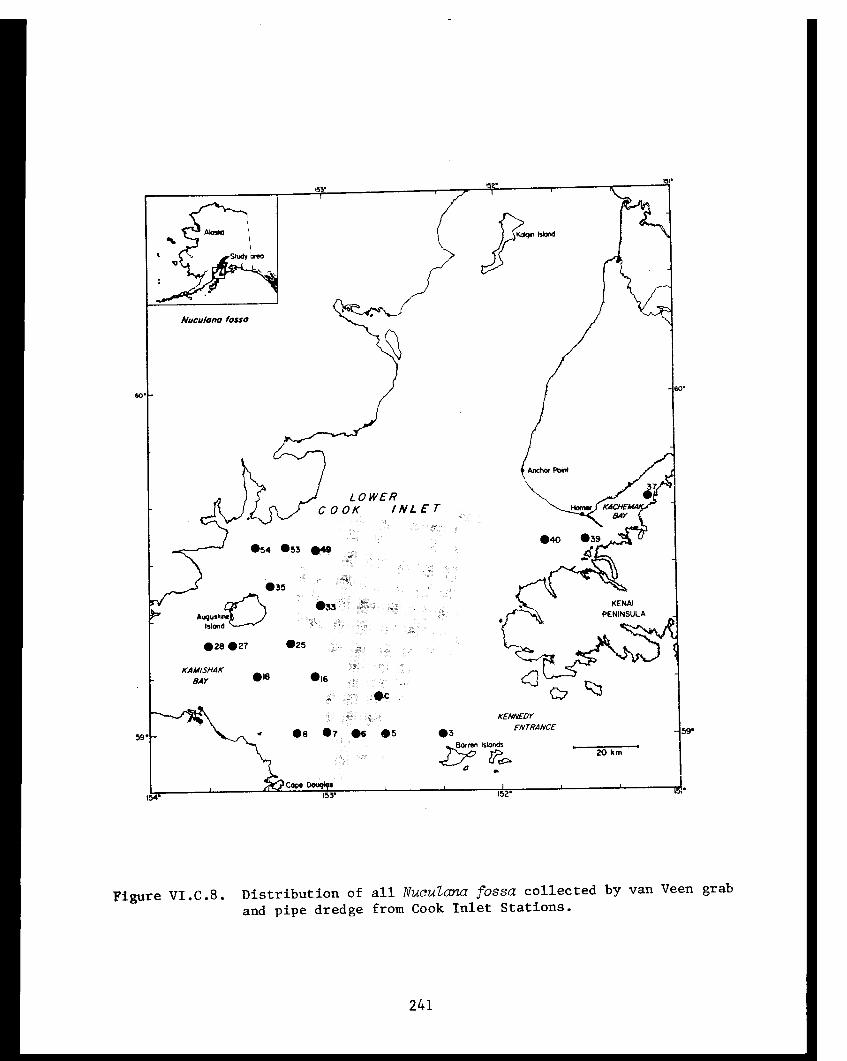
Figure VI.C.8. Distribution of all Nuculana fossa collected by van Veen grab
and pipe dredge from Cook Inlet Stations.
241
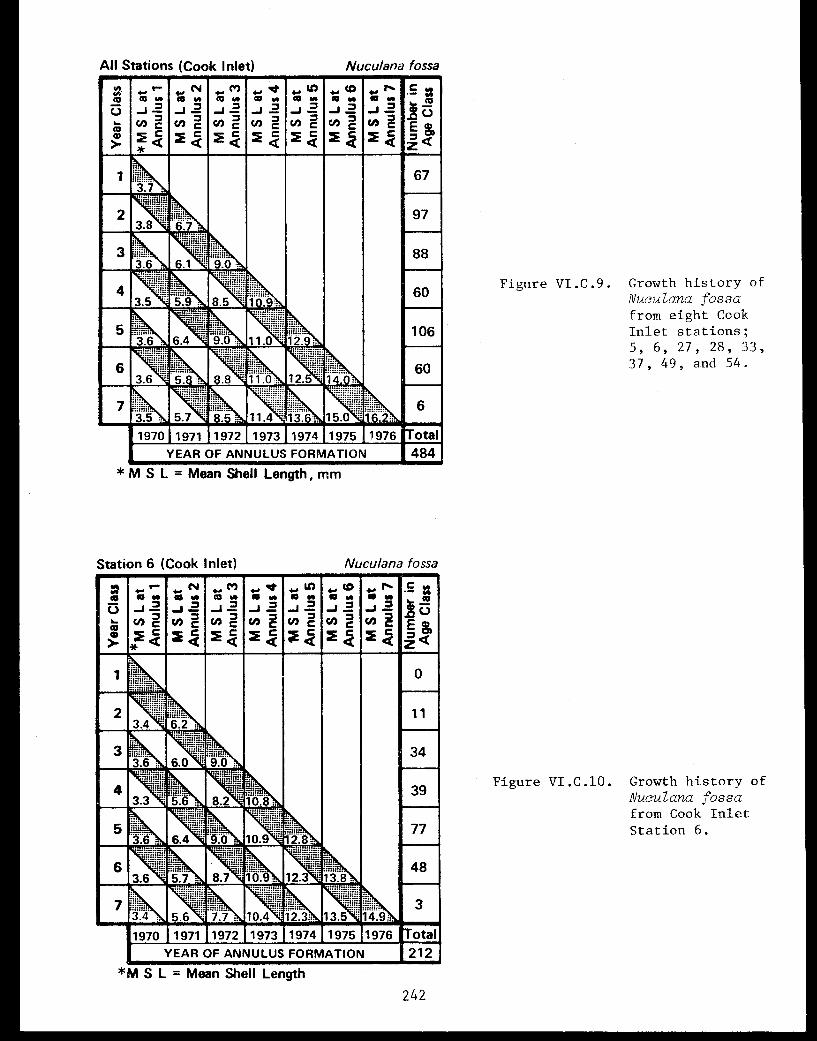
Figure VI.C.9. Growth history ofNuculana fossafrom eight CookInlet stations;5, 6, 27, 28, 33,37, 49, and 54.
Figure VI.C.10. Growth history ofNuculana fossafrom Cook InletStation 6.
242
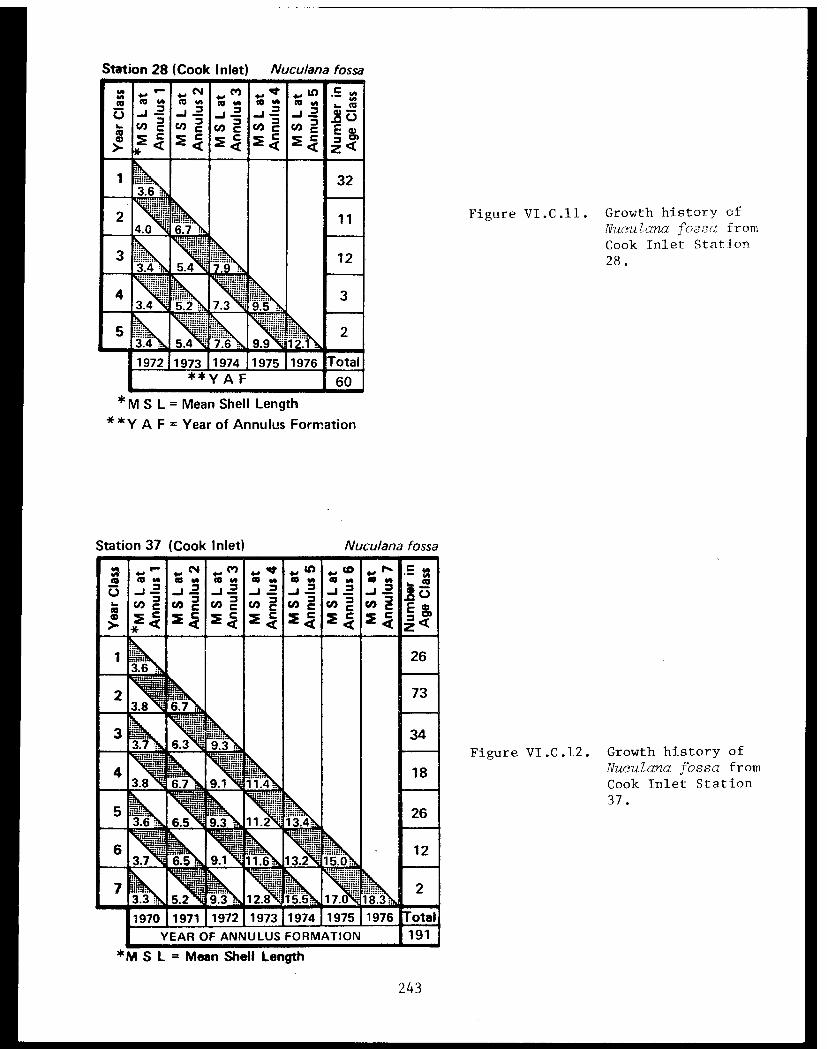
Figure VI.C.11. Growth history ofNuculana fossa fromCook Inlet Station28.
Figure VI.C.12. Growth history ofNuculana fossa fromCook Inlet Station37.
243

Figure VI.C.13. Growth curve for Nuculana fossa from Figure VI.C.14. Growth curve for Nuculana fossa fromeight Cook Inlet Stations; 5, 6, 27, 28, 33, 37, Cook Inlet Station 6. Mean length is denoted49 and 54. Mean length is denoted by the hori- by the horizontal line, standard deviation byzontal line, standard deviation by the white the white box, standard error of the mean bybox, standard error of the mean by the black the black box, and range by the vertical line.box, and range by the vertical line.
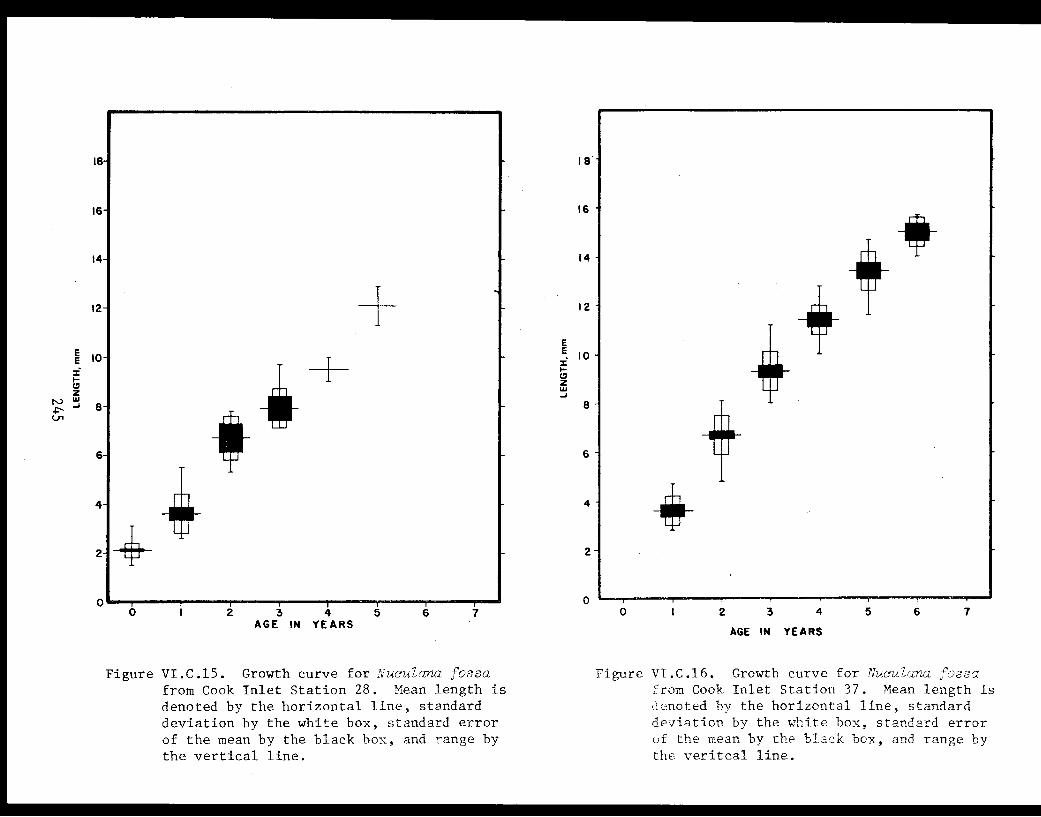
Figure VI.C.15. Growth curve for Nuculana fossa Figure VT.C.16. Growth curve for Nuculana fossafrom Cook Inlet Station 28. Mean length is from Cook Inlet Station 37. Mean length isdenoted by the horizontal line, standard denoted by the horizontal line, standarddeviation by the white box, standard error deviation by the white box, standard errorof the mean by the black box, and range by of the mean by the black box, and range bythe vertical line. the veritcal line.
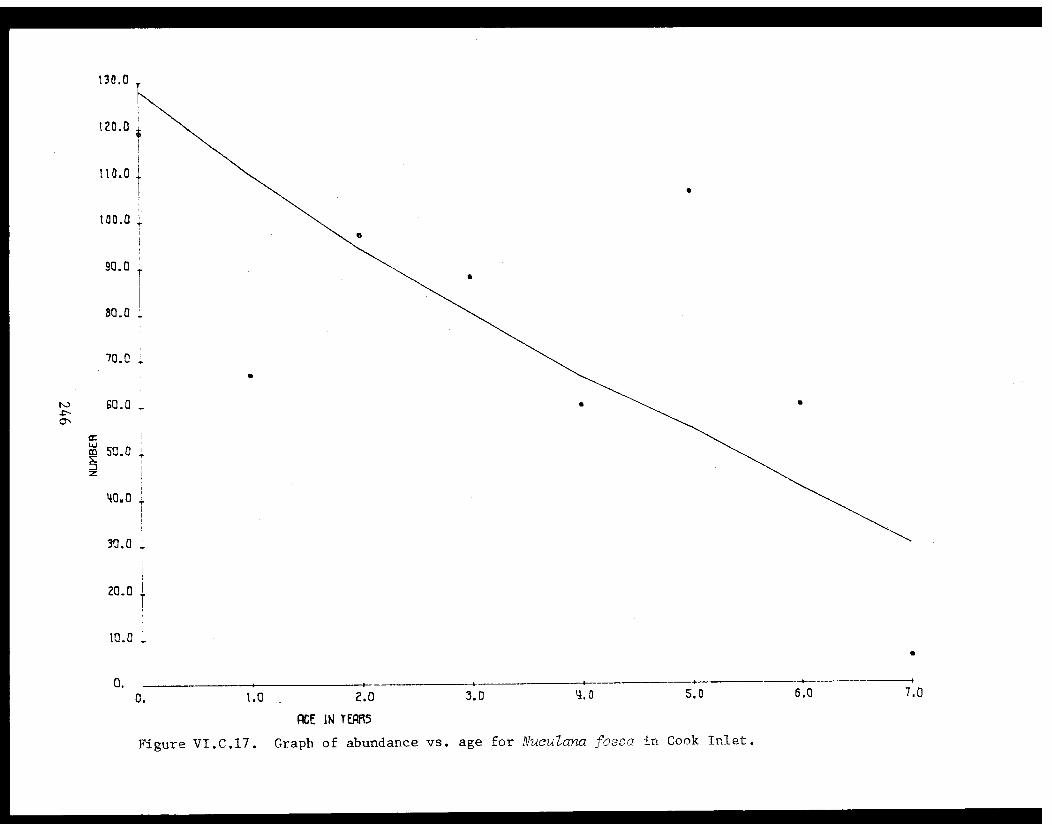
Figure VI.C.17. Graph of abundance vs. age for Nuculana fossa in Cook Inlet.

Glycymeris subobsoleta
Glycymeris subobsoleta was collected at the stations listed in Table
VI.C.I and shown in Fig. VI.C.18. There was no apparent gear bias in age
sampling of this species, as the age classes were well represented in the
collections as shown in age composition Table VI.C.XXI. Eight hundred
and seventy-eight G. subobsoleta were aged from ten stations; M, UW2, 28,
29, 30, 40A, 42, 44, 45, and 63. The annual increase in shell length for
each of the size classes in Cook Inlet was typically 1 to 3 mm (Tables
VI.C.XXI-VI.C.XXVII; Figs. VI.C.19-VI.C.28). Growth rates were similar
for all stations, and varied only slightly from year to year (Figs. VI.C.19-
VI.C.25). The integrity of the age classes is suggested by Figs. VI.C.26
to VI.C.28 where it can be observed that none of the standard errors of
the mean overlap. The mean shell length at each annular age showed some
variation (Figs. VI.C.19-VI.C.25). However, 235 of the 239 values for mean
shell lengths at an annulus (Figs. VI.C.19-VI.C.25) did not exceed the
standard deviation around that mean annular length by more than 1 mm (Tables
VI.C.XXI-VI.C.XXVII).
The majority of the specimens examined were between 0 and 4 years of
age. However, there was considerable variation in the age composition of
the collections (Tables VI.C.XXI-VI.C.XXVII). For example, 99% of the
Glycymeris subobsoleta from Station 28 were between 0 and 1 year of age,
while 78% of the clams from Station 42 were 3 to 5 years of age. The
oldest and largest G. subobsoleta collected were 11 years of age and 27.0 mm
in length, respectively.
Dry weights of the various age classes are available in Table
VI.C.XXVIII. Biomass estimations (dry tissue weight) for each age class
were made for Glycymeris subobsoleta at three stations; 28, 42, and 63
(Tables VI.C.XXIX-VI.C.XXXI). Total biomass estimations for these sta-
tions ranged from 0.22 to 0.81 g/m[superscript]2 (Tables VI.C.XXIX-VI.C.XXXI).
Approximately 20% mortality occurred in the second year class of
Glycymeris subobsoleta, this gradually increased to 50% by age 10 (Table
VI.C.XXXII; Fig. VI.C.29). Calculations using the age composition Tables
VI.C.XXI to VI.C.XXVII indicate that extensive mortality occurred after
247
age 4, 92% of the clams were between 0 and 4 years of age. This species is
not heavily preyed upon by the large crabs and shrimps of the area as seen
in the low frequency of occurrence with which G. subobsoleta was found in
the stomachs of the common crustacean predators (see Section B). No com-
parable mortality data are available for the species from other regions of
the Gulf of Alaska.
248

TABLE VI.C.XXI
THE AGE COMPOSITION AND SHELL LENGTHS OF CLYCYMERIS SUBOBSOLETA FROM LOWERCOOK INLET, THE TEN STATIONS (M, UW2, 28, 29, 30, 40A, 42, 44, 45 and 63)
WHERE THE CLAMS WERE COLLECTED (Fig. 16).
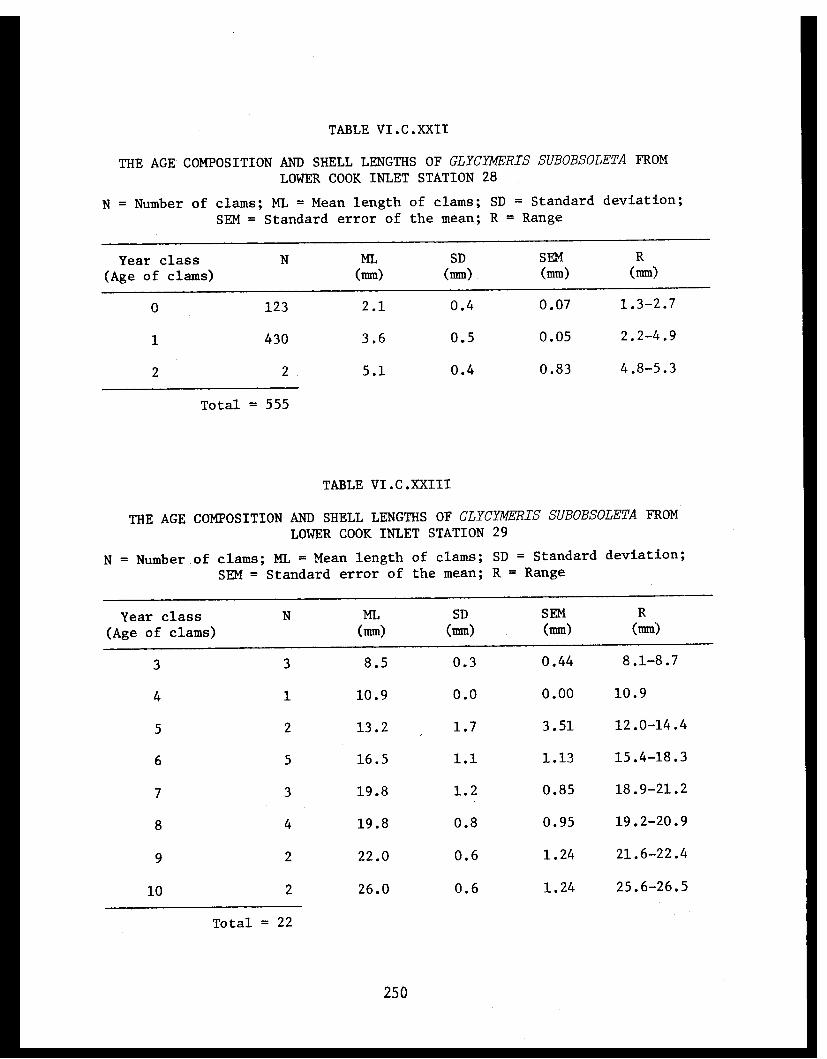
TABLE VI.C.XXII
THE AGE COMPOSITION AND SHELL LENGTHS OF GLYCYMERIS SUBOBSOLETA FROM
LOWER COOK INLET STATION 28
TABLE VI.C.XXIII
THE AGE COMPOSITION AND SHELL LENGTHS OF GLYCYMERIS SUBOBSOLETA FROM
LOWER COOK INLET STATION 29
250

TABLE VI.C.XXIV
THE AGE COMPOSITION AND SHELL LENGTHS OF GLYCYMERIS SUBOBSOLETA FROM
LOWER COOK INLET STATION 30
TABLE VI.C.XXV
THE AGE COMPOSITION AND SHELL LENGTHS OF GLYCYMERIS SUBOBSOLETA FROM
LOWER COOK INLET STATION 40A
251

TABLE VI.C.XXVI
THE AGE COMPOSITION AND SHELL LENGTHS OF GLYCYMERIS SUBOBSOLETA FROM
LOWER COOK INLET STATION 42
252
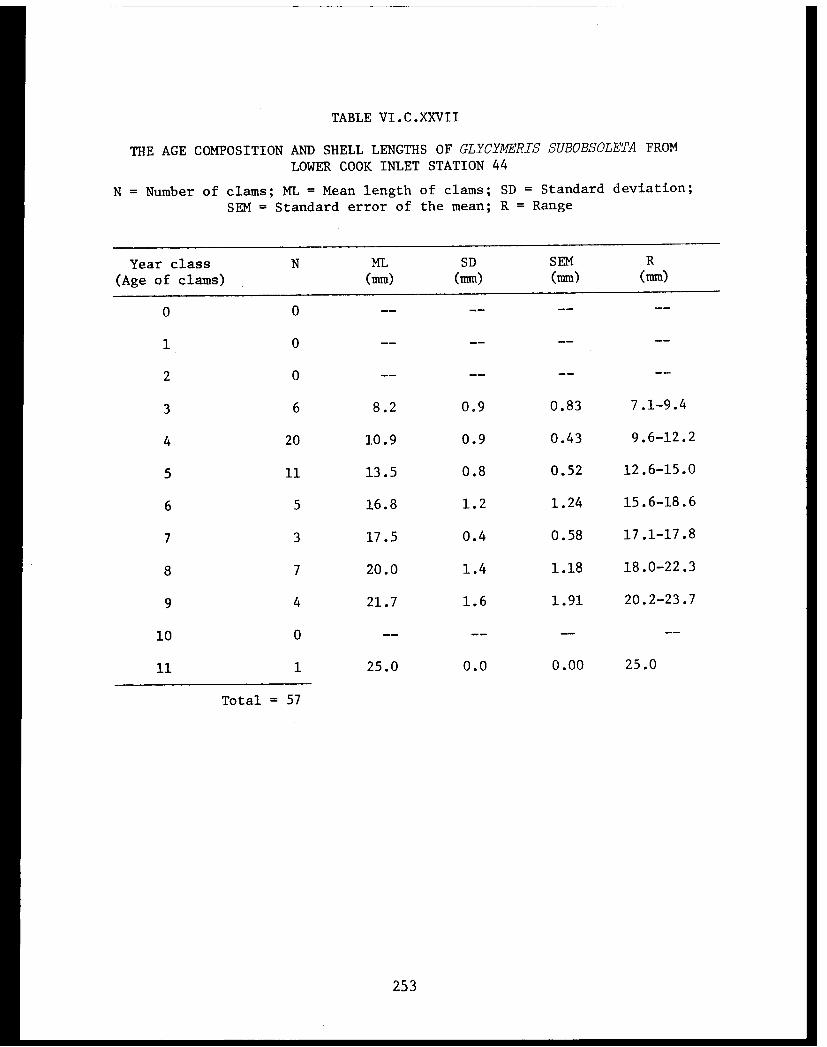
TABLE VI.C.XXVII
THE AGE COMPOSITION AND SHELL LENGTHS OF GLYCYMERIS SUBOBSOLETA FROM
LOWER COOK INLET STATION 44
253
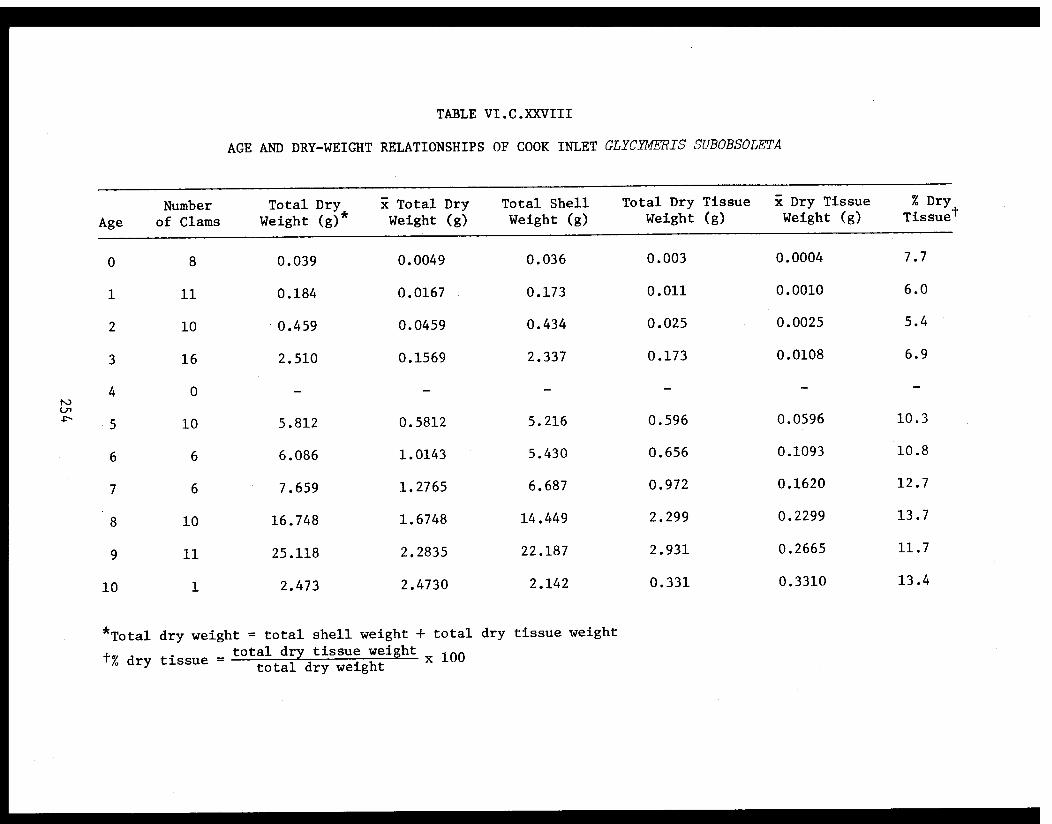
TABLE VI.C.XXVIII
AGE AND DRY-WEIGHT RELATIONSHIPS OF COOK INLET GLYCYMERIS SUBOBSOLETA

TABLE VI.C.XXIX
GLYCYMERIS SUBOBSOLETA: BIOMASS ESTIMATIONS PER m² AT STATION 28
255
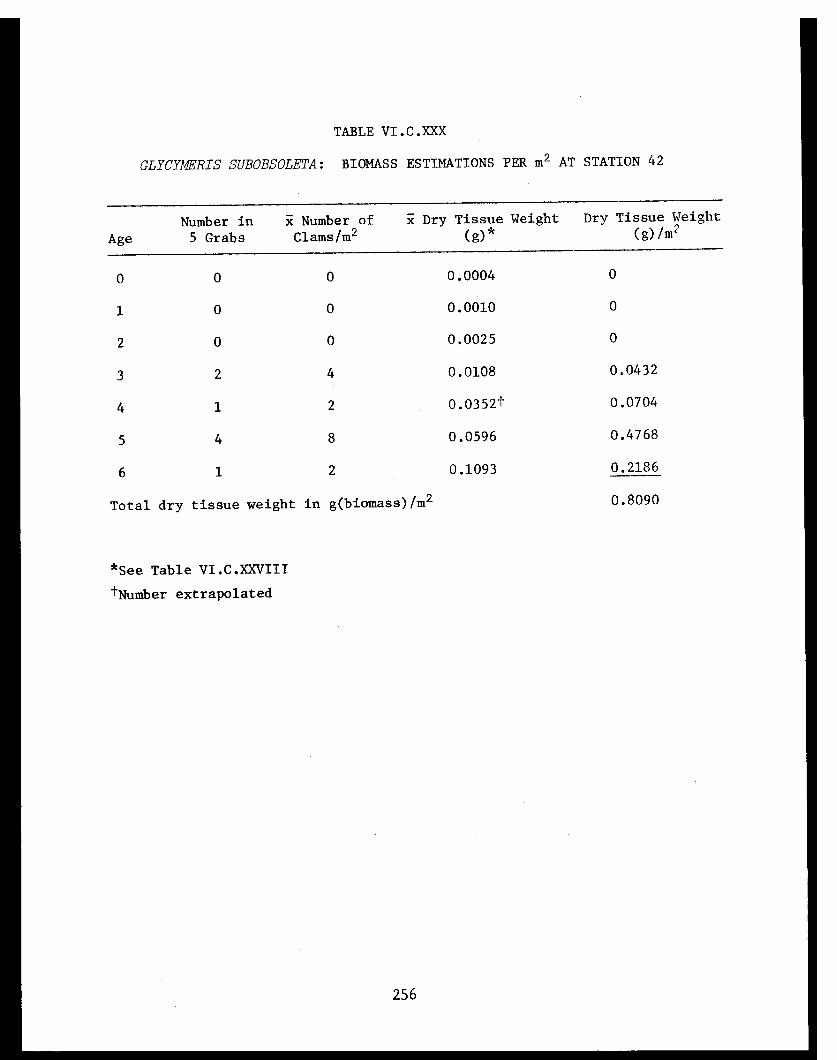
TABLE VI.C.XXX
GLYCYMERIS SUBOBSOLETA: BIOMASS ESTIMATIONS PER m² AT STATION 42
256
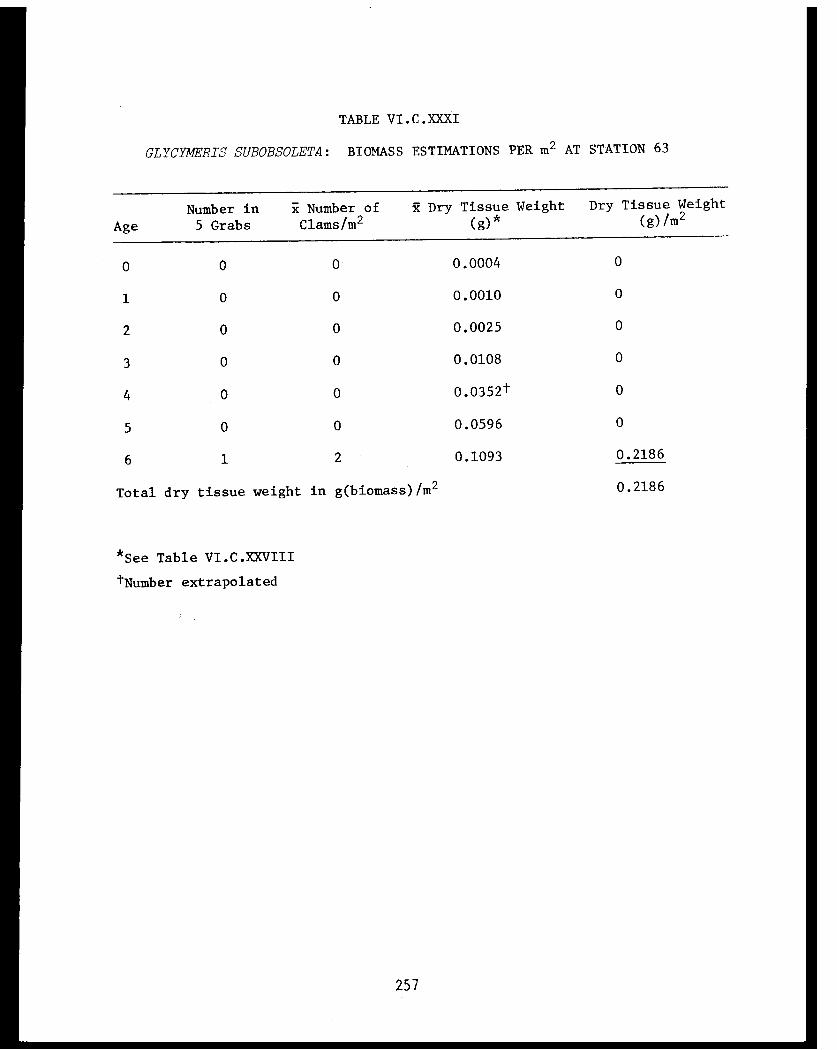
TABLE VI.C.XXXI
GLYCYMERIS SUBOBSOLETA: BIOMASS ESTIMATIONS PER m² AT STATION 63
257
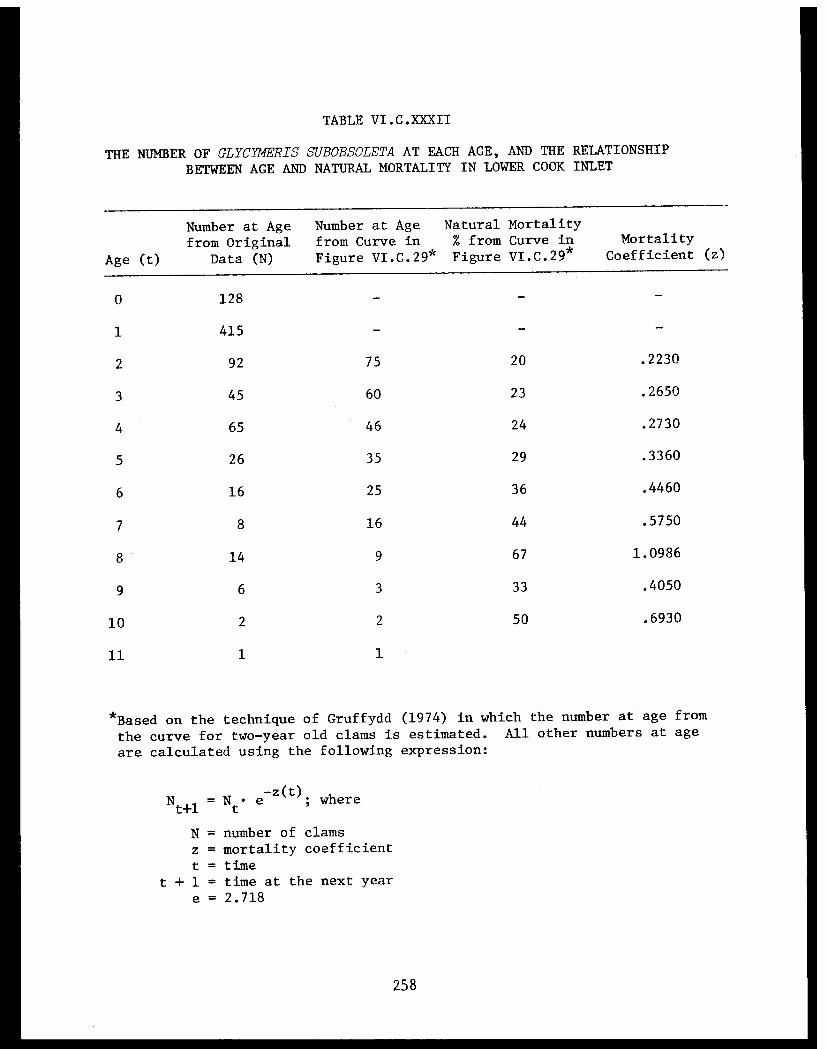
TABLE VI.C.XXXII
THE NUMBER OF GLYCYMERIS SUBOBSOLETA AT EACH AGE, AND THE RELATIONSHIP
BETWEEN AGE AND NATURAL MORTALITY IN LOWER COOK INLET
258
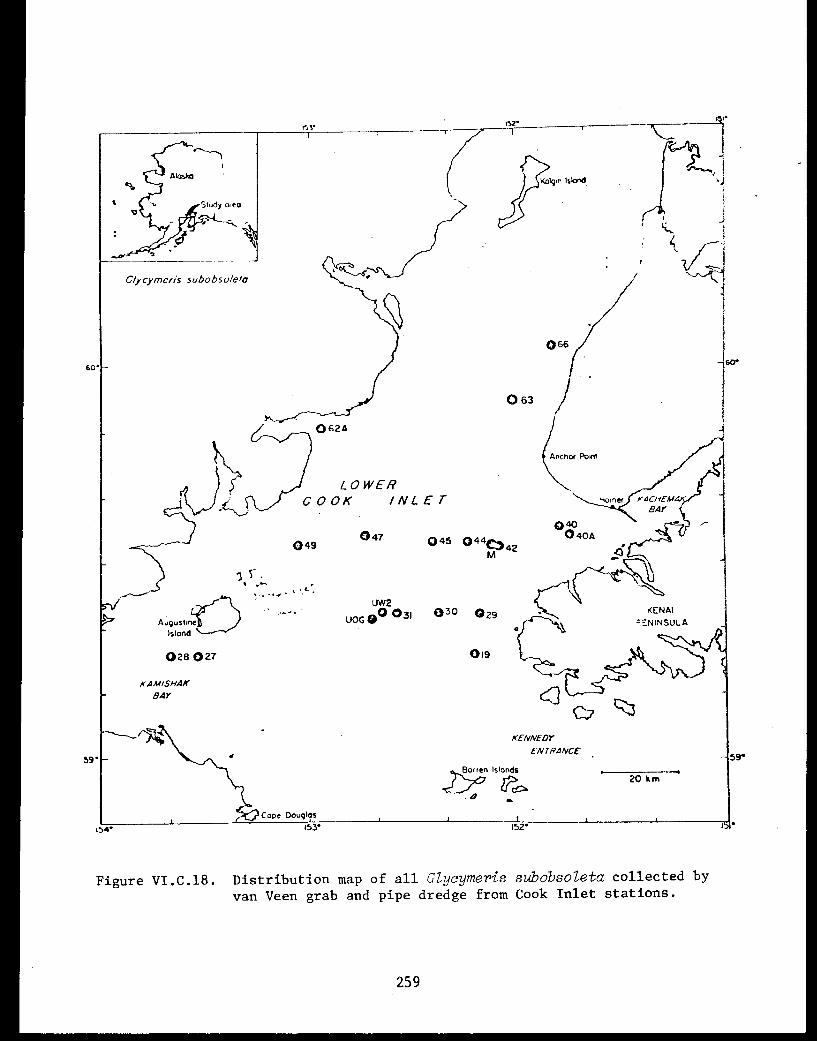
Figure VI.C.18. Distribution map of all Glycymeris subobsoleta collected by
van Veen grab and pipe dredge from Cook Inlet stations.
259
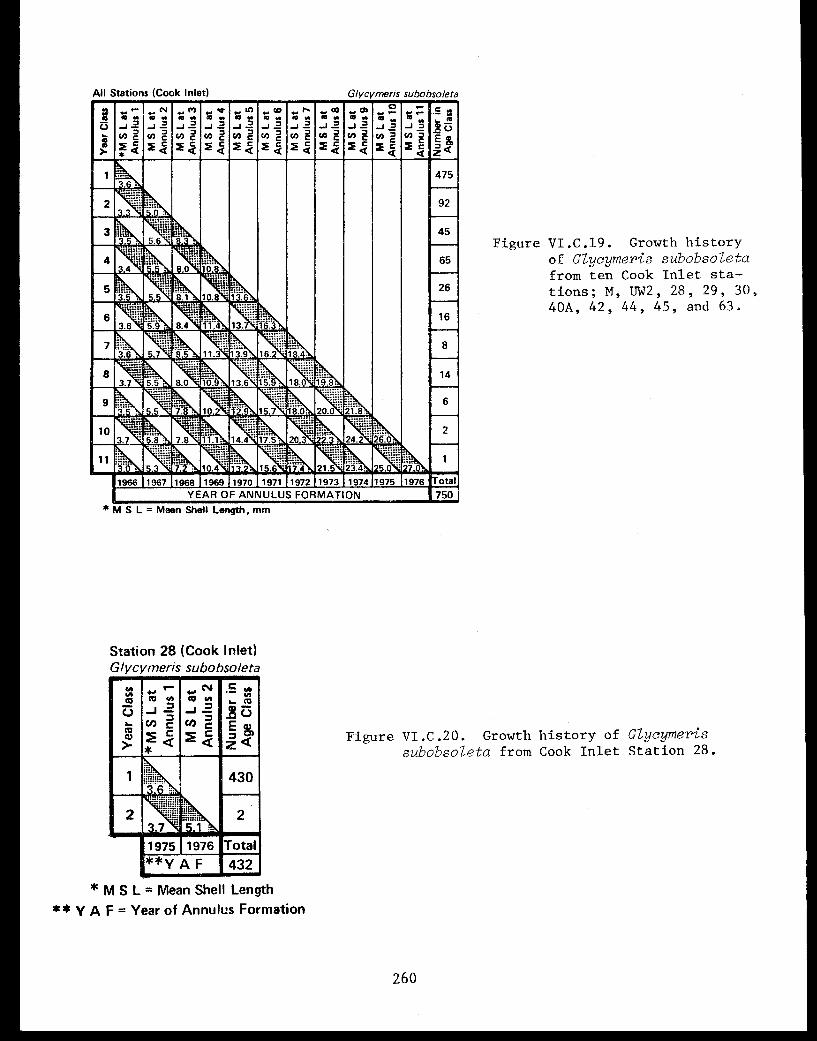
Figure VI.C.19. Growth history
of Glycymeris subobsoletafrom ten Cook Inlet sta-tions; M, UW2, 28, 29, 30,40A, 42, 44, 45, and 63.
Figure VI.C.20. Growth history of Glycymeris
subobsoleta from Cook Inlet Station 28.
260
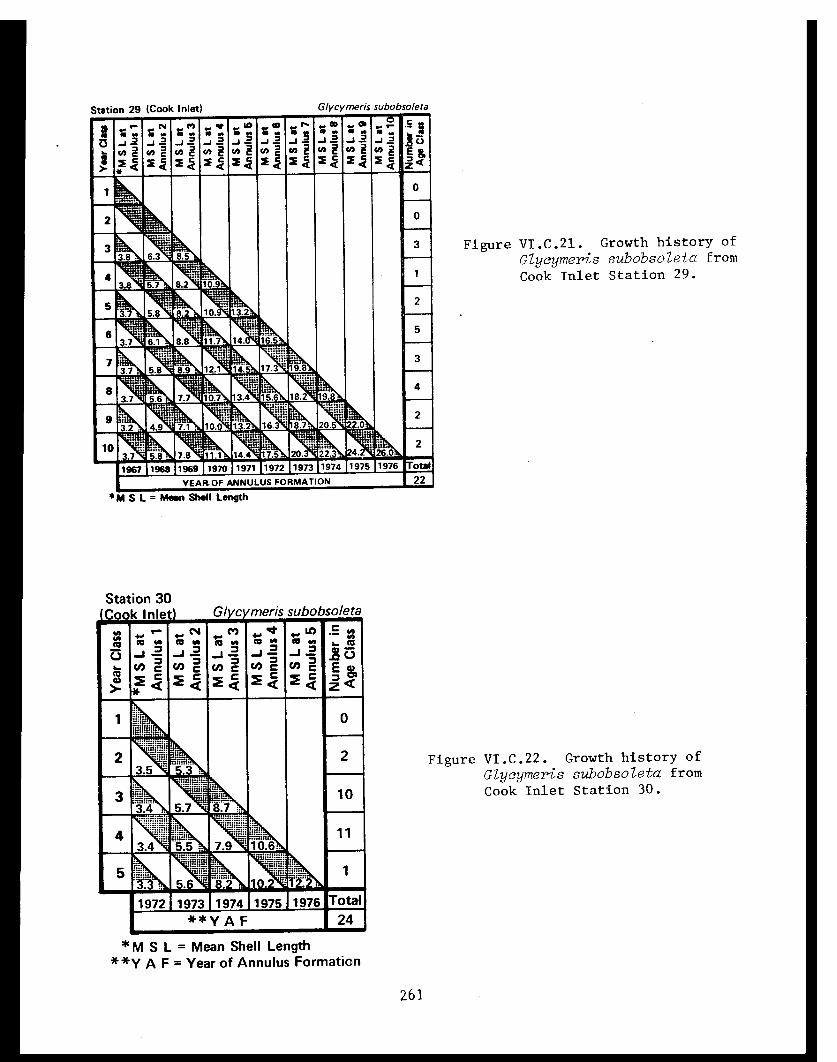
Figure VI.C.21. Growth history of
Glycymeris subobsoZeta from
Cook Inlet Station 29.
Figure VI.C.22. Growth history of
Glycymeris subobsoleta from
Cook Inlet Station 30.
261

Figure VI.C.23. Growth history Figure VI.C.24. Growth history of
of Glycymeris subobsoleta Glycymeris subobsoleta from
from Cook Inlet Station 40A. Cook Inlet Station 42.
Figure VI.C.25. Growth history
of Glycymeris subobsoletafrom Cook Inlet Station44.
262
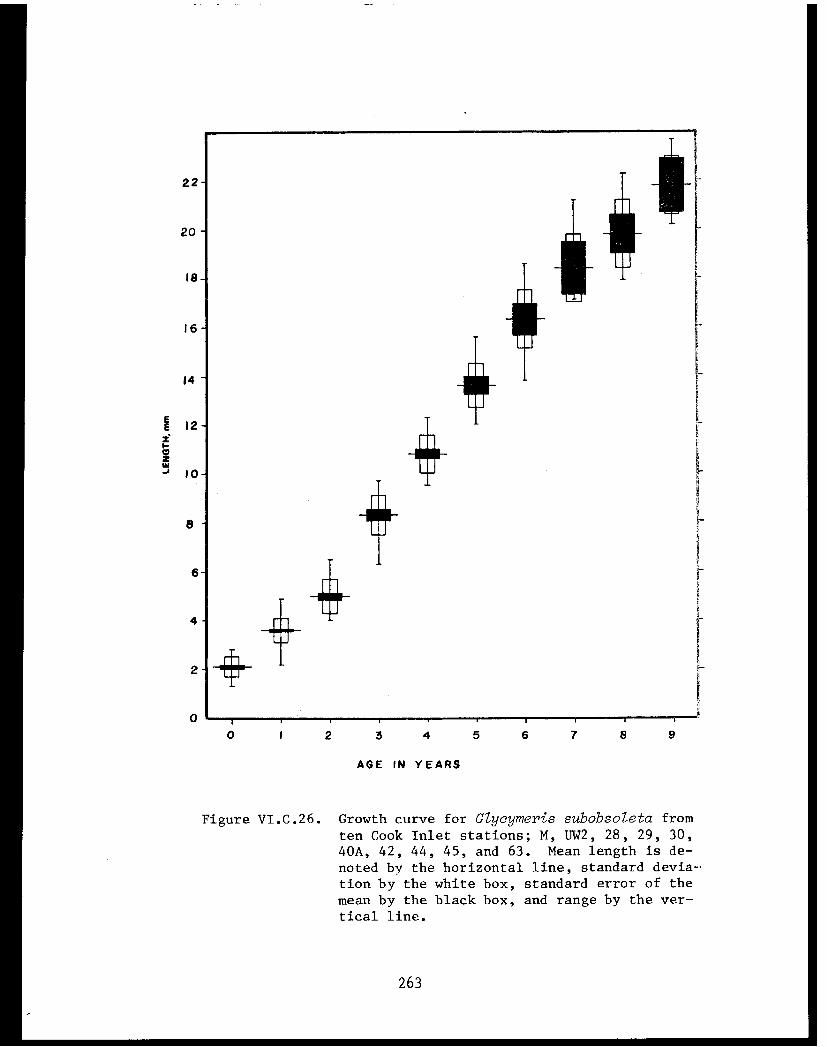
Figure VI.C.26. Growth curve for Glycymeris subobsoleta from
ten Cook Inlet stations; M, UW2, 28, 29, 30,40A, 42, 44, 45, and 63. Mean length is de-
noted by the horizontal line, standard devia-tion by the white box, standard error of the
mean by the black box, and range by the ver-tical line.
263

Figure VT.C.27. Growth curve for Glycymeris subobsoleta from
Cook Inlet Station 28. Mean length is denotedby the horizontal line, standard deviation bythe white box, standard error of the mean bythe black box, and range by the vertical line.
264

Figure VI.C.28. Growth curve for Glycymeris subobsoleta from
Cook Inlet Station 40A. Mean length is denoted
by the horizontal line, standard deviation by
the white box, standard error of the mean by
the black box, and range by the vertical line.
265
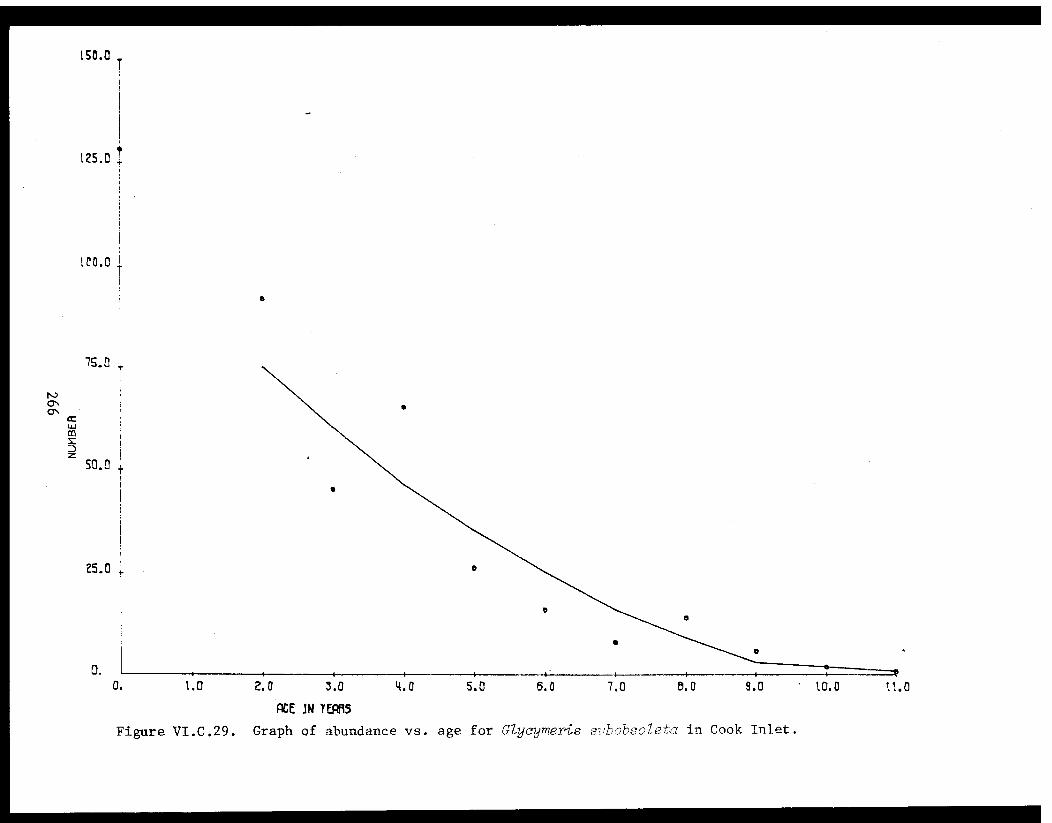
Figure VI.C.29. Graph of abundance vs. age for Glycymeris subobsoleta in Cook Inlet.
Spisula polynyma
Spisula polynyma was collected at the stations listed in Table
VI.C.I and shown in Fig. VI.C.30 (excluding DG stations). Of the specimens
over 30 mm in length, five were fresh-frozen specimens provided by the
Alaska Department of Fish and Game and 74 were empty shells collected by
anchor dredge. The sampling gear used in the present survey did not
adequately sample all size classes of S. polynyma. Therefore, observa-
tions on the biology of this clam were restricted to age and growth. Five
hundred and fifty-six S. polynyma were aged from seven stations; 40A, 41,
42, DG 1, DG 2, DG 3, and DG 4. The annual increase in shell length for
various size classes in Cook Inlet was typically 5 to 9 mm (Tables
VI.C.XXXIII-VI.C.XXXVI; Figs. VI.C.31-VI.C.38). Growth was similar at all
stations, and varied only slightly from year to year for age groups 0 to 4
(Figs. VI.C.31-VI.C.34). The integrity of the age classes is suggested by
Figs. VI.C.35 to VI.C.38 where it can be observed that none of the standard
errors of the mean overlap. The growth histories for the mean shell lengths
at annuli 1 through 3 (Figs. VI.C.31-VI.C.34) were similar, only 11 out of
126 mean annular lengths exceeded the standard deviations included in
Tables VI.C.XXXIII to VI.C.XXXVI by more than 1 mm. However, 68% of the
mean shell lengths for annulus 4 (Figs. VI.C.31-VI.C.34) exceeded the
standard deviations by more than 1 mm. No live S. polynyma older than 4
years of age occurred in the samples.
The majority of the 556 specimens examined were between 1 and 4 years
of age. Beyond 4 years of age, sample sizes were small and comparisons
could not be made. The oldest clams were 16 years of age at a variety of
sizes; the largest clam examined was 128 mm in length and 13 years of age.
A similar maximum size, 127 mm at 16 years of age, is reported for S.
polynyma in the southeastern Bering Sea (Feder et al., 1978). This clam
grows somewhat larger, 152 mm at 16 years of age, in Prince William Sound,
Alaska (Feder et al., 1976).
Dry weights of the various age classes collected by the van Veen grab
are available in Table VI.C.XXXVII.
267
Similar growth, size at age (Tables VI.C.XXXIII-VI.C.XXXVI; Figs.
VI.C.35-VI.C.38) and growth histories (Figs. VI.C.31-VI.C.34) were observed
for Spisula polynyma from each of the Cook Inlet stations examined. Data
appearing in Table VI.C.LXIV compares size at age from three studies: Feder
et al. (1976), Feder et al. (1978), and this report. Feder et al. (1976)
reported mean shell lengths of 8, 13, 22, 32, 43, 57, 66, 77, 88, 98,
108, 115, 122, 127, 133, and 139 mm in length for S. polynyma from Prince
William Sound for age classes 1 to 16, respectively. Feder et al. (1978)
reported mean shell lengths of 12, 28, 35, 48, 57, 69, 78, 85, 94, 101,
108, 114, 121, 123, and 127 mm from the eastern Bering Sea for age classes
2 to 16. These shell lengths compare with 10, 15, 21, 26, 38, 43, no data,
82, 80, 92, 98, 107, 112, 114, 120, and 118 mm in mean shell lengths for
our Cook Inlet specimens for age classes 1 to 16; therefore, this clam
appears to grow sightly faster in Prince William Sound (Table VI.C.LXIV).
268
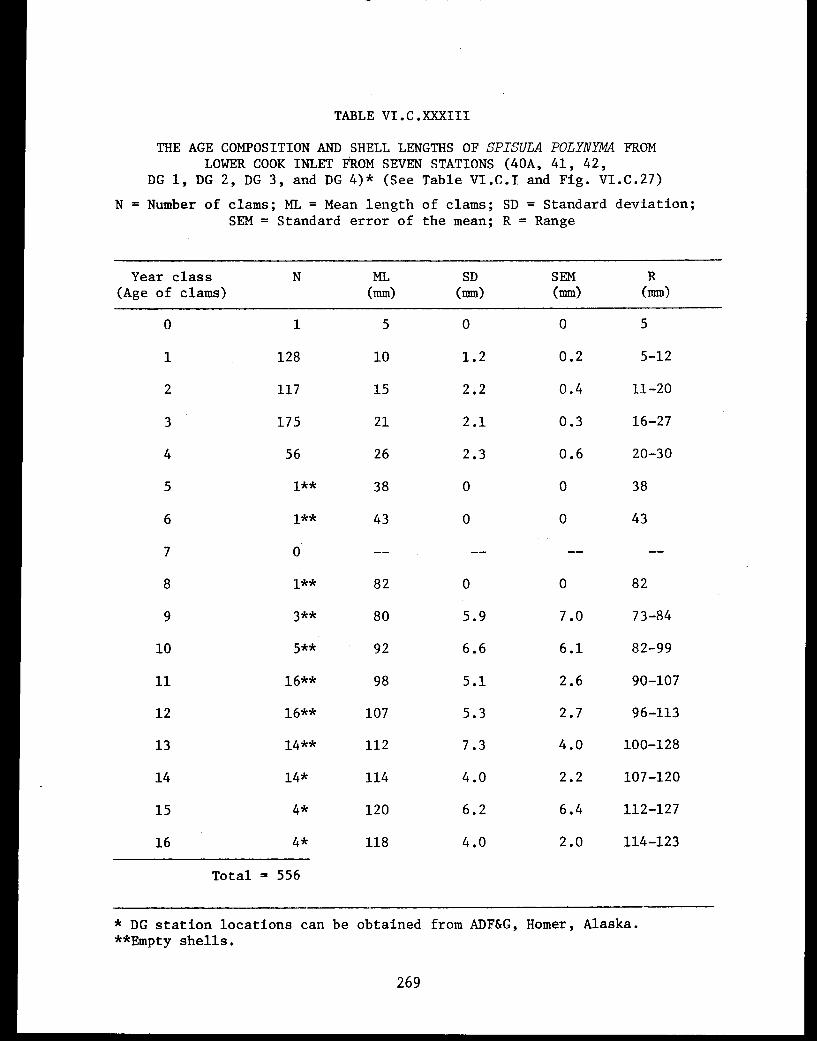
TABLE VI.C.XXXIII
THE AGE COMPOSITION AND SHELL LENGTHS OF SPISULA POLYNYMA FROMLOWER COOK INLET FROM SEVEN STATIONS (40A, 41, 42,
DG 1, DG 2, DG 3, and DG 4)* (See Table VI.C.I and Fig. VI.C.27)
269
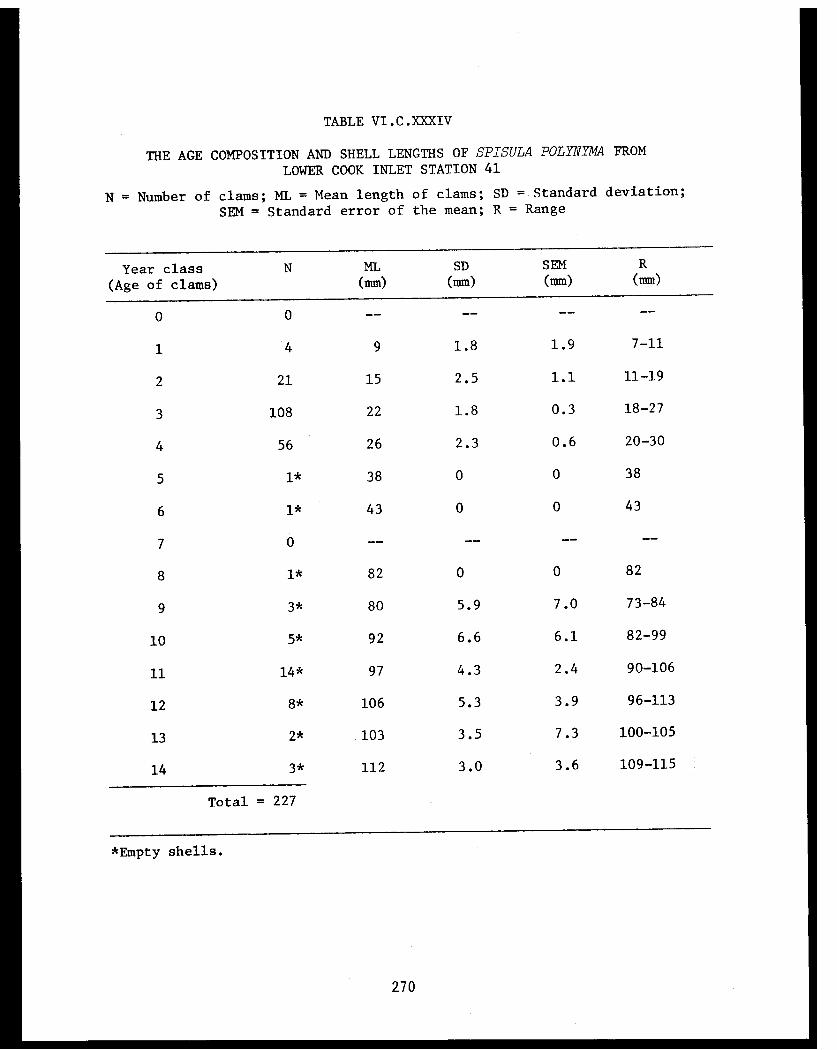
TABLE VI.C.XXXIV
THE AGE COMPOSITION AND SHELL LENGTHS OF SPISULA POLYNYMA FROM
LOWER COOK INLET STATION 41
270
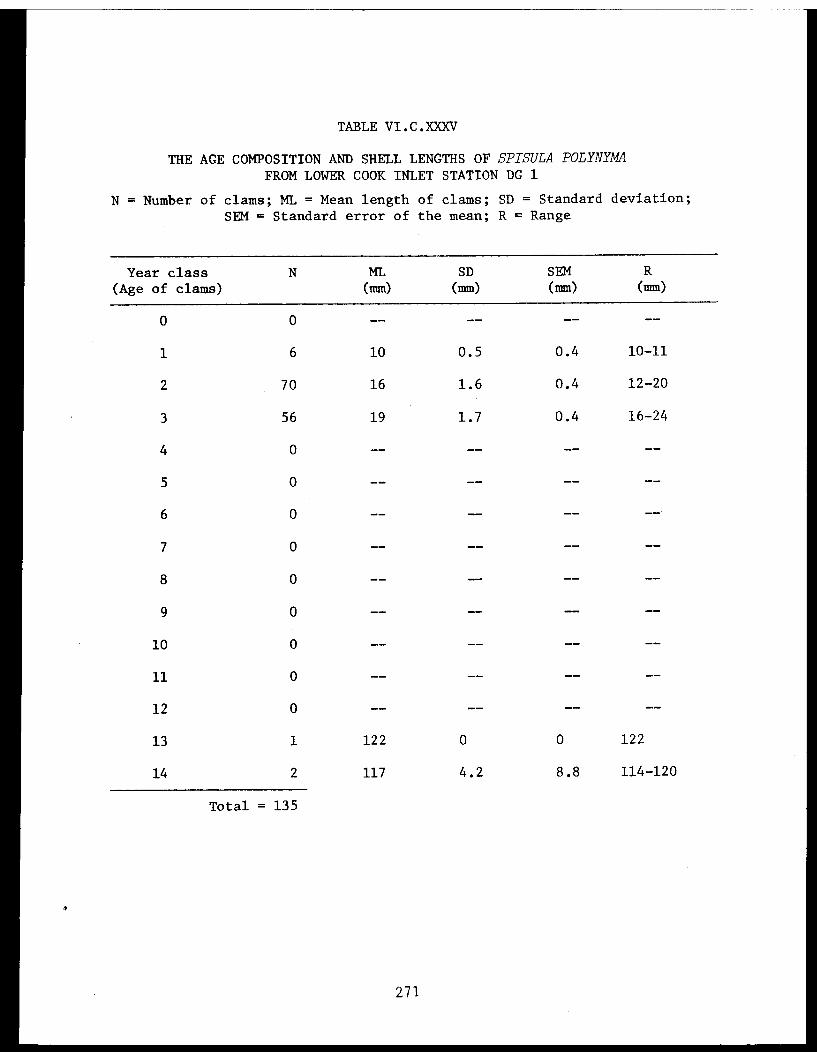
TABLE VI.C.XXXV
THE AGE COMPOSITION AND SHELL LENGTHS OF SPISULA POLYNYMAFROM LOWER COOK INLET STATION DG 1
271
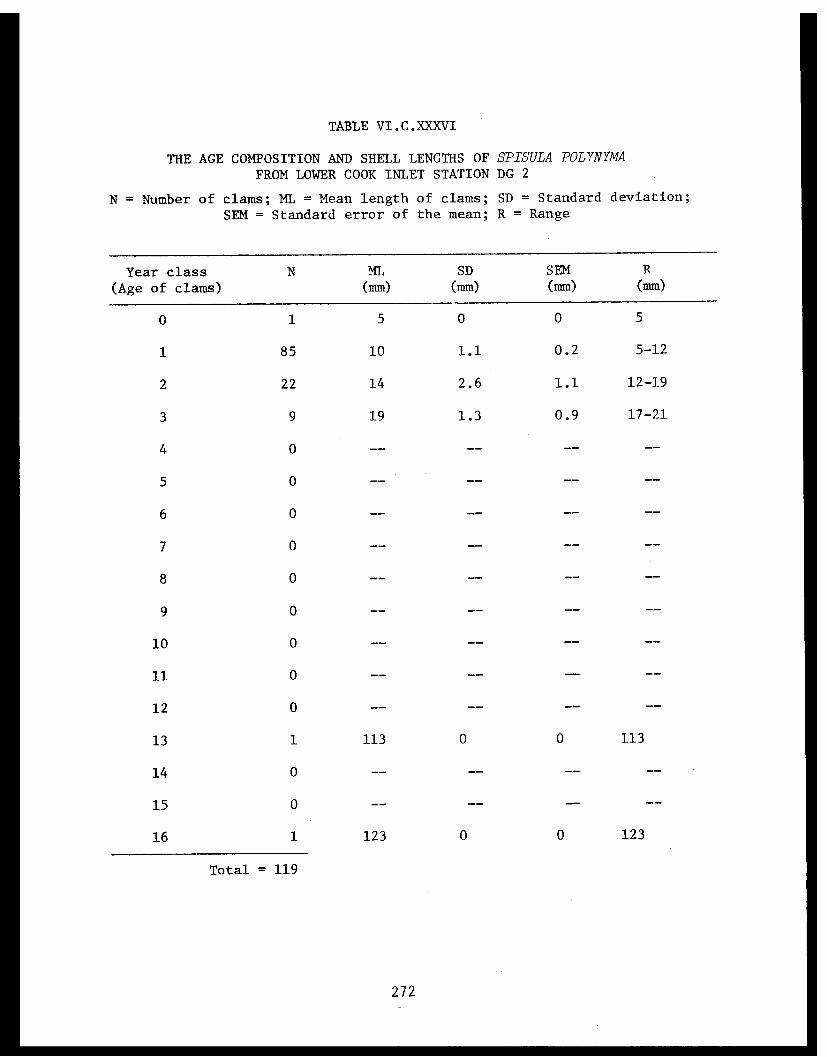
TABLE VI.C.XXXVI
THE AGE COMPOSITION AND SHELL LENGTHS OF SPISULA POLYNYMAFROM LOWER COOK INLET STATION DG 2
272

TABLE VI.C.XXXVII
AGE AND DRY-WEIGHT RELATIONSHIPS OF COOK INLET SPISULA POLYNYMA
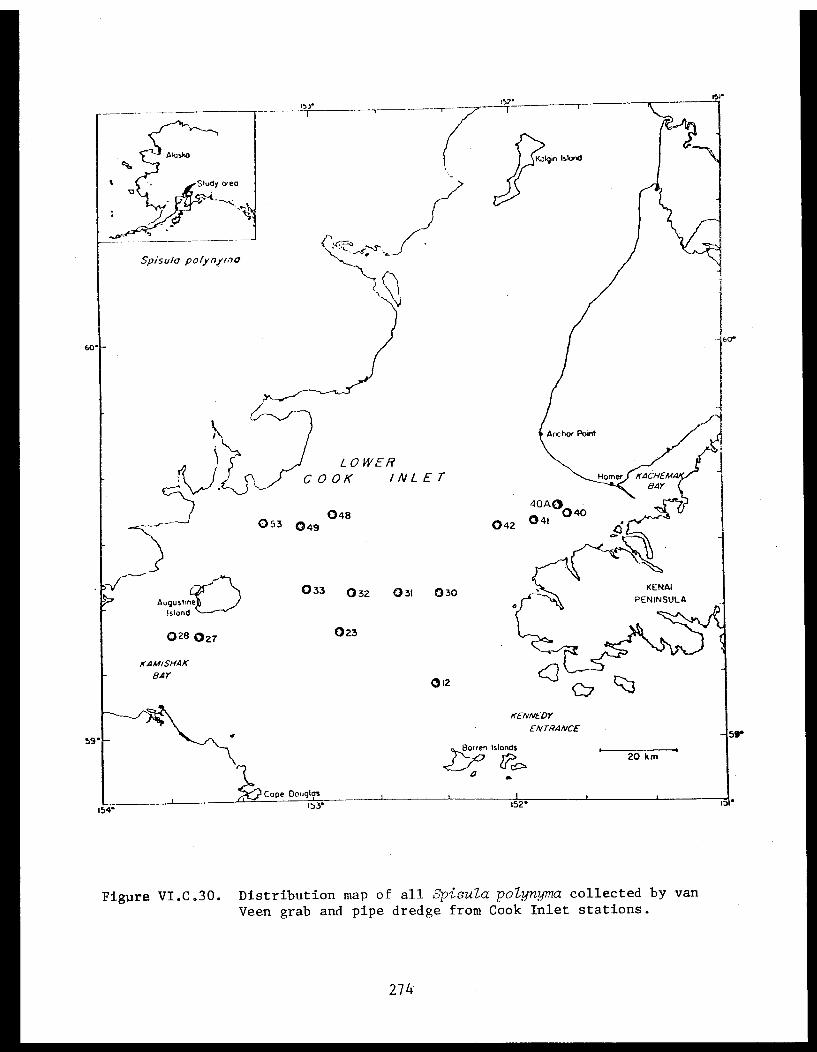
Figure VI.C.30. Distribution map of all Spisula polynyma collected by van
Veen grab and pipe dredge from Cook Inlet stations.
274
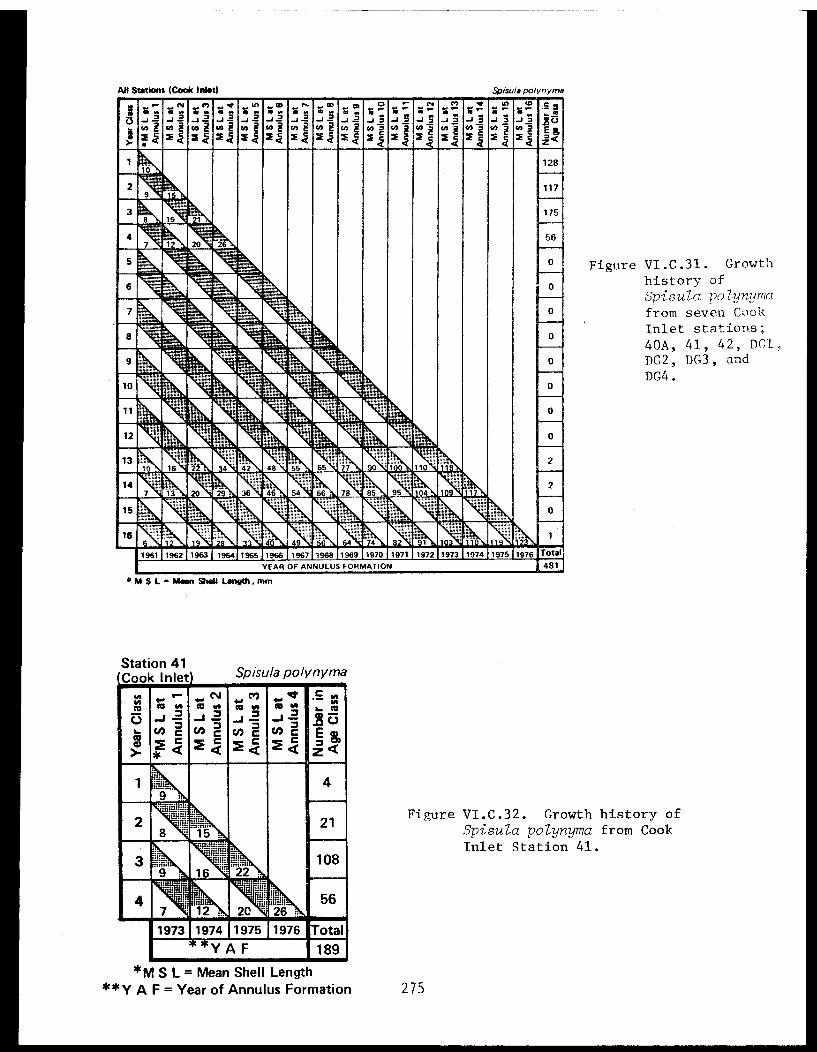
Figure VI.C.31. Growthhistory ofSpisula polynymafrom seven CookInlet stations;40A, 41, 42, DG1,DG2, DG3, andDG4.
Figure VI.C.32. Growth history of
Spisula polynyma from CookInlet Station 41.
275
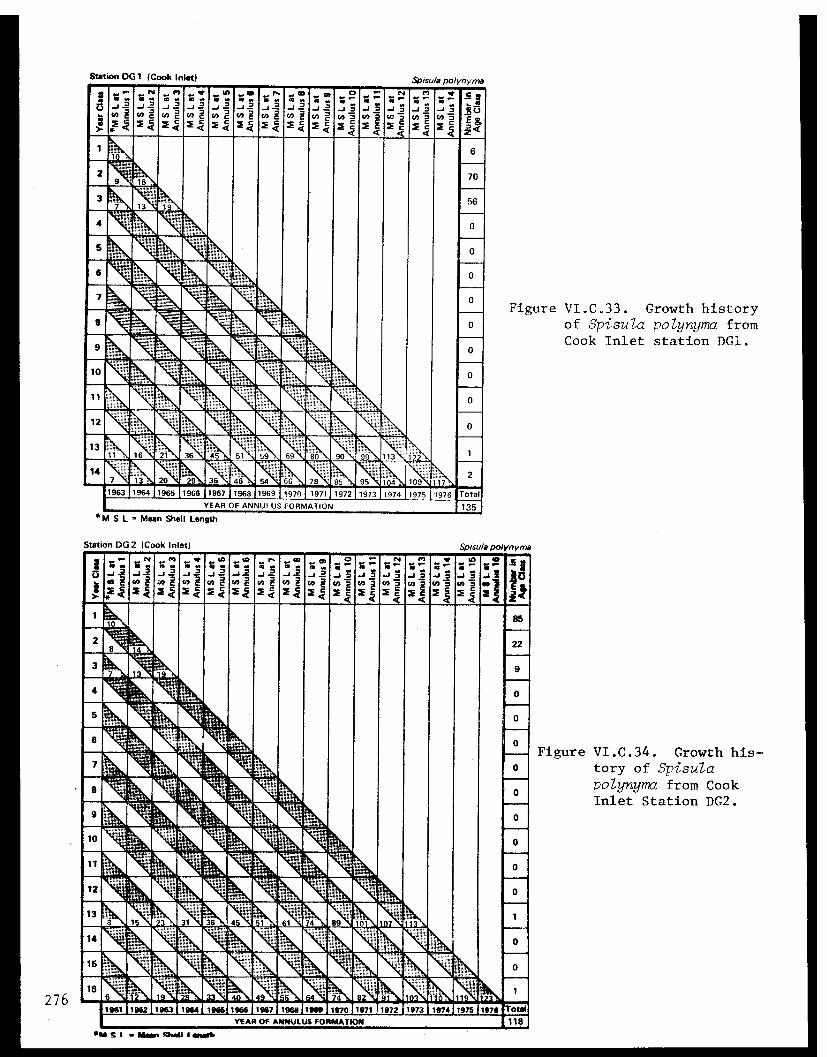
Figure VI.C.33. Growth historyof Spisula polynyma fromCook Inlet station DG1.
Figure VI.C.34. Growth his-tory of Spisulapolynyma from CookInlet Station DG2.
276

Figure VI.C.35. Growth curve for Spisula
polynyma from seven Cook Inlet Sta-
tions; 40A, 41, 42, DG1, DG2, DG3,
and DG4. Mean length is denoted
by the horizontal line, standarddeviation by the white box, standard
error of the mean by the black box,
and range by the vertical line.
Figure VI.C.36. Growth curve for Spisula
polynyma from Cook Inlet Station
41. Mean length is denoted by the
horizontal line, standard deviation
by the white box, standard error
of the mean by the black box, and
range by the vertical line.
277
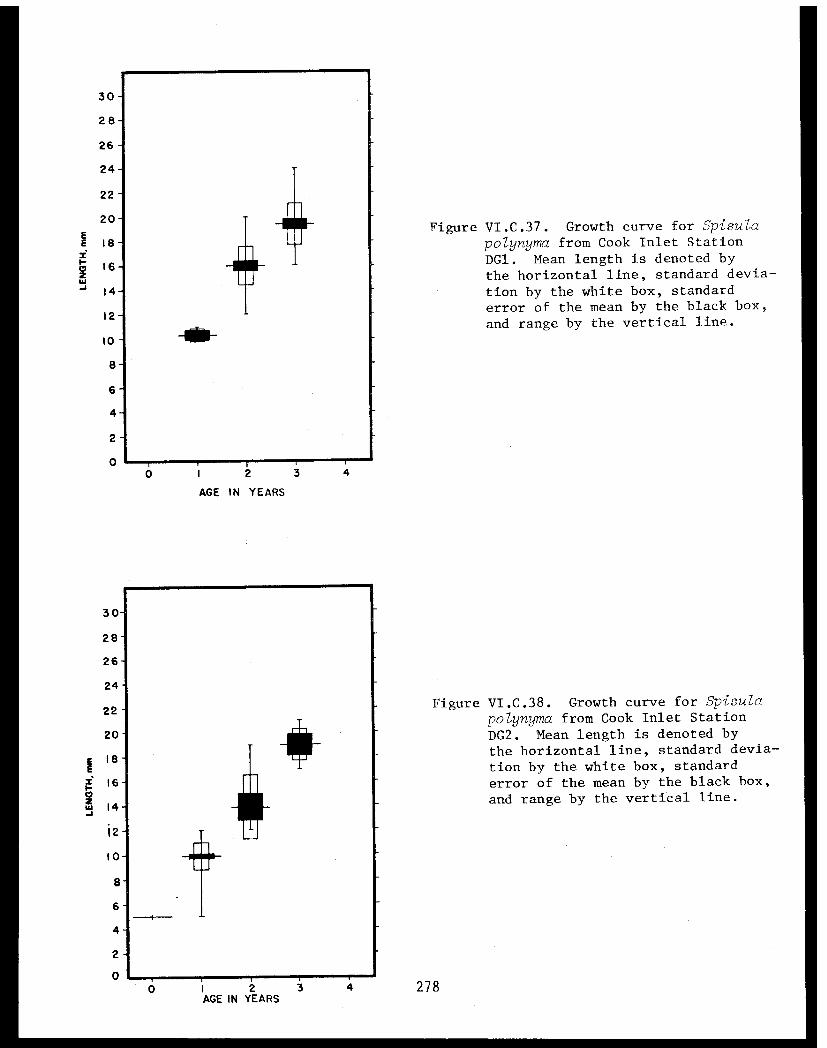
Figure VI.C.37. Growth curve for Spisula
polynyma from Cook Inlet Station
DG1. Mean length is denoted by
the horizontal line, standard devia-
tion by the white box, standard
error of the mean by the black box,
and range by the vertical line.
Figure VI.C.38. Growth curve for Spisula
polynyma from Cook Inlet Station
DG2. Mean length is denoted by
the horizontal line, standard devia-
tion by the white box, standard
error of the mean by the black box,
and range by the vertical line.
278

Macoma calcarea
Macoma calcarea was collected at the stations listed in Table VI.C.I
and shown in Fig. VI.C.39. There was no apparent gear bias in age sampling
of M. calcarea, as all age classes were well represented in the collec-
tion as shown in age composition Table VI.C.XXXVIII. Five hundred and
twenty M. calcarea were aged from thirteen stations; C, 18, 25, 27, 28, 32,
33, 35, 37, 39, 49, 53, and 54. The annual increases in shell length
for each of the size classes in Cook Inlet was typically 1.3 to 2.7 mm
(Tables VI.C.XXXVIII-VI.C.XLVI; Figs. VI.C.40-VI.C.49). Growth was similar
at all stations, and varied only slightly from year to year (Figs. VI.C.40-
VI.C.45). The integrity of the age classes is suggested in Figs. VI.C.46
to VI.C.49 where it can be observed that none of the standard errors of the
mean overlap. The mean shell lengths at each annular age showed some varia-
tion (Figs. VI.C.40-VI.C.45). However, 294 of the 300 values for mean shell
lengths at an annulus (Figs. VI.C.40-VI.C.45) did not exceed the standard
deviation around that mean annular length by more than 1 mm (Tables
VI.C.XXXVIII-VI.C.XLVI).
The majority of the 520 specimens examined were between 0 and 5 years
of age. However, there was considerable variation in the age composition
of the collections (Tables VI.C.XXXVIII-VI.C.XLVI). For example, 90% of
the Macoma calcarea from Station 28 were in the 0 age class, while 79%
of the clams from Station 53 were between 3 and 5 years of age. The
oldest and largest M. calcarea collected was 14 years of age and 31.4 mm
in length, respectively. This species attains 48.8 mm in length at age
9 as indicated by data from the Bering Sea (Feder et al., 1980).
Dry weights of the various age classes are available in Table VI.C.XLVII.
Biomass estimations (dry tissue weight) for each age class were made for
Macoma calcarea at Stations 27, 28, 32, and 33. Total M. calcarea biomass
for these stations ranged from 0.05 to 1.00 g/m² (Tables VI.C.XLVIII-VI.C.LI).
Approximately 38% mortality occurred in the third year class of Macoma
calcarea, this gradually increased to 50% by age 9 (Table VI.C.LII; Fig.
VI.C.50). Calculations using the age composition Tables VI.C.XXXVIII to
VI.C.XLVI indicate that extensive mortality occurred after 5 years of age,
279
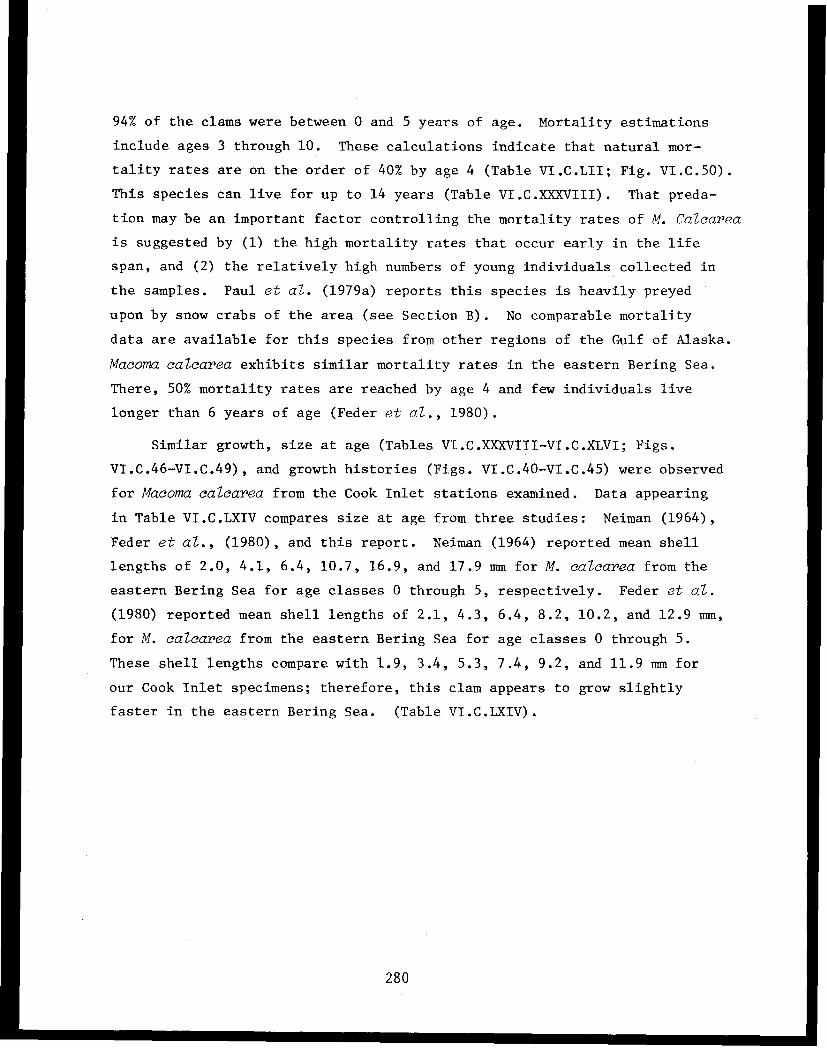
94% of the clams were between 0 and 5 years of age. Mortality estimations
include ages 3 through 10. These calculations indicate that natural mor-
tality rates are on the order of 40% by age 4 (Table VI.C.LII; Fig. VI.C.50).
This species can live for up to 14 years (Table VI.C.XXXVIII). That preda-
tion may be an important factor controlling the mortality rates of M. Calcarea
is suggested by (1) the high mortality rates that occur early in the life
span, and (2) the relatively high numbers of young individuals collected in
the samples. Paul et al. (1979a) reports this species is heavily preyed
upon by snow crabs of the area (see Section B). No comparable mortality
data are available for this species from other regions of the Gulf of Alaska.
Macoma calcarea exhibits similar mortality rates in the eastern Bering Sea.
There, 50% mortality rates are reached by age 4 and few individuals live
longer than 6 years of age (Feder et al., 1980).
Similar growth, size at age (Tables VI.C.XXXVIII-VI.C.XLVI; Figs.
VI.C.46-VI.C.49), and growth histories (Figs. VI.C.40-VI.C.45) were observed
for Macoma calcarea from the Cook Inlet stations examined. Data appearing
in Table VI.C.LXIV compares size at age from three studies: Neiman (1964),
Feder et al., (1980), and this report. Neiman (1964) reported mean shell
lengths of 2.0, 4.1, 6.4, 10.7, 16.9, and 17.9 mm for M. calcarea from the
eastern Bering Sea for age classes 0 through 5, respectively. Feder et al.
(1980) reported mean shell lengths of 2.1, 4.3, 6.4, 8.2, 10.2, and 12.9 mm,
for M. calcarea from the eastern Bering Sea for age classes 0 through 5.
These shell lengths compare with 1.9, 3.4, 5.3, 7.4, 9.2, and 11.9 mm for
our Cook Inlet specimens; therefore, this clam appears to grow slightly
faster in the eastern Bering Sea. (Table VI.C.LXIV).
280
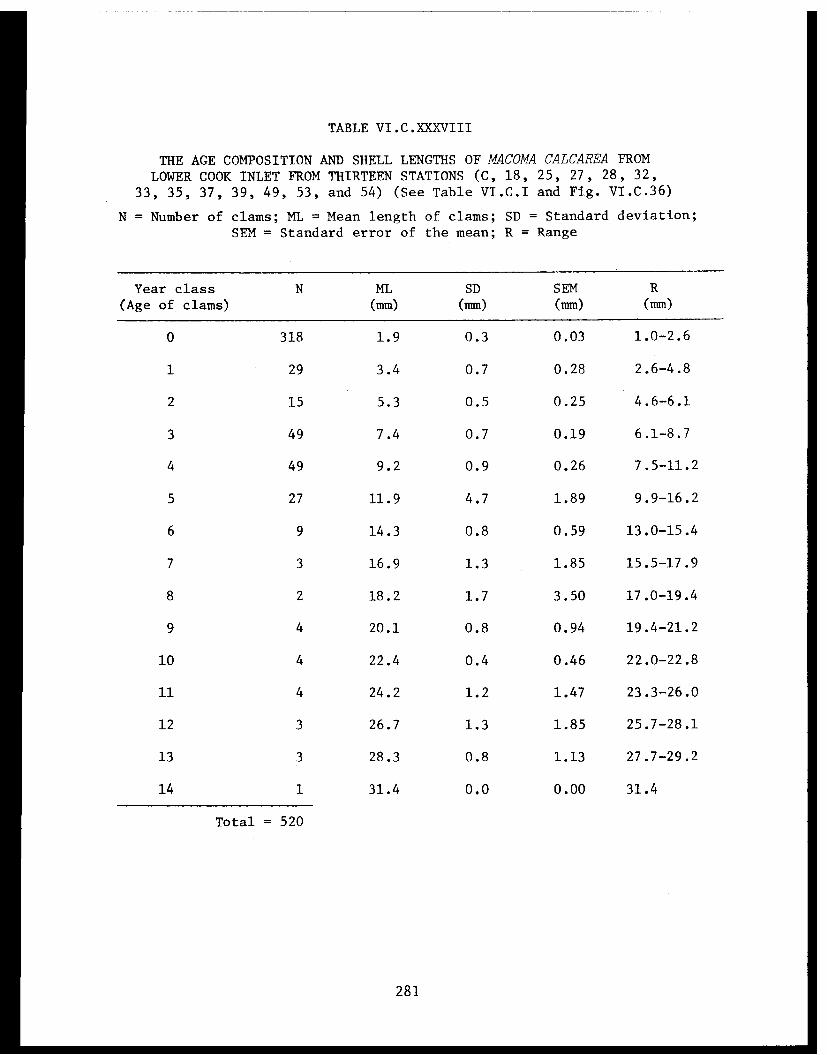
TABLE VI.C.XXXVIII
THE AGE COMPOSITION AND SHELL LENGTHS OF MACOMA CALCAREA FROM
LOWER COOK INLET FROM THIRTEEN STATIONS (C, 18, 25, 27, 28, 32,
33, 35, 37, 39, 49, 53, and 54) (See Table VI.C.I and Fig. VI.C.36)
281
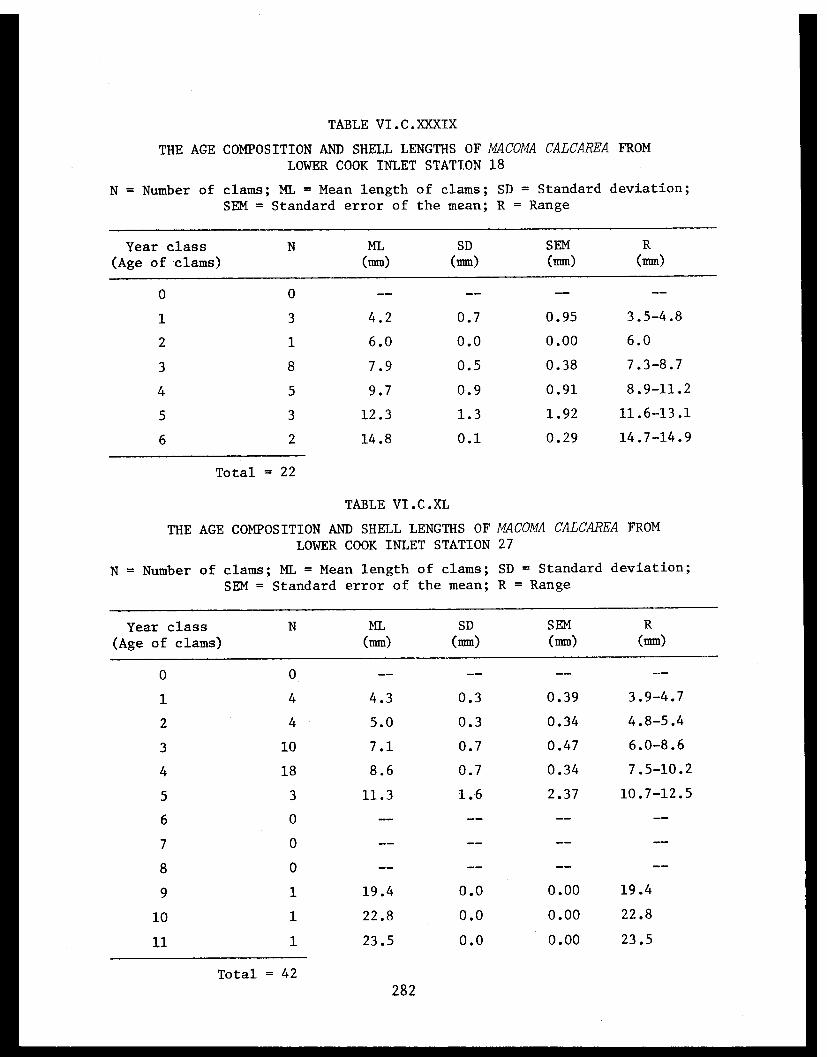
TABLE VI.C.XXXIX
THE AGE COMPOSITION AND SHELL LENGTHS OF MACOMA CALCAREA FROM
LOWER COOK INLET STATION 18
TABLE VI.C.XL
THE AGE COMPOSITION AND SHELL LENGTHS OF MACOMA CALCAREA FROM
LOWER COOK INLET STATION 27
282

TABLE VI.C.XLI
THE AGE COMPOSITION AND SHELL LENGTHS OF MACOMA CALCAREA FROMLOWER COOK INLET STATION 28
TABLE VI.C.XLII
THE AGE COMPOSITION AND SHELL LENGTHS OF MACOMA CALCAREA FROMLOWER COOK INLET STATION 33
283
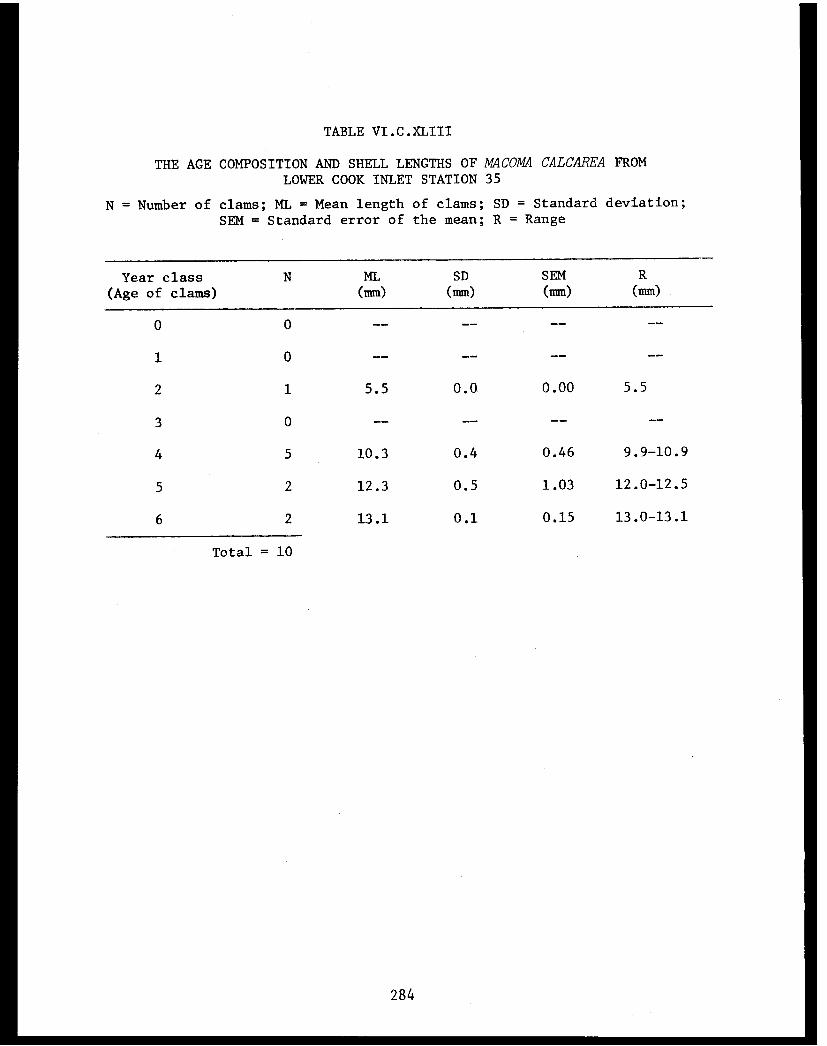
TABLE VI.C.XLIII
THE AGE COMPOSITION AND SHELL LENGTHS OF MACOMA CALCAREA FROMLOWER COOK INLET STATION 35
284

TABLE VI.C.XLIV
THE AGE COMPOSITION AND SHELL LENGTHS OF MACOMA CALCAREA FROMLOWER COOK INLET STATION 39
285
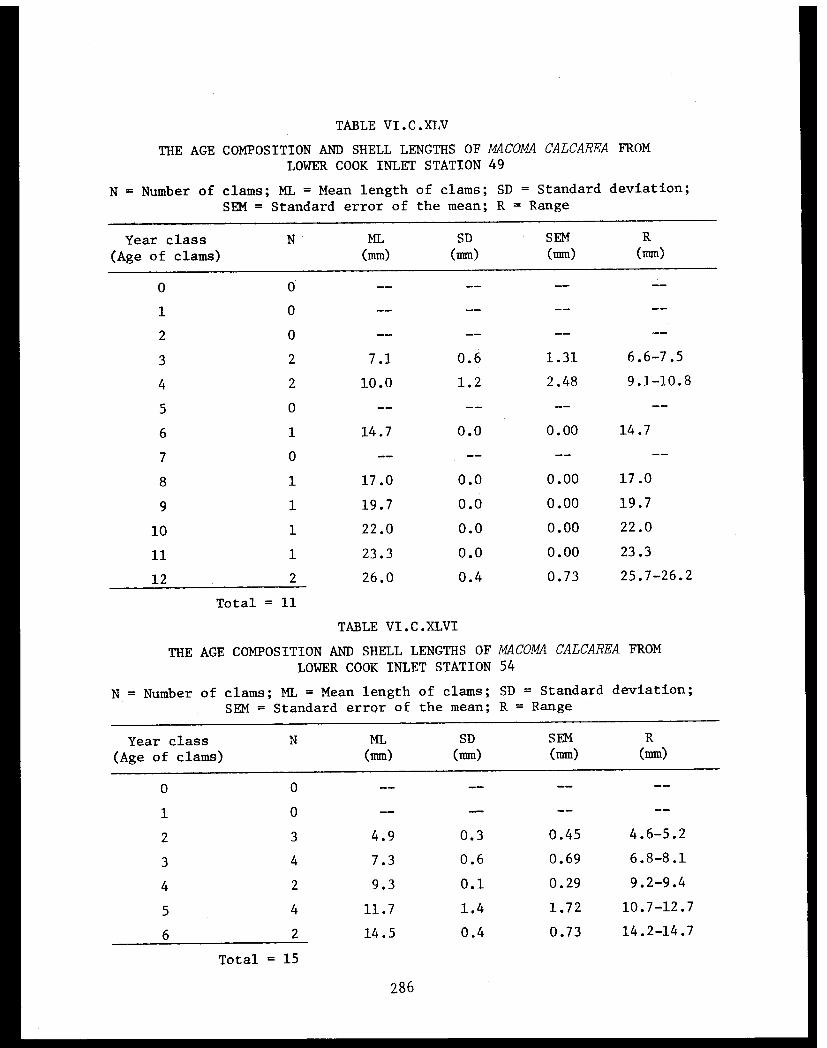
TABLE VI.C.XLV
THE AGE COMPOSITION AND SHELL LENGTHS OF MACOMA CALCAREA FROM
LOWER COOK INLET STATION 49
TABLE VI.C.XLVI
THE AGE COMPOSITION AND SHELL LENGTHS OF MACOMA CALCAREA FROM
LOWER COOK INLET STATION 54
286

TABLE VI.C.XLVII
AGE AND DRY-WEIGHT RELATIONSHIPS OF COOK INLET MACOMA CALCAREA

TABLE VI.C.XLVIII
MACOMA CALCAREA: BIOMASS ESTIMATIONS PER m² AT STATION 27
288

TABLE VI.C.XLIX
MACOMA CALCAREA: BIOMASS ESTIMATIONS PER m² AT STATION 28
289
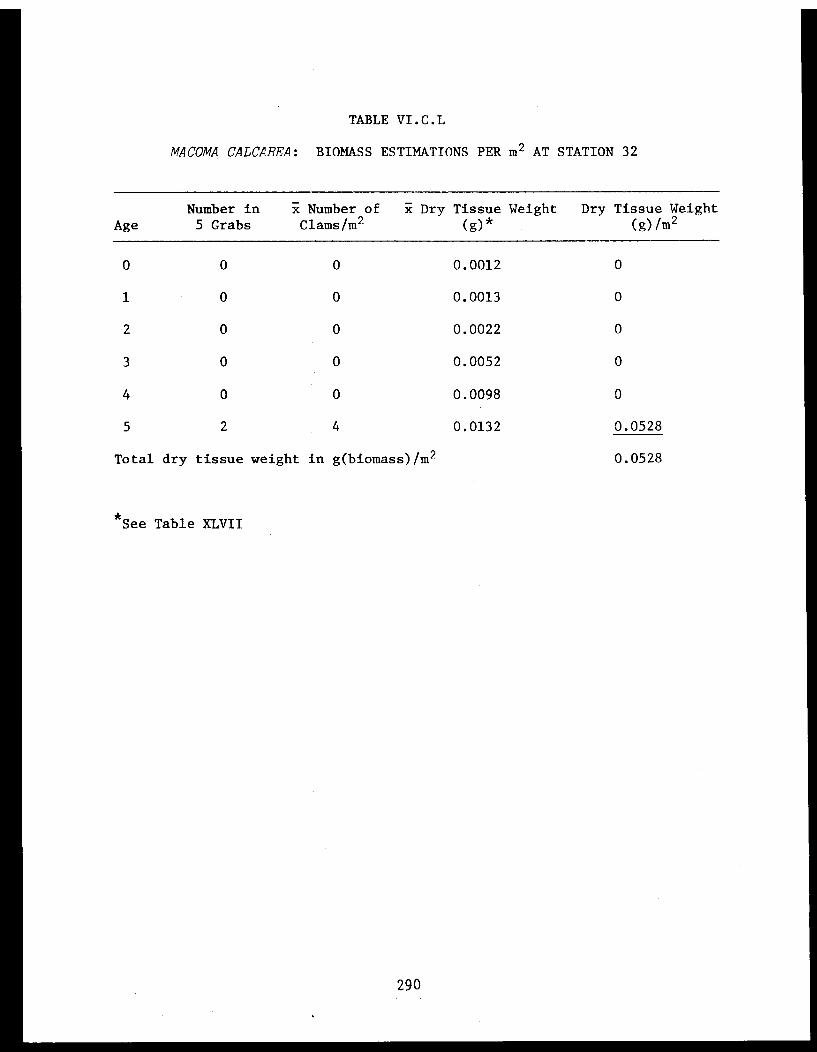
TABLE VI.C.L
MACOMA CALCAREA: BIOMASS ESTIMATIONS PER m² AT STATION 32
290
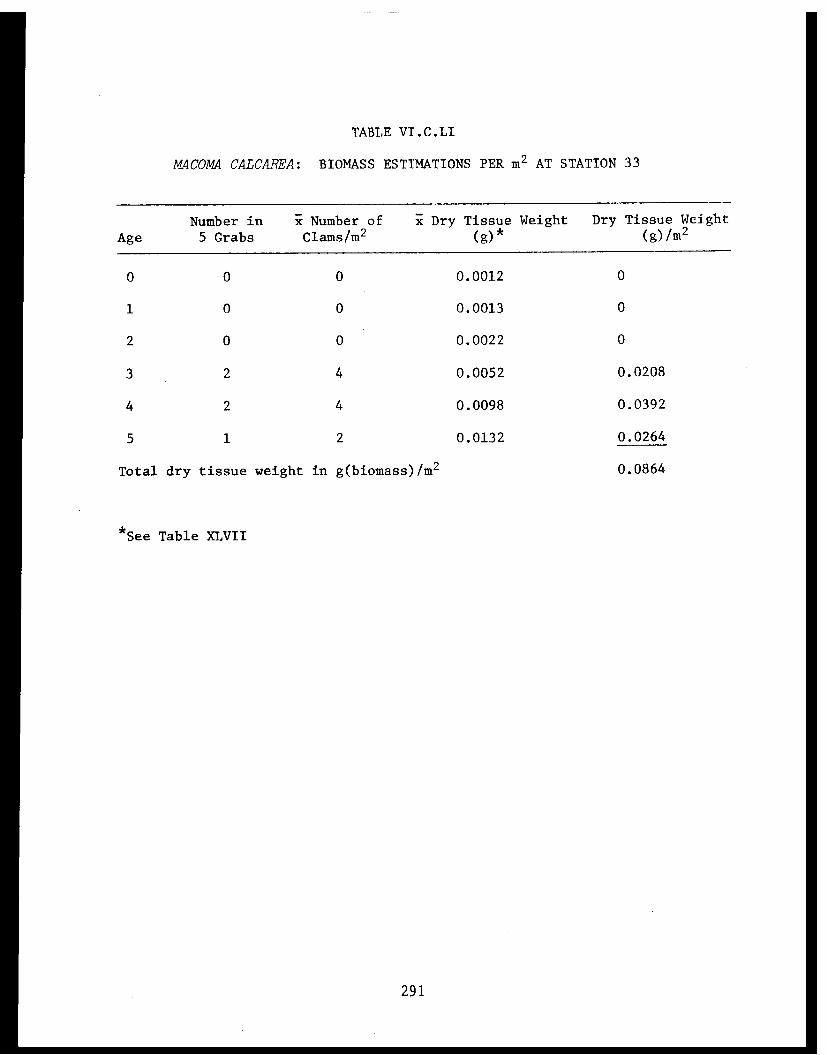
TABLE VI.C.LI
MACOMA CALCAREA: BIOMASS ESTIMATIONS PER m² AT STATION 33
291
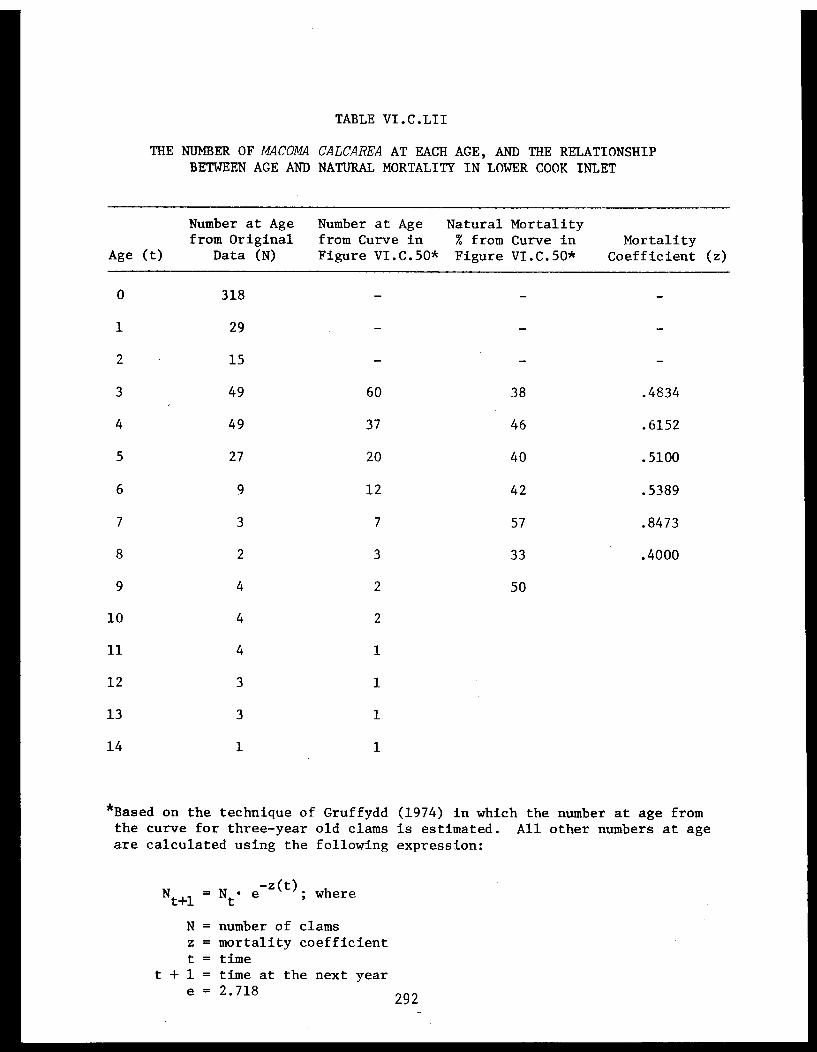
TABLE VI.C.LII
THE NUMBER OF MACOMA CALCAREA AT EACH AGE, AND THE RELATIONSHIPBETWEEN AGE AND NATURAL MORTALITY IN LOWER COOK INLET
292
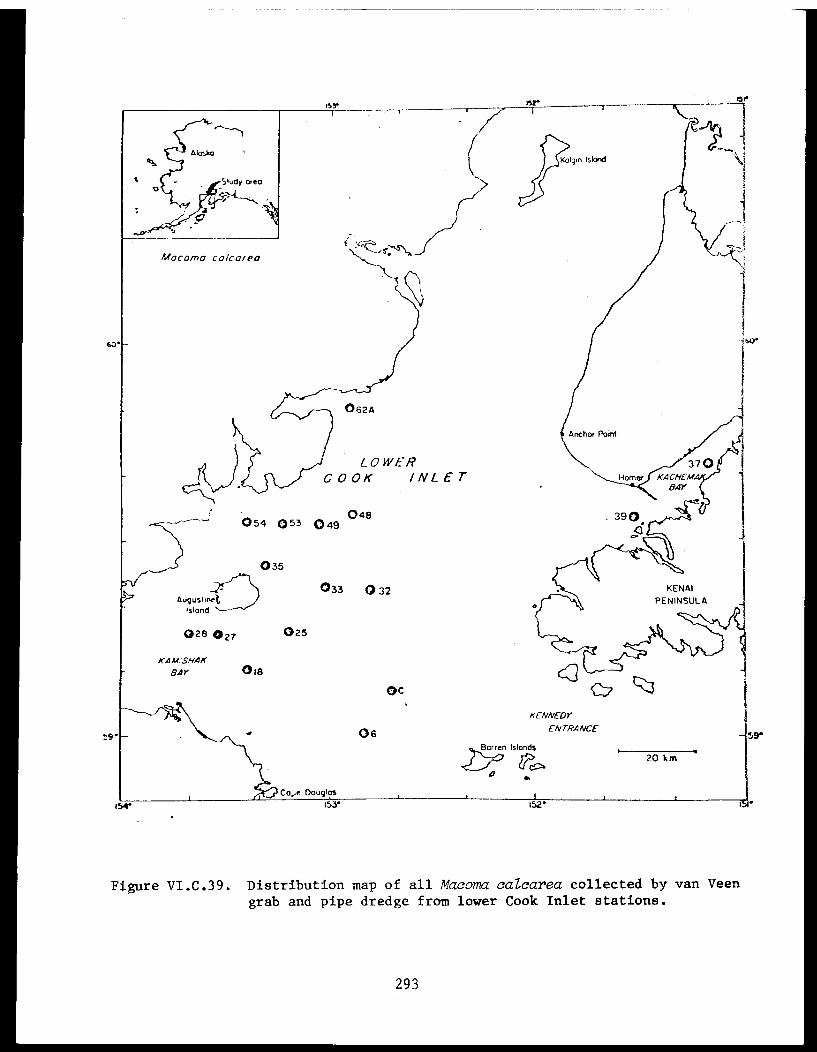
Figure VI.C.39. Distribution map of all Macoma calcarea collected by van Veen
grab and pipe dredge from lower Cook Inlet stations.
293
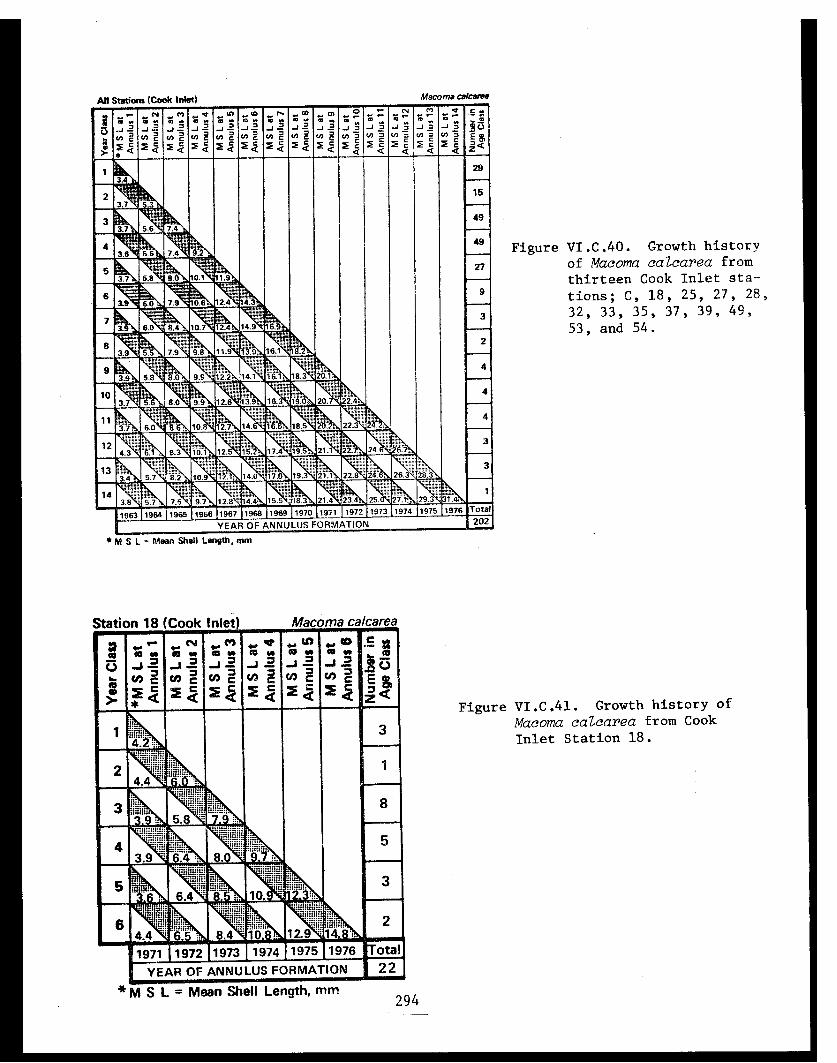
Figure VI.C.40. Growth history
of Macoma calcarea from
thirteen Cook Inlet sta-
tions; C, 18, 25, 27, 28,
32, 33, 35, 37, 39, 49,
53, and 54.
Figure VI.C.41. Growth history of
Macoma calcarea from Cook
Inlet Station 18.
294
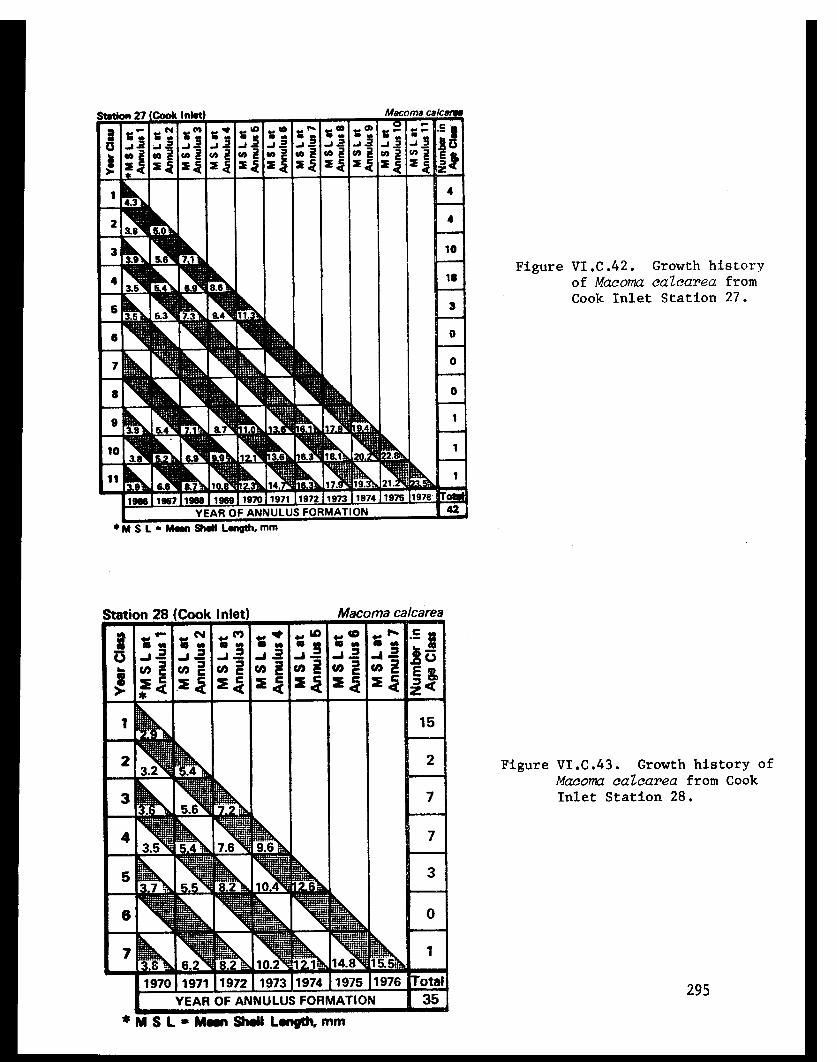
Figure VI.C.42. Growth historyof Macoma calcarea fromCook Inlet Station 27.
Figure VI.C.43. Growth history of
Macoma calcarea from CookInlet Station 28.
295
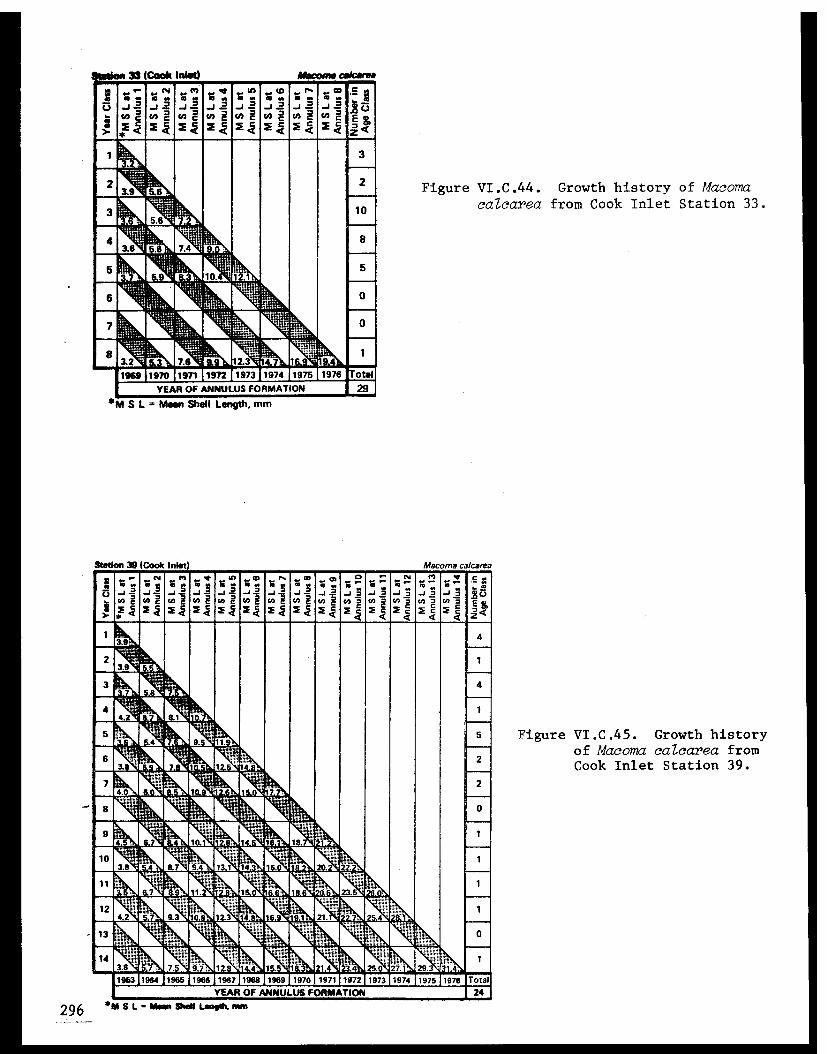
Figure VI.C.44. Growth history of Macomacalcarea from Cook Inlet Station 33.
Figure VI.C.45. Growth historyof Macoma calcarea fromCook Inlet Station 39.
296
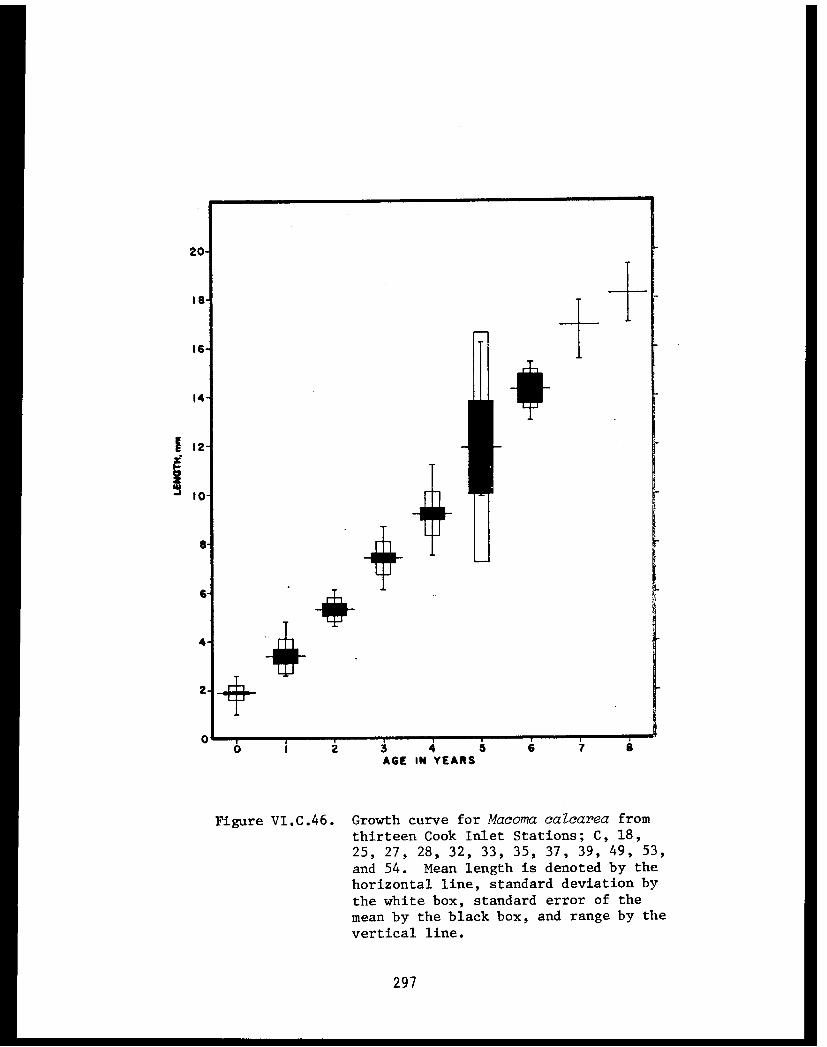
Figure VI.C.46. Growth curve for Macoma calcarea from
thirteen Cook Inlet Stations; C, 18,25, 27, 28, 32, 33, 35, 37, 39, 49, 53,
and 54. Mean length is denoted by thehorizontal line, standard deviation by
the white box, standard error of themean by the black box, and range by the
vertical line.
297

Figure VI.C.47. Growth curve for Macoma calcarea from
Cook Inlet Station 27. Mean length is
denoted by the horizontal line, standard
deviation by the white box, standard
error of the mean by the black box, and
range by the vertical line.
298
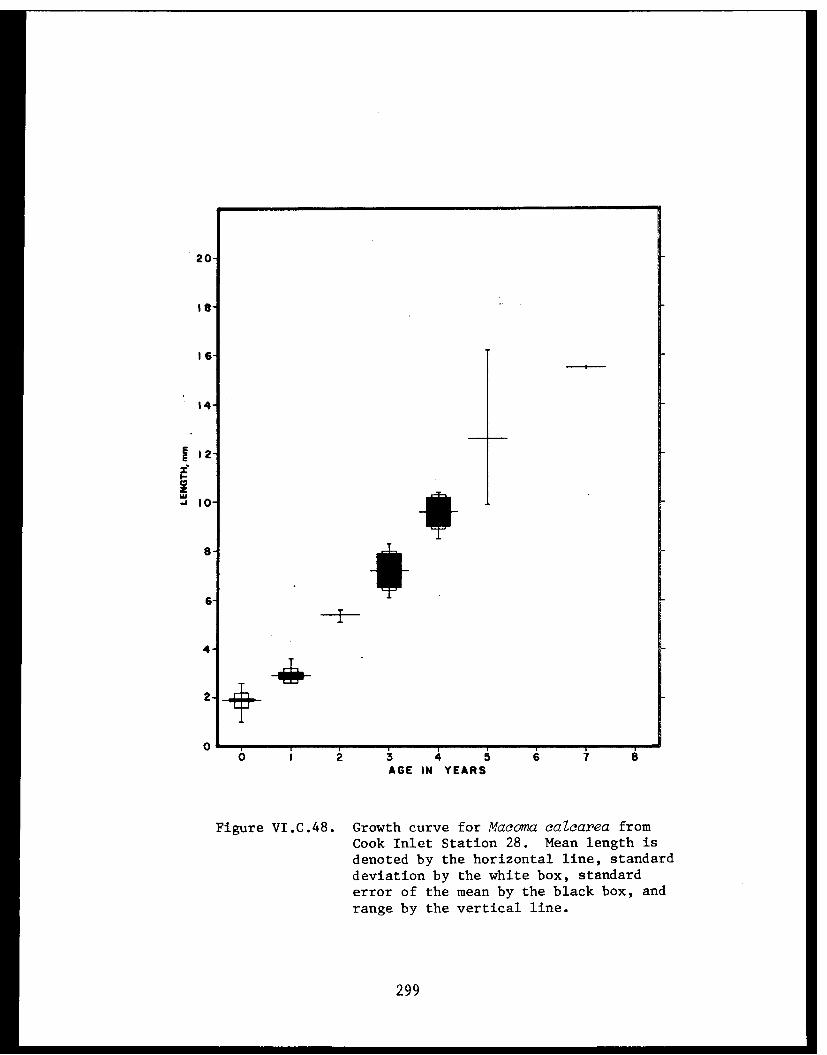
Figure VI.C.48. Growth curve for Macoma calcarea fromCook Inlet Station 28. Mean length isdenoted by the horizontal line, standarddeviation by the white box, standarderror of the mean by the black box, and
range by the vertical line.
299
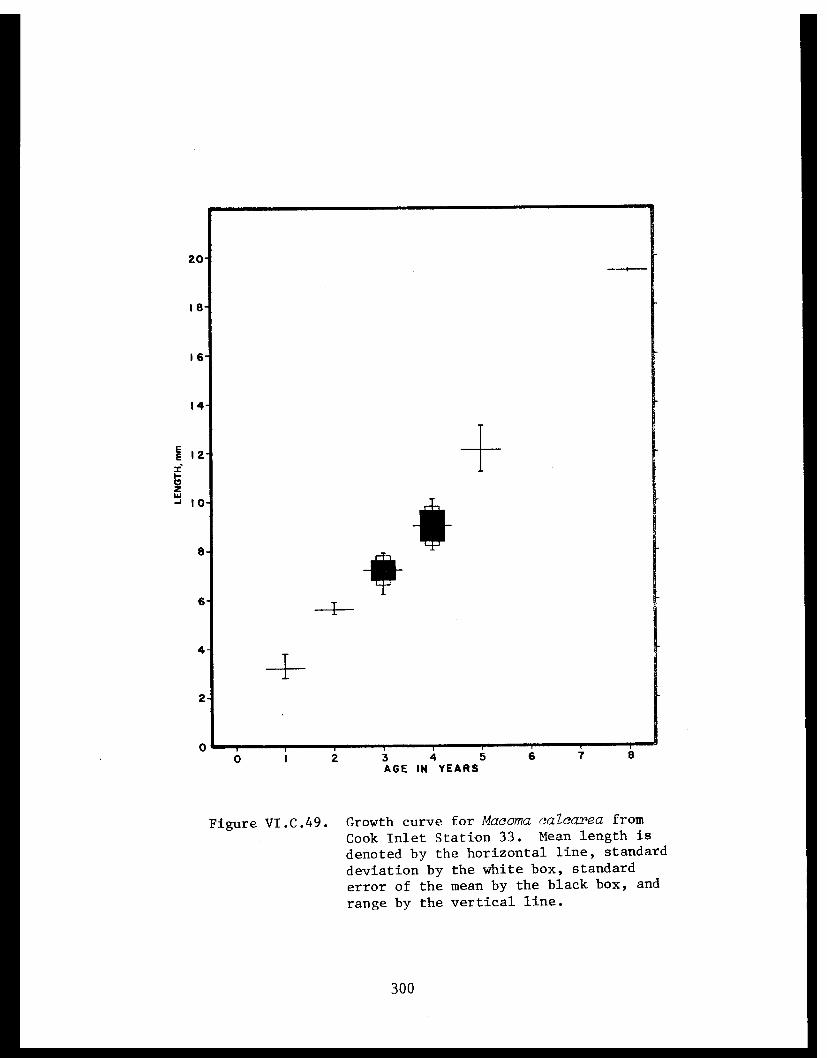
Figure VI.C.49. Growth curve for Macoma calcarea from
Cook Inlet Station 33. Mean length is
denoted by the horizontal line, standard
deviation by the white box, standard
error of the mean by the black box, and
range by the vertical line.
300

Figure VI.C.50. Graph of abundance vs. age for Macoma calcarea in Cook Inlet.
Tellina nuculoides
Tellina nuculoides was collected at the stations listed in Table VI.C.I
and shown in Fig. VI.C.51. There was no apparent gear bias in the collec-
tion of T. nuculoides, and all age classes were well represented in the
samples as shown in the age composition Table VI.C.LIII. Six hundred and
seventy-two T. nuculoides were aged from nine stations; UW2, 30, 31, 40A,
41, 42, 44, 45, and 63. The annual increase in shell length for each of
the size classes in Cook Inlet was typically 0.5 to 2.0 mm (Tables VI.C.LIII-
VI.C.LVI; Figs. VI.C.52-VI.C.61). Growth was similar at all stations, and
varied only slightly from year to year (Figs. VI.C.52-VI.C.57). The integ-
rity of the age classes is suggested by Figs. VI.C.58 to VI.C.61 where it
can be observed that none of the standard errors of the mean overlap. The
mean shell lengths at each annular age showed some variation (Figs. VI.C.52-
VI.C.57). However, 326 of the 336 values for mean shell lengths at an
annulus (Figs. VI.C.52-VI.C.57) did not exceed the standard deviation around
that mean annular length by more than 1 mm (Tables VI.C.LIII-VI.C.LVI).
The majority of the 672 specimens examined were between 5 and 10
years of age. However, there was considerable variation in the age com-
position of the collections (Tables VI.C.LIII-VI.C.LVI). For example, 71%
of the Tellina nuculoides from Station UW2 were in the 1 year class, while
78% of the clams from Station 44 were between 5 and 8 years of age. The
oldest and largest T. nuculoides collected were 13 years of age and 16.4 mm
in length, respectively.
Dry weights of the various age classes are available in Table VI.C.LVII.
Biomass estimations (dry tissue weight) for each age class were made for
Tellina nuculoides at Stations 30, 31, 42, 44, and 63. Total T. nuculoides
biomass at these stations ranged from 0.23 to 5.27 g/m² (Tables VI.C.LVIII-
VI.C.LXII).
Approximately 13% mortality occurred in the sixth year class of
Tellina nuculoides, this gradually increased to 80% by age 12 (Table
VI,C.LXIII; Fig. VI.C.62). Calculations using the age composition Tables
VI.C.LIII to VI.C.LVI indicate that extensive mortality occurred after 8
years of age, 89% of the clams were from 0 to 8 years of age. There was
302
uneven annual recruitment to year classes 0 through 6 (Tables VI.C.LIII and
VI.C.LXIII). Therefore, mortality estimates could only be made for clams
older than 5 years. However, it is obvious that T. nuculoides is relatively
long lived in Cook Inlet. Mortality rates did not reach the 50% level
until age nine (Table VI.C.LXIII; Fig. VI.C.62). The gradual increase of
mortality rates with age and the large number of older individuals in the
population suggests that senescence, rather than periodic environmental
stress or predation, is a prime source of mortality. This hypothesis is
supported by the low frequency of occurrence with which this species was
found in the stomachs of the common crustacean predators (see Section B).
No comparable mortality data are available for this species from other
regions of the Gulf of Alaska.
303
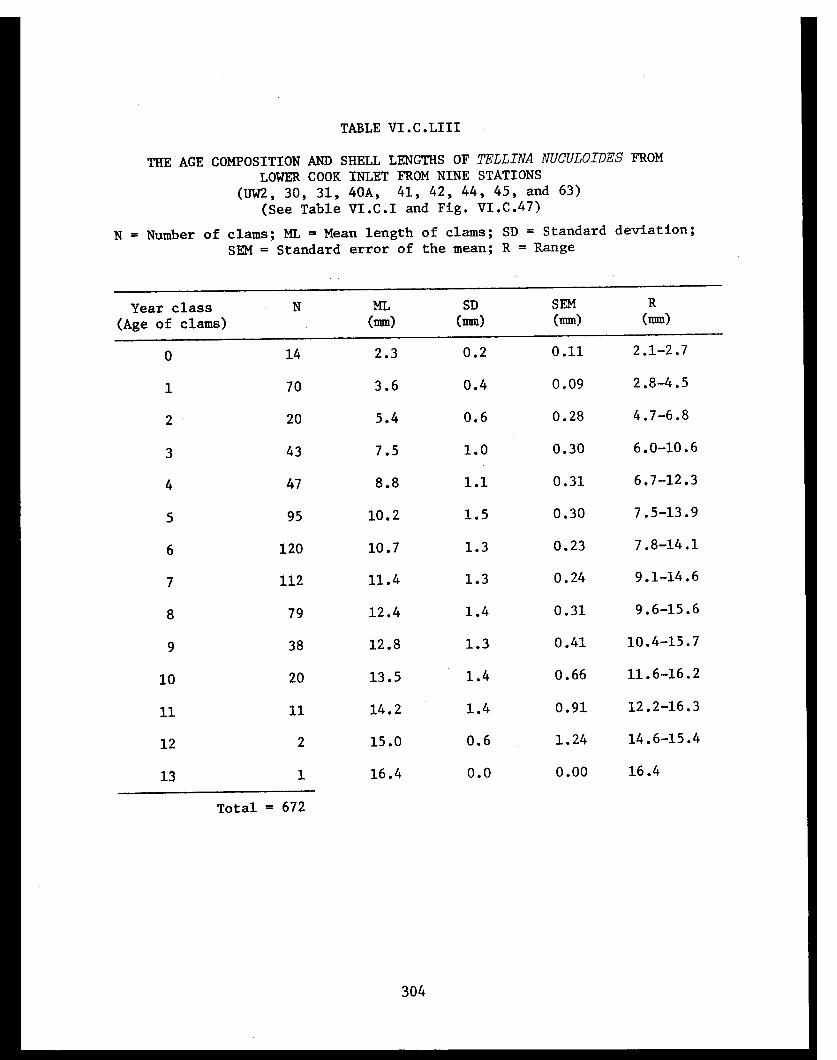
TABLE VI.C.LIII
THE AGE COMPOSITION AND SHELL LENGTHS OF TELLINA NUCULOIDES FROM
LOWER COOK INLET FROM NINE STATIONS
(UW2, 30, 31, 40A, 41, 42, 44, 45, and 63)
(See Table VI.C.I and Fig. VI.C.47)
304
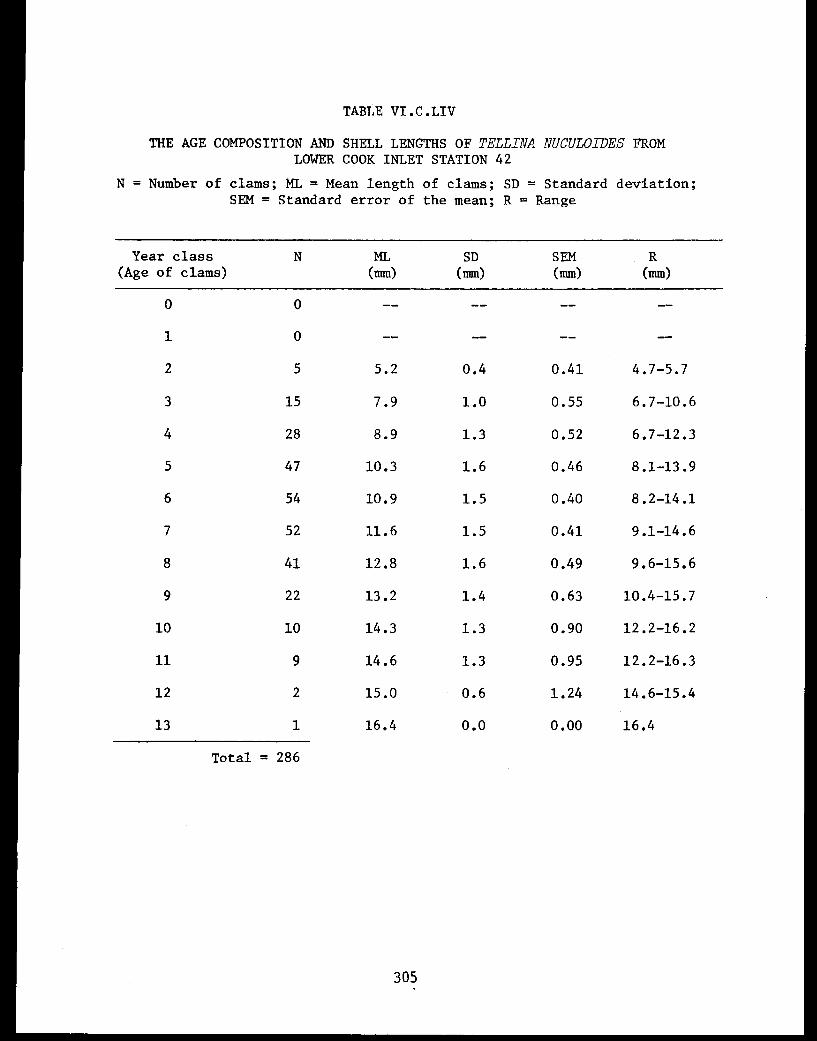
TABLE VI.C.LIV
THE AGE COMPOSITION AND SHELL LENGTHS OF TELLINA NUCULOIDES FROMLOWER COOK INLET STATION 42
305
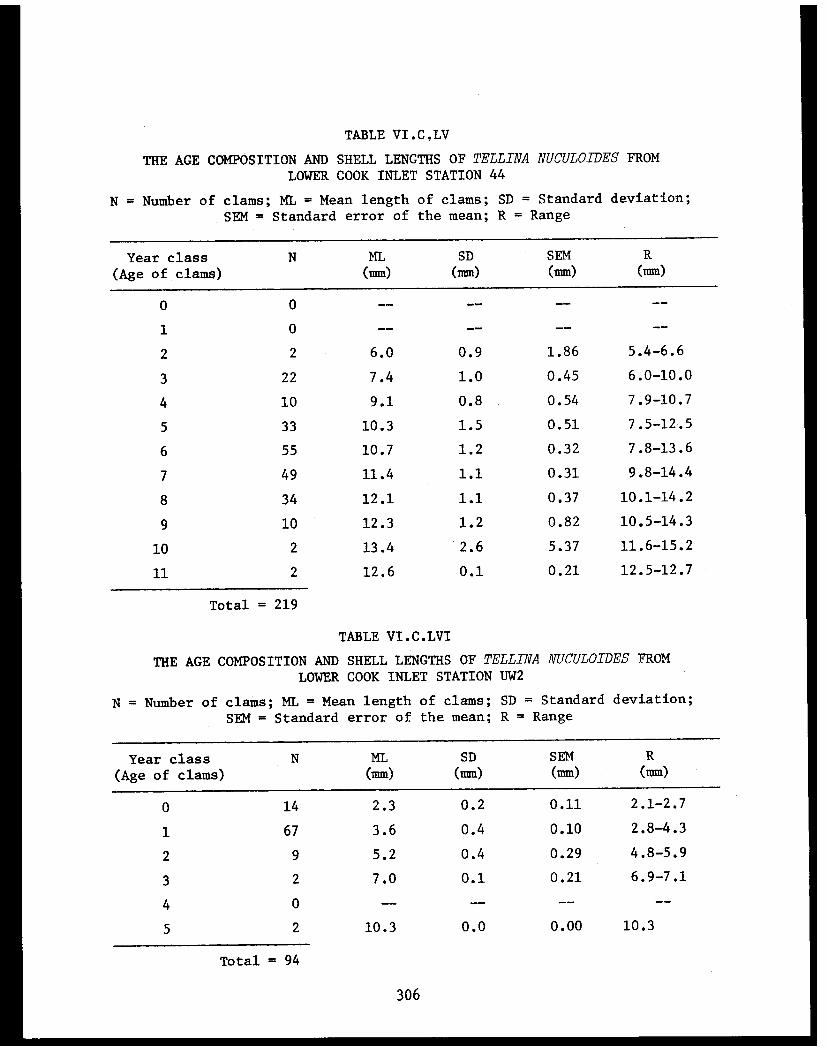
TABLE VI.C.LV
THE AGE COMPOSITION AND SHELL LENGTHS OF TELLINA NUCULOIDES FROM
LOWER COOK INLET STATION 44
TABLE VI.C.LVI
THE AGE COMPOSITION AND SHELL LENGTHS OF TELLINA NUCULOIDES FROM
LOWER COOK INLET STATION UW2
306
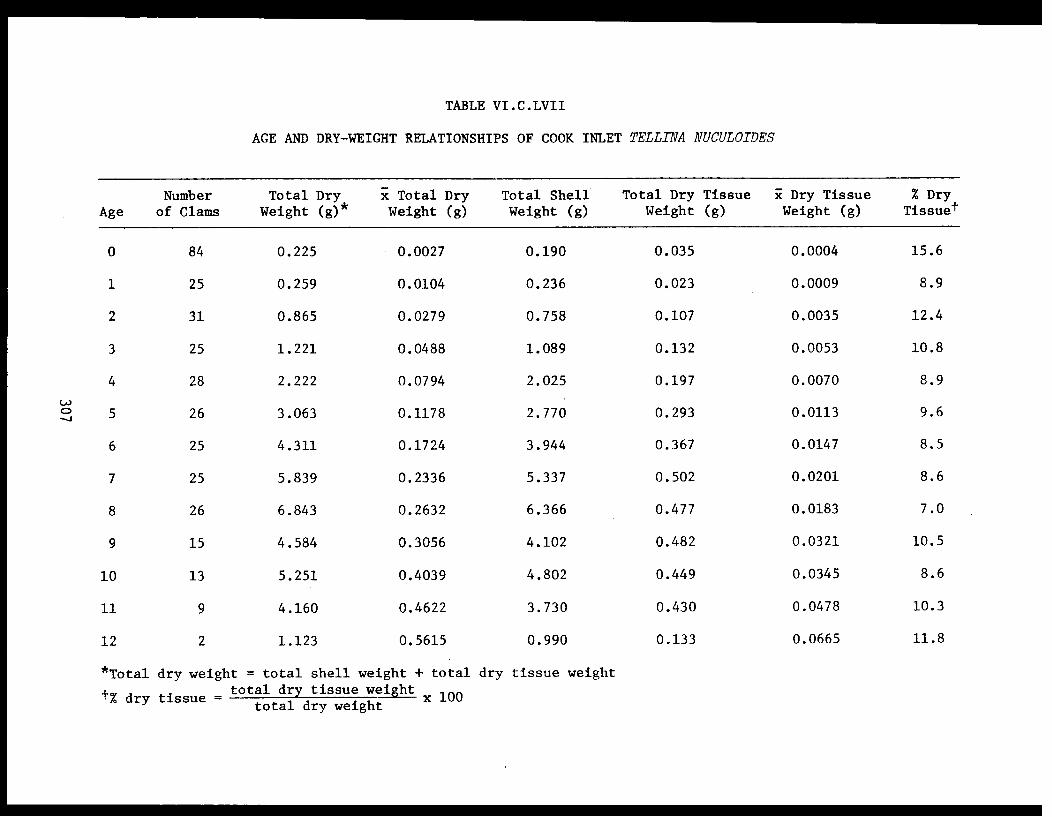
TABLE VI.C.LVII
AGE AND DRY-WEIGHT RELATIONSHIPS OF COOK INLET TELLINA NUCULOIDES
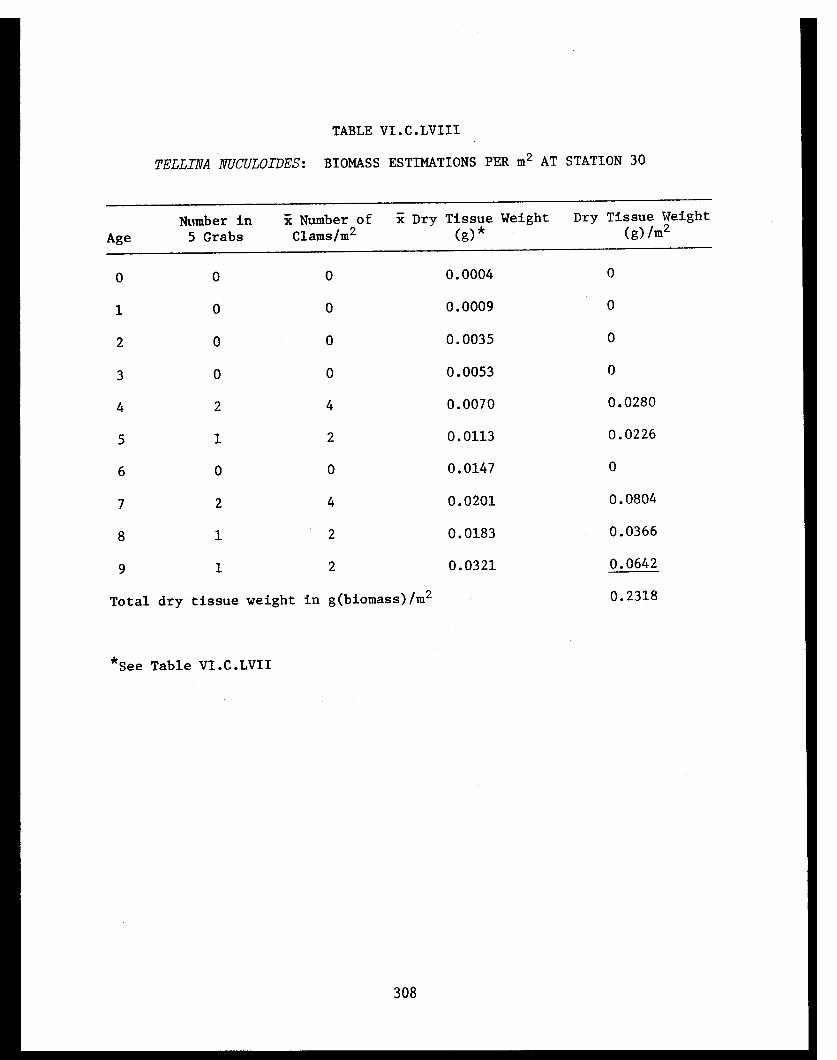
TABLE VI.C.LVIII
TELLINA NUCULOIDES: BIOMASS ESTIMATIONS PER m² AT STATION 30
308

TABLE VI.C.LIX
TELLINA NUCULOIDES: BIOMASS ESTIMATIONS PER m² AT STATION 31
309
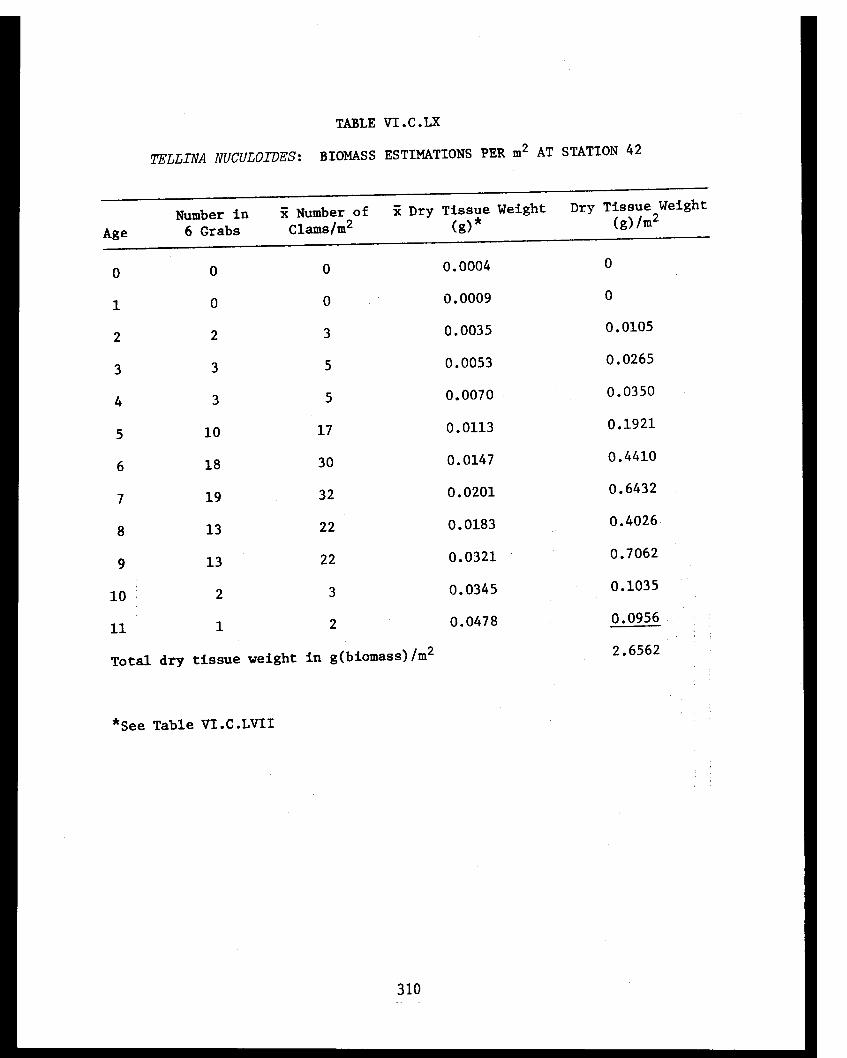
TABLE VI.C.LX
TELLINA NUCULOIDES: BIOMASS ESTIMATIONS PER m² AT STATION 42
310
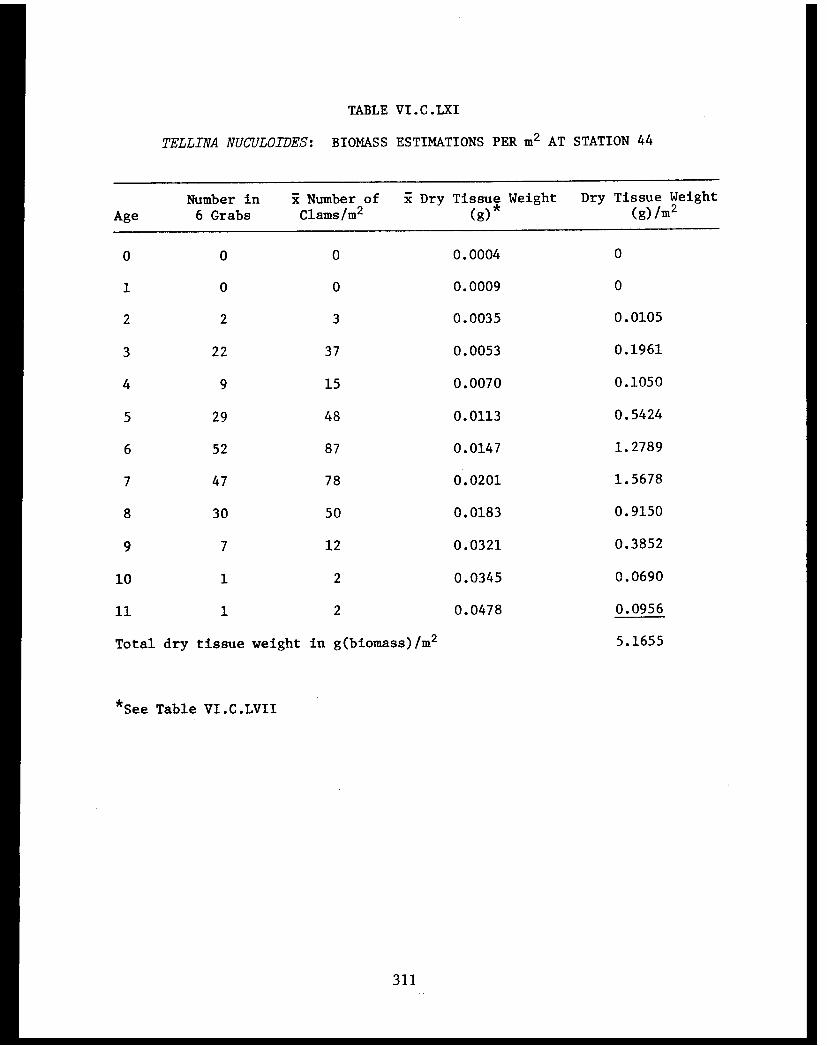
TABLE VI.C.LXI
TELLINA NUCULOIDES: BIOMASS ESTIMATIONS PER m² AT STATION 44
311

TABLE VI.C.LXII
TELLINA NUCULOIDES: BIOMASS ESTIMATIONS PER m² AT STATION 63
312
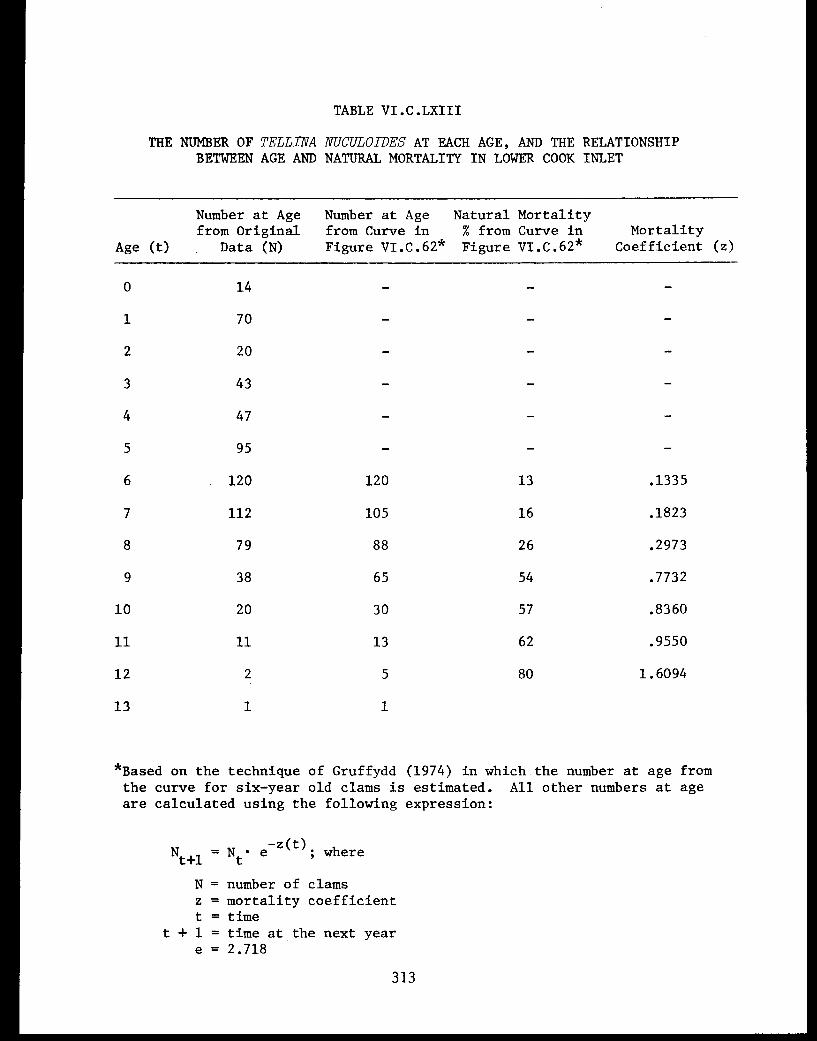
TABLE VI.C.LXIII
THE NUMBER OF TELLINA NUCULOIDES AT EACH AGE, AND THE RELATIONSHIPBETWEEN AGE AND NATURAL MORTALITY IN LOWER COOK INLET
313
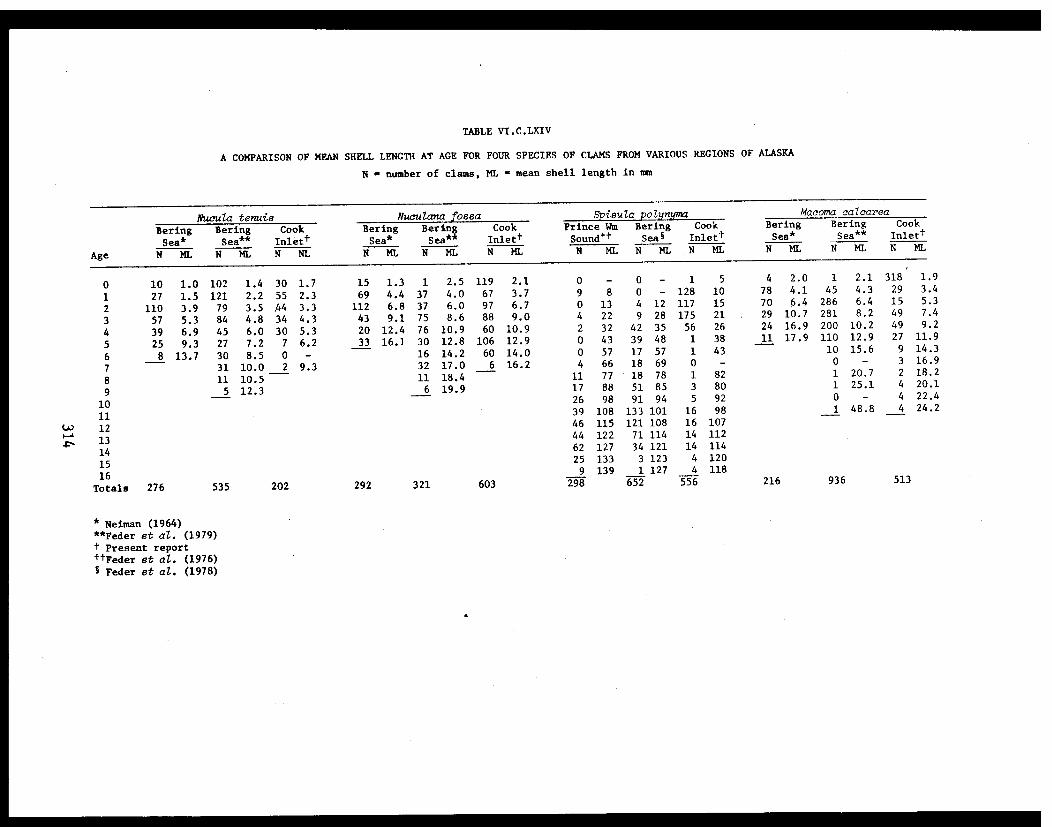
TABLE VI.C.LXIV
A COMPARISON OF MEAN SHELL LENGTH AT AGE FOR FOUR SPECIES OF CLAMS FROM VARIOUS REGIONS OF ALASKA
N - number of clams, ML - mean shell length in mm
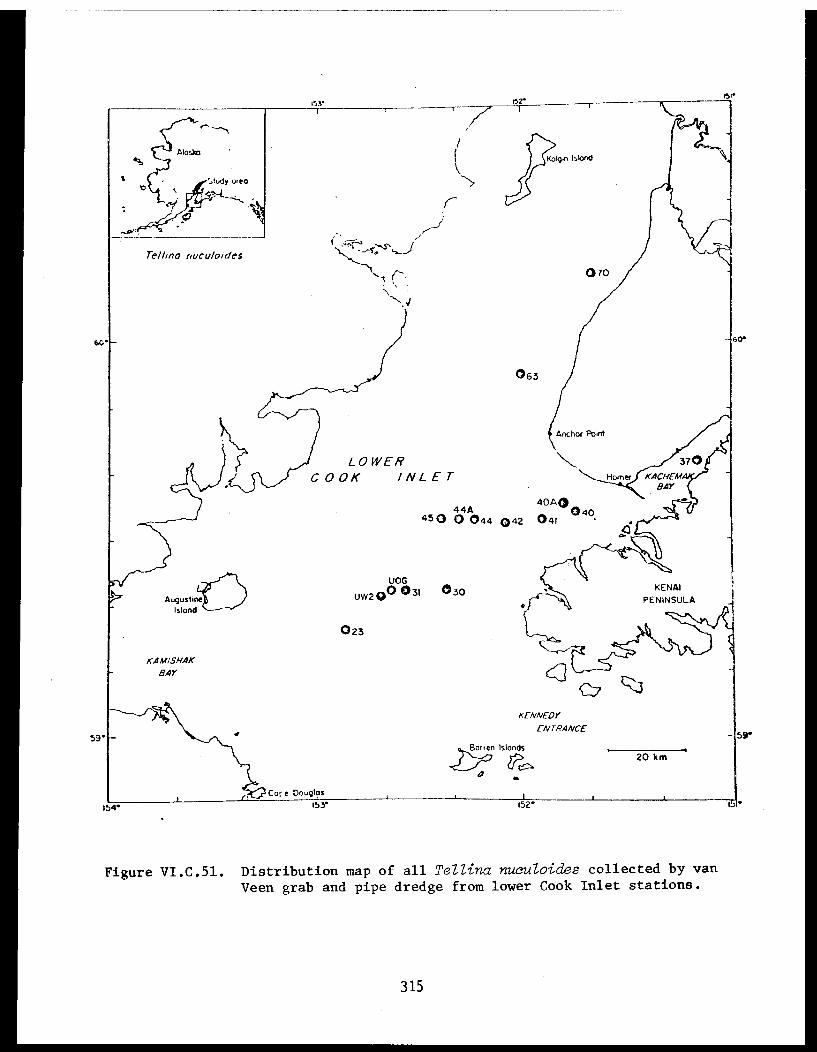
Figure VI.C.51. Distribution map of all Tellina nuculoides collected by vanVeen grab and pipe dredge from lower Cook Inlet stations.
315

Figure VI.C.52. Growth history of
Tellina nuculoides from nine
Cook Inlet stations; UW2,30, 31, 40A, 41, 42, 44, 45,
and 63.
Figure VI.C.53. Growth history of
Tellina nuculoides from
Cook Inlet Station 31.
316
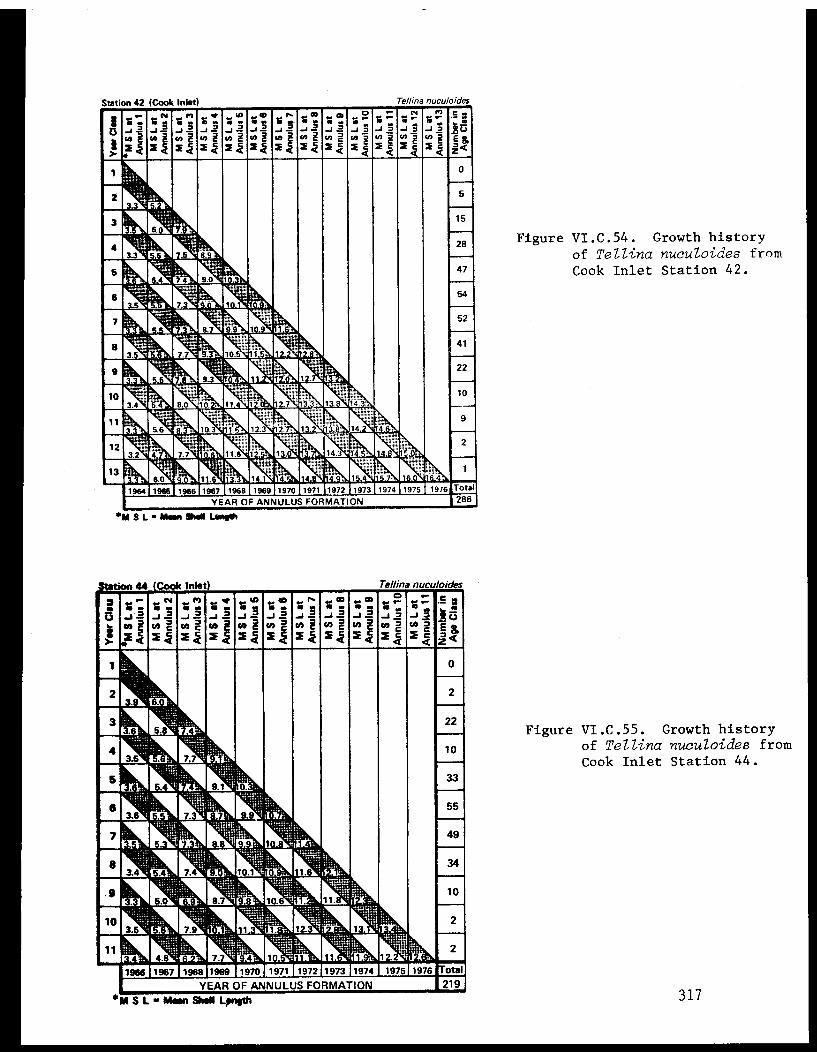
Figure VI.C.54. Growth history
of Tellina nuculoides from
Cook Inlet Station 42.
Figure VI.C.55. Growth historyof Tellina nuculoides fromCook Inlet Station 44.
317
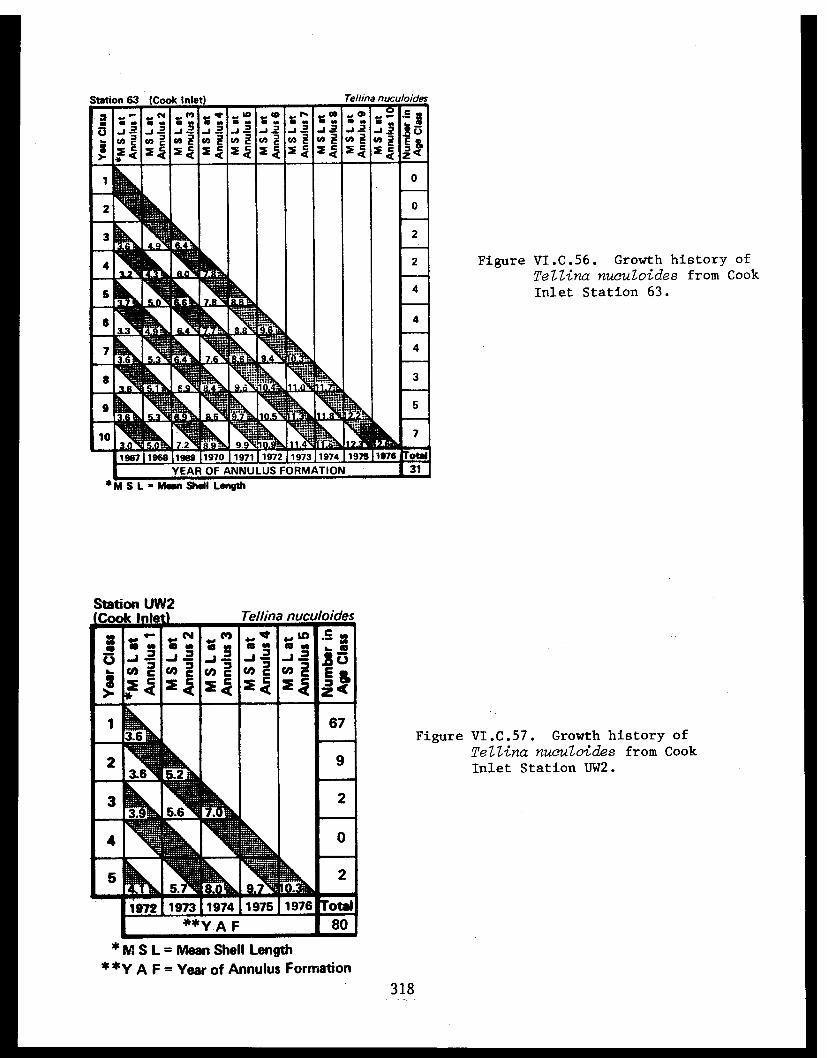
Figure VI.C.56. Growth history ofTellina nuculoides from CookInlet Station 63.
Figure VI.C.57. Growth history ofTellina nuculoides from CookInlet Station UW2.
318
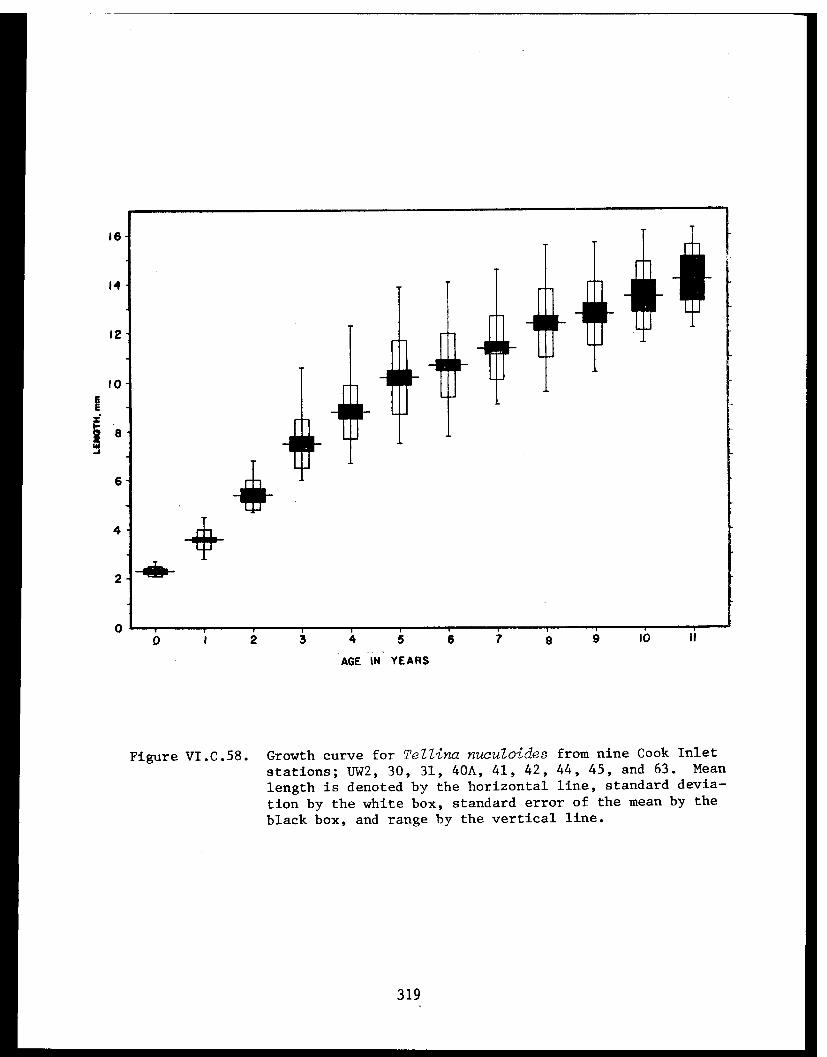
Figure VI.C.58. Growth curve for Tellina nuculoides from nine Cook Inlet
stations; UW2, 30, 31, 40A, 41, 42, 44, 45, and 63. Mean
length is denoted by the horizontal line, standard devia-
tion by the white box, standard error of the mean by the
black box, and range by the vertical line.
319

Figure VI.C.59. Growth curve for Tellina nuculoides from Cook Inlet Sta-
tion 42. Mean length is denoted by the horizontal line,
standard deviation by the white box, standard error of
the mean by the black box, and range by the vertical line.
320
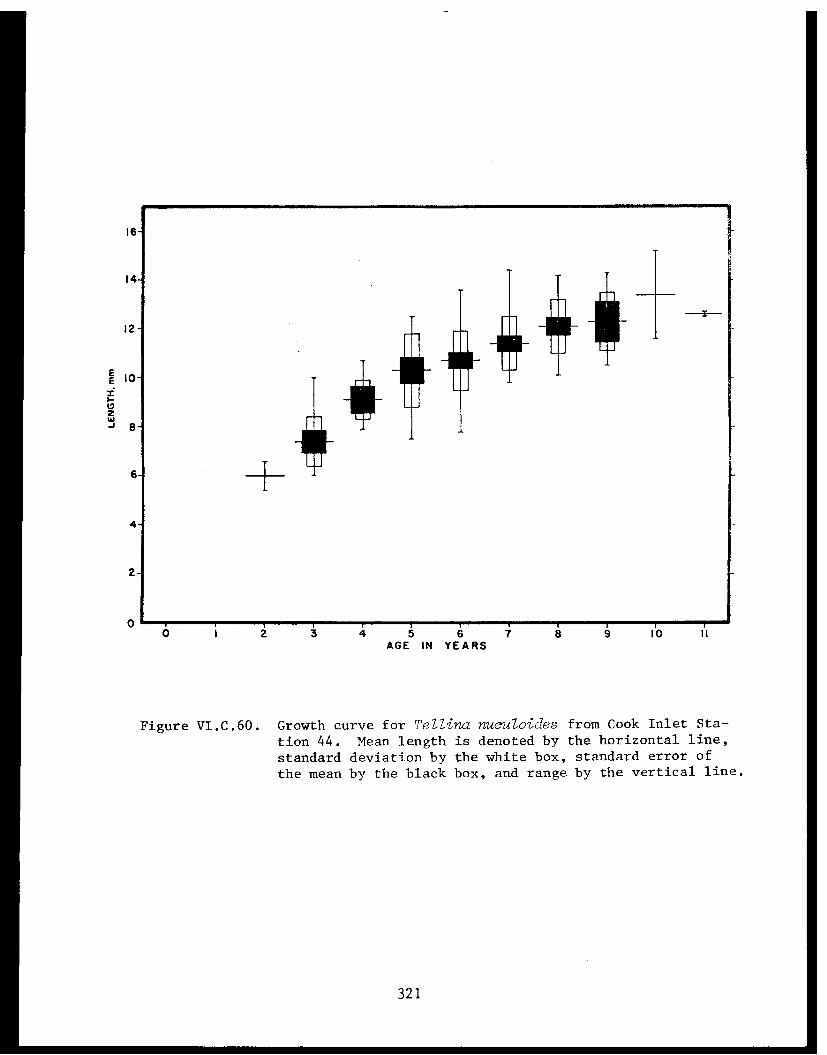
Figure VI.C.60. Growth curve for Tellina nuculoides from Cook Inlet Sta-
tion 44. Mean length is denoted by the horizontal line,
standard deviation by the white box, standard error of
the mean by the black box, and range by the vertical line.
321
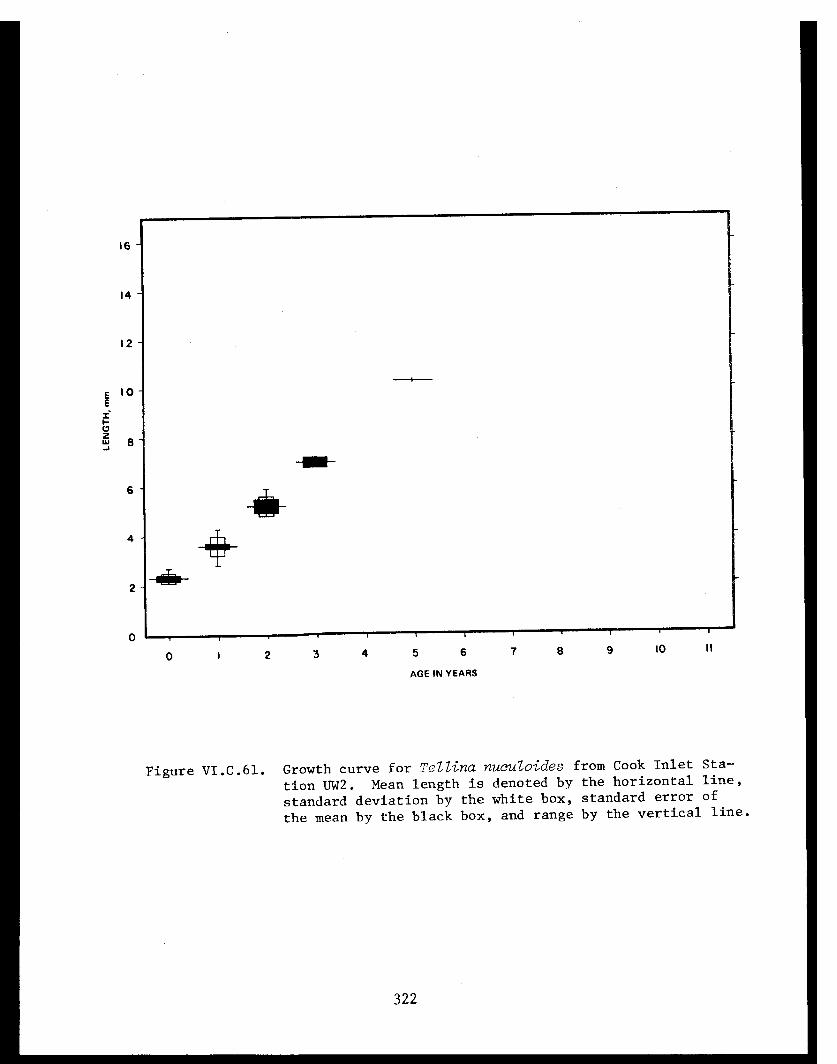
Figure VI.C.61. Growth curve for Tellina nuculoides from Cook Inlet Sta-
tion UW2. Mean length is denoted by the horizontal line,
standard deviation by the white box, standard error of
the mean by the black box, and range by the vertical line.
322
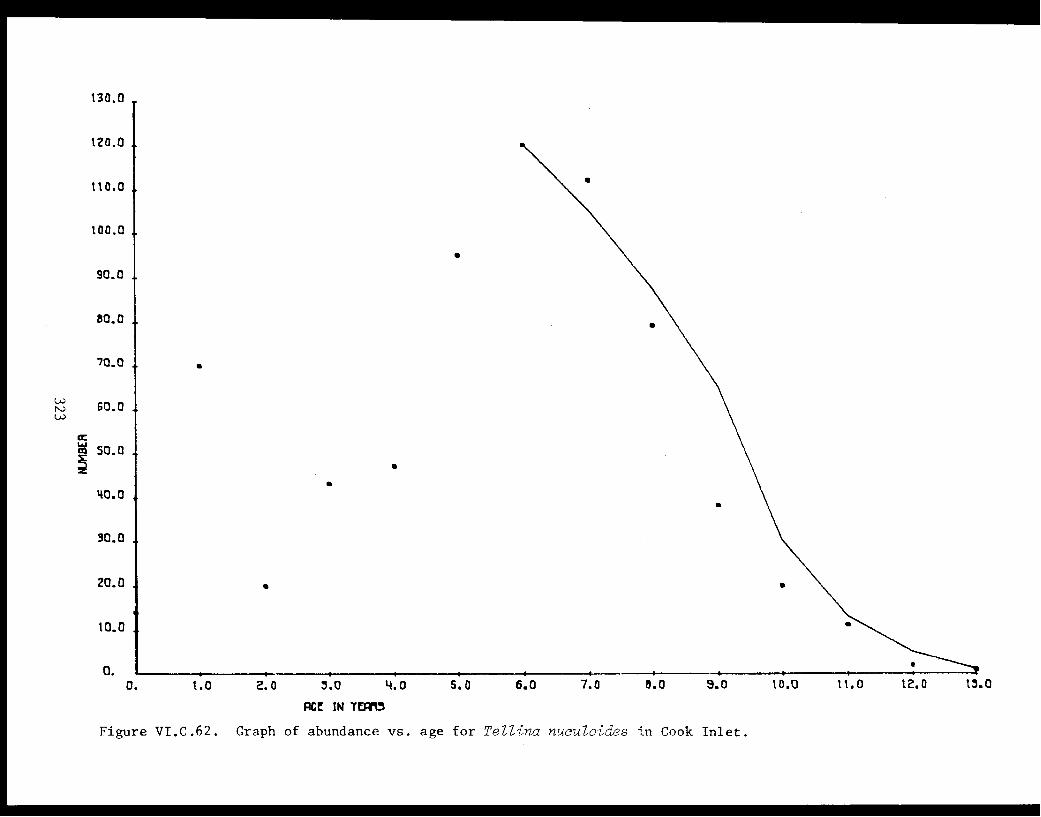
Figure VI.C.62. Graph of abundance vs. age for Tellina nuculoides in Cook Inlet.

SECTION D - IMPORTANT HABITATS FOR BIOLOGICALLY IMPORTANT INVERTEBRATES
Major concentrations of snow crabs (Chionoecetes bairdi) were found
primarily in the western part of lower Cook Inlet in all surveys. In
terms of numbers, the largest catches using the try-net in 1977 and 1978,
occurred at Stations 5 (111 crab per km fished), 25 (100 per km fished),
A53 (50 per km fished), 8 (43 per km fished), 18 (17 per km fished),
A62 (15 per km fished), and 27 (11 per km fished) (Table VI.D.I). At all
other stations in the Inlet, the average number captured in all trawls was
less than 10 per km fished. In Kachemak Bay, snow crabs were most abundant
at Stations 41 and 40 with an average of 8 and 5 snow crabs per km fished
(Table VI.D.I). See Feder et al. (1978) for distribution maps of the follow-
ing dominant lower Cook Inlet epifaunal species collected in 1976; Chionoecetes
bairdi, Hyas lyratus, Oregonia gracilis, Paralithodes camtschatica, Pagurus
ochotensis, Elassochirus tenuimanus, Crangon dalli, Neptunea lyrata, Fusitriton
oregonensis, Echinarachnius parma.
The size distribution data for snow crabs (Table VI.D.II) indicate that
the areas sampled are inhabited by size segregated populations. Snow crabs
less than 20 mm carapace width were encountered primarily near the mouth of
the Inlet and lower Kamishak Bay. Station 5 was the area where these small
crabs were most abundant ranging from 7 to 414 per km fished. Station 8
(4 to 135 per km fished) and 25 (8 to 238 per km fished) also had significant
numbers of these young crabs (Table VI.D.II). The size frequency of these
small snow crab at Station 8 is presented in Table VI.D.III. The size dis-
tribution data suggest the existence of a nursery area for snow crabs that
encompasses Stations 5, 6, 7, 8, 18, 23, 25, 53, A53 (Table VI.D.II), and
other nearby stations not sampled. Stations 6 and 23 are in the current
lease area and the other stations, with the exception of 53 and A53, are
directly in the path of prevailing currents which flow southward over the
lease area. The absence of snow crabs less than 20 mm carapace width in the
Kachemak Bay area is puzzling since the area supports a commercial fishery.
Their absence in Kachemak Bay may be due to recruitment failure, or perhaps
crabs move from the nursery area described above or from other nursery areas
not discovered, to Kachemak Bay and other parts of the Inlet. Further ob-
servations on the distribution of these small crabs are necessary to determine
324
the importance of nursery areas as a source of recruitment to Cook Inlet
and the adjacent Gulf of Alaska.
The trawl contents at Stations 5 through 8, where juvenile snow crabs
are most abundant (Table VI.D.II and VI.D.IV), are dominated by small
sponges intermixed with hydroid fragments, polychaete tubes, and crustacean
and mollusc fragments. The most common polychaete tubes associated with
the sponges are those of Spiochaetopterus typicus. After removing all
motile organisms the composition of the remaining material by per cent
weight and volume is as follows:
Wet Weight (%) Volume (%)
Sponge 70 67
Hydroid and worm tubes 12 14
Hydroids 6 6
Crustaceans andmollusc fragments 12 13
Totals 100 100
A variety of infaunal and epifaunal species are associated with the
sponge aggregate (see Table VI.D.IV and Section A).
Low numbers of sub-adult crabs 21 to 80 mm carapace widths, were en-
countered at all snow crab study stations (Table VI.D.II). Perhaps snow
crabs of this size range inhabit shallow waters not sampled. It is es-
sential to know where this important size group of crab is located if the
dynamics of this important species and its potential interaction with
oil is to be comprehended. Information on the highest observed abundance
of snow crab, all sizes included, are presented in Table VI.D.V).
Female snow crabs with eggs constituted significant percentages of
the catches at the following stations on the west side of the Inlet:
Station 62 (20%), PMEL 1 (12%), 54 (13%), 53 (4%), and 23 (4%) (see Table
VI.D.I). Near the mouth of the Inlet at Station 6, 17% of the snow crabs
captured were females with eggs. In Kachemak Bay 25% to 69% of the snow
crabs captured were females with eggs (pooled data from trawls November 1977
to August 1978). These areas must be considered critical habitats because
moulting success of snow crabs and survival of their zoeae are negatively
325
affected by crude oil (Rice et al., 1976). No newly moulted females or
females with hatching eggs were collected during the study period 1977-78
(see ADF&G, 1976 for data on migration, moulting and mating in snow crabs).
On the west side of lower Cook Inlet king crabs were most abundant
at Stations 35 (20 per km fished), and 27 (8 per km fished; see Table
VI.D.I). No king crabs were captured near the mouth of the Inlet in
1977 or 1978, although they were collected at Stations A5, 6, and 8 in
1976. In Kachemak Bay, king crabs were most abundant at Stations 43
(30 per km fished), 39 (16 per km fished), A40 (9 per km fished) and 40
(2 per km fished). In both Kamishak Bay and Kachemak Bay in excess of
20% of all king crab captured were females with eggs (Table VI.D.I).
Juvenile king crab did not make up a significant portion of any of the
catch at the stations sampled. Over 95% of the king crabs captured were
sexually mature individuals. No "pods" of juveniles were encountered.
Soft-shell male king crabs were encountered in March at Station 41, in
May at Station 54, and June at Station PMEL 7. One grasping pair was
captured in March at Station 55. Soft-shell females were observed at
Station 53 in June and July, and Station 35 in June. By June, the
majority of the crabs captured had new carapaces. (See ADF&G, 1976 for
data on migration, moulting, and mating in king crabs).
Dungeness crab were captured with regularity at Stations 40 (13 per
km fished), A40 (8 per km fished), and 41 (6 per km fished; see Table
VI.D.I). Females with eggs constituted 19%, 2%, and 3%, respectively, of
the catch at these same stations. In August, 64 Dungeness crab with cara-
pace widths of 22 to 45 mm were captured at Station A40. The remainder
of the Dungeness crab captured were generally over 100 mm in carapace width.
In non-quantitative trawls taken in June, 99% (n = 45) of the mature fe-
males examined had egg clutches. In July, only one female (n = 36) with
eggs was observed. Kachemak Bay must be considered as the most important
habitat for Dungeness crab in Cook Inlet (see ADF&G 1976 for data on migra-
tion, moulting, and mating in Dungeness crab. Distribution data for dominant
species is also included in Section A.
The pink shrimp (Pandalus borealis) was encountered in the greatest
abundance at Station 37, inner Kachemak Bay, where catches for all trawls
326
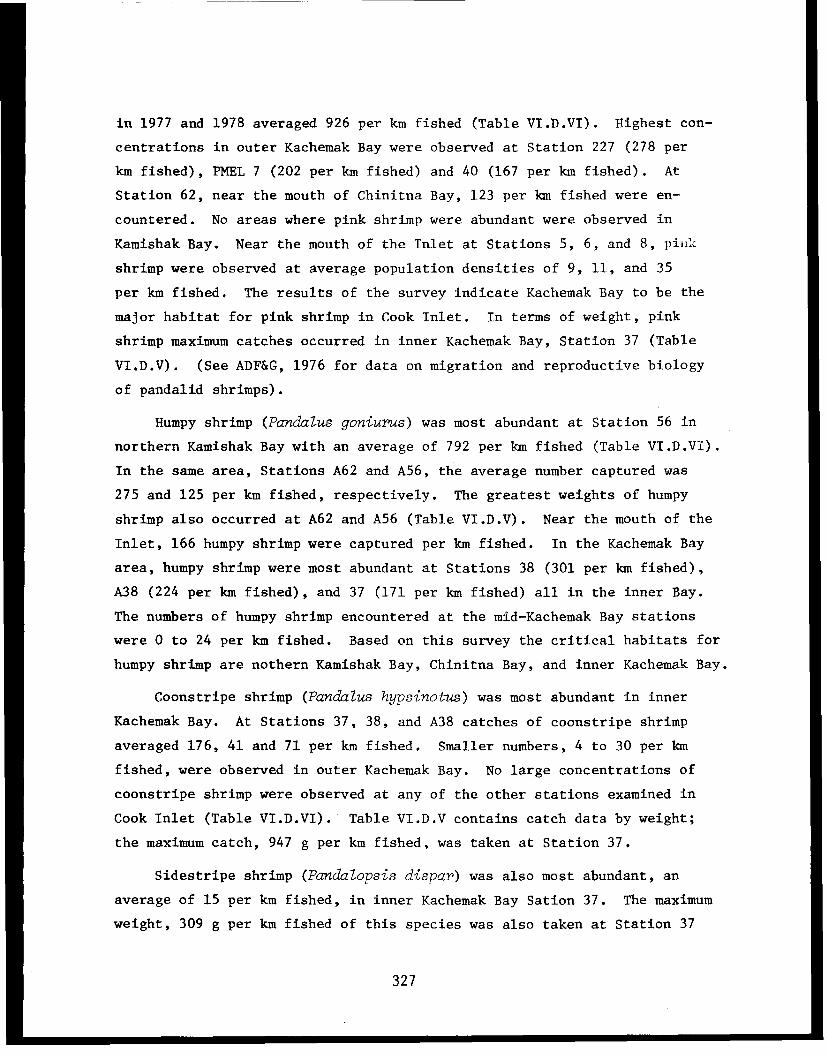
in 1977 and 1978 averaged 926 per km fished (Table VI.D.VI). Highest con-
centrations in outer Kachemak Bay were observed at Station 227 (278 per
km fished), PMEL 7 (202 per km fished) and 40 (167 per km fished). At
Station 62, near the mouth of Chinitna Bay, 123 per km fished were en-
countered. No areas where pink shrimp were abundant were observed in
Kamishak Bay. Near the mouth of the Inlet at Stations 5, 6, and 8, pink
shrimp were observed at average population densities of 9, 11, and 35
per km fished. The results of the survey indicate Kachemak Bay to be the
major habitat for pink shrimp in Cook Inlet. In terms of weight, pink
shrimp maximum catches occurred in inner Kachemak Bay, Station 37 (Table
VI.D.V). (See ADF&G, 1976 for data on migration and reproductive biology
of pandalid shrimps).
Humpy shrimp (Pandalus goniurus) was most abundant at Station 56 in
northern Kamishak Bay with an average of 792 per km fished (Table VI.D.VI).
In the same area, Stations A62 and A56, the average number captured was
275 and 125 per km fished, respectively. The greatest weights of humpy
shrimp also occurred at A62 and A56 (Table VI.D.V). Near the mouth of the
Inlet, 166 humpy shrimp were captured per km fished. In the Kachemak Bay
area, humpy shrimp were most abundant at Stations 38 (301 per km fished),
A38 (224 per km fished), and 37 (171 per km fished) all in the inner Bay.
The numbers of humpy shrimp encountered at the mid-Kachemak Bay stations
were 0 to 24 per km fished. Based on this survey the critical habitats for
humpy shrimp are nothern Kamishak Bay, Chinitna Bay, and inner Kachemak Bay.
Coonstripe shrimp (Pandalus hypsinotus) was most abundant in inner
Kachemak Bay. At Stations 37, 38, and A38 catches of coonstripe shrimp
averaged 176, 41 and 71 per km fished. Smaller numbers, 4 to 30 per km
fished, were observed in outer Kachemak Bay. No large concentrations of
coonstripe shrimp were observed at any of the other stations examined in
Cook Inlet (Table VI.D.VI). Table VI.D.V contains catch data by weight;
the maximum catch, 947 g per km fished, was taken at Station 37.
Sidestripe shrimp (Pandalopsis dispar) was also most abundant, an
average of 15 per km fished, in inner Kachemak Bay Sation 37. The maximum
weight, 309 g per km fished of this species was also taken at Station 37
327
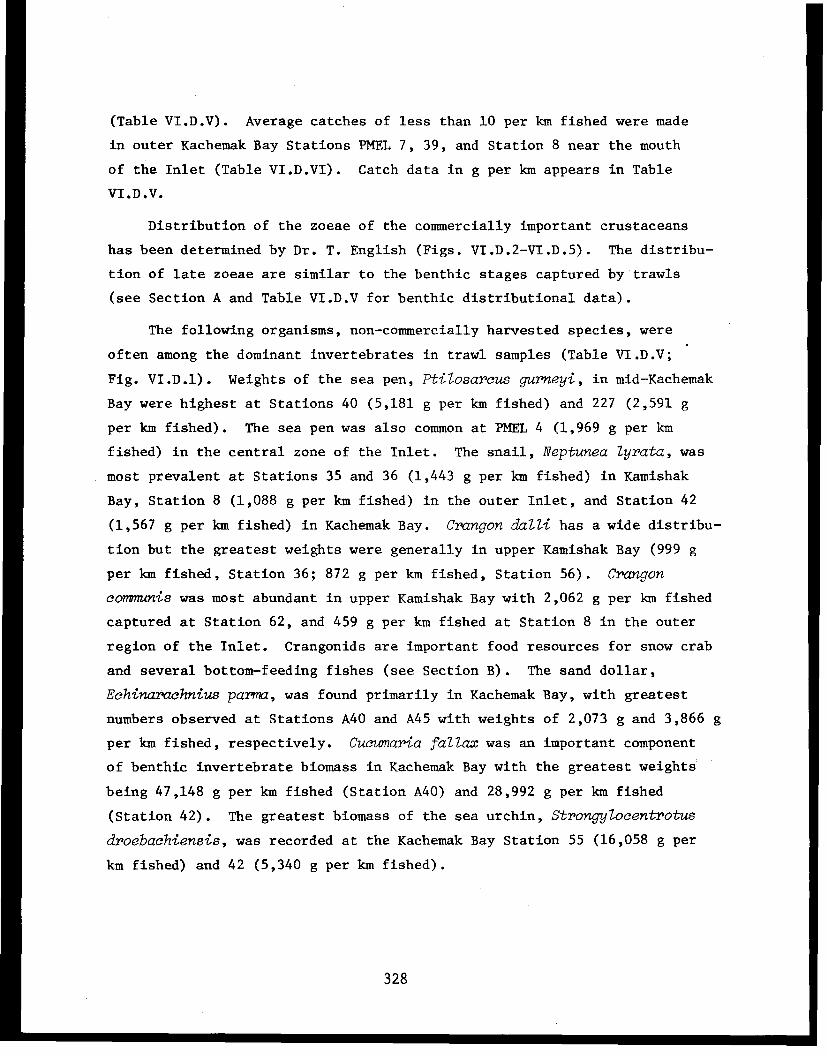
(Table VI.D.V). Average catches of less than 10 per km fished were made
in outer Kachemak Bay Stations PMEL 7, 39, and Station 8 near the mouth
of the Inlet (Table VI.D.VI). Catch data in g per km appears in Table
VI.D.V.
Distribution of the zoeae of the commercially important crustaceans
has been determined by Dr. T. English (Figs. VI.D.2-VI.D.5). The distribu-
tion of late zoeae are similar to the benthic stages captured by trawls
(see Section A and Table VI.D.V for benthic distributional data).
The following organisms, non-commercially harvested species, were
often among the dominant invertebrates in trawl samples (Table VI.D.V;
Fig. VI.D.1). Weights of the sea pen, Ptilosarcus gurneyi, in mid-Kachemak
Bay were highest at Stations 40 (5,181 g per km fished) and 227 (2,591 g
per km fished). The sea pen was also common at PMEL 4 (1,969 g per km
fished) in the central zone of the Inlet. The snail, Neptunea lyrata, was
most prevalent at Stations 35 and 36 (1,443 g per km fished) in Kamishak
Bay, Station 8 (1,088 g per km fished) in the outer Inlet, and Station 42
(1,567 g per km fished) in Kachemak Bay. Crangon dalli has a wide distribu-
tion but the greatest weights were generally in upper Kamishak Bay (999 g
per km fished, Station 36; 872 g per km fished, Station 56). Crangon
communis was most abundant in upper Kamishak Bay with 2,062 g per km fished
captured at Station 62, and 459 g per km fished at Station 8 in the outer
region of the Inlet. Crangonids are important food resources for snow crab
and several bottom-feeding fishes (see Section B). The sand dollar,
Echinarachnius parma, was found primarily in Kachemak Bay, with greatest
numbers observed at Stations A40 and A45 with weights of 2,073 g and 3,866 g
per km fished, respectively. Cucumaria fallax was an important component
of benthic invertebrate biomass in Kachemak Bay with the greatest weights
being 47,148 g per km fished (Station A40) and 28,992 g per km fished
(Station 42). The greatest biomass of the sea urchin, Strongylocentrotus
droebachiensis, was recorded at the Kachemak Bay Station 55 (16,058 g per
km fished) and 42 (5,340 g per km fished).
328
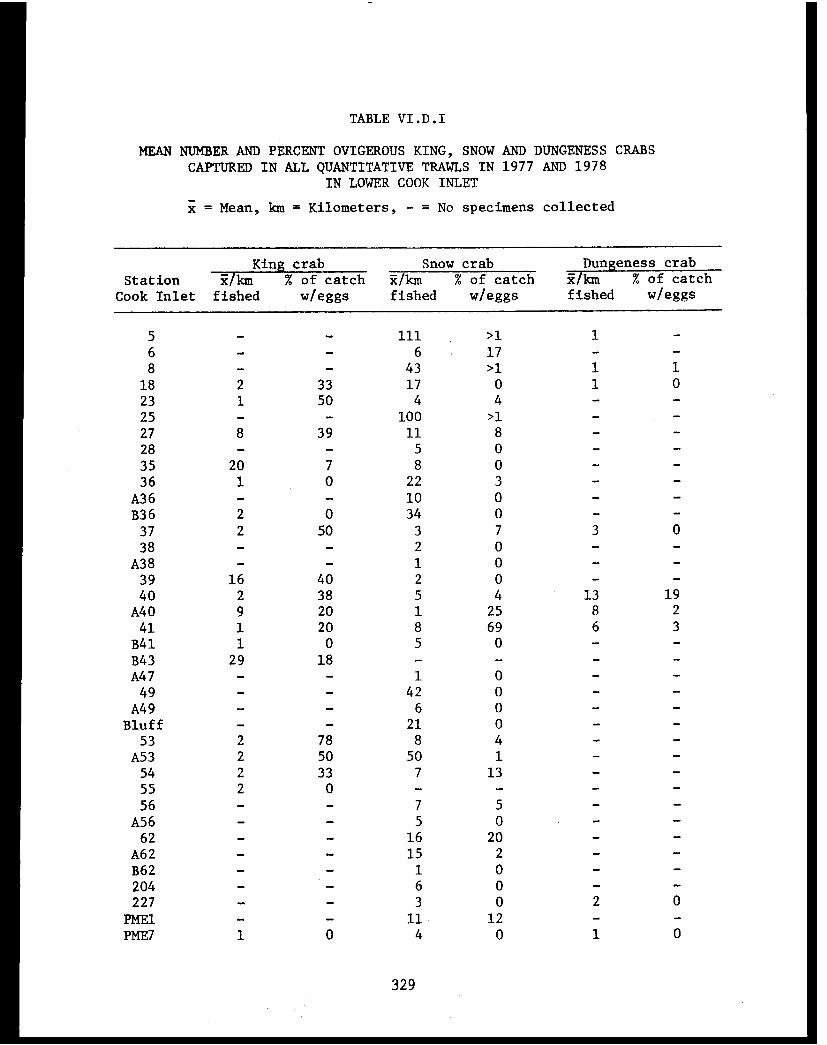
TABLE VI.D.I
MEAN NUMBER AND PERCENT OVIGEROUS KING, SNOW AND DUNGENESS CRABSCAPTURED IN ALL QUANTITATIVE TRAWLS IN 1977 AND 1978
IN LOWER COOK INLET
329
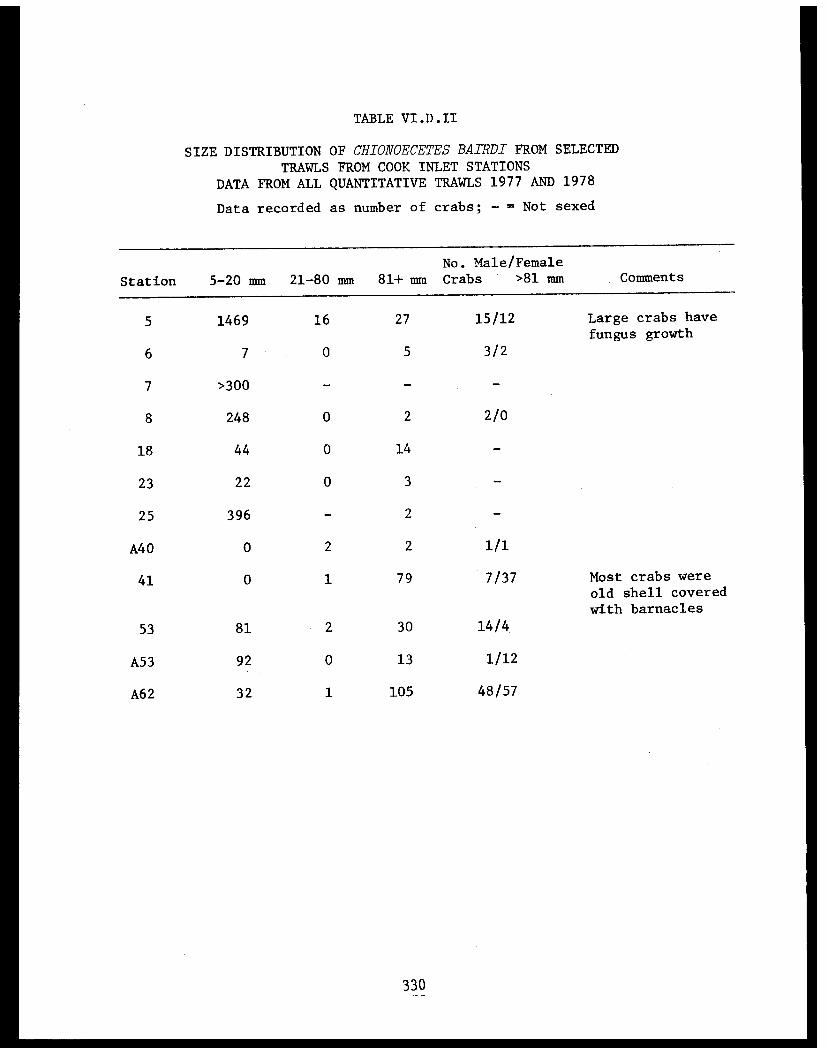
TABLE VI.D.II
SIZE DISTRIBUTION OF CHIONOECETES BAIRDI FROM SELECTED
TRAWLS FROM COOK INLET STATIONS
DATA FROM ALL QUANTITATIVE TRAWLS 1977 AND 1978
330
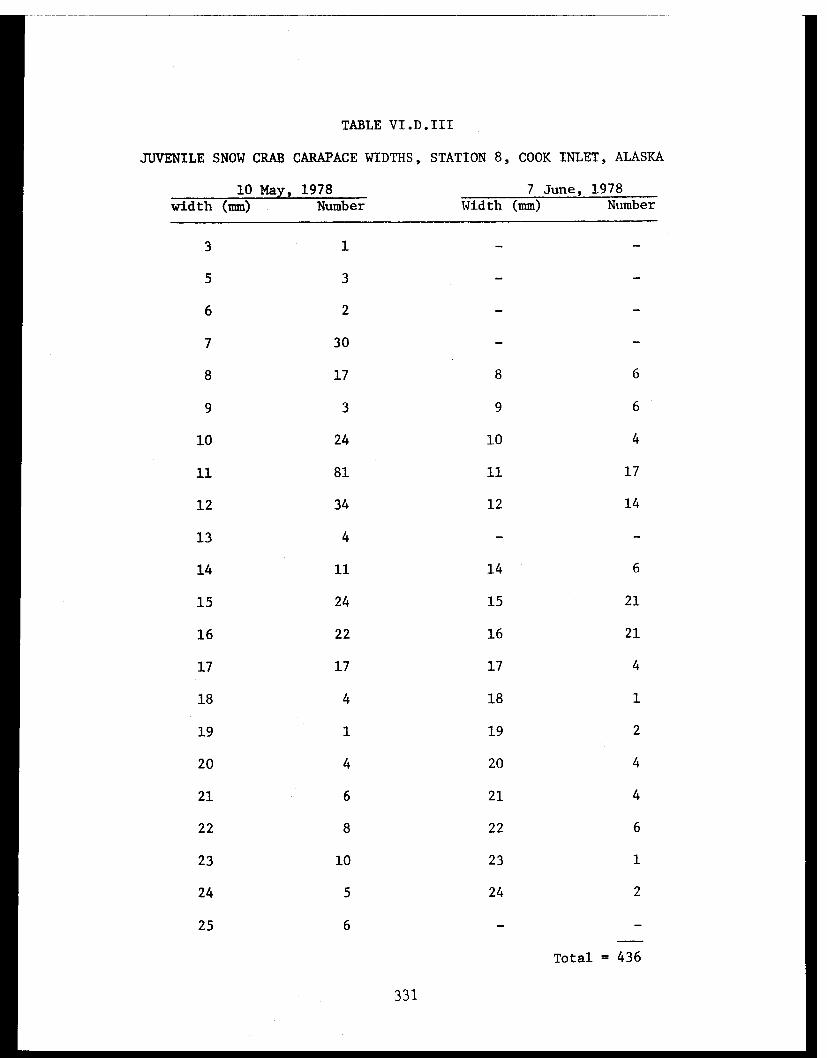
TABLE VI.D.III
JUVENILE SNOW CRAB CARAPACE WIDTHS, STATION 8, COOK INLET, ALASKA
331

TABLE VI.D.IV
FAUNA ASSOCIATED WITH JUVENILE SNOW CRAB AT STATION 8, COOK INLET
332

TABLE VI.D.IV
CONTINUED
333
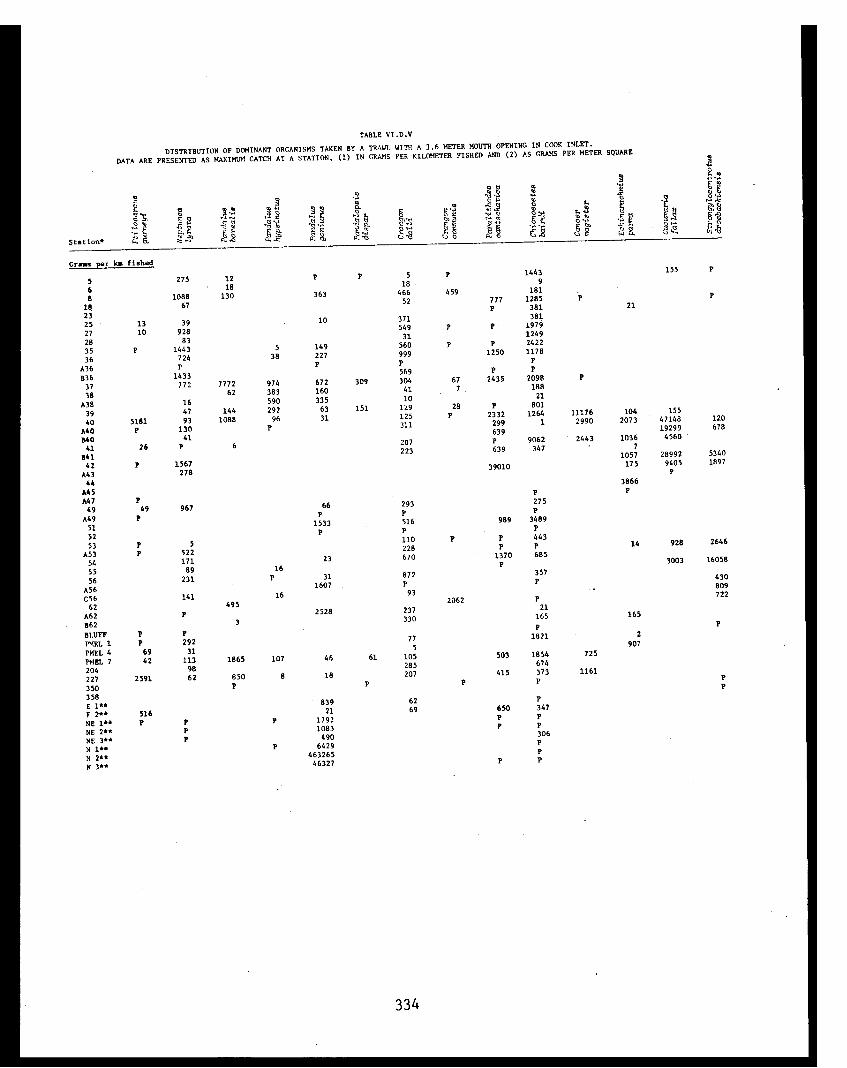
TABLE VI.D.V
DISTRIBUTION OF DOMINANT ORGANISMS TAKEN BY A TRAWL WITH A 3.6 METER MOUTH OPENING IN COOK INLET.
DATA ARE PRESENTED AS MAXIMUM CATCH AT A STATION, (1) IN GRAMS PER KILOMETER FISHED AND (2) AS GRAMS PER METER SQUARE
334
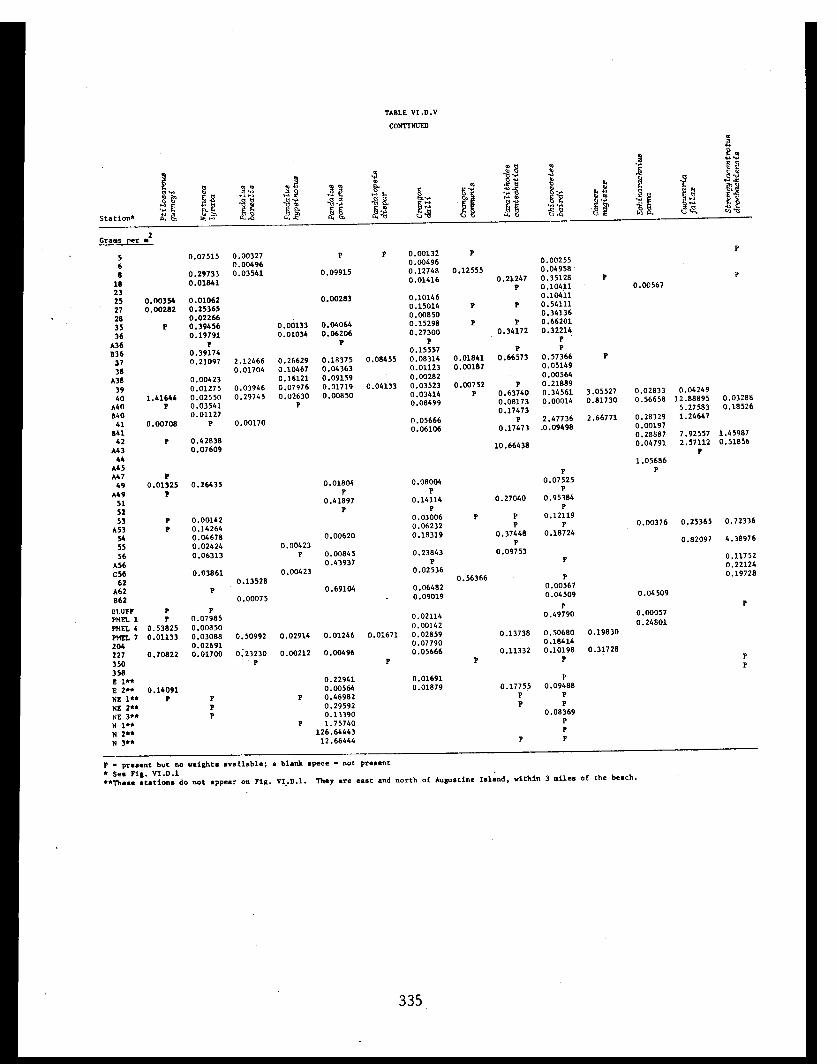
TABLE VI.D.V
CONTINUED
335
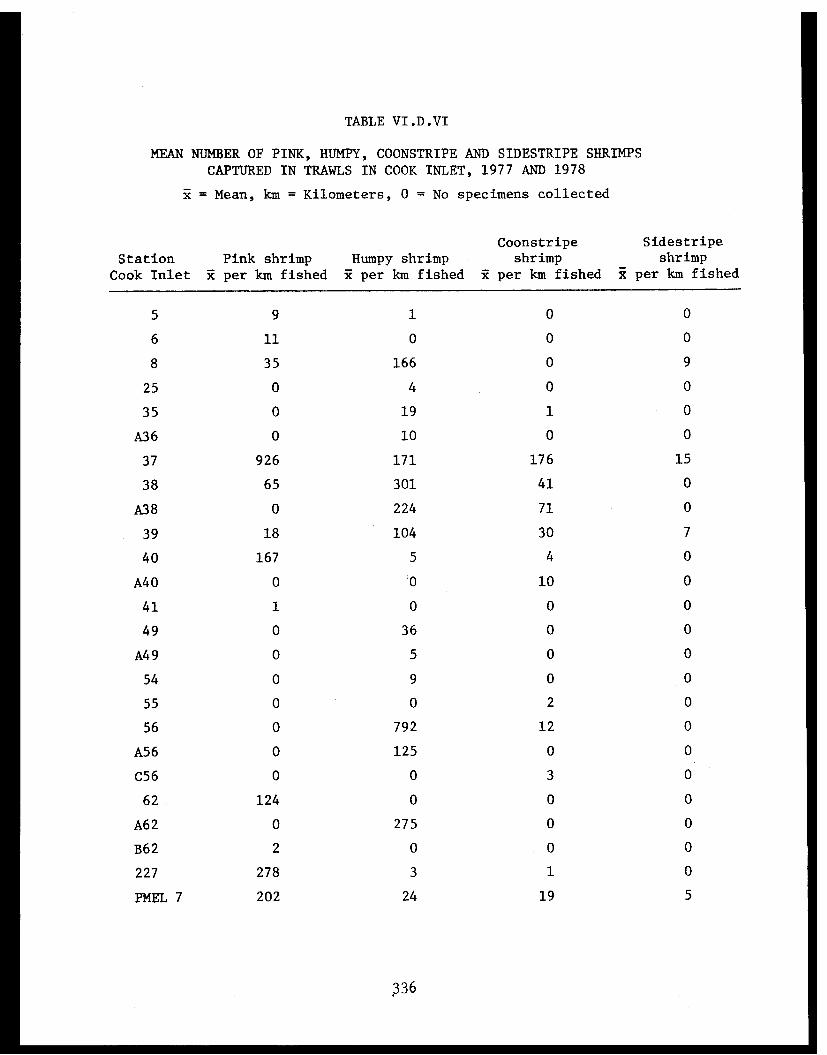
TABLE VI.D.VI
MEAN NUMBER OF PINK, HUMPY, COONSTRIPE AND SIDESTRIPE SHRIMPSCAPTURED IN TRAWLS IN COOK INLET, 1977 AND 1978
336
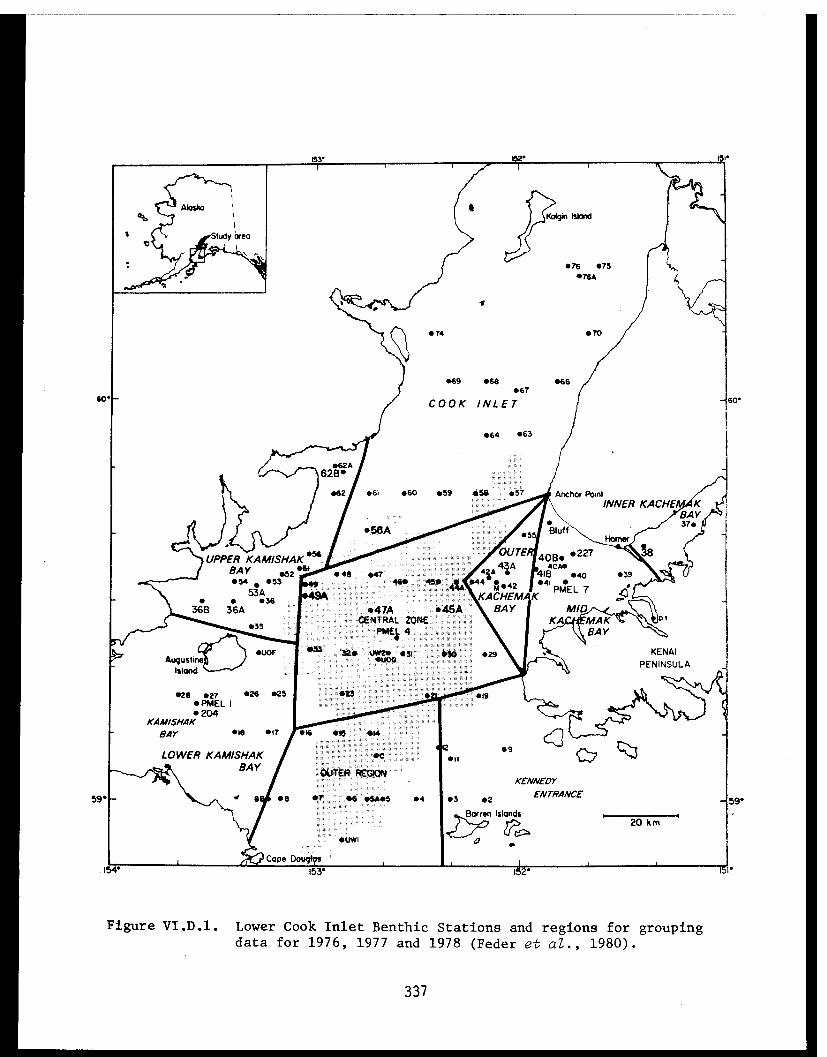
Figure VI.D.1. Lower Cook Inlet Benthic Stations and regions for groupingdata for 1976, 1977 and 1978 (Feder et al., 1980).
337

Figure VI.D.2. Distribution of crab stage I zoeae(data from Dr. Tom English).
338
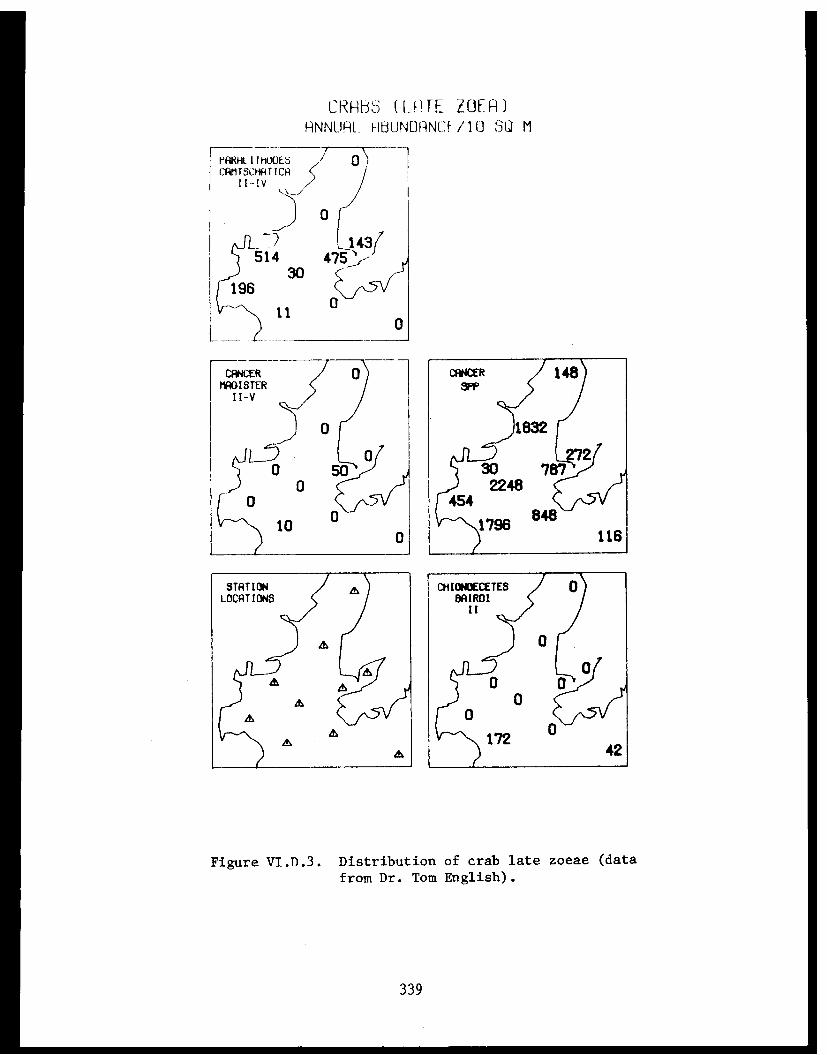
Figure VI.D.3. Distribution of crab late zoeae (data
from Dr. Tom English).
339
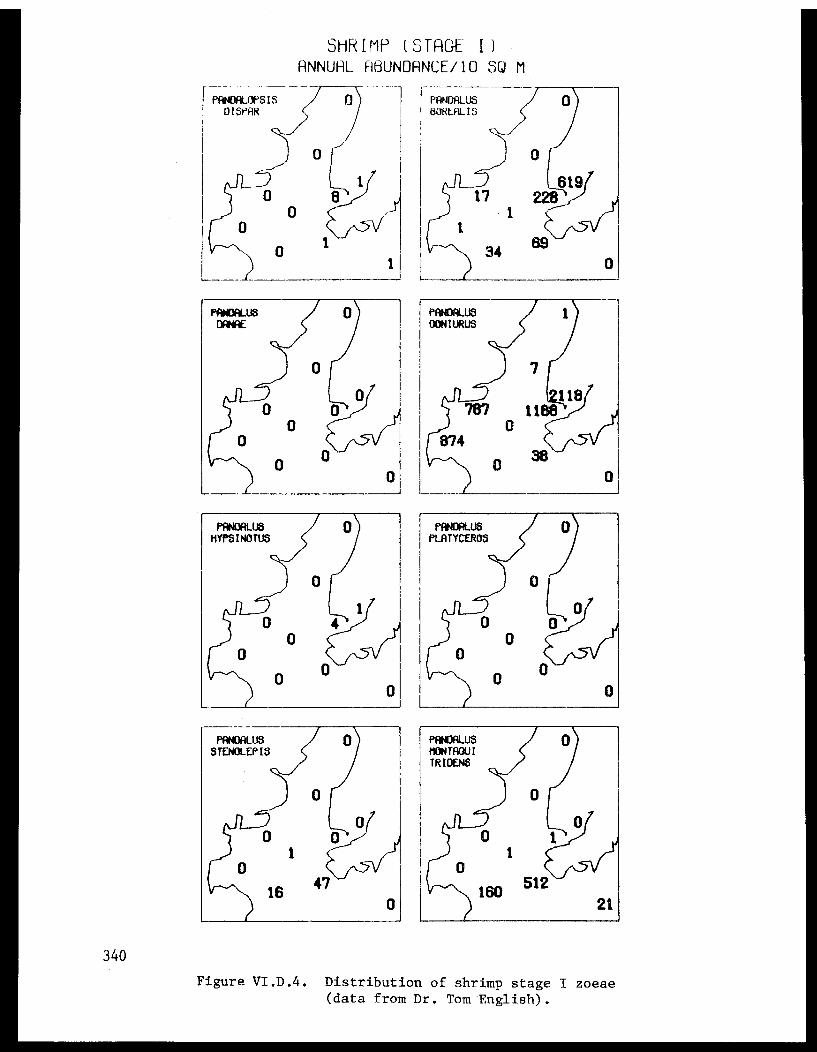
340
Figure VI.D.4. Distribution of shrimp stage I zoeae(data from Dr. Tom English).
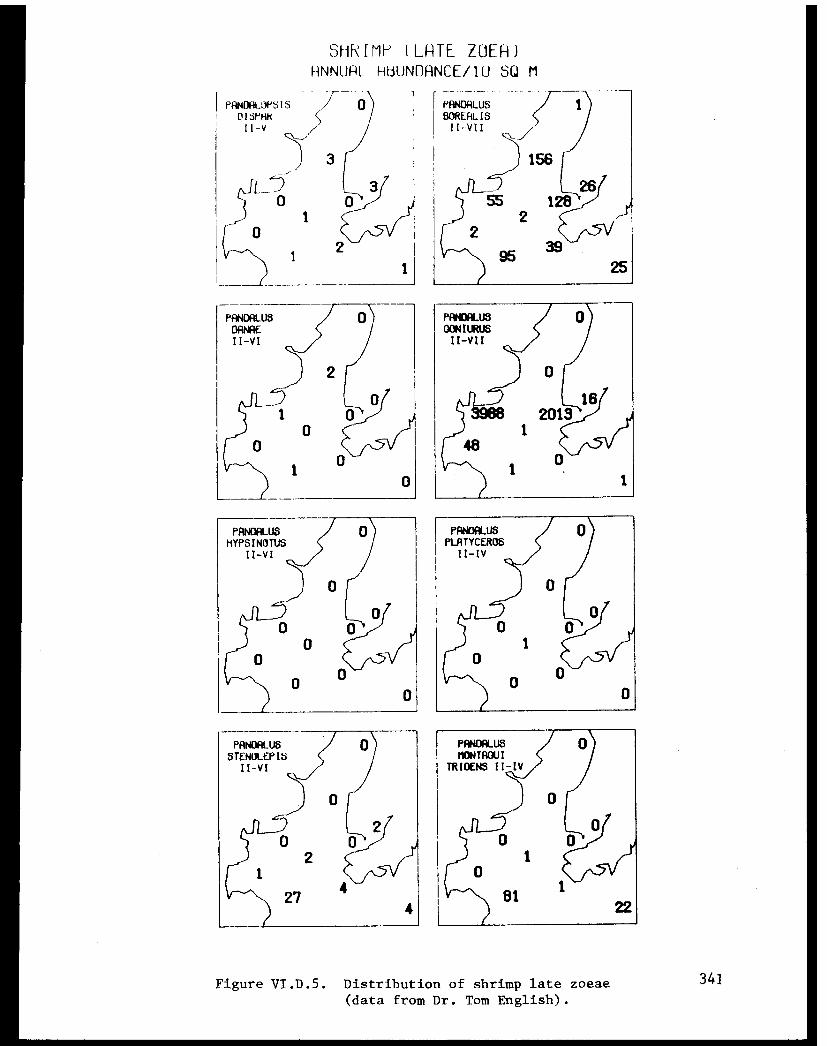
Figure VI.D.5. Distribution of shrimp late zoeae 341
(data from Dr. Tom English).
SECTION E - CRITICAL PERIODS FOR BENTHIC INVERTEBRATES
The egg stages of brooding crustaceans may be sensitive to oil pollu-
tion; however, this remains to be documented. Pink shrimp, Pandalus
borealis, generally carry their eggs from September to April. Snow crab,
Chionoecetes bairdi, and king crab, Paralithodes camtschatica, carry eggs
throughout the year (Al Davis, ADF&G Homer, pers. comm.). Thus, the
critical period for the commercially important crustaceans may include
all twelve months of the year, if their egg development is negatively
effected by oil.
Survival rates of the larva of the commercially harvested crustaceans
in Cook Inlet are negatively effected by the presence of crude oil at the
parts per million concentrations (Rice et al., 1976). Furthermore, if
the behavior of Dungeness crab larvae are typical of other crab and shrimp
species the zoeae cannot detect oil slicks and will swim into them (Rice
et al., 1976). The hatching periods for the commercially important crab
and shrimp are outlined in Fig. VI.E.1. Hatching of snow and king crabs,
pink and humpy shrimps occurs during April to August. The larvae of Dungeness
crab are found in the water from May to December.
Crab and shrimp zoeae require crustacean prey concentrations on the
order of 40 to 80 per liter to feed successfully (see Section B). If oil
contamination negatively effected crustacean prey populations of the zoeae,
then in addition to toxic effect of the oil, these zoeae would be subjected
to the stress of starvation. Likewise, if crustacean prey concentrations
were naturally low or dispersed throughout the water mass at densities less
than 40 per liter by the mixing action of storms the zoeae could be in a
starved condition and would be less likely to survive if further stressed
by oil toxicity.
Water temperature effects the ability of king crab zoeae to capture
prey when prey concentrations are low (see Section B). At temperatures of
2°C king crab zoeae that have failed to feed successfully during the first
2 to 3 days of life are less able to capture prey than zoeae in a similar
state of nutrition held at 4° to 6°C. Therefore, the added stress of oil
pollution would probably be more lethal to this species during the month
342
of April, when temperatures on the order of 2°C may occur, than in later
months when the water is warmer.
Snow crab, Chionoecetes bairdi, exposed to crude oil in the laboratory
exhibit reductions in molting success and automotizing of limbs (Karinen
and Rice, 1974). Therefore, oil pollution of the benthic environment
could have a negative effect on snow crab survival if it occurred during
a molting period. Adult females molt from April to July (A. Davis, ADF&G
Homer, Alaska, pers. comm.). Newly settled snow crab may molt five times
during the first year (Hilsinger, 1976) and, therefore, their molting
period may include all 12 months of the year. The effect of crude oil on
the molting success of the other crab and shrimp species of Cook Inlet is
poorly understood.
343

Figure VI.E.1. Larval periods for Cook Inlet crustaceans. Data from Alaska Department of Fish and Game (Figure takenfrom lower Cook Inlet Synthesis Report).

SECTION F - POTENTIAL FOR IMPACT FROM OCS OIL AND GAS EXPLORATION
Several organisms that are important in terms of numbers, weight,
or economics occur at the benthic stations samples in Kachemak Bay,
Kamishak Bay and near the mouth of the Inlet. Many of these species are
somewhat migratory, and reside in an area for variable lengths of time.
During the period in which they reside in an area one of their major
activities is that of seeking food. Many of the taxonomic groups utilized
as prey by the organisms that dominate in terms of number or weight must
therefore recognized as "key prey species", whose abundance regulate the
population size of their predators in an area. Community dominants have
been suggested in Section A, and further discussion would be repetitious.
Drilling Rigs
Unless an oil spill results during drilling, the major hazard to the
subtidal benthos from drilling will be exposure to drilling muds. The
level of toxicity of drilling muds to subtidal benthos is undescribed.
Shore-based Facilities and Tanker Terminals
Potential new locations of shore-based facilities and tanker terminals
include a possible support and supply facility at Homer, crude oil teminals
and LNG plants in Kennedy Entrance, and at Anchor Point, and production
treatment facilities in Kennedy Entrance, at Anchor Point and at Polly Creek,
near Tuxedni Bay. No facilities are projected south of Tuxedni Bay, on
the west side of Cook Inlet. Thus, impacts from these facilities on sub-
tidal habitats would mainly occur in Kennedy Entrance, in Kachemak Bay,
and near Anchor Point.
The main impacts would arise from acute or chronic oil contamination.
Oil spills could occur at all facilities and from tanker accidents. Chronic
contamination could occur at the production treatment facilities (disposal
of production water) and at tanker terminals (disposal of ballast water
and numerous minor spills).
The subtidal species assemblage in Kennedy Entrance is undescribed
because the area was not trawlable. Therefore, a detailed discussion of
345
potential impact of oil or gas related development is not possible. It
seems probable that routine winter weather conditions would preclude safe,
efficient tanker loading operations in the open waters of Kennedy Entrance,
and thus would dictate that such facilities be located in its major embay-
ments i.c., Port Chatham, Koyuktolik Bay, or Port Graham. The main concern
to subtidal assemblages would be acute oil spills.
Consequences of either acute or chronic contamination at Anchor Point
are of greater concern. Circulation studies indicate the presence of a
gyre system in northwestern Kachemak Bay, over the northern shelf (Burbank,
1977). Residence time of the water mass in this system is not clear, but
patterns of larval abundance suggest that it could act to concentrate
contaminants. As pointed out in Section A and E, this area is part of the
Kachemak Bay critical habitat for pandalid shrimp, king crab, Dungeness
crab and snow crab. Potential effects of oil contamination have been dis-
cussed in Section E.
Pipelines
Pipelines are a potential concern because of the activities associated
with laying the pipe and the possibility of breaks or small chronic leaks.
Distribution of the oil would be dependent on the direction and strength
of currents. Among the areas in which pipelines might effect subtidal
habitats are in Kennedy Entrance and at Anchor Point.
A break in the pipeline would constitute an acute oil spill. The
severity of the spill would depend upon the proximity of the break to the
habitat and the amount of time required to stop the flow from the break.
A pipeline break probably would be more damaging to the subtidal benthos
than a surface spill because unweathered oil would be actively mixed into
the water and with sediment. Because of the turbidity at Anchor Point and
the proximity to the productive areas of Kachemak Bay, this is a special
concern.
Other Concerns
Tanker routes and physical disturbance from boats or aircraft associated
with petroleum exploration and development that do not result in pollution
346

should have little effect on conditions on the subtidal organisms discussed
in this report.
347

VII. REFERENCES
Abbott, R. T. 1974. American Seashells: The marine mollusca of theAtlantic and Pacific coasts of North America. 2nd Edition. VanNostrand Reinhold Company, New York, N.Y. 663 pp.
Alaska Department of Fish and Game (ADF&G). 1976. A Fish and WildlifeResource Inventory of the Cook Inlet-Kodiak Area. Under contractto Alaska Coastal Management Program, Division of Policy Developmentand Planning, Anchorage. 2 Vols., Vol. 2 - Fisheries. 434 pp.
Bigford, T. E. 1978. Effect of several diets on survival, developmenttime, and growth of laboratory-reared spider crab, Libinia emerginata,larvae. Fish. Bull. 76(1):59-64.
Blumer, M. and J. Sass. 1972. Indigenous and petroleum-derived hydro-carbons in a polluted sediment. Mar. Poll. Bull. 3(6):92-93.
Blumer, M., G. Souza and J. Sass. 1971. Hydrocarbon pollution of edibleshellfish by an oil spill. Mar. Biol. 5:195-202.
Brillouin, L. 1962. Science and Information Theory. Academy Press,New York. 169 pp.
Burbank, D. C. 1977. Circulation studies in Kachemak Bay and Lower CookInlet. In Environmental Studies of Kachemak Bay and lower Cook Inlet,Vol. III, Alaska Dept. Fish and Game, Anchorage, Alaska. 207 pp.
Butler, T. H. 1954. Food of the commercial crab in Queen CharlotteIslands region. Fish. Res. Bd. Can., Pacif. Prog. Rep. No. 99:3-5.
Clifford, H. T. and W. Stephenson. 1975. An Introduction to NumericalClassification. Academic Press. 22 pp.
Crow, J. H. 1977. Food habits of shrimp in Kachemak Bay, Alaska. L. L.Trasky, L. B. Flagg and D. C. Burbank (eds.), Environmental Studiesof Kachemak Bay and Lower Cook Inlet, Alaska Dept. Fish and Game.6:32 pp.
Damkaer, D. 1977. Initial zooplankton investigations in Prince WilliamSound, Gulf of Alaska and Lower Cook Inlet, 137-274. In Environ-mental Assessment of the Alaskan Continental Shelf: Annual Reportsof Principal Investigators for the year ending March 1977. Vol. 10.Receptors-Fish, Littoral, Benthos. RU-425:586 pp.
Driskell, W. 1977. Benthic reconnaissance of Kachemak Bay, Alaska. InEnvironmental Studies of Kachemak Bay and Lower Cook Inlet. Vol. VII.102 pp.
348
Ellertsen, B., E. Moksness, P. Solendal, T. Strømme, S. Tilseth, T.Westgard, and V. Øistad. 1977. Vertical distribution and feedingof cod larvae in relation to occurrence and size of prey organisms.Coun. Meet. Int. Coun. Explor. Sea (L:33), 32 pp.
English, T. S. 1979. Lower Cook Inlet meroplankton. OCSEAP AnnualReport. 22 pp.
Evans, C. D., E. Buck, R. Buffler, G. Fisk, R. Forbes, and W. Parker.1972. The Cook Inlet Environment. A Background Study of AvailableKnowledge. Alaska Sea Grant, Univ. Alaska, Anchorage.
Fager, F. W. 1972. Diversity: A sampling study. Am. Nat. 106:293-310.
Farrington, J. W. and J. G. Quinn. 1973. Petroleum hydrocarbons inNarragansett Bay. I. Survey of hydrocarbons in sediments and clams(Mercenaria mercenaria). Est. Coast. Mar. Sci. 1:71-79.
Feder, H. M. 1977. The distribution, abundance, diversity and biologyof benthic organisms in the Gulf of Alaska and the Bering Sea.Annual Report to NOAA, R.U. #281/5/303. Inst. Mar. Sci., Univ.Alaska, Fairbanks. 340 pp.
Feder, H. M. and S. C. Jewett. 1977. The distribution, abundance, anddiversity of the epifaunal benthic organisms in two bays (Alitakand Ugak) of Kodiak Island, Alaska. Final Report to NOAA, R.U.#29. Inst. Mar. Sci., Univ. Alaska, Fairbanks. 79 pp.
Feder, H. M., A. J. Paul and J. Paul. 1976. Growth and size-weightrelationships of the pinkneck clam, Spisula polynyma, in Hartney Bay,Prince William Sound, Alaska. Proc. Natl. Shellfish. Assoc.66:21-25.
Feder, H. M., M. Hoberg and S. C. Jewett. 1977. The distribution,(Alitak and Ugak) bays of Kodiak Island, Alaska. Annual Report toNOAA, R.U. #P29. Inst. Mar. Sci., Univ. Alaska, Fairbanks. p. 1-54.
Feder, H. M., K. Haflinger, M. Hoberg and J. McDonald. 1980. The in-faunal invertebrates of the southeastern Bering Sea. Final Reportto NOAA, R.U. #5. 399 pp.
Feder, H. M., S. Jewett, M. Hoberg, A. J. Paul, J. McDonald, G. Mathekeand J. Rose. 1978. Distribution, abundance, community structureand trophic relationships of the near-shore benthos of the Kodiakshelf, Cook Inlet, northeast Gulf of Alaska and the Bering Sea.Annual Report to NOAA, R.U. #281/5/303. 315 pp.
Fenchel, T. M. and B. B. Jorgensen. 1977. Detritus food chains of aquaticecosystems: the role of bacteria. In M. Alexander (ed.), Advancesin Microbial Ecology, Vol. I.
349

Field, J. G. 1969. The use of the information statistic in the numerical
classification of heterogenous systems. J. Ecol.. 57:565-569.
Field, J. G. 1970. The use of numerical methods to determine benthicdistribution patterns from dredgings in False Bay. Trans. Roy. Soc.S. Africa 39:183-200.
Field, J. G. 1971. A numerical analysis of changes in the soft-bottomfauna along a transect across False Bay, South Africa. J. Exp. Mar.Biol. Ecol. 7:215-253.
Field, J. G. and G. MacFarlane. 1968. Numerical methods in marineecology. I. A quantitative "similarity" analysis of rocky shoresamples in False Bay, South Africa. Zool. Africa 3:119-137.
Fossato, V. U. and W. J. Canzonier. 1976. Hydrocarbon uptake and lossby the mussel Mytilus edulis. Marine Biology 36-243-250.
Gatto, L. W. 1976. Circulation and sediment distribution in Cook Inlet,Alaska. In Assessment of the Arctic Marine Environment; SelectedTopics, 205-227. Inst. Mar. Sci., Univ. Alaska, Fairbanks.
Gotshall, D. W. 1977. Stomach contents of northern California Dungenesscrabs, Cancer magister. Calif. Fish and Game 63(1):43-51.
Greenwood, J. G. 1972. The mouthparts and feeding behavior of two speciesof hermit crab. J. Nat. Hist. 6:325-337.
Gruffydd, LL. D. 1974. An estimate of natural mortality in an unfishedpopulation of the scallop Pecten maximus (L.). J. Cons. Int. Explor.Mer 35(2):209-210.
Haynes, E. 1977. Summary status on the distribution of king crab andpandalid shrimp larvae Kachemak Bay-Lower Cook Inlet, Alaska, 1976.In L. Trasky, L. Flagg and D. Burnbank (eds.), Environmental Studies
of Kachemak Bay and Lower Cook Inlet. Alaska Dept. of Fish and Game,
Anchorage, Alaska, Vol. 4. p. 1-52.
Hennick, D. 1973. Cook Inlet shellfish investigations, commercialfisheries research development act. Alaska Department of Fish andGame Project No. 5-29-R. Juneau, Alaska. 21 pp.
Hilsinger, J. R. 1976. Aspects of the reproductive biology of femalesnow crabs, Chionoecetes bairdi, from Prince William Sound and the
adjacent Gulf of Alaska. Mar. Sci. Commun. 2(3,4):201-225.
Hurlbert, S. H. 1971. The noncencept of species diversity: a critiqueand alternative parameters. Ecology 52:577-586.
Hyman, L. M. 1940. The Invertebrates: Protozoa through Ctenophora.McGraw-Hill Co., New York. 726 pp.
350
Ishimaru, J. 1936. Data for forecasting catch of king crab in theNemuro Area, Japan. Work Report Hokkaido Fisheries ExperimentalStation (Hokkaido Suisan Shikenjo Jigyo Jumpo), No. 332:294-295.
Jewett, S. C. and H. M. Feder. 1976. Distribution and abundance of someepibenthic invertebrates of the northeast Gulf of Alaska, with noteson the feeding biology of selected species. Inst. Mar. Sci. Tech.Rept. R76-8., Univ. Alaska, Fairbanks. 61 pp.
Karinen, J. F. and S. D. Rice. 1974. Effects of Prudhoe Bay crude oilon molting tanner crabs, Chionoecetes bairdi. MFR paper 1074.
Kinney, P. J., D. K. Button, D. M. Schell, B. R. Robertson and J. Graves.1970. Quantitative assessment of oil pollution problems in Alaska'sCook Inlet. Inst. Mar. Sci., Univ. Alaska, Fairbanks. 116 pp.
Kon, T. 1971. Fisheries biology of the tanner crab-IV. The durationof planktonic stages estimated by rearing experiments of larvae.Bull. Jap. Soc. of Sci. Fish. 36(3):219-224. Fish. Res. Board of CanadaTranslation Series No. 1603.
Knull, J. and R. Williamson. 1969. Oceanographic survey of Kachemak Bay,Alaska. Bur. Comm. Fish. Biol. Lab., Auke Bay, Alaska, MR-F Nos.60, 70 and 76.
Lance, G. N. and W. T. Williams. 1966. Computer programs for hierar-chical polythetic classification ("similarity analyses"). Comput. J.9:60-64.
Larrance, J. D. and A. J. Chester. 1979. Source, composition, and fluxof organic detritus in lower Cook Inlet. OCSEAP Final Report. 50 pp.
Lasker, R. 1975. Field criteria for survival of anchovy larvae: therelation between inshore chlorophyll maximum layers and successfulfirst feeding. Fish. Bull. 73(3):453-462.
Lasker, R. 1978. The relationship between oceanographic conditions andlarval anchovy food in the California current: identification offactors contributing to recruitment failure. Rapp. P-v. Reun.Cons. Int. Explor. Mer. 173 pp.
Loya, Y. 1972. Community structure and species diversity of hermatypiccorals at Eilat, Red Sea. Mar. Biol. 13:100-123.
Margalef. 1958. Information theory in ecology. General Systems 3:36-71.
Marukawa, H. 1933. Biological and fishery research on Japanese kingcrab, Paralithodes camtschatica (Tilesius). J. Imperial Fish. Exp.Sta., Tokyo, No. U. 152 pp.
351

Modin, J. C., and K. W. Cox. 1967. Post-embryonic development of lab-oratory-reared ocean shrimp, Pandalus jordani Rathbun. Crustaceana13:197-219.
Moriarty, D. J. W. 1976. Quantitative studies on bacteria and algae inthe food of the mullet Mugil cephalus and the prawn Metapenaeusbennettae. J. Exp. Mar. Biol. Ecol. 22:131-143.
Motoh, H. 1973. Laboratory-reared zoea and megalopae of Zuwai crab formthe Sea of Japan. Bull. Jap. Soc. of Sci. Fish. 39(12):1223-1230.
Mueller-Dombois, D. and H. Ellenberg. 1974. Aims and Methods of Vegeta-tion Ecology. Wiley, New York. 547 pp.
Muench, R. D., H. D. Mofjeld and R. L. Charnell. 1978. Oceanographicconditions in lower Cook Inlet: spring and summer 1973. J. Geophys.Res. 83(C10):5090-5098.
Nakanishi, T. 1976. Rearing larvae and post-larvae of the king crab(Paralithodes camtschatica). FAO Technical Conference on Aquacultureat Kyoto, Japan, FIR:AQ/Conf/76/E:44. 7 pp.
Neiman, A. A. 1964. Age of bivalve molluscs and the utilization ofbenthos by flatfishes in the southeastern Bering Sea. In Sovietfisheries investigations in the northeast Pacific, Part 3. p. 191-196.
Nybakken, J. 1978. Abundance, diversity and temporal variability in aCalifornia intertidal nudibranch assemblage. Mar. Biol. 45:129-146.
Orton, J. H. 1927. On the mode of feeding of the hermit-crab, Eupagurusbernhardus, and some other Decapoda. J. Mar. Biol. Assoc. U.K.14:909-921.
Paul, A. J. and H. M. Feder. 1973. Growth, recruitment and distributionof the littleneck clam, Protothaca staminea, in Galena Bay, PrinceWilliam Sound, Alaska. Fish. Bull. 71(3):665-677.
Paul, A. J., H. M. Feder and S. C. Jewett. 1979a. Food of the snow crab,Chionoecetes bairdi rathbun, 1924, from Cook Inlet, Alaska (Decapoda,Majidae). Crustaceana, Suppl. 5:62-68.
Paul, A. J., J. M. Paul, P. A. Shoemaker and H. M. Feder. 1979b. Preyconcentration and feeding response in laboratory-reared stage onezoeae of king crab, snow crab, and pink shrimp. Trans. Am. Fish.Soc. 108:440-443.
Paul, A. J. and J. M. Paul. In press. The effect of early starvationon later feeding success of king crab zoeae. J. Exp. Mar. Biol.Ecol.
352

Pearson, T. H. 1972. The effect of industrial effluent from pulp andpaper mills on the marine benthic environment. Proc. Roy. Soc.Lond. B. 130:469-485.
Pearson, T. H. 1975. The benthic ecology of Loch Linnke and Loch Eil,a sea loch system on the west coast of Scotland. IV. Changes in thebenthic fauna attributable to organic enrichment. J. Exp. Mar. Biol.Ecol. 20:1-41.
Pearson, T. H. and R. Rosenberg. 1978. Macrobenthic succession in rela-tion to organic enrichment and pollution of the marine environment.Oceanogr. Mar. Biol. Ann. Rev. 16:229-311.
Peet, R. K. 1974. The measurement of species diversity. A. Rev. Ecol.Syst. 5:285-307.
Pielou, E. C. 1966a. Species-diversity and pattern-diversity in thestudy of ecological succession. J. Theor. Biol. 10:370-383.
Pielou, E. C. 1966b. The measurement of diversity in different types ofbiological collections. J. Theor. Biol. 13:131-144.
Pielou, E. C. 1977. Mathematical Ecology. Wiley, New York. 285 pp.
Rhoads, D. C. 1974. Organism-sediment relations on the muddy sea floor.Oceanogr. Mar. Biol. Ann. Rev. 12:263-300.
Rice, S., J. Short, C. Brodensen, T. Mecklenburg, D. Moles, C. Misch,D. Cheatham and J. Karinen. 1976. Acute Toxicity and Uptake-Depuration Studies with Cook Inlet Crude Oil, Prudhoe Bay Crude Oil,No. 2 Fuel Oil and Several Subarctic Marine Organisms. NorthwestFisheries Center. Auke Bay, Alaska. 87 pp.
Rieper, M. 1978. Bacteria as food for marine harpacticoid copepods.Mar. Biol. 45:337-345.
Sager. P. and A. C. Hasler. 1969. Species diversity in lacustrine phyto-plankton. I. The components of the index of diversity from Shannon'sformula. Am. Nat. 102:243-282.
Satoe, S. 1958. Studies on larval development and fishery biology ofking crab, Paralithodes camtschatica (Tilesius). Bull. HokkaidoReg. Fish. Res. Lab., No. 17. 103 pp.
Scarratt, D. J. and V. Zitko. 1972. Bunker C oil in sediments and benthicanimals from shallow depths in Chedabucto Bay, N.S. J. Fish. Res. Bd.Can. 29:1347-1350.
Shannon, C. E. and W. Weaver. 1963. The Mathematical Theory of Communica-tion. Univ. Illinois Press, Urbana. 117 pp.
353
Shaw, D. G., A. J. Paul, L. M. Cheek and H. M. Feder. 1976. Macomabalthica: an indicator of oil pollution. Mar. Pull. Bull. 7:29-31.
Smith, J. E. (ed.). 1968. Torrey Canyon Pollution and Marine Life.Cambridge Univ. Press, Cambridge. 196 pp.
Snedecor, G. W. 1956. Statistical methods applied to experiments inagriculture and biology. 5th ed. Iowa State Coll. Press, Ames.534 pp.
Stephenson, W. and W. T. Williams. 1971. A study of the benthos ofsoft bottoms. Sek Harbour, New Guinea, using numerical analysis.Aust. J. Mar. Freshwater Res. 22:11-34.
Stephenson, W., W. T. Williams and S. Cook. 1972. Computer analysesof Petersen's original data on bottom communities. Ecol. Monogr.42:387-415.
Straughan, D. 1971. Biological and oceanographical survey of the SantaBarbara Channel oil spill 1969-1970. Allan Hancock Foundation, Univ.Southern California, Los Angeles. 425 pp.
Sundberg, K. A. and D. Clausen. 1977. Post-larval king crab (Paralithodescamtschatica) distribution and abundance in Kachemak Bay, lower CookInlet, Alaska, 1976. In L. Trasky, L. Flagg and D. Burbank (eds.),Environmental Studies of Kachemak Bay and Lower Cook Inlet, AlaskaDept. Fish and Game. 5:36 pp.
Takeuchi, I. 1968a. Food of the king crab, Paralithodes camtschatica, offthe west coast of Kamchatka in 1958. Fish. Res. Bd. Can. Transl. Ser.No. 1193:21 pp. From Bull. Hokkaido Reg. Fish. Res. Lab 33:23-44,1959.
Takeuchi, I. 1968b. Food of the king crab, Paralithodes camtschatica, offthe west coast of the Kamchatka Penninsula, 1958-1964. Fish Res.Bd. Can. Transl. Ser. No. 1194:21 pp. From Bull. Jap. Sea Reg. Fish.Res. Lab. 33:32-44, 1967.
Tarverdieva, M. I. 1976. Feeding of the Kamchatka king crab, Paralithodescamtschatica, and tanner, crabs, Chionoecetes bairdi and Chionoecetesopilio, in the southern part of the Bering Sea. Soviet. J. Mar. Biol.2(1):34-39.
U. S. Bureau of Commercial Fisheries, USF&WS: Exploratory Trawl SurveyData. 1958, 1961, 1963. Supplied by U.S. Department of Commerce,NMFS, Northwest Fisheries Center, Seattle, Washington.
U. S. Department of Commerce. 1970. Surface water temperature and density:Pacific coast North and South American and Pacific Ocean Islands. Nat.Ocean Survey Publication 31-3. 88 pp.
354

U. S. Department of Interior. 1977. Lower Cook Inlet Final EnvironmentalImpact Statements. Alaska Outer Continental Shelf Office. Vol. 1.561 pp.
Weymouth, F. W. 1923. The life history and growth of the pismo clam,Tivela stultorum (Mawe). Calif. Fish and Game Comm. Fish. Bull. 7:120 pp.
Yasuda, T. 1967. Feeding habit of the zawai-gani, Chionoecetes opilioelongatus, in Wakasa Bay. I. Specific composition of the stomachcontents. Bull. Jap. Soc. Sci. Fish. 33(4):315-319. (Transl. fromJapanese by Fish. Res. Bd. Can., Transl. Ser. No. 1111.)
355

APPENDIX I
INVERTEBRATE TAXA OBTAINED BY AGASSIZ TRAWL, TRY-NET TRAWLAND EASTERN OTTER TRAWL IN LOWER COOK INLET
356

APPENDIX I - TABLE I
INVERTEBRATE TAXA OBTAINED BY AGASSIZ TRAWL, TRY-NET TRAWL ANDEASTERN OTTER TRAWL IN LOWER COOK INLET
357

APPENDIX I - TABLE I
CONTINUED
358
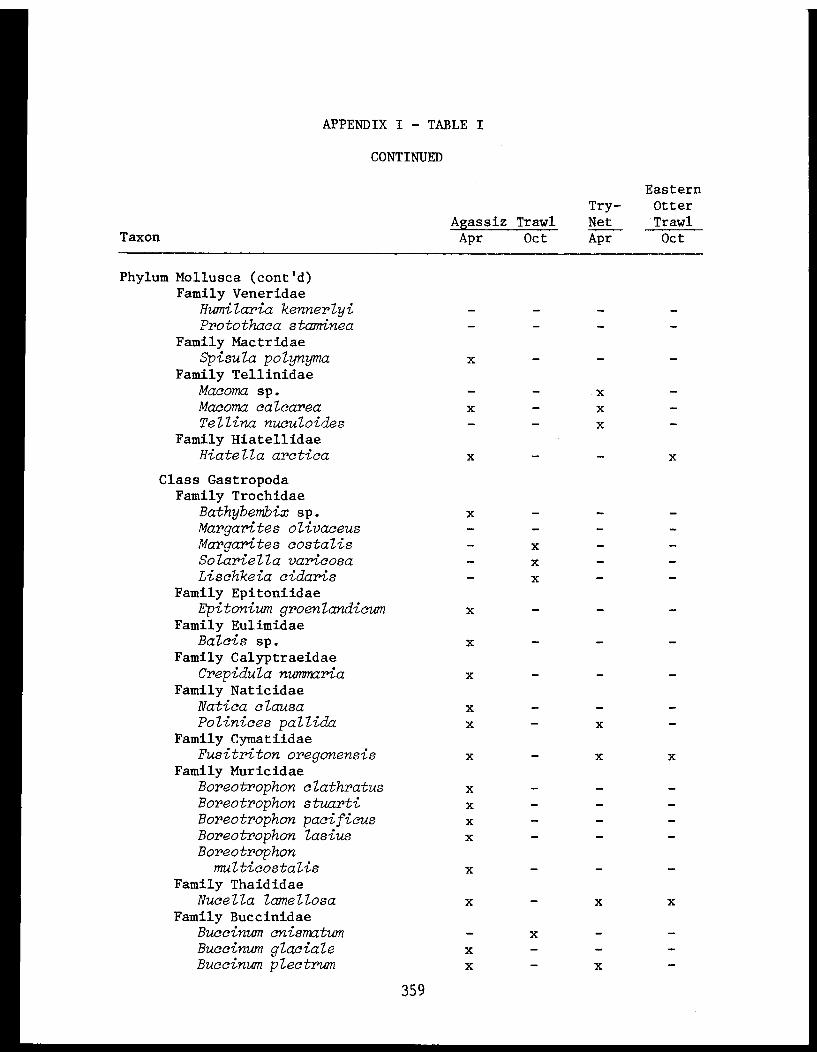
APPENDIX I - TABLE I
CONTINUED
359

APPENDIX I - TABLE I
CONTINUED
360
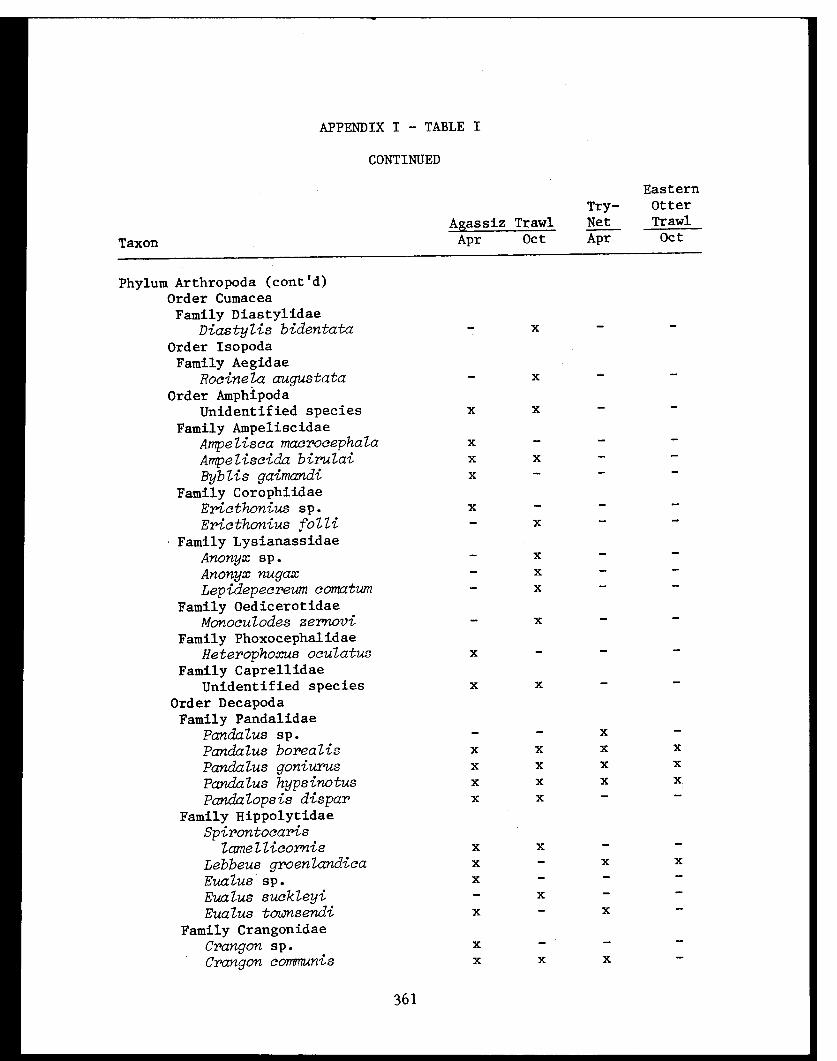
APPENDIX I - TABLE I
CONTINUED
361
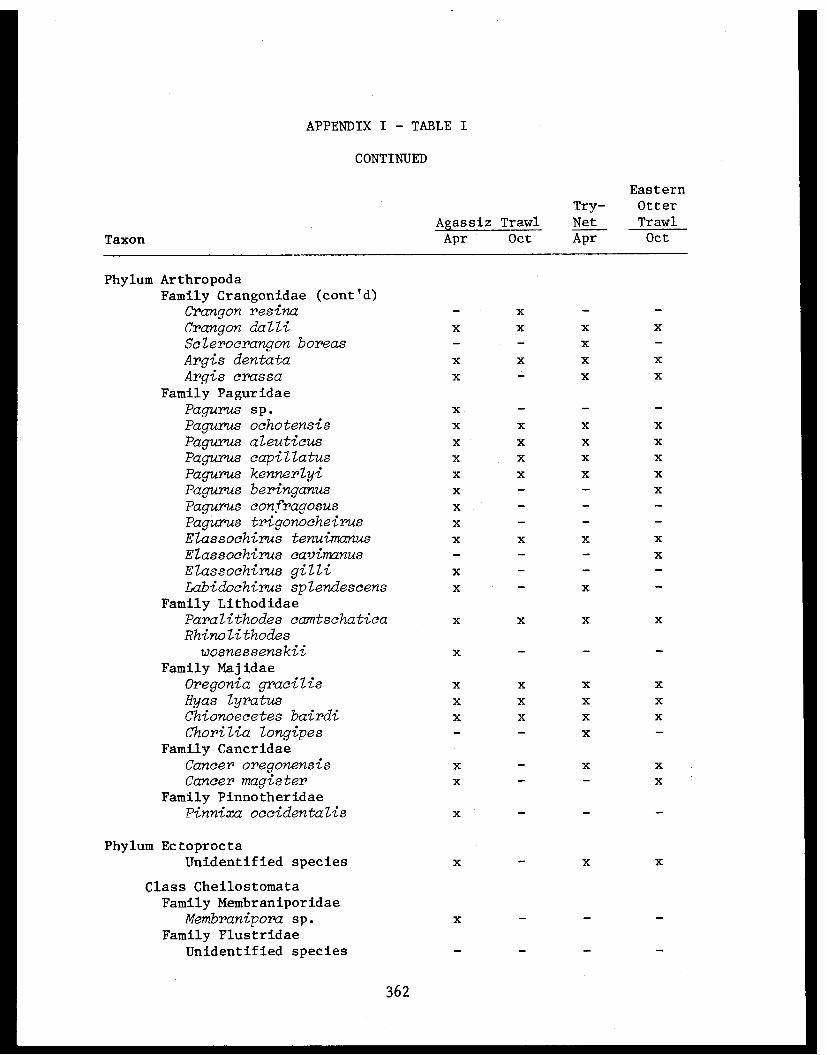
APPENDIX I - TABLE I
CONTINUED
362
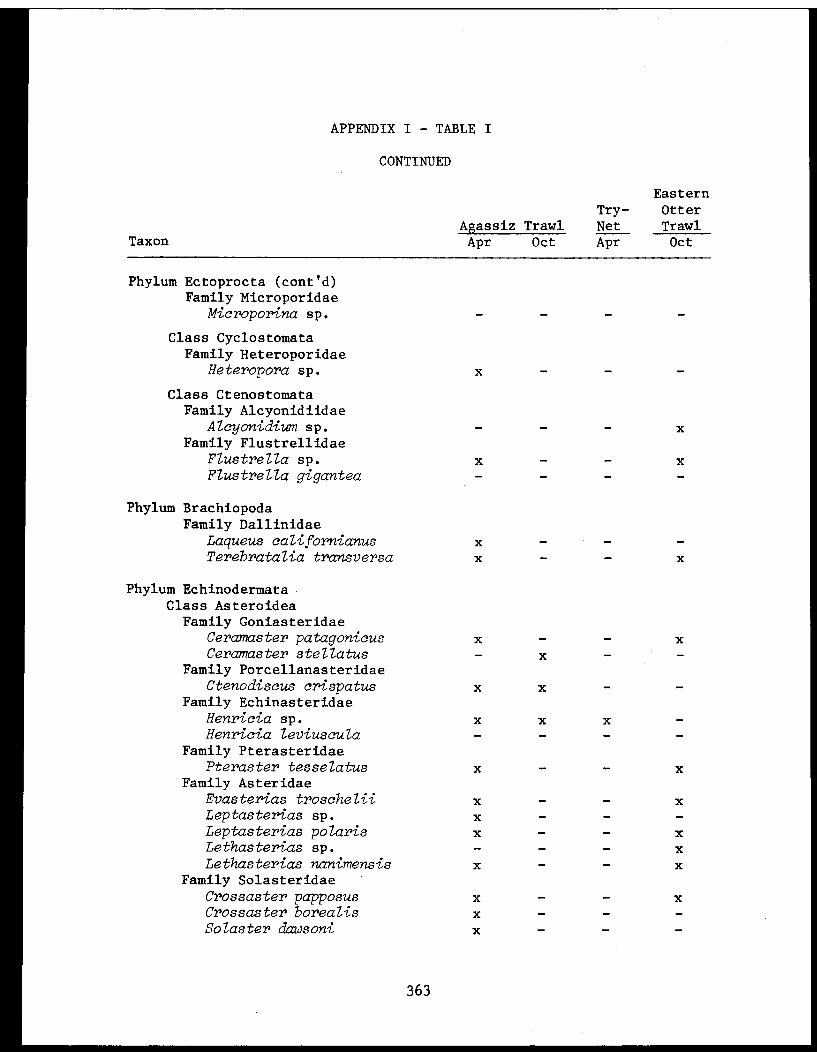
APPENDIX I - TABLE I
CONTINUED
363
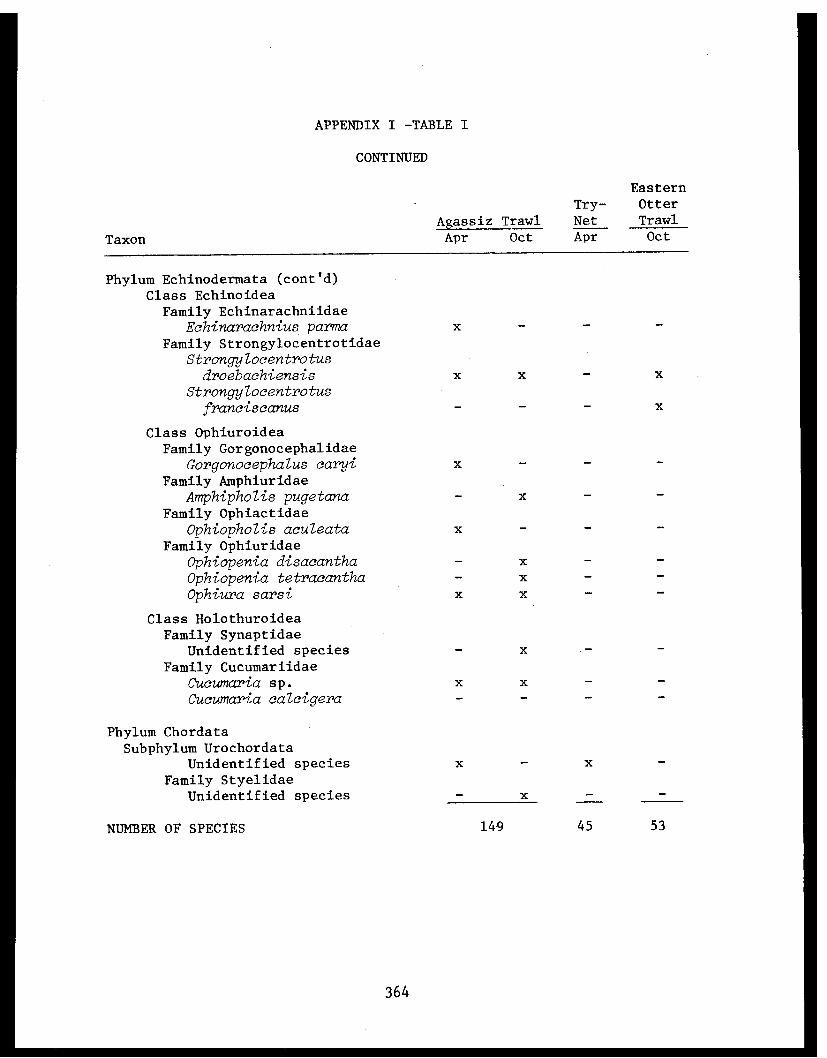
APPENDIX I -TABLE I
CONTINUED
364
APPENDIX II
TAXA FROM BOTTOM SKIMMER STATIONS, 10 AUGUST 1976
365

APPENDIX II - TABLE I
TAXA FROM BOTTOM SKIMMER STATION 01, 18.3 METERS, 10 AUGUST 1976
366
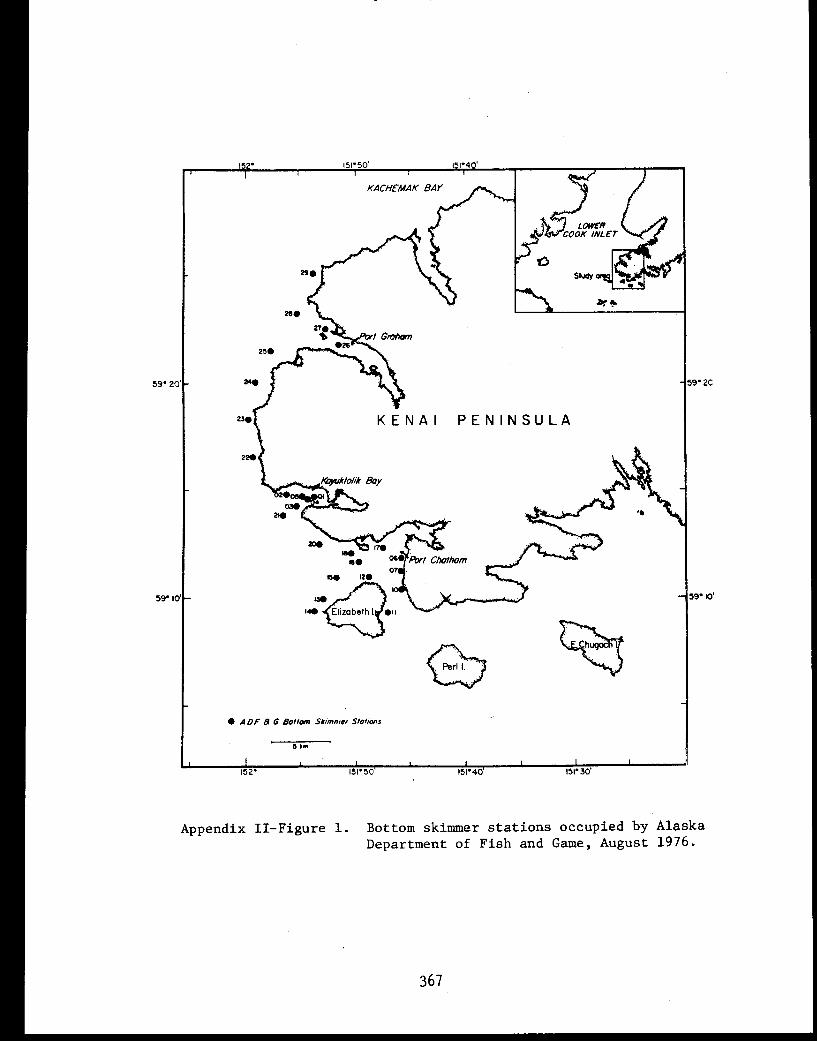
Appendix II-Figure 1. Bottom skimmer stations occupied by Alaska
Department of Fish and Game, August 1976.
367

APPENDIX II - TABLE II
TAXA FROM BOTTOM SKIMMER STATION 02, 20.1 METERS, 10 AUGUST 1976
368
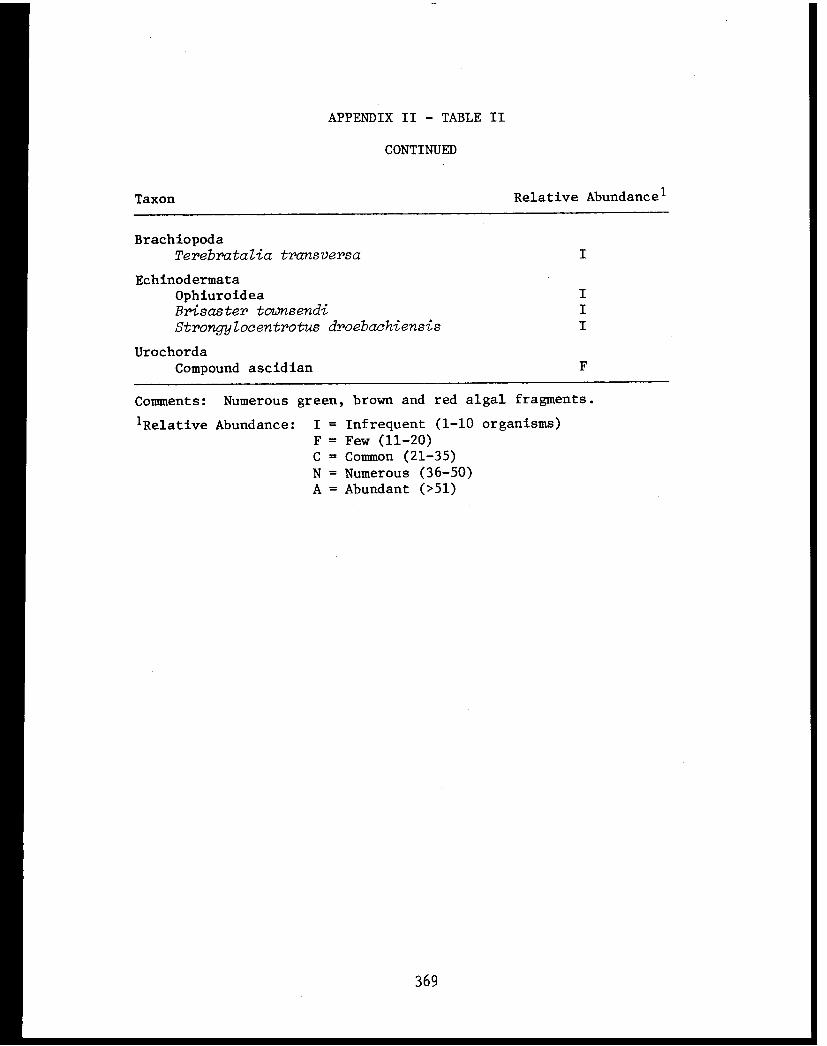
APPENDIX II - TABLE II
CONTINUED
369
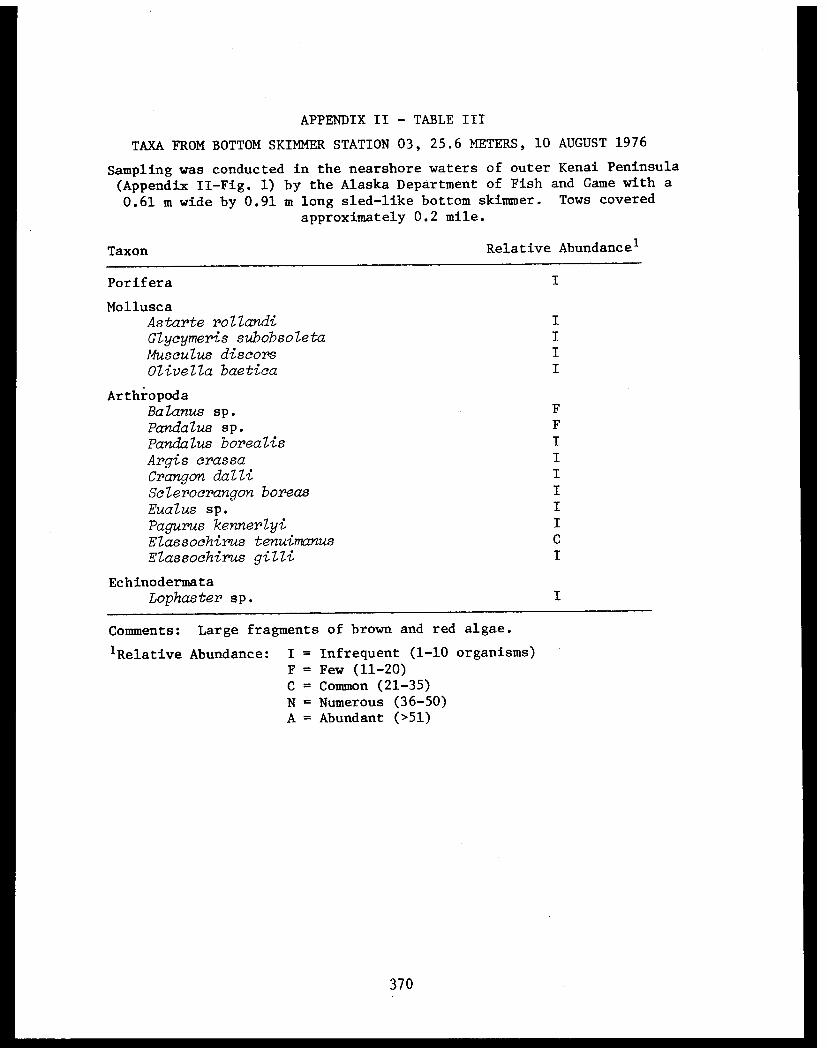
APPENDIX II - TABLE III
TAXA FROM BOTTOM SKIMMER STATION 03, 25.6 METERS, 10 AUGUST 1976
370
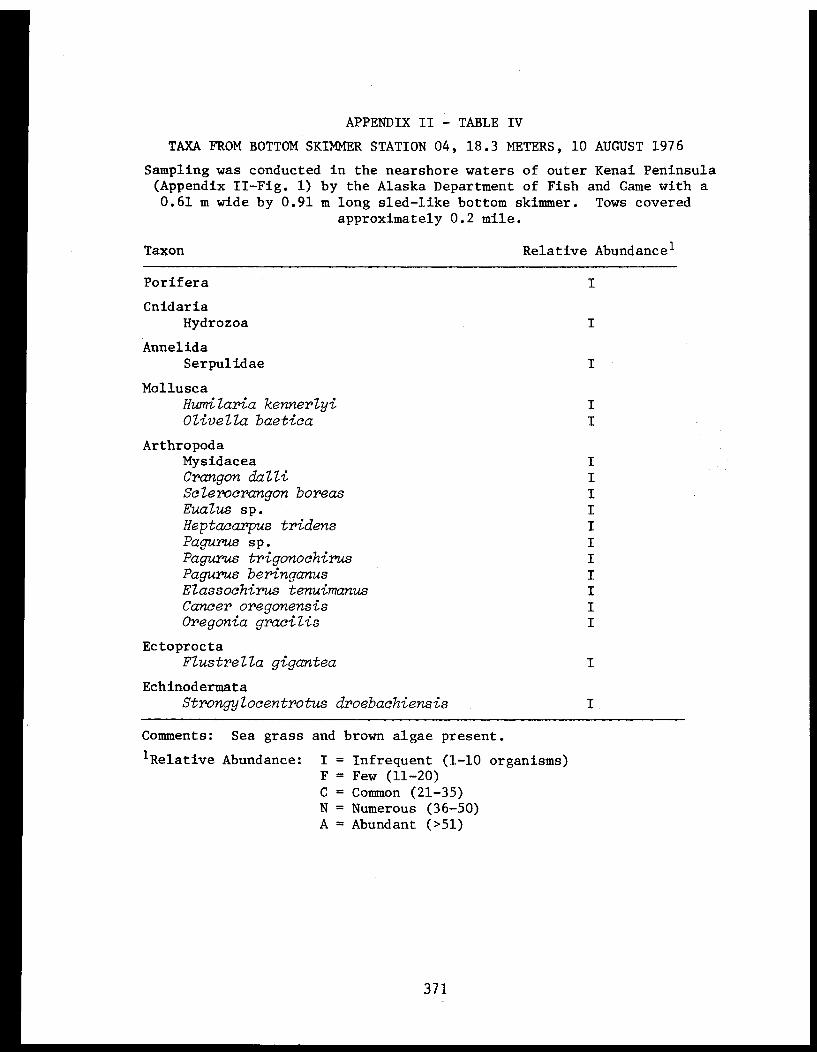
APPENDIX II - TABLE IV
TAXA FROM BOTTOM SKIMMER STATION 04, 18.3 METERS, 10 AUGUST 1976
371

APPENDIX II - TABLE V
TAXA FROM BOTTOM SKIMMER STATION 05, 20.1 METERS, 10 AUGUST 1976
372

APPENDIX II - TABLE VI
TAXA FROM BOTTOM SKIMMER STATION 06, 9.1-18.3 METERS, 10 AUGUST 1976
373
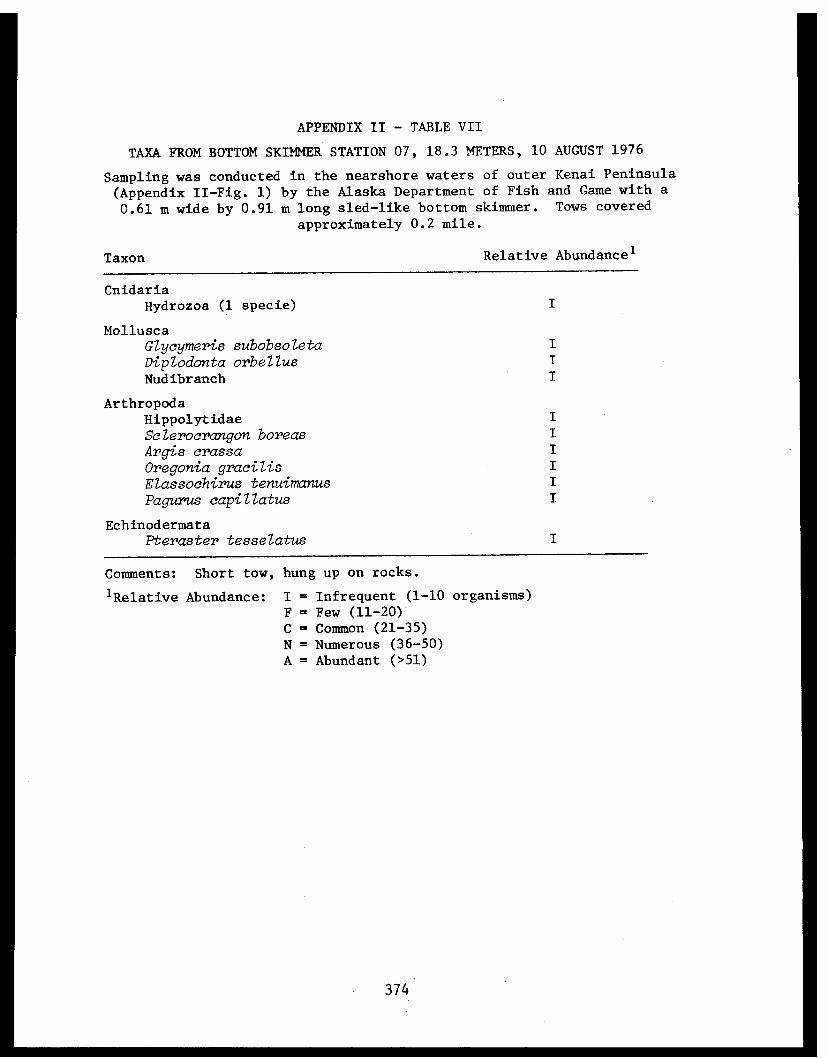
APPENDIX II - TABLE VII
TAXA FROM BOTTOM SKIMMER STATION 07, 18.3 METERS, 10 AUGUST 1976
374
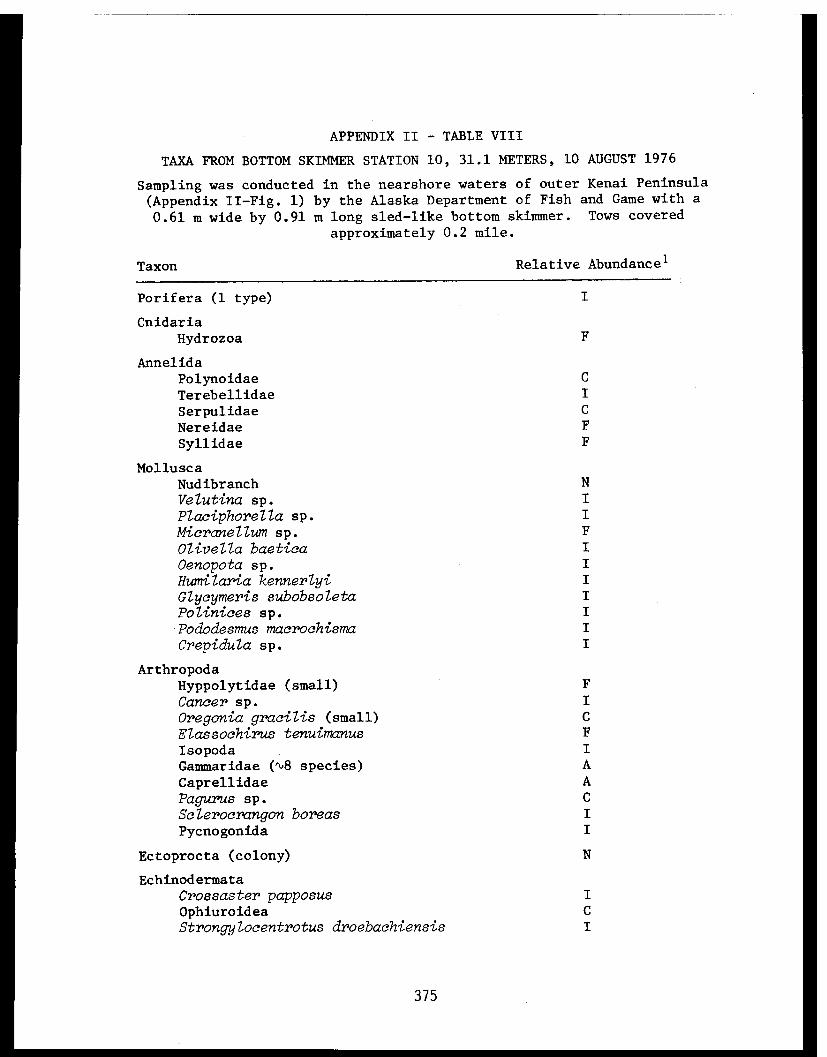
APPENDIX II - TABLE VIII
TAXA FROM BOTTOM SKIMMER STATION 10, 31.1 METERS, 10 AUGUST 1976
375
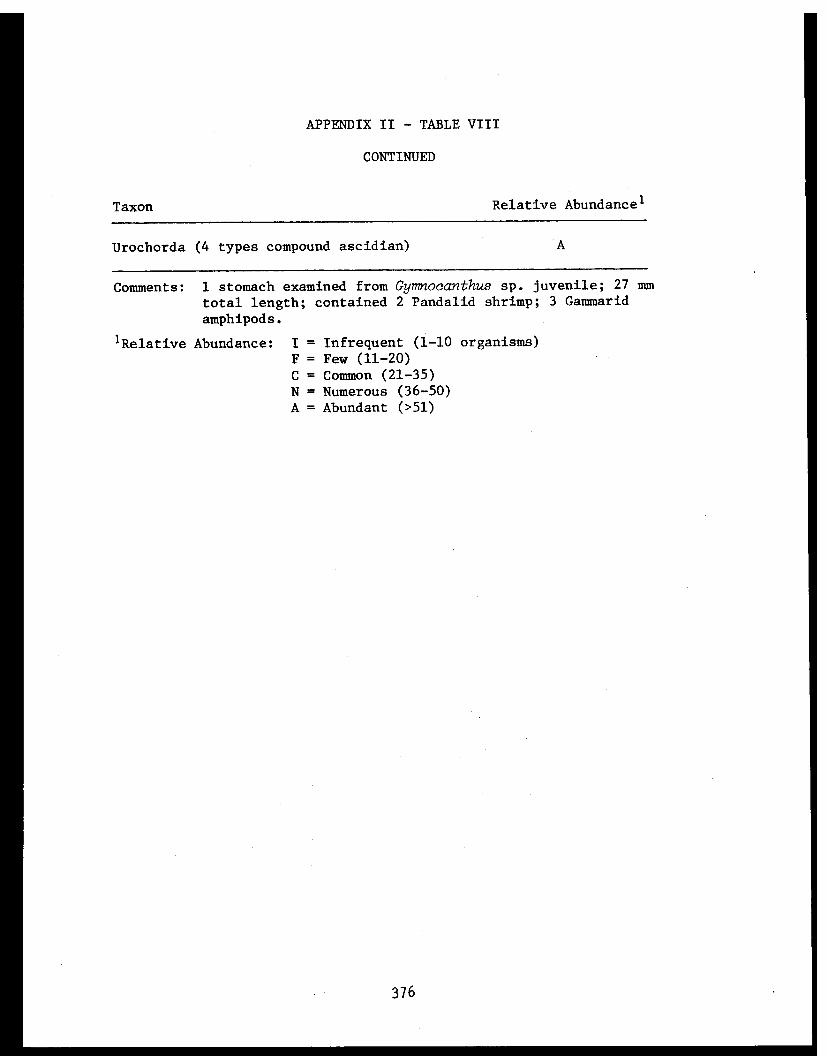
APPENDIX II - TABLE VIII
CONTINUED
376
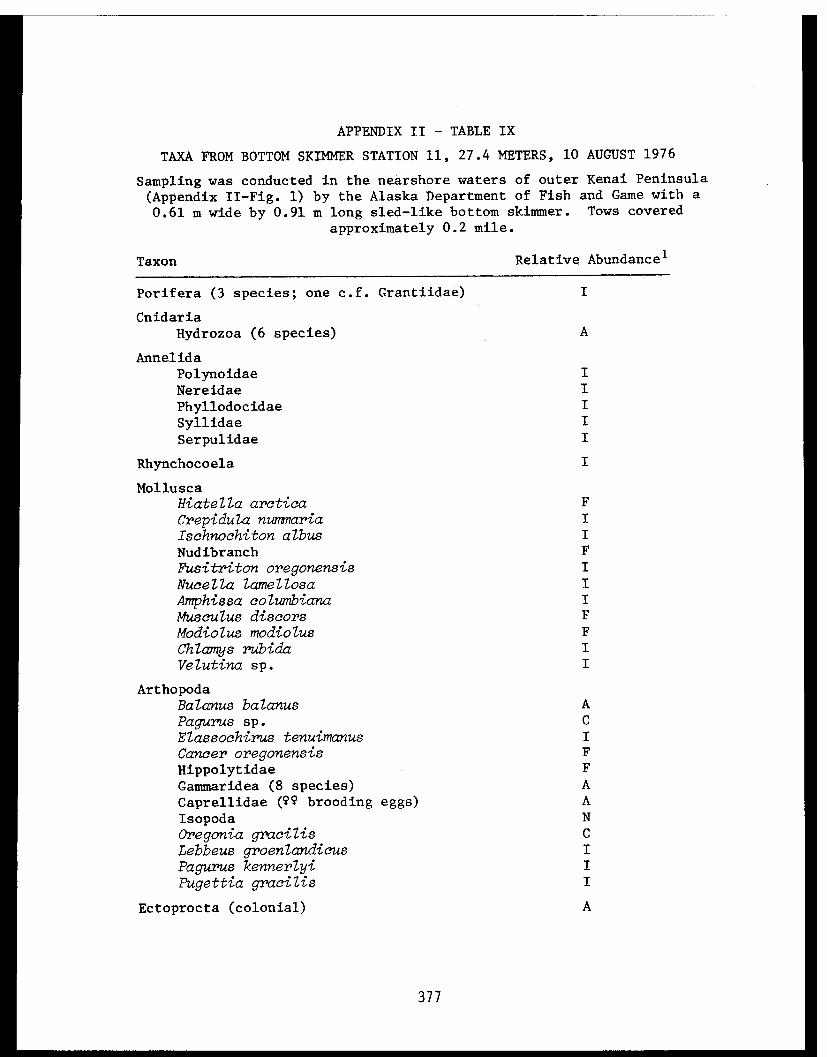
APPENDIX II - TABLE IX
TAXA FROM BOTTOM SKIMMER STATION 11, 27.4 METERS, 10 AUGUST 1976
377
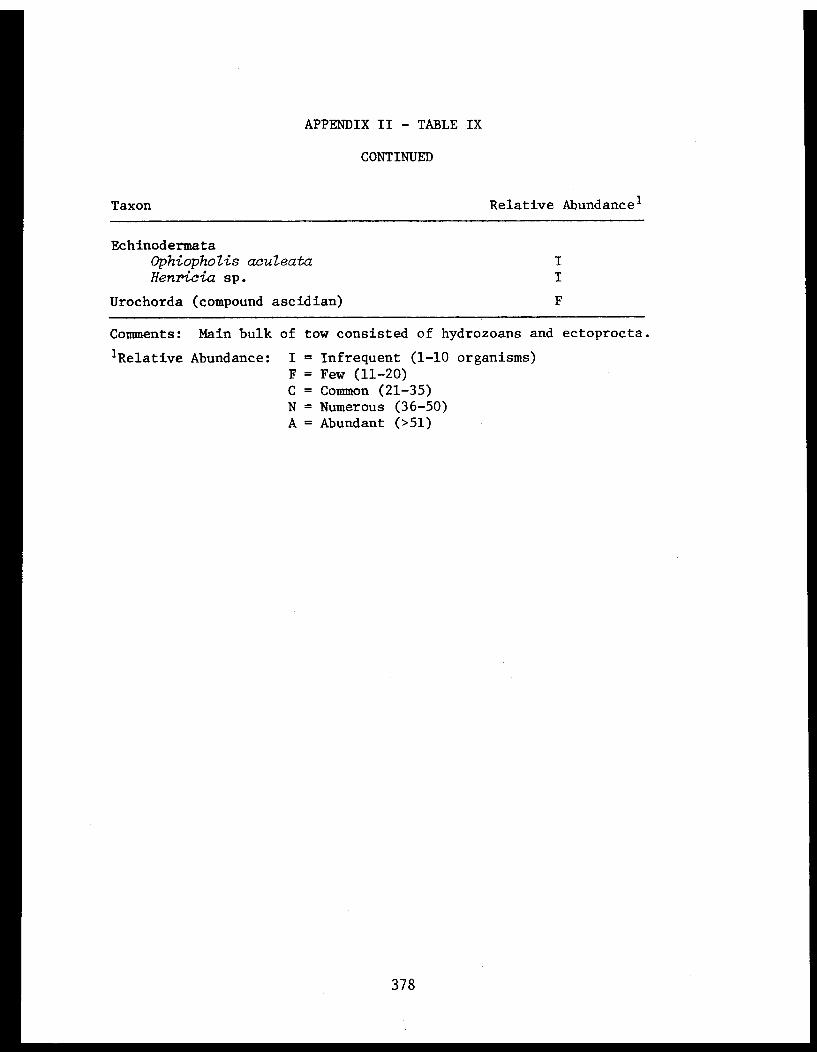
APPENDIX II - TABLE IX
CONTINUED
378
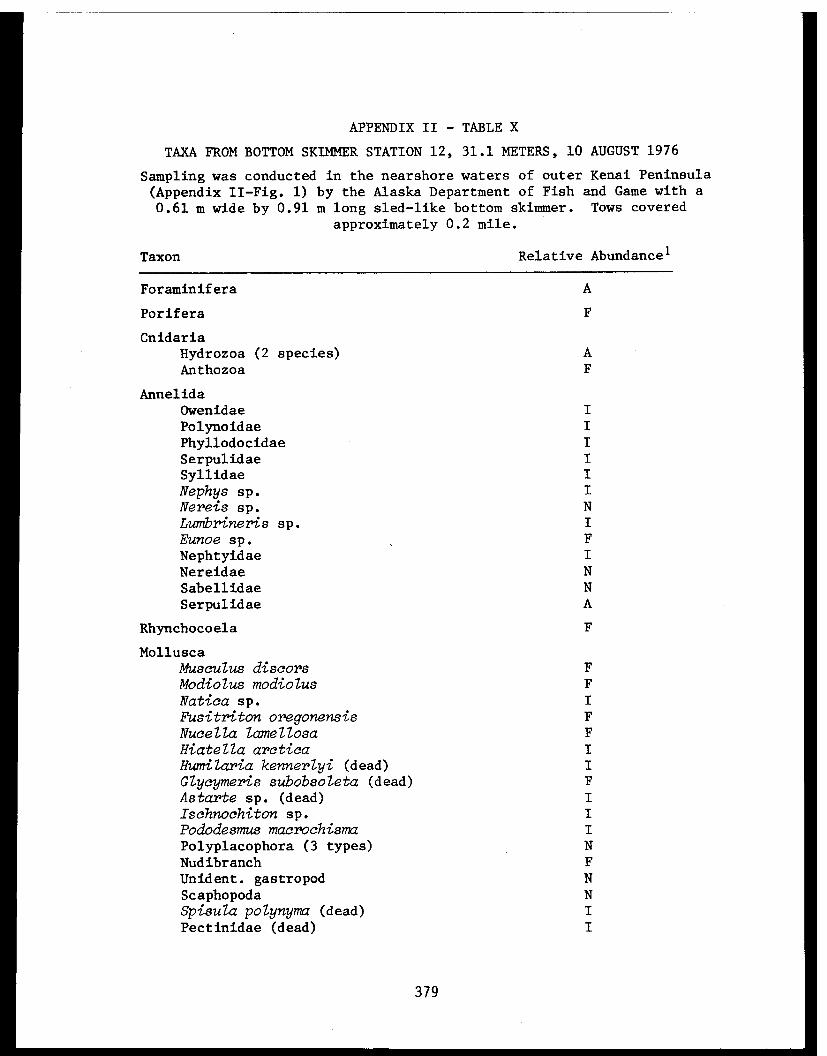
APPENDIX II - TABLE X
TAXA FROM BOTTOM SKIMMER STATION 12, 31.1 METERS, 10 AUGUST 1976
379
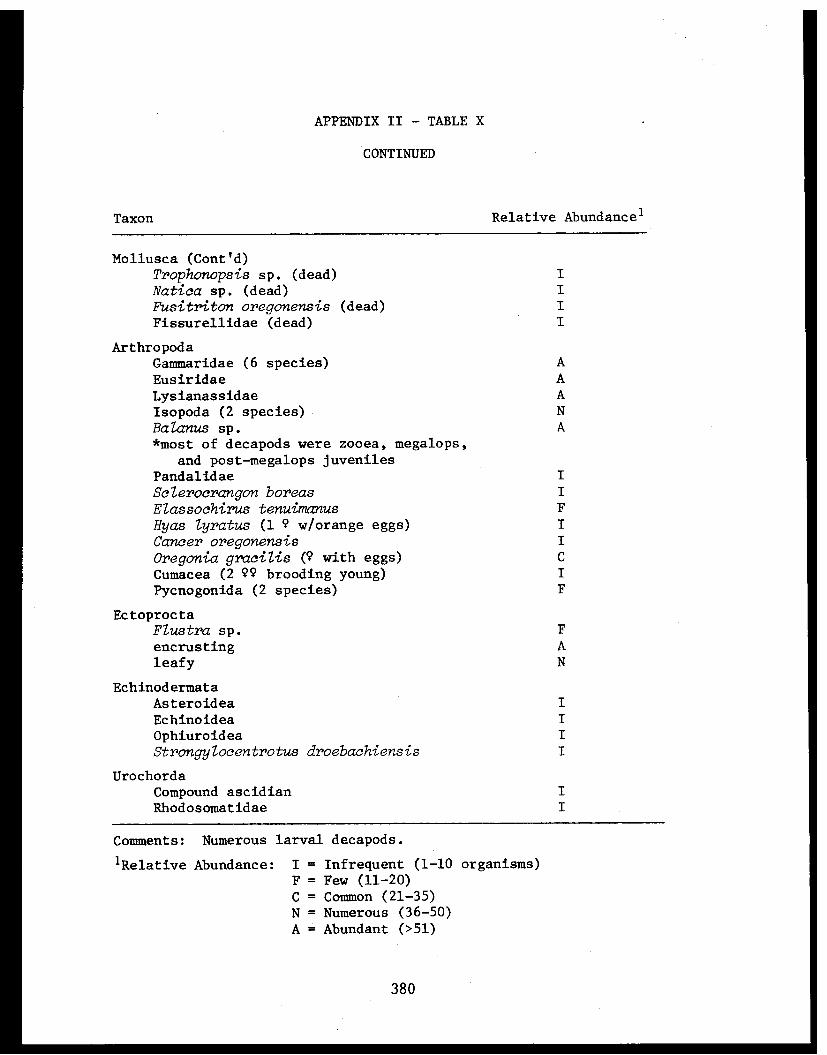
APPENDIX II - TABLE X
CONTINUED
380
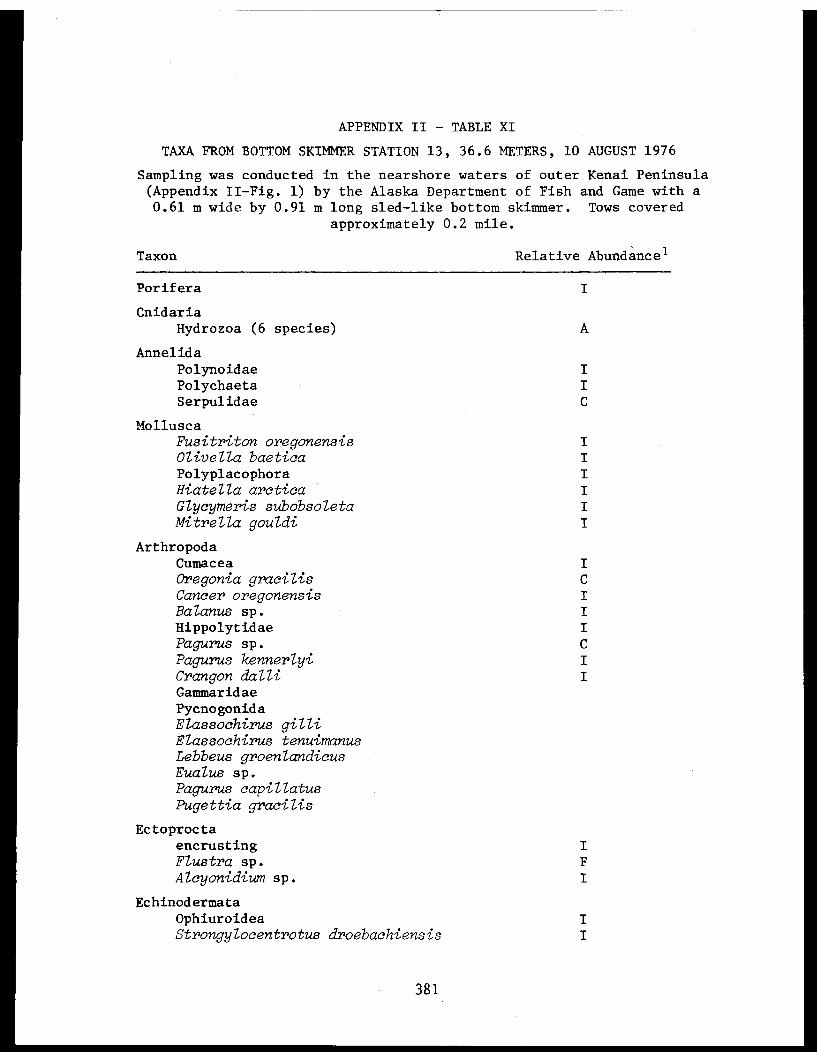
APPENDIX II - TABLE XI
TAXA FROM BOTTOM SKIMMER STATION 13, 36.6 METERS, 10 AUGUST 1976
381
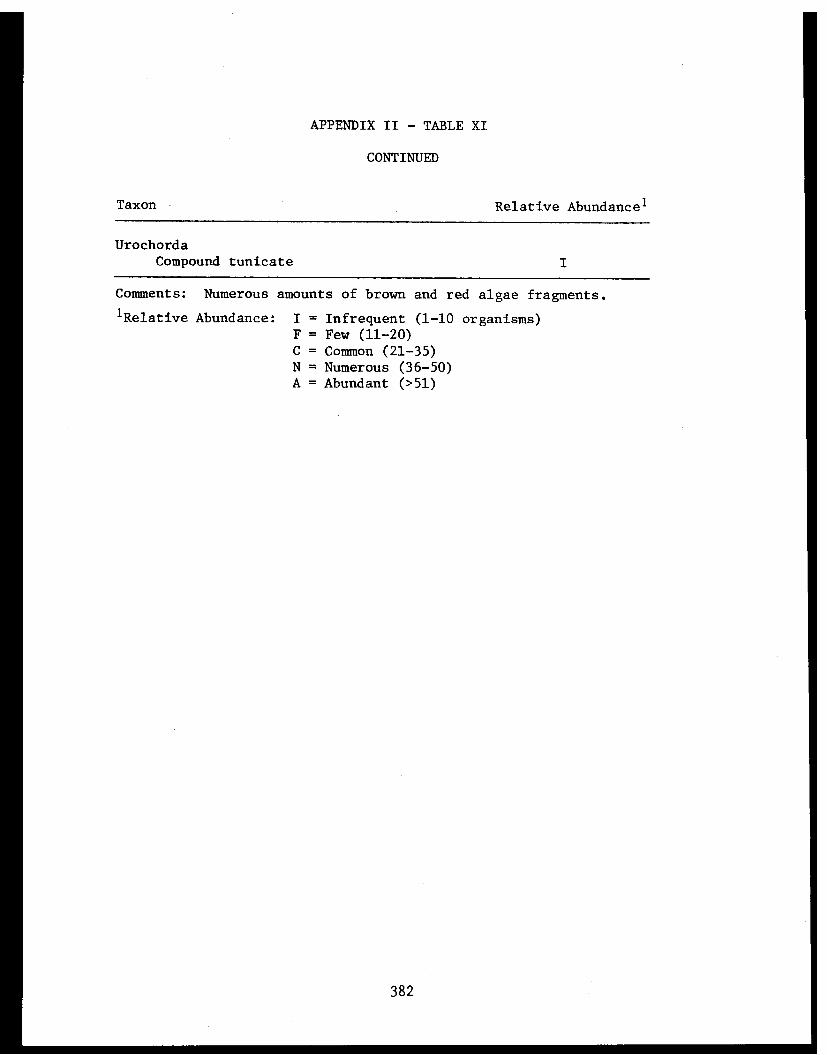
APPENDIX II - TABLE XI
CONTINUED
382
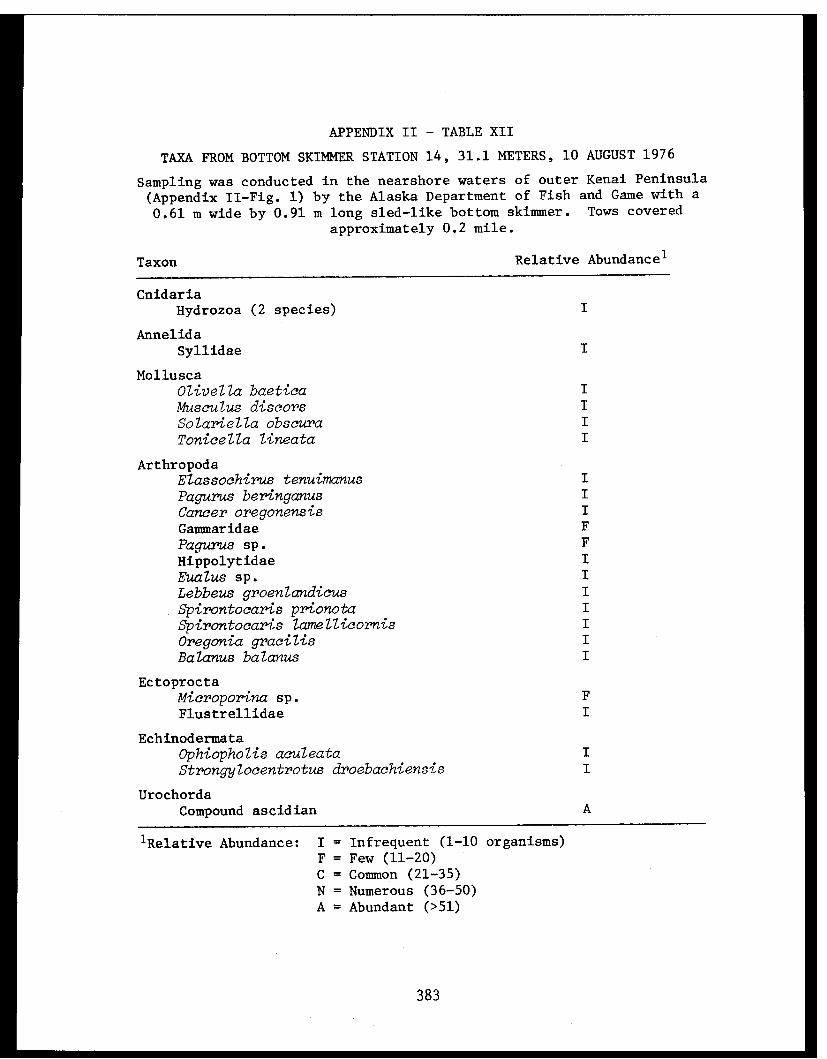
APPENDIX II - TABLE XII
TAXA FROM BOTTOM SKIMMER STATION 14, 31.1 METERS, 10 AUGUST 1976
383

APPENDIX II - TABLE XIII
TAXA FROM BOTTOM SKIMMER STATION 14, 31.1 METERS, 10 AUGUST 1976
384
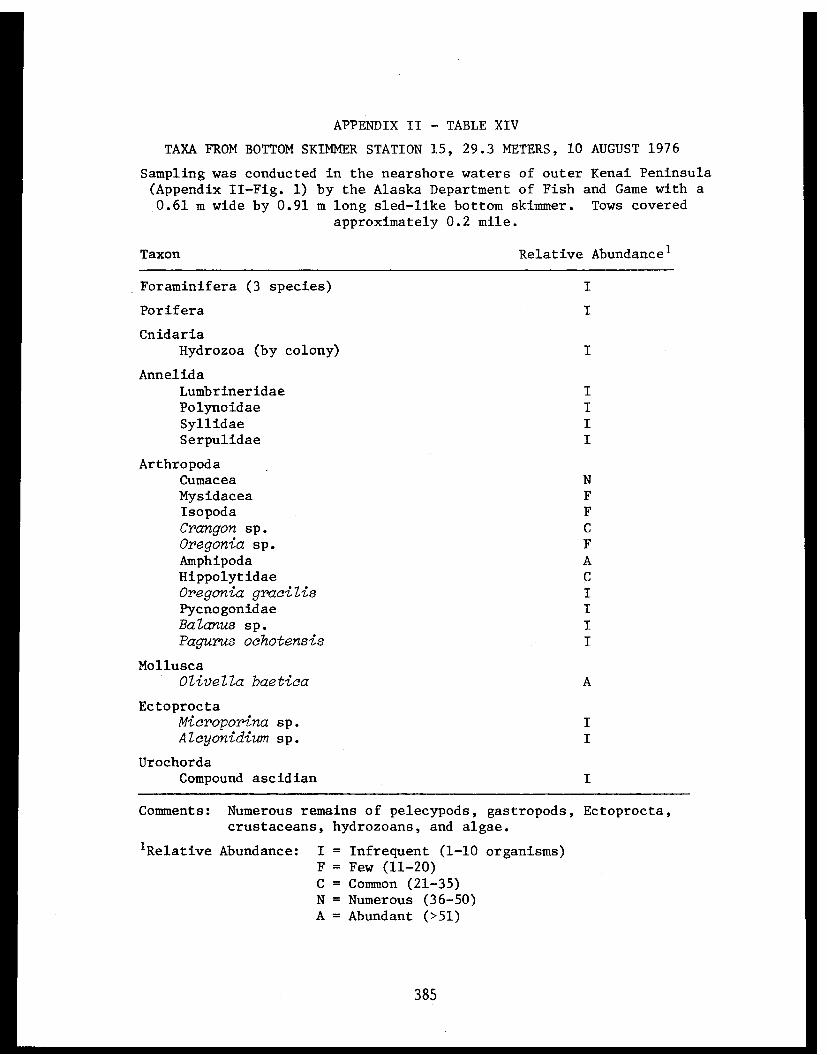
APPENDIX II - TABLE XIV
TAXA FROM BOTTOM SKIMMER STATION 15, 29.3 METERS, 10 AUGUST 1976
385
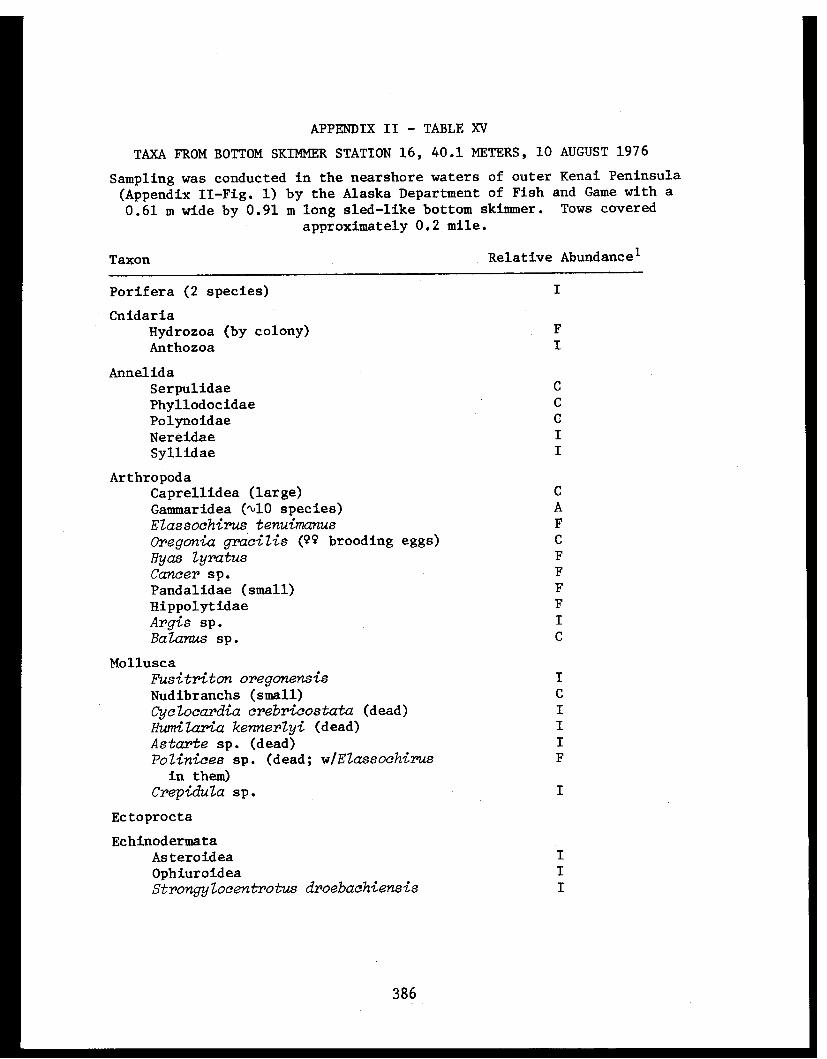
APPENDIX II - TABLE XV
TAXA FROM BOTTOM SKIMMER STATION 16, 40.1 METERS, 10 AUGUST 1976
386

APPENDIX II - TABLE XV
CONTINUED
387
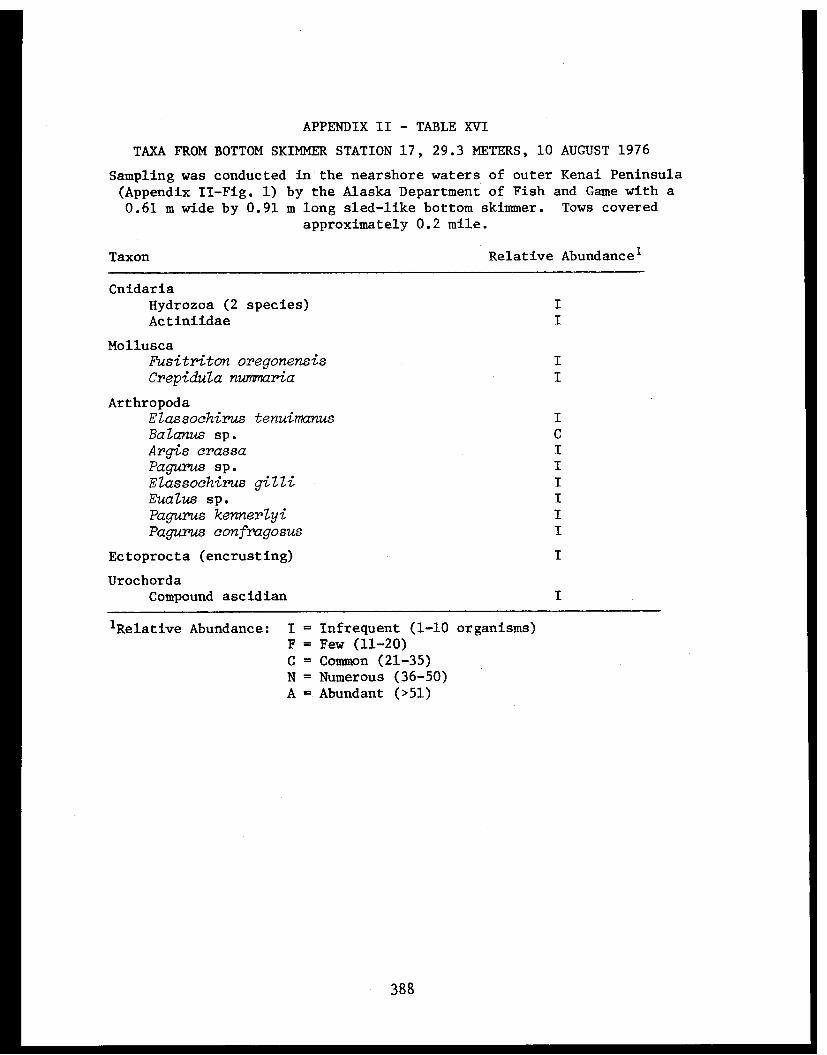
APPENDIX II - TABLE XVI
TAXA FROM BOTTOM SKIMMER STATION 17, 29.3 METERS, 10 AUGUST 1976
388

APPENDIX II - TABLE XVII
TAXA FROM BOTTOM SKIMMER STATION 18, 27.4 METERS, 10 AUGUST 1976
389
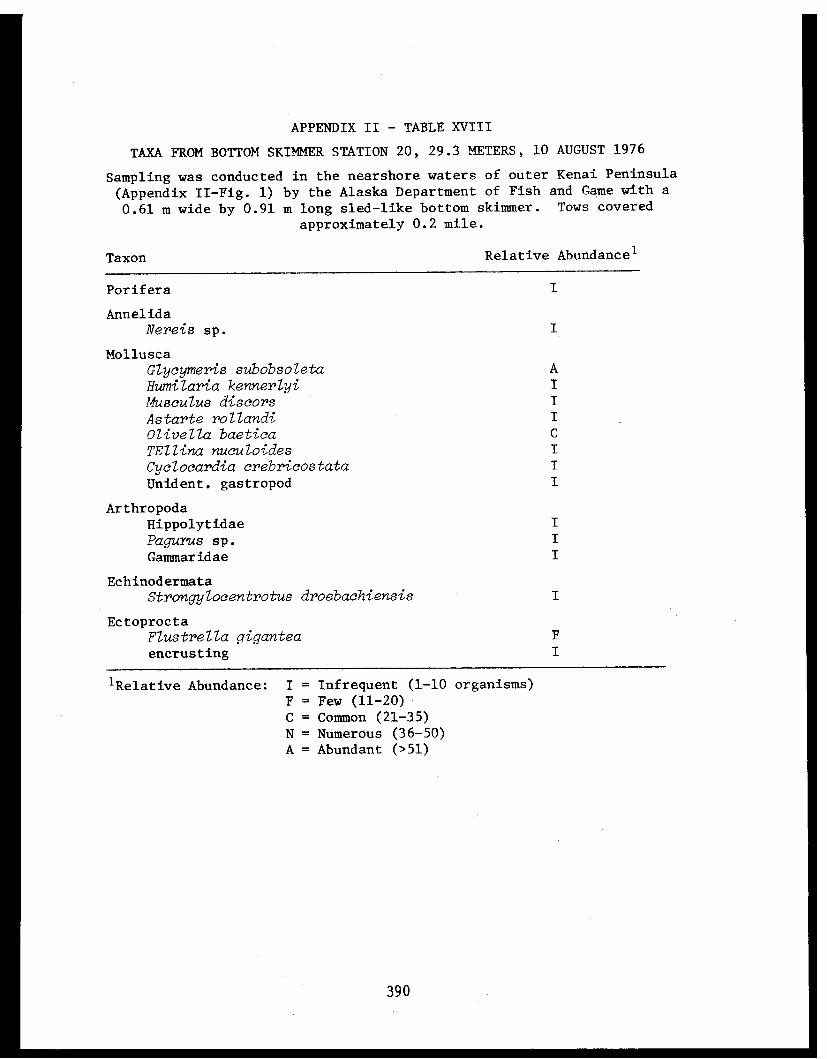
APPENDIX II - TABLE XVIII
TAXA FROM BOTTOM SKIMMER STATION 20, 29.3 METERS, 10 AUGUST 1976
390
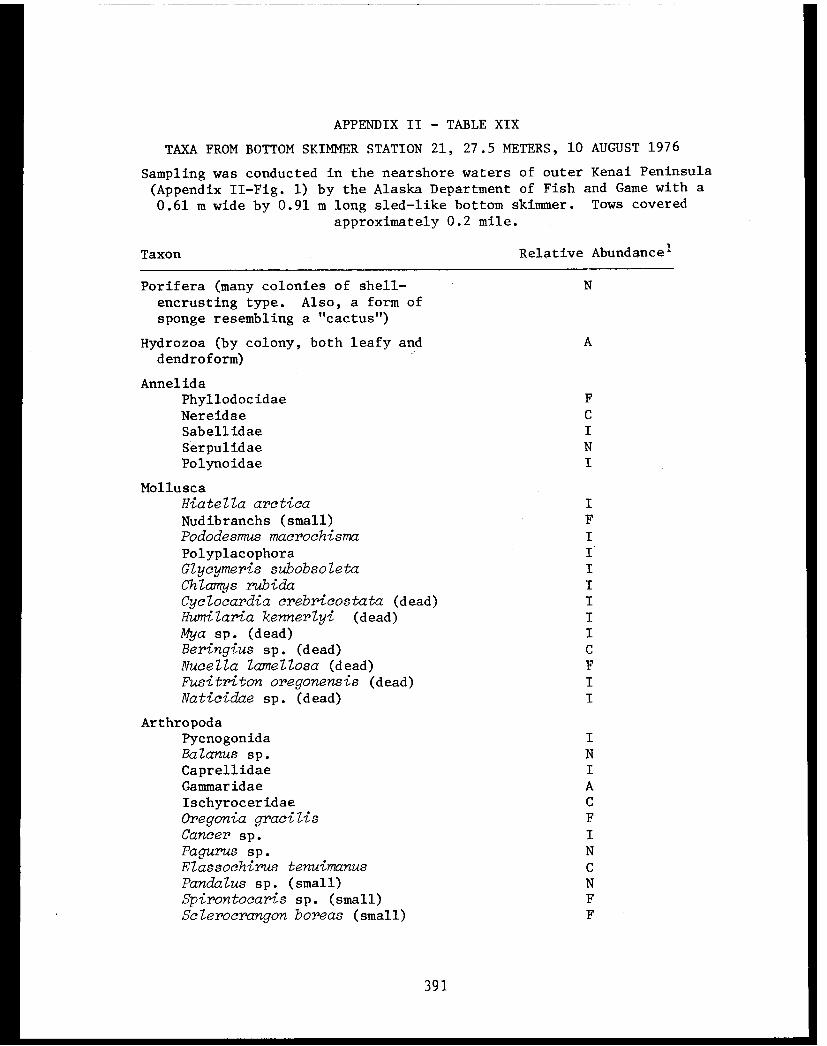
APPENDIX II - TABLE XIX
TAXA FROM BOTTOM SKIMMER STATION 21, 27.5 METERS, 10 AUGUST 1976
391
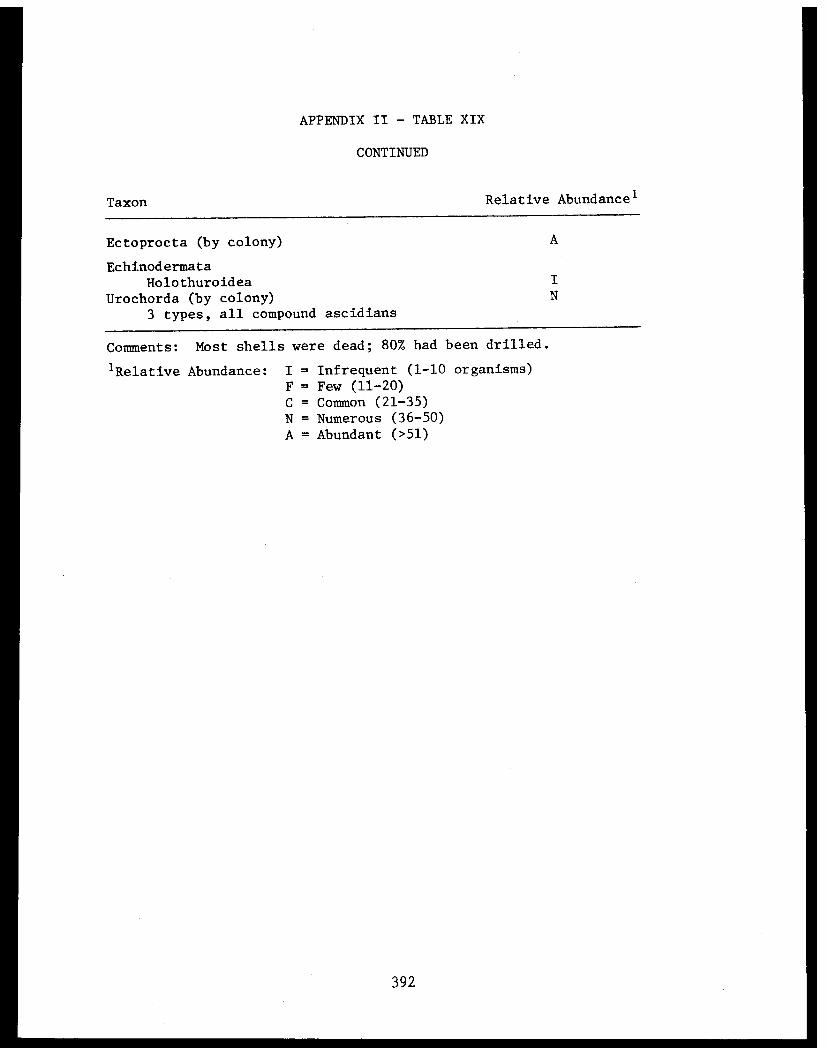
APPENDIX II - TABLE XIX
CONTINUED
392

APPENDIX II - TABLE XX
TAXA FROM BOTTOM SKIMMER STATION 22, 27.5 METERS, 10 AUGUST 1976
393
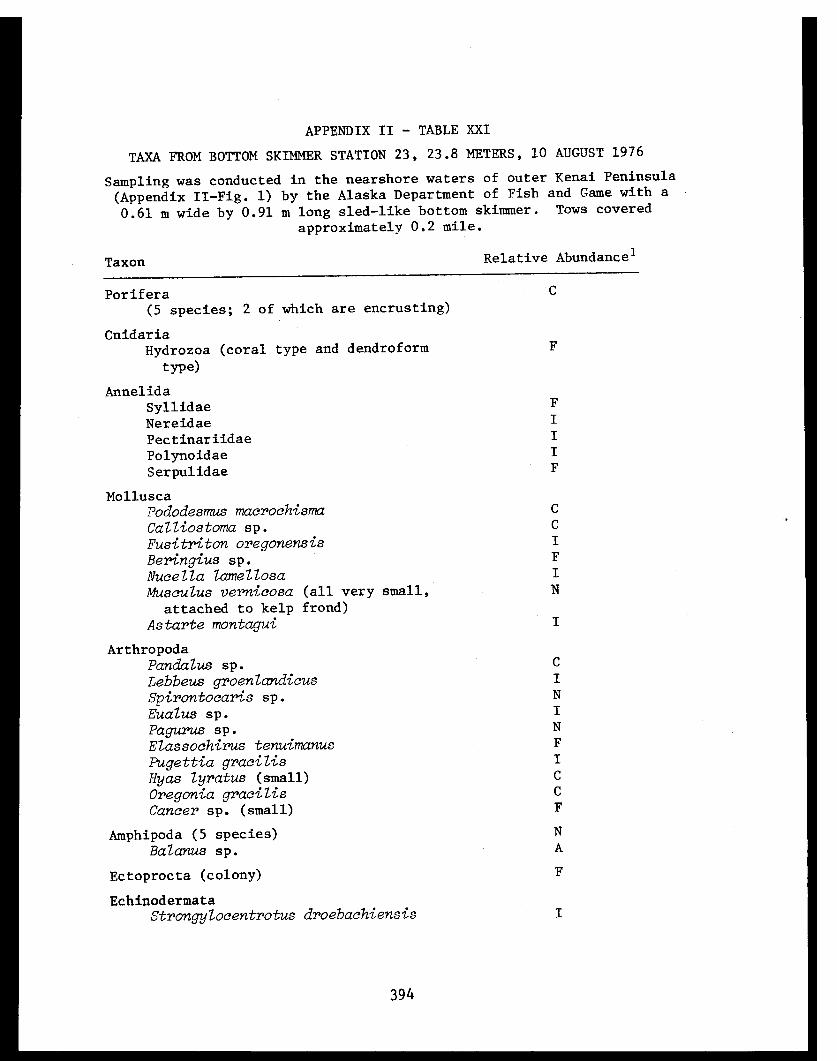
APPENDIX II - TABLE XXI
TAXA FROM BOTTOM SKIMMER STATION 23, 23.8 METERS, 10 AUGUST 1976
394
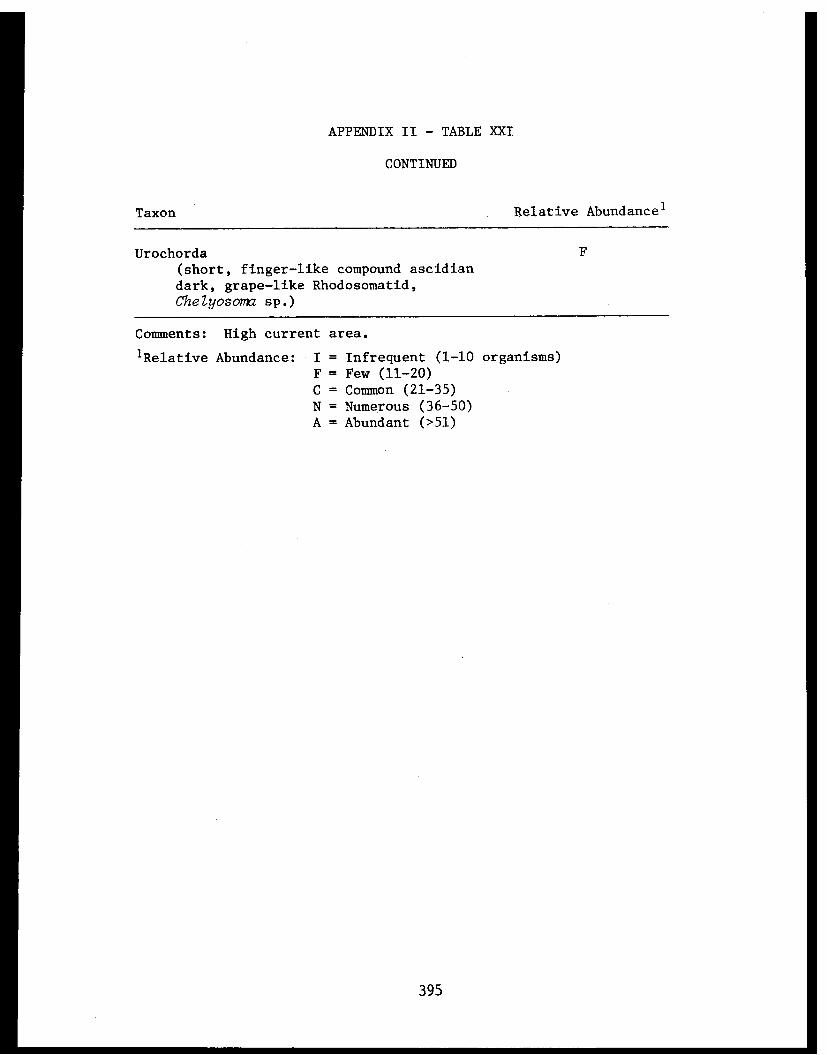
APPENDIX II - TABLE XXI
CONTINUED
395
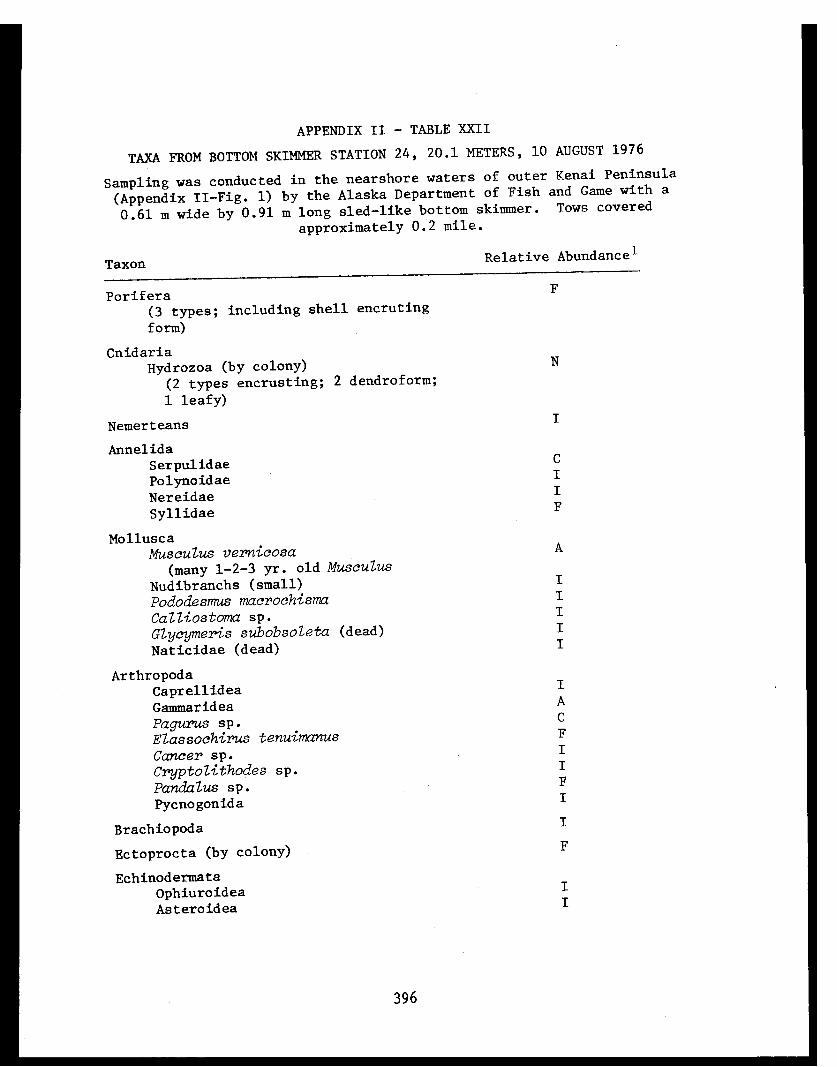
APPENDIX II - TABLE XXII
TAXA FROM BOTTOM SKIMMER STATION 24, 20.1 METERS, 10 AUGUST 1976
396

APPENDIX II - TABLE XXIII
TAXA FROM BOTTOM SKIMMER STATION 24, 20.1 METERS, 10 AUGUST 1976
397

APPENDIX II - TABLE XXIII
CONTINUED
398
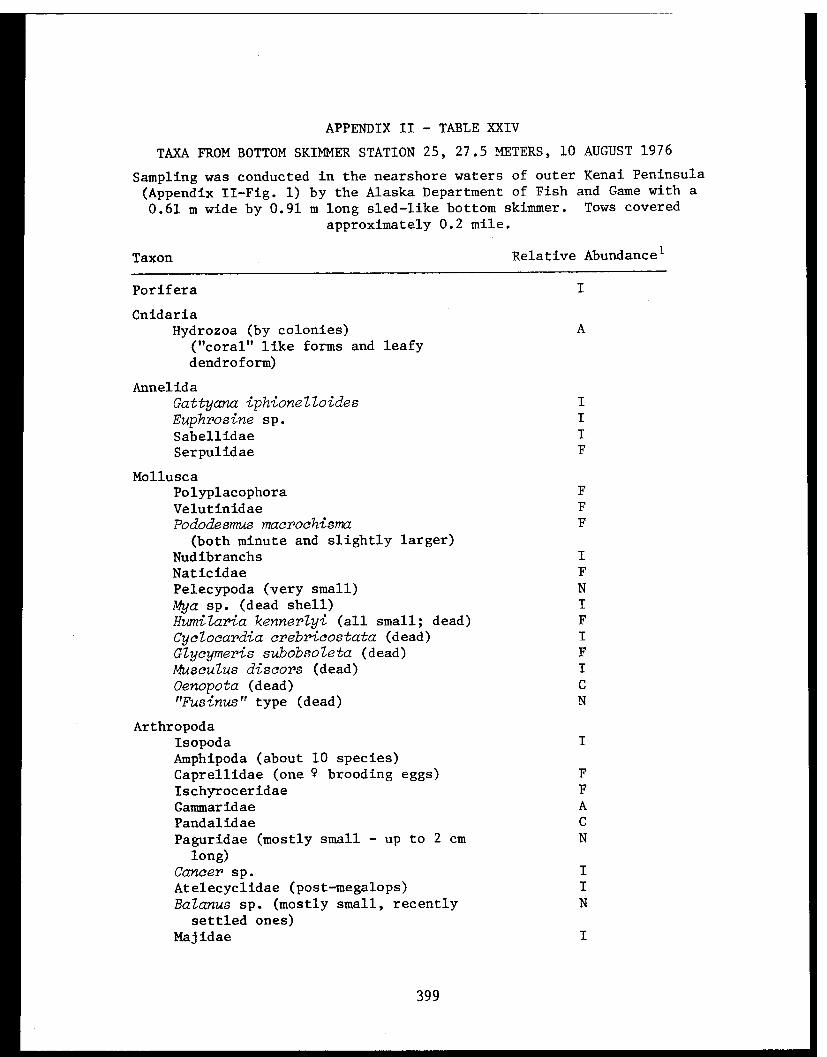
APPENDIX II - TABLE XXIV
TAXA FROM BOTTOM SKIMMER STATION 25, 27.5 METERS, 10 AUGUST 1976
399
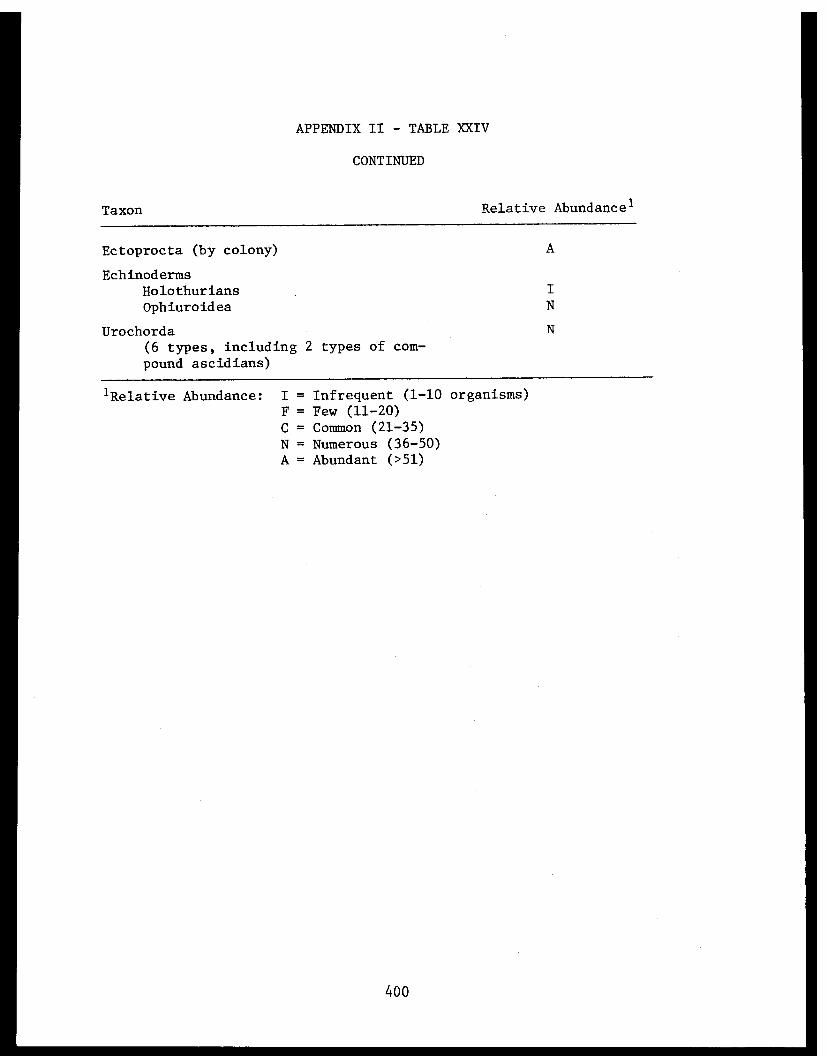
APPENDIX II - TABLE XXIV
CONTINUED
400
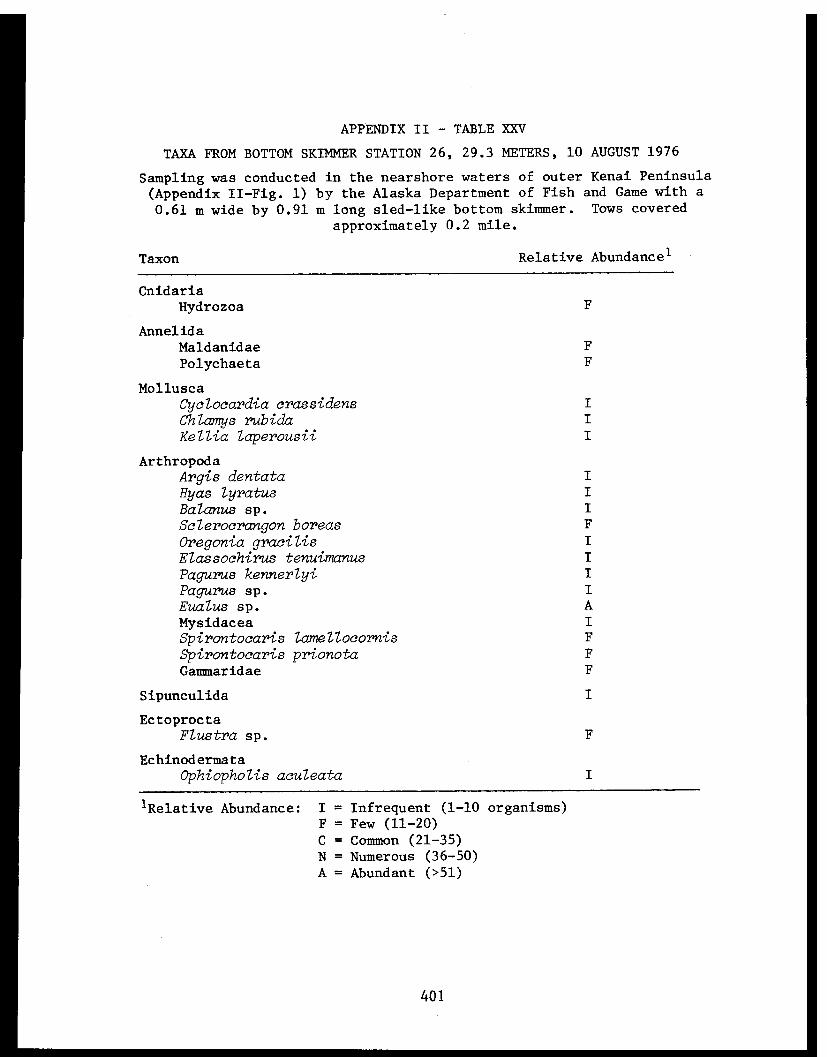
APPENDIX II - TABLE XXV
TAXA FROM BOTTOM SKIMMER STATION 26, 29.3 METERS, 10 AUGUST 1976
401
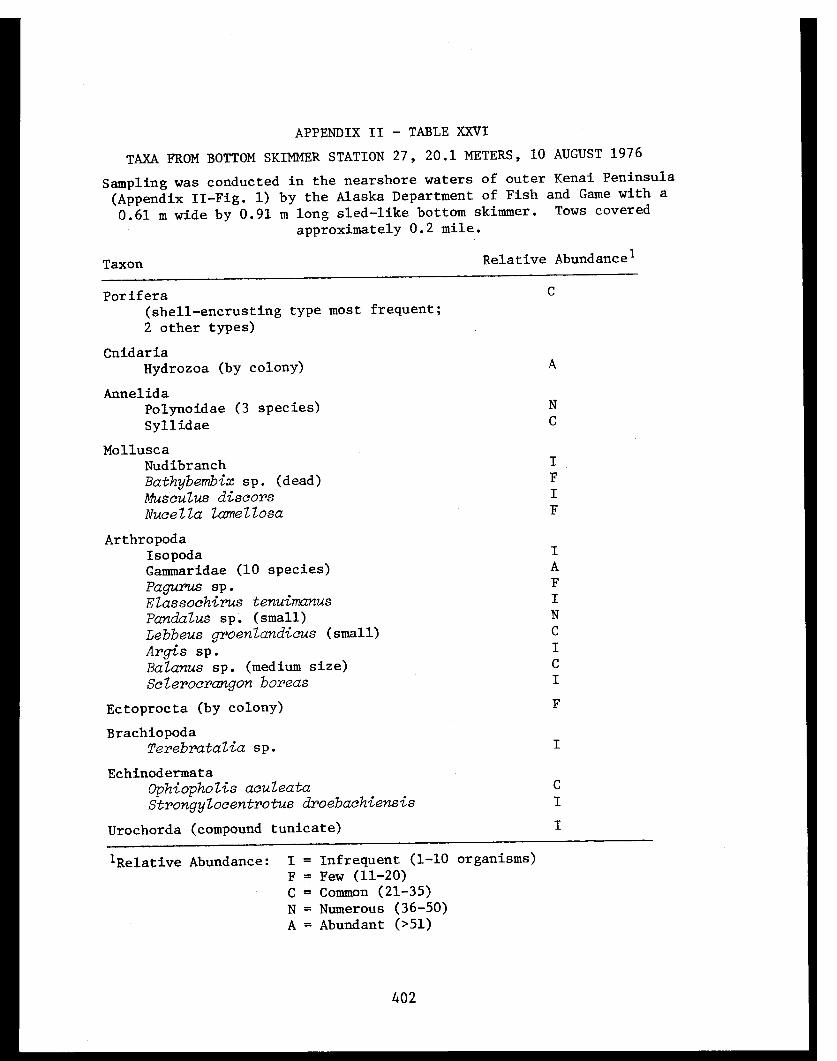
APPENDIX II - TABLE XXVI
TAXA FROM BOTTOM SKIMMER STATION 27, 20.1 METERS, 10 AUGUST 1976
402
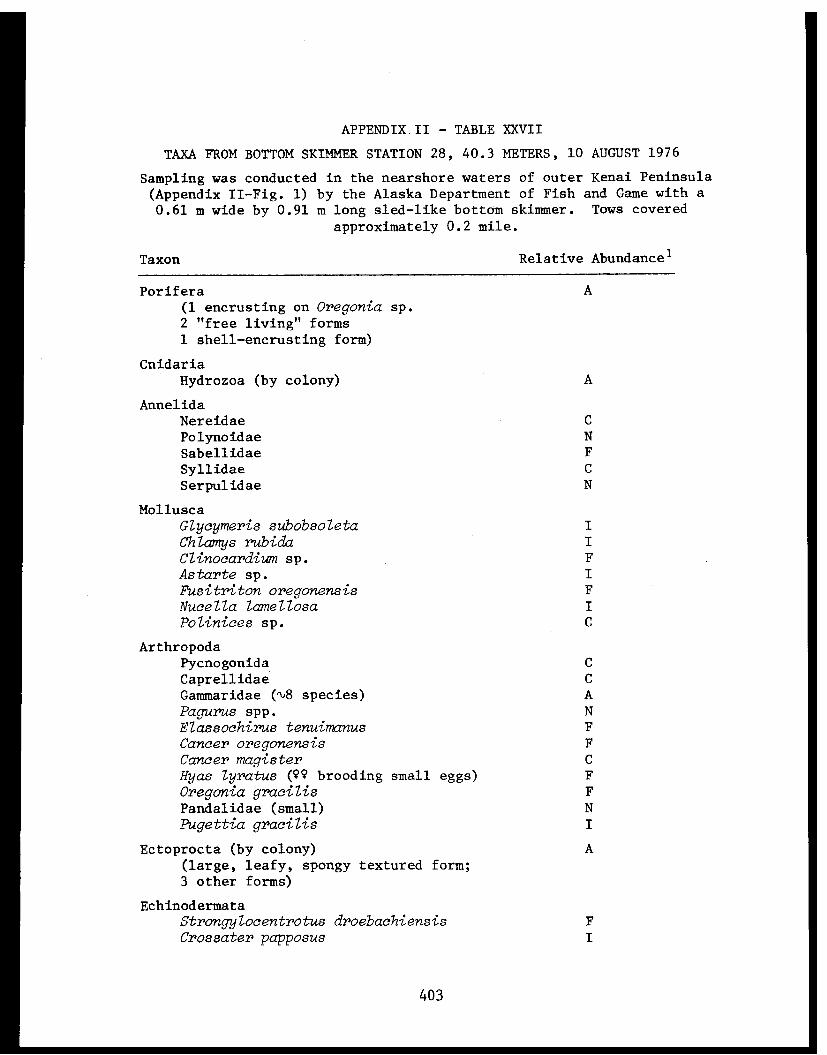
APPENDIX II - TABLE XXVII
TAXA FROM BOTTOM SKIMMER STATION 28, 40.3 METERS, 10 AUGUST 1976
403

APPENDIX II - TABLE XXVII
CONTINUED
404

APPENDIX II - TABLE XXVIII
TAXA FROM BOTTOM SKIMMER STATION 29, 31.1 METERS, 10 AUGUST 1976
405

APPENDIX III
INVERTEBRATE TAXA OBTAINED BY PIPE DREDGEIN LOWER COOK INLET
406
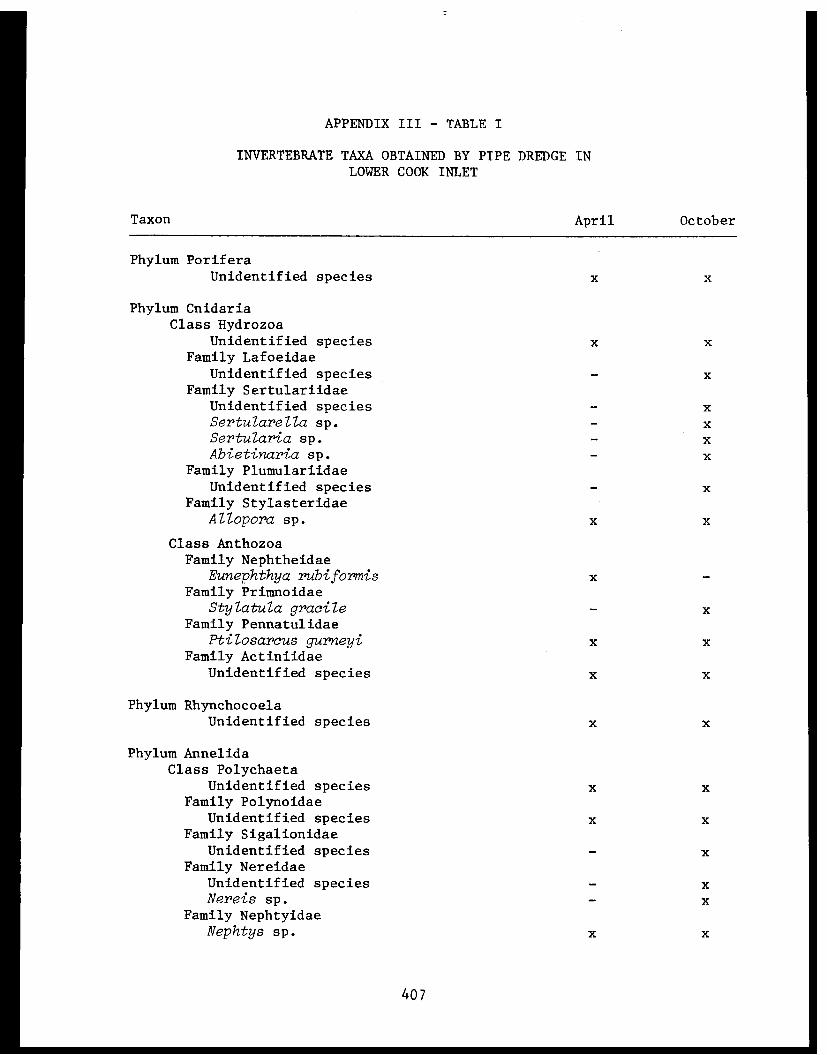
APPENDIX III - TABLE I
INVERTEBRATE TAXA OBTAINED BY PIPE DREDGE INLOWER COOK INLET
407
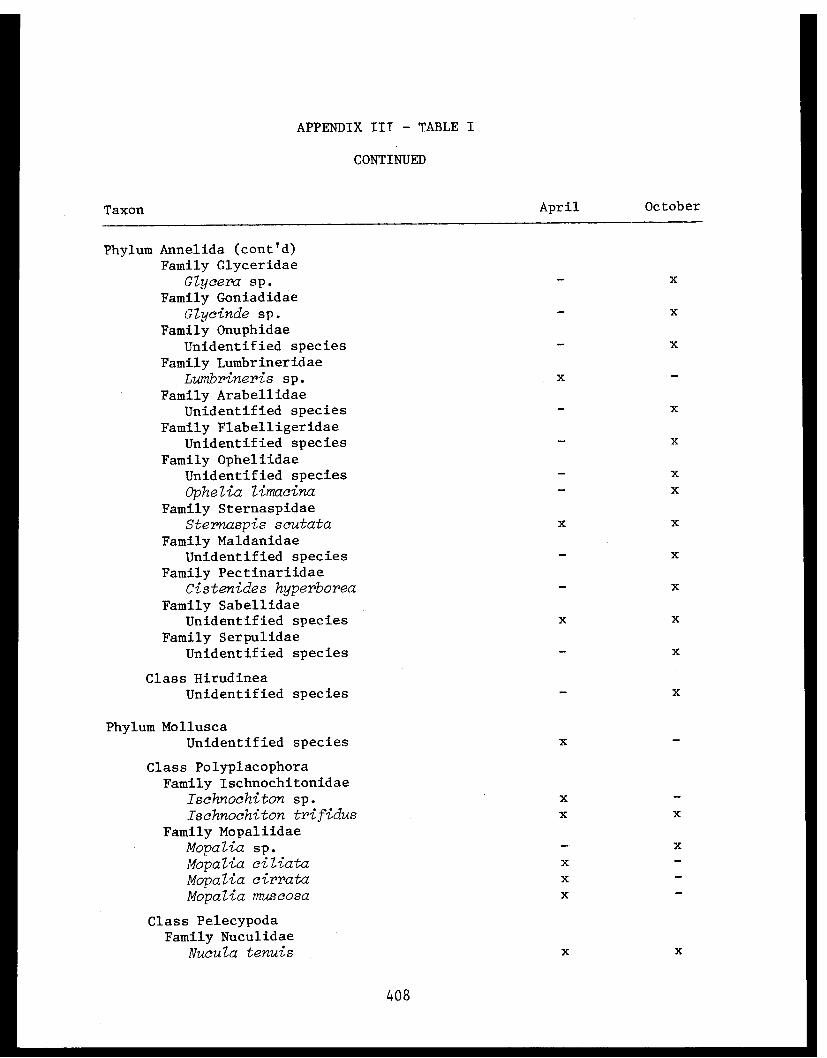
APPENDIX II - TABLE I
CONTINUED
408
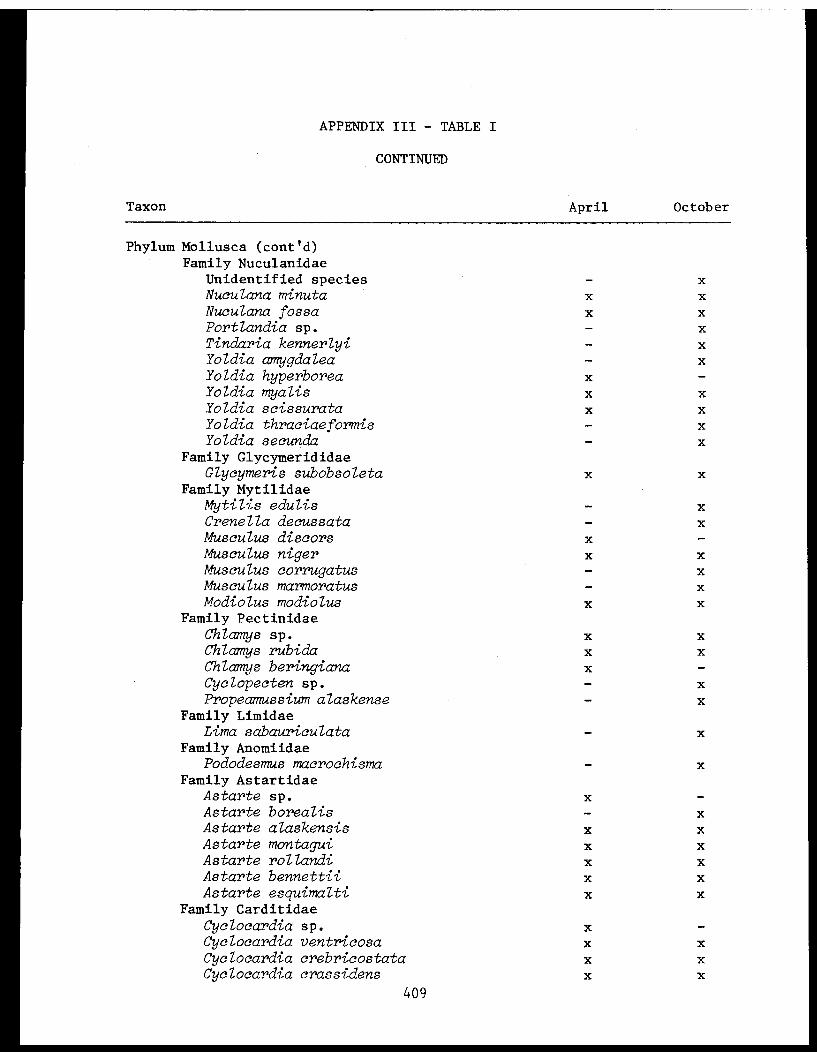
APPENDIX III - TABLE I
CONTINUED
409

APPENDIX III - TABLE I
CONTINUED
410
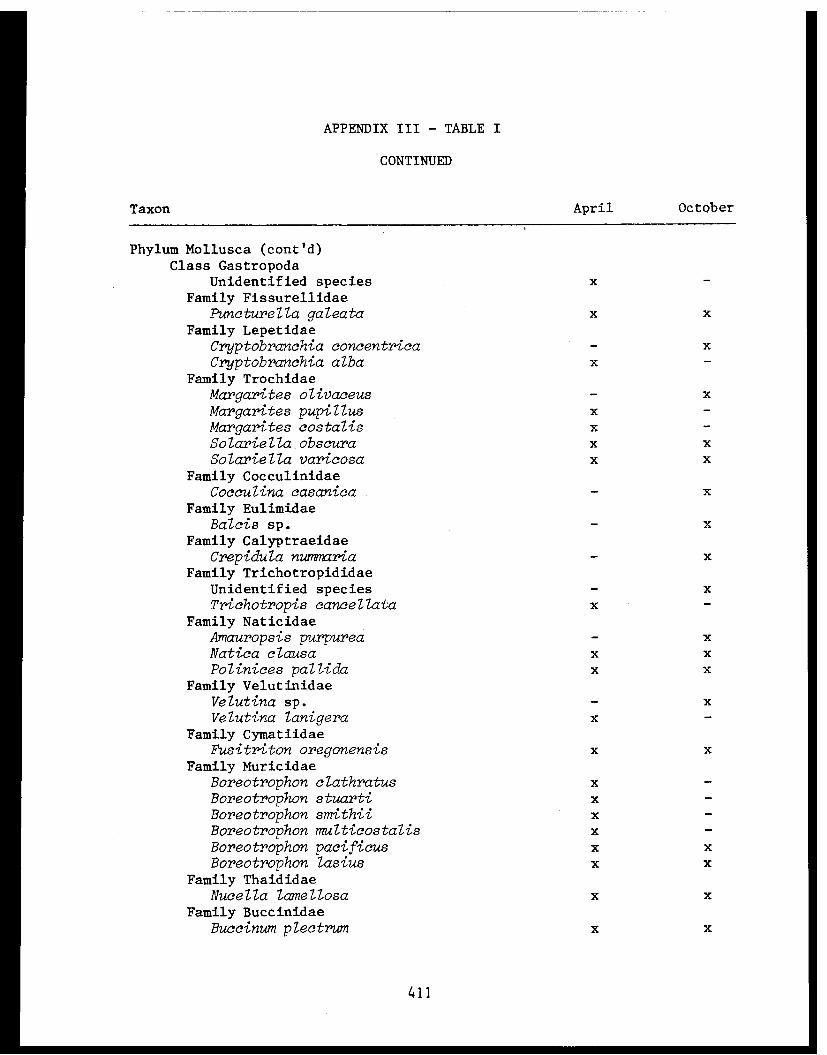
APPENDIX III - TABLE I
CONTINUED
411

APPENDIX III - TABLE I
CONTINUED
412
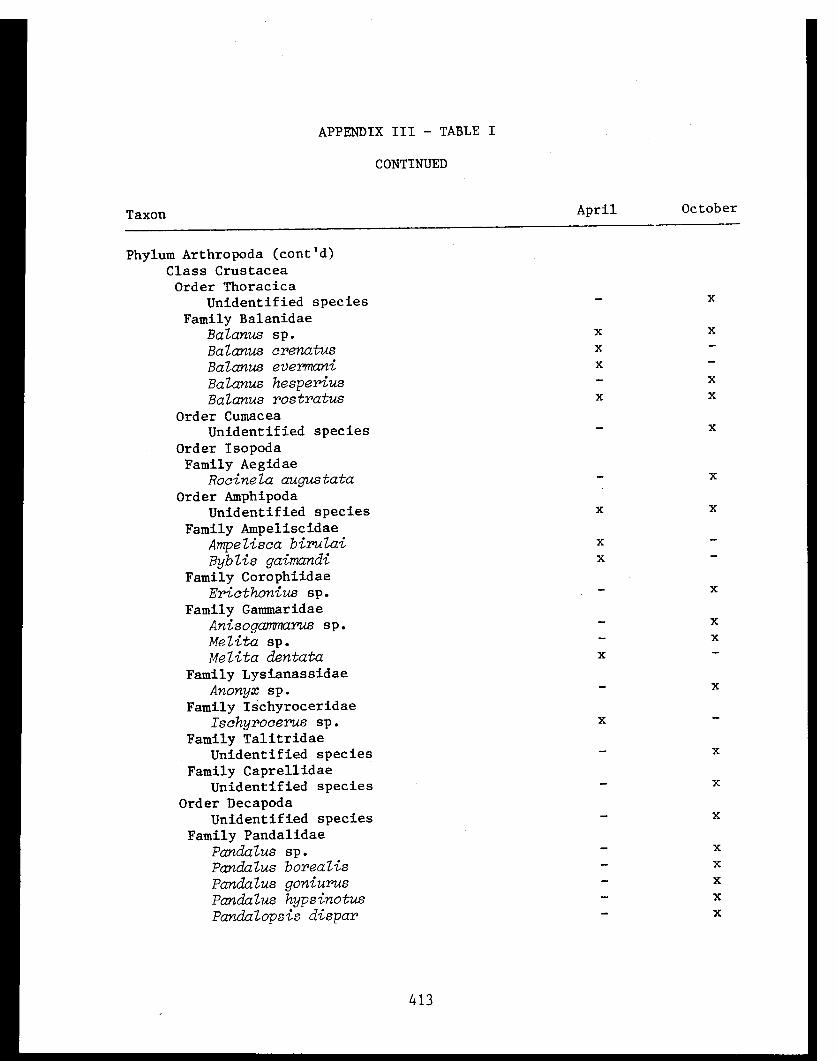
APPENDIX III - TABLE I
CONTINUED
413
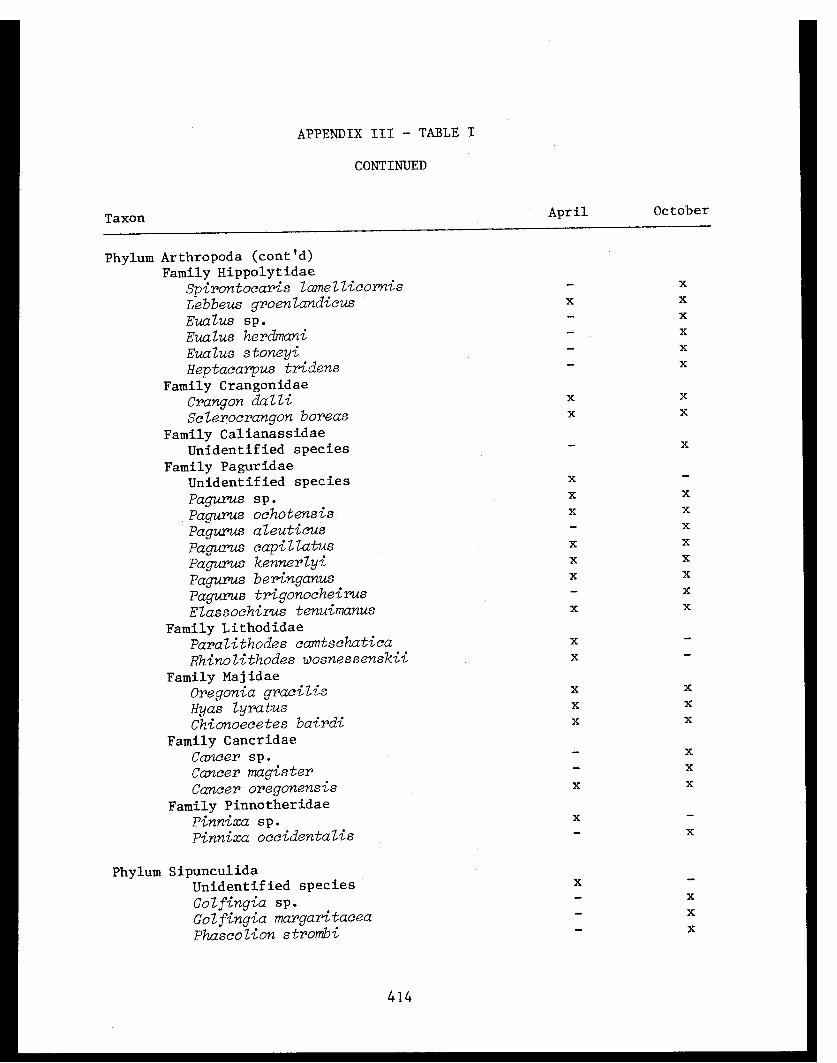
APPENDIX III - TABLE I
CONTINUED
414
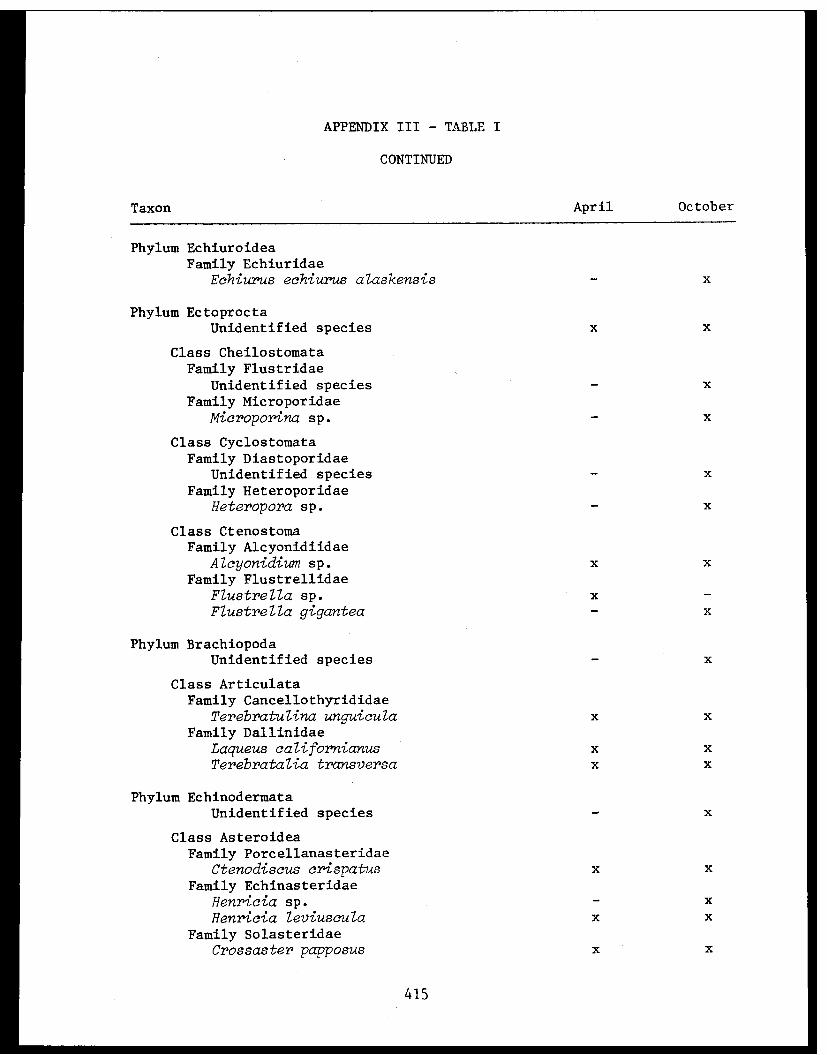
APPENDIX III - TABLE I
CONTINUED
415
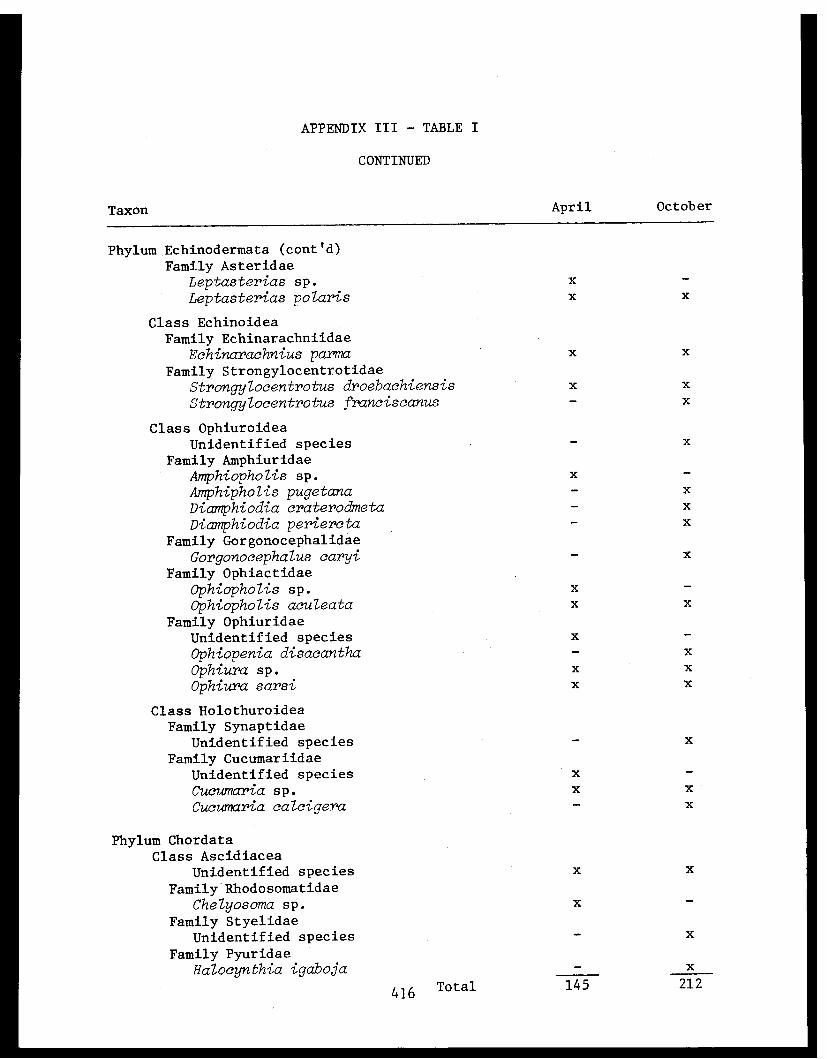
APPENDIX III - TABLE I
CONTINUED
416
APPENDIX IV
INVESTIGATIONS ON SHALLOW SUBTIDAL HABITATSAND ASSEMBLAGES IN LOWER COOK INLET
417


INVESTIGATIONS ON SHALLOW SUBTIDAL HABITATS
AND ASSEMBLAGES IN LOWER COOK INLET
by
Dennis C. Lees
and
William B. Driskell
DAMES & MOORE
For
Institute of Marine Sciences
University of Alaska
Anchorage, Alaska
February 11, 1980
419
TABLE OF CONTENTS
Page
Table of Contents .............................................. 420
List of Tables ................................................. 423
List of Figures................................................ 424
List of Appendices ............................................. 542
I. SUMMARY OF OBJECTIVES, CONCLUSIONS, AND IMPLICATIONS
WITH RESPECT TO OCS OIL AND GAS DEVELOPMENT .............. 426
II. INTRODUCTION ............................................. 427
A. NATURE AND SCOPE ..................................... 427
B. OBJECTIVES........................................... 428
III. CURRENT STATE OF KNOWLEDGE ............................... 429
IV. PHYSICAL SETTING AND STUDY AREAS ......................... 433
A. EAST SIDE OF INLET - ROCK ............................ 4331. Jakolof Bay ...................................... 434
2. Barabara Point ...................... ........... . 4353. The Northern Shelf ............................... 435
B. WEST SIDE OF INLET - ROCK ............................ 4351. Scott Island ..................................... 436
2. Knoll Head Lagoon................................ 4373. White Gull Island ................................ 437
4. Black Reef ....................................... 4385. Turtle Reef ....... ............................... 438
V. METHODS ......... ............................................ 439
A. FIELD COLLECTION PROCEDURES.......................... 439
B. LABORATORY PROCEDURES................................ 439
C. DATA ANALYSIS ........................................ 440
VI. RESULTS ........................ .......................... 441
A. KACHEMAK BAY - ROCK SUBSTRATE ........................ 441
1. The Biological Assemblage atArchimandritof Shoals ................. .......... 441
2. The Biological Assemblage at Bishop's Beach...... 444
3. The Biological Assemblage at Bluff Point......... 446
4. The Biological Assemblage at Anchor Point -
Troublesome Creek............................. 451
9 5. The Biological Assemblage at Jakolof Bay......... 457
420 6. The Biological Assemblage at Barabara Bluff...... 461

TABLE OF CONTENTS (Continued)
Page
B. KAMISHAK BAY ......................................... 4641. The Biological Assemblage at Scott Island........ 4642. The Biological Assemblage at Knoll Head
Lagoon. . ...................................... 4663. The Biological Assemblage at White Gull
Island ........................................ 4724. The Biological Assemblage at Black Reef .......... 4745. The Biological Assemblage at Turtle Reef......... 475
C. THE BIOLOGY OF MODIOLUS MODILUS ............. ......... 4751. Habitat .......................................... 4752. Distribution ..................................... 4763. Size Structure ................................... 4774. Predation and Secondary Production............... 485
D. FEEDING OBSERVATIONS ON BENTHIC INVERTEBRATES........ 494
E. SOFT SUBSTRATES ...................................... 4981. The Biological Assemblage at Mud Bay ............. 4982. The Biological Assemblage at Cottonwood Bay ...... 4993. The Biological Assemblage at Nordyke
Island Channel ................................ 505
4. The Biological Assemblage at Oil Bay ............. 505
VII. DISCUSSION ............................................... 506
A. COMPARISON OF ASSEMBLAGES ............................ 506
B. BIOLOGY OF MODIOLUS .................................. 513
C. TROPIC STRUCTURE OF INVERTEBRATE ASSEMBLAGES ONROCKY SUBSTRATES IN LOWER COOK INLET.............. 514
D. POTENTIAL FOR IMPACT FROM OCS OIL AND GASEXPLORATION, DEVELOPMENT, AND PRODUCTION .......... 520
1. Vulnerability to Exposure ........................ 5202. Sensitivity to Oil ............................... 521
a. Southern Kachemak Bay Assemblage............. 521b. Northern Kachemak Bay Assemblage............. 523c. Assemblage from the West Side of
Lower Cook Inlet.......................... 5243. Specific Activities or Developments .............. 525
a. Drilling Platforms ........................... 526b. Shore-based Facilities and
Tanker Terminals .......................... 528c. Pipelines ..... ........................ 530d. Other Concerns............................... 532
421
TABLE OF CONTENTS (Continued)
Page
VIII. CONCLUSIONS ............................................... 533
IX. LITERATURE CITED .......................... ......... 538
X. APPENDICES ............................................. 542
422
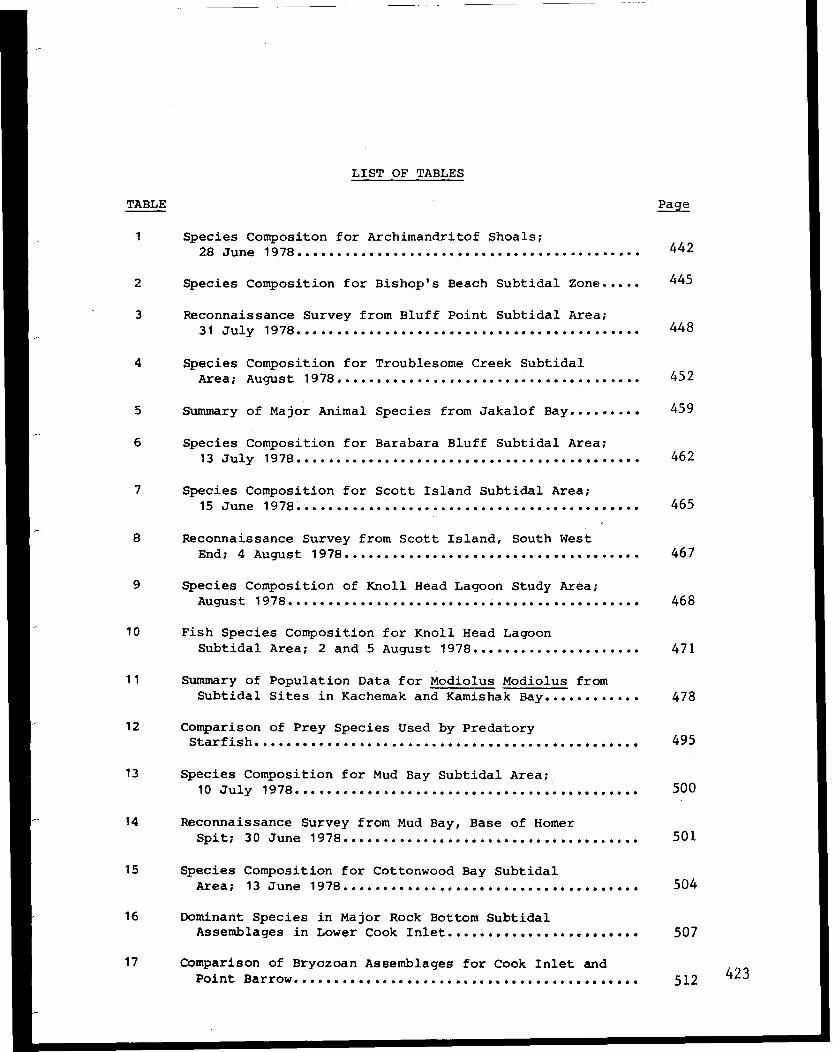
LIST OF TABLES
TABLE Page
1 Species Compositon for Archimandritof Shoals;28 June 1978. .......................... ......... 442
2 Species Composition for Bishop's Beach Subtidal Zone..... 445
3 Reconnaissance Survey from Bluff Point Subtidal Area;31 July 1978........................................... 448
4 Species Composition for Troublesome Creek SubtidalArea; August 1978 ...................................... 452
5 Summary of Major Animal Species from Jakalof Bay ......... 459
6 Species Composition for Barabara Bluff Subtidal Area;13 July 1978 .......................................... 462
7 Species Composition for Scott Island Subtidal Area;
15 June 1978.......... ........................... . 465
8 Reconnaissance Survey from Scott Island, South West
End; 4 August 1978 .................................... 467
9 Species Composition of Knoll Head Lagoon Study Area;August 1978 .................................... 468
10 Fish Species Composition for Knoll Head Lagoon
Subtidal Area; 2 and 5 August 1978..................... 471
11 Summary of Population Data for Modiolus Modiolus fromSubtidal Sites in Kachemak and Kamishak Bay............ 478
12 Comparison of Prey Species Used by PredatoryStarfish................................................ 495
13 Species Composition for Mud Bay Subtidal Area;10 July 1978 ........................................... 500
14 Reconnaissance Survey from Mud Bay, Base of HomerSpit; 30 June 1978 .................................... 501
15 Species Composition for Cottonwood Bay SubtidalArea; 13 June 1978..................................... 504
16 Dominant Species in Major Rock Bottom SubtidalAssemblages in Lower Cook Inlet........................ 507
17 Comparison of Bryozoan Assemblages for Cook Inlet and
Point Barrow ...... ........ ................... 512 423
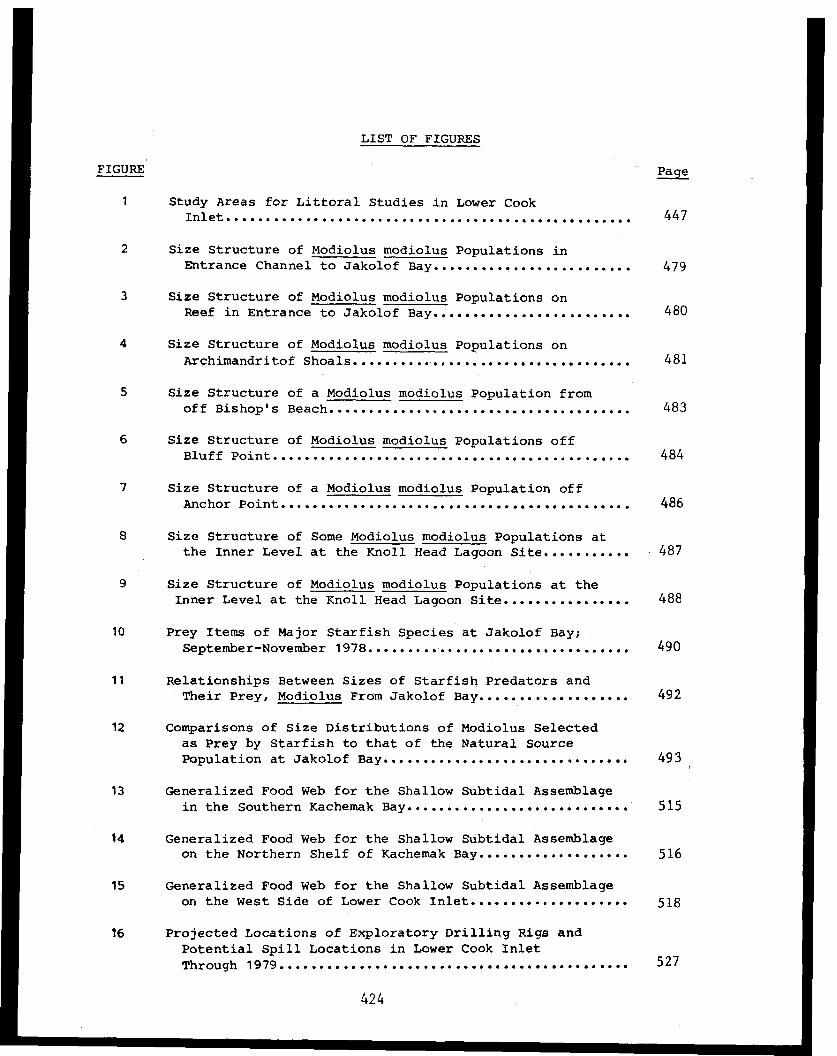
LIST OF FIGURES
FIGURE Page
1 Study Areas for Littoral Studies in Lower CookInlet................................................... 447
2 Size Structure of Modiolus modiolus Populations inEntrance Channel to Jakolof Bay.......................... 479
3 Size Structure of Modiolus modiolus Populations onReef in Entrance to Jakolof Bay......................... 480
4 Size Structure of Modiolus modiolus Populations onArchimandritof Shoals........ .................. 4.... 481
5 Size Structure of a Modiolus modiolus Population fromoff Bishop's Beach...................................... 483
6 Size Structure of Modiolus modiolus Populations offBluff Point........................................... . 484
7 Size Structure of a Modiolus modiolus Population offAnchor Point................. ......... ..... ...... 486
8 Size Structure of Some Modiolus modiolus Populations atthe Inner Level at the Knoll Head Lagoon Site........... 487
9 Size Structure of Modiolus modiolus Populations at theInner Level at the Knoll Head Lagoon Site................ 488
10 Prey Items of Major Starfish Species at Jakolof Bay;September-November 1978................................. 490
11 Relationships Between Sizes of Starfish Predators andTheir Prey, Modiolus From Jakolof Bay................... 492
12 Comparisons of Size Distributions of Modiolus Selectedas Prey by Starfish to that of the Natural SourcePopulation at Jakolof Bay................................ 493
13 Generalized Food Web for the Shallow Subtidal Assemblagein the Southern Kachemak Bay............................. 515
14 Generalized Food Web for the Shallow Subtidal Assemblageon the Northern Shelf of Kachemak Bay................... 516
15 Generalized Food Web for the Shallow Subtidal Assemblageon the West Side of Lower Cook Inlet.................... 518
16 Projected Locations of Exploratory Drilling Rigs andPotential Spill Locations in Lower Cook InletThrough 1979................................. .. 527
424

LIST OF FIGURES (Cont.)
FIGURE Page
17 Potential Locations for Onshore Facilities Associated
with Oil Exploration, Development and Production inLower Cook Inlet.......................................529
18 Potential Offshore Pipeline Corridors in LowerCook Inlet .................................... 531
425
I. SUMMARY OF OBJECTIVES, CONCLUSIONS, AND IMPLICATIONS
WITH RESPECT TO OCS OIL AND GAS DEVELOPMENT
The main objectives of this study were to expand the available informa-
tion base on shallow subtidal habitats in Kachemak and Kamishak Bays, to
describe the large horse mussel (Modiolus) assemblage in more detail, and
to examine the trophic structure of shallow subtidal assemblages. Major
emphasis was given to rocky substrates.
Three important types of assemblages were observed on shallow subtidal
rocky habitats. The southern Kachemak Bay assemblage, strongly resembling
shallow subtidal rocky assemblages in the northeastern Pacific, was strongly
dominated by kelps and is probably least vulnerable to impingement of oil
contamination and least sensitive to the effects of an acute oil spill. The
northern Kachemak Bay assemblage included an important kelp component but was
strongly dominated by suspension feeders. Standing stocks of suspension
feeders were very high. This assemblage is probably moderately vulnerable to
impingement but highly sensitive to the effects of an acute oil spill. The
western Cook Inlet assemblage, strongly resembling epifaunal assemblages in
the Bering and Beaufort Seas, was strongly dominated by suspension feeders.
Except in the intertidal and very shallow subtidal zones, kelps were absent.
The area is probably highly vulnerable to impingement of oil contamination
and highly sensitive to the effects of acute spills. Acute spills from
drilling platforms, terminal facilities, tankers, or pipelines probably
constitute the greatest threat to shallow subtidal assemblages in lower Cook
Inlet. Other oil-related impacts are of lesser concern because of the
remoteness of these assemblages from the activities and the high degree
of turbulence in the overlying water masses.
426
II. INTRODUCTION
Counterbalancing the economic and political gain that could be realized
from development of potential oil and gas reserves in lower Cook Inlet is
the -very real prospect that the intertidal and shallow subtidal habitats of
that estuary may be exposed to large-scale chronic or acute contamination.
The magnitude of this potential problem is dependent primarily on the overall
importance of the littoral* zone and its component habitats to the biolog-
ical systems of the inlet and associated areas and, secondarily, on the
actual sensitivity of these habitats to the potential perturbations. Man
tends to rank the importance of a resource according to his own observable
utilization of the resource. Since one of the most important human uses of
intertidal resources in lower Cook Inlet directly perceived by most indivi-
duals is clamming, and since only small segments of the coastline are used,
the importance of intertidal habitats is often considered to be low. How-
ever, the actual importance and sensitivity of the zone cannot be evaluated
until it has been adequately described and its relationships to other systems
are at least generally defined. It is clear from experience throughout the
world that severe observable impacts of oil-related problems can occur in the
littoral zone (Boesch, Hershner and Milgram 1974; Smith 1968; Nelson-Smith
1972; NAS 1975).
A. NATURE AND SCOPE
Littoral habitats and assemblages in lower Cook Inlet were generally un-
described until Dames & Moore biologists commenced rocky intertidal studies
in Kachemak Bay in 1974 (Rosenthal and Lees 1976). Soft intertidal habitats
(sand and mud) were not studied until spring and summer of 1976, when the
Bureau of Land Management (BLM) initiated a reconnaissance of physical,
chemical, and biological systems in lower Cook Inlet through its Outer
Continental Shelf Environmental Assessment Program (OCSEAP).
*Littoral as used in this document refers to the intertidal and shallowsubtidal zone, out to a depth of 25 m.
427
These studies were initially designed to collect the information necessary
to permit BLM to write the Environmental Impact Statement for the OCS oil
and gas lease sale. As part of the reconnaissance, the first phase of
this study (R. U. #417) was designed to examine and describe beaches repre-
sentative of the major littoral habitats in lower Cook Inlet (Lees and
Houghton 1977).
Additional site-specific studies followed, but did not permit examina-
tion of the diversity of habitat types suspected in the littoral zone
throughout lower Cook Inlet. Furthermore, because of the breadth of the
scope of these studies, certain specific aspects could not be addressed,
leaving some important data gaps.
B. OBJECTIVES
The specific objectives of this study have been to:
1. Examine more shallow subtidal locations in Kachemak and Kamishak Bays
in order to improve our understanding of the range of variation of
the community types existing there;
2. Study populations of the horse mussel Modiolus modiolus and benthic
assemblages associated with it; and
3. Expand the data base on the trophic structure of shallow subtidal
assemblages in Kachemak and Kamishak Bays.
428
III. CURRENT STATE OF KNOWLEDGE
Various facets of the major littoral assemblages in lower Cook Inlet
have been described in reports since 1975. However, at this time all of the
work has been descriptive, based on qualitative and/or quantitative obser-
vations. Critical examination of the processes shaping the littoral communi-
ties and the potential for impact from OCS oil and gas development awaits
experimental studies of the interrelationships and interactions among the
various organisms and assemblages and the physical and chemical environment
influencing them.
Most of the information describing littoral communities in lower Cook
Inlet is included in reports by Rosenthal and Lees (1976, 1979), Lees and
Houghton (1977), and Lees et al. (1979a).Additional information is included
in Lees (1976, 1977, and MS), Erikson (1977), Sundberg and Clausen (1977),
Cunning (1977), Driskell and Lees (1977), Sanger, Jones and Wiswar (1979).
These reports provide insights into the composition, structure, function,
seasonal variations, and production of the biological assemblages in lagoons,
bays, mud flats, kelp beds, sand beaches rocky intertidal and subtidal
habitats, mussel beds and cobble beaches; and the distribution, seasonal
abundance and diet of many associated birds. These reports indicate that the
littoral assemblages in Lower Cook Inlet are generally diverse, highly
dynamic and highly productive, especially the rock intertidal habitats, the
rocky subtidal areas in Kachemak Bay, and the mud flats.
Rosenthal and Lees (1976) studied several littoral habitats in Kachemak
Bay from 1974 to 1976. The majority of their work was on rocky intertidal
and subtidal habitat on both the north and south sides of the bay. The
report indicates that vegetative cover and floral composition on rocky
habitats varied considerably on a seasonal basis; greatest cover occurred
in the summer. A similar pattern was reported for sessile invertebrates
such as barnacles and mussels. In addition, the report provides a pre-
liminary description of trophic structure on rocky habitats and seasonal
variation in predation rates and predator occurrence. Furthermore, strong
differences were reported between the composition and productivity of the
429
assemblages on the north and south borders on Kachemak Bay, and high standing
stocks of the horse mussel Modiolus modiolus on the north shelf were noted.
The intertidal reconnaissance in lower Cook Inlet indicated that most of
the rocky intertidal habitats are located in Kachemak Bay and Kennedy
Entrance, on the east, and in Kamishak Bay, on the west (Lees and Houghton
1977). The intertidal areas north of Kachemak and Kamishak Bays are mainly
soft, with the lower beaches in exposed areas being sand and in protected
areas, mud. At lower tidal levels, approximately 50 percent of the shoreline
on the west side is mud flats, largely as a consequence of the number of bays
that intrude deeply into the coastline. North of Kachemak Bay on the east
side of the Inlet, the smooth shoreline is interrupted by just a few rivers
and streams, and the lower tidal levels are almost exclusively sandy. The
upper beaches (above MLLW) for a large proportion of the shoreline in the
lower Inlet are characterized by a steeper slope of poorly sorted sand,
coarse gravel, and cobbles. Based on the slope, grain size, and impoverished
fauna, this habitat appears to be the least stable of the soft, or unconsoli-
dated, intertidal substrates in lower Cook Inlet.
Lees and Houghton (1977) reported important differences in algal distri-
bution and production in lower Cook Inlet. The algal assemblages in the
southeastern quadrant of the inlet (including Kachemak Bay) appeared much
more productive than in the remaining quadrants, where significant algal
production was generally limited to depths of less than 3 m. These patterns
were attributed to both turbidity and available substrate. They also suggest
that macrophyte production in the SE quadrant of lower Cook Inlet might be of
importance in the overall scheme of plant production and trophic dynamics of
the inlet.
In addition, the report of Lees (1976) that the subtidal epifauna on the
west side of the inlet bore a strong resemblance to the assemblages described
by MacGinitie (1955) for the Beaufort Sea was corroborated by additional
diving studies.
430

The reconnaissance study further indicated sharp differences between
the biotic assemblages of the sand and mud habitats. Although both habitats
were characterized by detritus-based assemblages, and depended to varying
degrees upon organic debris produced in other areas, the sand beaches sup-
ported a rather impoverished assemblage with low biomass whereas the mud
beaches supported a more diverse assemblage with moderate biomass. The sand
beach faunas were dominated by polychaete worms and gammarid amphipods
whereas the mud flat faunas were heavily dominated by clams. The lower level
of the gravel upper beach appeared to be dominated by a gammarid amphipod and
an isopod, both of which formed dense aggregations under large cobbles (Lees
and Houghton 1977).
It is suspected, based on the reconnaissance study, that intertidal
resources are important to several non-resident or migratory organisms.
For instance, migratory shorebirds, gulls, and sea ducks feed heavily on
organisms living in soft intertidal substrates, especially mud. During
spring migration, at least one group is feeding there during each stage of
the tide. Fish and crustaceans move into the intertidal zone during high
tides to feed and some species remain there during low tide (Green 1968).
Several investigators have reported that mud flats are important feeding
areas for juvenile salmon (Sibert et al. 1977; Kaczynski et al. 1973).
However, only preliminary descriptions of the various systems examined were
provided by the reconnaissance studies.
The major objective of the research described by Lees et al. (1979a) was
to more fully describe the systems at specific sites, and to identify the
more important relationships and processes operating in these assemblages.
This necessitated a fairly detailed examination of seasonal changes in
species composition and structure. Trophic relationships were not emphasized
because the most important predators (birds and fish) are the object of other
research units.
Lees et al. (1979a), reported on seasonal, zonal, and geographic
variations in abundance, relative cover and biomass of biotic assemblages on
rock, sand, and mud substrates in lower Cook Inlet, They also discussed
431
seasonal variations in growth rates of three major kelp species (Alaria
fistulosa, Agarum cribrosum and Laminaria groenlandica) and primary produc-
tion of Alaria, observing that growth rates of the blades of these three
species were highest from March through June and declined to very low rates
in late summer through mid-winter. They pointed out that kelps accounted for
a major proportion of algal standing stocks on both intertidal and subtidal
rocky substrates in Kachemak Bay. They described the infaunal biomass
patterns on sand and mud beaches, noting that mud flats support high standing
stocks of the clams Mya spp. and Macoma balthica, and that the infaunal
assemblages on sand beaches are rather impoverished.
Rosenthal and Lees (1979) investigated composition, abundance and
trophic structure of inshore fish assemblages in lower Cook Inlet, parti-
cularly on rocky habitats in Kachemak Bay. Major groups included greenlings,
ronquils, sculpins and flatfish. Fish densities and species diversity were
highest in summer and lowest in winter. Most species appeared to move to
deeper water in the winter. Feeding efforts tended to concentrate on epi-
benthic forms, especially shrimp and crabs.
The importance of the interactions between birds and the littoral
zone has been noted by Erikson (1977), Sanger, Jones and Wiswar (1979), and
Lees et al. (1979a). Erikson (1977) reported on composition, seasonal
variations in distribution and abundance of bird assemblages in Kachemak Bay
and lower Cook Inlet. The most important year-round groups in littoral
habitats included sea ducks and gulls, but shorebirds are seasonally very
abundant. Sanger, Jones and Wiswar (1979) examined food habits of a number
of species and found that sea ducks fed largely on heavily infaunal and
sessile epifaunal molluscs whereas gulls had a more catholic diet. Of
particular importance to several sea ducks are the clam Macoma balthica and
the mussel Mytilus edulis.
432
IV. PHYSICAL SETTING AND STUDY AREAS
Cook Inlet is a large tidal estuary located on the northwest edge of the
Gulf of Alaska in south-central Alaska. The axis of the inlet trends north-
northeast to south-southwest and is approximately 330 km long, increasing
in width from 36 km in the north to 83 km in the south. The inlet, geograph-
ically divided into the upper and lower portions by the East and West
Forelands, is bordered by extensive tidal marshes, lowlands with numerous
lakes, and glaciated mountains. Large tidal marshes and mud flats are common
along much of the western and northern margins of the upper inlet. Most
tributary streams are heavily laden with silt and seasonally contribute heavy
sediment loads, especially in the upper inlet. The range of the semi-diurnal
tides is extreme with a normal amplitude of 9 m (30 ft) at the head of the
inlet. Tidally generated currents are strong. The general net current
pattern brings oceanic water through Kennedy Entrance and northward along the
east side of the inlet. Turbid and usually colder waters from the upper
inlet move generally southward along the west side of the inlet and through
Kamishak Bay, leaving the inlet through Shelikov Strait (BLM, 1976). It has
been suggested, however, that a considerable proportion of the oceanic
water entering Cook Inlet on an incoming tide is pumped back out on the
subsequent outgoing tide (BLM, 1976). During the winter and spring, ice
conditions are much more harsh on the west side of the inlet. Thus, the
oceanographic conditions on each side of the inlet are significantly dif-
ferent, resulting in notable differences in the nature of intertidal and
shallow water biological communities.
A. EAST SIDE OF INLET - ROCK
All surveys on the east side of Cook Inlet were conducted in Kachemak
Bay. The sites included Jakolof Bay, a station west of Barabara Point,
Archimanditof Shoals, Bluff Point and Troublesome Creek. These areas com-
prise a broad variety of habitat types. Other sites that have been examined
since 1974 included Seldovia Point, Cohen Island, and Gull Island.
433
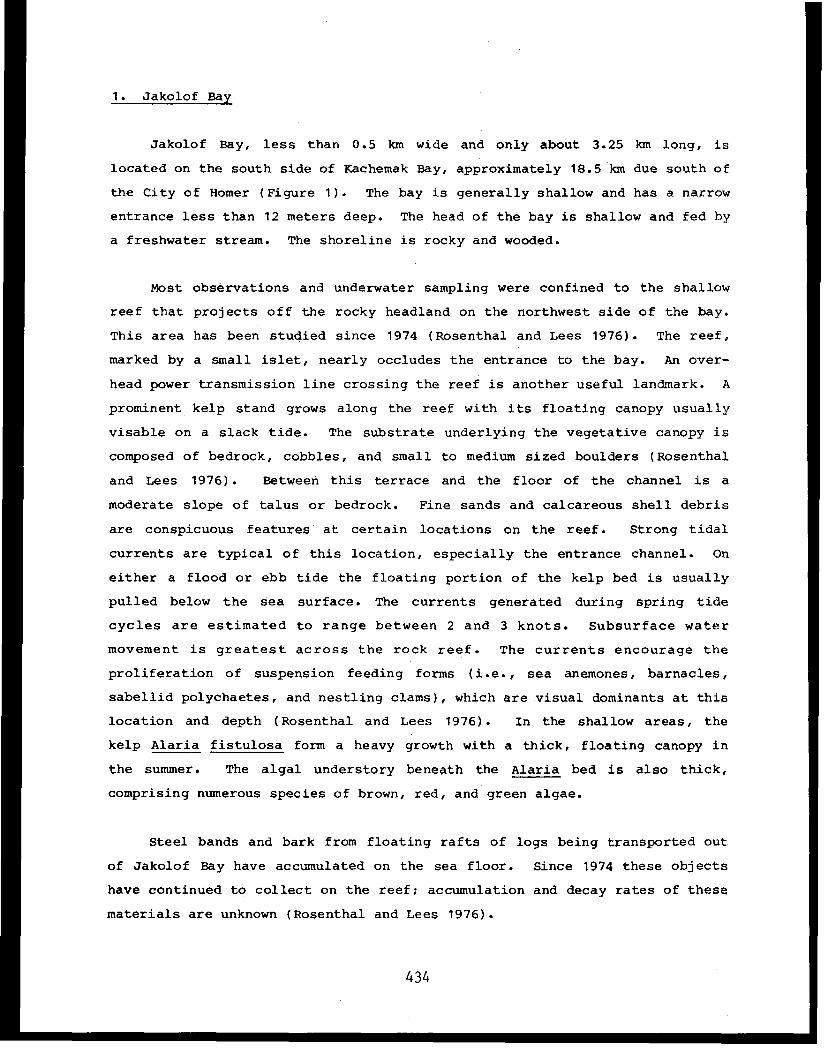
1. Jakolof Bay
Jakolof Bay, less than 0.5 km wide and only about 3.25 km long, is
located on the south side of Kachemak Bay, approximately 18.5 km due south of
the City of Homer (Figure 1). The bay is generally shallow and has a narrow
entrance less than 12 meters deep. The head of the bay is shallow and fed by
a freshwater stream. The shoreline is rocky and wooded.
Most observations and underwater sampling were confined to the shallow
reef that projects off the rocky headland on the northwest side of the bay.
This area has been studied since 1974 (Rosenthal and Lees 1976). The reef,
marked by a small islet, nearly occludes the entrance to the bay. An over-
head power transmission line crossing the reef is another useful landmark. A
prominent kelp stand grows along the reef with its floating canopy usually
visable on a slack tide. The substrate underlying the vegetative canopy is
composed of bedrock, cobbles, and small to medium sized boulders (Rosenthal
and Lees 1976). Between this terrace and the floor of the channel is a
moderate slope of talus or bedrock. Fine sands and calcareous shell debris
are conspicuous features at certain locations on the reef. Strong tidal
currents are typical of this location, especially the entrance channel. On
either a flood or ebb tide the floating portion of the kelp bed is usually
pulled below the sea surface. The currents generated during spring tide
cycles are estimated to range between 2 and 3 knots. Subsurface water
movement is greatest across the rock reef. The currents encourage the
proliferation of suspension feeding forms (i.e., sea anemones, barnacles,
sabellid polychaetes, and nestling clams), which are visual dominants at this
location and depth (Rosenthal and Lees 1976). In the shallow areas, the
kelp Alaria fistulosa form a heavy growth with a thick, floating canopy in
the summer. The algal understory beneath the Alaria bed is also thick,
comprising numerous species of brown, red, and green algae.
Steel bands and bark from floating rafts of logs being transported out
of Jakolof Bay have accumulated on the sea floor. Since 1974 these objects
have continued to collect on the reef; accumulation and decay rates of these
materials are unknown (Rosenthal and Lees 1976).
434

2. Barabara Point
The kelp bed at Barabara Point is continuous with that at Seldovia Point
(Figure 1), but is strongly dominated by bull kelp. However, currents are
considerably dampened by the effects of the large kelp bed and thus the
substrate and understory algae are rather more silty than at Seldovia Point.
The depth of the area surveyed was about 10 m. The boulder-bedrock substrate
has numerous crevices and ledges and offers considerable bottom relief.
Many of the outcrops appear to be low-grade coal well overgrown with encrus-
ting coralline algae and epifaunal invertebrates.
3. The Northern Shelf
On the north side of Kachemak Bay, west of Homer Spit, is a broad,
rocky shelf (Figure 1). Called herein the northern shelf, this relatively
flat bench extends from Archimandritof Shoals, off the west side of the Spit,
northwest to its widest point off Troublesome Creek and Anchor Point. The
substrate of the shelf is flat and characterized by rock, which predominated
at every site. Cobble and boulder fields were the principal type of struc-
ture observed, and patches of shell debris were also common. In several
areas, the boulders and associated outcrops were composed of coal. During
winter storms, large quantities of coal are broken up and moved across the
shelf to the beach. Evidence of silt deposition varied locally. Generally
algal cover was substantially less on the shelf than in the study areas on
the south side of the bay. The physical and chemical charactertistics of the
seawater bathing the shelf become more oceanic toward its western end.
B. WEST SIDE OF INLET - ROCK
All of the systematic work on rock habitat on the west side of Cook
Inlet was conducted in Kamishak Bay at three key locations, namely, Scott
Island, Knoll Head Lagoon, and White Gull Island. A number of other sites
have been examined on the west side of cook Inlet since 1975 (Lees and
Houghton 1977), including several sites each at Chinitna, Iniskin, and Bruin
435
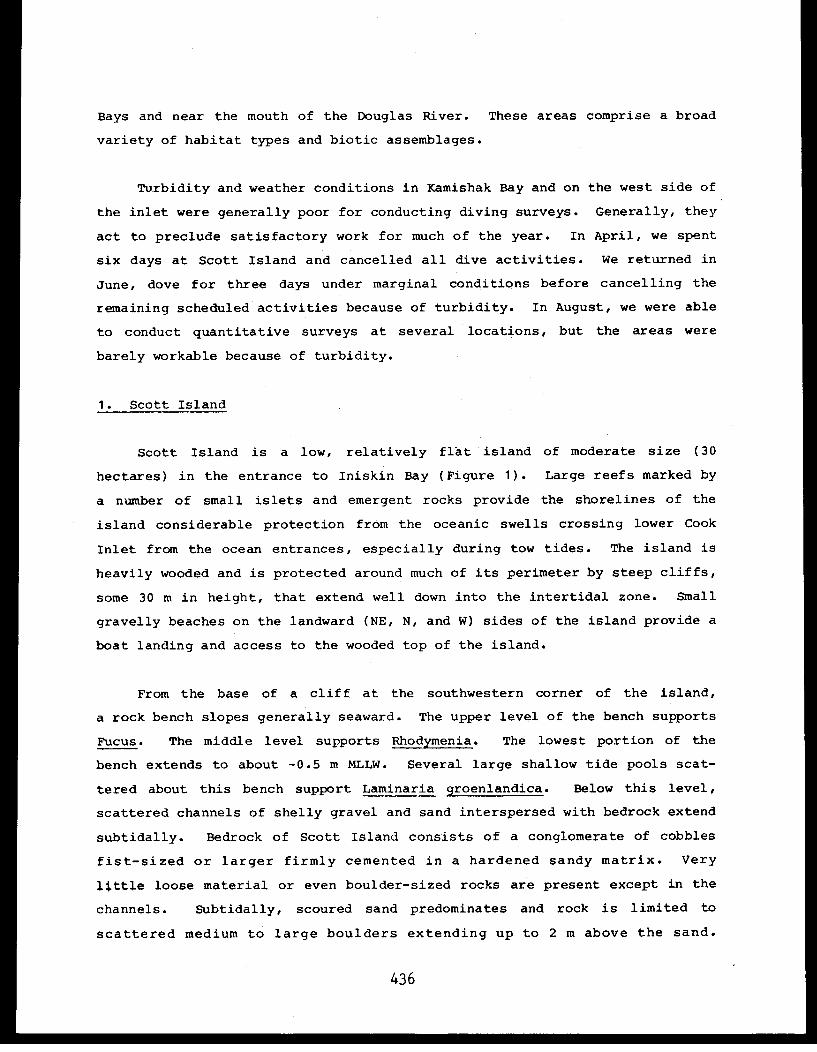
Bays and near the mouth of the Douglas River. These areas comprise a broad
variety of habitat types and biotic assemblages.
Turbidity and weather conditions in Kamishak Bay and on the west side of
the inlet were generally poor for conducting diving surveys. Generally, they
act to preclude satisfactory work for much of the year. In April, we spent
six days at Scott Island and cancelled all dive activities. We returned in
June, dove for three days under marginal conditions before cancelling the
remaining scheduled activities because of turbidity. In August, we were able
to conduct quantitative surveys at several locations, but the areas were
barely workable because of turbidity.
1. Scott Island
Scott Island is a low, relatively flat island of moderate size (30
hectares) in the entrance to Iniskin Bay (Figure 1). Large reefs marked by
a number of small islets and emergent rocks provide the shorelines of the
island considerable protection from the oceanic swells crossing lower Cook
Inlet from the ocean entrances, especially during tow tides. The island is
heavily wooded and is protected around much of its perimeter by steep cliffs,
some 30 m in height, that extend well down into the intertidal zone. Small
gravelly beaches on the landward (NE, N, and W) sides of the island provide a
boat landing and access to the wooded top of the island.
From the base of a cliff at the southwestern corner of the island,
a rock bench slopes generally seaward. The upper level of the bench supports
Fucus. The middle level supports Rhodymenia. The lowest portion of the
bench extends to about -0.5 m MLLW. Several large shallow tide pools scat-
tered about this bench support Laminaria groenlandica. Below this level,
scattered channels of shelly gravel and sand interspersed with bedrock extend
subtidally. Bedrock of Scott Island consists of a conglomerate of cobbles
fist-sized or larger firmly cemented in a hardened sandy matrix. Very
little loose material or even boulder-sized rocks are present except in the
channels. Subtidally, scoured sand predominates and rock is limited to
scattered medium to large boulders extending up to 2 m above the sand.
436
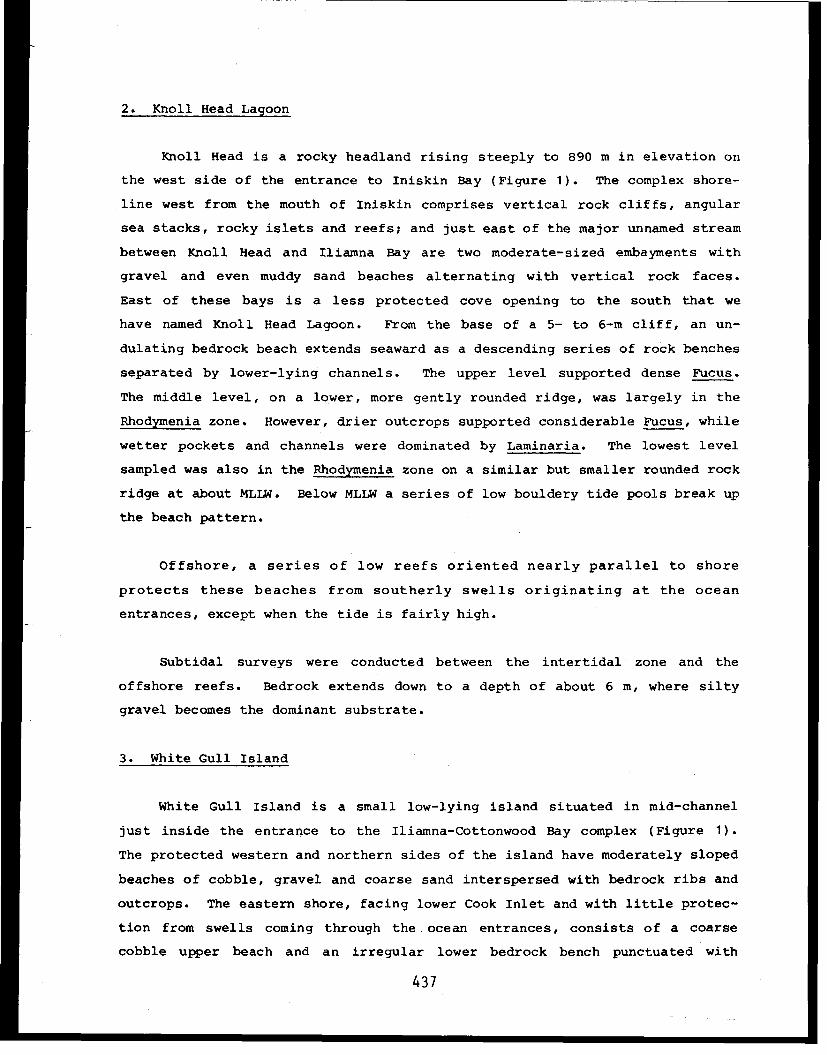
2. Knoll Head Lagoon
Knoll Head is a rocky headland rising steeply to 890 m in elevation on
the west side of the entrance to Iniskin Bay (Figure 1). The complex shore-
line west from the mouth of Iniskin comprises vertical rock cliffs, angular
sea stacks, rocky islets and reefs; and just east of the major unnamed stream
between Knoll Head and Iliamna Bay are two moderate-sized embayments with
gravel and even muddy sand beaches alternating with vertical rock faces.
East of these bays is a less protected cove opening to the south that we
have named Knoll Head Lagoon. From the base of a 5- to 6-m cliff, an un-
dulating bedrock beach extends seaward as a descending series of rock benches
separated by lower-lying channels. The upper level supported dense Fucus.
The middle level, on a lower, more gently rounded ridge, was largely in the
Rhodymenia zone. However, drier outcrops supported considerable Fucus, while
wetter pockets and channels were dominated by Laminaria. The lowest level
sampled was also in the Rhodymenia zone on a similar but smaller rounded rock
ridge at about MLLW. Below MLLW a series of low bouldery tide pools break up
the beach pattern.
Offshore, a series of low reefs oriented nearly parallel to shore
protects these beaches from southerly swells originating at the ocean
entrances, except when the tide is fairly high.
Subtidal surveys were conducted between the intertidal zone and the
offshore reefs. Bedrock extends down to a depth of about 6 m, where silty
gravel becomes the dominant substrate.
3. White Gull Island
White Gull Island is a small low-lying island situated in mid-channel
just inside the entrance to the Iliamna-Cottonwood Bay complex (Figure 1).
The protected western and northern sides of the island have moderately sloped
beaches of cobble, gravel and coarse sand interspersed with bedrock ribs and
outcrops. The eastern shore, facing lower Cook Inlet and with little protec-
tion from swells coming through the ocean entrances, consists of a coarse
cobble upper beach and an irregular lower bedrock bench punctuated with
437
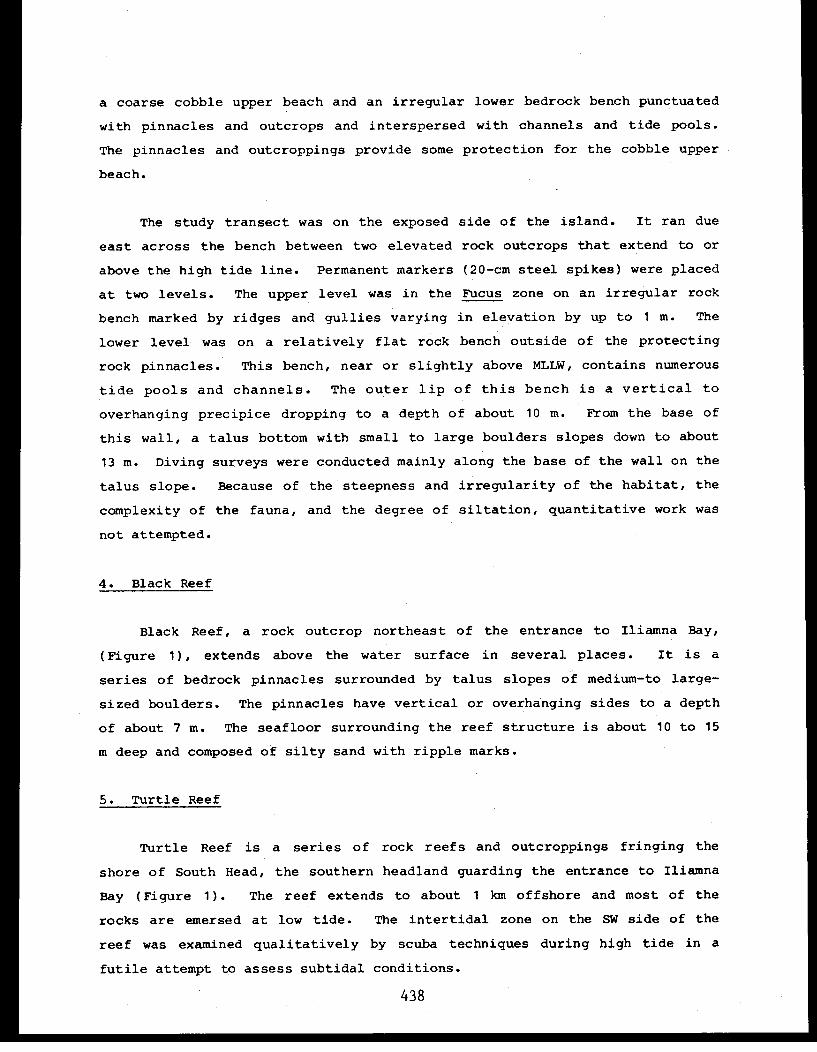
a coarse cobble upper beach and an irregular lower bedrock bench punctuated
with pinnacles and outcrops and interspersed with channels and tide pools.
The pinnacles and outcroppings provide some protection for the cobble upper
beach.
The study transect was on the exposed side of the island. It ran due
east across the bench between two elevated rock outcrops that extend to or
above the high tide line. Permanent markers (20-cm steel spikes) were placed
at two levels. The upper level was in the Fucus zone on an irregular rock
bench marked by ridges and gullies varying in elevation by up to 1 m. The
lower level was on a relatively flat rock bench outside of the protecting
rock pinnacles. This bench, near or slightly above MLLW, contains numerous
tide pools and channels. The outer lip of this bench is a vertical to
overhanging precipice dropping to a depth of about 10 m. From the base of
this wall, a talus bottom with small to large boulders slopes down to about
13 m. Diving surveys were conducted mainly along the base of the wall on the
talus slope. Because of the steepness and irregularity of the habitat, the
complexity of the fauna, and the degree of siltation, quantitative work was
not attempted.
4. Black Reef
Black Reef, a rock outcrop northeast of the entrance to Iliamna Bay,
(Figure 1), extends above the water surface in several places. It is a
series of bedrock pinnacles surrounded by talus slopes of medium-to large-
sized boulders. The pinnacles have vertical or overhanging sides to a depth
of about 7 m. The seafloor surrounding the reef structure is about 10 to 15
m deep and composed of silty sand with ripple marks.
5. Turtle Reef
Turtle Reef is a series of rock reefs and outcroppings fringing the
shore of South Head, the southern headland guarding the entrance to Iliamna
Bay (Figure 1). The reef extends to about 1 km offshore and most of the
rocks are emersed at low tide. The intertidal zone on the SW side of the
reef was examined qualitatively by scuba techniques during high tide in a
futile attempt to assess subtidal conditions.
438
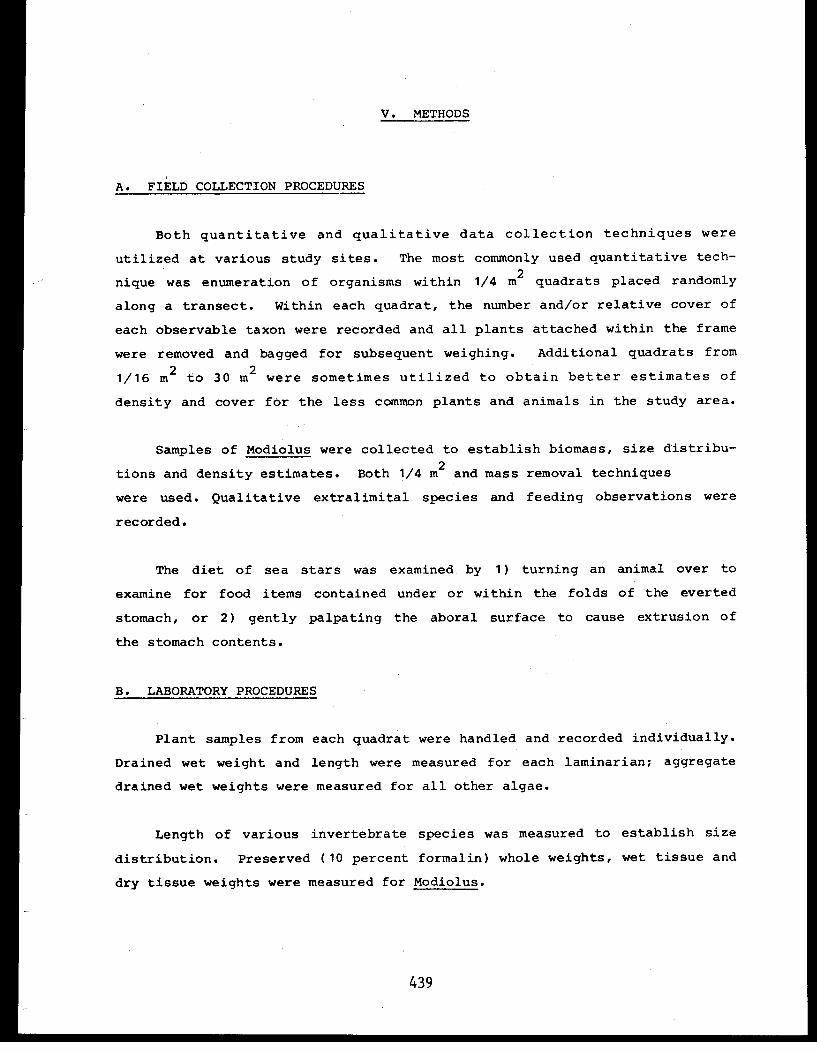
V. METHODS
A. FIELD COLLECTION PROCEDURES
Both quantitative and qualitative data collection techniques were
utilized at various study sites. The most commonly used quantitative tech-
nique was enumeration of organisms within 1/4 m² quadrats placed randomly
along a transect. Within each quadrat, the number and/or relative cover of
each observable taxon were recorded and all plants attached within the frame
were removed and bagged for subsequent weighing. Additional quadrats from
1/16 m² to 30 m² were sometimes utilized to obtain better estimates of
density and cover for the less common plants and animals in the study area.
Samples of Modiolus were collected to establish biomass, size distribu-
tions and density estimates. Both 1/4 m² and mass removal techniques
were used. Qualitative extralimital species and feeding observations were
recorded.
The diet of sea stars was examined by 1) turning an animal over to
examine for food items contained under or within the folds of the everted
stomach, or 2) gently palpating the aboral surface to cause extrusion of
the stomach contents.
B. LABORATORY PROCEDURES
Plant samples from each quadrat were handled and recorded individually.
Drained wet weight and length were measured for each laminarian; aggregate
drained wet weights were measured for all other algae.
Length of various invertebrate species was measured to establish size
distribution. Preserved (10 percent formalin) whole weights, wet tissue and
dry tissue weights were measured for Modiolus.
439
C. DATA ANALYSIS
Mean and standard deviation were used to summarize such parameters as
abundance, relative cover and biomass. Relationships between parameters
such as wet tissue weight vs. individual size were derived using linear
regression techniques, usually with a log[subscript]10 transformation to both variables
(log Y = b log X + a).
Size frequency analysis of population distribution was usually accom-
plished graphically while similarities between populations were tested using
a nonparametric Kolmogorov-Smirnov two-way test of significance.
Feeding observations from field notes and lab dissections were entered
into a computer data base and then extracted via various cross indices to
establish predator-prey relationships.
In data tables in this report, absence of a species is indicated by 0
and observations for a species is indicated by dash (-).
440
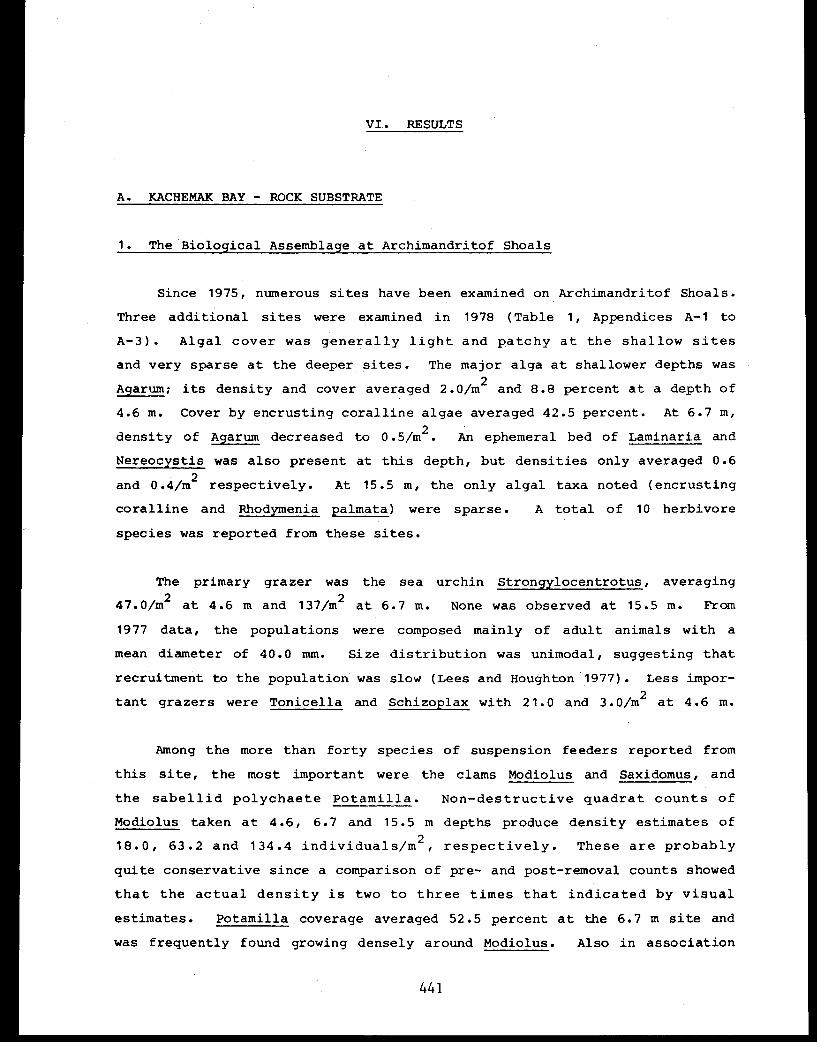
VI. RESULTS
A. KACHEMAK BAY - ROCK SUBSTRATE
1. The Biological Assemblage at Archimandritof Shoals
Since 1975, numerous sites have been examined on Archimandritof Shoals.
Three additional sites were examined in 1978 (Table 1, Appendices A-1 to
A-3). Algal cover was generally light and patchy at the shallow sites
and very sparse at the deeper sites. The major alga at shallower depths was
Agarum; its density and cover averaged 2.0/m² and 8.8 percent at a depth of
4.6 m. Cover by encrusting coralline algae averaged 42.5 percent. At 6.7 m,
density of Agarum decreased to 0.5/m². An ephemeral bed of Laminaria and
Nereocystis was also present at this depth, but densities only averaged 0.6
and 0.4/m² respectively. At 15.5 m, the only algal taxa noted (encrusting
coralline and Rhodymenia palmata) were sparse. A total of 10 herbivore
species was reported from these sites.
The primary grazer was the sea urchin Strongylocentrotus, averaging
47.0/m² at 4.6 m and 137/m² at 6.7 m. None was observed at 15.5 m. From
1977 data, the populations were composed mainly of adult animals with a
mean diameter of 40.0 mm. Size distribution was unimodal, suggesting that
recruitment to the population was slow (Lees and Houghton 1977). Less impor-
tant grazers were Tonicella and Schizoplax with 21.0 and 3.0/m² at 4.6 m.
Among the more than forty species of suspension feeders reported from
this site, the most important were the clams Modiolus and Saxidomus, and
the sabellid polychaete Potamilla. Non-destructive quadrat counts of
Modiolus taken at 4.6, 6.7 and 15.5 m depths produce density estimates of
18.0, 63.2 and 134.4 individuals/m², respectively. These are probably
quite conservative since a comparison of pre- and post-removal counts showed
that the actual density is two to three times that indicated by visual
estimates. Potamilla coverage averaged 52.5 percent at the 6.7 m site and
was frequently found growing densely around Modiolus. Also in association
441
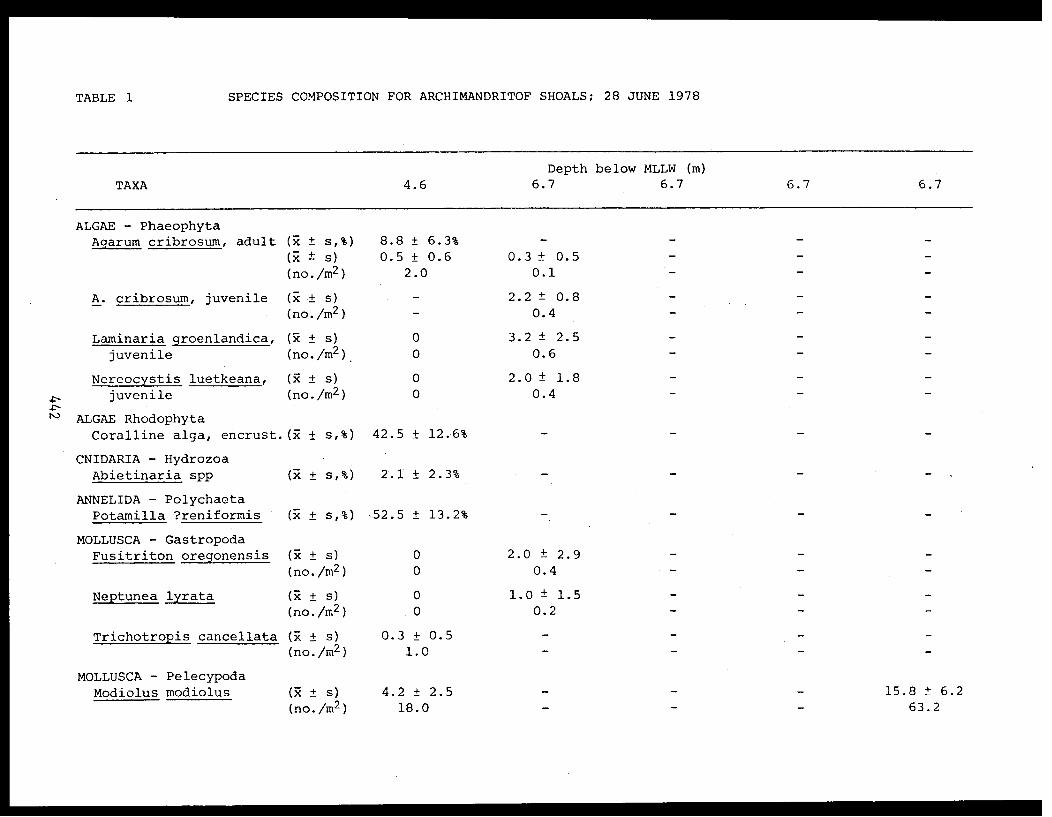
TABLE 1 SPECIES COMPOSITION FOR ARCHIMANDRITOF SHOALS; 28 JUNE 1978
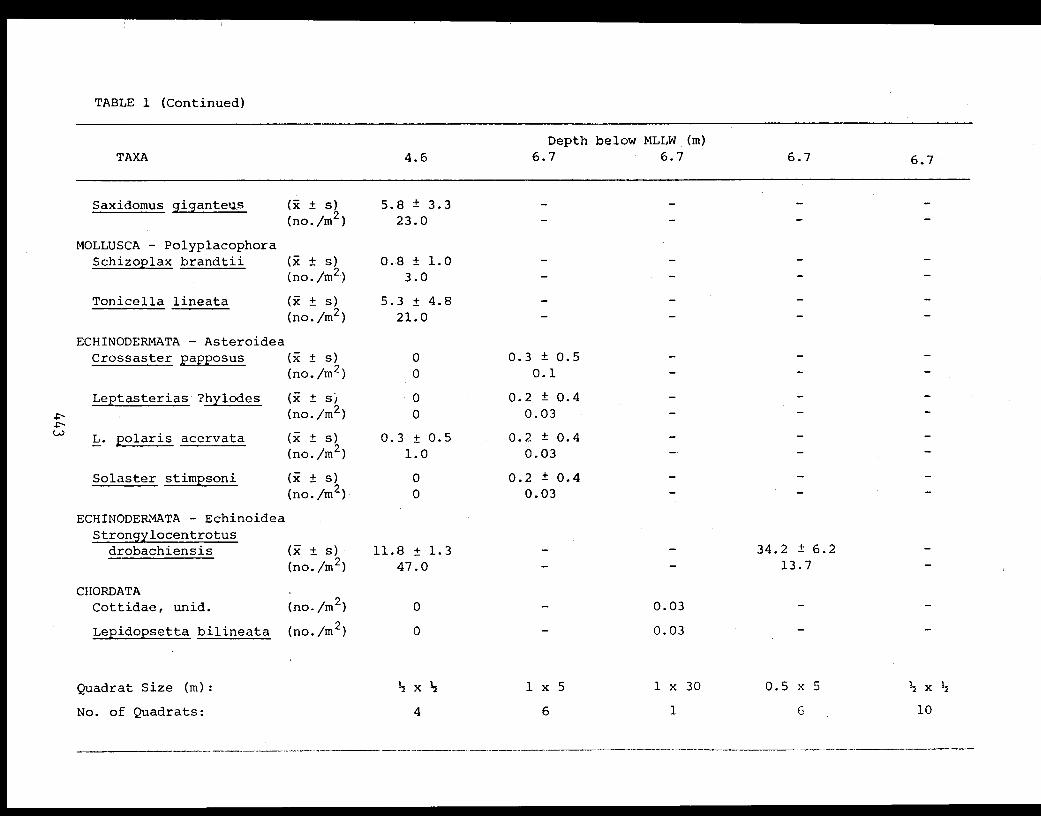
TABLE 1 (Continued)
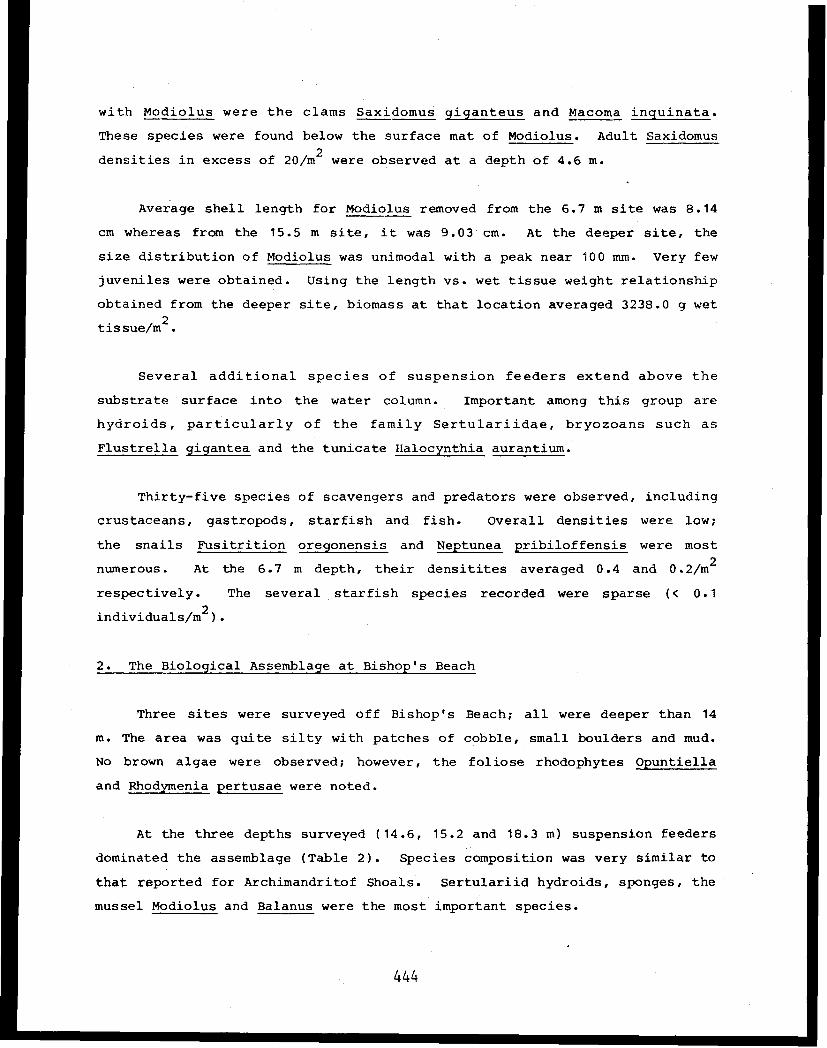
with Modiolus were the clams Saxidomus giganteus and Macoma inquinata.
These species were found below the surface mat of Modiolus. Adult Saxidomus
densities in excess of 20/m² were observed at a depth of 4.6 m.
Average shell length for Modiolus removed from the 6.7 m site was 8.14
cm whereas from the 15.5 m site, it was 9.03 cm. At the deeper site, the
size distribution of Modiolus was unimodal with a peak near 100 mm. Very few
juveniles were obtained. Using the length vs. wet tissue weight relationship
obtained from the deeper site, biomass at that location averaged 3238.0 g wet
tissue/m[superscript]2 .
Several additional species of suspension feeders extend above the
substrate surface into the water column. Important among this group are
hydroids, particularly of the family Sertulariidae, bryozoans such as
Flustrella gigantea and the tunicate Halocynthia aurantium.
Thirty-five species of scavengers and predators were observed, including
crustaceans, gastropods, starfish and fish. Overall densities were low;
the snails Fusitrition oregonensis and Neptunea pribiloffensis were most
numerous. At the 6.7 m depth, their densitites averaged 0.4 and 0.2/m²
respectively. The several starfish species recorded were sparse (< 0.1
individuals/m²).
2. The Biological Assemblage at Bishop's Beach
Three sites were surveyed off Bishop's Beach; all were deeper than 14
m. The area was quite silty with patches of cobble, small boulders and mud.
No brown algae were observed; however, the foliose rhodophytes Opuntiella
and Rhodymenia pertusae were noted.
At the three depths surveyed (14.6, 15.2 and 18.3 m) suspension feeders
dominated the assemblage (Table 2). Species composition was very similar to
that reported for Archimandritof Shoals. Sertulariid hydroids, sponges, the
mussel Modiolus and Balanus were the most important species.
444
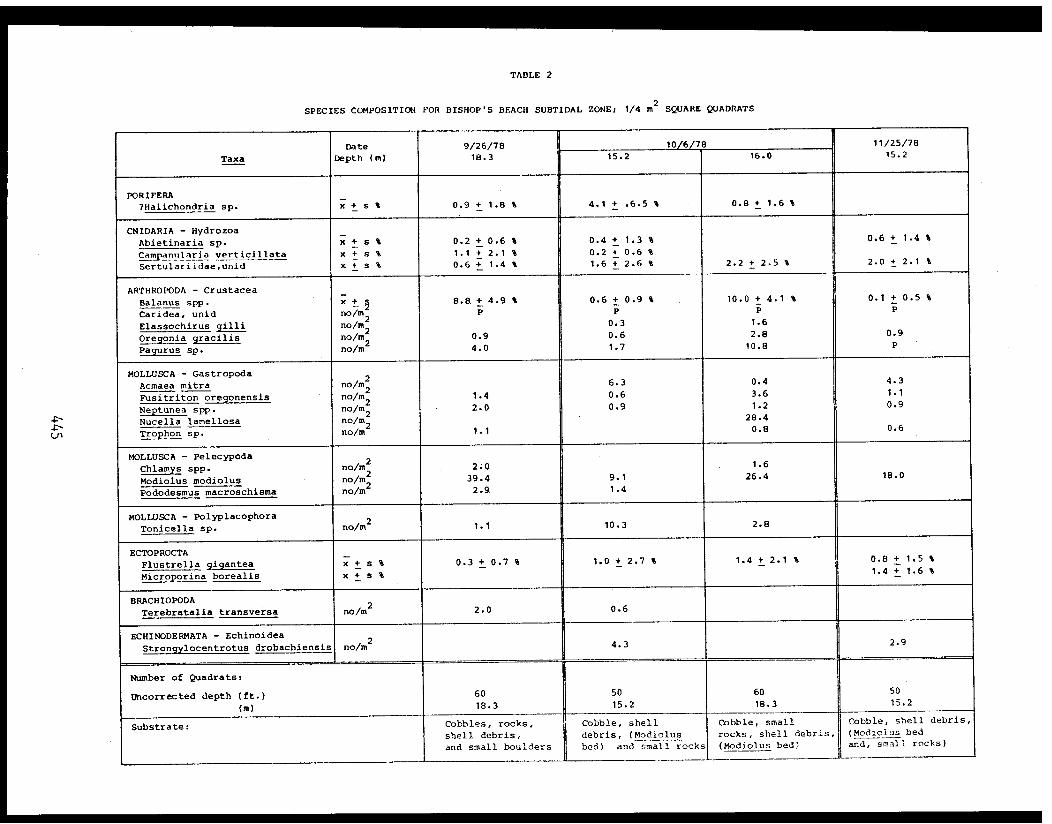
TABLE 2
SPECIES COMPOSITION FOR BISHOP'S BEACH SUBTIDAL ZONE; 1/4 m² SQUARE QUADRATS
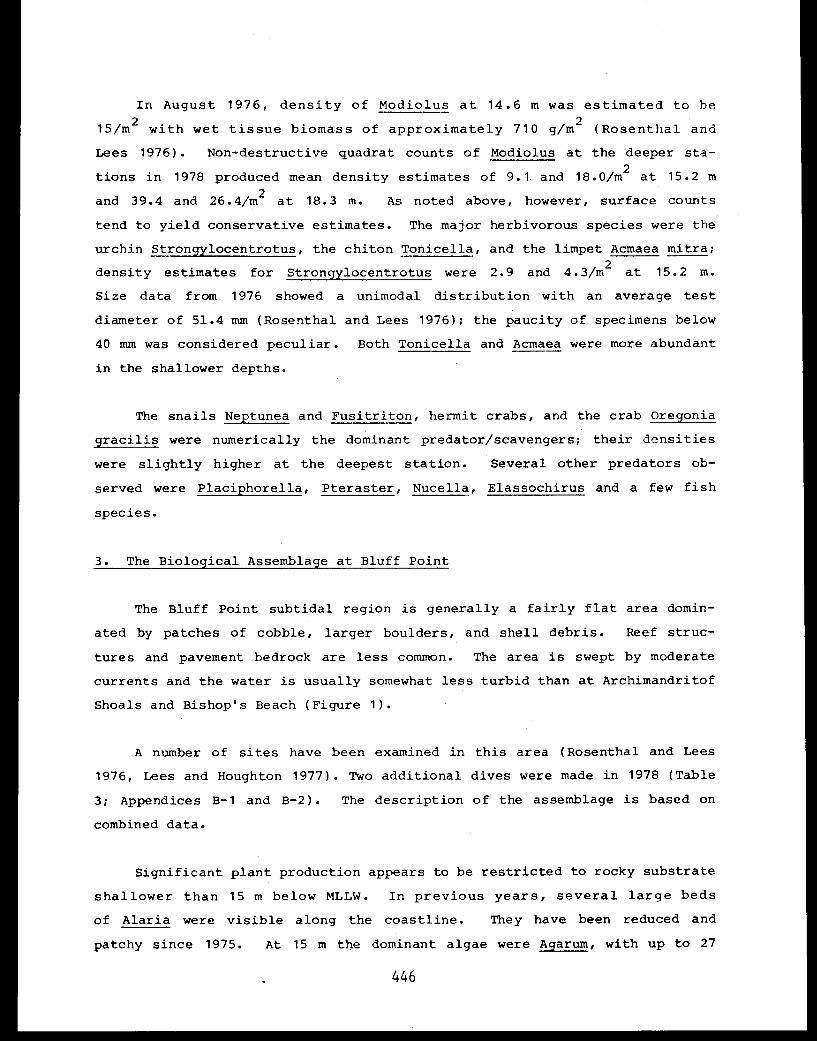
In August 1976, density of Modiolus at 14.6 m was estimated to be
15/m² with wet tissue biomass of approximately 710 g/m² (Rosenthal and
Lees 1976). Non-destructive quadrat counts of Modiolus at the deeper sta-
tions in 1978 produced mean density estimates of 9.1 and 18.0/m² at 15.2 m
and 39.4 and 26.4/m² at 18.3 m. As noted above, however, surface counts
tend to yield conservative estimates. The major herbivorous species were the
urchin Strongylocentrotus, the chiton Tonicella, and the limpet Acmaea mitra;
density estimates for Strongylocentrotus were 2.9 and 4.3/m² at 15.2 m.
Size data from 1976 showed a unimodal distribution with an average test
diameter of 51.4 mm (Rosenthal and Lees 1976); the paucity of specimens below
40 mm was considered peculiar. Both Tonicella and Acmaea were more abundant
in the shallower depths.
The snails Neptunea and Fusitriton, hermit crabs, and the crab Oregonia
gracilis were numerically the dominant predator/scavengers; their densities
were slightly higher at the deepest station. Several other predators ob-
served were Placiphorella, Pteraster, Nucella, Elassochirus and a few fish
species.
3. The Biological Assemblage at Bluff Point
The Bluff Point subtidal region is generally a fairly flat area domin-
ated by patches of cobble, larger boulders, and shell debris. Reef struc-
tures and pavement bedrock are less common. The area is swept by moderate
currents and the water is usually somewhat less turbid than at Archimandritof
Shoals and Bishop's Beach (Figure 1).
A number of sites have been examined in this area (Rosenthal and Lees
1976, Lees and Houghton 1977). Two additional dives were made in 1978 (Table
3; Appendices B-1 and B-2). The description of the assemblage is based on
combined data.
Significant plant production appears to be restricted to rocky substrate
shallower than 15 m below MLLW. In previous years, several large beds
of Alaria were visible along the coastline. They have been reduced and
patchy since 1975. At 15 m the dominant algae were Agarum, with up to 27
446
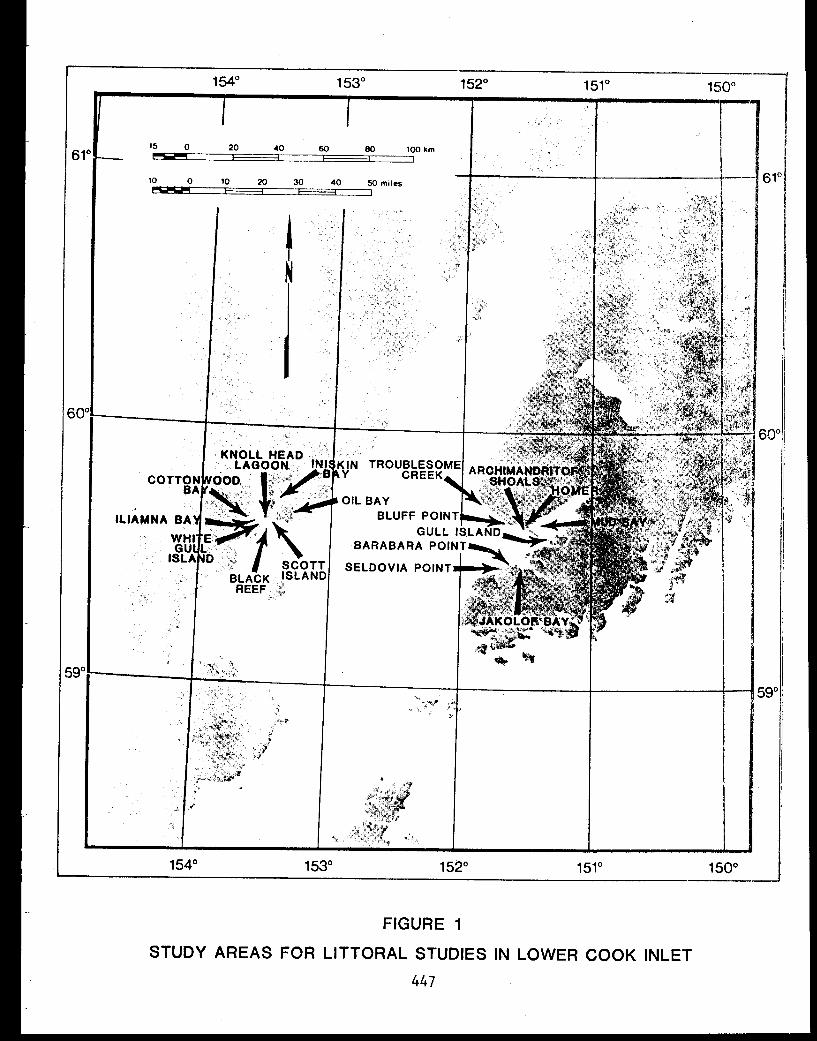
FIGURE 1
STUDY AREAS FOR LITTORAL STUDIES IN LOWER COOK INLET
447
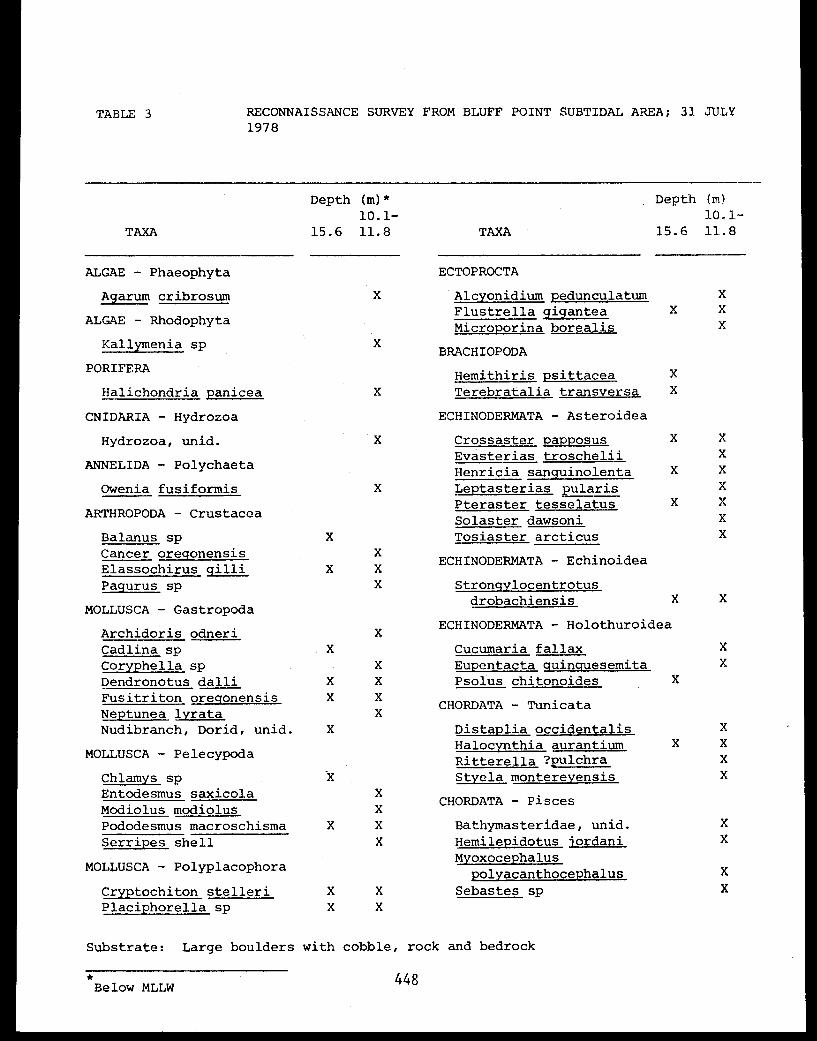
TABLE 3 RECONNAISSANCE SURVEY FROM BLUFF POINT SUBTIDAL AREA; 31 JULY1978
448
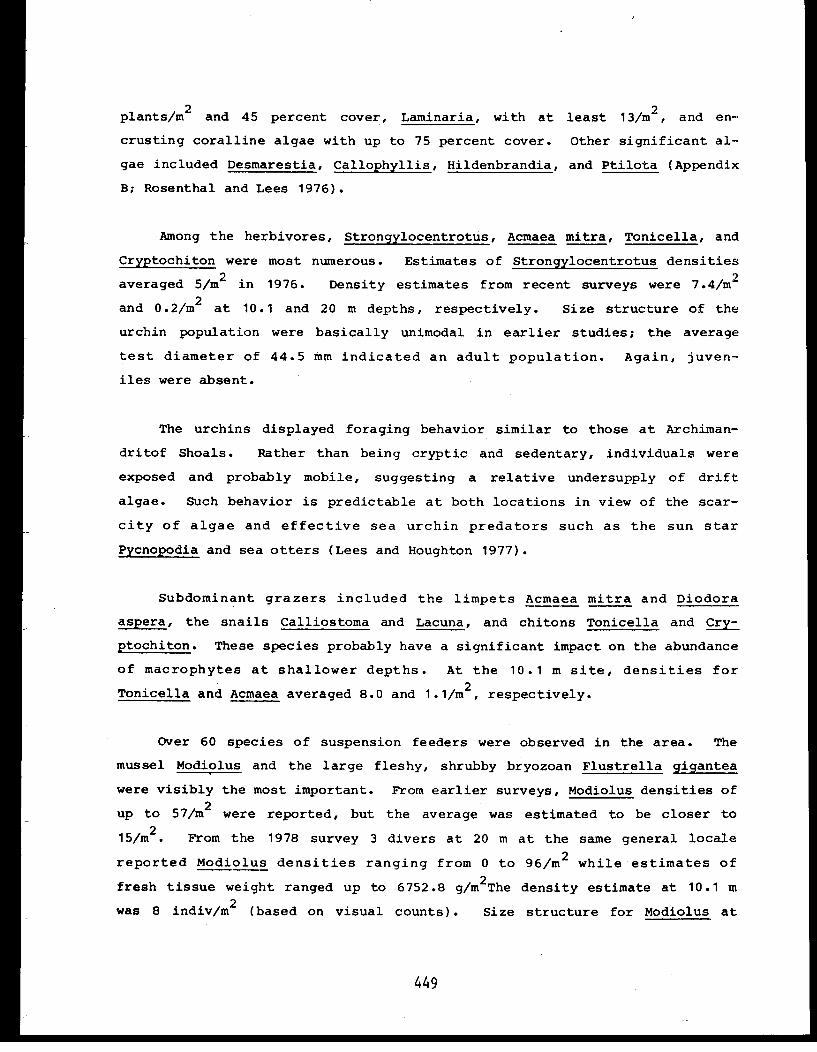
plants/m² and 45 percent cover, Laminaria, with at least 13/m², and en-
crusting coralline algae with up to 75 percent cover. Other significant al-
gae included Desmarestia, Callophyllis, Hildenbrandia, and Ptilota (Appendix
B; Rosenthal and Lees 1976).
Among the herbivores, Strongylocentrotus, Acmaea mitra, Tonicella, and
Cryptochiton were most numerous. Estimates of Strongylocentrotus densities
averaged 5/m² in 1976. Density estimates from recent surveys were 7.4/m²
and 0.2/m² at 10.1 and 20 m depths, respectively. Size structure of the
urchin population were basically unimodal in earlier studies; the average
test diameter of 44.5 mm indicated an adult population. Again, juven-
iles were absent.
The urchins displayed foraging behavior similar to those at Archiman-
dritof Shoals. Rather than being cryptic and sedentary, individuals were
exposed and probably mobile, suggesting a relative undersupply of drift
algae. Such behavior is predictable at both locations in view of the scar-
city of algae and effective sea urchin predators such as the sun star
Pycnopodia and sea otters (Lees and Houghton 1977).
Subdominant grazers included the limpets Acmaea mitra and Diodora
aspera, the snails Calliostoma and Lacuna, and chitons Tonicella and Cry-
ptochiton. These species probably have a significant impact on the abundance
of macrophytes at shallower depths. At the 10.1 m site, densities for
Tonicella and Acmaea averaged 8.0 and 1.1/m², respectively.
Over 60 species of suspension feeders were observed in the area. The
mussel Modiolus and the large fleshy, shrubby bryozoan Flustrella gigantea
were visibly the most important. From earlier surveys, Modiolus densities of
up to 57/m² were reported, but the average was estimated to be closer to
15/m². From the 1978 survey 3 divers at 20 m at the same general locale
reported Modiolus densities ranging from 0 to 96/m² while estimates of
fresh tissue weight ranged up to 6752.8 g/m² The density estimate at 10.1 m
was 8 indiv/m² (based on visual counts). Size structure for Modiolus at
449
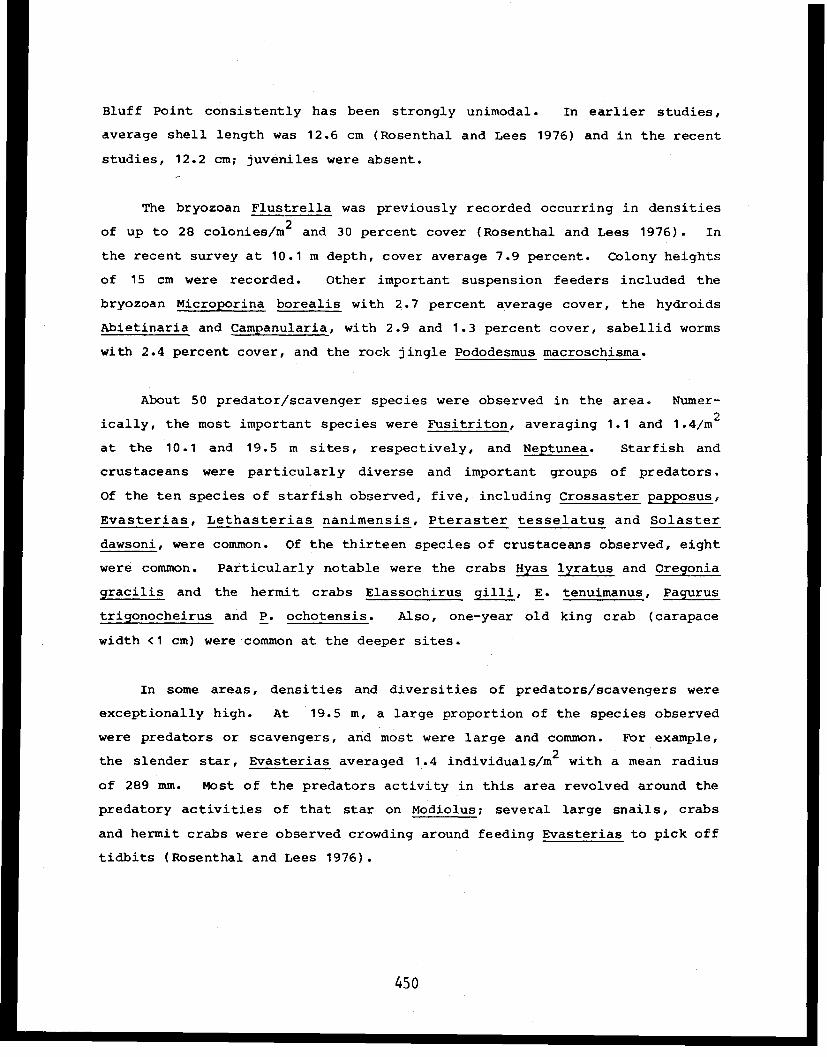
Bluff Point consistently has been strongly unimodal. In earlier studies,
average shell length was 12.6 cm (Rosenthal and Lees 1976) and in the recent
studies, 12.2 cm; juveniles were absent.
The bryozoan Flustrella was previously recorded occurring in densities
of up to 28 colonies/m² and 30 percent cover (Rosenthal and Lees 1976). In
the recent survey at 10.1 m depth, cover average 7.9 percent. Colony heights
of 15 cm were recorded. Other important suspension feeders included the
bryozoan Microporina borealis with 2.7 percent average cover, the hydroids
Abietinaria and Campanularia, with 2.9 and 1.3 percent cover, sabellid worms
with 2.4 percent cover, and the rock jingle Pododesmus macroschisma.
About 50 predator/scavenger species were observed in the area. Numer-
ically, the most important species were Fusitriton, averaging 1.1 and 1.4/m²
at the 10.1 and 19.5 m sites, respectively, and Neptunea. Starfish and
crustaceans were particularly diverse and important groups of predators.
Of the ten species of starfish observed, five, including Crossaster papposus,
Evasterias, Lethasterias nanimensis, Pteraster tesselatus and Solaster
dawsoni, were common. Of the thirteen species of crustaceans observed, eight
were common. Particularly notable were the crabs Hyas lyratus and Oregonia
gracilis and the hermit crabs Elassochirus gilli, E. tenuimanus, Pagurus
trigonocheirus and P. ochotensis. Also, one-year old king crab (carapace
width <1 cm) were common at the deeper sites.
In some areas, densities and diversities of predators/scavengers were
exceptionally high. At 19.5 m, a large proportion of the species observed
were predators or scavengers, and most were large and common. For example,
the slender star, Evasterias averaged 1.4 individuals/m² with a mean radius
of 289 mm. Most of the predators activity in this area revolved around the
predatory activities of that star on Modiolus; several large snails, crabs
and hermit crabs were observed crowding around feeding Evasterias to pick off
tidbits (Rosenthal and Lees 1976).
450

4. The Biological Assemblage at Anchor Point - Troublesome Creek
The Troublesome Creek area is very similar in physical relief to the
previously described Bluff Point region. Large boulders, cobble and shell
debris dominate the region, presenting a complex variety of niches. The water
is sometimes less turbid than that found at Bluff Point due to dilution of
turbid bay water with clean oceanic water(Figure 1).
This region had high species diversity. The dominant species at each
station varied widely (Appendices C-1 through C-8). Macrophyte abundance
and cover was low (Table 4), suggesting primary productivity was not high.
In 1976, only four species of algae were reported; Agarum was the only
important laminarian. In 1978, Agarum averaged only 0.4 individuals/m².
Also present were Laminaria, Desmarestia aculeata and D. ligulata at densi-
ties of 0.2, 0.2 and 0.1 plants/m²respectively. Encrusting coralline
algae provided 58.3 percent relative cover. The area supports a broad suite
of consumers, implying high secondary productivity. Most of the consumers
were long-lived species with populations of mature individuals. We postulate
that plant production was reduced due to the intense competition for avail-
able substrate between plants and encrusting animals.
Suspension feeders dominated the assemblage. The most abundant species
was the sea cucumber, Cucumaria miniata, averaging 16.7 individuals/m².
Relative cover of the bottom by its tentacles averaged 34 percent. Various
hydroid and bryozoan species were also common, including several hydroids
of the family Sertulariidae, and the bryozoan Flustrella gigantea; the lat-
ter averaged 6 percent relative cover. The tunicates Distaplia sp. and
Ritterella pulchra and the sponge Halichondria panicea also covered signifi-
cant portions of bottom. Other important suspension feeders were the butter-
clam Saxidomus gigantea and the large barnacle Balanus nubilus at a depth of
8 m.
Modiolus was found in 1976 at 14.6 m and 20 m depths. At 14.6 m, the
shell-length distribution was bimodal with a mean of 97 mm. Based on an
estimated average density of 10 individuals/m² and the length-weight
451
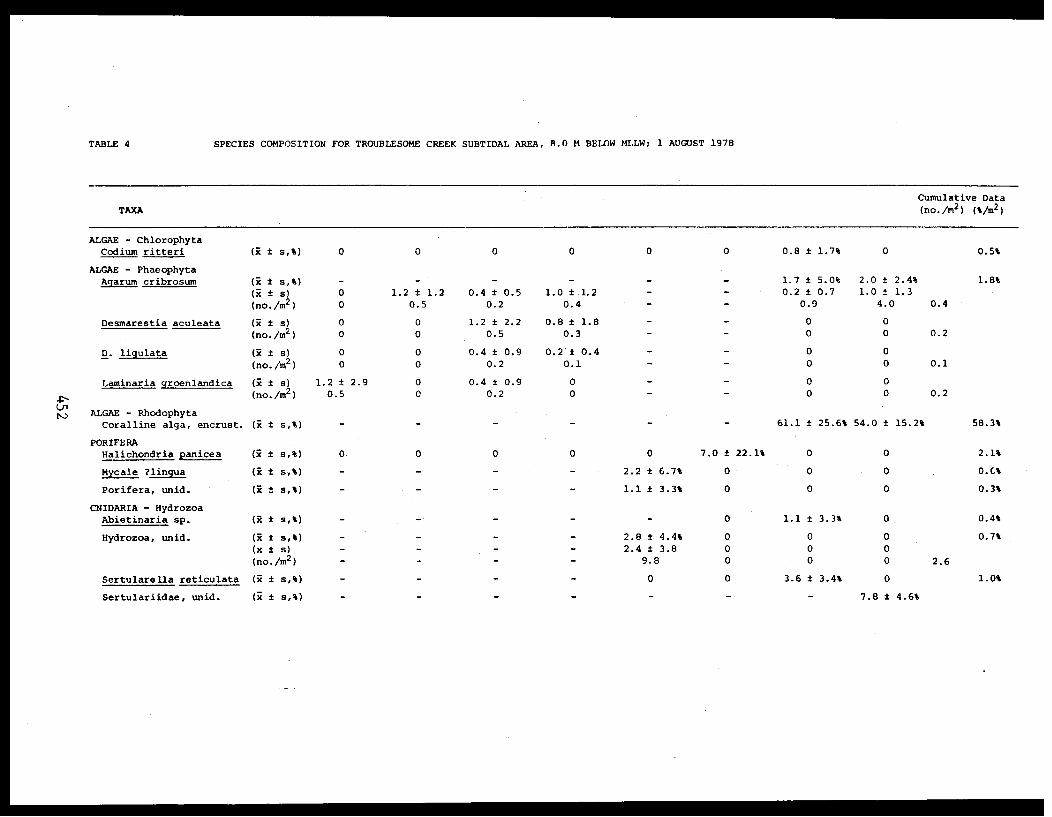
TABLE 4 SPECIES COMPOSITION FOR TROUBLESOME CREEK SUBTIDAL AREA, 8.O M BELOW MLLW; 1 AUGUST 1978
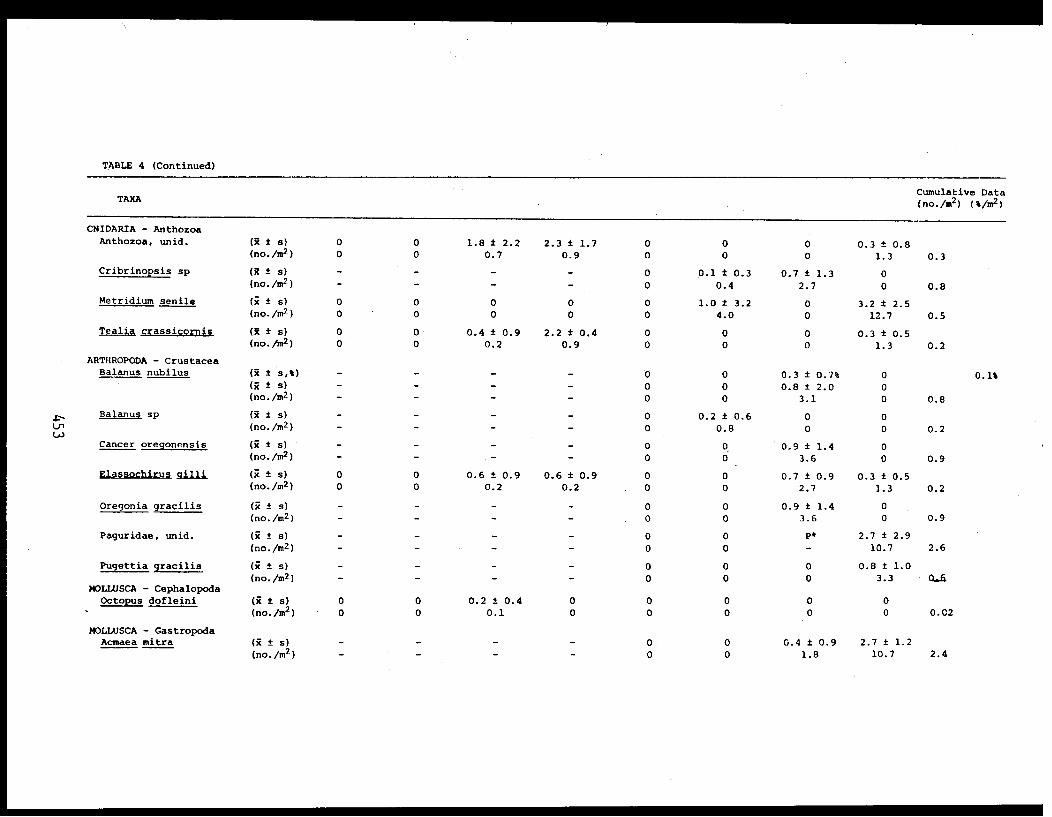
TABLE 4 (Continued)
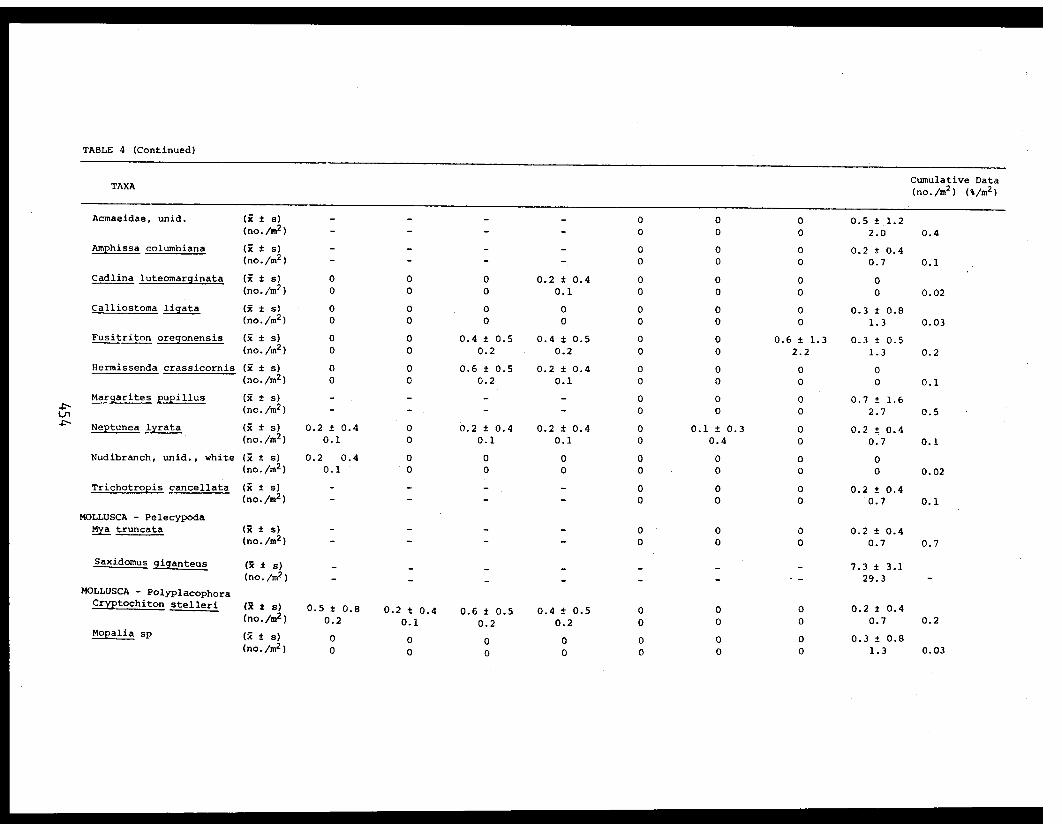
TABLE 4 (Continued)

TABLE 4 (Continued)

TABLE 4 (Continued)
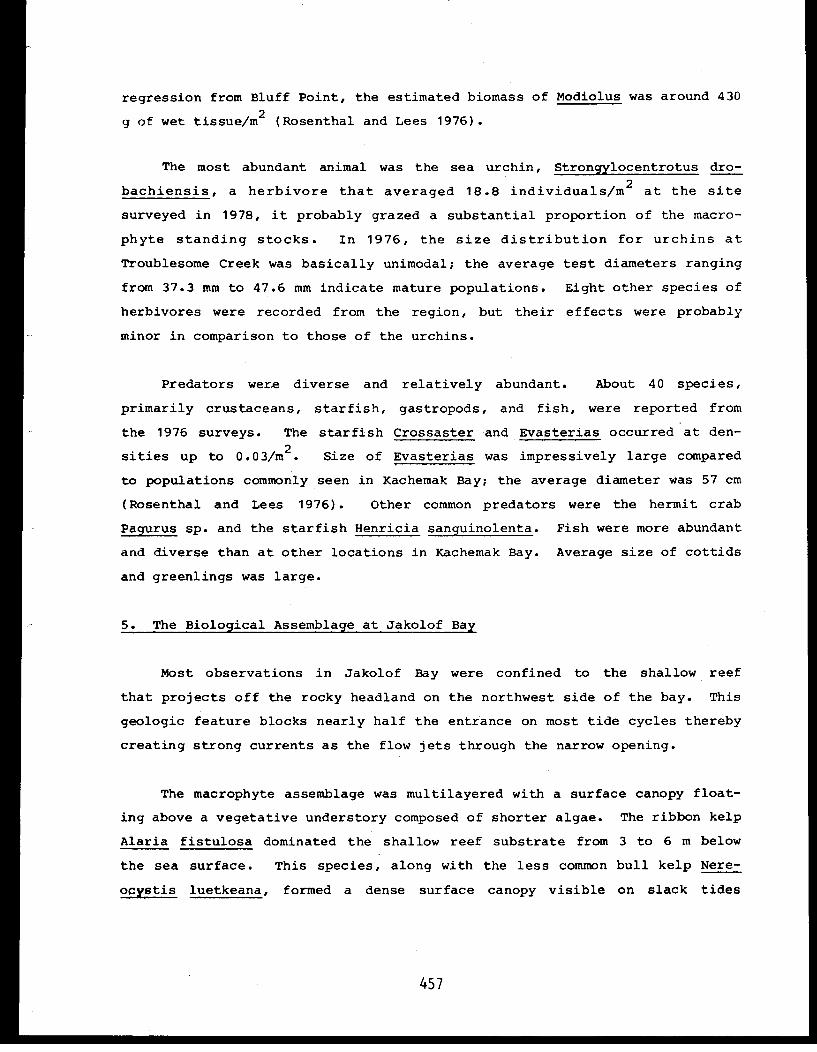
regression from Bluff Point, the estimated biomass of Modiolus was around 430
g of wet tissue/m² (Rosenthal and Lees 1976).
The most abundant animal was the sea urchin, Strongylocentrotus dro-
bachiensis, a herbivore that averaged 18.8 individuals/m² at the site
surveyed in 1978, it probably grazed a substantial proportion of the macro-
phyte standing stocks. In 1976, the size distribution for urchins at
Troublesome Creek was basically unimodal; the average test diameters ranging
from 37.3 mm to 47.6 mm indicate mature populations. Eight other species of
herbivores were recorded from the region, but their effects were probably
minor in comparison to those of the urchins.
Predators were diverse and relatively abundant. About 40 species,
primarily crustaceans, starfish, gastropods, and fish, were reported from
the 1976 surveys. The starfish Crossaster and Evasterias occurred at den-
sities up to 0.03/m². Size of Evasterias was impressively large compared
to populations commonly seen in Kachemak Bay; the average diameter was 57 cm
(Rosenthal and Lees 1976). Other common predators were the hermit crab
Pagurus sp. and the starfish Henricia sanguinolenta. Fish were more abundant
and diverse than at other locations in Kachemak Bay. Average size of cottids
and greenlings was large.
5. The Biological Assemblage at Jakolof Bay
Most observations in Jakolof Bay were confined to the shallow reef
that projects off the rocky headland on the northwest side of the bay. This
geologic feature blocks nearly half the entrance on most tide cycles thereby
creating strong currents as the flow jets through the narrow opening.
The macrophyte assemblage was multilayered with a surface canopy float-
ing above a vegetative understory composed of shorter algae. The ribbon kelp
Alaria fistulosa dominated the shallow reef substrate from 3 to 6 m below
the sea surface. This species, along with the less common bull kelp Nere-
ocystis luetkeana, formed a dense surface canopy visible on slack tides
457
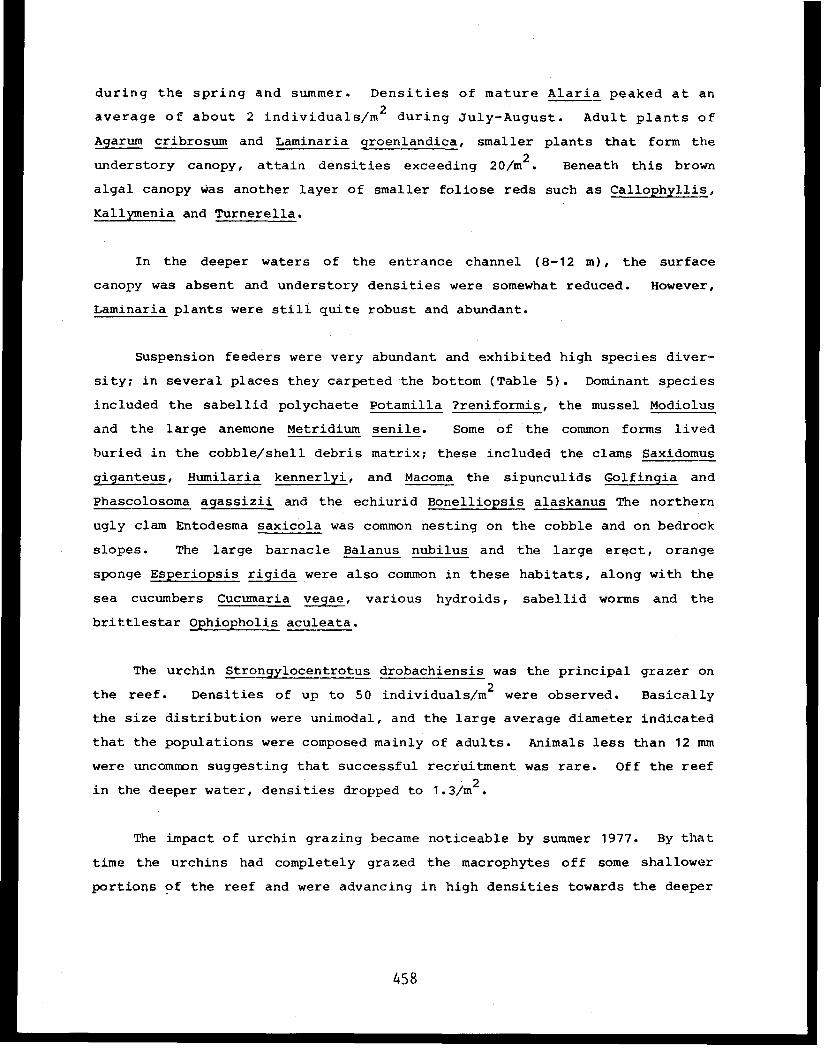
during the spring and summer. Densities of mature Alaria peaked at an
average of about 2 individuals/m² during July-August. Adult plants of
Agarum cribrosum and Laminaria groenlandica, smaller plants that form the
understory canopy, attain densities exceeding 20/m². Beneath this brown
algal canopy was another layer of smaller foliose reds such as Callophyllis,
Kallymenia and Turnerella.
In the deeper waters of the entrance channel (8-12 m), the surface
canopy was absent and understory densities were somewhat reduced. However,
Laminaria plants were still quite robust and abundant.
Suspension feeders were very abundant and exhibited high species diver-
sity; in several places they carpeted the bottom (Table 5). Dominant species
included the sabellid polychaete Potamilla ?reniformis, the mussel Modiolus
and the large anemone Metridium senile. Some of the common forms lived
buried in the cobble/shell debris matrix; these included the clams Saxidomus
giganteus, Humilaria kennerlyi, and Macoma the sipunculids Golfingia and
Phascolosoma agassizii and the echiurid Bonelliopsis alaskanus The northern
ugly clam Entodesma saxicola was common nesting on the cobble and on bedrock
slopes. The large barnacle Balanus nubilus and the large erect, orange
sponge Esperiopsis rigida were also common in these habitats, along with the
sea cucumbers Cucumaria vegae, various hydroids, sabellid worms and the
brittlestar Ophiopholis aculeata.
The urchin Strongylocentrotus drobachiensis was the principal grazer on
the reef. Densities of up to 50 individuals/m² were observed. Basically
the size distribution were unimodal, and the large average diameter indicated
that the populations were composed mainly of adults. Animals less than 12 mm
were uncommon suggesting that successful recruitment was rare. Off the reef
in the deeper water, densities dropped to 1.3/m².
The impact of urchin grazing became noticeable by summer 1977. By that
time the urchins had completely grazed the macrophytes off some shallower
portions of the reef and were advancing in high densities towards the deeper
458
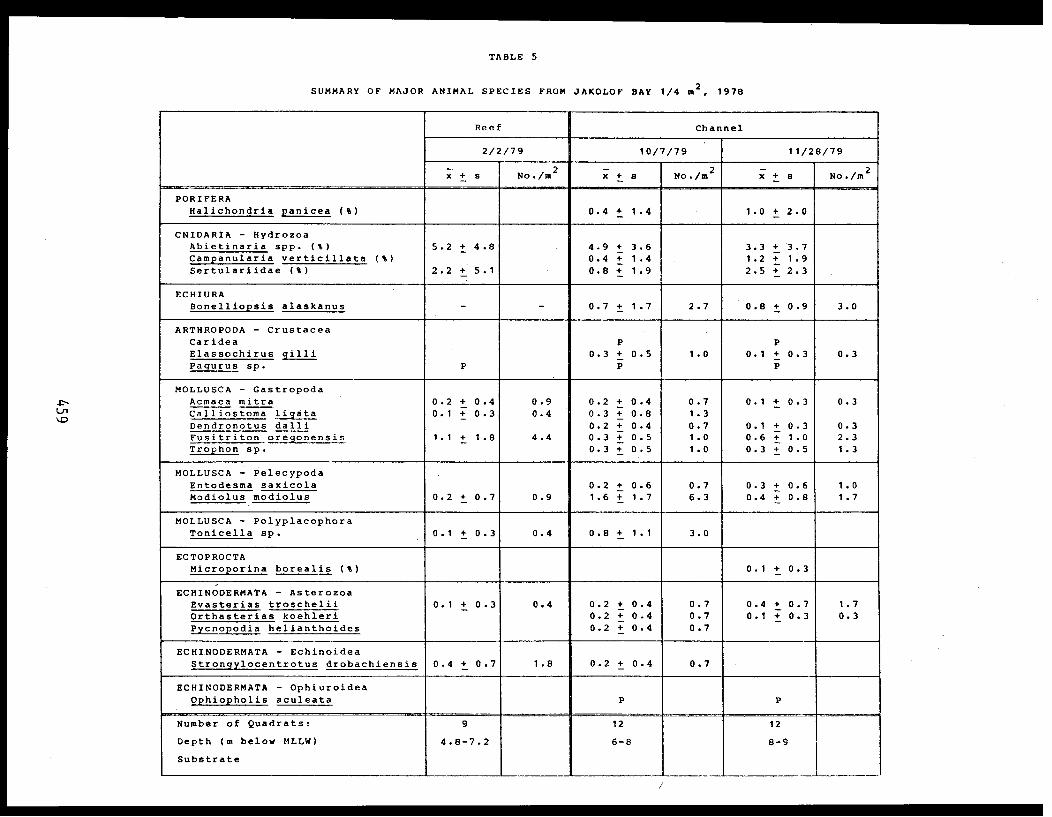
TABLE 5
SUMMARY OF MAJOR ANIMAL SPECIES FROM JAKOLOF BAY 1/4 m² 1978
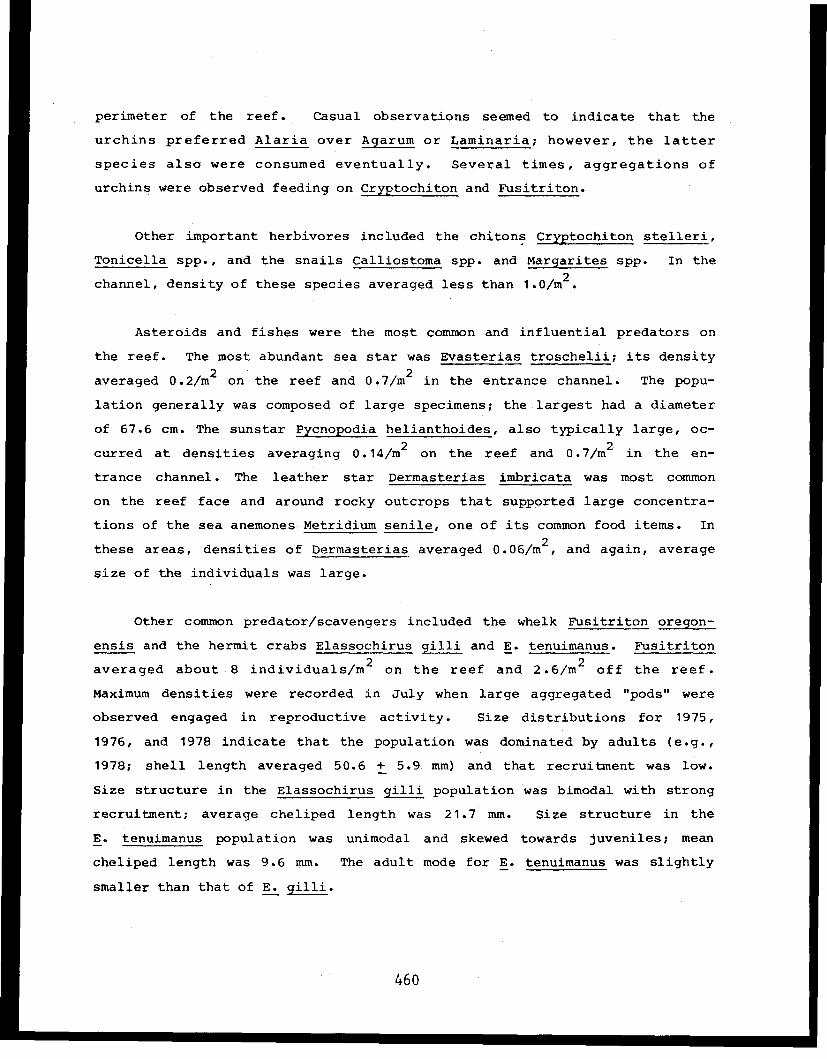
perimeter of the reef. Casual observations seemed to indicate that the
urchins preferred Alaria over Agarum or Laminaria; however, the latter
species also were consumed eventually. Several times, aggregations of
urchins were observed feeding on Cryptochiton and Fusitriton.
Other important herbivores included the chitons Cryptochiton stelleri,
Tonicella spp., and the snails Calliostoma spp. and Margarites spp. In the
channel, density of these species averaged less than 1.0/m².
Asteroids and fishes were the most common and influential predators on
the reef. The most abundant sea star was Evasterias troschelii; its density
averaged 0.2/m² on the reef and 0.7/m² in the entrance channel. The popu-
lation generally was composed of large specimens; the largest had a diameter
of 67.6 cm. The sunstar Pycnopodia helianthoides, also typically large, oc-
curred at densities averaging 0.14/m² on the reef and 0.7/m² in the en-
trance channel. The leather star Dermasterias imbricata was most common
on the reef face and around rocky outcrops that supported large concentra-
tions of the sea anemones Metridium senile, one of its common food items. In
these areas, densities of Dermasterias averaged 0.06/m², and again, average
size of the individuals was large.
Other common predator/scavengers included the whelk Fusitriton oregon-
ensis and the hermit crabs Elassochirus gilli and E. tenuimanus. Fusitriton
averaged about 8 individuals/m² on the reef and 2.6/m² off the reef.
Maximum densities were recorded in July when large aggregated "pods" were
observed engaged in reproductive activity. Size distributions for 1975,
1976, and 1978 indicate that the population was dominated by adults (e.g.,
1978; shell length averaged 50.6 ± 5.9 mm) and that recruitment was low.
Size structure in the Elassochirus gilli population was bimodal with strong
recruitment; average cheliped length was 21.7 mm. Size structure in the
E. tenuimanus population was unimodal and skewed towards juveniles; mean
cheliped length was 9.6 mm. The adult mode for E. tenuimanus was slightly
smaller than that of E. gilli.
460

Fish were seasonally important predators; they were generally present in
summer and absent during winter and spring. The most abundant species were
nesting rock and kelp greenling, Hexagrammos decagrammus and H. lagocephalus,
which brooded egg clutched in the area during summer and competed very
strongly for territories.
6. The Biological Assemblage at Barabara Bluff
The site surveyed at Barabara Bluff was a well-developed kelp bed
located at the depth of approximately 10 meters. The study site was high
relief bedrock and boulders (Figure 1).
As is typical of the kelp beds along the southern shore of Kachemak
Bay, the site had a multilayered macrophyte assemblage. The floating canopy
was formed solely by the bull kelp Nereocystis luetkeana. The species
exhibited patchy distributions; average density ranged from 0.6 to 3.6
individuals/m². Standing crop averaged 5438.4 g/m² and ranged from 0
to 20 kg/m² (Table 6; Appendix D-1 through D-5).
The algal understory was dominated by the kelps Agarum and Desmarestia;
but their distribution was also quite patchy. Agarum, the major species,
averaged 22.6 percent relative cover with 8.0 individuals/m²; its standing
crop averaged 312.8 g/m². Desmarestia aculeata, with 5.6 percent relativecover, averaged only 28.0 g/m². Laminaria groenlandica was sparse.
Beneath the phaeophytes, the filamentous rhodophyte ?Pterosiphonia provided
37.2 percent relative cover.
Abundance was not recorded for the epifauna; however, a partial species
list was obtained (Appendix D-5). Suspension feeders included the polychaete
Thelepus cincinnatus, bivalves Protothaca staminea and Saxidomus giganteus,
bryozoans Flustrella, Heteropora and Terminoflustra, the echiurid worm
Bonelliopsis alaskanus, the tunicates Distaplia occidentalis and Halocynthia
aurantium and the brittle star Ophiopholis aculeata.
461
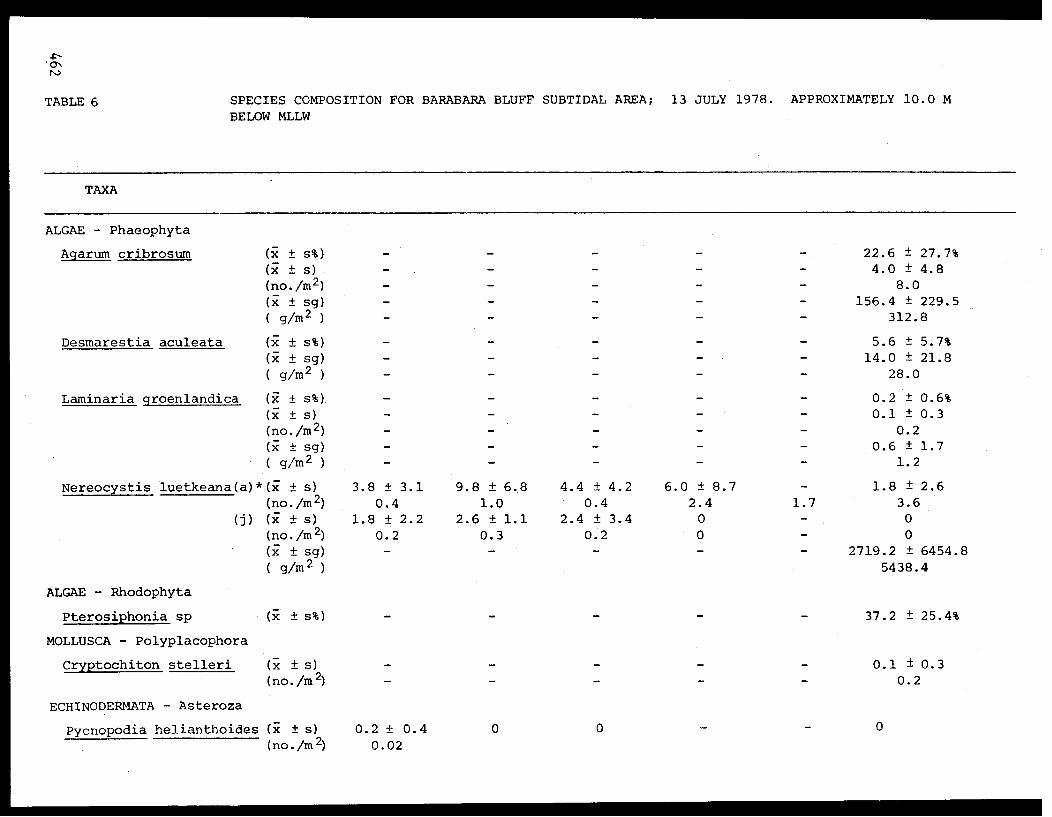
TABLE 6 SPECIES COMPOSITION FOR BARABARA BLUFF SUBTIDAL AREA; 13 JULY 1978. APPROXIMATELY 10.0 MBELOW MLLW

TABLE 6 (Continued)
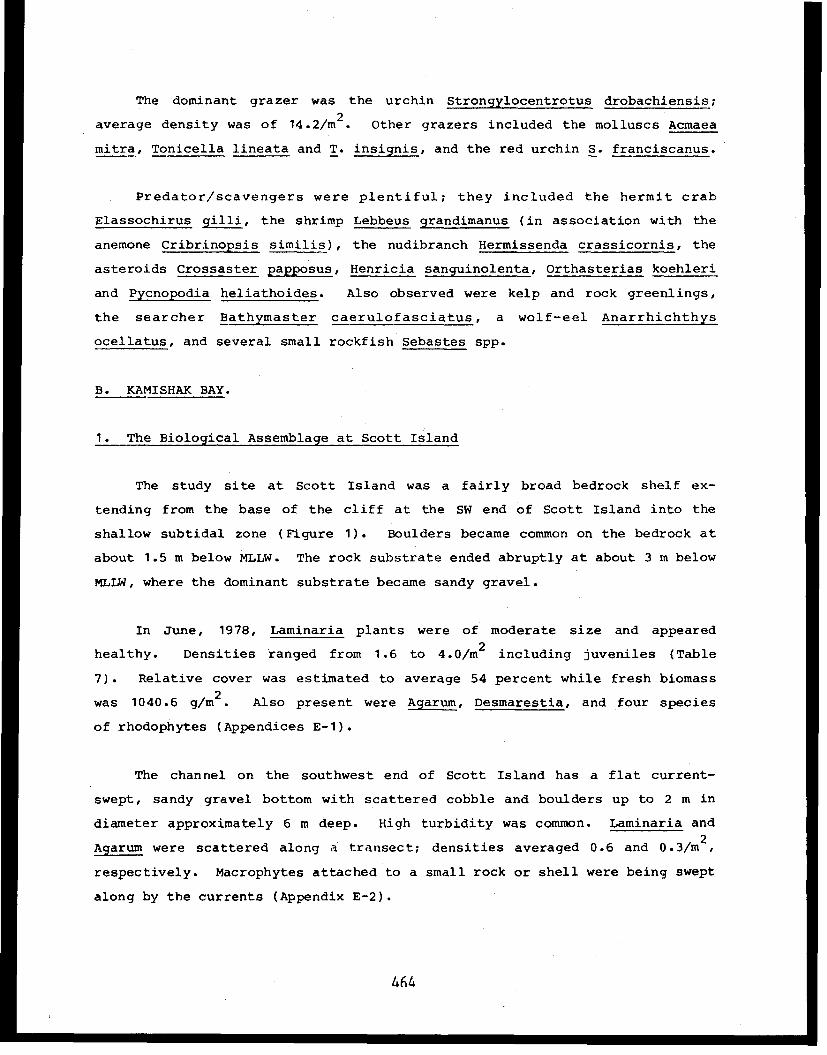
The dominant grazer was the urchin Strongylocentrotus drobachiensis;
average density was of 14.2/m². Other grazers included the molluscs Acmaea
mitra, Tonicella lineata and T. insignis, and the red urchin S. franciscanus.
Predator/scavengers were plentiful; they included the hermit crab
Elassochirus gilli, the shrimp Lebbeus grandimanus (in association with the
anemone Cribrinopsis similis), the nudibranch Hermissenda crassicornis, the
asteroids Crossaster papposus, Henricia sanguinolenta, Orthasterias koehleri
and Pycnopodia heliathoides. Also observed were kelp and rock greenlings,
the searcher Bathymaster caerulofasciatus, a wolf-eel Anarrhichthys
ocellatus, and several small rockfish Sebastes spp.
B. KAMISHAK BAY.
1. The Biological Assemblage at Scott Island
The study site at Scott Island was a fairly broad bedrock shelf ex-
tending from the base of the cliff at the SW end of Scott Island into the
shallow subtidal zone (Figure 1). Boulders became common on the bedrock at
about 1.5 m below MLLW. The rock substrate ended abruptly at about 3 m below
MLLW, where the dominant substrate became sandy gravel.
In June, 1978, Laminaria plants were of moderate size and appeared
healthy. Densities ranged from 1.6 to 4.0/m² including juveniles (Table
7). Relative cover was estimated to average 54 percent while fresh biomass
was 1040.6 g/m². Also present were Agarum, Desmarestia, and four species
of rhodophytes (Appendices E-1).
The channel on the southwest end of Scott Island has a flat current-
swept, sandy gravel bottom with scattered cobble and boulders up to 2 m in
diameter approximately 6 m deep. High turbidity was common. Laminaria and
Agarum were scattered along a transect; densities averaged 0.6 and 0.3/m²,
respectively. Macrophytes attached to a small rock or shell were being swept
along by the currents (Appendix E-2).
464

TABLE 7 SPECIES COMPOSITION FOR SCOTT ISLAND SUBTIDAL AREA; 15 JUNE 1978,
2 M BELOW MLLW
465
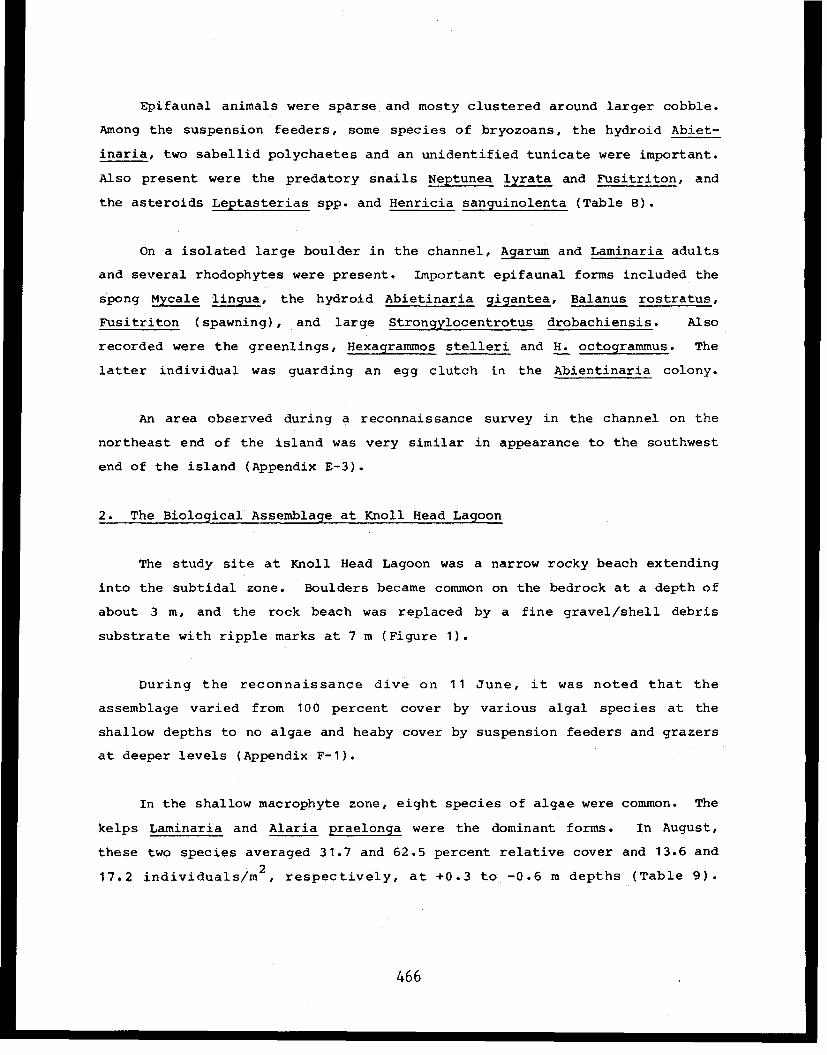
Epifaunal animals were sparse and mosty clustered around larger cobble.
Among the suspension feeders, some species of bryozoans, the hydroid Abiet-
inaria, two sabellid polychaetes and an unidentified tunicate were important.
Also present were the predatory snails Neptunea lyrata and Fusitriton, and
the asteroids Leptasterias spp. and Henricia sanguinolenta (Table 8).
On a isolated large boulder in the channel, Agarum and Laminaria adults
and several rhodophytes were present. Important epifaunal forms included the
spong Mycale lingua, the hydroid Abietinaria gigantea, Balanus rostratus,
Fusitriton (spawning), and large Strongylocentrotus drobachiensis. Also
recorded were the greenlings, Hexagrammos stelleri and H. octogrammus. The
latter individual was guarding an egg clutch in the Abientinaria colony.
An area observed during a reconnaissance survey in the channel on the
northeast end of the island was very similar in appearance to the southwest
end of the island (Appendix E-3).
2. The Biological Assemblage at Knoll Head Lagoon
The study site at Knoll Head Lagoon was a narrow rocky beach extending
into the subtidal zone. Boulders became common on the bedrock at a depth of
about 3 m, and the rock beach was replaced by a fine gravel/shell debris
substrate with ripple marks at 7 m (Figure 1).
During the reconnaissance dive on 11 June, it was noted that the
assemblage varied from 100 percent cover by various algal species at the
shallow depths to no algae and heaby cover by suspension feeders and grazers
at deeper levels (Appendix F-1).
In the shallow macrophyte zone, eight species of algae were common. The
kelps Laminaria and Alaria praelonga were the dominant forms. In August,
these two species averaged 31.7 and 62.5 percent relative cover and 13.6 and
17,2 individuals/m², respectively, at +0.3 to -0.6 m depths (Table 9).
466
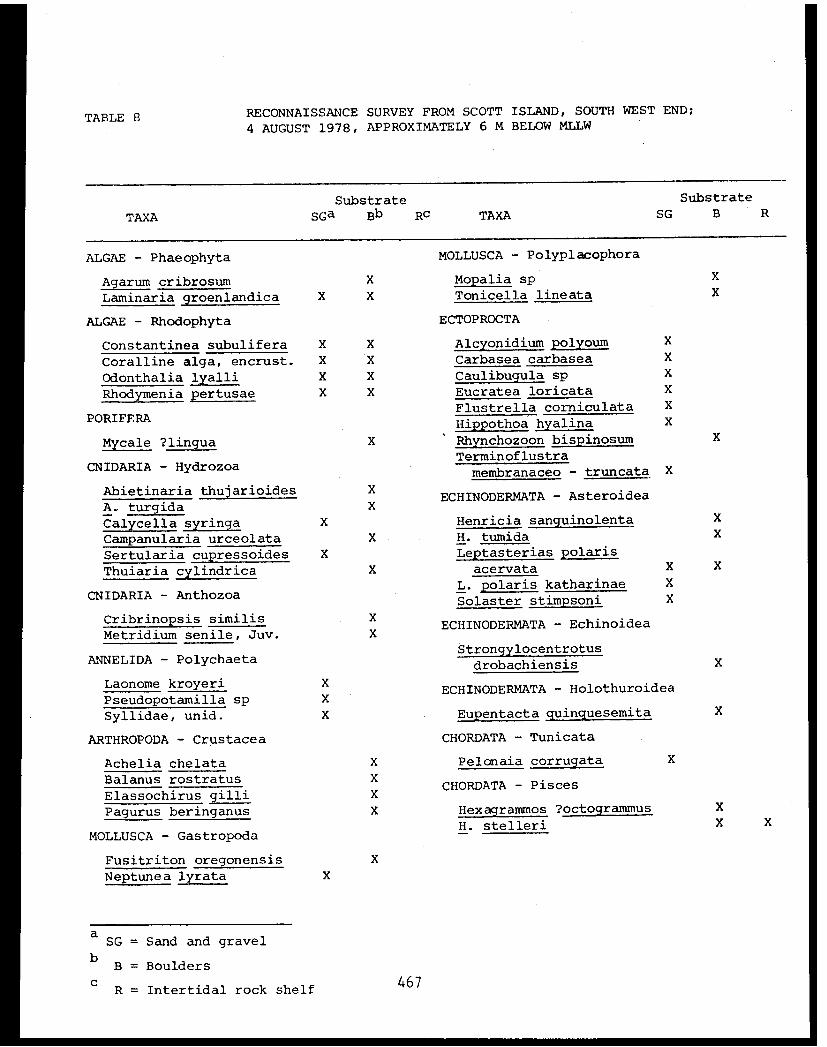
TABLE 8 RECONNAISSANCE SURVEY FROM SCOTT ISLAND, SOUTH WEST END;
4 AUGUST 1978, APPROXIMATELY 6 M BELOW MLLW
467

TABLE 9
SPECIES COMPOSITION OF KNOLL HEAD LAGOON STUDY AREA, AUGUST 1978

TABLE 9
(continued)
SPECIES COMPOSITION OF KNOLL HEAD LAGOON STUDY AREA, AUGUST 1978
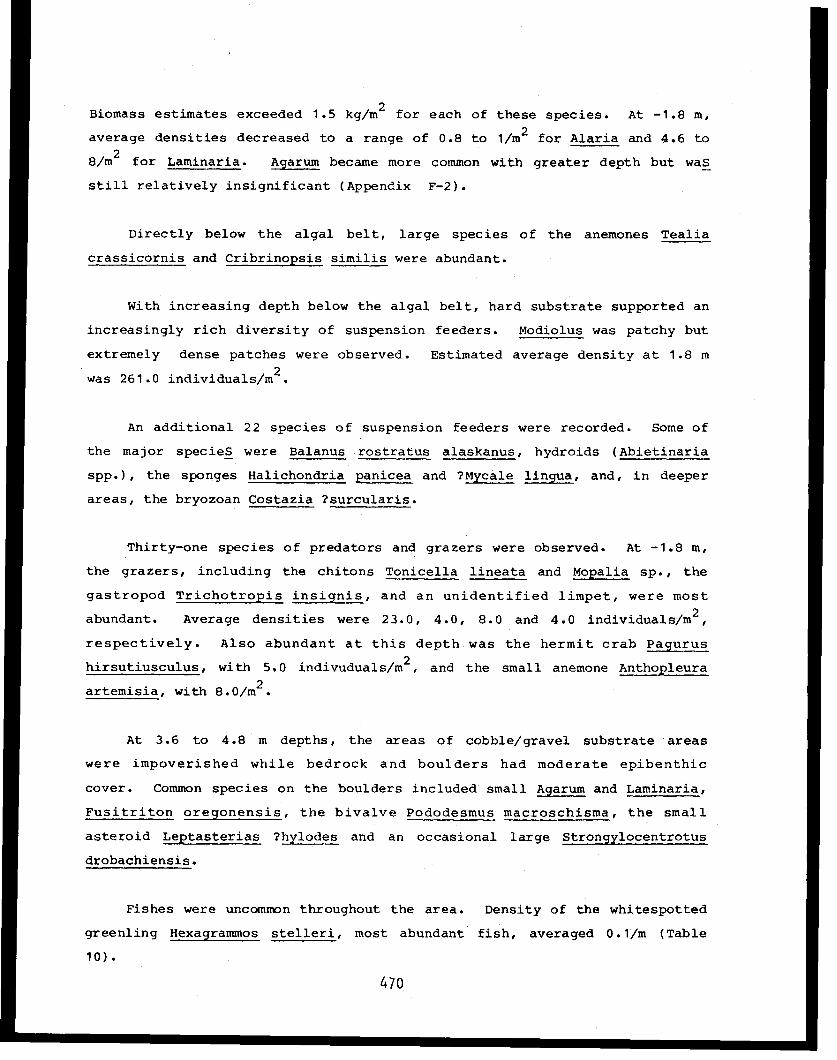
Biomass estimates exceeded 1.5 kg/m² for each of these species. At -1.8 m,
average densities decreased to a range of 0.8 to 1/m² for Alaria and 4.6 to
8/m² for Laminaria. Agarum became more common with greater depth but was
still relatively insignificant (Appendix F-2).
Directly below the algal belt, large species of the anemones Tealia
crassicornis and Cribrinopsis similis were abundant.
With increasing depth below the algal belt, hard substrate supported an
increasingly rich diversity of suspension feeders. Modiolus was patchy but
extremely dense patches were observed. Estimated average density at 1.8 m
was 261.0 individuals/m² .
An additional 22 species of suspension feeders were recorded. Some of
the major species were Balanus rostratus alaskanus, hydroids (Abietinaria
spp.), the sponges Halichondria panicea and ?Mycale lingua, and, in deeper
areas, the bryozoan Costazia ?surcularis.
Thirty-one species of predators and grazers were observed. At -1.8 m,
the grazers, including the chitons Tonicella lineata and Mopalia sp., the
gastropod Trichotropis insignis, and an unidentified limpet, were most
abundant. Average densities were 23.0, 4.0, 8.0 and 4.0 individuals/m²,
respectively. Also abundant at this depth was the hermit crab Pagurus
hirsutiusculus, with 5.0 indivuduals/m², and the small anemone Anthopleura
artemisia, with 8.0/m².
At 3.6 to 4.8 m depths, the areas of cobble/gravel substrate areas
were impoverished while bedrock and boulders had moderate epibenthic
cover. Common species on the boulders included small Agarum and Laminaria,
Fusitriton oregonensis, the bivalve Pododesmus macroschisma, the small
asteroid Leptasterias ?hylodes and an occasional large Strongylocentrotus
drobachiensis.
Fishes were uncommon throughout the area. Density of the whitespotted
greenling Hexagrammos stelleri, most abundant fish, averaged 0.1/m (Table
10).
470
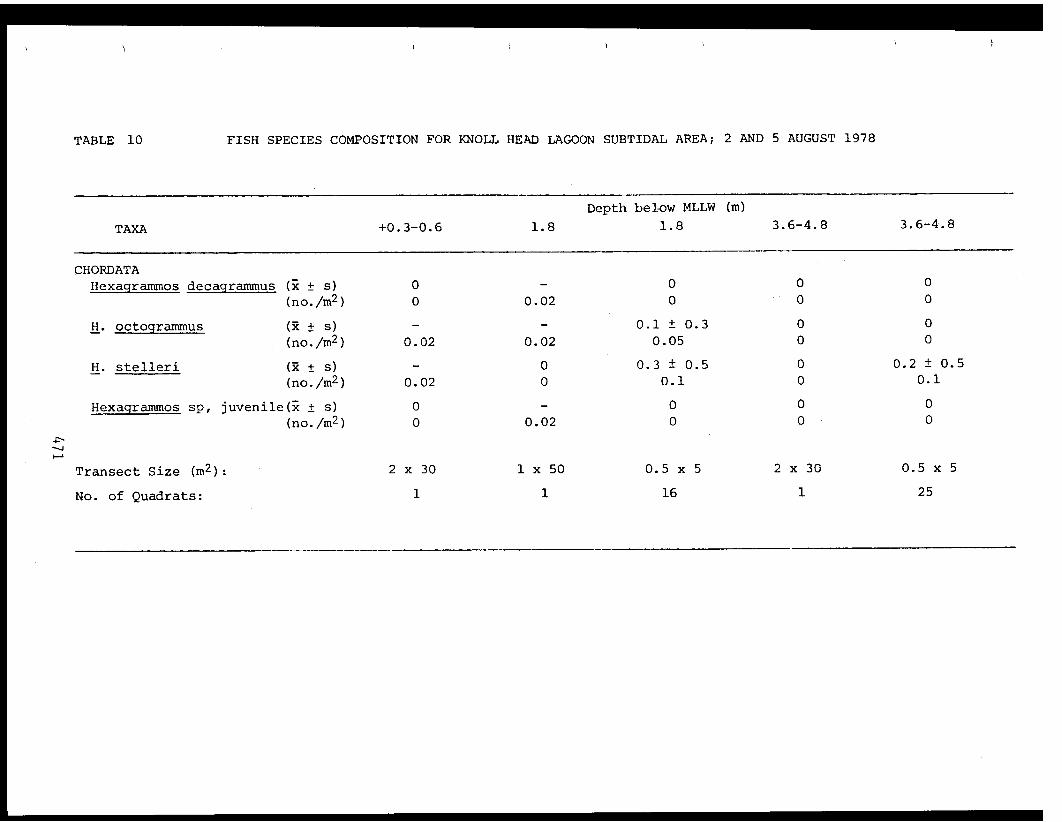
TABLE 10 FISH SPECIES COMPOSITION FOR KNOLL HEAD LAGOON SUBTIDAL AREA; 2 AND 5 AUGUST 1978
3. The Biological Assemblage at White Gull Island
Reconnaissance dives were made on the west of lee side of White Gull
Island in June, and along the exposed east side of the island in August
(Figure 1). Intertidally, the lee side of the island comprised two sub-
strates, i.e., a coarse gravel beach and sheer rock faces. These substrates
extended subtidally and then graded through an area of low-relief cobble and
small boulders to small gravel and shell debris, finally turning into silt
and gravel flats in the southern entrance channel.
The only organism observed on the intertidal gravel beach was Littorina.
Macrophytes were first encountered in the cobble and boulder field at 1.1
m below MLLW (Appendix G-1) but only extended to a depth of 3.6 m below
MLLW. Important macrophyte species included Monostroma, Alaria taeniata,
Desmarestia aculeata, and at deeper depth, Agarum cribrosum and Laminaria
spp. Numerous hydroid and bryozoan species, an orange, encrusting sponge and
the bivalves Astarte sp. and Macoma sp., formed the suspension-feeding
component of the assemblage. Predator/scavenger species included the gastro-
pods Boreotrophon spp., Buccinum glacialis, Natica clausa and Neptunea
?lyrata, three species of Leptasterias and whitespotted greenlings.
The intertidal sheer rock face extended subtidally to 2.3 m below MLLW.
The assemblage was similar to that reported for the boulder field below.
The small gravel/shell debris flat appeared to be typical of deeper
portions of Iliamna Bay. Observations out to the middle of the southern
entrance channel at a depth of 4 m below MLLW revealed no visual change in
substrate. Near slack tide, a fine layer of silt covered the bottom.
Below -2.8 m, the flat was completely devoid of macroalgae. The macro-
fauna comprised numerous deposit and suspension feeders, including a tere-
bellid polychaete, the hydroids Abietinaria spp. and ?Obelia sp., the bry-
ozoans Dendrobeania murrayana and Eucratea loricata, and the bivalve Clino-
cardium sp. Predators included the hermit crabs Elassochirus tenuimanus and
472
Pagurus ochotensis, the gastropods Neptunea lyrata and Oenopota spp., the
large asteroid Leptasterias polaris acervata, whitespotted greenlings and
rock soles. One of the more important epifaunal species was the sabellid
polychaete Schizobranchia ?insignis. This tubicolous suspension feeder was
observed in dense clusters up to 1.3 m in diameter and extending 0.3 m
above the bottom. Hermit crabs and the snail Neptunea were occasionally
observed in the midst of the clumps; both groups are reported to feed on
Schizobranchia in this manner.
The exposed east side of White Gull Island comprises a broad intertidal
bedrock shelf which abruptly breaks into a vertical face at approximately
1.6 m below MLLW. A steep talus slope commences at 4.4 to 5.4 m below
MLLW and continued down to 11.1 m below MLLW, where a gravel/shell debris
flat was encountered.
Although Alaria and Laminaria were abundant atop the bench, macrophytes
were generally absent below its edge (Appendix G-2).
On the vertical rock face, suspension feeders dominated. Young speci-
mens of the anemone Metridium senile (<10 cm high) were the most abundant
form. Also common were the small sea cucumber Eupentacta quinquesemita, the
anemones Tealia crassicornis and Cribrinopsis sp., several species of sponge,
hydroids, bryozoans and tunicates and the predatory gastropods Neptunea and
Fusitriton. Grazer species were of little importance.
The talus slope and boulder field were dominated by various suspension
feeders. Important species included the orange, social tunicate Dendrodoa
pulchella, the bryozoans Costazia ?surcularis and C. nordenskjoldi, the
sponge Mycale and the barnacle Balanus rostratus. Coverage by these species
was considerable; the epifaunal mat was complex.
The fine gravel/shell debris flat was not extensively surveyed, but had
small rippled marks and a very thin deposit of silt. Numerous small pagurid
crabs and Leptasterias polaris were observed occasionally.
473
4. The Biological Assemblage at Black Reef
Black Reef is a bedrock pinnacle surrounded by a talus slope. Sub-
tidally, the reef has a vertical face with slight undercutting. The talus
slope commences at a depth of about 4-6 m. With boulders up to 2 m in
diameter and many crevices and small caves, surface relief is high. At about
9.3 m, rock gives way to a flat bottom of silty sand, gravel, and shell
debris with small ripple marks. The reef is openly exposed to any wave
action generated across lower Cook Inlet or from the intense "williwaw" winds
jetting through the surrounding mountain passes (Figure 1).
The only significant macrophyte cover at the site occurred above 1.8
to 3.0 m. Algae included Laminaria groenlandica, Alaria taeniata, Rhodymenia
palmata, and encrusting coralline algae. Macrophytes were totally lacking
below 4.7 m (Appendix H).
Below the laminarian zone was located a zone of the anemone Tealia
crassicornis and Cribrinopsis, and below that, a band of the small social
tunicate Dendrodoa pulchella. The remainder of the rock face was dominated
by various species of bryozoans sponges and Balanus rostratus. Beneath
shallow overhangs the sea cucumbers Psolus sp. and Eupentacta and the gas-
tropods Calliostoma ligata and Margarites pupillus were reported. The
grazers Tonicella spp., Mopalia spp. and Ischnochiton trifidus were present
but sparse. Finally at the base of the face, specimens of many Boreotrophon
clathrus were feeding on in small patches of barnacles.
On the boulders at 4.7 m, a few of Agarum and Rhodymenia plants were the
only macrophytes present. The area was occupied mostly by Balanus rostratus,
the digitate bryozoan Costazia ?surcularis, the sponges Mycale ?lingua and
Halichondria panicea, the tunicate Dendrodoa pulchella, and encrusting
coralline algae. Also commonly observed was the clam Mya truncata, the small
decorator crab Oregonia gracilis, and the brittlestar Ophiopholis aculeata.
The latter was very abundant in crevices, among barnacles, in bryozoan
colonies and crawling over rocks.
474

Away from the boulders at 9.3 m, the fine sand/gravel/shell debris
substrate appeared impoverished. Several small hermit crabs and a single
Fusitriton were the only epifauna recorded.
5. The Biological Assemblage at Turtle Reef
In August 1978, a brief reconnaissance dive was made among the eastern
pinnacles at Turtle Reef, a broad intertidal shelf of fairly flat rock
(Figure 1). The biota, typically intertidal, was dominated by the macro-
phytes Fucus, Alaria, Rhodymenia palmata, the barnacle Balanus, the grazers
Acmaea and Tonicella lineata and the gastropod Littorina. Spongomorpha and
associated diatoms were abundant on top of rocks. The anemones Anthopleura
artemisia, Tealia crassicornis and Cribrinopsis were common in protected,
low sites. The sponge Halichondria panicea formed well-developed mats
in channels between the eastern and western rocks (Appendix I). In the
lower intertidal zone, Laminaria and several rhodophytes were more abun-
dant. Clusters of tunicates were evident and comprised the most obvious and
abundant epifauna. Also common were the anemone Cribrinopsis , the tunicate
Styela sp., and the brittle star Ophiopholis aculeata.
C. THE BIOLOGY OF MODIOLUS MODIOLUS
1. Habitat
The horse mussel, Modiolus modiolus, is typically found in aggregated
patches or beds. Individuals are joined to rocks or each other by networks
of byssal threads. Often the beds examined were so well stabilized by byssal
attachments that it required 45 to 60 minutes for a diver to excavate a 1/4m
area. They are usually buried in a silt, sand, cobble and shell debris
substrate with just the tips of their shells exposed. These tips may be
encrusted with epibiotic forms such as encrusting coralline algae, hydroids,
bryozoans, sponges or have macrophytes attached. In some areas, e.g., in the
entrance channel to Jakolof Bay, an overburden of Modiolus shell debris up to
15 cm thick is present; its function will be discussed below.
475
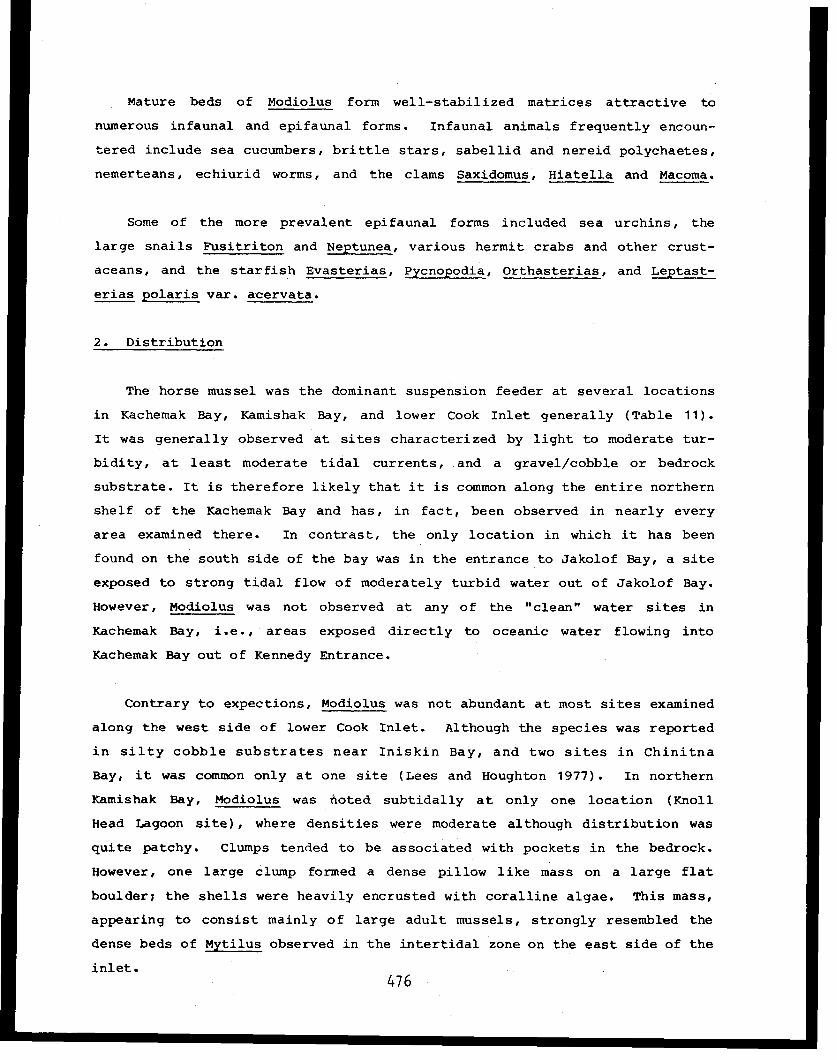
Mature beds of Modiolus form well-stabilized matrices attractive to
numerous infaunal and epifaunal forms. Infaunal animals frequently encoun-
tered include sea cucumbers, brittle stars, sabellid and nereid polychaetes,
nemerteans, echiurid worms, and the clams Saxidomus, Hiatella and Macoma.
Some of the more prevalent epifaunal forms included sea urchins, the
large snails Fusitriton and Neptunea, various hermit crabs and other crust-
aceans, and the starfish Evasterias, Pycnopodia, Orthasterias, and Leptast-
erias polaris var. acervata.
2. Distribution
The horse mussel was the dominant suspension feeder at several locations
in Kachemak Bay, Kamishak Bay, and lower Cook Inlet generally (Table 11).
It was generally observed at sites characterized by light to moderate tur-
bidity, at least moderate tidal currents, and a gravel/cobble or bedrock
substrate. It is therefore likely that it is common along the entire northern
shelf of the Kachemak Bay and has, in fact, been observed in nearly every
area examined there. In contrast, the only location in which it has been
found on the south side of the bay was in the entrance to Jakolof Bay, a site
exposed to strong tidal flow of moderately turbid water out of Jakolof Bay.
However, Modiolus was not observed at any of the "clean" water sites in
Kachemak Bay, i.e., areas exposed directly to oceanic water flowing into
Kachemak Bay out of Kennedy Entrance.
Contrary to expections, Modiolus was not abundant at most sites examined
along the west side of lower Cook Inlet. Although the species was reported
in silty cobble substrates near Iniskin Bay, and two sites in Chinitna
Bay, it was common only at one site (Lees and Houghton 1977). In northern
Kamishak Bay, Modiolus was noted subtidally at only one location (Knoll
Head Lagoon site), where densities were moderate although distribution was
quite patchy. Clumps tended to be associated with pockets in the bedrock.
However, one large clump formed a dense pillow like mass on a large flat
boulder; the shells were heavily encrusted with coralline algae. This mass,
appearing to consist mainly of large adult mussels, strongly resembled the
dense beds of Mytilus observed in the intertidal zone on the east side of the
inlet.476
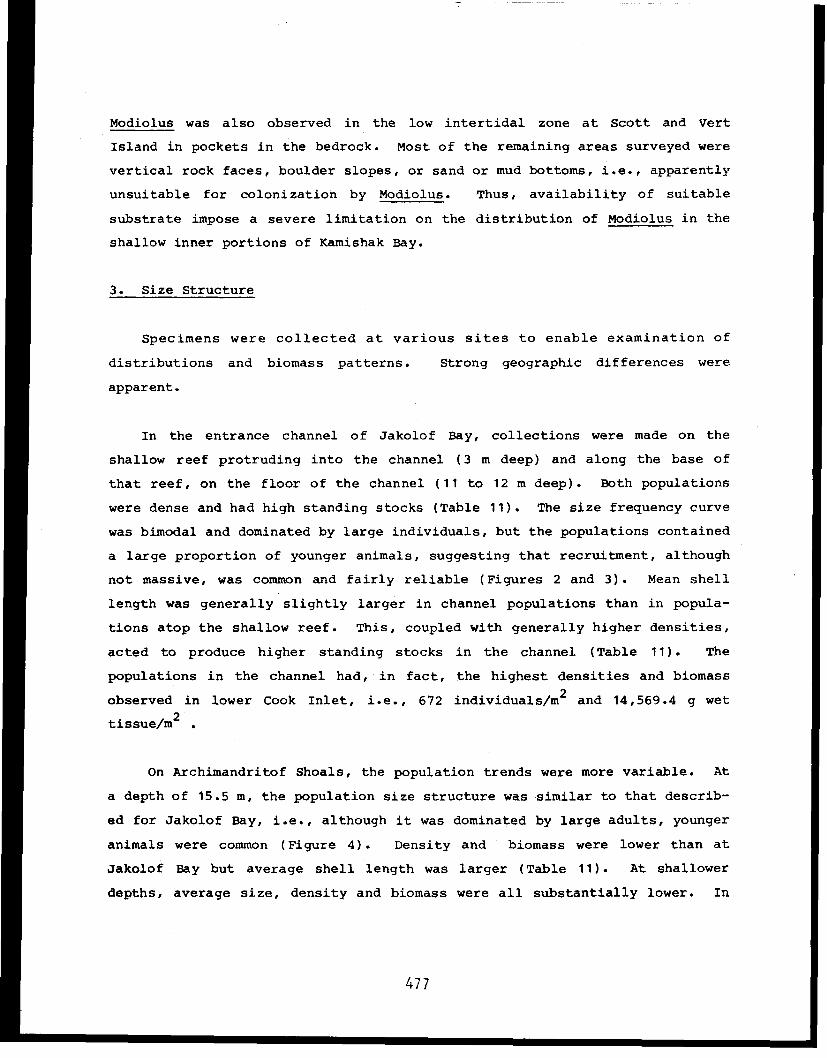
Modiolus was also observed in the low intertidal zone at Scott and Vert
Island in pockets in the bedrock. Most of the remaining areas surveyed were
vertical rock faces, boulder slopes, or sand or mud bottoms, i.e., apparently
unsuitable for colonization by Modiolus. Thus, availability of suitable
substrate impose a severe limitation on the distribution of Modiolus in the
shallow inner portions of Kamishak Bay.
3. Size Structure
Specimens were collected at various sites to enable examination of
distributions and biomass patterns. Strong geographic differences were
apparent.
In the entrance channel of Jakolof Bay, collections were made on the
shallow reef protruding into the channel (3 m deep) and along the base of
that reef, on the floor of the channel (11 to 12 m deep). Both populations
were dense and had high standing stocks (Table 11). The size frequency curve
was bimodal and dominated by large individuals, but the populations contained
a large proportion of younger animals, suggesting that recruitment, although
not massive, was common and fairly reliable (Figures 2 and 3). Mean shell
length was generally slightly larger in channel populations than in popula-
tions atop the shallow reef. This, coupled with generally higher densities,
acted to produce higher standing stocks in the channel (Table 11). The
populations in the channel had, in fact, the highest densities and biomass
observed in lower Cook Inlet, i.e., 672 individuals/m[superscript]2 and 14,569.4 g wet
tissue/m[superscript]2
On Archimandritof Shoals, the population trends were more variable. At
a depth of 15.5 m, the population size structure was similar to that describ-
ed for Jakolof Bay, i.e., although it was dominated by large adults, younger
animals were common (Figure 4). Density and biomass were lower than at
Jakolof Bay but average shell length was larger (Table 11). At shallower
depths, average size, density and biomass were all substantially lower. In
477
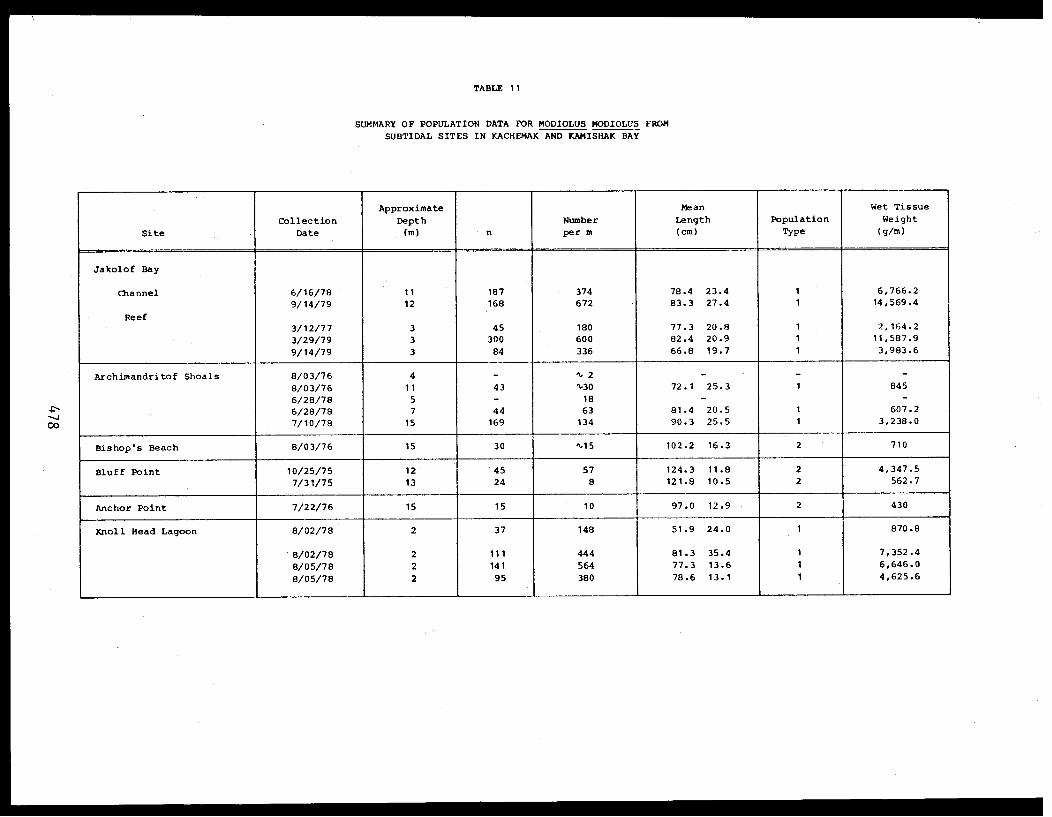
TABLE 11
SUMMARY OF POPULATION DATA FOR MODIOLUS MODIOLUS FROM
SUBTIDAL SITES IN KACHEMAK AND KAMISHAK BAY
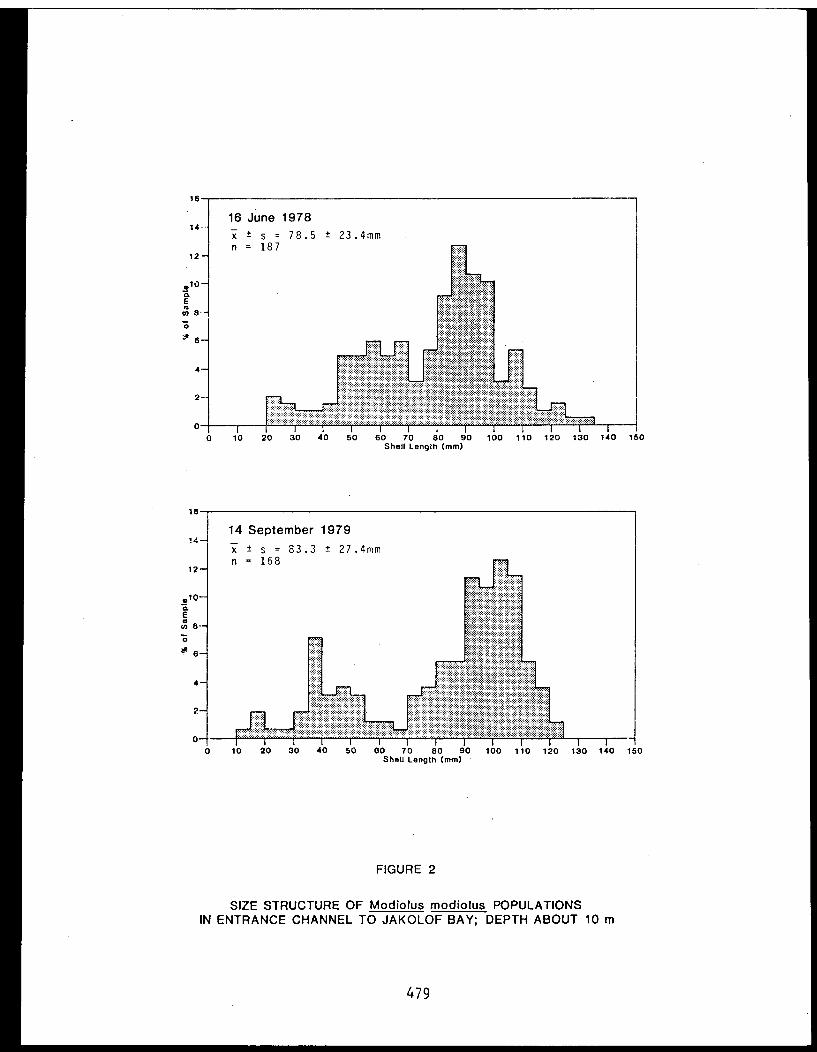
FIGURE 2
SIZE STRUCTURE OF Modiolus modiolus POPULATIONSIN ENTRANCE CHANNEL TO JAKOLOF BAY; DEPTH ABOUT 10 m
479

FIGURE 3
SIZE STRUCTURE OF Modiolus modiolus POPULATIONS
480 ON REEF IN ENTRANCE TO JAKOLOF BAY; DEPTH ABOUT 2 m

FIGURE 4
SIZE STRUCTURE OF Modiolus modiolus POPULATIONS ON ARCHIMANDRITOF SHOALS 481
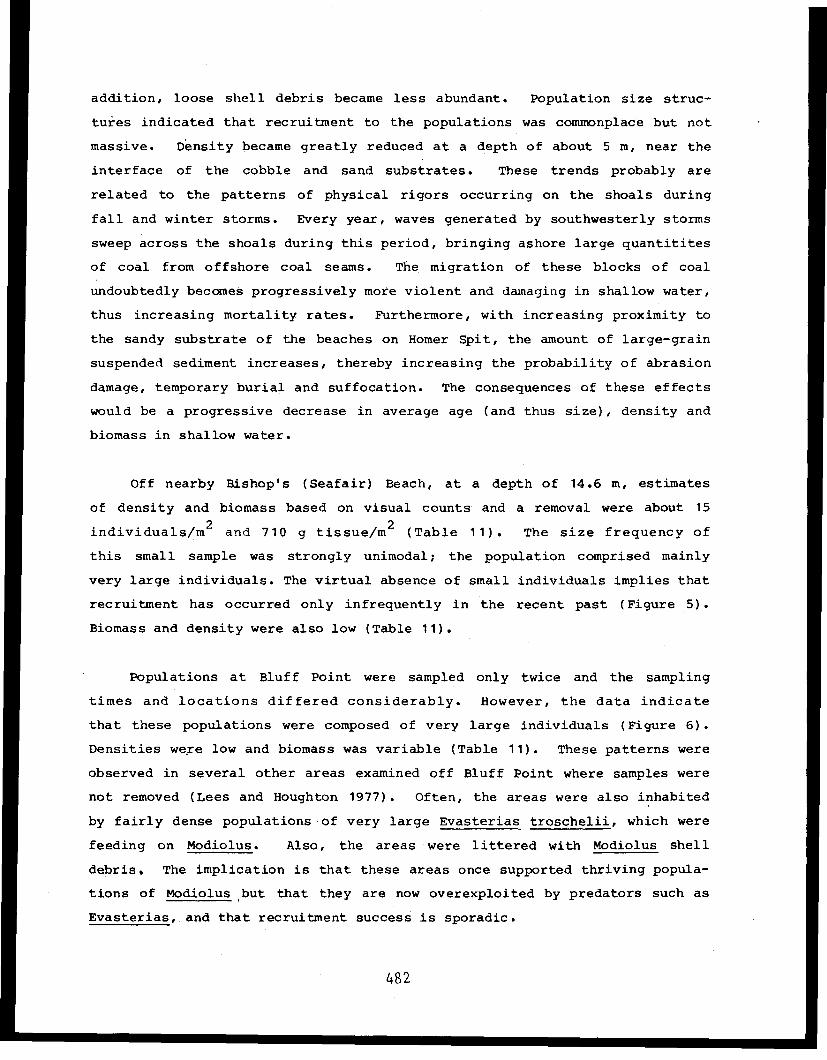
addition, loose shell debris became less abundant. Population size struc-
tures indicated that recruitment to the populations was commonplace but not
massive. Density became greatly reduced at a depth of about 5 m, near the
interface of the cobble and sand substrates. These trends probably are
related to the patterns of physical rigors occurring on the shoals during
fall and winter storms. Every year, waves generated by southwesterly storms
sweep across the shoals during this period, bringing ashore large quantitites
of coal from offshore coal seams. The migration of these blocks of coal
undoubtedly becomes progressively more violent and damaging in shallow water,
thus increasing mortality rates. Furthermore, with increasing proximity to
the sandy substrate of the beaches on Homer Spit, the amount of large-grain
suspended sediment increases, thereby increasing the probability of abrasion
damage, temporary burial and suffocation. The consequences of these effects
would be a progressive decrease in average age (and thus size), density and
biomass in shallow water.
Off nearby Bishop's (Seafair) Beach, at a depth of 14.6 m, estimates
of density and biomass based on visual counts and a removal were about 15
individuals/m² and 710 g tissue/m² (Table 11). The size frequency of
this small sample was strongly unimodal; the population comprised mainly
very large individuals. The virtual absence of small individuals implies that
recruitment has occurred only infrequently in the recent past (Figure 5).
Biomass and density were also low (Table 11).
Populations at Bluff Point were sampled only twice and the sampling
times and locations differed considerably. However, the data indicate
that these populations were composed of very large individuals (Figure 6).
Densities were low and biomass was variable (Table 11). These patterns were
observed in several other areas examined off Bluff Point where samples were
not removed (Lees and Houghton 1977). Often, the areas were also inhabited
by fairly dense populations of very large Evasterias troschelii, which were
feeding on Modiolus. Also, the areas were littered with Modiolus shell
debris. The implication is that these areas once supported thriving popula-
tions of Modiolus but that they are now overexploited by predators such as
Evasterias, and that recruitment success is sporadic.
482
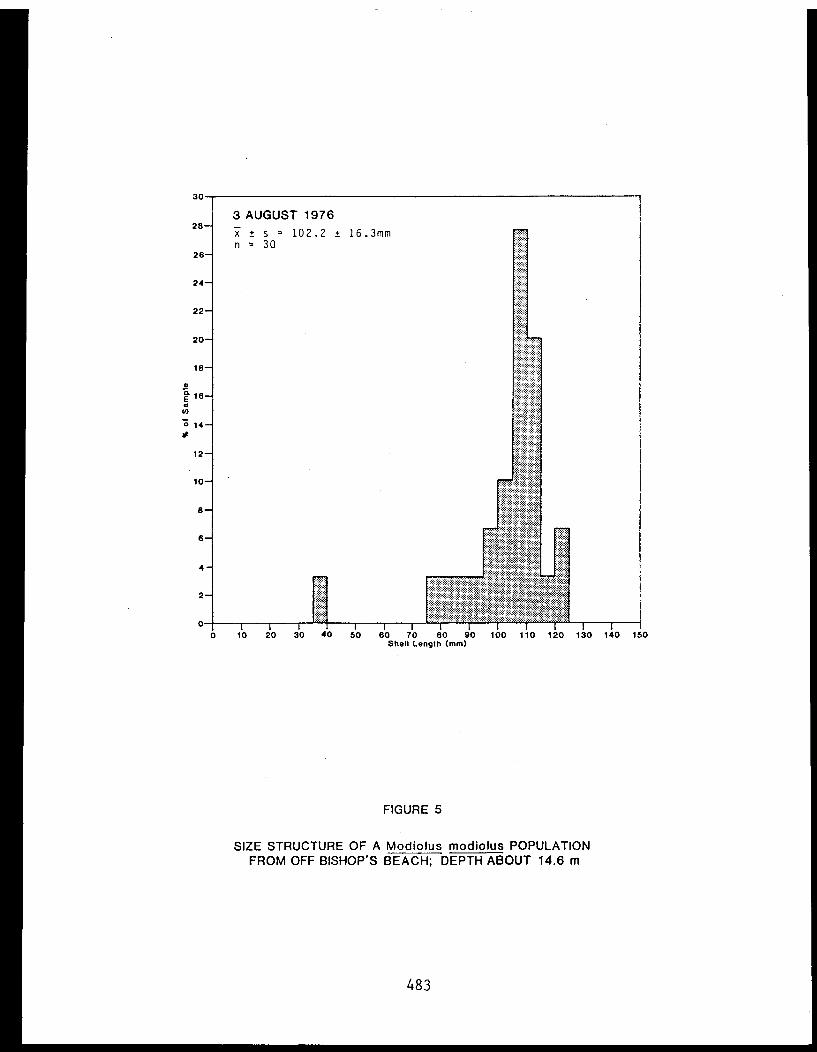
FIGURE 5
SIZE STRUCTURE OF A Modiolus modiolus POPULATIONFROM OFF BISHOP'S BEACH; DEPTH ABOUT 14.6 m
483
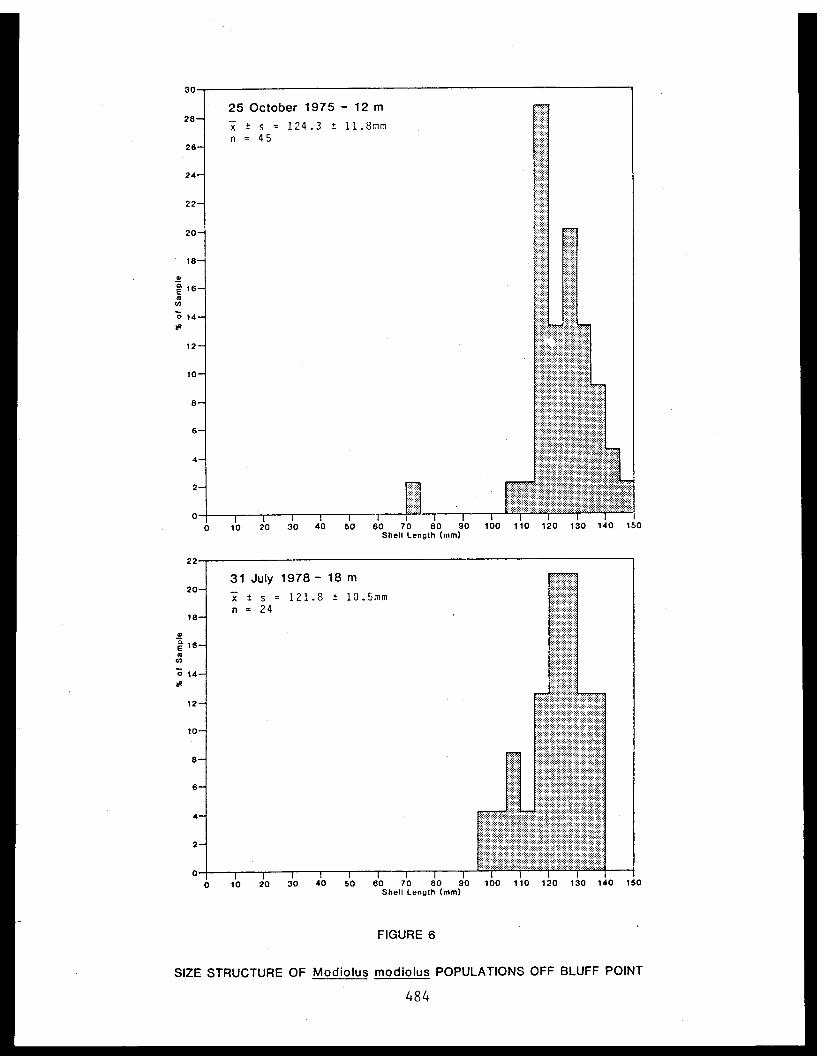
FIGURE 6
SIZE STRUCTURE OF Modiolus modiolus POPULATIONS OFF BLUFF POINT
484

Patterns observed off Troublesome Creek and Anchor Point were similar to
those described for Bluff Point but recruitment may be successful occasion-
ally (Figure 7). Average size was somewhat smaller (Table 11), and biomass
was the lowest recorded.
On the west side of the inlet, the only well-developed subtidal beds of
Modiolus were encountered at the Knoll Head Lagoon site, along the rocky
shore between Iniskin and Iliamna Bays. However, sparse beds were encoun-
tered in the low intertidal zone at Scott and Vert Islands, in front of
Iniskin Bay. Most of the beds observed at Knoll Head Lagoon were at a depth
of about 2 to 3 m, just below the intertidal zone. All the populations
sampled in this area gave evidence of successful recruitment (Figures 8 and
9), and some of the populations showed the strongest recruitment observed in
any of the populations sampled, e.g., Figure 9. The populations were distri-
buted patchily in small groups nestled in depressions in the bedrock. This
may account for the strong difference in size structure between the groups
sampled and represented in Figures 8 and 9. The effects of either ice scour
or predation would be more discrete in such a habitat, leading to greater
heterogeneity in size structure. Density and biomass were moderate, despite
the patchiness (Table 11).
4. Predation and Secondary Production
We attempted to determine growth rates for Modiolus in a plot in the
entrance channel of Jakolof Bay by notching shells a predetermined dis-
tance from the shell margin at the exposed (posterior) end of the shell. The
reason for notching the shell away from the margin was to preclude damaging
the mantle or destroying the integrity of the mantle cavity and thus exposing
the marked animals to increased predation rates. In order to obtain access
to the animals for this operation, it was necessary to remove the epifauna
(hydroids and bryozoans), small red algae and shell debris. The latter was
in a loose layer nearly 10 cm thick. When we returned about a year later to
recover the notched animals, all animals in the plot had been removed and
485
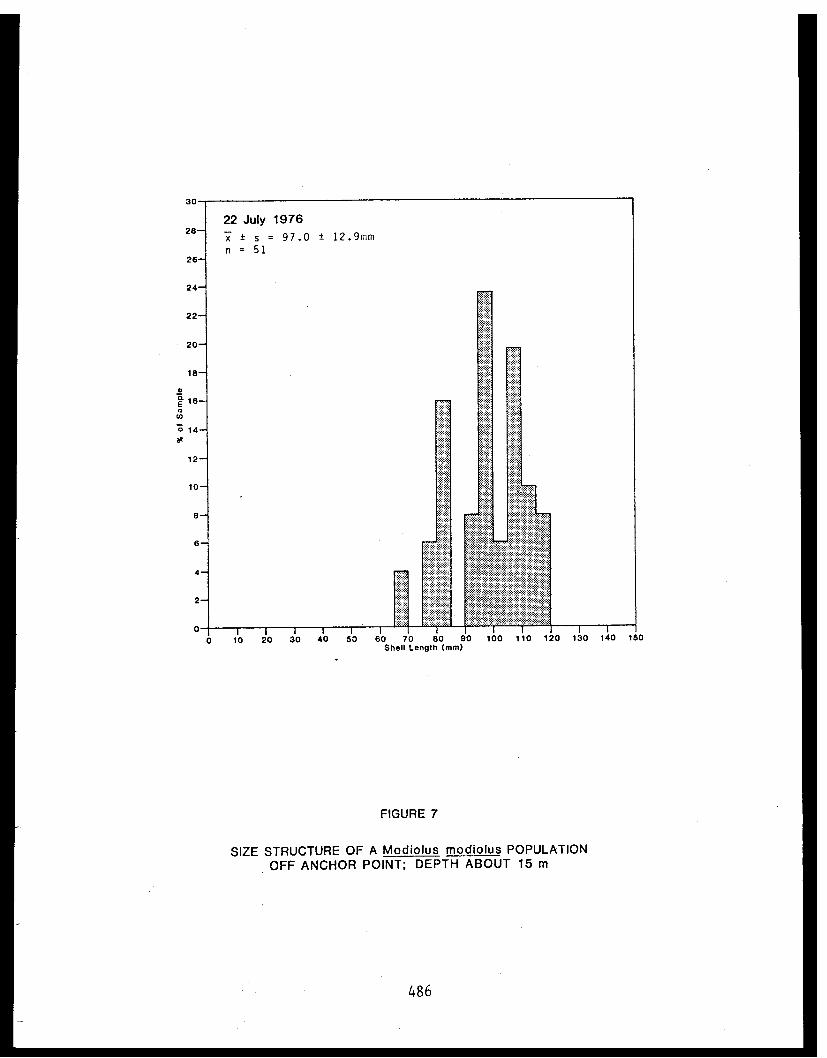
FIGURE 7
SIZE STRUCTURE OF A Modiolus modiolus POPULATIONOFF ANCHOR POINT; DEPTH ABOUT 15 m
486
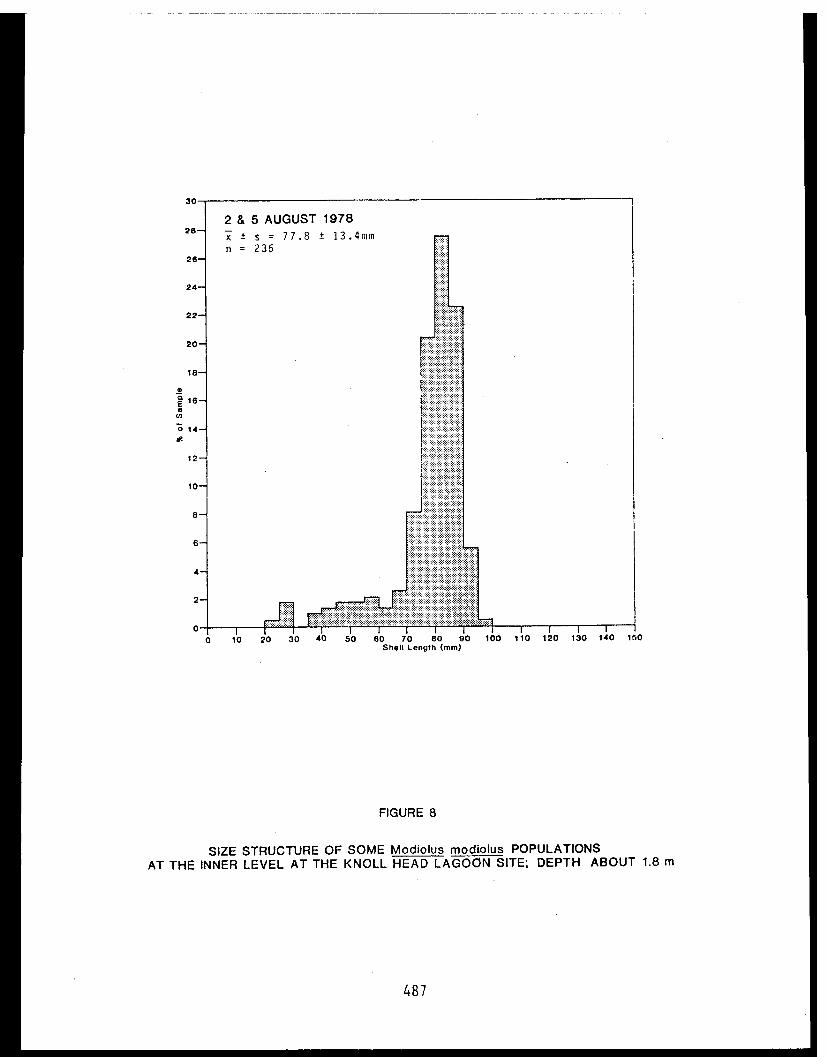
FIGURE 8
SIZE STRUCTURE OF SOME Modiolus modiolus POPULATIONSAT THE INNER LEVEL AT THE KNOLL HEAD LAGOON SITE; DEPTH ABOUT 1.8 m
487
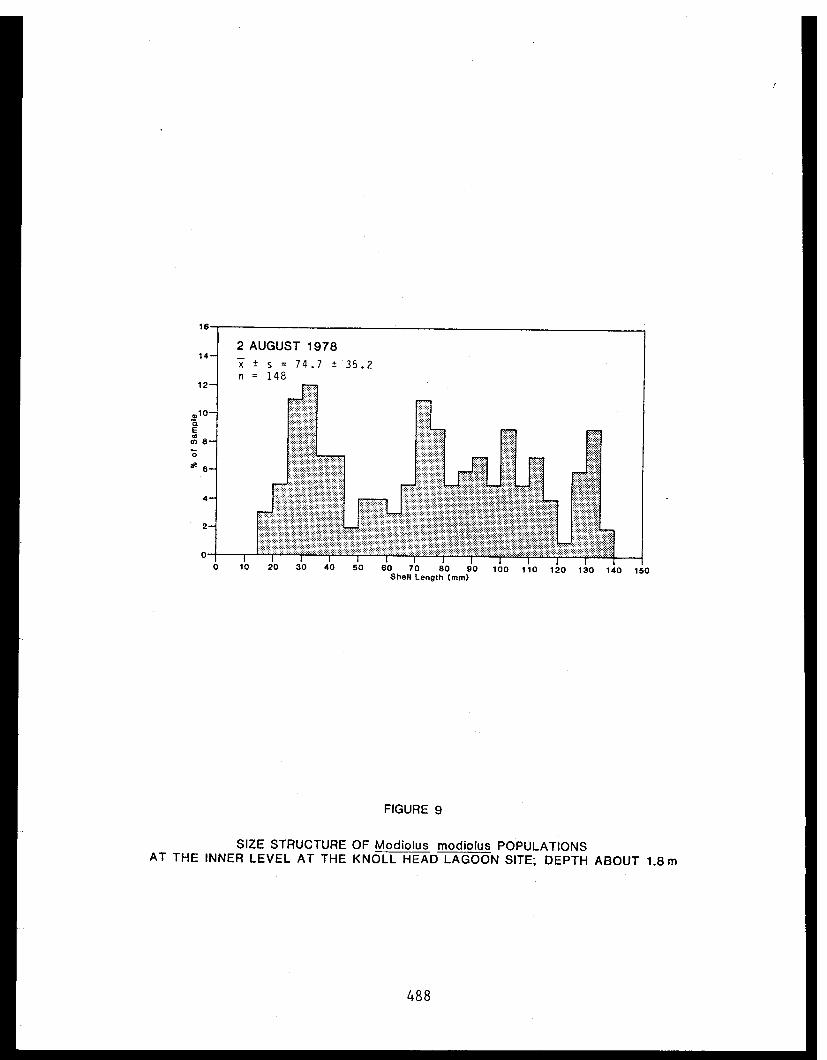
FIGURE 9
SIZE STRUCTURE OF Modiolus modiolus POPULATIONSAT THE INNER LEVEL AT THE KNOLL HEAD LAGOON SITE; DEPTH ABOUT 1.8m
488

consumed by starfish, leaving a conspicuous depression in the surrounding
mussel bed, and exposing the cobble matrix. Thus, it appears that the
epibiota and shell debris provide important protection against predation to
Modiolus, at least in certain circumstances. However, in areas such as
Archimandritof Shoals where surge action is a significant factor, shell
material is frequently sparse or lacking as it is resuspended and swept out
of the area by storms.
Although numerous actual or potential predators have been observed
or recognized, the observed effect of predators on Modiolus varied from
apparently low at Knoll Head to very intense at Jakolof Bay. At the latter,
its major predators were the starfish Pycnopodia helianthoides, Evasterias
troschelii and Orthasterias koehleri. The density relationships for these
starfish were 1.25:6.125:1.0, respectively, and their actual densities in
the channel approximated 0.20, 0.98, and 0.16 individuals/m² (Table 5).
Pycnopodia had the most varied diet, feeding on 13 different species; of the
157 individuals examined, about 12.7 percent were consuming Modiolus and 56.7
percent were not feeding (Figure 10). Evasterias fed on only 3 species; of
the 292 individuals examined, 20.9 percent were feeding on Modiolus and 75.7
percent were not feeding. Orthasterias fed on only 2 species; of the 42
individuals examined, 28.6 percent were feeding on Modiolus and 66.7 percent
were not feeding. Thus, of the 491 starfish examined, 19.0 percent were
feeding on Modiolus and 66.8 percent were not feeding at all (Figure 10).
Assuming a constant annual rate of consumption by all species, these
consumption ratios in the channel extrapolate to 0.025 mussels consumed/m²/-
day by Pycnopodia, 0.205 mussels consumed/m²/day by Evasterias, and 0.046
mussels consumed/ m[superscript]2 /day by Orthasterias, or 9.3, 74.8, and 16.8 mussels/m²/
year, respectively. This totals about 100 mussels consumed/m²/year, or
about 19 percent of the population per year. From these data, it appears
that Evasterias was the more important predator of the three from the view-
point of Modiolus.
We examined size data collected during this study for relationships be-
ween the size of a predator and its prey, and found that size is important.
489

FIGURE 10490 PREY ITEMS OF MAJOR STARFISH SPECIES AT JAKOLOF BAY
SEPTEMBER-NOVEMBER 1978
In all three species, the correlation was positive and significant (Figure
11). As individuals of the predatory species become larger, they select for
larger prey. However, these relationships do not appear to differ a great
deal among the species. In fact, the agreement among the dashed lines
describing the size-specific prey-size limitations for each predator is
remarkable (Figure 11).
Size distributions of the prey populations were compared with that of
the "source" population to examine prey selection strategies more closely.
Analysis with the Kolmogorov-Smirnov two-sample test indicated that the size
structures of all prey populations were significantly smaller than that
of the source population (Figure 12). The probability that the prey selected
by Pycnopodia and Evasterias represented a random selection from the source
population was low (P<0.01), and by Orthasterias, quite low (P<<0.001).
Nearly 50 percent of the mussels taken by Pycnopodia and Evasterias were
below 65 mm shell length, in contrast to over 78 percent by Orthasterias.
Over 70 percent of the prey were smaller than the average size for the source
population. The size distributions of prey captured by Pycnopodia and
Evasterias were not statistically distinct from each other (P>0.3), but
Orthasterias differed from both of them strongly (P<<0.001). These patterns
suggest that once Modiolus attains a certain size, it acquires a degree of
protection from predation, i.e., it has a refuge in size. However, this
"refuge" may be as much a result of probabilities as a matter of physical
limitations for the predator. The density of large predators and prey is low
and the probability encounter is thus low. Furthermore, it is obvious from
the data points in Figure 11 that large starfish do not restrict prey capture
to large prey.
This aspect of predation strategy has bearing on estimation of secondary
production for Modiolus. Specifically, these starfish crop about 20 percent
of the individuals in the prey populatations annually. However, because
selection is biased toward smaller prey, it is probable that somewhat less
than 20 percent of the biomass is removed. These estimates suggest a turn-
over time in excess of five years and secondary production of somewhat less
491
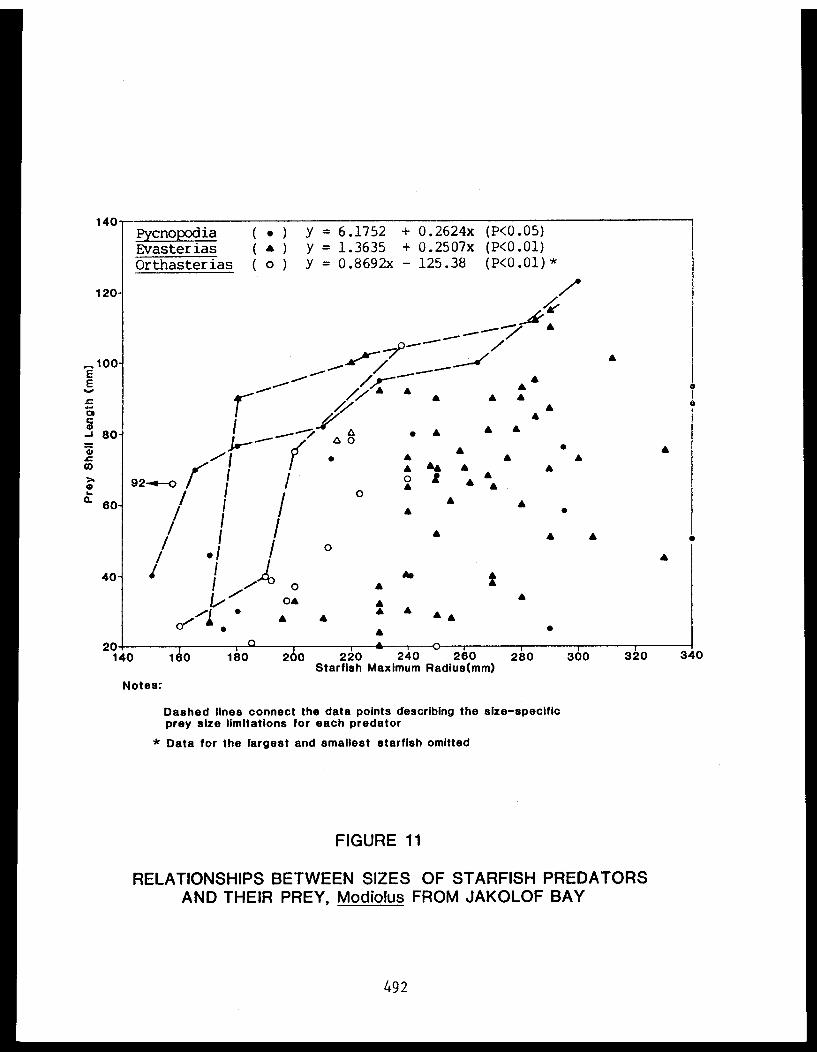
FIGURE 11
RELATIONSHIPS BETWEEN SIZES OF STARFISH PREDATORSAND THEIR PREY, Modiolus FROM JAKOLOF BAY
492

FIGURE 12
COMPARISONS OF SIZE DISTRIBUTIONS OF MODIOLUSSELECTED AS PREY BY STARFISH
TO THAT OF THE NATURAL SOURCE POPULATION AT JAKOLOF BAY
493
2.0 kg wet tissue/m/year. In addition, the population produces a subst-
antial quantity of gametes each year. In any event, however, the produc-
tivity: biomass ratio is probably considerably less than 0.5, despite the
high level of tissue productivity.
Other predators are known or suspected to exert significant pressure
on Modiolus populations in lower Cook Inlet. The starfish Leptasterias
polaris var. acervata is important on Archimandritof Shoals, at Bluff Point,
and on the west side of lower Cook Inlet. In some of these locations,
it replaces Evasterias. Common eiders, the largest of the sea ducks, feed
heavily on Mytilus, and flocks are commonly observed feeding in areas with
Modiolus beds. This includes Archimandritof Shoals in winter and spring,
and areas in Kamishak Bay during the winter, spring, and summer. Although
consumption has not been observed directly, eiders have been observed
feeding at the surface on mussels under conditions that would preclude taking
Mytilus; however, removal of adult Modiolus from a bed might be quite dif-
ficult. Potentially important predators include sea otters, dungeness and
king crabs, especially on the northern shelf of Kachemak Bay in late summer
and fall.
D. Feeding Observations on Benthic Invertebrates
During this study, we collected numerous feeding data. In addition,
we have summarized previously collected data as it pertains to the biotic
assemblages above. Computer printouts of this summary are presented as
appendices (Appendices J to M). Moreover, these data have been used to
construct a summary of the trophic structure for each of the major assem-
blages described bove (See Discussion).
A considerable amount of feeding data was collected for sea stars
because they are an abundant, important, conveniently observable predator.
Diets of eleven abundant starfish are compared in Table 12. Basically four
types of diets could be distinguished, namely, 1) sponge specialists, 2)
specialists on soft-bodied animals, 3) specialists on echinoderms, and
4) generalists. Group 1, comprising only Henricia spp, is controversial
494
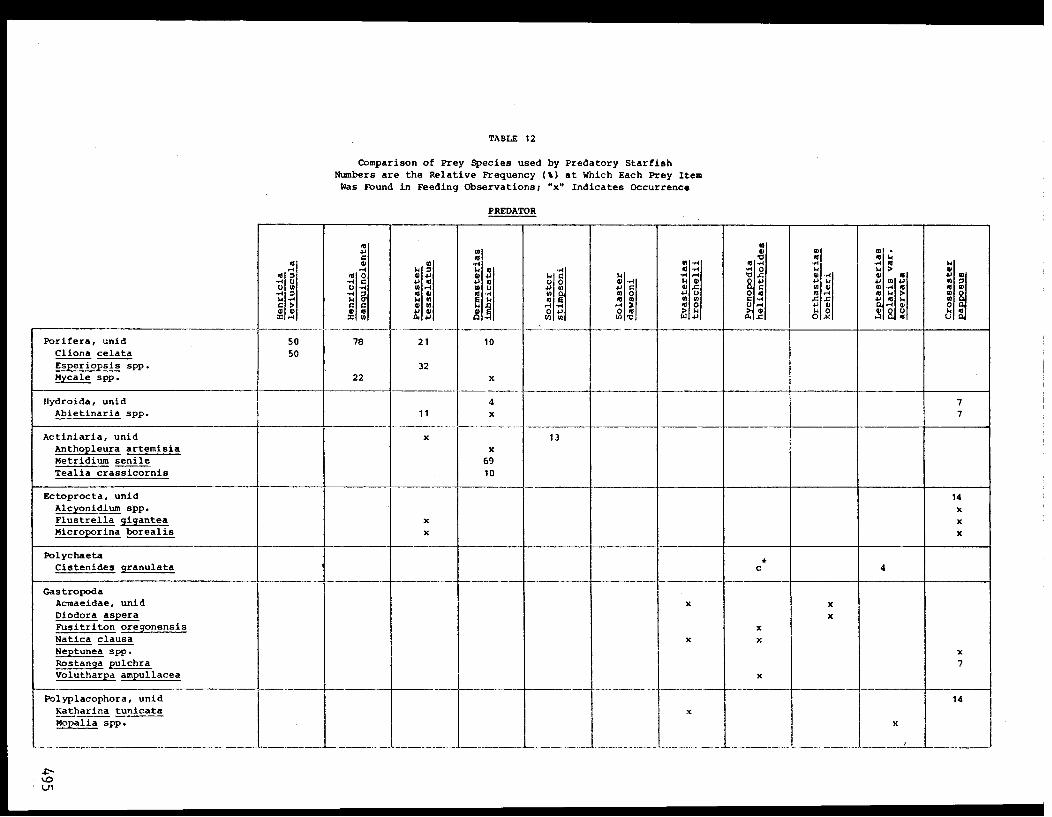
TABLE 12
Comparison of Prey Species used by Predatory StarfishNumbers are the Relative Frequency (%) at Which Each Prey Item
Was Found in Feeding Observations; "x" Indicates Occurrence
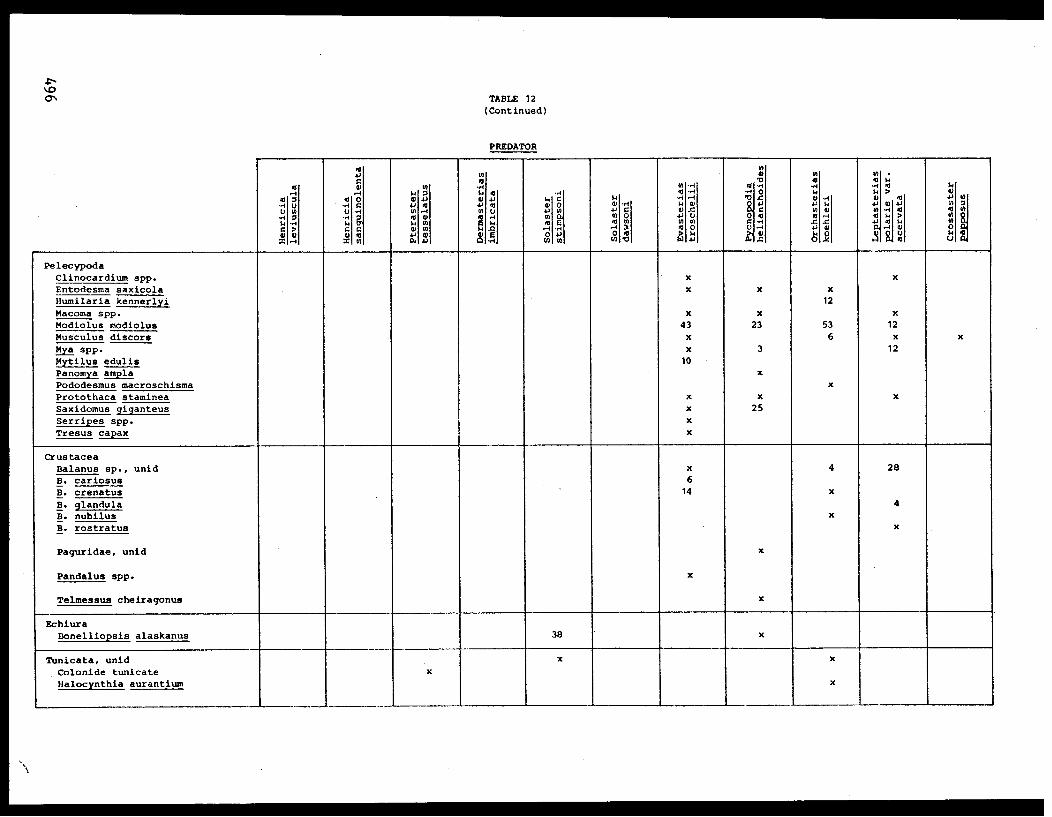
TABLE 12(Continued)
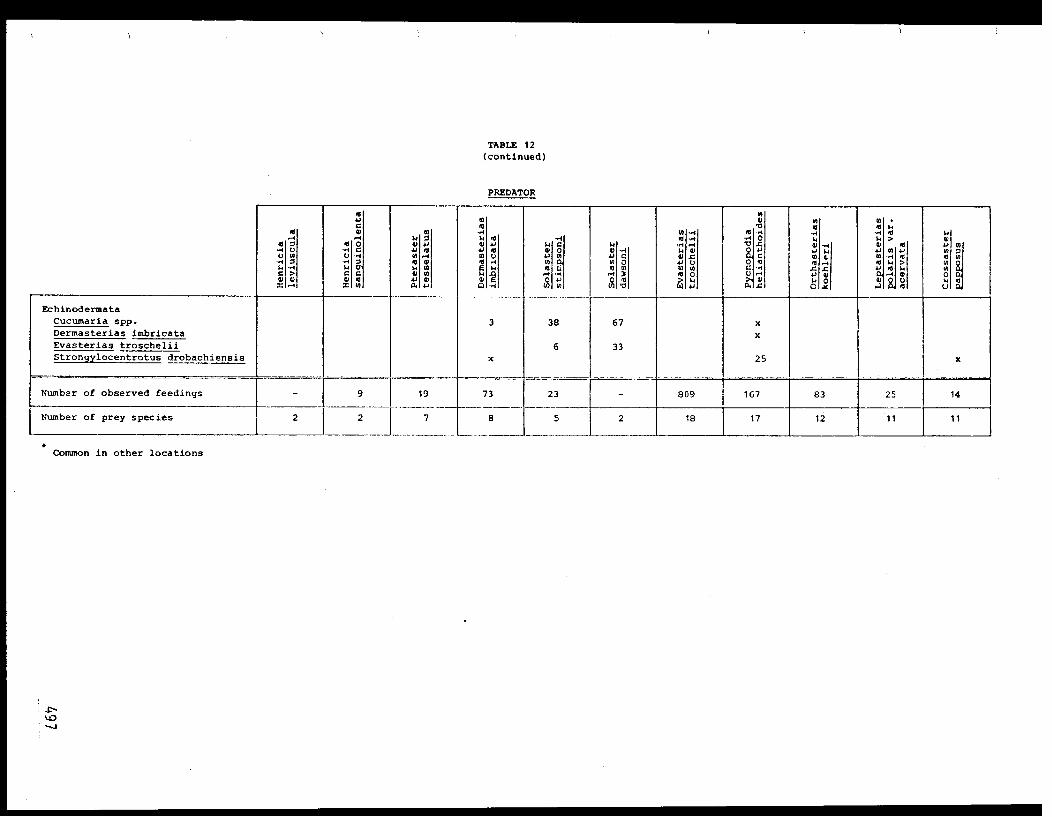
TABLE 12(continued)
because of its mode of feeding (Mauzey et al. 1968). Feeding observations
are based on visual assessment of damage to the sponge under a specimen of
Henricia; the surface of the sponges appeared bleached and damaged. In some
cases, the stomach of H. sanguinolenta was partially extruded. Attempts
to find spicules in the stomach were not successful, but it is possible
that spicules are not "ingested". Group 2, a loose collection, comprises
Pteraster and Dermasterias. The former appears to limit its prey to sponges,
cnidarians and bryozoans, whereas the latter feed on a broader variety of
taxa (Table 12; Rosenthal and Chess 1972). Group 3 was restricted to star-
fish of the genus Solaster; predation of this group on other echinoderms,
especially starfish and sea cucumbers, has been well documented (Mauzey
et al. 1968). Group 4 comprises Evasterias, Pycnopodia, Orthasterias,
Leptasterias polaris var. acervata, and Crossaster. All but the latter fed
on a broad variety of clams, snails and barnacles; only two fed on other
echinoderms or on tunicates, and only Crossaster fed on cnidarians or bryo-
zoans. Although the latter fed on a broad range of prey species, it exhi-
bited no strong preferences in choice. Most of its prey were not selected by
any other sea star. Therefore, although a generalist, it showed little
relationship to the other generalists.
An interesting trend in these groups is that Groups 1, 2, and 3 included
only members of the order Spinulosa whereas Group 4 included mainly members
of the order Forcipulata. Group 4 alone fed on clams and snails, both of
which include many community dominants and contribute substantially to
biomass.
The remaining data are considered most useful for indicating some of the
predator-prey interactions but should not be considered complete or repre-
observations and collections have been too biased.
E. SOFT SUBSTRATES
1. The Biological Assemblage at Mud Bay
Mud Bay in upper Kachemak Bay has a flat mud bottom lacking in any
surface relief except for sparsely scattered shell debris and small boulders.
498

These boulders were probably transported to the sea by ice rafting from
local drainages.
Reconnaissance dives were made at sites 1.5, 4.6, 6.1, and 10.7 m
below MLLW. Species composition of the assemblages observed in the three
deeper dives was generally similar (Table 13). Common epifaunal forms
included small specimens of the hermit crabs Labidochirus splendescens and
Pagurus capillatus, and larger crabs such as Telmessus cheiragonus and
Chionoecetes bairdi (young); juveniles of the sea pen Ptilosarcus gurneyi
were sparse. Common infaunal forms included suspension-feeding brittle stars
(?Amphiodia sp.), deeply buried but with erect, exposed arms, and small
tubicolus spionid and maldanid polychaetes. At 6.1 and 10.7 m, a large
assortment of the predatory snails (Oenopota spp.) was observed. Densities
of 2.5 and 9.0 individuals/m², respectively, were estimated for the two
sites. Small cottids and flatfish were present at densities of 0.1 and
0.2/m²Table 13); Appendix N).
The available hard substrate at three deeper stations was fairly well
covered by the barnacle Balanus rostratus alaskanus, the anemone Metridium
senile, and the serpulid polychaete Crucigera zygophora. Strongylocentrotus
drobachiensis was also common on these rocks. Plants were rare.
At a depth of about 1.5 m, large patches of Mytilus edulis were observed
Growing attached to the mussels were the algae Monostroma fuscum, Porphyra
sp., Spongomorpha, Desmarestia aculeata and Alaria taeniata. The sea stars
Evasterias troschelii, Leptasterias hexactis, and L. ?hylodes were also
present. This site was typical of the low intertidal zone in Mud Bay (Table
14).
2. The Biological Assemblage at Cottonwood Bay
At Cottonwood Bay, we examined a 1.2 km long transect through the low
intertidal and shallow subtidal zones to (0.6 to 2.5 m below MLLW) during a
high tide. The transect was divided into three sections, i.e., east of the
base camp, in front of the base camp and west of the base camp.
499
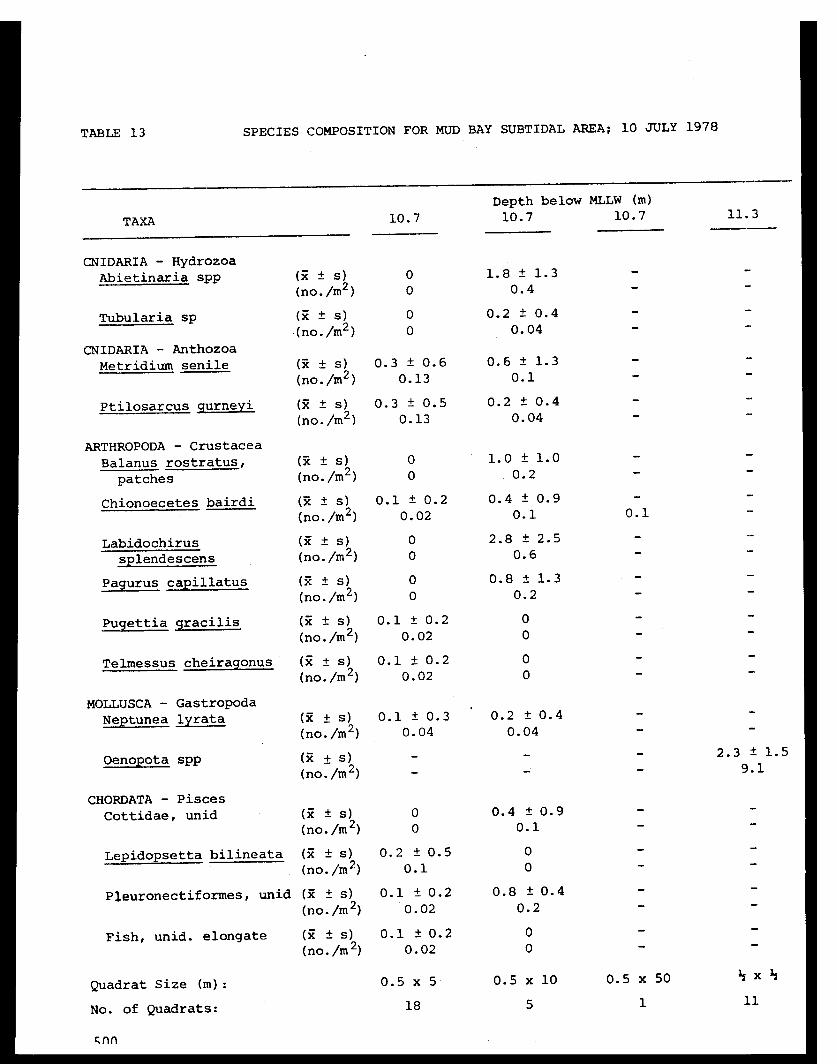
TABLE 13 SPECIES COMPOSITION FOR MUD BAY SUBTIDAL AREA; 10 JULY 1978
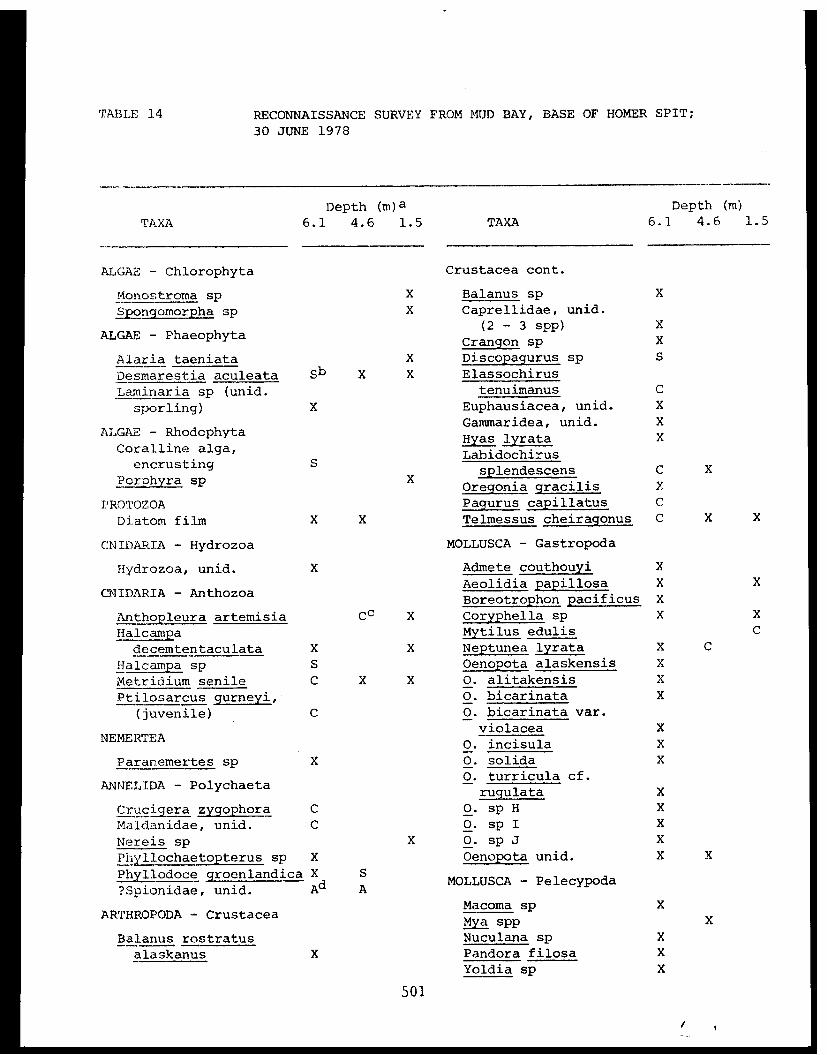
TABLE 14 RECONNAISSANCE SURVEY FROM MUD BAY, BASE OF HOMER SPIT;
30 JUNE 1978
501
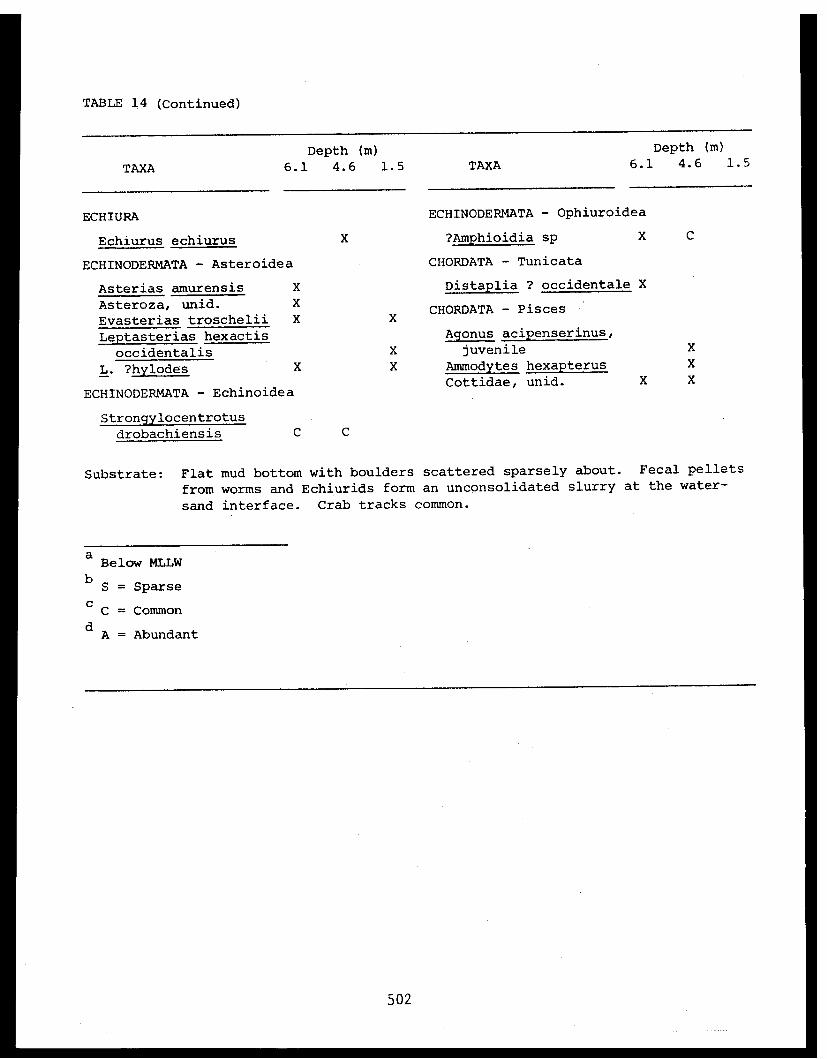
TABLE 14 (Continued)
502
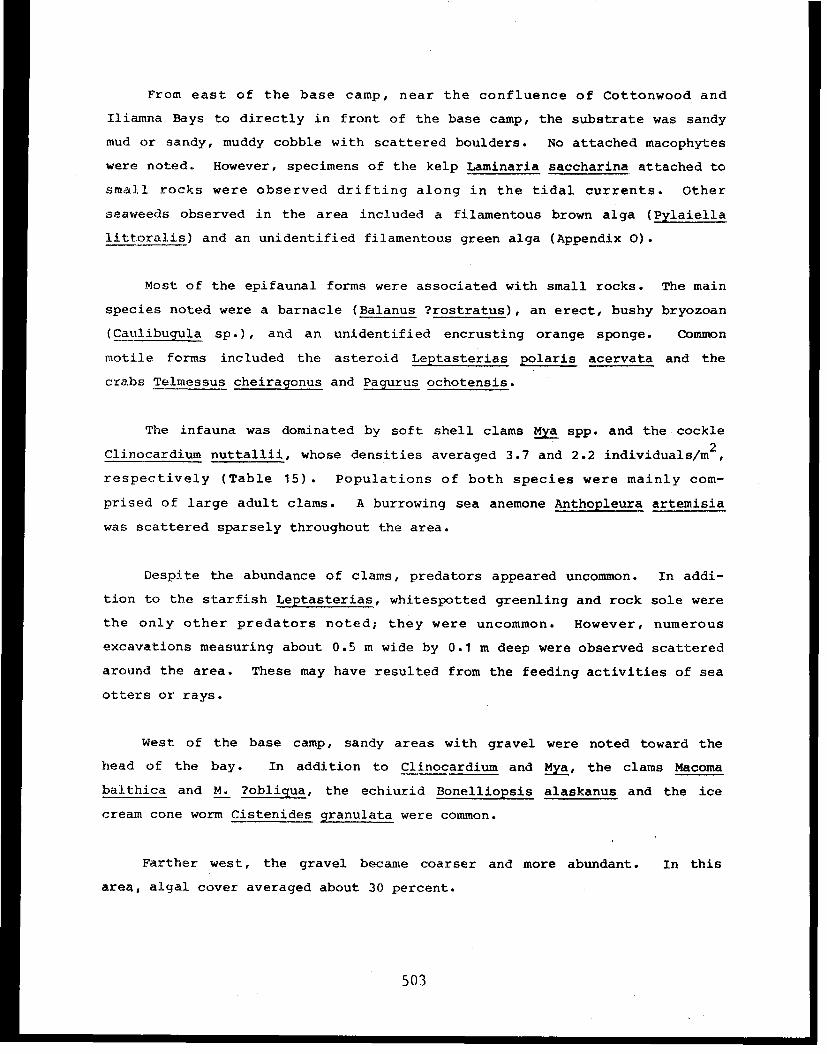
From east of the base camp, near the confluence of Cottonwood and
Iliamna Bays to directly in front of the base camp, the substrate was sandy
mud or sandy, muddy cobble with scattered boulders. No attached macophytes
were noted. However, specimens of the kelp Laminaria saccharina attached to
small rocks were observed drifting along in the tidal currents. Other
seaweeds observed in the area included a filamentous brown alga (Pylaiella
littoralis) and an unidentified filamentous green alga (Appendix O).
Most of the epifaunal forms were associated with small rocks. The main
species noted were a barnacle (Balanus ?rostratus), an erect, bushy bryozoan
(Caulibugula sp.), and an unidentified encrusting orange sponge. Common
motile forms included the asteroid Leptasterias polaris acervata and the
crabs Telmessus cheiragonus and Pagurus ochotensis.
The infauna was dominated by soft shell clams Mya spp. and the cockle
Clinocardium nuttallii, whose densities averaged 3.7 and 2.2 individuals/m²,
respectively (Table 15). Populations of both species were mainly com-
prised of large adult clams. A burrowing sea anemone Anthopleura artemisia
was scattered sparsely throughout the area.
Despite the abundance of clams, predators appeared uncommon. In addi-
tion to the starfish Leptasterias, whitespotted greenling and rock sole were
the only other predators noted; they were uncommon. However, numerous
excavations measuring about 0.5 m wide by 0.1 m deep were observed scattered
around the area. These may have resulted from the feeding activities of sea
otters or rays.
West of the base camp, sandy areas with gravel were noted toward the
head of the bay. In addition to Clinocardium and Mya, the clams Macoma
balthica and M. ?obliqua, the echiurid Bonelliopsis alaskanus and the ice
cream cone worm Cistenides granulata were common.
Farther west, the gravel became coarser and more abundant. In this
area, algal cover averaged about 30 percent.
503
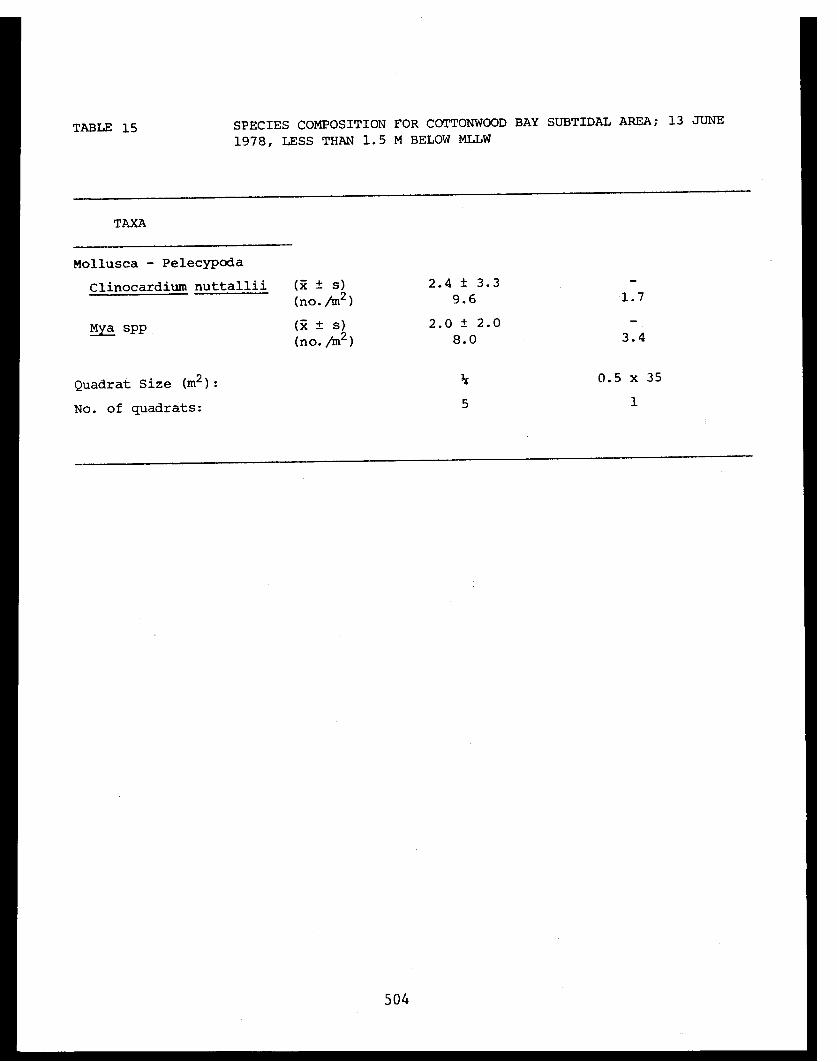
TABLE 15 SPECIES COMPOSITION FOR COTTONWOOD BAY SUBTIDAL AREA; 13 JUNE
1978, LESS THAN 1.5 M BELOW MLLW
504
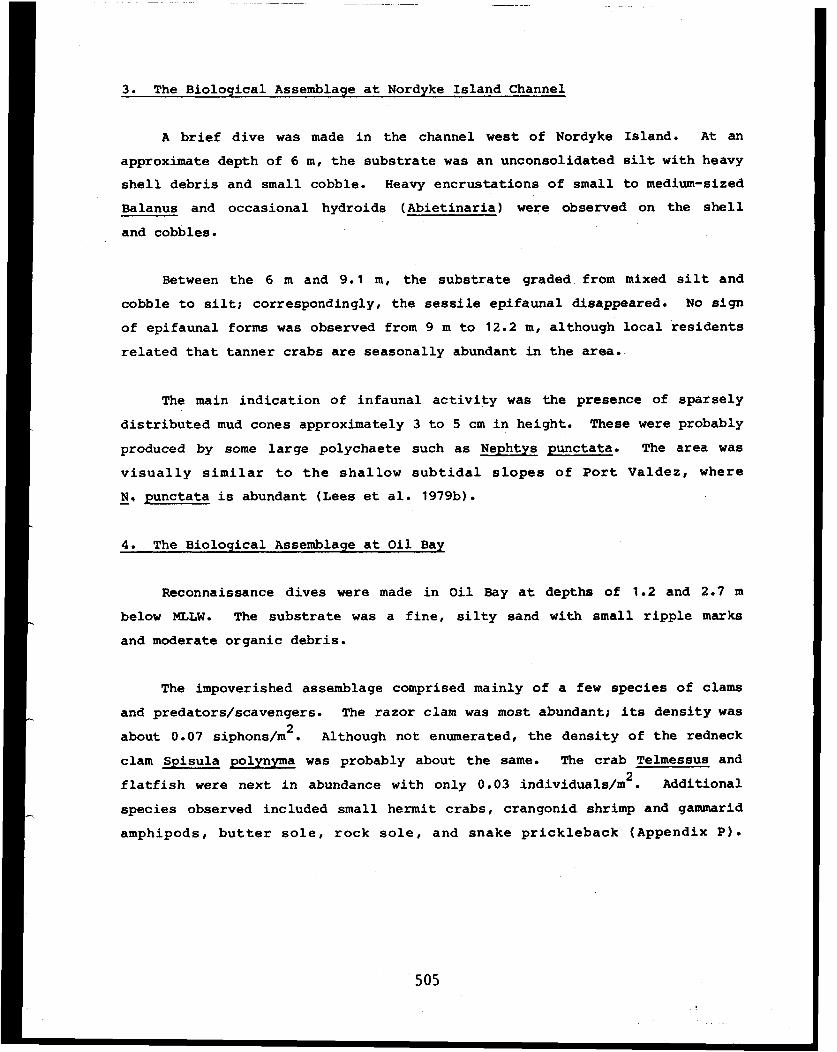
3. The Biological Assemblage at Nordyke Island Channel
A brief dive was made in the channel west of Nordyke Island. At an
approximate depth of 6 m, the substrate was an unconsolidated silt with heavy
shell debris and small cobble. Heavy encrustations of small to medium-sized
Balanus and occasional hydroids (Abietinaria) were observed on the shell
and cobbles.
Between the 6 m and 9.1 m, the substrate graded from mixed silt and
cobble to silt; correspondingly, the sessile epifaunal disappeared. No sign
of epifaunal forms was observed from 9 m to 12.2 m, although local residents
related that tanner crabs are seasonally abundant in the area.
The main indication of infaunal activity was the presence of sparsely
distributed mud cones approximately 3 to 5 cm in height. These were probably
produced by some large polychaete such as Nephtys punctata. The area was
visually similar to the shallow subtidal slopes of Port Valdez, where
N, punctata is abundant (Lees et al. 1979b).
4. The Biological Assemblage at Oil Bay
Reconnaissance dives were made in Oil Bay at depths of 1.2 and 2.7 m
below MLLW. The substrate was a fine, silty sand with small ripple marks
and moderate organic debris.
The impoverished assemblage comprised mainly of a few species of clams
and predators/scavengers. The razor clam was most abundant; its density was
about 0.07 siphons/m2. Although not enumerated, the density of the redneck
clam Spisula polynyma was probably about the same. The crab Telmessus and
flatfish were next in abundance with only 0.03 individuals/m2. Additional
species observed included small hermit crabs, crangonid shrimp and gammarid
amphipods, butter sole, rock sole, and snake prickleback (Appendix P).
505

VII. DISCUSSION
A. COMPARISON OF ASSEMBLAGES
The main habitat types examined included kelp and Modiolus beds on rocky
substrate. In several locations, such as Jakolof Bay, these assemblages
overlapped. Based on appearance and species composition, these assemblages
fall into three geographically distinct groups, namely, 1) southern Kachemak
Bay, 2) northern Kachemak Bay and 3) western Cook Inlet assemblages. Some
of the major species characterizing each assemblage are listed in Table 16
and their distribution patterns indicated. The three assemblages can be
distinguished on the basis of the composition and structure of both the
macrophyte and the epifaunal components.
The southern Kachemak Bay assemblage was characterized by consistent
development of a lush, fairly dense kelp bed consisting of both a canopy and
an understory, a low diversity, poorly-developed epifaunal component, and
a diverse, low-density predator/scavenger component (Table 16). Develop-
ment of the canopy usually did not extend past a depth of about 12 m but
the understory kelps extended past 21 m where appropriate substrate was
available. The canopy was formed by Alaria fistulosa in areas of high
current velocity and by Nereocystis in areas of lower velocity. Although
both Laminaria and Agarum were frequently mixed in the understory, Laminaria
was most successful in shallow, well-lighted situations and Agarum extended
out to greater depths; Laminaria was more common and better developed in
turbulent areas with good circulation.
The sedentary invertebrate component, mostly comprising suspension
feeders, was generally poorly developed. The only two commonly observed
species were the large fleshy bryozoan Flustrella gigantea and the butter
clam Saxidomus giganteus. Diversity was higher at the two sites more
exposed to tidal currents, but only at Jakolof Bay did the density or
standing stocks of suspension feeders approach that observed at Archi-
mandritof Shoals or Troublesome Creek. In fact, Jakolof Bay was a
506
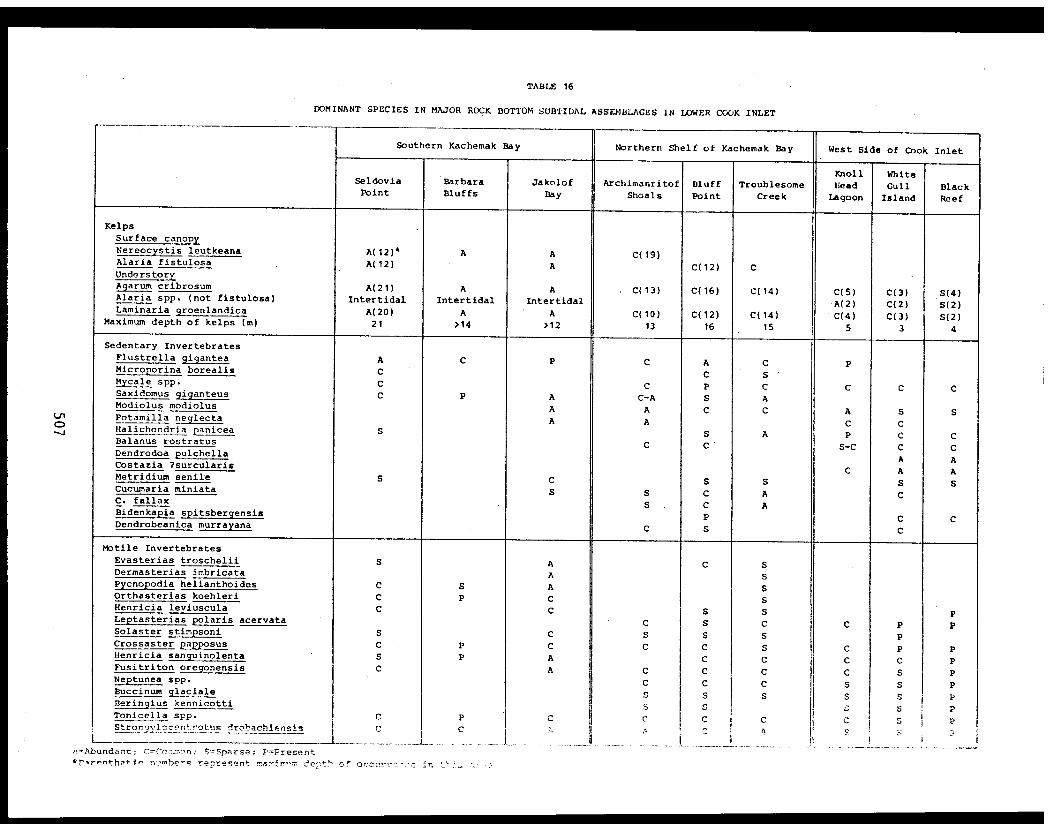
TABLE 16
DOMINANT SPECIES IN MAJOR ROCK BOTTOM SUBTIDAL ASSEMBLAGES IN LOWER COOK INLET
location where the kelp and Modiolus assemblages strongly overlapped.
However, although Modiolus and several other suspension feeders had extremely
robust populations, suspension-feeder diversity was not notably high.
The micrograzers Tonicella spp. and the macrograzer Strongylocentrotus
drobachiensis were generally common to abundant.
The predator/scavenger component of the southern Kachemak Bay assemblage
was generally diverse but, except at Jakolof Bay, exhibited low density.
Sea stars were the dominant motile predatory invertebrates. Twelve species
have been noted in southern Kachemak Bay; nine of these were common to
abundant in subtidal habitats. Sea star densities and standing stocks at
Jakolof Bay were among the highest observed in Cook Inlet or Prince William
Sound. Fusitriton oregonensis, the only large predatory snail present, was
generally common, but densities recorded at Jakolof Bay were quite high.
Fish assemblages were fairly well developed; species richness and abundance
were moderately high (Rosenthal and Lees 1979).
The northern Kachemak Bay assemblage was characterized by moderate
development of a kelp bed consisting of a very spotty, thin canopy and a
moderate understory, but well-developed assemblages of sedentary inverte-
brates and predator/scavengers (Table 16). Canopy development, seldom
extending past 10 m, was spatially patchy and temporally inconsistent.
Although understory kelps were observed out to 16 m, actual beds were gener-
ally not observed deeper than 12 m. Species composition and habitat char-
acteristics of the surface canopy and understory were the same as described
for the southern Kachemak Bay assemblage.
The sedentary invertebrate component, mostly comprising suspension
feeders, was generally well developed and highly robust; it had high diver-
sity and standing stocks. Species diversity and standing stocks were among
the highest seen, at least in Alaska. Some of the more important species
included Modiolus, Flustrella, Saxidomus, the sponge Mycale and the sea
cucumbers Cucumaria miniata and C. fallax. Several species, e.g., Modiolus,
508
Saxidomus, the sabellid worms Potamilla and Schizobranchia and C. miniata,
formed dense, compact beds of large size. Often these beds were a mixture of
two or more species. For instance, at several sites on Archimandritof
Shoals, the bottom was a carpet of Potamilla tubes overlaying a dense mixed
bed of Modiolus and Saxidomus. Other suspension feeders important at several
locations included the arborescent, calcified bryozoans Microporina borealis
and Dendrobeania murrayana, the sponge Halichondria panicea, and the barnacle
Balanus rostratus alaskanus. The development of this component at
Troublesome Creek was astounding, and could not be reflected accurately in
Table 16 because of the large number of unidentified species, especially
sponges, hydroids, tunicates and bryozoans, observed there.
The micrograzers Tonicella spp and the sea urchin S. drobachiensis, a
macrograzer, were generally quite abundant. It has been hypothesized that
the poor development of the algal assemblage is due in part to overgrazing,
particularly by sea urchins and, in part to low light levels resulting from
turbidity (Rosenthal and Lees 1976). The fact that most sea urchins are
exposed rather than cryptic indicates that the population is mainly browsing
on attached algae (Lees 1970). This condition probably results from a
relative undersupply of drift material.
The predator/scavenger component of this assemblage was diverse and
often, the density of these animals was high. Again, sea stars dominated the
component but snails and crustaceans were important. Although about fifteen
species of sea star were recorded from the northern shelf, only five were
considered common (Table 16). Most important among these seemed to be
Leptasterias polaris acervata, Crossaster and Henricia sanguinolenta.
Conspicuously sparse were Evasterias, Pycnopodia and Orthasterias. Important
predatory snails included Fusitriton, and Neptunea spp. Important crust-
aceans included the crabs Hyas, Oregonia and Pugettia and the hermit crabs
Pagurus ochotensis, P. beringanus, P. trigonocheirus, Elassochirus gilli and
E. tenuimanus. Furthermore, this is probably one of the more important
nursery areas for king crab in the southeastern quadrant (Sundberg and
Clausen 1977).
509
The western Cook Inlet assemblage was characterized by poor or no
development of a kelp bed assemblage, no surface canopy species, a diverse,
well-developed but thin veneer of sedentary invertebrates, and a moderately
developed predator/scavenger component (Table 16). The understory species,
Alaria praelonga, A. taeniata, Agarum and Laminaria, were observed to a
maximum depth of about 5 m, but were sufficiently dense to form beds only
to about 3 m. The depth limitation appeared to be imposed by turbidity
as suitable substrate was observed to a depth of 15 m in several loca-
tions. However, most rocky surfaces were covered with a moderate dusting of
sediments.
The sedentary invertebrate component, although diverse and covering a
large proportion of the available rock, generally formed only a thin veneer
over the surface. Standing stocks appeared low. The only exceptions were in
the few locations where Modiolus and Potamilla beds developed consider-
standing stocks (Table 11). Generally, these were not observed below a depth
of about 5 m, occurring in or just below the kelp understory. The most
important taxa below the kelp beds included the barnacle Balanus rostratus
alaskanus, several encrusting, digitate, and laminate bryozoan species,
several sponges, including Mycale and Halichondria, and some tunicates,
including the social form Dendrodoa pulchella and some species of Synoicum
(Table 16). The combination of the barnacles, encrusting digitate and
laminate bryozoans and the silt gave this asseblage a dirty, drab, jagged
appearance. Generally, encrusting forms such as bryozoans and tunicates were
absent in the kelp bed, probably as a consequence of scour by ice and algae.
The microherbivorous chitons Tonicella spp. and the macroherbivorous sea
urchin Strongylocentrotus drobachiensis, although frequently observed, were
generally less abundant than on the east side of the inlet. This is probably
a response to the small quantities of macrophytes available.
The predator/scavenger component of this assemblage was fairly diverse,
but densities of most species were low. Sea stars and snails were the most
important invertebrate taxa observed in this component. Of the eight species
510
of starfish observed, only three were common. These were Leptasterias
polaris acervata, Crossaster papposus and Henricia sanguinolenta; Solaster
stimpsoni and L. ?hylodes were observed frequently. Most of the sea star
species observed were brooders. Four species of predatory snail were ob-
served commonly but densities appeared low (Table 16). The fish assemblage
appeared poorly developed in rocky areas on the west side of the inlet; even
on habitat that appeared excellent, fish diversity and density was low
(Rosenthal and Lees 1979).
The strongest differences among these were between the Kachemak Bay
assemblages and the west side assemblage. Although many of the species
observed on the west side also were found in Kachemak Bay, especially
at Archimandritof Shoals and Bluff Point, the absence there of numerous
species dominant in Kachemak Bay and the abundance of numerous species more
characteristic of the Bering and Beaufort Seas acted to create a dramatically
different appearance. A comparison among the bryozoans reported for Point
Barrow and the three assemblages in lower Cook Inlet illustrates this simi-
larity (Table 17). In sharp contrast, the southern Kachemak Bay assemblage
includes 20 percent of the bryozoan species dominating at Point Barrow
whereas the west side assemblage includes over 65 percent. This is partic-
ularly important because most of thse species are erect forms, i.e., either
bushy, foliaceous, digitate or head-forming, and therefore contribute a great
deal more to biomass and habitat complexity than encrusting species.
Despite the contribution of bryozoans, the suspension-feeding component
was most strongly developed in Kachemak Bay, at Jakolof Bay and along the
northern shelf. In fact, these areas supported the most diverse, productive
suspension-feeding assemblages observed by the authors in the eastern
Pacific Ocean. Estimates of total standing stocks or production of suspen-
sion feeders have not been made, but would obviously be very high. However,
it is probable that standing stocks and productivity of suspension feeders
are higher on the west side than at Seldovia Point or Barabara Bluffs, and
probably in other typical kelp bed assemblages.
511
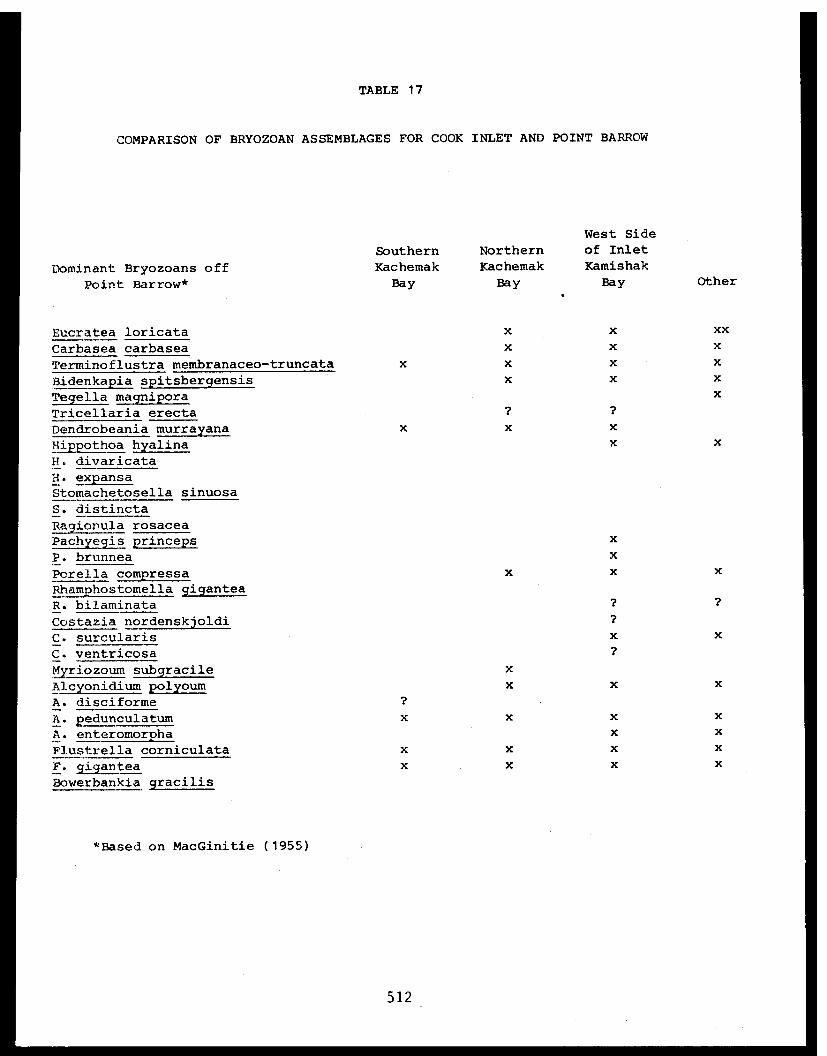
TABLE 17
COMPARISON OF BRYOZOAN ASSEMBLAGES FOR COOK INLET AND POINT BARROW
512

Development of the predator/scavenger components bears a direct corres-
pondence to development of the epifaunal component. Densities of a wide
variety of predator/scavengers were high at locations with well-developed
suspension-feeding components, i.e., Troublesome Creek and Jakolof Bay. A
strong qualitative difference in the sea star and snail fauna was obvious as
well. Most of the sea stars observed on the west side of the inlet are
thought to brood their eggs, rather than produce planktonic larvae. Nearly
all of these species were reported from Point Barrow (MacGinitie 1955).
Furthermore, only ten of the eighteen species found in Kachemak Bay were
observed on the west side of the inlet and five of the missing species are
dominant predators in some part of Kachemak Bay.
The conspicuous differences between development of the kelp assemblages
were also quite important. The presence of a surface canopy and extension
of the kelp assemblage down to at least 12 m in Kachemak Bay (vs. only 4 m
on the west side of the inlet) mean that, in addition to influencing the
appearance, primary productivity is much higher on rocky habitats in Kachemak
Bay than on the west side of the inlet.
B. BIOLOGY OF MODIOLUS
A comparison of the size-frequency histograms for Modiolus indicater
the occurrence of two general population types. Type 1 populations comprised
significant quantities of both young and old individuals and Type 2 popula-
tions were almost totally dominated by old animals. However, nearly all.
populations were strongly dominated by older adult animals and it appears
that, in contrast to the massive annual recruitment observed in Mytilus,
annual recruitment is generally small and unpredictable for Modiolus; a
population with a large proportion of juveniles was never observed. Size
(and age) structure and development of the population in terms of biomass and
density suggest that Type 1 populations are the most stable or viable, and
that the areas in which they occur are presently the most suitable for
Modiolus. The paucity of juveniles suggests that Type 2 populations are
senescent or predator-dominated.
513
The importance of Modiolus in lower Cook Inlet cannot be assessed
without better knowledge of its distribution. However, based on anecedotal
reports from several halibut fishermen and other scientists (Driskell and
Lees 1977; Bouma et al. 1978), Modiolus is common in 25 to 50 m of water on
the northern shelf of Kachemak Bay, along the east side of inlet between
Anchor Point and Ninilchik, and east of Chinitna Bay. Some of these areas
are favored by commercial halibut fishermen, implying that halibut aggre-
gate there. This is understandable if crustaceans are as common in deeper
Modiolus beds as was observed off Bluff Point; crustaceans constitute
a sizable proportion of the diet of halibut. Furthermore, migration "routes"
of king and tanner crabs seem to pass through several suspected or known
Modiolus beds in Kachemak Bay.
In any event, in terms of biomass and secondary production, Modiolus
must be among the most important species on subtidal rocky or mixed coarse
substrates. No other subtidal suspension feeder has been observed to contri-
bute as much to standing stocks over as large an area, or is suspected of
having such high productivity.
C. TROPHIC STRUCTURE OF INVERTEBRATE ASSEMBLAGES ON ROCKY SUBSTRATES IN
LOWER COOK INLET
A comparison of the generalized food webs constructed for the three
major shallow water rock bottom assemblages in lower Cook Inlet indicates
basic similarity but some important differences (Figures 13 and 14). The two
assemblages from Kachemak Bay, in particular, are quite similar. The main
differences are probably quantitative; kelp assemblages on the south side of
Kachemak Bay produce greater quantities of plant materials (Lees et al.
1979), thus contributing more energy to detrital reserves in other locations
(e.g., deep benthic assemblages, sand beaches or mud flats). On the other
hand, suspension-feeding and predator/scavenger components on the north side
of Kachemak Bay are better developed (Table 16; Rosenthal and Lees 1976;
Lees and Houghton 1977). Both assemblages contribute considerable quanti-
ties of plant, suspended and dissolved organic material to the consumer
514
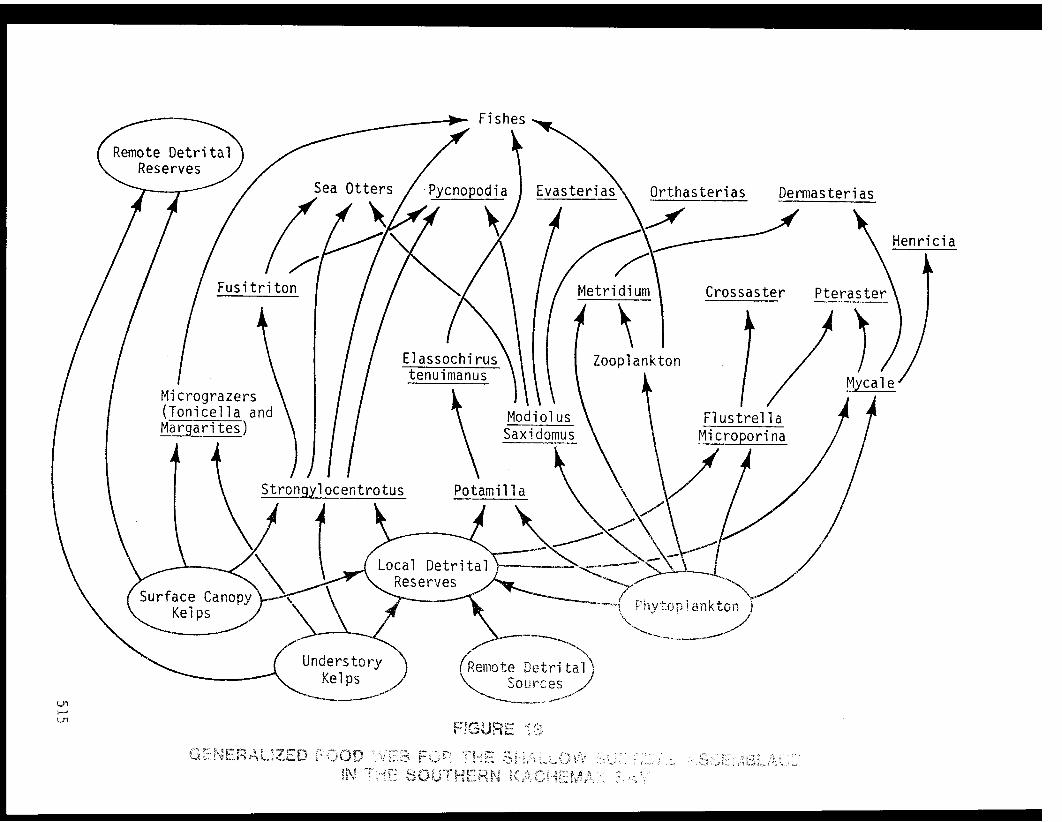
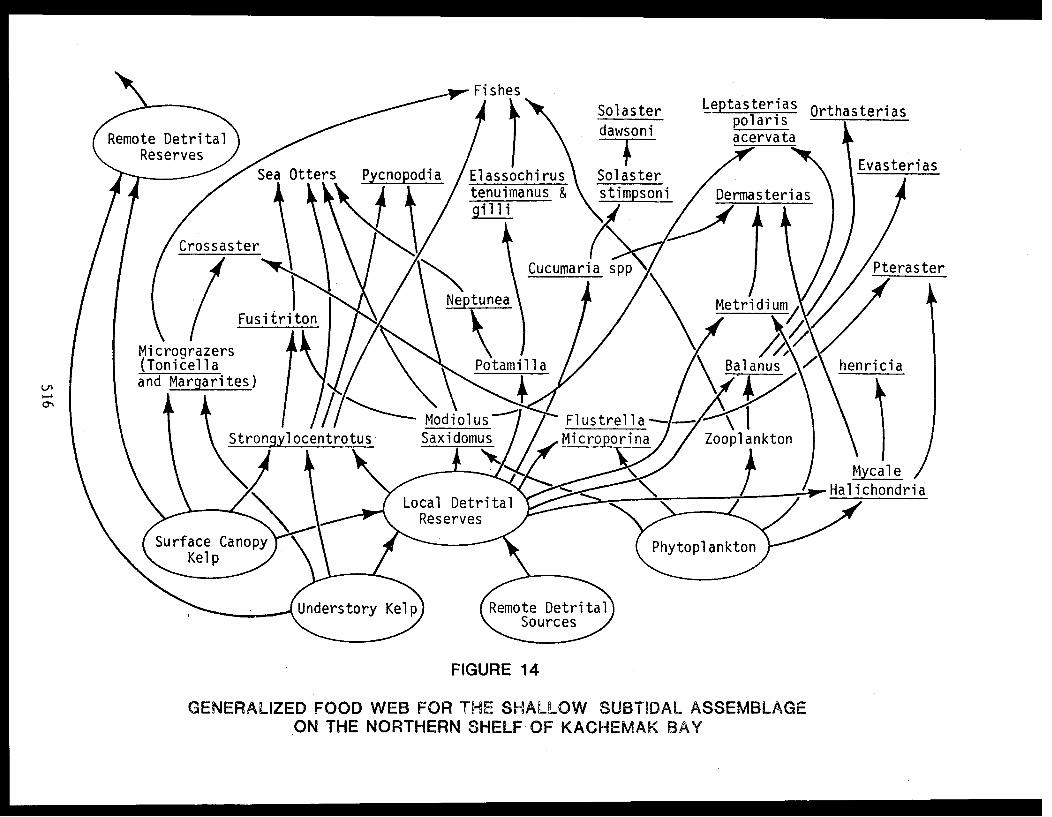
FIGURE 14
GENERALIZED FOOD WEB FOR THE SHALLOW SUBTIDAL ASSEMBLAGEON THE NORTHERN SHELF OF KACHEMAK BAY

organisms of lower Cook Inlet. In both cases, the suspension-feeding assem-
blage probably depends very heavily on organic materials of marine origin.
However, the proportion of terrigenous materials in the water mass is
probably substantially higher on the north side of Kachemak Bay. Because
prevailing currents and productivity patterns, the quantity of organic debris
available to suspension feeders is probably higher on the northern shelf than
on the southern side, except at sites like Jakolof Bay. Water passing
through Kachemak Bay picks up organic materials from the estuaries, rivers
and the high phytoplankton production in Kachemak Bay. It also picks up a
substantial quantity of suspended sediments in its progress through the bay.
These conditions promote microbial activity and flocculation. These waters
move rapidly across the northern shelf of the bay, providing great quantities
of suspended organic matter to the suspension feeders living there. The
differences in the development of kelp assemblages are also important in
explaining the differences in the development of the suspension-feeding
assemblages. The heavy growth of kelps along much of the south side of
Kachemak Bay substantially decreases the current velocity in the kelp beds;
this is particularly noticeable in the understory near the dense kelp bed
between Seldovia and Barabara Point where tidal currents are greatly reduced.
The effect of this on suspension feeders is to reduce the amount of food to
which they are exposed. This factor and the relative paucity of organic
matter in the impinging oceanic water mass are probably the major factors
responsible for the poor development of the suspension-feeding assemblage on
the south shore of Kachemak Bay. The extraordinary development of suspension
feeders at Jakolof Bay (>10 kg tissue/m²) is probably due to its proximity
to the rich, estuarine embayment, the strong tidal currents resulting from
the constricted entrance, and fact that the kelp bed is not large enough to
produce an effective reduction in current velocity. On the northern shelf,
however, current velocity is essentially unimpeded by the poorly-developed,
scattered kelp beds (personal observation). Thus, the nutrient-rich waters
leaving Kachemak Bay are more directly in contact with the suspension feeders
and exposure to food particles is greater.
Despite the basic similarity between the food web for the west side of
the inlet (Figure 15) and those for Kachemak Bay, some strong qualitative
517
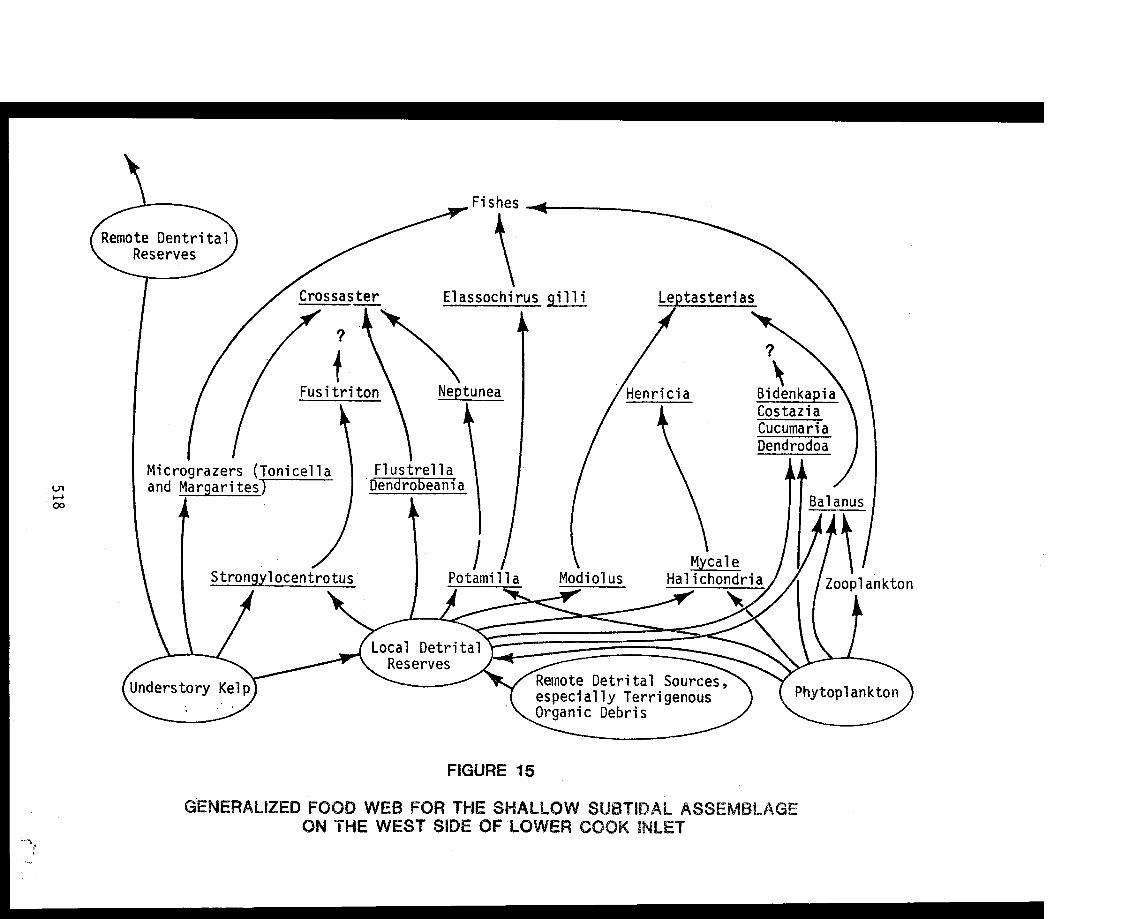
FIGURE 15
GENERALIZED FOOD WEB FOR THE SHALLOW SUBTIDAL ASSEMBLAGEON THE WEST SIDE OF LOWER COOK INLET
and quantitiative differences are apparent. The contribution of the kelp
assemblage to remote detrital reserves is much smaller; probably a greater
proportion of the available detrital material is terrigenous. This is a
consequence of the numerous rivers, especially the Susitna River, which also
contributes considerable fresh water to the water mass of Cook Inlet. Also,
based on the generally poor development and limited standing stocks of the
suspension-feeding assemblages observed on the west side of the inlet, the
quantity of available detritus is probably considerably smaller than on the
northern shelf in Kachemak Bay. Larrance and Chester (1979) reported that
phytoplankton contribution to the benthos was lower in Kamishak Bay.
Both density and species richness of predator/ scavenger component, including
fishes, are generally rather impoverished on rocky substrates.
The food webs exclude the relationships and effect of several important
groups within the various trophic levels because of inadequate information.
The effects of migratory crustaceans such as king and dungeness crabs have
not been considered because they have not been encountered in the study
areas. However, commercial fishing activities suggest that these species
pass through some of the areas examined, especially along the northern shelf
of Kachemak Bay. It is probable that they feed on at least some of the
dominant suspension feeders listed. Fishes have been considered by other
studies (Rosenthal and Lees, 1979; Blackburn, 1977) and so were omitted from
this discussion. However, it should be noted that fish on rocky habitats are
important consumers of crustaceans such as amphipods, isopods, shrimp, small
crabs and hermit crabs, and small snails (Rosenthal and Lees 1979). Marine
birds have also been examined in other projects and so have not been dis-
cussed in detail. Generally, diving birds are reported to concentrate on
small molluscs, crustaceans and fishes (Sanger, Jones, and Wiswar 1979, David
Erikson, personal communication, Paul Arneson, personal communication). Many
of the inshore birds feed on benthic forms of fish and crustaceans. Finally,
a number of the less conspicuous predators and scavengers have not been
examined or considered. The influence of micro-grazers such as limpets and
chitons is not clear in these habitats but may be substantial in the deter-
mination of algal development (Smith, 1968, Nelson-Smith, 1972). The in-
fluence of small predatory snails, crustaceans and polychaetes is unknown in
519
these habitats; because of their abundance, they could be very important as
predators on larval, juvenile or young forms of the dominant species, and
could be important to energy flow as well as species composition.
D. POTENTIAL FOR IMPACT FROM OCS OIL AND GAS EXPLORATION, DEVELOPMENT, AND
PRODUCTION
The susceptibility of the assemblages described above to deleterious
impacts from OCS oil and gas exploration, development, and production activi-
ties depends primarily upon the probability of exposure (i.e., the vulner-
ability of the assemblages), and the sensitivity of the assemblages and their
component organisms in the event that they are exposed to oil or dispersant
contamination. The probability of exposure has been predicted in oil spill
trajectory analyses for lower Cook Inlet conducted by Dames & Moore (1979).
Although some data are available for some of the species considered important
in the three main rocky subtidal assemblages, in fact, very little is known
directly and predictions must be based mainly upon the physical charac-
teristics of the habitats, apparent degree of development, productivity
and stability of the assemblages, and inferences of the sensitivity of
the organisms comprising the assemblages based on information for similar
species. The whole procedure is highly speculative.
1. Vulnerability to Exposure
Oil spill trajectory models indicate that shorelines with the greatest
risk of exposure in the event of an oil spill occur 1) between Iliamna Bay
and Chinitna Bay, on the west side of lower Cook Inlet, 2) between Dangerous
Cape and Cape Elizabeth, in Kennedy Entrance, 3) on the Barren Islands,
and, 4) on Shuyak Island, at the north end of the Kodiak Island archipelago
(Dames & Moore 1976; 1979). Exposure at these sites would generally occur
in one to three days of a spill, and the annual probability of exposure
generally is from 3 to 6 percent, assuming the occurrence of a single spill
per year for any one of the hypothetical spill sites. Additional areas of
concern are near Harriet Point, Anchor Point and on the NE quadrant of
520
Augustine Island. An important finding of the 1979 study was that the
trajectories contacted the Chugach Islands and Shuyak Island, and "suggest
the possibility of exposure on the eastern side of the Kenai Peninsula as
well as Kodiak Island" (Dames & Moore 1979).
Based on the tendency of spilled oil to attach to suspended sediment
particles (Kolpack 1971), turbidity patterns would cause a greater proportion
of the spilled oil to come into contact with the benthos in Kamishak Bay and
on the northern side of Kachemak Bay (NAS 1975). As a consequence, the
benthic assemblages on the west side of lower Cook Inlet have a greater
vulnerability to exposure than in Kachemak Bay, where the northern shelf
assemblages are at greatest risk. Although shoreline impact is predicted to
be critical in Kennedy Entrance and on the north shore of Shuyak Island, the
high degree of turbulence and generally great water clarity would tend to
minimize the amount and duration of contact.
2. Sensitivity to Oil
a. Southern Kachemak Bay Assemblage
The southern Kachemak Bay subtidal assemblage is dominated heavily by
kelps, which are generally quite tolerant to exposure to crude oils (Nelson-
Smith 1972; Smith 1968; Straughan 1972). Furthermore, Smith (1968) observed
that the kelp understory may impart some protection to the epifauna. The red
algae that do occur might be seriously effected, however, (Smith 1968).
Herbivores moderately abundant in this assemblage, are fairly sensitive to
oil exposure (Rice et al. 1979; Smith 1968; Nelson-Smith 1972). Thus, in the
event of a large spill, moderate damage to the herbivore component might
occur. The suspension-feeding and predator/scavenger components although
probably fairly sensitive to oil exposure, are generally poorly developed
except at Jakolof Bay. Thus, damage to the assemblage would be slight,
except at Jakolof Bay. At sites like Jakolof Bay, however, suspension-
feeding and predator/scavenger components are exceptionally well-developed
and complex and, although little is known about the sensitivity of the
521

species comprising the components, subtidal clams, starfish, and snails may
be moderately sensitive (Rice et al. 1979; Smith 1968; Nelson-Smith 1972)
and thus considerable damage could occur.
Recovery times in these systems would vary. The initial results in
a "standard" kelp bed, because of a reduction in grazing pressure and reduced
competition for space beetween suspension-feeders and kelps, would probably
lead to increased plant production. Although development of the herbivore
component in this assemblage is substantially less complex than in the one
described by North et al. (1964), recruitment appears to be slow in the
echinoid populations, which dominate many areas. Therefore, recovery of the
herbivore populations probably could require between five and ten years.
At sites like Jakolof Bay, where herbivore, suspension-feeding and
predator/scavenger components are well-developed, disruption and outright
damage might be extensive and recovery might require many years, especially
if dispersants were used. Damage to the herbivore component would result
in greater development of the kelp assemblage. Damage to the suspension-
feeding component also might result in greater development of the kelp
because of reduced consumption of spores, as suggested by North et al.
(1964), and increased availability of suitable substrate. Even if the
predator/scavenger component were not damaged directly by oil contamination,
it probably would be devastated by the loss of its prey resources, and its
recovery would depend upon the recovery of those components. Size structures
of several of the dominant species indicate that their populations are
dominated by adults, that successful recruitment is sporadic. Thus, recovery
would depend not only upon the time required for the habitat to recover to a
point at which the natural species could recolonize, but also upon the
occurrence of successful recruitment. This could be complicated if the
predator/scavenger populations are damaged less by oil than the suspension
feeders and herbivores.
We have recently observed the occurrence of an apparently analogous
situation in intertidal and shallow subtidal regions of Prince William
522
Sound. The Great Earthquake of 1964 uplifted large tracts of gravel/cobble
habitat and killed, in place, dense populations of large-sized clams (Baxter
1971). Thus, it is still possible to examine the density and size struc-
ture of the pre-quake populations. Densities and size structures of pre-
earthquake populations, examined in many uplifted areas during the summer of
1979, indicate that, although limited recruitment is occurring in these
areas, attainment of the previous high densities and large average shell size
has not occurred and may be strongly limited by the large populations of
mobile predators such as sea otters and sea stars which were not as severely
damaged by the earthquake. Although 15 years have passed since the Great
Earthquake, it appears that many more will pass before these populations have
recovered.
b. Northern Kachemak Bay Assemblage
The kelp component of the northern Kachemak Bay assemblage exhibits
moderate development whereas the suspension-feeding component is moderately
to highly developed. Herbivores, especially sea urchins, and predator/
scavengers are also common. Based on these patterns, it appears that a
large oil spill in this area could have a severe effect upon the appear-
ance and productivity of the assemblage. The kelp assemblage probably would
not be extensively harmed by exposure to either crude oil or dispersants.
However, the herbivore, suspension-feeder and predator/scavenger components
probably would exhibit moderate to severe damage. Because the overlying
waters in this area are characteristically somewhat turbid, a substantial
proportion of the oil entering the area would be adsorbed and enter the water
column; the turbulence characteristic of the area would then tend to bring
much of this oil into contact with that substrate and the benthic animals.
This is of special concern since this area appears to be an important nursery
area for king crab (Sundberg and Clausen 1977). Experiments by Rice et al.
(1979) suggest that some of these benthic forms such as king crab may be
moderately sensitive to damage from crude oil and that subtidal animals are
more sensitive than their intertidal counterparts. Crustaceans, which
constitute a large proportion of the predator/scavenger component of this
523

shelf, and, to a lesser extent, sea stars, appear quite sensitive to oil
contamination (Smith 1968; Rice et al. 1979; Nelson-Smith 1972; NAS 1975).
As a consequence of the damage to the herbivore and suspension-feeding
components, development of the kelp assemblage probably would improve
because of decreased competition for space and grazing pressure; thus
primary production might increase. However, the loss of the robust sus-
pension-feeding component probably would result in reduced secondary produc-
tion for a period of time.
Recovery time would probably be substantial. North et al. (1964)
reported that the subtidal epifaunal assemblage or a kelp bed was far from
recovery seven years after a catastrophic spill of diesel oil. Mann and
Clark (1978) estimated recovery of a bed assemblage kelp destroyed by sea
urchins off Nova Scotia would require at least ten to twenty years. Since
many of the important epifaunal animals live at least that many years, and
recruitment of many of them appears quite sporadic, it seems probable that
recovery from serious disruption might require at least ten to twenty years.
c. Assemblage from the West Side of Lower Cook Inlet
If the observation is true that a kelp understory provides some pro-
tection to the epifauna (Smith 1968), then the subtidal epifaunal assem-
blages on the west side of the inlet are structurally more exposed and
vulnerable than those in Kachemak Bay or in Kennedy Entrance because of the
sparseness or absence of the understory kelps. Only in the intertidal and
very shallow subtidal zone is the kelp assemblage present on the west side of
Cook Inlet. In those habitats, although the herbivore component generally is
poorly developed, kelp development is strongly limited by physical factors
such as ice scour and turbidity. The suspension-feeding component is moder-
ately developed in the subtidal zone, but composition and appearance differs
substantially between very shallow and somewhat deeper substrates. The very
shallow levels often support beds of Modiolus and the sabellid polychaete
Potamilla whereas the deeper areas are dominated by thin, jagged, drab
encrustations of barnacles, bryozoans, sponges, and tunicates. The moder-
ately developed predator/scavenger component is dominated by egg-brooding
524

sea stars. Sensitivity to oil for the suspension-feeding component at the
upper level probably is pretty similar to that predicted for Jakolof Bay,
but the amount of impact would be less in the event of a spill on the west
side of the inlet because of poorer development. Subtidally, the damage to
the suspension-feeding and predator/scavenger components probably would be
very great. Because of high turbidity year-round, a large proportion of
the oil entering the area following a spill would enter the water column
and come into contact with the epifauna. Furthermore, the trajectory models
indicate that this oil would not have aged appreciably and would thus still
contain a substantial proportion of the lighter, more toxic, fractions.
These assemblages lack the protection of a kelp understory and probably the
silt layer on the surface of the rocks and epifaunal crusts would become
contaminated with oil and oily particles, increasing the amount of contact
between the epifauna and oil. The effect of these oiled particles on these
types of suspension feeders is unknown, but, considering their feeding
mechanisms, they probably are quite sensitive and damage would be great. If
a dispersant were used in clean-up efforts, this might increase the damage to
the herbivore and predator-scavenger components because they are dominated by
echinoderms.
Recovery following a major spill would probably require at least 25
years. The assemblages are dominated by high arctic species, growth rates
are probably low and many of the species are brooders, implying that re-
colonization would require immigration by a benthic (rather than a plank-
tonic) stage. Recruitment for species with planktonic larvae (e.g., Modiolus
or the sea urchin) appears to range from fairly reliable to infrequent
and thus many of these species would recover only slowly.
3. Specific Activities or Developments
Exploration and development of an oil field involve several different
types of activities, installations, and potential perturbations. The major
potential impacts from these activities include: 1) acute oil spills,
2) effects from drill cuttings and muds, 3) effects of cooling systems,
525

4) chronic contamination from formation waters, refinery wastes or ballast-
treatment water, and 5) interference with fishing activities. The combina-
tion of potential impacts associated with each activity varies to a degree
from those of other activities. Therefore, activity-specific impacts for
most major activities are discussed below.
a. Drilling Platforms
The projected locations of exploratory drilling rigs in lower Cook Inlet
(Warren 1978) are indicated in Figure 16. All are located in Federal water a
moderate distance from all habitats and assemblages discussed in this report.
In view of the turbulent nature of lower Cook Inlet, the most pertinent
potential impact of drilling platforms would be from an acute oil spill.
Potential effects of an acute oil spill have been discussed generally for
Kennedy Entrance, Kachemak and Kamishak Bays in Section VII.D.2 above, but a
few additional remarks are applicable. The assemblages in Kennedy Entrance
and on the southern side of Kachemak Bay probably are quite similar; key
species are kelps, but suspension feeders may be considerably more important
in Kennedy Entrance. The assemblage on the northern shelf of Kachemak Bay is
intermediate between these and the assemblage described for the west side of
lower Cook Inlet; key species are kelps and suspension feeders, particularly
the horse mussel Modiolus and the sea cucumbers Cucumaria miniata and C.
fallax. This area has been designated a King Crab Sanctuary by the Alaska
Department of Fish and Game because of its apparent importance to larval
(Haynes 1977) and juvenile king crab (Sundberg and Clausen 1977). Key periods
of the year extend from March through September in these rocky habitats.
Kelp growth rates are highest from March through early June (Lees et al.
1979a). King crab enter the shallow habitats in February to molt and breed;
they remain for several months. Salmon fry move into the marine environment
in late April and early May; schools of fry are frequently observed in kelp
beds. Larval and juvenile king crab are common in Kachemak Bay in July and
August, particularly along the northern shelf between Bluff and Anchor Point
(Sundberg and Clausen 1977). Larval and juvenile stages of many of the
important epifaunal and infaunal species occur at peak densities from April
526

FIGURE 16 527
PROJECTED LOCATIONS OF EXPLORATORY DRILLING RIGSAND POTENTIAL SPILL LOCATIONS IN LOWER COOK INLET THROUGH 1979
(from Warren. 1978)
through August. Several of the demersal fish species, especially greenling,
"brood" their eggs in the shallow subtidal rock habitats until at least late
September. Large numbers of dungeness crab (Cancer magister) often forage in
Kachemak Bay in August and September and migrate out of Kachemak Bay across
the northern shelf of Kachemak Bay in September and October.
Several organisms perceived by regulatory or decision-making agencies
as "key" species occur periodically in the shallow subtidal rocky habitats;
most are somewhat migratory, i.e., they are motile and do not reside in
these habitats. Residence time of these migrants varies considerably.
However, a major reason they come to a particular area is to feed. The large
number and high abundance of the migratory species entering Kachemak Bay in
the spring and summer is an indication of its importance and the large amount
of food material available and concentrated here. Many of the food species
utilized by these migratory species must therefore be recognized as "key"
species, but the system is so diverse that it is still impractical to
approach this task definitively. Community dominants have been suggested
in Section VII.D.2, and further discussion would be repetitious.
b. Shore-based Facilities and Tanker Terminals
Potential new locations of shore-based facilities and tanker terminals
(Warren 1978) are indicated in Figure 17. They include a possible support
and supply facility at Homer, crude oil terminals and LNG plants in Kennedy
Entrance and at Anchor Point, and production treatment facilities in Kennedy
Entrance, at Anchor Point, and at Polly Creek, near Tuxedni Bay. No facili-
ties are projected south of Tuxedni Bay on the west side of Cook Inlet.
Thus, impacts from these potential facilities on shallow subtidal rocky
habitats would mainly occur in Kennedy Entrance, in Kachemak Bay, and near
Anchor Point.
The main impacts would arise from acute or chronic oil contamination.
Acute spills could occur at all facilities and from tanker accidents.
Chronic contamination could occur at the production treatment facilities
(disposal of production water) and at tanker terminals (disposal of ballast
water and numerous minor spills).
528
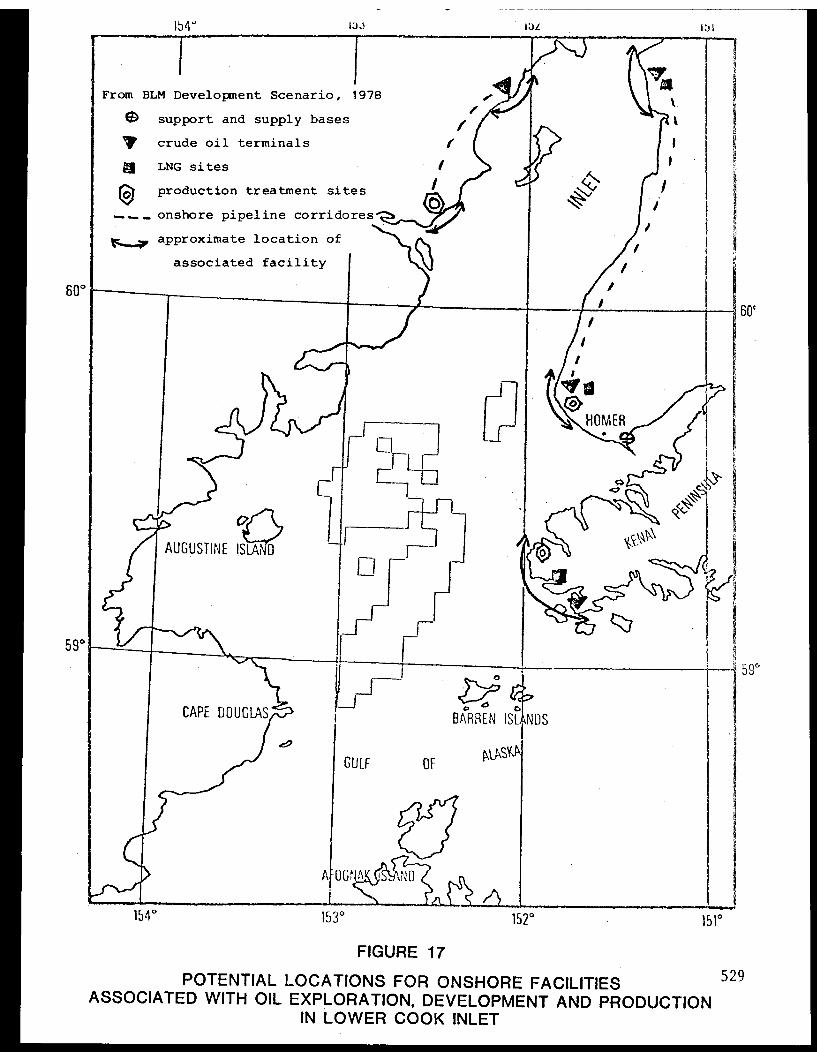
FIGURE 17
POTENTIAL LOCATIONS FOR ONSHORE FACILITIES 529ASSOCIATED WITH OIL EXPLORATION, DEVELOPMENT AND PRODUCTION
IN LOWER COOK INLET

Although the assemblages in Kennedy Entrance are probably somewhat
similar to these described for southern Kachemak Bay, descriptions of its
shallow subtidal rocky habitats are not adequate to permit a detailed
discussion (Lees 1977). Furthermore, these assemblages would probably be
rather distant from the facilities. It seems probable that routine winter
weather conditions would preclude safe, efficient tanker loading operations
in the open waters of Kennedy Entrance, and thus would dictate that such
facilities be located in its major embayments, i.e., Port Chatham, Koyuktolik
Bay, or Port Graham. Thus, the main concern to shallow rocky subtidal
assemblages would be acute oil spills, which were discussed in Section
VII.D.2. The extreme turbulence of this area would probably act to greatly
reduce the effects of either acute or chronic contamination by reducing
duration of contact and dilution.
Consequences of either acute or chronic contamination in the vicinity of
Anchor Point are of greater concern. Circulation studies indicate the
presence of a gyre system in northwestern Kachemak Bay, over the northern
shelf (Burbank 1977). Residence time of the water mass in this system is not
clear, but large concentrations of larvae (Haynes 1977) suggest that it also
could act to concentrate contaminants. As pointed out above, this area,
supporting the northern shelf assemblage, has been designated as a King Crab
Sanctuary and is part of the Kachemak Bay Critical Habitat area. Potential
effects of oil contamination have been discussed in Section VII.D.2.
c. Pipelines
Pipelines are a potential concern because of the activities associated
with laying the pipe and the possibility of breaks or small chronic leaks.
Possible pipeline corridors are indicated in Figure 18 (Warren 1978).
The only areas in which pipelines might affect shallow subtidal rocky
habitats are in Kennedy Entrance and at Anchor Point. Pipelines would have
to cross wide bands of rocky substrate in both locations (about 5 km and 10
km, respectively).
530

FIGURE 18 531POTENTIAL OFFSHORE PIPELINE CORRIDORS IN LOWER COOK INLET
(from Warren, 1978)
Activities associated with laying pipelines (blasting and dredging)
would be restricted to pipeline routes and thus would affect rather limited
areas.
A break in the pipeline would probably create an acute oil spill. The
severity of the spill would depend upon the proximity of the break to the
habitat and the amount of time required to stop the flow from the break.
If the break occurred in the rocky habitat, it probably would be more
damaging than a surface spill because the oil would be actively mixed with
water and sediment particles as it rose to the surface. This is a special
concern at Anchor Point because of the turbidity and the proximity to the
King Crab Sanctuary.
Because of the high degree of turbulence in both locations, small
chronic leaks in the pipeline would probably have no widespread effects
unless the pollutants were concentrated by the gyre system.
d. Other Concerns
Tanker routes and physical disturbance from boats or aircraft associated
with petroleum exploration and development are a concern to some other
habitats or vertebrate assemblages, or may interrupt existing activities.
However, tanker, boat and airplane activities constitute little threat to
conditions in the shallow subtidal habitats discussed in this report, except
as they involve access to the onshore facilities discussed above.
532
VIII. CONCLUSIONS
A. The three basic assemblages delimited in rocky, shallow subtidal
habitats in lower Cook Inlet were generally geographically distinct.
1. The southern Kachemak Bay assemblage was generally charac-
terized by a dense, well-developed, productive kelp component, a moderately
well-developed sparse to abundant herbivore component, and poorly to well-
developed suspension-feeding and predator/scavenger components. The kelp
component included a well-developed surface canopy of Alaria fistulosa and/or
Nereocystis luetkeana, and understory kelps extending deeper than 20 m.
Factors influencing species composition and structure probably include strong
tidal currents, and the oceanic characteristics of the water mass, i.e., the
low concentrations of suspended solids and detritus, and high variability in
suspended organic materials.
2. The northern Kachemak Bay assemblage was characterized by a
moderately well-developed kelp component, a moderately well-developed and
dense herbivore component, a moderate to massive development of the sus -
pension-feeding component, and a well-developed predator/scavenger component.
Surface canopies are patchy in time and space and understory kelps are common
only to about 15 m. Species composition of the predator/scavenger component
differs strongly on the northern and southern sides of Kachemak Bay. Factors
that influence species composition and structure probably include the strong
tidal currents, the moderate turbidity and dependable, abundant supply of
suspended organic materials, and the density of herbivores.
3. The western Cook Inlet assemblage was characterized by poor
development of the kelp component or its absence, a moderately diverse but
sparse herbivore component, a complex, but thinly developed suspension-
feeding component, and a poorly developed predator/scavenger component. The
kelp component lacks a surface canopy and extends only slightly below 3 m.
Factors influencing species composition and structure probably include ice
scour, high turbidity, low salinity, seasonal alteration in periods of
turbulence, sediment deposition and abrasion.
533

4. Rocky, shallow subtidal assemblages in Kachemak Bay (and
probably Kennedy Entrance) (the southeastern quadrant of lower Cook Inlet)
differ strongly from those observed in Kamishak Bay and at other locations
examined on the western side of lower Cook Inlet. Fundamental differences
are apparent in species composition, primary and secondary production, and
probably exist in the level of complexity development, i.e., the level of
succession attained.
5. Assemblages in the southeastern quadrant are closely allied to
others in the northeastern Pacific Ocean whereas assemblages on the western
side of lower Cook Inlet are more closely allied with assemblages described
for the Bering and Beaufort Seas. No evidence is available to indicate a
connection between the populations in lower Cook Inlet and the Bering Sea, so
it appears that this assemblage may be a relict of an earlier geological
period when sea level was appreciably higher.
6. The data base for Kennedy Entrance and the Barren Islands is
insufficient.
B. The large horse mussel, Modiolus modiolus, an important, widespread
suspension feeder on current-swept, cobble, gravel and bedrock, habitats
bathes with turbid water. It is often found in association with high den-
sities of several other suspension feeders.
1. Modiolus has been observed or reported in dense beds out to a
depth of at least 40 m on the northern shelf of Kachemak Bay, along the
eastern side of lower Cook Inlet between Anchor Point and Ninilchik, east of
Chinitna Bay, and in low intertidal and shallow subtidal rocky habitats in
northern Kamishak Bay out to a depth of about 5 m. A dense bed of Modiolus
was observed in the entrance to Jakolof Bay but otherwise appeared uncommon
on the southern side of Kachemak Bay.
2. Based on a comparison of size structures, the populations
sampled were separated into two categories, i.e., bimodal Type 1.populations,
534
in which large adults dominated but juvenile or younger animals were common,
and unimodal Type 2 populations, in which the population was limited to very
large adults. Type 2 populations were only observed on the northern shelf of
Kachemak Bay. In all populations, size structures indicated that recruitment
rates were slow.
3. The starfish Evasterias troschelii, Orthasterias koehleri
and Pycnopodia helianthoides appear to be the most important invertebrate
predators on Modiolus. In the Jakolof Bay bed, these three species probably
consume nearly 20 percent of the population. Although prey size is directly
correlated with predator size, effort is biased toward Modiolus smaller than
65 mm shell length; approximately half the animals consumed are below 65 mm
shell length whereas only about a third of the source population is below
this size.
4. Based on the feeding observations at Jakolof Bay, the
P:B ratio is somewhat less than 0.5, but production approaches 2 kg wet
tissue/year.
C. Starfish, among the most important invertebrate predators in lower
Cook Inlet, could be separated into three categories on the basis of food
selection.
1. Henricia spp. appeared to specialize on sponges, although the
validity of this observation is still somewhat questionable.
2. Pteraster and Dermasterias appeared to specialize on soft-
bodied forms such as sponges, cnidarians, bryozoans, and tunicates, although
Dermasterias is also known to feed on sea urchins.
3. Members of the genus Solaster fed on soft-bodied invertebrates
but concentrated on other echinoderms, especially other starfish and sea
cucumbers.
535
4. The last group, species with broad dietary selectivity,
included Evasterias, Pycnopodia, Orthasterias, Leptasterias polaris and
Crossaster. These species fed on a broad variety of mollusks and barnacles;
many of the prey items were community dominants.
5. Groups 1, 2, and 3 comprised only starfish from the order
Spinulosa whereas Group 4 comprised mainly forcipulate starfish.
D. The vulnerability of the shoreline to oil exposure in the event of
a catastrophic oil spill is highest on the west side of lower Cook Inlet,
especially from Chinitna Bay to Ursus Cove, intermediate on the northern
shelf of Kachemak Bay, and low on the southern side of Kachemak Bay, and
probably in Kennedy Entrance and on the Barren Islands; however, little
information is available for Kennedy Entrance and the Barren Islands.
1. The most highly sensitive faunal assemblages probably are
located on the northern shelf of Kachemak Bay and on the western side of
lower Cook Inlet. The richest assemblages were observed on the northern
shelf, and these assemblages would probably require the longest period of
time to recover from damage. Except at Jakolof Bay, the southern side
of Kachemak Bay was mainly dominated by kelp assemblages which have been
generally recognized as fairly tolerant to the effects of acute oil spills.
This situation is probably true in Kennedy Entrance and the Barren Islands.
2. Recovery of the shallow subtidal assemblages on rock habitats
might require from five to ten years at most sites on the southern side of
lower Cook Inlet to more than 20 years on the northern shelf of Kachemak Bay
and on the western side of lower Cook Inlet. Because of the possibility that
the latter assemblage is a relict, having a disjunct distribution from the
Bering Sea and includes many species without planktonic larvae, recovery
could require an extremely long time.
3. The main impact of concern from drilling platforms would be an
acute oil spill, which could affect all of lower Cook Inlet as described
536
above. The main impacts of concern from shore-based facilities and tanker
terminals are chronic and acute spills. In view of projected siting of such
facilities, the main areas of concern are in Kennedy Entrance, in Kachemak
Bay, and near Anchor Point. Because of the high degree of turbulence in
these locations, chronic contamination may be of little importance. The most
serious concern associated with underwater pipelines would be the possibility
of a break, which could constitute an acute spill, but be more severe because
of the release and subsequent mixture of large quantities of raw, unweathered
crude oil into the water column in locations where mixing would be great.
This could be extremely damaging to the benthic assemblages and planktonic
larvae on the northern shelf of Kachemak Bay, where the higher turbidity of
the water mass would increase the amount of oil retained in the water column.
537
IX. LITERATURE CITED
Baxter, R. E., 1971. Earthquake effects on clams of Prince William Sound.
In: The Great Alaska Earthquake of 1964: Biology. NAS Pub. 1604,Washington, D.C., National Academy of Sciences.
Blackburn, J. E., 1977. Pelagic and demersal fish assessment in the lower
Cook Inlet estuary system. Annual report from Alaksa Department of Fishand Game to NOAA, OCSEAP, 42 pp.
Boesch, D. F., C. F. Hershner, and J. H. Milgram, 1974. Oil spills and themarine environment. Ballinger Pub. Co., Cambridge, Mass.
Bouma, A. H., M. A. Hampton, M. L. Rappeport, P. G. Teleki, J. W. Whitney,R. C. Orlando, and M. E. Torresan, 1978. Movement of sandwaves in lowerCook Inlet, Alaska. Offshore Technology Conference, OTC 3311, 18 pp.
Burbank, D. C., 1977. Circulation studies in Kachemak Bay and Lower CookInlet, Vol. 3, pp. 207, In: Environmental Studies of Kachemak Bay andLower Cook Inlet (L. L. Trasky, L. B. Flagg, and D. C. Burbank, eds.),Alaska Department of Fish and Game, Anchorage, Alaska.
Bureau of Land Management, 1976. Final Environmental Impact Statement,Proposed 1976 Outer Continental Shelf Oil and Gas Lease Sale, Lower CookInlet, Vol. 1, 562 pp.
Cunning, A., 1977. Baseline study of beach drift composition in Lower CookInlet, Alaska, 1976, Vol. XI, pp. 32. In: Environmental Studies ofKachemak Bay and Lower Cook Inlet (L. L. Trasky, L. B. Flagg, and D. C.Burbank, eds.), Alaska Department of Fish and Game, Anchorage, Alaska.
Dames & Moore, 1976. Oil spill trajectory analysis, Lower Cook Inlet,Alaska, for NOAA, OCSEAP.
, 1979. Final Draft. Oil spill trajectory analysis, Lower CookInlet, Alaska, for Bering Sea-Gulf of Alaska Project Office, OCSEAP,NOAA, 42 pp., Appendices A-D.
Driskell, W. B., and D. Lees, 1977. Benthic reconnaissance of Kachemak Bay,
Alaska, Vol. VII, 102 pp. Environmental studies of Kachemak Bay andLower Cook Inlet (L. L. Trasky, L. B. Flagg, and D. C. Burbank, eds.),Alaska Department of Fish and Game, Anchorage, Alaska.
Erikson, D., 1977. Distribution, abundance, migration and breeding locations
of marine birds, Lower Cook Inlet, Alaska, 1976. Vol. VIII, 182 pp.
Environmental studies of Kachemak Bay and Lower Cook Inlet (L. L.Trasky, L. B. Flagg, and D. C. Burbank, eds.), Alaska Department of Fishand Game, Anchorage, Alaska.
Green, J., 1968. The biology of estuarine animals. Univ. of WashingtonPress, Seattle. 401 pp.
538
Haynes, E. B., 1977. Summary status on the distribution of king crab andpandolid shrimp larvae, Kachemak Bay-Lower Cook Inlet, Alaska, 1976,Vol. IV, 52 pp. In: Environmental Studies of Kachemak Bay and LowerCook Inlet (L. L. Trasky, L. B. Flagg, and D. C. Burbank, eds.), AlaskaDepartment of Fish and Game, Anchorage, Alaska.
Kaczynski, V. W., R. J. Feller, J. Clayton, and R. G. Gerke, 1973. Tropicanalysis of juvenile pink and churn salmon (Oncorhyrchus gorbuscha and0. keta in Puget Sound. J. Fish. Res. Bd. Canada 30:1003-1008.
Kolpack, R. L., 1971. Biological and oceanographical survey of the SantaBarbara Channel oil spill, 1969-1970. Vol. II. Physical, chemical andgeological studies. Allan Hancock Foundation, Univ. of So. Calif., LosAngeles, 477 pp.
Larrance, J. D., and A. J. Chester, 1979. Source, composition and flux oforganic detritus in lower Cook Inlet - Final report from Pac. Marine
Environmental Lab, NOAA for NOAA, OCSEAP, 50 pp., Appendix A.
Lees, Dennis C., 1970. The relationship between movement and available foodin the sea urchins Strongylocentrotus franciscanus and Strongylocen-trotus purpuratus. Master's thesis. San Diego State Univ.
, 1976. The epifaunal assemblage in the Phillips Petroleum leasesite off Spring Point, Chinitna Bay, Alaska. Dames & Moore final reportfor Phillips Petroleum Company, 42 pp.
, 1977. An ecological assessment of the littoral zone along theouter coast of the Kenai Peninsula. Dames & Moore final report forAlaska Department of Fish and Game, 101 pp.
, MS. Interactions between benthic assemblages and substrate inLower Cook Inlet, Alaska. In: U.S. Geol. Survey, Professional Paper,ed. A. Bouma.
Lees, D. C., W. D. Driskell, D. Erikson, and D. Boettcher, 1979. Intertidaland shallow subtidal habitats of Port Valdez. Final report prepared byDames & Moore for Alaska Petrochemical Co. 43 pp., Appendices 1-8.
Lees, D. C., and J. P. Houghton, 1977. Reconnaissance of the intertidal andshallow subtidal biotic assemblages in Lower Cook Inlet. Dames & Moorefinal report for Department of Commerce, NOAA, OCSAEP, 315 pp.
Lees, D. C., J. P. Houghton, D. Erikson, W. Driskell, and D. Boettcher, 1979.Ecological studies of intertidal and shallow subtidal habitats in LowerCook Inlet. Dames & Moore annual report for Department of Commerce,NOAA, OCSEAP. 261 pp.
MacGinitie, G. E., 1955. Distribution and ecology of the marine inver-tebrates of Point Barrow, Alaska. Smithsonian Misc. Collections, Vol128(9).
539
Mann, K. H., and R. B. Clark, 1978. Long-term effects of oil spills on
marine intertidal communities. J. Fish. Res. Bd. Canada 35:791-795.
Mauzey, K. P., C. Birkeland, and P. K. Dayton, 1968. Feeding behavior ofasteroids and escape responses of their prey in the Puget Sound Region.Ecology 49:603-619.
National Academy of Sciences, 1975. Petroleum in the Marine Environment,
Washington, D. C.
Nelson-Smith, A., 1972. Oil pollution and marine ecology. Elek Science,
London, England.
North, W. J., M. Neushul, and K. A. Clendenning, 1964. Successive biological
changes observed in a marine cove exposed to a large spillage of mineral
oil. Proc. Symp. Poll. Mar. Microorg. Prod. Petrol, Monaco:335.
Rice, S. D., A. Moles, T. L. Taylor, and J. F. Karinen, 1979. Sensitivity of
39 Alaskan marine species to Cook Inlet crude oil and No. 2 fuel oil,
pp. 549-554. Proc. 1979 oil spill conf. sponsored by API, EPA, USCG,
Los Angeles, March 19-22, 1979.
Rosenthal, R. J. and J. R. Chess, 1972. A predator-prey relationship between
the leather star, Dermasterias imbricata, and the purple sea urchin,Strongylocentrotus purpuratus. Fishery Bulletin 20:205-216.
Rosenthal, R. J., and D. C. Lees, 1976. Marine plant community studies,
Kachemak Bay, Alaska. Final report by Dames & Moore for Alaska
Department of Fish and Game, 288 pp.
, 1979. A preliminary assessment of composition and food webs for
demersal fish assemblages in several shallow subtidal habitats in lower
Cook Inlet, Alaska. Dames & Moore, for Alaska Department of Fish and
Game. 58 pp., Appendices I and II.
Sanger, G. A., R. D. Jones and D. W. Wiswar, 1979. The winter feeding habitsof selected species of marine birds in Kachemak Bay, Alaska. Annual
report of U.S. Fish and Wildlife Service to NOAA, OCSEAP, 35 pp.
Sibert, J., T. J. Brown, M. C. Healey, B. A. Kask, and R. J. Naiman, 1977.
Detritus-based food webs: Exploitation by juvenile churn salmon
(Oncorhynchus keta). Science 196:649-650.
Smith, J. (ed.), 1968. Torrey Canyon - Pollution and marine life. Report by
the Plymouth Laboratory of the Marine Biological Assoc. of the United
Kingdom. London, Cambridge Univ. Press, London, 196 pp.
Straughan, D., 1972. Factors causing environmental changes after an oil
spill. J. Petrol. Tech. (March):250-254.
540
Sundberg, K. A., and D. Clausen, 1977. Post-larval king crab (Paralithodes
kamtschatica) distribution and abundance in Kachemak Bay, Lower Cook
Inlet, Alaska, 1976, Vol. V, pp. 36. In: Environmental studies of
Kachemak Bay and Lower Cook Inlet (L. L. Trasky, L. B. Flagg, and D. C.
Burbank, eds.), Alaska Department of Fish and Game, Anchorage, Alaska.
Warren, T. C., 1968. Lower Cook Inlet OCS: Results of sale and scenario
of development, 19 pp. In: Environmental assessment of the Alaskan
Continental Shelf, proceedings of the Lower Cook Inlet synthesis
meeting, January 1978. U.S. Department of Commerce, NOAA, Boulder,
Colorado.
541
X. APPENDICES
542

APPENDIX A-1 COVER AND ABUNDANCE DATA FOR ARCHIMANDRITOF SHOALS; 28 JUNE 1978.
¼ M² SQUARE QUADRATS FROM 4.6 M BELOW MLLW
543
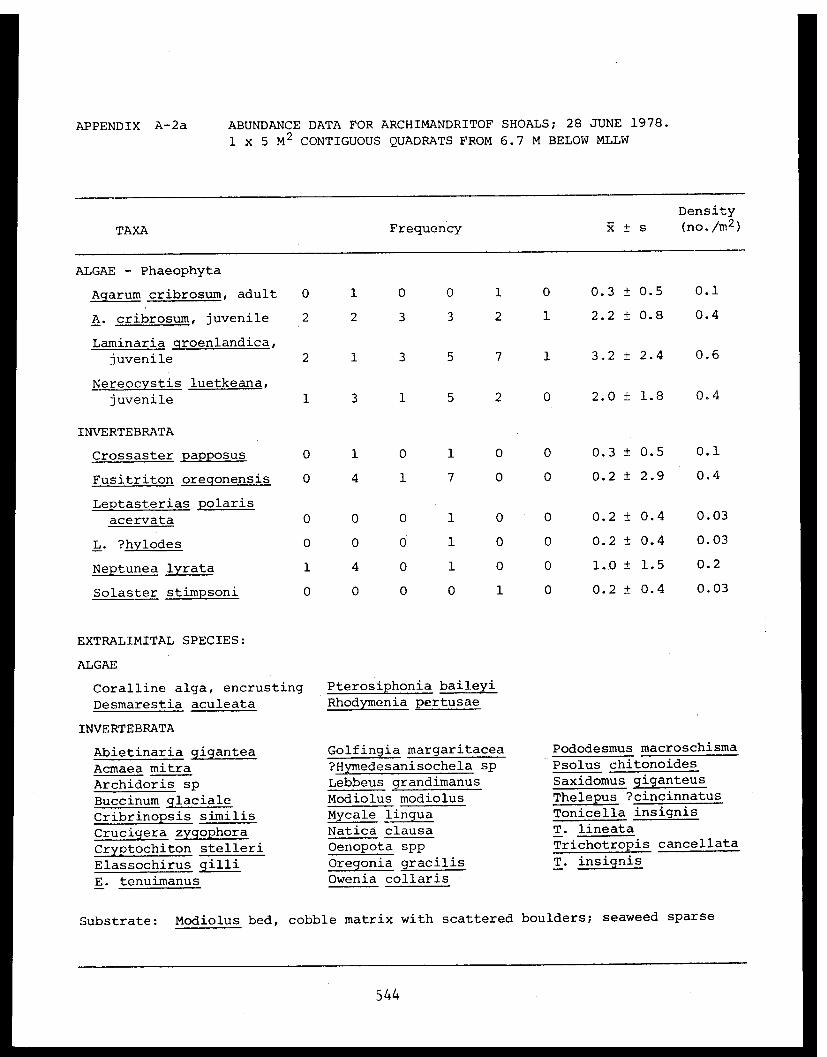
APPENDIX A-2a ABUNDANCE DATA FOR ARCHIMANDRITOF SHOALS; 28 JUNE 1978.
1 x 5 M 2 CONTIGUOUS QUADRATS FROM 6.7 M BELOW MLLW
544
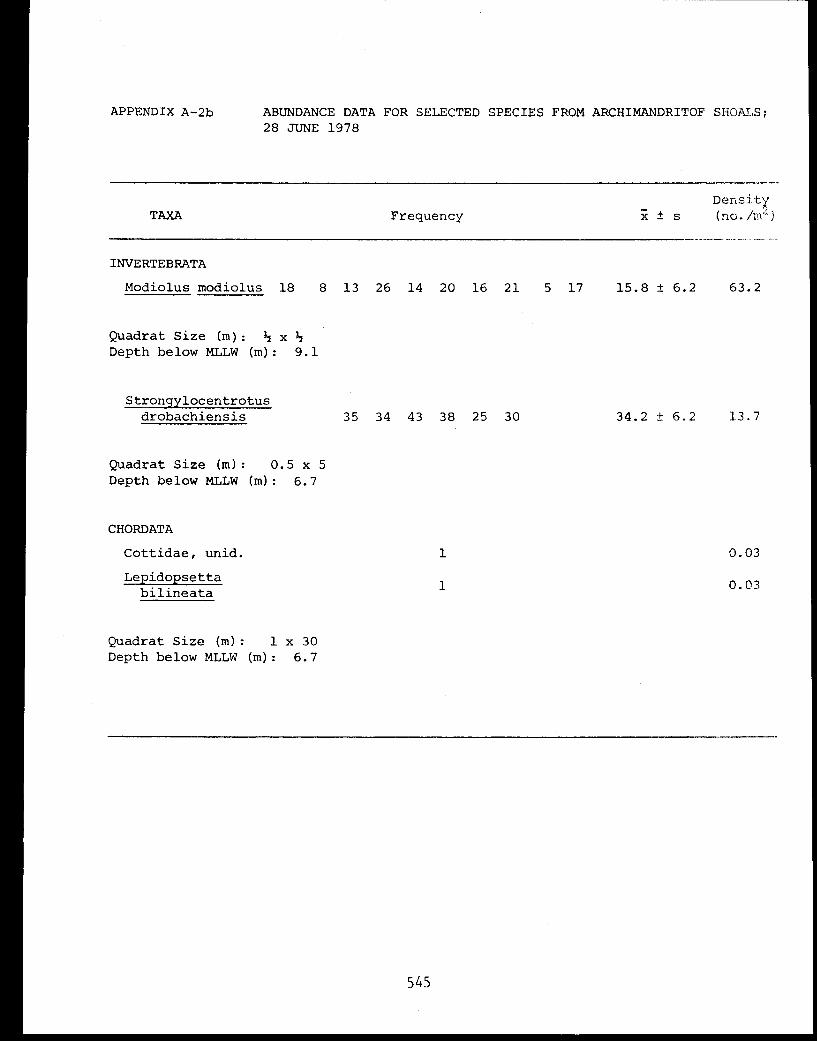
APPENDIX A-2b ABUNDANCE DATA FOR SELECTED SPECIES FROM ARCHIMANDRITOF SHOALS;28 JUNE 1978
545
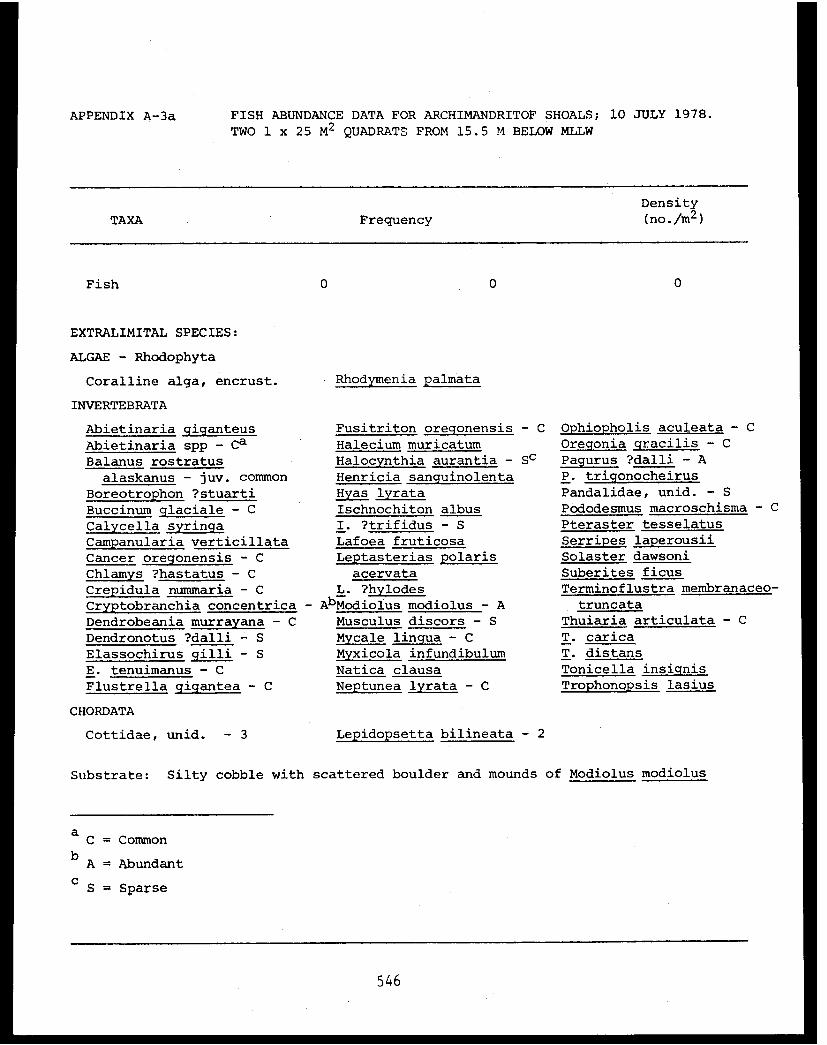
APPENDIX A-3a FISH ABUNDANCE DATA FOR ARCHIMANDRITOF SHOALS; 10 JULY 1978.
TWO 1 x 25 M² QUADRATS FROM 15.5 M BELOW MLLW
546

APPENDIX A-3b ABUNDANCE DATA FOR MODIOLUS MODIOLUS FROM ARCHIMANDRITOF SHOALS;10 JULY 1978. ¼ M² SQUARE QUADRATS FROM 15.5 M BELOW MLLW
547
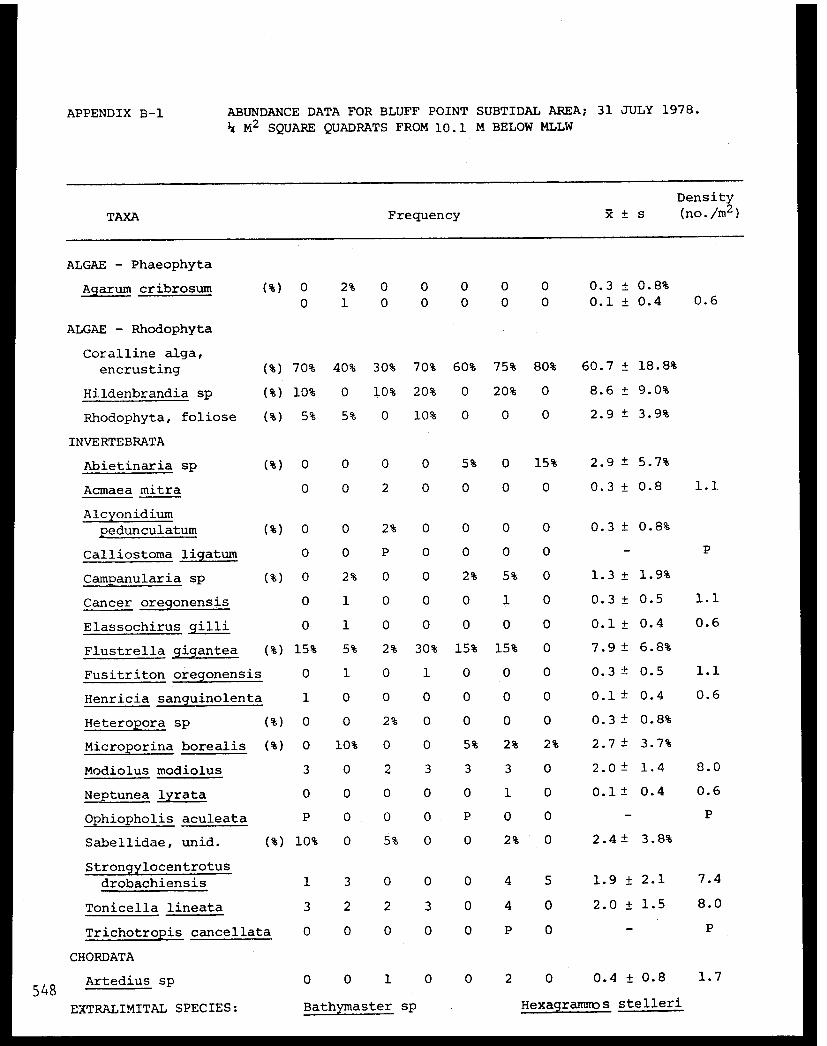
APPENDIX B-1 ABUNDANCE DATA FOR BLUFF POINT SUBTIDAL AREA; 31 JULY 1978.
¼ M² SQUARE QUADRATS FROM 10.1 M BELOW MLLW
548
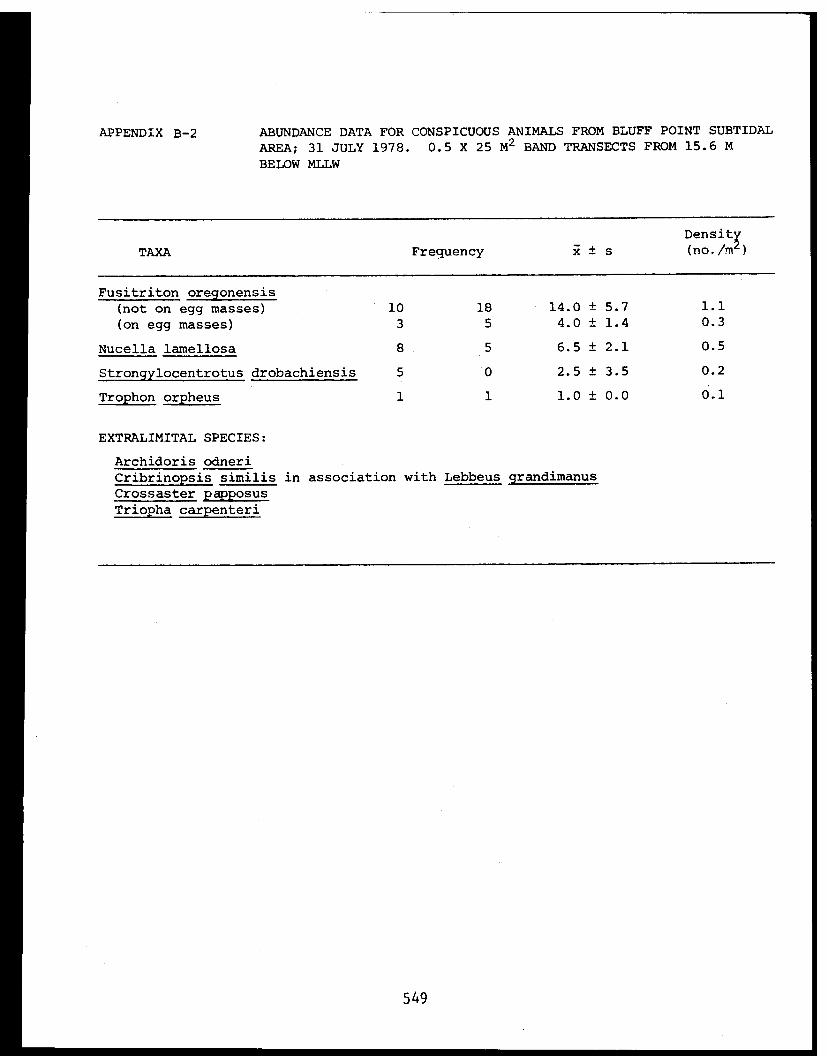
APPENDIX B-2 ABUNDANCE DATA FOR CONSPICUOUS ANIMALS FROM BLUFF POINT SUBTIDAL
AREA; 31 JULY 1978. 0.5 X 25 M 2 BAND TRANSECTS FROM 15.6 M
BELOW MLLW
549
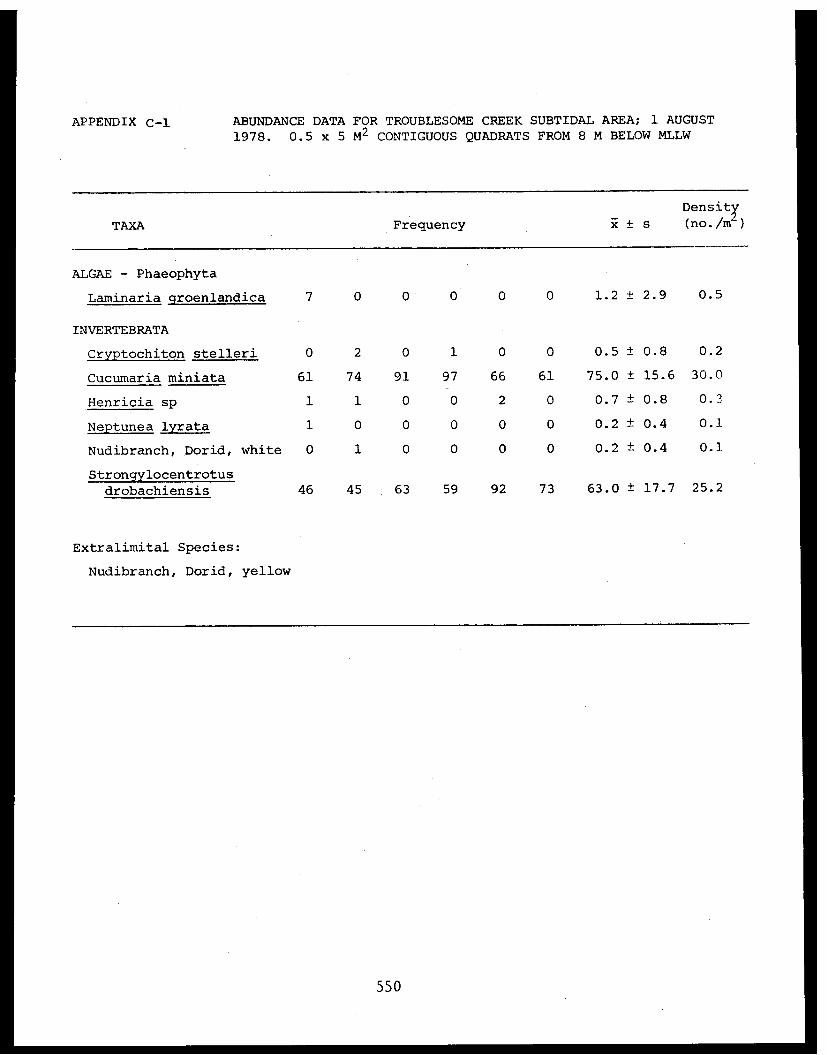
APPENDIX C-1 ABUNDANCE DATA FOR TROUBLESOME CREEK SUBTIDAL AREA; 1 AUGUST
1978. 0.5 x 5 M² CONTIGUOUS QUADRATS FROM 8 M BELOW MLLW
550
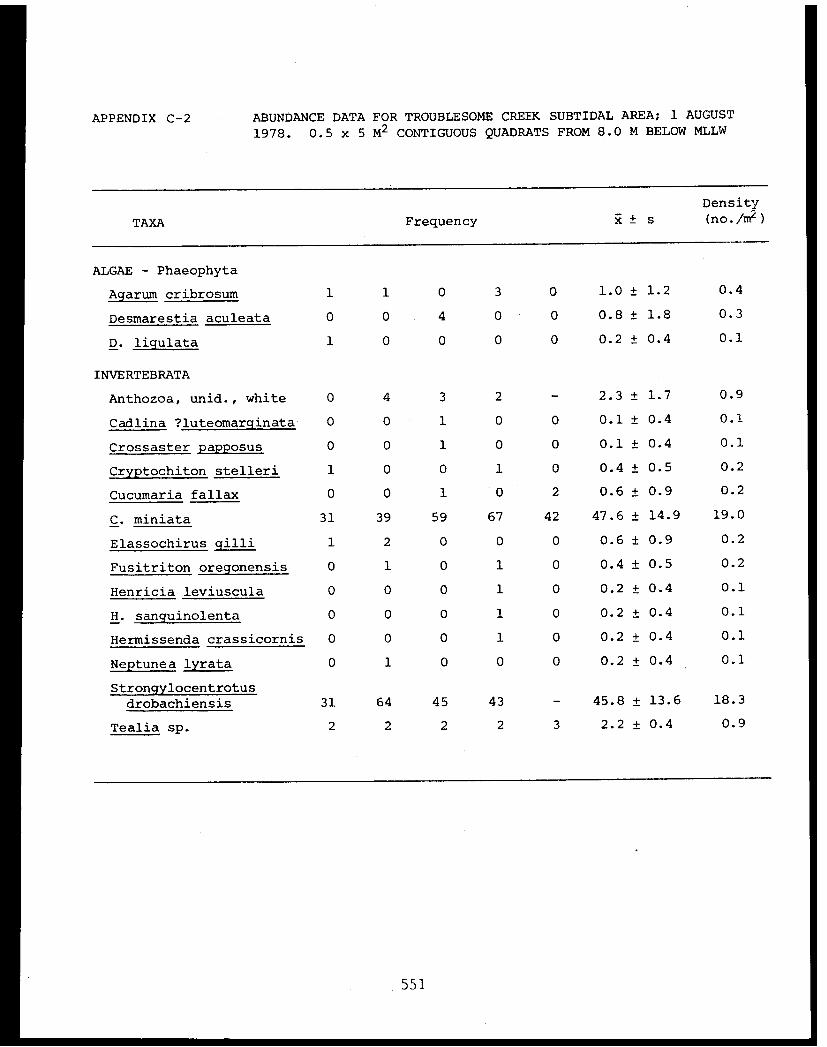
APPENDIX C-2 ABUNDANCE DATA FOR TROUBLESOME CREEK SUBTIDAL AREA; 1 AUGUST
1978. 0.5 x 5 M² CONTIGUOUS QUADRATS FROM 8.0 M BELOW MLLW
551
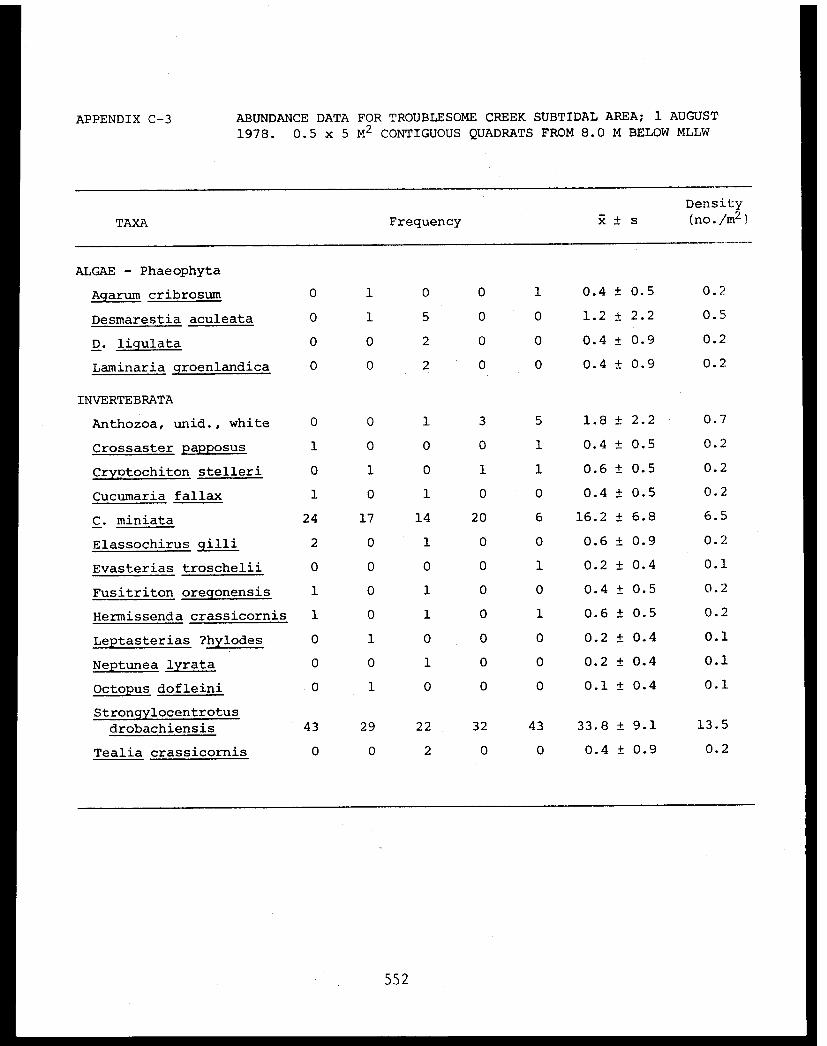
APPENDIX C-3 ABUNDANCE DATA FOR TROUBLESOME CREEK SUBTIDAL AREA; 1 AUGUST
1978. 0.5 x 5 M² CONTIGUOUS QUADRATS FROM 8.0 M BELOW MLLW
552
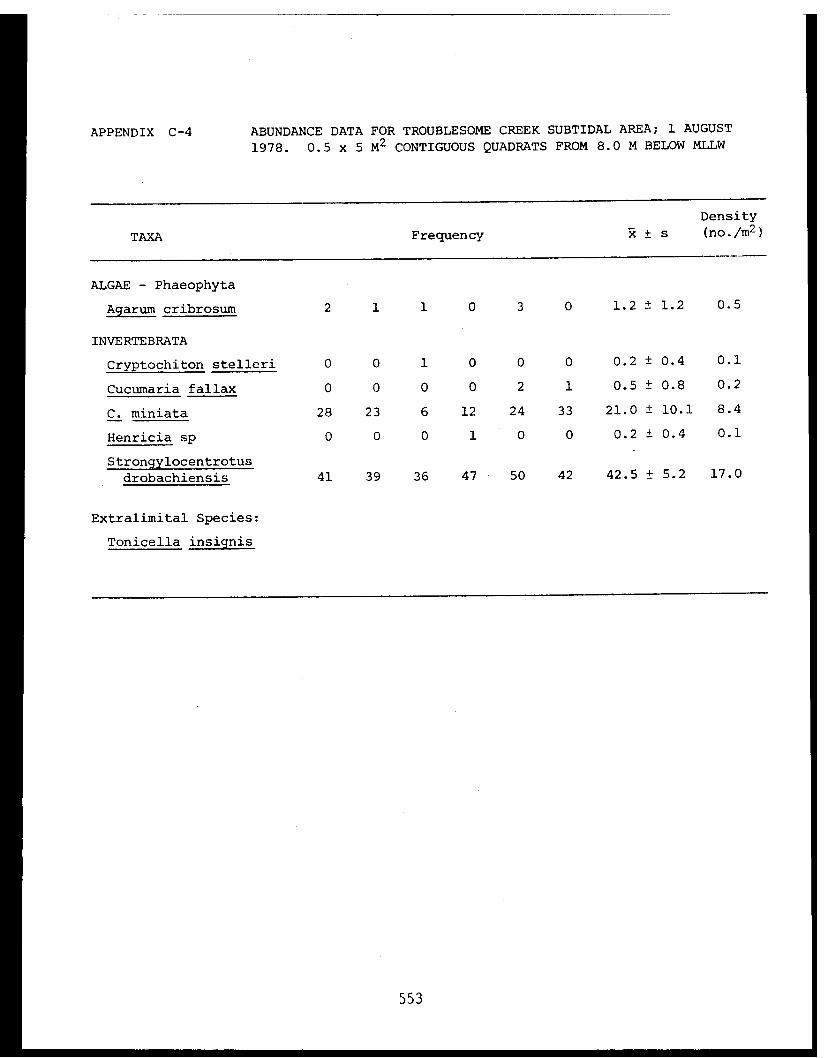
APPENDIX C-4 ABUNDANCE DATA FOR TROUBLESOME CREEK SUBTIDAL AREA; 1 AUGUST
1978. 0.5 x 5 M 2 CONTIGUOUS QUADRATS FROM 8.0 M BELOW MLLW
553
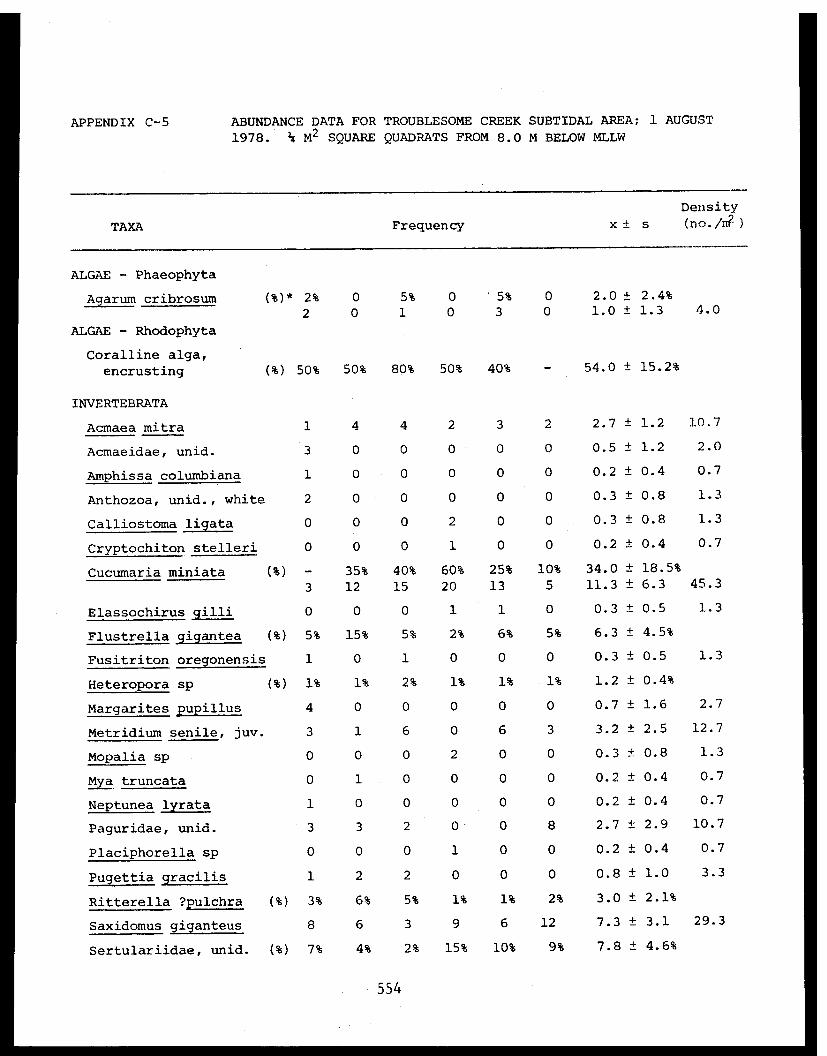
APPENDIX C-5 ABUNDANCE DATA FOR TROUBLESOME CREEK SUBTIDAL AREA; 1 AUGUST
1978. ¼ M² SQUARE QUADRATS FROM 8.0 M BELOW MLLW
554

APPENDIX C-5 (Continued)
555
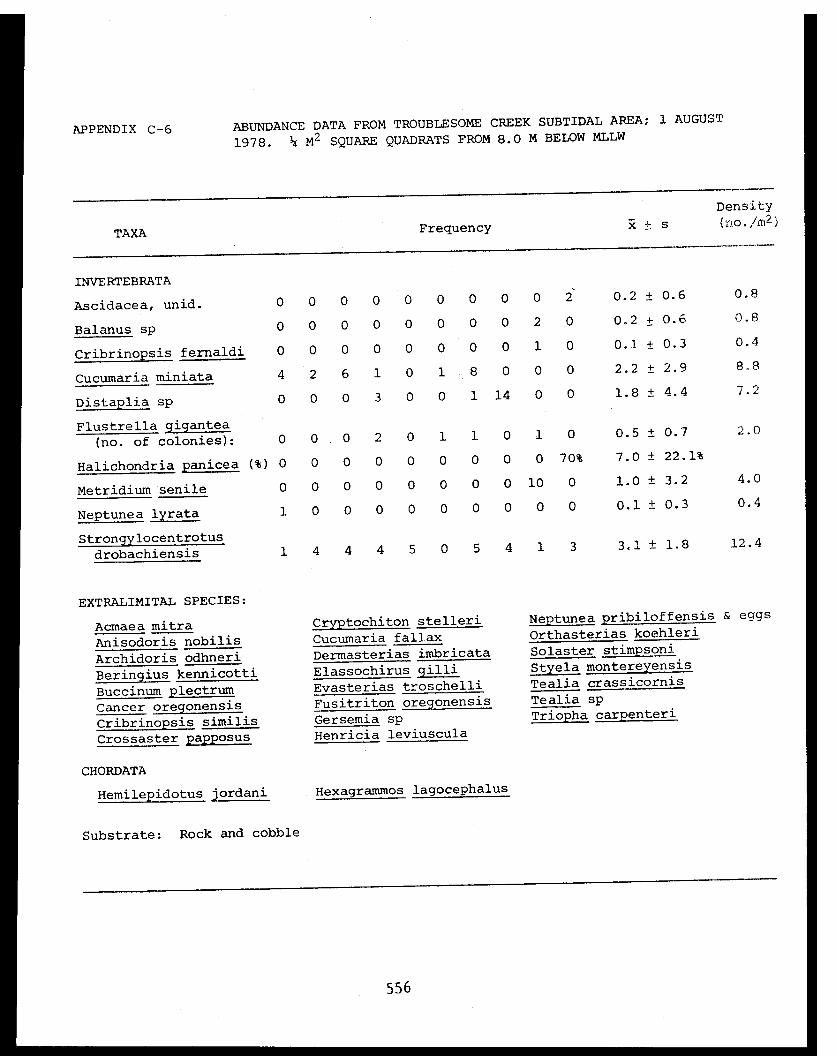
APPENDIX C-6 ABUNDANCE DATA FROM TROUBLESOME CREEK SUBTIDAL AREA; 1 AUGUST
1978. ¼ M² SQUARE QUADRATS FROM 8.0 M BELOW MLLW
556
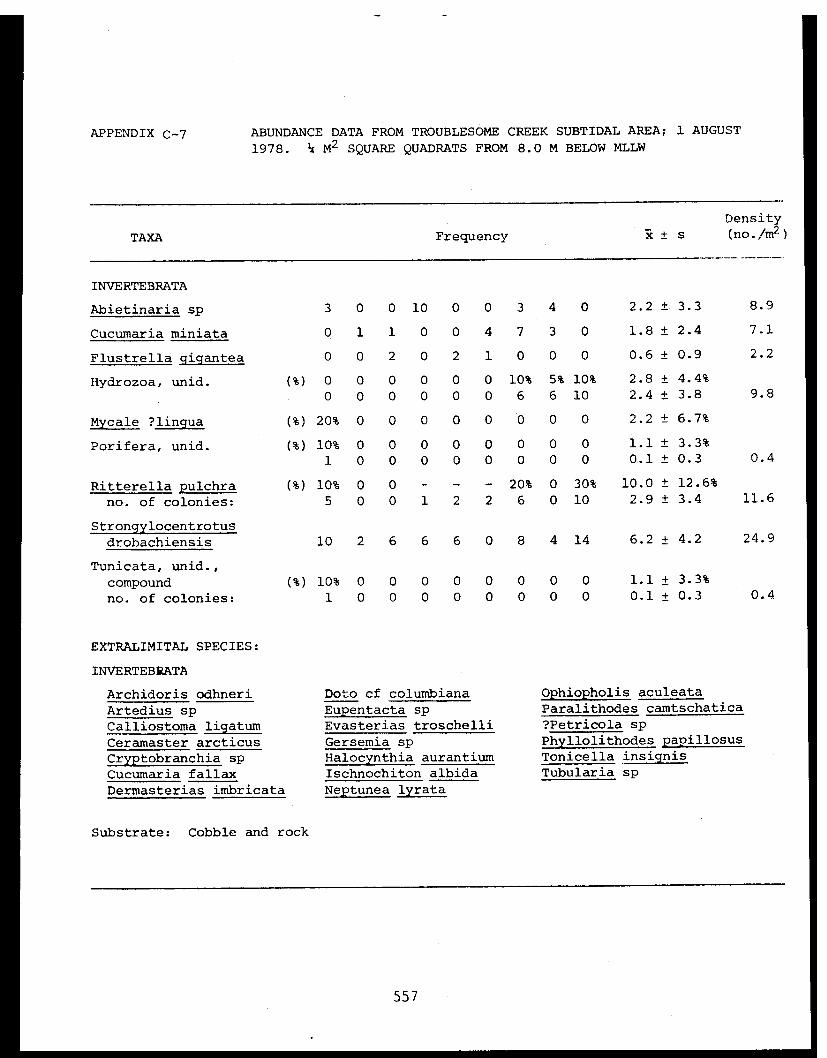
APPENDIX C-7 ABUNDANCE DATA FROM TROUBLESOME CREEK SUBTIDAL AREA; 1 AUGUST
1978. ¼ M² SQUARE QUADRATS FROM 8.0 M BELOW MLLW
557
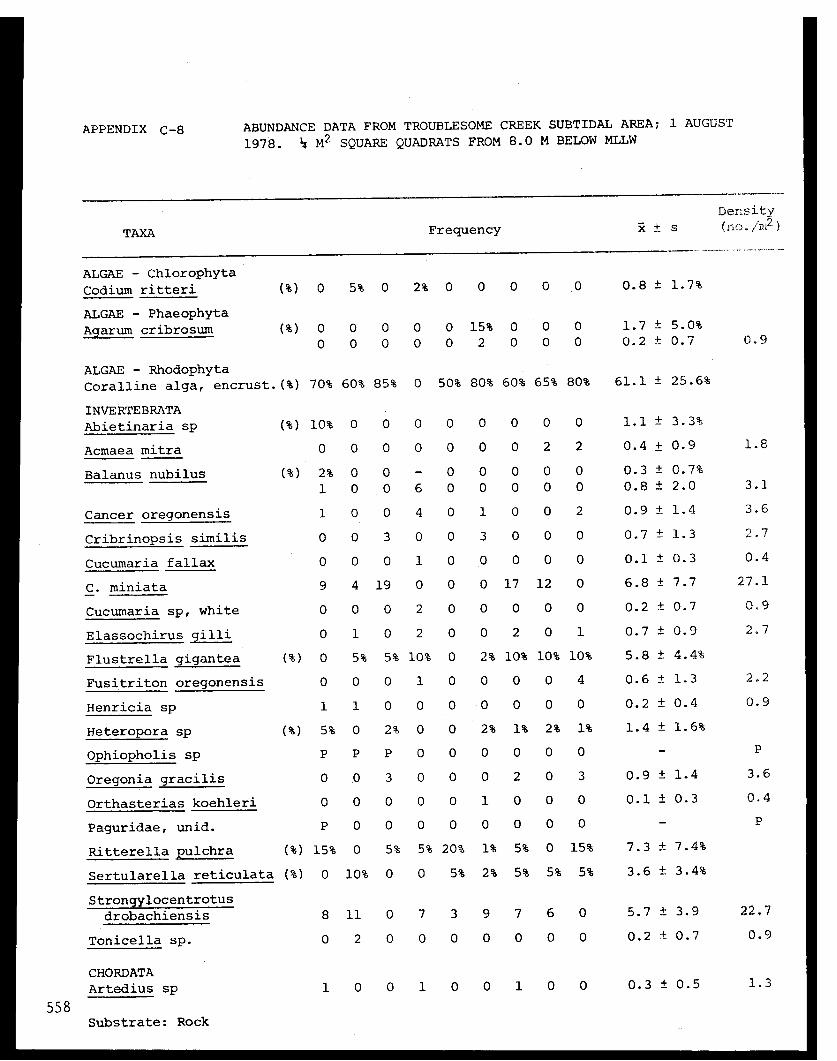
APPENDIX C-8 ABUNDANCE DATA FROM TROUBLESOME CREEK SUBTIDAL AREA; 1 AUGUST
1978. ¼ M² SQUARE QUADRATS FROM 8.0 M BELOW MLLW
558

APPENDIX D-1 ABUNDANCE DATA FOR NEREOCYSTIS LUETKEANA FROM BARABARA BLUFF;
13 JULY 1978. 0.5 X 5 M QUADRATS FROM 9.8 - 10.7 M BELOW MLLW
559
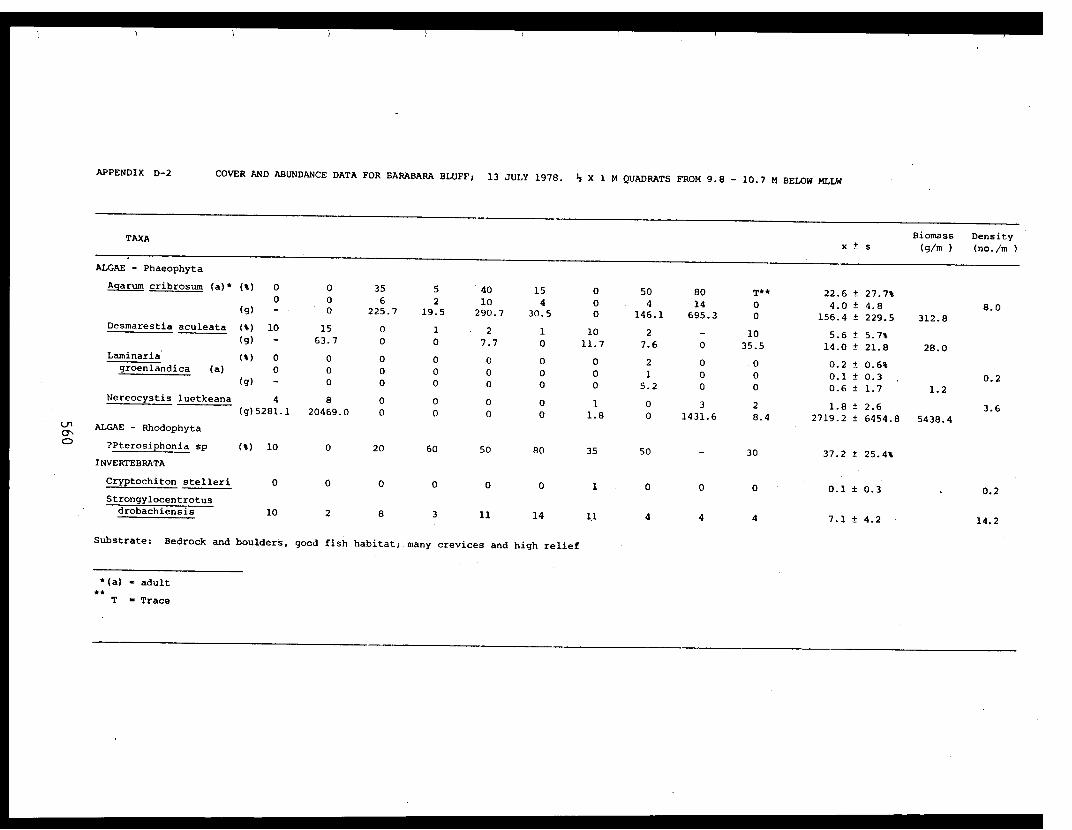
APPENDIX D-2 COVER AND ABUNDANCE DATA FOR BARABARA BLUFF; 13 JULY 1978. ½ X 1 M QUADRATS FROM 9.8 - 10.7 M BELOW MLLW

APPENDIX D-3 ABUNDANCE DATA FOR PLANTS AND FISH FOR BARABARA BLUFF; 13 JULY
1978. 0.5 X 30 M² QUADRAT FROM 9.8 - 10.7 M BELOW MLLW
561
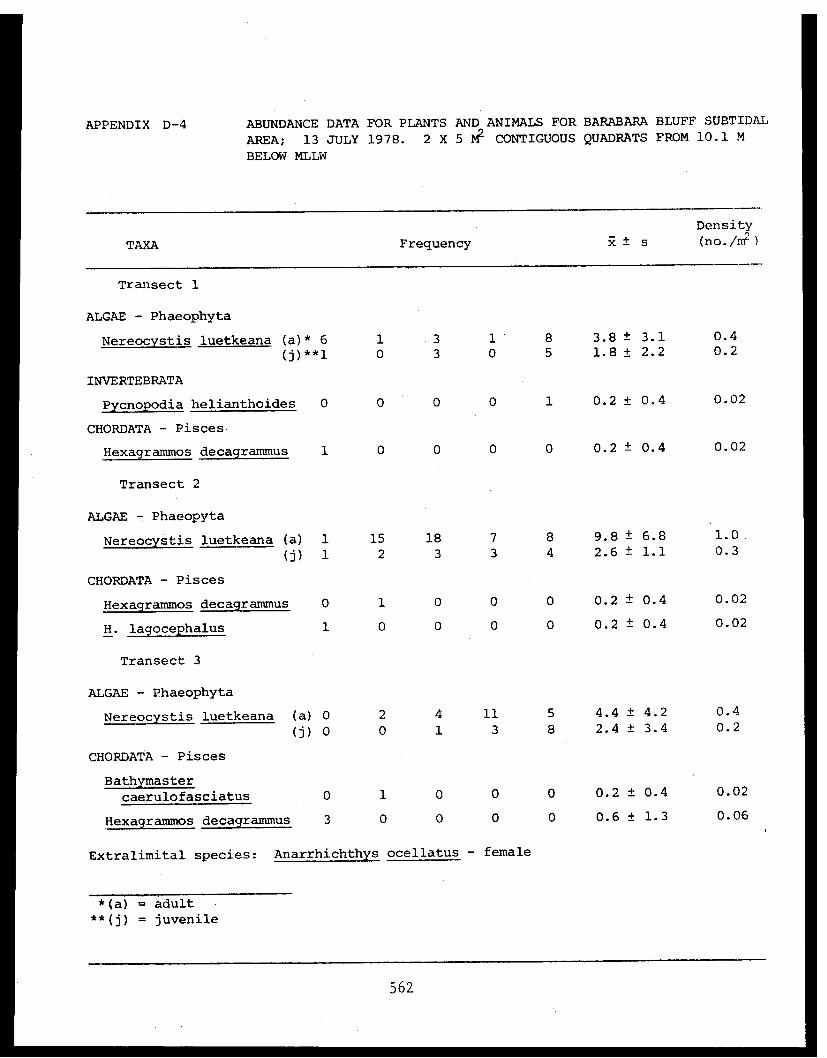
APPENDIX D-4 ABUNDANCE DATA FOR PLANTS AND ANIMALS FOR BARABARA BLUFF SUBTIDAL
AREA; 13 JULY 1978. 2 X 5 M² CONTIGUOUS QUADRATS FROM 10.1 M
BELOW MLLW
562
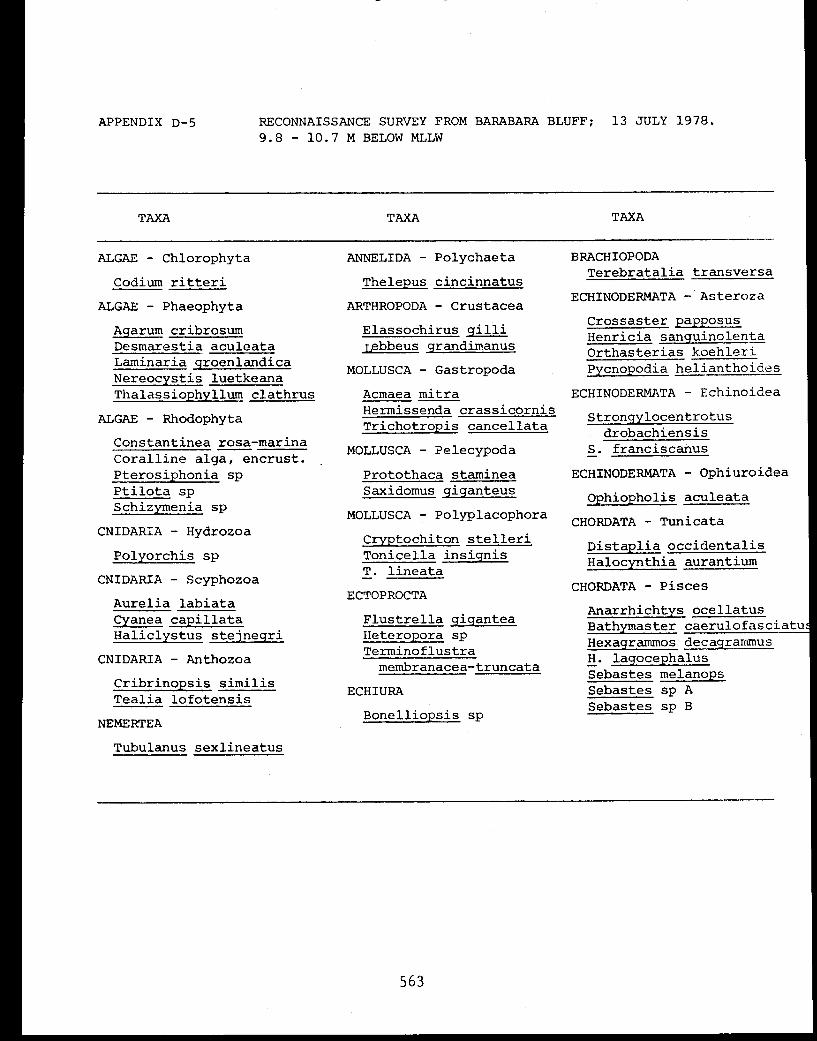
APPENDIX D-5 RECONNAISSANCE SURVEY FROM BARABARA BLUFF; 13 JULY 1978.
9.8 - 10.7 M BELOW MLLW
563
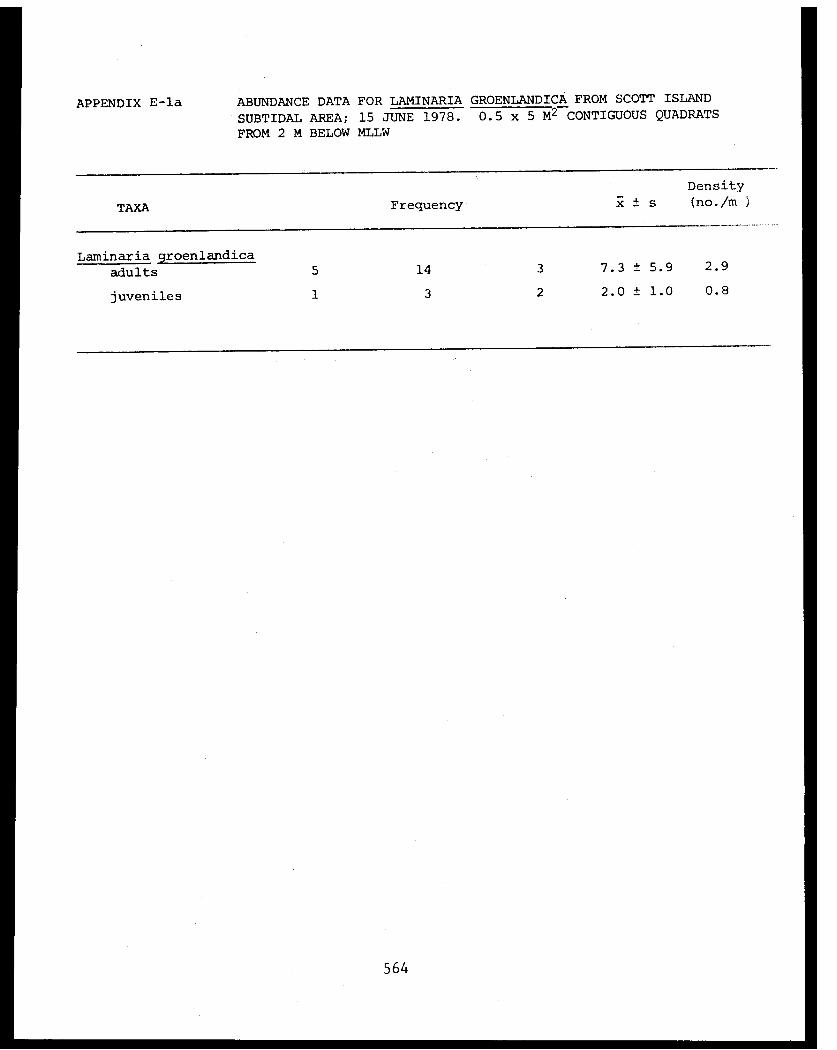
APPENDIX E-la ABUNDANCE DATA FOR LAMINARIA GROENLANDICA FROM SCOTT ISLAND
SUBTIDAL AREA; 15 JUNE 1978. 0.5 x 5 M² CONTIGUOUS QUADRATS
FROM 2 M BELOW MLLW
564
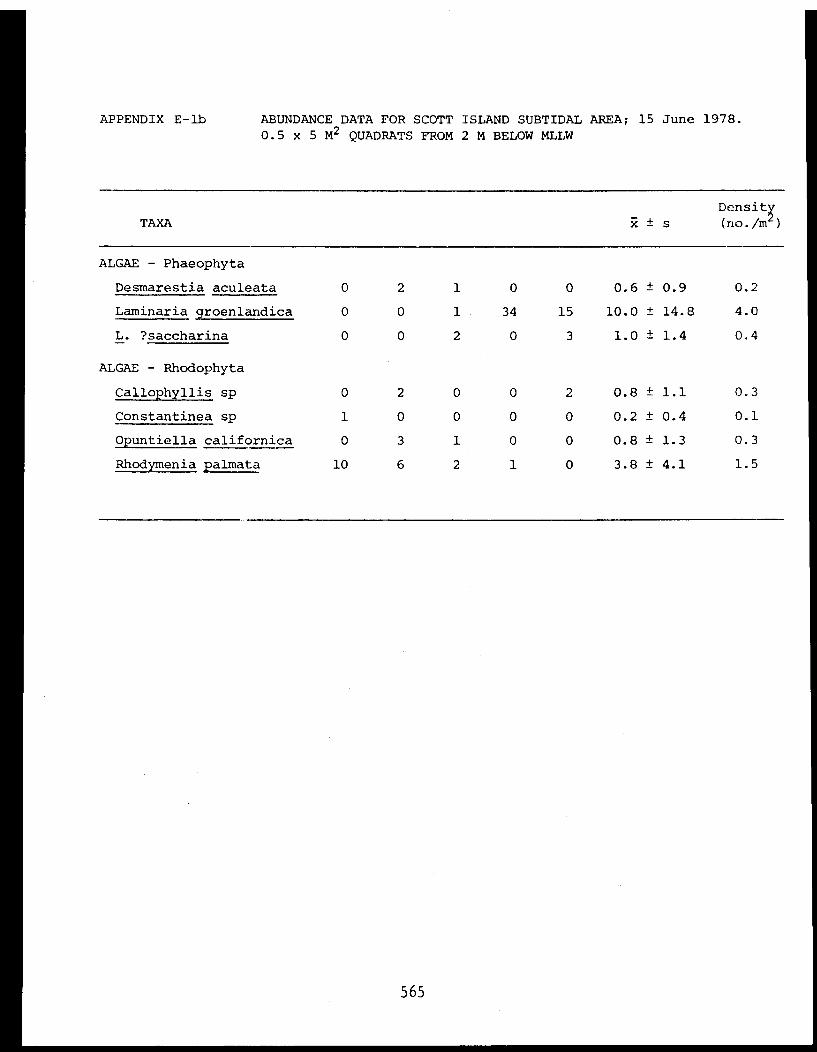
APPENDIX E-lb ABUNDANCE DATA FOR SCOTT ISLAND SUBTIDAL AREA; 15 June 1978.
0.5 x 5 M 2 QUADRATS FROM 2 M BELOW MLLW
565
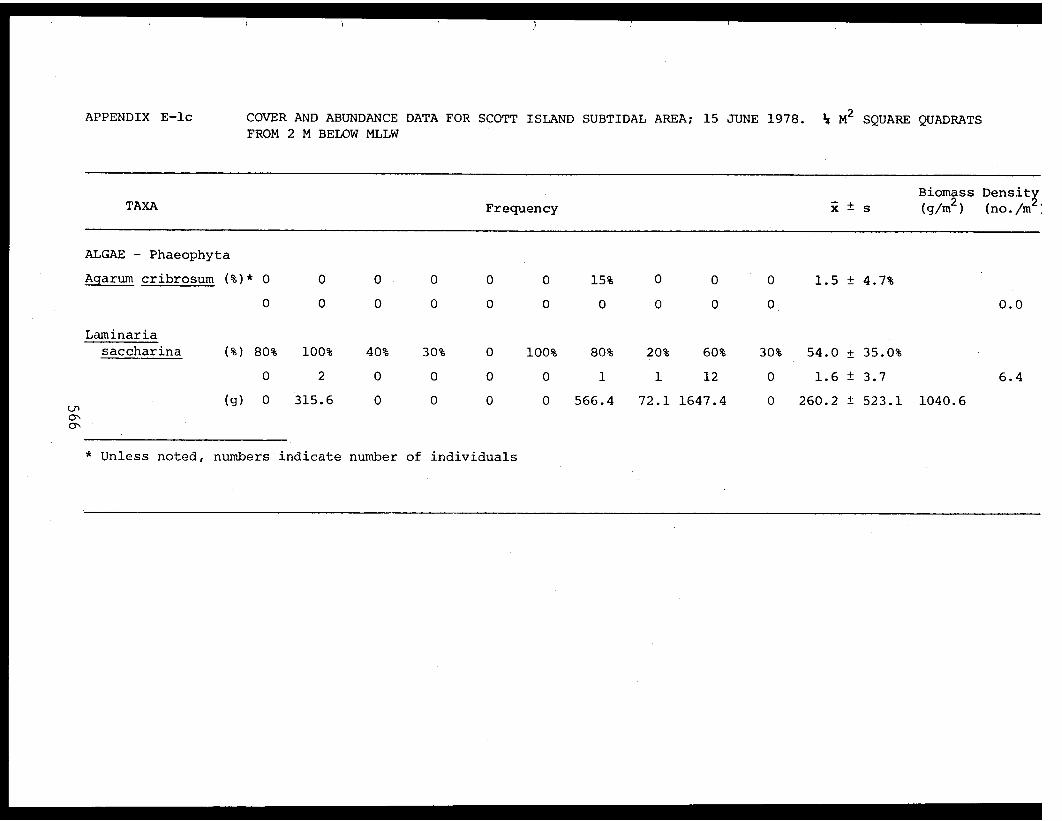
APPENDIX E-lc COVER AND ABUNDANCE DATA FOR SCOTT ISLAND SUBTIDAL AREA; 15 JUNE 1978. ¼ M² SQUARE QUADRATSFROM 2 M BELOW MLLW
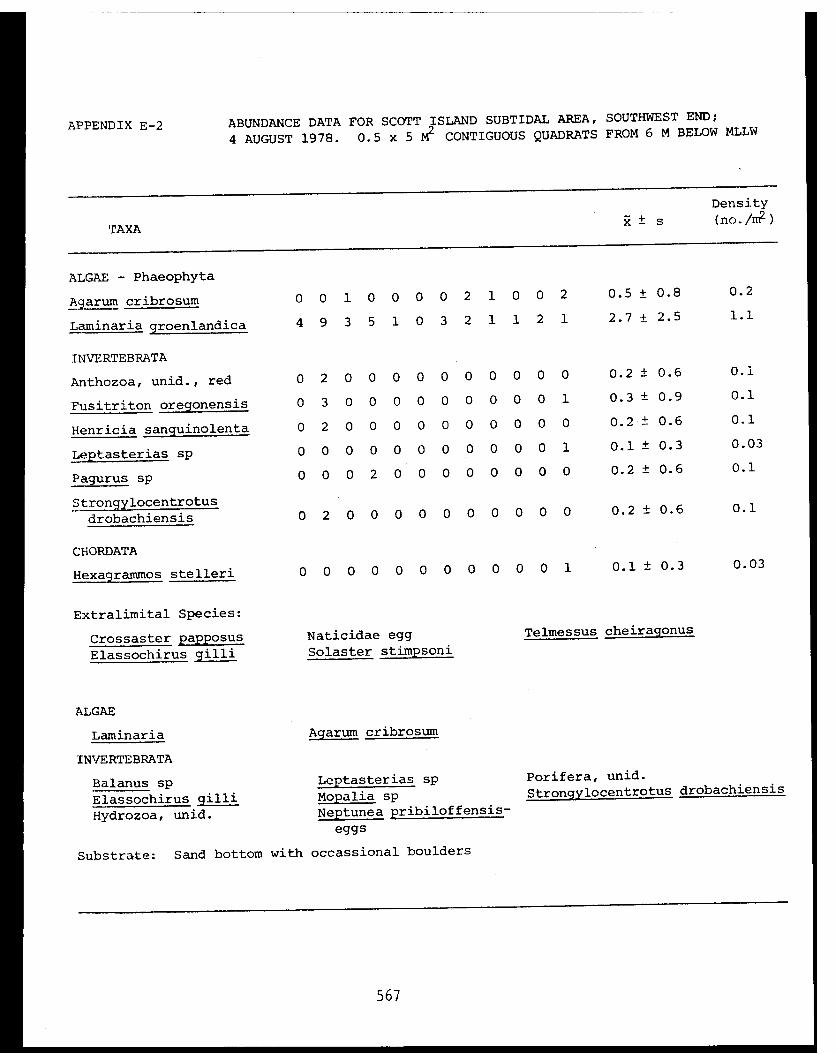
APPENDIX E-2 ABUNDANCE DATA FOR SCOTT ISLAND SUBTIDAL AREA, SOUTHWEST END;
4 AUGUST 1978. 0.5 x 5 M² CONTIGUOUS QUADRATS FROM 6 M BELOW MLLW
567
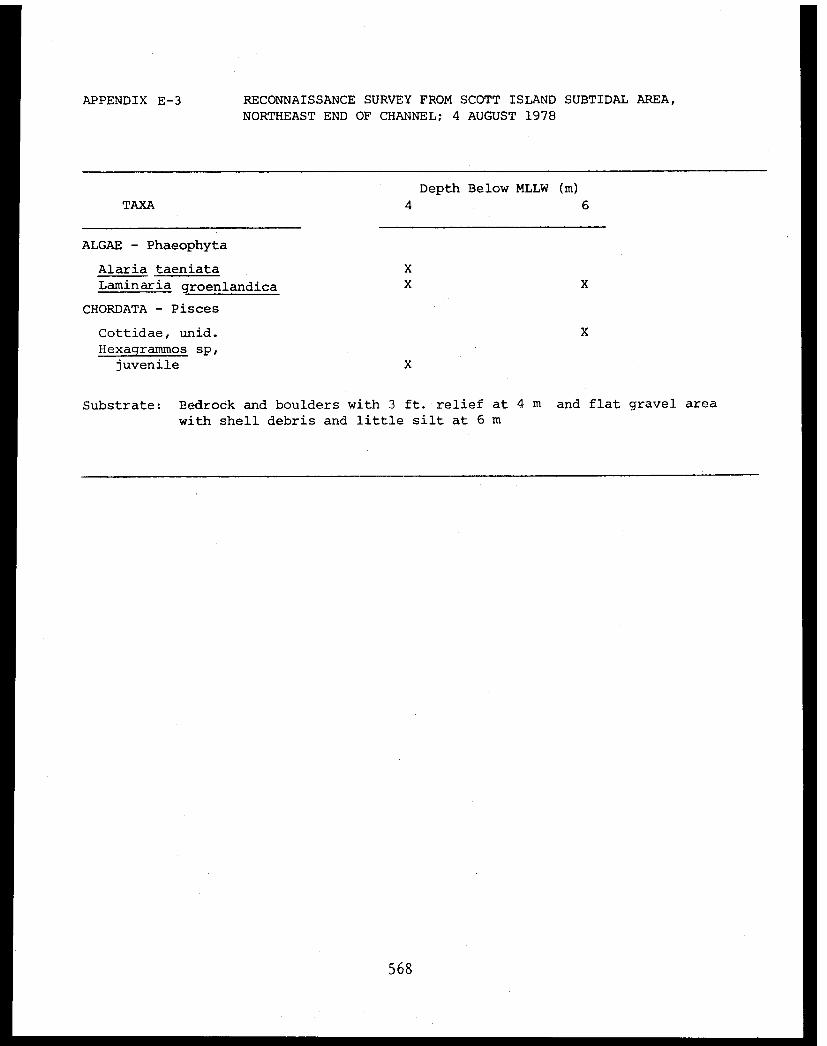
APPENDIX E-3 RECONNAISSANCE SURVEY FROM SCOTT ISLAND SUBTIDAL AREA,
NORTHEAST END OF CHANNEL; 4 AUGUST 1978
568
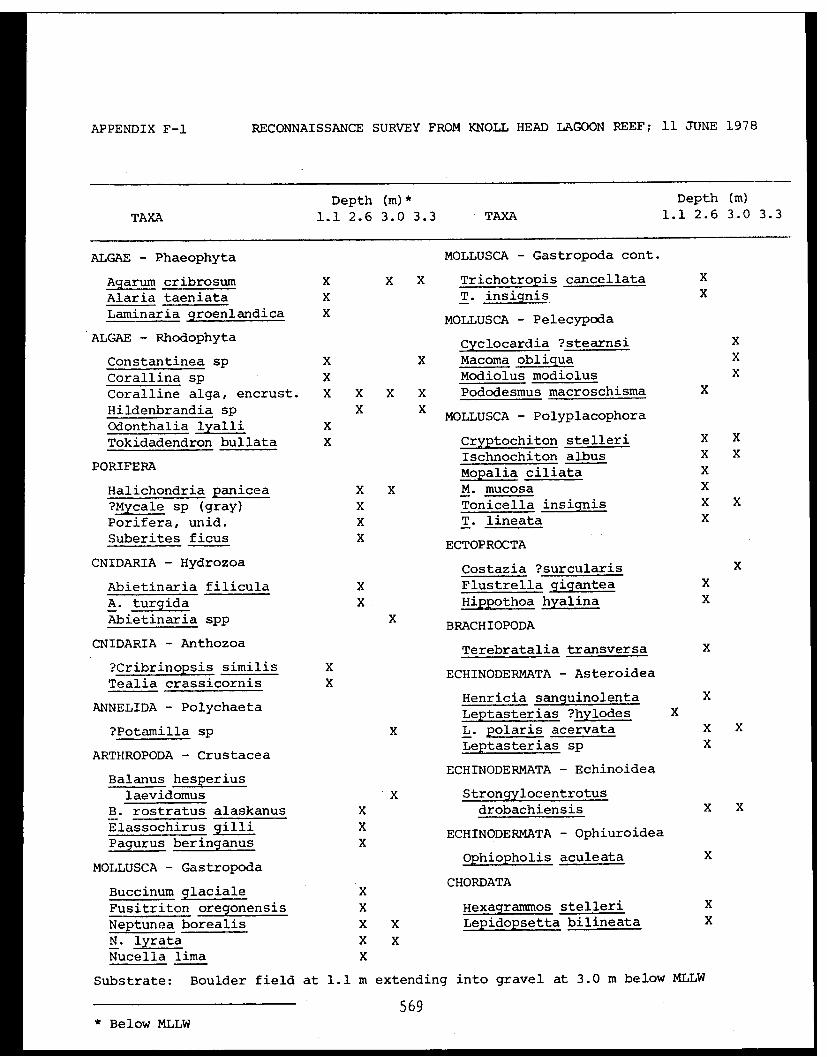
APPENDIX F-1 RECONNAISSANCE SURVEY FROM KNOLL HEAD LAGOON REEF; 11 JUNE 1978
569
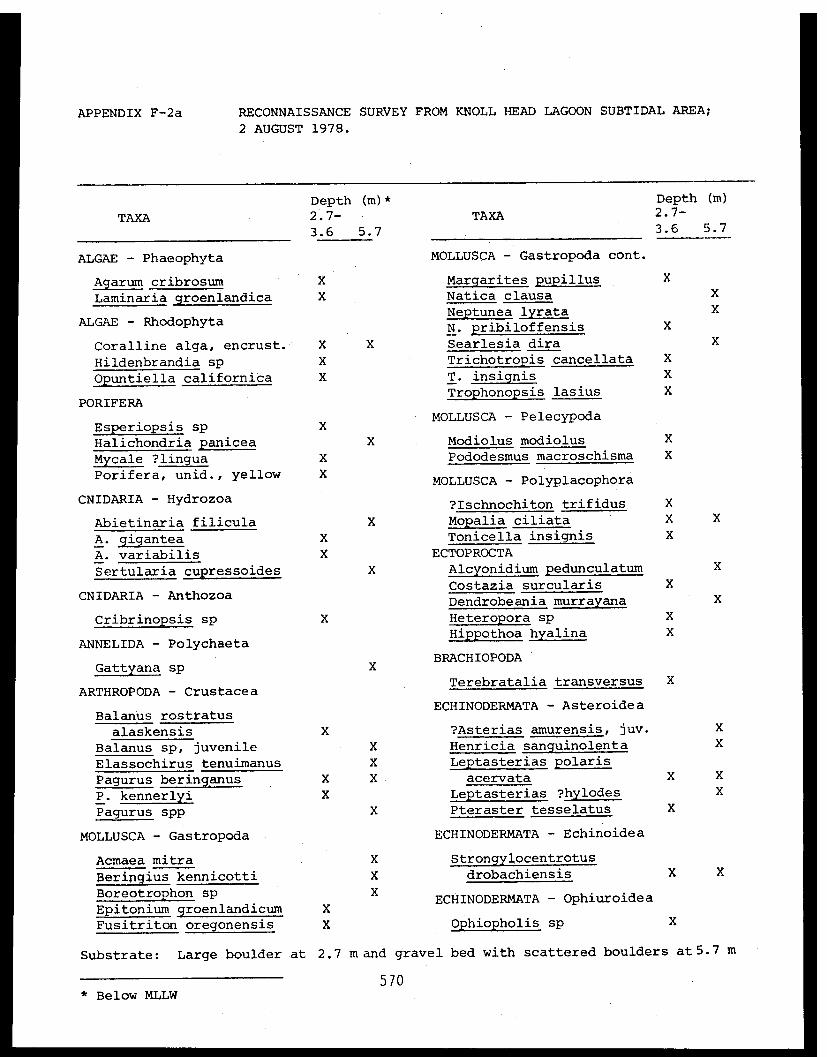
APPENDIX F-2a RECONNAISSANCE SURVEY FROM KNOLL HEAD LAGOON SUBTIDAL AREA;
2 AUGUST 1978.
570
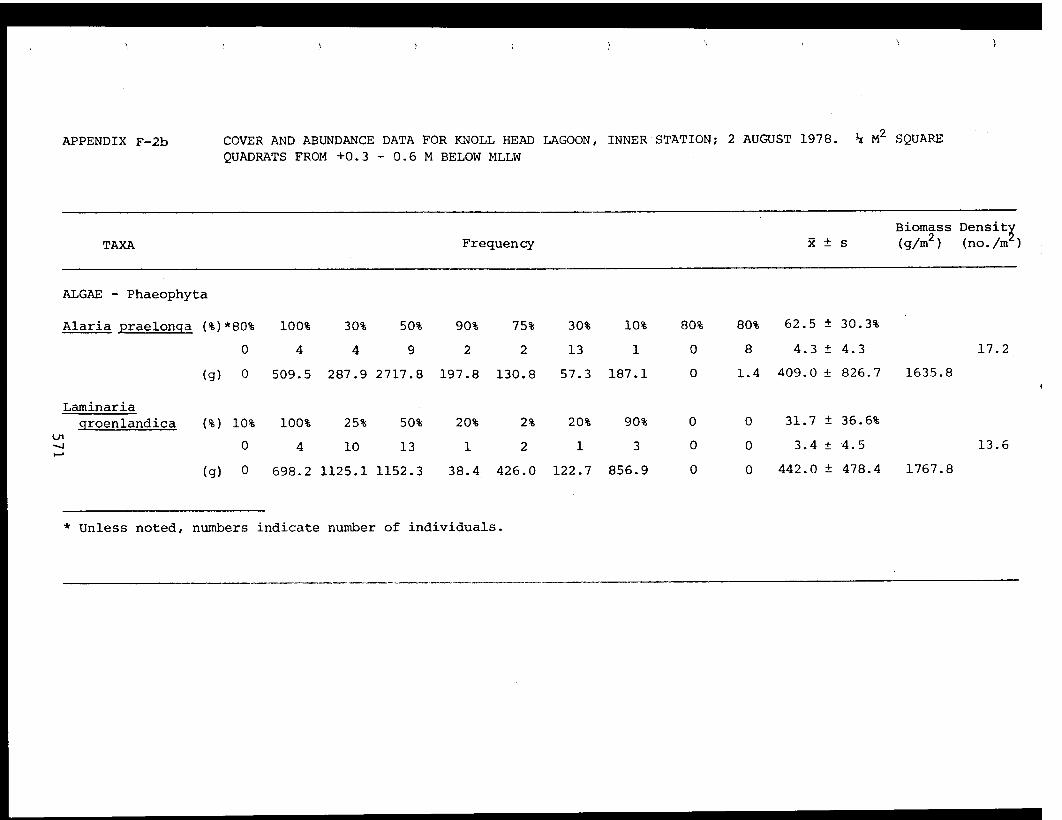
APPENDIX F-2b COVER AND ABUNDANCE DATA FOR KNOLL HEAD LAGOON, INNER STATION; 2 AUGUST 1978. ¼ M² SQUARE
QUADRATS FROM +0.3 - 0.6 M BELOW MLLW
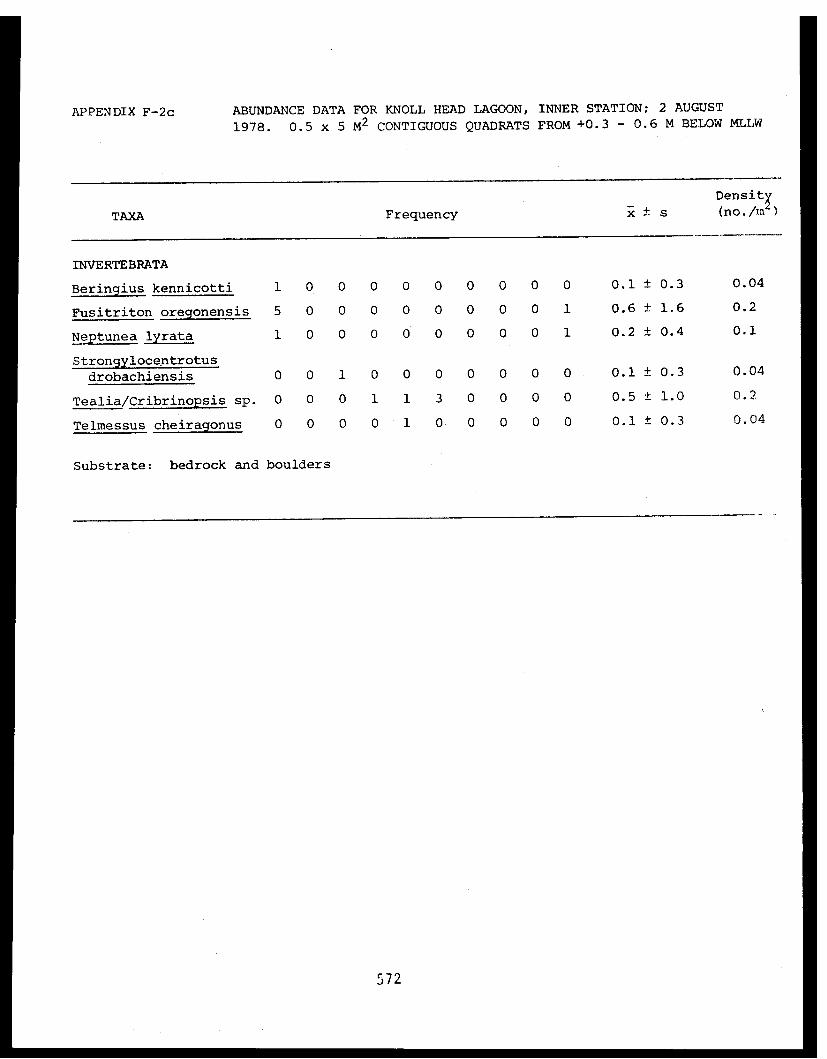
APPENDIX F-2c ABUNDANCE DATA FOR KNOLL HEAD LAGOON, INNER STATION; 2 AUGUST
1978. 0.5 x 5 M2 CONTIGUOUS QUADRATS FROM +0.3 - 0.6 M BELOW MLLW
572

APPENDIX F-2d ABUNDANCE DATA FOR KNOLL HEAD LAGOON SUBTIDAL AREA; 5 AUGUST 1978. 0.5 x 5 M² QUADRATSFROM 1.8 M BELOW MLLW
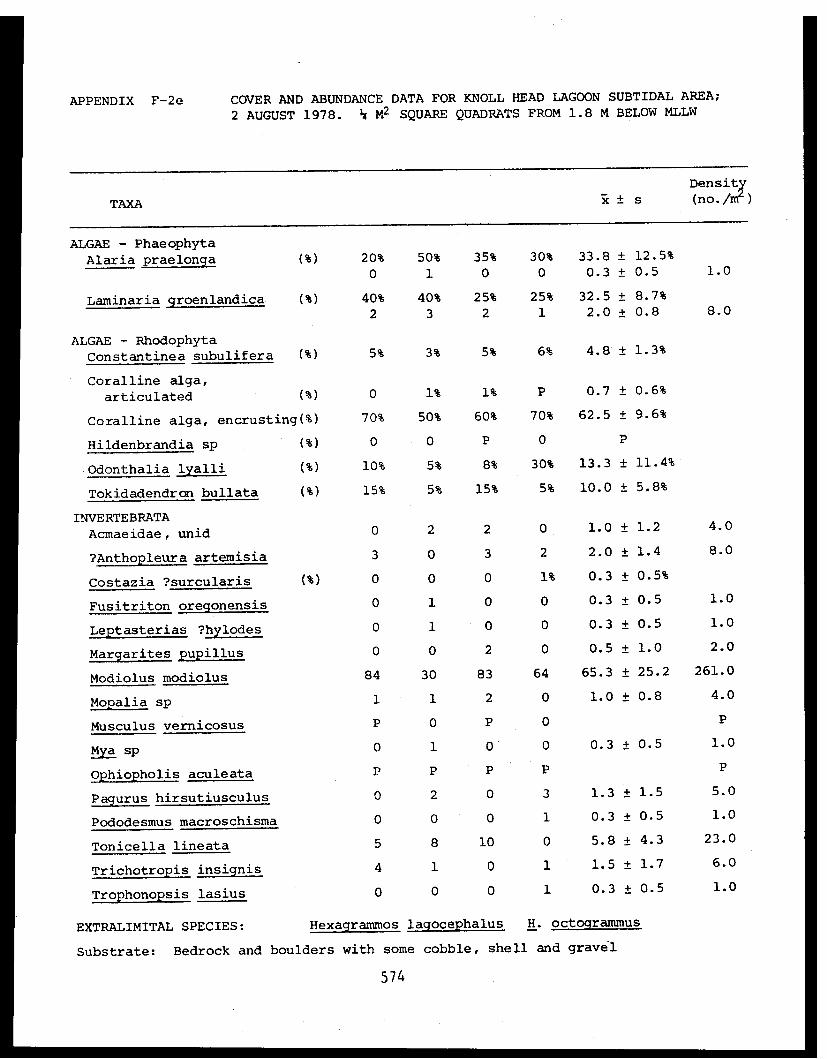
APPENDIX F-2e COVER AND ABUNDANCE DATA FOR KNOLL HEAD LAGOON SUBTIDAL AREA;
2 AUGUST 1978. ¼ M² SQUARE QUADRATS FROM 1.8 M BELOW MLLW
574
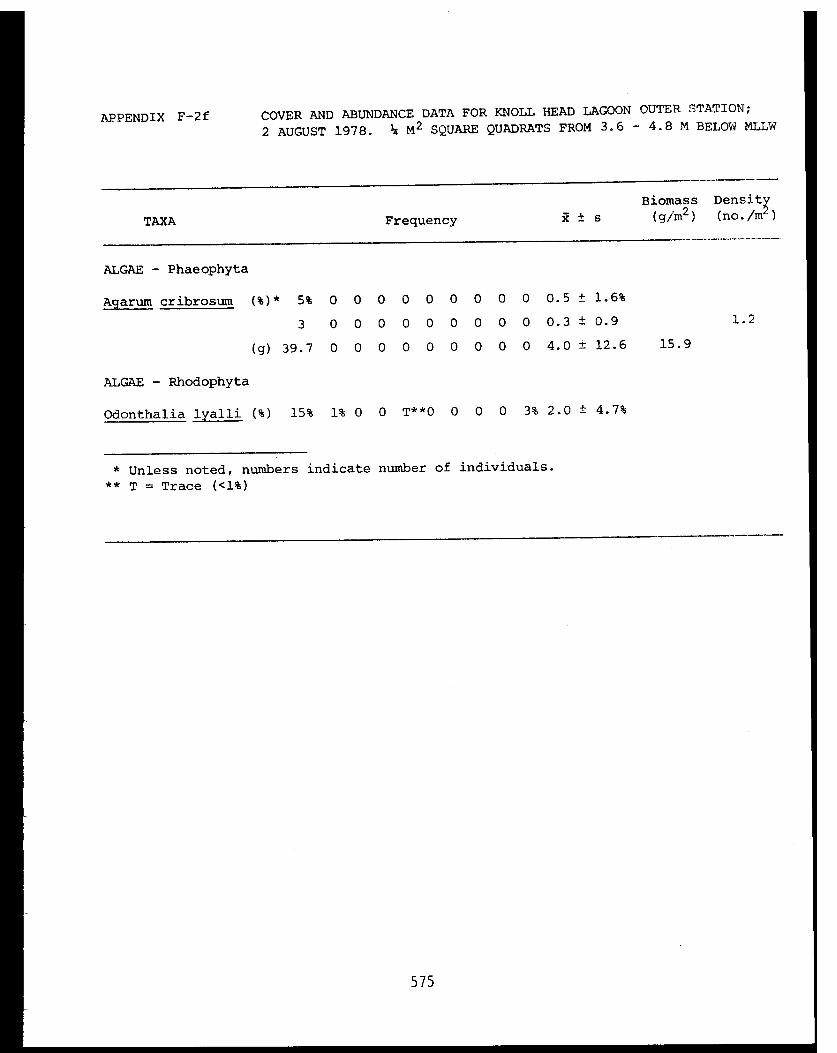
APPENDIX F-2f COVER AND ABUNDANCE DATA FOR KNOLL HEAD LAGOON OUTER STATION;
2 AUGUST 1978. ¼ M² SQUARE QUADRATS FROM 3.6 - 4.8 M BELOW MLLW
575
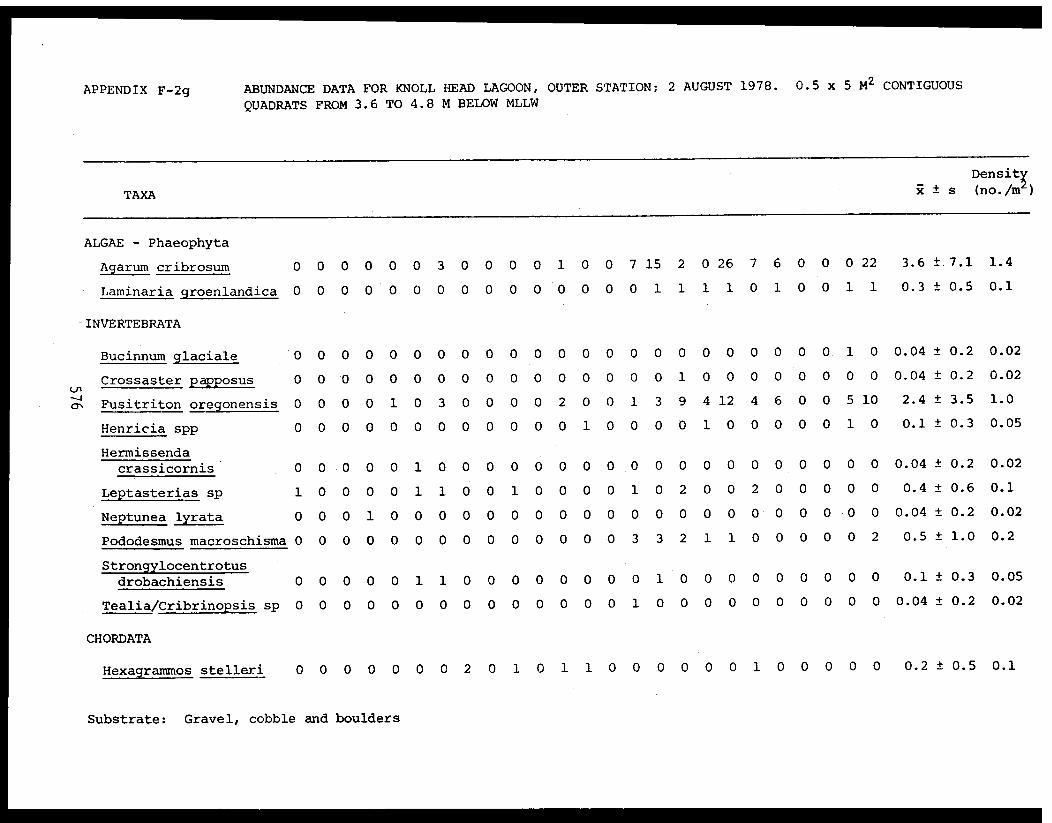
APPENDIX F-2g ABUNDANCE DATA FOR KNOLL HEAD LAGOON, OUTER STATION; 2 AUGUST 1978. 0.5 x 5 M² CONTIGUOUS
QUADRATS FROM 3.6 TO 4.8 M BELOW MLLW

APPENDIX G-1 RECONNAISSANCE SURVEY FROM WHITE GULL ISLAND SUBTIDAL AREA, WEST SIDE; 12 JUNE 1978
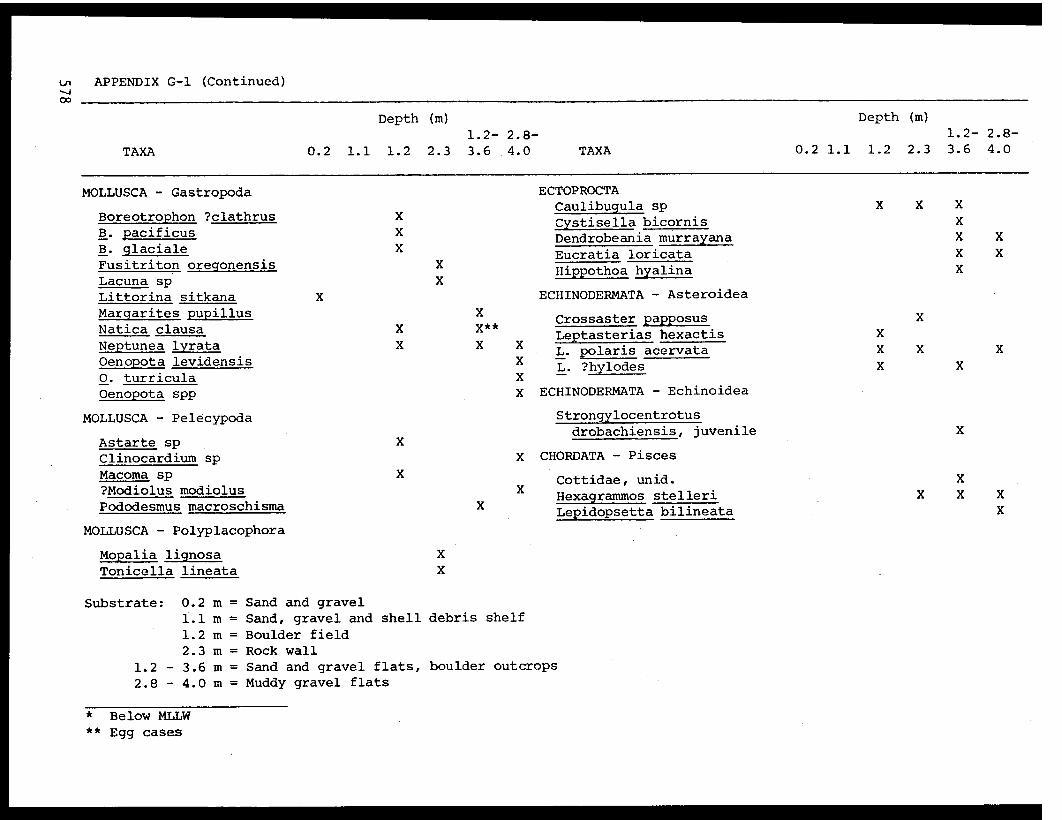
APPENDIX G-1 (Continued)
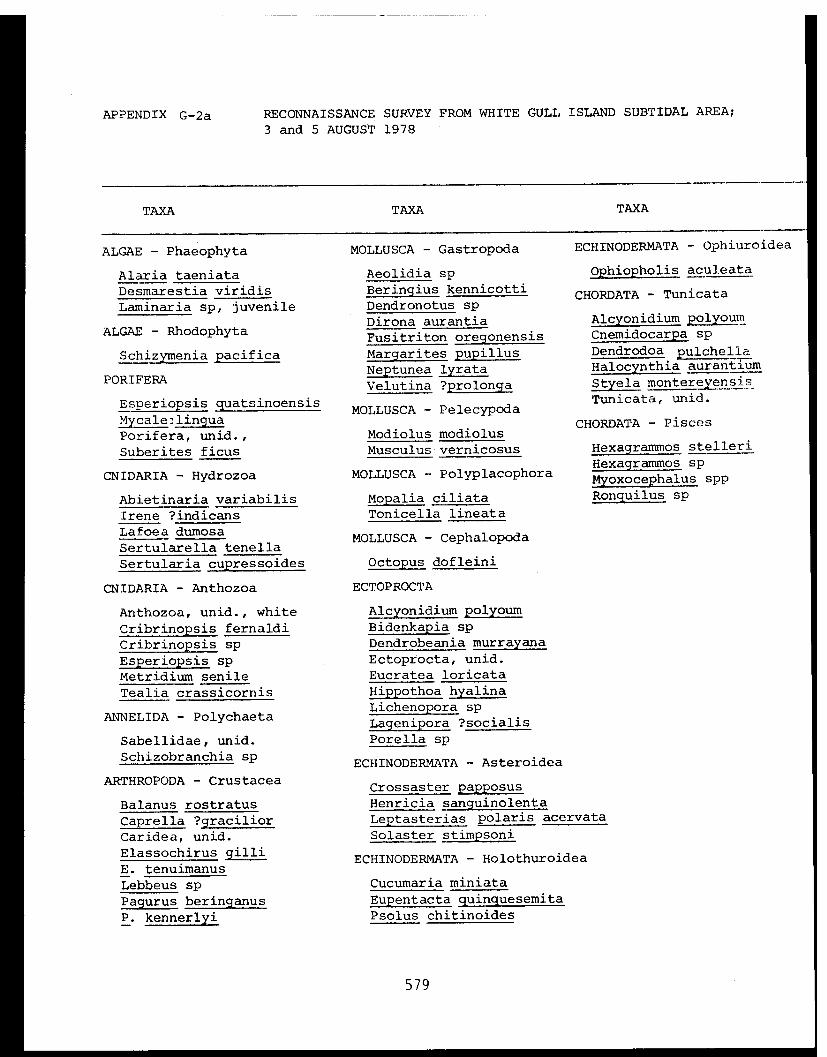
APPENDIX G-2a RECONNAISSANCE SURVEY FROM WHITE GULL ISLAND SUBTIDAL AREA;
3 and 5 AUGUST 1978
579
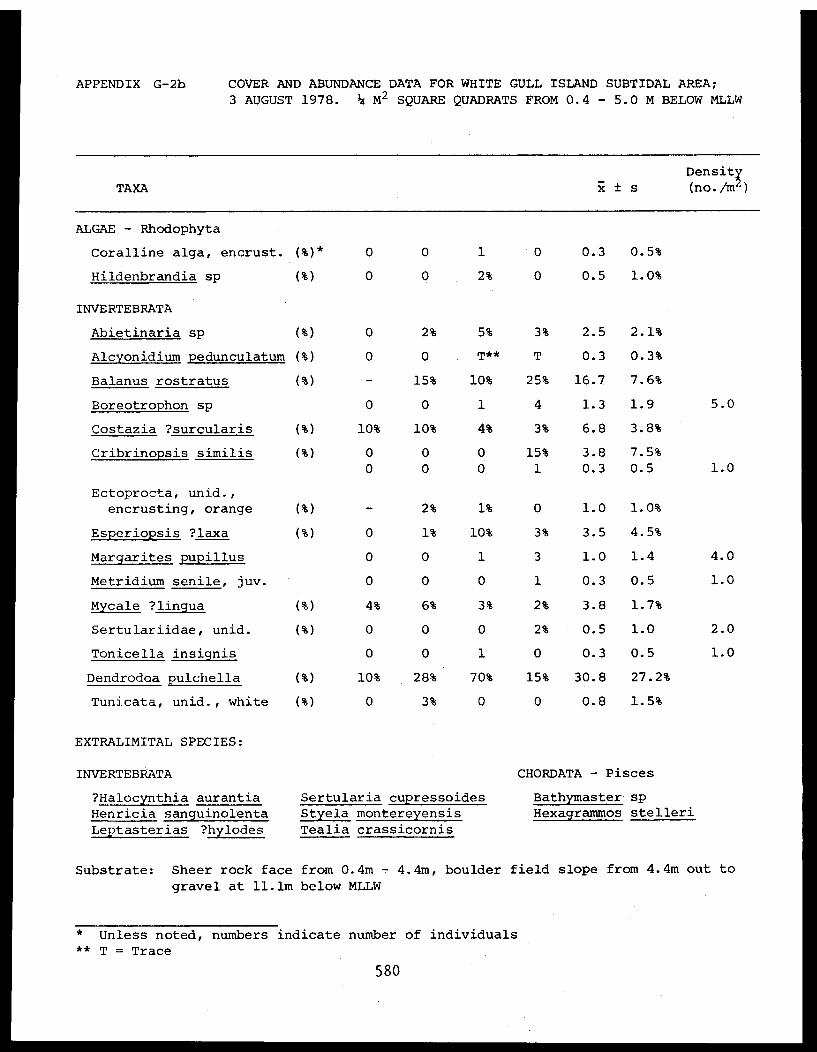
APPENDIX G-2b COVER AND ABUNDANCE DATA FOR WHITE GULL ISLAND SUBTIDAL AREA;
3 AUGUST 1978. ¼ M² SQUARE QUADRATS FROM 0.4 - 5.0 M BELOW MLLW
580

APPENDIX H RECONNAISSANCE SURVEY FROM BLACK REEF; 12 JUNE 1978

APPENDIX H (Continued)
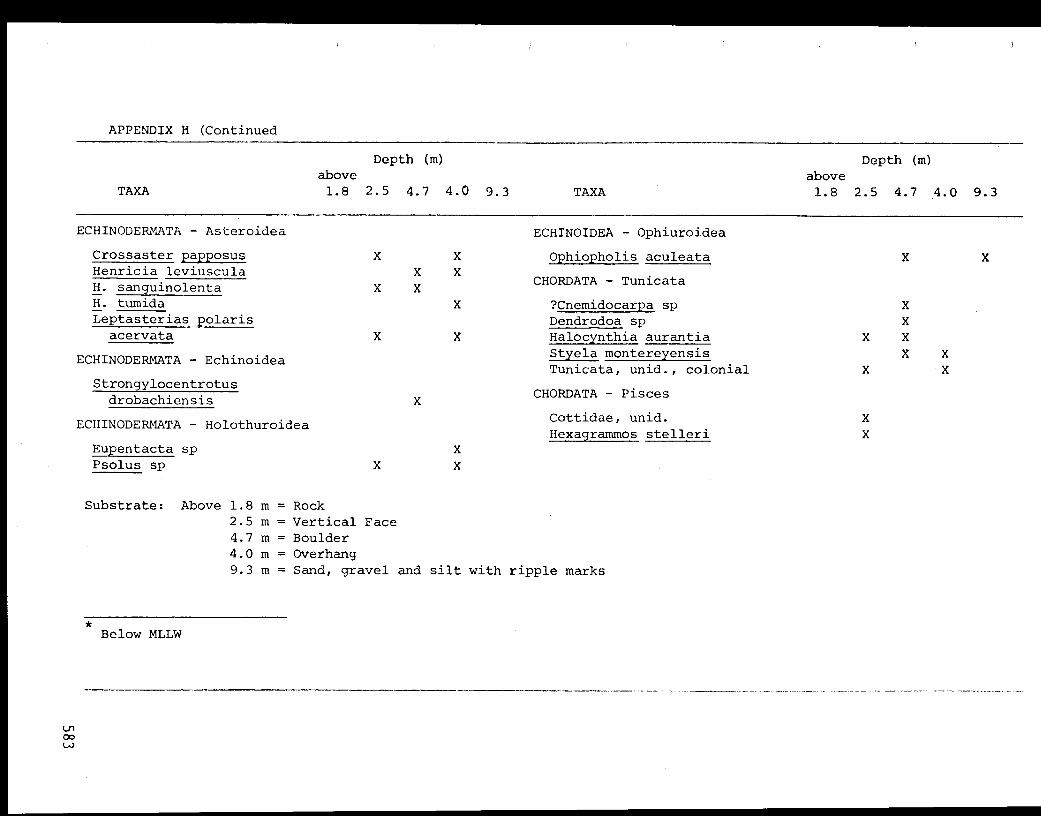
APPENDIX H (Continued
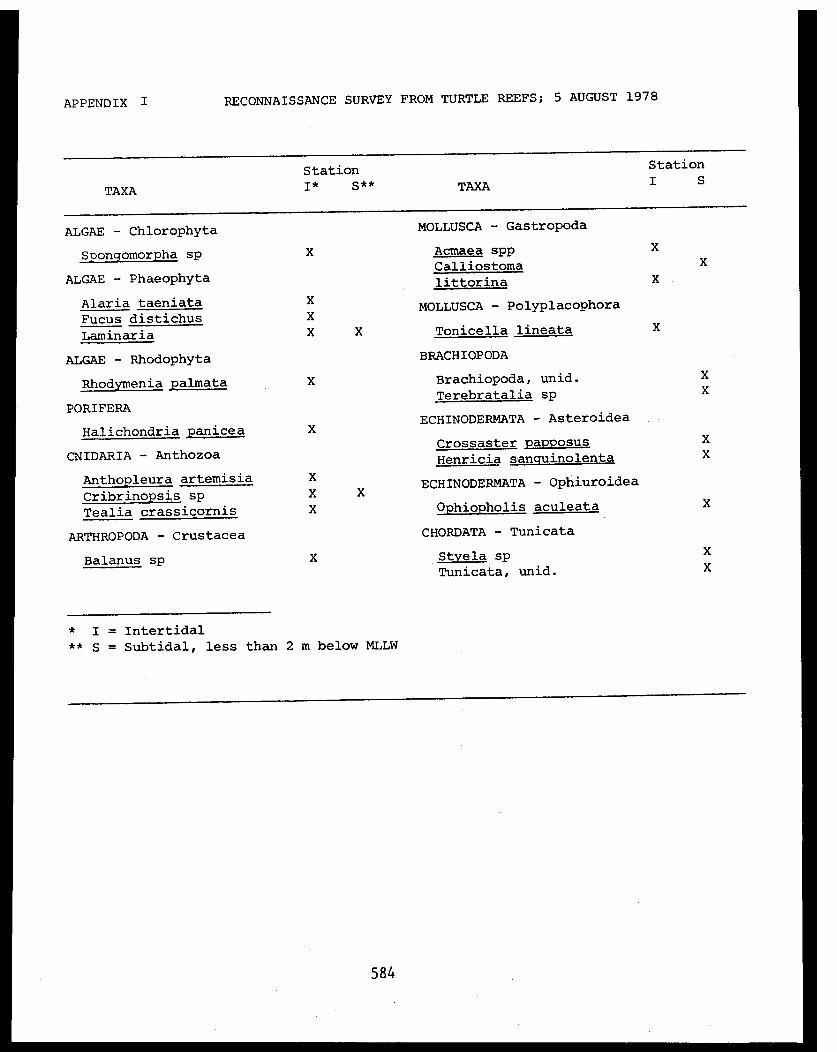
APPENDIX I RECONNAISSANCE SURVEY FROM TURTLE REEFS; 5 AUGUST 1978
584
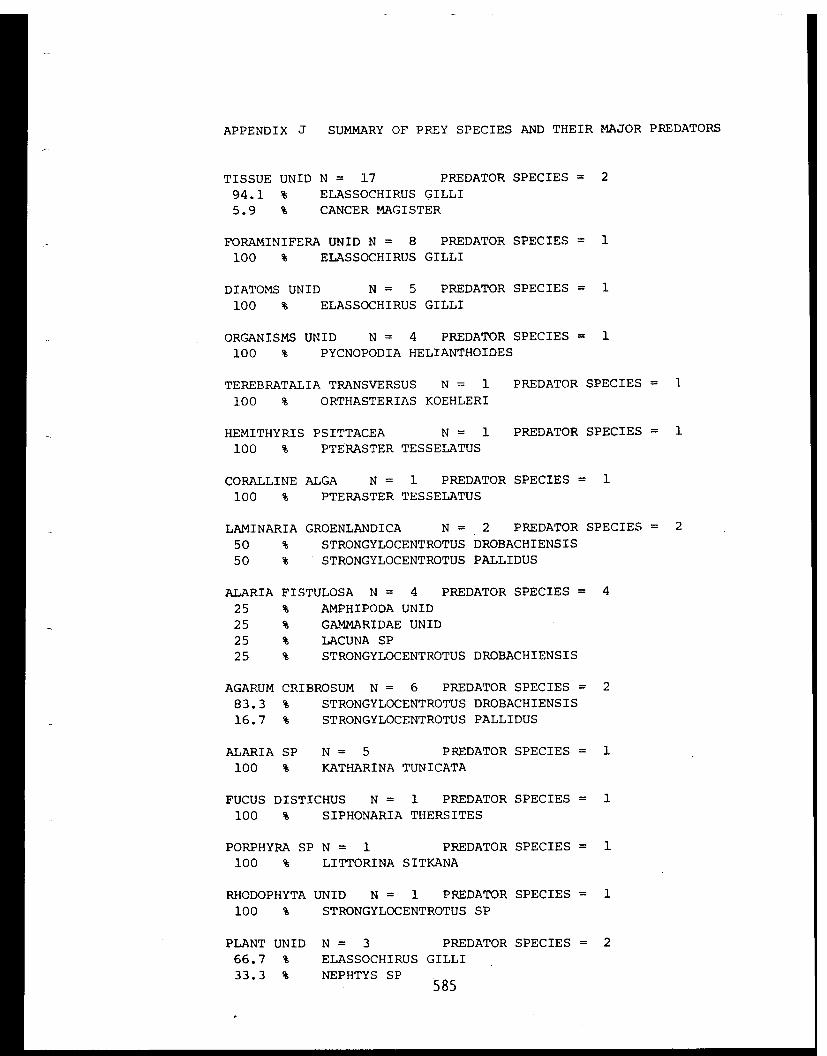
APPENDIX J SUMMARY OF PREY SPECIES AND THEIR MAJOR PREDATORS
585
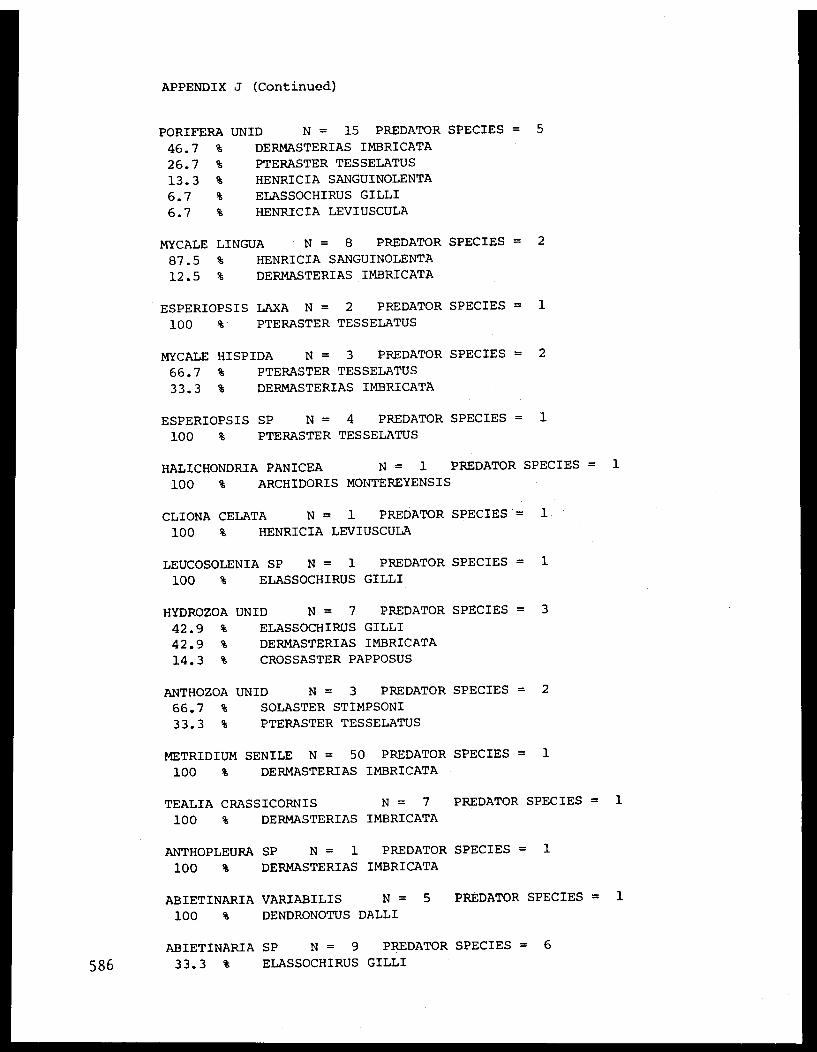
APPENDIX J (Continued)
586
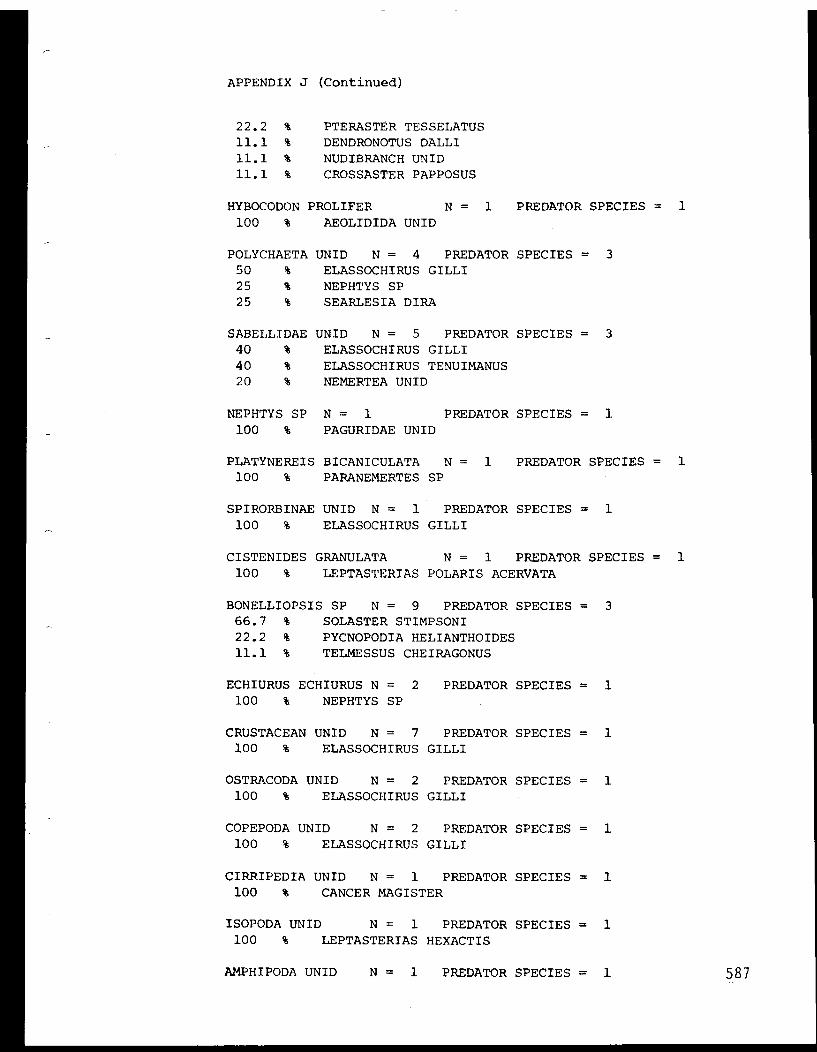
APPENDIX J (Continued)
587
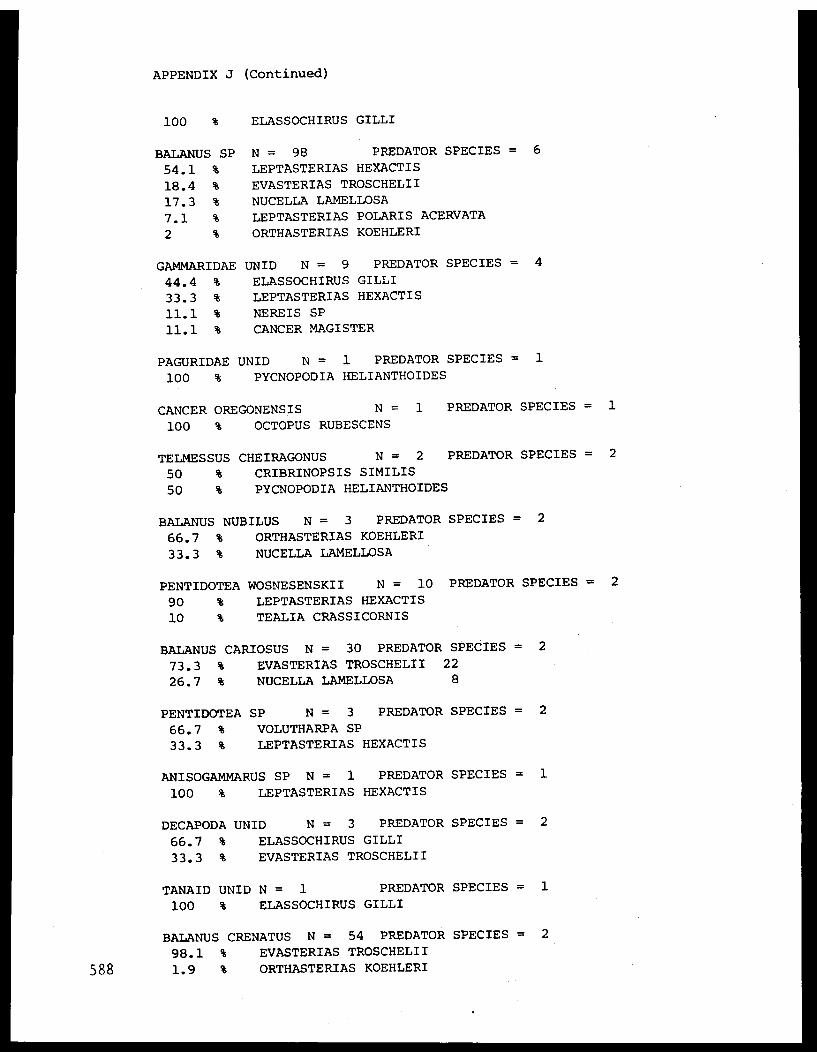
APPENDIX J (Continued)
588
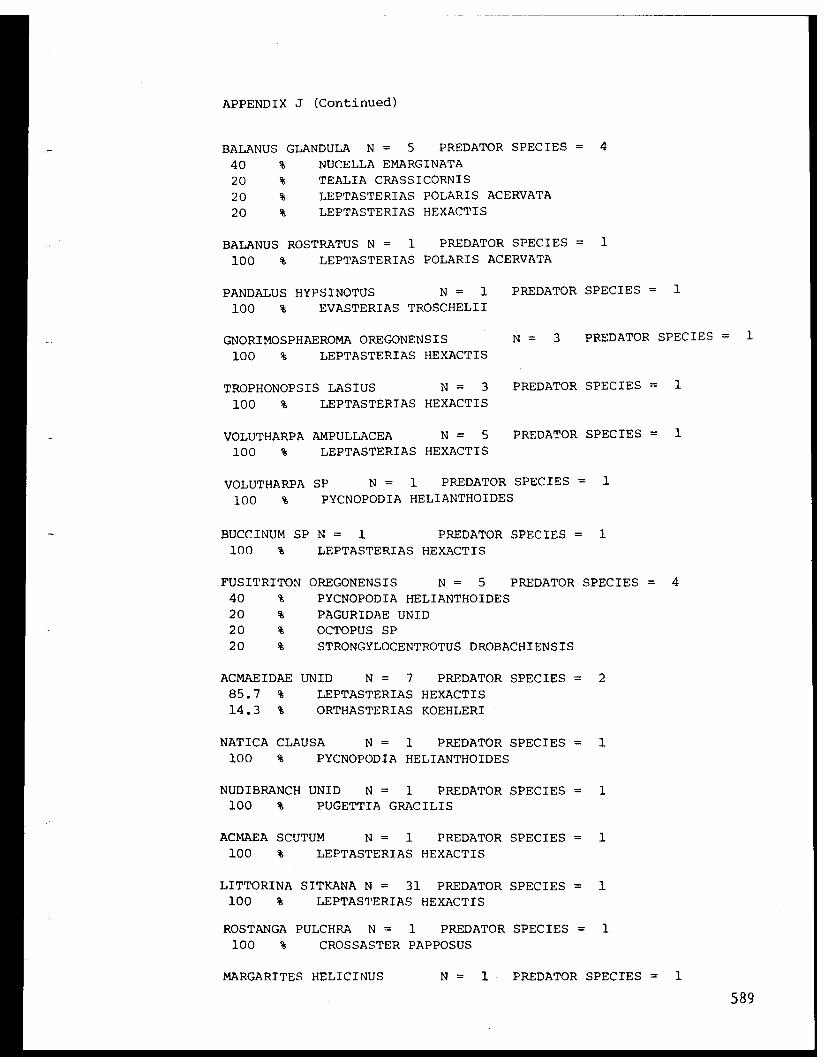
APPENDIX J (Continued)
589
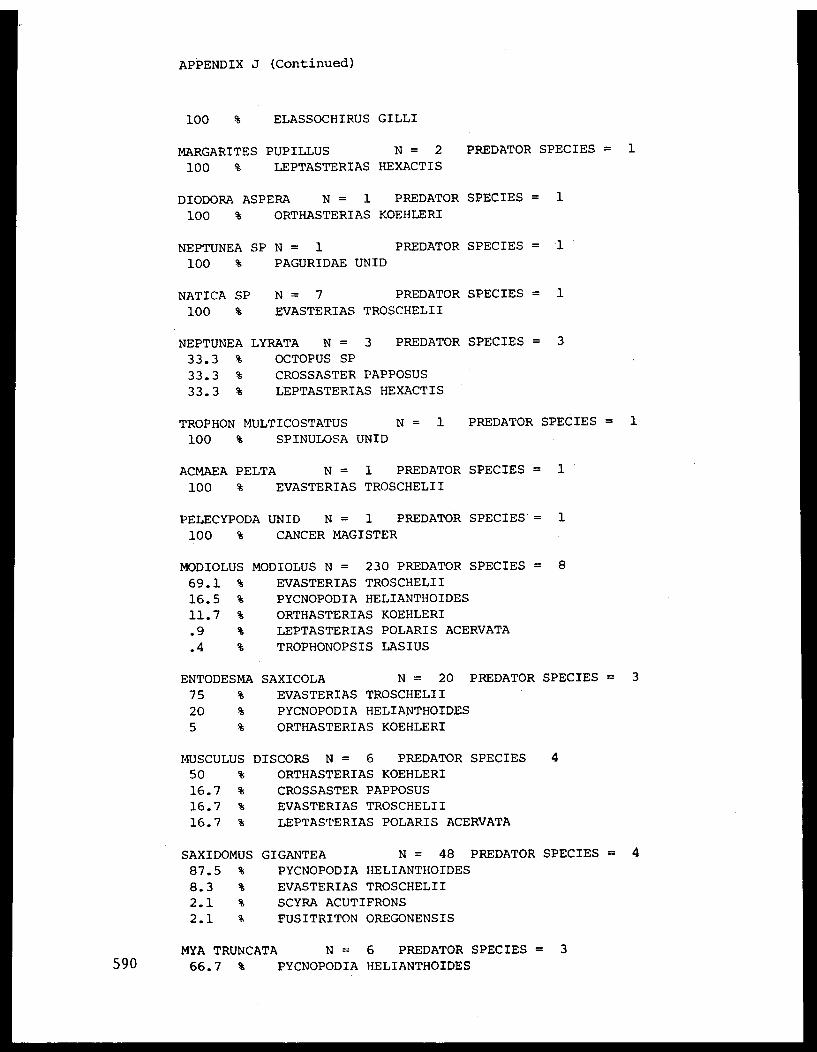
APPENDIX J (Continued)
590
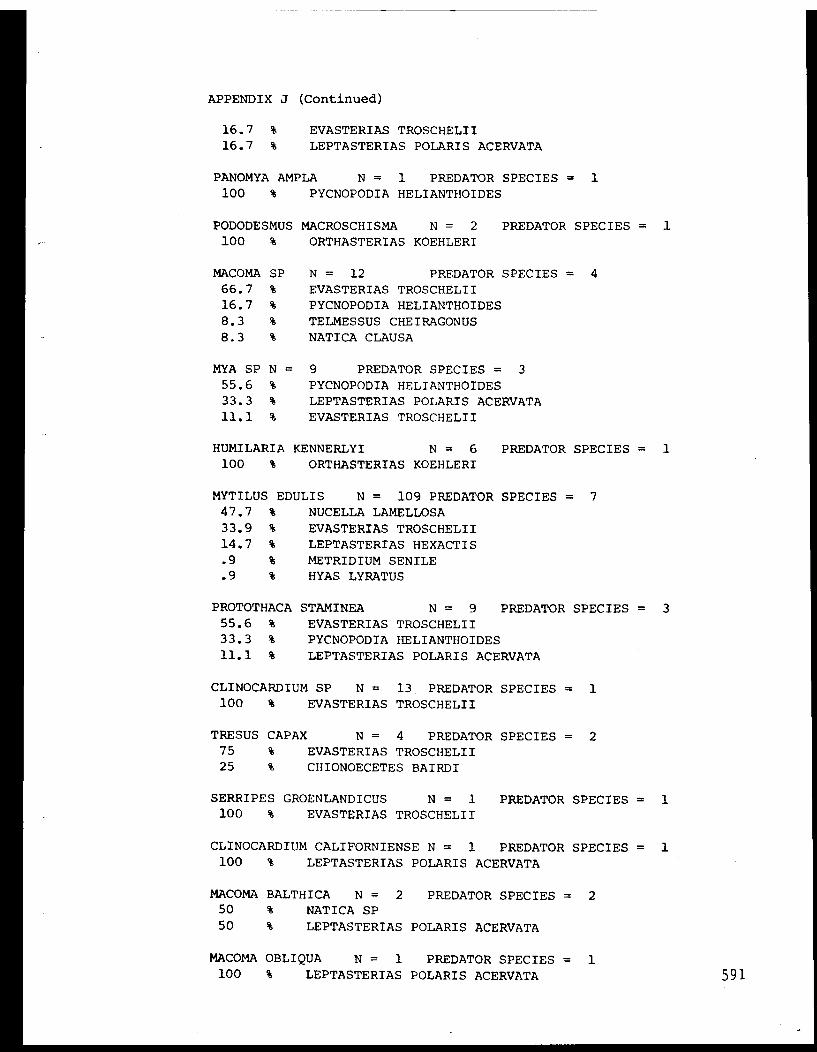
APPENDIX J (Continued)
591
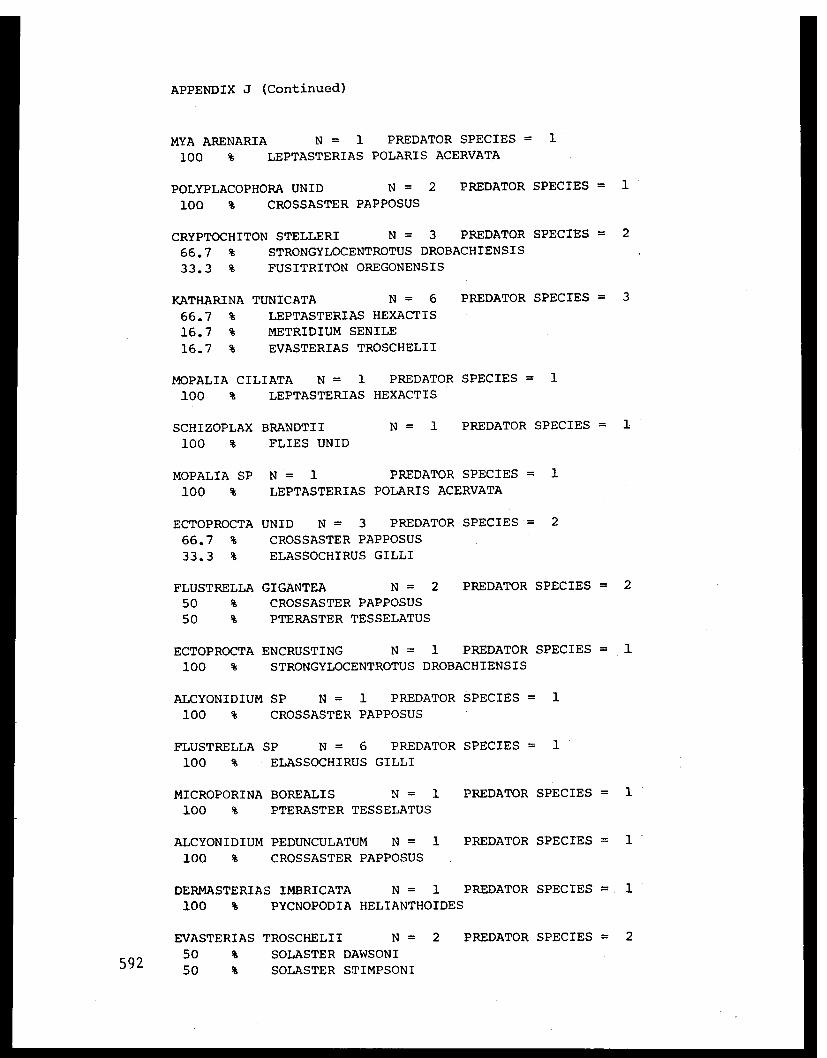
APPENDIX J (Continued)
592
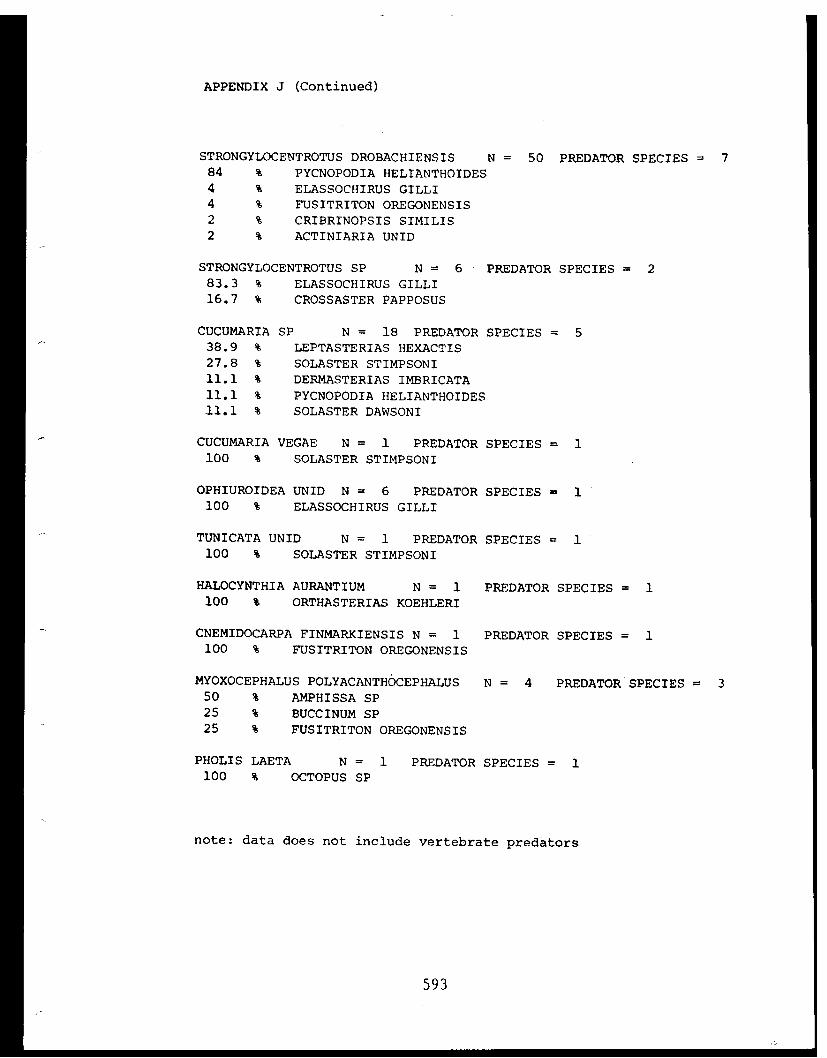
APPENDIX J (Continued)
593
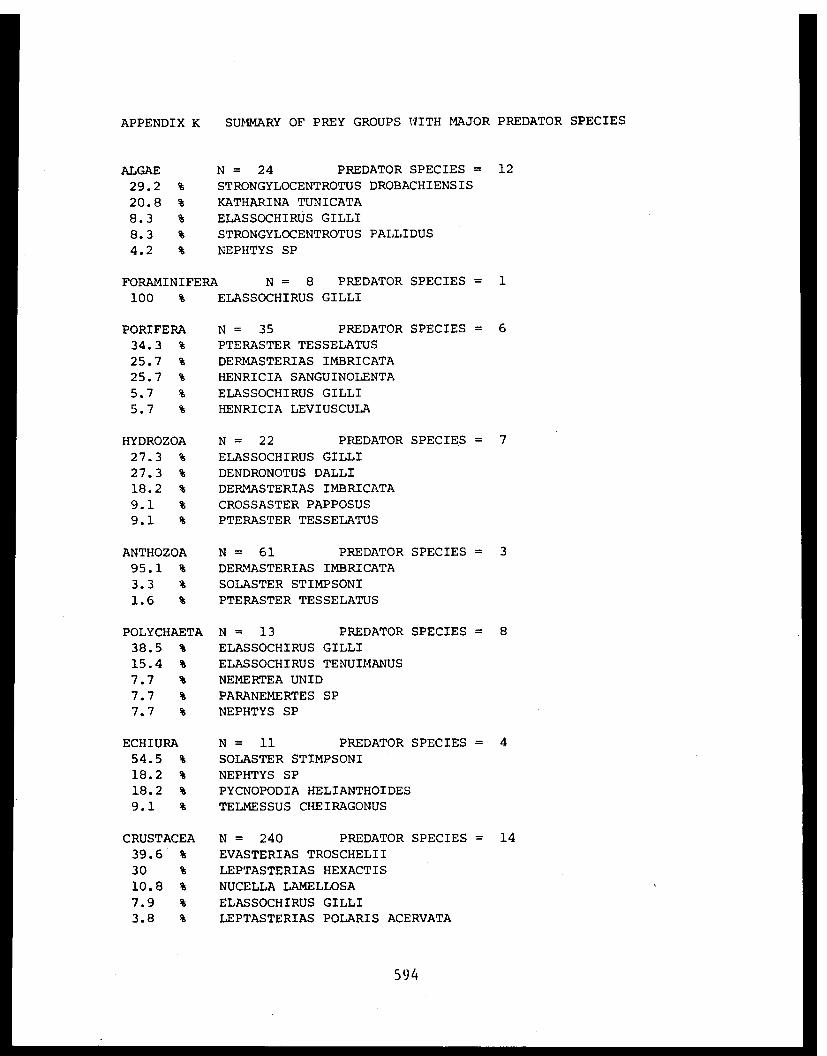
APPENDIX K SUMMARY OF PREY GROUPS WITH MAJOR PREDATOR SPECIES
594

APPENDIX K (Continued)
595
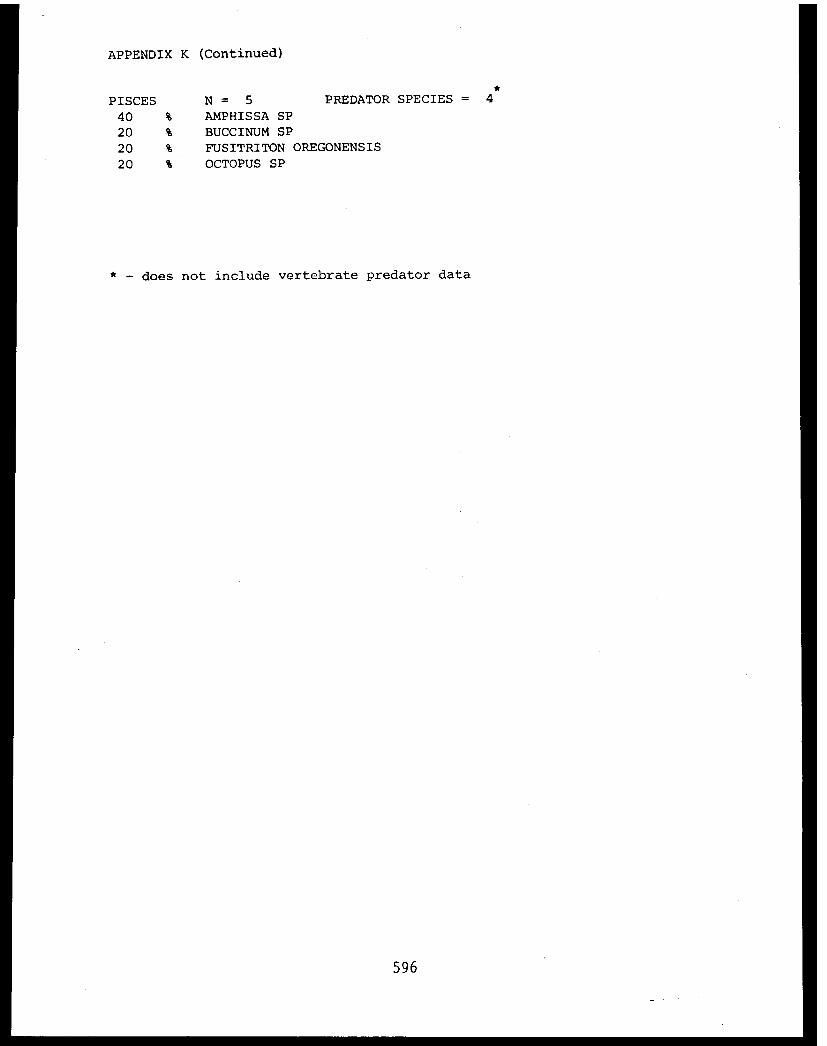
APPENDIX K (Continued)
596
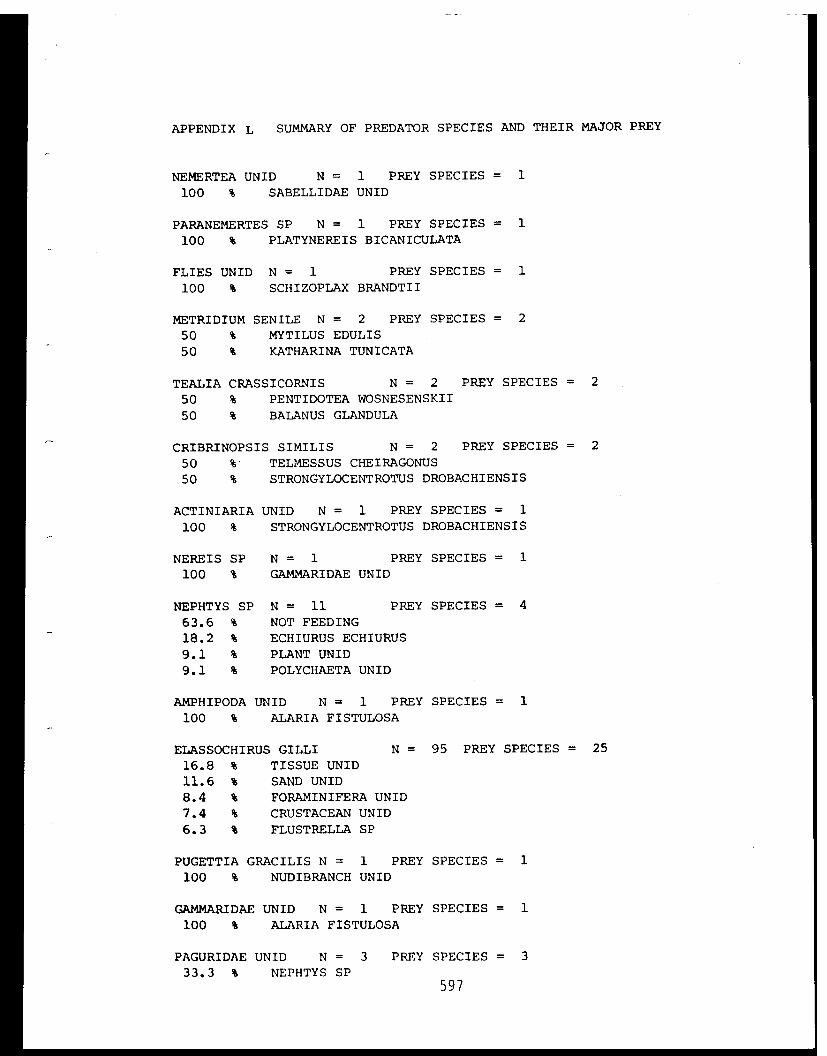
APPENDIX L SUMMARY OF PREDATOR SPECIES AND THEIR MAJOR PREY
597
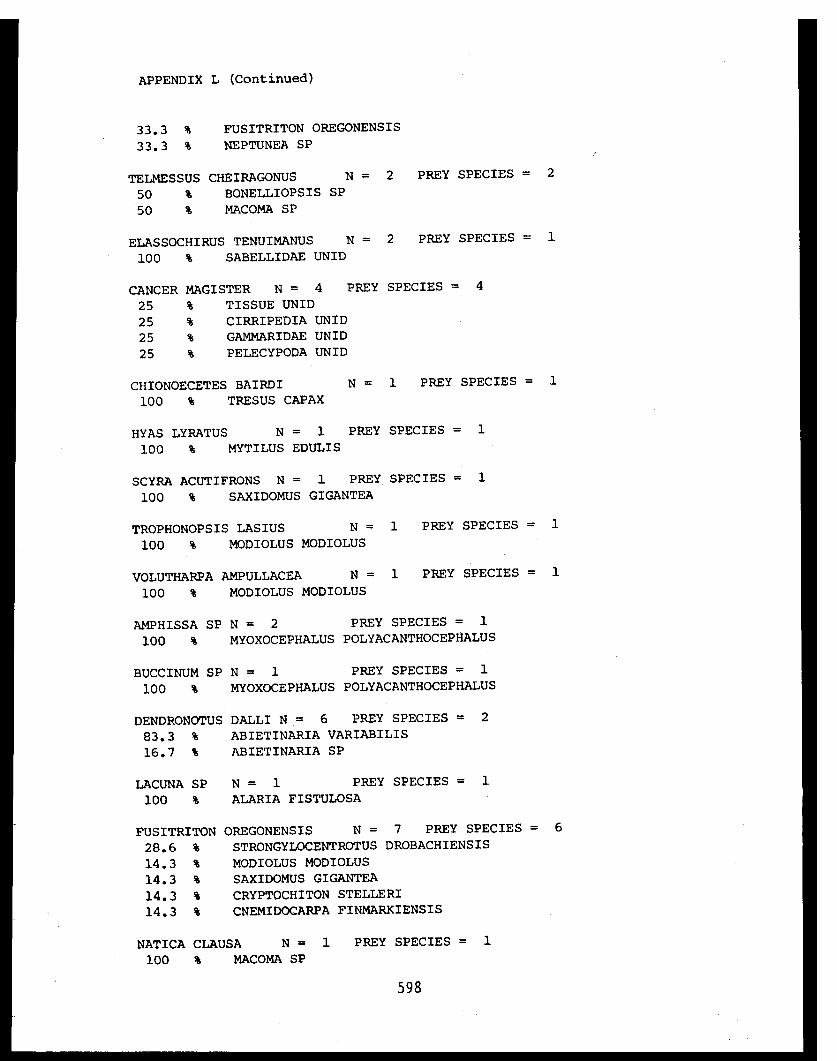
APPENDIX L (Continued)
598

APPENDIX L (Continued)
599
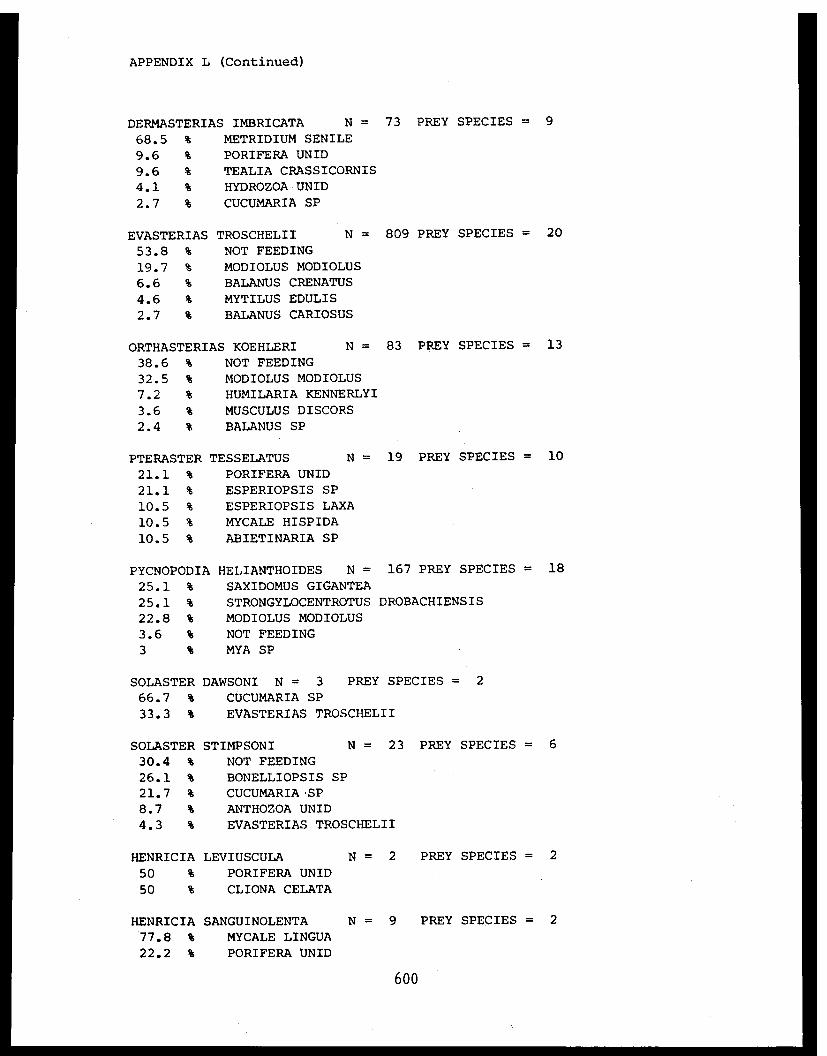
APPENDIX L (Continued)
600
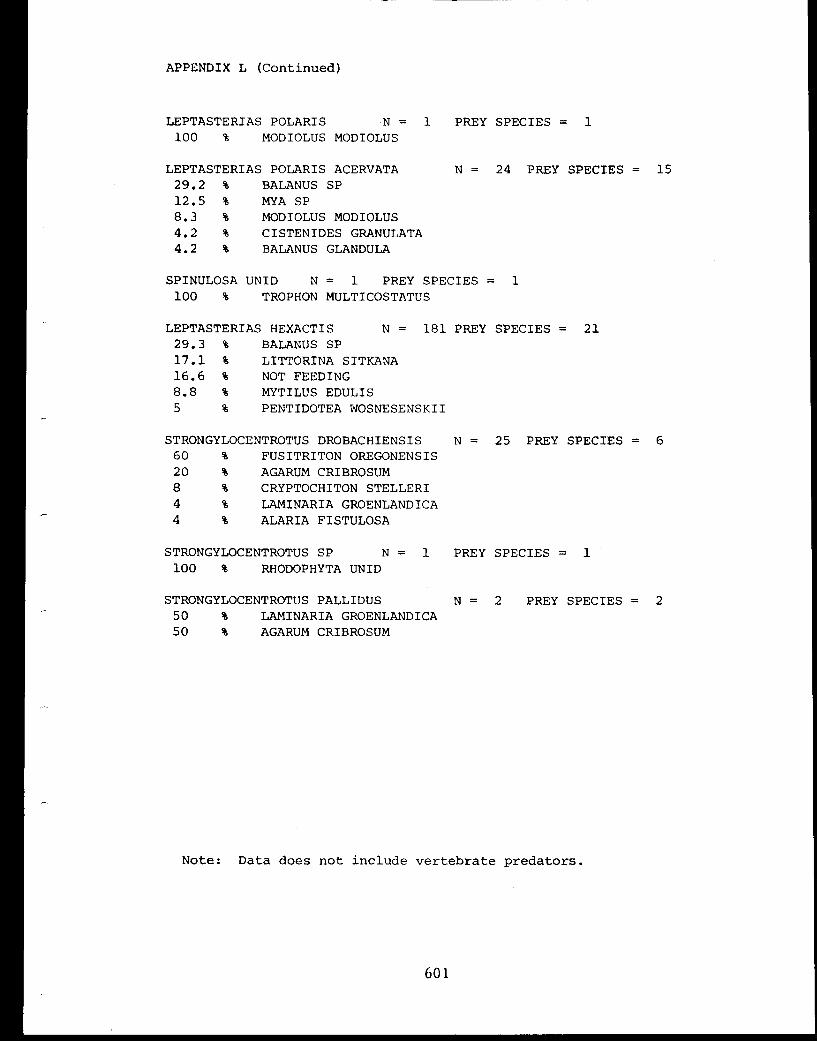
APPENDIX L (Continued)
601
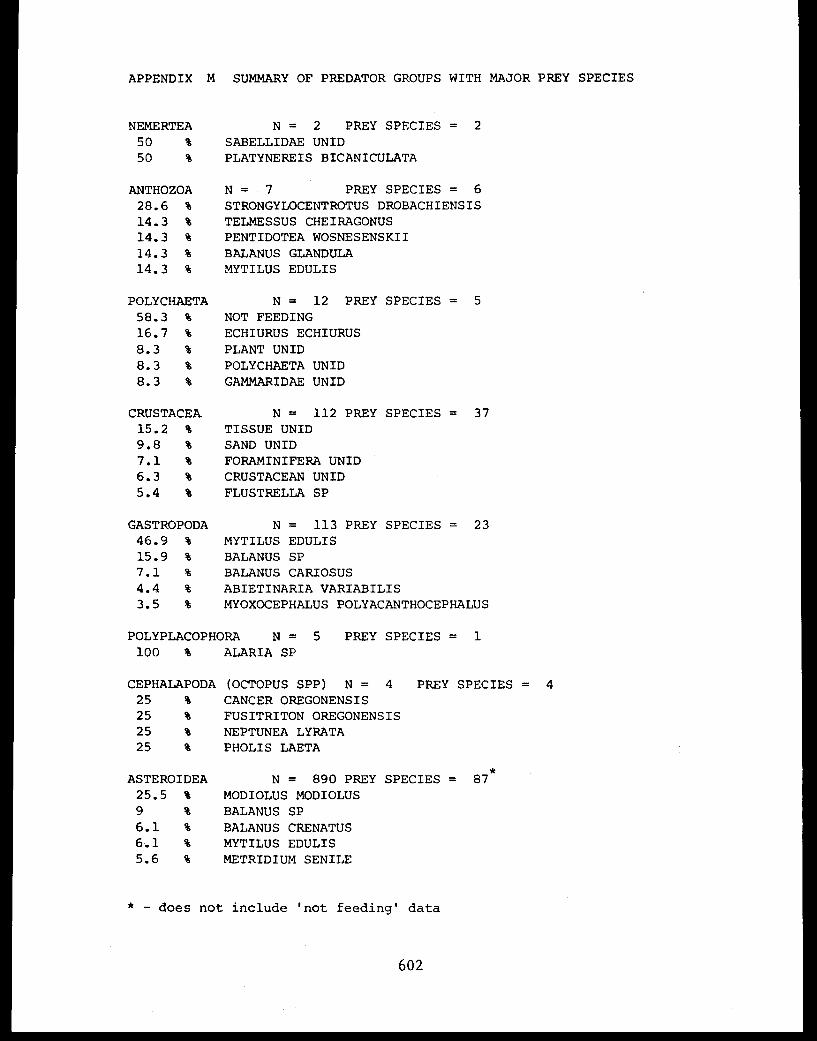
APPENDIX M SUMMARY OF PREDATOR GROUPS WITH MAJOR PREY SPECIES
602
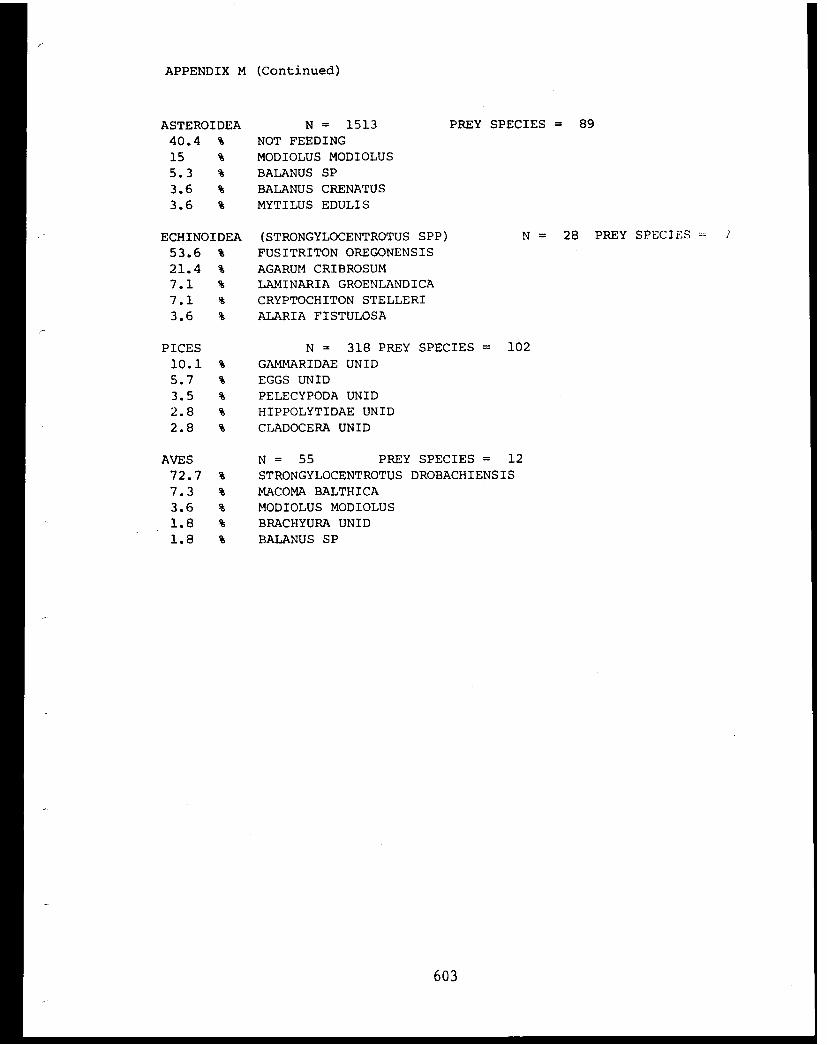
APPENDIX M (Continued)
603
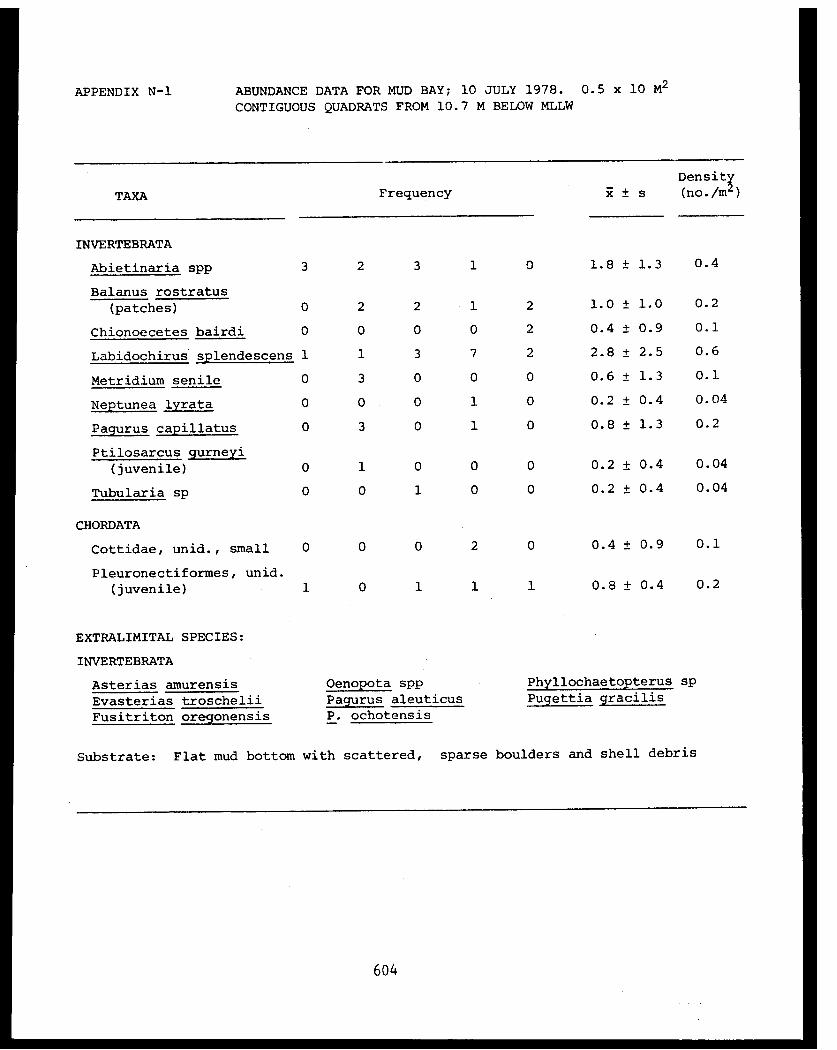
APPENDIX N-1 ABUNDANCE DATA FOR MUD BAY; 10 JULY 1978. 0.5 x 10 M²
CONTIGUOUS QUADRATS FROM 10.7 M BELOW MLLW
604

APPENDIX N-2 ABUNDANCE DATA FOR MUD BAY; 10 JULY 1978. 0.5 x 5 M² CONTIGUOUS QUADRATS FROM 10.7 M BELOW MLLW

APPENDIX N-3 ABUNDANCE DATA FOR SELECTED SPECIES FROM MUD BAY; 10 JULY 1978
606
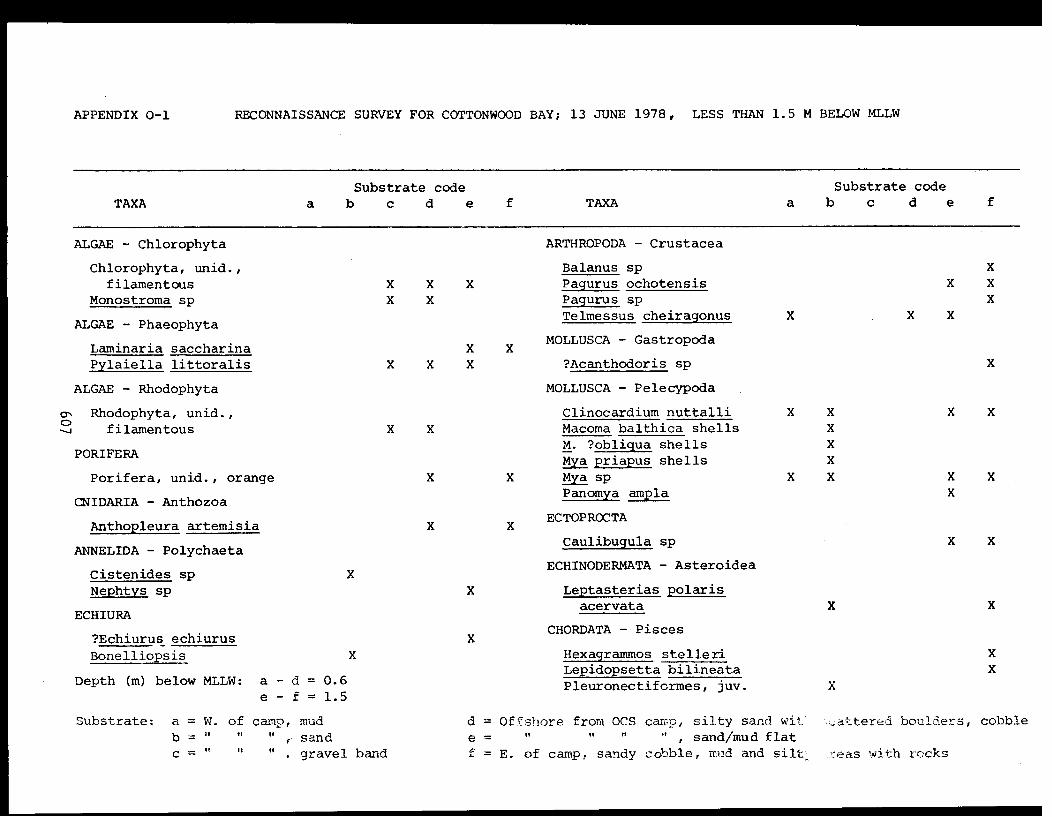
APPENDIX 0-1 RECONNAISSANCE SURVEY FOR COTTONWOOD BAY; 13 JUNE 1978, LESS THAN 1.5 M BELOW MLLW

APPENDIX 0-2 ABUNDANCE DATA FOR SELECTED SPECIES FROM COTTONWOOD BAY SUBTIDAL
AREA; 13 JUNE 1978. ¼ M² SQUARE QUADRATS FROM LESS THAN 1.5 M
BELOW MLLW
608

APPENDIX P-l ANIMAL ABUNDANCE DATA FOR OIL BAY SUBTIDAL AREA; 4 AUGUST 1978.0.5 X 30 M² BAND TRANSECTS FROM 1.2 M BELOW MLLW
609
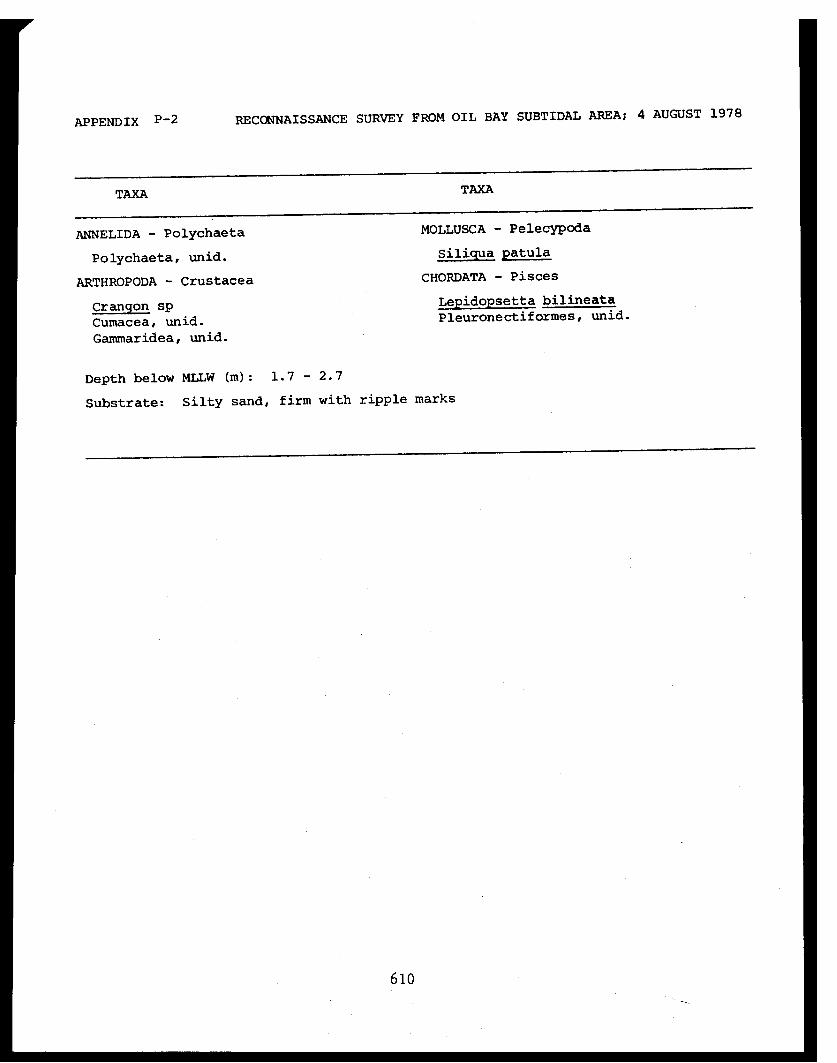
APPENDIX P-2 RECONNAISSANCE SURVEY FROM OIL BAY SUBTIDAL AREA; 4 AUGUST 1978
610
APPENDIX V
THESIS - FEEDING HABITS OF CRANGONID SHRIMPS AND SOMEASPECTS OF SEDIMENT-DETRITAL FOOD SYSTEMS IN
LOWER COOK INLET, ALASKA
611
FEEDING HABITS OF CRANGONID SHRIMPS AND SOME ASPECTS OF
SEDIMENT-DETRITAL FOOD SYSTEMS IN LOWER COOK INLET, ALASKA
A
THESIS
Presented to the Faculty of the
University of Alaska in partial fulfillment
of the Requirements
for the Degree of
MASTER OF SCIENCE
By
Randy L. Rice, B.A. (Honors)
Fairbanks, Alaska
May 1980
611 i
ABSTRACT
Feeding habits of crangonid shrimps and certain aspects of their
relationship with the sediment-detrital food system in Cook Inlet,
Alaska, were investigated from 1977 to 1979. A wide variety of prey
items were utilized including small crustaceans (35% frequency of occur-
rence) and polychaetes (24% frequency of occurrence). After digestion
of organic constituents, the inorganic sediment component averaged 55%
of the stomach contents on a dry weight basis. Sediment contained up
to 14.5 mg organic carbon per gram sediment. Respiration rate of
Crangon dalli averaged 25.7 µ1 O[subscript]2 g[superscript]-1 hr[superscript]-1 . The daily percent energy
potential available to crangonids from sediment-detrital and bacterial
carbon was estimated. On stations examined this potential ranged from
4.3% to 18.6% for sediment total organic carbon and up to 5.3% for the
bacterial carbon fraction. A theoretical maximum potential of 40% of
daily energy needs from sediment total organic carbon and 17.4% from the
bacterial carbon fraction was calculated. Although crangonids in this
area cannot meet all of their energy needs by ingestion of sediment,
sediment carbon may be supplemental to an opportunistic feeding style.
This may enhance their ability to survive in a wide range of habitats.
Feeding habits of crangonid shrimp and sediment-detrital quality was ob-
served to be related to previously described oceanographic conditions in
Cook Inlet.
613
ACKNOWLEDGEMENTS
I wish to acknowledge the assistance of my advisory committee; Dr.
H. M. Feder, Dr. C. Feist, Dr. V. Alexander, and Dr. W. S. Reeburgh.
Dr. Dan Holleman, Dr. M. J. Klug, A. J. Paul, Nancy Ricci, Steve Jewett,
and Joan Forshaug offered their time and assistance on various portions
of the project. Kristy McCumby did the taxonomic work on shrimp stomach
contents. Dr. R. Griffiths did the epifluorescence microscopy. Support
also came from the staff of the Seward Marine Station and the crews of
NOAA Ships Surveyor and Miller Freeman. This work was supported under
contract #03-5-022-56 between the University of Alaska and NOAA, Depart-
ment of Commerce through the Outer Continental Shelf Environmental
Assessment Program to which funds were provided by the Bureau of Land
Management, Department of Interior.
614
TABLE OF CONTENTS
ABSTRACT . . . . . . . . . . . . . . . . ... . . . . . . . . .. . 613
ACKNOWLEDGEMENTS ........ .. . . . . . . . . . . ...... . 614
LIST OF FIGURES. . . . . . . . . . . . . . . . . ... .. ... . .616
LIST OF TABLES . . . . . . . . . . . . . . . . . .. .. .. . 617
INTRODUCTION . . . . . . . . . . . . . . . . ........ . . . . . . . 618
The Study Area - Cook Inlet, Alaska . . . . . . . . ... .619
Crangonid Shrimp. . . . . . . . . . . . . . . . . ... . . ...... 623
METHODS. . . . . . . . . . . . . . . . . . . . . . . . . . . . 625
RESULTS. . . . . . . . . . . . . . . . . ... . . . . . .... . . 629
Food, Prey, Feeding Habits. . . . . . . . . . . . .. .. . 629
Gut Inorganic Sediment Content. . . . . . . . . . . .... ... 631
Microbial Biomass of Sediment . . . . . . . . . . . .... ... 634
Carbon Values of Sediments. . . . . . . . . . . . . .... ... 634
Respiration, Metabolic Rate . . . . . . . . . . . . .... ... 639
DISCUSSION ........................... .... ......... .. . 643
Summary and Conclusions ......................... 649
REFERENCES . . . . . . . . . . . . . . . . ... . . . . .... . . 651
APPENDIX - ASSIMILATION OF BACTERIAL CARBON BYCRANGONID SHRIMP. . . . . . . . . . . . . . . ... . . 654
Preface ......................... ......................... . 655
Introduction. . . . . . . . . . . . . . .......... .. . . 656
Methods . .................. . . . . . . . 657
Results ................... . . . . . . . 660
Discussion. . . . . . . . . . . . . . . . . . . . . . . .. 662
References. . ................. . . . . . . 665
615
LIST OF FIGURES
Figure 1. Lower Cook Inlet Benthic Stations . . . . . . . . . . .620
Figure 2. Net surface circulation in Lower CookInlet ......................... 622
Figure 3. Feeding periodicity of Crangon onStation 62. . . . . . . . . . . . . ..... .... .. 632
Figure 4. Relationship of bacterial and organiccarbon values of sediment from selectedstations in lower Cook Inlet. . . . . . . . . . .. . .640
Appendix Figure 1. Original conception of radio-isotope experiments. . . . . . . . . . .. . .658
Appendix Figure 2. Previously cultured labeledbacteria approach. . . . . . . . . . . .... .659
Appendix Figure 3. Experimental set up for closedmini-ecosystem approach. . . . . . . . . . . . 661
Appendix Figure 4. Activity of clam tissue homoge-nates. . .......... . ..... . ... 666
Appendix Figure 5. Activity of individual Crangondalli tissue homogenates . . . . . . . . . . . 671
Appendix Figure 6. Activity of Crangon dalli tissuesamples. . .......... . .. . . . 673
616

LIST OF TABLES
Table 1. Food of Cook Inlet Crangon dalli . . . . . . . . . ... . 630
Table 2. Inorganic Sediment Component in GutContents of Lower Cook Inlet Crangon . . . . . . . ... . 633
Table 3. Microbial Biomass of Cook Inlet Sedi-ment Samples . . . . . . . . . . . . . ... . . .... . 635
Table 4. Viable Counts of Lower Cook InletSediment Samples ................... . 636
Table 5. Carbon Content of Cook Inlet Sediments . . . . . . .. . .637
Table 6. Respiration Rate of Crangon dalliat 4.5°C . . . . . . . . . . . . . .. . . . .. . 641
Table 7. Oxygen Consumption and Carbon DioxideEvolution of Crangon dalli at 4.5°C. . . . . . . . ... .642
Table 8. Relationship of Oceanographic Condi-tions with Sediment Quality andMaximum Sediment Contribution to theEnergy Budget of Crangon sp. ................... 647
Appendix Table 1. Sample Preparation and LiquidScintillation Information . . . . . . . . . . . 663
Appendix Table 2. [superscript]14 CO[subscript]2 Evolution from Bacterial
Growth. . . . . . . . . . . . . . . . .. .. . .. 668
Appendix Table 3. Activity of Sediment SamplesDuring Feeding Trial. . . . . . . . . . .... .669
Appendix Table 4. 14-C Label Account for Mini-Ecosystem Bacterial Growth andShrimp Feeding Trial. . . . . . . . . . .... .670
617
INTRODUCTION
Sediment-detrital food systems are currently an area of intensive
research (Baker and Bradnam, 1976; Fenchel and Jørgensen, 1977; Kofoed,
1975, Rieper, 1978; Tenore, 1975; 1977). A significant number of
benthic dwelling invertebrates meet their energetic needs by ingestion
of sediment enriched with bacteria and detritus to varying degrees. Of
interest is the importance of bacteria in the nutrition of these detri-
tal feeding animals. For instance, it has been demonstrated that some
detrital feeding animals assimilate estuarine detritus and its associ-
ated bacteria (Adams and Angelovic, 1970) and growth efficiency is in
some cases higher when bacteria enriched food sources are included in
the diet (Kofoed, 1975). Further, some authors feel that bacteria may
play a central role in the energetic pathways of these food systems
(Fenchel and Jørgensen, 1977).
It is of interest to examine the dynamics of detrital food systems
in oil and natural gas producing areas, such as Cook Inlet, Alaska,
where hydrocarbons may become associated with sediments. Oil and gas
exploitation and related potential disturbances in Alaska waters has
led to a series of studies by the Outer Continental Shelf Environmental
Assessment Program (OCSEAP). In Cook Inlet, Alaska, studies have estab-
lished baseline data on distribution, abundance, and trophic relation-
ships of nearshore benthic communities (Feder et al., 1980), microbial
activity (Griffiths and Morita, 1979), and sedimentation characteristics
(Larrance, 1979).
618

The Study Area - Cook Inlet, Alaska
Cook Inlet is a positive, partially-mixed estuary located north of
the Gulf of Alaska in the southcentral portion of the state in an area
surrounded by mountains and glaciers (Figure 1). The inlet is some
370 km long in a northeast-southwest direction, and 139 km in width at
the mouth. The average depth is approximately 60 m with depths to 200 m
at the mouth. For the purposes of this report, "lower" Cook Inlet
encompasses the area from Cape Douglas in the south to Chinitna Bay in
the north. Other authors typically consider the forelands region as
the northern limit of "lower" Cook Inlet (Burbank, 1974).
Circulation in the inlet has been previously described (Burbank,
1977). Circulation is thought to be primarily tidal, modified by the
Coriolis effect and morphology of the basin. Currents to 6.5 kts may
be generated by tides. Oceanic water enters the inlet from the east
via the Alaska Current. Water is carried into the inlet on flood tides
and flows north along the eastern half of the upper inlet. On the ebb
tide relatively fresh silt-laden water from the upper inlet is carried
out along the western shores. Incoming oceanic water has been charac-
terized as saline (32°/oo) relative to the out-flowing water (28-29°/oo).
The water column is well mixed along the eastern shore from the southern
tip of the Kenai Peninsula north. Along the western shore the fresh
water outflow stratifies on top of more saline water. Fresh water
input to the inlet is supplied primarily by the Susitna River and Knik
Arm at the head of the inlet. The influence of wind on the general
circulation of the inlet is not fully understood. Burbank (1977) has
619
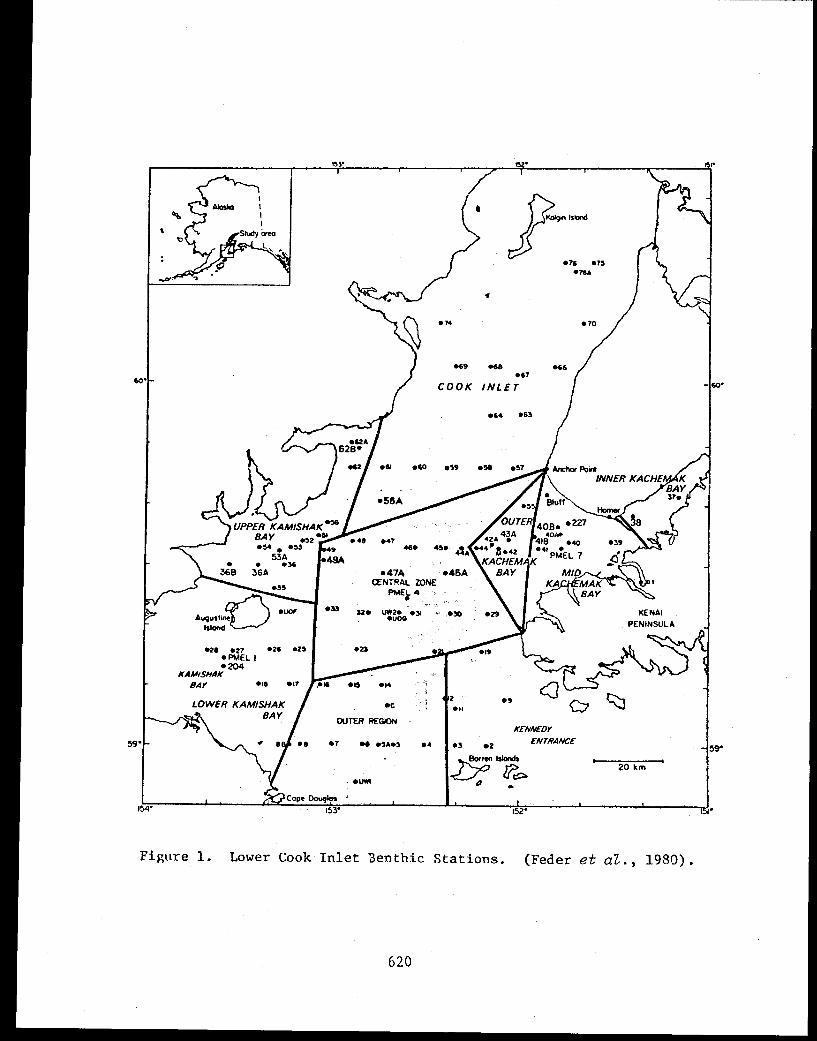
Figure 1. Lower Cook Inlet Benthic Stations. (Feder et al., 1980).
620
prepared a generalized net surface circulation scheme in lower Cook Inlet
(Figure 2).
Two important features and areas of specific interest in lower Cook
Inlet are Kamishak and Kachemak Bays. These are areas of high biolog-
ical activity and are important to commercial fisheries (Burbank, 1977;
Crow, 1977; Feder et al., 1980; Rice et al., 1980). Gyre systems are
present in inner and outer Kachemak Bay at least for part of the year.
Eddies and gyres are also suggested in the Augustine Island, Kamishak
Bay area from drift card studies, although little additional information
is available for this area (Burbank, 1977). During stormy periods
(September-November) the gyres may break down. Residence time of water
in the outer Kachemak Bay gyre system has been estimated at 15 days, with
the source of this water perhaps upwelling near Elizabeth Island. This
rich water may in part account for high primary production observed in
the Kachemak Bay region. Larrance (1979) reports values to 7.8 g m[superscript]-2
day primary production for Kachemak Bay and 6.8 g m day[superscript]- 1 for
Kamishak Bay.
Sediments in lower Cook Inlet have been characterized as facies 3,
sand with variable amounts of gravel (Sharma and Burrell, 1970). It was
noted that finer material is deposited in Kamishak Bay. Feder (personal
communication) has noted similar patterns of patchiness of sand and clays
observed in benthic grab studies. Muds and clays predominate in inner
and outer Kachemak Bay, as well as in Kamishak, with coarser sands ob-
served in middle inlet and western stations.
621
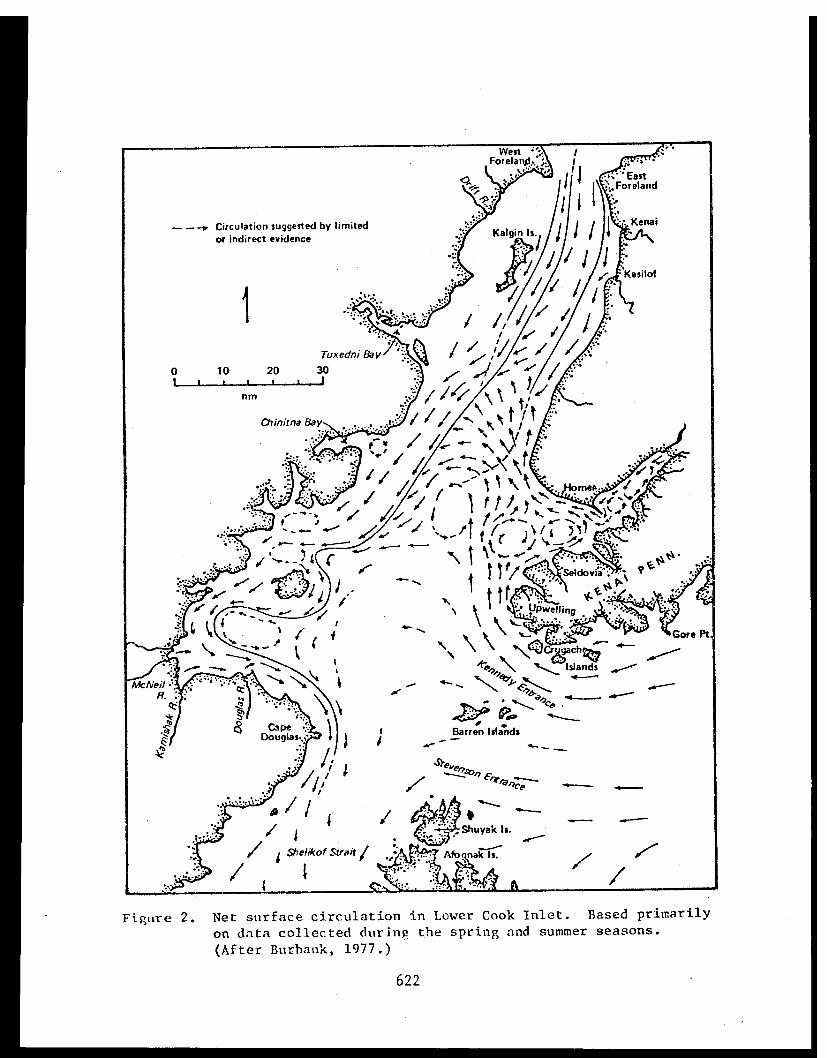
Figure 2. Net surface circulation in Lower Cook Inlet. Based primarily
on data collected during the spring and summer seasons.
(After Burbank, 1977.)
622
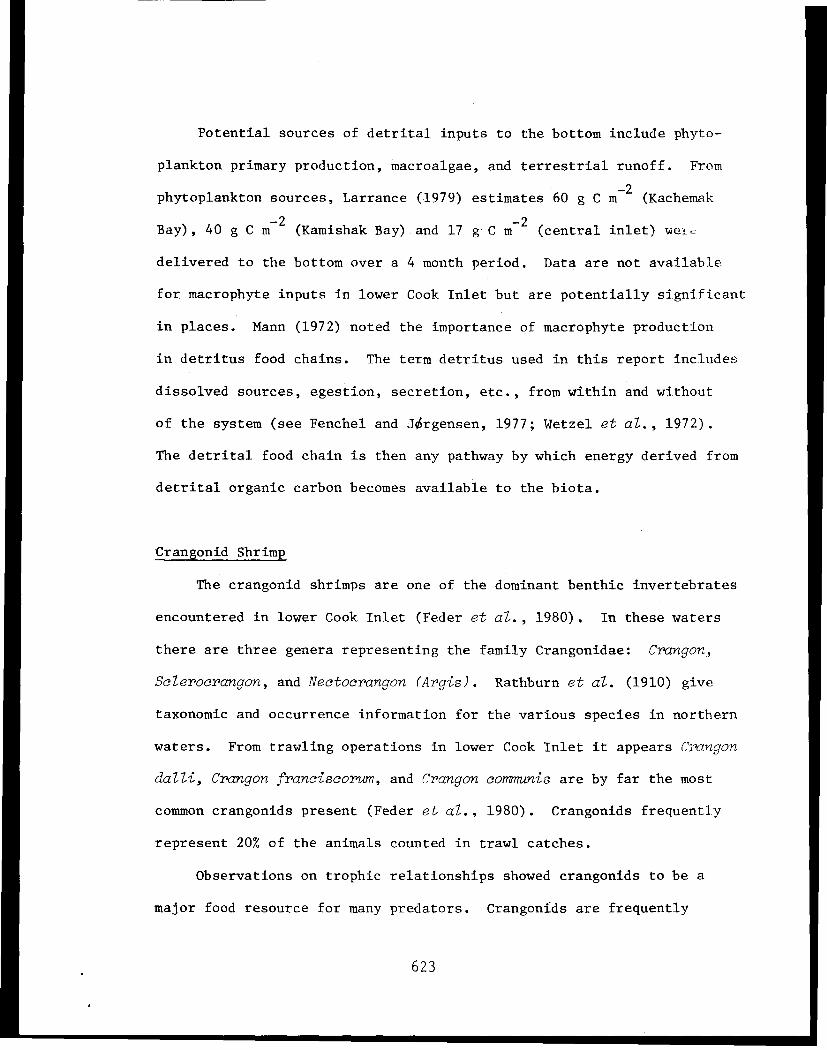
Potential sources of detrital inputs to the bottom include phyto-
plankton primary production, macroalgae, and terrestrial runoff. From
phytoplankton sources, Larrance (1979) estimates 60 g C m[superscript]-2 (Kachemak
Bay), 40 g C m[superscript]-2 (Kamishak Bay) and 17 g C m[superscript]-2 (central inlet) wer e
delivered to the bottom over a 4 month period. Data are not available
for macrophyte inputs in lower Cook Inlet but are potentially significant
in places. Mann (1972) noted the importance of macrophyte production
in detritus food chains. The term detritus used in this report includes
dissolved sources, egestion, secretion, etc., from within and without
of the system (see Fenchel and Jørgensen, 1977; Wetzel et al., 1972).
The detrital food chain is then any pathway by which energy derived from
detrital organic carbon becomes available to the biota.
Crangonid Shrimp
The crangonid shrimps are one of the dominant benthic invertebrates
encountered in lower Cook Inlet (Feder et al., 1980). In these waters
there are three genera representing the family Crangonidae: Crangon,
Sclerocrangon, and Nectocrangon (Argis). Rathburn et al. (1910) give
taxonomic and occurrence information for the various species in northern
waters. From trawling operations in lower Cook Inlet it appears Crangon
datli, Crangon franciscorum, and Crangon communis are by far the most
common crangonids present (Feder et al., 1980). Crangonids frequently
represent 20% of the animals counted in trawl catches.
Observations on trophic relationships showed crangonids to be a
major food resource for many predators. Crangonids are frequently
623
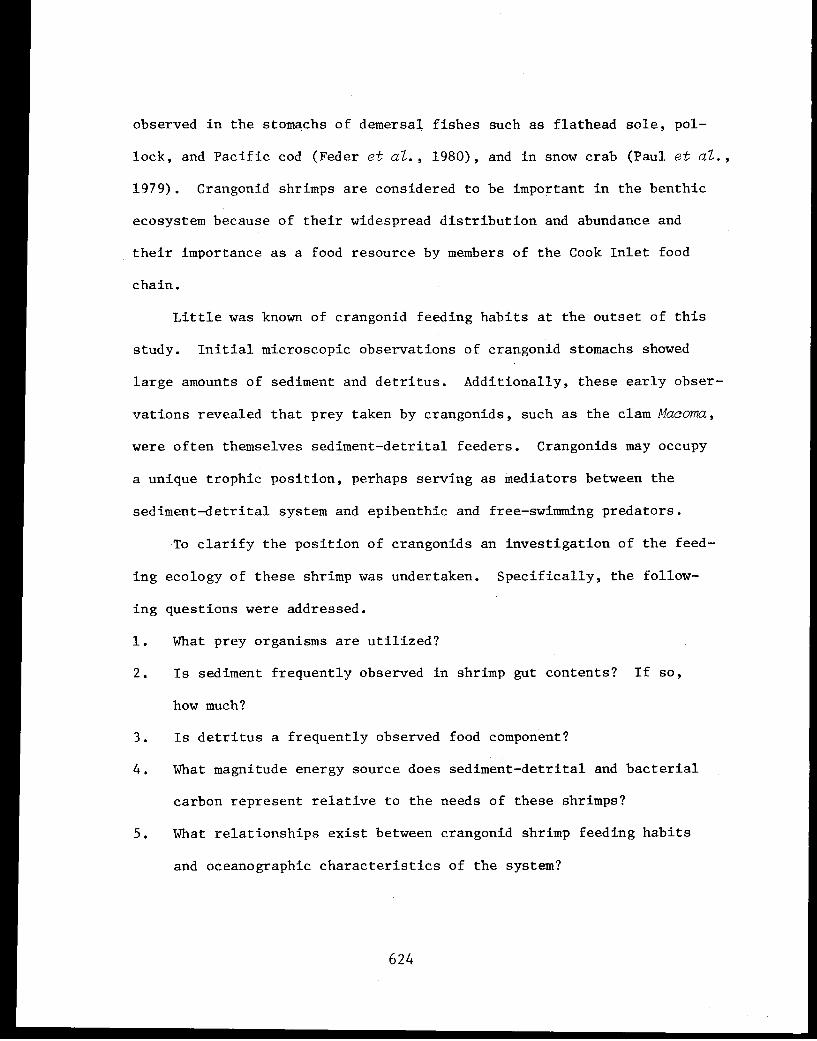
observed in the stomachs of demersal fishes such as flathead sole, pol-
lock, and Pacific cod (Feder et al., 1980), and in snow crab (Paul et al.,
1979). Crangonid shrimps are considered to be important in the benthic
ecosystem because of their widespread distribution and abundance and
their importance as a food resource by members of the Cook Inlet food
chain.
Little was known of crangonid feeding habits at the outset of this
study. Initial microscopic observations of crangonid stomachs showed
large amounts of sediment and detritus. Additionally, these early obser-
vations revealed that prey taken by crangonids, such as the clam Macoma,
were often themselves sediment-detrital feeders. Crangonids may occupy
a unique trophic position, perhaps serving as mediators between the
sediment-detrital system and epibenthic and free-swimming predators.
To clarify the position of crangonids an investigation of the feed-
ing ecology of these shrimp was undertaken. Specifically, the follow-
ing questions were addressed.
1. What prey organisms are utilized?
2. Is sediment frequently observed in shrimp gut contents? If so,
how much?
3. Is detritus a frequently observed food component?
4. What magnitude energy source does sediment-detrital and bacterial
carbon represent relative to the needs of these shrimps?
5. What relationships exist between crangonid shrimp feeding habits
and oceanographic characteristics of the system?
624
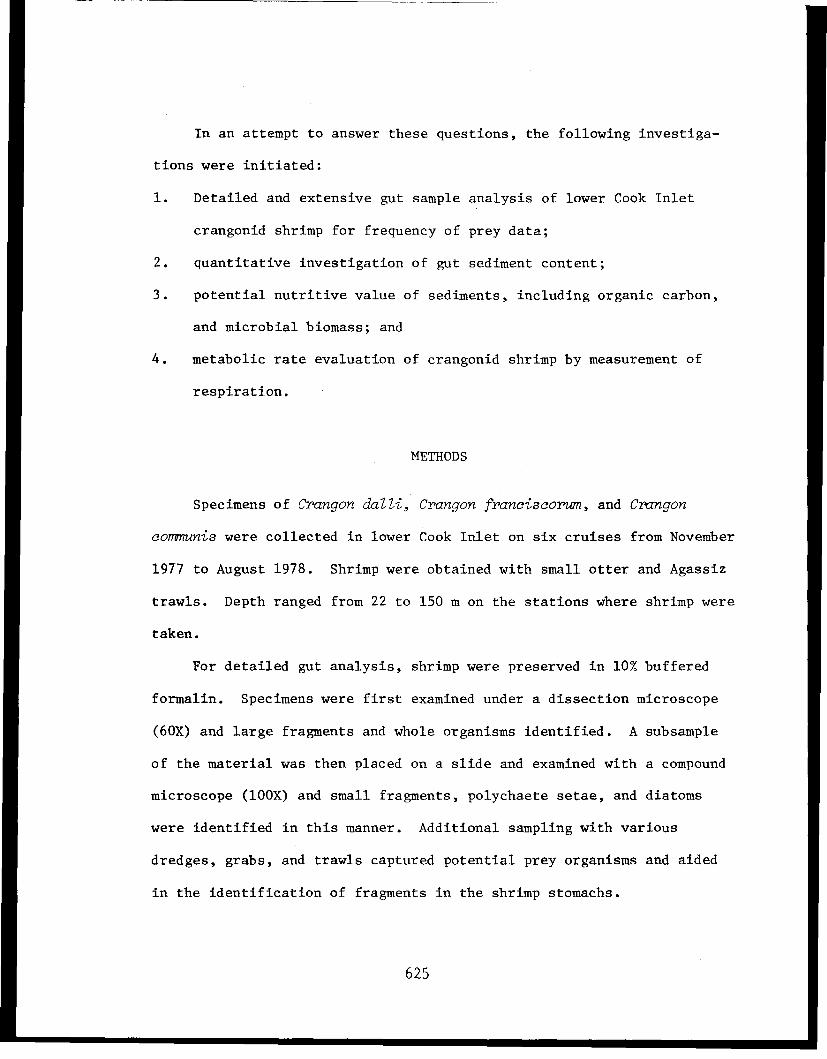
In an attempt to answer these questions, the following investiga-
tions were initiated:
1. Detailed and extensive gut sample analysis of lower Cook Inlet
crangonid shrimp for frequency of prey data;
2. quantitative investigation of gut sediment content;
3. potential nutritive value of sediments, including organic carbon,
and microbial biomass; and
4. metabolic rate evaluation of crangonid shrimp by measurement of
respiration.
METHODS
Specimens of Crangon dalli, Crangon franciscorum, and Crangon
conmmunis were collected in lower Cook Inlet on six cruises from November
1977 to August 1978. Shrimp were obtained with small otter and Agassiz
trawls. Depth ranged from 22 to 150 m on the stations where shrimp were
taken.
For detailed gut analysis, shrimp were preserved in 10% buffered
formalin. Specimens were first examined under a dissection microscope
(60X) and large fragments and whole organisms identified. A subsample
of the material was then placed on a slide and examined with a compound
microscope (100X) and small fragments, polychaete setae, and diatoms
were identified in this manner. Additional sampling with various
dredges, grabs, and trawls captured potential prey organisms and aided
in the identification of fragments in the shrimp stomachs.
625
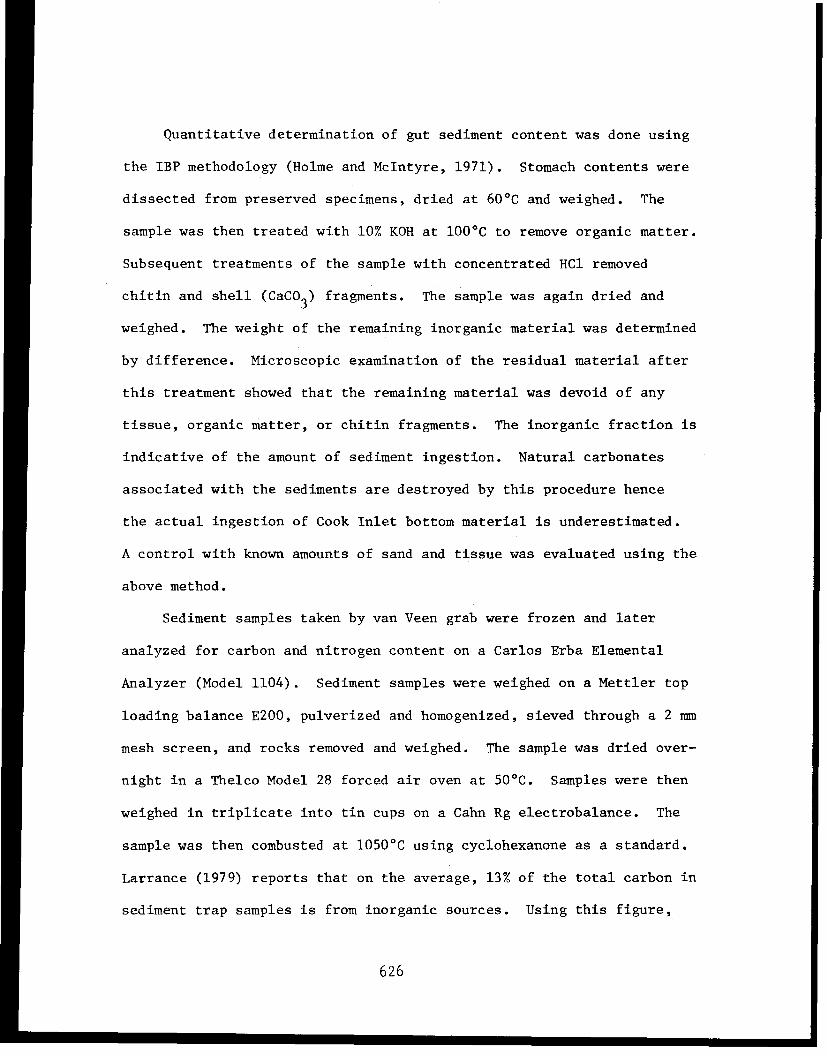
Quantitative determination of gut sediment content was done using
the IBP methodology (Holme and McIntyre, 1971). Stomach contents were
dissected from preserved specimens, dried at 60°C and weighed. The
sample was then treated with 10% KOH at 100°C to remove organic matter.
Subsequent treatments of the sample with concentrated HC1 removed
chitin and shell (CaCO[subscript]3) fragments. The sample was again dried and
weighed. The weight of the remaining inorganic material was determined
by difference. Microscopic examination of the residual material after
this treatment showed that the remaining material was devoid of any
tissue, organic matter, or chitin fragments. The inorganic fraction is
indicative of the amount of sediment ingestion. Natural carbonates
associated with the sediments are destroyed by this procedure hence
the actual ingestion of Cook Inlet bottom material is underestimated.
A control with known amounts of sand and tissue was evaluated using the
above method.
Sediment samples taken by van Veen grab were frozen and later
analyzed for carbon and nitrogen content on a Carlos Erba Elemental
Analyzer (Model 1104). Sediment samples were weighed on a Mettler top
loading balance E200, pulverized and homogenized, sieved through a 2 mm
mesh screen, and rocks removed and weighed. The sample was dried over-
night in a Thelco Model 28 forced air oven at 50°C. Samples were then
weighed in triplicate into tin cups on a Cahn Rg electrobalance. The
sample was then combusted at 1050°C using cyclohexanone as a standard.
Larrance (1979) reports that on the average, 13% of the total carbon in
sediment trap samples is from inorganic sources. Using this figure,
626
organic carbon was computed for lower Cook Inlet stations sampled in
this study.
Bacterial biomass of sediments was obtained from direct counts ob-
tained by epifluorescence microscopy. Sediment samples (10 ml) were
fixed in 1 ml of membrane-filtered (.45 µm) formaldehyde (37%). When
a relatively high number of organisms was present, the samples were
diluted with membrane-filtered seawater. Samples were filtered onto
nucleopore filters with .2 µm pore size. The staining procedure used
was that of Zimmerman and Meyer-Riel (1974). Bacterial cells were counted
using a Zeiss IV Fl epifluorescence condenser microscope fitted with
filters KP 500, KP 490, FT 510, and LP 520. The eyepiece used was KPT W
12.5X. Approximately 50 restriction fields were counted per sample. Only
bodies with distinct fluorescence (either orange or green), clear outline
and recognizable bacterial shape were counted as being bacterial cells.
Using a value of 1 x 10[superscript]-13 g as the amount of carbon per bacterial cell,
the amount of bacterial carbon present in these sediments was calculated
from the number of cells present as determined by the direct count method.
Although a variety of values are available from the literature, this
figure was recommended as appropriate for marine sediment mixed bacterial
populations (M. J. Klug, personal communication). Bacterial carbon in
1 ml sample was converted to a dry weight basis using a factor determined
in the laboratory by drying known volumes of sediments from the various
stations.
Heterotrophic colony forming units (CFU's) were counted on Zobell's
2216E media containing peptone, 5.0 g; FePO[subscript]4, 0.1 g; yeast extract, 1.0 g;
627
Bacto-agar, 15.0 g; "aged" seawater, 1000 ml. Sediment was collected
with a van Veen grab. In several cases plates were done from successive
grabs at one station. The top 1-2 cm of sediment in a grab were removed
and placed in sterile plastic bags (Nasco Whirl-Pak) until they could
be processed. Plating was done at room temperature. Each dilution
tube was mixed using a rotary mixer to facilitate removal of the bacteria
from the sediment particles. 0.1 ml of 10[superscript]-2 through 10[superscript]-5 dilutions were
plated. Five replicates were made at each dilution. Plates were incu-
bated for approximately ten days after which colonies were counted using
a Quebec Colony Counter. Dry sediment weights were determined by rinsing
the 10[superscript]-1 dilutions into pre-weighed beakers, drying them in a drying
oven (105°C) for 24-48 hours and weighing the dry sediment. These
weights were then used to calculate the viable count.
In order to evaluate the potential significance of bacterial carbon
utilization relative to the metabolic demands of the animal, the base
metabolic rate, or carbon demand of the shrimp was determined. This was
achieved by a simple respirometer experiment. Shrimp were placed in
individual flasks with 75 ml of seawater and a small amount of auto-
claved sediment. Carbon dioxide evolved by the animal during the course
of the procedure is trapped in 30% KOH and the Gilson respirometer mea-
sures the resultant decrease in volume. Temperature was maintained at
4.5°C during the course of the analysis (see Umbreit, 1964, for more on
respirometry).
628

RESULTS
Food, Prey, Feeding Habits
Data are tabulated in Table 1 summarizing the frequency of occur-
rence information gathered on Crangon dalli from lower Cook Inlet. Sixty
categories of food were observed in 863 individuals. The most important
food items, based on the frequency of occurrence of identifiable remains
in feeding shrimp, were Crustacea (unknown types) 35% frequency of occur-
rence, Polychaeta (unidentifiable types) 24%, Maldanidae 22%, and various
types of diatoms (naviculoids 23%, Coscinodisceae 18%, and Melosira 26%).
Unidentified organic matter (including animal tissue) was common, 32%,
and sediment was observed in virtually all of the stomachs with contents,
90%. Further, 14 types of polychaete worms were identified with frequency
of occurrence ranging from .4% to 10%. Unidentifiable bivalves were ob-
served in 9% of the stomachs with contents, with 6 additional categories
of identified clams infrequently observed in .6 to 1% of the samples with
contents. In addition to the unidentified Crustacea 7 other crustacean
categories were observed in .5 to 5% of the samples. Gastropoda 3%,
Echinodermata 1%, and Porifera 2% were occasionally observed. Prey items
observed in the stomach samples from the various stations typically
reflect the more abundant organisms observed in grab and dredge samples
at those stations. The prey observed, with few exceptions such as diatoms,
are bottom dwelling organisms.
Though opportunism and generalist feeding behavior are the dominant
feeding modes, active predation also took place in these animals as
629
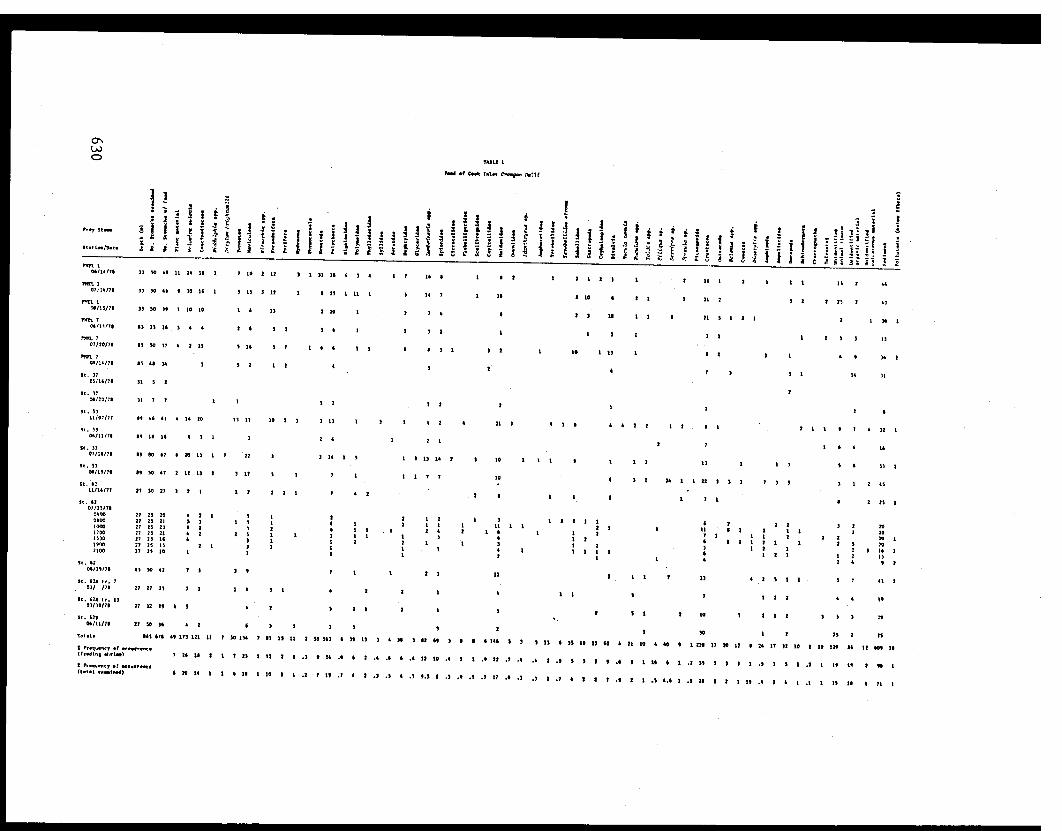
evidenced by type and quantity of contents in certain individual sto-
machs. For example, 4 intact Nuculana spp. (4-6 mm in size) were ob-
served in one individual Crangon datli stomach. It is noteworthy that
both the high frequency of sediment and detritus, and the type of prey
observed in crangonid stomachs suggest these shrimp rely heavily on the
sediment-detrital food system for their nutritive needs. With few excep-
tions (e.g. Teleostei, diatoms, Polynoidae) the organisms utilized as
food are themselves deposit feeding types such as Lumbrineris,
Capetellidae, and Nuculana.
The time series sampling on Station 62 suggests the possibility of
diurnal periodicity in feeding behavior. Figure 3 is a diagram of the
frequency of occurrence of numbers of stomachs with and without contents
in the sample with respect to time. The higher occurrence of stomachs
with contents during daylight hours declining towards evening suggests
the animals commence feeding at night.
Gut Inorganic Sediment Content
Data are summarized in Table 2 for the determination of quantity of
sediment present in crangonid gut samples after digestion of organic
matter by KOH. Samples typically contained more than 50% inorganic
material on a dry weight basis. This amount, based on the contents of
some 487 individuals was consistent, with the exception of samples from
two stations, 40A and 18. The percentage of the sediment component
estimated here is conservative, as controls with known amounts of sand
and tissue showed the method underestimated sediment content 2-14%.
631
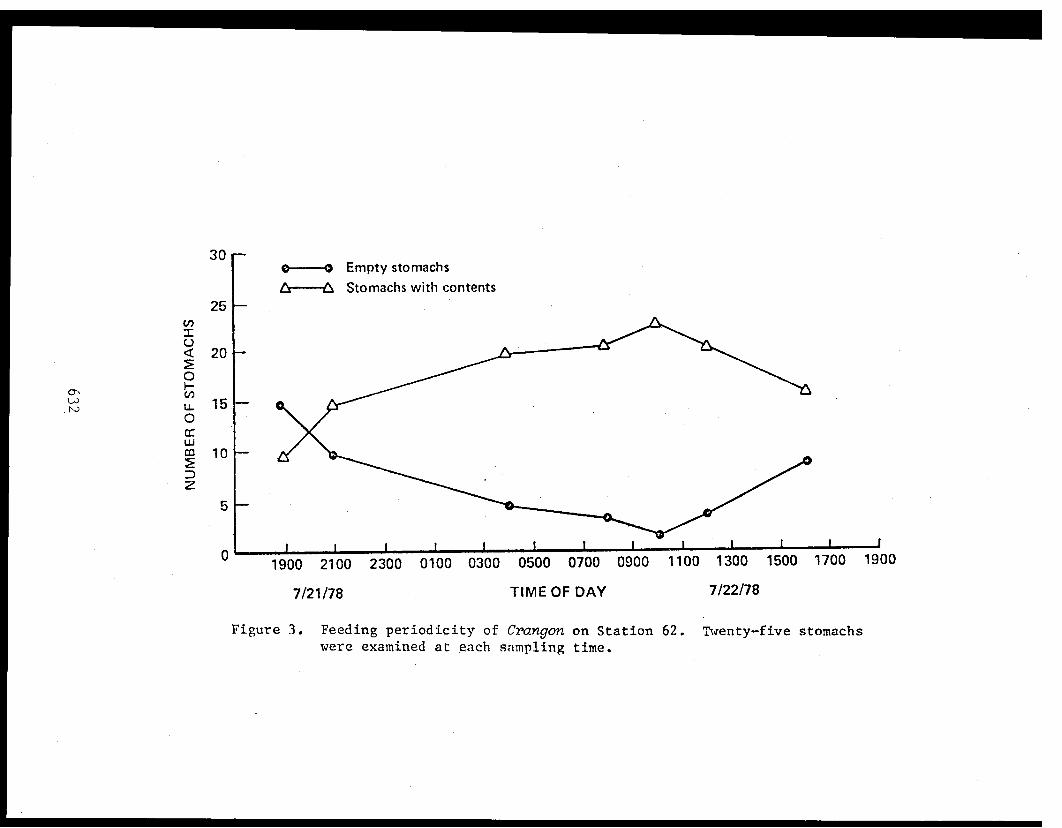
Figure 3. Feeding periodicity of Crangon on Station 62. Twenty-five stomachswere examined at each sampling time.
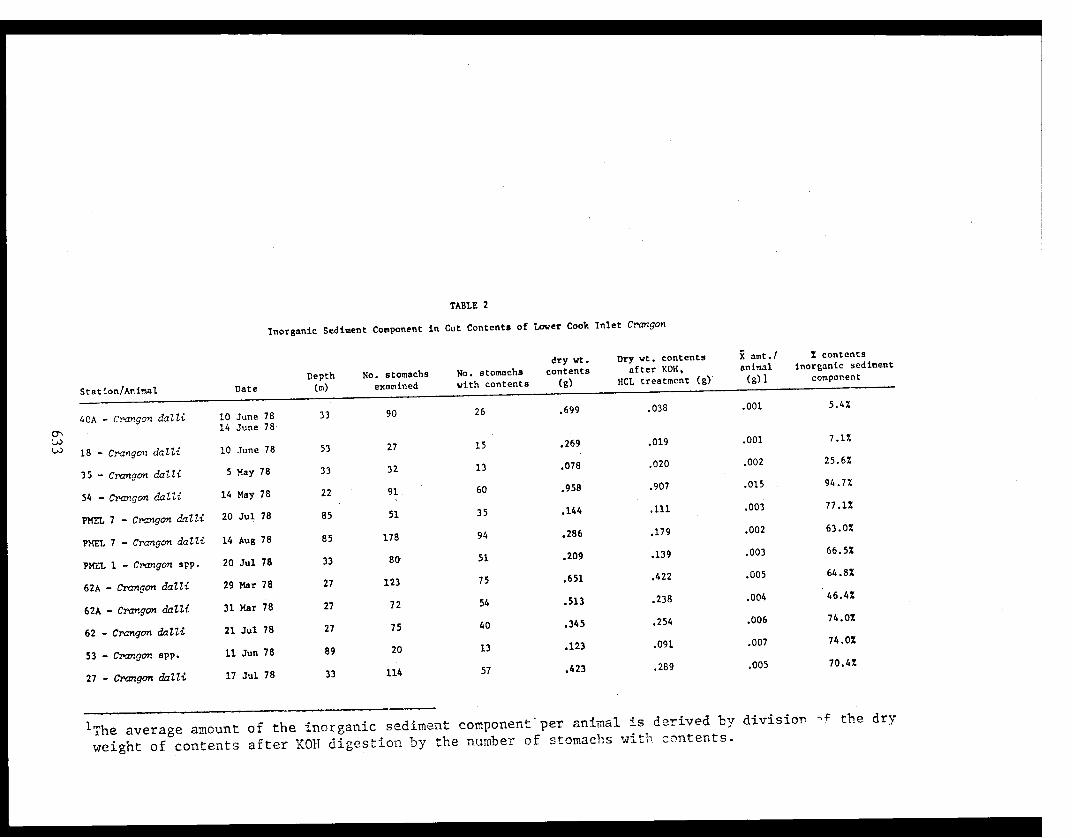
TABLE 2
Inorganic Sediment Component in Gut Contents of Lower Cook Inlet Crangon
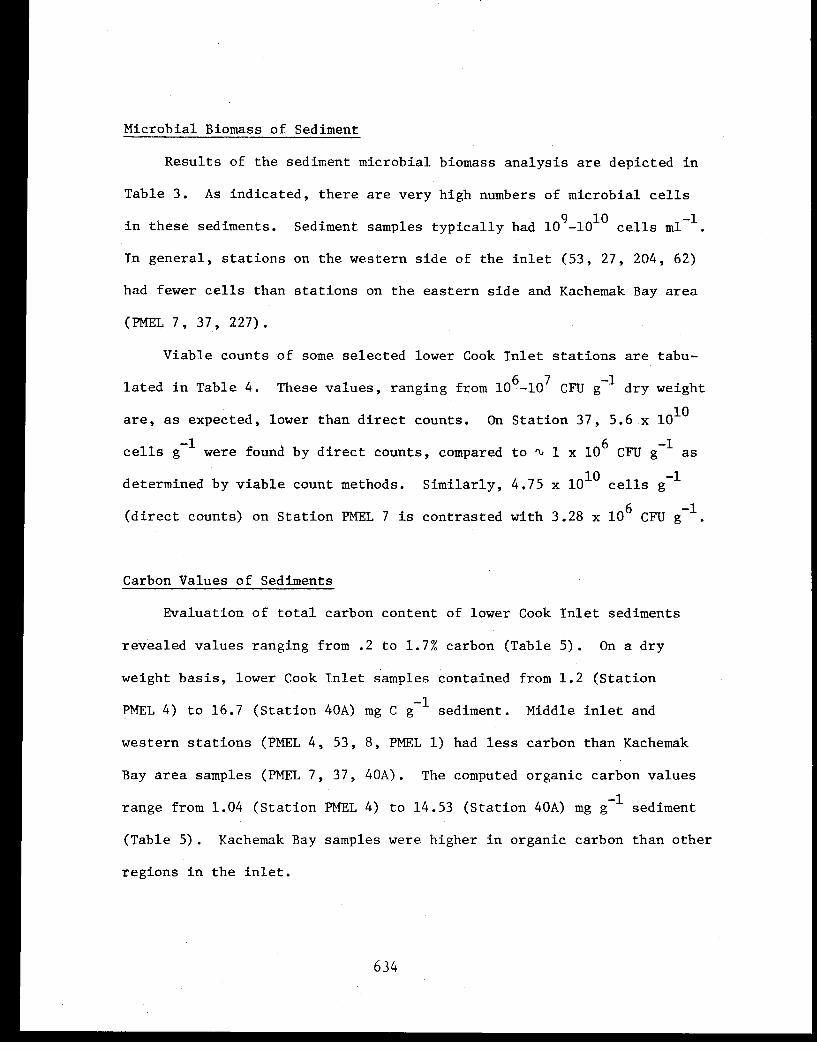
Microbial Biomass of Sediment
Results of the sediment microbial biomass analysis are depicted in
Table 3. As indicated, there are very high numbers of microbial cells
in these sediments. Sediment samples typically had 10[superscript]9-10[superscript]10 cells
ml[superscript]-1. In general, stations on the western side of the inlet (53, 27, 204, 62)
had fewer cells than stations on the eastern side and Kachemak Bay area
(PMEL 7, 37, 227).
Viable counts of some selected lower Cook Inlet stations are tabu-
lated in Table 4. These values, ranging from 10[superscript]6-10[superscript]7 CFU g[superscript]-1 dry weight
are, as expected, lower than direct counts. On Station 37, 5.6 x 10[superscript]10
cells g[superscript]-1 were found by direct counts, compared to ~ 1 x 10[superscript]6 CFU g[superscript]-1 as
determined by viable count methods. Similarly, 4.75 x 10[superscript]10 cells g[superscript]-1
(direct counts) on Station PMEL 7 is contrasted with 3.28 x 10[superscript]6 CFU g[superscript]-1
Carbon Values of Sediments
Evaluation of total carbon content of lower Cook Inlet sediments
revealed values ranging from .2 to 1.7% carbon (Table 5). On a dry
weight basis, lower Cook Inlet samples contained from 1.2 (Station
PMEL 4) to 16.7 (Station 40A) mg C g[superscript]-1 sediment. Middle inlet and
western stations (PMEL 4, 53, 8, PMEL 1) had less carbon than Kachemak
Bay area samples (PMEL 7, 37, 40A). The computed organic carbon values
range from 1.04 (Station PMEL 4) to 14.53 (Station 40A) mg g[superscript]-1 sediment
(Table 5). Kachemak Bay samples were higher in organic carbon than other
regions in the inlet.
634
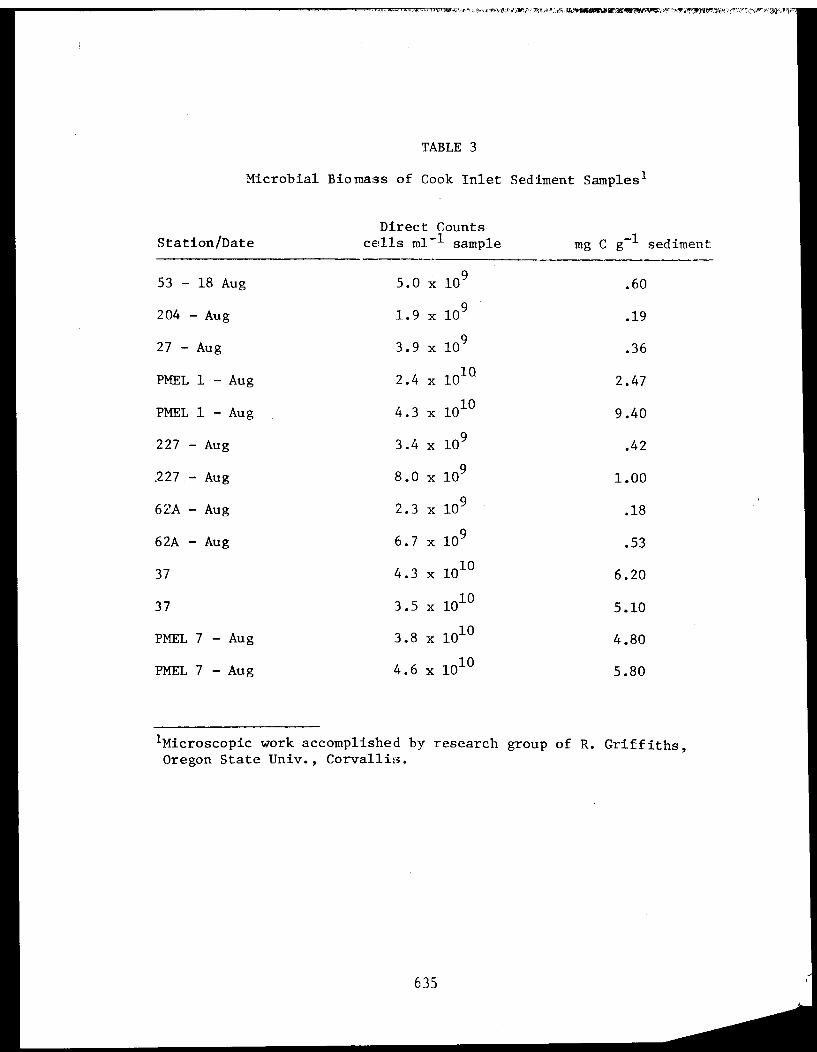
TABLE 3
Microbial Biomass of Cook Inlet Sediment Samples[superscript]1
635
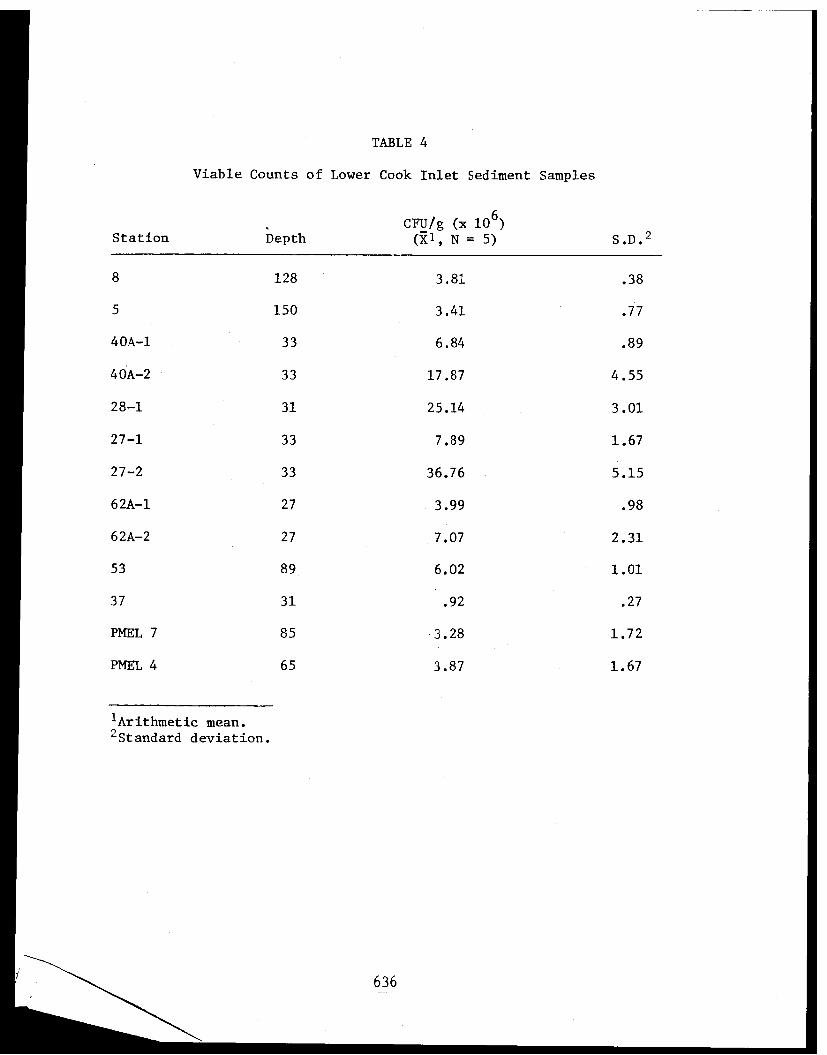
TABLE 4
Viable Counts of Lower Cook Inlet Sediment Samples
636
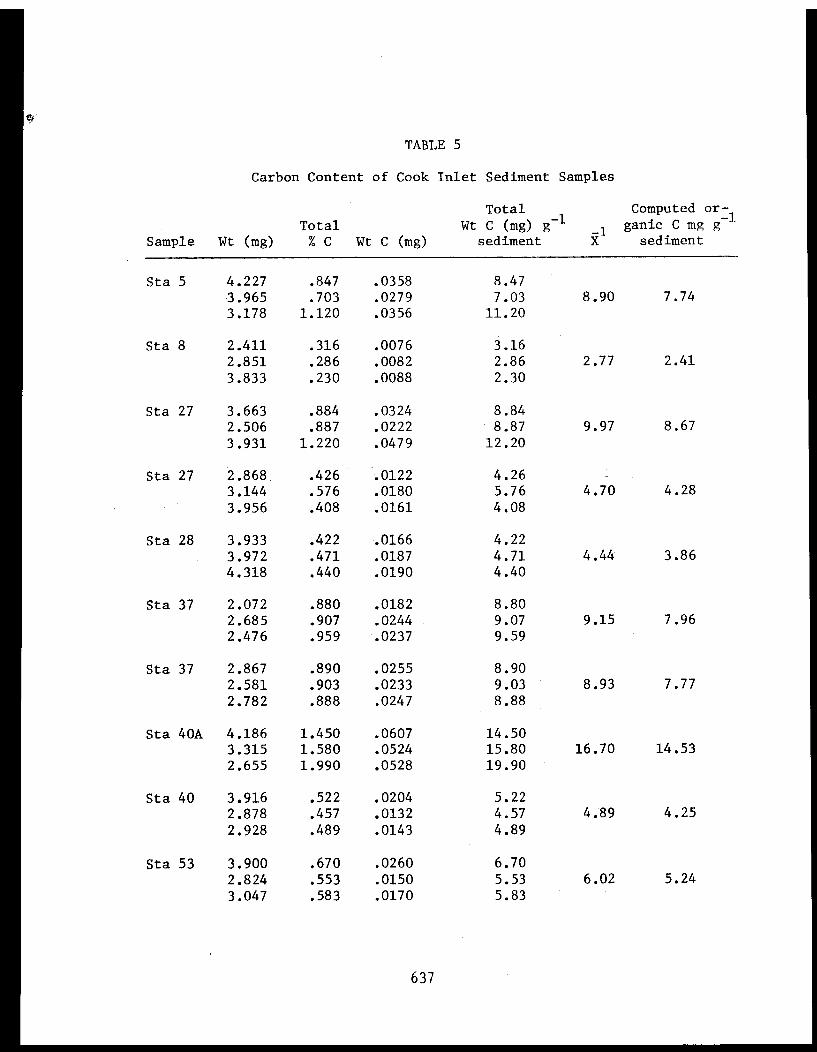
TABLE 5
Carbon Content of Cook Inlet Sediment Samples
637

TABLE 5
Continued
638
Sediment bacterial carbon values were calculated and are included
in Table 3. Computed carbon from bacterial sources ranged from 0.18
(Station 62A) to 6.2 (Station 37) mg g[superscript]-1 sediment. Kachemak Bay area
samples as a result of higher direct cell counts, had more bacterial
carbon.
Figure 4 depicts the relationship of organic and bacterial carbon
for selected stations in lower Cook Inlet. Estimated bacterial carbon
constitutes from 2% (Station 40A) to nearly 80% (PMEL 7) of the organic
carbon present in the sediments. On other stations (PMEL1, PMEL 4)
bacterial carbon constituted approximately 50% of the organic carbon
present in the sediment samples.
Respiration, Metabolic Rate
Data from respiration rate analysis are shown in Table 6. The
average respiration rate of all Crangon dalli measured was 25.7 µl
02 g[superscript]-1 hr[superscript]-1, with a range of 9.3 µ1 O[subscript]2 g[superscript]-1 hr[superscript]-1 to 42.7 µ1 O[subscript]2
g[superscript]-1 hr[superscript]-1. The data displayed rather high variability, S.D. = 10.2, and respiration
rate was not well correlated with shrimp size (r = .55, p > .02). By
use of the ideal gas law, the average volume of O[subscript]2 uptake (25.7 µl) can
be converted to moles of O[subscript]2 (1.10 x 10[superscript]-6). Multiplication by a respira-
tory quotient of .8 gave a mole CO[subscript]2 evolution value of 8.81 x 10[superscript]- 7 moles
CO2 g[superscript]-1 hr[superscript]-1 (Table 7). Using the molecular weight of CO[subscript]2 and the frac-
tion represented by carbon, carbon flux due to resting metabolism in the
average Crangon dalli was calculated:
639

Figure 4. Relationship of bacterial and organic carbon values of
sediment from selected stations in lower Cook Inlet.
1 denotes estimated from direct counts derived from
viable counts.
640
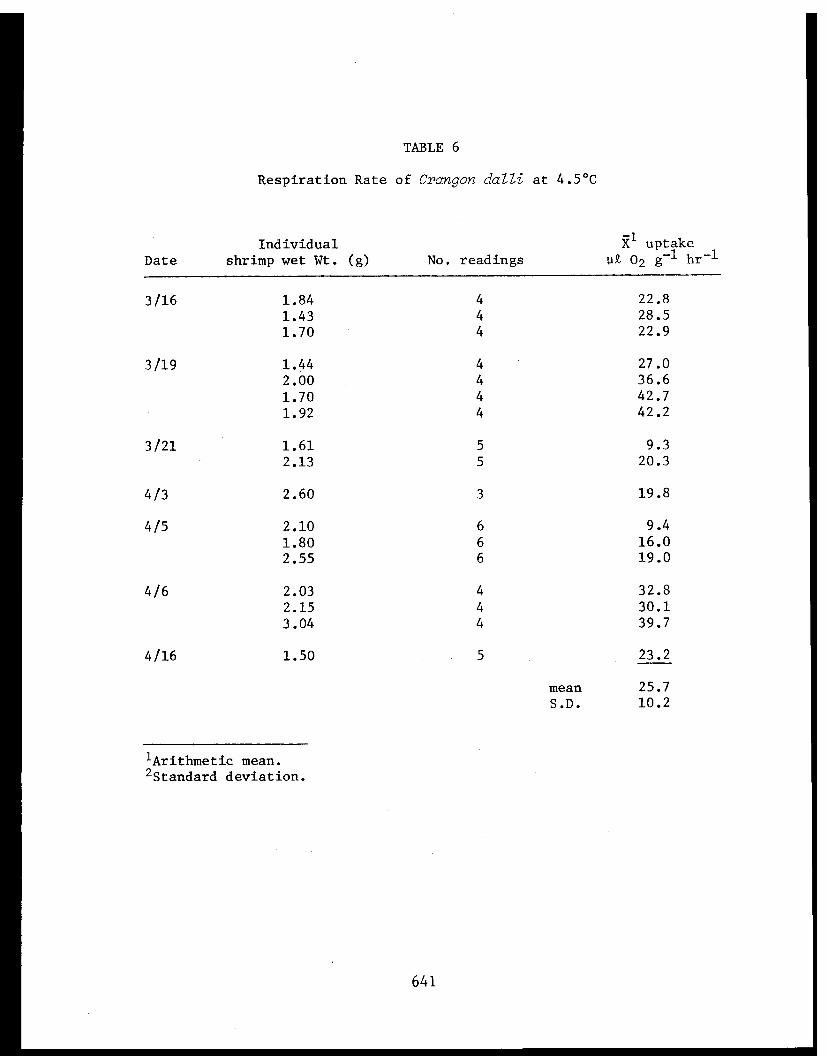
TABLE 6
Respiration Rate of Crangon dalli at 4.5°C
641
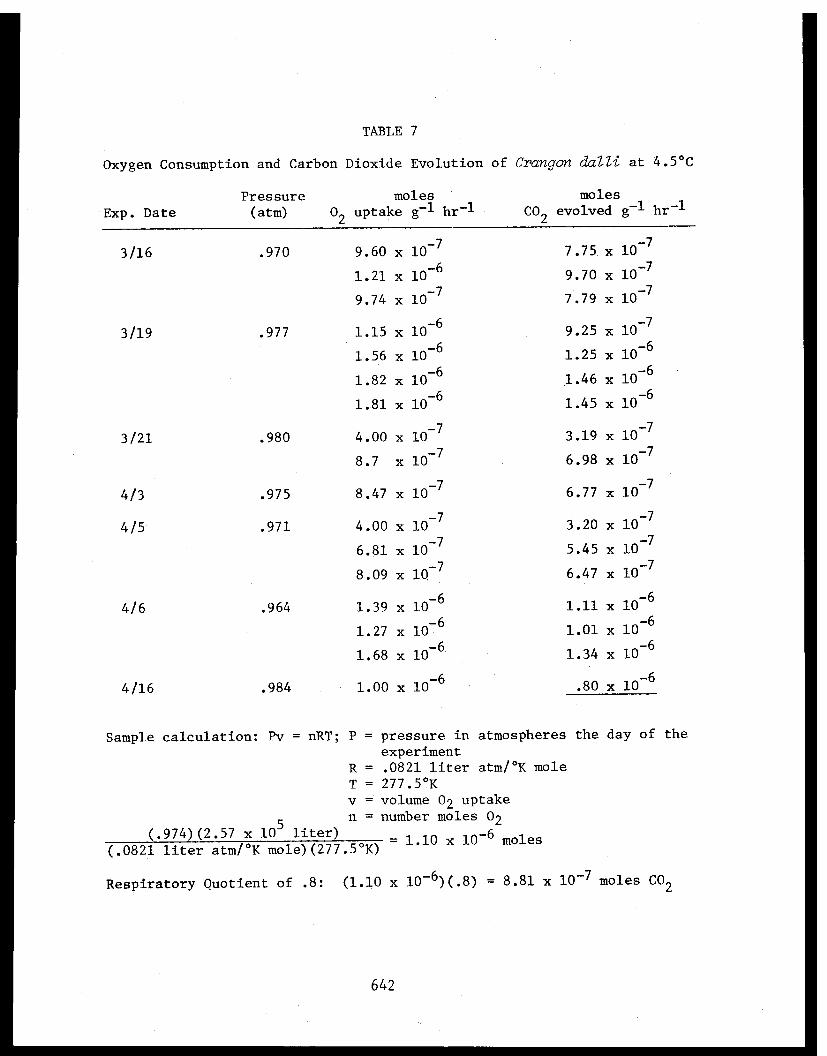
TABLE 7
Oxygen Consumption and Carbon Dioxide Evolution of Crangon dalli at 4.5°C
642
(8.81 x 10[superscript]- 7 moles CO[subscript]2 g[superscript]-1 hr[superscript]- 1 (44 g CO[subscript]2 mole[superscript]-1) =
3.88 x 10[superscript]-5g CO[subscript]2 g[superscript]-1 hr[superscript]-1or 1.05 x 10[superscript]-5 g C g[superscript]-1 hr[superscript]-1.
DISCUSSION
Virtually all of the prey categories and the gut contents obser-
ved have their origin on the bottom. Exceptions such as diatoms, chaet-
ognaths, and fish remains are best explained as dead organic matter
(detritus) which has its origin in the water column and has settled to
the bottom. In some areas of lower Cook Inlet (Kachemak Bay) up to 12%
of primary production in the water column fluxes rapidly to the benthos
(Larrance, 1979). Fish remains in crangonid gut contents clearly are
a result of dead animals being ingested on the bottom. The large
number of food categories (60) is a reflection of the feeding style of
these animals. However, it is noteworthy that some of the categories ob-
served in this report may be of limited value as food. A number of poly-
chaete occurrences listed in Table 1 were based on setae identification,
not on whole worms. Setae themselves would be of limited food value.
Identification of diatom tests in gut contents may bias frequency of
occurrence information in that their value as food is questionable. Re-
sults of the present study of Cook Inlet crangonids indicate they are
clearly generalists employing an opportunistic strategy, that is, eating
whatever is available. Similar findings with regard to prey and habits
were noted by Wilcox (1974) for an east coast crangonid. From the re-
sults of a study of Crangon septemspinosa, he concluded they fed on the
643
bottom and would eat virtually anything. He noted that variation in
gut contents may arise from availability of foods, not necessarily pre-
ference. That author considers C. septemspinosa an omnivore and agrees
with an earlier classification (Price, 1962) of the animal as a second-
ary consumer. It is significant that through direct consumption and as
a predator on other detrital feeding organisms (i.e., secondary con-
sumer) Cook Inlet crangonids are dependent on the sediment-detrital food
system for their energetic needs.
The observed high frequency of sediment ingestion in the present
report is consistent with the study of Wilcox (1974). However, sand was
considered to constitute only 4% of the total volume of Crangon
septemspinosa contents. In Cook Inlet crangonids, inorganic sediment
(which includes sand) constituted an overall average of 55.75% (dry
weight basis) of the stomach contents after KOH digestion of organic
matter. A high percentage contents of sediment in Cook Inlet pandalid
shrimps and hermit crabs has been similarly noted (Rice et aZ., 1980;
Feder et al., 1980). Although volumetric estimations were not done in
the present study, sediment constitutes a larger fraction of the contents
of Cook Inlet crangonids than that found in C. septemspinosa. The per-
cent dry weight sediment component was consistently high with two excep-
tions noted above. These two values may reflect experimental error in
that their determination was the first done in the laboratory. It is
again noteworthy that the method employed for estimating sediment in
this report can be expected to underestimate the actual amount present.
644
However, this is probably less than volumetric analytical error, con-
sidering the rather small size of the animals and their stomachs.
Microbial biomass estimates of Cook Inlet sediments in the present
study are in agreement with other recent studies. Atlas (1979) report
6.4 x 10[superscript]8 cells ml[superscript]-1 from direct counts of sediment samples in inner
Kachemak Bay. In Kamishak Bay 3.7 x 10[superscript]8 cells ml[superscript]-1 were observed.
Viable counts of these sediments ranged from 4.4 x 10[superscript]6 to 1.8 x 10[superscript]6
CFU g[superscript]-1 units respectively. Viable counts are typically less than direct
counts because direct counts include non-viable cells and some bacteria
present in the sample may be unable to grow on the media used for the
viable count analysis. Griffiths and Morita (1979) report that microbial
activities of Cook Inlet sediments were highest in the Kamishak and
Kachemak Bay areas. Microbial activity values from 58 ng glutamate g[superscript]-1
hr[superscript]- 1 (Kamishak Bay) to 380 ng glutamate g[superscript]-1 hr[superscript]- 1 (inner Kachemak Bay)
were reported in that study.
Total carbon values of Cook Inlet samples are likely reliable and
realistic. However, calculation of organic carbon from total carbon by
the method employed increases the potential for error. The organic
carbon value for Station 62A was high (~10 mg g[superscript]-1 sediment) while the
microbial carbon value was extremely low (< 1 mg g[superscript]-1 sediment). It is
noteworthy that large amounts of clam shells (CaCO[subscript]3) and significant
fresh water runoff are found in this area, potentially influencing the
inorganic carbon fraction relative to other stations. The presence of
such carbon sources on some stations (62A) may in part explain the large
difference (relative to other stations such as PMEL 7) between bacterial
645
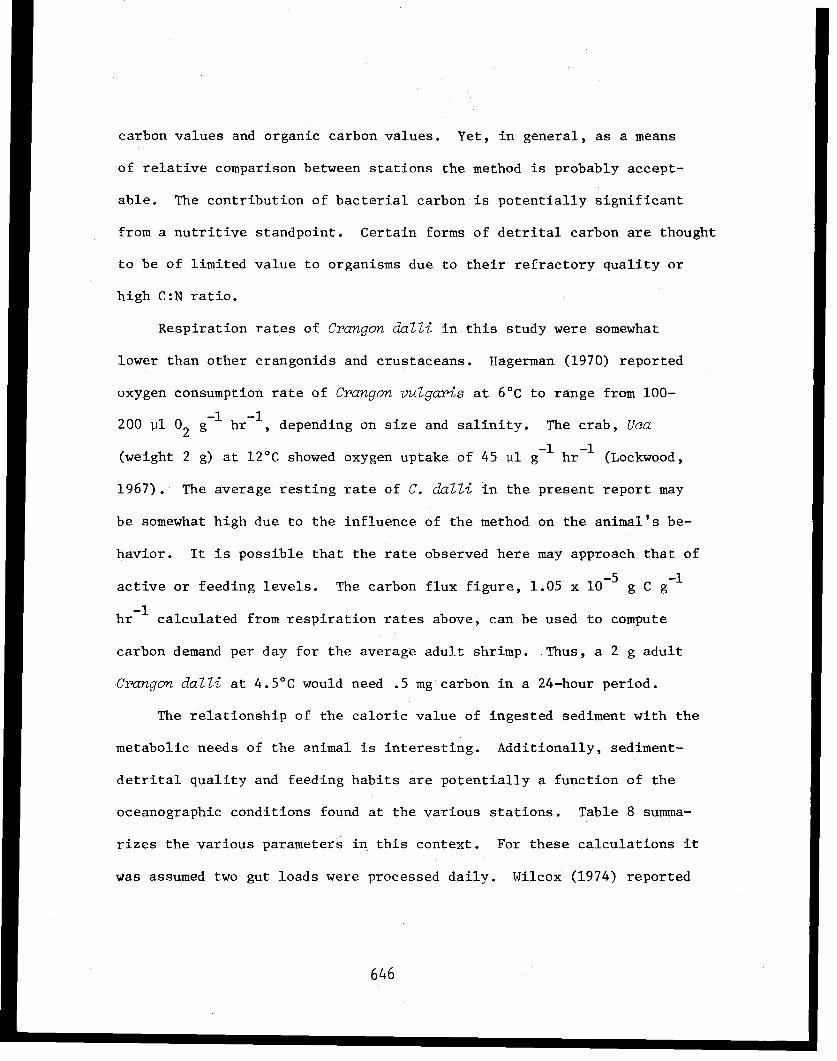
carbon values and organic carbon values. Yet, in general, as a means
of relative comparison between stations the method is probably accept-
able. The contribution of bacterial carbon is potentially significant
from a nutritive standpoint. Certain forms of detrital carbon are thought
to be of limited value to organisms due to their refractory quality or
high C:N ratio.
Respiration rates of Crangon dalli in this study were somewhat
lower than other crangonids and crustaceans. Hagerman (1970) reported
oxygen consumption rate of Crangon vulgaris at 6°C to range from 100-
200 µl O[subscript]2 g[superscript]-1 hr[superscript]-1, depending on size and salinity. The crab, Uca
(weight 2 g) at 12°C showed oxygen uptake of 45 µl g[superscript]-1 hr[superscript]-1 (Lockwood,
1967). The average resting rate of C. dalli in the present report may
be somewhat high due to the influence of the method on the animal's be-
havior. It is possible that the rate observed here may approach that of
active or feeding levels. The carbon flux figure, 1.05 x 10[superscript]- 5 g C g[superscript]-1
hr[superscript]-1 calculated from respiration rates above, can be used to compute
carbon demand per day for the average adult shrimp. Thus, a 2 g adult
Crangon dalli at 4.5°C would need .5 mg carbon in a 24-hour period.
The relationship of the caloric value of ingested sediment with the
metabolic needs of the animal is interesting. Additionally, sediment-
detrital quality and feeding habits are potentially a function of the
oceanographic conditions found at the various stations. Table 8 summa-
rizes the various parameters in this context. For these calculations it
was assumed two gut loads were processed daily. Wilcox (1974) reported
646
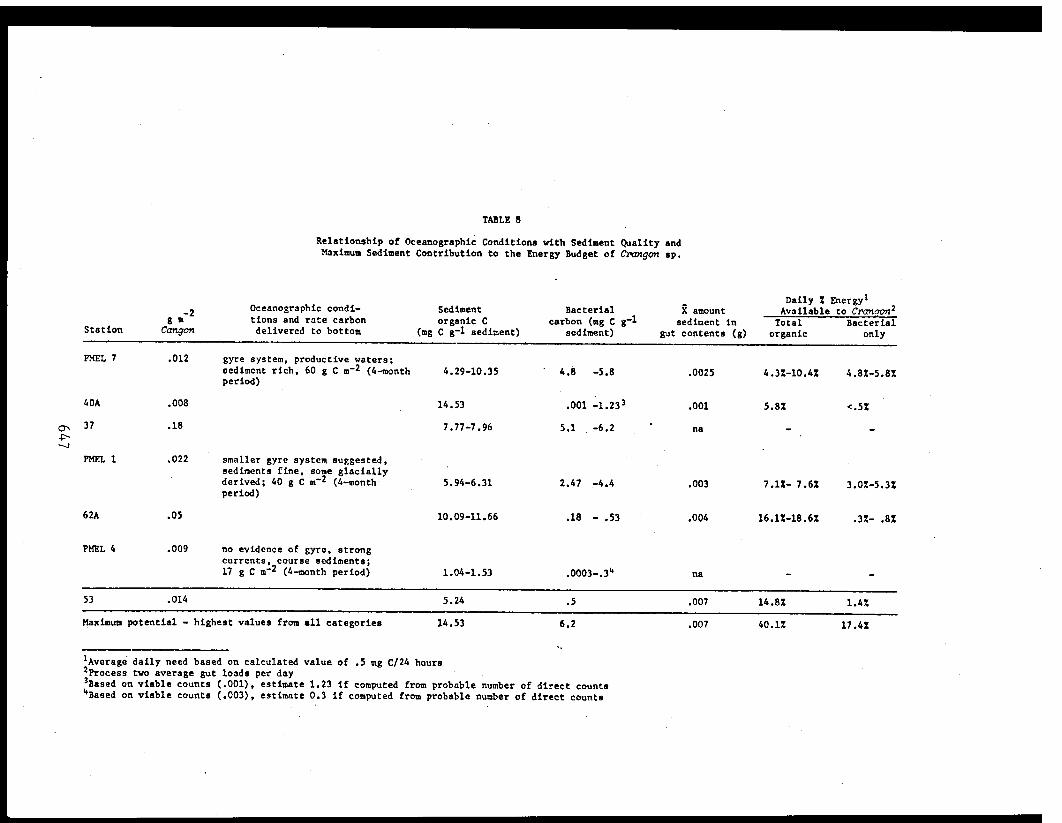
TABLE 8
Relationship of Oceanographic Conditions with Sediment Quality andMaximum Sediment Contribution to the Energy Budget of Crangon sp.
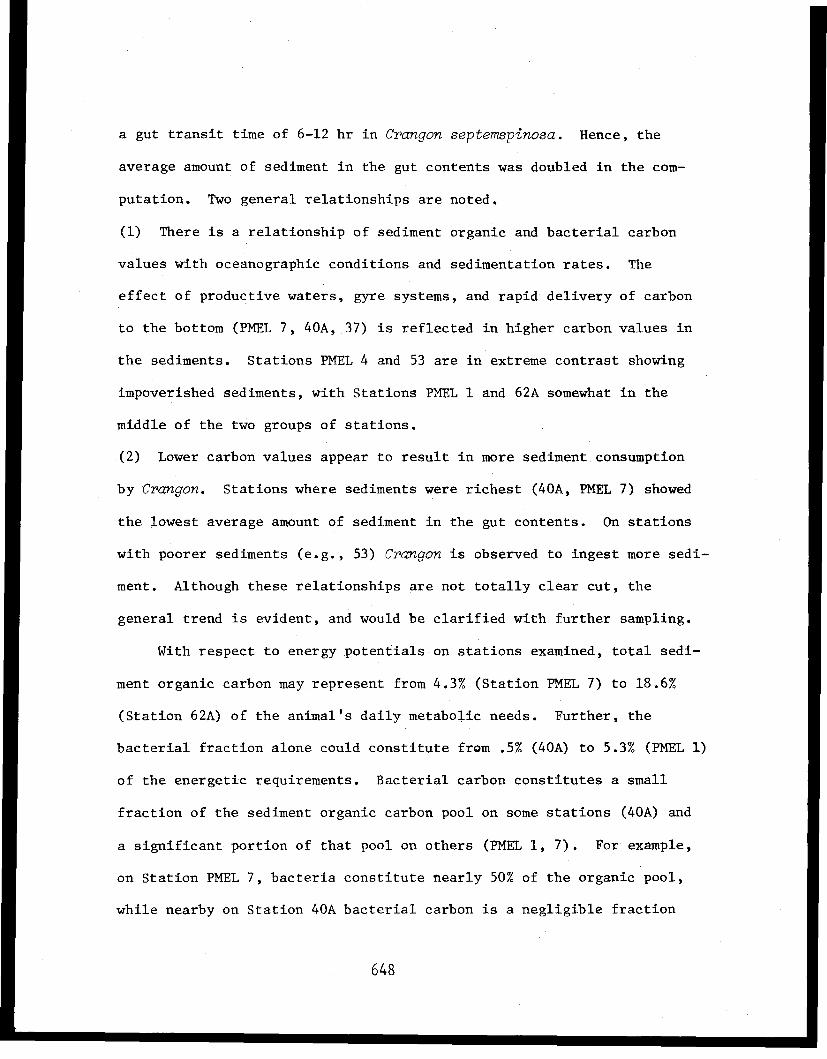
a gut transit time of 6-12 hr in Crangon septemspinosa. Hence, the
average amount of sediment in the gut contents was doubled in the com-
putation. Two general relationships are noted.
(1) There is a relationship of sediment organic and bacterial carbon
values with oceanographic conditions and sedimentation rates. The
effect of productive waters, gyre systems, and rapid delivery of carbon
to the bottom (PMEL 7, 40A, 37) is reflected in higher carbon values in
the sediments. Stations PMEL 4 and 53 are in extreme contrast showing
impoverished sediments, with Stations PMEL 1 and 62A somewhat in the
middle of the two groups of stations.
(2) Lower carbon values appear to result in more sediment consumption
by Crangon. Stations where sediments were richest (40A, PMEL 7) showed
the lowest average amount of sediment in the gut contents. On stations
with poorer sediments (e.g., 53) Crangon is observed to ingest more sedi-
ment. Although these relationships are not totally clear cut, the
general trend is evident, and would be clarified with further sampling.
With respect to energy potentials on stations examined, total sedi-
ment organic carbon may represent from 4.3% (Station PMEL 7) to 18.6%
(Station 62A) of the animal's daily metabolic needs. Further, the
bacterial fraction alone could constitute from .5% (40A) to 5.3% (PMEL 1)
of the energetic requirements. Bacterial carbon constitutes a small
fraction of the sediment organic carbon pool on some stations (40A) and
a significant portion of that pool on others (PMEL 1, 7). For example,
on Station PMEL 7, bacteria constitute nearly 50% of the organic pool,
while nearby on Station 40A bacterial carbon is a negligible fraction
648

of the organic pool. A hypothetical maximum potential was calculated
using the highest values from all categories. In this instance, total
sediment organic carbon could represent as much as 40% of the animals
daily needs with 17% of that coming from bacterial sources.
Observed percent energy potentials from sediment sources represent
a sizeable contribution to the energy budget of Crangon. However, it is
noteworthy that these contributions in themselves are insufficient for
growth and reproduction. Thus, these estimates are consistent with the
opportunistic scavenging and predatory behavior observed in Cook Inlet
crangonids.
Due to the limited data, no discussion of seasonal effects or ni-
trogen content of sediments is included. However these two parameters
are potentially important. Seasonal production may well affect the
quality of food and sediment available to detrital feeding animals in the
benthic community. The carbon/nitrogen ratios of potential food sources
is an important factor in determining ingestion rates.
Summary and Conclusions
The nature of crangonid feeding habits is interesting and suggests
a unique adaptation. Feeding behavior and the amount of sediment inges-
tion are related to the dynamics of the system. Prey avialability and
food resources in the nearshore benthos are quite variable. Shrimp will
ingest whatever prey is available in large amounts. Under impoverished
conditions accidental or deliberate ingestion of sediment and the ap-
parent ability to utilize affiliated carbon sources enhances their
649

nutritive intake. A low metabolic rate and sedentary habits serves to
reduce caloric needs. Their feeding habits indicate that if hydrocarbons
were to become associated with sediments, they would be ingested by
Crangon. Topics worthy of consideration for future research include
examination of sediment organic carbon quality and resuspension of bot-
tom sediments.
650

REFERENCES
Adams, S. M. and J. W. Angelovic. 1970. Assimilation of detritus andits associated bacteria by three species of estuarine animals.Chesapeake Science, Vol. II, No. 4, pp. 249-254.
Atlas, R. M. 1979. Assessment of potential interactions of microorgan-isms and pollutants resulting from petroleum development on theouter continental shelf of Alaska. Annual Rept. to OCSEAP, R.V. #29.NOAA, Bolder, Colorado.
Baker, J. H. and L. A. Bradnam. 1976. The role of bacteria in thenutrition of aquatic detritivores. Oceologia 24:95-104.
Burbank, D. C. 1974. Suspended sediment transport and deposition inAlaskan coastal waters. Master's Thesis, Univ. Alaska, Fairbanks.
Burbank, D. C. 1977. Circulation studies of Kachemak Bay and LowerCook Inlet. In L. L. Trasky, L. B. Flagg and D. C. Burbank (eds.),Environmental Studies of Kachemak Bay and Lower Cook Inlet, Vol. III.Alaska Dept. Fish and Game, Anchorage.
Crow, J. H. 1977. Food habits of shrimp in Kachemak Bay, Alaska. In
L. L. Trasky, L. B. Flagg and D. C. Burbank (eds.), EnvironmentalStudies of Kachemak Bay and Lower Cook Inlet, Alaska, Vol. VI.Alaska Dept. Fish and Game, Anchorage.
Feder, H. M., A. J. Paul, M. Hoberg, S. Jewett, G. Matheke, K. McCumby,J. McDonald, R. Rice and P. Shoemaker. 1980. Distribution, abun-dance, community structure and trophic relationships of the near-shore benthos of Cook Inlet. Annual Rept. to OCSEAP, R.V. #5.
Inst. Mar. Sci., Univ. Alaska, Fairbanks.
Fenchel, T. M. and B. Jorgensen. 1977. Detritus food chains of aquaticecosystems: The role of bacteria. In M. Alexander (ed.), Advancesin Microbial Ecology, Vol. 1. Plenum Press, New York. pp. 1-58.
Griffiths, R. P. and R. Y. Morita. 1979. Study of microbial activityand crude oil-microbial interactions in the waters and sedimentsof Cook Inlet and the Beaufort Sea. Annual Rept. to OCSEAP, R.U.#190. NOAA, Boulder, Colorado.
Kofoed, L. H. 1975. The feeding biology of Hydrobia ventrosa (Montagu)
II. Allocation of the components of the carbon-budget and thesignificance of the secretion of dissolved organic material. J.Exp. Mar. Biol. Ecol. 19:243-256.
Hagerman, L. 1970. The oxygen consumption of Crangon vulgaris (Fabricus)
(Crustacea, Natantias) in relation to salinity. Ophelia 7:283-292.
651
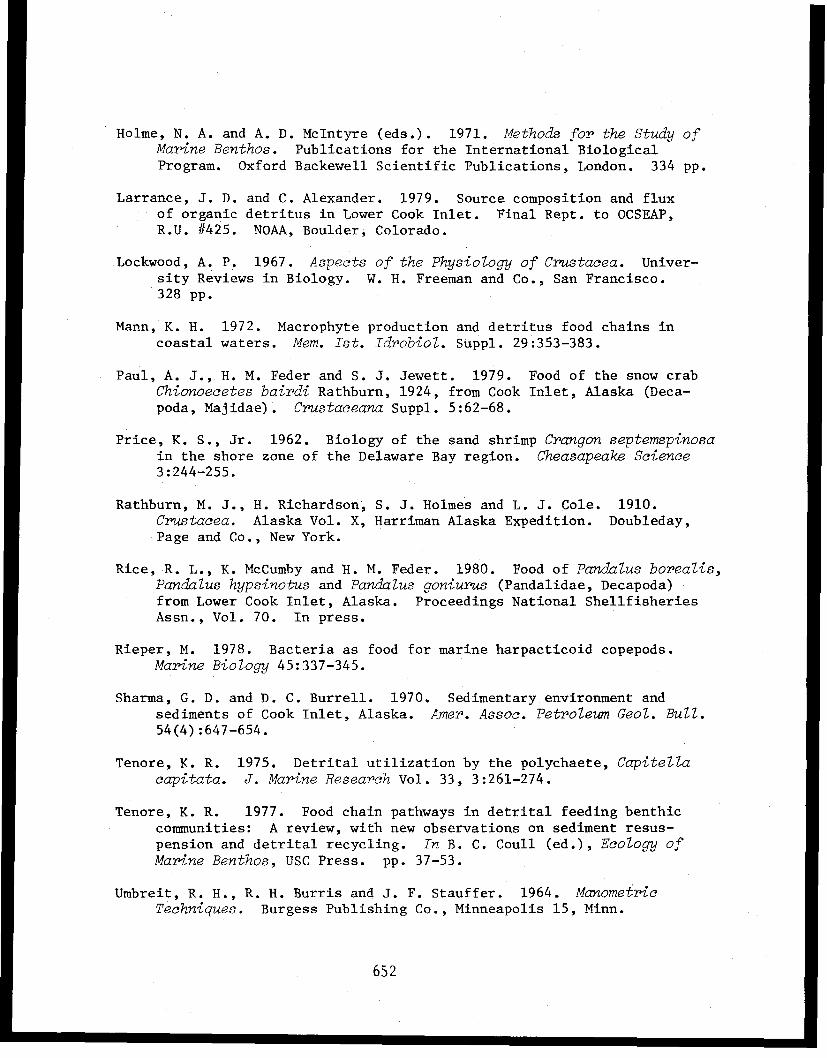
Holme, N. A. and A. D. McIntyre (eds.). 1971. Methods for the Study ofMarine Benthos. Publications for the International BiologicalProgram. Oxford Backewell Scientific Publications, London. 334 pp.
Larrance, J. D. and C. Alexander. 1979. Source composition and fluxof organic detritus in Lower Cook Inlet. Final Rept. to OCSEAP,R.U. #425. NOAA, Boulder, Colorado.
Lockwood, A. P. 1967. Aspects of the Physiology of Crustacea. Univer-sity Reviews in Biology. W. H. Freeman and Co., San Francisco.328 pp.
Mann, K. H. 1972. Macrophyte production and detritus food chains incoastal waters. Mem. Ist. Idrobiol. Suppl. 29:353-383.
Paul, A. J., H. M. Feder and S. J. Jewett. 1979. Food of the snow crabChionoecetes bairdi Rathburn, 1924, from Cook Inlet, Alaska (Deca-poda, Majidae). Crustaceana Suppl. 5:62-68.
Price, K. S., Jr. 1962. Biology of the sand shrimp Crangon septemspinosain the shore zone of the Delaware Bay region. Cheasapeake Science3:244-255.
Rathburn, M. J., H. Richardson, S. J. Holmes and L. J. Cole. 1910.Crustacea. Alaska Vol. X, Harriman Alaska Expedition. Doubleday,Page and Co., New York.
Rice, R. L., K. McCumby and H. M. Feder. 1980. Food of Pandalus borealis,Pandalus hypsinotus and Pandalus goniurus (Pandalidae, Decapoda)from Lower Cook Inlet, Alaska. Proceedings National ShellfisheriesAssn., Vol. 70. In press.
Rieper, M. 1978. Bacteria as food for marine harpacticoid copepods.Marine Biology 45:337-345.
Sharma, G. D. and D. C. Burrell. 1970. Sedimentary environment andsediments of Cook Inlet, Alaska. Amer. Assoc. Petroleum Geol. Bull.54(4):647-654.
Tenore, K. R. 1975. Detrital utilization by the polychaete, Capitellacapitata. J. Marine Research Vol. 33, 3:261-274.
Tenore, K. R. 1977. Food chain pathways in detrital feeding benthiccommunities: A review, with new observations on sediment resus-pension and detrital recycling. In B. C. Coull (ed.), Ecology ofMarine Benthos, USC Press. pp. 37-53.
Umbreit, R. H., R. H. Burris and J. F. Stauffer. 1964. ManometricTechniques. Burgess Publishing Co., Minneapolis 15, Minn.
652
Wetzel, R. G., P. H. Rich, M. C. Miller and H. L. Allen. 1972. Meta-bolism of dissolved and particulate detrital carbon in a temperatehard-water lake. Mem. Ist. Ital. Idrobiol. Suppl. 29:185.
Zimmerman, R. and L. Meyer-Riel. 1974. A new method for fluorescencestaining of bacterial populations on membrane filters. Kiel.Meeresforsch 30:24-27.
653
APPENDIX
ASSIMILATION OF BACTERIAL CARBON BY CRANGONID SHRIMP
654
PREFACE
Attempts to measure assimilation of bacterial carbon by crangonid
shrimp are described in the following section. A great deal of interest
is currently centered on this topic. Many investigators have attempted
to measure assimilation of carbon from bacteria by using radiolabeled
bacteria (Adams and Angelovic, 1970; Kofoed, 1975; Rieper, 1978).
Although methodological problems exist with this approach, most authors
agree that the radiolabeling approach has the necessary sensitivity and
is experimentally feasible.
In the experiments described here, the primary goal was to see if
crangonid shrimp could digest bacteria and assimilate released carbon
by ingesting sediment or detritus enriched with 14-C labeled bacteria.
A secondary goal was, if possible, to determine amounts and rates of as-
similation. This second interest was important if the significance of
bacterial carbon in the diet of these shrimps was to be addressed.
However, this second goal complicated the methodology; it was more
difficult to determine rates than simply to look for the appearance of
label in the body tissue of the shrimps.
Such investigations can prove time consuming, expensive, and experi-
mentally difficult. Constraints on this research existed due to the
format under which it was to be conducted. Yet, the question was inter-
esting and was of value both for its intrinsic worth as well as an
educational experience for this author.
655
INTRODUCTION
The use of radioisotopes in studies of detrital food systems has
grown both in usage and in sophistication. Detrital utilization stu-
dies (Tenore, 1975, 1977), carbon budget studies (Kofoed, 1975), as-
similation studies (Adams and Angelovic, 1970; Cummins, 1973), and
bacterial assimilation studies (Rieper, 1978) are but a few reports in
the literature which reflect the growing use of radioisotopes and their
applications in investigations dealing with detrital food systems.
Although they are not equally useful in all systems (Conover and Francis,
1973), radioisotopes possess the necessary sensitivity and experimental
flexibility to be a powerful research tool. In recent years, advances
in areas such as liquid scintillation counting, and increased availabil-
ity of a wide variety of radioisotopes has made the use of isotopes
even more attractive.
The potential of bacterial carbon as energy source for crangonid
shrimp in lower Cook Inlet, Alaska has been alluded to in this report.
Yet the significance of this carbon source can not be estimated without
evidence that these shrimp are in fact able to digest bacteria and as-
similate released carbon compounds. Other investigators have shown that
related shrimp can survive, and indeed grow on a diet of bacteria
(Wilcox, 1974). Certain prawns (Metapenaeus) are believed to utilize
bacteria as a food source in their natural diet (Moriarty, 1978). How-
ever, there were no studies on Alaskan crangonids nor were there any
estimates of assimilation efficiency or rates of uptake of carbon
656
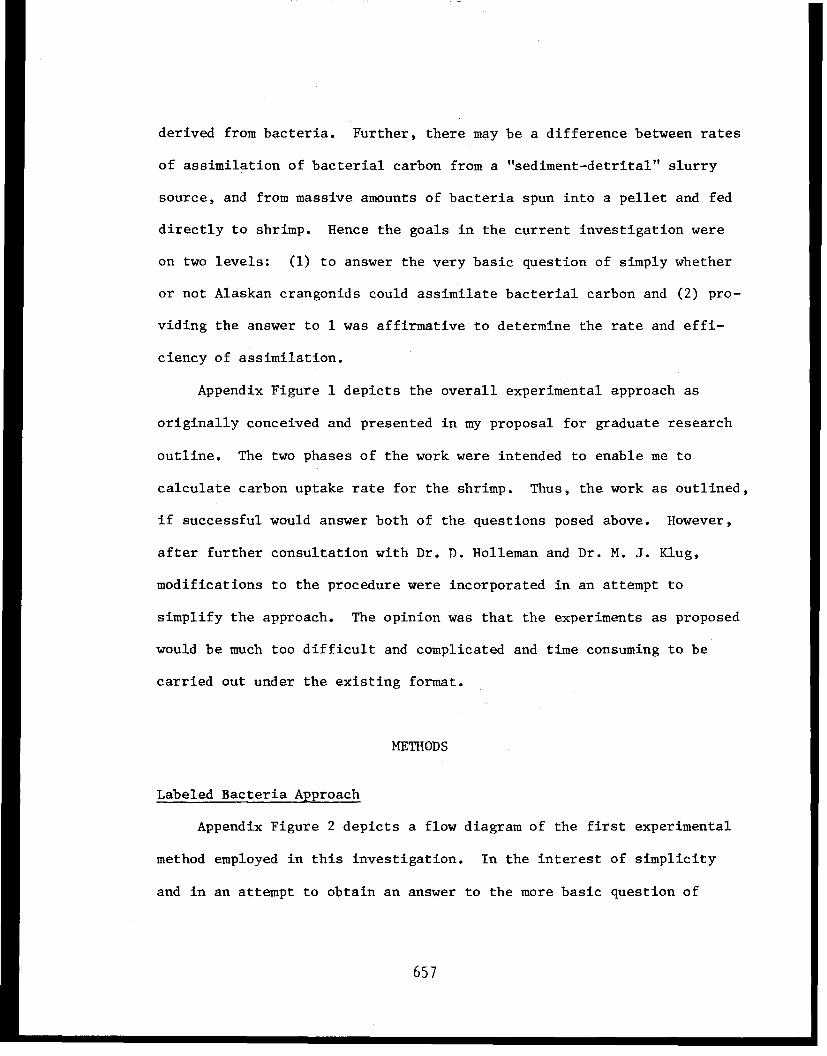
derived from bacteria. Further, there may be a difference between rates
of assimilation of bacterial carbon from a "sediment-detrital" slurry
source, and from massive amounts of bacteria spun into a pellet and fed
directly to shrimp. Hence the goals in the current investigation were
on two levels: (1) to answer the very basic question of simply whether
or not Alaskan crangonids could assimilate bacterial carbon and (2) pro-
viding the answer to 1 was affirmative to determine the rate and effi-
ciency of assimilation.
Appendix Figure 1 depicts the overall experimental approach as
originally conceived and presented in my proposal for graduate research
outline. The two phases of the work were intended to enable me to
calculate carbon uptake rate for the shrimp. Thus, the work as outlined,
if successful would answer both of the questions posed above. However,
after further consultation with Dr. D. Holleman and Dr. M. J. Klug,
modifications to the procedure were incorporated in an attempt to
simplify the approach. The opinion was that the experiments as proposed
would be much too difficult and complicated and time consuming to be
carried out under the existing format.
METHODS
Labeled Bacteria Approach
Appendix Figure 2 depicts a flow diagram of the first experimental
method employed in this investigation. In the interest of simplicity
and in an attempt to obtain an answer to the more basic question of
657
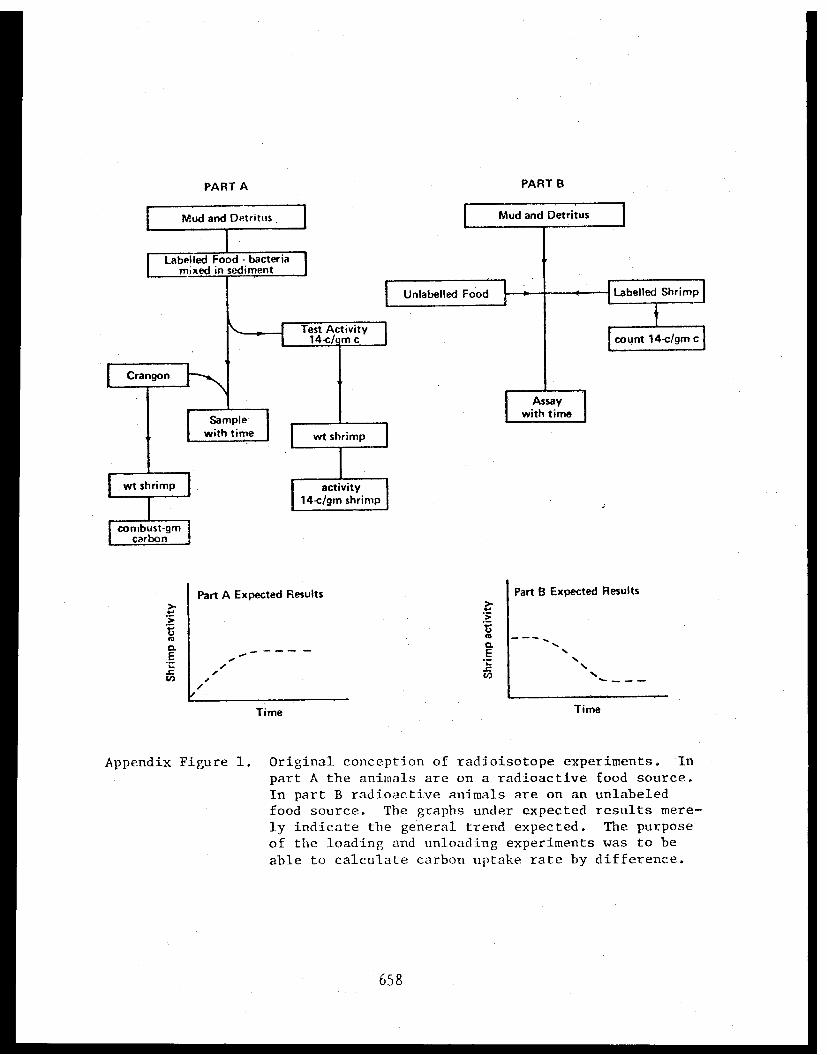
Appendix Figure 1. Original conception of radioisotope experiments. Inpart A the animals are on a radioactive food source.In part B radioactive animals are on an unlabeledfood source. The graphs under expected results mere-ly indicate the general trend expected. The purposeof the loading and unloading experiments was to be
able to calculate carbon uptake rate by difference.
658
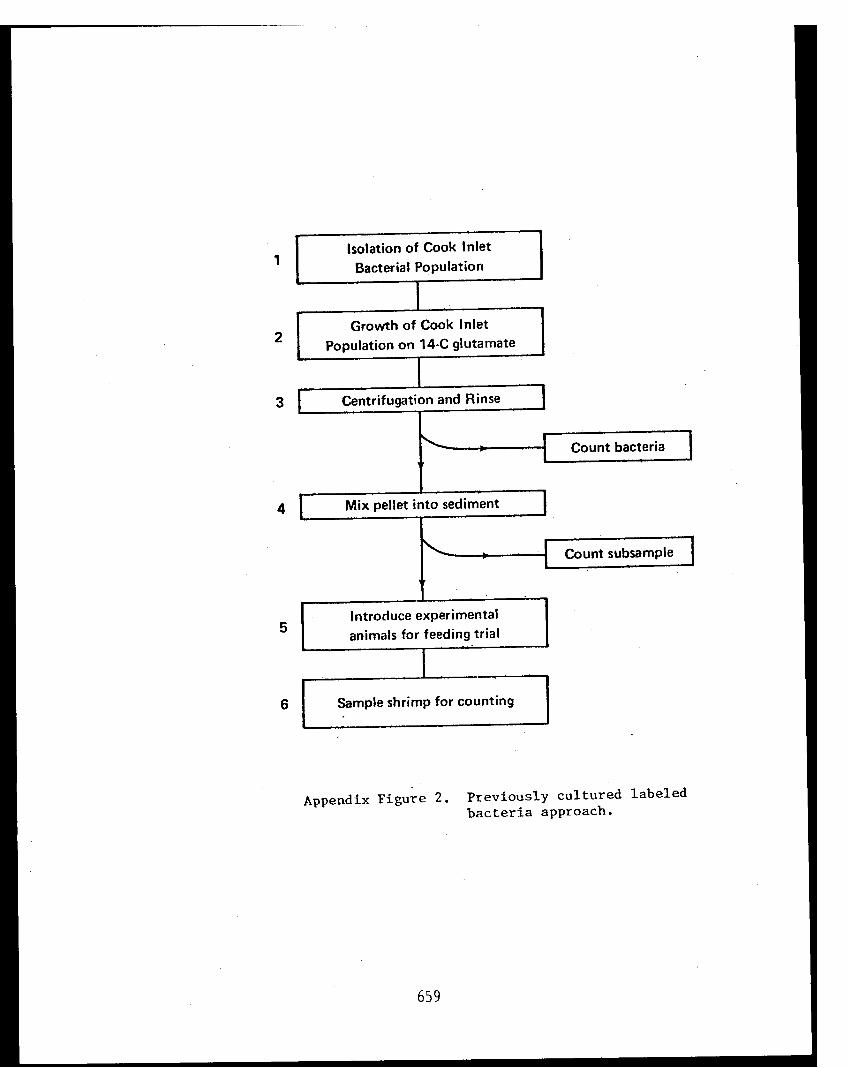
Appendix Figure 2. Previously cultured labeled
bacteria approach.
659
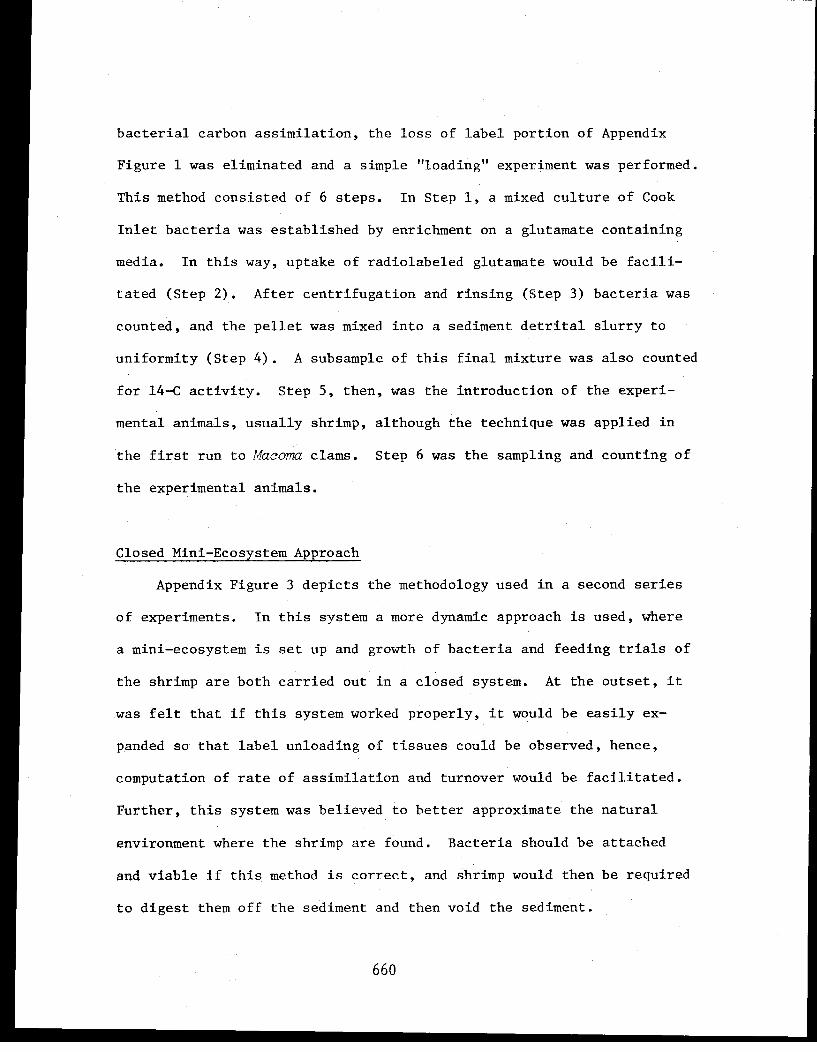
bacterial carbon assimilation, the loss of label portion of Appendix
Figure 1 was eliminated and a simple "loading" experiment was performed.
This method consisted of 6 steps. In Step 1, a mixed culture of Cook
Inlet bacteria was established by enrichment on a glutamate containing
media. In this way, uptake of radiolabeled glutamate would be facili-
tated (Step 2). After centrifugation and rinsing (Step 3) bacteria was
counted, and the pellet was mixed into a sediment detrital slurry to
uniformity (Step 4). A subsample of this final mixture was also counted
for 14-C activity. Step 5, then, was the introduction of the experi-
mental animals, usually shrimp, although the technique was applied in
the first run to Macoma clams. Step 6 was the sampling and counting of
the experimental animals.
Closed Mini-Ecosystem Approach
Appendix Figure 3 depicts the methodology used in a second series
of experiments. In this system a more dynamic approach is used, where
a mini-ecosystem is set up and growth of bacteria and feeding trials of
the shrimp are both carried out in a closed system. At the outset, it
was felt that if this system worked properly, it would be easily ex-
panded so that label unloading of tissues could be observed, hence,
computation of rate of assimilation and turnover would be facilitated.
Further, this system was believed to better approximate the natural
environment where the shrimp are found. Bacteria should be attached
and viable if this method is correct, and shrimp would then be required
to digest them off the sediment and then void the sediment.
660
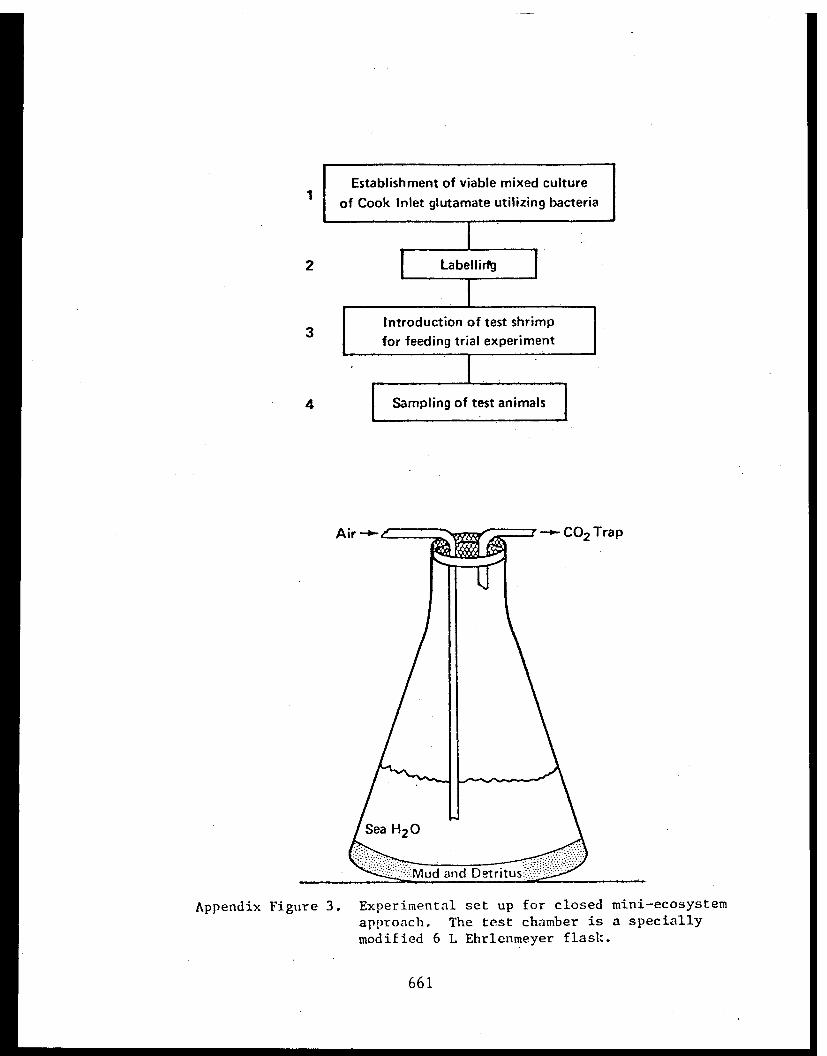
Appendix Figure 3. Experimental set up for closed mini-ecosystem
approach. The test chamber is a specially
modified 6 L Ehrlenmeyer flask.
661
Four principal steps were involved in this method. First, a cul-
ture of Cook Inlet glutamate utilizing bacteria was established in a
large airtight flask (Step 1). Sediment was enriched with amino acids
to prompt growth of potential glutamate users. Then, in Step 2, 14-C
labeled glutamate was introduced. At this time the system was sealed
and evolved gases from the chamber were passed through a CO[subscript]2 trap. The
solution in the trap was monitored and counted so that uptake and respi-
ration of the label by the bacteria could be detected (see sample pre-
paration, below). After it was determined that the bacteria population
was actively growing, incorporating and respiring label, the test animals
were introduced for the feeding trial (Step 3). A sufficient number of
shrimp were used to allow for non-feeding individuals and individual
variation. The final step then was the sampling and counting of the
animals with time (Step 4) (see sample preparation).
Preparation of Standards, Samples, and Scintillation Information
Appendix Table 1 summarizes information concerning the scintillation
cocktails and methods used for the various types of samples. A series
of quenched standards for each type of sample were prepared and counted.
It was found that quenching of the various samples differed signifi-
cantly (i.e., slopes of counting efficiency versus external standards
ratio differed), thus making it necessary to prepare such a series for
each type of sample. These standards could then be used in the analysis
of samples from the experiments.
662

APPENDIX TABLE 1
Sample Preparation and Liquid Scintillation Information

Samples for counting were collected in the following manner.
Shrimp were killed, rinsed, and the tail section removed. The shell
was removed and the tissue again rinsed. The intestine, lying along
the ventral surface of the tail section was carefully dissected out and
the tail tissue again rinsed. The tissue was then weighed and a 1:4
homogenate was prepared in a Waring blender fitted with a micro-cup.
A .8 ml subsample was then removed for the protosol treatment and count-
ing. In some cases, the intestines and gills of the animal were also
counted. Clams were killed, rinsed, and the gut, intestine, and gills
removed. The remaining tissue was again rinsed, removed from the shell,
weighed and used to prepare a 1:4 homogenate as above. A control animal
was also in the test chamber in a cloth-mesh enclosed vial so that it
would not be able to feed.
Sediment samples were siphoned off the surface of the substrate
with a pipette and placed directly in a scintillation vial and treated
with Protosol, as were the tissue homogenates. Incubation of sediment
and tissue samples at 50°C with Protosol greatly facilitates solubiliza-
tion. After the samples are digested, bleaching with peroxide helps in
the reduction of color quenching.
Seawater samples of 1 ml were taken from the experimental chambers
using a pipette and counted in Aquasol. One such sample was taken,
counted, then acidified (.1 N HCL) and recounted. It appeared that
most of the activity (~ 90%) in the water was in the form of bicarbonate.
CO[subscript]2 samples were taken from a manifold of scintillation vials which
contained the cocktail described in Appendix Table 1. Specially prepared
664
caps for the vials were drilled, fitted with glass tubing, and then sealed
with silicone so that air and gases from the experimental chamber (air-
tight) would pass through the manifold and CO2 trapping cocktails. The
vials were connected in series so that the evolved gases would pass
through a total of six vials before going through a final trap. It was
determined that more than 90% of the counts evolved were trapped in the
first vial, and that the last or sixth vial in the manifold trap set-up
showed only background levels of activity.
RESULTS
Previously Cultured Labeled Bacteria Experiments
Appendix Figure 4 displays the results of the first experiments in
which clams of the genus Macoma were allowed to feed on a sediment-
detrital mixture containing bacteria which had been previously grown on
a medium containing 14-C glutamate. As evidenced by the graph, clam
tissue showed a maximum of activity 2-3 days after the experiment began.
The general shape of the curves for the two species of clams was similar,
although the actual amounts of activity differed somewhat. The activity
observed in the clam tissue homogenates was low relative to the bacterial
culture broth, which when counted showed 2 x 10[superscript]6 dpm ml[superscript]-1. However, the
final sediment-detrital mixture showed 7 x 10[superscript]3 dpm ml[superscript]-1 when the test
animals were introduced.
The experiment using culture grown labeled bacteria as food for
crangonid and pandalid shrimp proved to be unsuccessful. Although
665
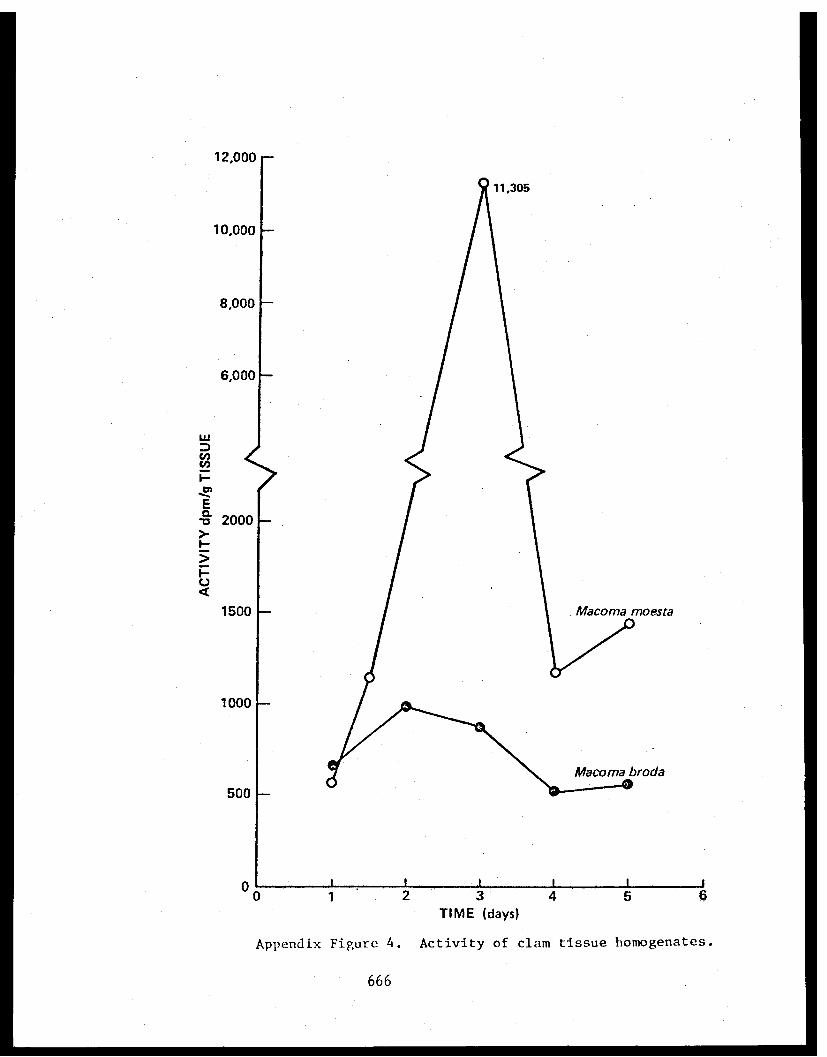
Appendix Figure 4. Activity of clam tissue homogenates.
666

labeled bacteria were successfully grown, the test animals did not feed,
and some died. The experiment was carried to completion anyway. It is
of interest that non-feeding animals typically showed low activities
throughout the experiment, with tissue activities as well as activity
of the water staying near background levels. The sediment-detrital
mixture was found to have an activity of 5.8 x 10[superscript]4 dpm ml[superscript]-1
Closed Mini-Ecosystem Experiments
Results of the first attempts at the closed system assimilation
experiment are summarized in Appendix Tables 2 through 4. It is evi-
dent from Appendix Table 2, [superscript]14CO[subscript]2 evolution, that the bacteria readily
incorporated the 14-C glutamate label. Further, after mixing the bac-
terial growth mixture into the sediment-detrital mixture, the final
substrate upon which shrimp were placed for the feeding trial, showed
high levels of activity (3.5 x 10[superscript]4 dpm ml[superscript]-1 ). The sediment activity
varied with time as indicated in Appendix Table 3.
Activity data for individual shrimp homogenates are graphed in
Appendix Figure 5. Activity appeared rapidly in shrimp tail tissue and
then tapered off to lower levels by the end of the experimental period.
Gills of these same shrimp showed very high activity levels (to 42000 dpm).
These animals were observed to feed during the experiment. Appendix
Table 4 displays an account of the label for the experiment.
A second experiment, utilizing the same approach as the one above,
but with more animals was attempted. Again bacteria incorporated label
(7 x 10[superscript]5 dpm in 24 hr) and the substrate for the feeding trial showed
667
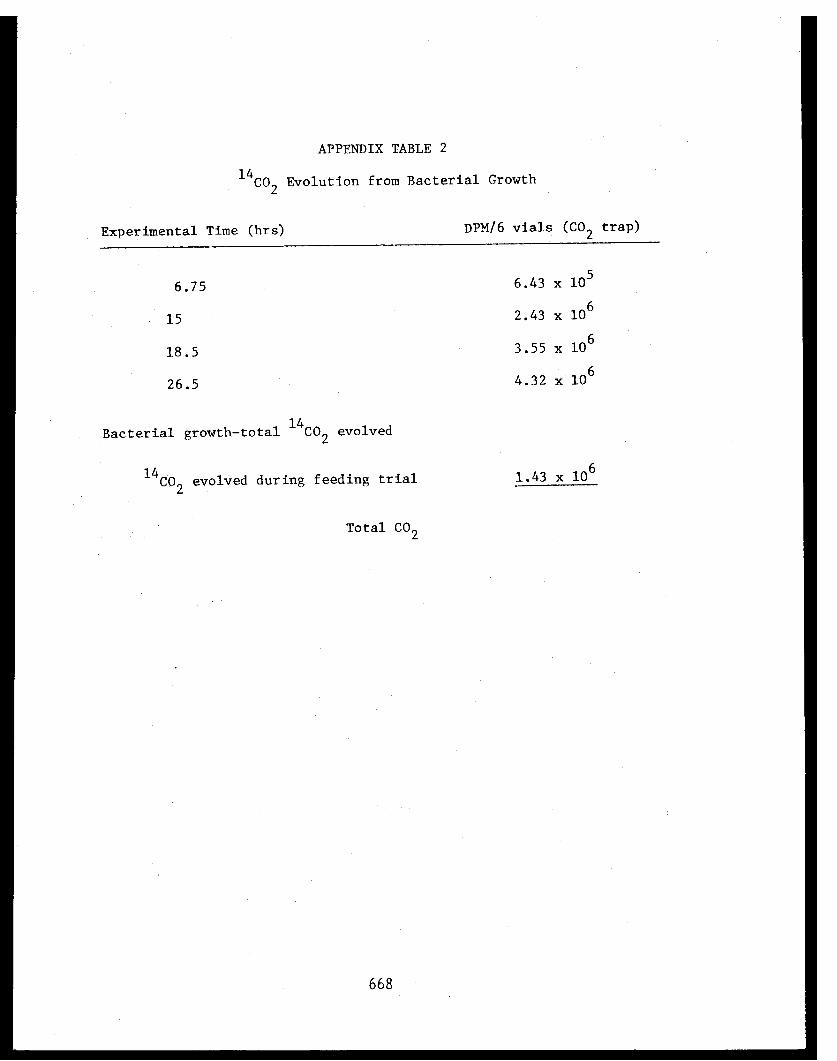
APPENDIX TABLE 2
[superscript]14CO [ s u b s c r i p t ]2 Evolution from Bacterial Growth
668
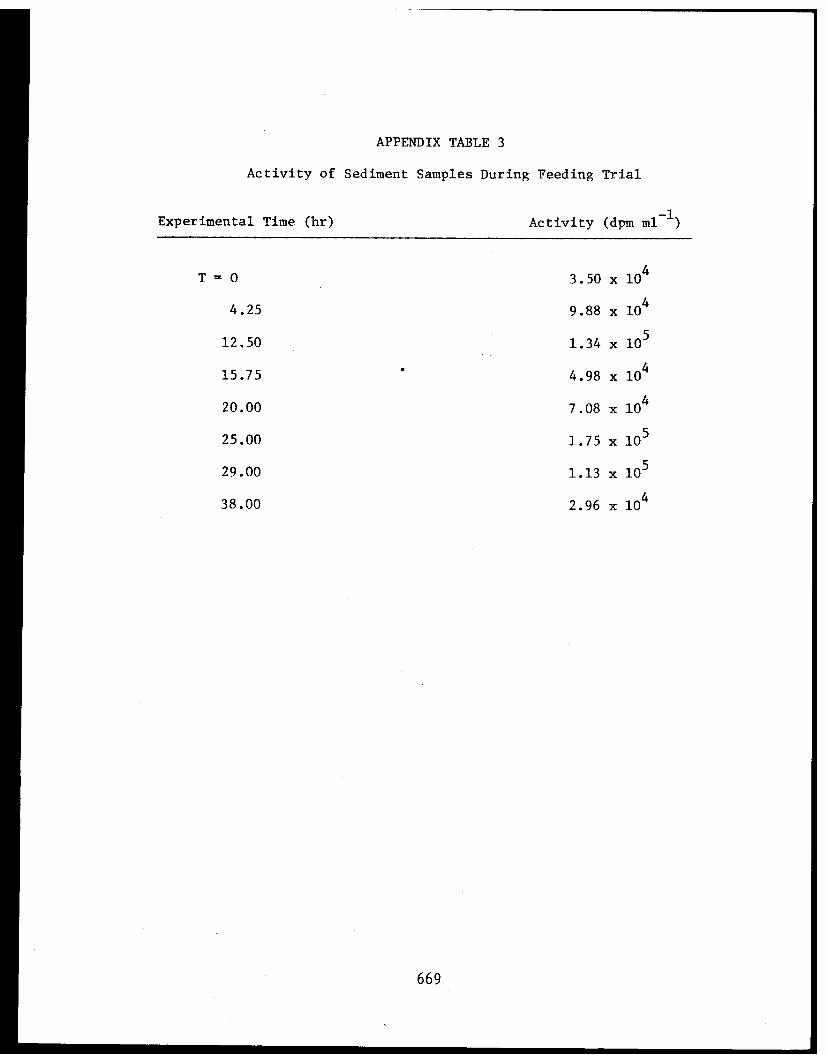
APPENDIX TABLE 3
Activity of Sediment Samples During Feeding Trial
669

APPENDIX TABLE 4
14-C Label Account for Mini-Ecosystem Bacterial
Growth and Shrimp Feeding Trial
670
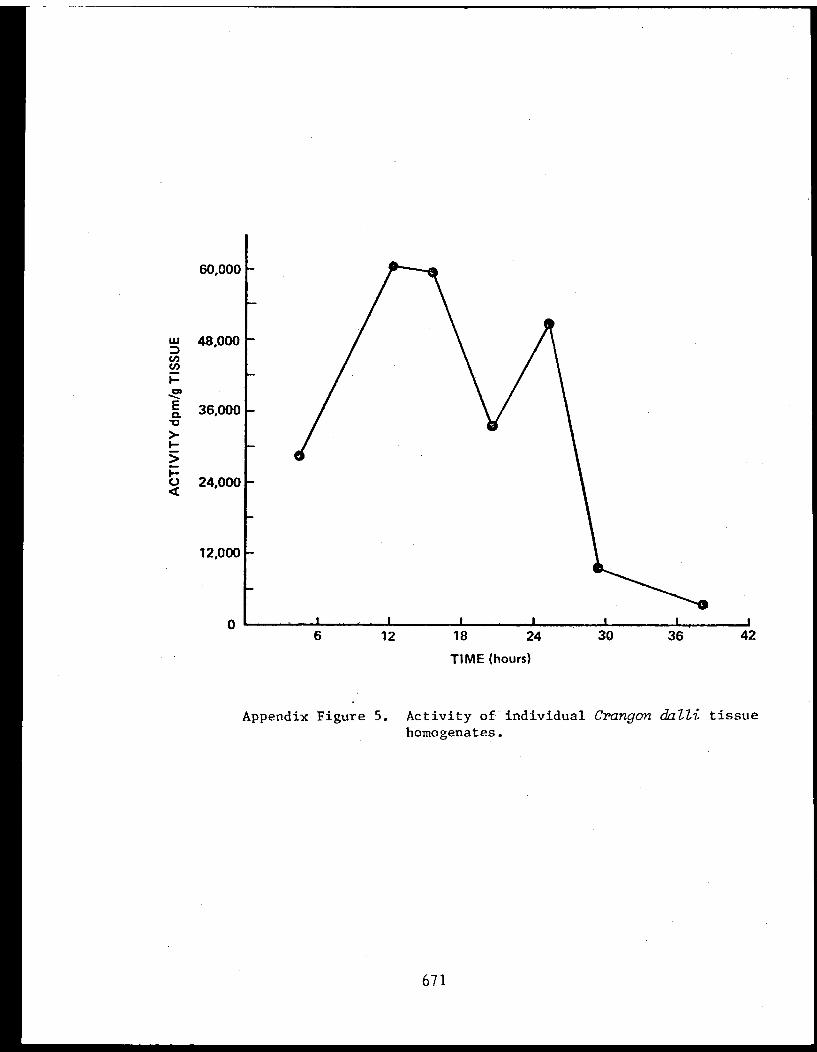
Appendix Figure 5. Activity of individual Crangon dalli tissuehomogenates.
671

good levels of activity (4 x 10[superscript]4 dpm ml[superscript]-1). However, shrimp death and
problems with the system resulted in failure of the experiment. Several
of the experimental animals died and it was necessary to restart the
experiment with new ones on the same substrate. These animals in most
cases did not feed. Appendix Figure 6 shows the activities of shrimp
tissue homogenates for this experiment. It is noteworthy that up to
2000 dpm g[superscript]-1 tissue were recorded for animals that did not feed and had
empty guts at the time of collection. Problems with the aeration system
resulted in resuspension of the substrate.
DISCUSSION
Results have been presented which suggest that Macoma spp. clams
assimilated bacteria which had been previously grown on a radioactive
label. Although activity levels of the clams were low, the general shape
of the curves suggests that label was assimilated, then metabolized,
resulting in a loss of activity in the tissues as suggested in the out-
line (Appendix Figure 1). The use of the labeled bacteria in this experi-
ment appeared to be a satisfactory method and to be relatively free of
complications. Although the shrimp experiment using the previously cul-
tured labeled bacteria approach did not work the methods seem satisfactory.
More specifically non-feeding animals did not pick up activity, nor did
the water or other pools in the experimental set up. Non-feeding animals
and death of experimental animals are hazards of experimental biological
systems. Hence, this approach appears to be a workable one provided
672
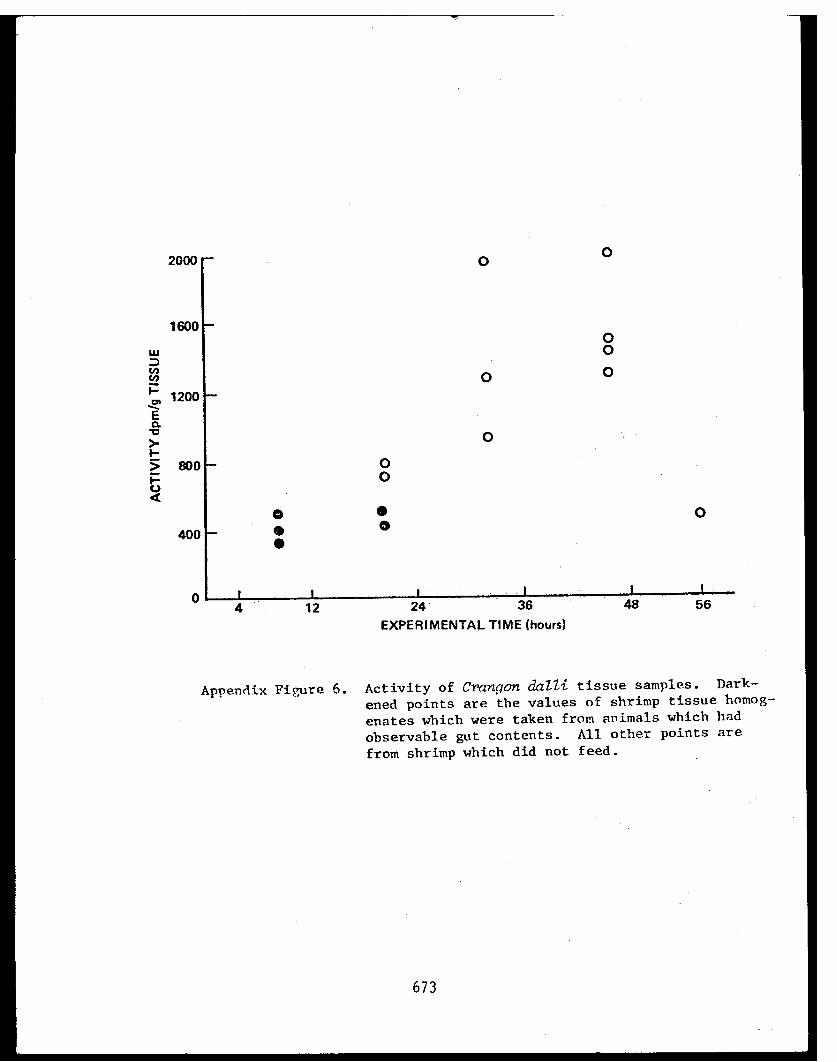
Appendix Figure 6. Activity of Crangon dalli tissue samples. Dark-
ened points are the values of shrimp tissue homog-
enates which were taken from animals which had
observable gut contents. All other points are
from shrimp which did not feed.
673
that activity levels can be adjusted by modifying the amount of label
introduction, volume of sediment-detrital mixture and numbers of exper-
imental animals to be dealt with. In the clam experiment, too much
dilution of the pregrown bacterial broth by the sediment-detrital mix-
ture took place because the volume of the sediment and the experimental
set up was too large.
Results of the mini-ecosystem approach were ambiguous. The first
experiment suggested that crangonid shrimp did indeed assimilate the
bacteria which had been labeled. High levels of activity were observed
after 18-24 hours of exposure to the food source. Again the level of
activity began to drop with time as above. This drop in activity was
similarly noted for the sediment-detrital food source.
The second experiment using this approach left some doubt as to
what was actually being assimilated by the shrimp. In this case animals
which had not fed showed activity. This suggests that they were absorb-
ing label from some other source. Further, the problems encountered
with this approach were much greater than with the use of the pregrown
labeled bacteria. Glassware, tubing, aeration, etc. contributed to the
overall complexity of the set up and made for problems during the actual
running of the experiment. Resuspension of labeled substrate was a big
problem which led to the demise of the control. Labeled substrate found
its way into the control chamber thus making activity available to the
control animal. However, even if the shrimp showed such levels of
activity as these (2000 dpm) it is still suggested from the first experi-
ment that they were absorbing additional label, presumably from bacteria.
674
The failure of the second experiment poses an interesting question: of
what significance is the assimilation of carbon from dissolved sources?
This question has frequently been raised for certain types of detrital
feeding animals. Recent work has demonstrated that detrital feeding
fishes are capable of assimilating detrital non-protein amino acids
(Bowen, 1980). Crangonids, residing in a rich organic slurry of sediment
and detritus as they do, might be able to take advantage of dissolved
organics such as amino acids.
In summary, the previously cultured labeled bacteria approach may
be of more value in addressing the simple question of whether or not an
animal can assimilate bacterial carbon. The closed system approach as
employed here led to problems in interpretation of the results as noted
by Conover and Francis (1973). It appears these animals are able to as-
similate bacterial carbon, and that additionally they may be able to
assimilate dissolved sources of carbon and nutrients. However, from
these experiments it is not certain how much occurs from either source.
If further efforts to examine bacterial and dissolved carbon assi-
milation in these animals were to be initiated, several points are
noteworthy in terms of methods. An open flowing seawater system with
previously cultured labeled bacteria should be employed. Scintillation
cocktails using Biofluor (NEN) should be used for most types of samples
with the exception of CO[subscript]2. CO[subscript]2 can be collected on filter paper soaked
in Protosol and counted in the Omnifluor cocktail.
675
REFERENCES
Adams, S. M. and J. W. Angelovic. 1970. Assimilation of detritus andits associated bacteria by three species of estuarine animals.Chesapeake Science, Vol. II, No. 4, pp. 249-254.
Bowen, S. H. 1980. Detrital non-protein amino acids are the key torapid growth of Tilapia in Lake Valencia, Venezuela. Science207:1216-1218.
Conover, R. J. and V. Francis. 1973. The use of radioactive isotopesto measure the transfer of materials in aquatic food chains.Marine Biology 18:272-283.
Cummins, K. W. 1973. Trophic relations of aquatic insects. AnnualReview of Entomology 18:183-206.
Kofoed, L. H. 1975. The feeding biology of Hydrobia ventrosa (Montagu)II. Allocation of the components of the carbon-budget and thesignificance of the secretion of dissolved organic material. J.Exp. Mar. Biol. Ecol. 19:243-256.
Moriarty, D. J. W. 1978. Quantitative studies on bacteria and algaein the food of the mullet Mugil cephalus and the prawn Metapenaeusbennettae (Racek and Dall). J. Exp. Mar. Biol. Ecol. 22:131-143.
Rieper, M. 1978. Bacteria as food for marine harpacticoid copepods.Marine Biology 45:337-345.
Tenore, K. R. 1975. Detrital utilization by the polychaete, Capitellacapitata. J. Marine Research Vol. 33, 3:261-274.
Tenore, K. R. 1977. Food chain pathways in detrital feeding benthiccommunities: A review, with new observations on sediment resus-pension and detrital recycling. In B. C. Coull (ed.), Ecology ofMarine Benthos, USC Press. pp. 37-53.
Wilcox, J. R. and H. P. Jefferies. 1974. Feeding habits of the sandshrimp Crangon septemspinosa. Biol. Bull. 146:424-434.
676