Environmental and Social Correlates of Physical Activity in Neighborhood Parks: An Observational...
17
This article was downloaded by:[Yale University] On: 11 July 2008 Access Details: [subscription number 788775020] Publisher: Routledge Informa Ltd Registered in England and Wales Registered Number: 1072954 Registered office: Mortimer House, 37-41 Mortimer Street, London W1T 3JH, UK Leisure Sciences An Interdisciplinary Journal Publication details, including instructions for authors and subscription information: http://www.informaworld.com/smpp/title~content=t713773100 Environmental and Social Correlates of Physical Activity in Neighborhood Parks: An Observational Study in Tampa and Chicago Myron F. Floyd a ; J. O. Spengler b ; Jay E. Maddock c ; Paul H. Gobster d ; Luis Suau b a North Carolina State University, Raleigh, NC, USA b University of Florida, Gainesville, FL, USA c University of Hawaii at Manoa, Honolulu, HI, USA d USDA Forest Service, Evanston, IL, USA Online Publication Date: 01 July 2008 To cite this Article: Floyd, Myron F., Spengler, J. O., Maddock, Jay E., Gobster, Paul H. and Suau, Luis (2008) 'Environmental and Social Correlates of Physical Activity in Neighborhood Parks: An Observational Study in Tampa and Chicago', Leisure Sciences, 30:4, 360 — 375 To link to this article: DOI: 10.1080/01490400802165156 URL: http://dx.doi.org/10.1080/01490400802165156 PLEASE SCROLL DOWN FOR ARTICLE Full terms and conditions of use: http://www.informaworld.com/terms-and-conditions-of-access.pdf This article maybe used for research, teaching and private study purposes. Any substantial or systematic reproduction, re-distribution, re-selling, loan or sub-licensing, systematic supply or distribution in any form to anyone is expressly forbidden. The publisher does not give any warranty express or implied or make any representation that the contents will be complete or accurate or up to date. The accuracy of any instructions, formulae and drug doses should be independently verified with primary sources. The publisher shall not be liable for any loss, actions, claims, proceedings, demand or costs or damages whatsoever or howsoever caused arising directly or indirectly in connection with or arising out of the use of this material.
-
Upload
independent -
Category
Documents
-
view
0 -
download
0
Transcript of Environmental and Social Correlates of Physical Activity in Neighborhood Parks: An Observational...

This article was downloaded by:[Yale University]On: 11 July 2008Access Details: [subscription number 788775020]Publisher: RoutledgeInforma Ltd Registered in England and Wales Registered Number: 1072954Registered office: Mortimer House, 37-41 Mortimer Street, London W1T 3JH, UK
Leisure SciencesAn Interdisciplinary JournalPublication details, including instructions for authors and subscription information:http://www.informaworld.com/smpp/title~content=t713773100
Environmental and Social Correlates of Physical Activityin Neighborhood Parks: An Observational Study inTampa and ChicagoMyron F. Floyd a; J. O. Spengler b; Jay E. Maddock c; Paul H. Gobster d; LuisSuau ba North Carolina State University, Raleigh, NC, USAb University of Florida, Gainesville, FL, USAc University of Hawaii at Manoa, Honolulu, HI, USAd USDA Forest Service, Evanston, IL, USA
Online Publication Date: 01 July 2008
To cite this Article: Floyd, Myron F., Spengler, J. O., Maddock, Jay E., Gobster, Paul H. and Suau, Luis (2008)'Environmental and Social Correlates of Physical Activity in Neighborhood Parks: An Observational Study in Tampaand Chicago', Leisure Sciences, 30:4, 360 — 375
To link to this article: DOI: 10.1080/01490400802165156URL: http://dx.doi.org/10.1080/01490400802165156
PLEASE SCROLL DOWN FOR ARTICLE
Full terms and conditions of use: http://www.informaworld.com/terms-and-conditions-of-access.pdf
This article maybe used for research, teaching and private study purposes. Any substantial or systematic reproduction,re-distribution, re-selling, loan or sub-licensing, systematic supply or distribution in any form to anyone is expresslyforbidden.
The publisher does not give any warranty express or implied or make any representation that the contents will becomplete or accurate or up to date. The accuracy of any instructions, formulae and drug doses should beindependently verified with primary sources. The publisher shall not be liable for any loss, actions, claims, proceedings,demand or costs or damages whatsoever or howsoever caused arising directly or indirectly in connection with orarising out of the use of this material.
Dow
nloa
ded
By:
[Yal
e U
nive
rsity
] At:
16:4
7 11
Jul
y 20
08
Leisure Sciences, 30: 360–375, 2008Copyright C© Taylor & Francis Group, LLCISSN: 0149-0400 print / 1521-0588 onlineDOI: 10.1080/01490400802165156
Environmental and Social Correlates of PhysicalActivity in Neighborhood Parks: An Observational
Study in Tampa and Chicago
MYRON F. FLOYD
North Carolina State UniversityRaleigh, NC, USA
J.O. SPENGLER
University of FloridaGainesville, FL, USA
JAY E. MADDOCK
University of Hawaii at ManoaHonolulu, HI, USA
PAUL H. GOBSTER
USDA Forest ServiceEvanston, IL, USA
LUIS SUAU
University of FloridaGainesville, FL, USA
This study used observational methods to examine physical activity (PA) and selectedcorrelates in 28 parks in Tampa, Florida, and Chicago, Illinois. We observed 9,454 parkusers within predetermined activity zones and coded their activity as sedentary, walking(i.e., moderate intensity), or vigorous PA. In Tampa, higher temperature, unorganizedactivity, lower amounts of shade, lower neighborhood income, Hispanic neighborhoodethnicity, male gender and child age group were significantly associated with walking.Vigorous activity was not associated with income and ethnicity. Morning hours, un-organized activity, lower neighborhood income and African American neighborhoodethnicity were associated with walking in Chicago. Vigorous activity was associatedwith children, lower neighborhood income and African American ethnicity. Findingsfrom this study can inform policy decisions and future research directions.
Keywords active living, built environment, health benefits, neighborhood diversity,observational methods, SOPLAY, urban parks
Received 12 March 2007; accepted 5 September 2007.Address correspondence to Myron Floyd, Department of Parks, Recreation and Tourism Management, Box
8004 Biltmore Hall, North Carolina State University, Raleigh, NC 27695-8004. E-mail: myron [email protected]
360

Dow
nloa
ded
By:
[Yal
e U
nive
rsity
] At:
16:4
7 11
Jul
y 20
08
Physical Activity in Parks 361
Lack of physical activity has become a significant health issue in the U.S. and itseffects on particular segments of the populations are especially troublesome. For example,statistics from the federal Healthy People 2010 report showed that slightly more than halfof African American and Latino Americans engage in no leisure time physical activity(LTPA) compared to 36% of non-Hispanic whites (U.S. Department of Health and HumanServices, 2000). LTPA also decreases with age, is less prevalent among women than men,and varies by region of the country (Macera et al., 2005). The consequences of physicalinactivity impact nearly all aspects of human health from obesity and overweight to type 2diabetes, loss of muscle strength and joint function, depression and anxiety, colon cancerand cardiovascular diseases (U.S. Department of Health and Human Services). Certaingroups bear a disproportionate share of these health effects. For example, deaths from heartdisease are 40% higher among African Americans than whites, Latino Americans are twiceas likely to die from diabetes as non-Hispanic whites, and obesity in children has tripled inthe last 30 years (U.S. Department of Health and Human Services).
Current efforts to increase physical activity emphasize changes that can be madethrough the design and management of environments such as parks, school playgroundsand neighborhoods (Sallis & Glanz, 2006). Healthy People 2010 (U.S. Department ofHealth and Human Services, 2000) identified access to safe and convenient communityopen spaces and facilities as a critical factor in increasing physical activity. In addition, TheTask Force on Community Preventive Services found that creating and improving placesfor physical activity can increase the percentage of people who exercise at least three timesa week by an average of 25% (Centers for Disease Control and Prevention, 2005). Due totheir wide availability, public neighborhood parks hold significant potential for promotingpopulation-wide increases in physical activity (Bedimo-Rung, Mowen, & Cohen, 2005;Godbey et al., 2005; Henderson & Bialeschki, 2005). A national study found that 80%of the public use parks (Godbey, Graefe, & James, 1991), and a review of recent studiessuggest that many park users engage in active forms of leisure (Godbey et al., 2005). How-ever, few researchers have measured how neighborhood parks contribute to specific levelsof LTPA and little is known about environmental correlates of LTPA in parks in ethnicallyand socio-economically diverse neighborhoods. To be most effective in promoting parksas settings for physical activity in diverse communities, planners and policy makers needresearch evidence on how parks contribute to LTPA.
Assessing LTPA in public parks has been hampered by a lack of objective measures ofphysical activity until recently (McKenzie et al., 2006). Previous studies of park use reliedalmost exclusively on self-report measures (Godbey et al., 2005; Henderson & Ainsworth,2001). Moreover, leisure researchers have not generally focused on measuring physicalactivity, as it is commonly assumed that park users are by definition active (Godbey et al.,2005). Instead, greater emphasis in park studies has been given to social psychologicaloutcomes such as perceived benefits and user satisfaction, or perceptions of environmentalimpacts (Henderson & Bialeschki, 2005; Sallis et al., 2005). As a result, despite numerousstudies of park users little systematic quantification of the physiological aspects of parkuse has occurred. To further establish how public parks contribute to community healththrough physical activity, studies must incorporate dependent variables tied to evidence-based physical activity recommendations.
Our study examined levels of physical activity in diverse neighborhood parks usinga recent innovation in observational methods. The specific aims of the study were to: (a)examine the reliability of an observation procedure to measure LTPA, (b) examine LTPAlevels (i.e., sedentary, moderate, vigorous) in selected neighborhood parks using directobservations, and (c) examine relationships between physical activity in parks and socio-demographic and environmental variables.

Dow
nloa
ded
By:
[Yal
e U
nive
rsity
] At:
16:4
7 11
Jul
y 20
08
362 M. F. Floyd et al.
Related Literature
Research evidence on the association between parks and physical activity is increasing.Access to public parks, especially parks within walking distance, has been associated pos-itively with various measures of physical activity including self-reported physical activity(Chad et al., 2005), pedometer readings (King et al., 2003), meeting recommendationsfor obtaining moderate and vigorous physical activity (MVPA; Sharpe, Granner, Hutto, &Ainsworth, 2004) and recommended levels of walking and physical activity (Wilson et al.,2004). Despite such evidence, how parks contribute to physical activity through designedfeatures and/or natural settings has not been firmly established. A crucial step in filling thisgap is the development and employment of objective measures of physical activity in parks.
Although numerous benefits of recreation participation have been identified, few studiesgive primary focus to quantifying physical activity in parks (Godbey et al., 2005). Severalstudies, however, do provide useful information on the extent of active recreation withinurban parks through the identification and classification of park activities.
Hutchison (1987) conducted observations in 13 Chicago area parks and recorded 18,000user groups and more than 300 activities. Activities were summarized as stationary (e.g.,picnicking), mobile (e.g., cycling, jogging) and sports (e.g., organized activities). He re-ported that 63% of both black and white park user groups took part in mobile or sportsactivities and only 44% of Hispanics took part in mobile or sports activities. In a surveyof Lincoln Park users in Chicago, Gobster (2002) found 45% of all park users reportedengaging in active-individual activities (e.g., walking, jogging, walking a dog), and 23% re-ported engaging in active-group activities (e.g., team sports). Among white park users, 76%reported engaging in active-individual forms of recreation. This finding compared to abouta third of black and Latino park users and 24% of Asian park users. Scott (1997) reportedthat the second most frequent planned or intended activity among Cleveland Metroparksvisitors was walking or hiking (44%). Other activities included bicycling (5%), runningor jogging (6%) and walking a dog (9%). Time of day, week and season were statisticallysignificantly associated with park activities. For example, walking or hiking and runningor jogging tended to occur during morning rather than afternoon hours. Walking or hikingand walking a dog tended to be reported among users interviewed during the spring or fallrather than the summer. Moore, Scott, and Graefe (1998) categorized their sample as 50%walkers, 13% runners, 20% skaters and 17% bicycle riders in their study of recreation useof a suburban Cleveland greenway trail. They focused on the effect of other activities onthe respondents’ trail experience. In another study of trail users, Moore and Graefe (1994)investigated place attachment among rail-trail users in three geographic regions. They foundbicycling was the predominant use of trails located farthest from home residence and thatthe frequency of walking as the predominant activity increased for trails close to home. Anational study of park use in five major cities in the United States found 31% of peoplebetween the ages of 55 and 65 engaged in exercise or sport activity, with 25% of thoseover 65 years of age reporting such activity (Godbey & Blazey, 1983). Raymore and Scott(1998) found 55% of older park users (50 and above) walked or hiked during their visits toCleveland Metroparks. Less than 10% jogged or reported bicycle riding. Another study ofolder adults (age 55 and older) in Chicago’s Lincoln Park reported that 43% of park usersused bicycle paths (Tinsley, Tinsley, & Croskeys, 2002).
Taken together, such studies demonstrate the potential of public parks to contributeto recommended levels of physical activity (Godbey et al., 2005). As noted, however,previous studies of park use have relied almost exclusively on self-report measures (seeHutchison, 1987, as an exception). Although self-report measures of park use, experiencesand perceived benefits are conventional tools in leisure research, they provide no validatedmeasurement of leisure-time physical activity.

Dow
nloa
ded
By:
[Yal
e U
nive
rsity
] At:
16:4
7 11
Jul
y 20
08
Physical Activity in Parks 363
Several alternatives to self-report measures exist for deriving objective measures ofphysical activity in parks. These include heart monitors, pedometers, accelerometers anddirect observation. Pedometers are known for low validity and a high degree of inter-instrument variability (Bassett et al., 1996). Most accelerometers measure vertical move-ments. While they are the most commonly used method of objectively measuring physicalactivity, they do not provide valid measures for recreation activities that may be stationary(e.g., weight lifting or some calisthenics). Other potential challenges include equipment lossor malfunction and the cost of outfitting large numbers of participants. For these reasons,direct observation has been shown to be best suited for assessing physical activity in openenvironments such as parks and open space areas where there can be constant change inthe number of participants and level of activity (McKenzie et al., 2006). Direct observationmeasures are also well-suited for children since research has shown that children under age10 do not provide reliable and valid self-reports of their physical activity (Sallis & Owen,1999).
Direct observation has been used extensively in physical activity research (McKenzie,2002). For example, several systems have been developed for measuring children’s phys-ical activity in school settings (McKenzie et al., 1991). The System for Observing Playand Leisure Activity in Youth (SOPLAY) was developed for leisure settings (McKenzie,2002). The SOPLAY consists of periodic momentary scans of individuals and environ-mental features in pre-determined zones. The system requires trained observers to codeactivities into one of three activity codes (i.e., sedentary, walking and vigorous) duringa brief scan of a predetermined activity area or zone. Separate scans are made for malesand females. Additionally, observers code setting characteristics or environmental variablessuch as time, accessibility (e.g., locked or gated), dominant activity and presence or absenceof supervision. From this method, data on levels of physical activity by gender, activity, andenvironmental variables can be obtained. McKenzie et al. (2006) recently reported modi-fications in the SOPLAY to accommodate measurement of physical activity in parks andopen space areas. McKenzie et al. (2006) conducted a study in eight residential area parks inLos Angeles using a new observation tool, the System for Observing Play and Recreation inCommunities (SOPARC). Acceptable reliabilities (i.e., percent agreement) were reportedbetween observers for age (89% females; 85% males), activity level (80% females; 88%males) and setting characteristics such as presence of equipment and supervision (above94%). Across the eight parks, the percentage of users observed engaging in vigorous ac-tivity ranged from 11–23%. The range for walking and vigorous activity combined was23–51%. They observed that males were more likely than females to be park users (62%vs. 38%) and more active during their visits (19% vs. 10%). Also, adults (43%) were morelikely to be park users than children (34%), teens (19%) or seniors (5%). The findings fromMcKenzie et al.’s (2006) study on measuring physical activity in parks and open space ar-eas are promising. To strengthen confidence in observational measures of physical activity,replication of such methods under different conditions and additional parks is necessary. Inlight of this need, we used a modified version of the SOPLAY to examine physical activityin 28 parks across two major U.S. cities.
Methods
Study Settings and Parks Selection
Data for the study were obtained from direct observations of users in 10 neighborhoodparks in Tampa, Florida, and 18 neighborhood parks in Chicago, Illinois. Observations inTampa were conducted between March and April 2005. Observations in Chicago occurredbetween May and June 2005. These months were selected to match the two cities on average
Dow
nloa
ded
By:
[Yal
e U
nive
rsity
] At:
16:4
7 11
Jul
y 20
08
364 M. F. Floyd et al.
daytime temperatures around 75◦F. Observations took place hourly Friday through Sundaybetween 10 AM and 6 PM. Selection of these days and times was determined largely bybudgetary constraints.
Parks were selected on the basis of race/ethnic composition (e.g., white non-Hispanic,African American and Hispanic) and income characteristics of the surrounding neighbor-hoods. Neighborhood was defined in terms of U.S. Census tracts. Fifty percent or greaterconcentration of one racial/ethnic group served as the cut-point for designating the pre-dominant race/ethnic composition of a census tract (Brown & Bennington, 1993). Censustracts with median income greater than the metro area income and poverty rate of 10% orless were designated as “middle to high” neighborhood income (Jargowski & Banes, 1991).Census tracts with median income less than the metro area income and with 30% povertyrate were classified as “low income” neighborhood areas. ArcGIS was used to identify cen-sus tracts with desired characteristics. Parks within these tracts were eligible for the study.An attempt was made to observe three parks in each of six “race/ethnicity X income” cells(i.e., 3 race/ethnicity by 2 income groups). The final list of parks selected for observationwas made after consulting with park administrators in both cities. The mean acreage forTampa area parks selected was 41 acres with a range of 11.4 to 145 acres. The mean acreagefor Chicago area parks was 46 acres with a range of 8 to 207 acres.
Within each park activity zones and their boundaries were identified and mapped bytwo members of the research team prior to observations. In Tampa parks, 122 activity areaswere identified. These areas included athletic courts (17), sport fields (21), picnic areas (49),playgrounds (16), tracks (1), open space areas (10) and other use areas (8). In Chicago, 178activity areas for scans were identified. Similarly, activity areas in Chicago parks includedathletic courts (41), sport fields (93), picnic areas (2), playgrounds (27), tracks (6), openspace (4) and other areas. Each park and activity zone was observed at least twice ondifferent days by two teams of observers. Observation teams alternated parks between AMand PM so that no team spent an entire observation day in a single park.
As described earlier, SOPLAY provides a count of individuals within each designatedactivity zone and classification of observed activity using a momentary time sampling orscan. To apply this procedure, all observers received training in SOPLAY from a certifiedtrainer. Observers received one day of classroom training using lecture and videotapeddemonstrations of the procedure followed by two weekend days of practice fieldwork inthree different neighborhood parks.
Measures
The dependent variable of study, physical activity, was observed and coded as sedentary(e.g., sitting, standing, lying down), walking (i.e., moderate intensity behavior), or vigorous(e.g., climbing, running, jumping when playing basketball). In SOPLAY, walking refers toan intensity level of PA and represents all moderate intensity activity rather than walkingper se. Likewise, vigorous refers to an intensity level. Previous research has established theconstruct validity of these activity code measures using heart rate monitors and accelerom-eters (McKenzie et al., 1991; Rowe et al., 2004; Scruggs et al., 2003). Readers interested inmore detailed descriptions of these procedures are encouraged to consult McKenzie (2005,2006).
For independent variables, observers recorded during each scan the gender of theparticipants, apparent age of participants (children approximately 10 years old and youngervs. adults), time of the observations (AM vs. PM), temperature (a continuous measure),amount of shade cover (0%, 25%, 50%, 75%, or 100% shaded), and whether the observedactivity was organized or unstructured (coded as Yes or No; e.g., sanctioned league play

Dow
nloa
ded
By:
[Yal
e U
nive
rsity
] At:
16:4
7 11
Jul
y 20
08
Physical Activity in Parks 365
vs. free play). For the logistic regression analyses, females, adults, AM hours, unorganizedactivity and 100% shade were treated as reference categories.
Neighborhood income and race/ethnicity were also included in the regression anal-yses as independent variables and coded as categorical variables. High income served asthe reference category. For neighborhood race/ethnicity, neighborhoods that classified aspredominantly White, non-Hispanic served as the reference category.
Data Analysis
Inter-observer reliability results were reported for physical activity levels and setting char-acteristics codes using Cohen’s Kappa. Standards for Cohen’s Kappa recommend 0.40 to0.59 as moderate inter-rater reliability, 0.60 to 0.79 as substantial, and 0.80 outstandinginter-observer reliability (Landis & Koch, 1977). Chi-square tests of association were usedto examine bivariate associations among physical activity and socio-demographic and set-ting characteristics. For multivariate tests, multinomial logistic regression was used sincethe dependent variable was categorical with three levels (i.e., sedentary, walking and vigor-ous). Odds ratios (OR) with 95% confidence intervals are reported to indicate associationbetween independent variables and the three levels of physical activity. Nagelkerke R2
measured model fit.The multi-nomial logit model assumes that the outcome categories exhibit the property
of independence of irrelevant alternatives (IIA). This assumption holds that including orexcluding categories do not affect the relative risks (i.e., odds) associated with the predictorin the remaining categories (StataCorp, 2005). The Hausman specification test examined thevalidity of this assumption by estimating a full model with all outcome categories followedby a restricted model eliminating one or more outcome categories (StataCorp, 2005). If thereare no systematic changes in regression coefficients when outcome categories are excluded,the IIA assumption is satisfied. The IIA assumption was tested by STATA Version 9.
Results
Inter-observer Reliability
The observation protocol required observers to conduct the first and last observations ineach park in pairs, which resulted in 156 paired observations in Tampa parks and 186paired observations in Chicago parks. Cohen’s kappa was used to assess the inter-observerreliability of the paired observations. The results are reported by city and overall (Table 1).For observations conducted in Tampa parks, most environmental codes exhibited acceptablereliability (shade = 0.71, organized = 0.85, usable = 1.0 and activity zone = 1.0). Cohen’skappa coefficients for physical activity codes were also acceptable. For girls, coefficientsranged from 0.85 (sedentary) to 0.94 (walking). For observations of boys, coefficients rangedfrom 0.78 (sedentary) to 0.87 (vigorous). Kappa’s for observations for adult women rangedfrom 0.80 (sedentary) to 0.97 for walking and vigorous. For observations of adult males,kappa coefficients ranged from 60.9 (sedentary), 0.80 (walking) and 90.2 (vigorous). Thelowest reliability was associated with observations of adult male sedentary activity (0.69).
Results from observations in Chicago followed the same pattern. Codes for settingcharacteristics ranged from a low of 0.94 (temperature) to 0.98 (usable facility). For girls,kappa coefficients for physical activity were 0.86 (sedentary), 0.90 (walking) and 0.93(vigorous). For observations of boys, the coefficients ranged from 0.84 (sedentary) to 0.87(for walking and vigorous). Kappas for adult women were 0.87 (sedentary), 0.90 (walking)and 0.95 (vigorous). For adult males coefficients ranged from 0.76 (sedentary) to 0.85(vigorous). In summary, all physical activity codes exhibited acceptable reliability consistent

Dow
nloa
ded
By:
[Yal
e U
nive
rsity
] At:
16:4
7 11
Jul
y 20
08
366 M. F. Floyd et al.
TABLE 1 Proportion of Agreement (Cohen’s kappa) between Observer Pairs on SettingCharacteristics and Physical Activity Levels by Age and Sex
Setting Characteristics andPhysical Activity Levels Tampa (N = 156) Chicago (N = 186) Total (N = 342)
Time 0.94 0.97 0.96Zone 1.0 0.99 0.99Shade 0.71 0.94 0.84Usable Facility 1.0 0.98 0.99Organized Activity 0.85 0.91 0.89FC Sedentary 0.85 0.86 0.86FC Walking 0.94 0.90 0.92FC Vigorous 0.93 0.93 0.93MC Sedentary 0.78 0.84 0.82MC Walking 0.83 0.87 0.85MC Vigorous 0.86 0.87 0.87FA Sedentary 0.80 0.87 0.84FA Walking 0.89 0.90 0.90FA Vigorous 0.97 0.95 0.96MA Sedentary 0.69 0.76 0.73MA Walking 0.79 0.80 0.80MA Vigorous 0.92 0.85 0.89
Note: FC is female child; MC is male child; FA is female adults and MA is male adult.
with previous studies using SOPLAY (McKenzie et al., 2000) and SOPARC (McKenzieet al., 2006).
Level of Physical Activity
Across all parks in the two cities, 9,454 park users were observed and classified as sedentary,walking and vigorous. Nearly two-thirds (65%) of park users were classified as sedentary,24% were classified as walking and approximately 12% were classified as vigorous. Theseresults varied by city. About 70% of park users observed in Tampa were classified as seden-tary, 22% were classified as walking and 8% were classified as vigorous. By comparison,51% of Chicago park users were classified as sedentary, 28% classified as walking and 22%classified as vigorous.
Bivariate Relationships
Bivariate associations between park setting characteristics and socio-demographic variableswith physical activity are shown in Tables 2 and 3. In setting characteristics for Tampaparks, park users observed during mornings were slightly more likely to be classified aswalking or vigorous. In addition, organized activity was associated with greater numbers ofsedentary park users. Park users observed in unorganized activity also were more likely tobe classified as walking or vigorous. Further, lower amounts of shade cover were associatedwith an increased likelihood of walking or vigorous park users. For socio-demographicvariables, males were less likely than females to be classified as sedentary and more likelyto be classified as walking or vigorous. Children were less likely than adults to be classifiedas sedentary and more likely to be classified as walking or vigorous. In fact, children were
Dow
nloa
ded
By:
[Yal
e U
nive
rsity
] At:
16:4
7 11
Jul
y 20
08
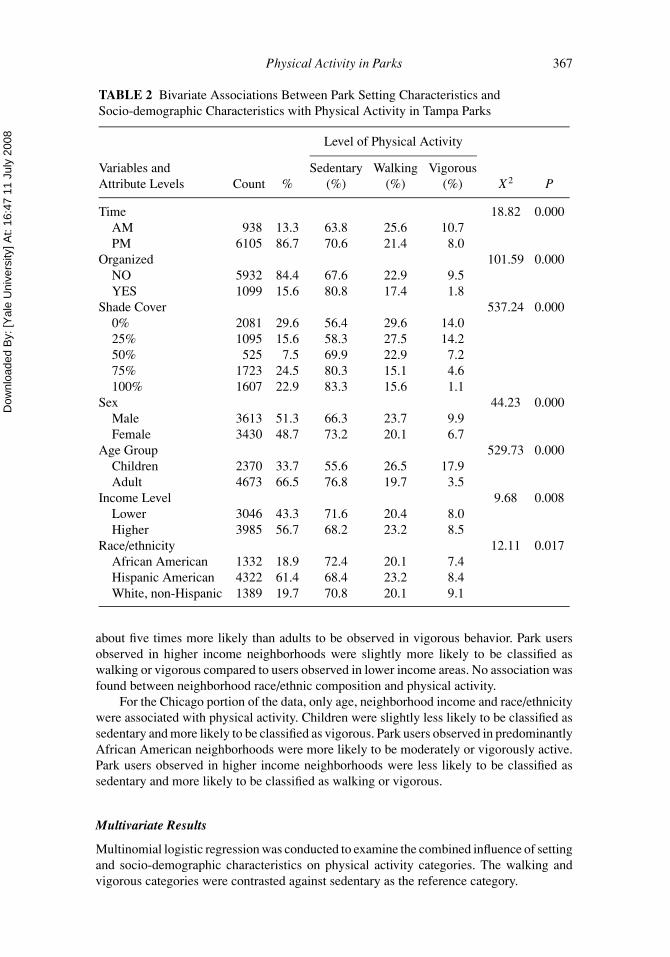
Physical Activity in Parks 367
TABLE 2 Bivariate Associations Between Park Setting Characteristics andSocio-demographic Characteristics with Physical Activity in Tampa Parks
Level of Physical Activity
Variables and Sedentary Walking VigorousAttribute Levels Count % (%) (%) (%) X2 P
Time 18.82 0.000AM 938 13.3 63.8 25.6 10.7PM 6105 86.7 70.6 21.4 8.0
Organized 101.59 0.000NO 5932 84.4 67.6 22.9 9.5YES 1099 15.6 80.8 17.4 1.8
Shade Cover 537.24 0.0000% 2081 29.6 56.4 29.6 14.025% 1095 15.6 58.3 27.5 14.250% 525 7.5 69.9 22.9 7.275% 1723 24.5 80.3 15.1 4.6100% 1607 22.9 83.3 15.6 1.1
Sex 44.23 0.000Male 3613 51.3 66.3 23.7 9.9Female 3430 48.7 73.2 20.1 6.7
Age Group 529.73 0.000Children 2370 33.7 55.6 26.5 17.9Adult 4673 66.5 76.8 19.7 3.5
Income Level 9.68 0.008Lower 3046 43.3 71.6 20.4 8.0Higher 3985 56.7 68.2 23.2 8.5
Race/ethnicity 12.11 0.017African American 1332 18.9 72.4 20.1 7.4Hispanic American 4322 61.4 68.4 23.2 8.4White, non-Hispanic 1389 19.7 70.8 20.1 9.1
about five times more likely than adults to be observed in vigorous behavior. Park usersobserved in higher income neighborhoods were slightly more likely to be classified aswalking or vigorous compared to users observed in lower income areas. No association wasfound between neighborhood race/ethnic composition and physical activity.
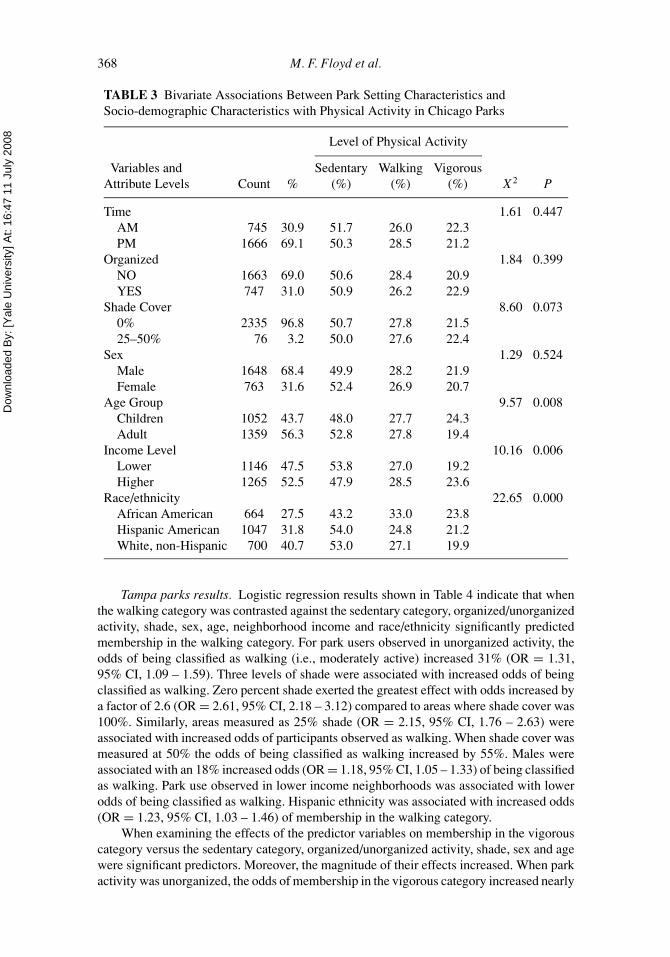
For the Chicago portion of the data, only age, neighborhood income and race/ethnicitywere associated with physical activity. Children were slightly less likely to be classified assedentary and more likely to be classified as vigorous. Park users observed in predominantlyAfrican American neighborhoods were more likely to be moderately or vigorously active.Park users observed in higher income neighborhoods were less likely to be classified assedentary and more likely to be classified as walking or vigorous.
Multivariate Results
Multinomial logistic regression was conducted to examine the combined influence of settingand socio-demographic characteristics on physical activity categories. The walking andvigorous categories were contrasted against sedentary as the reference category.
Dow
nloa
ded
By:
[Yal
e U
nive
rsity
] At:
16:4
7 11
Jul
y 20
08
368 M. F. Floyd et al.
TABLE 3 Bivariate Associations Between Park Setting Characteristics andSocio-demographic Characteristics with Physical Activity in Chicago Parks
Level of Physical Activity
Variables and Sedentary Walking VigorousAttribute Levels Count % (%) (%) (%) X2 P
Time 1.61 0.447AM 745 30.9 51.7 26.0 22.3PM 1666 69.1 50.3 28.5 21.2
Organized 1.84 0.399NO 1663 69.0 50.6 28.4 20.9YES 747 31.0 50.9 26.2 22.9
Shade Cover 8.60 0.0730% 2335 96.8 50.7 27.8 21.525–50% 76 3.2 50.0 27.6 22.4
Sex 1.29 0.524Male 1648 68.4 49.9 28.2 21.9Female 763 31.6 52.4 26.9 20.7
Age Group 9.57 0.008Children 1052 43.7 48.0 27.7 24.3Adult 1359 56.3 52.8 27.8 19.4
Income Level 10.16 0.006Lower 1146 47.5 53.8 27.0 19.2Higher 1265 52.5 47.9 28.5 23.6
Race/ethnicity 22.65 0.000African American 664 27.5 43.2 33.0 23.8Hispanic American 1047 31.8 54.0 24.8 21.2White, non-Hispanic 700 40.7 53.0 27.1 19.9
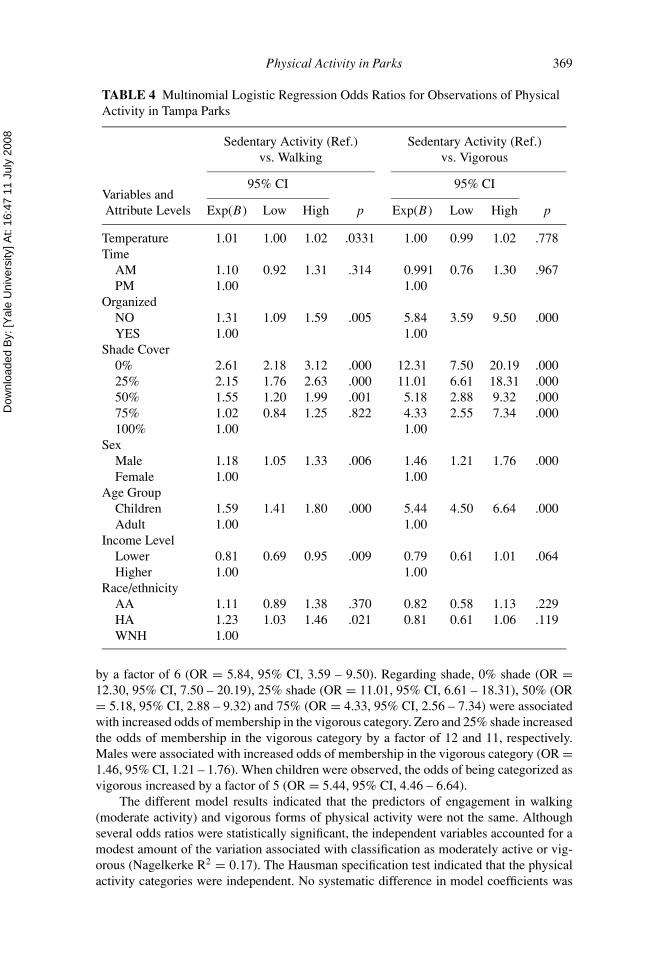
Tampa parks results. Logistic regression results shown in Table 4 indicate that whenthe walking category was contrasted against the sedentary category, organized/unorganizedactivity, shade, sex, age, neighborhood income and race/ethnicity significantly predictedmembership in the walking category. For park users observed in unorganized activity, theodds of being classified as walking (i.e., moderately active) increased 31% (OR = 1.31,95% CI, 1.09 – 1.59). Three levels of shade were associated with increased odds of beingclassified as walking. Zero percent shade exerted the greatest effect with odds increased bya factor of 2.6 (OR = 2.61, 95% CI, 2.18 – 3.12) compared to areas where shade cover was100%. Similarly, areas measured as 25% shade (OR = 2.15, 95% CI, 1.76 – 2.63) wereassociated with increased odds of participants observed as walking. When shade cover wasmeasured at 50% the odds of being classified as walking increased by 55%. Males wereassociated with an 18% increased odds (OR = 1.18, 95% CI, 1.05 – 1.33) of being classifiedas walking. Park use observed in lower income neighborhoods was associated with lowerodds of being classified as walking. Hispanic ethnicity was associated with increased odds(OR = 1.23, 95% CI, 1.03 – 1.46) of membership in the walking category.
When examining the effects of the predictor variables on membership in the vigorouscategory versus the sedentary category, organized/unorganized activity, shade, sex and agewere significant predictors. Moreover, the magnitude of their effects increased. When parkactivity was unorganized, the odds of membership in the vigorous category increased nearly
Dow
nloa
ded
By:
[Yal
e U
nive
rsity
] At:
16:4
7 11
Jul
y 20
08
Physical Activity in Parks 369
TABLE 4 Multinomial Logistic Regression Odds Ratios for Observations of PhysicalActivity in Tampa Parks
Sedentary Activity (Ref.) Sedentary Activity (Ref.)vs. Walking vs. Vigorous
95% CI 95% CIVariables andAttribute Levels Exp(B) Low High p Exp(B) Low High p
Temperature 1.01 1.00 1.02 .0331 1.00 0.99 1.02 .778Time
AM 1.10 0.92 1.31 .314 0.991 0.76 1.30 .967PM 1.00 1.00
OrganizedNO 1.31 1.09 1.59 .005 5.84 3.59 9.50 .000YES 1.00 1.00
Shade Cover0% 2.61 2.18 3.12 .000 12.31 7.50 20.19 .00025% 2.15 1.76 2.63 .000 11.01 6.61 18.31 .00050% 1.55 1.20 1.99 .001 5.18 2.88 9.32 .00075% 1.02 0.84 1.25 .822 4.33 2.55 7.34 .000100% 1.00 1.00
SexMale 1.18 1.05 1.33 .006 1.46 1.21 1.76 .000Female 1.00 1.00
Age GroupChildren 1.59 1.41 1.80 .000 5.44 4.50 6.64 .000Adult 1.00 1.00
Income LevelLower 0.81 0.69 0.95 .009 0.79 0.61 1.01 .064Higher 1.00 1.00
Race/ethnicityAA 1.11 0.89 1.38 .370 0.82 0.58 1.13 .229HA 1.23 1.03 1.46 .021 0.81 0.61 1.06 .119WNH 1.00
by a factor of 6 (OR = 5.84, 95% CI, 3.59 – 9.50). Regarding shade, 0% shade (OR =12.30, 95% CI, 7.50 – 20.19), 25% shade (OR = 11.01, 95% CI, 6.61 – 18.31), 50% (OR= 5.18, 95% CI, 2.88 – 9.32) and 75% (OR = 4.33, 95% CI, 2.56 – 7.34) were associatedwith increased odds of membership in the vigorous category. Zero and 25% shade increasedthe odds of membership in the vigorous category by a factor of 12 and 11, respectively.Males were associated with increased odds of membership in the vigorous category (OR =1.46, 95% CI, 1.21 – 1.76). When children were observed, the odds of being categorized asvigorous increased by a factor of 5 (OR = 5.44, 95% CI, 4.46 – 6.64).
The different model results indicated that the predictors of engagement in walking(moderate activity) and vigorous forms of physical activity were not the same. Althoughseveral odds ratios were statistically significant, the independent variables accounted for amodest amount of the variation associated with classification as moderately active or vig-orous (Nagelkerke R2 = 0.17). The Hausman specification test indicated that the physicalactivity categories were independent. No systematic difference in model coefficients was

Dow
nloa
ded
By:
[Yal
e U
nive
rsity
] At:
16:4
7 11
Jul
y 20
08
370 M. F. Floyd et al.
TABLE 5 Multinomial Logistic Regression Odds Ratios for Observations ofPhysical Activity in Chicago Parks
Sedentary Activity (Ref.) Sedentary Activity (Ref.)vs. Walking vs. Vigorous
95% CI 95% CIVariables and
Attribute Levels Exp(B) Low High p Exp(B) Low High p
Temperature 1.00 0.98 1.01 .543 1.00 0.98 1.01 .983Time
AM 0.78 0.63 .98 .029 0.90 0.63 0.98 .386PM 1.00 1.00
OrganizedNO 1.28 1.02 1.60 .036 0.99 0.78 1.27 .989YES 1.00 1.00
Shade Cover0% 1.14 0.65 2.01 .645 0.94 0.51 1.72 .83725% 1.00 1.00
SexMale 1.12 0.90 1.38 .307 1.18 0.93 1.49 .167Female 1.00 1.00
Age GroupChildren 1.11 0.91 1.36 .293 1.45 1.17 1.80 .001Adult 1.00 1.00
Income LevelLower 0.80 0.65 0.97 .027 0.70 0.56 0.87 .002Higher 1.00 1.00
Race/ethnicityAA 1.82 1.41 2.36 .000 1.56 1.18 2.08 .002HA 1.04 0.82 1.32 .767 1.16 0.89 1.50 .278WNH 1.00 1.00
found when either the moderate (walking; X2 = −2.34) or vigorous category (X2 = 16.08(9df), p = 0.065) was eliminated. A negative X2 indicates strong evidence of independence(StataCorp, 2005).
Chicago park results. Time of day, organized/unorganized activity, neighborhood in-come, and neighborhood race/ethnicity were significant predictors of membership in thewalking category versus the sedentary category in Chicago (see Table 5). Observationsduring morning hours lowered the odds of being classified as walking (OR = 0.78, 95%CI, 0.63–0.98). Unorganized activity (OR = 1.28, 95% CI, 1.02–1.60) was associated withincreased odds of being classified as walking. Lower neighborhood income (OR = 0.80,95% CI, 0.65 – 0.97) decreased the odds of membership in the walking category. Neighbor-hood race/ethnicity was associated with the largest increase (82%) in odds of membershipin the walking category.
Only three variables were significant predictors when contrasting the sedentary andvigorous categories. Children (OR = 1.45, 95% CI, 1.17 – 1.80) were associated with a 45%increase in odds of vigorous physical activity. Lower neighborhood income decreased oddsof being classified as vigorous versus sedentary (OR = 0.70, 95% CI, 0.56 – 0.87). When
Dow
nloa
ded
By:
[Yal
e U
nive
rsity
] At:
16:4
7 11
Jul
y 20
08
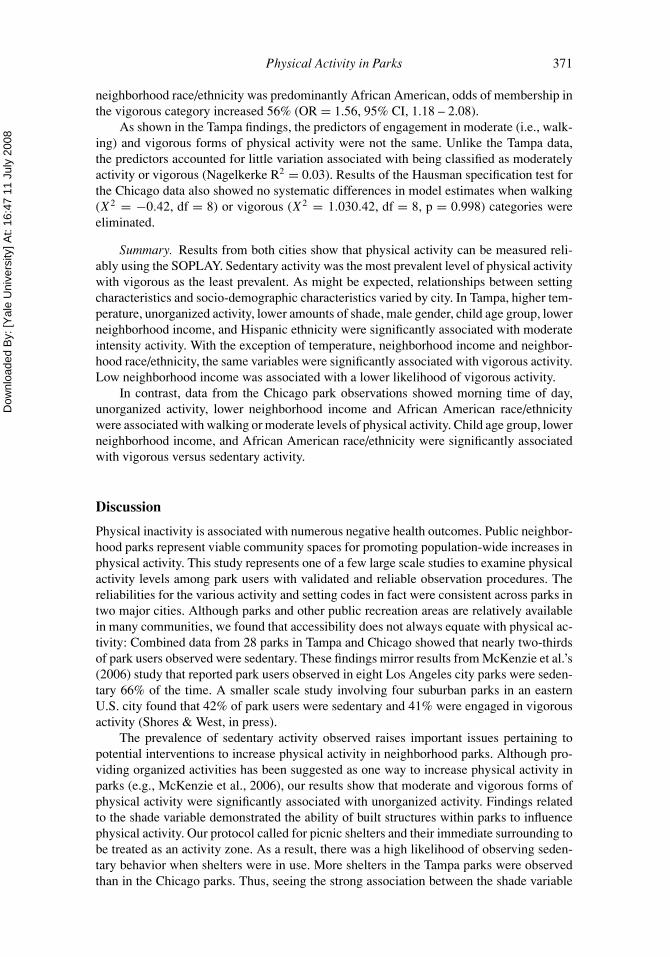
Physical Activity in Parks 371
neighborhood race/ethnicity was predominantly African American, odds of membership inthe vigorous category increased 56% (OR = 1.56, 95% CI, 1.18 – 2.08).
As shown in the Tampa findings, the predictors of engagement in moderate (i.e., walk-ing) and vigorous forms of physical activity were not the same. Unlike the Tampa data,the predictors accounted for little variation associated with being classified as moderatelyactivity or vigorous (Nagelkerke R2 = 0.03). Results of the Hausman specification test forthe Chicago data also showed no systematic differences in model estimates when walking(X2 = −0.42, df = 8) or vigorous (X2 = 1.030.42, df = 8, p = 0.998) categories wereeliminated.
Summary. Results from both cities show that physical activity can be measured reli-ably using the SOPLAY. Sedentary activity was the most prevalent level of physical activitywith vigorous as the least prevalent. As might be expected, relationships between settingcharacteristics and socio-demographic characteristics varied by city. In Tampa, higher tem-perature, unorganized activity, lower amounts of shade, male gender, child age group, lowerneighborhood income, and Hispanic ethnicity were significantly associated with moderateintensity activity. With the exception of temperature, neighborhood income and neighbor-hood race/ethnicity, the same variables were significantly associated with vigorous activity.Low neighborhood income was associated with a lower likelihood of vigorous activity.
In contrast, data from the Chicago park observations showed morning time of day,unorganized activity, lower neighborhood income and African American race/ethnicitywere associated with walking or moderate levels of physical activity. Child age group, lowerneighborhood income, and African American race/ethnicity were significantly associatedwith vigorous versus sedentary activity.
Discussion
Physical inactivity is associated with numerous negative health outcomes. Public neighbor-hood parks represent viable community spaces for promoting population-wide increases inphysical activity. This study represents one of a few large scale studies to examine physicalactivity levels among park users with validated and reliable observation procedures. Thereliabilities for the various activity and setting codes in fact were consistent across parks intwo major cities. Although parks and other public recreation areas are relatively availablein many communities, we found that accessibility does not always equate with physical ac-tivity: Combined data from 28 parks in Tampa and Chicago showed that nearly two-thirdsof park users observed were sedentary. These findings mirror results from McKenzie et al.’s(2006) study that reported park users observed in eight Los Angeles city parks were seden-tary 66% of the time. A smaller scale study involving four suburban parks in an easternU.S. city found that 42% of park users were sedentary and 41% were engaged in vigorousactivity (Shores & West, in press).
The prevalence of sedentary activity observed raises important issues pertaining topotential interventions to increase physical activity in neighborhood parks. Although pro-viding organized activities has been suggested as one way to increase physical activity inparks (e.g., McKenzie et al., 2006), our results show that moderate and vigorous forms ofphysical activity were significantly associated with unorganized activity. Findings relatedto the shade variable demonstrated the ability of built structures within parks to influencephysical activity. Our protocol called for picnic shelters and their immediate surrounding tobe treated as an activity zone. As a result, there was a high likelihood of observing seden-tary behavior when shelters were in use. More shelters in the Tampa parks were observedthan in the Chicago parks. Thus, seeing the strong association between the shade variable

Dow
nloa
ded
By:
[Yal
e U
nive
rsity
] At:
16:4
7 11
Jul
y 20
08
372 M. F. Floyd et al.
and physical activity was not surprising. By comparison, Chicago study parks had moreathletic courts, sports fields and playgrounds and lower levels of sedentary activity. Fullydocumenting associations between park features and physical activity will be important forfuture studies.
Findings related to age and gender were consistent with previous studies showingmales and children as more active than females and adults (Gobster, 2005; McKenzieet al., 2000; McKenzie et al., 2006). As others have suggested (e.g., Cohen et al., 2006;McKenzie et al., 2006), understanding what kinds of parks and park amenities are morelikely to increase physical activity among women and girls is needed. Results related toneighborhood income followed the socioeconomic gradient consistently found in healthresearch (Evans & Katrowski, 2002) with higher income areas associated with more activepark users.
On the other hand, neighborhood race/ethnicity was not associated with physical ac-tivity in the Tampa portion of the study, and its effects in the Chicago data run counter toconventional expectations. In general, racial and ethnic minorities accumulate less leisure-time physical activity than whites (Crespo et al., 2000). In the Tampa observations, thelogistic regression results showed that park users in Hispanic areas were 23% more likely tobe observed in walking (i.e., moderate level of activity) than park users observed in mostlywhite areas. In Chicago, park users observed in African American neighborhoods were82% more likely to be observed in moderate level physical activity and 56% more likely tobe observed in vigorous activity compared to park users observed in predominantly whiteareas. This finding might be explained by a greater preference among African Americansfor group sport activities (Floyd et al., 1994; Gobster, 2002). In addition, a larger numberof males and slightly larger number of children were observed in the Chicago portion ofthe data.
The results of the study also raise the question of what an appropriate level of physicalactivity in parks is. The Centers for Disease Control and Prevention and the AmericanCollege of Sports Medicine recommend that adults engage in moderate intensity activityfor at least 30 minutes for 5 or more days each or 20 or more minutes in vigorous intensityactivity for at least three days per week (Pate et al., 1995). When considering the extentof sedentary activity in public parks, especially when measured by observational methods,arriving at a desirable level of physical activity for a park visit is not straightforward.Also, parks provide a variety of social, psychological, economic, environmental benefitsin addition to health and physical activity benefits (Bedimo-Rung, et al., 2005). Attemptsto increase physical activity through physical and environmental or policy changes may becontroversial if resources are diverted from established or traditional priorities. Therefore,efforts to implement policy changes to promote physical activity should reflect awarenessof the diversity of park users and desired benefits.
Several limitations of this study should be noted. First, while we employed activitycodes that have been validated through heart monitoring, the codes did not permit mea-surement of time spent in sedentary, moderate or vigorous activity. The activity codes werealso broad such that “vigorous,” for example, can encompass a wide range of intensities(McKenzie et al., 2006). Second, observations in the study occurred on only one weekday(Friday) and the weekend (Saturday and Sunday). Therefore, the results cannot be gener-alized to early mornings and mid-week days. Past research has shown that urban park usepatterns vary by time of day (Scott, 1997). For example, Scott’s (1997) findings suggestedthat moderate and vigorous intensity activities such as walking, jogging, and running areunder-represented. He also reported differences in some park activities by time of week.However, our findings did correspond with those of McKenzie et al. who observed parkusers across a seven-day week and included early morning hours. Our results also are based

Dow
nloa
ded
By:
[Yal
e U
nive
rsity
] At:
16:4
7 11
Jul
y 20
08
Physical Activity in Parks 373
on spring and summer observations when park use is more common. A strength of our studyis that it provides data on park-based physical activity on a larger sample of parks in twolarge cities. Finally, SOPLAY only provided a brief snapshot of park users’ behavior. Thissystem may also double-count individuals who remain in the target zone for more than onehour. For example, a person playing basketball may be observed as sedentary, walking orvery active depending on when the scan is conducted. Nevertheless, SOPLAY provided avalidated and systematic method for observing a large number of individuals and groups inpark and open space settings.
As the health benefits of parks are increasingly touted, showing evidence of how parkscontribute to physical activity is important. A major challenge has been the absence ofobjective measures of physical activity in parks and other open areas. Our study providesevidence on the utility of SOPLAY as a means of measuring physical activity in neighbor-hood parks and for examining associations between physical activity and several predictorvariables. Future research should examine specific park amenities and features that pro-mote physical activity in parks. To assist park planners and program specialists, knowingwhat kinds of facilities are most conducive to physical activity would be useful. Similarly,knowing whether the quality of park settings, measured subjectively and objectively, affectthe likelihood of park users engaging in moderate and vigorous physical activity in parkswould be useful. Finally, we recommend that observational approaches such as SOPLAY orSOPARC be used in conjunction with survey methods to understand park users’ perceptionsof park environments, motivations, and constraints.
Acknowledgements
A version of this paper was presented at the 2006 Active Living Research Conference,Coronado California. Financial support for this study was provided by the Robert WoodJohnson Foundation, Active Living Research program. The authors wish to thank the anony-mous reviewers for their extensive and helpful comments on earlier drafts of this paper. Theauthors also wish to thank Dr. Chrystos Siderelis for his advice on data analysis.
References
Bedimo-Rung, A. L., Mowen, A. J., & Cohen, D. A. (2005). The significance of parks to physicalactivity and public health. American Journal of Preventive Medicine, 28(Suppl. 2), 159–168.
Brown, J., & Bennington, C. (1993). A study of racial discrimination by banks and mortgage companiesin the United States. GIS for equitable and sustainable for Communities. Retrieved April 2, 2004,from http://miles.publicgis.org/reports/redindex.html
Centers for Disease Control and Prevention, Guide to community services. (2005). Creating or improv-ing access to places for physical activity is recommended to increase physical activity. Retrievedon January 8, 2006, from http://www.thecommunityguide.org/pa/pa-int-create-access.pdf
Chad, K. E., Reeder, B. A., Harrison, E. L., Ashworth, N. L., Sheppard, S. M., & Schultz, S. L.,et al. (2005). Profile of physical activity levels in community-dwelling older adults. Medicineand Science in Sports and Exercise, 37, 1774–1784.
Cohen, D. A., Ashwood, J. S., Scott, M. M., Overton, A., Evenson, K. R., Staten, L. K., Porter, D.,McKenzie, T. L., & Catellier, D. (2006). Public parks and physical activity among adolescentgirls. Pediatrics,118(5): 1381–1389. Retrieved January 8, 2007, from www.pediatrics.org
Crespo, C., Smit, E., Andersen, R., Carter-Pokras, O., & Ainsworth, B. (2000). Race/ethnicity, socialclass and their relation to physical inactivity during leisure time: Results from the Third NationalHealth and Nutrition Examination Survey, 1988–1994. American Journal of Preventive Medicine,18, 46–53.
Evans, G., & Katrowitz, E. (2002). Socioeconomic status and health: The potential role of environ-mental risk exposure. Annual Review of Public Health, 23, 303–331.
Dow
nloa
ded
By:
[Yal
e U
nive
rsity
] At:
16:4
7 11
Jul
y 20
08
374 M. F. Floyd et al.
Floyd, M. F., Shinew, K. J., McGuire, F. A., & Noe, F. P. (1994). Race, class, and leisure activitypreferences: Marginality and ethnicity revisited. Journal of Leisure Research, 26, 158–173.
Gobster, P. H. (2002). Managing urban parks for a racially and ethnically diverse clientele. LeisureSciences, 24, 143–159.
Gobster, P. H. (2005). Recreation and leisure research from an active living perspective: Taking asecond look at urban trail use data. Leisure Sciences, 27, 367–383.
Godbey, G. C., & Blazey, M. (1983). Old people in urban parks: An exploratory investigation. Journalof Leisure Research, 15, 229–244.
Godbey, G. C., Caldwell, L. L., Floyd, M., & Payne, L. L. (2005). Contributions of leisure studiesand recreation and park management to the active living agenda. American Journal of PreventiveMedicine, 28(Suppl. 2), 150–158.
Godbey, G. C., Graefe, A. R., & James, S. W. (1992). The benefits of local recreation and parkservices: A nationwide study of the perceptions of the American public. Ashburn, VA: NationalRecreation and Park Association.
Henderson, K.A., & Ainsworth, (2001). Researching leisure and physical activity with women ofcolor: Issues and emerging questions. Leisure Sciences, 23, 21–34.
Henderson, K. A., & Bialeschki, M. D. (2005). Leisure and active lifestyles: Research reflections.Leisure Sciences, 27, 355–365.
Hutchison, R. (1987). Ethnicity and urban recreation: Whites, Blacks, and Hispanics in Chicago’spublic parks. Journal of Leisure Research, 19, 205–222.
Jargowski, P., & Banes, M. (1991). Ghetto poverty in the United States. In C. Jenks & P. Peterson,(Eds.), The urban underclass (pp. 235–273). Washington, DC: The Brookings Institution.
King, W. C., Brach, J. S., Belle, S., Killingsworth, R., Fenton, M., & Kriska, A. M. (2003). Therelationship between convenience of destinations and walking levels in older women. AmericanJournal of Health Promotion, 18, 74–82.
Landis, J. R., & Koch, G. G. (1977). The measurement of observer agreement for categorical data.Biometrics, 33, 159–174.
Macera, C. A., Ham, S. A., Yore, M. M., Jones, D. A., Ainsworth, B. E., Kimsey, C. D., & Kohl,III, W. W. (2005). Prevalence of physical activity in the United States: Behavioral Risk FactorSurveillance System, 2001. Preventing Chronic Disease, 2 [serial online]. Retrieved July 30,2007 from http://www.cdc.gov/pcd/issues/2005/apr/04 0114.htm
McKenzie, T. L. (2002). The use of direct observation to assess physical activity. In G. Welk (Ed.),Physical activity assessments for health-related research (pp. 179–195). Champaign, IL: HumanKinetics.
McKenzie, T. L. (2005). Systematic observation: SOPLAY/SOPARC Introduction, practice, and as-sessment (DVD). San Diego, CA: San Diego State University.
McKenzie, T. L. (2006). SOPLAY System for observing play and leisure among youth: Description andprocedures manual. Retrieved August 25, 2007, from http://www.activelivingresearch.org/files/SOPLAY Protocols.pdf
McKenzie, T. L., Cohen, D. A., Sehgal, A., Williamson, S., & Golinelli, D. (2006). System forobserving play and recreation in communities (SOPARC): Reliability and feasibility measures.Journal of Physical Activity and Health, 3(Suppl. 1), 208–222.
McKenzie, T. L., Marshall, S. J., Sallis, J. F., & Conway, T. L. (2000). Leisure-time physical activityin school environments: An observational studying using SOPLAY. Preventive Medicine, 30,70–77.
McKenzie, T. L., Sallis, J. F., Patterson, T. L., Elder, J. P., Berry, C. C., and Rupp, J. W.. (1991).BEACHES: An observational system for assessing children’s eating and physical activity be-haviors and associated events. Journal of Applied Behavioral Analysis,24, 141–151.
Moore, R., & Graefe, A.R. (1994). Attachment to recreation settings: The case of rail-trail users.Leisure Sciences, 16, 17–31.
Moore, R. L., Scott, D., & Graefe, A. R. (1998). The effects of activity differences on recre-ation experiences along a suburban trail. Journal of Park and Recreation Administration, 16,35–53.
Pate, R. R., Pratt, M., Blair, S. N., Haskell, W. L., Macera, C. A., Bouchard, C., Buchner, D.,Ettinger, W., Heath, G. W., and King, A. C. (1995). Physical activity and public health. A

Dow
nloa
ded
By:
[Yal
e U
nive
rsity
] At:
16:4
7 11
Jul
y 20
08
Physical Activity in Parks 375
recommendation from the Centers for Disease Control and Prevention and the American Col-lege of Sports Medicine. Journal of the American Medical Association, 273, 402–407.
Raymore, L., & Scott, D. (1998). The characteristics and activities of older adult visitors to a metropoli-tan park district. Journal of Park and Recreation Administration, 16, 1–21.
Rowe, P., van der Mars, H., Schuldheisz, & J., Fox, S. (2004). Measuring students’ physical activ-ity levels: Validating SOFIT for use with high school students. Journal of Teaching PhysicalEducation, 23, 235–251.
Sallis, J. F., Cervero, R. B., Ascher, W., Henderson, K. A., Kraft, M. K., Kerr, J. (2006). An ecologicalapproach to creating active living communities. Annual Review of Public Health, 27, 297–322.
Scott, D. (1997). Exploring time patterns in people’s use of a metropolitan park district. LeisureSciences, 19, 159–174.
Scruggs, P., Beveridge, S., Eisenman, P., Watson, D., Schultz, B., & Ransdell, L. (2003). Quantifyingphysical activity via pedometry in elementary physical education. Medicine and Science in Sportand Exercise, 35, 1065–1071.
Sharpe, P. A., Granner, M. L., Hutto, B., & Ainsworth, B. E. (2004). Association of environmentalfactors to meeting physical activity recommendations in two South Carolina counties. AmericanJournal of Health Promotion, 18, 251–257.
Shores, K. A., & West, S. T. (in press). Documenting and explaining physical activity of AfricanAmerican park visitors. Journal of Park and Recreation Administration.
StataCorp. (2005). Stata Statistical Software [Release 9.0.] College Station, TX: Stata Corporation.Tinsley, H. E., Tinsley, D. J., & Croskeys, C. E. (2002). Park usage, social milieu, and psychosocial
benefits of park use reported by older urban park users from four ethnic groups. Leisure Sciences,24, 199–218.
U.S. Department of Health and Human Services (2000). Healthy people 2010: Understanding and im-proving health andobjectives for improving health (2nd ed.). Washington, DC: U.S. GovernmentPrinting Office.
Wilson, D. K., Kirtland, K. A., Ainsworth, B. E., & Addy, C. L. (2004). Socioeconomic status andperceptions of access and safety for physical activity. Annals of Behavioral Medicine, 28, 20–28.