Enrollment and Success in Transfer-Level English and Math in ...
48
Enrollment and Success in Transfer-Level English and Math in the California Community Colleges System Fall 2015 to Fall 2019 Statewide Analysis January 2021 www.rpgroup.org
-
Upload
khangminh22 -
Category
Documents
-
view
1 -
download
0
Transcript of Enrollment and Success in Transfer-Level English and Math in ...

Enrollment and Success in Transfer-Level English
and Math in the California Community Colleges SystemFall 2015 to Fall 2019 Statewide Analysis
January 2021
www.rpgroup.org

Table of Contents
Executive Summary 3
Project Overview 3
Research Questions 3
Methodology 4
Summary of Results 4
Research Limitations 7
Conclusion 7
Introduction 9
Project Overview 9
Research Questions 9
Methodology 11
In This Report 12
Key Findings 13
Enrollment in Transfer-Level English and Math 13
Successful Completion of Transfer-Level English and Math 20
Conclusion 33
Research Limitations 33
Enrollment 34
Success 34
Persistent Equity Issues 34
Next Steps and Implications 34
Research and Planning Group for California Community Colleges 36
Authors 36
Acknowledgments 36
Appendix 37
Enrollment and Success in Transfer-Level English and Math in the California Community Colleges SystemThe RP Group | January 2021 | Page 2

Executive SummaryProject OverviewColleges across the California Community College (CCC) system have been preparing for changes to their assessment and placement processes associated with the required implementation of Assembly Bill (AB) 705. While many inititiatives were already underway to increase students’ completion of their education, including Guided Pathways and the Student Centered Funding Formula, AB 705 focuses on maximizing student completion of transfer-level English and math within one year.1 In anticipation of AB 705, numerous CCCs began adjusting English and math placement processes in fall 20182 to facilitate students’ direct entry into and success in transfer-level courses. All CCCs were required to be in compliance with AB 705 no later than fall 2019.
In order to understand how the mandate of AB 705 has impacted student enrollment and success over time, including the years leading up to the 2019 required implementation, the Research and Planning Group for California Community Colleges (RP Group) conducted a statewide analysis of student outcomes from fall 2015 to fall 2019. The areas of inquiry in this report include enrollment in transfer-level English and math courses and success in these courses, both as a proportion of those who enroll in them and as a proportion of the general math- and English-course-taking population overall.
This analysis examines data from five fall cohorts from 2015-2019. However, this report focuses most on the changes that occurred between cohorts that began in fall 2018 and fall 2019, the time period during which colleges were required to increase enrollment in transfer-level courses. That said, it is also important to note that between 2017 and 2018, many colleges began to substantially increase enrollment in transfer-level courses; therefore, looking at both of these time periods (2017 to 2018 and 2018 to 2019) relative to those before 2017 helps distinguish between changes that are a part of broader trends that have been ongoing since at least 2015 and changes that are more likely a result of reforms in assessment, placement, and student support processes.
Research QuestionsTo better understand the relationships between AB 705 reforms and student outcomes, this report explores research questions pertaining to the following two key areas:
• Enrollment in transfer-level English and math courses
• Success in transfer-level English and math classes, as measured by the number of students who successfully complete transfer-level English and math courses within one year, both (a) out of those who attempted transfer-level courses, and (b) system-wide, as a proportion of the entire cohort of math and English course-taking students (commonly referred to as throughput rate).
1 http://bit.ly/2m5bQxW2 http://bit.ly/2m4wb6o
Enrollment and Success in Transfer-Level English and Math in the California Community Colleges SystemThe RP Group | January 2021 | Page 3

Patterns and trends with respect to enrollment and success are explored for fall cohorts beginning in 2015 through 2019 and tracked for one year. Enrollment and success metrics are disaggregated by student demographic characteristics, and throughput rates are also broken out by high school grade point average (GPA) as defined in the AB 705 default placement rules. Transfer-level math enrollment and course success patterns are disaggregated by statistics-liberal arts math (SLAM) pathways and business-science, technology, engineering, and math (B-STEM) pathways.3
MethodologyThe data used in this report were provided to the RP Group’s Multiple Measures Assessment Project (MMAP) research team from CalPASS Plus. These data included all CCCs (N = 115), with the addition of Los Angeles ITV/Weekend College submitting to the Management Information System (MIS). The data included students enrolled between fall 2015 and fall 2019. The math (N = 804,993) and English (N = 864,236) samples included all students who attended a CCC anywhere in the system and enrolled in one or more credit math or English course.
When reviewing the results in this report, please note that unless stated otherwise, all of the findings refer only to students whose first course in English or math is at transfer level. In other words, the report examines the experiences of students who have not previously taken non-transferable English or math courses, but instead started at transfer level.
Summary of ResultsOverall, the results of this study offer encouraging insight into the impact of AB 705. Direct enrollment into transfer-level English and math courses rose substantially (most pronounced for African American and Latinx4 students). While course success rates among those who enrolled directly into transfer-level English and math courses declined somewhat, the size of the decline was not proportional to the size of the increase in enrollment rates. As such, there was a large overall net increase in the total volume of students completing transfer-level English and math, as well as an increase in the overall throughput rates (proportion of all students enrolled in a math or English class passing transfer-level English and math within one year).
These results support the finding that changes to assessment and placing students directly into transfer-level English and math courses enables more students not only to enroll, but also succeed in transfer-level coursework, helping them move more efficiently toward their ultimate educational goals.
3 Note: Throughput rates are not disaggregated by SLAM and B-STEM due to the inability to identify the starting course for math students without knowing their program of study, which is not available in the data file provided.4 Ethnicity data are from the MIS, though we use the term “Latinx” instead of “Hispanic” to indicate students who are Hispanic or Latina/o/x. Additionally, “African American” is used in this report to refer to students who are identified by some colleges as “Black.”
Enrollment and Success in Transfer-Level English and Math in the California Community Colleges SystemThe RP Group | January 2021 | Page 4

Enrollment in Transfer-Level English and Math CoursesENGLISH COURSES
• Direct enrollment into transfer-level English rose to 95% in fall 2019 compared to 71% in fall 2018, an increase of 24 percentage points (%pts) and 46,994 more students.
• All racial/ethnic groups saw large gains in direct enrollment into transfer-level English from fall 2018 to fall 2019, with the largest gains in enrollment among African American students (32 %pts).
• Between fall 2015 and fall 2019, the gap in direct enrollment into transfer-level English courses between African American and White students narrowed to 4% (closing by 26 %pts, including 17 %pts in the past year alone). At the same time, the gap between Latinx and White students narrowed to just 1% (closing by 24 %pts since 2015, including 13 %pts in the past year).
• While all student groups increased their direct enrollment into transfer-level English from fall 2018 to fall 2019, most notably, students in Puente saw a dramatic increase in enrollment into transfer-level English on the order of 56 percentage points (from 42% to 98%), while foster youth saw a gain of 33 percentage points (from 62% to 95%).
MATH COURSES
• Direct transfer-level math enrollment rose to 79% in for the fall 2019 cohort compared to 43% in fall 2018, an increase of 36 %pts and 46,248 more students.
• All racial/ethnic groups saw large gains in direct enrollment into transfer-level math from fall 2018 to fall 2019, with the largest gains found among both African American and Latinx students (42 %pts each).
• Between fall 2015 and fall 2019, the gap in direct enrollment into transfer-level courses between African American and White students narrowed to 13 %pts after having remained stagnate at 32 %pts both as far back as 2015 and as recently as 2018). Furthermore, the gap between Latinx and White students narrowed to 8 %pts, a substantial decrease from the 27 %pt gap seen in 2018 and the 30 %pt gap found in 2015.
• While all student groups increased their direct enrollment into transfer-level math from fall 2018 to fall 2019, students in CCC support programs experienced some of the most significant enrollment growth. Most notably, students in Extended Opportunities Programs and Services (EOPS) saw a dramatic enrollment increase on the order of 43 percentage points (from 34% to 77%), and students in Disabled Students Programs and Serviecs (DSPS) saw a gain of 39 percentage points (from 28% to 67%).
Success in Transfer-Level English and Math CoursesOverall, findings suggest that despite a dramatic influx of students into transfer-level English and math courses in fall 2019, student success (transfer-level course completion within a year) has not declined substantially, resulting in a large net increase in the number of students passing
Enrollment and Success in Transfer-Level English and Math in the California Community Colleges SystemThe RP Group | January 2021 | Page 5

such courses. In other words, students appear to be rising to the challenge of direct enrollment in transfer-level courses when given the opportunity.
FIRST COURSE COMPLETION VOLUME AND SUCCESS RATES
The data indicate that students are successfully completing transfer-level courses within one year in larger numbers than ever before. The number (volume) of students across all ethnic groups who successfully completed transfer-level English and math classes has risen substantially since fall 2015. Looking across the past five years, 2.5 to 3 times as many African American and Latinx students completed transfer-level English and math among the fall 2019 cohort relative to fall 2015 cohort, though the most growth took place between the fall 2018 and 2019, when AB 705 implementation became a requirement.
ENGLISH COURSES
• Within the fall 2019 cohort, 26,103 more students completed transfer-level English in one year than in the cohort beginning fall 2018, a 28% increase. The largest gain was seen among Latinx students (15,587 more students).
• While the number of successful completers of tranfer-level English has increased substantially since fall 2015, success rates for transfer-level English have decreased by five percentage points.
MATH COURSES
• Within the fall 2019 cohort, 22,193 more students completed transfer-level math than in the cohort beginning fall 2018, a 47% increase. However, the increase was larger in SLAM math courses (68%) than in B-STEM (18%) math courses. The largest gains in transfer-level math completion were among Latinx students (11,201 more students).
• While the number of successful completers of tranfer-level math has increased substantially since fall 2015, success rates for transfer-level math have decreased by eight percentage points in the past year for math overall, and by nine and seven percentage points for SLAM and B-STEM math courses, respectively.
THROUGHPUT RATES
Success in transfer-level English and math as a proportion of the entire cohort of students taking any English or math courses (throughput) demonstrates a clear positive impact of the new placement rules. Throughput rates increased substantially since 2015, particularly from 2017 to 2018 and then again from 2018 to 2019, when colleges began implementing changes to assessment and placement into transfer-level courses at a higher rate and then at full scale, respectively.
ENGLISH COURSES
• One-year throughput rates for English have been consistently increasing since 2015. From fall 2018 to fall 2019, there was a five percentage point increase in English throughput (62% to 67%).
Enrollment and Success in Transfer-Level English and Math in the California Community Colleges SystemThe RP Group | January 2021 | Page 6

• English throughput rates have increased for all racial/ethnic groups (and more so for students of color) over time, though equity gaps in English throughput remain, favoring Asian and White students.
• Especially notable are the throughput gains among foster youth and students enrolled in Puente that occurred between fall 2018 and 2019.
MATH COURSES
• In math, the one-year throughput rate in math increased by 15 percentage points (35% to 50%) between fall 2018 and fall 2019.
• Math throughput rates have consistently increased for all racial groups since 2015. However, gaps between racial groups continue to persist.
• Especially notable are the throughput gains among veterans and students enrolled in Puente.
HIGH SCHOOL GPA BANDS
• A comparison of throughput rates among the fall 2019 cohort for students who enrolled directly in transfer-level courses relative to students who in prior years started at one or more levels below transfer demonstrates that enrollment directly into transfer-level subjects maximizes the liklhood students will successfully pass such courses.
• In English courses, the full implementation of AB 705 has been particularly impactful for students with lower high school GPAs.
Research LimitationsWhile degree-seeking students are included in AB 705, only transfer-level courses were included in this study, limiting the inclusion of intermediate algebra for local degrees. Moving forward, new data elements will be available that will help with the identification of additional courses in other Taxonomy of Program (TOP) codes that meet transfer requirements. The ability to include support courses will also be possible in the future due to the inclusion of a new MIS data element designed to identify these particular courses.
ConclusionThis year’s report provides evidence as to the initial success of system-wide AB 705 implementation. On the whole, findings suggest that the AB 705-aligned approaches to assessment and placement are having a positive impact on students’ equitable enrollment in transfer-level English and math courses, significantly increasing the volume of students from all backgrounds succeeding in these courses. Additionally, findings thus far have shown consistency across several measures of student success, even though enrollment has expanded. While this most recent analysis shows that success rates in transfer-level English and math classes have dipped, there has nonetheless been a substantial net increase in the number of students passing these courses.
Enrollment and Success in Transfer-Level English and Math in the California Community Colleges SystemThe RP Group | January 2021 | Page 7

However, findings also suggest that gaps between racial/ethnic groups continue to persist, even with the gains in access to transfer-level courses, most notably in math. Future research will examine how different pedagogical and curricular models are best supporting the achievement of transfer-level success for all students as well as varied long-term outcomes. If these results hold true over the next few years, increased enrollment and success in transfer-level English and math can ultimately help students complete their courses of study in a more timely fashion and perhaps increase the likelihood of achieving their educational goals.5
Issues to ConsiderWhile the early indicators discussed in this report are mainly encouraging, the findings also point to some issues of potential concern that colleges might want to keep in mind as they evaluate their implementation of new assessment and placement practices. One particular issue is the variation in success rates among students in the middle and lowest GPA bands compared to students in the highest band. The lower and middle GPA bands tend to comprise a higher proportion of marginalized students.6 The fact that these students do not seem to be succeeding in the same way as their peers in the highest GPA band aligns with the findings that show only small progress related to closing gaps between racial/ethnic groups in terms of success rates. This finding suggest that if colleges are going to make meaningful progress in closing equity gaps in transfer-level courses, it will be important to pay close attention to the experiences of these middle- and lower-band GPA students, including the courses in which they enroll (at transfer-level or below), the support provided to them, and the curriculum and learning taking place in these courses.
5 ccrc.tc.columbia.edu/media/k2/attachments/early-momentum-metrics-college-improvement.pdf6 http://bit.ly/2n3e1lW
Enrollment and Success in Transfer-Level English and Math in the California Community Colleges SystemThe RP Group | January 2021 | Page 8

Introduction Project OverviewThe California Community College (CCC) system has made changes to its assessment and placement processes under Assembly Bill (AB) 705. While many inititiatives were already underway in order to increase the likelihood that students would complete their education goals at a higher rate—including acceleration, Guided Pathways, and the Student Centered Funding Formula—AB 705 focuses on maximizing student completion of transfer-level English and math courses within one year.7 In anticipation of AB 705, which became a requirement in fall 2019, numerous CCCs throughout the state began adjusting English and math assessment and placement processes in fall 20188 to facilitate students’ direct entry into transfer-level courses.
In order to understand how the statewide mandate of AB 705 impacts access and success over time, the Research and Planning Group for California Community Colleges (RP Group) conducted a statewide analysis of student outcomes from fall 2015 to fall 2019. This analysis focuses in particular on changes that occurred between 2018 and 2019, the time period during which AB 705 became mandatory. However, since many colleges began to implement new assessment and placement practices in preparation of the AB 705 mandate, notable changes between fall 2017 and fall 2018 are also highlighted where especially relevant.
Research QuestionsTo better understand the relationship between AB 705 reforms and student outcomes, two key areas are explored in this analysis: (1) enrollment in transfer-level English and math courses, and (2) success in completing transfer-level English and math courses. Outcomes are examined for the overall student population and are also disaggregated by race/ethnicity,9 gender, foster youth status, veteran status, economic status, and participation in Disabled Students Programs and Services (DSPS)10, Extended Opportunities, Programs and Services (EOPS)11, Mathematics, Engineering and Science (MESA)12, Puente13, and/or Umoja.14
7 http://bit.ly/2mYQrGM8 http://bit.ly/2lvNLQI9 While the charts only present data for African American, Asian, Latinx, and White students, the tables present additional data for Native American and Pacific Islander students, as well as students of two or more races and students for whom race/ethnicity is unknown.10 https://www.cccco.edu/About-Us/Chancellors-Office/Divisions/Educational-Services-and-Support/Student-Ser-vice/What-we-do/Disabled-Student-Programs-and-Services11 https://www.cccco.edu/About-Us/Chancellors-Office/Divisions/Educational-Services-and-Support/Student-Service/What-we-do/Extended-Opportunity-Programs-and-Services12 https://www.cccco.edu/About-Us/Chancellors-Office/Divisions/Educational-Services-and-Support/What-we-do/Curriculum-and-Instruction-Unit/Mathematics-Engineering-Science-Achievement13 https://www.cccco.edu/About-Us/Chancellors-Office/Divisions/Educational-Services-and-Support/What-we-do/Curriculum-and-Instruction-Unit/Puente-Project14 https://umojacommunity.org
Enrollment and Success in Transfer-Level English and Math in the California Community Colleges SystemThe RP Group | January 2021 | Page 9

Enrollment is captured in the following ways:
• Total number of students who attempted a transfer-level course as their first English or math course (enrollment volume)
• Proportion of students who attempted a transfer-level course as their first English or math course in the fall term out of all those who took any English or math course that fall (enrollment rate)
Success is captured in the following ways:
• Total number of students who successfully completed a transfer-level course as their first English or math course (first course completion volume)
• Proportion of students who successfully completed a transfer-level course within a year out of:
ᇶ Those who attempted such a course (first course success rate)
ᇶ The entire cohort who took any English or math course (throughput)
In addition, please note that unless stated otherwise, all of the findings refer only to students whose first course in English or math is at transfer level. In other words, the report examines the experiences of students who have not previously taken non-transferable English or math courses, but instead started at transfer level.
The specific research questions this analysis aimed to answer are listed below.
Enrollment
• How many students in fall 2019 enrolled in a transfer-level English or math course as their first enrollment in the discipline compared to previous fall terms?
• What proportion of students in fall 2019 enrolled in a transfer-level English or math course as their first enrollment in the discipline compared to previous fall terms?
Success
First Course Completion Volume
• Among students whose first English or math course is at transfer level in the fall term of a given year, how does the volume of successful completions within one year compare with prior years?
First Course Success Rate
• What are the one-year success rates in transfer-level English or math among students who enrolled directly into the course as their first enrollment in the discipline in each fall term?
Full Cohort Success Rate (Throughput Rate)
• Among the full cohort of incoming students each fall who take any English or math course, what proportion both take and pass transfer-level English and math within a year?
• How does throughput differ by high school GPA band?
Enrollment and Success in Transfer-Level English and Math in the California Community Colleges SystemThe RP Group | January 2021 | Page 10

MethodologyTo conduct this analysis, a data file was provided to the RP Group’s Multiple Measures Assessment Project (MMAP) research team from CalPASS Plus (dated 11/13/2020) that included all California Community Colleges (N = 115) submitting to the Management Information System (MIS). The data included students enrolled between fall 2015 and fall 2019. The math (N = 804,993) and English (N = 864,236) samples included all students who attended a California Community College and enrolled in one or more credit English or math courses.
English courses were defined by the Taxonomy of Program (TOP) code 1501.00 (English). Math courses were defined by the TOP code 1701.00 (Mathematics) as well as specific “non-math” math courses in other TOP code areas including 0103.00 (Plant Science), 0501.00 (Business), 0505.00 (Business Administration), 0506.00 (Business Management), 0707.10 (Computer Programming), 1799.00 (Other Math), 2001.00 (Psychology), 2003.00 (Behavioral Science), 2099.00 (Other Psychology), 2201.00 (Social Sciences), 2204.00 (Economics), and 2208.00 (Sociology). Math courses within other TOP codes were identified in collaboration with the Academic Senate for the California Community Colleges.
Additionally, courses with pre-transfer CB 21 codes (e.g., “A”, “B”, “C”, or “D”) were included as below transfer-level. Transfer-level gateway courses with math and English TOP codes were those courses with a CB21 code of “Y” (not prior to college level) and a CB05 transfer status code indicating that the course transfers to the University of California (UC) and/or California State University (CSU) system.
Ethnicity data are from the MIS system, though we use “Latinx” instead of “Hispanic” to indicate students who are Hispanic or Latina/o/x. The underlying data elements and counts, however, are the same. The MIS data used in the report are state-level data; thus, enrollments and completions are counted at the system level and are not duplicated at the college level if a student is enrolled at more than one institution.
Data on student enrollment, success, and GPA were based on students whose first enrollment in an English or math course was at the transfer level. Student enrollment in a pre-transfer-level course was based on their first enrollment in the discipline. Note that enrollments with grade codes of XX, DR, MW, RD, UD, UG, RD1, RD4, RD5, and IP were not included in the analysis, as they do not represent valid enrollments or letter grades. Student outcomes were tracked anywhere within the system. Successful completions include A, B, C, P, and CR grades, as well as incomplete grades equivalent to a passing grade (e.g., IA, IB, IC). Withdrawals, including excused withdraws (EW), were considered to be non-successful attempts, as were incomplete, non-satisfactory, and non-passing grades (e.g., D, F, NP, I).
First enrollment in math and English was not limited to students’ first term or year, as students may delay enrollment in these courses. The MIS data file was matched to CalPASS Plus high school transcript records, which resulted in 64%-66% of student records having both MIS data and a valid high school GPA available. A students’ transcriptable unweighted high school GPA was provided.
Throughput rates include students who completed a transfer-level gateway class within one year (365 days) of their initial attempt in the sequence. If students’ first transfer-level attempt was
Enrollment and Success in Transfer-Level English and Math in the California Community Colleges SystemThe RP Group | January 2021 | Page 11

unsuccessful, their second transfer-level attempt was also included in the data file. Therefore, throughput rates described in this report could be slightly underestimating the true effect, as it is feasible that some students could attempt to pass a transfer-level course more than two times within one year (especially across colleges or districts, or at colleges using the quarter system).
Statistics and liberal arts math (SLAM) and business-science, technology, engineering, and math (B-STEM) courses were categorized by examining course titles and, when necessary, college catalogs to determine the course type. For example, a course titled Introductory Statistics would be classified as SLAM, while a course titled Precalculus would be classifies as B-STEM. Four percent of math courses did not fall within the SLAM or B-STEM categories; these included courses such as Arithmetic or Combined Elementary and Intermediate Algebra. Courses that appeared to cover below transfer-level content and had apparently been miscoded as transfer-level (e.g., arithmetic) were not coded as either SLAM or B-STEM.
Enrollment in special programs (i.e., DSPS, EOPS, veterans, or foster youth) were included as enrolled in the program if enrollment occurred at any point within the timeframe of the study. Enrollment in the program did not have to take place at the time of enrollment in a math or English course.
In This ReportThis report begins by discussing key findings in the areas of enrollment and success, identifying specific research questions, providing detailed charts and tables with relevant data, and offering brief analyses of those charts and tables. Next, the report offers a short discussion of the limitations of this particular study, followed by a conclusion that reflects on the report’s findings, explores what those findings might mean, and places the findings in the context of the big picture of AB 705 and overall assessment and placement practices in California Community Colleges. It also includes an appendix that presents the counts and percentages upon which charts are based.
Enrollment and Success in Transfer-Level English and Math in the California Community Colleges SystemThe RP Group | January 2021 | Page 12

Key FindingsThe key findings are organized by research questions, beginning with those that address enrollment and followed by those that address success. As noted earlier, please keep in mind that unless stated otherwise, all of the findings refer only to students whose first course in the English or math discipline is at transfer level. In other words, the report examines the experiences of students who have not previously taken a non-transferable English or math course, but instead started at transfer level. The only exception is in the case of throughput rates, which examine outcomes among students who began the English or math discipline at any starting level, not just those who entered directly at transfer level.
Enrollment in Transfer-Level English and Math This section examines enrollment patterns in transfer-level English and math courses among students who are entering either discipline for the first time. Specifically, the data presented below answer the following research question:
How many students in fall 2019 enrolled in a transfer-level English or math course as their first enrollment in the discipline compared to prior fall terms?
Enrollment in transfer-level English or math courses as the first course a student takes in the sequence is displayed in Chart 1. For English, enrollment increased by 24 percentage points from fall 2018 to fall 2019, growing from 71% to 95%. Direct transfer-level enrollment in math also saw a marked increase from fall 2018 to fall 2019, growing by 36 percentage points (from 43% to 79%).
While large gains were seen in both disciplines as AB 705-aligned approaches were being rolled out in many CCCs, such increases grew further once the mandate was put into place in fall 2019. The data indicate that implementation of systems and processes that allowed for greater access to transfer-level English and math courses had a substantial impact on student enrollment numbers.
Chart 1. Percentage of Students Who Enrolled Directly in Transfer-Level English and Math—Fall 2015 to Fall 2019
Enrollment and Success in Transfer-Level English and Math in the California Community Colleges SystemThe RP Group | January 2021 | Page 13

Table 1 below displays the student enrollment numbers that were used to calculate the percentages shown in Chart 1. (See Tables A1 and A2 in the Appendix for math course-taking rates disaggregated by SLAM and B-STEM, respectively.)
Table 1. Number and Percentage of Students Whose First English or Math Course Was at Transfer Level by Cohort
Cohort # of Students Who # of Total Enrollments in a % of Students Who Enrolled Directly into
Transfer-LevelSubject at Any Level Enrolled Directly into
Transfer-LevelEnglish
Fall 2015 72,788 166,150 44%Fall 2016 81,441 168,940 48%Fall 2017 96,582 172,331 56%Fall 2018 125,423 175,572 71%Fall 2019 172,367 181,232 95%
MathFall 2015 42,734 163,654 26%Fall 2016 46,434 165,656 28%Fall 2017 53,998 167,309 32%Fall 2018 69,487 162,317 43%Fall 2019 115,735 146,057 79%
Chart 2 on the next page disaggregates enrollment in transfer-level English courses as the first course taken in the discipline by race/ethnicity. All racial/ethnic groups saw large gains in direct transfer-level English enrollment from fall 2015 to fall 2019, with the largest year-to-year gain occurring between fall 2018 and fall 2019.
Particularly striking, however, is the narrowing of the gaps between racial/ethnic groups. For example, the gap between African American and White students narrowed from 30 percentage points in fall 2015 to just four percentage points in fall 2019. The corresponding gap between Latinx students and White students narrowed from 25 percentage points to one percentage point. Furthermore, while enrollment levels varied widely across the four groups in fall 2015, that 30-percentage-point spread narrowed substantially by fall 2019 when all ethnic groups achieved enrollment levels of 92% to 96%.
Enrollment and Success in Transfer-Level English and Math in the California Community Colleges SystemThe RP Group | January 2021 | Page 14

Chart 2. Enrollment in Transfer-Level English, Disaggregated by Ethnicity—Fall 2015 to Fall 2019
Below, Chart 3 disaggregates enrollment into transfer-level English courses by different student groups. Again, all groups saw large gains in direct transfer-level English enrollment from 2015 to 2019, with the largest year-to-year gain occurring between the 2018 and 2019 fall cohorts. Students in Puente saw an increase in enrollment of 56 percentage points (from 42% to 98%), while foster youth saw a gain of 33 percentage points (from 62% to 95%).
Chart 3. Enrollment in Transfer-Level English by Student Group—Fall 2015 to Fall 2019
Enrollment and Success in Transfer-Level English and Math in the California Community Colleges SystemThe RP Group | January 2021 | Page 15

Table 2 on the following page provides the specific data from which Charts 2 and 3 were derived. With respect to race/ethnicity, direct enrollment in transfer-level English increased from fall 2018 to fall 2019 for all racial/ethnic groups. Latinx students had the most notable volume increase (29,502 more Latinx students, or +28 percentage points), and there was a proportional increase for African American students (2,865 more African American students, or +32 percentage points).
Table 2. Enrollment in Transfer-Level English, Disaggregated by Student Group —Fall 2015 to Fall 2019
Fall 2015 Fall 2016 Fall 2017 Fall 2018 Fall 2019# % # % # % # % # %
EthnicityAfrican American 2,897 30% 3,422 37% 4,111 45% 5,468 60% 8,333 92%Asian 9,719 49% 10,692 54% 12,593 63% 16,383 76% 19,945 95%Latinx 28,948 35% 34,414 40% 43,717 49% 61,011 67% 90,513 95%Native American 306 39% 293 38% 371 50% 519 70% 609 95%Pacific Islander 251 33% 295 40% 407 53% 515 68% 776 95%2+ Races 3,935 55% 4,644 60% 5,077 66% 5,960 77% 7,214 96%White 23,234 60% 26,087 63% 27,987 69% 32,646 81% 34,437 96%Unknown 1,497 48% 1,594 55% 2,319 59% 2,921 74% 10,540 96%GenderFemale 37,323 43% 41,581 48% 50,429 56% 66,097 72% 91,517 95%Male 34,514 44% 38,561 48% 44,935 56% 57,775 71% 78,568 95%Other/Unknown 951 47% 1,299 54% 1,218 59% 1,551 76% 2,282 95%DSPS StatusDSPS 4,059 32% 4,524 35% 5,591 43% 7,542 59% 10,756 89%Not DSPS 68,729 45% 76,917 49% 90,991 57% 117,881 72% 161,611 96%Foster Youth StatusFoster Youth 1,247 34% 1,377 37% 1,661 47% 2,006 62% 4,528 95%Not Foster Youth 71,541 44% 80,064 48% 94,921 56% 123,417 72% 167,839 95%EOPS StatusEOPS 6,328 31% 7,520 37% 9,928 48% 13,751 65% 18,207 95%Not EOPS 66,460 46% 73,921 50% 86,654 57% 111,672 72% 154,160 95%Economic StatusEcon Dis 2,986 39% 3,937 41% 6,764 51% 12,395 70% 16,721 95%Not Econ Dis 69,802 44% 77,504 49% 89,818 56% 113,028 72% 155,646 95%MESA StatusMESA 641 59% 705 64% 860 76% 932 86% 761 99%Not MESA 72,147 44% 80,736 48% 95,722 56% 124,491 71% 171,606 95%Puente StatusPuente 83 8% 139 14% 289 24% 536 42% 1,283 98%Not Puente 72,705 44% 81,302 48% 96,293 56% 124,887 72% 171,084 95%Umoja StatusUmoja 341 30% 449 33% 695 45% 1,125 67% 1,537 96%Non Umoja 72,447 44% 80,992 48% 95,887 56% 124,298 71% 170,830 95%Veteran StatusVeteran 2,678 51% 2,810 57% 2,843 65% 2,908 74% 3,435 97%Non Veteran 70,110 44% 78,631 48% 93,739 56% 122,515 71% 168,932 95%
Enrollment and Success in Transfer-Level English and Math in the California Community Colleges SystemThe RP Group | January 2021 | Page 16

Chart 4 below disaggregates enrollment in transfer-level math courses by race/ethnicity. In fall 2019, African American and Latinx students saw meaningful gains in direct enrollment in transfer-level math, both increasing by 42 percentage points (from 30% to 72% for African American students and 35% to 77% for Latinx students).
While differences between racial/ethnic groups in terms of direct enrollment in transfer-level math decreased substantially between fall 2018 and fall 2019, a gap still exists. The largest existing gap is between Asian students and African American students, though it is worth noting that this gap did decrease from 32 percentage points in fall 2018 (where it had been stagnant for three years) to 13 percentage points in fall 2019. The disparity between White and African American students, while still nine percentage points in fall 2019, decreased from 20 percentage points the year prior (fall 2018). A substantial narrowing of the equity gap was also seen between Asian and Latinx students, which decreased from 27 percentage points in fall 2018 to eight percentage points in fall 2019.
Furthermore, it is notable that African American students have the lowest rate of enrollment in transfer-level math. This suggests that these students are the largest group still being directed to pre-transfer-level courses, and their successful completion of the transfer-level course should be monitored. (See the tables A3 and A4 in the Appendix for rates disaggregated by SLAM and B-STEM math, respectively.)
Chart 4. Enrollment in Transfer-Level Math by Ethnicity—Fall 2015 to Fall 2019
Note: Students of unknown race, Pacific Islander students, students of two or more races, and Native American students are not plotted, but are shown in Table 3.
Enrollment and Success in Transfer-Level English and Math in the California Community Colleges SystemThe RP Group | January 2021 | Page 17

Chart 5 on the next page disaggregates enrollment into transfer-level math courses as the first course taken in the discipline by different student groups. Again, all groups saw dramatic increases in direct transfer-level math enrollment from 2015 to 2019, with the largest year-to-year gain occurring between fall 2018 and fall 2019. Students in EOPS saw an increase in enrollment into transfer-level math of 43 percentage points (from 34% to 77%), while students in DSPS saw a gain of 39 percentage points (from 28% to 67%).
Chart 5. Enrollment in Transfer-Level Math by Student Group—Fall 2015 to Fall 2019
Table 3 on the next page provides the specific data from which Charts 4 and 5 were derived, as well as the relative counts of each of the student groups.
Enrollment and Success in Transfer-Level English and Math in the California Community Colleges SystemThe RP Group | January 2021 | Page 18

Table 3. Enrollment in Transfer-Level Math, Disaggregated by Student Group—Fall 2015 to Fall 2019
Fall 2015 Fall 2016 Fall 2017 Fall 2018 Fall 2019# % # % # % # % # %
EthnicityAfrican American 1,372 15% 1,488 17% 1,750 20% 2,406 30% 4,814 72%Asian 10,205 48% 10,458 49% 11,179 54% 13,408 62% 17,344 85%Latinx 14,164 18% 16,536 20% 20,814 24% 29,258 35% 55,812 77%Native American 110 17% 128 19% 160 24% 208 33% 344 73%Pacific Islander 125 17% 142 21% 188 27% 256 40% 528 79%2+ Races 2,115 30% 2,439 33% 2,769 39% 3,507 48% 5,215 82%White 13,258 32% 13,924 35% 15,465 39% 18,677 50% 24,652 81%Unknown 1,385 42% 1,319 43% 1,673 39% 1,767 48% 7,026 82%GenderFemale 19,702 23% 21,310 25% 25,987 30% 34,455 41% 58,809 79%Male 22,471 29% 24,402 31% 27,321 34% 34,155 44% 55,365 80%Other/Unknown 561 27% 722 31% 690 35% 877 47% 1,561 80%DSPS StatusDSPS 1,890 16% 2,094 17% 2,571 21% 3,132 28% 5,819 67%Not DSPS 40,844 27% 44,340 29% 51,427 33% 66,355 44% 109,916 80%Foster Youth StatusFoster Youth 606 17% 577 16% 721 22% 943 31% 2640 69%Not Foster Youth 42,128 26% 45,857 28% 53,277 32% 68,544 43% 113,095 80%EOPS StatusEOPS 3,437 17% 3,800 19% 4,857 24% 6,705 34% 11,006 77%Not EOPS 39,297 27% 42,634 29% 49,141 33% 62,782 44% 104,729 80%Economic StatusEcon Dis 1,479 20% 2,098 23% 3,450 28% 5,654 38% 10,157 75%Not Econ Dis 41,255 26% 44,336 28% 50,548 33% 63,833 43% 105,578 80%MESA StatusMESA 574 52% 622 54% 693 62% 767 72% 724 91%Not MESA 42,160 26% 45,812 28% 53,305 32% 68,720 43% 115,011 79%Puente StatusPuente 125 26% 128 28% 213 32% 317 43% 639 79%Not Puente 42,609 16% 46,306 16% 53,785 24% 69,170 37% 115,096 84%Umoja StatusUmoja 177 26% 196 28% 254 32% 396 43% 764 79%Non Umoja 42,557 18% 46,238 18% 53,744 21% 69,091 31% 114,971 80%Veteran StatusVeteran 1,223 22% 1,138 23% 1,129 25% 1,375 35% 2,174 69%Non Veteran 41,511 26% 45,296 28% 52,869 32% 68,112 43% 113,561 79%
Enrollment and Success in Transfer-Level English and Math in the California Community Colleges SystemThe RP Group | January 2021 | Page 19

Successful Completion of Transfer-Level English and MathFirst Course Completion Volume and Success RateThis section seeks to answer two key questions:
1) Among students whose first English or math course is at transfer level in the fall term of a given year, how does the volume of successful completions of transfer-level English or math courses within one year compare to student success in the same courses in prior years?
2) What are the success rates in transfer-level English or math within one year among students who enrolled directly into the course in each fall term?
Below, Chart 6 illustrates the number of students in each fall cohort who successfully completed a transfer-level English or math course within one year when a transfer-level course was the first course in which they enrolled. Successful completion is defined as a grade of A, B, C, CR, or P.
For transfer-level English, the year-over-year completions rose by 26,103 students from fall 2018 to fall 2019, a 28% increase (from 93,918 to 120,021 students). In transfer-level math courses, 22,193 additional students in fall 2019 successfully completed the course within one year compared to fall 2018, a 47% increase (from 46,938 to 69,131 students). The growth in completions found between 2018 and 2019 suggests that the implementation of AB 705 sped up the growth in the number of students completing transfer-level English and math courses.
Chart 6. Number of Successful Completions in Transfer-Level English or Math Over Time
Table 4 on the next page provides the information which was used to create Chart 6. It includes the number and percentage of students who directly enrolled in and completed transfer-level
Enrollment and Success in Transfer-Level English and Math in the California Community Colleges SystemThe RP Group | January 2021 | Page 20

English and math courses within one year. It also provides the year-to-year change in the number of students successfully completing these courses.
It is worth noting that while the number of both enrolled students and successful completers increased substantially from fall 2015 to fall 2019, success rates for transfer-level English and math have decreased somewhat. With such a large increase in the number of students enrolled in transfer-level English and math, one might expect success rates to decrease substantially, as perhaps some of those students would have found themselves unprepared for the rigor of transfer-level coursework. However, the drop in English and math success rates from fall 2018 to fall 2019 (five and eight percentage points, respectively) is countered by the 28% increase in the number of total successful completions in English and 47% increase in the number of total successful completions in math in that same timeframe.
Table 4. Number and Percentage of Successful Completions of Transfer-Level English and Math Courses by Cohort—Fall 2015 to Fall 2019
Term Successful Completions Total Enrollments Success Rate Additional Successful Completions
from Prior Fall CohortEnglish
Fall 2015 56,046 72,788 77% —Fall 2016 62,638 81,441 77% 6,592Fall 2017 73,764 96,582 76% 11,126Fall 2018 93,918 125,423 75% 20,154Fall 2019 120,021 172,367 70% 26,103
MathFall 2015 31,217 42,734 73% —Fall 2016 33,692 46,434 73% 2,475Fall 2017 37,906 53,998 70% 4,214Fall 2018 46,938 69,487 68% 9,032Fall 2019 69,131 115,735 60% 22,193
Note: Success is defined as earned grade of A, B, C, CR, or P.
Chart 7 on the next page disaggregates the number of successful completions within one year in transfer-level English by race/ethnicity. Between fall 2018 and fall 2019 alone, 15,587 additional Latinx students successfully completed their English courses, representing a 37% increase in the number of Latinx students completing transfer-level English. Among African American students, 1,283 more completed transfer-level English among the fall 2019 cohort than the fall 2018 cohort. While much smaller in volume than the increase for Latinx students, this growth represents a 36% increase in the number of African American students completing transfer-level English.
Enrollment and Success in Transfer-Level English and Math in the California Community Colleges SystemThe RP Group | January 2021 | Page 21

Chart 7. Number of Successful Completions of Transfer-Level English, Disaggregated by Ethnicity—Fall 2015 to Fall 2019
Chart 8 below disaggregates the number of successful completions in transfer-level math by race/ethnicity over time. Over three times as many Latinx students who started directly at transfer-level in fall 2019 successfully completed their math courses within a year relative to those in the fall 2015 cohort. Similarly, more than 2.5 times as many African American students who started directly at transfer-level in fall 2019 successfully completed their math courses within a year relative to the fall 2015 cohort.
Chart 8. Number of Successful Completions of Transfer-Level Math, Disaggregated by Ethnicity—Fall 2015 to Fall 2019
Enrollment and Success in Transfer-Level English and Math in the California Community Colleges SystemThe RP Group | January 2021 | Page 22

Chart 9 on the next page offers more detail on math course completion, focusing specifically on SLAM and B-STEM courses. Breaking math completion down by course type reveals that the largest year-over-year increase in transfer-level math completion comes in the area of SLAM, whereby an additional 14,890 students in fall 2019 completed their SLAM course within one year compared to students in fall 2018, a 68% increase.
With respect to B-STEM, an additional 4,366 students in fall 2019 successfully completed their B-STEM courses within one year compared to fall 2018, an 18% increase. Thus, while approximately 23,000 students in the fall 2018 cohort completed both B-STEM and SLAM math courses within one year, completion of transfer-level SLAM math courses grew substantially more in 2019 than did completion of B-STEM math courses.
Chart 9. Number of Successful Completions in Transfer-Level B-STEM and SLAM Math Courses—Fall 2015 to Fall 2019
Table 5 on the next page offers the specific data used to develop Chart 7. It includes the number of students who enrolled directly in transfer-level SLAM and B-STEM math courses, the number and percentage of students who successfully completed those courses within one year, and the year-over-year change in the number of students successfully completing transfer-level SLAM and B-STEM math courses within one year.
Following the overall math trend, while the number of both enrolled students and successful completers increased from fall 2015 to fall 2019 (most notably in SLAM math courses), success rates for both course types have decreased somewhat. However, the drop in both SLAM and B-STEM course success rates from fall 2018 to fall 2019 (nine and seven percentage points, respectively) is countered by the 68% increase in the number of total successful completions in SLAM math courses and 18% increase in the number of total successful completions in B-STEM math courses in that same timeframe.
Enrollment and Success in Transfer-Level English and Math in the California Community Colleges SystemThe RP Group | January 2021 | Page 23

Table 5. Number and Percent of Successful Completions of Transfer-Level SLAM and B-STEM Math Courses by Cohort—Fall 2015 to Fall 2019
Term Successful Completions Total Enrollment Success Rate Additional Successful Completions
from Prior FallSLAM
Fall 2015 11,399 15,447 74% —Fall 2016 13,047 17,845 73% 1,648 Fall 2017 15,890 22,540 70% 2,843Fall 2018 22,034 32,537 68% 6,144Fall 2019 36,924 62,471 59% 14,890
B-STEMFall 2015 19,064 26,048 73% —Fall 2016 19,857 27,224 73% 793Fall 2017 21,193 29,944 71% 1,336Fall 2018 23,786 34,751 68% 2,593Fall 2019 28,152 45,825 61% 4,366
Note: Success is defined as receiving grades of A, B, C, CR, and P.
Below, Chart 10 illustrates the number of students who successfully completed transfer-level SLAM math courses in one year, disaggregated by race/ethnicity. Again, substantial increases were seen across racial/ethnic groups in the fall 2019 cohort relative to fall 2018. During that timeframe, 7,627 additional Latinx students successfully completed a transfer-level SLAM math course, an 82% increase (from 9,324 students to 16,951). Among African American students, successful completions increased by 677 students, a 97% increase (from 698 students to 1,375). (See Table A6 in the Appendix for a full accounting of the number and percentages of successful completions of transfer-level SLAM math courses, disaggregated by student groups.)
Chart 10. Number of Successful Completions of Transfer-Level SLAM Math Courses, Disaggregated by Ethnicity—Fall 2015 to Fall 2019
Enrollment and Success in Transfer-Level English and Math in the California Community Colleges SystemThe RP Group | January 2021 | Page 24

With regards to B-STEM math, as displayed below in Chart 11, between fall 2018 and fall 2019, only Latinx and African American students demonstrated large gains in completion volume. In fall 2019, 2,313 additional Latinx students successfully completed a transfer-level B-STEM math course compared to fall 2018, a 32% increase (from 7,228 students to 9,541). Further, while only an additional 149 African American students completed B-STEM math courses in fall 2019 relative to fall 2018, this shift represents a 29% increase. (Please see Table A7 in the Appendix for a full accounting of the number and percentages of successful completions of transfer-level B-STEM math courses, disaggregated by student groups.)
Chart 11. Number of Successful Completions of Transfer-Level B-STEM Math Courses, Disaggregated by Ethnicity—Fall 2015 to Fall 2019
ThroughputThis section explores one-year throughput rates (also known as full cohort success rates) for transfer-level English and math among students between 2015 and 2019. Throughput rates here describe the proportion of students who take and pass transfer-level courses within one year of first attempting to do so out of the full cohort of incoming students who take any level course (basic skills through transfer).
The following research questions were examined:
What are the throughput rates for transfer-level English and math courses, with throughput defined as the rate in which students attempting their first English or math course at any level complete the transfer-level course within one year? How does throughput differ by incoming GPA?
Enrollment and Success in Transfer-Level English and Math in the California Community Colleges SystemThe RP Group | January 2021 | Page 25

THROUGHPUT RATES IN ENGLISH COURSES
Chart 12 below displays the one-year English throughput rate for fall cohorts from 2015 through 2019. As shown, one-year throughput rates have been growing consistently over time, with the largest surges occurring between fall 2017 and 2018 (seven percentage points) and fall 2018 and 2019 (five percentage points). This increase suggests that the implementation of AB 705 has had a positive impact on throughput rates in transfer-level English.
Chart 12. One-Year Throughput Rates for Transfer-Level English—Fall 2015 to Fall 2019
Next, Chart 13 illustrates the one-year English throughput rates by students’ high school GPA. English throughput increased for students across all GPA bands from 2015 to 2019. However, for students in the middle and lowest GPA bands, the largest year-over-year increase in throughput was seen between fall 2018 and fall 2019. This finding suggests that the full implementation of AB 705 has been particularly impactful for students with an incoming high school GPA of less than 2.6, and the greatest impact has been felt by students in the lowest GPA band.
Chart 13. One-Year Throughput Rates for Transfer-Level English by GPA Band—Fall 2015 to Fall 2019
Enrollment and Success in Transfer-Level English and Math in the California Community Colleges SystemThe RP Group | January 2021 | Page 26

Chart 14 below shows the change in one-year throughput rates for transfer-level English by ethnicity. Despite the overall growth in one-year throughput rates within each racial/ethnic group, gaps between the groups have only decreased slightly. For example, the gap between African-American and White students in the fall 2015 cohort was 29 percentage points, and in the fall 2019 cohort it was 22 percentage points. Similarly, the gap between Latinx and Asian students in 2015 was 20 percentage points, and in 2019 it remained at 17 percentage points. Thus, while results are trending in the right direction, much more work needs to be done with respect to closing equity gaps in English throughput.
Chart 14. One-Year Throughput Rates for Transfer-Level English by Ethnicity—Fall 2015 to Fall 2019
Chart 15 on the next page breaks out the one-year English throughput rate into more detail (also see Table A8 in the Appendix for more information). With the exception of MESA (where throughput was already far above average), one-year throughput rates increased for all groups between fall 2018 and fall 2019, with especially notable gains among foster youth and students enrolled in Puente.
Enrollment and Success in Transfer-Level English and Math in the California Community Colleges SystemThe RP Group | January 2021 | Page 27

Chart 15. One-Year Throughput Rates for Transfer-Level English by Student Group—Fall 2015 to Fall 2019
On the next page, Charts 16a and 16b illustrate the proportion of students who passed transfer-level English within one term, one year, two years, and three years, broken out by those who were placed directly into transfer-level English (Chart 16a) and those who began one level below transfer-level English (Chart 16b). It is useful to look at these two groups because many students who placed directly into transfer-level English after AB 705 was implemented would likely have started one level below transfer without the AB 705 mandates.
A comparison of these charts reveals that 70% of students passed transfer-level English in one year in fall 2019, which is lower than the 75% who passed in one year in 2018. Nonetheless, the 2019 throughput rate of 70% is substantially higher than the 37% of students starting one-level below transfer-level English in 2017-18 who passed transfer-level English within one year (before colleges started making substantial changes in preparation for AB 705). These findings suggest that students have an increased likelihood of passing transfer-level English in a shorter period of time if placed directly into the course. (See Table A10 in the Appendix for more details on transfer-level English throughput by starting level.)
Enrollment and Success in Transfer-Level English and Math in the California Community Colleges SystemThe RP Group | January 2021 | Page 28

Chart 16a. Successful Completion of Transfer-Level English Among Students Starting at Transfer- Level—2015 to 2019
Chart 16b. Successful Completion of Transfer-Level English Among Students Starting One Level Below Transfer-Level—2015 to 2019
THROUGHPUT RATES IN MATH COURSES
Chart 17 on the following page displays the one-year throughput rates for transfer-level math courses among students whose first enrollment in math was in fall of that year at any starting level. As shown, one-year throughput rates grew slowly from fall 2015 to fall 2017, followed by a larger increase between 2017 and 2018, and then an even more substantial increase from fall 2018 to fall 2019. The fall 2019 cohort’s one-year throughput rate of 50% is 15 percentage points above the next highest rate of 35% in fall 2018. As with English, this finding suggests that the implementation of AB 705 has had a positive impact on throughput rates in transfer-level math.
Enrollment and Success in Transfer-Level English and Math in the California Community Colleges SystemThe RP Group | January 2021 | Page 29

Chart 17. One-Year Throughput Rates for All Transfer-Level Math—Fall 2015 to Fall 2019
Chart 18 displays the one-year math throughput rates broken out by students’ high school GPA. For all GPA bands, the largest year-over-year increase in throughput seen to date took place from fall 2018 to fall 2019. Students in the middle and lowest GPA bands saw especially large jumps in throughput rates during this time (14 and 11 percentage points, respectively). This finding suggests that the full implementation of AB 705 has been particularly impactful for students with an incoming high school GPA of less than 3.0.
Chart 18. One-Year Throughput Rates for Transfer-Level Math by GPA Band—Fall 2015 to Fall 2019
On the next page, Chart 19 demonstrates the change in one-year throughput rates for transfer-level math by race/ethnicity. Just as was seen with English throughput rates, the overall growth in one-year throughput rates within each racial/ethnic group has neither eliminated nor substantially lessened gaps between the groups. For example, the gap between African-American and Asian students in the fall 2015 cohort was 35 percentage points, and in 2019 that gap remained exactly the same. The disparity between Latinx and White students actually grew by two percentage points—in the fall 2015 cohort, the gap was 15 percentage points, and for the fall 2019 cohort, it was 17 percentage points.
Enrollment and Success in Transfer-Level English and Math in the California Community Colleges SystemThe RP Group | January 2021 | Page 30

Chart 19. One-Year Throughput Rates for Transfer-Level Math by Ethnicity—Fall 2015 to Fall 2019
Chart 20 displays the one-year throughput rate broken out by student group (see Table A9 in the Appendix for more details). As with English, with the exception of MESA (where throughput was already above average), one-year throughput rates increased for all groups between fall 2018 and fall 2019, with especially notable gains among veterans and students enrolled in Puente.
Chart 20. One-Year Throughput Rates for Transfer-Level Math Over Time by Student Group
Enrollment and Success in Transfer-Level English and Math in the California Community Colleges SystemThe RP Group | January 2021 | Page 31

Charts 21a and 21b below examine the proportion of students who passed transfer-level math within one term, one year, two years, and three years, broken out by those who placed directly into transfer-level math (Chart 21a) and those who were began one-level below transfer-level math (Chart 21b).
A comparison of Charts 21a and 21b reveals that in fall 2019, 60% of students who enrolled directly into transfer-level math passed in one year. While the 2019 throughput rate among these students was lower than the 68% achieved the year before, it is nonetheless substantially higher than the 22% of students starting one-level below transfer-level math in 2017-18 who passed within one year (before colleges started making substantial changes in preparation for AB 705). (See Table A11 in the Appendix for more details on transfer-level math throughput by starting level.)
Chart 21a. Successful Completion of Transfer-Level Math Among Students Who Started at Transfer-Level—Fall 2015 to Fall 2019
Chart 21b. Successful Completion of Transfer-Level Math Among Students Who Started One Level Below Transfer-Level—Fall 2015 to Fall 2019
Enrollment and Success in Transfer-Level English and Math in the California Community Colleges SystemThe RP Group | January 2021 | Page 32

ConclusionNow that the full implementation of AB 705 has arrived, community colleges across California have put into place approaches to assessment and placement that align with the mandates of the law. Administrators, faculty, and staff are eager to know how their work to meet the requirements of AB 705 will impact student outcomes. As such, while this report examines changes in student outcomes that have taken place from fall 2015 to fall 2019, focusing in particular on substantial movement that took place between 2018 and 2019, when all colleges were expected to implement AB 705. By looking at trends over the past five years, as well as any changes that occurred specifically in the past year, this report sought to provide insight into the impact of AB 705 on both CCCs and their students.
While it is difficult to tease out the impact of AB 705 from systemwide trends or the effects of other initiatives, there is a strong likelihood that shifts that occurred between 2018 and 2019 to a substantially greater degree than in previous years are to a large extent the result of AB 705. By tracking these sizable increases or decreases in outcomes such as enrollment, course success, and throughput, early findings indicate that AB 705 has thus far had a positive impact on many, but not all, key student outcomes.
Research Limitations There are several limitations to this study that are important to keep in mind when analyzing its findings. First, this research presents a snapshot in time and can only be applied to what was happening within the system during the timeframe of analysis. Further, interpretation of longitudinal data comes with the caveat that the onset of the COVID-19 pandemic occurred in spring 2020, precipitating a number of significant changes throughout the CCC system.
Second, this study was not able to include every potentially relevant math course. The study looked only at transfer-level math courses, which excludes intermediate algebra, a course that can be used to satisfy local degree requirements. Four percent of math courses did not fall within the SLAM or B-STEM categories, including courses like Arithmetic and Combined Elementary and Intermediate Algebra. Courses that appeared to cover content that was below transfer-level and which had apparently been miscoded as transfer-level (e.g., arithmetic) were not coded as either SLAM or B-STEM. Moving forward, new data elements will be available that will help with the identification of additional courses in other TOP codes that meet transfer requirements. Inclusion of support courses will also be possible in the future due to the creation of a new MIS data element designed to identify support courses.
Third, throughput rates were calculated by dividing the number of students who completed a transfer-level gateway class in a given subject within one year of their initial attempt in the sequence by the number of students taking a course at any level in that subject. If students’ first transfer-level attempt was unsuccessful, only their second transfer-level attempt was included in the data file (and thus the numerator of this calculation). Therefore, throughput rates described in this report could be slightly underestimating the true effect, as it is feasible that some students could attempt to pass a transfer-level course more than two times within one year (especially across colleges or districts, or at colleges on the quarter system).
Enrollment and Success in Transfer-Level English and Math in the California Community Colleges SystemThe RP Group | January 2021 | Page 33

EnrollmentThis research shows that there have been dramatic shifts in enrollment, in fall 2019 in particular. Across all student groups, enrollment in transfer-level English and math courses sharply increased from fall 2017 to fall 2018 (as colleges prepared for AB 705 implementation) and grew even more between fall 2018 and fall 2019 (upon full implementation). Specifically, in fall 2019, enrollment in transfer-level English and math courses as students’ first course in the discipline increased among all racial/ethnic groups at the greatest rate over the past five fall terms, nearly eliminating equity gaps in transfer-level English enrollment. However, racial/ethnic gaps have not narrowed as readily in transfer-level math enrollment.
Success Students who would have been assigned to developmental education pre-AB 705 are now enrolling directly into transfer-level classes. Some concern about the impact of this increased enrollment on student success is of course reasonable. This study shows that there has in fact been a decrease in student success rates in both English and math courses. This finding suggests that in order to pass transfer-level courses, some students may need more support or support of a different nature than is currently available to them.
However, the decrease in student success rates must be viewed alongside the dramatic increase in the sheer number of students both enrolling in and successfully completing transfer-level courses. When examining the volume of successful completers, the results indicate that the implementation of AB 705 has produced far more students successfully completing transfer-level English and math (SLAM more so than B-STEM) than ever before.
The magnitude of this increased volume is apparent in throughput rates. When comparing students in each fall term who started at any level of English or math course and successfully completed transfer-level English and math within one year, throughput rates are improving as more students are being directly placed into transfer-level courses. Such increases are especially notable among students in lower GPA bands as well as students in groups with historically lower throughput rates.
Persistent Equity IssuesWhile the data in this report are encouraging across various indicators, not all demographic groups are experiencing the benefits of AB 705 equally, and therefore targeted attention to these findings is needed. Despite gains across all racial/ethnic groups in terms of enrollment and success in transfer-level courses, equity gaps between those groups persist, especially in math courses. It is critical to keep a close eye on equity, continuing to measure gaps between student groups and focusing additional resources on closing those gaps.
Next Steps and ImplicationsAs more data become available, local as well as statewide analyses should survey the various approaches colleges are taking to support students both in and out of the classroom, with
Enrollment and Success in Transfer-Level English and Math in the California Community Colleges SystemThe RP Group | January 2021 | Page 34

particular attention paid to those colleges where equity gaps are closing. Throughput data, disaggregated by high school performance band and student groups, will be extremely valuable in comparing how a particular support or curricular structure is working with different students. Increased attention should be paid to students in the middle and lowest GPA bands—who are often from marginalized groups—to ensure that the innovative supports directed to these students are resulting in increased completion of transfer-level English and math within one year.
Moreover, instructional and counseling faculty—along with academic and student services deans—should work collaboratively with their institutional research, planning, and effectiveness offices, engaging in discussions about how the data reflect on the impact of current processes and practices. Colleges also need to continue to monitor additional outcomes, including success in subsequent courses, enrollment trends, financial aid usage, academic standing, degree completion, transfer, and employment.
Enrollment and Success in Transfer-Level English and Math in the California Community Colleges SystemThe RP Group | January 2021 | Page 35

Research and Planning Group for California Community Colleges
As the representative organization for Institutional Research, Planning, and Effectiveness (IRPE) professionals in the California Community Colleges (CCC) system, the RP Group strengthens the ability of CCC to discover and undertake high-quality research, planning, and assessments that improve evidence-based decision-making, institutional effectiveness, and success for all students.
AuthorsKatie Brohawn, RP Group
Mallory Newell, De Anza College
Loris Fagioli, RP Group
AcknowledgmentsCraig Hayward, Bakersfield College
John Hetts, California Community College Chancellor’s Office
Dan Lamoree, Educational Results Partnership
Terrence Willett, Cabrillo College
Darla Cooper, RP Group
www.rpgroup.org
Enrollment and Success in Transfer-Level English and Math in the California Community Colleges SystemThe RP Group | January 2021 | Page 36

Appendix Table A1. Enrollment in Transfer-Level SLAM of Students Whose First Enrollment in the Discipline Is at Transfer Level by Cohort—Fall 2015 to Fall 2019
Term Total Students in SLAM Total Enrollment in Transfer-Level Math Percent in SLAM Math
Fall 2015 15,447 42,734 36%Fall 2016 17,845 46,434 38%Fall 2017 22,540 53,998 42%Fall 2018 32,537 69,487 47%Fall 2019 62,471 115,735 54%
Table A2. Enrollment in Transfer-Level B-STEM Math of Students Whose First Enrollment in the Discipline Is at Transfer Level by Cohort—Fall 2015 to Fall 2019
Term Total Students in B-STEM Math
Total Enrollment in Transfer-Level Math Percent in B-STEM Math
Fall 2015 26,048 42,734 61%Fall 2016 27,244 46,434 59%Fall 2017 29,944 53,998 55%Fall 2018 34,751 69,487 50%Fall 2019 45,825 115,735 40%
Note: B-STEM refers to math for business, science, technology, engineering, and mathematics. SLAM refers to statistics and liberal arts math.
Enrollment and Success in Transfer-Level English and Math in the California Community Colleges SystemThe RP Group | January 2021 | Page 37

Table A3. Enrollment (Number and Percent) of Students in SLAM Among Those Whose First Enrollment in the Math is at Transfer Level, Disaggregated by Student Group—Fall 2015 to Fall 2019
Fall 2015 Fall 2016 Fall 2017 Fall 2018 Fall 2019# % # % # % # % # %
EthnicityAsian 2,777 27% 2,997 29% 3,474 31% 4,641 35% 7,073 41%African American 630 46% 692 47% 879 50% 1,285 53% 2,971 62%Latinx 5,637 40% 7,093 43% 9,662 46% 15,311 52% 32,492 58%Native American 53 48% 57 45% 74 46% 101 49% 200 58%Pacific Islander 53 42% 63 44% 94 50% 137 54% 330 63Two or More 839 40% 925 38% 1,210 44% 1,661 47% 2,736 52%White 5,078 38% 5,621 40% 6,606 43% 8,733 47% 12,988 53%Unknown 380 27% 397 30% 541 32% 668 38% 3,681 52%GenderFemale 9,156 46% 10,551 50% 13,571 52% 19,688 57% 37,305 63%Male 6,091 27% 7,035 29% 8,692 32% 12,460 36% 24,373 35%Other/Unknown 200 36% 259 36% 277 40% 389 44% 793 51%DSPS StatusDSPS 647 34% 800 38% 1,054 41% 1,523 49% 3,540 61%Not DSPS 14,800 36% 17,045 38% 21,486 42% 31,014 47% 58,931 54%Foster Youth StatusFoster Youth 231 38% 222 38% 300 42% 485 51% 1,323 50%Not Foster Youth 15,216 36% 17,623 38% 22,240 42% 32,052 47% 61,148 54%EOPS StatusEOPS 1,193 35% 1,527 40% 2,151 44% 3,394 51% 6,716 61%Not EOPS 14,254 36% 16,318 38% 20,389 41% 29,143 46% 55,755 53%Economic StatusEcon Dis 451 30% 451 29% 1,217 35% 2,562 45% 5,701 56%Not Econ Dis 14,996 36% 17,229 39% 21,323 42% 29,975 47% 56,770 54%MESA StatusMESA 69 12% 59 9% 81 12% 88 11% 87 12%Not MESA 15,378 36% 17,786 39% 22,459 42% 32,449 47% 62,384 54%Puente StatusPuente 60 48% 66 52% 113 53% 171 54% 411 64%Not Puente 15,387 36% 17,779 38% 22,427 42% 32,366 47% 62,060 54%Umoja StatusUmoja 67 38% 81 41% 113 44% 234 59% 533 70%Non Umoja 15,380 36% 17,764 38% 22,427 42% 32,303 47% 61,938 54%Veteran StatusVeteran 505 41% 436 38% 485 43% 637 46% 1,124 52%Non Veteran 14,942 36% 17,409 38% 22,055 42% 31,900 47% 61,347 54%
Note: Native American includes Native Alaskan; Pacific Islander includes Native Hawaiian. Cells present the number and percentage of students in a given cohort with a given characteristic who first enrolled in a transfer-level course.
Enrollment and Success in Transfer-Level English and Math in the California Community Colleges SystemThe RP Group | January 2021 | Page 38

Table A4. Enrollment (Number and Percent) of Students in B-STEM Among Those Whose First Enrollment in Math is at Transfer Level, Disaggregated by Student Group—Fall 2015 to Fall 2019
Fall 2015 Fall 2016 Fall 2017 Fall 2018 Fall 2019# % # % # % # % # %
EthnicityAfrican American 620 45% 677 45% 724 41% 956 40% 1,521 32%Asian 7,341 72% 7,369 70% 7,632 68% 8,580 64% 9,451 54%Latinx 7,822 55% 8,581 52% 10,177 49% 12,689 43% 19,421 35%Native American 51 46% 60 47% 82 51% 91 44% 104 30%Pacific Islander 71 57% 75 53% 91 48% 108 42% 171 32%Two or More 1,230 58% 1,471 60% 1,509 54% 1,803 51% 2,136 41%White 7,927 60% 8,108 58% 8,627 56% 9,505 51% 10,016 41%Unknown 986 71% 903 68% 1,102 66% 1,019 58% 3,005 43%GenderFemale 9,821 50% 10,050 47% 11,567 45% 13,697 40% 17,766 30%Male 15,877 71% 16,748 69% 17,977 66% 20,595 60% 27,387 49%Other/Unknown 350 62% 446 62% 400 58% 459 52% 672 43%DSPS StatusDSPS 1,080 57% 1,154 55% 1,353 53% 1,445 46% 1,882 32%Not DSPS 24,968 61% 26,090 59% 28,591 56% 33,306 50% 43,943 40%Foster Youth StatusFoster Youth 349 58% 328 57% 390 54% 419 44% 1,143 43%Not Foster Youth 25,699 61% 26,916 59% 29,554 55% 34,332 50% 44,682 40%EOPS StatusEOPS 2,037 59% 2,107 55% 2,491 51% 2,988 45% 3,486 32%Not EOPS 24,011 61% 25,137 59% 27,453 56% 31,763 51% 42,339 40%Economic StatusEcon Dis 1,004 68% 1,455 69% 2,204 64% 3,063 54% 4,307 42%Not Econ Dis 25,044 61% 25,789 58% 27,740 55% 31,688 50% 41,518 39%MESA StatusMESA 502 87% 558 90% 610 88% 663 86% 624 86%Not MESA 25,546 61% 26,686 58% 29,334 55% 34,088 50% 45,201 39%Puente StatusPuente 59 47% 55 43% 91 43% 135 43% 200 31%Not Puente 25,989 61% 27,189 59% 29,853 56% 34,616 50% 45,625 40%Umoja StatusUmoja 102 58% 107 55% 127 50% 145 37% 212 28%Non Umoja 25,946 61% 27,137 59% 29,817 55% 34,606 50% 45,613 40%Veteran StatusVeteran 683 56% 675 59% 628 56% 691 50% 920 42%Non Veteran 25,365 61% 26,569 59% 29,316 55% 34,060 50% 44,905 40%
Note: Native American includes Native Alaskan; Pacific Islander includes Native Hawaiian. Cells present the number and percentage of students in a given cohort with a given characteristic who first enrolled in a transfer-level course.
Enrollment and Success in Transfer-Level English and Math in the California Community Colleges SystemThe RP Group | January 2021 | Page 39

Table A5. First Course Completion Volume and Success Rates in English, Disaggregated by Student Group—Fall 2015 to Fall 2019
Fall 2015 Fall 2016 Fall 2017 Fall 2018 Fall 2019# % # % # % # % # %
EthnicityAfrican American 1,910 66% 2,335 68% 2,703 66% 3,526 64% 4,809 58%Asian 8,324 86% 9,107 85% 10,680 85% 13,922 85% 16,379 82%Latinx 21,004 73% 24,901 72% 31,403 72% 42,693 70% 58,280 64%Native American 206 67% 207 71% 275 74% 333 64% 377 62%Pacific Islander 165 66% 200 68% 268 66% 324 63% 477 61%Two or More 2,950 75% 3,529 76% 3,871 76% 4,513 76% 5,248 73%White 20,245 80% 21,021 81% 22,676 81% 26,339 81% 26,883 78%Unknown 1,242 83% 1,338 84% 1,888 81% 2,268 78% 7,568 72%GenderFemale 29,732 80% 32,950 79% 39,789 79% 50,972 77% 66,037 72%Male 25,592 74% 28,713 74% 33,089 74% 41,828 72% 52,401 67%Other/Unknown 722 76% 975 75% 886 73% 1,118 72% 1,583 69%DSPS StatusDSPS 3,039 75% 3,416 76% 4,076 73% 5,301 70% 6,716 62%Not DSPS 53,007 77% 59,222 77% 69,688 77% 88,617 75% 113,305 70%Foster Youth StatusFoster Youth 803 64% 893 65% 1,018 61% 1,222 61% 2,668 59%Not Foster Youth 55,243 77% 61,745 77% 72,746 77% 92,696 75% 117,353 70%EOPS StatusEOPS 5,014 79% 5,930 79% 7,741 78% 10,729 78% 12,843 71%Not EOPS 51,032 77% 56,708 77% 66,023 76% 83,189 74% 107,178 70%Economic StatusEcon Dis 2,311 77% 3,118 79% 5,505 81% 9,278 75% 11,672 70%Not Econ Dis 53,735 77% 59,520 77% 68,259 76% 84,640 75% 108,349 70%MESA StatusMESA 574 90% 652 92% 780 91% 862 92% 647 85%Not MESA 55,472 77% 61,986 77% 72,984 76% 93,056 75% 119,374 70%Puente StatusPuente 69 83% 106 76% 239 83% 430 80% 1,082 84%Not Puente 55,977 77% 62,532 77% 73,525 76% 93,488 75% 118,939 70%Umoja StatusUmoja 285 84% 339 76% 525 76% 808 72% 1,025 67%Non Umoja 55,761 77% 62,299 77% 73,239 76% 93,110 75% 118,996 70%Veteran StatusVeteran 2,054 77% 2,155 77% 2,199 77% 2,234 77% 2,577 75%Non Veteran 53,992 77% 60,483 77% 71,565 76% 91,684 75% 117,444 70%
Note: Native American includes Native Alaskan; Pacific Islander includes Native Hawaiian.
Enrollment and Success in Transfer-Level English and Math in the California Community Colleges SystemThe RP Group | January 2021 | Page 40

Table A6. First Course Completion Volume and Success Rates in SLAM Math Courses Within One Year, Disaggregated by Student Group—Fall 2015 to Fall 2019
Fall 2015 Fall 2016 Fall 2017 Fall 2018 Fall 2019# % # % # % # % # %
EthnicityAfrican American 396 63% 416 60% 472 54% 698 54% 1,375 46%Asian 2,292 83% 2,452 82% 2,862 82% 3,746 81% 5,370 76%Latinx 3,752 67% 4,702 66% 6,090 63% 9,324 61% 16,951 52%Native American 36 68% 35 61% 42 57% 59 58% 111 56%Pacific Islander 33 62% 44 70% 60 64% 76 55% 157 48%Two or More 621 74% 683 74% 878 73% 1,135 68% 1,688 62%White 3,955 78% 4,389 78% 5,068 77% 6,521 75% 9,097 70%Unknown 314 83% 326 82% 418 77% 475 71% 2,175 59%GenderFemale 7,015 77% 7,926 75% 9,889 73% 13,712 70% 22,845 61%Male 4,247 70% 4,943 70% 5,800 67% 8,055 65% 13,613 56%Other/Unknown 137 69% 178 69% 201 73% 267 69% 466 59%DSPS StatusDSPS 431 67% 551 69% 689 65% 923 61% 1,846 52%Not DSPS 10,968 74% 12,496 73% 15,201 71% 21,111 68% 35,078 60%Foster Youth StatusFoster Youth 146 63% 145 65% 158 53% 257 53% 633 48%Not Foster Youth 11,253 74% 12,902 73% 15,732 71% 21,777 68% 36,291 59%EOPS StatusEOPS 847 71% 1,066 70% 1,478 69% 2,288 67% 3,817 57%Not EOPS 10,552 74% 11,981 73% 14,412 71% 19,746 68% 33,107 59%Economic StatusEcon Dis 313 69% 404 66% 818 67% 1,618 63% 3,049 53%Not Econ Dis 11,086 74% 12,643 73% 15,072 71% 20,416 68% 33,875 60%MESA StatusMESA 60 87% 54 92% 68 84% 76 86% 53 61%Not MESA 11,339 74% 12,993 73% 15,822 70% 21,958 68% 36,871 59%Puente StatusPuente 40 67% 54 82% 71 63% 120 70% 253 62%Not Puente 11,359 74% 12,993 73% 15,819 71% 21,914 68% 36,671 59%Umoja StatusUmoja 46 69% 44 54% 68 69% 145 62% 269 59%Non Umoja 11,353 74% 13,003 73% 15,822 71% 21,889 68% 36,655 59%Veteran StatusVeteran 364 72% 301 69% 350 72% 444 70% 767 68%Non Veteran 11,035 74% 12,746 73% 15,540 70% 21,590 68% 36,157 59%
Note: Native American includes Native Alaskan; Pacific Islander includes Native Hawaiian. SLAM refers to statistics and liberal arts math.
Enrollment and Success in Transfer-Level English and Math in the California Community Colleges SystemThe RP Group | January 2021 | Page 41

Table A7. First Course Completion Volume and Success Rates in B-STEM Math Courses Within One Year, Disaggregated by Student Group—Fall 2015 to Fall 2019
Fall 2015 Fall 2016 Fall 2017 Fall 2018 Fall 2019# % # % # % # % # %
EthnicityAfrican American 380 61% 394 58% 375 52% 509 53% 658 43%Asian 6,009 82% 6,091 83% 6,278 82% 7,040 82% 7,465 79%Latinx 4,968 64% 5,410 63% 6,100 60% 7,228 57% 9,541 49%Native American 26 51% 35 58% 49 60% 39 43% 39 38%Pacific Islander 44 62% 40 53% 48 53% 63 58% 89 52%Two or More 849 69% 1,040 71% 1,072 71% 1,245 69% 1,395 65%White 5,951 75% 6,089 75% 6,409 74% 6,880 72% 6,997 70%Unknown 837 85% 758 84% 862 78% 782 77% 1,968 65%GenderFemale 7,451 76% 7,520 75% 8,349 72% 9,511 69% 11,180 63%Male 11,381 72% 12,019 72% 12,576 70% 13,953 68% 16,539 60%Other/Unknown 232 66% 318 71% 268 67% 322 70% 433 64%DSPS StatusDSPS 731 68% 780 68% 880 65% 907 63% 1,042 55%Not DSPS 18,333 73% 19,077 73% 20,313 71% 22,879 69% 27,110 62%Foster Youth StatusFoster Youth 225 64% 211 64% 245 63% 258 62% 578 51%Not Foster Youth 18,839 73% 19,646 73% 20,948 71% 23,528 69% 27,574 62%EOPS StatusEOPS 1,603 79% 1,608 76% 1,875 75% 2,140 72% 2,126 61%Not EOPS 17,461 73% 18,249 73% 19,318 70% 21,646 68% 26,026 61%Economic StatusEcon Dis 700 70% 1,018 70% 1,605 73% 2,076 68% 2,514 58%Not Econ Dis 18,364 73% 18,839 73% 19,588 71% 21,710 69% 25,638 62%MESA StatusMESA 437 87% 494 89% 540 89% 565 85% 476 76%Not MESA 18,627 73% 19,363 73% 20,653 70% 23,221 68% 27,676 61%Puente StatusPuente 36 61% 44 80% 59 65% 88 65% 111 56%Not Puente 19,028 73% 19,813 73% 21,134 71% 23,698 68% 28,041 61%Umoja StatusUmoja 71 70% 65 61% 76 60% 79 54% 94 44%Non Umoja 18,993 73% 19,792 73% 21,117 71% 23,707 69% 28,058 62%Veteran StatusVeteran 479 70% 472 70% 421 67% 460 67% 579 635Non Veteran 18,585 73% 19,385 73% 20,772 71% 23,326 68% 27,573 61%
Note: Native American includes Native Alaskan; Pacific Islander includes Native Hawaiian. B-STEM refers to business, science, technology, engineering, and mathematics.
Enrollment and Success in Transfer-Level English and Math in the California Community Colleges SystemThe RP Group | January 2021 | Page 42

Table A8. One-Year Throughput Rates for Transfer-Level English by Student Group
Fall 2015 Fall 2016 Fall 2017 Fall 2018 Fall 2019# % # % # % # % # %
Ethnicity
African American 3,021/ 9,526 32% 3,492/
9,262 38% 3,750/ 9,161 41% 4,337/
9,054 48% 4,930/ 9,022 55%
Asian 11,935/ 19,981 60% 12,571/
19,721 64% 13,453/ 20,128 67% 15,910/
21,508 74% 16,706/ 21,102 79%
Latinx 34,231/ 82,734 41% 38,603/
86,420 45% 43,506/ 89,561 49% 51,441/
91,551 56% 59,358/ 95,361 62%
Native American 310/784 40% 313/767 45% 360/749 49% 384/745 56% 380/642 62%Pacific Islander 269/755 36% 299/729 41% 367/768 48% 392/752 52% 484/816 59%
Two or More 3,835/ 7,170 53% 4,456/
7,758 57% 4,682/ 7,676 61% 5,031/
7,709 65% 5,345/ 7,522 71%
White 25,658/ 42,079 61% 26,226/
41,363 63% 26,903/ 40,351 67% 28,989/
40,314 72% 27,261/ 35,828 76%
Unknown 1,747/ 3,120 56% 1,733/
2,920 59% 2,376/ 3,937 60% 2,615/
3,939 66% 7,675/ 10,950 70%
Gender
Female 43,782/ 86,091 51% 47,038/
86,919 54% 52,115/ 89,466 58% 59,501/
91,631 65% 67,256/ 96,135 70%
Male 36,232/ 78,052 46% 39,370/
79,637 49% 42,273/ 80,795 52% 48,355/
81,904 59% 53,265/ 82,695 64%
Other/Unknown 992/2,007 49% 1,285/ 2,384 54% 1,099/
2,070 53% 1,243/ 2,037 61% 1,618/
2,413 67%
DSPS Status
DSPS 4,747/ 12,683 37% 5,267/
12,820 41% 5,744/ 13,064 44% 6,599/
12,787 52% 6,981/ 12,090 58%
Not DSPS 76,259/ 153,467 50% 82,426/
156,120 53% 89,743/ 159,267 56% 102,500/
162,785 63% 115,158/ 169,153 68%
EOPS Status
EOPS 9,259/ 20,345 46% 10,239/
20,543 50% 11,542/ 20,824 55% 13,582/
21,053 65% 13,136/ 19,173 69%
Not EOPS 71,747/ 145,805 49% 77,454/
148,397 52% 83,945/ 151,507 55% 95,517/
154,519 62% 109,003/ 162,070 67%
Foster Youth
Foster Youth 1,211/ 3,689 33% 1,338/
3,708 36% 1,367/ 3,539 39% 1,477/
3,253 45% 2,712/ 4,753 57%
Not Foster Youth 79,795/ 162,461 49% 86,355/
165,232 52% 94,120/ 168,792 56% 107,622/
172,319 62% 119,427/ 176,490 68%
Economic Status
Ec Dis 3,830/ 7,595 50% 5,204/
9,515 55% 7,885/ 13,339 59% 11,113/
17,628 63% 11,873/ 17,628 67%
Non Ec Dis 77,176/ 158,555 49% 82,489/
159,425 52% 87,602/ 159,001 55% 97,986/
157,944 62% 110,266/ 163,615 67%
MESA StatusMESA 830/1,083 77% 908/1,108 82% 955/1,135 84% 957/1,078 89% 652/768 85%
Non MESA 80,176/ 165,067 49% 86,785/
167,832 52% 94,532/ 171,196 55% 108,142/
174,494 62% 121,487/ 180,475 67%
Enrollment and Success in Transfer-Level English and Math in the California Community Colleges SystemThe RP Group | January 2021 | Page 43

Fall 2015 Fall 2016 Fall 2017 Fall 2018 Fall 2019# % # % # % # % # %
Puente Status
Puente 688/1,026 67% 678/1,029 66% 810/1,214 67% 896/1,276 70% 1,093/ 1,310 83%
Non Puente 80,349/ 165,124 49% 87,015/
167,911 52% 94,677/ 171,117 55% 108,203/
174,296 62% 121,046/ 179,933 67%
Umoja Status
Umoja 548/1,147 48% 670/1,376 49% 815/1,528 53% 1,108/ 1,683 60% 1,043/
1,598 65%
Non Umoja 80,458/ 165,003 49% 87,023/
167,564 52% 94,672/ 170,803 55% 108,081/
173,889 62% 121,096/ 179,645 67%
Veteran Status
Veteran 2,870/ 5,286 54% 2,859/
4,933 58% 2,719/ 4,402 62% 2,603/
3,909 67% 2,614/ 3,545 74%
Non Veteran 78,136/ 160,864 49% 84,834/
164,007 52% 92,768/ 167,929 55% 106,496/
171,663 62% 119,525/ 177,698 67%
Enrollment and Success in Transfer-Level English and Math in the California Community Colleges SystemThe RP Group | January 2021 | Page 44
Note: Native American includes Native Alaskan; Pacific Islander includes Native Hawaiian.
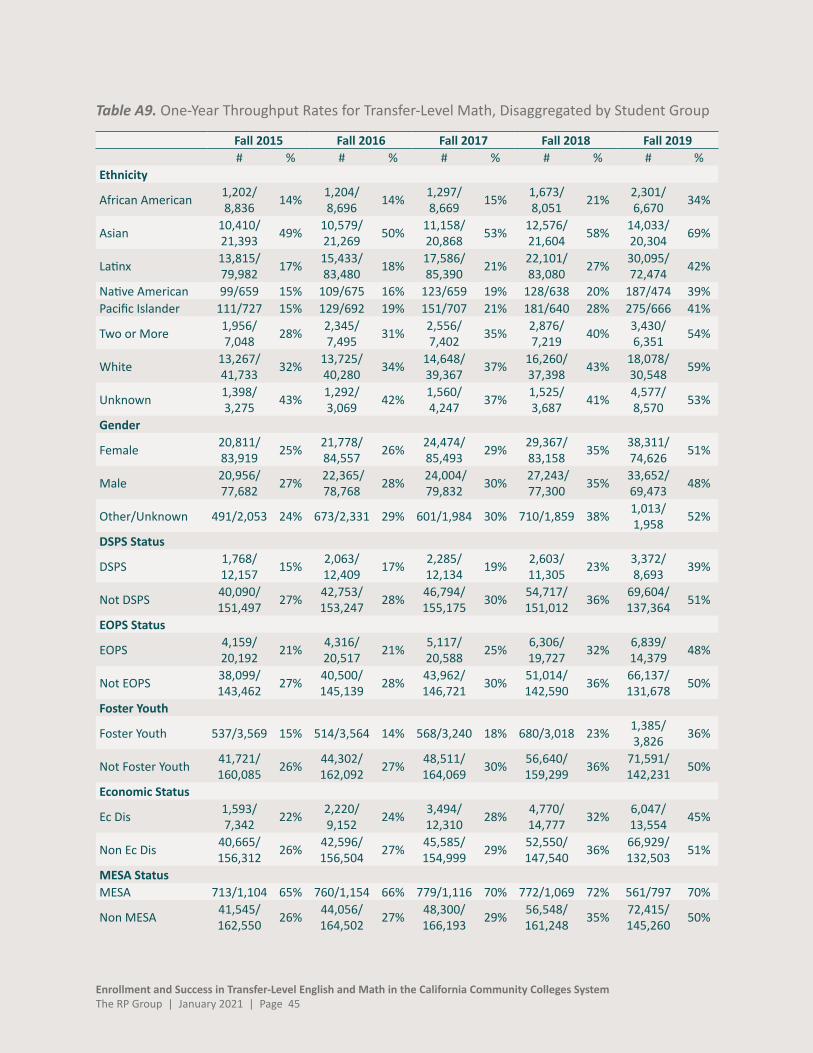
Table A9. One-Year Throughput Rates for Transfer-Level Math, Disaggregated by Student Group
Fall 2015 Fall 2016 Fall 2017 Fall 2018 Fall 2019# % # % # % # % # %
Ethnicity
African American 1,202/ 8,836 14% 1,204/
8,696 14% 1,297/ 8,669 15% 1,673/
8,051 21% 2,301/ 6,670 34%
Asian 10,410/ 21,393 49% 10,579/
21,269 50% 11,158/ 20,868 53% 12,576/
21,604 58% 14,033/ 20,304 69%
Latinx 13,815/ 79,982 17% 15,433/
83,480 18% 17,586/ 85,390 21% 22,101/
83,080 27% 30,095/ 72,474 42%
Native American 99/659 15% 109/675 16% 123/659 19% 128/638 20% 187/474 39%Pacific Islander 111/727 15% 129/692 19% 151/707 21% 181/640 28% 275/666 41%
Two or More 1,956/ 7,048 28% 2,345/
7,495 31% 2,556/ 7,402 35% 2,876/
7,219 40% 3,430/ 6,351 54%
White 13,267/ 41,733 32% 13,725/
40,280 34% 14,648/ 39,367 37% 16,260/
37,398 43% 18,078/ 30,548 59%
Unknown 1,398/ 3,275 43% 1,292/
3,069 42% 1,560/ 4,247 37% 1,525/
3,687 41% 4,577/ 8,570 53%
Gender
Female 20,811/ 83,919 25% 21,778/
84,557 26% 24,474/ 85,493 29% 29,367/
83,158 35% 38,311/ 74,626 51%
Male 20,956/ 77,682 27% 22,365/
78,768 28% 24,004/ 79,832 30% 27,243/
77,300 35% 33,652/ 69,473 48%
Other/Unknown 491/2,053 24% 673/2,331 29% 601/1,984 30% 710/1,859 38% 1,013/ 1,958 52%
DSPS Status
DSPS 1,768/ 12,157 15% 2,063/
12,409 17% 2,285/ 12,134 19% 2,603/
11,305 23% 3,372/ 8,693 39%
Not DSPS 40,090/ 151,497 27% 42,753/
153,247 28% 46,794/ 155,175 30% 54,717/
151,012 36% 69,604/ 137,364 51%
EOPS Status
EOPS 4,159/ 20,192 21% 4,316/
20,517 21% 5,117/ 20,588 25% 6,306/
19,727 32% 6,839/ 14,379 48%
Not EOPS 38,099/ 143,462 27% 40,500/
145,139 28% 43,962/ 146,721 30% 51,014/
142,590 36% 66,137/ 131,678 50%
Foster Youth
Foster Youth 537/3,569 15% 514/3,564 14% 568/3,240 18% 680/3,018 23% 1,385/ 3,826 36%
Not Foster Youth 41,721/ 160,085 26% 44,302/
162,092 27% 48,511/ 164,069 30% 56,640/
159,299 36% 71,591/ 142,231 50%
Economic Status
Ec Dis 1,593/ 7,342 22% 2,220/
9,152 24% 3,494/ 12,310 28% 4,770/
14,777 32% 6,047/ 13,554 45%
Non Ec Dis 40,665/ 156,312 26% 42,596/
156,504 27% 45,585/ 154,999 29% 52,550/
147,540 36% 66,929/ 132,503 51%
MESA StatusMESA 713/1,104 65% 760/1,154 66% 779/1,116 70% 772/1,069 72% 561/797 70%
Non MESA 41,545/ 162,550 26% 44,056/
164,502 27% 48,300/ 166,193 29% 56,548/
161,248 35% 72,415/ 145,260 50%
Enrollment and Success in Transfer-Level English and Math in the California Community Colleges SystemThe RP Group | January 2021 | Page 45

Fall 2015 Fall 2016 Fall 2017 Fall 2018 Fall 2019# % # % # % # % # %
Puente StatusPuente 144/769 19% 169/798 21% 208/904 23% 293/856 34% 399/759 53%
Non Puente 42,114/ 162,885 26% 44,647/
164,858 27% 48,871/ 166,405 29% 57,027/
161,461 35% 72,577/ 145,298 50%
Umoja StatusUmoja 191/1,009 19% 193/1,085 18% 228/1,210 19% 336/1,276 26% 394/957 41%
Non Umoja 42,067/ 162,645 26% 44,623/
164,571 27% 48,851/ 166,099 29% 56,984/
161,041 35% 72,582/ 145,100 50%
Veteran Status
Veteran 1,275/ 5,508 23% 1,188/
4,960 24% 1,211/ 4,433 27% 1,359/
3,971 34% 1,619/ 3,180 51%
Non Veteran 40,983/ 158,146 26% 43,628/
160,696 27% 47,868/ 162,876 29% 55,961/
158,346 35% 71,357/ 142,877 50%
Enrollment and Success in Transfer-Level English and Math in the California Community Colleges SystemThe RP Group | January 2021 | Page 46
Note: Native American includes Native Alaskan; Pacific Islander includes Native Hawaiian.

Table A10. One-Year Throughput Rates for Transfer-Level English by Cohort and Starting Level
Term and Starting Level Successful Completers within One Year Total Students One-Year
Throughput RateFall 2019 Cohort 122,139 181,243 67% Starting at transfer-level 120,021 172,367 70% Starting 1 level below 1,813 7,142 25% Starting 2+ levels below 305 1,734 18%Fall 2018 Cohort 109,009 175,572 62% Starting at transfer-level 93,918 125,423 75% Starting 1 level below 12,897 37,372 35% Starting 2+ levels below 2,284 12,777 18%Fall 2017 Cohort 95,487 172,331 55% Starting at transfer-level 73,764 96,582 76% Starting 1 level below 18,901 50,477 37% Starting 2+ levels below 2,822 25,272 11%Fall 2016 Cohort 87,693 168,940 52% Starting at transfer-level 62,638 81,441 77% Starting 1 level below 22,216 56,372 39% Starting 2+ levels below 2,839 31,127 9%Fall 2015 Cohort 81,006 166,150 49% Starting at transfer-level 56,046 72,788 77% Starting 1 level below 21,969 56,683 39% Starting 2+ levels below 2,991 36,679 8%
Enrollment and Success in Transfer-Level English and Math in the California Community Colleges SystemThe RP Group | January 2021 | Page 47

Table A11. One-Year Throughput Rates for All Transfer-Level Math by Cohort and Starting Level
Term and Starting Level Successful Completers within One Year Total Students One-Year
Throughput RateFall 2019 Cohort 72,976 146,057 50% Starting at transfer-level 69,131 115,735 60% Starting 1 level below 3,526 24,525 14% Starting 2+ levels below 319 5,686 6%Fall 2018 Cohort 57,370 162,317 35% Starting at transfer-level 46,938 69,487 68% Starting 1 level below 8,737 45,490 19% Starting 2+ levels below 1,645 47,340 3%Fall 2017 Cohort 49,079 167,309 29% Starting at transfer-level 37,906 53,998 70% Starting 1 level below 9,837 44,886 22% Starting 2+ levels below 1,336 68,425 2%Fall 2016 Cohort 44,816 165,656 27% Starting at transfer-level 33,692 46,434 73% Starting 1 level below 9,842 44,141 22% Starting 2+ levels below 1,282 75,081 2%Fall 2015 Cohort 42,258 163,654 26% Starting at transfer-level 31,217 42,734 73% Starting 1 level below 9,669 42,654 23% Starting 2+ levels below 1,372 78,266 2%
Note: Throughput rates are not disaggregated by SLAM and B-STEM due to the inability to identify the starting course for math students without knowing their program of study, which is not available in the data file provided.
Enrollment and Success in Transfer-Level English and Math in the California Community Colleges SystemThe RP Group | January 2021 | Page 48