Abstract Raising school enrollment, like economic ...
78
W ORKING P APER N UMBER 37 M ARCH 2004 The Long Walk to School: International education goals in historical perspective By Michael A. Clemens Abstract Raising school enrollment, like economic development in general, takes a long time. This is partly because, as a mountain of empirical evidence now shows, economic conditions and slowly- changing parental education levels determine children’s school enrollment to a greater degree than education policy interventions. A succession of international meetings has nevertheless adopted a litany of utopian international goals for universal school enrollment and gender parity in education based on the idea that a correct education policy backed by sufficient cash could achieve the goals in short order. The latest of these, the Millennium Development Goals, call for universal primary schooling and full gender parity by 2015. This work quantifies how long it has taken countries rich and poo make the transition towards high enrollments and gender parity. There are three central lessons. First, there is a remarkable uniformity of experience in the rates of enrollment increases, a reality from which the various rounds of goals appear entirely detached. Second, many countries that have not raised enrollments fast enough to meet the goals have in fact raised enrollments extraordinarily rapidly b historical standards and deserve celebration rather than condemnation. The very few poor countries that have raised enrollment figures at the rates envisioned by the goals have done so in many cases by accepting dramatic declines in scho quality, failing large numbers of students, or other practices that cast doubt on sustainability or exportability of their techniques. Third, aid-supported education policies can help within limits, and their performance should be judged in the context of country-specific, historically-grounded goals. But a country’s broader development strategy outside the classroom matters much more t r to y oling the han education olicy. p
-
Upload
khangminh22 -
Category
Documents
-
view
0 -
download
0
Transcript of Abstract Raising school enrollment, like economic ...

W O R K I N G P A P E R N U M B E R 3 7 M A R C H 2 0 0 4
The Long Walk to School: International education goals
in historical perspective
By Michael A. Clemens
Raising school enrollment, like econotime. This is partly because, as a moueconomic conditions and slowly- chachildren’s school enrollment to a greainterventions. A succession of internalitany of utopian international goals foparity in education based on the idesufficient cash could achieve the goMillennium Development Goals, call parity by 2015. This work quantifies homake the transition towards high enrocentral lessons. First, there is a remarkenrollment increases, a reality from wentirely detached. Second, many coenough to meet the goals have in fahistorical standards and deserve celefew poor countries that have raised ethe goals have done so in many casequality, failing large numbers of studesustainability or exportability of their tpolicies can help within limits, and thecontext of country-specific, historicaldevelopment strategy outside the cla
olicy. p
Abstract
mic development in general, takes a long ntain of empirical evidence now shows, nging parental education levels determine ter degree than education policy
tional meetings has nevertheless adopted a r universal school enrollment and gender
a that a correct education policy backed by als in short order. The latest of these, the for universal primary schooling and full genderw long it has taken countries rich and poollments and gender parity. There are three
able uniformity of experience in the rates of hich the various rounds of goals appear untries that have not raised enrollments fastct raised enrollments extraordinarily rapidly bbration rather than condemnation. The very nrollment figures at the rates envisioned by s by accepting dramatic declines in schonts, or other practices that cast doubt on
echniques. Third, aid-supported education ir performance should be judged in the
ly-grounded goals. But a country’s broader ssroom matters much more t
r to
y
olingthe
han education

The Long Walk to School:
International education goals in historical perspective
Michael A. Clemens�
Center for Global Development
March 2004
Abstract
Raising school enrollment, like economic development in general, takes a long time. This ispartly because, as a mountain of empirical evidence now shows, economic conditions and slowly-changing parental education levels determine children�s school enrollment to a greater degreethan education policy interventions. A succession of international meetings has neverthelessadopted a litany of utopian international goals for universal school enrollment and gender parityin education based on the idea that a correct education policy backed by su¢ cient cash couldachieve the goals in short order. The latest of these, the Millennium Development Goals, callfor universal primary schooling and full gender parity by 2015. This work quanti�es how long ithas taken countries rich and poor to make the transition towards high enrollments and genderparity. There are three central lessons. First, there is a remarkable uniformity of experience inthe rates of enrollment increases, a reality from which which the various rounds of goals appearentirely detached. Second, many countries that have not raised enrollments fast enough to meetthe goals have in fact raised enrollments extraordinarily rapidly by historical standards anddeserve celebration rather than condemnation. The very few poor countries that have raisedenrollment �gures at the rates envisioned by the goals have done so in many cases by acceptingdramatic declines in schooling quality, failing large numbers of students, or other practicesthat cast doubt on the sustainability or exportability of their techniques. Third, aid-supportededucation policies can help within limits, and their performance should be judged in the contextof country-speci�c, historically-grounded goals. But a country�s broader development strategyoutside the classroom matters much more than education policy.
�Correspondence to [email protected]. JEL No. I21, I28, N30, O19. This research was originally carriedout under the auspices of the United Nations Millennium Project Task Force on Education and Gender Equality.Prarthna Dayal and Sabeen Hassanali provided excellent research assistance. The author is particularly grateful toLant Pritchett and Steven Radelet for detailed comments. Nancy Birdsall, David Bloom, Sara Brandspigel, MaríaEugenia Bonilla, Jesse Bump, William Cline, Joel Cohen, Daniel Devroye, Charles Kenny, Ruth Levine, Todd Moss,and participants in the American Academy of Arts and Science�s Universal Basic and Secondary Education projecto¤ered helpful suggestions, but all errors belong to the author.
1

�Development is long; logic, short.�
� David Landes, The Wealth and Poverty of Nations, p. 315.
1 Introduction
Roughly once every two decades since the Second World War, an international gathering of poli-
cymakers has solemnly promised to achieve universal primary education in developing countries by
about twenty years thereafter. They succeeded in that their promises spurred public action; they
failed in that their stated quantitative goals were never achieved. In 2000, the largest-ever gathering
of heads of state adopted a new set of goals including universal primary school completion and full
gender parity in education by 2015. Like the earlier pledges, these new Millennium Development
Goals for education will not be met. Many will ascribe the outcome� as others have when past
deadlines came and went� to lack of funding or �political will�. Perhaps, instead, unmet policy goals
re�ect the limited impact of supply interventions in education. The record of developing countries�
progress on education attainment is now long and impressive. Many developing countries whose
educational attainment might be judged unfavorably by the litany of development goals should be
judged favorably by history.
To what degree can education policy control the outcomes pledged by education goals? Everyone
recognizes that education can create positive externalities: others may bene�t from the resulting
human (and social) capital. But families and individuals invest in education only insofar as the pri-
vate bene�t from doing so exceeds the private cost. They stop investing when the cost is prohibitive,
or when the bene�t is insu¢ cient. If governments are interested in increasing schooling levels for
any reason� altruism, tax receipts from skilled workers, political indoctrination, populist handouts
or what have you� what can they do to promote it? They can, and do, reduce the private cost
of parents�investment in their children�s education� by subsidizing demand, say, or by increasing
the available supply. But even signi�cant reductions in cost may have only limited e¤ects on the
level of investment if the private expected bene�t of education remains relatively low. This private
bene�t depends in large part on expectations of �rms�demand for skilled labor, which is hard for
governments to control. In short, the demand for educated workers is limited in some measure by
the pace of economic development. With limited demand, governments can lead their young people
to the fountain of education, but cannot make them drink.
2

If educational decisions are based in part on the private returns to education, and those returns
depend in any way on the educational decisions of others, then there can be poverty traps. Low
levels of education beget low levels of education, and high levels beget high levels. Countries can
make a transition from one group to the other provided that other factors change� private returns
change as the economy changes (demand), or the government interacts with students in a di¤erent
way (supply). Can we see such a transition in the data? Is there a typical transition for most
developing countries? How long does it take, and to what degree can governments accelerate it?
2 Education policy is not the main constraint
2.1 The traditional view: Schooling causes higher income
Support for public �nance of education has a venerable tradition in economics. Adam Smith (1904
[1776], V.1.182) advocated public �nance of basic education, and Alfred Marshall (1920, I.IV.28)
wrote that economists �with one consent� consider such spending �a true economy, and that to
refuse it is both wrong and bad business from a national point of view.�At the same time, they
have long held that the decision to invest in education depends on its return. Smith made the
parallel between education and investing in �expensive machines� (1904 [1776], I.10.9), and Jean-
Baptiste Say (1855 [1803], II.VII.15) stated explicity, �Education is capital which ought to yield
interest.�This return obviously depends on the economic context, so for centuries there has been a
dilemma: externalities justify public intervention, but the return to education and thus the proper
extent of intervention� in the presence of competing demands for public money� depends on the
surrounding economy. When Great Britain was relatively poor and uneducated, John Stuart Mill
(1848, II.13.13) recognized these opposing forces. He wrote, �Education is not compatible with
extreme poverty. ... [Educational] improvement in ... the mass of unskilled day-labourers will be
di¢ cult and tardy, unless means can be contrived of raising the entire body to a state of tolerable
comfort, and maintaining them in it until a new generation grows up.�
We have no shortage of arguments that schooling children produces an educated workforce and
thereby increases national productivity and income. Obviously it is true that educating children
eventually produces more educated adults, and many economists have suggested that this type of
investment raises incomes in developing countries more than in others. This literature, typi�ed by
Colclough (1982), is large, well-known, and backed by Nobel prize-winning research (Schultz 1989).
3

It need not be summarized here, but studies making this point continue to emerge. For example,
McMahon (1998) argues that human capital investment has caused economic growth in East Asia,
and Appleton (2000) �nds that a year of education is associated with a 3-14% increase in wages
and productivity in Sub-Saharan Africa. Lin (2003) �nds that rising education rates are positively
correlated with growth in Taiwan since 1960. There are many others.
2.2 But income and parental education can cause schooling
There is also a large and growing literature suggesting that there is a complementary path of cau-
sation running in reverse: from family income to child schooling, and from adult education levels to
child schooling. The idea goes back at least to Harbison and Myers (1965), who call education �both
the seed and the �ower of economic development,�and surely earlier. Since most of these studies
were designed to measure policy impact, they include includes variables representing school quality
or availability, such as distance to school, as determinants of outcomes like school enrollment. While
often statistically signi�cant, they are nowhere near as economically signi�cant as household income
and parental education in explaining the variance of schooling choices in the large majority of these
studies. There are micro and macro strands to this literature. It is worthwhile to review both in
detail in order to appreciate the magnitude of the evidence.
Starting many years ago, micro-level country studies have shown again and again that household
income and parental education are fundamental determinants of parents�schooling choices for their
children. Behrman (1987) argues that World Bank studies of the 1980s overestimated the positive
impact of schooling in less developed countries (LDCs) by ignoring reverse causation from income
to educational attainment. Psacharopoulos and Arriagada (1989) �nd that household income and
parental education are major determinants of schooling attainment in Brazil. Lavy (1996, Table 2)
reports that household income and parental education levels explain much more of the variance in
entry of young children into the primary education system in Ghana than do distance to school,
school fees, or teacher education. Burney and Irfan (1995) �nd that after controlling for parents�
income and education, the presence of a school has no signi�cant e¤ect on their decisions regarding
enrollment of their children in Pakistan. �This suggests,� they conclude, �that a solution to low
literacy in the developing countries does not depend solely on an expansion in educational facil-
ities.� In Ghana, Canagarajah and Coulombe (1997) �nd that households with low incomes and
low levels of parental education are much less likely to send their children to school rather than
4

employing them as child laborers, even after controlling for the (relatively weak) e¤ects of distance
to school and public schooling expenditure. Bredie and Beeharry (1998) review micro evidence from
Côte d�Ivoire, Tanzania, and Madagascar and question whether school availability and quality have
anywhere near the impact on changes in enrollment due to changes in incomes and employment op-
portunities. Filmer and Pritchett (1998) �nd that the e¤ect of household wealth on primary school
attainment is large and negative, though it varies greatly across countries. Binder (1999) �nds that
economic stagnation in Mexico in the 1980s translated directly into stagnation in the expansion of
school enrollments. Holmes (1999) �nds that after controlling for wage levels, the distance to a pri-
mary school does not signi�cantly a¤ect the years of school attainment among children in Pakistani
villages.
The evidence continues to accumulate in more recent work. Siphambe (2000) �nds that rates
of return to education have been rising in Botswana generally, but that education is not income-
equalizing� consistent with causation from development to schooling. Shapiro and Tambashe (2001)
�nd that the major determinants of primary enrollment among children in Kinshasa are economic
well-being of the household and family structure. Brown and Park (2002) �nd that the major
determinant of whether or not rural Chinese children enrolled in primary school drop out is the
poverty of their household, overshadowing the e¤ects of education expenditures and measures of
school quality. Tansel (2002) �nds that the major determinants of primary school enrollment in
Turkey are household income and parents�education. Edmonds (2003) �nds that 80% of declines in
child labor in Vietnam during the 1990s were due to increases in households�per capita expenditure.
Sawada (2003) �nds that negative shocks to income cause families to pull their children out of school
in Pakistan. Cogneau (2003) �nds that former British colonies in Africa exhibited signi�cantly higher
educational attainment in 1960 than French colonies, but that �the education di¤erential did not give
rise to either income per capita or life expectancy di¤erentials�between the two groups in subsequent
years. Filmer�s (2003) systematic analysis of household data from 21 developing countries �nds that
while distance-to-school is often a statistically signi�cant determinant of enrollment, the magnitude
of the e¤ect is small. Halving the distance to school in rural Chad, for example� which would
certainly require large investments in infrastructure� would only increase enrollments by less than
�ve percent; for the other 20 countries the e¤ect is even smaller.
We intentionally do not dwell here on the reasons underlying these �ndings. It could be that
household income signals insertion of that household into a social network that commands economic
5

opportunities others do not, as one example of various explanations, and it could be that parents�
education makes them raise infants in a way that makes those children get more out of school. But
it is not important for the present purpose why parental income and schooling matter, only that
they do matter and that they are largely inaccessible to change by youth education policies in the
short run. Of course, countervailing studies do exist; not all micro research agrees that household
income explains more of the variance in enrollment decisions than do variables measuring access
to quality-adjusted schooling services in all circumstances. Handa (2002) �nds that building more
schools would have a much larger impact on school enrollments in Mozambique in 1996/7 than would
raising the incomes of household heads, a result perhaps to be expected in a country where a quarter
century of armed con�ict had brought about the destruction or abandonment of many buildings.
On the macro side, numerous studies question causation of rising income by rising education.
Behrman (1987) and Schultz (1988) and more recently Ram (1999) use cross-country evidence to
argue that demand for education rises with income per capita. Krueger and Lindahl (2000) argue
that increases in educational attainment are indeed positively associated with economic growth, but
note that in cross-country studies the direction of causation is di¢ cult to isolate. Mankiw (1997,
pp. 103-6) calls the assumption of exogenous education the �weak link� of the empirical growth
literature. Bils and Klenow (2000) conclude that �the evidence favors a dominant role for the
reverse channel from growth to schooling.�Benhabib and Spiegel (2000) �nd that �nancial sector
development positively impacts human capital investment. Consistent with causation of schooling
by growth, Pritchett�s (2003) authoritative review of the macro evidence concludes, �Do di¤erences
in the evolution and dynamics of schooling help explain the big facts about output growth? Largely,
no.�
2.3 Policy matters, but not nearly as much
Evaluations of speci�c education policy interventions likewise suggest that these are not the primary
determinants of enrollment. De Gregorio (1996) �nds that education expenditure is not a signi�cant
determinant of school enrollment in LDCs after controlling for the development of national private
�nancial markets. Ablo and Reinikka (1998, p. 30) �nd that a large fraction of the �nance for
rising enrollments in Uganda in the early 1990s came from parental contributions despite rising
budget outlays, observe that a small fraction of non-salary education budget increases actually
reached schools, and conclude that �budget allocations may not matter when institutions or their
6

popular control are weak.�The cross-country data of Papagni (2002) �nds that family income a¤ects
enrollment decisions much more than public �nance of education. Universal primary education has
been the policy of the Pakistani government since 1955, but the fraction of its budget allocation for
basic education going unspent was 50% in the 1970s and 20% in the 1990s, despite the fact that one
third of primary school age children were not enrolled in 2000. This re�ects a complex interaction
of employer practices, societal expectations, economic forces, government policies, and so on (World
Bank 1997). An experiment giving performance incentives linked to student test scores for teachers
in Kenya increased students�test scores in the short run, but �[t]eacher attendance did not improve,
homework assignment did not increase, and pedagogy did not change,�and rather than e¤ecting a
lasting increase in education quality, �teachers focused on manipulating short-run scores�(Glewwe
et al. 2003). Das et al. (2003) �nd that anticipated increases in public spending on education in
Zambia were ine¤ective in increasing student test scores as it substituted one-to-one for parental
schooling expenditures. Taiwan introduced compulsory junior high school in 1968, but �roughly
�ve out of six students receiving publicly funded JHS education just after the reform would have
received that schooling anyway�(Spohr 2003).
Certainly, careful studies have documented numerous instances in which directing massive capital
spending to education infrastructure has improved not only school enrollment but lifetime wages�
such as the work of Du�o (2001) on Indonesia. But this does not tell us the relative impact of
economic conditions and schooling investments. Can we know what the impact of those invest-
ments on lifetime wages, and therefore the incentive to enroll, would have been had Indonesia not
experienced relative political stability and outstanding economic performance during the 1970s and
1980s?
The evidence visited in the sections that follow strongly suggests that while country characteris-
tics strongly a¤ect the timing of the beginning of an ascent to high schooling rates, these character-
istics have only a limited e¤ect on the rate at which that ascent proceeds over the long term. This
does not at all imply that policy does not matter� unquestionaly it does� but it does suggest that
policy cannot compete with other, more important determinants of the long-term rate of change.
Among those characteristics, development of the economy and slow accumulation of a stock of edu-
cated adults appear to make the most di¤erence. Controlling for these and other country traits that
change slowly or not at all in response to education policy, the impact of policy on the rate of tran-
sition to high levels of schooling is in fact di¢ cult to discern. Chenery and Syrquin (1975) started
7

a large literature, continued recently by Branson et al. (1998) among many others, by pointing out
that certain patterns of structural change in developing countries have been repeated over and over
in very di¤erent cultural, geographic, and institutional contexts. The transition to high schooling
rates appears to be yet another of these. It cannot be emphasized too strongly that this paper
does not claim that there is a single path necessarily followed by all economic development� the
view embodied by the theories of Karl Marx as well as by their capitalist-friendly but equally de-
terministic antithesis, Walt Rostow�s �stages of economic growth�. On the contrary, there has been
an extraordinary diversity of approaches to education policy and of rates of change in educational
attainment. All of this diversity has, however, been con�ned within a remarkably narrow range of
experience in the transition from low to high enrollments. Ambitious education policymakers ignore
this uniformity at their peril. The surprisingly rigid constraints on this transition have applied not
only to today�s developing countries but also to today�s rich countries in the course of their long-term
development.
3 Development goals: try, try again
3.1 A trail of missed targets
International meetings have declared a series of pharaonic development goals for education since
World War II, about once every 20 years, each time pledging universal primary schooling in poor
countries by 10 to 20 years thence (Table 1). These earnest proclamations have emerged from
the belief that educational attainment is mostly supply-constrained. The ministers of education
who gathered in the early 1960s to pledge universal primary education by 1980 certainly believed
that reaching this goal depended mainly on their commitment and on su¢ cient funding. The head
of UNESCO celebrated that �for the �rst time, educators at the highest level in their respective
countries made joint proposals to the governments of a vast region; proposals de�nite both in quantity
and quality, [to be] realized within a de�nite time limit� (UNESCO 1962, p. 45). Participants at
the meetings lamented their �shameful complacence� and hoped their new commitment would be
fueled by �endless resources unleashed by disarmament to educational development�(Guruge 1986,
p.20). They felt the bite of Dwight Eisenhower�s resounding �Shame on the world! Shame on its
leaders!�at the 1967 International Conference on the World Crisis in Education. The chairman of
that conference estimated that $15 billion would largely resolve the education crisis. The 1950s and
8

1960s saw multiple proposals for an �International Educational Development Fund�� later named
the International Fund for Education, Science, and Culture� similar in some respects to today�s
proposals for an omnibus �Education for All�Fast Track Initiative fund. After years of negotiations,
the fund was never created.
Ten years on, when it became clear that the goals would not be reached, the reaction was to
cite insu¢ cient political will� justifying a new, more solemn round of goals for the year 2000�
and insu¢ cient funding. After all, �[w]here could international aid in the amount of thousands of
millions of dollars over ten years be found?� (Eteki-Mboumoua 1972, p. 161). When even this
new round of education goals went unmet, blame fell once again to the unwillingness of national
leaders to �rethink�and �transform�traditional approaches to education, and to the unwillingness
of donors to provide �substantial, long-term resources�to fund education (Torres 2000, pp. 24, 48).
A separate but related succession of goals for gender parity in education, summarized in Table 2,
has followed a very similar pattern.
3.2 The latest avatar
A third wave of targets, the Millennium Development Goals, followed. The largest-ever gathering of
heads of state in New York City in 2000 unanimously resolved �by the year 2015 ... [t]o ensure that ...
children everywhere, boys and girls alike, will be able to complete a full course of primary schooling
and that girls and boys will have equal access to all levels of education� (UN doc. A/RES/55/2).
Achieving these new goals is unquestioningly taken to be a matter of �getting serious�(World Bank
2002a), to be understood as a combination of ��nancial assistance� from donors and �political
commitment�from developing-country leaders (Devarajan et al. 2002).
In spite of all the evidence that enrollment outcomes depend on much, much more than education
policy and expenditures, discussion of the Millennium Development Goals for education centers
almost exclusively on public �nance of education as the prime determinant of raising enrollment
and completion rates. Devarajan et al. (2002) take the average cost of educating a primary school
student in developing countries ($111) and multiply it by the number of children not in school to get
a �cost�of meeting the second MDG ($11.4 billion). While they admit that ��nancial assistance is
but one of the factors required to reach these goals,�their prime examples of other necessary factors
are �country-level policies�and �political commitment.�Likewise, Mingat et al. (2002) meticulously
calculate the �cost�of achieving universal education in 33 African countries by, in essence, multiplying
9

the number of children to be educated by the unit cost of doing so. An equivalent approach is
taken by Colclough and Al-Samarrai (2000), who likewise simply de�ne the outcome of educational
enrollment to be proportional to spending inputs, as if households engage in no decision process
whatsoever, and proceed to calculate the cost of expanding enrollments. Delamonica et al. (2001)
add their voices to the chorus of those who multiply unit costs by the number of children out of
school, arriving at roughly $9 billion in additional annual spending required. This view of the world
is not entirely without empirical support, such as the work of Haddad et al. (1990), who list the
number one constraint to educational expansion in the lowest income countries as lack of �nancial
resources, and Bose et al. (2003), who �nd that government expenditure on education is a strong
determinant of growth. But it goes against the large majority of empirical �ndings.
We have seen these costing exercises before. Experts built complex, assiduous models of exactly
how many billions in public �nancing for education would be necessary to meet the �cost�of the
1960 Karachi goals (UNESCO 1966). Their projections of attainment sprung from a complex but
mechanistic model whose dynamics were determined by initial stocks, assumptions on the course
of demographic change and student retention, stocks and �ows in the pool of trained teachers and
school buildings, and other �supply-side�factors. The study predicted that gross primary enrollment
in Afghanistan, Nepal and Laos would rise from 22% to 53% by 1980; in Burma, Cambodia, India,
Indonesia, Iran, Mongolia, Pakistan and Vietnam it would rise from 68% to 100%; and in Ceylon,
China, Korea, Malaysia, the Philippines, Singapore and Thailand it would rise from 101% to 105%
(ibid., Table 19, p. 55). The additional education expenditures required for this expansion in the
three groups, respectively, estimated at $35 million, $1.67 billion, and $552 million, for a regional
total of $2.26 billion in additional expenditures (ibid., Table 25, pp. 66-73). Depending on whether
regional growth averaged 4% or 6% during 1964-1980, this amounted to an expansion in spending on
education as a percent of regional GDP from either 3.4% or 3.7% in 1964 to either 4.2% or 6.2% in
1980 (ibid., Table 26, p. 74). In�ating those �gures to today�s dollars, they are roughly comparable
with today�s estimates of the �cost�of meeting the education goals for Asia and the rest of the world.
The message has been the same for decades: if rich countries would only have the virtue to render
several billion in public money each year, and nearly all children everywhere will be in school about
15 years down the road.
10

3.3 Why do they do it?
The view that su¢ cient cash plus �political will�can achieve the goals remains �rmly entrenched in
policy arenas like the 2000 World Education Forum in Dakar, where �it was agreed that no country
seriously committed to education for all will be thwarted by a lack of resources� (UNESCO 2002,
p. 20). Already, a new round of incriminations and recriminations have begun. Again, developing
countries lament the lack of public �nance while developed countries decry a lack of �commitment�on
the part of the developing world. While the US is channelling most of its new bilateral foreign aid to
a restricted list of countries that meet criteria including �investing in people�� implying that most
do not� non-governmental organizations lament the �broken promises�of funding for Education for
All (Oxfam 2002; Global Campaign for Education 2003). All this is by now a classic tale.
Why has the international community not tired of this cycle, and instead has signed on for another
round? Perhaps the least plausible explanation is that policymakers simply do not understand the
determinants of education, and have simply not seen the evidence that two-way causation between
education and economic development places constraints on the impact of policy interventions in
the short run. A second and better explanation is that making lofty commitments is the optimal
strategy for governments of rich and of poor countries when neither is accountable to the other. Rich-
country governments satisfy their constituents by promising aid contingent on developing-country
�commitment�, knowing that they will either be out of o¢ ce when the promises are called in or
they will have abundant examples of �uncommitted�dictatorships and basketcases. Poor-country
governments ask for massive aid �ows in exchange for the promise of universal schooling, knowing
that only a fraction of the aid is likely to arrive, which in turn provides a reliable explanation
for limited or low-quality schooling. A third explanation is that neither rich nor poor country
governments are interested in creating human capital at all, and use the development goal cycle to
conceal their true aims from voters. These aims might include, for rich countries, rewarding ally
governments with aid unlikely to be used in its entirety for schooling; for poor countries, they might
include using educational structures to reward loyal elites or provide only su¢ cient schooling to
indoctrinate youth with the basic tools of nationalism. The present investigation makes no claim
whatsoever about which of these models, or another that has not been mentioned, is correct. The
only point of interest for present purposes is that the cycle of development goals may have continued
for decades for reasons entirely detached from the relationship of its promises and targets to the true
11

determinants of the past century�s epochal changes in schooling rates.
3.4 Meanwhile, enrollments skyrocket
Those changes in enrollments have indeed been staggering and heartening. The sections that follow
document massive increases in school enrollments among developing countries over the last few
decades, a revolution that continues to occur at rates much, much faster than it occurred in what
are today�s rich countries during their own development process. Goals have come and gone, and
failure has been repeatedly declared, just as developing countries have been moving hundreds of
millions of children into the classroom at collectively unprecedented speed.
This realization should make us suspicious of the policy implications of the inevitable �failure�of
many countries to meet the latest round of goals. It should not, however, condemn the very existence
of any sort of development goal. Certainly we cannot know what would have happened to enrollments
in the absence of the repeated sound and fury over ambitious goals, and it could be that they helped
galvanize into action a system that in their absence would have schooled fewer children worldwide.
But it might rightly condemn the existence of homogeneous, contextless, universal, extraordinarily
ambitious goals. How could a goal that at least has a slim possibility of being reached be less
galvanizing than one that does not?
The following sections visit the evidence we have on how rapidly countries from 1865 to 2000 have
been able to approach universal primary enrollment and gender parity. The results suggest that this
speed is determined by forces largely exogenous to variations in policy and within limits irrelevant
to the ambitious goals we have seen again and again. Extrapolating from the patterns in Tables 1
and 2, sometime in the next �ve years we will declare the latest education goals unreachable, lament
poor countries� lack of political will and rich countries� lack of funding, and create another set of
goals for 2030. Meanwhile, enrollments will continue to soar.
4 How fast can enrollments increase?
Here we do not fashion a model of human capital investment but rather inquire about the empirical
implications of a model standard in the literature. Parents have their children complete primary
school if the present value of the consequent lifetime wage increment exceeds the combined value of
12

foregone labor and of direct schooling costs.1 That is, children complete primary school if
R ���
r� 1�w � c > 0, (1)
where R is the log present value of the net return to completing primary school, w is log wages
without primary schooling, c is the log of direct costs of attending primary school such as fees paid
or distance traveled, � is the increment in the value of the child�s labor due to a complete primary
education, and r is the return on the parents�best alternative investment.
Development goals for education are often framed in terms of fractions of the relevant pop-
ulation, so any model of progress toward the goals must admit heterogenous children. Suppose
that w and c are independent and logistically distributed in the population of a given coun-
try.2 That is, the returns to and costs of education are distributed across the population, for
reasons of natural and nurtured ability, placement in social networks (Borjas 1995), geographi-
cal location (Bénabou 1996), or others. Assuming w � L (�w; �w) and c � L (�c; �c), we have
R � L ((�=r � 1)�w � �c; j(�=r � 1)�w � �cj) � L (�R; �R). Finally, let FR represent the cumula-
tive distribution function of R.
An education minister seeking to induce more children to complete primary school must use
policy to alter the distribution of R, by changing the timepath of �R or �R or both. Average return
�R evolves as _�R = (�=r � 1) _�w ���=r2
�_r + (�w=r)
_� � _�c, where a superscript dot represents the
derivative with respect to time. It is immediately apparent that all of these variables are at least
partially beyond the control of the education minister, and some are totally beyond his or her control.
Enforced restrictions on child labor or improvements in teacher training could a¤ect _�, but so could
exogenous technological change. Building schools, abolishing fees, or enforcing truancy laws could
a¤ect _�c, but so could urbanization, improvements to transportation infrastructure, and cultural
change. Finally, _�w and _r are certainly beyond the control of the education minister. Following a
very similar argument for �R, it is convenient to de�ne
_�R �:��R +
:
�R and _�R �:��R +
:
�R, (2)
1They invest in their children�s schooling according to a simple version of the standard human capital modeldeveloped in Becker (1964) and Mincer (1974) among others, based on Mincer (1958) and Schultz (1961), and surveyedin Harmon, Oosterbeek and Walker (2003).
2These can be thought of as normally distributed. The cumulative distribution function of the normal distributionhas no closed-form solution, so it is simply more convenient to model these variables with the logistic distributionL (�; �), whose small deviation from the normal is here immaterial.
13
where a superscript bar (:��R;
:��R) suggests that the variable is taken as given by an education pol-
icymaker, and a �hat� (:
�R;:
�R) suggests that that variable could be in�uenced by an education
policymaker.3
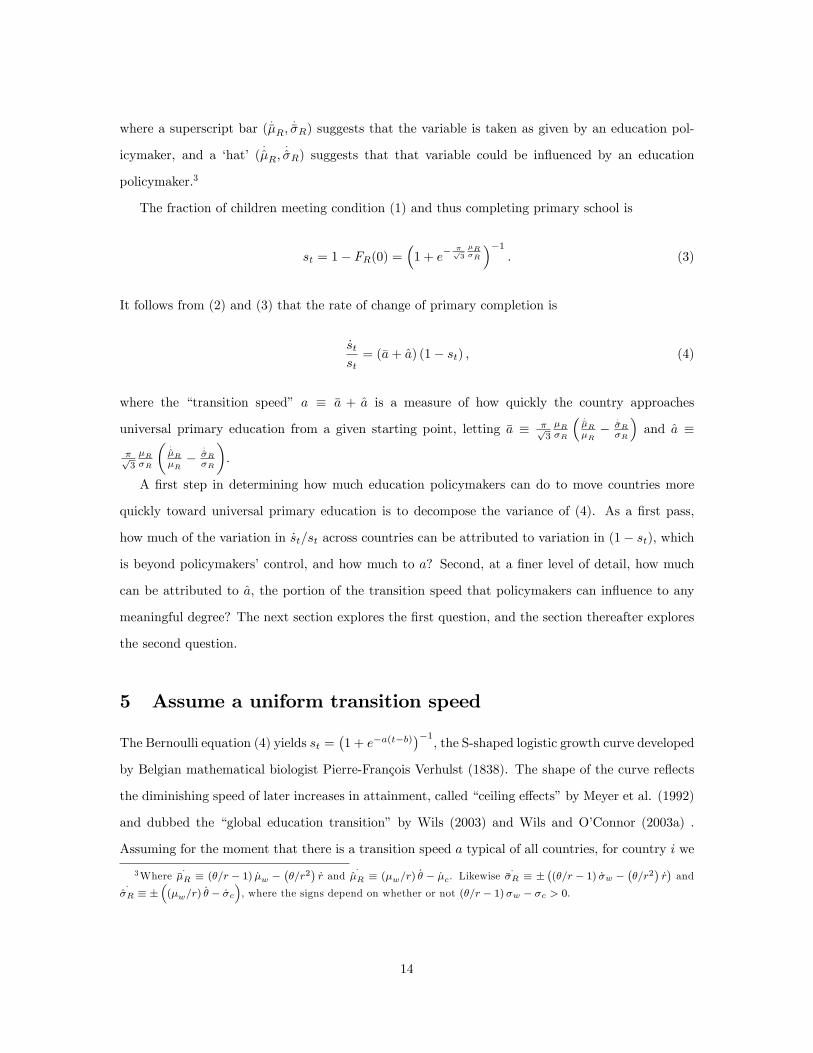
The fraction of children meeting condition (1) and thus completing primary school is
st = 1� FR(0) =�1 + e
� �p3
�R�R
��1. (3)
It follows from (2) and (3) that the rate of change of primary completion is
_stst= (�a+ a) (1� st) , (4)
where the �transition speed� a � �a + a is a measure of how quickly the country approaches
universal primary education from a given starting point, letting �a � �p3
�R�R
� :��R�R�
:��R�R
�and a �
�p3
�R�R
�:
�R�R�
:
�R�R
�.
A �rst step in determining how much education policymakers can do to move countries more
quickly toward universal primary education is to decompose the variance of (4). As a �rst pass,
how much of the variation in _st=st across countries can be attributed to variation in (1� st), which
is beyond policymakers�control, and how much to a? Second, at a �ner level of detail, how much
can be attributed to a, the portion of the transition speed that policymakers can in�uence to any
meaningful degree? The next section explores the �rst question, and the section thereafter explores
the second question.
5 Assume a uniform transition speed
The Bernoulli equation (4) yields st =�1 + e�a(t�b)
��1, the S-shaped logistic growth curve developed
by Belgian mathematical biologist Pierre-François Verhulst (1838). The shape of the curve re�ects
the diminishing speed of later increases in attainment, called �ceiling e¤ects�by Meyer et al. (1992)
and dubbed the �global education transition� by Wils (2003) and Wils and O�Connor (2003a) .
Assuming for the moment that there is a transition speed a typical of all countries, for country i we
3Where:��R � (�=r � 1) _�w �
��=r2
�_r and
:�R � (�w=r)
_� � _�c. Likewise:��R � �
�(�=r � 1) _�w �
��=r2
�_r�and
:�R � �
�(�w=r)
_� � _�c�, where the signs depend on whether or not (�=r � 1)�w � �c > 0.
14

have
� ln�1
si;t� 1�= at� abi. (5)
5.1 The typical transition speed, 1960-2000
Table 3 summarizes the variables in the database. Table 4 presents the results of regressions based
on equation (5), using net primary enrollment as s. The analysis includes only those countries for
which at least two observations over time are available.
The analysis demands that we account in some way for countries that report net enrollment over
100%� a measurement error arising from inappropriate counting of children held back or from the
fact that it is easier to count children in school in than children in the whole population by age
group. In equation (5), those observations are censored since the logarithm of a negative number
is unde�ned. We can either ignore this issue, as in column (1) of Table 3, analyze only those
countries that never report s > 100% as in column (2), or use nonlinear regression to estimate is
st =�1 + e�a(t�b)
��1directly.4 The con�dence intervals for the various estimates of a overlap at
about 0.04.
Two features stand out from Table 4. The �rst is that given the year bi in which each country
achieved 50% enrollment, and a single transition speed a � 0:04 typical of the world as a whole, we
can predict roughly 90% of the variation in net primary enrollment in all countries for the entire
postwar period. Each country has its own circumstance, but it is nevertheless meaningful to speak
of �the�education transition.5 This does not suggest that there is one path that all must take, but
that there is a remarkably homogenous set of paths that most have taken.
The second is that the typical transition occurs at a measured pace. Figure 1 shows the typical
transition as a solid line compared to actual net primary enrollment data. �Adjusted year� is the
di¤erence between the year of the quinquennial datapoints and the estimate bi from (5). The �gure
thus reveals how the transition might look if every country had reached 50% enrollment in the
same year. If that were the case, then in the postwar 20th century the typical country� rich or
poor� would have risen to 70% after 22.3 years, 80% after 36.4 years, and 90% after 57.7 years.6
4The nonlinear regression constrains bi � 1750 and omits outliers BLR 2000 and PLW 2000. The results are notsensitive to either of these restrictions.
5Simon and Boggs (1997) document pictorially that despite wide international variation in primary educationexpenditures per student, the rate of transition from low to high enrollments has been remarkably uniform across awide variety of countries.
6Wils and O�Connor (2003a), who use a much more limited dataset and proxy enrollment with literacy acquisition,�nd that the typical country in this period took 35-80 years to make a hypothetical transition from 10% net primary
15

5.2 The typical transiton speed before 1914
While this may seem slow, it is in fact an unprecedented achievement. In the late 19th and early
20th centuries, when today�s rich countries had levels of school enrollment more comparable to those
seen in today�s poorer countries, they took signi�cantly longer to undergo the same transition. Table
5 presents regressions based on (5), both for all 35 countries7 on which we have data and for the 16
countries among them that are today the most developed.8
The dependent variable in Table 5 is not net primary enrollment because surviving statistics for
most of these countries do not allow its calculation. Rather, it is the number of people of any age
enrolled in primary school divided by the size of the population under the age of 15, analogous to but
not precisely equal to gross enrollment (the denominator includes infants). Since the highest level of
this statistic in any of these countries was approximately 60% during the entire period 1865-2000,
60% was chosen as the presumed maximum value for the linear analysis of columns 1 and 2. The
material results are not sensitive to this assumption, as revealed when the assumption is relaxed by
the nonlinear analysis of columns 3 and 4. Figure 2 shows the typical transition for all 35 countries
before 1914. The S-shaped pathway for educational expansion in this period, �rst reported by Meyer
et al. (1992), is evident.
Again, the regressand is not the same in Tables 4 and 5, so the results are not comparable in
the narrowest sense. But the units of the transition speed are percent of the maximum value per
year; it measures how long these countries typically took to get from low levels of enrollment to high
levels. Table 4 implies that the typical country after 1960 took about 28 years to get from 75% of
the worldwide maximum level of that enrollment statistic to 90% of the maximum. Table 5 reveals
that before 1914 it took about 41 years to get from 75% of the worldwide maximum value of net
primary enrollment to 90% of the maximum. These results would be incomparable to the extent
that the demographic structure of the countries in question was rapidly changing at the time�
rapid increases in population growth would in�ate the denominator of the regressand in Table 5 and
enrollment to 90%� much more rapidly than the 115 years implied by the �gures here. The two results are notcomparable for many reasons. Among these are that literacy �gures are often compiled by census takers who simplyask whether or not the respondent is literate and are therefore a poor proxy for school completion, and are furthermoreundesirable for the present purposes because development goals are not stated in literacy terms.
7Argentina, Australia, Austria-Hungary (now Austria and Hungary), Brazil, Canada, Ceylon (now Sri Lanka),Chile, China, Colombia, Cuba, Denmark, Egypt, France, Germany, Greece, India, Netherlands Indies (now Indonesia),Italy, Japan, Mexico, Burma (now Myanmar), New Zealand, Norway, Peru, Philippines, Portugal, Russia, Serbia (nowSerbia and Montenegro), Spain, Sweden, Siam (now Thailand), Anatolian portion of Ottoman Empire (now Turkey),United Kingdom, United States, Uruguay. The nonlinear analysis constrains Constrains bi � 1650:
8Australia, Austria-Hungary, Canada, Denmark, France, Germany, Greece, Italy, Japan, New Zealand, Norway,Portugal, Spain, Sweden, United Kingdom, United States.
16

depress the estimated coe¢ cient on year� but it was not. Aside from New Zealand and Ceylon,
the rate of population growth was not changing fast enough in these countries at this time for a
panel regression of population growth on time to yield a statistically signi�cant coe¢ cient (results
not reported).
6 Allow heterogeneous transition speed
While it is thus reasonable to speak of a typical transition speed, it is of course not true that all
countries have the same transition speed. Modifying equation (5) to allow for a random coe¢ cient ai
and employing the estimator of Hildreth and Houck (1968) allows calculation of the �2-distributed
Swamy (1970) statistic, which Johnston (1984) has shown is equivalent to testing the null hypothesis
that ai = a 8 i. In the case of the �rst column of Table 4, �2190 = 9; 230 and the null is rejected at
p < 1%. Cross-country heterogeneity of a is statistically sign�cant during 1960-2000.
We now relax the assumption that all countries have the same transition speed. Let each country
have an idiosyncratic transition speed ai = Z 0i� + v, where Zi = (zi;1; :::; zi;n)0 is a vector of known
characteristics of country i exogenous to the transition speed, � = ( 1; :::; n)0 is an unknown vector
of coe¢ cients common to all countries, and v is some unknown constant common to all countries.
Together with equation (5), this implies
� ln�1
si;t� 1�= vt+ t
nXj=1
zi;j j + ci, (6)
where ci � �aibi. Equation (6) lends itself to estimation with country �xed e¤ects to capture ci.
The coe¢ cient on the interaction of each country characteristic zi;j with the year t� the second
term on the right-hand side� yields an estimate of j , the degree of correlation between a marginal
change in that characteristic and a change in the transition speed. Random e¤ects, though more
e¢ cient, would give biased coe¢ cient estimates in this case since the country e¤ect is systematically
related to the interaction term through (Zi;�).
Table 6 estimates equation (6) for a set of country-characteristics Zi measured at the year 1980.
The three numbers reported for each variable are the estimated coe¢ cient, the standard error (in
round braces) and the standardized coe¢ cient (in square braces).9 Variables under the control
9The standardized coe¢ cient is coe¢ cient estimate if regressors and regressand are �rst normalized to mean zeroand standard deviation one. It is represents the number of standard deviations of the dependent variable explained
17

of education policymakers, and thus determining a, include public expenditure on education as a
percent of GDP and the pupil-teacher ratio in primary education. While the coe¢ cients on both of
these variables have the expected sign, neither is statistically signi�cant. Moreover, the standardized
coe¢ cients reveal that alongside other country characteristics, neither is economically sign�cant.
A brief calculation illustrates the meaning of these estimates. From Table 3, the typical country
had GDP per capita at Purchasing Power Parity in 1980 of $4,380 and spent 4.0% of its GDP
on public education. If we reduce that country�s income to $3,060, the transition speed slows from
a = 0:0378 (column 1) to a = 0:0291 (since (30:6� 43:8)�0:000658 = �0:00869). If we then increase
its public education spending to 11.3% of GDP, the highest value on record, this is just enough to
bring the transition speed exactly back to 0.0378 (since (0:113� 0:040)� 0:119 = +0:00869). Even
this is an optimistic assessment of the ability of education expenditures to make up the di¤erence,
because the statistical insigni�cance of the coe¢ cient estimate means that we cannot be sure it
is di¤erent from zero. If income falls below $3,060 (roughly the level of Paraguay or Papua New
Guinea), educational expenditures would need to rise to levels higher than have ever been seen in
any developed or developing country� all else equal� to keep the country at the typical transition
speed.
In other words, the coe¢ cient estimates suggest that for very poor countries, �a is much more
important than a in determining the transition speed. In the poorest countries, those with less than
$3,060 a year in PPP income or roughly one third of the countries on earth, no reasonable amount
of education expenditure can� in and of itself, and all else equal� even bring them up to the typical
transition speed, much less make them vault beyond it. This does not in the slighest imply that poor
countries cannot move faster than the typical transition speed (many have), but only that there is no
evidence whatsoever that increased education expenditures� per se and all else equal� are capable
of bringing this about.
It is di¢ cult to conduct a similar exercise for the pupil-teacher ratio, since the high correlation
between that ratio and GDP per capita (�0.684) means that multicollinearily may cloud the relative
importance of their coe¢ cients. The pattern revealed in the standardized coe¢ cients is, however,
clearly that the structure of the economy and the extent and distribution of adults�education have
been far more highly correlated with rapid expansion of enrollment than has provision of additional
by a one standard-deviation change in each independent variable, and allows comparison of correlation magnitudesacross regressors measured in di¤erent units.
18

teachers.
Thomas et al. (2001) estimate Gini coe¢ cients based on educational attainment, where a value
of zero indicates that the entire population has completed the same number of years of schooling
and a value of one means that only one person in the country has completed any years of schooling
at all. The fact that a higher education Gini index is associated with faster primary enrollment
transition speeds in Table 6 might be expected for several reasons. One of these is that if the return
to a marginal year of education tends to rise for each year� as Duraisamy (2002) has shown for India
and Siphambe (2000) for Botswana� then communities might require the �demonstration e¤ect�of
watching a small number of their members go far enough to realize high returns before choosing
to invest in the initial, low-return years. Another is that communities believe from the start that
high returns can be realized at higher levels of education, but do not believe that returns are high
for primary education alone, so wait until secondary schools are su¢ ciently available for there to be
some reasonable chance of their child continuing past primary school before enrolling their children
in primary. This last is suggested, though not proven, by the fact that no country today has achieved
over 90% primary net enrollment without having at least roughly 35% secondary net enrollment.
There is no con�ict between the observation that household income shows up in surveys as a
strong determinant of enrollment decisions whereas Figure 1 suggests that many countries raised
enrollments where income did not grow. In the language of equations (1) and (2), rising wages w can
raise �R and �R, but so can many other forces. Technological di¤usion can change r, for example,
and slow changes in parents�child-rearing practices can change the bene�ts � that children receive
from being in school. But the speed of these changes, too, is structurally constrained.
7 The gender transition
The transition from low to high enrollments has followed di¤erent paths for girls and boys. It
is therefore interesting to disaggregate the preceding analysis by gender. The variable of interest
for gender equity goals in education has frequently been the ratio of female enrollment to male
enrollment at a given level.
Coverage for gender-disaggregated data is more limited for net enrollment than for gross. It is
therefore tempting to calculate the female-to-male ratio for gross enrollment and let this serve as
a proxy for the net ratio, allowing recourse to much more extensive data. The drawback of this
19

approach is that the evolution of this ratio cannot be expressed exactly as a function of time and
of the ratio itself; some inclusion of gender-disaggregated net enrollment data is necessary to model
the timepath of the ratio exactly. There is thus a tradeo¤ between approximating the evolution of
this ratio with better data, or measuring it exactly with worse data. Here we take both approaches.
First we use better data and an approximate functional form to model the gender transition.
Let r � sf=sm represent the ratio of female net enrollment to male net enrollment. From _r=r =
_sf=sf � _sm=sm, equation (4) gives _r=r = af�1� sf
�� am (1� sm), or
_r
r=�af � am
�+ afsm
�am
af� r�. (7)
When af t am, then as sm approaches unity, (7) will resemble (4) and the growth of r will be
roughly logistic. Taking the ratio of female gross enrollment to male gross enrollment as a proxy
for r, we can therefore use an equation analogous to (5) to model the evolution of r. That is,
� ln((1 � r)=r) is approximately linear in t. Table 7 takes advantage of this fact to estimate the
corresponding speed of transition to parity in the gross enrollment ratio for primary and secondary
education. Figure 3 shows the typical transition for gender ratios in primary education, and reveals
that the logistic curve is indeed a good approximation of the true process.
The numbers suggest, for example, that a country whose ratio of girls�gross primary enrollment
to boys�is 0.8 typically takes 28 years to reach a ratio of 0.95. In secondary education, the transition
from 0.8 to 0.95 has typically taken 29 years.
Now we use more limited data and an exact functional form to model the gender transition.
The distributions of the parameters of enrollment condition (1) could be quite di¤erent for girls
than for boys. Di¤erent labor roles in the home and di¤erent degrees of labor force participation by
women could mean that w and � are distributed di¤erently for each gender. Sexual harassment in
public spaces, among other factors, could mean that c di¤ers by gender as well. Such di¤erences are
supported by volumnious micro research, such as Herz et al. (1991). In short, boys and girls could
follow di¤erent versions of equation (4).
First, assume that the female transition speed af is common to all countries, as is the male
transition speed am. Each gender would then have a separate relationship (5), estimated in Table
20

8. The di¤erence of these equations is
� ln 1=sfi;t � 11=smi;t � 1
!=�af � am
�t� c0i, (8)
where c0i � afbfi � ambmi is a country-speci�c constant. The �rst and third columns of Table 9
estimate this relationship, con�rming that the di¤erence between af and am in Table 8 is indeed
statistically signi�cant. The big picture since 1950 is that girls�primary and secondary enrollments
have been catching up to those of boys, that the gender gap in education is closing� supporting the
results of Wils (2003), but contrary to the �nding of Ahuja and Filmer (1995).
Relaxing the constraint that�af � am
�is identical across countries, the equation analogous to
(6) is
� ln 1=sfi;t � 11=smi;t � 1
!=�vf � vm
�t+ t
nXj=1
zi;j
� fj � mj
�+ c00i . (9)
where c00i � afi bfi �ami bmi is a country-speci�c constant. Estimates of the coe¢ cient on the interaction
term between t and each country characteristic zi;j reveal the correlation between that characteristic
and the degree to which transition speed is faster for females than for males. Table 9 explores this
relationship as well. The included set of country characteristics is intended to capture some aspects
of women�s social and economic status, repeatedly identi�ed as major determinants of the level of
girls�schooling relative to boys�(e.g. Stromquist 1989; King and Hill 1993).
The estimates suggest that populations that are a priori more educated have been quicker to
close the gender gap, as suggested by Wils and Goujon (1998). Female labor force participation is
positively but not statistically signi�cantly correlated with faster transitions to gender parity at the
primary level. The sign of this relationship is suggested e.g. by the work of King (1996) in Peru.
Higher fertility, interestingly, is associated with faster elimination of the gender gap. Perhaps
families with one boy and one girl might elect to keep the daughter out of school to assist with
household tasks, while a family with �ve boys and �ve girls can send four of the girls to school and
get the same household labor. This is consistent with Glick and Sahn (2000), who found that having
a large number of sisters increased the years of schooling for girls in Guinea, and Al-Samarrai and
Peasgood (1998) who found that the number of children in the household signi�cantly increased
primary enrollment and completion rates in Tanzania, as well as the �ndings of Canagarajah and
Coulombe (1997) in Ghana and World Bank (1997) in Pakistan.
21

Finally, populations with high proportions of their population professing Christian, Muslim,
or indigenous/animist faith have been slower to make the transition to gender parity in primary
education. All else equal, poorer countries have notably been just as e¤ective as richer ones at
closing the gender gap in education� as Filmer et al. (1998) �nd at the state level in India and
Pakistan, Shapiro and Tambase (2001) �nd for households in Kinshasa, and Pal (2003) �nds among
households in West Bengal.
While these characteristics do not come close to explaining all of the variation in the data, they
do point out that 1) worldwide girls have been slowly closing the gender gap with boys, 2) this
process is relatively uniform and takes many decades, and 3) what variation there has been across
countries in the speed of this �catching up�has been correlated with many factors beyond the control
of education policymakers.
8 Case studies
8.1 Many �o¤ track�countries are moving at blistering speed
Figure 4 shows alternative futures for net primary enrollment in Burkina Faso, a country classi�ed
as �seriously o¤ track�in an education progress report published by the World Bank (Bruns et al.
2003, p. 180). Circles show actual data from the recent Burkinabe past. The solid line �ts equation
(5) to those data to approximate the current trend. The long-dashed line shows the path that would
be necessary to meet the second Millennium Development Goal, a radical departure from the past
several decades. The short-dashed line shows the hypothetical path Burkina Faso would follow if it
were to move at the typical post-1960 transition speed measured in Table 4. Finally, the dotted line
shows the path according to the typical 19th-century transition speed of today�s richest countries.
The transition speed parameter a for Burkina Faso is 0.058, while for the typical country after 1960
it was 0.038 and for the typical rich country in the nineteenth century, 0.027.
Burkina Faso may indeed be �seriously o¤ track� to meet the Millennium Development Goals,
but it has spent the last few decades bringing children into primary school at more than twice the
rate achieved by today�s rich countries when they were developing. It has also far exceeded the
typical transition speed of all countries collectively, rich and poor, after 1960. It has done this with
an economy far less developed than the leading economies of the 1800s and less developed than the
vast majority of countries after 1960. In historical perspective, Burkina Faso is better than �on
22

track� for any reasonable education goal. It could only be �o¤ track� for a goal divorced from a
century and a half of experience by hundreds of millions of families and countless well-intentioned
policymakers.
Table 10 documents the same information regarding a variety of the poorest countries for which
we have a su¢ ciently long time series to comfortably �t equation (5) by individual countries. Of
these, only The Gambia and Nicaragua are classi�ed as �on track�by Bruns et al. (2003, p. 176).
The reality is that none of these countries will meet the second Millennium Development Goal, but
with very limited resources all of them are likely to outshine the past performance both of their
peers and of today�s wealthiest nations.
8.2 �Development goals�of the 19th century
This last point is underscored by Table 11, which presents a picture of the education development
goals today�s rich countries once set for themselves. The �rst column gives the year in which
compulsory primary education was �rst legally instituted10� a form of national development goal
since de jure universal education preceded de facto in all these cases. The next column gives GDP
per capita in the year that compulsory basic schooling was instated, expressed in 1990 US$; compare
these �gures to the rightmost column of Table 10 (all from Maddison 2001). The next two columns
show the evolution, starting in that year and over the following three decades, of the number of
people enrolled in primary school divided by the population under age 15. Recalling Table 5, note
that progress toward roughly 60% indicates progress toward universal primary enrollment.
It stands out starkly in this table that when today�s rich countries made universal primary en-
rollment a national development goal, 1) they were richer than today�s lowest-income countries,
and 2) they either set the goal when they had nearly achieved universal enrollment, or took several
decades to approach it. For example, when Massachusetts became the �rst state to declare com-
pulsory primary education in 1852, the US was richer than most of the countries in Table 10 and
had already reached relatively high levels of enrollment.11 As Goldin (1999, p.8) notes for the US,
101852 is the year in which Massachusetts established compulsory basic schooling; all states in the union did not havesuch laws until 1918 (Goldin 1999). 1872 is the year in which Victoria colony instituted compulsory basic schooling;the rest of what is now Australia followed during 1875-1880 (Cubberly 1920, Ch. 27). Italy established three yearsof compulsory basic education in 1877, but �little had been accomplished in enforcing the compulsion previous tothe new compulsory law of 1904� (ibid., Ch. 23). The rest of these years come from Cubberly (1920) or Godo andHayami (2002).11 In 1852 income per capita in Massachusetts was roughly 35% higher than the national average shown in the table,
or roughly $2,700 in 1991 dollars, which only strengthens the conclusion (Maddison [2001] adjusted by Richard A.Easterlin, [1961], �Regional income trends, 1840-1950,� in Seymour Harris, ed., American Economic History [New
23

�[a]lthough compulsory education laws were also passed during the period of the common [primary]
school transformation, it is believed that they lagged rather than led it. That is, the state laws
were passed only after the majority of youths had already gone beyond the age of compulsion in the
laws.� Japan�s Primary School Order (Shogakko Rei) of 1886 introduced compulsory education of
four years12 when income per capita was somewhat lower and schooling much less widespread, but
progress toward the upper bound of roughly 62% from Table 5 was very slow� from 24% to 38%
over the following three decades.
These stylized facts are not limited to the countries in the table; Jónasson (2002) �nds that in
Iceland since 1900, �[i]t has never been the case that laws stipulating compulsory education have pre-
ceded important changes in school attendance.�Nor are they limited to primary education: Goldin
and Katz (2003) �nd that a scant �ve percent of the massive increases in secondary enrollments in
the United States from 1910 to 1939 can be attributed to compulsory schooling and child labor laws.
The rises are instead attributable to increases in and equitable distribution of wealth and economic
opportunity as well as demographic changes and social stability (Goldin and Katz 1997).
8.3 Bad news for the goals, good news for many children
What can we expect in today�s developing countries over the next few decades? It is instructive to
test the out-of-sample predictive power of equation (5) by �tting it to past data and comparing its
predictions to actual performance. Table 12 carries out this exercise for net primary enrollment.
Suppose we were sitting at the Education for All meeting in Jomtien, Thailand, in 1990. We would
no longer have access to any data recorded after that year. The �rst column records the simple
average, across countries, of net primary enrollment in each region in 1990. Suppose we were then to
estimate the typical transition speed for net primary enrollment up to 1990 and use this to predict
what would happen to regional enrollment levels by 2000, Jomtien�s goal year for universal primary
enrollment.
These predictions, shown in the second column, match quite well with actual performance since
Jomtien� in the third column. All the same pledges of aid and political will were heard at Jomtien
as were heard at Karachi in 1960 and at New York in 2000, but equation (5) turns out to be a
York: McGraw-Hill], pp. 525-547, Table 1). All US states had introduced compulsory primary education by 1918,when national income per capita was around $5,700 (based on Maddison 2001). The US �rst achieved gender parityin elementary education around 1900 (Goldin 1999).12Extended to 6 years in 1907 (Godo and Hayami 2002).
24
far better predictor of events than the most impassioned pledges and goals. Sub-Saharan Africa,
South Asia, and Latin America all beat the trend the world had been on prior to Jomtien, but this
unprecedented success was naturally termed a failure. The fourth column of the table uses the same
technique, this time with data through the year 2000, to predict where each region might stand in
2015.
Table 13 carries out a similar exercise for the gender ratio in primary schooling. South Asia
and Middle East/North Africa missed the lofty goals of the Mexico City, Copenhagen, and Nairobi
summits, but during the 1990s managed to beat the typical worldwide speed of transition to gender
parity prior to 1990. Rather than malign the �failure�of these heavily Muslim regions to get girls
into school, we might justi�ably celebrate their achievement.
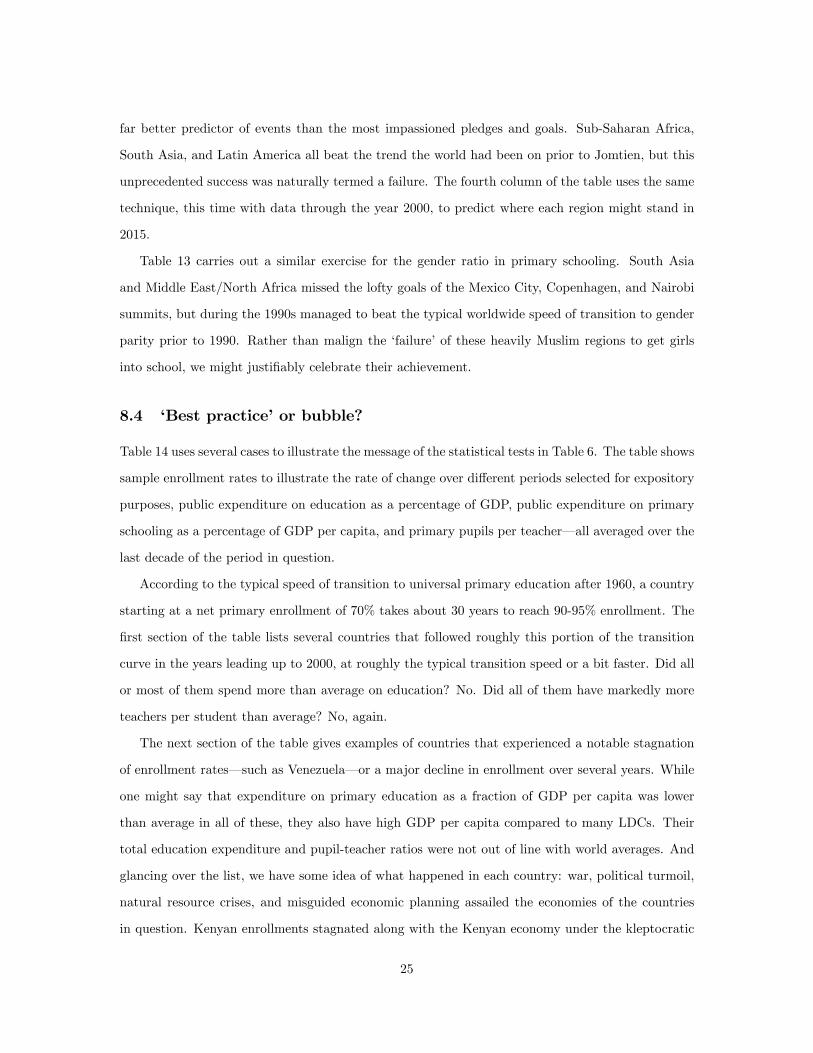
8.4 �Best practice�or bubble?
Table 14 uses several cases to illustrate the message of the statistical tests in Table 6. The table shows
sample enrollment rates to illustrate the rate of change over di¤erent periods selected for expository
purposes, public expenditure on education as a percentage of GDP, public expenditure on primary
schooling as a percentage of GDP per capita, and primary pupils per teacher� all averaged over the
last decade of the period in question.
According to the typical speed of transition to universal primary education after 1960, a country
starting at a net primary enrollment of 70% takes about 30 years to reach 90-95% enrollment. The
�rst section of the table lists several countries that followed roughly this portion of the transition
curve in the years leading up to 2000, at roughly the typical transition speed or a bit faster. Did all
or most of them spend more than average on education? No. Did all of them have markedly more
teachers per student than average? No, again.
The next section of the table gives examples of countries that experienced a notable stagnation
of enrollment rates� such as Venezuela� or a major decline in enrollment over several years. While
one might say that expenditure on primary education as a fraction of GDP per capita was lower
than average in all of these, they also have high GDP per capita compared to many LDCs. Their
total education expenditure and pupil-teacher ratios were not out of line with world averages. And
glancing over the list, we have some idea of what happened in each country: war, political turmoil,
natural resource crises, and misguided economic planning assailed the economies of the countries
in question. Kenyan enrollments stagnated along with the Kenyan economy under the kleptocratic
25

Moi régime, and as willing as are Bedi et al. (2003) to ascribe the enrollment declines to school
fees, a healthier Kenyan economy would certainly have eased the �scal constraints that motivated
those fees in the �rst place. As much as Julius Nyerere prattled about �education for liberation�, his
catastrophic ujamaa campaign and associated well-meaning socialist blunders helped eviscerate the
Tanzanian economy (e.g. Schott 1998, pp. 223-261) and led directly to one of the largest and longest
enrollment declines on the UNESCO record. These experiences do not eliminate the possibility that
these countries might have raised enrollments with massive policy e¤ort if economic conditions had
been di¤erent. But instability, bungled economic plans, con�ict, volatile terms of trade, and so
on are the rule in the developing world, not the exception. For an education minister to claim
that universal primary education could have been achieved in a developing world without turmoil
is indeed of little use. The e¤ect of such upsets on the economy and therefore on the incentives to
invest in education are major determinants of education progress that are far beyond the control of
Education Ministry budgets.
Finally, the table gives a few examples of very poor countries for which the enrollment numbers
reported by UNESCO have risen at a rate su¢ cient to meet even extremely ambitious goals. While
the world has looked to some of these countries to justify the feasibility of the Millennium Devel-
opment Goals, it is important to look very closely at these numbers for Togo, Rwanda, Malawi,
Uganda, Botswana, and Indonesia.
In Togo in the mid 1990s, as UNESCO-reported net primary enrollment soared from 69% to 84%
in just two years, roughly half of primary students failed and were held back (of 663,126 enrolled
primary students in 1994, 304,742 failed; World Bank 1995, p. 36). This is likely to explain why,
while Togo reported net primary enrollment of 92.3% to UNESCO in 2000, the World Bank places
the true �gure for 2000 at �no more than 65%� (World Bank 2003, p. 2). In other words, from
1985 to 2000 Togo�s net primary enrollment probably grew roughly �ve or perhaps ten percent�
important and meritorious progress, to be sure, but more slowly than the typical post-1960 country,
which would have increased enrollment by about 13% during that period starting from similar levels.
The story is similar in Rwanda, where �the entry rate to �rst grade did not improve and can
therefore be excluded as a factor behind the increase in educational coverage�during the late 1990s.
Most (57%) of the sharp rise in enrollments �re�ects increased recycling within the system� as
failure/repetition rates soared threefold in the 1990s, reaching 38% in grade 5. The remaining
minority of the increase is explained by an increase in survival rate to the end of the primary
26

education cycle, but �high rates of grade repetition ... raise concerns about the sustainability of
the gains in cohort survival rates�(World Bank 2003, pp. 25-6). A rise in enrollment based in its
majority on failing students cannot be considered an exportable �best practice�of any kind.
In the statistics that Malawi has reported to UNESCO, net primary enrollment skyrocketed from
roughly 50% in 1990 to 103% in 1994 and 101% in 2000. While the careful analysis of Al-Samarrai
and Zaman (2002, p.3) agrees with the 1990 �gure, it estimates 1997/8 enrollment at only 77%.
Even after this reality check, an increase of 25-30% in a decade appears impressive. But it cannot
escape our attention that the astonishing increase in enrollments seen in Malawi was accompanied
by a deterioration of the quality of school services to among the lowest in Africa (Castro-Leal 1996,
p.17), severely compromising continuation rates and therefore the sustainability of the increase. The
number of children per quali�ed teacher roughly doubled (ibid.).
In Uganda, the World Bank (2002, p.2) reports that gross primary enrollment nearly doubled
between 1996 and 1999, after President Museveni honored his election promise to abolish school
fees for up to four children per family. Did the president really double enrollment? Let us set
aside for a moment the �ndings of Ablo and Reinikka (1998, Table 2), who question whether or
not enrollments started out as low as the government claims, suggesting that o¢ cial �gures may
have underestimated true 1993-1995 enrollments by as much as one third and thereby exaggerating
the post-1996 growth rate. Even though enrollments did rise after 1996, getting those children
through the door required much more than low fees. First, it was also a product of explosive
economic growth seen almost nowhere else in Africa. That is, �[t]he Ugandan government has
been able to meet its objectives in the area of primary education, because as a prior condition it
established macroeconomic stability� (Stasavage 2003, p. 3). While Uganda touted the �political
will�it demonstrated in raising enrollments so quickly, its education ministry also pointed out that
the government�s ability to do so was initimately related to emerging from two decades of war and
instability to one of the highest economic growth rates in the world (Republic of Uganda 1999, p.
19). The increase additionally was accompanied by a dramatic decline in education quality. Over
the same 1996-1999 period, the number of 3rd grade pupils achieving a �satisfactory score�on the
English oral test collapsed from 92% to 56% (World Bank 2002b, p.3). The World Bank reports
that the number of pupils per student soared from 35.2 in 1995 to 60.1 in 1998. The symmetry
of these numbers is arresting; Uganda doubled enrollments not only by lowering fees but also by
promising job growth for graduates in the middle of a boom, packing twice as many children into
27

every classroom, and roughly halving their test scores. Indeed, Deininger (2003, p. 303) �nds that
in Uganda, it is �impossible to reject the hypothesis that, in quality-adjusted terms, there has been
little change in the cost of primary education.�
This last is not the case in Botswana, but the rapid gains achieved in that country leading
up to 1990 proved temporary. Net primary enrollment in Botswana fell from 93% to 84% over
the course of the 1990s. Ethnic homogeneity and one of the world�s fastest growing economies
were closely related to the initial enrollment gains (Duncan et al. 1997), and Botswana�s dubious
distinction as the center of the AIDS calamity is closely linked to the slippage since then (Ainsworth
et al. 2002; Bell, Devarajan and Gersbach 2003). The story is analogous for Indonesia, the last
country in the table, before 1985. Rapid enrollment gains in that country were accompanied by
massive school construction, but even so, as a fraction of GDP education spending was low by world
standards. Perhaps what mattered most was the rapid economic growth that raised millions out of
poverty during this period and buoyed parents�expectations regarding their childrens�opportunity
set, encouraged in no small measure by a one-o¤ resource boom and a political stability that many
other countries of Southeast Asia did not enjoy at the time. Like Botswana, Indonesia�s enrollment
achievements proved fragile and vulnerable to subsequent crises, falling to 92% in 2000. One wonders
how much education policymakers in other countries can truly learn from enrollment changes during
booms in arguably two of the most the economically successful poor countries of the late 20th century
that started out truly poor� except to note that economic development is a good thing and is often
in�uenced by conditions beyond the reach of policy.
Some other countries of potential interest are not listed in the table because UNESCO�s net
enrollment data cover these countries sparsely: Malaysia, Thailand, China, and Cuba. But even
these countries o¤er little hope of an exportable best practice capable of producing atypically sharp
rises in net primary enrollments elsewhere. Malaysia followed the typical transition speed closely,
rising from 88% in 1970 to 98% in 2000, while the typical country would have hit 96% in 2000.
Thailand lagged slightly behind, rising from 72% in 1965 to 85% in 2000, wheras the typical country
would have reached 90% by 2000. Both China and Cuba are di¢ cult to analyze based on the
UNESCO �gures, since both of these opaque and totalitarian governments claim enrollments near
100% in all the years for which UNESCO has data. But Aguirre and Vichot (1996) �nd that in
Cuba, for example, primary enrollment �gures are in�ated and �are the result of a generalized
tendency to exaggerate real revolutionary achievements to ... an implausible extent.�And even if
28

we are to believe China�s and Cuba�s largely inscrutable statistics, the motive force behind so much
government involvement in education might be that of political indoctrination� as argued forcefully
by Pritchett (2002)� a practice of hopefully limited exportability. Mehrotra (1997) also questions
the sustainability of top-down educational achievements in Cuba in the face of a vapid economy
that, now a decade and a half on, has not adjusted its international relationships to accommodate
the collapse of the Soviet Union.
Taken together, these stories do not bode well for the prospects of very recent surges in en-
rollments in neighboring Kenya and Tanzania after they abolished school fees in during 2002-2003.
There can be no doubt that Malawi, Uganda, and now Kenya and Tanzania have demonstrated that
the demand for schooling can be highly price elastic when considered independently of the quality
of education, the sustainability of the increase, and the political and economic conditions under
which it occurs. For Malawi and Uganda, the declines in quality have been su¢ cient to suggest that
demand for human capital is price inelastic even as demand for schooling is elastic. The experiences
of Togo and Rwanda have suggested that massive increases in enrollments can hide massive increases
in failure and retention, inviting questions about the sustainability of enrollment rises for any more
than a few years. And the unique conditions under which most of these rises have occurred are
strikingly uniform: in Malawi, Kenya, and Tanzania the increases followed within three years of the
death or departure from government of an in�uential individual whose régime�s failed policies had
helped hobble the economy for decades, while in Rwanda they followed resolution of major armed
con�ict. In�ated expectations of a new era of opportunity in these countries, as much as did the
de facto opportunities in the booming Uganda of the 1990s or Indonesia of the 1970s, may have
led to increased perception that in the near future an unschooled child would be more economically
disadvantaged. Such feelings would prop up the propects of candidates promising to eliminate school
fees, and make parents willing to send their children to shoddy classrooms teeming with 60 children
or more per underquali�ed teacher. But like all bubbles, this one too must pop unless the funda-
mentals are right. Unless the graduates are truly better o¤ for the investment they made, which is
to say that unless jobs await them to which they could not otherwise have aspired, enrollments are
likely to stagnate or fall in these countries after a few years. And other countries seeking to mimic
their rapid increases may do so in vain in the absence of conditions for a similar bubble, conditions
largely beyond the reach of education ministers.
These cases have a message. Meeting the Millennium Development Goals for education will
29
require very fast enrollment increases for many countries, and increases at comparable speeds have
been seen almost exclusively in countries sharing certain characteristics. These countries 1) are
frequently small; 2) carry out incomplete censuses of the general population or fail large fractions
of their students, in�ating enrollment ratios; 3) experience enviable economic booms far beyond
the realm of education policy; 4) experience a one-o¤ end to warfare or decades of repressive rule,
producing a surge of hope for future economic opportunity, and/or 5) are willing to accept a débâcle
in the amount of quality attention that each child receives from quality teachers.13 Certainly none of
these can serve as a readily-exportable �best practice.� In other words, after we look more closely at
fabled national success stories, we see tremendous progress but we do not see examples of countries
that have started from the levels of today�s low-enrollment countries and achieved �complete free
and compulsory primary education of good quality�in very short periods. Meanwhile, the world is
�lled with countries that have achieved this goal more slowly� over the span of several decades, at
remarkably uniform long-term rates. This does not mean that many African countries would not do
well to emulate many aspects of, say, Uganda�s or Botswana�s experience. In doing so, they might
progress faster than they otherwise would have, but they are extremely unlikely to progress as fast
as necessary to meet the Millennium Development Goals.
9 Discussion
9.1 Policy and resources matter� within limits
Figure 5 summarizes the message of this investigation. The x-axis is transition speed a, and the
y-axis is the number of countries with that transition speed. The country-by-country estimates of
a shown are for those countries for which we have at least three datapoints, allowing a country-
speci�c �t of equation (5).14 The estimates are given in a histogram with bins of width 0.025. The
bell-shaped outline is that of a normal distribution with the same mean and standard deviation of
the population shown. Note the average transition speed of roughly 0.04, familiar from Table 4.
The arrows to the right of the curve show the hypothetical transition speed that would be necessary
to reach 95% net primary enrollment by 2015, given various starting levels in the year 2003. In
13Duraisamy et al. (1997) likewise �nd that rapid increases in school enrollments in Tamil Nadu, India wereaccompanied by massive deterioration in school conditions and education quality.14 In cases where countries report s > 100% in any year, a nonlinear �t of st = c
�1 + e�a(t�b)
��1is performed to
allow calculation of an idiosyncratic maximum toward which that country is converging, as in column 3 of Table 4.
30
brief, anything approaching universal primary enrollment by 2015, starting at anything less than
80%, requires increases in enrollment without any precedent in the long-term trends of all countries
from 1960-2000 for which we have data. Among the countries for which UNESCO has data on net
primary enrollment in 2000, 39 are below 80%.
In other words, for dozens of countries, the only education policy that could achieve the latest
round of development goals would be one without meaningful precedent. Burkina Faso would have to
�gure out something that Korea did not. Since this is the third or fourth time that the international
community has been through such a paroxysm of pledges and frustration, perhaps it is time to stop
empty promises of unprecedented action and let precedent suggest what is feasible. The latest goals,
taken literally, are not feasible.
Some of the goals�advocates do openly recognize this. Vandemoortele (2003) agrees that the
world is not �on track�to meet the education-related Millennium Development Goals, but falls into
the pattern recycled for over four decades� attributing this to �broken promises�of aid. Since his
and co-authors�estimate of the �cost�of meeting the goals is �a¤ordable,�then clearly only political
will can be to blame. But as rich-country parents know, putting up enough money to send your
daughter to college does not guarantee that she will go, much less that she will complete the degree.
There is an alternative conclusion from the same evidence. Although aid and education policies
matter, and although money can certainly buy some degree of advancement in educational attain-
ment, perhaps short-term utopian goals cannot be bought. Perhaps there is a common reason why
today�s developing countries are so daunted by rapid increases in educational attainment and why
today�s rich countries could not quickly �buy�universal primary schooling when they were developing.
Perhaps the statistically signi�cant impacts of education policy on parents�educational decisions for
their children do not compare in magnitude to the impact of long-term economic changes on those
decisions.
The standard World Bank view is that to achieve universal primary education by 2015, �[t]he
most important actors are clearly the governments,� by which he means that governments must
give �high budgetary priority�to education (Fredriksen 2002, p. 4). The evidence simply does not
support this view. The micro studies show that the most important actors are clearly parents, people
whose incentives can only be modi�ed to a limited degree by governments, as well as government
actors outside the education policy sphere who shape the economic environment in which those
parents act.
31

9.2 What the evidence does not imply
It is important to review three things that this study does not claim:
Emphatically, the message of this work is not that �history doesn�t matter�nor that countries�
idiosyncratic institutions and policies have no e¤ect on a purely mechanistic world. This study speaks
only to the determinants and range of the transition speed (a), and is mute on the subject of when
the transition begins (bi). Easterlin (1981), Benavot and Riddle (1988), and Lindert (2001) make
a strong case that political and institutional di¤erences across countries have throughout history
helped determine the date of takeo¤ toward mass schooling alongside economic forces. They do not
address, however, why the rate of change in enrollments across such di¤erent countries have been so
notably uniform.
Likewise, this analysis does not claim that policy doesn�t matter. Within limits, the micro
literature reveals that building more schools, with better-trained teachers using better materials can
increase enrollment rates. This is perfectly compatible with the fact that over the long term these
adjustments are not the primary determinant of the speed of transition from low enrollments to
high. Similarly, while few doubt that the US president or Federal Reserve Chair can a¤ect economic
performance, Landon-Lane and Robertson (2003) �nd that government policies have been irrelevant
to the long-run growth rates of OECD countries. Policy and money may matter, but that does not
mean that su¢ cient policy and su¢ cient money can reach any goal.
Finally, this work does not in any way imply that the Millennium Development Goals are useless.
The purpose of setting international development goals is to solve a collective action problem in order
to generate policy e¤ort adequate to the task, not to convince the world that all real outcomes are
the result solely of policy e¤ort. Gaiha (2003) points out that while meeting the goals is �not
plausible,�they are nevertheless �useful in drawing attention to pervasive deprivation in developing
countries.�Like so many others he concludes, however, that the result of such attention should be
�a determined and co-ordinated e¤ort by the development community.�The realization that we are
far from utopia can motivate public action, in the area of education policy for instance, and public
action can certainly accomplish many good things. But this should not be the only lesson we draw.
We might also come to see that sound economic performance is essential to expanding educational
systems, and that the chaos brought on by poverty traps and economic misrule might do more to
make meeting the goals �not plausible�than anything that education funders and policymakers are
32

failing to do. The problem is that no one is sure how to break poverty traps nor how to conjure
up economic growth, nor that these challenges are vulnerable to even the most �determined and
co-ordinated e¤ort.�
9.3 Country speci�c goals, grounded in history
Why donor and recipient governments have signed up for yet another round of ambitious goals and
inevitable failure was discussed brie�y earlier but is not our focus here. It may be that there are
good political reasons why unprecedented progress has been labelled as �failure� in the past� and
will be again in 2015. But this label need not be heeded by those outside the game.
Table 15 shows what historically-grounded, country-speci�c education goals might look like for
six countries. The goal numbers, in italics, challenge each country to match the performance of the
typical developing country after 1960. That is, they challenge policymakers for each country to beat
the performance of roughly half the countries on earth, no small feat. For example, a historically-
based goal for Niger would be to have 45% net primary enrollment by 2015 and a ratio of girls�to
boys�gross primary enrollment of 0.83. Some would consider these unambitious, yet they assume
that Niger follows the typical transition speed in both areas, and certainly the goal of beating the
performance of roughly half the countries on earth is quite ambitious for Niger and its peers.
Of course �recommending�that countries set historically-based development goals is futile if the
reason for the cycle of ambitious goals is politically motivated, but at the very least the simple
formulas for country-speci�c goals implied by Tables 4 and 7 provide tools with which others may
challenge that political roundabout and question its normative conclusions. Equation (5) and Table
4, for example, imply that a country performing at the level of the typical country after 1960,
starting at net primary enrollment fraction s0 in year t0, will reach enrollment s in the year t =
t0 + (1=a) [ln ((1=s0)� 1)� ln ((1=s)� 1)], where a � 0:038.
10 Conclusion: What government can do
10.1 Act �rst outside the classroom
Just because goal-setters promise the moon and deliver merely the earth does not mean that aid
should not seek to do what it can, where it can, nor that recipient governments should not do
33

what is within their power to expand opportunities for education. But if there is a limited role
for education policy in working toward these goals, what is a well-intentioned government to do?
To be sure, governments can a¤ect educational outcomes with interventions including public health,
strengthening institutions, and promoting job opportunities for the poor. Miguel and Kremer (2003),
for example, have shown that an intenstinal worm treatment experiment decreased Kenyan school
absenteeism by one quarter. And Ablo and Reinikka (1998) �nd that building governance institutions
(read: battling corruption) can increase the degree to which education budgets bene�t children.
But many of these successful interventions begin to look suspiciously like economic development,
not heroic education policy. And economic development takes a long time. It might be better to
think of education expenditures as endogenously determined by economic and demographic devel-
opment, as in Schultz (1989) and by political and institutional forces as in Pritchett and Filmer
(1999) and Addison and Rahman (2001), not by goals, pledges, or huge omnibus international aid
co¤ers. Fuller and Rubinson�s (1992) sweeping century-and-a-half review of the institutional forces
shaping schooling expansion in today�s rich countries� bluntly entitled �Does the State Expand
Schooling?�� concludes,
Empirical evidence to date suggests that state actions� material and symbolic�can in�uence school enrollments under certain conditions. To review, the forms of e¤ec-tive action may include the political crafting of labor structures; opening the opportunitystructure and signaling that more schooling will yield economic returns; directly raisingthe supply of schools and pupil places; linking schooling to broader Western ideals re-garding enfranchisement, national integration, and individual development; and loweringperceived opportunity costs by restricting child labor and legitimating the school as thenormative location for socialization.
These actions can only be mounted by �strong states.�And underlying political-economic conditions de�ne the likelihood that strong actions can be legitimately pursuedand that they will hold actual e¤ects on school expansion. [...]
In nineteenth-century France [national schooling expansion was constrained by]a fragile, contested central state; low capital accumulation and industrialization; a per-sistently low level of economic integration; and relentless strength of the Church and itstraditional allies. Only when these contextual constraints on the state lessened wouldconstruction of schooling by the central political actors be possible. [...]
School construction continues. But state actors are no longer the master crafts-men.
10.2 But education policy remains important
This pattern persists; policy can move hills but not mountains. There is now ample evidence, for
example, that conditioned transfers for education make a di¤erence. These programs, made famous
34

by pioneering work in Mexico by PROGRESA (now known as Oportunidades) and successfully repli-
cated in various countries, can raise school enrollment rates among poor families (Morley and Coady
2003). Likewise, education policy approaches like India�s District Primary Education Program,
Ethiopia�s Basic Education Systems Overhaul, and Colombia�s PACES voucher program (among
many others) have produced documented results. Can these interventions a¤ect enrollments? Little
doubt remains. Can they cause enrollments to skyrocket in short periods? This we have every reason
to doubt. At the end of the day, poor people send their children to school if it will mean a better
life for the family over the long term than not doing so. The rewards of that decision continue to
depend far more on the job opportunities available to schooled children than on any of the above
interventions, no matter how successful.
Those opportunities are the key. Governments can encourage human capital investment by
reducing uncertainty in the economy (Levhari and Weiss 1974), they can listen to their citizens�
demands (Chen and Desai 1997, p. 423)� pressure for increased schooling went up in Kenya and
Malawi after the demise of repressive régimes� and they can soundly manage the economy to ensure
that bungled macro interventions the brain drain do not erase any positive impacts of schooling
on the economy (Rogers 2003). �Sound management�and �do no harm�are not in the least banal;
witness the massive declines in school enrollments in both Zimbabwe and Tanzania from 1985 to the
late 1990s. Both countries engaged in horrendous mismanagement of the economy while producing
strong budget allocations for education and plentiful rhetoric about their commitment to children.15
10.3 A fertility analogy
For some aspects of the development process, such as changes in women�s fertility, there is growing
(though by no means universal) acceptance in the donor community that the economic environment
is a fundamental causal factor (e.g. Schultz 2001). Most development policymakers will tell you
that families�fertility choices take place within an economic context that evolves slowly over time
and according to patterns that have been repeated over and over in various countries. The heads
of state who adopted the Millennium Development Goals notably refrained from declaring that the
fertility of every poor woman on earth shall be that of a Norwegian woman by 2015, refusing to seek
to buy this outcome with su¢ cient foreign aid or �getting serious�in imposing laws to that e¤ect.
15The World Bank�s World Development Indicators reports Zimbabwe�s expenditure per primary student as apercent of GDP per capita, averaged over the 1990s, as 18.8, above the LDC average of 13.3. Its total educationexpenditure as a percent of GDP was 8.2 percent, far above the LDC average of 4.5.
35
Until relatively recently many believed that low fertility could be bought, but acceptance has
grown in recent years that even the existence of some degree of �unmet need�in family planning does
not at all imply that any degree of fertility reduction is achievable in any time period if only the aid
intervention is large enough (e.g. Pritchett 1994, Sathar and Casterline 1998, Basu and Amin 2000).
Why, then, do many consider households�decisions to have children in a radically di¤erent light
from their decisions to invest in their childrens�schooling? Only a totalitarian state would accept
extremely ambitious development goals relating to fertility decisions; China�s ambitious national
goals in this arena may not have survived in an environment of democratic accountability, meeting
the same fate as did compulsory sterilization in India in 1970s. This does not mean that donors and
LDC governments have no fertility goals nor that they do nothing for the fertility transition; on the
contrary, they support it with countless aid interventions. But they do not set radical, Herculean
goals in the arena of fertility because they realize the limited impact of government policies in that
particular household decision in the absence of major changes in the economic sphere.
10.4 Success without saltum
The same realization seems not to have occurred widely in the �eld of education. �Incentives�and
�decentralized decisionmaking� are �alien terms to education, in both industrial and developing
countries,� decries Hanushek (1995). Abundant evidence suggests that families in poor countries
often realize their desired level of human capital investment in their children, and this desire is
shaped by many complex and interacting factors of which the existence of a nearby school or the
quality of the teacher therein may not be the most important. Goal-setters seeking to a¤ect that
desire may do well to better understand the incentives faced by those families before calling for
billions in supply-side education sector interventions, and outsiders seeking to understand ahistorical
proclamations of �failure�to meet education goals may do well to better understand the incentives
faced by goal-setters.
For a long time, academics have been noting from on high the stark fact of gradual economic
development� from Alfred Marshall�s economic slant on Darwin�s natura non facit saltum (�nature
does not make leaps�) through Göran Hydén�s classic No Shortcuts to Progress. And for a long time,
policymakers on the ground have called for immediate change� from former Brazilian President
Kubitschek�s ��fty years in �ve years�, to Samper�s Salto Social (�social leap forward�) in Colombia,
to James Wolfensohn�s current calls for a �quantum leap� by donors. Today, without doubt, the
36

international education policy arena has been conquered by the �leap to equality.�16 Perhaps after
the universal schooling goals for 2015 and then 2030 go unmet, while developing countries continue
to raise school enrollments at breakneck speeds, this will change. But even if it does not, let us
at least look askance at the coming proclamations of failure, and celebrate success where it occurs.
This foreboding century needs more to look forward to.
16Subtitle of the Education for All Global Monitoring Report 2003/4 published by UNESCO.
37

Table 1: Development goals for universal primary education
Goal year Approved Forum
� 1934 International Conference on Public Education, Geneva� 1948 UN Universal Declaration of Human Rights, New York� 1951 International Conference on Public Education, Geneva� 1952-54 UNESCO Regional Conferences on Free and Compul-
sory Education; Bombay, Cairo, and Lima1980 1960 UNESCO Meeting of Representatives of Asian Mem-
ber States on Primary and Compulsory Education,Karachi (�Karachi Plan�)
� 1961 UNESCO Conference of African States on the Devel-opment of Education in Africa, Addis Ababa (�AddisAbaba Plan�)
� 1962 UNESCO Conference of Ministers of Education andthose Responsible for Economic Planning, Santiago(�Santiago Plan�)
� 1966 UNESCO Conference of Ministers of Education andMinisters Responsible for Economic Planning in theArab States, Tripoli
� 1970 International Development Strategy for the SecondUN Development Decade, New York
2000 1979 UNESCO Conference of Ministers of Education andThose Responsible for Economic Planning of MemberStates in Latin America and the Caribbean, MexicoCity
� 1980 International Development Strategy for the Third UNDevelopment Decade, New York
� 1990 World Conference on Education for All, Jomtien(�Jomtien Declaration�)
� 1993 Education for All Summit of Nine High-PopulationCountries, Delhi (�Delhi Declaration�)
2015 1995 Fourth World Conference on Women, Beijing (�BeijingDeclaration and Platform for Action�)
� 1996 Shaping the 21st Century, OECD Development Assis-tance Committee
� 2000 World Education Forum, Dakar (�Dakar Declara-tion�)
� 2000 Millennium Summit, New York (�Millennium Decla-ration�)
� 2001 Road map towards the implementation of the UnitedNations Millennium Declaration
38

Table 2: Development goals for gender parity in education
Goal year Approved Forum
� 1960 UNESCO Convention against Discrimination in Edu-cation
� 1967 UN Declaration on the Elimination of Discriminationagainst Women
� 1981 UN Convention on the Elimination of All Forms ofDiscrimination against Women
1980 1975 World Plan of Action for the Implementation of theObjectives of the International Women�s Year, MexicoCity
1995 1980 Programme of Action for the Second Half of the UnitedNations Decade for Women, Copenhagen
2000 1985 Nairobi Forward-Looking Strategies for the Advance-ment of Women Towards 2000
� 1993 UNESCO and UNICEF Pan-African Conference onthe Education of Girls (�Ouagadougou Declaration�)
2005 1995 Fourth World Conference on Women, Beijing (�BeijingDeclaration and Platform for Action�)
� 1996 Shaping the 21st Century, OECD Development Assis-tance Committee
2015 2000 Millennium Summit, New York (�Millennium Decla-ration�)
� 2001 Road map towards the implementation of the UnitedNations Millennium Declaration
39

Table 3: Summary of data
Variable N � � Min. Max.
Panel 1960-2000Net primary enrollment 654 0.808 0.211 0.100 1.110Female net prim. enrol. 562 0.784 0.240 0.069 1.093Male net prim. enrol. 560 0.825 0.198 0.120 1.127Female net sec. enrol. 378 0.536 0.299 0.003 1.014Male net sec. enrol. 378 0.539 0.276 0.014 1.003Female/Male gross prim. enrol. 1,421 0.831 0.234 0.042 1.250Female/Male gross sec. enrol. 1,402 0.765 0.312 0.008 1.408
Panel 1865-1914Primary enrollment/population age <15 383 0.212 0.173 0.001 0.579
Cross section 1980Public expenditure on education/GDP 174 0.040 0.018 0.005 0.113Pupils/teachers, primary 163 0.310 0.132 0.068 0.815GDP per capita, PPP (hundreds $) 131 43.8 43.0 3.46 254% of population urban 190 0.453 0.237 0.0390 1.00Women�s lifetime fertility 184 4.45 2.01 1.41 9.93% value added in agriculture 132 0.205 0.158 0.002 0.720% value added in manufacturing 108 0.146 0.089 0.006 0.460% of adults with primary education 106 0.422 0.268 0.014 0.973% of adults with higher education 106 0.022 0.026 0.000 0.129Education Gini coe¢ cient 81 0.477 0.204 0.100 0.957% of parliament female 153 0.136 0.088 0.000 0.427% of labor force female 170 0.367 0.105 0.051 0.554Socialist dummy 207 0.101 0.302 0.000 1.000% pop. Hindu or Buddhist (1970) 205 0.052 0.178 0.000 0.923% pop. Muslim (1970) 205 0.209 0.341 0.000 0.998% pop. Christian (1970) 205 0.582 0.400 0.000 0.999% pop. �Ethnorelgionist�(1970) 205 0.069 0.143 0.000 0.669
40

Table 4: Quantifying the speed of the education transition, 1960-2000
Estimator OLS OLS Nonlinear LSDependent variable � ln (1=si;t � 1) � ln (1=si;t � 1) si;tSample All ijsi;t< 1008t All
Year 0.0381 0.0372 0.0426Std. error (0.00331) (.00337) (0.00259)95% conf. int. [0.0316, 0.0446] [0.0305, 0.0438] [0.0375, 0.0477]
Max. si;t { � 100} { � 100} 101Std. error (1.00)95% conf. int. [98.6, 103]
N 562 471 625Countries 129 108 138Avg. N=country 4.36 4.36 4.53Country dummies Yes Yes YesConstant term Yes Yes NoR2 0.820 0.828 0.916
Standard errors are in parentheses. Curly brackets indicate a value assumed by the model speci�cation. Square
brackets indicate 95% con�dence bounds on the coe¢ cient estimate.
41

Figure 1: The transition in net primary enrollment: all countries, 1960-2000
SOM
BFA
SOMMLI
SOM
NER
BFA
MLI
NER
AFG
BFANER
AFG
DJI
BFA
BDIMLINER
DJIBFA
GIN
BDI
MLINER
GMB
PAK
ERIDJIBFA
ETH
SAU
MOZGINAGO
MLI
GMB
ERI
DJI
HTISEN
CAFGNBETH
SAU
MOZ
GIN
BDI
GMB
TZA
OMN
MAR
HTI
LAO
SENSAUMOZGIN
BDI
TCD
NIC
ZAR
BGD
GMB
TZA
MWIOMN
MARGTM
HTI
CIV
IRN
SEN
CAF
RWA
SAU
MOZ
COMTCD
BENGMBTZA
MWI
OMN
MAR
GTM
COLHTICIVSENJOR
CAF
TGO
SAU
MOZ
LSO
NIC
MRTGHA
GMB
TZA
EGY
MWI
OMN
MARGTM
COL
HTI
CIV
IRQ
INDIRNSEN
CAFGNB
SLV
KWTSAU
BWA
MDGMMRNICBEN
MRTCMR
BGD
GMB
ZMB
TZA
EGYOMN
MAR
JOR
RWA
KWT
SAUBWA
LSOMDG
COM
YEM
NIC
ZAR
BENCMR
BGDPAK
SWZEGY
ARMYUG
MWI
OMN
MARLAO
IRQ
JORBRA
CAF
VEN
THA
RWATGO
KWT
BWA
LSOGNQNIC
ZAR
NPL
LBN
SWZ
MAR
GTM
LAOIRQPRY
IRN
ZAF
BRA
VEN
SYRPER
THA
RWA
TGO
KWTBWA
LSOAREQATECUNIC
HKGBHR
BGD
LBNZMB
SWZ
GTM
COL
BOL
IRQ
PRY
IRN
MDA
JOR
BRAVEN
SYR
PERHRV
TGO
BWA
CHE
LSO
LUX
ARE
QATZWEECUHNDNIC
MAC
BHR
TUNDZA
ZMB
SWZBOL
IRQ
PRYIRNKEN
JOR
BRA
PANSLVVEN
SYR
CYP
HRV
RWA
TGO
KWT
DEUBWA
CHEMNGLSOLUX
ARE
QAT
MEX
ECUNIC
CRIHKGTTO
DOM
BRNBHRDZAPRT
IDN
GRD
SWZGUY
COLIRQMUS
PRY
IRN
KENJOR
BRAPAN
SLVVEN
SYRPER
KWT
DEUBWACHE
MNG
LUXARE
MMR
QAT
LBYMEX
NAMAUTHNDCHLCRI
MACLVA
HKGDOM
BHR
TUN
DZA
PRT
IRL
IDN
SWZ
EGYGUYCOLBOL
IRQ
MUS
CZEPRY
ZAF
GABPAN
VEN
SYRPERCYP
URYDEU
CHE
KGZ
AREQAT
NAM
AUT
HND
CHL
CRIKAZ
LVA
HKG
TTO
BHR
TUNDZA
PRT
IRL
IDN
SWZEGYSVK
IRQ
MUS
CZEPRY
BRABRB
PANVENBLZ
SYRCYP
URY
CHE
KGZ
QAT
AUT
MYSHND
CRI
HUNNLDTTO
EST
BRN
BHR
TUN
ARG
DZA
PRTIRL
IDNBOL
TON
MUSPRY
BGR
ZAFROMPAN
VEN
SYRPERCYPURYJAMNCL
LUXMEX
SURECU
AUTCPV
CRI
CUB
NLDTTO
ESTBHRTUN
ARG
DZA
USA
PRT
IRL
IDNGUYMKDMUS
PRY
BGR
ROM
KEN
BRB
MLTVEN
SYR
PER
CYPTHA
URY
JAMLTUSVNNCLMEXECU
AUTCHL
PHLCPV
CRI
VNM
CUB
HUN
HKGNLDTTO
TUN
ARGUSA
PRT
IRLIDN
GUY
MKD
NOR
ANTMUSPRY
BGRTURBRB
MLT
PANBLZ
CYP
JAMLTUSVNCAN
MEXGRC
CHL
FJICRI
POL
CUB
HUN
NLDTTO
GEOARGUSA
PRT
IRL
GBRGUY
MKD
NOR
TUR
CHN
BRB
MLT
CYPJAMVUTCAN
MEX
GRC
CHL
FJIPHLPOLCUB
HUN
NLD
TTO
SGP
KHMUSA
PRT
IRL
GBRNOR
BGR
TURCHNWSMMLTWBGCANDNKGRC
AUT
FRA
MYS
AUS
FJI
PHL
CPVPOLCUBHUN
UGA
ABWNLD
TTO
SGP
KHM
BELGBRKORNOR
BGRCHN
WSMMLT
JAM
CANDNKGRC
AUT
FRAMYS
AUS
PHLVNM
POL
HUN
UGA
NLDSGPITABEL
GBR
KORNOR
BGR
MLTDNKGRCFRAAUSFJIPOL
ARG
GBR
KOR
NOR
BRB
MLTCOGDNK
GRC
FRAAUSPHL
POL
ARG
GBR
KOR
BHSNOR
COG
DNK
GRC
FRAMDV
AUSPHL
POL
SGP
BELGBR
KOR
BHSJPNFINGRCFRAAUS
ITA
BELKOR
JPNFINFRAITA
BELKORISL
ESP
NZL
JPNFRAALB
BEL
ISLNZLESPSWEJPNLCAFRA
ALBBELJPNESPNZLJPN
ESP
JPN
ESP
SWENZL
JPN
NZL
SWEESPPYF
JPNISRESPTJK
NZLSWE
025
5075
100
Net
prim
ary
enro
llmen
t
-150 -100 -50 0 50 100 150 Adjusted year
�Adjusted years�are the elapsed time since 50% enrollment. Datapoints show country-years, spaced quinquenni-
ally. Solid line shows �tted line from �rst column of Table 4, dotted lines show 95% con�dence interval on parameter
a from the same table.
42

Table 5: Quantifying the speed of the education transition, 1865-1914
Estimator OLS Nonlinear LSDependent variable � ln (1=si;t � 1) si;tSample All 35 16 richest All 35 16 richest
Year 0.0267 0.0273 0.0251 0.0231Std. error (0.00160) (0.00209) (.00171) (0.00289)95% conf. int. [0.0236, [0.0232, [0.0217, [ 0.0174,
0.0299] 0.0314] 0.0285] 0.0288]
Max. si;t { � 60} { � 60} 62.2 64.1Std. error (2.39) (4.13)95% conf. int. [57.4, 66.9] [ 55.9, 72.2]
N 383 174 383 174Countries 35 16 35 16Avg. N=country 10.9 10.9 10.9 10.9Country dummies Yes Yes Yes YesConstant term Yes Yes No NoR2 0.938 0.872 0.984 0.988
Standard errors are in parentheses. Curly brackets indicate a value assumed by the model speci�cation. Square
brackets indicate 95% con�dence bounds on the coe¢ cient estimate.
43

Figure 2: The transition in primary enrollment: 35 countries, 1865-1914
THATHATHATHATHATHATHATHATHATHATHA IDNIDNIDNIDNIDN
CHN
IDNINDCHN
IDNIND
EGY
CHN
IDNIND
EGY
CHNIDN
MMR
IND
EGY
CHNIDN
MMR
IND
EGY
IDNCHN
MMR
BRAIND
EGY
CHNMMRBRAIND
EGY
PER
CHNMMRBRAIND
EGYPER
CHN
MMRBRA
TUR
IND
EGYPER
CHN
MMRBRA
RUS
TUR
INDEGY
CHN
PERINDMMRBRA
RUS
TURYUG
EGY
COL
PHLPERMMRBRA
RUS
TURYUG
EGY
COL
PHLPERMMRBRA
RUS
TURYUG
MEX
COL
PHLMMR
PERBRARUS
TURYUG
PORMEX
COL
PHL
PER
BRA
RUSTURYUG
LKA
POR
CUB
MEX
CHLCOLPHL
BRAPERRUSTURYUGLKA
POR
CUB
MEX
CHLCOLPHL
PER
RUS
TURYUGLKA
POR
CUB
MEX
CHLPERCOL
PHL
ARGRUS
TUR
YUGLKA
POR
CUB
MEX
CHL
COL
PHL
TUR
ARGRUSYUGLKA
POR
CUB
MEXGRC
CHL
COL
PHLRUSARG
UGY
YUG
LKAPOR
CUB
MEX
GRC
CHL
COL
PHL
YUG
ARG
UGYLKAPOR
CUB
MEX
COL
PHL
GRC
CHL
ITA
ARG
UGYLKA
POR
CUB
MEX
GRC
CHL
ITA
ARGUGYLKA
PORMEX
CUB
GRC
CHL
JPN
ITAARGUGY
POR
LKA
CUB
GRC
CHL
JPN
ITAARGLKAUGY
CUBCHL
GRC
ESPJPN
AUS
ITAARGUGY
GRC
ESP
JPNAUS
ITA
ARG
UGY
DNK
GRC
ESPARG
JPN
GBR
AUSITA
UGY
DNK
GRC
ESP
JPN
GBR
AUSITAUGY
AUT
DNK
NZL
ESP
JPN
GBR
UGYAUSITA
AUT
DNK
NZL
ESP
JPNGBR
AUS
ITA
AUT
DNK
NZL
ESP
ITAJPNGBR
AUS
AUTDNK
NZL
ESP
JPNGBR
AUS
AUTDNK
NZL
JPN
SWE
ESP
NORGBRAUS
AUTDNK
NZL
SWE
ESP
NORGBR
AUS
AUT
DEU
DNK
ESP
NZL
SWE
AUS
NOR
GBR
AUT
DEU
DNK
NZL
SWE
NOR
GBR
AUT
DNK
DEUNZL
SWE
GBR
FRA
NORAUT
DEU
NZL
SWE
FRANOR
AUTNZLDEUCANSWEFRA
NOR
USA
DEUCAN
SWE
FRA
NORUSADEU
CAN
SWE
FRA
NORUSA
DEU
CAN
SWE
FRA
NORUSA
DEUSWE
CAN
FRAUSA
DEU
CANFRA
DEU
USACANFRA
USACANFRA
USA
CAN
FRAUSA
CAN
USA
CAN
USA
015
3045
60%
pop
. bel
ow a
ge 1
5 en
rolle
d in
prim
ary
scho
ol
-250 -200 -150 -100 -50 0 50 100 150 Adjusted year
�Adjusted years�are the elapsed time since 50% enrollment. Datapoints show country-years, spaced quinquenni-
ally.
44

Table 6: Determinants of primary net enrollment transition speed
Dependent variable � ln (1=si;t � 1)Year 0.0365*** �0.0516 0.0614*** �0.0307
(0.0125) (0.0534) (0.0166) (0.0480)[0.324] [�0.459] [0.549] [�0.275]
Year � educ. spending/GDP 0.198 0.119(0.309) (0.336)[4.41] [2.65]
Year � pupil-teacher ratio �0.0523 �0.0815(0.0478) (0.0588)[�8.40] [�13.1]
Year � GDP/capita PPP 0.000658** 0.000406(0.000291) (0.000333)
[26.7] [15.0]Year � urbanization �0.109** �0.0950**
(0.0448) (0.0458)[�38.5] [�33.5]
Year � fertility �0.000616 �0.000291(0.00505) (0.00506)[�1.53] [�0.0712]
Year � % value added agric. �0.126* �0.105(0.0748) (0.0725)[�22.6] [�18.8]
Year � % value added manuf. 0.173** 0.169*(0.0869) (0.0863)[18.4] [18.1]
Year � % adults w/ prim. educ. 0.106** 0.126**(0.0485) (0.0508)[30.8] [35.4]
Year � % adults w/ high. educ. �0.959*** �1.11***(0.359) (0.376)[�27.1] [�28.7]
Year � education Gini 0.183*** 0.185***(0.0546) (0.0546)[44.7] [44.6]
Country dummies Yes Yes Yes YesN 251 251 247 247Countries 51 51 50 50Avg. N=country 4.92 4.92 4.94 4.94R2 0.744 0.774 0.740 0.772Adjusted R2 0.677 0.702 0.673 0.700
Standard errors are in parentheses; standardized �beta� coe¢ cients are in square brackets. Signi�cant at * 10%,
**5%, ***1% level.
45

Table 7: Quantifying the speed of the gender transition in education, 1950-2000
Estimator OLS Nonlinear LS
Dependent variable � ln��sfi;t=s
mi;t
��1� 1�
sfi;t=smi;t
Type of gross enrollment Primary Secondary Primary Secondary
Year 0.0540 0.0653 0.0562 0.0539Std. error (0.00150) (0.00191) (0.00111) (0.00149)95% conf. int. [0.0511, [0.0615, [0.0541, [0.0510,
0.0570] 0.0690] 0.0584] 0.0569]
Max. si;t { � 100} { � 100} 101 113Std. error (0.352) (0.798)95% conf. int. [101, 102] [111, 114]
N 1,142 929 1,422 1,394Countries 168 139 188 181Avg. N=country 6.80 6.68 7.56 7.70Country dummies Yes Yes Yes YesConstant term Yes Yes No NoR2 0.890 0.823 0.936 0.893
Standard errors are in parentheses. Curly brackets indicate a value assumed by the model speci�cation. Square
brackets indicate 95% con�dence bounds on the coe¢ cient estimate.
46

Figure 3: The gender transition in primary enrollment: all countries, 1950-2000
AFGTCDTCDAFG
NPL
TCDBTN
AFG
GINSOMCAF
TCD
BTN
PAK
NERETHAFG
COM
MRT
GINSOMCAFMLINPL
TGO
TCDPAKNER
GMB
LBR
ETH
AFG
BFA
COM
CIV
MRT
GINSOM
CAF
MLI
NPL
TGO
TCDMARPAKGNBNERGMBLBR
ETH
AFG
SLE
BFA
COM
CIVMRTSEN
GIN
SOM
CAF
IND
MLI
NPL
IRQ
KHM
BEN
TGO
MOZMAR
PAK
GNBNERGMB
LAOSDN
LBR
NGA
ETH
UGA
AFG
SLE
BFA
COMCIV
SEN
GIN
SOM
CAF
IND
MLINPL
BDIIRQ
BENTGO
MOZ
TCD
LBY
MAR
PAKGNB
NER
SYRGMBLAOSDNNGAETH
YEMUGA
AFGSLEBFACOM
CIV
TUNMRTIRN
MWI
GINDZASOMCAF
SAU
IND
MLI
NPLDJI
AGO
BDIIRQ
KHMBENTGO
COG
MOZ
TCD
LBY
MAR
PAK
GNB
NER
SYRGMBLAO
SDN
LBR
NGA
ETHZAR
YEMSTP
UGAAFG
SLEBFA
CMR
CIV
TUN
MRTSEN
IRN
MWI
GIN
DZASOMCAF
SAUGHA
INDMLI
NPL
DJI
AGOBDI
IRQ
KHM
BENTGO
COG
MOZTCD
LBY
MAR
GAB
PAKGNBNER
SYR
GMB
LAOSDN
LBRNGAETHZAR
YEM
STP
BGD
UGA
SLE
BFA
COM
CIV
TUNMRT
SEN
IRN
MWI
GIN
DZA
SOM
CAF
SAUGHA
IND
MLI
NPL
OMN
TUR
AGO
BDI
IRQTZA
KHM
KEN
GTM
BEN
TGO
COG
HTITCD
LBY
MAR
GAB
PAK
GNBNER
SYRGMB
RWA
LAOSDNNGA
ETHZARSTP
BGD
UGASLE
BFACMR
COM
CIV
TUN
MRT
SEN
IRN
MWI
GINVNM
JOR
DZA
SOM
CAFSAU
GHA
IND
MLI
NPL
OMN
PNG
DJI
AGO
GNQBDI
IRQTZAKEN
GTM
BEN
TGO
COGEGYLBYMAR
GABPAKGNBNER
SYR
BRN
GMB
RWA
SDNLBRNGAETHZAR
BGD
UGASLE
BFA
CMRCOMCIV
TUN
MRT
KWT
BHR
BOLSEN
IRNMWIGINJOR
DZA
SOM
CAFSAU
GHAIND
MLI
OMN
PNG
DJI
TUR
ZWEBDI
IRQ
TZA
KEN
GTM
BENTGO
COG
EGYHTI
MOZ
LBY
MAR
GAB
PAK
GNB
NER
SYR
BRN
GMB
RWA
LAO
PERSDNLBR
NGA
ETH
ZAR
BGDUGA
CPV
MDGBFA
CMRCOM
CIVTUN
MRT
KWT
BOLSENLBN
IRNMWI
GIN
VNM
JOR
DZACAF
SAUGHAIND
MLI
OMNPNGDJIZWE
BDIIRQ
TZA
KEN
GTM
TGO
SLB
COG
SGP
EGY
MOZ
SWZ
LBY
MARNER
SYR
BRN
GMB
RWA
MMRLAO
PER
SDN
LBR
NGA
ETH
ZAR
PRYBGD
CPVMDGSLE
BLZ
BFA
VEN
CMRCOM
CIVTUN
IDN
MRT
KWT
BOL
SEN
ZMB
MWI
VNMJORDZA
ERI
SAU
GHAINDMLI
OMN
PNG
DJITUR
AGOBDIIRQ
TZA
KHM
KEN
GTMTGO
COG
SGP
EGY
MOZ
SWZ
LBY
MAR
SYRBRNGMB
RWALAO
SDN
NGAZAR
BGDALB
UGAMDG
SLE
BLZ
BFA
CMR
CIV
TUNIDN
KWT
BHR
CUB
BOLSEN
ZMBIRNMWI
JORDZAERI
SAU
GHAIND
OMN
THA
PNG
PAN
YUG
TUR
AGO
BDI
IRQ
TZA
KHMKENGTMSLB
COG
BRA
SGPEGY
MOZ
SWZ
LBY
MAR
ANTSYR
RWA
MMRLAOPERSDN
NGA
ZARPRY
BGD
ALB
UGA
CPV
SLE
BLZ
VEN
CMRTUN
IDN
KWTBHR
CUB
BOLSENZMBLBNIRN
MWI
VNM
JOR
DZA
SAU
MEX
IND
SLVOMN
THA
PNG
PANYUGTURAGO
ZWEIRQTZAKHMKEN
GTMCHNSLBCOG
BRA
SGPEGYHTI
MOZ
SWZ
LBYANT
SYR
JAM
RWA
LAOPER
LKA
PRY
ALB
UGA
PRT
CPV
MDG
BLZ
VEN
CMRTUN
IDNKWT
BHR
BOLECUZMB
IRNMWI
HKG
VNM
MUS
JOR
DZA
QAT
MEX
GHA
SLVPNG
PANTUR
AGO
ZWE
TZAKEN
GTMCHN
COG
BRAZAF
SGPEGY
HTISWZ
LBY
TONSYRBRN
JAM
RWAMMRLKAPRYALB
COL
CPV
MDG
VENESP
CMR
TUN
IDN
KWT
DOM
BHR
CUB
BOLECU
ZMBIRNMWI
HKG
VNM
MUS
JOR
DZA
QAT
GHA
URYSLVCHLTHAROMPANYUGTURGNQ
TZAKENPOL
GTMCHN
COGZAFSGP
FJI
HTISWZVUT
FRABRNNLD
JAM
RWAMMRPERLKATTO
HUN
PRYALBCOLPRTCPVMDGVENESP
IDNPYFKWTDOM
BHR
CUB
BOLECUZMB
HKG
CRIVNMMUS
JOR
HND
QATMEX
GHA
URY
SLVCHL
THAROMPANTURZWETZAKEN
GTM
MACCHN
BRA
ZAF
SGP
FJI
HTISWZ
VUT
GUYGABFRAVCTBRNNLDJAM
RWAMMRPERLKATTOBMUHUNMLT
ISR
PRYLCAALB
COLPRTCPVVEN
IDNKWT
DOMBHRCUBBOL
ECUZMBLBNUSAHKG
CRI
VNM
MUS
JORTJKQATMEXSLVCHLITACAN
THAROMPANTUR
ZWENZLTZAKENPOLBGR
GTM
MACCHNBRAESTSGPPRISWZ
VUT
GUYFRA
VCTBRNNLDJAMRWA
MMRPERUZBLKATTOBMU
HUNMLTPRYALB
COL
PRTCPVMDG
BLZ
DEUVENESPIDNPYF
KWTBHR
CUBECULBN
USA
HKGCRIVNM
MUSJORHNDTJKQATMEXSLVCHL
CHE
ITACANTHAROMPANZWENZLPOLBGRMAC
CHN
ABWBRABELESTSGP
FJI
LUXGRCSWZGUYFRAVCTCZE
BRN
NLDBLRJAMMMRPERLTUUZBLKATTOMDV
SYC
HUNMLTPRYALB
COL
PRT
GRDNCLMDGBLZDEUVENESP
IDNPYFKWTPLWBHR
CUBECUKGZLBNARG
MYS
HKGCRIMUSCYP
HND
TJKQAT
PHL
MEX
AREURY
SLVCHLCHEITACAN
ROM
PANKORZWENZLPOLBGRBEL
GBR
ESTSGPFJI
LUX
GRCSWZGUYAUTFRAVCTCZENLD
BLR
JAM
FINMMR
LTUUZBLKATTOMDVSYCHUNMLTISRPRY
BHS
ALBCOL
PRTGRDNCLMDGBLZ
DEUVENESPDOM
CUBECUKGZARGMYSHKGCRIMUSJPN
HNDQATPHLMEXMKDAREURYCHLCHEITACANTHAROMPANKORYUGAUSNZLPOLBGR
BRABELZAFGBRESTFJILUXLVAGRCSWZGUYAUT
FRA
ANT
CZENLDBLRJAM
FIN
MMRLTUUZBLKATTOMDVSYCHUNMLTISRPRYBHSALBCOL
PRTGRDNCLBLZ
DEU
VENESPDOMCUBECUKGZARGMYSHKGCRIMUSJPNCYPHNDQATPHLMEXMKDAREURYSLVCHLCHEITACANTHAROM
PAN
KORYUGAUSNZLPOLBGRDNKBRABELZAFGBRESTMDAFJILVAGRCGUYAUTFRACZETONTKMNLDJAMFINLTUTTOSYCHUNMLTISRBHSALBCOL
PRTUKRESPDOMCUBECUKGZ
ARGMYSHKG
CRIMUSJPNCYPHNDPHLMEXMKDAREURYSLVCHLCHEITACANTHAROMPANKORAUSNZLPOLBGRDNK
BRABEL
ZAF
GBRMDAFJILUXHRVLVAGRCKAZGUYAUTFRACZETKMNLD
JAMFINLTUTTOHUNMLTBHS
COL
PRTESPDOMECUKGZSVNARGUSAMYSCRIMUSJPNCYP
IRL
HNDPHLMEXAREURYSLVCHLCHEITACANROMKORAUSBRBNZLPOLBGR
DNKBELGBRMDAFJILUXHRVGRCKAZGUYAUTFRAMNG
WSM
NLDJAMFINTTOHUNISR
BHSCOLPRTUKRESPGEOAZENORECUSVNARGUSAMYSCRIMUSJPNCYPIRLHND
PHLAREURYCHLCHEITACANROMKORAUSBRBNZLPOLBGRDNKBELGBRMDAFJILUXHRVGRCKAZAUTFRAMNGWSMNLDFINTTOHUN
ISRCOLUKRESPGEO
AZE
NORSVNARMARGUSAMYSCRIJPNCYP
IRLHNDURYCHLITACANROMKORAUSBRBNZLPOLBGRDNKBELGBRMDAPRIFJIISLLUXGRCAUTFRA
MNG
WSMFINTTOHUNRUSISRUKRDEUGEOAZE
NOR
ARMARGUSAJPNCYPIRLHNDITACANKORAUSNZLDNKBELGBRPRIISL
LUX
GRCAUT
SVKMNGFINRUSISRDEUGEONORARMARGUSAJPNIRLITACANAUSBRBNZLDNKBELGBRLUXGRCSVKMNGRUSDEUGEONORARGJPNIRLBRBDNKGBRISLLUXSVK
MNG
RUSNORARGJPNSURIRLBRBDNKISLRUSNORJPNIRLDNKISLNORIRLISLNORIRLIRL
025
5075
100
125
150
Rat
io o
f fem
ale
gros
s pr
imar
y en
rollm
ent t
o m
ale
-100 -50 0 50 100 150 Adjusted year
�Adjusted years� are the elapsed time since 50% ratio of girls� gross primary enrollment to boys�. Datapoints
show country-years, spaced quinquennially.
47

Table 8: The net enrollment transition speed, by gender
Estimator OLSDependent variable � ln
�1=si;t � 1
�Type of net enrollment Primary SecondaryGender Female Male Female Male
Year 0.0412 0.0329 0.0662 0.0536(0.00434) (0.00422) (0.00293) (0.00267)
Country dummies Yes Yes Yes YesN 481 464 333 333Countries 122 120 92 92Avg. N=country 3.94 3.87 3.62 3.62R2 0.842 0.824 0.942 0.934Adjusted R2 0.789 0.763 0.920 0.909
Standard errors in parentheses.
48

Table 9: Determinants of the gender di¤erential in net enrollment transition speed
Dependent variable � ln�1=sfi;t�11=smi;t�1
�Type of net enrollment Primary SecondaryYear 0.00713*** 0.0221 0.0112*** 0.0159
(0.00261) (0.0350) (0.00137) (0.0229)[0.102] [0.316] [0.286] [0.407]
Year � GDP/capita PPP �0.000224 0.0000895(0.000149) (0.0000756)[�25.7] [18.3]
Year � % parliament female �0.00663 0.00357(0.0370) (0.0163)[�1.70] [1.80]
Year � Socialist dummy �0.0106 �0.0172**(0.0119) (0.00670)[�8.24] [�17.7]
Year � % labor force female 0.0515 �0.0200(0.0379) (0.0199)[13.0] [�7.94]
Year � % adults w/ prim. educ. 0.0649** 0.00499(0.0225) (0.0106)[49.9] [6.27]
Year � % fertility 0.00839** 0.00137(0.00350) (0.00170)
[49.2] [13.2]Year � % Christian �0.0940*** �0.0178
(0.0281) (0.0199)[�102] [�31.5]
Year � % Muslim �0.0915*** 0.00972(0.0310) (0.0219)[�85.0] [14.8]
Year � % Hindu or Buddhist �0.0603 0.00593(0.0386) (0.0252)[�20.2] [2.86]
Year � % �Ethnoreligionist� �0.108*** 0.00113(0.0355) (0.0235)[�52.4] [0.817]
Country dummies Yes Yes Yes YesN 290 290 238 238Countries 71 71 63 63Avg. N=country 4.08 4.08 3.78 3.78R2 0.750 0.783 0.821 0.877Adjusted R2 0.669 0.698 0.756 0.822
Standard errors are in parentheses; standardized �beta� coe¢ cients are in square brackets. Signi�cant at * 10%,
**5%, ***1% level.
49

Figure 4: Net primary enrollment scenarios for Burkina Faso
020
4060
8010
0
N
et p
rimar
y en
rollm
ent,
%
1960 1980 2000 2020 2040 2060 2080 2100 Year
Actual Typical post-1950Typical rich 19th C. 2015 goalBurkina Faso trend
50
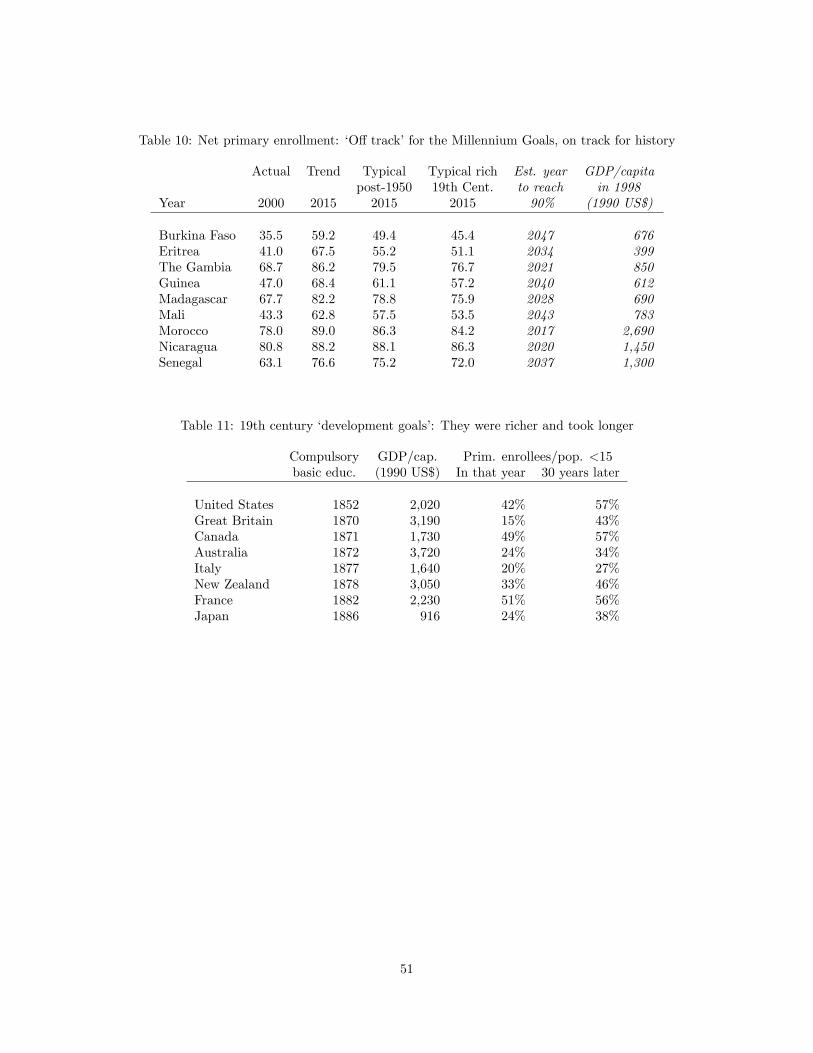
Table 10: Net primary enrollment: �O¤ track�for the Millennium Goals, on track for history
Actual Trend Typical Typical rich Est. year GDP/capitapost-1950 19th Cent. to reach in 1998
Year 2000 2015 2015 2015 90% (1990 US$)
Burkina Faso 35.5 59.2 49.4 45.4 2047 676Eritrea 41.0 67.5 55.2 51.1 2034 399The Gambia 68.7 86.2 79.5 76.7 2021 850Guinea 47.0 68.4 61.1 57.2 2040 612Madagascar 67.7 82.2 78.8 75.9 2028 690Mali 43.3 62.8 57.5 53.5 2043 783Morocco 78.0 89.0 86.3 84.2 2017 2,690Nicaragua 80.8 88.2 88.1 86.3 2020 1,450Senegal 63.1 76.6 75.2 72.0 2037 1,300
Table 11: 19th century �development goals�: They were richer and took longer
Compulsory GDP/cap. Prim. enrollees/pop. <15basic educ. (1990 US$) In that year 30 years later
United States 1852 2,020 42% 57%Great Britain 1870 3,190 15% 43%Canada 1871 1,730 49% 57%Australia 1872 3,720 24% 34%Italy 1877 1,640 20% 27%New Zealand 1878 3,050 33% 46%France 1882 2,230 51% 56%Japan 1886 916 24% 38%
51

Table 12: Average net primary enrollment: Out-of-sample predictive power of the S-curve
Net primary enrollment Actual Predicted Actual PredictedIn year 1990 2000 2000 2015Uses data available in � 1990 � 2000
Sub-Saharan Africa 58.3 68.5 68.7 79.6South Asia 65.7 74.9 77.7 86.1Middle East/North Africa 76.9 83.8 80.6 88.0Latin America/Caribbean 85.6 90.2 92.4 95.6High-Income Non-OECD 90.3 93.6 90.6 94.4Eastern Europe/Central Asia 92.1 94.8 93.7 96.3High-Income OECD 96.7 97.8 98.1 98.9East Asia/Paci�c 98.1 98.8 94.9 97.0
Table 13: Gender ratio in net primary enrollment: Out-of-sample predictive power of the S-curve
Fem./Male primary enrollment Actual Predicted Actual PredictedIn year 1990 2000 2000 2015Uses data available in � 1990 � 2000
Sub-Saharan Africa 79.9 88.1 85.9 93.2South Asia 77.9 86.8 90.0 95.3Middle East/North Africa 84.4 91.0 91.4 96.0Latin America/Caribbean 99.3 99.6 98.0 99.1High-Income Non-OECD 98.2 99.0 98.5 99.3Eastern Europe/Central Asia 99.2 99.6 98.4 99.3High-Income OECD 100.2 � 99.7 99.9East Asia/Paci�c 94.7 97.1 97.2 98.8
52

Table 14: Case studies in policy and outcomes: Best practice or bubble?
Spending PublicUNESCO-reported per primary educ. Primary
Net prim. enrollment (year) student, spending, pupils/Country From To % GDP/cap. % GDP teacher
TypicalBolivia 75.5 (1975) 97.1 (1998) 12.0 4.6 25.1Brazil 69.8 (1970) 97.0 (2000) 11.8 4.1 23.8Ecuador 73.0 (1965) 96.9 (1996) 5.6 2.6 27.2Paraguay 76.0 (1960) 92.1 (2000) 6.9 3.4 23.1Swaziland 62.3 (1970) 92.8 (2000) 8.5 6.3 33.0Syria 66.0 (1965) 96.3 (2000) 12.9 3.5 23.9Tunisia 75.5 (1970) 95.8 (1992) � 5.4 35.0
StagnationIran 80.9 (1985) 73.6 (2000) 8.3 4.5 29.9Kenya 88.0 (1975) 68.5 (2000) 11.6 6.6 30.6Tanzania 67.8 (1980) 46.7 (2000) � 2.5 37.1Venezuela 81.0 (1960) 83.8 (1996) 3.0 4.4 22.2
Rapid rise?Malawi 49.7 (1990) 100.6 (2000) 7.0 4.2 62.8Rwanda 65.9 (1990) 97.3 (2000) 6.9 2.6 55.1Togo 60.5 (1985) 92.3 (2000) 8.8 5.0 48.9Uganda 48.0 (1993) 109.5 (2000) 7.7 2.1 38.2Botswana 75.6 (1980) 93.3 (1990) 6.8 5.7 32.2Indonesia 72.4 (1975) 98.1 (1985) � 2.1 29.1
World average 14.0 4.5 27.5LDC average 13.3 4.5 30.8
Note: In late 2003, UNESCO issued a revised set of estimates for net primary enrollment in the years 1998-2001
only. Since revised estimates were not issued for earlier years, this study uses the pre-revision estimates of enrollment
during 1998-2001 in order to strive for comparability with the pre-1998 �gures. This decision is discussed in detail in
the appendix. The post-revision changes relevant to this table do not a¤ect the table�s qualitative message and are
con�ned to �ve changes� two of which di¤er from the pre-revision estimate by 1% or less, and two of which changed
the previous estimate to a missing observation. These post-revision �gures are: Bolivia (1998) 98; Syria (2000) 95;
Malawi (2000) no data ; Togo (2000) 91; and Uganda (2000) no data.
53

Figure 5: What it would take to meet the net primary enrollment goal
-0.1 -0.05 0 0.05 0.1 0.15 0.2 0.25Estimated transition speed, 1960-2000
AREARGBENBOLCOLDZAECUGUYHKGHNDIRQJORMLINICNORPRYQATSAUSENSLVTUN
BRABRBCAFCANCHECHLCUBDEUDJIFRAGBRJAMJPNKORLSOMOZNERPOLPRTTHATTOURYUSAVEN
BDIBFABGDBWACIVEGYGINGMBGTMIDNLAOMARMWIOMNPANPERRWASWZTGO
AUSAUTBGRCRICYPGRCHTI
HUNIRL
KWTTZAZAR
MKDZMBSOM
BHRDNKIRNLUXMEXMUSNLDSYR
CPVFJI
MLT
Transition speed necessary to reach 95% by 2015,starting from 50% in 2003 (0.245)
Starting from 60% (0.211)
Starting from 70% (0.175)
Starting from80% (0.130)
54

Table 15: Examples of country-speci�c, historically-grounded education goals
Net prim. GenderGender GDP/cap. enrollment ratio, prim.
Income Enrollment ratio Example $PPP 2000 2000 2015 2000 2015
Lower Lower Lower Niger 750 30 45 68 83Lower Higher Lower Benin 1,000 70 85 69 84Higher Lower Higher Saudi Arabia 11,400 58 71 96 98Higher Higher Higher Namibia 6,400 82 89 100 �Medium Higher Lower India 2,400 86 92 83 92Medium Medium Lower Morocco 3,600 74 84 87 94
55

References
Ablo, Emmanuel and Ritva Reinikka (1998), �Do budgets really matter? Evidence from publicspending on education and health in Uganda,�Policy Research Working Paper 1926, Africa Region,Macroeconomics 2, World Bank, June.
Addison, Tony and Aminur Rahman (2001), �Why is so little spent on educating the poor?�Dis-cussion Paper 29, World Insititute for Development Economics Research (Helsinki: United NationsUniversity).
Aguirre, Benigno E. and Roberto J. Vichot (1996), �Are Cuba�s educational statistics reliable?�inAssociation for the Study of the Cuban Economy (ASCE), Cuba in Transition, Vol. 6, proceedingsof the 5th Annual Meeting, University of Miami, Miami, Florida, August 8-10, pp. 371-386.
Ahuja, Vinod and Deon Filmer (1995), �Educational attainment in developing countries: Newestimates and projections disaggregated by gender,�Policy Research Working Paper 1489, WorldBank.
Ainsworth, Martha, Kathleen Beegle, and Godlike Koda (2002), �The impact of adult mortality onprimary school enrollment in Northwestern Tanzania,�Africa Region Human Development WorkingPaper Series, World Bank.
Al-Samarrai, Samer and Hassan Zaman (2002), �The Changing Distribution of Public EducationExpenditure in Malawi,�Africa Region Working Paper Series No. 29, March.
Al-Samarrai, Samer and Tessa Peasgood (1998), �Educational Attainments and Household Char-acteristics in Tanzania,�Economics of Education Review, 17 (4): 395�417.
Appleton, Simon (2000), �Education and health at the household level in sub-Saharan Africa,�Working Paper 33 (Cambridge, MA: Harvard University Center for International Development).
Basu, Alaka Malwade and Sajeda Amin (2000), �Conditioning factors for fertility decline in Bengal:History, language identity, and openness to innovations,�Population and Development Review, 26(4): 761-794.
Becker, Gary (1964), Human capital: A theoretical and empirical analysis, with special referenceto education (New York: Columbia University Press).
Bedi, Arjun S., Paul K. Kimalu, Damiano Kulundu Manda, and Nancy Malufa (2003), �Thedecline in primary school enrollment in Kenya,�Discussion Paper No. 14 (Nairobi: Kenya Institutefor Public Policy Research and Analysis).
Behrman, Jere R. (1987), �Schooling in developing countries: Which countries are the over- andunderachievers and what is the schooling impact?�Economics of Education Review, 6 (2): 111-127.
Bell, Clive, Shantayanan Devarajan, and Hans Gersbach (2003), �The Long-run Economic Costsof AIDS: Theory and an Application to South Africa,�Working Paper 3152, World Bank.
Bénabou, Roland (1996), �Equity and e¢ ciency in human capital investment: The local connec-tion,�Review of Economic Studies, 63: 237-264.
Benavot, Aaron, Phyllis Riddle (1988), �The expansion of primary education, 1870-1940: Trendsand issues,�Sociology of education, 61 (3): 191-210.
Benhabib, Jess and Mark M. Spiegel (2000), �The Role of Financial Development in Growth andInvestment,�Journal of Economic Growth, 5 (4): 341-360.
56

Bils, Mark and Peter J. Klenow (2000), �Does Schooling Cause Growth?�, American EconomicReview, 90 (5), pages 1160-83.
Binder, Melissa (1999), �Schooling indicators during Mexico�s �Lost decade,��Economics of Edu-cation Review 18: 183�199
Borjas, George J. (1995), �Ethnicity, neighborhoods, and human-capital externalities,�AmericanEconomic Review, 85 (3): 365-390.
Bose, Niloy, M. Emranul Haque, and Denise R. Osborn (2003), �Public expenditure and growth indeveloping countries: Education is the key,�Discussion Paper 30, Centre for Growth and BusinessCycle Research, University of Manchester.
Branson, William H., Isabel Guerrero, and Bernhard G. Gunter (1998), �Patterns of development,1970-1994,�WBI Working Paper, World Bank.
Bredie, Joseph W. B. and Girindre K. Beeharry (1998), �School enrollment decline in Sub-SaharanAfrica: Beyond the Supply Constraint�Discussion Paper 395, World Bank.
Brown, Philip H. and Albert Park (2002), �Education and poverty in rural China,�Economics ofEducation Review 21: 523�541.
Bruns, Barbara, Alain Mingat, and Ramahatra Rakotomalala (2003), A Chance for Every Child:Achieving Universal Primary Education by 2015 (Washington, DC: World Bank).
Burney, Nadeem A. and Mohammad Irfan (1995), �Determinants of child school enrolment: evi-dence from LDCs using choice-theoretic approach,� International Journal of Social Economics, 22(1): 24-40.
Canagarajah, Sudharshan and Harold Coulombe (1997), �Child labor and schooling in Ghana,�Policy Research Working Paper 1844, World Bank.
Castro-Leal, Florencia (1996), �Who bene�ts from public education spending in Malawi? Resultsfrom the recent education reform,�Discussion Paper 350, World Bank.
Chen, Lincoln C. and Meghnad Desai (1997), �Paths to social development: Lessons from case-studies,�in Santosh Mehrotra and Richard Jolly, eds., Development with a Human Face: Experiencesin Social Achievement and Economic Growth (Oxford: Clarendon Press).
Chenery, Hollis B. and Moshe Syrquin (1975), Patterns of Development: 1950-1970 (London:Oxford University Press).
Cogneau, Denis (2003), �Colonisation, School and Development in Africa: An empirical analysis,�Document de travail DT/2003/01 (Paris: Unité de Recherche CIPRÉ, Institut de recherche pour leDéveloppement).
Colclough, Christopher (1982), �The impact of primary schooling on economic development: Areview of the evidence,�World Development, 10 (3): 167-185.
Colclough, Christopher and Samer Al-Samarrai (2000), �Achieving schooling for all: Budgetaryexpenditures on education in Sub-Saharan Africa and South Asia,�World Development 28 (11):1927-1944.
Das, Jishnu, Stefan Dercon, James Habyarimana, and Pramila Krishnan (2003), �When Can SchoolInputs Improve Test Scores?�forthcoming Policy Research Working Paper, Development Economics,World Bank.
57

De Gregorio, José (1996), �Borrowing constraints, human capital accumulation, and growth,�Jour-nal of Monetary Economics, 37 (1): 49-71.
Deininger, Klaus (2003), �Does cost of schooling a¤ect enrollment by the poor? Universal primaryeducation in Uganda,�Economics of Education Review, 22: 291-305.
Delamonica, Enrique, Santosh Mehrotra, and Jan Vandemoortele (2001), �Is EFA a¤ordable? Es-timating the global minimum cost of �Education for All,��Innocenti Working Paper 87, Florence:UNICEF Innocenti Research Centre.
Devarajan, Shantayanan, Margaret J. Miller, and Eric V. Swanson (2002), �Goals for development:History, prospects, and costs,�Policy Research Working Paper 2819, April, World Bank.
Du�o, Esther (2001), �Schooling and labor market consequences of school construction in Indonesia:Evidence from an unusual policy experiment,�American Economic Review, 91 (4): 795�813.
Duncan, Tyrrell, Keith Je¤eris, and Patrick Molutsi (1997), �Botswana: Social development in aresource-rich economy,� in Santosh Mehrotra and Richard Jolly, eds., Development with a HumanFace: Experiences in Social Achievement and Economic Growth (Oxford: Clarendon Press).
Duraisamy, P. Estelle James, Julia Lane, and Jee-Peng Tan (1997), �Is There a Quantity-QualityTradeo¤ as Enrollments Increase? Evidence from Tamil Nadu, India,�Working Paper 1768, Educa-tion Division, Human Development Department, World Bank.
Duraisamy, P. (2002), �Changes in returns to education in India, 1983�94: by gender, age-cohortand location,�Economics of Education Review, 21: 609�622
Easterlin, Richard A. (1981), �Why isn�t the whole world developed?�Journal of Economic History,41 (1):1-19.
Edmonds, Eric V. (2003), �Does child labor decline with improving economic status?�WorkingPaper 10134 (Cambridge, MA: National Bureau of Economic Research).
Eteki-Mboumoua, William A. (1972), �Africa,� in UNESCO, In the minds of men: Unesco 1946to 1971 (Paris: United Nations).
Filmer, Deon and Lant Pritchett (1998), �The e¤ect of household wealth on educational attainment:Demographic and health survey evidence,�Policy Research Working Paper 1980, World Bank.
Filmer, Deon, Elizabeth M. King, and Lant Pritchett (1998), �Gender Disparity in South Asia:Comparisons between and within Countries,�Policy Research Working Paper 1867, World Bank.
Filmer, Deon (2003), �School availability and school participation in 21 developing countries,�mimeo, World Bank.
Fredriksen, Birger (2002), �Education for All African Children by 2015: What will it take tokeep the promise?�Paper prepared for the Annual Bank Conference on Development Economics �Europe, Oslo, June 24-26.
Fuller, Bruce and Richard Rubinson (1992), �Does the State Expand Schooling? Review of theEvidence,� in Bruce Fuller and Richard Rubinson, eds., The Political Construction of Education:The State, School Expansion, and Economic Change (New York: Praeger).
Gaiha, Raghav (2003), �Are millennium goals of poverty reducation useful?�Oxford DevelopmentStudies, 31 (1):59-84.
58

Glewwe, Paul, Nauman Ilias, Michael Kremer (2003), �Teacher Incentives�Working Paper 9671,National Bureau of Economic Research
Glick, Peter and David E. Sahn (2000), �Schooling of girls and boys in a West African country: thee¤ects of parental education, income, and household structure,�Economics of Education Review,19: 63�87.
Global Campaign for Education (2003), Must try harder: A �School Report�on 22 rich countries�aid to basic education in developing countries (Brussels: Global Campaign for Education).
Godo, Yoshihisa, and Yujiro Hayami (2002), �Catching Up in Education in the Economic Catch-upof Japan with the United States, 1890�1990,�Economic Development and Cultural Change, 50 (4):961-78.
Goldin, Claudia (1999), �A brief history of education in the United States,�Historical Paper 119(Cambridge, MA: National Bureau of Economic Research).
Goldin, Claudia and Lawrence Katz (1997), �Why the United States led in education: Lessonsfrom secondary school expansion, 1910 to 1940,�Working Paper 6144 (Cambridge, MA: NationalBureau of Economic Research).
Goldin, Claudia and Lawrence Katz (2003), �Mass secondary schooling and the state: The role ofstate compulsion in the high school movement,�Working Paper 10075 (Cambridge, MA: NationalBureau of Economic Research).
Guruge, W. P. Ananda (1986), �Growing Up in UNESCO�with ROEAP� in �UNESCO in Asiaand Paci�c: 40 Years on,�Bulletin of the UNESCO Regional O¢ ce for Education in Asia and thePaci�c, 27 (November).
Haddad, Wadi. D., Martin Carnoy, Rosemary Rinaldi, and Omporn Regel (1990), �Education anddevelopment: Evidence for new priorities,�Discussion Paper 95, World Bank.
Handa, Sudhanshu (2002), �Raising primary school enrolment in developing countries: The relativeimportance of supply and demand,�Journal of Development Economics 69: 103-128.
Hanushek, Eric A. (1995), �Interpreting recent research on schooling in developing countries,�World Bank Research Observer, 10 (2): 227-46.
Harbison, Frederick and Charles Myers, eds. (1965),Manpower and Education (New York: McGrawHill), p. xi.
Harmon, Colm, Hessel Oosterbeek, and Ian Walker (2003), �The returns to education: Microeco-nomics,�Journal of Economic Surveys, 17 (2): 115-155.
Herz, Barbara, K. Subbarao, Masooma Habib, and Laura Raney (1991), �Letting girls learn:Promising approaches in primary and secondary education,�Discussion Paper 133, World Bank.
Hildreth, C. and C. Houck (1968), �Some estimators for a linear model with random coe¢ cients,�Journal of the American Statistical Association, 63: 584-595.
Holmes, Jessica (1999), �Measuring the determinants of school completion in Pakistan: analysis ofcensoring and selection bias,�Economics of Education Review, 22: 249-264.
Johnston, J. (1984), Econometric Methods (New York: McGraw-Hill).
Jónasson, Jón Tor� (2002), �Policy and reality in educational development: an analysis based onexamples from Iceland,�Journal of Education Policy, 17 (6): 659-671.
59

King, Elizabeth (1996), �Education, work, and earnings of Peruvian women,�Economics of Edu-cation Review, 15 (3):213-230.
King, Elizabeth M. and M. Anne Hill (1993), Women�s Education in Developing Countries: Bar-riers, Bene�ts, and Policies (Baltimore: Johns Hopkins University Press).
Krueger, Alan B. and Mikael Lindahl (2000), �Education for Growth: Why and For Whom?�Working paper 7591, National Bureau of Economic Research (Cambridge, MA: NBER).
Landon-Lane, John S. and Peter E. Roberston (2003), �Can government policies increase nationallong-run growth rates?�Paper prepared for the Royal Economic Society Conference, University ofWarwick, April.
Lavy, Victor (1996), �School supply constraints and children�s educational outcomes in ruralGhana,�Journal of Development Economics, 51: 291-314.
Levhari, David and Yoram Weiss (1974), �The e¤ect of risk on the investment in human capital,�American Economic Review, 64 (6): 950-963.
Lin, T.-C. (2003), �Education, technical progress, and economic growth: the case of Taiwan,�Economics of Education Review, 22: 213-220.
Lindert, Peter (2001), �Democracy, decentralization, and mass schooling before 1914,�WorkingPaper No.104, Agricultural History Center, University of California, Davis.
Maddison, Angus (2001), The World Economy: A Millennial Perspective (Paris: OECD).
Mankiw, N. G. (1997), �Comment,� in Ben Bernanke and Julio Rotemberg, eds., NBER Macro-economics Annual 1997 (Cambridge, MA: NBER).
Marshall, Alfred (1920), Principles of Economics (New York: Macmillan and Co., Ltd.). Libraryof Economics and Liberty. 9 December 2003.
McMahon (1998), �Education and Growth in East Asia,�Economics of Education Review 17 (2):159-172.
Mehrotra, Santosh (1997), �Human development in Cuba: Growing risk of reversal,� in SantoshMehrotra and Richard Jolly, eds., Development with a Human Face: Experiences in Social Achieve-ment and Economic Growth (Oxford: Clarendon Press).
Meyer, John W., Francisco O. Ramírez, and Yasemin Nuho¼glu Soysal (1992),�World expansion ofmass education, 1870-1980,�Sociology of Education, 65 (2): 128-149.
Miguel, Edward and Michael Kremer (2003),�Worms: Identifying Impacts on Education and Healthin the Presence of Treatment Externalities,�forthcoming Econometrica.
Mincer (1958), �Investment in human capital and income distribution,�Journal of Political Econ-omy, 66 (4): 281-302.
Mincer, Jacob (1974), Schooling, Experience, and Earnings (New York: Columbia UniversityPress).
Mingat, Alain, Ramahatra Rakotomalala, and Jee-Peng Tan (2002), Financing Education for Allby 2015: Simulations for 33 African Countries, Human Development Sector, Africa Region (Wash-ington, DC: World Bank).
Morley, Samuel and David Coady (2003), From Social Assistance to Social Development (Wash-ington, DC: Center for Global Development and International Food Policy Research Institute).
60

Oxfam (2002), �Broken Promises? Why donors must deliver on the EFA action plan,� GlobalCampaign for Education Brie�ng Paper, September 23.
Pal, Sarmistha (2003), �How Much of the Gender Di¤erence in Child School Enrolment Can Be Ex-plained? Evidence from Rural India,�Working Paper, Economics Section, Cardi¤ Business School,UK.
Papagni, Erasmo (2002), �Human Capital, Fertility, and Growth under Borrowing Constraints,�Working paper, Dipartimento di Diritto ed Economia, Università di Napoli II.
Pritchett, Lant (1994), �Desired fertility and the impact of population policies,�Population andDevelopment Review, 20 (1): 1-55.
Pritchett, Lant (2002), �When will they ever learn? Why all governments produce schooling,�mimeo, John F. Kennedy School of Government, Harvard University.
Pritchett, Lant (2003), �Does learning to add up add up? The returns to schooling in aggregatedata,�forthcoming chapter in Handbook of Development Economics.
Pritchett, Lant and Deon Filmer (1999), �What Education Production Functions Really Show: APositive Theory of Education Expenditures,�Economics of Education Review 18 (2): 223-239.
Psacharopoulos, George and Ana Maria Arriagada (1989), �The determinants of early age humancapital formation: Evidence from Brazil,� Economic Development and Cultural Change, 37 (4):683-708.
Ram, Rati (1999), �Tropics, income, and school life expectancy: an intercountry study,�Economicsof Education Review 18: 253�258.
Republic of Uganda (1999), �The Ugandan experience of Universal Primary Education (UPE),�Ministry of Education and Sports, July.
Rogers, Mark (2003), �Directly unproductive schooling: How country characteristics a¤ect theimpact of schooling on growth,� Discussion Paper 166, Department of Economics, University ofOxford.
Sathar, Zeba and John B. Casterline (1998), �The onset of fertility transition in Pakistan,�Popu-lation and Development Review, 24 (4): 773-796.
Sawada, Yasuyuki (2003), �Income risks, gender, and human capital investment in a developingcountry,�Discussion Paper, Graduate School of Economics, University of Tokyo.
Say, Jean-Baptiste (1855 [�rst published 1803]), A Treatise on Political Economy (Philadelphia:Lippincott, Grambo & Co.) Trans. C. R. Prinsep. Ed. Clement C. Biddle. Library of Economics andLiberty. 9 December 2003.
Schott, James C. (1998), Seeing Like a State (New Haven: Yale University Press).
Schultz, Theodore W. (1961), �Investment in human capital,�American Economic Review, 51 (1):1-17.
Schultz, T. Paul (1988), �Expansion of public school expenditures and enrollments: Intercountryevidence on the e¤ects of income, prices, and population growth,�Economics of Education Review,7 (2): 167-183.
Schultz, T. Paul (2001), �The fertility transition: Economic explanations,�Discussion Paper 833,Economic Growth Center, Yale University.
61
Schultz, Theodore W. (1989), �Investing in people: Schooling in low-income countries,�Economicsof Education Review, 8 (3): 219-223.
Shapiro, David and B. Oleko Tambase (2001), �Gender, poverty, family structure, and investmentsin children�s education in Kinshasa, Congo,�Economics of Education Review 20: 359�375.
Simon, Julian L. and Rebecca Boggs (1997), �Trends in the quantities of education: A pictorialessay,�Economics of Education Review, 16 (1): 69-80.
Siphambe, H. K. (2000), �Rates of return to education in Botswana,� Economics of EducationReview 19: 291�300.
Smith, Adam (1904 [�rst published 1776]), An Inquiry into the Nature and Causes of the Wealthof Nations. Methuen and Co., Ltd. 1904. Ed. Edwin Cannan. Library of Economics and Liberty. 9December 2003.
Spohr, Chris A. (2003), �Formal schooling and workforce participation in a rapidly developing econ-omy: evidence from �compulsory�junior high school in Taiwan,�Journal of Development Economics,70: 291-327.
Stasavage, David (2003), �On the role of democracy in Uganda�s move to Universal Primary Edu-cation,�Background paper for the World Bank�sWorld Development Report 2003/4, London Schoolof Economics.
Stromquiest, Nelly P. (1989), �Determinants of educational participation and achievement of womenin the third world: A review of the evidence and a theoretical critique,� Review of EducationalResearch, 59 (2): 143-183.
Swamy, P. (1970), �E¢ cient inference in a random coe¢ cient regression model,�Econometrica, 38:311-323.
Tansel, Ays¬t (2002), �Determinants of school attainment of boys and girls in Turkey: individual,household and community factors,�Economics of Education Review, 21: 455�470.
Thomas, Vinod, Yan Wang, and Xibo Fan (2001), �Measuring Education Inequality: Gini Coe¢ -cients of Education,�Policy Research Working Paper 2525 (Washington, DC: World Bank)
Torres, Rosa María (2000), One decade of Education for All: The challenge ahead (Buenos Aires:International Institute of Educational Planning).
UNESCO (1962), Report of Meeting of Ministers of Education of Asian Member States Participat-ing in the Karachi Plan (Bangkok: Post Publishing Co.).
UNESCO (1966), An Asian model of educational development: Perspectives for 1965-80 (Paris:UNESCO).
UNESCO (1993), Trends and Projections of Enrollment by Level of Education and by Age : 1960-2025. Paris, UNESCO, 1993 Call No: LB 2846 .U65.
UNESCO (2002), Education for All: Is the world on track? (Paris: UNESCO).
Vandemoortele (2003), �Are the MDGs feasible?�Development Policy Journal (United NationsDevelopment Program), 3 (April): 1-22.
Verhulst, P.F. (1838), �Notice sur la loi que la population suit dans son accroissement,�Correspon-dence Mathématique et Physique, publiée par A. Quetelet, 10: 113-121.
62
Wils, Annababette (2003), �National Transitions to Full Literacy: Patterns of Timing, GenderInequality and Regional Di¤usion,�Working Paper, Academy of Educational Development, Wash-ington, DC.
Wils, Annababette and Raymond O�Connor (2003a), �The Transition to Education for All: GeneralPatterns and Timing,�Working Paper, Academy of Educational Development, Washington, DC.
Wils, Annababette and Raymond O�Connor (2003b), �The causes and dynamics of the globaleducation transition,�Working Paper, Academy of Educational Development, Washington, DC.
Wils, Annababette, and Anne Goujon (1998), �Di¤usion of education in six world regions, 1960-90,�Population and Development Review, 24 (2): 357-368.
World Bank (1995), �Sta¤Appraisal Report: Republic of Togo Education Rehabilitation Project,�Report No. 13648-TO, Population and Human Resources Division, West Central Africa Dept., AfricaRegion, June 7 (Washington, DC: World Bank).
World Bank (1997), �Pakistan. Improving basic education: Community participation, system ac-countability, and e¢ ciency,�Report No. 14960-PAK, Population and Human Resources Division,Country Department I, South Asia Region, World Bank.
World Bank (2002a), Getting serious about meeting the Millennium Development Goals: A Com-prehensive Development Framework progress report (Washington, DC: World Bank).
World Bank (2002b), �Achieving universal primary education in Uganda: The �big bang�approach,�Education Notes, Human Development Network, April.
World Bank (2003). �Education in Rwanda: Rebalancing resources to accelerate post-con�ict de-velopment and poverty erradication,� Report No. 26038-RW, Human Development Department(AFTH3), Africa Region, World Bank.
63

A Appendix: UNESCO�s 2003 data revision
During the course of 2003, the UNESCO Institute of Statistics (UIS) revised its latest estimates ofnet primary enrollment in 1998 to 2001 as part of its ongoing process of working with its membergovernments to correct errors in reported statistics. Among the changes was that of what UISdescribed as �capping�net enrollment rates over 100%, that is, the data are censored from above at100%; several other types of corrections were also made. The estimates in this paper use quinquennialdata, so only one observation (the year 2000) is a¤ected by the change. This presents a researchdilemma: 1) use the pre-revision estimates for 2000 in order to assure comparability with the datafrom 1995 and before, or 2) replace the previous estimates for 2000 with the revised estimates?The choice was made in this study to use the pre-revision estimates for 2000 in the regression
analysis. This is justi�ed by several considerations:First, estimates of the transition speed in Table 4 and Figure 1 depend entirely on time series
dynamics, so it is important to strive for comparability across time wherever possible. Net primaryenrollment �gures currently available from UNESCO for the years 1995 and before do not complywith the same standard used to revise the 1998-2001 numbers. Thus if the number of studentsenrolled in primary school in Mexico increased between 1990 and 2000, but the census in both yearsunderestimated the total number of children in the appropriate age group so that both the 1990and 2000 �gures exceeded 100%, then leaving these �gures uncensored would allow the enrollmentincrease to be re�ected in the regression results whereas censoring both at 100% would hide thisincrease.Second, for the vast majority of countries, the divergence between the pre-revision and post-
revision estimates of 2000 net primary enrollment is small, as Figure 6 shows.Third, the mean of the di¤erence between the two estimates for 143 countries in the year 2000 is
�0:914 (signi�cantly less than zero at the <1% level) with a standard deviation of 3:32, representedin Figure 7. That is, the pre-revision estimates typically overestimated, to a small degree, net primaryenrollment in the year 2000. Replacing the pre-revision estimates with the post-revision estimatescould only, therefore, decrease the estimated transition speed. Thus all qualitative conclusionsregarding the remarkable slowness of the transition would be una¤ected were the revised data to beused.Fourth, any measurement error introduced by using pre-revision enrollments instead of post-
revision enrollments would not decrease the transition speed estimates via standard attentuationbias since the error is in the regressand, not the regressor, of equation (5).
B Appendix: Enrollment vs. completion
The second Millennium Development Goal is that �by 2015, children everywhere, boys and girlsalike, will be able to complete a full course of primary schooling� (UN 2001). The net enrollmentfraction is not exactly equal to the fraction of children who complete primary school. The lattercan, however, serve as an upper bound on the former. Thus a country that requires until the year2030 to reach 90% net primary enrollment can only reach 90% primary completion at some pointlater than 2030. The analysis of Table 4 can then be understood as a lower bound on the time oftransition to primary completion. This can be demonstrated both theoretically and empirically.
Proposition 1 The percent of each age cohort completing each grade of primary school (P c) mustbe less than percent net primary enrollment in all grades up to and including that grade (P e).Proof. Let 0 � fg;t � 1 be the fraction of those who completed grade g � 1 in year t � 1 whocomplete grade g in year t and enroll in grade g + 1. Let f0;t be the net intake rate to �rst gradeamong children of age to do so. The fraction of the age cohort that completes grade k in year t isP ck;t �
Qki=0 fi;t�k+i. Net enrollment in grades 1 through k during the school year that ends in year t
64

Figure 6: Net primary enrollment in the year 2000, before and after the 2003 UNESCO data revision
NER
DJI
BFA
AGO
ERIMLI
TZA
ETH
GIN
GNB
BDI
MOZ
CAFCOMSAUTCD
GHA SENMRT
CIV
OMNZMB
PAK
KWTYEMMDGKEN
GMBBEN
GNQ
NPL
IRN
LBN
MAR
LSO
MDAZWENIC
SLVLAONAM
KGZMMR
GRD
BWAGTM
MACTHADEU
ARE
GABHNDVENCOLKAZMNGCHLBGD
ZAF
SVKHUNIRLCZEURYAUTCRITONLVAPRY
SUR
IDNTGO
MKDTTODOMEGYPHLSWZROMIRQCHNSVNJORBGRANTLTUMUSJAMUSACYPGEOVNM
KHM
AUSBHR
VUT
SYRLUXWBGWSMBOLABW
BRACUBGRCRWAESTALB
POLGUYDZAMYSCANCPVGBRCHEMDVMLTTUN
NZLDNKFJIECUKOR
FRALCAITABLZNLDPANFINBELISRJPNNORISLESPSWE
TJKMEXPERBRBARG
2040
6080
100
120
Pos
t-rev
isio
n
20 40 60 80 100 120 Pre-revision
is P ek;t � (1=k)Pk�1
j=0 Pcj;t. Assuming k is small enough that f0;t�k � fk;t8k, which is to say that attri-
tion rates do not change too rapidly over time, then we have P ek;t=Pck;t =
Pki=0
�Qij=0 fk�j;t
��1> 1
8 k � 2.
This relationship is easliy seen empirically as well. Figure 8 uses �gures on net intake rate ingrade 1 and persistence rate to grade 5 from the World Bank�s World Development Indicators toconstruct a measure of the fraction of each age cohort completing primary school. It then comparesthese �gures to net primary enrollment, with a 45� line added for reference.
C Appendix: Comparing transition rates from enrollment�gures in di¤erent units
School enrollments for the period 1865-1914 are in units of total population enrolled in primaryschool of any age divided by number of people under age 15 in the larger population. Call this�modi�ed gross enrollment.�Net primary enrollment is measured in units of number of children ofschool age enrolled in primary school divided by number of people in the larger population that areof school age. Thus we can de�ne the relationship between modi�ed gross enrollment (smg) and netenrollment (sn) as smg � (�1=�2) sn, where �1 is one plus the fraction of enrollees who are older thanschool age, and �2 is one plus the fraction of people under age 15 who are not of school age (such
65

Figure 7: Histogram of the di¤erence between post-revision and pre-revision estimates of net primaryenrollment in the year 2000
0.1
.2.3
.4.5
Den
sity
-20 -10 0 10 20 Difference between post-revision and pre-revision
as infants). The rate of change of smg is thus _smg=smg = _sn=sn + _�1=�1 � _�2=�2 which by equation(5) is equal to a (smax � s) + _�1=�1 � _�2=�2. Thus estimates of the transition speed a obtained fromusing smg and smax = 62% are comparable to estimates of a obtained from sn and smax = 101% ifand only if _�1=�1 � _�2=�2 = 0, of which a case is _�1=�1 = _�2=�2 = 0.In other words, if the age structure of those who typically attend school and the age structure of
the larger population change very slowly over time, estimates of a derived from smg are comparableto those derived from sn. Aside from New Zealand and Ceylon, the rate of population growth wasnot changing fast enough in the 35 countries examined during 1865-1914 for a panel regression ofpopulation growth on time to yield a statistically signi�cant coe¢ cient (results not reported). Thisat least suggests that _�2=�2 was small. If _�1=�1 was large, this would place an upward bias onestimates of a using smg, making the results in Table 5 an upper bound on the transition speed fornet primary enrollment at that time. Any such bias would thus only reinforce the conclusion thatthe typical transition speed for net primary enrollment during 1865-1914 was slower than during1960-2000.
66
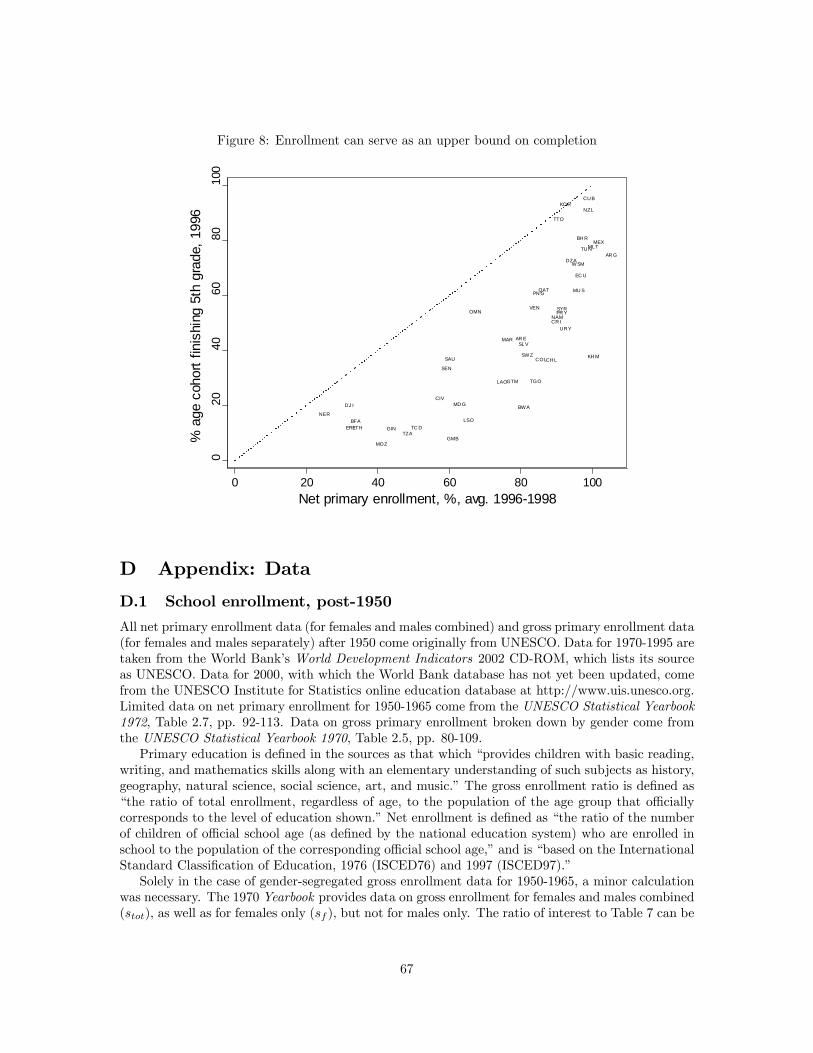
Figure 8: Enrollment can serve as an upper bound on completion
DZAAR G
BH R
BW A
BFA
KH M
TC D
CHLCOL
CRI
CIV
CUB
DJ I
EC U
SL V
ER IETH
GMB
GTM
GIN
KOR
LAO
LSO
MD G
ML T
MU S
MEX
MAR
MOZ
NAM
NZL
NER
OMN
PN G
PR Y
QAT
W SM
SAU
SEN
SW Z
SYR
TZA
TGO
TTO
TU N
AR E
URY
VEN
020
4060
8010
0
%
age
coh
ort f
inis
hing
5th
gra
de, 1
996
0 20 40 60 80 100 Net primary enrollment, %, avg. 1996-1998
D Appendix: Data
D.1 School enrollment, post-1950
All net primary enrollment data (for females and males combined) and gross primary enrollment data(for females and males separately) after 1950 come originally from UNESCO. Data for 1970-1995 aretaken from the World Bank�s World Development Indicators 2002 CD-ROM, which lists its sourceas UNESCO. Data for 2000, with which the World Bank database has not yet been updated, comefrom the UNESCO Institute for Statistics online education database at http://www.uis.unesco.org.Limited data on net primary enrollment for 1950-1965 come from the UNESCO Statistical Yearbook1972, Table 2.7, pp. 92-113. Data on gross primary enrollment broken down by gender come fromthe UNESCO Statistical Yearbook 1970, Table 2.5, pp. 80-109.Primary education is de�ned in the sources as that which �provides children with basic reading,
writing, and mathematics skills along with an elementary understanding of such subjects as history,geography, natural science, social science, art, and music.�The gross enrollment ratio is de�ned as�the ratio of total enrollment, regardless of age, to the population of the age group that o¢ ciallycorresponds to the level of education shown.�Net enrollment is de�ned as �the ratio of the numberof children of o¢ cial school age (as de�ned by the national education system) who are enrolled inschool to the population of the corresponding o¢ cial school age,�and is �based on the InternationalStandard Classi�cation of Education, 1976 (ISCED76) and 1997 (ISCED97).�Solely in the case of gender-segregated gross enrollment data for 1950-1965, a minor calculation
was necessary. The 1970 Yearbook provides data on gross enrollment for females and males combined(stot), as well as for females only (sf ), but not for males only. The ratio of interest to Table 7 can be
67

proxied with sf=sm � (2 (stot=sf )� 1)�1, assuming that school-age cohorts in the greater populationcontain roughly equal numbers of girls and boys.
D.2 School enrollment, pre-1914
Data for pre-1914 primary enrollment as a fraction of the total population in Argentina, Brazil,Burma (Myanmar), Ceylon (Sri Lanka), China, Egypt, France, Germany, India, Netherlands In-dies (Indonesia), Italy, Japan, Mexico, the Philippines, Russia, Serbia (Yugoslavia), Spain, Siam(Thailand), the Anatolian portion of the Ottoman Empire (Turkey), and the United States arefrom Richard A. Easterlin (1981), �Why Isn�t the Whole World Developed?�Journal of EconomicHistory, 41(1)(March):1-19., and Richard A. Easterlin (1996), Growth Triumphant (Ann Arbor:University of Michigan Press), p. 61. Data for Austria-Hungary (Austria), Australia, Canada,Chile, Colombia, Denmark, Greece, Norway, Peru, Portugal, Sweden, and Uruguay are from ArthurS. Banks (1976), Cross-National Time Series, 1815-1973 [Computer File], ICPSR ed. Ann Arbor,MI: Inter-University Consortium for Political and Social Research [producer and distributor] andArthur S. Banks (1971), Cross-Polity Time Series Data (Cambridge, MA: MIT Press).Data for New Zealand come from G. T. Bloom�eld (1984), New Zealand: A Handbook of His-
torical Statistics (Boston: G. K. Hall & Co.), p. 110. Data for Cuba come from Susan Schroeder(1983), Cuba: A Handbook of Historical Statistics (Boston: G. K. Hall & Co.). Data for Colom-bia are estimated based on José Antonio Ocampo, et al. (1997), Historia Económica de Colombia(Bogotá: Presidencia de la República), pp. 160-1, and Gabriel Poveda Ramos (1979), Dos Siglosde Historia Económica de Antioquia (Medellín: Biblioteca Pro Antioquia), p. 95. Data for Ceylon(Sri Lanka) come from Colonial Secretary�s O¢ ce (1914), Ceylon Blue Book (Colombo: H.C. CottleGovernment Printer), front endsheet.To obtain primary enrollment as a fraction of the population below age 15, the above �gures
for primary enrollment as a fraction of the total population were divided by the fraction of thepopulation below age 15. This latter statistic was gathered as follows:Data for fraction of the population below age 15 (the �youth dependency ratio�) for Argentina,
Australia, Austria-Hungary, Brazil, Burma, Canada, Denmark, France, Germany, Greece, India,Italy, Japan, Mexico, Norway, Portugal, Russia, Spain, Sweden, and the United States come from theappropriate volume of B. R. Mitchell (1981), European Historical Statistics, 2nd rev. ed., Macmillan,London; B. R. Mitchell (1998), International Historical Statistics, Africa, Asia & Oceania, 3rd ed.,St. Martin�s Press, New York; or B. R. Mitchell (1998), International Historical Statistics, TheAmericas, 4th ed., St. Martin�s Press, New York. Figures for Chile are from Markos J. Mamalakis(1989), Historical Statistics of Chile, Vol. 2, Greenwood Press, New York. Figures for Ceylonare approximated using a straightforward demographic model employing population growth �guresfrom the 1914 Ceylon Blue Book op. cit., and viable birth and infant mortality statistics from L.J. B. Turner (1923), Report on the Census of Ceylon 1921 (Colombo: H. Ross Cottle, GovernmentPrinter), pp. 11, 15.Youth dependency ratio statistics for China are gathered from a range of sources, giving a picture
of trends in the ratio from 1771 to 1990. Data for 1771-1835 and 1872 are from Ping-ti Ho (1959),Studies on the Population of China 1368-1953, Harvard University Press, Cambridge, Mass., pp. 59,68. A benchmark from 1842 is in Gilbert Rozman (1982), Population and Marketing Settlements inCh�ing China, Cambridge University Press, 1982, p. 59. A �gure from 1953 is in S. Chandrasekhar(1960), China�s Population: Census and Vital Statistics, Hong Kong University Press, Hong Kong, p.47, and �gures from 1953, 1964, and 1982 are in Li Chengrui (1992), A Study of China�s Population,Foreign Languages Press, Beijing. A datapoint for 1958 is in Chai Sunglin (1977), Population andPopulation Policy in Mainland China, Asia and the World Forum, Monograph 6, Taipei, Taiwan, p.56. Benchmarks for 1926, 1929, 1931, 1934, and 1947 are in Yang Zi Hui (1995), China HistoricalPopulation Data and the Relevant Studies, China Reform Publishing House, Beijing, pp. 1364,1366, 1369. The general agreement of these disparate �gures on long-term trends in the population
68

structure allows con�dent interpolation for 1870-1914.Youth dependency data for Colombia come from Mitchell op. cit. 1998, Ocampo 1997 op. cit.
p. 160, and Poveda op. cit. p. 95. Data for Cuba are from Schroeder, op. cit., pp. 51-3. Abenchmark for Egypt in 1917 is from Mitchell 1998 op. cit., and in preceding years the Egyptianyouth dependency ratio is assumed to change at the same rate as that of India. Data for Indonesiaare from Boomgaard and Gooszen, op. cit. pp. 200-3. Figures for New Zealand are in Bloom�eldop. cit., pp. 48-50. Peruvian �gures for 1876 are benchmarked in Alida Díaz (1974), El CensoGeneral de 1876 en el Perú, Seminario de Historia Rural Andina, Lima, Table 8, page 33. Theseare compared with post-1940 statistics in Mitchell 1998 op. cit. to reveal long-term trends in thePeruvian population structure. For the Philippines, there is a 1918 benchmark in Felipe Buencamino,Sr. (1921), Census of the Philippine Islands, Vol. 2, Census O¢ ce of the Philippine Islands, Manila,p. 65, and a 1903 benchmark in J. P. Sanger (1905), Census of the Philippine Islands, Vol. 2,United States Bureau of the Census 1905, p. 65. Serbian data come from Holm Sundhaussen(1989), Historiche Statistik Serbiens 1834-1914, R. Oldenbourg Verlag, Munich p. 114. Data forThailand in 1911, 1925, 1947, and 1960 come from the Statistical Year Book of the Kingdom of Siampublished by the Ministry of Finance, and data points for 1929 and 1937 are in Mitchell 1998 op.cit. Together these give a clear view of long-term trends in the Thai population structure that allowcon�dent extrapolation to the period 1870-1913. For Turkey, an 1886 benchmark can be found inJustin McCarthy (1982), The Arab World, Turkey, and The Balkans (1878-1914): A Handbook ofHistorical Statistics, G. K. Hall & Co., Boston, p. 87, and comparison points for 1935-1960 are inMitchell 1998 op. cit., giving a clear picture of long-term trends in Turkish demographic structure.Uruguayan dependency ratios for 1900 and 1908 are in Mitchell 1998 op. cit., and before 1900 theyare assumed to have changed at the same rate as did those for Argentina.
D.3 Additional data
Data on GDP per capita at Purchasing Power Parity, percent of national income devoted to educationexpenditure, ratio of primary pupils to teachers, urbanization, fraction of value-added in the manu-facturing and agricultural sectors, female lifetime fertility, and fraction of the labor force that is fe-male come from the World Bank�s World Development Indicators 2003 CD-ROM. Data for educationGini coe¢ cients come from Vinod Thomas, Yan Wang, and Xibo Fan (2001), �Measuring EducationInequality: Gini Coe¢ cients of Education,�Policy Research Working Paper 2525 (Washington, DC:World Bank), whose dataset is available at http://www.worldbank.org/devforum/�les/Ginidata.xls.Fraction of the adult (age 15+) population with primary, secondary, and higher education completeis from Robert Barro and Jong-Wha Lee (2000), �International Data on Educational AttainmentUpdates and Implications,�Working Paper 7911 (Cambridge, MA: National Bureau of EconomicResearch), whose dataset is available at http://www.cid.harvard.edu/ciddata/ciddata.html. Frac-tion of the national legislature that is female comes from UNIFEM (2002), Progress of the World�sWomen 2002 (New York: United Nations), Table 7, p. 43. Fraction of the population of di¤erentreligions in 1970 comes from David B. Barrett, George T. Kurian, and Todd M. Johnson (2001),World Christian Encyclopedia (New York: Oxford University Press), Vol. 1. Classi�cations of cer-tain countries as �socialist� are given in Janos Kornai (1992), The socialist system : the politicaleconomy of communism (Princeton, N.J.: Princeton University Press).
E Appendix: Past development goals
Information for Tables 1 and 2 was gathered from the following sources.
69

E.1 Universal primary education
E.1.1 No goal year
The Geneva 1934 meeting is discussed in UNESCO [1979], International Conference on Education:Recommendations 1934-1977 [Paris: United Nations Educational, Scienti�c and Cultural Organi-zation], p. 1. The Universal Declaration of Human Rights, adopted by the United Nations in NewYork in 1948, states in Article 26: �Everyone has the right to education. Education shall be free,at least in the elementary and fundamental stages. Elementary education shall be compulsory.�In1951, meeting again in Geneva, the International Conference on Public Education, recommended:�Plans for the full enforcement of compulsory education, in the spirit of Article 26 of the UniversalDeclaration of Human Rights adopted on the 10th December, 1948, should be drawn up withoutdelay in those countries where the problem arises�(UNESCO [1979] op. cit., p. 87).In 1951, UNESCO planned a series of regional conferences on free and compulsory education.
The �rst was the Regional Conference on Free and Compulsory Education in South Asia and thePaci�c, held in Bombay in 1952. UNESCO member states in the region were �invited to drawup during 1953 and 1954 their long-term general plans for the extension of free and compulsoryeducation� (UNESCO [1954], Compulsory Education in South Asia and the Paci�c: Report of theBombay Conference, December 1952 [New York: United Nations], p. 135).Similar meetings for the Middle East and Latin America likewise discussed the goal without
setting a speci�c date. These were the UNESCO Conference on Free and Compulsory Educationin the Arab Countries of the Middle East, held in Cairo in 1954, and the UNESCO RegionalConference on Free and Compulsory Education in Latin America (MINEDLAC I), held in Limain 1956. (�Because of the unwillingness of the Arab states to join with Israel in an internationalgathering, this conference was not organized by Unesco but by Egypt. However, Unesco providedsome technical services.�H. C. Laves and Charles A. Thomson [1957], UNESCO: Purpose, Progress,Prospects [Bloomington, IN: Indiana University Press], p. 387)
E.1.2 Goal year 1980
The UNESCO Regional Meeting of Representatives of Asian Member States on Primary and Com-pulsory Education took place in Karachi, Pakistan from December 28th 1959 to January 9th 1960.The Karachi meeting set the ambitious goal of universal primary education (seven years) throughoutthe region by the year 1980. Similar UNESCO meetings for Africa, Latin America, and the MiddleEast produced a goal of universal primary education by 1980 for those regions. These were the Con-ference of African States on the Development of Education in Africa, which was held in Addis Ababain 1961 and produced the �Addis Ababa Plan,�and the Conference of Ministers of Education andThose Responsible for Economic Planning, which occurred in Santiago, Chile in 1962 and producedthe �Santiago Plan,� and the Conference of Ministers of Education and Ministers Responsible forEconomic Planning in the Arab States, held in Tripoli in 1966.In Tokyo in 1962, the Karachi Plan was modi�ed to take a more ��exible�approach to the 1980
goal: �We have heard and examined the reports from the 18 Asian States, and have been impressedwith the resolute e¤orts of these countries to implement the Karachi Plan, during the two yearswhich have elapsed since its formulation. Although we are at various stages of educational andeconomic development, most of us hope to achieve the target of at least seven years of primaryeducation by 1980, some of us will achieve it earlier, while others will complete a �rst phase of 4-5years compulsory schooling within this decade. Under the circumstances educational and economicprevailing in our countries, this �exible approach and application of the Karachi decisions to ourcountries is considered a wise procedure.�(UNESCO [1962], op. cit., paragraph 1).In 1966, UNESCO issued a follow-up report on the Karachi Plan, including projections of educa-
tional attainment in Asia over the following decade and a half (UNESCO [1966], An Asian model ofeducational development: Perspectives for 1965-80 [Paris: UNESCO]). While several governments
70

in the region had prepared national plans for implementing the Karachi Plan, some had not, andmost others had plans that departed to varying degrees from the numbers in the Karachi Plan.India�s goal was 100% enrollment for the 6-11 age group by 1976; Pakistan�s was 100% enrollmentin grades 1-5 by 1985; Afghanistan�s was 50% primary enrollment by 1980; the Phillippines�was90% enrollment of 7 year-old children by 1980; Burma�s was 100% primary enrollment by 1970;Iran�s was 100% of the age 7-13 age-group by 1983; and Laos and Nepal had no national plans (pp.22-23). The implicit recognition was that Afghanistan, Laos, and Nepal would certainly not meetthe Karachi Plan goal.In 1970 the UN General Assembly adopted the International Development Strategy for the
Second UN Development Decade, which lists among the goals of the decade �achieving enrolment ofall children of primary school age�(Resolution 2626 XXV, Document A/8124 and Add. 1, paragraph18[b]).
E.1.3 Goal year 2000
On December 4-13, 1979, the UNESCO Conference of Ministers of Education and Those Responsiblefor Economic Planning of Member States in Latin America and the Caribbean, held in Mexico City,recommended to the member states in its Final Report �that they make a speci�c endeavour tobring about full and e¤ective exercise of the right to education and to ensure that all children receiveeducation of the requisite duration and quality so that illiteracy may be eradicated before the endof the present century. . . � In 1980, the UN issued its International Development Strategy for theThird UN Development Decade in New York, stating the goal of �the closest possible realization ofuniversal primary enrolment by the year 2000�(General Assembly Resolution A/RES/35/56 Annex,paragraph 46).In 1985, the 23rd UNESCO General Conference in So�a approved its �Plan of action to eradicate
illiteracy by the year 2000.�These goals were rea¢ rmed in 1990, when the World Conference onEducation for All in Jomtien, Thailand stated that �countries may wish to set their own targets forthe 1990s in terms of the following proposed dimensions: . . . Universal access to, and completionof, primary education (or whatever higher level of education is considered as �basic�) by the year2000� (World Conference on Education for All: Meeting Basic Learning Needs [1990], Frameworkfor Action to Meet Basic Learning Needs, adopted March 5-9 in Jomtien, Thailand, paragraph 8).At the UNESCO Sixth Conference of Ministers of Education and Those Responsible for Economic
Planning in African Member States, held Dakar, Senegal in 1991, the ministers recommended asliding scale of education goals for di¤erent countries, including �adoption of national strategiesthat di¤er according to the degree of development of basic education, with a view to achieving thegoals of the global strategy: countries with a net enrolment ratio of less than 40 per cent would aimat doubling that ratio; countries with a net enrolment ratio of between 40 and 49 per cent wouldaim at a target of 75 per cent; countries with a net enrolment ratio of between 50 and 70 per centwould aim at a target of 80 per cent; the other countries would aim at universal school enrolment�(Final Report, Paragraph 5).In December 1993, representatives of some of the most populous developing countries (Bangladesh,
Brazil, China, Egypt, India, Indonesia, Mexico, Nigeria, and Pakistan) met in Delhi at the Educationfor All Summit of Nine High-Population Countries to launch the �E-9 Initiative.�They rea¢ rmedtheir interest in �the commitment to the goal of education for all and in intensifying their e¤ortsto achieve it by the year 2000 or at the earliest possible moment� (UNESCO [1994], The DelhiDeclaration and Framework for Action, paragraph 4.3)
E.1.4 Goal year 2015
In 1995 the United Nations�Fourth World Conference on Women issued its Beijing Declaration andPlatform for Action, where �strategic objective�B1 calls for: �By the year 2000, universal access tobasic education and completion of primary education by at least 80 per cent of primary school-age
71

children�as well as �universal primary education in all countries before the year 2015�(paragraph82[b]).On May 6-7, 1996, the 34th High Level Meeting of the OECDDevelopment Assistance Committee�
representing all major donor nations� adopted a report entitled Shaping the 21st Century: The Con-tribution of Development Co-operation. This document was the �rst attempt to collect in one placea set of quantitative development goals embracing poverty, education, child health, and environ-ment that had been discussed at several di¤erent international meetings, and was accompanied bya promise of �adequate resources�for achieving the targets (p. 2). These goals included �universalprimary education in all countries by 2015.�The largest-ever gathering of heads of state occurred in New York City in the year 2000. There,
at the Millennium Summit, 147 presidents, prime ministers, and monarchs unanimously issued theMillennium Declaration, in which the leaders �resolve . . . by the year 2015 . . . to ensure that . . .children everywhere, boys and girls alike, will be able to complete a full course of primary school-ing�(United Nations [2000], United Nations Millennium Declaration, General Assembly resolutionA/RES/55/2 [New York: UN], paragraph 19).The o¢ ce of the Secretary General proposed in September of the following year a set of Mil-
lennium Development Goals, of which �goal 2�and �target 3� is: �Ensure that, by 2015, childreneverywhere, boys and girls alike, will be able to complete a full course of primary schooling�(UnitedNations [2001], Road map towards the implementation of the United Nations Millennium Declara-tion, General Assembly document A/56/326 [New York: UN], p. 56).
E.2 Gender parity in education
E.2.1 No goal year
In 1920-1 and again in 1923-24, the Phelps-Stokes Fund in New York launched what may have beenthe �rst development �missions�to Africa. A team of US, British, and South African governmento¢ cials, Christian church o¢ cials, and African academics traveled throughout several Sub-SaharanAfrica to make a country-by-country assessment of existing systems of basic and higher education.Their revolutionary �nal reports, Education in Africa and Education in East Africa, were amongthe �rst prominent documents to advocate colonial government provision of mass education for�Natives�� on a continent where this responsibility was largely shouldered by religious missionswhere it was accepted at all. The reports emphasized that mass education should be providedto girls and boys in equal measure, though it did not specify any timeline for this goal. �Thediscussions of educational objectives and adaptations, of supervision and administration, bear withequal directness on the education of women and men. . . . It is essential for the future welfare ofAfrica that the education of men and women, of boys and girls, should be parallel and simultaneous�(Thomas Jesse Jones [1923], Education in East Africa: A Study of East, Central, and South Africaby the second African Education Commission under the auspices of the Phelps-Stokes Fund, incooperation with the International Education Board [New York: Phelps-Stokes Fund], p. 339, 349).The UNESCO Convention against Discrimination in Education of 1960, which entered into force
in 1962, speci�es �sex�as one of many bases of discrimination and in Article 4 calls for the parties to�formulate, develop and apply a national policy which, by methods appropriate to the circumstancesand to national usage, will tend to promote equality of opportunity and of treatment in the matterof education and in particular . . . to make primary education free and compulsory; make secondaryeducation in its di¤erent forms generally available and accessible to all.�It sets no date for reachingthis goal.UN Declaration on the Elimination of Discrimination against Women (General Assembly reso-
lution 2263 [XXII] of 7 November 1967) in Article 9 pledges: �All appropriate measures shall betaken to ensure to girls and women, married or unmarried, equal rights with men in education atall levels.�No date is set for meeting this goal.
72

E.2.2 Goal year 1980
�The achievement of the following should be envisaged as a minimum by the end of the �rst �ve-year period (1975-1980): . . . Equal access at every level of education, compulsory primary schooleducation. . . � Para 46(c), p. 192, Report of the World Conference of the International Women�sYear, held in Mexico City from 19 June to 2 July 1975; including the Agenda, the World Planof Action for the Implementation of the Objectives of the International Women�s Year, and theDeclaration of Mexico on the Equality of Women and Their Contribution to Development andPeace, and resolutions and decisions adopted by the Conference, E/CONF.66/34, 1976, in UnitedNations (1996), The United Nations and the Advancement of Women: 1945-1996 (New York: UN),pp. 187-211.
E.2.3 Goal year 1995
�Although the World Plan of Action for the Implementation of the Objectives of the InternationalWomen�s Year already contains a comprehensive list of measures necessary to achieve those objec-tives, it is evident, and has been further borne out by the review of progress made over the past�ve years, that they cannot be achieved in such a short span of time. . . Therefore, the possibility ofa second decade could be envisaged for the period 1985-1995.�(para 9, pp. 252-3). �Governmentsshould undertake the following: The establishment of qualitative and quantitative targets for thesecond half of the United Nations Decade for Women: Equality, Development, and Peace; projec-tions for the planning cycles of 1985-1995 should be made where appropriate, and reviews conductedin 1985 and 1990. These should especially seek to remove the gap between the attainments of menand women . . . in all sectors and particularly in the �elds of employment, health, and education.�(Report of the World Conference of the United Nations Decade for Women: Equality, Development,and Peace, held in Copenhagen from 14 to 30 July 1980; including the Agenda, Programme of Ac-tion for the Second Half of the United Nations Decade for Women and resolutions adopted by theConference (extract), para 51(a), p. 259, A/CONF.94/35, in United Nations (1996), The UnitedNations and the Advancement of Women: 1945-1996 (New York: UN), pp. 250-284.
E.2.4 Goal year 2000
�Special measures should be taken by Governments and the international organizations, especiallyUNESCO, to eliminate the high rate of illiteracy by the year 2000, with the support of the interna-tional community. . . . While the elimination of illiteracy is important to all, priority programmesare still required to overcome the special obstacles that have generally led to higher illiteracy ratesamong women than among men.�(para 164, p. 333) Note that para. 35 (p. 317) also stresses thatthe goals of the 1975 World Plan of Action and the 1980 Programme of Action remain in e¤ect and�constitute the basis for the strategies and concrete measures to be pursued up to the year 2000�(Report of the World Conference to Review and Appraise the Achievements of the United NationsDecade for Women: Equality, Development and Peace, held in Nairobi from 15 to 26 July 1985;including the Agenda and the Nairobi Forward-looking Strategies for the Advancement of Women(extract), A/CONF.116/28/Rev.1, 1986, in United Nations [1996], The United Nations and theAdvancement of Women: 1945-1996 [New York: UN], pp. 310-362).At the UNICEF/UNESCO Pan-African Conference on the Education of Girls in Ouagadougou
in 1993, the Ouagadougou Declaration called upon governments �of those countries in which thedisparity between boys and girls in school is more than 10 per cent of the target population toeliminate such disparities by the year 2000�(UNESCO/UNICEF and Government of Burkina Faso[1993], The Education of Girls�The Ouagadougou Declaration and Framework for Action, Pan-African Conference on the Education of Girls, March-April).
73

E.2.5 Goal year 2005
In1995 the United Nations�Fourth World Conference on Women issued its Beijing Declaration andPlatform for Action, where �strategic objective�B1 calls for �closing the gender gap in primary andsecondary school education by the year 2005�(paragraph 82[b]).On May 6-7, 1996, the 34th High Level Meeting of the OECDDevelopment Assistance Committee�
representing all major donor nations� adopted a report entitled Shaping the 21st Century: TheContribution of Development Co-operation. This document was the �rst attempt to collect in oneplace a set of quantitative development goals embracing poverty, education, child health, and envi-ronment that had been discussed at several di¤erent international meetings, and was accompanied bya promise of �adequate resources�for achieving the targets (p. 2). These goals included �eliminatinggender disparity in primary and secondary education by 2005.�
E.2.6 Goal year 2015
The largest-ever gathering of heads of state occurred in New York City in the year 2000. There,at the Millennium Summit, 147 presidents, prime ministers, and monarchs unanimously issued theMillennium Declaration, in which the leaders �resolve . . . by the year 2015 . . . to ensure that . . .children everywhere, boys and girls alike, will be able to complete a full course of primary schoolingand that girls and boys will have equal access to all levels of education� (United Nations [2000],United Nations Millennium Declaration, General Assembly resolution A/RES/55/2 [New York: UN],paragraph 19).The o¢ ce of the Secretary General proposed in September of the following year a set of Mil-
lennium Development Goals, of which �goal 3� and �target 4� is: �Eliminate gender disparity inprimary and secondary education, preferably by 2005, and to [sic] all levels of education no laterthan 2015� (United Nations [2001], Road map towards the implementation of the United NationsMillennium Declaration, General Assembly document A/56/326 [New York: UN], p. 56).
* * *
74

CENTER FOR GLOBAL DEVELOPMENT WORKING PAPERS No. 1, January 2002 Inequality Does Cause Underdevelopment: New Evidence,
William Easterly No. 2, January 2002 HIV/AIDS and the Accumulation and Utilization of Human Capital
in Africa, Amar Hamoudi and Nancy Birdsall No. 3, February 2002 External Advisors and Privatization in Transition Economies, John
Nellis No. 4, March 2002 The Cartel of Good Intentions: Bureaucracy versus Markets in
Foreign Aid, William Easterly No. 5, April 2002 Intellectual Property and the Availability of Pharmaceuticals in
Developing Countries, Jean O. Lanjouw No. 6, May 2002 Winners and Losers: Assessing the distributional impacts of
privatization, Nancy Birdsall and John Nellis No. 7, May 2002 Commodity Dependence, Trade, and Growth: When ‘Openness’ is
Not Enough, Nancy Birdsall and Amar Hamoudi. No. 8, June 2002 Financial Crises and Poverty in Emerging Market Economies,
William Cline No. 9, August 2002 An Identity Crisis? Testing IMF Financial Programming, William
Easterly No. 10, Sept. 2002 Solutions when the Solution is the Problem: Arraying the Disarray
in Development, Lant Pritchett and Michael Woolcock No. 11, October 2002 What did structural adjustment adjust? The association of policies
and growth with repeated IMF and World Bank adjustment loans, William Easterly
No. 12, October 2002 Asymmetric Globalization: Global Markets Require Good Global
Politics, Nancy Birdsall No. 13, October 2002 Low Investment is not the Constraint on African Development,
Shantayanan Devarajan, William Easterly, Howard Pack
No. 14, October 2002 An Index of Industrial Country Trade Policy toward Developing Countries, William R. Cline
No. 15, October 2002 Tropics, Germs, and Crops: How Endowments Influence Economic
Development, William Easterly and Ross Levine No. 16, October 2002 Do As I Say Not As I Do: A Critique Of G-7 Proposals On
Reforming The MDBs, Devesh Kapur

No. 17, October 2002 Policy Selectivity Foregone: Debt and Donor Behavior in Africa, Nancy Birdsall, Stijn Claessens and Ishac Diwan
No. 18, Nov. 2002 Private Sector Involvement in Financial Crisis Resolution:
Definition, Measurement, and Implementation, William R. Cline No. 19, Dec. 2002 Do Rich Countries Invest Less in Poor Countries Than the Poor
Countries Themselves?, Michael A. Clemens No. 20, December 2002 World Bank capital neither complements nor substitutes for private
capital, Michael A. Clemens No. 21, December 2002 From Social Policy to an Open-Economy Social Contract in Latin
America, Nancy Birdsall No. 22, January 2003 Global Economic Governance and Representation of Developing
Countries: Some Issues and the IDB Example, Nancy Birdsall No. 23, February 2003 The Millennium Challenge Account: How much is too much, how
long is long enough?, Michael A. Clemens and Steve Radelet No. 24, February 2003 Bootstraps Not Band-Aids: Poverty, Equity and Social Policy in
Latin America, Nancy Birdsall and Miguel Szekely No. 25, February 2003 Privatization in Africa: What has happened? What is to be done?,
John Nellis No. 26, March 2003 New Data, New Doubts: Revisiting “Aid, Policies, and Growth”,
William Easterly, Ross Levine, David Roodman No. 27, May 2003 National Policies and Economic Growth: A Reappraisal, William
Easterly No. 28, July 2003 Financing Pharmaceutical Innovation: How Much Should Poor
Countries Contribute?, William Jack and Jean O. Lanjouw No. 29, April 2003 Economic Policy and Wage Differentials in Latin America, Jere R.
Behrman, Nancy Birdsall and Miguel Székely No. 30, July 2003 The Surprise Party: An Analysis of US ODA Flows to Africa,
Markus P. Goldstein and Todd J. Moss No. 31, August 2003 Privatization in Latin America, John Nellis No. 32, September 2003 The Anarchy of Numbers: Aid, Development, and Cross-country
Empirics, David Roodman No. 33, November 2003 Who is not Poor? Proposing A Higher International Standard for
Poverty, Lant Pritchett No. 34, December 2003 Once more into the breach: economic growth and integration,
Andrew Warner

No. 35, January 2004 The Illusion of Sustainability, Michael Kremer and Edward Miguel No. 36, February 2004 Boom Towns and Ghost Countries: Geography, Agglomeration, and
Population Mobility, Lant Pritchett