
Enhancing Water Use Efficiency in Canal Commands
218
Manual on Enhancing Water Use Efficiency in Canal Commands Coordinating Unit AICRP on Water Management Directorate of Water Management (Indian Council of Agricultural Research) Bhubaneswar-751 023
-
Upload
khangminh22 -
Category
Documents
-
view
2 -
download
0
Transcript of Enhancing Water Use Efficiency in Canal Commands

Manual onEnhancing Water Use
Efficiency in Canal Commands
Coordinating UnitAICRP on Water Management
Directorate of Water Management (Indian Council of Agricultural Research)
Bhubaneswar-751 023

Manual onEnhancing Water Use
Efficiency in Canal Commands
Coordinating UnitAICRP on Water Management
Directorate of Water Management (Indian Council of Agricultural Research)
Bhubaneswar-751 023
Editors Rajbir Singh & Ashwani Kumar

Citation : Singh, Rajbir and Kumar, Ashwani (2011), Manual on Enhancing Water Use Efficiency in Canal Commands. Directorate of Water Management (Indian Council of Agricultural Research), Chandrasekharpur, Bhubaneswar - 751023, India. page : 208.
Edited and Compiled by :Rajbir Singh and Ashwani Kumar
Published byDirector, Directorate of Water Management(Indian Council of Agricultural Research)Bhubaneswar - 751 023, India
Copy Right : c Director, Directorate of Water Management, Bhubaneswar, Orissa
Printed at Capital Business Service & ConsultancyB-51, Saheed Nagar, Bhubaneswar - 751 [email protected]

ater, as an input to agriculture, is critical for sustaining the food Wsecurity. India faces the daunting task of increasing its food grain
production to a level of 300-325 million tons by 2025. Amidst competition
from non-agricultural uses in households, industry and environment, supply
of irrigation will have to keep pace with the targeted annual agricultural
growth rate of over four percent, therefore, demand-supply management in
water sector and efficiency in its every use is critical for providing sustainable
water-food security to the country.
More than 60% of country's food grain production is now contributed from irrigated agriculture.
The irrigation potential of the country has increased from 22.6 M ha by 1950-51 to more than 100 M
ha through construction of 382 major projects, 1147 medium projects and millions of minor
irrigation schemes. Most of the irrigation systems are reported to have serious problems relating to
the distribution of water and its use efficiency. The overall irrigation efficiency of irrigation
projects is estimated around 35 percent. Excessive loses in conveyance systems, over irrigation and
wastage of water in field are the biggest bane of irrigation practices in our country and have
resulted in low yields and cropping intensity. Over irrigation in the canal commands have also
resulted in water logging and salinity. The performance of the irrigation sector thus needs an
improvement through improved water delivery and application systems. It is estimated that by
reducing conveyance losses and increasing water application efficiency by 10-15 percent, it is
possible to significantly add to the irrigated area. Achieving water savings in existing uses through
increased water used efficiency in agriculture has been suggested as the most readily available
path to meet the current and future demands. Thus, irrigated agriculture is increasingly feeling the
pressure to improve its performance. Depending on the local conditions in the irrigation system,
series of agronomic, technical, managerial, and institutional improvements can have large positive
impacts on water use efficiencies.
All India Coordinated Project on Water Management (AICRPWM) has made spectacular progress
in developing a variety of strategies and technologies for improving sustainable use, planning and
management of available water resources which can improve water use efficiency to a great extent.
I am happy to know that Coordinating Unit has compiled publication entitled “Manual on
Enhancing Water Use Efficiency in Canal Commands”. I congratulate the authors, contributors
and scientists of AICRPWM who have put in lot of efforts in compilation of this important
publication. I hope this compilation Manual on Enhancing Water Use Efficiency in Canal Commands
will serve as a useful guide for the planner, irrigation experts, extension personnel and field
officials for guiding the end users.
F O R E W O R D
A.K. SinghDeputy Director General (NRM)
ICAR, New Delhi
F O R E W O R D


fficient use of available limited water resources holds the key for enhancing and
sustaining agricultural production. Introduction of irrigation coupled with other Emanagement practices during the last five decades has helped in boosting agricultural
production. Even the present share of water for irrigation is expected to decrease in future to
meet the growing demand of other users. Irrigation facilities created by the government at
huge cost, but the optimum benefits from irrigation water were not obtained and there is
considerable wastage of water in the major and medium canal commands. The project
irrigation efficiency of major projects is less than 35 percent. Inadequate natural drainage,
rising water table in brackish ground water and canal irrigated areas, decreasing water table
due to over exploitation of underground water, poor irrigation efficiency, high seepage
losses from conveyance system, poor land development and mismanagement of the
irrigation water resources are major problems for poor performance of the canal system.
Realizing that the development of water resources is very costly, therefore, the urgent need is
to adopt location specific efficient water management technologies. Agriculture being major
consumer of water, even a marginal improvement in the efficiency of water use in irrigation
sector will result in saving of substantial quantity of water which can be utilized either for
extending irrigated area or diverting saving to other sectors of water use.
Keeping the above in view, the publication entitled “Manual on Enhancing Water Use
Efficiency in Canal Commands” attempts to familiarise the extension workers, field
functionaries, planners, research worker and farmers about the efficient water management
technologies generated by the scientists over four decades of research. The dissemination
and adoption of the technologies by the farmers would certainly help in the enhancing water
productivity and maintaining soil quality. The authors express sincere gratitude to Dr. A. K.
Singh, Deputy Director General (NRM) and Dr. P. S. Minhas, ADG (Soil and Water
Management) for their guidance, cooperation and keen interest in conducting network
research. We also express our sincere thanks to the contributors who have taken keen interest
in writing relevant chapters in the field of their specialization. We fervently hope that this
compilation will prove worthy to agricultural planners, policy makers, irrigation engineers,
extension personnel and field workers who are directly or indirectly related to agricultural
water management.
P R E F A C E
Rajbir SinghAshwani Kumar
nd2 May, 2011Bhubaneswar
P R E F A C E

Dr. P. S. Brahmanand
Dr. Ashwani Kumar
Dr. A. S. Dhindwal
Dr. A Zaman
Dr. B. S. Yadav
Dr. B. D. Bhakare
Dr. M. B. Dhonde
Dr. M J Kaledhonkar
Dr. M. L. Jat
Dr. Prabhakar Nanda
Dr. R. K. Pannu
Dr. Rajbir Singh
Dr. Ravish Chandra
Dr. Satynedra Kumar
Dr. Souvik Ghosh
Dr. S Krishnasamy
Dr. S. K. Patra
Dr. S. Mohanty
Dr. V.K Phogat
About the Contributors
Director, Directorate of Water Management, Bhubaneswar-751 023
Professor and Head, Department of Agronomy, CCS Haryana Agricultural University, Hisar-125 004
Professor and Head, Department of Agronomy, Bidhan Chandra Krishi Viswavidyalaya (BCKV), Mohanpur-741 234, West Bengal
Chief Scientist, AICRP on Water Management, Agricultural Research Station (S K RAU), Sriganganagar-335 001
Associate Professor (Soil Science), AICRP on Water Management, Mahatma Phule Krishi Vidyapeeth (MPKV), Rahuri- 413 722
Chief Scientist, AICRP on Water Management, Department of Agronomy, Mahatma Phule Krishi Vidyapeeth (MPKV), Rahuri- 413 722
Principal Scientist, Coordinating Unit, AICRP on Ground Water Utilization, Director of Water Management, Bhubaneswar-751 023
Senior Scientist (Agronomy), Directorate of Maize Research, Pusa, New Delhi-110 012
Senior Scientist (Agronomy), Directorate of Water Management, Bhubaneswar-751 023
Principal Scientist (Ag. Economics), Coordinating unit, AICRP on Water Management, Directorate of Water Management, Bhubaneswar-751 023
Professor, Department of Agronomy, CCS Haryana Agricultural University, Hisar- 125 004
Principal Scientist (Agronomy) Coordinating Unit, AICRP on Water Management, Director of Water Management, Bhubaneswar-751 023
Assistant Scientist, Department of Irrigation and Drainage, College of Agricultural Engineering, R.A.U, Pusa, Samastipur-848125
Senior Scientist (Soil Water Conservation Engineering), Division of Irrigation and Drainage Engineering, Central Soil Salinity Research Institute, Karnal-132001
Senior Scientist (Ag. Extension), Directorate of Water Management, Bhubaneswar-751 023
Chief Scientist, AICRP on Water Management, Department of Agronomy, Agricultural College and Research Institute, TNAU, Madurai-625 104
Professor (Soil Physics) AICRP on Water Management, Gayeshpur – 741 234
Senior Scientist (Soil Water Conservation Engineering), Directorate of Water Management, Bhubaneswar-751 023
Professor (Soil Physics), AICRP on Water Management, Department of Soil Science, CCS Haryana Agricultural University, Hisar 125 004

FOREWORD
PREFACE
1.0 Surface water resource and canal irrigation management 1Ashwani Kumar
2.0 Soil physical properties vis-à-vis soil-plant-water relationships 10V. K. Phogat, R. K. Pannu and Rajbir Singh
3.0 Water requirement and irrigation scheduling 32 Rajbir Singh, B.S. Yadav and Satyendra Kumar
4.0 Concept of irrigation performance indicators :Irrigation efficiencies 47and water productivityRajbir Singh and Ashwani Kumar
5.0 Methods of surface irrigation and measurement of irrigation water 63Rajbir Singh and S. Mohanty
6.0 On-farm development for enhancing water application efficiency 73Rajbir Singh and M.L. Jat
7.0 Optimum utilisation of irrigation water for enhanced land and water productivity 87Rajbir Singh and P.S. Brahmanand
8.0 Enhancing water use efficiency through pressurized irrigation system 98 in canal commandSatyendra Kumar, Rajbir Singh and Ashwani Kumar
9.0 Drainage system for waterlogged saline soils in canal commands 118M.J. Kaledhonkar and Satyendra Kumar
10.0 Conjunctive use of saline/ sodic water in canal commands 129 M.J. Kaledhonkar
11.0 Participatory irrigation management (PIM) for optimum utilization 137of irrigation waterSouvik Ghosh, Rajbir Singh and Parbhakar Nanda
12.0 On-Farm water management for enhanced water use efficiency 150Rajbir Singh and Parbhakar Nanda
13.0 Impact of conjunctive use on water productivity across a canal command 159of Bhakra Irrigation SystemRavish Chandra
14.0 Enhancing water productivity through canal water harvesting and 165by introducing microirrigation in tail-endRajbir Singh, Satyendra Kumar and Ashwani Kumar
C O N T E N T S

15.0 Enhancing crop productivity and water use efficiency in JLN 173lift irrigation projectA.S Dhindwal and V.K. Phogat
16.0 Enhancing crop productivity and water use efficiency in Deep 178Tube well Command (DTW) S.K. Patra and A. Zaman
17.0 Enhancing crop productivity and water use efficiency in Periyar 185 Vaigai CommandS. Krishnasamy
18.0 Enhancing crop productivity and water use efficiency in 197Mula and Kukadi CommandsM.B. Dhonde and B.D. Bhakare

Manual on Enhancing Water Use Efficiency in Canal Commands 1
1.0 SURF1.0 SURF1.0 SURF1.0 SURF1.0 SURFAAAAACE WCE WCE WCE WCE WAAAAATER RESOURCE AND CTER RESOURCE AND CTER RESOURCE AND CTER RESOURCE AND CTER RESOURCE AND CANALANALANALANALANALIRRIGIRRIGIRRIGIRRIGIRRIGAAAAATION MANATION MANATION MANATION MANATION MANAGEMENTGEMENTGEMENTGEMENTGEMENT
Ashwani KAshwani KAshwani KAshwani KAshwani Kumarumarumarumarumar
Water is one of the most essential naturalresources for sustaining life, food production andeconomic development. Efficient use of waterresource is the basic to survival of the ever-increasing population of a country. India receivesaverage annual rainfall of 1194 mm with avariation of 100 mm/year in western regions to11,690 mm/year in Mousinram, Cherapunji ofeastern region. With 4000 billion cubic meter(BCM) of annual rainfall, average runoffgenerated is only 1869 BCM. Due to variousconstraints about 1,122 BCM of water can be putto beneficial use of which 690 BCM is throughsurface water and 432 BCM by groundwater(Table 1.1). Out of 690 BCM of surface water, sofar about 213 BCM of storage are built throughmajor and medium irrigation projects. Another184 BCM of storage are under construction/consideration. Similarly, out of 432 BCM ofgroundwater resource, about 360 BCM ofgroundwater is expected to be available forirrigation, out of which present usage is about135 BCM.
per capita, China 2500 m3 per capita, and evenMorocco and South Africa remains at 500 m3 percapita. The per capita water availability in theyear 2005 was 1703 cubic meter which is projectedto further reduce to 1401 and 1191 cubic meterby the years 2025 and 2050 respectively (Table1.2). Therefore, there is a need for properplanning, development and management of thisprecious natural resource.
Table 1.1 : Water resources of India
Table 1.2 : Per capita water availability of India
Year Per capita water
availability (M3)
1950 5300
1990 2200
2005 1703
2025 1465
2050 1235
Water resource Volume in
Billion Cubic
Meter (BCM)
Annual precipitation 4000
Available water resources 1869
Utilizable water resources 1122
Surface water 690(storage and diversion)
Groundwater (replenishable) 432
In spite of massive infrastructure built, the storagecapacity of India as compared to many othercountries remains low at just 200 m3 per capita,while USA and Australia are at about 5000 m3
1.1 Irrigation sector : an evaluation
In India, irrigation development has beenreceived high priority in the successive five yearplans since independence to enhance theagricultural production. A record food grainproduction of 233.88 M tones was achieved in2008-09 from 50.8 M tones in 1950. About 60% ofcountry’s food grain production is nowcontributed from irrigated agriculture. Theultimate irrigation potential of the countrythrough major, medium and minor irrigationprojects has been assessed as 139.9 M ha byconventional storage and diversion works. Thecultivable area of the country is estimated to beabout 186 M ha out of which about 142 M ha isunder cultivation. With rise in population andindustrialisation putting pressure on land, it isexpected that net cultivated area will stabilise at140-145 M ha.

2 Manual on Enhancing Water Use Efficiency in Canal Commands
The irrigation potential of the country hasincreased from 22.6 M ha by 1950-51 to about100 M ha through construction of 382 majorprojects, 1147 medium projects, 146 Extension,Renovation and Modernisation (ERM) schemesand millions of minor schemes. The decadalgrowth in cropped and irrigated area of thecountry since 1951 is given in Table 1.3. Totalwater use in agriculture at current level ofdevelopment is of the order of about 525 BCM
which is about 83 percent of total present wateruse in the country. This may get progressivelyreduced to about 75 percent in future, due toincreased demand of other sectors. Being, majorconsumer of water, even a marginalimprovement in the efficiency of water use inirrigation sector will result in saving ofsubstantial quantity of water which can beutilized either for extending irrigated area ordiverting saving to other sectors of water use.
In irrigation sector of the country, the overallirrigation efficiency of the major and mediumirrigation projects is estimated around 35 %.Theuneven distribution of water over the length ofthe canal system has resulted in low yields andcropping intensity. Over irrigation in some of thecanal command areas has also resulted inwaterlogging and salinity. The performance ofthe irrigation sector thus needs an improvementthrough improved water delivery andapplication systems.
Irrigation projects, in general, are underperforming due to inadequate systemmaintenance mainly on account of financialconstraints. This could be attributed to low waterrates and revenue recovery from farmers. Eventhough it is well recognized and recommendedthat water charges may have to be so fixed so asto meet at least annual costs of operation andmaintenance in order to make the system self -
sustainable though this has not beenimplemented in many states. This affects theplanned efficiency of projects and theirperformance. It is imperative to devise amechanism for proper water rates and recoveryof water charges.
In spite of the achievements made so far, thecountry cannot afford to brook complacency yetas only 38 percent of the cultivated land isirrigated. Further, despite the fact thatproductivity in irrigated areas has increased, ingeneral, it is seen that in irrigation system withoutstorage back up like Kosi, Gandak etc., suchincreases are still way below the world standardsand even of developing countries like China andBrazil. This low productivity, manifests itself notonly through the irrigated yields being less thanwhat it would be possible to achieve but also isnot being able to irrigate properly the whole ofthe area planned for irrigation and in not being
Table 1.3 : India's cropped and irrigated area from 1951 to 2005
Year Area in M ha Irrigation
intensity
Net sown Gross sown Net irrigated Gross irrigated
area area area area
1950-51 118.75 131.89 20.85 22.56 17.1
1960-61 133.20 152.77 20.66 27.98 18.3
1970-71 140.27 165.79 31.10 38.19 23.0
1980-81 140.00 172.63 38.72 49.78 28.8
1990-91 143.00 185.74 47.78 62.47 33.6
2000-01 141.16 185.71 54.83 75.87 40.9
2005-06 141.89 192.80 60.20 82.63 42.9

Manual on Enhancing Water Use Efficiency in Canal Commands 3
able to supply the water in sufficient quantitiesand with timeliness, reliability and equity all overthe command. The problem of equity, timelinessand reliability and the low efficiency in regard toconveyance, distribution and application ofirrigation are considered as a main cause for thelow productivity of irrigated agriculture and alsoof the low satisfaction level among the irrigatedfarmers. The overall efficiency in most irrigationsystems is low and in the range of 35 to 40 percent.The main cause of low efficiencies, is observedto be deficiencies in water delivery system dueto poor maintenance, inequitable delivery ofwater to the fields, lack of on-farm developmentand inefficient water management. Further,productivity of irrigated land ranges from around1.5 - 4 tonnes per ha for cereal crops as comparedto an achievable target of about 5 to 6 tonnes perha putting additional pressure on water demandfor irrigation. Absence of any meaningful co-ordination of multidisciplinary departments atvarious levels also results in wasteful andunlawful use of water, resulting in low systemefficiencies and productivity levels.
1.1.1 Status of irrigation efficiencies in canalcommand
Irrigation efficiency mainly depends on loss ofwater in conveyance system includingdistribution system and in the field. Loss of waterin conveyance system is mainly due to seepageand evaporation. Evaporation loss takes place
from the exposed water surface. In hot and drysummer months, these losses are maximum butthey may seldom exceed about 10 percent of thetotal conveyance losses. Conveyance and fieldlosses, contributing to overall irrigation efficiencyfrom source to field application, vary widely withthe extent of lining, type of strata through whichcanal system passes, material used and qualityof work in the canal lining, preparation of thefield, type of soil, stream size, method of waterapplication i.e irrigation practices in vogue etc.Some studies have been carried out to have ageneral idea about the project features whichinfluence the irrigation efficiencies. Irrigationefficiencies and seepage losses in some existingprojects are briefed in Table 1.4 and 1.5. Generalconclusions of these studies are described below:
Area served by one distributary rangedbetween 400 ha to 3000 ha, conveyanceefficiency was higher than in schemeswhere this area was larger or smaller. Inschemes where the tertiary units werelarger than 200 ha, the average conveyanceefficiency was higher than in schemes withtertiary units between 5 and 100 ha.
In schemes where the size of flow per farminlet was more than 50 litreIsecond, thedistribution efficiency was higher than inschemes where the size of flow was 50 litre/second or less.
Table 1.4 : Irrigation efficiencies in some of the existing Indian projects
Sl. Particulars Observed irrigation efficiencies of projects (%)
No. 1 2 3 4 5 Average
1 Conveyance efficiency
a) Main canal 92 84 85 94 86 88
b ) Distributary/Minor 79 83 75 75 89 80
c) Field channel 68 64 72 - 67 68
Overall conveyance efficiency (EC) 49 44 46 70 51 48
2 Field Application efficiency(Ea) 77 69 83 58 59 68
3 Project Efficiency (Ep) 38 31 38 41 30 36

4 Manual on Enhancing Water Use Efficiency in Canal Commands
It is observed that such losses are 40 to 50 percentof the discharge at canal head. This includes 15percent to 20 percent in main canal and branches,10 to 20 % in distributaries and 10-20 % in watercourses. In general, it can be generalized that aconsiderable amount of water is lost throughevaporation and seepage in the canal system fromthe head of the canal up to the distributaries
outlet. National Commission on Integrated WaterResources Development Plan also tried tocompile the data for national level assessment ofoverall irrigation efficiencies but they could notcome to any conclusion. However, the NationalCommission opined that 35 to 40 % efficiency insurface water and 65-70 % efficiency in groundwater will be a fair approximation.
Table 1.5 : Seepage losses in some of the existing Indian projects
Sl. No. Project Seepage losses in canal system(Cusec per Million Sq. ft.)
1 Harsi Canal System(M.P) 5 to 24
2 Sarda Canal System (U.P) 6 to 8
3 Kaldiya Irrigation Scheme (Assam) 17 to 27
4 Pazhassi Irrigation Project (Kerala) 11 to 21
5 Kangsabati Irrigation Project (W.B) 9 to 70
1.1.2 : Review of present efficiencies in canalcommands
The development of irrigation sector, like a fewother development activities has its share ofproblems also. A number of irrigation systems,are operating much below their potential due topoor maintenance, problems of equity,waterlogging, lag in potential created and utilizedetc., all leading to actual irrigation efficienciesbeing much less than the achievable values. Thisis not to say that problems of existing irrigationsystems can be limited to those related toirrigation efficiency and equity. At times thewater availability itself may be inadequate or mayhave become inadequate due to excessiveupstream development. The cropping patternhave changed from those for which the systemwas planned. While all these problems needspecific consideration, particular problem whichis common to all the systems and required to betackled is the low water use efficiency.
The irrigation efficiencies of 35-40 percent insurface water as generally obtained areconsidered to be low. The reasons whichcontribute towards low values of irrigationefficiencies can be summarized as under:-
i) A large number of major and mediumprojects could not be completed due tovarious reasons including thin spreadingof resources. In many cases headworkswere completed but the canal systems wereonly partially completed. Withdevelopment of part command andabundant availability of water as plannedfor the project. The head reach farmersstarts growing high water consuming cropspractically on full size of their farms withirrigation intensities much higher thanplanned. They also tend to over irrigate andindulge in wasteful use of water. Theproblem is more acute in large systemwhere full development of command takes10-20 years. Even after completion of theproject, the head reach farmers continue todraw more water in pretext of changedcropping pattern depriving tail reachfarmers of their share of water. Some tailend channels, practically do not get anywater, resulting in low water use efficiency.
ii) Excessive losses in conveyance anddistribution systems are due to seepage,evaporation etc. Whereas the evaporation

Manual on Enhancing Water Use Efficiency in Canal Commands 5
loss is less, as much as, 40-50 percent ofwater is lost in seepage through maincanals, branches, distributaries, minors,water courses and field channels. It isobserved that almost half of these lossesoccur in field channels.
iii) Design and operation of the conveyanceand distribution systems, is in such a waythat inequity and indiscipline prevail in thecommand. The systems are designed to runeither at full discharge or at partialdischarge. The cross regulators and headregulators are so designed, that off takingbranch can draw full supply even when theflow in parent channel is having partialsupply. In the secondary system, this leadsto various manipulations in head reaches.The head branches take larger share of theparent channel and much higher shortagesare passed on to the lower branches. So, theoperation of the system is fundamentallydependent upon the two factors, i.e methodof water allocation and method ofdistribution adopted for the system andwater control within distribution system.
iv) Most of the irrigation systems are todayfacing twin issues of sub-optimal sectorplanning and financial management onone hand and inadequate maintenance ofthe system on the other hand. Efficientwater management cannot be achievedunless the infrastructure for waterconveyance and delivery system is in areasonably good condition. Maintenance ofirrigation system is generally neglected,which leads to weed growth, silting of canalsystem, breaches etc. Situation in somecases is seen to be so precarious, that eventhe head works & other regulatorystructures start showing signs of distress.Infrastructure deterioration frominattentive and absent maintenance regimeis one of the main reasons of wastage ofwater and lower value of irrigationefficiency.
v) The water rates being charged at presentare low and the revenues are only a smallfraction of the amount required for propermaintenance. This adversely affects theavailability of resources with the StateGovernments for proper and regularmaintenance of irrigation systems. Thisconsequently leads to deterioration ofsystem and is responsible for the poorquality of services.
vi) Another grey area is inordinate delay incompletion of On-farm Developmentworks (OFD works). Out of the irrigationpotential of about 101 M. ha created so far,about 81 M. ha only is being utilized leavinga gap of 20 M. ha of unutilized potential.Though there are many factors whichinfluence the utilization of createdpotential, the prime cause of underutilization is non-completion of fieldchannels, land leveling and shaping,drainage channels etc.
vii) Other important factor leading to low valueof efficiency is lack of involvement ofbeneficiaries. Farmers are real stake holdersof water use. Though the process offormation of Water Users Associations(WUAs) and Participatory IrrigationManagement (PIM) started in 1985, thebeneficiaries are not involved sufficientlyand effectively in the up-keep of the systemand water management aspects. Theseworks are considered to be theresponsibility of irrigation department andis one of the important reasons of gettinglow efficiency of irrigation in many States.
viii) In initial phase of irrigation development,thrust was on for creation of irrigationinfrastructure and no efforts were made forproviding matching drainage facilities inthe irrigation commands. This has resultedin problem of water logging and salinity insome of the irrigation commands. Seepagefrom conveyance system of the irrigationprojects, excessive application of irrigation

6 Manual on Enhancing Water Use Efficiency in Canal Commands
water to crops, lack of conjunctive use ofsurface and ground water, poor on farmwater management, deficient maintenanceetc only added to the problem. WorkingGroup of Ministry of Water Resources(MOWR) in their report of 1991, estimatedwater logged area and salinity affected areain command of major and mediumirrigation schemes as 2.46 and 3.3 M.harespectively. Some waterlogged area isreclaimed but the progress of reclamationis very slow. In addition to waterloggedarea, which has practically gone out ofcommand and could not be used for cropproduction, other areas where sufficientdrainage facilities for effective disposal ofsub-surface water have not been provided,also lose fertility, leading to low yields.
ix) In spite of the fact that there is an acuteshortage of water, no concerted efforts havebeen made to improve water applicationtechniques in the field and age oldirrigation practices continue to be in vogue.Most of the area in the country is irrigatedby surface application methods such asbasin, check basin, border strip, furrowirrigation etc. Except for furrow irrigation,adoption of other methods practicallymeans flooding of the irrigation fieldsresulting in substantial loss of water. Thishappens as fields are generally not properlylevelled or provided with correct slope forquick flow of water from one end toanother. The application efficiency of thesemethods has been found to be only 30 to 50percent as compared to attainable leve of60 to 80 percent.
x) Development and management of waterresources still remains with National andState Governments. The responsibility isspread amongst several institutions, somewith overlapping jurisdiction. There is adistinct lack of coordination among variousagencies involved. Research efforts in watermanagement are being carried out by theIndian Council of Agricultural Research,
Water and land Management Institutes ofvarious States, various AgriculturalUniversities, other Central and StateResearch Centres etc. MOWR also fundsthe research schemes through INCID,INCH, INCOH etc. Though lot ofinformation have been generated/collectedby various agencies, there is no meaningfulinteraction and linkages between variousagencies. The agencies involved in theextension services, fail to translate theresearch findings to actual field. There islack of mass awareness programmes andfarmers not realizing the scarcity of watercontinue to waste water.
1.2 Water use efficient technologies
Improving the use-efficiency of existing waterresources will be crucial to relax the supply sideconstraints on future agricultural growth and toallow reallocation of water from agriculture toother uses. The development of technologies andmanagement systems that enhance water-useefficiency warrants high priority. Theidentification, breeding and introduction of waterefficient crops for dry land and salineenvironments are potentially an important aspectof achieving greater water-use efficiency. A largeshare of water to meet new demands must comeby saving water from existing uses. As per oneof the estimates, a 10% improvement in irrigationefficiency could conserve enough water to doublethe amount of water available for drinking.Further, at plausible sites, recycle / reuse of waterhas to be promoted to have more crops per dropof water.
Global climate change is likely to have a majordifferential impact on precipitation, wateravailability, crop water demand, erosion,salinization, droughts and floods in India. Shiftsin the existing biodiversity and land use patternsare likely to occur due to climate change. Thegrowing frequency and magnitude of the extremeclimatic events warrants for researches on naturaldisasters as well as regional vulnerability. Amongall natural disasters, floods are the most frequent,affecting annual average of 7.56 M ha and 33

Manual on Enhancing Water Use Efficiency in Canal Commands 7
million people in India. The post-flood contingentmeasures need to be more focused and targetedto minimize the agricultural loss. The droughtprone area assessed in the country is of the orderof 51.12 M ha. These areas should have soil-moisture conservation measures, waterharvesting practices, evaporation lossesminimization measures and development ofground water potential. The possibility ofdiverting surface water from surplus areas needsto be explored.
1.2.1 Measures for improving efficiency
There is a considerable scope for rationalizingirrigation demand and applying the rightquantity of water at right time. Some of theimportant measures are as listed below:
i) Timely execution of projects
ii) Lining of conveyance system
iii) Operational and Maintenance
iv) Appropriate water price
v) Timely and adequate water supply
vi) Participation of stakeholders
vii) On-farm water management
viii) Technology upgradation
ix) Conjunctive use of water
x) Drainage as an integral part of irrigationproject
xi) Policy changes
R & D efforts in irrigation agriculture require theattention to the following aspects:
Development of data base on agriculturalutilization.
Saving in agricultural use, soil moistureconservation through use of mulches,improving water use efficiency, selectivelining of canal.
Conjunctive use of surface and groundwater.
Conjunctive use of multi source and multiquality waters.
Economizing through micro irrigationsystems.
Environmental protection for waterpollution, reuse of irrigation water.
Developing policy guidelines forrationalising water pricing.
Cropping for flood affected flood pronearea.
Biotechnology for developing salt/drought tolerant crops, low waterrequiring crops etc.
Membrane technology for water treatment& desalinization at low cost.
Improved water management.
Participatory irrigation management.
1.3 Paradigm shift for integrate watermanagement
A paradigm shift in the policies for irrigationdevelopment and management has beenhappening during the past two decades throughparticipatory irrigation management (PIM) andirrigation management transfer (IMT) approach.The centralized control and managementresponsibility of the irrigation resources are beingtransferred to the local farmer groups or waterusers associations (WUAs) for bettermanagement. About 13.16 M ha of irrigated landhas been covered under 56539 numbers of WUAsin the country. Recognizing the need for soundlegal framework for PIM in the country, theMinistry brought out a model act which has beenenacted by eight state governments, namely,Andhra Pradesh, Goa, Madhya Pradesh,Karnataka, Orissa, Rajasthan, Tamil Nadu andKerala. The other states also need to work in thisdirection. Concerted efforts should be made toinvolve farmers progressively in various aspectsof management of irrigation systems. Commandarea development programme should be takenup in all irrigation projects to bridge the gapbetween the potential created and actualutilization.

8 Manual on Enhancing Water Use Efficiency in Canal Commands
Groundwater played a major role in the successof green revolution and contributes 60% of thetotal irrigated area of the country. Overexploitation of groundwater has reached dangerlevels in Haryana, Punjab, Rajasthan and TamilNadu. The Punjab-Haryana region could lose itsproduction potential in a few decades if currentpatterns of groundwater extraction and pollution,soil salinization and rice-wheat monoculturepersist. Groundwater remains under developedin regions where surface water is adequate. Arecent estimate reveals that in 15% of the blocks,the annual extraction of groundwater exceedsannual recharge. In 4% of the blocks, it is morethan 90% of the recharge. Groundwater extractionin such blocks needs to be better regulated.
Conjunctive use of surface and groundwater isdesirable to fulfill the irrigation requirements ofcrops by judiciously utilizing the water from boththe sources. The optimal conjunctive use of theregion’s surface and ground water resourceswould help in minimizing the problem ofwaterlogging and groundwater mining. Theconjunctive use also facilitates the use of highlysaline groundwater which can’t be otherwise usewithout appropriate dilution. Strengthening ofknowledge base on geology and aquifercharacteristics, hydrology of surface andgroundwater, and existing surface and groundwater facilities is required to develop appropriateconjunctive use system. Moreover, the quality ofland and water must be sustained in the face ofmounting pressure to degrade these resourcesthrough waterlogging, salinization, groundwatermining, and water pollution. Water erosion alonehas contributed significantly to the degradationprocess. Temporal and spatial spread ofdegradation process, if not checked and reversed,would affect the future agriculture.
1.4 Virtual water
With the increase of food trade in coming years,the importance of virtual water at global level islikely to be felt more. In the water scarce areas,the transfer of virtual water embedded in the foodbeing traded would become an important
component of water management. Therefore,assessment of virtual water in terms of its valueover space and time and its consideration atagricultural and water policy level is ofparamount importance.
1.5 Future water requirements
The population crossed 1200 million and isexpected between 1500 million and 1800 millionby the year 2050. It is expected that the populationwill stabilise by 2050. The U.N. agencies have putthe figure as 1640 million by then. The NationalCommission on Integrated Water ResourcesDevelopment Plan (NCIWRDP) has assessed thewater demand for irrigation sector consideringlow and high variant population of 1346 millionand 1581 million as 628 BCM and 807 BCMrespectively by 2050. Average food grainconsumption at present is about 550 gm per capitaper day whereas the corresponding figures inChina and USA are 980 gm and 2850 gmrespectively. With population growth at about1.5 per cent per year, the food production shouldincrease by about 2.6 percent annually. The areairrigated should also show an annual growth rateof about 3 percent to match the rising demand offoodgrain. NCIWRDP has, earlier expressed aview that per capita economic growth rate of 4.5percent per year is a reasonable assumption. Assuch 284 kg of foodgrain per head per year ortotal of 382 M.T (low demand) and 449 MT (highdemand) foograins will be required by the year2050. For assessing the future water demand tomeet this requirement of foodgrains, theCommission has assumed that croppingintensity, which at present is about 135 percentshall increase to 150-160 percent by 2050.Irrigated area is also likely to increase fromabout 40 percent to 53 percent of total croppedarea by 2050.
The National Commission also looked into thepossibility of increase in the food grain yields ofrainfed and irrigated areas and opined that goodprobability exists for achieving food crop yieldsas given in Table 1.6. This is against presentaverage yield of about 1.0 and 2.3 tonnes per hafor rainfed and irrigated agriculture respectively.

Manual on Enhancing Water Use Efficiency in Canal Commands 9
Keeping the above projections in view, thecommission has estimated that by 2050 the totalirrigated area will have to be increased to 113 Mha and 146 M ha for low demand and highdemand scenario for which water requirementwill be of the order of 628 BCM and 807 BCMrespectively.
Conclusion
Water forms the backbone for all the futureendeavours to achieve the vision of food security.In the present day context, upscaling agriculturaleconomic growth to more than 4% annually isthe main challenge. Taking water technologiesfor better water management from lab to land isa formidable task to be addressed.Modernization/ automation of irrigation system,precision irrigation, land reforms, corporatefarming, cooperative farming, water and energypricing, crop insurance, institutional mechanismfor better governance, water rights are some ofthe key issues for bettering water management
in agriculture. The projected food requirementdemands a pronounced role for research,development and training in the water andagriculture sector.
It is evident that the water availability foragriculture is declining and to enhanceagricultural production more water is needed.Therefore, concerted and holistic efforts arerequired in increasing the overall water useefficiency at system level which would beachieved through various measures like timelyexecution of projects, minimizing the losses,better operational efficiency through stakeholders participation, implementation of on-farmwater management technologies, conjunctive useof water and changes in irrigation policy.Simultaneously, the efforts of R&D institutionsare required in development of watermanagement technologies, suitable databasedevelopment, economic studies of variousirrigation systems, policy guidelines for on-farmwater management and adoption of participatoryirrigation management. The serious efforts ofdevelopmental agencies as well as researchinstitutes are required to develop a suitable waterprespective plan for various regions in thecountry for its implementation.
Table 1.6 : Food crop yield (t /ha) projections
Yield (t/ha)
Production System 2025 2050
Rainfed 1.25 1.5
Irrigated 3.4 4.0

10 Manual on Enhancing Water Use Efficiency in Canal Commands
2.0 SOIL PHYSIC2.0 SOIL PHYSIC2.0 SOIL PHYSIC2.0 SOIL PHYSIC2.0 SOIL PHYSICAL PROPERAL PROPERAL PROPERAL PROPERAL PROPERTIES VIS-À-VIS SOIL-TIES VIS-À-VIS SOIL-TIES VIS-À-VIS SOIL-TIES VIS-À-VIS SOIL-TIES VIS-À-VIS SOIL-PLPLPLPLPLANT-WANT-WANT-WANT-WANT-WAAAAATER RELTER RELTER RELTER RELTER RELAAAAATIONSHIPSTIONSHIPSTIONSHIPSTIONSHIPSTIONSHIPS
VVVVV. K. Phog. K. Phog. K. Phog. K. Phog. K. Phogaaaaat, Rt, Rt, Rt, Rt, R. K. P. K. P. K. P. K. P. K. Pannu and Rannu and Rannu and Rannu and Rannu and Rajbir Singhajbir Singhajbir Singhajbir Singhajbir Singh
For designing, operating and managing anyirrigation system, the basic concepts of soilphysical properties, soil moisture constants,movement and retention water in very necessary.The soil acts as the basic substrate and serves notonly as a medium for plant growth but also as asink and recycles many waste products whichmight otherwise accumulate to pollute theenvironment. In addition, soil supports thebuildings and provides materials for theconstruction of earthen structures such as damsand canal. Soil physical properties influence themovement, retention and availability of water insoil profile, therefore, these properties have to beunderstood in depth for deciding the efficientmanaging of the water resources. Similarly, soil-plant-water relationship should be clear to planirrigation system to suit different crops grownon different soils.
2.1 Soil Profile
The most obvious part of any soil is its surface,through which the matter and energy aretransported between the soil and the atmosphere.The conditions of soil surface affect the processesof radiation and heat exchange, water and solutemovement and gaseous diffusion. Thus, soilsurface is important but it does not describe thecharacter of the soil as a whole. To characterizesoil as a whole, it is necessary to examine the soilin depth. It is done by digging a vertical sectionof the soil from surface to the parent material,called a soil profile (Fig. 2.1.1).
The soil profile consisted of a succession of moreor less distinct layers, in terms of physical,chemical and biological properties, is called thesoil horizons. The surface layer or A horizon is thezone of major biological activities and is,therefore, generally high in organic matter anddarker in colour than the lower horizons. Thishorizon is the most fertile zone of soil but also
Fig. 2.1.1 Schematic representation of ahypothetical soil profile
most vulnerable to erosion by water and wind. Itis the eluviated horizon from which certaincolloidal materials such as clay, oxides andcarbonates are removed constantly by leachingaction of water. A layer beneath the A-horizon,which contains less organic matter than A-horizon, is called the B-horizon (subsoil). It is thezone of illuviation where some of the colloidalmaterials that are leached from the A-horizonaccumulate. The B-horizon is often thicker thanthe A-horizon. The pressure of the overlying soil

Manual on Enhancing Water Use Efficiency in Canal Commands 11
tends to reduce the porosity of the deeper layers.In some cases, the dense B horizon may inhibitgas exchange, water drainage and rootpenetration. Directly below the B-horizon is theC-horizon which contains weathered rock or thesoil’s parent material. If the soil is formed fromthe bedrock in situ, the C horizon consists of aweathered and fragmented rock material. In othercases, the C-horizon may consist of alluvial,aeolian, or glacial deposits. In a young soil, theB-horizon is absent but in a developed maturedsoil, A- and B-horizons are more prominent, andat times, the C-horizon may disappear. In a recentalluvium, hardly any profile differentiation isapparent. The terminology to describe thehorizons in a soil profile is given in Fig. 2.1.2.
Fig. 2.1.2. Descriptive terminology for soil profilehorizons
A soil, which contains adequate amount ofvarious nutrients required by the plants inavailable form, not excessively acidic or alkalineand is free of toxic agents, can be considered topossess chemical fertility but such fertility doesnot by itself ensure the success of a crop. Thesuitability of a soil as a medium for plant growthdepends upon the state and movement of waterand air and also upon mechanical support of soiland its thermal regime. The soil must be loose,soft and friable to prevent root development
without any mechanical obstruction. Therefore,for higher productivity, the soil in addition tochemical fertility should also possess physicalfertility. The examples of soils, which arechemically but not physically fertile, are:
A soil rich in all essential plant nutrients isa desert if water is absent.
A fertile low lying land becomes worthlessif flooded for a long time due to deficiencyof oxygen.
The nutrients and water of the sub-soilremain unapproachable to the crops if adense plough layer restricts their rootpenetration.
2.1.1 Soil as a Dispersed Three Phase System
Soil is a dispersed three-phase system as it ismade up of solids, liquids and gases. The solidphase composed of mineral particles and organicmaterials. It also contains amorphous compoundssuch as hydrated iron and aluminum oxides, andgenerally, the proportion of the amorphousmaterial is small. Organic fraction of the solidphase is consisted of organic residues in differentstages of their decomposition (undecomposedmaterials and well decomposed products) alongwith enormous varieties of millions of living aswell as dead microorganisms. Solid phase formsmatrix of the soil system and provides seat formost of the physico-chemical reactions, like ion-exchange, adsorption, etc. It shapes the poreswhich control the movement of air and water andpenetration and development of roots in the soil.
Solid phase acts as an ultimate fertility sourcesand provides mechanical support to the plants.Organic matter helps in soil aggregation andlargely responsible for loose and friableconditions of the soils. Apart from providingessential nutrients, it increases water holdingcapacity of the soil and available water. It is alsothe main source of energy for soilmicroorganisms.
Liquid phase is water in the soil, and the soilwater always contains dissolved minerals.Therefore, it is also called as soil solution.

12 Manual on Enhancing Water Use Efficiency in Canal Commands
Nutrients get dissolved in water and becomeavailable to the plants. These nutrients movefrom soil to the root and from roots to the leavesthrough the medium of water, which meets therequirement of the plants and is important forall biochemical processes occurring in the plants.Water controls soil aeration, temperature of soiland plant and microbiological activities in thesoil.
Gaseous phase is the soil air or soil atmosphere,which is not continuous as atmospheric air sinceit is located in soil pores separated by soil solids,and its composition varies from place to place inthe soil. Soil air has higher moisture than theatmosphere, and the relative humidityapproaches 100% at optimum moisture. Contentof carbon dioxide is generally higher and that ofoxygen lower than their contents in theatmosphere. Soil air provides oxygen for therespiration of roots and soil microorganisms.
The relative proportion of three phases in the soilis not fixed but it varies continuously dependingon weather, vegetation and managementpractices. At interface of two phases in the soil,many physical phenomena such as adsorption ofwater and nutrients, capillarity, ion-exchange,dispersion, flocculation, aggregation, swelling,shrinkage, heat of wetting, etc., occur. Thehypothetical volume composition of three phasesin a medium textured soil at a conditionconsidered optimal for plant growth is presentedin Fig. 2.1.3.
The solid matter constitutes 50% (45% mineraland 5% organic matter) of the soil volume andrest 50% is the pore volume which is equallyshared by water and air. The water and aircomponents can vary widely and are negativelyrelated so that an increase in one is associatedwith a decrease in other.
2.2 Physical Properties of soil
2.2.1 Mechanical composition of soil : The termmechanical composition is often usedinterchangeably with soil texture, which is anexpression of prominent size or size range of the
Fig. 2.1.3 Schematic volume composition of threephases in a medium textured soil at a condition
optimal for plant growth
soil particles, and it has both qualitative andquantitative meaning. Qualitatively, soil texturerefers to the feel of soil whether it is coarse andgritty or fine and smooth when rubbed betweenthumb and finger. Quantitatively, soil texturerefers to the relative proportions of different sizegroups or soil separates, specifically referred toas sand, silt and clay in a given soil.
The texture of a given soil is more or less a staticproperty, hence, it is considered as a basic/inherent property of a soil affecting almost allother soil properties.
2.2.1.1 Classification of soil particles : Soilparticles may be classified on the basis of shape,density, chemical composition, or size but theclassification based on shape, density andchemical composition is no longer in use. Onlysize of the particle is conveniently used to classifythe soil particles. An essential criterion fordetermining soil texture is the upper limit ofparticle size, which is to be included in thedefinition of soil material. The conventionaldefinition of soil material/fine earth includesparticles <2 mm in diameter. Particles larger than2 mm are generally referred to as gravel and still

Manual on Enhancing Water Use Efficiency in Canal Commands 13
larger rock fragment, several centimeters indiameter, are called stone or cobbles, and if verylarge then they are called boulders.
Only soil material is normally considered inchemical and mechanical analysis of soils. Alllarger rocks, gravel, etc. are removed by screeningthe soil material through a 2 mm sieve. Thecomponents of fine earth are sand, silt and clay.The different particle size fractions are named
and classified arbitrarily. Several conventionalschemes exist for the classification of soilparticles according to particle diameter ranges.Classifications of the International Society of SoilScience (ISSS) renamed as the InternationalUnion of Soil Sciences and the United StatesDepartment of Agriculture (USDA) are widelyin use (Table 2.2.1).
Table 2.2.1 Classification of soil fractions according to particle diameter ranges
ISSS USDA European System
Fraction Diameter Fraction Diameter Fraction Diameter
Coarse sand 2–0.2 Very coarse sand 2–1 Coarse sand 2-0.6
Fine sand 0.2–0.02 Coarse sand 1–0.5 Medium sand 0.6-0.2
Silt 0.02–0.002 Medium sand 0.5–0.25 Fine sand 0.2-0.06
Clay < 0.002 Fine sand 0.25–0.10 Coarse silt 0.06-0.02
Very fine sand 0.10–0.05 Medium silt 0.02-0.006
Silt 0.05–0.002 Fine silt 0.006-0.002
Clay < 0.002 Coarse clay 0.002-0.0006
Medium clay 0.0006-0.0002
Fine clay <0.0002
The clay may be subdivided into coarse or non-colloidal clay of 0.002-0.0002 mm in diameterand fine or colloidal clay of <0.0002 mm indiameter.
2.2.1.2 Specific surface
Specific surface is an important property of soilparticles and is defined as the surface area ofparticles per unit mass or per unit volume ofsoil particles. Most of the chemical reactions and
physical processes, like adsorption of water,swelling, shrinkage, plasticity, soil strength,cation exchange capacity, availability ofnutrients, etc., depend on the specific surface ofparticles, which increases as the size of theparticle decreases. For same volume, the specificsurface increases the times as the size of theparticle decreases. Specific surface of soilparticles, different clays and different texturedsoils is given in Table 2.2.2
Table 2.2.2 Specific surface of soil particles, clay minerals and different textured soils
Size Diameter Specific Clay mineral Specificfraction/ soil (mm) surface (cm2/g) surface (m2/g)
Coarse sand 2.0-0.2 45 Kaolinite 37-45Fine sand 0.2-0.02 446 Illite 120-170Silt 0.0-0.002 4458 Chlorite 130-180Clay 10-4 -10-6 1000 x 104 Montmorillonite 580-750Sandy loam 1x10⁴- 4x10⁴ Vermiculite 780-900Loam 50x104- 100x104
Clay 150x104-250x104

14 Manual on Enhancing Water Use Efficiency in Canal Commands
2.2.2 Textural class : The overall texturaldesignation of a soil is called the textural class.It is normally determined on the basis ofrelative proportion of sand, silt and clay(weight basis) . Soi ls with differentproportions of sand, silt and clay are assignedto different classes as shown in Texturaltriangle (Fig. 2.2).
Fig. 2.2 Textural triangle (sand, silt and clay particlesizes of 2-0.02 mm, 0.02-0.002 mm and < 0.002 mm,
respectively)
There are three well recognized broad primarytextural groups of soils, namely sandy soils,loamy soils and clayey soils.
(a) Sandy soils
Soils in which the sand content is 70% or moreand the clay content is 15% or less of the materialby weight are characterized as sandy. Twospecific textural classes are sand and loamy sand.
(b) Loamy soils
The loamy soil group contains seven sub-divisions, i.e., sandy loam, loam, silt loam, silt, sandyclay loam, clay loam and silty clay loam. To qualifyfor the modifier sandy or silt, a soil must have atleast 40-50% of these separates, thus, a loam soilin which sand is dominant is classified as sandyloam.
An ideal loam soil is defined as a mixture of sand,silt and clay particles that exhibit the propertiesof these separates in equal proportions. Thisdefinition does not mean that the three separatesare present in equal amounts. From agriculturalpoint of view, loam soil is the most favorable asits capacity to retain water and nutrients is betterthan that of sand, while its drainage, aeration andtillage properties are more favorable than thoseof clay.
(c) Clayey soils
A soil to be designated as clayey must contain atleast 35% of the clay separates. This group isfurther divided into three sub-divisions. If percent of clay is 40 or more, class name is giveneither as sandy clay, silty clay, or clay dependingupon the sand and silt contents as compared to40% of clay. Sandy clay contains more sand thanclay. Similarly, silt content of silt clay is usuallymore than the clay fraction.
i) Particle density
Particle density of a soil is the oven dry mass orweight of the soil per unit volume of soil solidonly. It depends on chemical and mineralogicalcomposition of the soil. In most mineral soils, itis in the range of 2.60 to 2.70 Mg m-3, and for mostpurposes, an average value of 2.65 Mg m-3 istaken. The presence of iron oxides and of otherheavy minerals increases, whereas, organicmatter lowers the value of particle density.
ii) Bulk density
Bulk density of a soil is the oven dry mass of thesoil per unit volume. If pores constitute half ofthe soil volume, the bulk density is half of theparticle density. Therefore, the value of bulkdensity will range from 1.3 to 1.35 Mg m-3. Bulkdensity of soil is influenced by soil texture,structure, moisture content, organic matter andland management practices. In coarse texturedsoils, it varies from 1.40 to 1.75 Mg m-3, and infine textured soils, it normally ranges from 1.10to 1.40 Mg m-3. Increase in organic matter contentlowers the bulk density of soil, which normallydecreases as the mineral soils become finer in

Manual on Enhancing Water Use Efficiency in Canal Commands 15
texture. High bulk density indicates compactnessof the soil. Bulk density is generally higher inlower depths in the soil profile due to lowerorganic matter content and higher overburdenof the upper soil layers. In swelling soils, bulkdensity decreases with the increase in moisturecontent and vice versa. Bulk density is of greaterimportance than particle density inunderstanding the physical behavior of soils. Itis used for calculating the weight of a furrow sliceof soil in a given area.
iii) Porosity
Porosity is the volume occupied by pores per unitvolume of soil and generally expressed aspercentage. Its value lies between 30 and 60%.Porosity is less in coarse/light textured than infine textured soils but size of individual pores islarger in coarse textured than in fine texturedsoils. In clayey soils, porosity is highly variableas the soil alternatively swells, shrinks,aggregates, disperses, compacts and cracksduring wetting and drying. Porosity is related tobulk density and particle density of the soil andthe relationship is expressed as under:
Porosity (%) = 100 density Particle
densityBulk 1 ⎟⎟
⎠
⎞⎜⎜⎝
⎛−
Two types of pores- macro- and micro-poresoccur in soils without any clear demarcation.Usually, pores larger than 0.06 mm in diameterare considered as macro-pores and those smallerthan this are called as micro-pores or capillarypores. Macro-pores allow air and watermovement readily, whereas, movement of waterand air is restricted to some extent in micro-pores.Pore space directly controls the amount of waterand air in the soil and indirectly influences theplant growth. Distribution of different sized poresrather than total pore space is more importantfor crop production. For optimum plant growth,the existence of approximately equal proportionof macro and micro-pores are needed, whichinfluences aeration, permeability, drainage andwater retention favorably. Porosity of a soil canbe changed easily.
iv) Air-filled porosity
Air-filled porosity is the volume occupied by airper unit volume of soil and expressed aspercentage. This is an important criterion of soilaeration. Air-filled porosity is related to thedegree of saturation of soil.
v) Mass wetness (θθθθθg)
Mass wetness is the mass of water per unit massof oven dried soil and often referred as thegravimetric water content. It is expressed as afraction or percentage.
Mass wetness (θθθθθg) = 100 soil driedoven of Mass
waterof Mass⎟⎠⎞
⎜⎝⎛
In mineral soils, gravimetric water content atsaturation ranges from 0.25 to 0.60 (25-60%)depending on the bulk density. The saturatedwater content is usually taken as maximum waterholding capacity of the soil and is generallyhigher in clayey than in sandy soils. In case oforganic soils, such as peat and muck, thesaturation water content on mass basis mayexceed 100%.
vi) Volume wetness (θθθθθv)
Volume wetness is the ratio of total volume ofwater occupied in the pore spaces to the totalvolume of soil and expressed as a fraction orpercentage.
Volume wetness (θv) = 100 soil of volumeTotal
waterof Volume⎟⎠⎞
⎜⎝⎛
Volumetric water content can be computed fromthe gravimetric water content by multiplying itwith soil bulk density. At saturation, volumetricwater content is equal to the porosity of soil. Insandy soils, the value of qv at saturation pointranges from 40 to 50%, in medium textured soils,it is approximately 50%, and in clayey soils, itcan be up to 60%. In clayey soil, the relativevolume of water at saturation point can exceedthe porosity of dry soil since clayey soil swellsupon wetting.
The expression of water content on volumetricbasis is more useful and convenient sincevolumetric water content is directly involved in

16 Manual on Enhancing Water Use Efficiency in Canal Commands
calculating water flux, volume of water added tothe soil by rain or through irrigation and volumeof water extracted from the soil by the process ofevaporation and transpiration by plants.
2.2.3 Influence of Soil Separates on Propertiesand Behaviour of Soils
The soil separates have profound influence onproperties and behaviour of soils. Different soilscontain different proportions of sand, silt andclay, and exhibit properties as determined by thedominant fraction. The comparative influence ofsoil separates on some properties and behaviorof soils is presented in Table 2.2.3.
Table 2.2.3 : Comparative influence of soil separates on properties and behavior of soils
Property/behavior Rating associated with soil separates
Sand Silt Clay
Feel Gritty Gritty Plastic
Water holding capacity Low Medium to high High
Plant available water Low Medium High
Aeration Good Medium Poor
Drainage High Slow to medium Very slow
Organic matter decomposition Rapid Medium Slow
Summer warming up Rapid Moderate Slow
Compactability Low Medium High
Wind erosion Moderate High Low
(high in fine sand)
Water erosion Low High Low if(unless fine sand) aggregated
Shrinking-swelling Very low Low Moderate to
very high
Sealing Poor Poor Good
Fertility Poor Medium to high High
Buffering capacity Low Medium High
Runoff Low Low-medium Medium-high
In general, sandy soils have low water andnutrient holding capacity, low organic mattercontent, little or no swelling and shrinkage, poorsealing properties for ponds and dams, highleaching of nutrients and pollutants. The finesands are easily blown by wind, while coarsesands resist erosion by water.
The medium textured soils dominating in siltcontent have medium to high water and nutrientholding capacity, moderate aeration, slow tomedium drainage, medium to high organicmatter content, usually good supply of plant
nutrients and moderate leaching of pollutantsand nutrients. These soils are easily blown bywind and susceptible to water erosion, easilycompacted, have little swelling and shrinkageand are moderately difficult to till after rain.
A loam soil is often considered to be the optimalfor plant growth. Its capacity to retain water andnutrients is better than that of sandy, while itsdrainage, aeration and tillage properties are oftenfavorable than those of clayey.
The clayey soils have high water and nutrientsholding capacity, poor aeration, very slow

Manual on Enhancing Water Use Efficiency in Canal Commands 17
drainage unless cracked, high to medium organicmatter content, medium to high shrinkage andgood sealing properties. These soils resist winderosion and aggregated clays also resist watererosion. They are easily compacted, and thus,retard leaching of nutrients and pollutants.
2.2.3 Soil structure
Soil structure is defined as the arrangement ofprimary and secondary particles into a certainstructural pattern. This arrangement results in theformation of different sized soil pores. Therefore,sometimes, soil structure is also defined as thearrangement of various sized soil pores into acertain structural pattern.
Soil structure as such is not a plant growth factor,but practically, it influences all plant growthfactors such as water supply, aeration, availabilityof plant nutrients, microbial activity, rootpenetration, etc. Soil structure is affected by soilmanagement practices such as tillage, cultivationand application of fertilizers, manures,amendments (liming, gypsum) and irrigation.Aggregation decreases the detachability andtransportability of soil particles by water or wind,and thus, reduces the runoff and soil erosion.
2.2.3.1 Desirable soil structure
The desirable soil structure is one that results inhighest crop production. The quality of soilstructure can be expressed in terms of pore sizedistribution, aggregation and permeability.
a) Pore-size distribution
Suitable proportion of large (>0.06 mm), medium(0.06-0.01 mm) and small (0.01-0.0002 mm) sizedpores are needed for higher crop production.Large sized pores serve aeration and infiltration,medium sized pores water conduction, and smallpores storage of plant available water, while thehygroscopic water is held on surface of the soilparticles and within the lattices of the expandingclays. In areas where sufficient water is availablefrom rain or irrigation, the water storage pores(small pores) are not so important but aerationpores (large pores) are greatly required. Inregions of restricted rainfall (dry land areas), the
storage pores are very important and sufficientlarge pores are needed to ensure adequateinfiltration capacity.
b) Aggregation
The aggregation of a soil should be such that canprovide the pore distribution as described above,and they should be stable enough to retain theiridentities in spite of rainfall impact or temporarysubmergence. Aggregates of sand and gravel sizeare preferred. If such aggregates are water stable,the soil is said to be in good tilth. Silt sizedaggregates are undesirable as the resulting porescannot be drained by gravity, and the dispersedclay represents the most unfavourable structure.
c) Permeability
Soil structure should be such that the infiltrationcapacity may be large, the percolation capacitymedium and air exchange not excessive butsufficient.
d) Cohesiveness
It is desirable that the individual peds are highlycohesive since this will protect them fromdestruction by rain drop impact or submergence.Cohesiveness of soil changes with moisturecontent. Soil should be in friable condition butnot too loose since very loose soil suffers fromexcessive aeration. It does not provide enoughcontact between roots and soil and does notprovide the plants sufficient support. Massivelycompact soil restricts aeration and rootproliferation.
2.3 Soil Moisture Constants
Knowledge of the amount of water held by thesoil at various tensions provides informationregarding the amount of water available to theplants, the water that can be stored by the soilbefore percolation starts and the amount of waterneeded for irrigation. The relationship betweenthe amount of soil water and the energy withwhich it is held (soil water potential) is acontinuous function, and the plot of relationshipbetween the two for a given soil is known as thesoil moisture retention curve. Water held at specific

18 Manual on Enhancing Water Use Efficiency in Canal Commands
water potential values are called soil moistureconstants. These constants have been proposedin attempts to characterize a soil by a singlenumber and to compare the retention capacity ofdifferent soils.
i) Saturation
When all pores in the soil are completely filledwith water, the soil is said to be at saturation. Atsaturation, water in the soil is at zero tension orsuction and majority of its pores are filled withwater. The maximum water holding capacity ofa soil is desirable in pot culture experiments as itprovides a simple means of determining usefulmoisture level to be maintained for good plantgrowth. With medium textured soils in pots, thegood plant growth is obtained at moisture levelcorresponding to 50-70% of the maximum water
holding capacity.
ii) Available water
The available water or plant available watersignifies the water held by a soil between 1/3 and15 bar suction, i.e., between field capacity andthe wilting point. The available moisture holdingcapacities of soils are presented in Table 2.3.1.
iii) Air dried soil
The term air dry soil designates the moisturecondition when soil is in equilibrium with theatmosphere. It corresponds to -31 to -1000 bardepending upon the degree of saturation andtemperature of the atmosphere. It is not an equi-potential. Soil moisture constants and theircorresponding soil water potential have beenshown in Fig. 2.3.
Fig. 2.3. Soil moisture constants and corresponding soil water potential
iv) Field capacity
When a saturated field soil is allowed to drain,soil moisture decreases with time. After 2 to 3days, the moisture in surface layer attains asteady state. At this stage, the water retained inthe soil is known as at field capacity. Thus, fieldcapacity is defined as the amount of waterretained in the soil after downward movementfrom a pre-saturated soil has materially ceasedor practically zero. It is determined with the help
of pressure plate apparatus. The matric potentialcorresponding to this moisture content is affectedby soil texture, type of clay, organic matter, depthof wetting, the presence of impeding layers andevapo-transpiration. For these reasons, theconcept of field capacity, being misleading, isgenerally abandoned by soil scientists. Generally,moisture percentage at 1/10 to 1/3 bar representsa measurable field capacity. Moisture percentageat 1/10 bar is more reasonable field capacity for

Manual on Enhancing Water Use Efficiency in Canal Commands 19
coarse textured, while 1/3 bar for medium andfine textured soils. The field capacity is about 4%(by mass) in sandy soils, 45% in clayey soils andeven up to 60% in some organic soils.
v) Wilting point
It refers to the soil moisture content at which plantroots can not extract water at a rate sufficient tomeet the transpiration needs. At this moisturecontent, the plants lose cell turgidity and showsymptoms of wilting. At this point, the plant cannot regain turgidity even when placed in watersaturated atmosphere. The matric potentialcorresponding to this moisture content is -15 bar(1 bar = 1000 cm of water column = 0.987 Atm) or
pF of 4.18. Water retained by the soil at matricpotential -15 bar can be estimated with the helpof pressure plate apparatus. The wilting point isaffected by both the plant species and the stageof plant growth. At wilting point, there is a layerof about 5-6 molecules of water around theparticles which is an exceedingly thin. So, the soilstructure has very little influence on moisturecontent at -15 bar and only texture plays the role.Concentration of salts in soil solution also hasgreat influence on wilting point. Normally, theroots of a crop plant are extended to lower depthsdiffering in moisture contents. Therefore, a plantcan thrive in a soil which is dry at surface but hasrelatively higher moisture in lower depths.
Table 2.3.1 : Soil moisture constants and available water ranges of different soils
Soil texture Field capacity Permanent wilting point Available moisture
(%) (cm/m) (%) (cm/m) (%) (cm/m)
Sandy 9 15 4 7 5 8
(6-12)* (10-20) (2-6) (3-10) (4-6) (7-10)
Sandy loam 14 21 6 9 8 12
(10-18) (14-27) (4-8) (6-12) (6-10) (9-15)
Loam 22 31 10 14 12 17
(18-26) (25-36) (8-12) (11-13) (10-14) (14-19)
Clay loam 27 36 13 18 14 19
(23-31) (30-43) (11-15) (14-21) (12-16) (17-22)
Silty clay 31 40 15 20 16 21
(27-35) (34-46) (13-17) (16-23) (14-18) (18-23)
Clay 35 44 17 21 18 23
(31-39) (37-50) 15-19) (18-25) (16-20) (19-26)
*Figures in parentheses are ranges
2.3.1 Water intake in soil
The movement of irrigation water from surfaceinto and through the soil is called water intake.It is essentially an expression of infiltration andpercolation.
i) Infiltration
Infiltration is the entry of water into the soilthrough its surface due to sorption and verticalflow through soil profile. The rate at which water
enters into the soil is known as infiltration rate,i.e., volume of water entering into the soil perunit area per unit time. The process of infiltrationis of a great practical importance as it determinesthe amount of runoff, helps in deciding the rateof irrigation to be applied and assesses thetextural and structural conditions of soil surfaceand transmission characteristics of sub-surfacesoil layers.

20 Manual on Enhancing Water Use Efficiency in Canal Commands
Irrespective of soil texture, the infiltration ratereduces with time and attains a steady rate aftera long lapse of time. The final steady rate isknown as the basic infiltration rate. Infiltrabilityor infiltration capacity of soil is the maximum fluxof water that enters the soil with free water
ponded at the surface. The total amount/depthof water that infiltrates the soil in a given time iscalled as cumulative infiltration.
In addition to texture, the infiltration capacity alsodepends on vegetation (Table 2.3.2). Theinfiltration rate is classified as given in Table 2.3.3.
Table 2.3.2 : The effect of soil texture and vegetation on infiltration capacity
Texture Infiltration capacity (mm/h)
Vegetated soil Bare soil
Loamy sand 40-50 20-25
Loam 20-25 10-15
Silt loam 10-15 5-10
Clay loam 3-5 2-3
Table 2.3.3 : Classification of infiltration rate
Class description Infiltration rate (mm/h)
Very rapid >250
Rapid 125-250
Moderately rapid 60-125
Moderate 20-60
Moderately slow 5-20
Slow 1-5
Very slow < 1
ii) Percolation
Percolation is the downward movement of waterthrough the soil profile. It is same as the drainage.Percolation occurs predominantly in downwarddirection and infiltration can be considered asfirst stage of percolation. The downward flux ofwater below the maximum root zone depth iscalled deep percolation. It is unavoidable lossfollowing irrigation which is more in coarser thanin finer soils. Pressurized/micro-irrigationsystems (sprinkler and drip) are very helpful inchecking deep percolation loss as waterapplication rate in these systems may be adjustedas per the hydraulic properties of soil and waterrequirement of the crops.
Percolation occurs when the soil water potentialis greater than about 1/2 atmosphere as soil drier
than this potential holds water with a force whichis greater than the downward attraction force ofgravity. Percolation is very important in soildevelopment and land management. It removesthe high salt content through leaching butremoves valuable plant nutrients also. Sincesignificant amount of water is lost throughevaporation and transpiration processes,therefore, the amount of water that percolatesthrough the soil decreases with depth. Further,during the active vegetative period, only smallamount of water percolates from surface to thelower depths except in sandy soils. Classificationof percolation rate is given in Table 2.3.4.
Table 2.3.4 : Classification of percolation rate
Class description Percolation rate (mm/h)
Rapid >150
Moderately rapid 50-150
Moderate 15-50
Moderately slow 5-15
Slow 1.25-5
Very slow <1.25
iii) Seepage
Seepage is the downward and lateral movementof water into soil. Water seeps or leaks from awater source such as irrigation canal or a reservoir

Manual on Enhancing Water Use Efficiency in Canal Commands 21
to the adjoining area. Such water may join theunderground water table or may join the sub-surface flow to springs or streams or may appearas wet spot or seeps on the surface. Seepage ratedepends on the wetted parameter of the reservoiror the canal and conductivity of the soil.
2.3.2 Water Retention by Soils
In an unsaturated soil, water is retained by theforces of capillarity and adsorption. The adsorptionof water occurs through the hydration of dry soilmatrix surface and exchangeable cations.Continued adsorption results in the formation ofwater rings at the points of contact of soilparticles. With further intake of water, it gets intothe soil pores where surface tension and radiusof curvature of the air-water interface determineits distribution. The capillary concept is,therefore, often utilized to describe waterretention in soil pores. In coarser soils, capillaryaction is more important than adsorption whilethe reverse is true in the finer soils. Water heldby the soil is capable of movement and it isutilized by plants. When water supply isexhausted, soil gradually dries up from above todownwards.
2.3.3 Capillarity and Water Retention
The water rises in a capillary tube when it ispartially immersed in water. If the tube is madeof glass or quartz, water makes contact with thetube at an angle close to zero, and forms a concaveair-water meniscus. Since the pressure at thewater surface outside tube is the atmosphericpressure, water rises in the tube till thehydrostatic pressure of water column equals thepressure difference across the air-water meniscus.The hydrostatic pressure is actually equal to theheight of water in the capillary tube, which isgiven by πr2hρwg, where r is the radius of thecapillary tube, h is the height of water, ρw is thedensity of water and g is the acceleration due togravity. This downward force is balanced by theupward force due to surface tension which isestimated as 2πrσcosθ, where 2πr is thecircumference of the capillary tube, σ is thesurface tension and θ is the contact anglesubtended by water with the glass tube.
At equilibrium the downward force will bebalanced by the upward force as represented inthe following equation :
πr2hρwg = 2πrσcosθ
From this equation, water height (h) can bedetermined by the following equation :
h = grcoswρ
θσ2
For water, θ being close to zero, cos θ may betaken as equal to unity and the above equationsimplifies to the following equation:
h =
gr wρσ2
or h = gd wρσ4
where d is the diameter of capillary tube.
Considering θ = 0, σ = 72.75 x 10⁻³ N m-1, ρw =0.998 Mg m-3 and g = 9.81 m s-2 at 20 oC, we getthe simplified equation as:
h = d
297.0 =
d
3.0
Above equation can be used to estimate capillaryor matric potential for a known pore size, or tocalculate the diameter of the largest effective poreof a soil for which the capillary rise is known.
In soil, the capillary pores are not uniform in size.The variation in size of pores and the degree ofsaturation lead to air-water interfaces of varyingradii of curvature, which also affect the matricpotential by altering the pressure differenceacross the air-water interface. The relation of thecurvature of an air-water interface to the pressuredifference across the interface in given by theLaplace equation given below.
Pw – P
a = 2σ
rrr
σ211
21=⎟
⎠⎞+⎜
⎝⎛
Where Pw and Pa are the pressure of water belowand above air-water meniscus, respectively andr1 and r2 are the principal radii of curvatureformed above and below the air-water meniscus.The mean radius of curvature r is positive if itlies within the water phase and negative if it liesin the gas phase.

22 Manual on Enhancing Water Use Efficiency in Canal Commands
2.4 Movement of Soil Water
Water is a highly dynamic component in soilsystem. It moves in all the three phases: solid,liquid and gaseous (vapour) phases. Underordinary conditions, water movement in the soildoes not occur in the form of ice or solid phase.Movement in solid phase is commonly occurringin the frozen soil where the formation of ice lensesmakes the soil heave or swell and such movementoccurs as part of a movement of the entire soilbody. Movement in these soils is also believed totake place close to the clay surface. In a floodedor saturated soil, water moves in liquid phase,while in a partially dry or unsaturated soil, itmoves in both liquid and vapour phases.
Liquid movement is of two types:
a) Saturated flow: When flow takes place undersaturated conditions, flow is known assaturated flow. Most of the pores are filledwith water and water in this condition istension free. This occurs in the zone ofgroundwater and sometimes in the soilafter heavy rains or during irrigation.
b) Unsaturated flow: When flow of water takesplace under unsaturated condition, theflow is termed as unsaturated flow. Poresare partially filled with air and partiallywith water. The water is under tension.
Water vapour movement is of two types:
a) Diffusion: When water vapour move bydiffusion as a result of vapour pressure(partial pressure) differences i.e. diffusionof water vapour.
The vapour pressure of soil moisture isaffected by:
a. Moisture content—Vapour pressureincreases with moisture content.
b. Temperature— Vapour pressure increaseswith temperature.
c. Soluble salts— Vapour pressure decreasewith increase of soluble salt content.
b) Mass flow: When water vapor flow in amass with the other gases of the system inresponse to difference in total pressure i.e.bodily movement of soil atmosphere. Massflow can be caused by change inatmospheric pressure, change in soiltemperature and pressure change cause byinfiltration (compression) and bypercolation (evacuation).
Mass flow of water vapour represents only a smallportion of the entire water vapour movement in thesoil.
In liquid and vapour phases, water movement isgoverned by the principles of fluid flow. In aflooded or saturated soil, water moves by gravityand the velocity of flow through soil poresincreases with the height of water above it.
Poiseuille’s Law states that flow of water througha narrow tube is directly proportional to thefourth power of its radius and pressuredifference, and inversely proportional to theviscosity and length of tube and is given by theequation:
q = ⎟⎠⎞
⎜⎝⎛ Δ
L
pr
ηπ8
4
where pΔ is the pressure difference in dynes cm2,r is the radius of tube in cm, L is the length oftube in cm and h is the coefficient of viscosity ofthe liquid in dynes-sec cm2 (poise). This relationis true only when the flow is steady or streamlineand pressure is constant along the cross-sectionof the tube.
Soil water movement will occur when there is apotential difference between different points inthe soil system. The water moves from higher tolower potential.
All theories of flow of water in soils are based onearly theories of fluid dynamics for flow of waterthrough narrow capillaries or pipes. Earlytheories of fluid dynamics were based on thehypothetical concepts of a prefect fluid i.e. thefluid is frictionless and incompressible. In theflow of fluid, contacting layers can exhibit noshearing stress but only normal pressure. Suchfluids do not in fact exist. In the flow of real fluids,

Manual on Enhancing Water Use Efficiency in Canal Commands 23
adjacent layers do transmit tangential stresses(drag) and the existence of intermolecularattraction causes the fluid molecules in contactwith a solid wall to adhere to it rather than slipover it. The flow of real fluid is associated withthe properties of viscosity.
Saturated flow: When the soil pres are filled withwater, the soil suction is negligible and thepotential is made up of the gravitational andhydrostatic pressure terms. The theory of watermovement in saturated soil is based on Darcy’sLaw or its generalization, which states that thequantity of water crossing a unit cross-section of asoil in unit time is proportional to the hydraulic headgradient.
v = -K i
Where v = flux velocity, K = hydraulicconductivity. This law was derived empiricallyin one dimension by Darcy.
Both types of flow are governed by Darcy’s Law
Darcy’s Law hold good under the followingconditions:
The fluid is incompressible, the medium issaturated, a steady state flow has beenestablished,
Temperature remains constant
The flow is laminar.
In nature, the hydraulic head in most cases is suchthat the flow remains laminar. Hence, the law isconsidered valid in all soils except very sandyones.
2.4.1 Soil Aeration
Soil aeration refers to the process of exchange ofoxygen and carbon dioxide between the soil airand the atmospheric air. Soil aeration replenishesoxygen consumed during respiration of plantroots and microorganisms and prevents toxicityof carbon dioxide evolved during respiration (Fig.2.4). Aeration porosity is used to describe aerationstatus of soil which is defined as the volume ofpore space filled with air when soil is under atension of 50 cm of water. At this tension, soil
pores of sizes greater than 0.06 mm in diameterare filled with air.
Fig. 2.4. Consumption of oxygen andproduction of carbon dioxide during
respiration by roots and microbes
2.4.2 Characterization of Soil Aeration Status
Soil aeration status may be characterized byvarious methods including composition of soilair, air-filled porosity, carbon dioxide released,air-permeability, diffusion coefficient, redox-potential and oxygen diffusion rate. The oxygendiffusion rate (ODR) is the best method ofmeasuring soil aeration. The ODR is the rate atwhich oxygen can replenish when it is used byrespiring plant roots or by microorganisms. Theinstrument used to measure ODR is known asODR meter. The instrument consists of a smallplatinum electrode and a standard calomelelectrode. These electrodes are inserted into thesoil to a desired depth. The calomel electrode isconnected to the galvanometer which isconnected to the positive terminal of an externalsource of direct current. Its negative terminal isconnected to the platinum electrode. The out putelectric current is related to the rate of oxygenflux at the electrode surface and given by theequation :
i ×10-6 = nFA ö (1)
Where, i is the electric current in microamperes,n is the number of electron required for thereduction of one molecule of oxygen which is 4,

24 Manual on Enhancing Water Use Efficiency in Canal Commands
F is the Faraday’s constant, A is the surface area(cm2) of platinum electrode and ö is the flux orODR to the electrode surface in number ofmolecules of oxygen per second per cm2. TheODR is calculated by equation (1) as:
Oxygen diffusion rate (ODR) =
A 96500 4
10 32 60 i -6
×××××
= 12-8
mincm gA
i 10 0.497 −−××
The ODR has a critical importance to growingplants. Growth of most plants roots ceases whenODR drops to 20´10-8 g cm-2 min-1. The growth ofplant is normally satisfactory as long as the ODRremains about 30-40x0-8 g cm-2 min-1. Therequirement of ODR of some crops is given inTable 2.4.1.
depends on geographical location. Therefore, itis highly variable and area specific, and mainlydetermined by weather parameters such astemperature, relative humidity, radiation,rainfall, wind speed, etc.
Every plant process is affected directly orindirectly by the water supply. The metabolicactivity of cells and plants is closely related totheir water content. Water acts as a solvent inwhich gases, mineral and other solutes enterplant cells and move from cell to cell and tissueto tissue within the plant. Water is a reagent inmany physiological processes includingphotosynthesis and hydrolytic such as hydrolysisof starch to sugar. Decreasing water content isaccompanied by a loss of cell turgor and wilting,cessation of cell enlargement, closure of stomata,reduction of photosynthesis and interferencewith many basic metabolic processes. Eventually,continued dehydration causes disorganization ofthe protoplasm and death of most organisms.
Factors which influence the water relations ofplants, and thus their growth and yield responses,includes: i) soil (soil moisture content, texture,structure, density, salinity, fertility, aeration,temperature and drainage), ii) plant (type of crop,density and depth of rooting, rate of root growth,aerodynamic roughness of the crop, droughttolerance etc.), iii) weather (sunshine,temperature, humidity, wind and rainfall) andiv) management factors (soil volume and plantspacing, soil fertility, and crop and soilmanagement).
2.5.1 Soil-Water Relations
Soil supplies water to plants and weatherparameters controls the demand of water forvarious agro-physiological processes in theplants. Thus, soil-plant-water relationships aremainly related to the properties of soil and plantsthat affect the movement, retention and use ofwater. The rate of entry of water into the soil andits retention, movement and availability to plantroots are affected by the amount and sizedistribution of the soil pores. The amount ofwater present in soil is not very useful unless the
Table 2.4.1 : Critical oxygen diffusion rate(ODR) for different crops
Crop ODR(10-8 g cm-2 min-1)
Maize 30.0
Soybean 28.4
Wheat (unirrigated) 26.9
Wheat (irrigated) 26.3
Peas (Unirrigated) 32.9
Peas (irrigated) 39.5
Toria 22.9
The ODR decreases with the depth of soil andthe decrease is sharp for the soils in which theconcentration of oxygen is lower at soil surface.It also decreases as the moisture contentincreases.
2.5 Soil–Plant–Water Relationships
The judicious and efficient use of water forirrigation in agriculture needs thoroughknowledge of soil-plant-water relationships. Insoil-plant-atmosphere system, the integratedapproach for water management helps inselection of suitable crops and varieties,improvement in crop yields and water useefficiency. The atmospheric demand for evapo-transpiration of water during the crop season

Manual on Enhancing Water Use Efficiency in Canal Commands 25
soil water potential is known as far as the wateravailability to plants is concerned. The amountof water which may represent saturation in sandysoil might be below the permanent wilting pointin a clay soil (Table 2.5.1). The available watercapacity of medium textured soils is greater than
light and heavy textured soils. Heavy texturedsoils have poor aeration under more wetconditions. Hence, in light and very heavytextured soils, shallow and frequent irrigationsare more beneficial to avoid deep percolation andwaterlogging.
Table 2.5.1 : Water content of different soils at -30 and -1500 kPa matric potentials
Soil type Gravimetric moisture content (%)
- 30 kPa -1500 kPa
Sand 4.6 1.6
Fine sandy loam 12.6 5.5
Loam 19.1 8.0
Clay loam 40.2 21.0
Clay 45.1 26.2
Apart from texture, soil structure also affects theamount and size distribution of pores in soils,thereby influences the movement and retentionof water, soil aeration, and penetration anddevelopment of roots. Unlike soil texture, whichis more or less constant, the structure is highlydynamic and may change in response to naturalconditions, biological activities and managementpractices. In an ideal soil, the total pore spaceshould almost be equally divided between non-capillary and capillary pores. Non-capillary helpsin movement of water in the soil profile,penetration and development of roots, whereas,capillary pores are mainly responsible forretention of water in the soil and its availabilityto plant roots. Generally, sandy soils drain almostcompletely at low tension due to the presence ofnon-capillary pores (larger sized pores), but fine-textured clay still hold a considerable amount ofmoisture even at such high tension that plantgrowing in the soil may wilt due to the presenceof large pore volume in capillary pores. Whenthe tension is increased from -10 to -30 kPa insandy soil, more than 50% of the available wateris released. The energy of water (soil waterpotential) is decreased mainly due to theinteraction of water and soil particle surface, andthe solubility of salts in the soil.
The major force in driving water in saturated soilis gravity and naturally, most of it is directeddown ward. Lateral movement also occursmainly due to matric potential. In unsaturatedsoil, the movement of water is a function of soilmoisture content. At moisture contents belowfield capacity, the unsaturated hydraulicconductivity (capillary conductivity) is so lowthat water movement is of little or no significancein relation to plant growth. Movement ofunsaturated flow ceases at a lower tension in sandthan in finer textured soils as the water films losecontinuity sooner between the larger particles.The wetter the soil, the greater is the conductivityfor water. In the ‘moist range’, the range ofunsaturated flow in sand soil is less than loamfollowed by clay soil but a reverse is true undersatu-rated flow. However, in the ‘wet range’ theunsaturated conductivity occurs in the same orsimilar order as saturated conductivity.
At a soil moisture potential of -1500 kPa, thecontinuity of the liquid films is broken and watermoves only in vapour form. Diffusion of watervapour is caused by a vapour pressure gradient.The vapour pressure of soil moisture increaseswith the increase in soil moisture content andtemperature, it decreases with the increase insoluble salt content. Water vapour movement issignificant only in the ‘moist range’. In the wet

26 Manual on Enhancing Water Use Efficiency in Canal Commands
range vapour movement is negligible becausethere are few continuous open pores. In the‘dry range’ water movement exists, but rateof movement is very low due to little water
in the soil. The major force, direction and therate of water movement in saturated,unsaturated and vapour flow is summarizedin Table 2.5.2.
Soil water potential (Øsoil)
Water potential is a measure of the capacity ofwater at a point in an equilibrium (soil-water orplant water) system to do work as compared tothe work capacity of pure free water at the sametemperature and pressure. The principal forceswhich contribute to the soil water potential arethose associated with soil matrix (matricpotential, Øm), osmotic characteristics of the soilsolution (osmotic potential, ø
ð), the total pressure
(pressure potential, ø p) and external force field(gravita-tional potential, ø g). Thus, the soil waterpotential (ø soil) comprise of :
Øsoil = øm+ øð + øp + øg
In normal soils, the major component of soilwater potential is associated with the soilstructure and characteristics of the soil matrix(ø m) while in salt affected soils, in addition toø m, osmotic forces associated with the soilsolution also constitute a major component ofø
ð. Solutes lower the vapour pressure of the soil
water and decrease its free energy or waterpotential (Table 2.5.3). The energy status ofwater is drastically reduced in highly salineconditions, particularly at low soil water contentTherefore, in salt affected soils heavy and/orfrequent irrigation is required to maintain lowsolute concentration in the root zone soil forproper growth of plants (Singh, 1993).
Table 2.5.2 : Saturated, unsaturated and vapour flow of water in soil
Particular Saturated Unsaturated Vapour
Major force Gravitational Metric Vapour pressure
Water form Liquid Liquid and vapour Vapour
Major direction of flow Downward Lateral All directions
Pore space All pores filled Micro pores filled All pores empty
Rate of flow Fast, (1-100 cm/day) Slow, -(0.01-0.00001 cm/day)
Vol. of water movement Large, 375 m3/ha Small, 100 m3/ha inin 15 cm depth 15 cm soil depth) Negligible
Table 2.5.3 : Components of Øsoil at low and high salinity levels in silty loam soil
Soil water Low salinity High salinitycontent (v/v, %)
Matric Solute Total Matric Solute Total
37 -0.105 -0.100 -0.205 -0.105 -5.00 -5.10
20 -15.00 -0.185 -15.20 -15.00 -9.25 -24.25
Soil moisture is always being subjected topressure gradients and vapour pressuredifferences cause it to move. Thus, soilmoisture cannot be said to be constant at anypressure and the amount of available water
varies in different soil textural groups (Table2.5.4). For irrigation system design, the totalavailable water is calculated for a soil depthbased on the root system of a mature crop plantto be grown.

Manual on Enhancing Water Use Efficiency in Canal Commands 27
2.5.2 Plant-Water Relations
The total quantity of water required for theessential physiological func-tions of the plant isusually less than 5% of all the water absorbed.Most of the water entering the plant is lost intranspiration. However, failure to replace thewater lost by transpiration results in the loss ofturgidity, cessation of growth, and eventual deathof the plant. The main areas of plant-waterrelationship are water absorption, waterconduction and translocation, and water loss ortranspiration. These processes are responsible foruptake of plant nutrient, creation of energygradient and ultimately all the metabolic andphysiological activities in the plant.
Plant water potential (Øl)
The plant water potential or leaf water potentialat any point in the system can be partitioned into:
Øl = ø ð + ø p + ø m + ø g + ø i
Except in very dry tissue or in cells with smallvacuoles, the matric potential (ø m) is very smallrelative to osmotic potential (ø
ð) and turgor
potential (ø p). The gravitational potential (ø g) isusually very small for crop plants and isconsidered mainly in trees where a verticalchange of 10 m affects the ø g by approximately100 kPa. The ø i is the interaction of aboveexplained components of total water potential isalso very small in most of the crop species, henceit can be neglected and than :
Ø l = ø ð + ø p
Assuming no change in cell volume therelationships can be:
Øl = ø ð + ø p
0 = - 20 + 20 bars, turgid
- 10 = - 20 + 10 bars, partially turgid
- 20 = - 20 + 0 bars, flaccid or wilted
2.5.2.1 Plant structure
Morphologically a plant consists of roots, stemand leaves. The leaves are born throughout thestem in all the plants and are mainly responsiblefor the loss of water. Similar variation in plantwater relations among different species andbetween surfaces also exist. The internal structureof a typical leaf in Figure 2.5.1 shows that thesurface has small pores surrounded by two cells.These pores are called stoma and the cellssurrounding them are called guard cells.
Table 2.5.4 : Range of available water holding capacity of soils
Soil type Gravimetric moisture content (%) Depth of available water
Field capacity Permanent wilting point (cm/m soil depth)
Fine sand 3-5 1-3 2-4
Sandy loam 5-15 3-8 4-11
Silt loam 12-18 6-10 6-13
Clay loam 15-30 7-16 10-18
Clay 25-40 12-20 16-30
Fig. 2.5.1 Portion of a leaf cross-section adjacent to stomata.
The stomata regulate the loss of water as vapoursand exchange of carbon dioxide in the leaf andother organs. The leaves maintain their continuityof structure with the stem which has conductingtissues called xylem, the main channels of watertransport, and phloem. The stem maintains itscontinuity with the root, which eventually is incontact with the soil. The outer-most cell of the

28 Manual on Enhancing Water Use Efficiency in Canal Commands
root usually gets elongated into a long hair whichhas its continuity with the remaining cells. Otherepidermal cells are also capable of absorbingwater but the root hair pro-vides the advantageof exploring more area because of its enlargedsurface. Thus, a large number of root hairs drawmoisture from their vicinity and supply water tothe cortex.
2.5.2.2 Rooting characteristics and moisture use
The amount of soil moisture that is available to aplant is determined by the moisturecharacteristics of the soil, the depth to which theplant roots extend and the proliferation of theroots. Little can be done to alter soil moisture
availability. Greater possibilities lie in changingthe plant characteristics, enabling it to extend itsrooting system deeper into the soil, therebyenlarging its reservoir of water. Plants varygenetically in their rooting characteristics (Table2.5.5). Vegetable crops, such as onions andpotatoes, have a sparse rooting system and areunable to use all the soil water within the rootzone. Forage grasses, sorghum, maize and suchother crops have very fibrous, dense roots.Lucerne has a deep root system. Perennial planthas already established root depth, and needsonly to extend its small roots and root hairs toutilize the entire amount of available soil water.
Table 2.5.5 : Effective root zone depth of common crops in well drained soil
Shallow (60 cm) Moderately deep(90 cm) Deep (120 cm) Very deep (180 cm)
Rice Wheat Maize SugarcanePotato Tobacco Cotton CitrusCauliflower Castor Sorghum CoffeeCabbage Groundnut Pearl millet AppleLettuce Muskmelon- Soybean GrapevineOnion Carrots, Chilli Sugar beet Safflower
Pea, Bean Tomato Lucerne
Moisture extraction pattern within root zone:The moisture extraction pattern is the relativeamounts of moisture extracted from differentdepths within the root zone. About 40% of thetotal moisture used is extracted from the 1st,30% 2nd, 20% 3rd and only 10% from the lastquarter of the root zone (Fig. 2.5.2). So to havea fair estimate of the soil moisture status, itshould be measured at different depths withinthe root zone.
2.5.2.3 Development of crop water deficit: Theinternal water balance or degree of turgidity of aplant depends on the relative rates of waterabsorption and water loss, which is influencedby the complex of atmospheric, soil and plantfactors (Zhuang et al, 2000). Water stress causeschanges in metabolism of plants, decreasingphysiological processes, leaf area, cell size andinter-cellular volume and at certain critical stagesof plant growth causes more injury than at otherstages. During recovery from stress when thewater deficit in the tissues is being replenished,losses from transpiration will be less than gainsand the absorption lag will be -ve. During thetransition period between the development ofdeficits in the morning and afternoon recoveryperiod, the water potential of vascular andsurrounding tissues approaches equilibrium, asdoes transpiration and water uptake i. e. there islittle or no absorption lag by the roots (Ludlow
Fig. 2.5.2 Moisture-extraction pattern of plantsunder adequate soil moisture

Manual on Enhancing Water Use Efficiency in Canal Commands 29
and Muchow, 1990). All actively transpiringplants, therefore, experience some degree ofshort-term water deficits, regardless of how wellthey are supplied with water. In contrast to steadydecline in soil water potential, the leaf exhibitsmarked diurnal fluctuations in water status asthe evaporative demand varies during day andnight (Ellsworth, 1999). The essential nature ofwater movement through the soil-plant-atmosphere systems, particularly thedevelopment of plant water deficits grown in soilallowed drying from a fully saturated to the pointof wilting on a diurnal time scale is shown inFigure 2.5.3.
reaching almost to compensation point at middaywhen Øl = ø
ð.. The leaf attains zero turgor at thispoint, which causes wilting of leaves. The valuesø l for CO2 compensation point for several cropsare summarized in table 2.5.6. Though the loss ofleaf turgor is a major cause for stomatal closurebut it is not a sole cause for stomatal response towater deficit (Turner, 1997). In controllingstomatal conductance in sorghum ø soil and ø p
were equally important, but the ø soil in pearlmillet and ø p in maize were the dominatingfactors in regulating the stomatal conductance(Singh and Singh, 1995).
2.5.3 Water Movement along Soil – Plant -Atmosphere System
The complete path of water from the soil plantatmos-phere forms a continuous system, which
may be divided into four sequential processes. i)supply of liquid water to the root surface, ii) entryof water into the root, iii) passage of water in theconducting ele-ments and iv) movement of watervapour through and out of the leaves. The rateof water movement is proportional to thepotential gradient and inversely proportional tothe resistance to flow. The difference in totalwater potential in the soil-plant-atmospheresystem could generate a driving force for watermovement from the soil through the plant toatmosphere. On an average, the ø soil variesbetween - 0.1 to – 20, ø leaf between - 5.0 to - 50 andø atms between - 1000 to - 2000 kPa (Bharmabe et al,1999). If this continuum is broken, the drivingforce would automatically disappear.
Fig. 2.5.3 Probable changes in ø leaf and ø root of aplant (Slatyer, 1967)
The rate of photosynthesis goes on decreasingwith the progressive increase in moisture stress,
Table 2.5.6 : Leaf water potential at which net photosynthesis is zero (Singh et al, 1991)
Crop Cultivar Growth stage ØØø l (±2 kPa)
Wheat WH-147 Anthesis - 42
Barley BG-25 Anthesis - 46
Chickpea H-355 Pod initiation - 30
Mustard Parkash Flowering - 43
Pearl millet BJ-I04 Heading - 40
Cluster bean FS-277 Pod initiation - 30
Green gram T-44 Flowering - 16

30 Manual on Enhancing Water Use Efficiency in Canal Commands
Water movement in soil-plant atmosphere (SPA)is proportional to the driving force betweenevaporating surfaces and is inverselyproportional to the various resistances in thepathway. Plants can extract water from the soilonly when their water potential is lower than thatin the soil. This potential difference or water
potential gradient between the evaporatingtissues of the plant and the soil water in the rootzone increases with the evaporative demand andliquid flow resistances in the pathway.
The rate of water movement (flux) in soil-plant-atmosphere system :
Øsoil -Ø root surface Ø root surface - Øxylem Øxylem - Øleaf Øleaf - ØairFlux = —————————— = ——————————— = ——————— = ———————
rsoil
rroot
rxylem
+ rleaf
rleaf
+ rair
Resistance to water movement in the soil (rsoil) isgoverned by its hydraulic conductivity, watercontent and path length. Water movement in theplant can be considered in two phases, i.e. theliquid phase from the root surface to themesophyIl cell, and the vapour phase from thesurface of the leaf mesophyll cell to the stomatal
pores. The resistances to flow are relatively lowin the liquid phase, being highest in the roots (atthe endodermis), intermediate in the leaves andlowest in the stems. In actively growing plant ina steady state in moist soil, the water potential atvarious points along the pathway are given inTable 2.5.7.
Table 2.5.7 : The water potential at different points in soil-plant-atmosphere system
Location Potential (kPa)Soil 1 cm from root - 3Soil adjacent to root - 5Xylem of root near ground surface - 6Xylem in leaf - 7Cell wall of leaf mesophyll cells - 8Air just inside stomata at 20°C and 95 % R.H. - 69Air just outside stomata at 20°C and 50 % R.H. - 701Air outside atmosphere at 20°C and 50 % R.H. - 960
The transformation of water from the liquid tothe gaseous phase requires energy, which comesfrom the solar radiation falling upon the leaf.There are several resistances to water movementfrom within the leaf to the external atmospherebut the most important are stomatal resistanceand the resistance to diffusion through boundarylayer of still air around the leaf.
a) Evaporation
Evaporation is a diffusive process by which waterin the form of vapour is transferred from theunderlying natural surfaces, such as open water,bare soil or vege-tative cover to the atmosphere.The essential requirements in evaporationprocess are: i) source of heat to vaporise the liquidwater, and ii) presence of a gradient ofconcentration of water vapour between the
evaporating surface and the surrounding air. Thesource of energy for evaporation may be solarenergy, the air blowing over the surface or theunderlying surface itself. The energy required forevaporation, regardless of the surface whereevaporation is taking place is 540 calories pergram of water evaporated at 250C. Evapo-rationcan, however, occur only when the vapourconcentration at the evaporating surface exceedsthat in the overlying air (Zhuang et al, 2000).--Evaporation from the land surface is dependsmainly on the degree of saturation of soil surface,temperature of air and soil, humidity and windvelocity. Several of these factors are greatlyinfluenced by the vegetative cover. At highmoisture contents, evaporation from landsurfaces is nearly equal to that from free watersurface. At lower moisture level, evaporation

Manual on Enhancing Water Use Efficiency in Canal Commands 31
may decrease in proportion to the water contentin the soil.
b) Transpiration
Transpiration is the process by which watervapour depart the living plant body and entersthe atmosphere. It involves continuousmovement of water from the soil into the roots,through the stem and out through the leaves tothe atmosphere. The process includes cuticulartranspiration, or direct evaporation into theatmosphere from moist membranes through thecuticle and stomatal transpiration, or outwarddiffusion into the atmosphere, through thestomata and lenticels. The rate of transpirationdepends on the supply of energy to vaporisewater, the water vapour pressure orconcentration gradient in the atmosphere, whichconstitutes the driving force, and the resistancesto diffusion in the vapour pathway. Transpirationis influenced by: i) climatic parameters viz., lightintensity, atmospheric vapour pressure,temperature, and wind speed, ii) the plantfeatures viz., the extent and efficiency of rootsystems in moisture absorption, the leaf area, leafarrangement and structure, and stomatalbehaviour and iii) the capacity of the soil tosupply water plant roots (Bharambe et al, 2002).
Water use by crops or summation of evaporationand transpiration are combined into one termevapo-transpiration (ET), as it is difficult toseparate these two losses in cropped fields. Theterm consumptive use is used to designate thelosses due to evapo-transpiration and the waterthat is used by the plant for its metabolicactivities. Since the water use in the actualmetabolic processes is insignificant (less than 1% of ET), the term consumptive use is generallytaken equivalent to ET. Usually a closerelationship exists between net incoming solarradiation and evapo-transpiration.
References
Bharmabe, P.R., Oza, S.R., Jadhav, G.S. and Shelke,D.K. 1999. Effect of irrigation layouts on soilplant water relationship and water useefficiency of safflower. Journal of IndianSociety of Soil Science. 47: 396-400.
Bharmabe, P.R., Shelke, D.K., Oza, S.R., andVaishnava, V.G. 2002. Effect of irrigation levelson spatial moisture distribution, soil plantwater relationship and water use efficiency ofcotton under drip irrigation. Journal of IndianSociety of Soil Science. 50: 303-305.
Ellsworth,D.S. 1999. The CO2 enrichment in a maturingpine forest: are CO2 exchange and water statusin canopy affected. Plant Cell and Environment.22: 461-472.
Ludlow, M.M. and Muchow, R.C. 1990. A criticalevaluation of traits for improving crop yield inwater limited environments. Advances inAgronomy. 43: 107-153.
Singh, B.R. and Singh, D.P. 1995. Agronomic andphysiological response of sorghum, maize andpearl millet to irrigation. Field Crops Research.42: 57-67.
Singh, D.P. 1993. Soil plant atmospheric waterrelations and irrigation management. In:Important aspects of on-farm watermanagement (Eds. D.P.Singh andH.C.Sharma).CCS Haryana AgriculturalUniversity, Hisar. pp 109-131.
Singh, P., Singh, D.P., Kumar, A. and Chaudhary, B.D.1991. Pattern of soil water use in oilseed brassicaand chickpea under dryland conditions. In:Recent advances in dryland agriculture. (Eds.Somani et.al). Scientific Press. Jodhpur. pp 167-173.
Slyater, R.O. 1967. Plant water relationship. AcademicPress, New York. pp 366
Turner, N.C. 1997. Further progress in crop waterrelations. Advances in Agronomy. 58: 293-338.
Zhuang, J., Yu, G., Nakayama, K. and Urushisaki,T. 2000. Environmental dependence of sapflow of maize. Technical Bulletin of Facultyof Horticulture, Chiba University. Vol.54:53-64.

32 Manual on Enhancing Water Use Efficiency in Canal Commands
3.0 WA3.0 WA3.0 WA3.0 WA3.0 WATER REQUIREMENT AND IRRIGTER REQUIREMENT AND IRRIGTER REQUIREMENT AND IRRIGTER REQUIREMENT AND IRRIGTER REQUIREMENT AND IRRIGAAAAATIONTIONTIONTIONTIONSCHEDULINGSCHEDULINGSCHEDULINGSCHEDULINGSCHEDULING
RRRRRajbir Singh, B.S. Yajbir Singh, B.S. Yajbir Singh, B.S. Yajbir Singh, B.S. Yajbir Singh, B.S. Yadadadadadaaaaav and Sav and Sav and Sav and Sav and Satyendrtyendrtyendrtyendrtyendra Ka Ka Ka Ka Kumarumarumarumarumar
Land and water are the basic natural resourcesin agriculture and efficient utilization of theseresources in crop production is very important.The demands for these resources arecontinuously escalating due to increasingpopulation. The drastic increase in populationand improvement in standard of living and alsoincreasing water demand towards industries, thewater availability in agriculture sector withpassage of time is declining at faster rate. Hencein agriculture sector, the available water can beutilized effectively for crop production by variousapproaches without further depletion.
3.1 Water requirement
Water requirement (WR) of a crop is the quantityof water required by crop at a given period oftime for its normal growth under field conditionsat a certain place which may be supplied byprecipitation or by irrigation or by both Water isneeded mainly to meet the demands ofevaporation (E), transpiration (T) and metabolicneeds of the plants, all together known asconsumptive use (CU).
CU = E+ T + water needed for metabolic purposes
Water use in the metabolic activities of plant isnegligible and often less than one percent of thequantity of water passing through the plant.Evapotranspiration is, therefore, considered asequal to consumptive use. Different losses likepercolation, seepage, runoff etc., occur duringtransport and application of irrigation water.Water is needed for special operations such asland preparation, transplanting, leaching etc.Water requirement of a crop (WR), therefore,includes evapotranspiration, application lossesand water needed for special purposes.
WR = ET + application losses + water for specialpurposes
The sources of WR are irrigation + effectiverainfall (ER) + soil moisture depletion (SMD).
Therefore, field irrigation requirement (IR) = WR–(ER + SMD).
Water requirement is a demand whereas thesupply consists of contribution from irrigationwater, effective rainfall (ER) and soil profilecontribution including that from shallow watertable. The water requirement may be assessed as:
WR (mm) = {Eto x Kc (C, T, F) - ER (R, ETa, S)+Ti} / E
where, WR = Gross water requirement; ETo=Reference crop ET; Kc = Crop coefficient (C-croptype, T= stage of crop development, F= frequencyof soil wetting), ER= Effective rainfall, R= rainfall,ETa= actual ET, S= soil moisture storage factor),Ti
= Technical irrigation (pre-irrigation), E=Irrigation efficiency
ETa is based on assumption that it is directlyrelated to ETo. Kc is the proportion between ETa
and ETo and is a function of crop and its growingstage. In the initial crop stage, when level ofcoverage is very small, the Kc is independent ofthe crop and is only a function of wettingfrequency (F) and ETo. ER is estimated by ET- RFratio. Mean effective rainfall is a function ofmonthly RF, the actual ET (ETa) and the effectivemoisture storage in the soil (S).
3.1.1 Irrigation requirement
Irrigation requirement is the total amount ofwater applied to a field to supplement rainfalland soil profile contribution to meet the waterneeds of crops for optimum growth.
Irrigation requirement = WR – (ER + S)
The net irrigation requirement is the total amountof irrigation water just required to bring the soilmoisture content in the root zone depth of thecrops to field capacity. Thus the net irrigationrequirement is the difference between fieldcapacity and soil moisture content in the rootzone before irrigation. Gross irrigation

Manual on Enhancing Water Use Efficiency in Canal Commands 33
requirement is the total of net irrigationrequirement and other losses such as conveyance,distribution and application.
a) Net irrigation requirement (NIR)
DDx)MM(
NIR bbifc
100−=
Where, NIR = Net irrigation reqirement (cm)
Mfc = Moisture content at field capacity (%)
Mbi = Moisture content before irrigation (%)
Db = Bulk density of the soil (g/cm3)
D = Depth of soil (cm)
b) Gross irrigation requirement (GIR)
Gross irrigation requirement is the net irrigationrequirement plus losses in water application andother losses. It is the total amount of waterapplied through irrigation.
systemofefficiencyFieldtrequiremenirrigationNet
GIR =
3.1.2 Water requirement of crops
The water requirement of crops during completecrop growth periods varies from soil types,duration of crops, evaporative demand of cropsand management practices. The waterrequirement of the major crops, being grown indifferent location is given below for reference(Table 3.1).
Table 3.1 : Irrigation guide for important field crops
Crop Irrigation scheduling Irrigation Critical stagecriteria
IW/CPE Others Depth Number Requireratio (cm) ment (cm)
Rice 1-5DDPW 5±2 8-26 49-129 PI, floweringWheat 0.8-1.5(0.9) For dwarf 4-7 4-8 30-52 CRI, Flowering
For tall 7-8 3-4 25-30 Tillering , Flow.Cotton 0.7-0.9 3-8 2-9 24-64 Flow., boll form.Sugarcane o.6-0.9 50 % DASM 6-10 5-20 60-200 Shoot elong.
tilleringSorghum 0.8-1.25 45-55%DASM 6-8 1-8 8-48 Flow.,
priomordial init.Maize 0.75-1.2 5-8 3-6 24-48 Tasseling, silkingG. nut 0.4-0.9 50-75%DASM 5-8 2-8 15-50 Peg. ,pod fillingSesamum 0.5-0.9 60-75% DASM 5-8 1-5 8-30 Flow. Seed
settingGram 0.4-0.8 50-75%DASM 6-8 1-4 8-24 Flow., pod
formationPigeon pea 0.25-0.9 6-8 1-4 8-30 Flow. initiationPotato 1.0-1.2 3-6 6-9 30-45 Stolonisation,
tuber formationSunflower 0.8-1.05 40-50%DASM 5-8 2-6 15-20 Flow bud init.,
seed set.Soyabean 0.4-0.8 5-6 3-7 18-35 Flow.init., pod
set.Greengram/ 0.6-0.9 80-300mm CPE 5-8 2-4 15-30 Floweringblack gramSugar beet 0.60 0.2 bar 4-5 8-10 40-50 Root init. and
develop.Jute 50-60%DASM 6-8 1-3 8-20Rapeseed, 0.6-1.05 75%DASM 6-8 1-4 8-24 Flow. Initiation,mustard pod. Form.
Source: Fifty Years of Agronomic Research In India (Edit. R.L.Yadav et al.1998), Publ. Indian Society of Agronomy, New Delhi

34 Manual on Enhancing Water Use Efficiency in Canal Commands
3.1.3 Factors affecting irrigation waterrequirements: The factors which affectevaporation and transpiration ultimatelyinfluence the irrigation water requirements ofcrops. Five main factors are i) climatic viz.,temperature, relative humidity, sunshine andwind, ii) soil viz., texture, hydraulicconductivity, water holding capacity, bulkdensity, salt content and depth of soil, iii) plantviz., growing period of crop, crop coefficient (Kc),root depth, stress sensitivity, critical stage of thecrop, cropping pattern; iv) irrigation waters viz.,source, amount, quality and v) management viz.,irrigation methods; cultural practices,fertilization, irrigation technologies, on-Farmirrigation efficiencies, and leaching and otherspecial requirements.
3.2 Irrigation scheduling
Irrigation scheduling is a systematic method ofdeciding the quantity and timing of irrigationcommensurate with crop needs, soil moistureholing capacity, water application procedure andthe availability of water supplies. It helps theirrigator to decide on when and how much waterto apply for maximizing crop yields andefficiency of water use. The basic objective ofirrigation scheduling is to make available thecorrect amount of water for the biologicalprocesses of plants at appropriate time byapplying the exact amount of water needed toreplenish the soil moisture to the desired level.Irrigation scheduling becomes particularlysensitive under scarce water supplies wherewater shortage requires a refined timing of waterapplication in order to minimize yield reductions.
Criteria most suitable for scheduling irrigationsvary from one situation to another. Planningoptimum irrigation schedules requiresinformation on as to when and how much waterstress occurs for a given set of conditions.Similarly, under saline conditions knowledge ofwater yield function and salt tolerance levels ofplants is needed. Where water is scarcer orexpensive, irrigation should be planned tomaximize water productivity but where good
land is scarcer than water, it be planned to obtainmaximum production per unit of area. Severalother factors such as: i) soil hydraulic properties,depth, salinity and nutrient status of root zone,ii) ground water level, iii) method of waterapplication, vi) availability and quality of watervii) weather conditions, viii) plant characteristicsand ix) other specific needs such as crop cooling,frost protection etc. must be considered. It shouldcomplement in favour of enhancing theefficiencies of other applied inputs. Its planningmust be in such a way that the efficiencies of otherapplied inputs get enhanced.
3.2.1 Advantages of Irrigation Scheduling
Enables the farmer to schedule waterrotation among the various fields tominimize crop water stress and maximizeyield.
Helps to lower water losses and minimizewaterlogging problems.
Enhances the efficiencies of other appliedinputs viz., fertilizers, pesticides,weedicides etc.
Help to reduce energy and labourrequirement by avoiding over-irrigation.
Helps in maintaining soil health.
Water saved can be used to irrigateadditional area.
Increase net profits by increasing cropyields and quality.
3.3 Irrigation Scheduling Criteria
All irrigation scheduling procedures consists ofmonitoring indicators that determine the need forirrigation. Various indicators are used to assessirrigation needs, including soil moisturemeasurement, plant indicators and climatologicalindices. Accordingly, the various approaches ofirrigation scheduling may be classified as
Soil water status approachClimatological approachPlant parameters’ approachSimulation modeling approach

Manual on Enhancing Water Use Efficiency in Canal Commands 35
3.3.1 Soil water status approach
The amount of water to be applied on eachirrigation depends upon the capacity of the soilto store and supply water. Soil may contain largeamount of water but the water stored betweenfield capacity (upper limit) and wilting point(lower limit) is the available water for plantgrowth. Three concepts relating soil water toplant response are in existence, each of these mayapply under certain conditions. In the firstconcept soil water is considered equally availableover the entire range between upper and lowerlimits. As per the second concept, the soil wateravailability gradually decreases from upper to thelower limit of available water. The third conceptis based on the existence of critical soil moisturelevel within the available soil moisture rangebelow which yield reduction is significant. Thepoint at which this condition is reached depends
on weather, plants and soil. Irrigation is,therefore, needed when this lowest limit ofoptimum water regime is reached and it isconsidered as the most opportune time forirrigation. Based on soil water status, irrigationscan be planned by monitoring either soil waterdepletion or soil moisture tension.
i) Soil water depletion
Irrigations are scheduled based on depletion ofavailable water from effective root zone of thecrops. In this approach periodical determinationof soil water content in the root zone is made toknow the time when the available soil waterdepletion reached the critical level. For semi aridregions as encountered in northern India, theoptimum allowable depletion of availablemoisture in the root zone for maximum yield ofmajor crops is given in table 3.2.
Table 3.2 : Allowable water depletion in medium textured soils
Crop Allowable water depletion (%) at different crop growth stages
Initial Development Mid Late
Wheat (dwarf) 40-50 40-60 50-70 70-80
Wheat (tall) 45-55 50-65 55-70 70-80
Cotton 60-70 50-65 50-65 75-85
Mustard 50-60 50-60 50-70 60-80
Barley 50-60 55-65 65-75 70-80
Sorghum 40-50 40-60 50-60 65-75
Pearl millet 50-60 50-60 60-70 70-80
Chick pea 50-70 50-70 60-70 75-85
Pigeon pea 50-60 50-60 60-70 70-80
Cluster bean 50-60 50-60 60-70 70-80
Maize 40-50 40-60 50-60 65-75
Sugarcane 30-40 25-35 40-50 50-60
Sunflower 35-45 40-50 40-50 60-70
Groundnut 40-50 40-50 40-50 55-65
Greengram 40-50 45-55 50-60 65-75
Berseem 20-30 20-30 20-30 50-60

36 Manual on Enhancing Water Use Efficiency in Canal Commands
This approach is not very effective in the earlystages of crop growth. Practical limitationencountered in implementing irrigationscheduling using this approach includes: periodicdetermination of root growth and soil waterdepletion. The moisture content in the soil profilecan be determined by gravimetrically, electricalresistance blocks or by using neutron probe, timedomain reflectometry (TDR) etc.
ii) Soil moisture tension
Plant response to soil moisture is better correlatedwith water tension than the water content in thesoil. The use of the soil-water tension or potentialto schedule irrigation overcomes much of thedifficulty in applying results from one area toanother. Figure 3.1 presents water-retentioncurves for several soils plotted in terms of percentavailable water removed (Richards and Marsh,1961). Soil water potential can be determined bytensiometers or electrical resistance units.
Fig. 3.1 Relation between available water depletionand soil moisture tension for different soils
Soil moisture tension may vary from soil surfaceto the bottom of root zone. It has been observedthat, soil moisture tension measured at a depthof 15 to 30 cm is used as an indicator forscheduling irrigation. Optimum soil moisturetension to initiate irrigation varies for differentcrops (Table 3.3). Cotton, which is capable oftolerating water stress needs irrigation at muchmore soil moisture tension as compared toberseem, which very sensitive to water stress.
3.3.1.1 Soil water measurement
Soil water content can be determined by directand indirect methods.
a) Direct method
In this method, the water is separated from thesoil and the volume or mass of water is measured.The principles involved in this method are toremove water by oven dry method which isdefined as thermo-gravimetric method. Beforeeach irrigation, soil samples are taken from pre-determined soil depth in moisture boxes anddried in a hot air oven at 105 0 C till constantweight is obtained . The gravimetricmeasurement of soil water content involvesindependent measurement i.e the wet mass ,Mw; dry mass , Md; of the soil sample and thetare mass , Mt. They are used to calculate
W= { (Mw-Mt)/ (Md-Mt)}
When it is multiplied by 100 , this ratio becomesthe percentage of water in soil sample on drymass basis .
Disadvantage
In this method, the accuracy and reproducibilityis dependent on the mass determination and onthe dryness process. Soil is composed of mineralparticles, organic matter, water, chemicalsdissolved in water, volatile liquid, colloidal andnon colloidal particles and gases; most of thesecan be removed from soil at different temperatureso that depending on the drying temperatureused in the process, different water content maybe obtained.

Manual on Enhancing Water Use Efficiency in Canal Commands 37
Precautions to be taken for obtaining accuracyof soil moisture
Generally, at least duplicate soil sample sshould be analyzed.
While taking samples, evaporative losses ofwater must be prevented.
Sample should be placed in sealed weighingcontainer and weighed as soon as possibleto minimize evaporation.
When the soil samples are at or nearsaturation a lid with small hole must be usedto cover the paper or glass container in orderto avoid loss of sample from boiling.
i) Feel and appearance method : With experience,irrigator can judge soil water content by feel andappearance of the soil. Soil samples are taken witha probe or soil auger from each quarter of theroot zone depth, formed into a ball, tossed intoair and caught n one hand. From the descriptiongiven in Table 3.4, available moisture percentageis estimated for soil of different textures.Considerable experience and judgment arenecessary to estimate available soil moisturecontent in the sample within reasonable accuracy.This is a crude method but in the absence of anyfacility, this method can be used for estimationof soil moisture.
Table 3.3 Optimum soil moisture tension to irrigated different crops
Crops Suction Depth of Crops Suction Depth of(M Pa) measurement (M Pa) measurement
(cm) (cm)
Wheat 1.00 20 Tomato 0.8 30
Rice (upland) 0.15 15 Potato 0.3 15
Sugarcane 0.70 20 Onion 0.65 15
Soybean 0.50 20 Peas 0.45 15
Maize 0.65 20 Ladies Finger 0.50 20
Cotton 1.5 30 Banana 0.30 30
Groundnut 0.60 15 Grapes 0.25 30
Lentil 0.50 20 Orange 0.60 30
Berseem 0.25 20 Tea 0.50 30
Table 3.4 Guide for judging the amount of available soil moisture for various soil texture andconditions
Available soil Coarse textured Moderately Medium texture Fine texturedmoisture (loamy sand) coarse (loamy and (clay loamy and
(sandy loamy) silt loamy) silty clay loamy)
Filed capacity (100%) On squeezing, no Similar Symptoms for Symptoms for alfree water appears symptoms al types of soils types of soilson soil, but wet outlineis left on hand
75 to 100 percent Tends to stick together Forms weak Forms a ball, is Easily ribbonsslightly, sometimes ball, breaks very pliable, out betweenforms a very weak easily, do slicks readily fingers, has slickball under pressure not slick feelings

38 Manual on Enhancing Water Use Efficiency in Canal Commands
50 to 75 percent Appears to be dry do Tends to form Forms a ball Forms a ball,not form a ball with a ball under somewhat plastic, ribbons outpressure pressure but sometimes between thumb
seldom holds slick slightly and forefingertogether with pressure
25 to 50 percent As above, but ball is Appears to Somewhat Somewhatformed by squeezing be dry, do not crumbly but pliable, forms avery firmly form a ball holds together ball under
unless squeezed with pressure pressurevery firmly
0 to 25 percent Dry, loose, single Dry, loose, Powdery dry, Hard, baked,grained flows through flows through sometimes cracked,fingers fingers slightly crusted sometimes has
but easily loose crumbs onbroken down surfaceinto powderyconditions
b) Indirect method
Since the direct method of soil water content areoften considered as the standard method, thismethod requires more time and destructiveaspect of sample measurement. But in indirectmeasurement, it can be made electronically andfrequently. Soil water content is estimatedwithout disturbing soil profile by followingmethods :
(i) Neutron Thermolisation
The hydrogen nucleus of the water molecules hasthe property of scattering and slowing down themovement of neutrons. This property is used inneutron method for measuring water content inporous material. When the neutron probe isinserted in access tube, high energy which areemitted from radioactive source from probecollides with atomic nuclei which are emittedfrom radio-active sources with atomic nucleiwhich are present in nearby in the soil. Sincehydrogen atom in water has same mass, they arevery effective in slowing down the neutron. Theslow down neutron reflected by the hydrogen insoil water are counted and the results areindicated through attached gauge. Theequipment required to make measurement
includes a neutron moisture meter, depth probeand meter consisting of fast neutron source(americium 241/beryillium). A detector forthermolised neutron, a protective shield is alsoused as the reference standard and the scale forcounting. A soil auger for installing access tube,with a slightly smaller diameter from the tube togive tight fit thin wall tubing (aluminum, steel,or plastic) of the size consistent with the probesize to minimize error due to air gaps, calibrationcurve or parameters, radiation film badges leaktest kit.
Radius of influence
In the bulk soil, the radius of the sphere ofinfluence ranges from 16 cm at water saturationto about 70 cm at near zero water content (vanBavel et al., 1956). However the chemicalcomposition of the soil changes the value of theparameters and lack of high resolution preventthe detection of sharp changes in water contentparticularly near the soil surface.
Precaution to be taken while operation
The auger is used to execute the hole forinstallation of excess tube, which canminimize the air space around the tube.

Manual on Enhancing Water Use Efficiency in Canal Commands 39
The tube should be closed at the bottom endby rubber stopper or an expansion plug.
The top portion of the access tube shouldextend above soil surface and should alsobe closed by a rubber stopper.
Safety rules supplied by the manufacturersshould be followed to operate, transportand store the probe.
Operator should wear radiation badge.
If the surface probe is used, the soil surfaceshould be smoothened out to eliminate airgaps between the soil and the bottom of thesurface probe.
(ii) Time Domain Reflectometry (TDR)
The Time Domain Reflectometry measures thepropagation of an electrical signal, which isindependent on the dielectric constant of soil. TheTDR measurement is independent of soil texture,temperature and salt content (Topp et. al., 1980).In TDR technique a step voltage pulse or signalis propagated along a transmission line. Paralleltransmission line is usually used formeasurement in soil. The parallel rods / wiresserve as conductors and the soil, in which the rodare installed, serve as the dielectric medium. Thepair of the rods acts as wave-guide and the signalsis reflected from the end of the transmission linein the soil and returns back to the TDR receiver.The propagation velocity and the amplitude ofthe reflected signals are used in the measurementand analysis.
Precautions
The soil between and around the rod of thetransmission line is most critical for thepropagation of TDR pulse, and any disruptionof soil, adversely influence the soil water contentmeasurement. Air gaps around the rod / crackingshould be sealed. Thus careful installation of thetransmission line is most important
(iii) Soil water potential methods
In the soil profile, water is retained due to someenergy force which is called soil water potential.
This soil water potential indirectly gives statusof soil water which can be measured bythermocouple psychrometers, tensiometer,resistance block and thermal dissipation sensors.
Thermocouple psychrometer
Thermocouple psychrometer determines the totalwater potential of the liquid phase of the soil bymaking measurement of vapour pressuredifference in the vapour phase in equilibriumwith liquid phase.
Tensiometer
Tensiometer measures the matric potential in thesoil. The tensiometer consist of porous ceramic,high conductivity cup connected to pressuremeasuring devises through a small bore plasticor tube. The tesiometer is filled with de- airedwater and can be inserted into a cored whole untila good contact is made with surrounding soil.After hydraulic equilibrium is achieved, the waterin the tensiometer will be at same matric potentialas present in soil.
Limitation of tensiometer
The tensiometer records moisture tension upto –0.8 bar (80 j/kg ). Generally most of the field cropsare irrigated before this moisture tension reachedand hence it can be used successfully.
(iv) Electrical Resistance Measurement
The principal behind electrical resistance is thatthe resistance to flow electricity through a porousmedia is a function of water content which isinversely related but directly related to capillarypressure. In electrical resistance block (gypsum)two electrodes are embedded in and buried insoil at desired depth and connected by insulatedlead to a resistance bridge. The resistance in blockis measured by inducing a current across the twoelectrodes and measured by simple ohm-meter.Thereafter the resistance block reading iscalibrated with water content by gravimetricmethod regularly if the block is installed for aseason or year.

40 Manual on Enhancing Water Use Efficiency in Canal Commands
(v) Thermal Dissipation Measurement
The rate of heat dissipation in a porous mediumof low heat conductivity is good indicator to soilwater content. Basically it depends on the factthat air is good thermal insulator with respect towater, so that air and the remaining water filmbecome thinner replace water and the path lengthfor heat conduction increases. This requires alarger temperature gradient to dissipate a givenquantity of heat. Supplying and measuring thetemperature rise at those points thereforemeasure the water content of porous material.Thus heat dissipation in porous medium can beused as an index of the amount of water present.
3.3.2 Climatological Approach
In climatological approach, cropevapotranspiration is basic important term aswater requirement of crop is based on manyclimatic parameters. The soil moisture storagedepletion is equivalent to actual
evapotranspiration (ETc). When the computedvalue of cumulative ETc is equal to allowableamount of soil water depletion, irrigation isapplied to replenish the water lost through ETc.Evapotranspiration/water use in a crop can bemeasured by studies in lysimeters. Alternatively,potential evapotranspiration (PET) of a crop canalso be estimated by locally developed empiricalformulae, energy balance equations andevaporation from open water surface.
i) Empirical formulae
Depending on the availability of differentmeteorological parameters, PET can be estimatedby different formulae either empirical or basedon certain aerodynamics and energy balanceprinciples. The actual ET can be estimated byusing PET and crop coefficients. Commonly usedempirical formulae and required weatherparameters are given in table 3.5.
Table 3.5 : Commonly used formulae for estimating potential/reference ET
Formulae Required weather parameters Adoptability
Thornthwaite Mean monthly air temperature Temperate continental climate where
temperature and radiation are
strongly correlated
Blaney-Criddle Mean monthly air temperature
and daylight hours
Penman Mean monthly air temperature, Humid and arid regions with calm
saturation vapour pressure, weather conditions
net radiation and wind velocity
Modified Penman Mean monthly air temperature, Almost all conditions, except high
actual and saturation vapour altitude
pressure, net radiation and
wind velocity
Penman-Monteith Mean monthly air temperature, Recommended for all conditions
actual and saturation vapour
pressure, net radiation and
wind velocity

Manual on Enhancing Water Use Efficiency in Canal Commands 41
Computation of daily referenceevapotraspiration, FAO56 PM (Allen et al., 1998)
)U.(
)ee(UT
)GR(.ET
asn
2
2
0 340+1γ+Δ
−273+
900γ+−Δ4080=
Where,
ET0 = reference evapotranspiration, mm day-1
Δ = slope of vapour pressure curve (kPa 0 c-1)
Rn = net radiation (MJm-2day-1)
G = soil heat flux density (MJm-2day-1)
γ = psychrometric constant (0.0671 kPa 0 c-1)
T = mean daily temperature at 2 m height
U2 = wind speed at 2 m height (m s-1)
es = saturation vapour pressure (kPa)
ea = actual vapour pressure( kPa)
es-ea = saturation vapour pressure deficit (kPa).
Modified Penman method (Doorenboss andPruitt, 1977)
( ) ( )( ){ }dan0 ee.uf.W1R.WcET −−+=Where, C = adjustment factor for day and nightwind speed and different relative humidity
W= weighing factor for altitude and temperatureon radiation
Rn = net radiation in equivalent evaporation inmm day-1
1-W = weighing factor for altitude andtemperature effect on wind and humidity
f(u) = wind function or effect of wind on ETo andexpressed in equivalent evaporation, mm day-1
ea-ed = vapour pressure deficit in mbar
Hargreaves method, (Hargreaves and Samani,1985)
Hargreaves (1985) method is often used tocompute ET0 through temperature data for daily/ weekly or longer period for use in regionalplanning, reservoir operation studies where otherclimatic data are not available or the availabledata are questionable.
50.0a0 TR)8.17TC(R0023.0ET +=
Where, Ra=extra terrestrial radiation (mm day-1)
TR = Tmax.-Tmin. (0 c)
TC = mean temperature (0 c)
Radiation method (Doorenboss and Pruitt, 1977)
( )s0 RWcET ×=
Where, ET0 = evapotranspiration mm day-1
Rs = solar radiation in equivalent in mm day-1
W= weighing factor which depend ontemperature and altitude
c = adjustment factor which depends on meanRH and daytime wind estimate.
Blaney Criddle method (Doorenboss and Pruitt,1977)
( ){ }8T46.0pcET0 +=
Where,T = mean daily temp.0c
p = mean daily % of total annual day time hoursfor a given month and latitude
c = adjustment factor which depend on minimumRH and sun shine hour and day time windestimate
Pan evaporation method (Doorenboss and Pruitt,1977)
ppan0 KEET ×=
Where, E pan = pan evaporation mm day-1 andKp = pan coefficient
The Kp value depends upon wind speed, relativehumidity and fetch distance.
To a certain extent, ET increases as the crop cover,height and density increases. Crops with deeperand extensive root system have higher ET. Cropcoefficient, which is the ratio of actual andpotential ET under no water stress conditions, isused to account the influence of different plantparameters on actual ET. The crop coefficientsfor each crop needs to be determined locally,lysimeter studies being the most appropriatemethod for its estimation. Typical values of crop

42 Manual on Enhancing Water Use Efficiency in Canal Commands
coefficients for some selected crops are given inTable 3.6. Knowing the soil water reserve in the
root zone, daily values of ETc are used to findthe remaining available soil moisture storage.
Table 3.6 : Crop Coefficients for selected crops (Doorenbos and Pruitt, 1977)
Crop Stage of crop growth (% of growth season)
0 20 40 60 80 90 100
Wheat 0.14 0.45 0.88 0.89 0.76 0.65 0.51
Maize 0.40 0.63 1.04 1.11 1.00 0.89 0.70
Sorghum 0.42 0.50 0.64 1.01 1.05 0.91 0.70
Cotton 0.22 0.26 0.95 1.07 0.85 0.62 0.40
Rice 1.00 1.07 1.13 1.22 1.16 1.10 0.86
Sugarcane 0.34 0.50 0.90 1.07 1.19 1.20 1.19
Groundnut 0.30 0.40 0.69 0.96 0.86 0.79 0.55
ii) Irrigation water (IW)/cumulative panevaporation (CPE) ratio
Considering the strong relationship between thepan evaporation and crop ET, particularly insemi-arid tropics, the IW/CPE ratio has beensuggested as a practical approach for irrigationscheduling. IW represents the fixed amount ofirrigation water, and CPE is cumulative panevaporation (USWB pan evaporation) minuseffective rainfall, since previous irrigation. The
first step in this approach is to find out theirrigation depth on the basis of permissible soilwater depletion from the root zone for potentialyield. The next step is to find a factor (known asIW/CPE ratio) which is to be multiplied with CPEto compute the depth of water depleted from thesoil storage. Irrigation is applied as soon as CPEmultiplied with IW/CPE ratio becomes equal tothe irrigation depth. The optimum ratio of IW/CPE for major crops is given in Table 3.7.
Table 3.7 : Recommended values of IW/CPE for different crops
Crop Irrigation depth (cm) IW/CPE
Wheat (dwarf) 5-7 0.8 -1.0Wheat (tall) 6-8 0.7-0.8Barley 5-8 0.6-0.7Summer maize 6-8 0.8-0.9Winter maize 5-7 0.9-1.0Pearlmillet 6-8 0.6-0.7Sorghum 6-8 0.8-0.9Cotton 8-10 0.5-0.75Chickpea 6-8 0.4-0.5Pigeonpea 6-8 0.5-0.7Moongbean 6-8 0.4-0.6Clusterbean 6-8 0.3-0.5Mustard 6-8 0.4-0.5Groundnut 6-8 0.7-0.8Sunflower 6-8 0.6-0.8Sugarcane 8-10 1.0-1.2

Manual on Enhancing Water Use Efficiency in Canal Commands 43
Irrigation schedule based on IW/CPE of 0.75 to1.0 were observed to save 34% of water comparedto the practice of applying 5 irrigations at 5phenological stages of wheat. (Prihar et al,. 1976).This criterion can easily be adopted by Indianfarmers but the lacunae of this criterion are theregion specific and soil specific one.
3.3.3 Plant Parameters Approach
Many plant characters respond readily to waterdeficit. Thus, different plant indices may serveas a criterion for time of irrigation to crops,important ones for irrigation scheduling aresummarized below:
i) Visual symptoms
Visual sign of plant wilting in response to waterdeficit viz., drooping, curling, rolling of leavesetc may be used as an indication of crops need
for irrigation. Similarly, other plant criteria suchas change in foliage colour, can also be used.Leaves of beans, cotton and peanuts become darkas the available soil water is depleted andmoisture stress begins to affect the plant. Cornand sorghum leaves curl or change their angle oforientation when soil moisture decreases.
ii) Critical crop growth stage
Some physiological stages of crop growth arefound to be more sensitive to water stress thanother stages. The stages of the crop at whichmoisture stress affects the yield significantly arecalled critical growth stages. The critical growthstages in different crops have been identified andin order of decreasing sensitivity to water stressfor major crops are given in Table 3.8 (Majumdar,2000 and Singh and Sharma, 1993).
Table 3.8 : Critical growth stages for major crops in the semi-arid region.
Crop Crop duration (days) Critical stages for irrigation
Wheat (dwarf) 130-140 Crowing, flowering, jointing, milk and dough
Wheat (tall) 140-150 Tillering, heading and dough
Barley 125-135 Tillering, booting
Rice (dwarf) 130-140 Flowering, grain filling, tillering
Rice (Basmati) 140-150 Flowering, grain development
Summer maize 90-110 Tasseling and silking, and grain development
Winter maize 150-180 Tasseling, grain development
Pearlmillet 75-85 Heading
Sorghum 90-110 Flowering, seeding, grain filling
Cotton 150-180 Flowering and boll development
Chickpea 130-140 Preflowering and pod development
Pigeonpea 150-170 Flowering initiation, pod development
Moongbean 65-75 Flowering
Clusterbean 130-145 Branching and flowering
Mustard 140-150 Pre-flowering and pod development
Groundnut 110-135 Pegging, pod-setting and pod filling
Sunflower 100-120 Flowering, seed filling, late vegetative
Sugarcane 280-330 Tillering and grand growth

44 Manual on Enhancing Water Use Efficiency in Canal Commands
iii) Plant water contents and leaf water potentialThe leaf water content (ÖL) and leaf waterpotential (ØL) in most of the plants changes withvariation in soil water availability. As the ÖL orØL drops below a certain criterion limit, specificto plant species and its growth stage, thephysiological and growth phenomenon areadversely affected. Consequently these thresholdvalues can serve as reliable indications forirrigating crops. For many plant species, stressesare mild when mid afternoon ØL depressions arenot more than -12 bars; moderate if in the rangeof -12 to -16 bars and extreme if below -16 bars.
Plant water content measurement and methods:Due to withhold of irrigation water plant showssymptoms of moisture stress. This moisture stresscan be measured for relative leaf water content(RWC) or water saturation deficit (WSD). Theenergy status of water is usually expressed as thetotal leaf water potential.
a) Relative Water content
The water present in leaf before irrigation isdetermined by detaching 10-15 leaf segments andkeeping in distilled water for 4-6 hrs. at 30± 10 Cand 600-700 lux illumination after taking freshweight of leaf segments. It is then surface driedby placing in between filter paper and then overdried at 700c for 24 hrs. Then dry weight isdetermined. The relative water content iscalculated as
100−
−= x.WtdryOven.WtTurgid
.WtdryOven.WtFreshRWC
100−
−= x.WtdryOven.WtTurgid
.WtFresh.WtTrgidWSD
WSD = 100-RWC
b) Pressure Chamber
To measure leaf water potential, pressurechamber technique is used. For this the leafyshoot is enclosed in a steel pressure chamber sothat the cut end of stem protrudes. The pressureinside is then increased until xylem sap appearson the cut end. The pressure (with negative sign)
is just sufficient to force xylem fluid to appear atthe exposed cut end of the shoot is taken as thewater potential of the leaf cell.
Precautions
(i) Ensure the accuracy of the pressure gauge (ii)Cut the stem or twig with sharp kharif(iii) Preventtranspiration loss. (iv) Do not increase thepressure too quickly.
c) Stomata Resistance
Under unlimited irrigation, water uptake fromsoil to the tip of leaf is very fast. As soil watercontent decreases, the resistance in soil water-plant continuum increase due to closure ofstomata in leaf. This resistance is measured withthe help of porometer. For field studies, the mostpopular instrument is steady state prorometerwhich is manufactured by LICOR and Delta tDevices. For irrigation scheduling, the resistanceshould recorded from top leaves instead ofshaded and bottom leaves. Measurement ofstomatal conductance/ resistance should beperformed at any time of the day afterevaporation of dew in the morning. To observeday to day changes due to changing soil watercondition early afternoon is the most appropriatetime of the day.
iv) Canopy temperature
The plant canopy temperature responds to airtemperature and the relative transpiration rate.Leaves of a water stressed plant are warmer thana non-stressed plant, due to reduced evaporative(transpiration) cooling. The difference betweenthe canopy temperature under actual condition,air temperature and the expected canopytemperature under non stressed and fullystressed condition is used to decide the timing ofirrigation application. Canopy temperature canbe measured with infrared thermometers (IRTs)or remote sensing sensors. Some of theshortcomings of the technique include: difficultyin measuring canopy temperature of row cropsin early stages of development; it allowsdetermination of irrigation timing but notamounts; sharp climatic changes may cause low

Manual on Enhancing Water Use Efficiency in Canal Commands 45
canopy temperature even when soil water islimited. Alternatively, under such conditions,high canopy temperature may be observed whensoil water is not limiting.
3.3.4 Simulation Modelling Approach
Simulation models are often used to simulatedifferent water balance components forprevailing crop, climatic, soil and water supplyconditions. These models can be used to evaluateor generate alternative irrigation schedules.Different water balance components aresimulated on daily basis keeping full track of allinputs of water through rainfall, irrigation,capillary flux, withdrawal of water throughrunoff, crop evapo-transpiration and deeppercolation.
The CROPWAT is a computer model forcalculating of water, irrigation and scheme watersupply for a crop and an area (FAO, 1992). Themodel has the options to calculate i) ReferenceET (ETo), according to Penman-Monteithapproach, ii) crop water requirement, effectiverainfall and irrigation requirements, iii) irrigationschedules and iv) scheme water supply of an area.For the calculation of reference ETo, the weatherparameters required are: monthly averageminimum and maximum temperatures, relativehumidity, sunshine hours and wind speed. Theprogramme calculates the Radiation and ETo foreach month. The crop water requirements arethen calculated using the ETo, effective rainfalldata, crop data and soil parameters.
The crop data required for various crop growthstages are:
i. Length of individual growing stage: Initialphase, development stage, mid- season andlate stage.
ii. Crop Coefficient (Kc): For initial stage,mid-season and at harvest are to be givenand Kc for development stage areinterpolated.
iii. Rooting depth: The depths of soil waterwhich can be used effectively by the crop
for initial and at full development stagesare required.
iv. Allowable depletion level: The criticalmoisture level where first drought stressoccurs affecting ET and crop productionand expressed as a fraction of total availablesoil moisture.
v. Yield response factor: For each growthstage to estimate yield reduction due todrought stress.
vi. Soil data: The data on soil required are totalavailable soil moisture content, initial soilmoisture depletion, maximum rootingdepth and maximum rain infiltration rate.
After the input of these data for each crop andplanting date the crop water requirement iscalculated. Irrigation requirement and schedulingare determined by:
IRReq = ET crop - Peff
The irrigation scheduling programme providesthe possibility to:
Develop and plan indicative irrigationschedules adapted to field operationalconditions;
Evaluate field irrigation programmes interms of efficiency of water use and yieldproduction;
Simulate field irrigation programme underwater deficiency conditions, rainfedconditions, supplementary irrigation, etc.
There are eight options for irrigation scheduling
i. Each irrigation defined by user
ii. Irrigation at critical depletion (100% RAM)
iii. Irrigation below or above critical depletion(% RAM)
iv. Irrigation at fixed interval per stage
v. Irrigation at fixed depletion (mm)
vi. Irrigation at given ET crop reduction (%)
vii. Irrigation at given yield reduction (%)

46 Manual on Enhancing Water Use Efficiency in Canal Commands
This programme gives the irrigation calendar forthe entire season, the efficiency of irrigationschedule, efficiency of rainfall, total and grossirrigation, and actual water use by crops,reduction in yield etc.
3.4 Frequency of Irrigation
Frequent irrigations with water applicationsufficient to meet the soil moisture deficit areusually more productive than heavier irrigationsat long intervals. On the other hand, higherfrequency of irrigations keeps surface soil moistfor longer period leading to higher evaporationlosses. The frequency of irrigations is affectedby weather conditions, soil and cropcharacteristics and crop and water managementpractices (Table 3.9).
Table 3.9 : Representative available waterholding capacity for various texture classes
Texture class Available waterholding capacity
(cm/m)
Sand 4 -9Loamy sand 6-12Sandy loam 11-15Fine sand loam 14-18Loam and silt loam 17-23Clay loam and 14-21silty clay loams
Silty clays and clays 13-18
Crop characteristics such as crop consumptiveuse rate, sensitivity to water stress and rootcharacteristics also influence the frequency ofirrigations. Crops with higher consumptive userate (such as rice), varieties sensitive to water
stress (such as dwarf wheat) and shallow rootedcrops require more frequent irrigations
3.5 Depth of Irrigation
The net depth (d) of irrigation to be applieddepends on the amount of water required to bringthe soil water content to the field capacity of thesoil. If the soil moisture content in the root zonejust prior to irrigation is known, the net depth ofwater required can be estimated as:
ii
n
i
bifi Dd ××−
=∑=
ρθθ
1 100
where, d is the net depth of water to be applied,èfi is the field capacity of i-th soil layer in percentby weight, èbi is the moisture content of i-th soillayer just before irrigation in percent by weight,ñi is the bulk density of the i-th soil layer, Di isthe depth of i-th soil layer and n is the number ofsoil layers in the root zone.
References
Doorenbos, J. and Pritt, W.O. 1977. Crop waterrequirements. Irrigation and Drainage Paper 24,FAO, Rome.
FAO. 1992. CROPWAT-A computer program forirrigation planning and management. FAOIrrigation and Drainage Paper 46.
Majumdar, D.K. 2000. Irrigation water management:principles and practices. Prentice-Hall of IndiaPvt. Ltd., New Delhi. 487 p.
Prihar, S.S., Khera, K.S., Sandhu, K.S. and Sandhu, B.S.1976. Comparison of irrigation schedules basedon pan evaporation growth stages in wheat.Agron. J. 68: 650-653.
Singh, D.P. and Sharma, H.C. 1993. Important aspectsof on-farm water management. CCS HAU,Hisar.

Manual on Enhancing Water Use Efficiency in Canal Commands 47
4.0 CONCEPT OF IRRIG4.0 CONCEPT OF IRRIG4.0 CONCEPT OF IRRIG4.0 CONCEPT OF IRRIG4.0 CONCEPT OF IRRIGAAAAATION PERFORMANCETION PERFORMANCETION PERFORMANCETION PERFORMANCETION PERFORMANCEINDICINDICINDICINDICINDICAAAAATORS : IRRIGTORS : IRRIGTORS : IRRIGTORS : IRRIGTORS : IRRIGAAAAATION EFFICIENCIES ANDTION EFFICIENCIES ANDTION EFFICIENCIES ANDTION EFFICIENCIES ANDTION EFFICIENCIES AND
WWWWWAAAAATER PRODUCTIVITYTER PRODUCTIVITYTER PRODUCTIVITYTER PRODUCTIVITYTER PRODUCTIVITYRRRRRajbir Singh and Ashwani Kajbir Singh and Ashwani Kajbir Singh and Ashwani Kajbir Singh and Ashwani Kajbir Singh and Ashwani Kumarumarumarumarumar
Globally, about 270 million hectares area is underirrigation accounting for two third of total waterconsumption, which is currently estimated at 4billion m3 yr-1. Food production and food securityare closely linked to water availability and watersecurity in most of the developing countries.About 40 percent of foodgrain is produced from20 percent arable irrigated land. In developingcountries, the proportion of water going toirrigation is often ranging from 75–85 percent oftotal use and serious concern has focussedattention about the scarcity of water. Improvingirrigation system and reducing irrigation waterapplications losses are thus of paramountimportance. Water in the system is lost bypercolation, run-off and the magnitude of theselosses varies widely among irrigation projects.However, reducing irrigation water supply willcut off the field scale percolation rates andreducing irrigation water supply by improvedconveyance and application efficiencies maycause decline of the groundwater table. One of
the alternative solutions in water utilization is theframework of water accounting (Molden, 1997),which distinguishes different water usecategories such as process depletion, non-processdepletion, non-beneficial depletion, committedoutflow and uncommitted outflow. Theframework of performance indicators describesthe various aspects of water management suchas production, utilization, environment andeconomy (Kijne et al, 2003) and it needs to getmore attention.
4.1 Performance indicators
The purpose of analysis of irrigation performanceis to diagnose operational problems and suggestsolutions and to identify potential changes insupport of strategic planning. The exercise isuseful for all stakeholders which include:irrigation and drainage service providers andwater mangers, research agencies, farmers andother service recipients. Factors affecting theperformance of irrigation are described below:
Agronomic Crops, precipitation capture, evaporation, soil characteristics, cropping patternEngineering Engineering systems that reduce losses, distribution uniformityManagement Demand-scheduling, root zone threshold, system maintenanceInstitutional User participation, water pricing, training, legal steps
With increasing demand on the water resources,water use efficiency is becoming one of the keyissues facing water managers. Efficiencyconcepts have been developed to determine howbest the improvements can be made. Irrigationpractices have to be evaluated from the timewater leaves reservoir until it is utilized by theplants. Irrigation efficiency indicated howefficiently the available water supply is beingused based on different methods of evaluation.The design and operation of the carrier system,the degree of land preparation, the method of
irrigation and the management skill of thefarmer are the factors which mainly influenceirrigation efficiency.
4.1.1 Concept of Irrigation Efficiency
In engineering, dimensionless ratios of inputs andoutputs are generally known as efficiencies. Forexample, the transmission efficiency of theelectrical grid is the ratio of the energy receivedby consumers to the energy delivered into thegrid from the power stations, similarly, thethermodynamic efficiency of a heating boiler is

48 Manual on Enhancing Water Use Efficiency in Canal Commands
the heat energy absorbed by the water in theboiler divided by the heat energy generated bythe fuel heating the boiler. In simple term, themechanical efficiency of any device per se abicycle, is the ratio of the energy transferredthrough the wheels to the road to the energyapplied to the pedals by a person. Theseefficiencies clearly indicate that if there are lesslosses the efficiency is high and vice-versa.
In irrigation engineering, the concept of efficiencywas evolved some 60 years ago. Israelsen (1950)did extensive field work during 1940s onmeasuring the quantities of water applied to thefield and stored in root-zone soil of farm andthereby absorbed or transpired by plants. Hedefined irrigation efficiency as the ratio of theirrigation water consumed by the crops of anirrigation farm or scheme to the water divertedfrom a river or other natural water source intothe farm or scheme canal or canals. In equationform, he defined irrigation efficiency (Ei) as
Ei = Wc/Wr
Where, Wc is irrigation water consumed by thecrops and Wr is the water diverted from a riveror other natural source (Israelsen, 1950).Essentially, irrigation efficiency as the ratio ofwater consumed by the intended purpose to thatdiverted. This basic approach to irrigationaccounting remained fundamentally unchangedfor over 40 years. Many researchers suggestedmany refinements. Hansen (1960) pointed outthat if the water applied is less than the potentialconsumption by the crop, the water-applicationefficiency may approach 100%, but the irrigationpractice and crop yield may be poor indicatingthat high efficiency was not reliably correlatedto good performance. He proposed todisaggregate efficiency into a number ofcomponents, and proposed an overall concept ofconsumptive use efficiency. Jensen (1967) definedirrigation efficiency as the ratio of ET of irrigationwater plus the water ‘‘necessary’’ for leaching ona steady-state basis to the volume of waterdiverted, stored, or pumped specifically forirrigation. Subsequently, Jensen (2002) has
pointed out that this resulted in the numeratorcontaining a consumptive component and a smallnon-consumptive component, making waterbalance calculations more complex. Bos andNugteren (1974, 1982) published the results of ajoint effort of the International Commission onIrrigation and Drainage (ICID), and theInternational Institute for Land Reclamation andImprovement (ILRI), Wageningen. Thedefinitions of efficiency terms were refined in the1982 edition. Distribution efficiency was definedas the ratio of the volume of water furnished tothe fields to the volume of water delivered to thedistribution system. Field application efficiencywas defined as the ratio of the volume ofirrigation water needed, and made available, forET to the volume of water furnished to the fields.Combining these various figures at appropriatescales provided measures of efficiency at field,farm, tertiary, and scheme level.
Despite these variations and enhancements,Israelsen’s original definition of irrigationefficiency, i.e, water used by the crop to the waterdiverted, remained the basis of accounting inirrigation. Since the various losses in distributionand field application were essential knowledgeto those designing the irrigation systems, thisaccounting basis was appropriate and relevantto that engineering purpose. High efficiencyimplied that a high proportion of the wateravailable at the head of a scheme was being usedfor the design purpose of augmenting croptranspiration.
US Interagency Task Force, Irrigation Water Useand Management (Interagency TF, 1979)evaluated available literature and undertookdetailed review of field data on irrigationefficiency and suggested in their report that anyproject dealing with irrigation efficiencies mustdefine “efficiency” with a great deal of care. Thereport further suggested that it is frequentlyassumed that because irrigation efficiency is low,much irrigation water is wasted but this is notnecessarily true.

Manual on Enhancing Water Use Efficiency in Canal Commands 49
As discussed above, the current nomenclaturerelated to how irrigation interacts with hydrology– particularly the term efficiency– and producesconfusing results for planners and policymakers.Even irrigation engineers use various termsinterchangeably and without due regard to theclarity. Further, non-engineers have added manyterminologies to the literature on the subject ofirrigation efficiency. Therefore, first priority is todefine terms that can be used unambiguously byplanners, hydrologists, engineers and others,concerned with analysing water resources.
Given that the science of hydrology has been inplace for many years, it provides the most testedframework, and whatever the irrigationprofession finally opts for should be entirelyconsistent with hydrological analysis. Beyond thegeneral framework, each speciality will have itsown additional set of parameters of interest, butterminology for the basic parameters should becommon. After in-depth consultations with manyworkers, Perry (2007) has suggested the followingterms:
1. Water use: any deliberate application ofwater to a specified purpose. The term doesnot distinguish between uses that removethe water from further use (evaporation,transpiration, flows to sinks) and uses thathave little quantitative impact on wateravailability (navigation, hydropower, mostdomestic uses).
2. Withdrawal: water abstracted from streams,groundwater or storage for any use –irrigation, domestic water supply, etc.Within withdrawals, following therecommendations of Willardson et al. (1994)and Allen et al. (1997), water would go to:
a. Changes in storage (positive or negative) –changes in storage include any flows to orfrom aquifers, in-system tanks, reservoirs,etc. The key characteristic of storage is thatthe water entering and leaving is essentiallyof the same quality.
b. Consumed fraction (evaporation andtranspiration) comprising :
i. Beneficial consumption: Water evaporatedor transpired for the intended purpose – forexample evaporation from a cooling tower,transpiration from an irrigated crop.
ii. Non-beneficial consumption: Waterevaporated or transpired for purposes otherthan the intended use – for exampleevaporation from water surfaces, riparianvegetation, waterlogged land.
c. Non-consumed fraction, comprising:
i. Recoverable fraction: water that can becaptured and reused – for example, flows todrains that return to the river system andpercolation from irrigated fields to aquifers;return flows from sewage systems.
ii. Non-recoverable fraction: water that is lostto further use – for example, flows to salinegroundwater sinks, deep aquifers that arenot economically exploitable, or flows to thesea.
An approach was developed by the InternationalCommission on Irrigation and Drainage (ICID)and used the terms like overall project efficiency,which is suitable for all irrigation systems andsubdivided this definition into three sub-components viz., conveyance efficiency,distribution efficiency and field applicationefficiency to track and account for water use fromthe point of supply through to the crops. Becauseof many factors that influence water efficiencyform the source to the crop (capital investment,labour availability and skills, energy sue,weather, and the physical performance ofirrigation system). Efficiency in the use of waterfor irrigation consists of various components andtakes into account losses during storage,conveyance and application of the drained outwater from one plot to other irrigation plot. CWChas proposed that water use efficiency forirrigation may be separated into i) ReservoirEfficiency WR); Conveyance efficiency (WC); Onfarm water application efficiency (WF) anddrainage efficiency WD.

50 Manual on Enhancing Water Use Efficiency in Canal Commands
The product of the four types of efficiencies isthe total efficiencies of water use for irrigation(WP), which can be expressed functionally as:
WP = WR * WC * WF * WD
Similar calculations on the weighted average(volume of water) basis will give a true pictureof the efficiency of the basin (WB) as a whole fromall the major /medium projects of the basin. Inaddition to above, the Irrigation Potential Created(IPC) by a project and the Actual PotentialUtilized (IPU) is also a indicator of the optimumwater use, overuse or under use. A correlation ofWP with IPU/IPC is generally determined.
a) Storage efficiency is the ratio between thevolume diverted for irrigation (Vd) and thevolume entering a storage reservoir (Ve) forthat purpose.
b) Conveyance efficiency is the ratio betweenthe volume of water delivered to irrigationplots (Vp) and the volume diverted from thesupply source (Vd).
c) On Farm Application Efficiency is theration between the volume used by plantsthroughout the evapotranspiration process(Vu) and the volume that reaches theirrigation plots (Vp). It is important to pointout that the volume used during theevapotranspiration process (Vu) is equal tothe volume of evapotranspiration by plantsminus the volume of effective rainfall.
The term irrigation efficiency which is expressedas ratio of Vr/Vp; where Vr is the volume ofusable water stored in the exploration zone of theplants roots Vp is the volume received by thefield.
i) Irrigation efficiency
Irrigation efficiency is the ratio usuallyexpresses as percent of the volume ofirrigation water transpired by plants, plusthat evaporated from the soil, plus thatnecessary to regulate the salt concentrationin the soil solution and that used by theplants in building plant tissues to the total
volume of water diverted, stored or pumpedfor irrigation.
100−1+= xWi
ReWWetEi
Where :
Ei : Irrigation efficiency, percent
Wet : The volume of irrigation water per unit areaof land transpired by plants, evaporatedfrom the soil during the crop period(including field preparation and nursery)
W1 : The volume of irrigation water per unit areaof land to regulate the salt content of thesoil solution
Re : Effective rainfall
Wi : The volume of water per unit area of landthat is stored in a reservoir or diverted forirrigation
Irrigation efficiency or overall efficiency indicateshow efficiently or beneficially the available watersupply is being used.
ii) Water conveyance efficiency
Losses that occur during conveyance of waterfrom the reservoir outlet into the main canal andto the farm are excessive. These losses are due toseepage and evaporation in the canal network,water courses and field channels. Seepage lossesare influenced by the nature and porosity of thesoil, depth, turbidity, shape of the canal sectionand the ground water level. Weeds and aquaticplants along and in the water courses and fieldchannel also use significant amount of water.
Water conveyance efficiency is the ration usuallyexpressed as percent of the volume of waterdelivered by an open or closed conveyancesystem at the field to the volume of waterdelivered to the conveyance system at the supplysource or reservoir outlet.
Ec = (Wf / Wd) X 100Where
Ec = Water conveyance efficiency (percent)
Wf = Volume of water delivered by theconveyance system at the field

Manual on Enhancing Water Use Efficiency in Canal Commands 51
Wd = Volume of water delivered to theconveyance system at the supply sourceor reservoir
iii) Water application efficiency
Water application efficiency is the ratio, usuallyexpressed as percent, of the volume of irrigationwater used in evapotranspiration in a specifiedirrigation area plus that necessary to maintain afavourable salt content in the soil solution to thevolume of water delivered to the area.
Ea = (Ws / Wf) x 100
Where,
Ea = Water application efficiency (percent)
Ws = Volume of irigation water stored in rootzone
Wf = Volume of water delivered to the filled
The common source of loss of irrigation waterduring application are: surface runoff, deeppercolation below the root zone and evaporation.The aim should be to store in the root zone of thesoil the maximum percent of water that is appliedto the field consistent with good irrigationpractice and economy. Irregular land surfaces,shallow soil underlain by gravel of highpermeability, small irrigation streams, non-attendance on water during irrigation, longirrigation runs and excessive depth of applicationcontribute to large losses and low efficiency.
The depth of water application in each irrigationis the dominant factor influencing efficiency ofapplication. Land uniformity, irrigation methods,length of run, soil texture and permeabilityinfluence the depth of irrigation. As the depth ofirrigation increases efficiency of applicationdecreases. Where the depth of water applicationwas 5 cm, the irrigation efficiency was 87 percentwith 5-10 cm depth it was 55 percent and 10 –15cm depth, it was 35 percent. In normal gravityirrigation, surface irrigation efficiency ofapplication are in the range of 60 percent whereas in a well designed sprinkler system it isapproximately 75 percent and it is as high as 90percent in drip irrigation system.
iv) Water storage efficiency
It is considered that irrigation with smallquantities of water may lead to high waterapplication efficiencies. The water storageefficiency refers to how completely the waterneeded prior to irrigation has been stored in theroot zone during irrigation.
100= xWnWs
Es
Where,
Es = Water storage efficiency (percent)
Ws = Water stored in the root zone afterirrigation
Wn = Water needed in the root zone prior toirrigation
Water storage efficiency assumes importancewhen water supplies are limited or whenexcessive time is required to secure adequatepenetration of water into the soil. When saltproblem is there, water storage should be kepthigh to maintain a favourable salt balance.
v) Water distribution efficiency
Uniform distribution of water over the entire fieldis necessary for high crop production per unit ofwater. The water distribution efficiency indicatesthe extent to which water is uniformly distributedalong the run. The length of irrigation run infurrow or borders is decided to a large extent bythe uniformity of water distribution for a givensoil, size of stream and management practices.
100−1= xdy
Ed
Where,
Ed = Water distribution efficiency percent)
d = Average depth of water stored along therun during irrigation
y = Average numerical duration from d
vi) Project irrigation efficiency
Project irrigation efficiency is the percentage ofirrigation water stored in the root zone of the soil

52 Manual on Enhancing Water Use Efficiency in Canal Commands
and is available for consumptive use by the cropto the amount of water delivered as measured atthe point of main source of supply. When thewater is measured at the farm head gate (or well),it is called farm irrigation efficiency and whenmeasured at the inlet ot he field than it is calledfield irrigation efficiency.
vii) Operational efficiency
It is the ratio of the actual project efficiencycompared to the operational efficiency of anideally designed and managed system using thesame irrigation method and facilities. Lowoperational efficiencies indicate defectivemanagement or system design.
viii) Economical irrigation efficiency
It is the ratio of the total farm production (net orgross profit) attained under with the operatingsystem, compared to the total productionexpected under ideally operated system underideal conditions. Since this relates to input andoutput, it is a measure of the overall efficiency ofthe project.
ix) Water use efficiency
Agronomical speaking, water use efficiency(WUE) is the yield of marketable crop producedper unit of water use in evapotranspiration.
ETY
WUE =
Where,
WUE = water use efficiency (kg/ha-mm)Y = Marketable yield of the crop (kg/ha)ET = Evapotranspiration (mm)
WUE is also known as crop water use efficiency(Ecu) if the water used for metabolic purpose ofthe crop (G) is also included with ET.
ETGY
Ecu+
=
Field water use efficiency (Eu) is the ratio of cropyield to the amount of water used in the field(WR) which includes G + ET + deep percolation(D).
WRY
DETGY
Eu =++
=
4.1.2 Evaluation of irrigation efficiencies
A summary of the current efficiency with whichwater is used in irrigated agriculture is given inTable 4.1. A considerable amount of water is lostas evaporation and/or leakage during storageand transport of the water to the fields where thecrops are grown. Bos (1985) has estimated thatglobally ∼ 30% of irrigation water is lost in storageand conveyancing. Once the remaining (70%)water reaches the field where it is further lost asrunoff and/or drainage. Postel (1993) hasestimated the world wide irrigation efficiency,i.e. the amount of water evaporated comparedto the amount of water delivered to the field, tobe ∼ 37%. This would mean 63% of the waterdelivered is lost as runoff and/or drainage.Broadly similar figures demonstrating the poorperformance of most irrigation systems have alsobeen published by the Food and AgricultureOrganisation (e.g. see Barghouti, 1999). However,some of the water “lost” from an irrigated fieldmay return to aquifers or streams from which itcan be abstracted again, provided the necessaryinfrastructure is available and the water qualityhas not deteriorated beyond acceptable limits. Ifthis is the case the efficiency of water use overlarge irrigated areas may be greater than theabove global mean of field level irrigationefficiencies ( Bouwer, 1992).
Water resources are, therefore, veryinefficiently used in irrigated agriculture. Thepoor efficiencies of water resources are
Table 4.1. Estimates of WUE of irrigatedagriculture in semi-arid area
Source: Wallace, 2000.
WUE Fraction ofavailablewater (%)
Storage and conveyance 30
Run-off and drainage 44
Evaporation (from soil to water) 8-13
Transpiration 13-18

Manual on Enhancing Water Use Efficiency in Canal Commands 53
disappointing but there are plenty of scope forimprovement. If properly utilized and managed,more food can be grown with existing waterresources.
4.1.3 Confusion on WUE
The term water use efficiency (WUE) itself isconfusing and is used in confused ways (Perry,2007). In the context of irrigation, WUE isgenerally defined as the crop yield per unit ofwater. However, the term is frequently simplyinterchanged with irrigation efficiency, or ismisquoted. Many researchers in literature usethis term and confirm that the meaning of wateruse efficiency is not well agreed or applied inthe context of irrigation. Thus term water useefficiency (WUE) is an unfortunate misnomer.Firstly, the water taken up by a plant canopyand transpired or lost in evaporation is only‘‘used’’ in the very broadest sense – in realityonly a very small part of the water taken up isactually utilised in the construction ofcarbohydrates or even in the composition ofplant tissue. Furthermore, as usually defined,it is not even a true ‘‘efficiency’’, which is a termconventionally reserved for the dimensionlessratio between the output of a quantity and itsinput (Jones, 2004).
There are many benefits to improve water useefficiency, including environmental andeconomics. These include less stress on waterresources, reduced losses of water and nutrientsto groundwater and surface water resources,improving production and overall profits andallowing greater area to be irrigated with a givenvolume of water. Water use efficiency can bedefined in many different ways by agriculturists,hydrologists and engineers. Efficient on-farmirrigation depends on water-use, energy use,labour and capital investment, and how theseaspects relate to production and profitability, andthere is no single definition that covers all theseaspects of water use efficiency.4.1.4 Improvement in water use efficiency
There is considerable scope for improving theefficiency and productivity of water utilisation.There are a wide range of options available forimproving irrigation water use efficiency andproductivity at the farm level (Table 4.2). Poormanagement is cited as the most frequent causeof inefficient water use on irrigation schemes andit is clear that few of the options listed in Table4.2 will result in a significant increase in efficiencyif overall management is of a low standard.Attempts to improve the efficiency of irrigationthat are centred on a technological, agronomicor institutional quick fix are rarely successful.
Table 4.2. Option available for improving irrigation efficiency at farm level
Improvement category Examples of options available
Agronomical improvements Improved crop husbandry; introduction of high yielding varieties;adoption of cropping strategies that maximize cropped area during periodof low ET and periods when recycling of water as rainfall is highest.
Technical improvements Laser leveling of flood irrigation schemes to improve irrigation uniformaly;adoption of practices that increase effectiveness of rainfall; introductionof more efficient irrigation methods that reduce soil evaporation, improveuniformity and reduice drainage
Managerial improvements Adoption of demand-based irrigation scheduling systems; use of deficitscheduling; better use and management of saline and waste water
Institutional improvements Users involvement in scheme operation and maintenance; Introductionof water pricing and legal frameworks to provide incentives for efficientwater user and disincentives for inefficient use; improved training andextension
Source: Batchelor (1999)

54 Manual on Enhancing Water Use Efficiency in Canal Commands
Although it is not possible to discuss all theoptions listed in Table 4.2 in detail, three of theoptions are of particular interest. Firstly, demand-based irrigation scheduling (such as tensiometerirrigation scheduling) is used frequently onirrigation trials but rarely used at the farm level.One reason for this has been the lack of cheapand reliable soil moisture sensors. However, it ispossible that further development of dielectricsoil moisture sensors can fulfil this need. Suchsensors will facilitate irrigation applications thatare matched closely to crop demand or even setat less than crop demand as in the case of deficitirrigation. Secondly, irrigation methods such asdrip irrigation can be used extremely effectivelyto increase the yields, crop quality and water useefficiency of many crops. However, it should berecognised that these methods are relativelysensitive to management and maintenance.Poorly-managed surface and sprinkler irrigationsystems continue to provide often low but
acceptable crop yields whereas poorly-manageddrip systems tend to fail catastrophically. Finally,there is potential for better use and managementof poor quality irrigation water and areas proneto soil salination. Research and experience inrecent years has demonstrated that waters ofmuch higher salinity than those customarilyclassified as unsuitable for irrigation can, in fact,be used effectively for the production of cropsgiven appropriate management and croppingstrategies (Rhoades et al., 1992). In a review paperon irrigation with poor quality water, Oster (1994)states that the use of poor quality waters requiresthree changes from standard irrigation practice.These are: selection of appropriately salt-tolerantcrops; improvements in water management andin some cases, the adoption of innovativeirrigation technology; and, maintenance of soil-physical properties to assure soil tilth andadequate soil permeability to meet crop waterand leaching requirements.
4.2 CONCEPT OF WATER PRODUCTIVITY (WP)
Water productivity is defined as crop productionper unit amount of water used. Concept of waterproductivity in agricultural production systemsis focused on producing more food with the samewater resources or producing the same amountof food with less water resources. Initially,irrigation efficiency or water use efficiency wasused to describe the performance of irrigationsystems. In agronomic terms, water use efficiencyis defined as the amount of organic matterproduced by a plant divided by the amount ofwater used by the plant in producing it. However,the used terminology water use efficiency does notfollow the classical concept of efficiency, whichuses the same units for input and output.Therefore, International Water ManagementInstitute has proposed a change of thenomenclature from water use efficiency to waterproductivity. Definitions of WP change with thebackground of the researcher or stakeholderinvolved. For example, obtaining more kilogramsdry matter production per unit of transpirationis a key issue for plant breeders. At a basin scale,
economists wish to maximize the economicalvalue from water used. Water managers tend tobe more concerned with the total water input.Rainfed farmers in arid areas are highlyconcerned with doing the most with limitedrainfall. For irrigation farmers, and managers ofirrigation systems, water supply is a managerialfactor and they will evaluate their own WP onthe basis of canal water supplies in relation tocrop yield, rainfall, supplemental irrigation, orfull irrigation supplies. Water productivity canbe further defined in several ways accordingto the purpose, scale and domain of analysis(Table 4.3).
Water productivities (WP) are defined fordifferent scales viz., the crop, the field and theregional scale. Water productivity (WP, kg of drymatter per m3 of water) can be defined in differentways (To Phuc Tuong, 1999; Molden et al., 1997,Zoebl (2006). The numerator may refer todifferent types of dry matter (DM), e.g. total DMor yield DM. The denominator may refer todifferent types of water, e.g. water transpired by
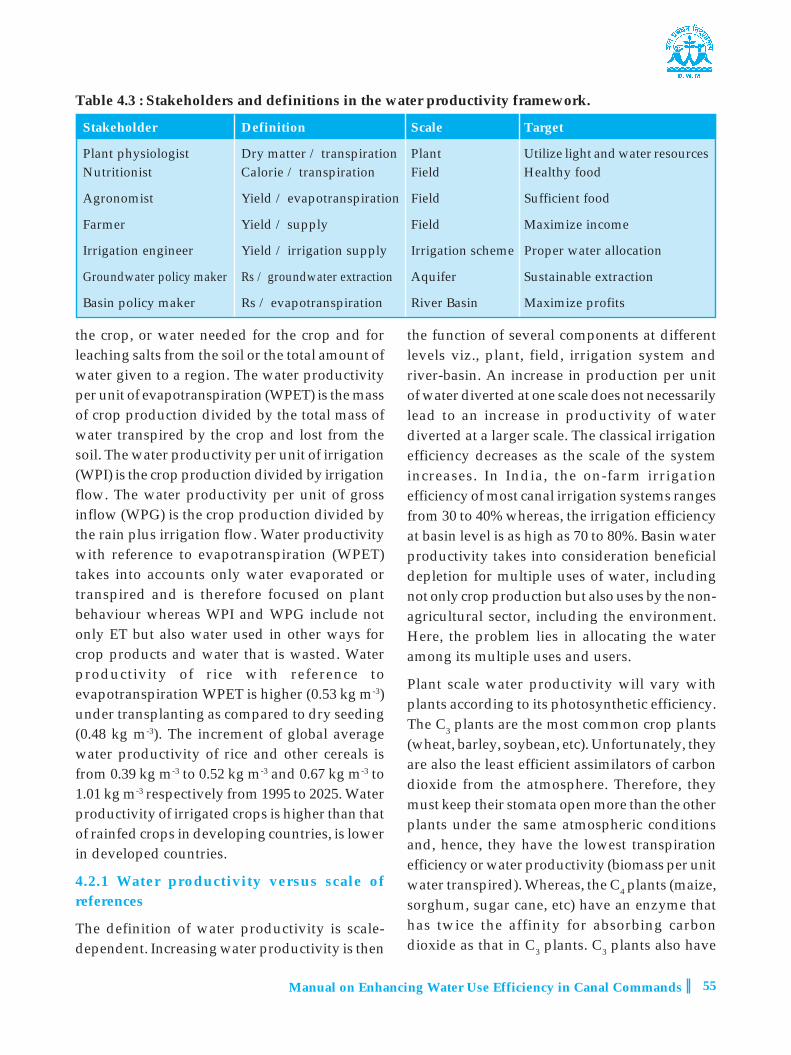
Manual on Enhancing Water Use Efficiency in Canal Commands 55
the crop, or water needed for the crop and forleaching salts from the soil or the total amount ofwater given to a region. The water productivityper unit of evapotranspiration (WPET) is the massof crop production divided by the total mass ofwater transpired by the crop and lost from thesoil. The water productivity per unit of irrigation(WPI) is the crop production divided by irrigationflow. The water productivity per unit of grossinflow (WPG) is the crop production divided bythe rain plus irrigation flow. Water productivitywith reference to evapotranspiration (WPET)takes into accounts only water evaporated ortranspired and is therefore focused on plantbehaviour whereas WPI and WPG include notonly ET but also water used in other ways forcrop products and water that is wasted. Waterproductivity of rice with reference toevapotranspiration WPET is higher (0.53 kg m-3)under transplanting as compared to dry seeding(0.48 kg m-3). The increment of global averagewater productivity of rice and other cereals isfrom 0.39 kg m-3 to 0.52 kg m-3 and 0.67 kg m-3 to1.01 kg m-3 respectively from 1995 to 2025. Waterproductivity of irrigated crops is higher than thatof rainfed crops in developing countries, is lowerin developed countries.
4.2.1 Water productivity versus scale ofreferences
The definition of water productivity is scale-dependent. Increasing water productivity is then
the function of several components at differentlevels viz., plant, field, irrigation system andriver-basin. An increase in production per unitof water diverted at one scale does not necessarilylead to an increase in productivity of waterdiverted at a larger scale. The classical irrigationefficiency decreases as the scale of the systemincreases. In India, the on-farm irrigationefficiency of most canal irrigation systems rangesfrom 30 to 40% whereas, the irrigation efficiencyat basin level is as high as 70 to 80%. Basin waterproductivity takes into consideration beneficialdepletion for multiple uses of water, includingnot only crop production but also uses by the non-agricultural sector, including the environment.Here, the problem lies in allocating the wateramong its multiple uses and users.
Plant scale water productivity will vary withplants according to its photosynthetic efficiency.The C3 plants are the most common crop plants(wheat, barley, soybean, etc). Unfortunately, theyare also the least efficient assimilators of carbondioxide from the atmosphere. Therefore, theymust keep their stomata open more than the otherplants under the same atmospheric conditionsand, hence, they have the lowest transpirationefficiency or water productivity (biomass per unitwater transpired). Whereas, the C4 plants (maize,sorghum, sugar cane, etc) have an enzyme thathas twice the affinity for absorbing carbondioxide as that in C3 plants. C3 plants also have
Table 4.3 : Stakeholders and definitions in the water productivity framework.
Stakeholder Definition Scale Target
Plant physiologist Dry matter / transpiration Plant Utilize light and water resourcesNutritionist Calorie / transpiration Field Healthy food
Agronomist Yield / evapotranspiration Field Sufficient food
Farmer Yield / supply Field Maximize income
Irrigation engineer Yield / irrigation supply Irrigation scheme Proper water allocation
Groundwater policy maker Rs / groundwater extraction Aquifer Sustainable extraction
Basin policy maker Rs / evapotranspiration River Basin Maximize profits

56 Manual on Enhancing Water Use Efficiency in Canal Commands
photorespiration which occurs withphotosynthesis in light and requires oxygen. Thisprocess does not occur in C4 plants.Consequently, C4 plants have 2-3 times highertranspiration efficiency or water productivitythan C3 plants. Further, the CAM plants(pineapple, agave, etc) have the ability toassimilate CO2 during the night and store it inthe form of organic acids. During the day thestored CO2 is available for producingcarbohydrates by photosynthesis. This enablesCAM plants to close their stomata during thedaytime, when transpiration is the highest, andopen the stomata at night when it is lowest. CAMplants can attain a transpiration efficiency orwater productivity as much as 10 times that ofC3 plants; however, their biomass production perunit land area is low.
At field level, WPET values under typical lowland conditions range from 0.4 to 1.6 g kg-1 andWPIP values from 0.2 to 1.1 g kg-1. In wheat, theWPET was 0.65 g kg-1 and WPIP was 0.8 g kg-1 inIndian condition. An experiment on the waterproductivity analysis from field to regional scaleat Sirsa district, Haryana, concluded that at fieldscale, the average WPET (kg m-3) was 1.39 forwheat, 0.94 for rice and 0.23 for cotton, andrepresents its average values for the climatic andgrowing conditions in Northwest India (Singh etal, 2006). Factors responsible for low values ofWP include a high share (20 to 40%) ofevaporation into ET for rice, percolation fromfields and seepage losses (34 to 43% of the totalcanal inflow) from the conveyance system.
Finally, WP of different farm enterprises meansgetting more profit per drop of water. Producingmore crops, livestock, fish and forest productsper unit of agricultural water use holds a key toboth food and environmental security. But, forsociety as a whole, concerned with a basin orcountry’s water resource, this means getting morevalue per unit of water resource used.Researchers stated the importance of working outWP within agriculture, water use by fisheries,forests, livestock and field crops and concludedthat analyzing each water use independently
often leads to false conclusions because of theseinteractions.
4.2.2 Water accounting :
It involves classifying water balance componentsinto water-use categories that reflect theconsequences of human interventions in thehydrologic cycle. Gross Inflow is the total amountof water flowing in the water balance domainfrom precipitation, and surface and subsurfacesources. Net inflow is gross inflow plus anychanges in storage.
Water depletion is a use or removal of water froma water basin that can not be used again.Consumptive water for crops and ET from forestsand evaporation from canals, surfaces and non-irrigated area are categorized into depleted water.Depleted water is classified into 3 parts, process,non-process and non-beneficial. Process depletionis the amount of water that is used to produce anintended good. For agriculture ET and watercontaining in the plants are process depletedwater. Non-process depletion occurs when wateris depleted by a natural use such as evaporationfrom forest cover or when diverted waterdepleted, but not by the intended process. Non-beneficial depletion occurs when no benefit or anegative benefit is derived from the depletion ofwater.
Committed water is that part of outflow that isallocated to other uses.
Uncommitted outflow is water that is neitherdepleted nor committed, is available for a usewithin a basin, but flows out due to lack of storageor operational measures. Uncommitted outflowscan be classified as utilizable or non-utilizable.Uncommitted outflow utilizable is water that can beavailable if improvement of management withexisting facilities can be achieved. Uncommittedoutflow non-utilizable is water that can not beavailable without appropriate or sustainableimprovement of facilities.
Available water is the net inflow less the amountof water set aside for committed uses and lessnon-utilizable uncommitted outflow.

Manual on Enhancing Water Use Efficiency in Canal Commands 57
Fig. 4.1 Water accounting at field scale
4.2.2.1 Water accounting indicators : The WPcan be measured in terms of quantity producedper unit of water. When the water is required forcompeting users in an irrigation scheme or basin,it has to be expressed in monetary terms. Thewater balance can be estimated at field, irrigationscheme and basin scales. While performanceindicators are based on the water balanceapproach using inflows and outflows, non-agricultural water users and interaction withother users be considered. Fig. 4.1 shows flow ofwater at the field scale. On the right side, wateris depleted by process of transpiration andevaporation.
The concept of water accounting is to presentconcepts and definition to account for water use,depletions and productivity. Some varieties ofdefinitions, so-called “irrigation efficiency” hasbeen used to evaluate irrigation water use. Butthese irrigation efficiencies do not take outflowsinto consideration. On the other hand, this wateraccounting approach take outflows intoconsiderations. This approach is applicable oneach level such as field, farm, irrigation systemcommand and basin level. Of course, the domainshould be defined not only area but also verticalrange, for example, root zone or ground waterlevel.
The accounting procedure can be considered atdifferent spatial scales: basins, sub-basins,irrigation systems or fields. The water balance fora certain area can be described as and presentedin Table 4.4.
Precipitation + Irrigation+ Capillary rise+ Soilwater storage change= Transpiration +Evaporation + Surface runoff +Drainage +Percolation + Soil water storage change
Table 4.4 : Water balance components indicators of WP for field, irrigation scheme and basin scale
Performance indicators (kg/m3) Field Irrigation Basinscheme
WP irrigated =Productivity/ irrigation Irrigation Irrigation Notappropriate
WP inflow =Productivity/net inflow P + I + dS + Cap. P + I + dS + Cap. P + dS
WP depleted =Productivity/depletion E + T or E + T + Drg. E + T or E + T + outflow+ Perc.+ R off Drg. + Perc.+
R off
WP process = Productivity/ process T T T
depletion
P = Precipitation, I = Irrigation, dS = Change in soil water storage, Cap. Capillary rise, E = Actual evaporation, T =Actual transpiration, Perc. = Percolation, Drg. = Drainage
Within the irrigation system irrigationinfrastructure is water provided for croptranspiration, domestic and industrial uses, fishand livestock. In addition to the intendeddepletion, water is also depleted by evaporation
from weeds, tress, fallow lands and waterbodies. The analytical framework for wateraccounting in an irrigation system is shown infollowing Fig. 4.2.

58 Manual on Enhancing Water Use Efficiency in Canal Commands
The following processes are involved in wateraccounting at the project level.
Process depletion (by crops, cities,industries).
Non-process but beneficial depletion, likeevaporation by trees, wetlands within thesystem, or fisheries.
Evaporative depletion of low or negativebenefit, like evaporation from fallow land orfrom waterlogged areas (that do not haveimportant wetland values).
Flows that are directed by irrigation intosinks like seas or inland water bodies thatdo not add value, and could have been usedwithin the irrigation system or elsewhere -this is considered as water depleted byirrigation
Uncommitted flows, that are utilizablewithin the irrigation system or elsewhere
Committed flows to meet environmentalneeds, or legal or traditional rights ofdownstream users.
As the scale of analysis increases morecomplexities are encountered (Fig. 4.3). Undersuch a situation the competition for water amongdifferent users increases. The understanding ofbasin scale processes are required to solve theseproblems. The solutions to these problemsthough, most often lie in action taken at localscales – irrigated and rainfed fields or withinirrigation systems.
4.2.3 Water productivity at command scale
When water is distributed in an irrigationsystem at a major scale like this, the important
processes include allocation, distribution,conflict resolution and drainage. Allocation anddistribution of irrigation water are primarily forirrigation farmers besides meeting the non-agricultural demands like domestic, industrial,livestock and fisheries use.
For canal command areas, irrigation schedulingcannot be done on a micro-scale calculating thedepth of irrigation required, frequency ofirrigation and the duration of irrigation owingto a larger areal extent with different crops anda different system of irrigation supplythroughout the season on a rotational basis.Here, irrigation scheduling refers to thequantum of water to be stored or diverted formeeting the overall command area crop andallied demands. The water productivity conceptshall be redefined by way of incorporating theoverall irrigation efficiency and the duty ofwater at storage, flow and field level. The baseperiod over which irrigation flow is continuousthrough the canal network with suitable timerotations at outlets for distribution, also decideupon the productivity.
The overall productivity of this scale of referencedepends ultimately on the total quantum ofwater released from storage over the baseperiod, the area covered and the project yield.The storage duty includes the losses duringconveyance, distribution and application overand above the field duty in a canal networkproject. The physical and economic waterproductivity under different canal system inTamil Nadu is presented in Table 4.5.
Fig. 4.2 Water accounting at irrigation project level
Fig. 4.3 Water accounting at basin scale

Manual on Enhancing Water Use Efficiency in Canal Commands 59
4.2.4 Ways of enhancing water productivity
Water productivity could be improved either byreducing the water losses that occur in variousways during water conveyance and irrigationpractices or increasing the economic produce ofthe crop through efficient water managementtechniques. Principle factors that are influencingwater losses and water productivity of acommand area are the design and nature ofconstruction of the water conveyance system,type of soil, extent of land preparation andgrading, design of the field, choice of irrigationmethods and skill of irrigators.
i) Enhancing water productivity at plant /croplevel
Identification of traits and genes usingconventional and molecular breeding techniquesthat have the following specific characters isrequired to improve the water productivity atindividual plant level.
Table 4.5 : Physical and economic water productivity under different canal irrigation systems withdifferent scale of reference in Tamil Nadu
Scale of Reference Total water Output Water Productivity
used (m3) Physical Economic Physical Economic(kg) (Rs) (kg/m3) (Rs/m3)
Parambikulam Aliyar Project
Plant/crop level 0.013 0.0051 0.0312 0.39 2.40
Field level (0.4 ha) 3388.8 680 4160 0.20 1.23
Distributary level 1335283.7 185661 1135810 0.14 0.85
Lower Bhavani Project
Plant/crop level 0.018 0.0131 0.029 0.73 1.61
Field level (0.4 ha) 5473.5 2200 7000 0.40 1.28
Distributary level 833824.4 213796 621952 0.26 0.75
Vaigai River Basin
Plant/crop level 0.020 0.014 0.033 0.70 1.65
Field level (0.4 ha) 6931.25 1650 4390 0.24 0.63
Distributary level 2486534.4 396000 1053600 0.16 0.42
Tampiraparani River Basin
Plant/crop level 0.028 0.017 0.068 0.60 2.43
Field level (0.4 ha) 7909.4 2100 7100 0.27 0.90
Distributary level 37647968.0 3549038 12066949.5 0.09 0.30
Traits that reduce the non-transpirationaluses of water in agriculture
Traits that reduce the transpiration of waterwithout affecting the productivity
Traits that increases production withoutincreasing transpiration
Traits that tolerance to water logging,drought and salinity stress.
Development of short duration varietiesreducing the growing time from 5 monthsto 3.5 to 4 months will also resulting higherwater saving.
ii) Enhancing water productivity at field /farmlevel
Water productivity at the field level can beimproved through increasing the total output perunit cumulative water used, reducing theunproductive water outflows and depletions andmaking more effective use of rainfall. Its

60 Manual on Enhancing Water Use Efficiency in Canal Commands
reduction at field /farm level is mainly due tothe losses occurring by seepage in the supplychannel, deep percolation and occasionally runoffoccurring in fields. Improper land leveling andgrading, faulty choice of irrigation methods,application of excess water, frequent irrigationand faulty design of fields are the major factorsthat cause low water productivity.
Water productivity of an agricultural ecosystemhas been improved either by reducing the waterlosses that occur in various ways during waterconveyance and irrigation practices or increasingthe economic produce of the crop throughefficient water management techniques
Water use can be minimized through variouswater conservation measures like:
Proper land leveling and grading is aprerequisite for efficient water application.
Lining of farm channels will reduce thewater losses through seepage
Reducing unproductive water outflowsthrough the following ways will also behelpful viz., minimizing idle periods duringland preparation, soil management toincrease resistance to water flow (shallowtillage before land preparation to closecracks, puddling and soil compaction etc.)and water management to reducehydrostatic pressure.
Pipes may be laid for water conveyance infarms wherever feasible to cut the waterconveyance losses.
Crop productivity can be maximizedthrough various measures like:
Proper selection of irrigation methodsaccording to crops, soil types, topography,climate and stream sizes are important tosecure high water productivity.
Introduction of water-saving irrigationtechniques like drip and sprinkler willenhance the crop productivity. Institutionaland Governmental policies will alsopromote the spread of these technologies,which could result in higher productivity.
Improved agronomic practices, such as site-specific nutrient management, good weedmanagement and proper land leveling canincrease the crop yield significantly withoutaffecting ET and therefore, may result inincreased water productivity
Adoption of water –saving irrigationtechnology in rice namely System of RiceIntensification (SRI), aerobic rice and dry-seeded rice techniques would increase thewater productivity of rice.
Optimum scheduling of irrigation is mostimportant way of improving crop waterproductivity.
iii) Enhancing water productivity throughmultiple uses
The multiple uses of water i.e. using the availablewater sources for more than one uses/production system is inevitable to produce morewith less water. Multiple use systems, operatedfor domestic use, crop production, aquaculture,agroforestry and livestock, can improve waterproductivity and reduce poverty. However,intensification of multiple use of water in thecatchment may affect downstream flow both interms of quality and quanity. There is a need forproper understanding and economic evaluationof non-irrigation uses and to greater recognitionof the linkages between water managementactivities and aquatic ecosystems.
iv) Enhancing water productivity at basin level
Conveyance loss is the main cause ofreduction in water productivity at basinlevel. It can be reduced by lining canals,waterways and channels with imperviousmaterials like bricks or stone masonry orbitumen clay mixture and so on.
Repairing of cracks, holes, burrows, erosiondamages, leaks in water control structuresshould be done as a part of continuousmaintenance.
Weed growth should be checked in unlinedcanals and water ways etc. Integrated water

Manual on Enhancing Water Use Efficiency in Canal Commands 61
and land management will be much helpfulin enhancing land and water productivity.
Participatory irrigation managementapproach.
4.2.5 Future challenges and options
The scale and boundary of the area over whichwater productivity is calculated greatly affect itsvalue. This is because of outflow losses byseepage, percolation and runoff at a specificlocation or field can be reused at another locationwithin the area under consideration. Data onwater productivity across scales are usefulparameters to assess whether water outflowsupstream are effectively reused downstream. Theavailable informations suggest that waterproductivities at scale levels vary widely. Thepaucity of data on water productivity at scalelevels higher than the field level is the majorconstraint.
In this context, increasing crop water productivityis a challenge at various levels which is brieflyoutlined hereunder:
The first challenge is to continue to enhancethe marketable yield of crops withoutincreasing transpiration.
The second challenge is at field, farm andsystem levels to reduce as much as possibleall outflows that do not contribute to cropproduction.
The third challenge is to increase theeconomic productivity of all sources ofwater, especially rainwater but also waste-water of various qualities and saline(ground) water.
Interdisciplinary team work is warranted.
Hence, analysis of irrigation efficiency isimportant in canal irrigation systems as it is animprovement over the previously used physicalmeasures. This measure provides information onhow much water use could be decreased withoutaltering the output produced and other inputsused. Comparison of irrigation efficiency andtechnical efficiency at farm level indicated that
irrigation efficiency is lower than technicalefficiency and the need for possibilities isreduction in water use with present situations.However use of modern water managementtechnologies could improve the irrigationefficiencies considerably thus conforming thescope of introduction of modern irrigationtechnologies in canal irrigation systems.
References
Allen, R.G, Willardson, L.S, Frederiksen, H. 1997.Water use definitions and their use for assessingthe impacts of water conservation. InProceedings ICID Workshop on SustainableIrrigation in Areas of Water Scarcity andDrought. Jager J.M, Vermes L.P, Ragab R (Eds),Oxford, England, 11–12 Sept.; 72–82.
Barghouti, S. 1999. Growing Challenges to WaterResources Management. SustainableDevelopment International, Launch Edition,Spring, 1999, pp. 43–52.
Batchelor, C. 1999. Improving water use efficiency aspart of integrated catchment management.Agricultural Water Management 40: 249-263.
Bos, M.G. 1985. Summary of ICID definitions onirrigation efficiency. ICID Bull. 34.
Bos, M.G, Nugteren, J. 1974. On Irrigation Efficiencies,1st edition. International Institute for LandReclamation and Improvement :Wageningen,The Nether-lands; 95 pp.
Bos, M.G, Nugteren, J. 1982. On Irrigation Efficiencies,3rd edition, International Institute for LandReclamation and Improvement: Wageningen,The Netherlands; 142 pp.
Bouwer, A. 1992. Agricultural and municipal use ofwaste water. Water Sci. Technol. 26, pp. 1583–1591.
Hansen, V.E. 1960. New concepts in irrigationefficiency. Transactions of the ASAE 3(1): 55–57, 61, 64.
Israelsen, O.W. 1950. Irrigation Principles andPractices. John Wiley and Sons, New York;471 pp.
Jensen, M.E. 1967. Evaluating irrigation efficiency.Journal of Irrigation and Drainage,American Society of Civil Engineers 93(IR1):83–98.

62 Manual on Enhancing Water Use Efficiency in Canal Commands
Jensen, M.E. 2002. Irrigation efficiency. 18th ICIDCongress on Irrigation and Drainage, Montreal,Canada, 25 July 2002.
Jones, H. 2004. What is water use efficiency? In WaterUse Efficiency in Plant Biology, Bacon M (ed.).Blackwell: Oxford, UK.
Kijne, J, Barker, R and Molden, D. 2003. Waterproductivity in agriculture: limits andoppurtunities for improvement. CABI Press,Wallingford, UK.
Molden, D. 1997. Accounting for water use andproductivity. IWMI/SWIM Paper No. 1,InternationalWater Management Institute,Colombo, Sri Lanka.
Molden, D, Sakthivadivel, R. 1999. Water accountingto assess use and productivity of water.International Journal of Water ResourcesDevelopment 15(1): 55–71.
Oster, J.D. 1994. Irrigation with poor quality.Agricultural Water Management 25: 271-297.
Perry, C. 2007. Efficient irrigation; inefficientcommunication; flawed recommendations.Irrigation and Drainage 56: 367-378.
Postel, S.L. 1993. Water and agriculture. In: Gleick,P.H. (Ed.), Water in Crisis: A Guide to theWorld’s Fresh Water Resources. OxfordUniversity Press, Oxford, pp. 56–66.
Rhoades, J.D. Kandiah, A and Mashali, A.M. 1992. Theuse of saline waters for crop production.Irrigation and Drainage Paper 28, FAO, Rome,p. 133.
Singh, R, Dam, J.C and Feddes, R.A. 2006. Waterproductivity analysis of irrigated crops in Sirsadistrict, India. Agricultural Water Management82(3): 253-278.
To Phuc Tuong. 1999. Productive water use in riceproduction: Opportunities and limitations.Journal of Crop Production 2(2):241-264.
US Interagency Task Force. 1979. Irrigation Water Useand Management. US Govt. Printing Office:Washington DC, USA; 143 pp.
Wallace, J.S. 2000. Increasing agricultural water useefficiency to meet future food production.Agriculture, Ecosystems and Environment, 82:105-119.
Willardson, L.S, Allen, R.G and Frederiksen, H. 1994.Eliminating Irrigation Efficiencies. USCID 13thTechnical Conference, Denver, Colo., 19-22October, 15 pp.
Zoebl, D. 2006. Is water productivity a useful conceptin agricultural water management?Agricultural Water Management 84(3): 265-273.

Manual on Enhancing Water Use Efficiency in Canal Commands 63
5.0 METHODS OF SURF5.0 METHODS OF SURF5.0 METHODS OF SURF5.0 METHODS OF SURF5.0 METHODS OF SURFAAAAACE IRRIGCE IRRIGCE IRRIGCE IRRIGCE IRRIGAAAAATION ANDTION ANDTION ANDTION ANDTION ANDMEAMEAMEAMEAMEASUREMENT OF IRRIGSUREMENT OF IRRIGSUREMENT OF IRRIGSUREMENT OF IRRIGSUREMENT OF IRRIGAAAAATION WATION WATION WATION WATION WATERTERTERTERTER
RRRRRajbir Singh and S. Mohantyajbir Singh and S. Mohantyajbir Singh and S. Mohantyajbir Singh and S. Mohantyajbir Singh and S. Mohanty
Different methods are used to apply irrigationwater to the crop depending on the source ofsupply of water, topography, quantity of waterto be applied, crop and method of cultivation.These methods are classified as surface, sub-surface, overhead or sprinkler and drip irrigationmethods. In surface methods of irrigation, wateris applied directly to the soil surface from achannel or open ditch located at the upper reachof the field. The pressurized irrigation system likeoverhead or sprinkler and drip irrigationmethods are described in different chapterseparately.
Surface methods of irrigation are oldest and mostcommonly used methods of irrigation. Surfacemethods are followed as back as 4000 years. Evenin developed countries like USA, 66 percent ofirrigated area is under surface methods ofirrigation and it is around more than 80 percentin most of the countries. Surface methods aremost suitable for leveled lands or lands with slopeless than 2-3 percent.
The most common methods of surface irrigationare flooding, check-basin, basin , border –stripand furrow methods. High efficiency in surfacemethods can be obtained if water distributionsystems are properly constructed to provideadequate control of water to the fields and properland shaping and leveling is done for uniformdistribution of water over the field.
5.1 Methods of surface irrigation
5.1.1 Flooding
In this method, water is allowed form the channelinto the field without much control on either sideof the flow. It covers the entire field and movesalmost unguided. The ideal size of each plot is0.1 to 0.2 ha. The height of bund around the basinshould be 15 cm for impounding and effectiveuse of rainfall. Labour requirement for thismethod is minimum and large stream can be
maintained in this method. Uneven distributionand low water application efficiency are thecommon drawbacks of the method.
5.1.2 Border-strip method
In this method, field is divided into number ofstrips by making bunds of around 15cm height.This method makes use of parallel ridges to guidea sheet of flowing water as it moves down theslop. The land is divided into a number of longparallel strips called borders that are separatedby low ridges. The border strip has little or nocross slope but has a uniform gentle slop in thedirection of irrigation. The essential feature ofborder irrigation is to provide uniform depth.Each strip is irrigated independently by turningin a stream sheet confined by the border ridges.The irrigation stream must be large enough tospread over the entire width between the borderridges without overtopping them. When theadvantage water front either reaches the lowerend, or a few minutes before or after that streamis turned off. The water temporarily stored in theborder moves down the strip and infiltrates, thuscompleting irrigation. This method is suitable forfield crops and medium to heavy textured soils.The length of the strip ranges from 30 to 300 mand width from 3 to 15 m depending upon streamsize, soil type and slop of the field (Table 5.1)However, the most common sizes are 60 to 90min length and 6 to 12m in width.
5.1.3 Check basin irrigation
Check basin irrigation is the most commonmethod fo irrigation in India and in manycountries. This is the simplest in principle of allmethod of irrigation. There are many variationin its use, but all involve dividing the field intosmaller unit areas so that each has a nearly evensurface. Bunds or ridges are constructed aroundthe areas forming basins within which theirrigation water can be controlled. The basins are

64 Manual on Enhancing Water Use Efficiency in Canal Commands
Table 5.1 : Suggested size of borders and stream sizes for different soils and land slopes
Soil type Slope (%) Width (m) Length(m) Flow (l/s)
Sand 02 -0.4 12-30 60-90 10-15
0.4-0.6 9-12 60-90 8-10
0.6-1.0 6-9 75 5-9
Loamy sand 02 -0.4 12-30 75-150 7-10
0.4-0.6 9-12 75-150 5-8
0.6-1.0 6-9 75 3-6
Sandy loam 02 -0.4 12-30 90-250 5-7
0.4-0.6 9-12 90-180 4-6
0.6-1.0 6 90 2-4
Clay loam 0.2-0.4 12-30 180-300 3-4
0.4-0.6 6-12 90-180 2-3
0.6-1.0 6 90 1-2
filled to the desired depth and the water isretained until it infiltrates into the soil. Whenirrigating rice or ponding water for leaching ofsalts from the soil, the depth of water may bemaintained for considerable period of time byallowing water to continue to flow into the basins.
The size of the check basin ranges from 4m x 3mto 6m x 5m depending on the stream size andsoil texture. Bigger size streams of water needbig check basins. Light textured soils need smallsized check basins. The advantage of this methodis that water can be applied uniformly. Even withsmall streams (2 l/s) irrigation can be appliedeffectively and efficiently. It is suitable for closegrowing crops like wheat, groundnut,pearlmillet, fingermillet etc. More labour arerequired for field layouts and irrigation. Moreland (about 5-8%) is wasted under channels andbunds.
In USA, large sized plots of over 5 hectares areperfectly leveled with the help of laser landleveler and large stream of 400-500 l/s are usedto fill the basins. These large basins facilitatemechanized cultivation.
5.1.4 Basin method
Basin method is almost similar to check-basinmethod except that in this method entire field isirrigated wheras in basin method only basinaround the tress are irrigated. This method issuitable for orchards. Basins are generally roundin shape, occasionally square in shape. The basinsare small when the trees are young and their sizeis increased with age of plant. Basins areconnected with irrigation channel for supply ofwater.
5.1.5 Furrow method
In this method, small channels are formed alongor across the slope of a field and water from openditches are diverted into the furrows. Waterinfiltrates from the bottom and sides of thefurrows moving downward and laterally to wetthe soil. Furrow method of irrigation is adoptedto crops grown with ridges and furrows. Thesize and shape of the furrow depends on the cropgrown and spacing of the crop. Depending onthe stream size, water infiltrates into the soil andspreads laterally as it flows through the furrowsin smalls stream. Furrow length depends on soiltexture and stream size (Table 5.2).

Manual on Enhancing Water Use Efficiency in Canal Commands 65
Table 5.2 : Length of furrows and streams sizes for different soils, land slopes and depth of waterapplication
This method is applicable in light to moderatelyheavy soils of 0.5 –2.5 cm/h infiltration rate, landslope of 0.3-0.6%, stream size of 2-10 l/s, suitedto row crops and vegetable. It is good for crustingsoil and provides better aeration and drainagebut leaching is not possible. This method is bestfor cotton in which substantial amount of wateris saved without any reduction in yield. Thefurrows can be made after each row oralternatively before or after first irrigation.Planting cotton in paired rows of 30-90 cm andmaking of furrows between the pairs saves
another 15% of irrigation water. If flooding ispracticed, than the width of borders should notbe more then 5-8 m. and length should be 60-66m. Making of furrows can be helpful in caseheavy showers are received and temporaryflooding occurs. The comparison of differentmethods of irrigation in cotton is shown in Table5.3. Furrow irrigation is always better than bordermethod and irrigation in alternate or paired rowsgives higher water use efficiency. Generalspecifications for surface methods for irrigationare given in Table 5.4.
Table 5.3 : Wetted area, irrigation water applied, profile water use, yield and WUE in cotton underdifferent methods of irrigation
Furrow Furrow length (m)slope (%)
Soil type
Clay Loam Clay loam Loamy sand Maximumand Sandy loam and sandy flow (l/s)
Depth of water application (cm)
7.5 15 7.5 10 15 7.5 10 15
0.05 300 400 120 270 400 60 90 150 120.10 340 440 180 340 440 90 120 190 60.20 370 470 220 370 470 120 190 250 30.30 400 500 280 400 500 150 220 280 20.50 400 500 280 370 470 120 190 250 1.21.00 280 400 250 300 370 90 150 220 0.61.50 250 340 220 280 340 80 120 190 0.42.00 220 270 180 250 300 60 90 150 0.3Applicationdepth (mm) 75 150 50 100 150 50 75 100
Irrigation Wetted area, Irrigation Water use, Seed cotton W.U.E. Kg/methods m2/ha water cm yield, kg/ha ha-cm
applied, cm
Border 10000 40.4 82.4 1960 26.1Each furrow 6987 30.1 71.1 1980 32.0Alternate furrow 4053 23.3 65.0 1900 35.7Paired crop row 1003 24.4 63.7 2010 36.7

66 Manual on Enhancing Water Use Efficiency in Canal Commands
Table 5.4 : General specifications for surface method of irrigation
Item Border Check basin Furrow
Soils Most soils except Most soils Most soils except sandy soilscoarse sands
Infiltration rate Moderately low to Moderate to low Moderate to lowmoderately high
Slop (%) 0.20 – 1.0 No restriction Minimum 0.05% upto 0.50%and even upto 2.0% in somecases
Stream size (l/s) 12-15 Large or small, basin 0.3 to 2.5 common, maximum 12size to be adjusted
Length (m) 60-300 Length : width (1.5-2.5 :1) Usually 50-400. Spacing 45-60cm depending on the crop.Depth of furrow : 7.5-12.5cm
Crops Wheat, barley, legumes, Groundnut, vegetables, Sugarcane, potato, cotton, fodder crops, close rice, fingermillet sorghum, maize, chilli, growing crops vegetables
5.1.6 Corrugation
Corrugation irrigation consists of running waterin small furrow, called corrugations which directthe flow down the slope. It is commonly used forirrigation non-cultivated, close growing cropssuch as small grains and for pasture growing onsteep slopes. Corrugations may be used inconjunction with border irrigation on lands withrelative flat slops to help in obtaining uniformcoverage with water. The water is applied tosmall furrows, the main difference from regularfurrow irrigation being that more, but smaller
furrows are utilized and the crop rows are notnecessarily related to the irrigation furrows.
5.1.7 Sub surface irrigation
In sub-irrigation water is applied below theground surface by maintaining an artificial watertable at some depth depending upon the soiltexture and the depth of the plant roots. Waterreaches the plant roots through capillary action.Water may be introduced through open ditchesor underground pipelines such as tile drains ormole drains. The depth of open ditches ortrenches vary from 30 to 100 cm and they arespaced about 15 to 30 m apart.
5.2 METHODS OF WATER MEASUREMENT
Water is the most valuable asset of irrigatedagriculture. Systematic water measurementsproperly recorded interpreted and used, help inenhancing irrigation efficiency. In the absence ofsuitable measuring special facilities, there arepossibilities of either under-irrigating the cropscausing uneconomic returns, or over-irrigatingresulting in wastage of valuable and scarce waterand chances of crop damage. Accuracy in watermeasurement is, therefore, essential in theoperation of a distribution system. Different units
are used to measure irrigation water at rest andwhile flowing. Water from different sources onfarms, is conveyed through open channels orpipelines. Water measuring methods arecategorized as (i) volumetric, (ii) Area-velocity,and (iii) using measuring structures.
5.2.1 Volumetric method
This method is generally used to measure smalldischarges from pumps or other water liftingdevices by collecting water in a container of

Manual on Enhancing Water Use Efficiency in Canal Commands 67
known volume for a period of time. The methodmay also be well adopted to measure a streamdischarging into a reservoir of sufficient capacity.The discharge rate is then calculated by notingthe time for the reservoir to fill to a certain depth,or for the water surface to rise to a predeterminedlevel Rate of flow is calculated by the formula as:
containerfillto)h/m(sec/Time)liters(containerofVolume
rateeargDisch =
5.2.2 Area-velocity methods
It involves the measurement of velocity of waterflow passing a point in an open channel. The flowrate is estimated by multiplying the cross-sectional area of the flow perpendicular to thedirection of flow by the average velocity of water.The cross-sectional area is determined by directmeasurements and the velocity of water may bedetermined by float method and current meter
Q = AV
Where,
Q = discharge rate, cm3/s
A = cross-sectional area, cm2
V = velocity of water, cm/s
i) Float method
The velocity of water is measured with the helpof a float-block of wood or long-necked bottlepartly filled with water in a straight clean sectionof the channel with fairly uniform cross section.The cross-sectional area of the stream iscalculated by multiplying the mean width of thewetted part of the channel by the depth of wate.The velocity of water is the highest on the surface;therefore, a constant factor of 0.85 is used. Thedischarge of the stream may be estimated by:
Q = 0.85 A V
Where,
Q = discharge, cm3/s
A = mean cross section of the channel, cm2
V = mean flow velocity, cm/s
ii) Current meter method
Current meter (Fig. 5.2.1) is suspended in a deepstream and the vanes that revolve by themovement of water in a stream and measure thevelocity of water. The number of revolutions ofthe vane made by the flowing water in a givenperiod is referred to a calibration chart to knowthe velocity of water. Discharge is estimated bymultiplying the mean velocity of water by thecross-sectional area of the stream. Measurementsare usually taken at 20% to 80% region of thestream depth to obtain an accurate estimate ofthe velocity in a vertical plane.
iii) Water meter
Water meter has multi blade propeller made ofmetal, plastic or rubber that rotates in a verticalplane. The meter is fitted in water line pipes. Thepropeller is geared to a totalizer with a counterthat totals the flow in volumetric unit. Watermeters are available for a range of sizes suitingthe pipe sizes.
iv) Dethridge meter
The meter is simple and consists of an under-shotwater wheel revolved by the moving waterthrough a concrete pipe and is fitted at the outlet.It gives the direct measurement of the dischargein volumetric units and operates with small headloss. The accuracy of measurement is more than95 per cent under normal situations.
Fig. 5.2.1. Current meter

68 Manual on Enhancing Water Use Efficiency in Canal Commands
v) Pipe method
This coordinate method is used to estimatedischarges from flowing vertically or frompumping plants discharging horizontally (Fig.5.2.2). The method presents difficulties inaccurately measuring the coordinates of the jetand therefore is of limited use.
a) Flow from a vertical pipe
When water flows vertically out of an open pipe,the height to which it will rise above the pipe isproportional to the flow. When the height of thejet was less than 0.37D, where D is the insidediameter of the pipe, the flow is similar to theflow over a weir and can be expressed by theempirical equation:
Q = 3.1 x 10⁻⁷ D2.5 H3.5
When the height of the jet exceeds 1.4 D, the flowis comparable to jet flow and can be expressedby the empirical equation:
Q = 0.029 Dl.99 H 0.53
Where,
Q = flow in liters per second
D = inside diameter of pipe, cm
H = average height of rise of the center of the jet,cm
b) Flow from a horizontal pipe
The trajectory of a stream of water from ahorizontal pipe can be used to estimate thedischarge. X and Y coordinates are measured, Xparallel and Y perpendicular to the pipe. Thehorizontal distance, X is from the end of the pipeto the middle point of the water jet where it fallsvertically. The drop in height, Y of the water jet
Fig. 5.2.2 Flow measurement through vertical and horizontal pipes
is the distance of the point from where it fallsvertically from the centre of the pipe. The formulais derived using the equations :
Y= 2
1 gt2 X = Vt Q = AV
Q = C’ 2
g
Y
AX = 0.022 CA
Y
X
Where,
Q = discharge, litre/second
C = coefficient of discharge (Table 5.2.1)
g = acceleration due to gravity, cm/sec2
A = Cross-sectional area of water at the end ofpipe, cm2
X = Horizontal coordinate of the point measuredfrom the water surface, cm
Y = vertical coordinate of the point measuredfrom the water surface, cm
The coefficient of discharge C is very importantand depends on the depth of flow in the pipe andX, Y coordinates. In case of partially flowing pipe,the depth of flow is denoted by d. Fig. 5.2.2 canbe used to measure discharge for different insidediameters of fully flowing pipes (D). At ahorizontal distance equal to 8D, vertical distanceor fall of jet (Y) is measured.
5.2.3 Measuring Structures
The most common structures used formeasurement of water in farm irrigation practicesare – orifice, meter gate, weir and flumes
i) Orifices
An orifice is a simple opening, circular orrectangular in shape, in a wall made of steel oraluminum plates and placed across a channel tomeasure the flow rate (Anonymous 1997). Thecross-sectional area of the orifice is small inrelation to the stream cross section. Under freeflow conditions, the flow from the orificedischarges entirely into air (Fig. 5.2.3). Insubmerged flow orifice, the downstream waterlevel is above the top of the opening and the flow

Manual on Enhancing Water Use Efficiency in Canal Commands 69
Table 5.2.1 : Coefficient of discharge for measuring discharge from horizontal pipes
discharges into water. Free flow orifices platescan be used to measure comparatively smallstreams like in border strips, furrows or checkbasins (Michael 1992)
Flowing partially full at the end
d/D X/D
1.00 1.50 2.00 2.50 3.00 4.00 5.00 8.00
0.2 1.02 1.01 1.00
0.3 1.11 1.06 1.03 1.02 1.01 1.00
0.4 1.17 1.10 1.06 1.03 1.02 1.01 1.00
0.5 1.22 1.13 1.07 1.04 1.03 1.01 1.01 1.00
0.6 1.26 1.15 1.09 1.05 1.03 1.02 1.01 1.00
0.7 1.30 1.17 1.10 1.06 1.04 1.02 1.01 1.00
0.8 1.33 1.18 1.11 1.07 1.04 1.02 1.01 1.00
Flowing completely full at the end
Y/D X/D
1.00 1.50 2.00 2.50 3.00 4.00 5.00 8.00
0.5 1.44 1.28 1.18 1.13 1.10 1.06 1.03 1.00
1.0 1.37 1.24 1.17 1.12 1.09 1.06 1.03 1.00
2.0 1.11 1.09 1.08 1.07 1.05 1.03 1.00
3.0 1.04 1.04 1.04 1.04 1.03 1.00
4.0 1.01 1.01 1.02 1.03 1.02 1.00
5.0 0.97 0.99 1.00 1.01 1.01 1.00
Fig. 5.2.3 Free flow through orifice
The discharge from an orifice is calculated by theformula,
Q = 61x10-5 A gH2
Where,
Q = discharge, litre/sec
A = cross-sectional area of the orifice, cm2
C = coefficient of discharge, usually found to be 0.61
g = acceleration due to gravity which is 981 cm/s2
H = Depth of water over the centre of the orifice(on the upstream side) in case of free flowOrifice or the difference in elevation betweenthe water surface at the upstream anddownstream faces of the orifice plate in case ofsubmerged orifice , cm

70 Manual on Enhancing Water Use Efficiency in Canal Commands
ii) Meter gate
It is a modified submerged orifice with anadjustable dimension and are used to control thewater flowing from one channel to another. Aflow rate is a function of the head and the degreeof gate opening as measured by the displacementof the gate stem.
iii) Weirs
The term, weir is used to denote a notch in a wallbuilt across an irrigation channel. It may berectangular, trapezoidal or triangular. Water isallowed to flow over it for measurement in anirrigation channel. Weirs are very simple devicesthat can profitably be used to measure even smallwater supplies and are of two types- sharp crested
and broad crested. The discharge through a weiris proportional to the head on the crest dependson condition of the crest, contraction, velocity ofapproaching stream and elevation of the watersurface downstream of the weir.
Q= CLHm
Where,
Q = discharge
C = coefficient dependent on nature of crest andapproach conditions
L = length of crest
H= head n crest
m = an exponent depending on weir opening
Table 5.2.2 : Discharge through V-notch in relation to hight of water over V-notch (cm)
The accuracy in water measurement, simplicityand ease of construction, non-obstruction byfloating material and durability are some ofadvantages of using weirs. But it requiresconsiderable fall of water surface making theiruse in areas having level land impracticable.Deposition of gravel, sand and silt above the weiraffects accurate measurements. A weir when
properly constructed and installed is one of thesimplest and most accurate methods ofmeasuring water. The accuracy may vary from80 to 85 per cent.
iv) Flumes
Flumes are shaped, open channel flow sectionsthat force flow to accelerate. Acceleration is
Height of water Discharge, Height of Discharge, Height of Discharge,over V-notch, cm litre/sec water over litre/sec water over litre/sec
V-notch, cm V-notch, cm
4.0 0.45 12.5 7.8 21.0 28.34.5 0.60 13.0 8.6 21.5 30.35.0 0.80 13.5 9.5 22.0 31.05.5 1.0 14.0 10.5 22.5 34.06.0 1.2 14.5 11.3 23.0 35.76.5 1.5 15.0 12.3 23.5 38.27.0 1.8 15.5 13.3 24.0 40.07.5 2.2 16.0 14.5 24.5 42.78.0 2.5 16.5 15.6 25.0 44.58.5 2.8 17.0 16.7 25.5 46.79.0 3.4 17.5 18.3 26.0 48.89.5 3.9 18.0 19.4 26.5 51.0
10.0 4.5 18.5 21.7 27.0 53.810.5 5.1 19.0 22.3 27.5 56.311.0 5.7 19.5 23.5 28.0 58.711.5 6.3 20.0 25.5 29.0 64.512.0 7.1 20.5 27.0 30.0 69.4

Manual on Enhancing Water Use Efficiency in Canal Commands 71
produced by converging the side walls, raisingthe bottom or combination of both (Clemmens etal. 1993). Flumes range in size 2.5 cm to 15 m usedin ditches and large canals. Parshall flumes andcut throat flumes are the most commonly usedflumes for discharge measurement at the farms.
a) Parshall flume
It is an important device for measuring water inirrigation channels or canals by measuring theloss of head of a stream passing through theflume. It can be used to measure streams ofvarying sizes from a very small one to a very largeone. Parshall flume consists of three sections viz.,i) converging or upstream section, ii) throat ormiddle section, and iii) diverging or downstreamsection (Fig. 5.2.4). Converging section has a levelfloor with vertical walls converging to the throat.Throat section has parallel walls and a floorinclined downward at a slope of 9 vertical to 24horizontal. Diverging section has a floor inclinedupward at a slope of one vertical to six horizontal
and wall diverging towards the outlet. Agraduated scale is fixed in a stilling wellconstructed in the converging section (Ha) tomeasure the head of water over the floor of thissection and to calculate the stream size. Anotherscale is fixed in the other stilling well at thebeginning of the divergent section (Hb) tomeasure the head at that section for necessarycorrection for submerged flow. Dischargesthrough the flume may be either free flow orsubmerged flow.
The size of flume is decided by the size of throat.Flumes are built of wood, steel sheet, concreteblocks or concrete and bricks. A heavy metal sheetmay be used for a smaller flume. Standard
Fig. 5.2.4 Parshall flume showing different components
Width of throat, cm Free flow limit, H b / Ha
2.5 to 7.5 0.5
15 to 22.5 0.6
30 to 240 0.7

72 Manual on Enhancing Water Use Efficiency in Canal Commands
dimensions of Parshall flumes and discharges canbe referred in any standard book for irrigationand water engineering.
The limitations are: i) it is costlier and moredifficult to construct than weirs, ii) protection ofthe channel immediately down the flume againstthe channel bed erosion occurs and iii) it cannotbe readily combined with a turnout.
For successful operation, the flume should be ofcorrect size carefully. The probable maximumand minimum flows and the allowable head arerequired to be estimated. Maximum allowableflow on the grade of the channel and thefreeboard at the place where installed. Thefreeboard is the upward distance from the normalwater surface in the channel to the top of banks.Flumes should have a free flow possible.
b) Cutthroat flume
The cutthroat flume is an improvement over theParshall flume and has only two sections, viz.,converging and diverging and no throat section(Fig. 5.2.5). The flume has a flat bottom, verticalwalls and a zero length throat section. It may haveboth free flow and submerged flow. Under freeflow condition, critical depth of flow occurs nearthe flume neck or flume throat, which is thejunction of the converging and diverging sections.The ratio of incoming flow depth (ha) to the flumelength shout be less than 0.4. The flume lengthmay be from 45 cm to 3 m at neck width mayvary from 2.5 cm to 1.8 m. The flume should be a
Fig. 5.2.5 Cut throat flume
straight section of the channel. It is desirable tooperate it under free flow conditions.
The discharge through a cutthroat flume underfree flow conditions is:
Q = C1han
1
Where,
Q = flow rate, ft3/sec
C1 = free flow coefficient, which is the value of Qwhen ha is 1.0 foot which is the slope of the freeflow rating curve
ha = head at the converging section, ft
n1= exponent whose value depends on flumelength. L
The value of n1 is a constant for all cut throatflumes of the same length regardless of theirthroat width, W. The value of n1 can be obtainedfor any flume length between 1.5 feet and 9 feetby plotting Q and ha on logarithmic paper andreading the intercept and slope and the dischargemay be Q = 1.09 ha
1.825
When the flow depth exceeds the critical depth,the flow becomes submerged. For finding out thedischarges, flow depths both at the convergingsection (ha) and the diverging sections (hb) areconsidered. The submergence, S is expressed asthe ratio, often expressed as a percentage, of thedown stream depth (hb) the upstream depth (ha).
References
Anonymous. 1997. Water Measurement Manual1997.U.S. Department of Interior, Bureau ofReclamation,, Washington, U.S. A.
Clemmens, A. J., Bos, M.S. and Replogle, J.A. 1993.Flume-Design and Calibration of long throatedMeasuring Flumes 1993. ILRI Publication 54,Wageningen, the Netherlands, pp. 123.
Majumdar, D.K. 2000. Irrigation Water Management-Principles and Practice. Prentice Hall of IndiaPvt. Ltd., New Delhi, pp. 487.
Michael, A.M. 1992. Irrigation - Theory and Practice.Vikas Publishing House Pvt. Ltd., New Delhi,pp. 801.

Manual on Enhancing Water Use Efficiency in Canal Commands 73
6.0 ON-F6.0 ON-F6.0 ON-F6.0 ON-F6.0 ON-FARM DEVELARM DEVELARM DEVELARM DEVELARM DEVELOPMENT FOR ENHANCINGOPMENT FOR ENHANCINGOPMENT FOR ENHANCINGOPMENT FOR ENHANCINGOPMENT FOR ENHANCINGWWWWWAAAAATER APPLICTER APPLICTER APPLICTER APPLICTER APPLICAAAAATION EFFICIENCTION EFFICIENCTION EFFICIENCTION EFFICIENCTION EFFICIENCYYYYY
RRRRRajbir Singh and M.L. Jaajbir Singh and M.L. Jaajbir Singh and M.L. Jaajbir Singh and M.L. Jaajbir Singh and M.L. Jattttt
Water is a precious natural resource whichshould be used judiciously. However, in anirrigation system, water is lost by evaporation,transpiration by weeds and seepage inreservoirs and carrier systems. Water is also lostby deep percolation beyond root zone in fields,and also by runoff at the end of borders andfurrows. The magnitude of these loses varieswidely among irrigation projects because of thedifferent physiographic features, water controland conveyance structures and managementpractices.
6.1 Losses in unlined canals
The actual quantity of water used by the crops
through transpiration and loss from the croppedfield due to evaporation during the crop periodwas only 38.5% of supply at the head of thecanal. In no irrigation project in India the totallosses in the canal distribution system and fieldhas been less than 50% of the head discharge. Areview of 90 irrigation projects of the worldindicated generally low irrigation efficiencies,with only 20-40% of the water diverted from thereservoir being effectively used by the crop,while in India, the irrigation efficiency is around10-20%. The losses of irrigation water in unlinedcanal distributary system in north India aregiven in Table 6.1.
Table 6.1 : Losses of irrigation water in unlined canal distribution systems and in the field
Source of loss % of supplies at canal head
Seepage Evaporation Total
Main canal and branches 13.6 3.4 17.0
Distributories (10% of supply at distributor) 6.4 1.6 8.0
Field water courses (27% of supply at outlet head) 16.0 4.0 20.0
Losses from field during application 13.2 3.3 16.5(30% of supply reaching the head)
Total 49.2 12.3 61.5
In any irrigation project the total losses in thecanal distribution system and field has not beenless than 50% of the head discharge. Studiesconducted in Nagarjuna Sagar Project haverevealed that only 40-60% of water released fromthe reservoir reaches the field and only 20-40% isused by the crops. The main components of waterlosses in an irrigation system are: (a) water lossesin storage-10 to 20% (b) water losses inconveyance systems -25 to 40% (c) water lossesin operation 10 to 30% and (d) water losses inapplication 45 to 70%. Irrigation efficiency isconsidered to be as low as 10-20% in someprojects in India. It is estimated that 11 millionha-m of water is contributed to ground water
recharge annually through seepage from canalsystem and the return flow from irrigation. Anoverall irrigation efficiency of 40-50% for a projectcan be considered to be high and this can beachieved only by the adoption of improvedirrigation and drainage practices based onscientific land and water management principles.In view of these heavy losses, it is necessary tofind out where and how improvement can bemade which will result in more efficient use ofirrigation water.
6.2 On-Farm development
The objective of On-Farm development is todevelop a proper water distribution system and

74 Manual on Enhancing Water Use Efficiency in Canal Commands
to obtain maximum crop production per unit ofwater from a unit land in unit time. Ungatedoutlets, huge outlets, badly constructed andpoorly maintained outlets, field channels, fieldto field irrigation lead to enormous wastage ofwater. Suitable gated outlets, junction boxes todivide the size of stream , use of water applicationcontrol devices such as syphons, spiles, canvasdam etc., increases field application efficiency.The important aspects of wasteful use ofirrigation water at farmers level are as follow:
Field to field irrigation in the absence offield channels
Escape of water to drains during transitfrom outlet to field
Improper field Leveling result into surfacerun-off
Over irrigation particularly during night
6.2.1 Components of On-Farm development
On-Farm development consists mainly thefol1owing items of work under the pipe outlets
A. Community items
Formation of field channels providingwater to each survey number
Internal irrigation channels within eachsurvey number, if the extent is large
Drop structures and distribution boxes infield channels and drains
Crossing on field channels and drainswherever required
B. Items on individual farmers holding
Providing bunds to form plots in theholding.
Land shaping to a planned grade forcultivation of light irrigated crops
Land Leveling
Efficient water-use on the farmer’s field.
6.2.3 Field Channels
The foremost requirement is the construction ofa net work of field channels of acceptable
standards and their maintenance for properdistribution of water. The topographicalconfiguration of land holdings are primaryconsiderations in the design and layout of fieldchannels. Scattered and fragmented holdingscause considerable problems. Consolidation ofholdings will help but it has become almostimpossible to accomplish under our present socialand economic conditions. The field channels areusually aligned along field boundaries except theplots are of bigger size when it is unavoidable toalign them through the plot. It is advantageousto align field channels to reduce seepage losses.
6.2.3.1 Capacity of Field Channel
The capacity of field channel depends on howlarge an area is to be irrigated, how often andhow much water is to be coveyed for eachconveyance.
A x d x 27.8Capacity of channel (l/s) =
F x H
Where, A = Area to be irrigated (ha or acre)
d = depth of water to be sent through thechannel (cm)
F = Number of days over which irrigation willbe spread
H = Number of hours of irrigation per day
Generally, the natural slope of the landdetermines the slope of the bed of the fieldchannel. The permissible velocities for varioussoils which do not cause erosion or silting aregiven in table 6.2. The entire length of the fieldchannel should have the same carrying capacityequivalent to the flow at the pipe outlet.
Table 6.2 : Permissible velocities for fieldchannels
Type of soil Maximum velocity (cm/s)
Loam, sandy loam, 60silt loam
Clay loam 65
Clay 70

Manual on Enhancing Water Use Efficiency in Canal Commands 75
6.2.3.2 Lay-out of field channel
The field channel system should be laid out so asto provide atleast one outlet for each individualfarmer. Where convenient and to minimise thelength of farm channels, additional outlets maybe provided permitting diversion directly to thefield channel bordering a holding. However eachoutlet from the field channel as far as possibleshould be a permanent gate structure withaccompanying check structure if necessary tocommand the outlet. The field channel has to beprovided with drop structures and distributionboxes to ensure diversion at full capacity at eachoutlet. The field channels as-far as possible shouldbe in the cutting. The alignment of the fieldchannel is determined by both topographic andcadastral considerations. As far as possible itshould follow field boundaries. The upstreamone quarter to one third of the field channelshould be aligned directly on the main ridge tothe extent possible.
Irrigation channels are generally constructedalong the line of the land and if the slope is steepsoil erosion takes place. Drops and chutes areconstructed to flatten channel grades, reducevelocity of water and soil erosion. In steep slops,chutes are more economical than a series of dropstructures. Similarly, water application controldevices are necessary for easy and properapplication of irrigation water. Good control ofwater will reduce the labour required to irrigateand will help to make the best use of the watersupply without wastage.
6.2.3.3 Lining of field channels
In canal irrigation as well as irrigation throughtube well or ponds, the water reaches the plantin its final lap through water courses or fieldchannels. These channels are generally smallearthen channels running along the borders ofthe fields. The loss due to seepage andevaporation which can occur in the watercourses/field channels can be staggeringly high.Width of water courses and velocity of flow isgenerally quite low. Earlier, the water courseswere maintained by cultivators and the tariff
system was based on area irrigated and not thevolume of water used. The cultivator, therefore,had hardly any interest in the efficiency of watercourse. However, recently, the enormous lossesof water in field channels has attracted theattention of irrigation authorities andconsiderable efforts are being made to constructlined water courses which would reduce waterlosses. Construction of field course channels hasbeen taken up on a large scale under thecommand area development in many major andminor irrigation projects. Since, CADAauthorities as well as minor irrigationdepartments are going to handle water courselining it would be easier to introduce modern,economical and technically feasible liningmethod on extensive scale.
6.2.3.4 Lining material
Six experimental field channels were designedfor discharge varies between 28 and 56 lps basedon the criteria of best hydraulic section for bothtrapezoidal and rectangular shapes. Five differentlining materials were: cement pointed brick lining(1:1 side slope), low density polyethylene(L.D.P.E.) overlaid with 15 cm soil cover (1.5 : 1and 2 : 1 side slopes), and with 15 cm soil coveron the bottom (rectangular section) and the sixthchannel was kept unlined (control). The steadystate seepage rates observed in these six channels(channels 1 to 6) were 1.350, 0.057, 0.121, 0.011,0.031 and 3.228 cm3/cm2/h respectively (Kumarand Singh, 2010). Based on their studies, it wasrecommended that earthen irrigation channelsshould be lined with 150 micron LDPE filmoverlaid by soil cover at 2:1 side slope
6.3 Proper farm layout, appropriate irrigationmethod and provision of drainage
Size of irrigation stream, depth of irrigation, soilinfiltration rate, land slope, method of irrigationand crop to be irrigated are the factors whichdecide the size of the individual farm plots tosecure uniform water application withoutwastage or loss of nutrients. The length of thefield should not exceed 90 m where as the widthshould not be less than 15 m. Similarly, there are

76 Manual on Enhancing Water Use Efficiency in Canal Commands
standard dimensions of basins; furrows, borderstrips etc., to suit the soil type, slope, stream size,crop to be irrigated etc. The detail of each methodis described in detail in Chapter 5. Proper landshaping with rational layout of form boundariesand land slopes permit more controlled use ofwater and increases water use efficiency. Theslope of the plots varies from 0.05% to 0.5%depending upon soil type and other factors. Inaddition for proper water management, fielddrains have to be laid out for removal of surfacewater during heavy rainfall or removal of excessirrigation water due to over irrigation or seepage
from an adjacent channel as well as percolationof irrigation water from the fields. Drains haveto be laid out at the lower end of each block orfarm to convey water to a collector drain whichin turn should discharge into a natural drainagecourse at the nearest convenient point. Spacingand layout of collector drains depends on size ofindividual blocks, topography, soil and locationof outfall into natural drainage. The design offarm drainage system has been discussed inChapter-9.
6.4 FIELD LEVELING – KEY TO ENHANCE WATER APPLICATION EFFICIENCY
Surface method of irrigation need level plots orfield with a planned grade for efficientapplication of irrigation water. It is notuncommon to find uneven lands with boulders,mounds, depression, gullis, shrub, jungle andoutcrop of rocks. When such land is to beirrigated, land development is essential. The mostimportant land development at farmers field island leveling. Low spots in a field allowconcentration of water and cause waterloggingwhereas high spots do not receive enoughmoisture for plant growth. It is difficult to controlwater in an uneven field. Unevenness of the soilsurface has a major impact on the germination,stand and yield of crops through nutrient waterinteraction and salt and soil moisture distributionpattern. Excessive slope leads to acceleratederosion. Leveling of land permits easy control anduniform application of irrigation water. If thefield or plot is well leveled, erosion is reduced,time for irrigation is saved and crop yield is alsoincreased due to uniform moisture in the entirefield. Efficiency of use of irrigation water is,therefore, increased due to proper leveling ofland.
6.4.1 Methods and equipments for leveling
Mostly farmers rely on animal power or smallmechanized equipment which an individual canown and operate. As the farmers irrigate theirfields, they observe the locations of high and low
spots on the field. Then as he prepares the fieldsbetween plantings, he tries to move soil from thehigh spots to the low ones. Over a period ofseveral years, individual fields are smoothedenough to be watered fairly well. Conventionally,farmers use plankers drawn by draft animals orby small tractors. However, farmers in Punjab,Haryana and Uttar Pradesh use tractor operatediron scrappers or leveling boards. Traditionalland leveling includes field survey, staking anddesigning the field, calculation of cuts and fillsand then using a scraper and a land plan to eventhe land. Despite all these labor-intensive efforts,desired accuracy is not achieved. Thus traditionalmethods of leveling are not only morecumbersome and time consuming but donotachieve a precise land leveling. Very often mostrice farmers level their fields under ponded waterconditions and check level by ponding water.Thus in the process of a having good leveling infields, a considerable amount of water is wasted(Rickman, 2002). It is a common knowledge thatmost of the farmers apply irrigation water untilall the parcels are fully wetted and covered witha thin sheet of water. Studies have indicated thata significant (20-25%) amount of irrigation wateris lost during its application at the farm due topoor farm designing and unevenness of the fields(Rickman, 2002). This problem is more

Manual on Enhancing Water Use Efficiency in Canal Commands 77
pronounced in the case of rice fields. Unevennessof fields leads to inefficient use of irrigation waterand also delays tillage and crop establishmentoptions. Fields that are not level have unevencrop stands, increased weed burdens and unevenmaturing of crops.
New equipment is continually being introducedwhich provides the capability for more preciseland Leveling operations. One of the mostsignificant advances has been the adaptation oflaser control in land Leveling equipment. Theequipment has made level basin irrigationparticularly attractive since the final field gradecan be very precise. Comparisons with lessprecise techniques have clearly shown that laser-levelled fields achieve better irrigation andproduction performance. The advent of the laser-controlled land Leveling equipment has markedone of the most significant advances in surfaceirrigation technology. The precision improvesirrigation uniformity and efficiency and as aresult the productivity of water and land. Theimproved productivity has shown to payeconomic dividends that easily exceed the costof the Leveling. Laser-guided equipment is beingdemonstrated and tested in different part of thecountry and this technology has become verypopular among farmers particularly in plains ofNorthern part of the country. Farmers recognizethis and therefore devote considerable attentionand resources in leveling their fields properly.
6.4.2 Laser land leveling and layout
The extent of laser leveling in South Asia iscurrently extremely small, compared with 50-80%leveling in many advanced countries (Rickman,2002; Jat et al, 2006). Land leveling can reduceevaporation and percolation losses from wheatby enabling faster irrigation times and byeliminating depressions and therefore pondingof water in depressions. This also reduceswaterlogging problems, especially on heavytextured soils. Laser leveling in Pakistan resultedin average wheat irrigation water savings of 25%in comparison with non-lasered fields whileincreasing yield by 20- 35% and reducing labour
and land preparation costs (Jat et al, 2006). Landleveling also reduces the depth of water requiredto cover the highest parts of the field and forponding for weed control in rice. Rickman (2002)found that rice yields in rainfed lowland laser-leveled fields were 24% higher than in non-lasered fields in Cambodia, and that yieldincreased with the uniformity of leveling.
Laser-controlled precision land leveling helps to:
Save irrigation water
Increase cultivable area by 3 to 5%approximately
Improve crop establishment
Improve uniformity of crop maturity
Increase water application efficiency up to50%
Increase crop yields
Facilitate management of salineenvironments
Reduce weed problems and improve weedcontrol efficiency
6.4.3 Laser land leveling
The introduction of laser leveling in the 1970’sproduced a silent revolution that has raisedpotential of surface irrigation efficiency to thelevels of sprinkler and drip irrigation (Erie andDedrick 1979). Laser-controlled land Levelingequipment grades fields to contour the land fordifferent irrigation practices. With sprinklers, aperfectly level field conserves water by reducingrunoff and allowing uniform distribution ofwater. Furrow irrigation systems need a slightbut uniform slope to use water most efficiently.Before starting the laser land leveling process, thefield should be ploughed and a topographicsurvey be carried out. One of the measures toimprove irrigation efficiency is zero-gradeLeveling for crop production. Zero-slope fieldscan be flushed or drained more quickly. Levelfields allow for a more uniform flood depth, usingless water. Benefits from precision leveling ofland extend for many years, although some minor

78 Manual on Enhancing Water Use Efficiency in Canal Commands
land smoothing may be required from time totime due to field operations and weatherconditions.
6.4.3.1 Components of laser land levelingsystem
The laser leveler involves the use of laser(transmitter), that emits a rapidly rotating beamparallel to the required field plane, which ispicked up by a sensor (receiving unit) fitted to atractor towards the scraper unit. The signalreceived is converted into cut and fill leveladjustment and the corresponding changes in thescraper level are carried out automatically by ahydraulic control system. The scraper guidanceis fully automatic; the elements of operator errorare removed allowing consistently accurate landleveling. The set-up consists of two units. TheLaser transmitter, which is mounted on a highplatform. It rapidly rotates, sending the laser lightin a circle like a lighthouse except that the light isa laser, so it remains in a very narrow beam. Themounting has an automatic leveler built into it,so when it’s set to all zeros, the laser’s circle oflight is perfectly level. A laser-controlled landleveling system consists of the following fivemajor components: (i)Drag bucket; (ii) Lasertransmitter; (iii) Laser receiver; (iv) Control boxand (v) Hydraulic system
i) Drag bucket
The drag bucket can be either 3-point linkagemounted on or pulled by a tractor. This systemis preferred as it is easier to connect the tractor’shydraulic system to an external hydraulic ramthan to connect the internal control system usedby the 3-point-linkage system. Bucket dimensionsand capacity will vary according to the availablepower source and field conditions.
ii) Laser transmitter
The laser transmitter mounts on a tripod, whichallows the laser beam to sweep above the field.Several tractors with laser unit and drag bucketcan work from one transmitter with guidancefrom laser receiver.
iii) Laser receiver
The laser receiver is a multi-directional receiverthat detects the position of the laser referenceplane and transmits this signal to the control box.The receiver is mounted on a manual or electricmast attached to the drag bucket. It is mountedon the scraper. A set of controls allow the laserreceiver to control the height of the bucket on thescraper.
iv) Control box
The control box accepts and processes signalsfrom the machine mounted receiver. It displaysthese signals to indicate the drag buckets positionrelative to the finished grade.
v) Hydraulic control system
The hydraulic system of the tractor is used tosupply oil to raise and lower the leveling bucket.The oil supplied by the tractor’s hydraulic pumpis normally delivered at 2000-3000 psi. As thehydraulic pump is a positive displacement pumpand always pumps more oil than required, apressure relief valve is needed in the system toreturn the excess oil to the tractor reservoir. Ifthis relief valve is not large enough ormalfunctions, damage can be caused to thetractors hydraulic pump.
6.4.3.2 Operational aspects of laser land leveller
Laser-controlled grading technology is currentlythe best method to grade a field. The systemincludes a laser-transmitting unit that emits aninfrared beam of light that can travel up to 700min a perfectly straight line. The second part of thelaser system is a receiver that senses the infraredbeam of light and converts it to an electricalsignal. The electrical signal is directed by a controlbox to activate an electric hydraulic valve. Severaltimes a second, this hydraulic valve raises andlowers the blade of a grader to keep it followingthe infrared beam. Laser leveling of a field isaccomplished with a dual slope laser thatautomatically controls the blade of the landleveler to precisely grade the surface to eliminateall undulations tending to hold water. Lasertransmitters create a reference plane over the

Manual on Enhancing Water Use Efficiency in Canal Commands 79
work area by rotating the laser beam 360 degrees.The receiving system detects the beam andautomatically guides the machine to maintainproper grade.
6.4.3.3 Steps in laser land Leveling
i) Ploughing of field: Ploughing of a fieldshould start from the center outwards. It ispreferable to plough the field when the soilis slightly moist, because if the soil isploughed dry a significant increase intractor power is required and large clodsizes may remain. If the soil is very dry, aone-way disc or mould board plough maybe used. Disc harrow implements are idealfor second workings. All surface residuesneed to be cut up or removed to facilitatethe transport of soil.
ii) Topographic survey: After ploughing, atopographic survey can be conducted torecord the high and low spots in the field.Adjust the individual positioning of thetripod legs until the base plate is level. Attachthe laser transmitter to the base plate. If thelaser is not well leveled, adjust the individualscrews on the base of the transmitter to getthe level indicator (bubble) at the center.Most lasers will not rotate unless thetransmitter is leveled. When transmitter isleveled, attach the receiver to the pole andactivate the alarm to take field observations.All measurements should be recorded in afield book. The mean height of the field iscalculated by taking the sum of all thereadings and dividing by the number ofreadings taken. It is advisable to take thereading at a regular interval of 15 m x 15 mto achieve greater precision in land leveling.
iii) Steps in the process of leveling of field : Following steps are taken for precise levelling of the field
Step1 Set the average elevation value of the field in the control box
Step 2 The laser-controlled bucket should be positioned at a point that represents the mean heightof the field
Step 3 The cutting blade should be set slightly above ground level (1.0-2.0 cm).
Step 4 The tractor should then be driven in a circular direction from the high areas to the lowerareas in the field.
Step 5 To maximize working efficiency, as soon as the bucket is near filled with soil the operatorshould turn and drive towards the lower area. Similarly as soon as the bucket is nearempty the tractor should be turned and driven back to the higher areas
Step 6 When the whole field has been covered in the circular manner, the tractor and bucketshould then do a final leveling pass in long runs from the high end of the field to the lowerend
Step 7 The field should then be re-surveyed to make sure that the desired level of precision hasbeen attained
iv) Tillage practices to maintain the level offield after Leveling
Traditional tillage practices often move the soilin one direction — outward from the center ofthe field. Over time, such soil movement createsan uneven soil surface resulting in a low spot inthe centre of the field. The center of the field oftenremains wetter and tillage operations will oftenbe delayed with high incidence of weeds. After
leveling, the field should be ploughed beginningfrom the center and working out toward the fieldboundary. Initially, a single pass should be madein the centre of the field to move the soil to theright. The tractor is then repositioned at the endof the first run so as to plough the second runoutwards from the furrow created. The thirdplough run then moves the previous ploughedsoil back into the depression in the center of the

80 Manual on Enhancing Water Use Efficiency in Canal Commands
field. The fourth run then refills the remainingfurrow leaving the center of the field level. Thefield should then be ploughed on either side ofthe land until a margin equal to the width of theheadland is left. The remainder of the field is thenploughed in a continuous pattern with the finalrun leaving a drainage furrow beside the bund.
6.4.4 Impact of laser leveling
Laser leveling of agricultural land is a recenttechnology development in India. Preciseleveling by laser leveler has the potential toenhance water and other precious inputs withoutdeleterious effect of environment. Popularisationof this technology among farmers in aparticipatory mode on a comprehensive scale,therefore, needs appropriately focused attentionon priority basis along with requisite supportfrom researchers and planners. Laser leveling isevidently one of the ways by which we canaddress these issues of conservation agricultureto a great extent. The results reported by differentworks and agencies are quite encouraging. Themajor effects on different aspect are summarizedbelow:
i) Increase in cultivable area
Smoothness of the land surface permits largerplot sizes for irrigation. This helps in saving
precious land, and also adds additional land afterremoval of extra bunds and channels. Plot sizesin different villages have increased from 33 to80% when laser leveled as compared to originalplot sizes. The plot size for the wheat cropincreased from 50 m x 12 m (before leveling) to50 m x 20 m (after laser leveling) whereas in ricecrop plot size increased from 50m x 25m to 50mx50m (Rajput and Patel, 2003). In anotherinvestigation, it was found that 2 to 3% additionin the cultivable area is possible due to laserland leveling (Khan,1986). Rickman (2002) hadalso reported that about 5 to 7% cultivablearea could be increased due to precision landleveling. Increasing field size from 0.1 ha to 0.5ha results in the increase of the farming areafrom 5 to 7 percent. This increase in farming areagives the farmer the option to reshape thefarming area that can reduce operating time by10 to 15 percent (Rickman, 2002). Another studyconducted under USAID project at the farmers’fields in western Uttar Pradesh, revealed thatabout 3 to 6% additional land areas could bebrought under cultivation in canal and tubewell irrigated areas respectively, however, thearea increase varies from field to fielddepending on plot size and divisions (Table 6.3and 6.4).
Table 6.3 : Effect of laser land leveling on plot size for wheat and rice
Village Field No. Wheat Rice
Polt size (mxm) Polt size (mxm)
Before levelling After levelling Before levelling After levelling
Lakhan 516 50x12 50x20 50x25 50x50
456 30x12 50x12 50x10 50x25
745 25x14 45x14 40x15 60x25
Masanta 364 60x11 60x20 60x15 80x25
ii) Saving in irrigation water
A significant reduction in total water use in wheatas well as rice was recorded due to precision landleveling compared to traditional land leveling.The total water use in wheat and rice in laser
leveled field was reduced to 49.5% and 31.7%,respectively (Jat et al. 2003, 2005). The estimatedtotal water use of wheat crop was 5270 m3 ha-1
and 3525 m3 ha-1 in traditionally leveled field andlaser leveled fields respectively. In raised bed

Manual on Enhancing Water Use Efficiency in Canal Commands 81
Table 6.4 : Estimated additional area which can be brought under cultivation by precision landleveling in selected farmers' fields in western Uttar Pradesh
Parameters Traditional land Laser land
levelling levelling
Canal Tube well Canal Tube well
irrigated irrigated irrigated irrigated
Basin size (mxm) 40x30 30x20 50x50 40x30
Basin area (m2) 1200 600 2500 1200
Area under bund & channel (m2 ha-1) 600 1200 300 600
Additional area brought under cultivation (%) - - 3 6
planted wheat, about 26% water can be savedthrough laser land leveling. In rice, total wateruse was estimated as 6950 m3 ha-1 and 9150 m3
ha-1 under precision land leveling and traditionalland leveling respectively. From other on-farminvestigations on wheat in villages Masauta andLakhan, 338 to 808 m3 ha-1 saving in total wateruse was found (Rajput and Patel, 2003). Studiesconducted by RWC and PDCSR, Modipuram atthe 71 farmers’ fields of western Uttar Pradeshrevealed that more than 61 farmers saved about5-10 ha-cm water in wheat crop and about 10-15ha-cm water in transplanted rice crop (Jat et al,2006) . Tyagi (1984) reported the applicationdepth values of 3.9 and 9.7 cm at leveling index(LI) of 0.75 cm. and 6.75 cm, respectively in wheatcrop under sodic soils of Haryana. Further, thedistribution efficiency obtained with variousdepths of application (4 to 12 cm) showed thatdistribution was more uniform (> 90%) in plotswith an average LI of 0.75 cm and poor (< 50%)in plots with an average LI of 6.75 cm. However,with increasing depth of water application, thedistribution improved in poorly leveled plots as well.
iii) Improvement in irrigation and nutrient-useefficiency
The foremost objective of laser land leveling is toimprove application and distribution efficienciesof irrigation which ultimately leads to higherwater productivity. The distribution efficiency ofapplied water in wheat in sandy loam soil wassignificantly higher under precision land
Leveling compared to traditional leveling (Jat etal. 2003, Jat et al 2006). The application anddistribution efficiencies of applied water wereimproved significantly under precision landleveling compared to traditional leveling (Sattaret al. 2003 and Rajput et al. 2004). Laser landLeveling facilitate uniform application of waterunder irrigated condition create an opportunityfor uniform distribution of nutrients. The uptakeof applied nutrients in a sandy loam soilincreased significantly under precision landleveling compared to traditional land leveling.A significant increase in the uptake efficiency aswell as apparent recovery fraction of the appliedN, P and K in a typicUstochrept in rice wasobserved due to precision land leveling (Pal et al.2003). Choudhary et al. (2002) observed higherfertilizer use efficiency in wheat in fields underlaser land leveling compared to conventionalleveling. In on-farm investigations carried out at71 locations in western Uttar Pradesh, significantimprovement in nitrogen-use efficiency in rice-wheat cropping system was recorded andincrease in NUE were found from 45.11 to 48.37and 34.71 to 36.90 kg grain kg-1 applied nitrogenin rice and wheat, respectively.
iv) Enhancement of water productivity
In an on-station investigation at PDCSR,Modipuram, a significant reduction in water use,and marked improvement in water productivityin rice-wheat cropping system was recorded dueto precision land leveling compared to traditional

82 Manual on Enhancing Water Use Efficiency in Canal Commands
leveling. It was recorded that with similar fertilitylevels and land configurations, the waterproductivity of rice and wheat increased from0.55 and 0.82 to 0.91 and 1.31 kg grain m3 water,respectivel (Jat et al. 2005). Raised bed plantingfurther improved the productivity of wheat inlaser leveled fields. On-farm investigations,carried out under USAID project in Meerut,Baghpat, Muzaffarnagar and Ghaziabad districtsof western Uttar Pradesh in a rice-wheat croppingsystem, revealed significant improvement inwater productivity of rice and wheat under laserland leveling compared to traditional landleveling. Field trials were conducted in riceseason to evaluate the interactive effects of riceplanting methods and land leveling on 16farmers’ fields inWestern Uttar Pradesh. Resultsindicated that precision land leveling improvesthe yield and water productivity of rice grownas puddled transplanted or unpuddled directseeded rice. The total saving in irrigation waterin DSR rice over the puddled transplanted ricewas nearly 25cm-ha shared equally betweendirect seeding and precision land leveling. Thedescriptive statistical analysis of 71 locationsrevealed that the coefficient of variation in waterproductivity decreased in rice and wheat from10.84% and 8.97% to 9.72% and 7.89%respectively due to precision land leveling.Further, the average irrigation water productivityof rice and wheat was increased from 0.49 and1.02 to 0.61 and 1.22 kg grain m-3 water. With theuse of precision land leveling, significant increasein water-use efficiency of seed cotton wasobserved from 36.9 to 63.1% (Sattar et al. 2003).The increase in WUE was attributed to lessrequirement of irrigation under precision leveling(54.80 cm) as compared to traditional leveling(74.65 cm). Choudhary et al. (2002) also reportedhigher water use efficiency (1.67) under precisionleveling compared to conventional leveling (1.10)under on-farm investigations.
v) Increase in crop yield
A considerable increase in yield of crops ispossible due to laser land leveling. Results of anexperiment carried out at PDCSR, Modipuram
showed a perceptible yield advantage of laserland leveling over traditional leveling (Jat et al.2006). They reported that the grain yield of wheatincreased from 4.3 t ha-1 under traditionalLeveling to 4.6 t ha-1 through precision leveling.The improvement in yield of wheat under laserland leveling was associated with overallimprovement in the growth and yield attributingcharacters of the crop due to better environmentfor the development of the plants under well-leveled field. In another investigation atModipuram, Pal et al. (2003) reported a significantimprovement in growth and yield of uplandpaddy due to precision land leveling comparedto traditional land leveling. Farmers’participatory research under USAID project inwestern Uttar Pradesh revealed a marked yieldimprovement in rice-wheat cropping system duethe laser land leveling. The average yield levelsof rice and wheat respectively, being recorded4.84 and 5.53 t ha-1 under laser land leveling weremarkedly superior to traditional land levelingbeing 4.51 and 5.21 t ha-1 (Table 6.5). Further, thecoefficient of variation in yield of rice (9.58%) andwheat (7.86%) between farmers was decreasedwith laser land leveling compared to traditionalland leveling being 10.24 and 8.82%, respectively.
Findings of a long-term study (Rickman, 2002)showed 24% increase in yield of rice due toprecision land leveling over traditional landLeveling at the same level of variety and fertilizeruse. Further, a strong correlation was foundbetween the levelness of the land and crop yield.Sattar et al. (2003) reported a reduction in the yieldof seed cotton up to 20.1% on traditionally leveled(TL) fields compared to precision leveling (PL)maily due to (i) low plant population in TL,(ii) greater variation in plant height from averageplant height (tallness and shortness of the plantswithin the TL field declined fruit bearing capacityof the plants), and (iii) late crop maturity orprolonged vegetative growth due to excessivewater applied to the TL fields. Choudhary et al.(2002) demonstrated the effect of laser landleveling on the productivity of wheat sown ondifferent dates. In general, as the time of sowing

Manual on Enhancing Water Use Efficiency in Canal Commands 83
delayed, the yield decreased. But, the marginaldecrease in the yield due to delayed seeding(from 1st to 2nd and 2nd to 3rd date of seeding)was much higher in traditionally sown wheat(774.5 and 1425.5 kg ha-1) compared to seedingunder laser land leveling (346 and 581 kg ha-1).Tyagi (1984) reported that the yields were higherby 50% in precision-leveled plots compared totraditional leveled plots. In a similar studyKhepar (1982) observed a decrease of 270 kg ha-
1 for each unit increase in topographic indexfrom 0.5 to 2.82 cm. Recently, Jat et al, (2009)reported 6 percent increase in system yield ofrice-wheat rotation with a saving of 15 percentin water use and net returns of about 143 US$in laser land leveling compared to traditionalleveling (Table 6.6).
Field demonstrations with precision land levelingwere conducted in the districts of Bathinda,Mansa and Muktsar by, Regional ResearchStation, Bathinda in rice (PAU-201), Bt Cottonhybrid (RCH-134) and chilli (CH-1), wheat (PBW343), potato (Kufri Bahar) and cauliflower (Punjab
Katki) during 2008-09. The results are presentedin Table 6.7 indicated that during kharif, there was6.5, 10.5 and 14.6 per cent increase in yield and21.4, 20 and 25 per cent saving in water in rice,cotton and chilli, respectively with laser levelingcompared to conventional method of leveling.The laser land leveling resulted in an additionalmonetary benefit of 4.8 per cent (Rs. 2055/-) perhectare without any additional cost of cultivationin rice. Similarly, there was additional benefit of10.4 per cent (Rs. 5820/-) per hectare over theconventional method at the same cost ofcultivation in cotton. Interestingly, in chilli, theadditional monetary benefit was 21.6 per cent (Rs.13080/-) per hectare over conventional method.
During rabi, the mean wheat yield increase was8.0 % with 31.4 % water saving over theconventional technology. Tthe laser levelingincreased the tuber yield and curd yield by 10percent where as the saving in water was to thetune of 20 percent both in potato and cauliflowercompared to conventional leveling. Though therewas no monetary benefit with this technology in
Table 6.5 : Water productivity of rice-wheat cropping system due to land leveling in western UttarPradesh
Parameters Grain yield (t ha-1)*
Rice Wheat
Laser Traditional Laser Traditionalleveling leveling leveling leveling
Minimum 3.90 3.50 4.60 4.20
Maximum 5.70 5.44 6.21 6.12
Average 4.84 4.51 5.53 5.21
CV (%) 9.58 10.24 7.86 8.82
Water productivity (kg grain m3 water)*
Minimum 0.49 0.38 1.00 0.83
Maximum 0.73 0.60 1.38 1.18
Average 0.61 0.49 1.22 1.02
CV (%) 9.72 10.8 7.89 8.97
*Data is mean of 71 farmers

84 Manual on Enhancing Water Use Efficiency in Canal Commands
wheat, however, additional monetary benefit of13.1 and 10.4 percent was obserbed in potato andcauliflower respectively (Table 6.7). It can,
therefore, be concluded that precision levelingis the most effective technique to improveproductivity of surface irrigated crops
Table 6.6 : Effect of levelling on grain yield, water productivity and net returns of Rice-Wheat System
Table 6.7 : Effect of Laser land leveling on water saving, yield and monetary benefits in differentcrops during 2008-09 in Punjab
Parameters Land leveling Rice Wheat RW system
Grain yield (t ha-1) PLL 6.42 4.69 11.11TL 6.15 4.32 10.47
Total water use (cm ha-1) PLL 155.5 32.5 187.0TL 179.0 36.0 215.0
Water productivity (kg grain m3 water) PLL 0.29 1.13 0.43TL 0.25 0.95 0.36
Cost of production(US$ ha-1) PLL 590 374 955TL 593 387 978
Net returns (US$ ha-1) PLL 385 788 1173TL 336 694 1030
Parameters CT PLL Benefits Percent Remarks in increase
quantity
RiceWater use(m3/ha) 15750 12375 3375 21.4 Uniform distribution ofYield(kg/ha) 8178 8708 530 6.5 water, better plant standMonetary benefits (Rs/ha) 42484 44539 2055 4.8 with laser levelingCottonWater use(m3/ha) 3750 3000 750 20.0 Uniform distribution ofYield(kg/ha) 2875 3178 303 10.5 water, better germinationMonetary benefits (Rs/ha) 56120 61940 5820 10.4 with laser levelingChilliWater use(m3/ha) 8250 6000 2250 25.0 Uniform distribution ofYield(kg/ha) 17800 20400 2600 14.6 water, better plant standMonetary benefits (Rs/ha) 60454 75534 13080 21.6 with laser levelingWheatWater use(m3/ha) 4375 3000 1375 31.4 Uniform distribution ofYield(kg/ha) 5148 5560 412 8.0 water, better germinationMonetary benefits (Rs/ha) 28899 28098 - - with laser levelingPotatoWater use(m3/ha) 6000 4800 1200 20.0 Uniform distribution ofYield(kg/ha) 25000 27500 2500 10.0 water, better germinationMonetary benefits (Rs/ha) 42095 47595 5500 13.1 with laser levelingCauliflowerWater use(m3/ha) 6000 4800 1200 20.0 Uniform distribution ofYield(kg/ha) 16200 17900 1700 10.5 water, better plant standMonetary benefits (Rs/ha) 63118 69693 6575 10.4 with laser leveling
CT : Conventional leveling; PLL: Precision Laser Leveling
PLL : precision land leveling; TL: Traditional leveling (Source: Jat et al, 2009)

Manual on Enhancing Water Use Efficiency in Canal Commands 85
vi) Environmental benefits of laser landleveling
Laser land leveling can certainly minimize yieldvariability at farm level, optimize input-outputrelation and save resources like soil, water andenergy. If adopted on a large scale, the laserleveling would help in improving the quantityand quality of ground water because of improvedwater productivity and less accumulation anddeep percolation of water-soluble pesticides andchemicals, especially nitrate. It is estimated thatadoption of precision land leveling system to justtwo million hectare of area under rice-wheatsystem could save 1.5 million hectare-meter ofirrigation water and improve crop yieldsamounting to US$ 500 million in three years.Rickman (2002) reported 10-15% reduction inoperating time of agricultural machinery in thelaser-leveled fields as compared to traditionalleveling. Laser leveling thus may prove to be animportant technology in reducing the consumptionof fossil fuel for various farming operations, whichwill bring a direct tangible and intangible benefitto farmers. It is estimated that extension of laserassisted precision land leveling system to just twomillion hectares of area under rice-wheat systemcould save diesel up to 200 million liters (equal toUS $1400 million) and reduce GHG emissionsequivalent to 500 million kg.
In spite of several direct and indirect benefitsderived from laser land leveling technology, it isyet to become a popular farming practice in ourcountry. For accelerating its popularisation andlarge-scale adoption, it requires a number of well-considered and synchronized research, extensionin participatory mode and policy initiativeskeeping in view the long-term sustainability ofour production systems. A judicious blendingof appropriate research and policy strategies inconjunction with various resource conservationtechnology options have the necessary potentialto bring about a significant change in agriculturalproduction scenario of country.
References :
Choudhary, M.A, Mushtaq, A, Gill, M, Kahlown, Aand Hobbs, P.R. 2002. Evaluation of resourceconservation technologies in ricewheat systemof Pakistan. In: Proceedings of the Internationalworkshop on developing an action program for farmlevel impact in rice-wheat system of Indo-Gangeticplains, 25-27 September 2000, New Delhi, India.Rice-wheat Consortium Paper Series 14, NewDelhi, India. Ricewheat Consortium for theIndo-Gangetic Plains. 148 pp.
Erie, L.J and Decrick, A.R. 1979. Level basin irrigation:A method for conserving with and Labor.USDA Farmers' Bulletin 2261, 23.
Jat, M.L, Pal, S.S, Subba Rao, A.V.M. and Sharma, S.K.2003. Improving resource use efficiency inwheat through laser land leveling in anustochrept of Indo-Gangetic plain. In: NationalSeminar onDevelopments in Soil Science, 68thAnnual Convention of the Indian Society of SoilScience, November 4-8,2003, CSAUAT, Kanpur(UP).
Jat, M.L, Sharma, S.K and Gupta, R.K, Sirohi, K andChandana, P. 2005. Laser land leveling: theprecursor technology for resource conservationin irrigated ecosystem of India. In: ConservationAgriculture-status and prospects (Eds., Abrol,I.P., Gupta, Raj K. and Malik, R.K.), CASA, NewDelhi, p. 145-154.
Jat M.L., Chandna, P, Gupta, R.K, Sharma, S.K. andGill, M.A. 2006. Laser Land Leveling: APrecursor Technology for ResourceConservation. Rice-Wheat ConsortiumTechnical Bulletin Series 7.New Delhi, India:Rice-Wheat Consortium for the Indo-GangeticPlains. pp 48.
Jat, M.L. Gathala, M.K, Ladha, J.K, Saharawat Y.S, Jat,A.S. Kumar, V, Sharma, S.K, Kumar, V andGupta, R. 2009. Evaluation of precision landleveling and double zero-till systems in the rice–wheat rotation: Water use, productivity,profitability and soil physical properties. Soiland Tillage Research, 105 (1): 112-121.
86 Manual on Enhancing Water Use Efficiency in Canal Commands
Khan, B.M. 1986. Overview of water management inPakistan. Proceedings of Regional seminar for
SAARC member countries on farm water
management. Govt. of Pakistan. P. 8.
Khepar, S.D., Chaturvedi, M.C. and Sinha, B.K. 1982.Effect of precise leveling on the increase of cropyield and related economic decision. Journal ofAgricultural Engineering. 19(4): 23-30.
Kumar, A and Singh, Rajbir. 2010. Plastic lining forwater storage structues. Technical Bulletin No.50. DWM, Bhubaneswar.
Pal, S.S., Jat, M.L. and Subba Rao, AVM. 2003. Laserland leveling for improving water productivityin rice-wheat system. PDCSR Newsletter.
Rajput, T.B.S. and Patel, N. 2003. Laser land leveler se
khet samatal karayiye, pani bachayiye aur paidavar
badhayiye. Folder (Hindi). Water TechnologyCentre, Indian Agricultural research Institute,Pusa New Delhi.
Rajput, T.B.S., Patel, N. and Agrawal, G. 2004. LaserLeveling- A tool to increase irrigation efficiencyat field level. J. Agril. Eng. 41(1): 20-25.
Rickman, J.F., 2002. Manual for laser land leveling,Rice-Wheat Consortium Technical BulletinSeries 5. New Delhi-110 012, India: Rice-WheatConsortium for the Indo-Gangetic Plains. pp.24.
Sattar, A., Khan. F.H. and Tahir, A.R. 2003. Impactof precision land leveling on water saving anddrainage requirement. J. AMA. 34: 39- 41.
Tyagi, N.K. 1984. Effect of land surface uniformity onirrigation quality and economic parameters insodic soils under reclamation, Irrigation Sci. 5:151-166.

Manual on Enhancing Water Use Efficiency in Canal Commands 87
7.0 OPTIMUM UTILIS7.0 OPTIMUM UTILIS7.0 OPTIMUM UTILIS7.0 OPTIMUM UTILIS7.0 OPTIMUM UTILISAAAAATION OF IRRIGTION OF IRRIGTION OF IRRIGTION OF IRRIGTION OF IRRIGAAAAATION WTION WTION WTION WTION WAAAAATER FORTER FORTER FORTER FORTER FORENHANCED LENHANCED LENHANCED LENHANCED LENHANCED LAND AND WAND AND WAND AND WAND AND WAND AND WAAAAATER PRODUCTIVITYTER PRODUCTIVITYTER PRODUCTIVITYTER PRODUCTIVITYTER PRODUCTIVITY
RRRRRajbir Singh and Pajbir Singh and Pajbir Singh and Pajbir Singh and Pajbir Singh and P.S. Br.S. Br.S. Br.S. Br.S. Brahmanandahmanandahmanandahmanandahmanand
Water is a scarce and expensive resource and itis, therefore, necessary to use this resource mostefficiently. In big and medium irrigation projects,the water is transported to large distances andon the way to the field a large portion of it is lostmainly due to seepage from the system,evaporation from the open water surface. It hasbeen estimated that under semi-arid and medium
to light textured soil conditions, the net utilizationis only 30% of the total water delivered when theentire system is unlined. When the whole systemis lined than the net utilization has increased to50% (Table 7.1). World over, on an average, only45% of the total delivered water is used by thecrop (Fig. 7.1).
Table 7.1 : Losses (%) and net utilization of irrigation water under different irrigation system
Systems Canals Distri- Field Field Total Netbutories water losses losses utilization
courses
Entire system unlined 15 7 22 27 71 29
Only canals lined 4 7 25 30 66 34
Canal and distributory lined 4 2 26 32 64 36
Whole system lined 4 2 6 42 54 46
Whole system lined and 4 2 6 6 18 82
sprinkler method
Fig. 7.1 Average irrigation water losses
7.1 Optimum utilisation of irrigation water
Optimum utilisation of irrigation water meansthe using of irrigation water for achievingmaximum crop production without excessivelosses in the distribution system and applicationlosses in the field. Maximum crop productionshould be obtained from a unit of land, per unitof water in a unit time. For optimum utilisation
of irrigation water, the supply of water to thefarmer should be dependable, timely andadequate. Reducing losses in the field andapplying correct quantity of water based on cropwater requirements will be of little value if thedesign and operation of the irrigation system isnot geared for meeting the actual fieldrequirements to ensure delivery of the properquantities of water to the field at the right time.
7.2 Improvements to the irrigation system
In the operation of an irrigation system, waterlevel control and water flow control are two mostimportant functions. These are achieved bymeans of appropriate hydraulic structures andtheir operation. The operation of these structuresis now done manually. In major irrigationsystems in the country, outlets are ungated, outletsizes are either too large or inadequate to meetthe crop water requirements; water courses are

88 Manual on Enhancing Water Use Efficiency in Canal Commands
either absent and field to field irrigation ispracticed or water courses are constructed badlyand poorly maintained leading to enormouswastage of water. In south India, water flows arecontinuous and variable and so regulated fromthe reservoir to the outlet. In this process largenumber of gate controls are provided and becomeunmanageable. Because of large number of suchoperations are to be done manually, they are notbeing operated in the manner they are designedand intended to be operated. In view of this,water regulation is inefficient and the farmerstamper the gate controls and draw water far inexcess of their allocation.
The effective solution of tackling this problem isto reduce the number of gates to a manageablenumber and shifting the last control from pipeoutlet to distributory head. If this is done, the flowabove this point will be continuous, variable andregulated. Below this point proportional dividerscan be provide which supply water to each offtake in proportion to the area irrigated by it. Theflows will be at full supply level of the channel,when the control is ‘on’ and flow completelyclosed when contro1 is ‘off’. In view of this, thetendency of the farmers to tamper with thesluices, over draw and wastage of water isavoided. Another alternative is to providestructures. This will reduce considerably humaninvolvement in the operation of the canal system.If gates are not provided, it is necessary to controlthe water levels in the main and branch canals(conveyance system) and in the distributories andminors (distribution system). In the conveyancesystem, water levels are maintained by regulationand in the distribution system by running thecanals full whenever they are open. It means thatthe main and branch canals run continuouslywith regulation flows to maintain constant levelsand in distributories and minors runintermittently with flow whenever open andcompletely empty when ‘off’. The main systemreceives the water from the head regulator. Basedon requirements of irrigation water, flows areregulated at the head regulator and the depth offlow in the canal depends on the quantity of water
released. At low flows, water depth in the canalmay be low far supply to distributory off takes.Control structures are, therefore, necessary. Thecommon control structures to control water levelare the cross-regulators and duckbill weir.
Distributories receive water from the mainsystem through offtake sluices. The off-take sluiceat the head of a distributory is a rguIatingstructure because the flow is regulated at thispoint and operated for ‘on’ and ‘off’ supplies indistributories. They are normally operated on anintermittent basis. From the distributory,proportional distribution of water takes placethrough ungated structures such as proportionaldistributor, open flume, tail cluster, ungated pipeoutlet, orifice semi-module etc. All the minor andwater courses receive flows proportional to thearea served. Water flows are controlled by off-take sluice and proportional division structures.Operation of the structures is needed only at thecross regulator and off-take sluice and inexceptional cases the duckbill weir.
The measurement of flow is a key aspect of anirrigation system. The flows in the irrigationsystem have to be measured regularly at variouslocations in canals during the irrigation season.Too much flow drawn in the upstream outletsmay result in less water being available to tailenders, damage canals and create drainageproblems. The purpose of flow measurement isto monitor flows in canals i.e. to know if the flowsin different parts of the system are as scheduled,to know the total quantity of water delivered tothe system over a period of time; to set gates atoff-take sluices and to modify and adjustoperation of the system.
Too little flow in the canal may lead to unequaldistribution of water and interference from thewater users. To maintain correct flow and itsmonitoring, measurements of flow in the maincanal and distributories periodically is essential.For this purpose, the two commonly usedmethods are (i) flow measurement withstructures and low measurement with stage

Manual on Enhancing Water Use Efficiency in Canal Commands 89
discharge curve (ii) the second method requiresonly a gauge for measuring water depth fromwhich discharge can be found. Any irrigationsystem provided with facilities for water levelcontrol, water flow control and for monitoringflows in canals will help to deliver the exactquantity of water required for the crop and avoidswastage of water.
7.3 Lining the carrier system
Percolation and seepage are two main losses inconveyance system as described earlier. The otherlosses in the distribution system are throughevaporation, weed consumption, operational andaccidental losses. Rapid changes in water demandpattern which cannot be met in time by adjustingreleases form head works or by effectiveredistribution with in the system results in non-productive release into drain channels throughescapes and this is purely an operational loss.Spillage by overtopping of canal bank, breaches,incorrect or unresponsive gate setting especiallyduring night irrigation are accidental losses. Foroperational and accidental losses, allowance of10- 15% in fully lined distribution system andhigher percentage in unlined system is provided.
The methods to reduce conveyance losses are bylining the bed and sides of canal, eradication ofweeds, reduction of wastage from escapes andtail ends. If the financial resources do not permitlining the entire length of the conveyance system,lining may be limited to selected canal reachesidentified to be heavy in seepage losses or whichare vulnerable for breaching.
7.3.1 Plastic film as lining material
The use of plastic films as a lining material hasoffered tremendous scope as lining materialwhich provide an impervious lining thus preventwater losses due to seepage (Anonymous, 1982).The performance of these films as lining materialhas been found very satisfactory. These liningsusing Poly Vnyl Chloride (PVC) and LowDensityPolyethylene (LDPE) film have been triedexperi-mentally. Out of all the types tested so far,LDPE film appears to be the best whereas, PVClining has several limitations. It cannot be
manufactured in wide width and, further, thestability of this film is hampered by the migrationof plasticizers, which are essential for ex-trudingflexible PVC film. In India, where plasticmaterials are always sold on weight basis, PVCfilm becomes too expensive compared to LDPEfilm. Due to its higher specific gravity, PVC filmgives 40% less film for a given weight comparedto LDPE film. LDPE film lining which had beentried on an experimental basis for the past severalyears is now extensively used in states like WestBengal, Gujarat, Rajasthan, Madhya Pradesh,Punjab, Haryana and the irrigation departmentsof other states (Singh and Kumar, 2007; Kumaret al, 2008; Kumar and Singh, 2010). Theexperience indicates that lining with plastic filmsis a convenient and economical proposition.
7.3.2 Role of plastic film (Agri-film) in canallining
The use of plastic films (Agri-film) as a liningmaterial was introduced in India as far back as1959 in canal system. More than 10000-km lengthof canals in different irrigation projects has beenlined with LDPE films (Anonymous, 1985). Thisprevents water losses due to percolation andthere is tremendous scope in the years to come.Basically, Agri-film is a tough, wide width blacklow-density polyethylene (LDPE) film tailormade for lining applications. Agri-film ismanufactured by blown film extrusion techniquefrom virgin Indothene grade 22F A002 and hasexcellent mechanical properties which meets 1SIspecification of LDPE films as per IS: 2508-1984.Agrifilm has got excellent water barrierproperties, very good blend of physicalproperties like tensile-impact strength coupledwith good weatherability and chemical resistanceproperties.
Numerous studies conducted abroad and in Indiashows that plastic material is quite effective inlining the canal system. The plastic material ofpolyethylene or poly vinyl chloride (PVC) iswidely adopted in lining of canals. Heat weldingof polyethylene and PVC is possible by heated

90 Manual on Enhancing Water Use Efficiency in Canal Commands
metal plates, hot gas welding and sonic welding.Polyethylene and PVC are two crystallinepolymers that are used as liners for waterconservation. Polyethylene provides the lowtemperature flexibility and toughness needed formost liner applications. The most desirable waterbarrier characteristics of plastic film arementioned below:
Effective means of water barrier to reduceseepage
Resistance to deterioration by soil microorganisms, climatic parameters (heat, air,sunlight, wind) and subgrade movement
Resistance to weatherability, mechanicalpuncture and worm attack
Ease of installation and transportabilitywith respect to the use at the site
Less maintenance requirement and bettereconomic feasibilityproperties.
7.3.3 Research findings of lining with Agri-film
LDPE film has been found to be cheap, promisingand effective method for minimizing seepagelosses. LDPE film layer minimizes damage towater bodies due to burrowing animals. For smallwater bodies like small canal, the construction isalso quick and polyethylene film can be laid evenin running canals during closure periods ofrotation. The breaches which were frequent inthese canals either due to rodents or due to soilcharacteristics have been practically eliminatedafter lining. There is no effect on canal lining dueto alternative wet and dry conditions. Rodentsgenerally bore holes after closure of canals. Butin case of vertically laid polyethylene film, thenibbling even parts of film are minimum. Even ifthe hole is dug by rodents and the film pierced,the breach does not get widened easily as the holegets plugged by the sliding earth.
Long-term experiments have been conducted atIrrigation and Power Research Institute (IPRI),Amritsar with LDPE film (Anonymous, 1985).The permeability of LDPE film was determinedin permeability cylinders at a head of 3.65 meter,
and the permeability was found to be practicallynil for 100 micron (400 gauge, 0.1 mm) LDPE filmeven after 12 years of lining. The laboratoryexperiments were extended to semi field scalewhere LDPE films of 400 gauge and 250 gaugewere embedded in channels at DoburjiDistributary under a cover of 30 cm thick layerof local soil and sides were lined with 3.75 cmthick masonry laid in 1:3 cement sand mortar.The steady value of seepage varied from 0.95 to1.37 cusecs per million square feet of wettedperimeter. Jalandhar distributary with a bedwidth of five feet and full supply water depth of5 feet was selected for carrying out full field scaleexperiments of the combination type of lining.The section of the canal was brought to 1:1 slopeand lined with LDPE film in the bed and rigidlining was laid in the sides. To monitor seepagelosses, piezometers were installed in the back fillof the lined reach of the Jalandhar distributary.Observations of water level were taken at regularintervals with the help of these piezometers andno seepage was observed. The film has beenvisually examined by removing the soil or tilecover at different sites and has been found intact.At places where there is animal traffic, the hoofsof the animals have not affected the film, as itwas protected under 30 cm soil cover. It has beenobserved that the indent of the hoof is hardly 7cm deep and even repeated indent are not deeperthan 10 cm. LDPE film laid 27 years ago on theDoburji distributary near Amritsar has beenfound as fresh as a new specimen (Anonymous,1985). It is also not affected by the submergedaquatic weeds when laid on the bed. The softweed-roots do not penetrate deep at 30 cm thicksoil cover is sufficient to protect the film fromgetting punctured. Similarly, the Central WaterCommission reported almost impermeability ofLDPE Agrifilm after a period of more than onedecade (Anonymous, 1985). Similarly, the resultsof accelerated laboratory tests have shown thatthe service life of black film of 200 micron thickfilm is between 40 to 50 years when used as water-proof lining material (Anonymous, 1982).

Manual on Enhancing Water Use Efficiency in Canal Commands 91
In brief, use of LDPE film as lining material hasbeyond doubt, made impetuous impact on savingwater from seepage losses. It has made liningpracticable successful in many arid and extremelycold countries. Some of the countries that havemade extensive use of polyethylene film for liningof the irrigation schemes and water reservoirs areIraq, Sudan, Russia, U.S.A, Canada, Romania,Spain, Nigeria and Pakistan etc. Above facts offerample evidences for the usefulness of Agri-filmlining on a large scale. It may, however, bedesirable that the specification can be morecritically gone into by the expert committee andthe same finalized to suit the different parametersand areas where lining of channels is theprogramme for conservation of water. Apart fromthe lining of channels, it would be of greatadvantage to provide a buried layer ofpolyethylene with soil cover in unlined reachesof the canal, distributaries and minors where veryoften breaches take place.
7.4 Better operational planning
Irrigation system operation is the process ofreleasing, conveying and diverting water in thecanal systems to ensure pre-determined flows atprescribed times for specified duration at alldesignated points of delivery. The operation plantakes into account the water available in thereservoir at the beginning of each crop season andspells out the starting date of release of water,the mode of supplies i.e. whether intermittent orcontinuous, the detailed schedule of releases andthe closing date of release of water. The operationplan should be prepared with active participationand involvement of farmer’s representatives sothat it may be implemented without anyresistance from the farmers to plan their cropproduction operation properly. This will reducewastage and better utilisation of irrigation water.
7.4.1 Systematic canal operation
The object of systematic canal operation is toensure equitable distribution of available flowsat the heads of all off-takes on a distributory. Aschedule of canal operation has to be preparedin advance. For instance, a distributory may be
divided into seven reaches each covering one ormore, off-takes whose total discharge is about aseventh of the designed ‘discharge of thedistributory. One-seventh of the total dischargecan be saved on each day by closing the off-takein each reach far 24 hours in succession in a week.This water can be made available to tail-enders.This will result in saving water besides not havingdry tail-enders problem.
7.4.2 Response to rainfall in canal operations
Canal operations should respond meticulouslyto rainfall in the command area for efficient useof storage water in the reservoir. The demand ofcrops for water is met in the wet season by bothrainfall in the command area and water stored inthe reservoir. Water requirement of crops isworked out using one of the empirical methodssuggested by FAO. The most common methodused is Modified Penman method. Whileassessing the water requirements of crops duringthe wet season for preparing the operation plan,effective rainfall worked out from the data ofaverage rainfall over a period of past 20 years isdeducted from the water requirements of cropsworked out by the ‘Modified Penman method’or other empirical methods. But in real timesituations, the pattern and amount of rainfallvaries influencing the scheduled deliveries. Whenrainfall is in excess, the scheduled irrigations areskipped and when rainfall is deficientunscheduled deliveries have to be made. This willensure maximum utilisation of rainfall as well asprotecting the crops from water stress or fromexcess water.
7.5 Cropping pattern in command areas
Cropping pattern means the proportion of areaunder different crop at a particular period of time.A change in cropping pattern means change inthe proportion of area under different crops. Theirrigation departments have been planningirrigation projects on the basis of a designedcropping pattern to give a favourable benefit-costratio. In any command area of irrigation projects,the current cropping systems are the result of pastand present decisions of individual farmers or

92 Manual on Enhancing Water Use Efficiency in Canal Commands
farming communities. These decisions areusually based on experience, tradition, expectedprofit, personal preferences and availableresources.
7.5.1 Factors influencing cropping patterns
A wide range of factors such as soil, rainfall,temperature, altitude,availability of inputs(irrigation water, high yielding varieties,fertilizers, pesticides), length of growing season,market demand and prices for farm products,availability of credit, socio-economic status offarmers, expertise of farmers, comparativeeconomics of alternate crops, benefit-cost ratioetc., have bearing on individual farmer’sdecisions to grow any particular crop. Croppingpattern should therefore, be viewed as a dynamicrather than a static concept.
Climate : Climatic conditions, especially rainfalland temperature influence cropping pattern. Theperiod of commencement of monsoon rains isvery important as time of sowing of the crop isdependent on rainfall. Due to diversity in climateand soil conditions, different cropping patternsare adopted in different areas.
Soils : Each type of soil gives high yield of certaincrops and not others. In alluvial soils all types ofcrops can be grown. Sandy soils are not suitablefor growing rice and sugarcane. Laterite soils aremore suitable for growing coffee, tea, rubber etc.In crops that are climatically suitable, their waterrequirements have to be considered in relationto both water supply and the efficiency of waterutilisation in crop production.
Economics : Cropping pattern is influenced bythe prevailing price for the farm products in themarket, yield per hectare and the relativeprofitability per hectare. The prices influence theaverage area under crops in two ways. Variationin price among products of different crops leadsto shift in area between crops. The maintenanceof stable level of prices for a crop provides a better
incentive to a producer to increases the outputthan what a higher level of price does.
Economic Status of Farmer : Farmers who areeconomically sound adopt a cropping patternwhich is most profitable with high inputintensity, while a farmer who is economicallyweaker adopts a cropping pattern which is lessrisky and with low input requirements.Availability of timely and adequate credit alsoinfluences cropping pattern. .
Time of Sowing : Timely sowing of a crop giveshigh yield besides reduced incidence of pests anddiseases. Delayed sowings reduce yields andexpose the crop for higher incidence of pests anddiseases. The crop to be grown, is dependent onthe availability of irrigation water for sowingduring the crop season.
7.5.2 Project planning
The cropping pattern, which includes choice ofcrops, crop varieties, crop rotation, and croppingintensity and the efficiency with whichproduction resources can be utilised is essentialinput in overall project planning. The croppingpattern selected has to match the overall availablesoil and water resources. For the selected crops,not only the water requirements have to beconsidered in relation to water supply availablebut also the efficiency of water utilisation in cropproduction. The most suitable cropping patternand several other alternate profitable croppingpatterns have to be considered at the time ofproject planning and designing for introducingflexibility into the system and attaining the mostefficient use of available water supply and thedistribution system. Similarly, the most suitablecropping pattern has to be decided well beforethe commencement of each sowing season formost efficient project operation. Maximumprofitable production (with favourable benefit-cost ratio) should be obtained from a unit of land,per unit water, in a unit time.

Manual on Enhancing Water Use Efficiency in Canal Commands 93
Without proper distribution and management ofavailable irrigation water resources, it may notbe possible to ensure maximum economically andsocially desired returns. If proper distribution ofirrigation water is not done by any agency/authority, excessive use of water by head-reachand influential farmers is common thus deprivingthe legitimate right of those at the tail end of anoutlet command.
7.6.1 Concept of Warabandi
Warabandi is nothing but rotational supply ofirrigation water system and in vogue for over acentury in north-western states of India and inPakistan. The cardinal principle in this system isthat available water, whatever be the quantum,is allocated to farmers in equal proportion to theirholdings. The principal management objective inWarabandi is to simultaneously achieve highefficiency of water by imposing water scarcity oneach and every farmer. This acts as a deterrent towasteful practices and results in maximumproduction per unit of available water, though itmay not be the maximum production per unit ofland irrigated. This system has its focus on equityand provides ample safeguards for the farmersat the tail end of the conveyance system.
7.6.2 Distribution System
Water from the source, which may be a river or areservoir, is carried by a main canal. The maincanal feeds two or more branch canals whichoperate by rotation and may or may not be ableto run full supply. This is primary distributionsystem and runs throughout the irrigation seasonwith varying supply. Branch canal supply waterto a large number of distributories, which mustrun full supply by rotation. This is the secondarydistribution system. Distributaries supply waterto water courses through ungated, fixeddischarge outlets. An outlet is the measuringstructure through which water is admitted fromdisrtributory to farmers’ water course. Watercourse run full supply when the distributory isrunning and the water is allocated between
7.6 Rotation supply of irrigation water (Warabandi system)
farmers on a water course by a time roster. Themanagement of the secondary and tritiarydistribution system under Warabandi is thedistinguishing feature from other systems ofwater distribution.
Each unit of culturable command area is allocateda certain rate of flow of water which is termed aswater allowance. Its value is a compromisebetween demand and supply. The carryingcapacity of the distributaries and water course isdesigned on the basis of this allowance. Waterallowance and capacity factor donot ensureirrigation for 100 percent of the culturablecommand area. The ratio which the resultantirrigated area would bear to the total culturablecommand area is known as intensity of irrigation.The intensity of irrigation is used for monitoringthe actual performance of the system and itsvarious constituents.
Most of our irrigation projects have not visualisedproblems of equitable water distribution and thusmade no provision for enough control andregularising devices in irrigation net work.Additional structures and improvements likestrong embankments, cross regulators, dropstructures, gates, distribution boxes andmeasuring devices have to be provided ifwarabandi system is to be adopted.
An advantage of rotational irrigation is possibilityof a more effective use of rainfall. For theintroduction of warabandi, proper maintenance ofcanals and carrying capacity of canals at fullsupply level (FSL) in middle reaches as well as attail end reaches is a pre-requisite. ThusWarabandi will be successful only to the extentthat the farmers at the chak willingly accept theregulation of water. There has to be a concertedeffort to make the system a success.
7.6.3 Farmers participation in Warabandi
The present system of water management doesnot provide for collective efforts in selfgovernance by the users. In most of the irrigationprojects, farmers involvement is limited. Usually

94 Manual on Enhancing Water Use Efficiency in Canal Commands
a meeting of the farmers of localised area isconvened at the commencement of the cropseason for fixing the date of release of water intothe canal from the reservoir. The operation andcontrol of water up to the outlet level is done bythe irrigation department officials. The problemof irrigation water theft in upper reaches andthereby creating water scarcity in the lowerreaches are solely due to lack of understandingand cooperation among the farmers. Theobjective of any irrigation project can be achievedonly when efficiency in use of irrigation water isensured at sluice level and on the actual field.The ability of farmers to properly mange thewater to get the maximum yield has a big say onthe efficiency of the project. Therefore, there isurgent need to bring farmers into group actionand involving them in the planning of watermanagement strategy, accommodating all theirgenuine needs will make them voluntarily workfor the success of the system. Hence, for aneffective mechanism of managing the waterefficiently and effectively is to involveparticipation of farmers for water distributionright from the stage of release of water fromreservoir and also make them responsible formaintenance of the irrigation system.Participation of farmers in irrigation watermanagement implies a significant role for themin decision making.
7.6.4 Pricing of water
The present system of levying irrigation waterrates on the basis of crop area irrigated rather thanon volume of water received in the field is leadingto excessive and inefficient use and wastage ofwater. The ideal practice would be to levyirrigation water rates on the volume of waterdelivered in the field so as to act as a disincentiveto over irrigation. If this is not done, determiningthe quantity of water supply in warabandhi systembased on outlet discharge and time allowed forirrigation can be adopted to charge water rates.
7.6.5 Water budgeting
Maintaining a consolidated account of receipt ofriver flows and release into canal system at thereservoir, and supplies made to branch canal,distributaries, minors and field channels will helpto know the wastage of water. Seasonaloperational plans should be drawn for allocatingwater for both seasons. Similarly, weeklyirrigation schedules should be preparedallocating water to different water to different off-take. Water levels at various off-takes aremeasured daily and discharge recorded for theweek and month. The deliveries planned to bereleased and the deliveries actually made arecompared. It will be known whether the deliveryof water is as planned or in excess. If it is in excess,schedules can be revised so that less water isdrawn in the next week and adjusting irrigationschedule by skipping irrigations in non-criticalperiods of the crops. Thus water budgeting canhelp in ensuring the supply of water moreefficiently and effectively.
7.7 Integrated irrigation water management
The process of water management in an irrigationsystem includes an integrated development ofsub-systems such as watershed, reservoir intake,conveyance, regulation, measurement, effectiveuse of rainfall, application of appropriatequantities for crop use and effective drainagefrom command area. For efficient use of irrigationwater simultaneous development of all thecomponents of an irrigation system is essential.Further, active involvement of farmers in themanagement of irrigation water will ensure theobjectives of increased utilization of createdpotential, equitable distribution of water at thefarm level and increased production onsustainable basis.
7.8 Operation research
Research progrmme should be relevant tofarmers needs. Operational research is mostneeded at present. It should not only be a functionof needs as perceived by farmers who areultimate beneficiaries of the irrigation system, but

Manual on Enhancing Water Use Efficiency in Canal Commands 95
should also respond to the project limitations andto the concerns of the irrigation department whomanages it. For this purpose it is necessary to
Diagnose operational constraints forimproving management and use of water
Measure the impact of changes in watermanagement on cropping pattern andconsequently on the timing of farmoprations
Establish crop growth and yield responsesto different levels of water supply over thefull growing period for specific crops andcrop sequences
Monitor and record factors influencing thesupply of water which could disturb andchange the underlying assumptions fordesigning water delivery schedule
The occurrence of frequency and distribution oflocal rainfall, water table fluctuations, residualmoisture, crop input-output relations and onfarm water management have to be studied.
The operational research should cover the entirecommand area of a canal irrigation system or totalcommand area of a tank or well command. Therewill be considerable variability in irrigation watermanagement in the command area and the cropmanagement practices. This variability existingin the command should be used to establishcorrelations between certain water managementsituations and farmers’ output. Improved waterand crop management practices can beintroduced simultaneously for purposes ofcomparison in the entire command of adistributor or minor. Farmers respond todiffererent situations can also be studied. Farmmanagement factor can be introduced as anindependant variable and can be rated to scaleto get an indication how farmers endowed withthe same resources utilize these resources toobtain farm output. The aim of the diagnostic andgap analysis is to determine the major fielddeterimants under the actual farming and watersupply situation. The constraints affectingadoption of recommended technologies and
farmer innovations in the field of irrigationshould be taken into consideration for betterunderstanding the system. Further, thecontribution of ground water to meeting cropwater requirements, either from wells or by directconsumption through capillary rise, has to bestudied for both canal and tank commands.
Pressurized irrigation systems like sprinkler anddrip methods can be best substitutes for surfaceirrigation methods. There is great need to trythese methods under various situations andworkout cost-benefit ratios. The economic andfinancial consequences of water managementsystems and their effect on subsequent croppingpatterns, yields and farm incomes should bemonitored. Special efforts should be made foractive and enthusiastic participation of farmersin the implementation of the operationprogramme.
7.8.1 Extension and Training
Extension efforts in irrigated agriculture aremainly focussed on recommendations of crops,varieties, fertiliser application, crop protectionetc. Very little attention is paid to soil waterrelationships, methods of field preparation,layout of irrigation response to variable watersupply conditions, synergistic packages of levelof irrigation, plant population and fertilisers etc.Concepts of integrated management of soils,water, crops, soil fertility, plant protection etc.,has to be developed by the extension staff.
With the expansion of the irrigation programme,the need for training technical personnel both inmethod of construction and efficientmanagement of the irrigation system hasassumed importance. The command areapersonnel have to be trained in operation andmaintenance for improved water management.Water and Land Management Institute (WALMI)and Irrigation Management and TrainingInstitutes (IMTI) have been established for thispurpose in several states.

96 Manual on Enhancing Water Use Efficiency in Canal Commands
7.9 Knowledge Gap and Researchable Issues on Water Management
i) Creation of data base: The detailed monthly/weekly data on command/ region basis onavailability and utilization of water fromvarious sources of water i.e., canal, groundand rainfall on long term basis is lacking. Therelevant information on soil, croppingpattern, water table, etc. should also bemonitored and integrated. A sound data baseis an essential requisite in water resourcemanagement. Dependable data, based onagro-climatic conditions of a regions, areneeded on water resources availability,temporal release of water and reliability ofwater supply from reservoirs, ground waterstatus in terms of recharge, extraction andquality, areas under irrigation and quality ofirrigation service, use of waste/recycledwaters, water use pattern, efficiencyconstraints, water induced environmentalsocio-economic and institutional aspects.Periodic monitoring, analysis,documentation and dissemination of thisinformation will help in proper waterresource utilization, framing policyguidelines and planning managementstrategies. The GIS is the modern tool to storeand manipulate spatial information. Naturalresources like water and soil etc. always havea spatial dimension overriding them.Therefore, GIS is an essential requirement forefficient and quality water resourcesresearch.
ii) Development of irrigation schedule andcropping pattern for the potential watertable rising areas: In the canal irrigated areasand where the ground water exploitation dueto its poor quality is low, the water table isshowing a rising trend. Obviously, the areashaving water table within critical limit arelikely to be increased. For these areas thereis a need to develop irrigation schedules foreconomically viable cropping pattern whichrequire less input of canal irrigation water.This will help in arresting the further rise inwater table, water-logging and secondary soil
salinization for long term sustainableagriculture.
iii. Mismatch between irrigation demand andsupply of canal irrigation water: In most ofthe command areas, the supply does notmatch as per the requirement of the areaswhich is highly variable and uncertain inspace and time. On long term basis, thiscreates hydrological imbalances in the area.The excess water during rainy season maybe diverted to falling water table areas forrecharging the ground water. Moreover,uninsured water availability leads to highwastage of irrigation water. The croppingpattern can also not be planned in advanceunder such situations. Under suchconditions, the supply of water onprobability basis will ensure judicious use.There is need to determine the optimum levelof probability i.e., 60-80% for planningpurpose.
iv. Integrated use of rain, canal and groundwaters: Integrated management of surface,ground and rain water resources is notpractised owing to availability of canal waterat cheaper rates and costlier exploitation ofground water.
v. Artificial recharge of ground water infalling water table areas: During rainyseason, excess surface water, both fromrainfall and canal, is available, which causeswater-logging in some areas. If this water isdiverted properly for recharging the groundwater, the falling water table can be arrestedon the one hand and the water loggingproblem can be avoided on the other.
vi. Diversification of land use in favour of highvalue crops: To achieve high crop yieldsrequire high input cost and its management,growing of conventional crops is becomingless and less profitable. There exists a hugescope for fruits and vegetables and other non

Manual on Enhancing Water Use Efficiency in Canal Commands 97
conventional crops. Switching over to suchcrops can be more profitable undersomewhat controlled conditions of cropgrowth. There is thus need to developappropriate water management technologyfor these diversified crops.
vii. Water management technology for the reuseof waste waters: The waste waters includeindustrial effluent, sewage water and goodquality drainage waters. The consumption ofwater by urban population and industries isincreasing day by day and these waters canbe recycled and can be safely used forirrigation purpose, as in case of developedcountries. A technology, suited to ourconditions, need to be developed for the safeuse of such waters.
viii. Drip fertigation: It is a well known fact thatthe efficiency of irrigation water and fertiliseris less than 50% when applied throughconventional methods of irrigation.Increasing the efficiency of these two factorsholds the key for long term profitableagriculture. This can be substantiallyincreased to the level of 90% underpressurized system of irrigation. However,as installation and management of microirrigation system including drip, sprinklerand micro-sprinkler require a highinvestment, at this stage it can be adopted inhigh value crops, which require a favourablemarketing infrastructure. The industries canplay a significant role in adoption for thistechnology by providing, high qualitysystem, post sale services, storage andprocessing of harvested crops. By adoptingthe technology of controlled application ofwater, fertilizers and pesticides the pollutionhazards to the environment can beminimized.
ix. Development of irrigation Atlas: IrrigationAtlas containing all the relevant informationabout the water can be prepared on the eachof the agro-ecological regions of the state.
x. Development and validation of cropgrowth and water use models: There is needto focus more attention on the developmentof crop growth and water use models. Thesemodels can be validated keeping in view ouragro-climatic and socio-economicconditions. This will help the researchers,to put less effort on experimentations, theplanners and the farmers for working out along term strategy for efficient use of water.
References
Anonymous. 1982. Proceedings of Seminar on The useof plastics for lining of water conveyancesystems in irrigated agriculture. Ministry ofIrrigation, Government of India, New Delhi.
Anonymous. 1985. A Manual on Canal and ReservoirLining with Agri-film. Indian PetrochemicalCorporation Limited, New Delhi.
Kumar, A and Singh Rajbir. 2010. Plastic Lining forWater Storage Structures. Technical BulletinNo. 50, Directorate of Water Management,Chandersekharpur, Bhubaneswar-751 023,India, page: 34.
Kumar, S., Singh, Rajbir, Bhatnagar, P.R., Gupta, R.Kand Nangare, D.D. 2008. Microirrigation inconjuction with service reservoir in canalcommand. Technical Bulletin APA/Pub/03/2008, CIPHET, Abohar.
Michael, A.M. 1992. Irrigation-Theory and Practice.Vikas Publishing House Pvt. Ltd., New Delhi.
Reddi, G.H.S and Reddy, T.Y. 1999. Efficient use ofirrigation water. Kalyani Publishers, NewDelhi.
Singh, Rajbir and Kumar, S. 2007. Plastic Films inEfficient Water Management. (Ed). K.K. Singhet al. Kalyani Publisher (Pvt) Ltd, Ludhiana.

98 Manual on Enhancing Water Use Efficiency in Canal Commands
8.0 ENHANCING W8.0 ENHANCING W8.0 ENHANCING W8.0 ENHANCING W8.0 ENHANCING WAAAAATER USE EFFICIENCTER USE EFFICIENCTER USE EFFICIENCTER USE EFFICIENCTER USE EFFICIENCY THROUGHY THROUGHY THROUGHY THROUGHY THROUGHPRESPRESPRESPRESPRESSURIZED IRRIGSURIZED IRRIGSURIZED IRRIGSURIZED IRRIGSURIZED IRRIGAAAAATION SYSTEM IN CTION SYSTEM IN CTION SYSTEM IN CTION SYSTEM IN CTION SYSTEM IN CANAL COMMANDANAL COMMANDANAL COMMANDANAL COMMANDANAL COMMAND
SaSaSaSaSatyendrtyendrtyendrtyendrtyendra a a a a KKKKKumar, Rumar, Rumar, Rumar, Rumar, Rajbir Singh and Ashwani Kajbir Singh and Ashwani Kajbir Singh and Ashwani Kajbir Singh and Ashwani Kajbir Singh and Ashwani Kumarumarumarumarumar
The water use efficiency under conventionalflood method of irrigation, which ispredominantly practised in Indian agriculture, isvery low due to substantial conveyance anddistribution losses. Recognizing the fast declineof irrigation water potential and increasingdemand for water from different sectors, anumber of demand management strategies andprogrammes have been introduced to save waterand increase the existing water use efficiency inIndian agriculture. One such method introducedrelatively recently in Indian agriculture ispressurized irrigation system, which includesboth drip and sprinkler method of irrigation.Since, these methods need water under pressure,they are classified as pressurized irrigationsystem. Pressurized irrigation system is provedto be an efficient method in saving water andincreasing water use efficiency as compared tothe conventional surface method of irrigation,where water use efficiency is only about 35-40percent.
One of the main reasons for adopting pressurizedirrigation system in crop cultivation is to savewater and increase the efficiency of water use.Over centuries all over the world, irrigation waterhas been predominantly applied for crops usingflood/gravity method. Generally, underconventional (flood/gravity) method ofirrigation, water is supplied through unlined
canal and field channels for crops wherecontrollability of water is not easily possible andtherefore, conveyance and distribution losses aresubstantial. Unlike conventional method ofirrigation, both sprinkler and drip irrigationsupply water to crop using pipe network alongwith drippers, emitters and nozzles. As a resultof supplying water directly to the crop or to thefield, the conveyance and distribution losses arefound to be completely absent under pressurizedirrigation system. Estimates carried out atdifferent research stations under differentmethods of irrigation reveal the comparativeefficiency of irrigation under different methods(Table 8.1). While the conveyance efficiencyunder surface method of irrigation is estimatedto be only in the range of 40-50 percent in canaland 60-70 percent in well, the same is estimatedto be 100 percent in both sprinkler and dripmethod of irrigation. As mentioned earlier, thehigher level of conveyance efficiency underpressurized irrigation system is mainly becauseof application of water by pipe network, whereseepage and other leakages are also completelyabsent. A less than 50 percent of conveyanceefficiency in surface irrigation method suggeststhat by converting all the surface method ofirrigation into micro-irrigation, we would be ableto double the irrigated area without constructingany new irrigation projects.
Table 8.1 : Irrigation efficiencies (%) under different methods of irrigation
Irrigation efficiency (%) Methods of irrigation
Surface Pressurized irrigation systems
Sprinkler Drip
Conveyance Efficiency 40-50 (canal) 100 10060-70 (tube well)
Application Efficiency 60-70 70-80 90Surface water moisture evaporation 30-40 30-40 20-25Overall Efficiency 30-35 50-60 80-90

Manual on Enhancing Water Use Efficiency in Canal Commands 99
Application efficiency refers to water use at thefarm level. Estimates suggests that there are widevariation here too in the level of efficiency. Watercan be applied at a required quantity and timeunder pressurized irrigation system andtherefore, the application efficiency is alwayshigher under pressurized irrigation system ascompared to conventional surface irrigationmethod. The overall application efficiency isestimated to be 60-70 percent in surface irrigation,whereas the same comes to 70-80 percent forsprinkler and 90 percent for drip irrigationmethod. Because of flooding of water undersurface irrigation method, large quantity of wateris wasted in the form of evaporation and seepagelosses and thus, the application efficiency isalways lower. Since water is applied directly tothe root zone of the crop at a required quantityby drip method of irrigation, the applicationefficiency is above 90 percent. The applicationefficiency is estimated to be relatively lowerunder sprinkler irrigation as compared to dripmethod because of two reasons. First, sprinklerirrigation is often affected by wind interferencewhich ultimately reduces the efficiency. Second,
unlike drip method, sprinkler supplies water towhole of cropped area and therefore, water losseswould obviously be higher.
Unlike application efficiency, there are novariations between surface method and sprinklermethod of irrigation in the case of surface watermoisture evaporation. In both surface andsprinkler method, it is estimated to be the same,varying from 30 to 40 percent (Table 8.1). In thecase of drip, the surface water moistureevaporation is only 20-25 percent. Drip methodof irrigation does not allow water to spreadbeyond the root zone of the crop and therefore,the water moisture evaporation is very less indrip irrigation. Because of very high level ofconveyance and application efficiency and lowwater moisture evaporation, the overall water useefficiency is very high (80-90 percent) under dripmethod of irrigation as compared to sprinkler (50-60 percent) and surface method of irrigation (30-35 percent). Therefore, drip irrigation appears tobe the most efficient method of irrigation in termsof absolute use of water for crop cultivation. Dripirrigation method also appears to be efficientmethod in terms of moisture availability to crops
8.1 SPRINKLER IRRIGATION SYSTEM
Available information suggests that sprinklerwas introduced in India during the mid-fiftiesfor plantation crops like coffee and tea. Duringmid-seventies, progressive farmers in Narmadavalley in MP, southern part of Haryana andnorth east part of Rajasthan started usingsprinkler particularly during summer to avoidthe shortage of water (INCID, 1998). Over theyears, the adoption of sprinkler systempenetrated into larger area in states likeHaryana, Rajasthan, MP, Maharashtra andKarnataka. However, detailed and accuratestatistics are lacking for sprinkler irrigation butthe present estimate indicate that gross areaunder sprinkler irrigation has increased from0.23 mha in 1985 to 0.67 mha in 1998. Accordingto the latest information compiled by theNational Committee on PlasticultureApplications in Horticulture (NCPAH), the total
area under sprinkler in the country is estimatedto have increased to 2.45 Mha.
The spread of sprinkler irrigation is also not thesame across the states. State-wise area undersprinkler irrigation shows that it is mainlyconcentrated in Central and northern part of thecountry. Up to 2008, states like Haryana (0.51Mha), Rajasthan (0.70 Mha), West Bengal (0.15Mha) and Maharashtra (0.21 Mha) togetheraccounted for about 70 percent of India’s totalsprinkler irrigated area. The reasons for largeadoption of sprinkler irrigation are different fordifferent states. Though MP receives mediumrainfall, factors like unpredictable rainfall andlong dry spells during the summer encouragedthe farmers to adopt sprinkler irrigation for cropslike soybean in various part of the state. In thecase of Haryana, the soil condition, topographyand the climates that are prevailing in the south
100 Manual on Enhancing Water Use Efficiency in Canal Commands
western part of the state especially in districts ofBhiwani, Mahindergarh, Rothak, Sirsa and Hisarhave prompted the adoption of sprinklerirrigation. Similarly, favourable cropping patternand water scarcity during the summer season arefound to be the main reasons for the relativelyhigher adoption of sprinkler irrigation inRajasthan (INCID, 1998).
8.1.1 Sprinkler irrigation in canal commandareas
For economic and efficient use of water, it isnecessary to use the sprinkler irrigation system.This can be used not only in groundwaterapplication but also in canal water application.The irrigation department in Haryana launchedthe installation of during late seventies and eightyon the existing canal network. The installation ofsprinkler system in canal network is first of itskind in the country and has shown a successstory. During 1978 and 1981, 131 sprinkler setswere installed in the Lift Command, BhakraCommand and Western Jamuna Canal (WJC)areas. The area selected for experimentalsprinkler irrigation was chronically deficit inwater. These sets were installed in lift canalcommand areas for irrigation of lands ofundulating terrain where extension of irrigationby normal method of construction of water coursewas not feasible. In the canal command areas ofestablished Western Jamuna Canal and BhakraCanal system, these sets were installed to extendirrigation to high lands which were identified asnon-command areas within the gross area ofcommand. Typically the command areas of thedistributary and minors in which these sprinklersare installed are divided into groups and theregulation of irrigation supply is made in 8 daysrotation. The periodicity of the rotation isdependent upon the available supplies for predetermined rotational programme and aims toensure equitable distribution of water. Generally,the system runs for 16 days out of 24 days in kharifand 8 days out of 24 days in rabi.
Large number of farmers of these areas hasadopted sprinkler system during eighty and
nineties and number of sets owned by farmershas increased to more than 15,000. About 18% ofthe area is reported to be sandy soil and thesprinkler system is ideal for these areas. TheHaryana irrigation department installed morethan 200 community sprinkler sets (eachirrigating about 40 hectares) on canal system (Juicanal, Jui feeder and Sewani canal commands).During eighties, sprinkler irrigation system wasintroduced in Rajasthan. Initially, aluminum pipebased sprinkler systems were adapted by thefarmers in Sikar, Jhunjunu, Nagaur districts. Lateron HDPE pipes based sprinkler system wereintroduced. Sprinkler system was also introducedin canal irrigated areas of Bikaner and Kota.
Sprinkler system of irrigation has tremendousscope for irrigation in different command area ofmajor and medium projects in different agro-ecological regions. Gravity flow system ofirrigation is the common method of irrigation inall the command areas of irrigation project inIndia. Where supplies are planned for dry cropslike millets and pulses, it would be economicallyrewarding if sprinkler irrigation can beintroduced in these areas. The area availableunder this category is estimated to be about 10 mha based on the assumption that at least 50 % ofthe 20 Mha under CAD schemes (Anonymous,1998) will be under irrigated low duty crops likecoarse cereals, millets, pulses and oil seed crops.This would also substantially contribute to higherlevels of production on sustainable basis.
8.1.2 Type of sprinkler system and components
Sprinkler system are classified into following twomajor types of the arrangement for sprayingirrigation water.
a) Rotating head or revolving system
b) Perforated pipe system
a) Rotating head
Small size nozzles are placed on riser pipes fixedat uniform intervals along the length of the lateralpipe and the lateral pipes are usually laid on theground surface. They may also be mounted onposts above the crop height and rotated through

Manual on Enhancing Water Use Efficiency in Canal Commands 101
900, to irrigate a rectangular strip. In rotating typesprinklers, the most common device to rotate thesprinkler heads is with a small hammer activatedby the thrust of water striking against a vaneconnected to it.
Rotating head system can further be divided intothree categories:
i) Conventional system/small rotarysprinklers
ii) Boom type and self propelled sprinklersystem
iii) Mobile rain gun/large rotary sprinkler
b) Perforated pipe system
Perforated pipe system consisted of drilledholes or nozzles along the length of thelateral pipe through which water is sprayedunder pressures. This system is usuallydesigned for re lat ively low operat ingpressure (<1.5 kg/cm2). The application rateranges from 1.25 to 5 cm per hour for variouspressures and spacings. There are threetypes of spraying systems:i)Stationary; ii)Oscillating and iii) Rotating
8.1.2.1 Classification based on portability
Based on portability, sprinkler systems areclassified into following types
(i) Portable system : A portable system hasportable main lines, laterals and pumpingplant.
(ii) Semi portable system: A semi portablesystem is similar to a portable system exceptthat the location of water source andpumping plant is fixed.
(iii) Semi permanent system: A semi permanentsystem has portable lateral lines, permanentmain lines and sub mains and a stationerywater source and pumping plant.
(iv) Solid set system: A solid set system hasenough laterals to eliminate theirmovement. The laterals are positions in thefield early in the crop season and remainfor the season.
(v) Permanent system: A fully permanentsystem consists of permanently laid mains,sub mains and laterals and a stationerywater source and pumping plant.
8.1.2.2 Components of sprinkler system
A typical sprinkler irrigation system usuallyconsists of following parts or components.
Components Approximate cost of componentof the total sprinkler system (%)
Pipe network: mains, sub mains and laterals 70
Couplers 15
Sprinkler head 7
Accessories like valves, bends, plugs, risers and fittings 8
In addition, the pumping and control unit costs about 40% of this total cost
a) Pipe networks
The pipe network comprises of three types: main,sub main and laterals. Main pipe lines carry waterfrom the pumping plant to different parts of thefield. Sub main lines are provided to take waterfrom the main to laterals. The lateral pipe linesthen carry the water from main or sub main pipeline to the sprinklers. Sprinklers on a lateral pipeline may vary in number from one to thirty. The
main pipe lines can be laid either as permanent,semi-permanent or portable ones. However, thelateral pipes are always laid as portable ones.Permanent pipes are made of steel, asbestos,cement, plastic or wrapped aluminium. They arecommonly buried at about 45 to 60 cm belowground level so as to be out of the way of farmingoperations. Portable pipe lines are usually madeof aluminium or plastic (HDPE) and are generally

102 Manual on Enhancing Water Use Efficiency in Canal Commands
equipped with quick coupling devices. These canbe shifted quickly to enable farming operation.
b) Couplers
A coupler provided connection between twopipes and between pipes and fittings. Couplersshould i)provide flexible connection; ii)not leakat the joint under pressure; iii)automatically drainat no pressure; iv) be simple and easy to coupleand uncouple and v) be light, non-corrosive anddurable.
c) Sprinkler head or sprinkler
Sprinkler may be rotating or fixed type. Thecomponents of a rotating sprinkler can beadapted for a wide range of application rate andspacings. They are effective with pressure ofabove 1.5 to 4 kg/cm2 at the sprinkler nozzle.Fixed type sprinklers are commonly used toirrigate small lawns and gardens. A recentvariation of the fixed type sprinkler is the ‘pop-up’ sprinkler. In this, the sprinkler unit poops upout of a casing when put to use and sinks downinto the casing when not in use. This facilitatessafety of the unit from being damaged. Perforatedlateral pipes are also sometimes used assprinklers. They require less pressure thanrotating sprinklers. They also release more waterper unit of time than rotating sprinklers. Theiruse should be restricted to soils that have highintake rates.
d) Other accessories/fittings
To operate sprinkler system some fittings areessentially required while some are optional.Some of the important fittings/accessories usedin sprinkler systems are bends, tee, reducers,elbows, hydrants, risers, plugs and crosses andbutterfly values. These are fabricated either fromaluminium or HDPE, as the case may bedepending upon the material of the pipe to suitthe standard size of pipe. While drawing a bill ofmaterials a designer should provide suitablecouplers with all fittings.
e) Pump and control unit
To operate the sprinkler system sufficientpressure is required to distribute water under
pressure to the fields. The pumping plant usuallyconsists of a centrifugal or a turbine pump, adriving unit, a suction line and a foot value forthe centrifugal system. Centrifugal pump isgenerally used when the distance from pumpinlet to the water surface is less than eight meters.Normally centrifugal pumps are used to lift waterfrom irrigation ditches, drainage canals, lakes,ponds, river channels or shallow wells. If thedistance to the water surface is more than eightmeters or if the water level is fluctuating widely,the use of a turbine pump is recommended. Thedriving unit may be either an electric motor oran internal combustion engine.
Different types of pumps with desiredcharacteristics, including monoblocks forsprinkler irrigation system are manufactured inIndia. Therefore, the farmers can select the pumpsets depending upon the soil, crop, slopes anddischarge available and the pumping water level.
f) Water meter
This is used to measure the volume of water tobe delivered. In India, though irrigation water isnormally not measured and users pay accordingto the area irrigated; this is necessary to operatethe system to give the required quantity of water.
g) Pressure gauge
It is used to measure and monitor the pressureunder which the sprinkler is working in order todeliver the water uniformly. A portable gauge-pack with a pitot tube enables an operator to readthe sprinkler pressure at the sprinkler nozzlewhich is in use.
h) Connectors
Flanges, couplings and nipples are used forfacilitating proper connection to the pump andsuction delivery pipes.
i) Fertilizer applicators
Soluble chemical fertilizers can be injected intothe sprinkler system and applied to the crop. Theequipment for fertiliser application is relativelycheap and simple and can be fabricated locally.The fertilizer applicator consists of a sealed

Manual on Enhancing Water Use Efficiency in Canal Commands 103
fertilizer tank with necessary tubings andconnections. A venturi injector can be arrangedin the main line, which creates the differentialpressure suction and allows the fertilizer solutionto flow in the main water line.
8.1.3 Design of sprinkler system
The objective of the design of sprinkler system isto obtain a system that provides satisfactorilyuniform application of water with a minimumannual operation and maintenance cost. Thedesign procedure should take into considerationcrop requirements, existing soil type, climate,water quality and quantity, topography andshape of the field, irrigation facility, labour,economics and future expansion considerations.
8.1.3.1 Principles of design
a) Inventory of the area
The first step in the design of sprinkler systemsis to make the resource inventory of the area. Thisconsists in obtaining information about theavailable land, water and equipments. Atopographical map of the area to be irrigatedshould be prepared. The soil type in the areaunder consideration should be known.Information about the source of water, qualityand its availability during the entire year shouldbe collected. The water available should be ofsufficient quantity and its quality should besatisfactory for irrigation. Amount of sedimentpresent in the water is an important considerationin sprinkler system design. The type of sprinklerequipment available and its specifications arenecessary in the proper selection of theequipment.
b) Depth of irrigation
The quantity of water to be applied and theperiod of irrigation depends upon the crops,climate and soil. The proposed crops, their waterrequirements along with the water holdingcapacities of the soils of the area should beknown. The depth of irrigation required (d, cm)is determined using the relationship:
Gross depth of irrigation (d) = D*dm*s/Ea
Where,
D = Effective root zone depth of soil to be broughtto field capacity, cm
dm=Difference in moisture content between fieldcapacity and the moisture content beforeirrigation in percentage on dry weight basis
s = Specific gravity of soil
Ea = Irrigation application efficiency
c) Irrigation interval (days)
The irrigation interval (F) presented in days isexpressed as below:
)day/cm(useeconsumptivdailyofratePeak
)cm(irrigationofDepth)days(F =
d) Effect of wind
To achieve uniform sprinkling of water, it isnecessary to overlap water spread of sprinklers.The overlap increases with the increase in windvelocity. The design of sprinkler overlap underdifferent wind conditions is presented in Table8.1.2. The actual spacing, however, shall beguided by the standard sizes of pipe available inthe market. Pipe sizes of 6 m (full size) and 3 m(half size) are generally available in the market.
Table 8.1.2 : Maximum spacing of sprinklers under different wind conditions
Average wind speed Overlap (%) Spacing
No wind 35 65% of the diameter of the water spread area of a sprinkler head
0 to 6.5 km/ha 40 60% of the diameter of the water spread area of a sprinkler head
6.5 to 13 km/hr 50 50% of the diameter of the water spread area of a sprinkler head
Above 13 km/hr 70 30% of the diameter of the water spread area of a sprinkler head

104 Manual on Enhancing Water Use Efficiency in Canal Commands
e) Application rate for different soils andsurface slopes
The discharge of the sprinkler system wouldvary with the characteristics of the soil and
Table 8.1.3 : Maximum application rate (lph) of sprinkler for different soils and surface slops
Soil texture and profile Slope (%)
0.5 5-8 8-12 12-16
Coarse sandy soil for 2 m depth 5.0 3.7 2.5 2.3
Coarse sandy soil over more compact soils 3.7 2.5 2.0 1.0
Light sand loams to 2 m 2.5 2.0 1.5 1.0
Light sand loams over more compact soils 2.0 1.3 1.0 0.8
Silt loam to 2 m 1.3 1.0 0.8 0.5
Silt loam over more compact soils 0.8 0.6 0.4 0.3
Clay loam 0.4 0.4 0.2 0.1
its surface slope. The following informationmay be used to decide on water applicationrates for different soils and surface slopes(Table 8.1.3).
f) Selection of sprinkler nozzle
The sprinkler nozzle which gives application rateequal to or less than the infiltration rate of thesoil is normally selected. The specifications of thesprinkler nozzle shall include model of sprinklernozzle, nozzle size, diameter of throw,application rate and discharge of the nozzle.
g) Spacing of sprinkler nozzles
The spacing of sprinkler nozzle will depend uponnozzle size diameter of throw and winddirections. The value of maximum sprinklernozzle spacing as a fraction of diameter of throwis given in table 8.1.4.
Table 8.1.4 : Maximum allowable sprinklernozzle spacing as a fraction of diameter of throwunder condition of wind
be irrigated, the depth of water applied at eachirrigation, the time allowed to apply this waterand the application efficiency. The capacity isgiven by the formula
ExHxF.xDxA
Q827=
Where,
Q = Pump capacity (lps)A = Area (ha) of the field to be irrigatedD = Depth of application (cm)F = Irrigation interval (days)H = Duration of operation (h/day)E = Field application efficiency (fraction) andconversion factor of 27.8
The optimum water application rate isdetermined by soil type, slope of land and crop.Rate of application should bot exceed intake rateof soil. For almost level soil (slope less than 2percent) and moderate infiltration rate, themaximum application rate is 1.5 cm/hr.
8.1.3.3 System layout
Topography, field lay out and locations of watersource are the important factors that influencethe system layout. When there is choice, the watersource and pumping unit have to be located tominimize pipe and pumping cost. Wells should
Wind velocity Nozzle spacing (m) (km/hr)
0 – 6.5 0.6 x diameter of throw
6.5 – 13.0 0.5 x diameter of throw
13 or above 0.3 x diameter of throw
8.1.3.2. Capacity of the system
The capacity of sprinkler system or the capacityof the pump to be used depends upon the area to

Manual on Enhancing Water Use Efficiency in Canal Commands 105
be located as close to the centre of the irrigatedarea as possible. Lateral are placed across the slopto minimize the variation of pressure along thelaterals. When it is necessary to run laterals upand down the major slope, it is preferably forwater to flow downslope rather than upslope.When water must flow-up hill, laterals need tobe shortened unless pressure of flow regulatorsare used. Whenever possible, lateral should belocated at right angles to the prevailing winddirection. If wind direction and slope are in
opposite direction, precedence is given to slopeand laterals are kept across the slope. Layout ofmainline and sub main is done according tolateral layout. When laterals run acrossprominent land slope, mainlines and sub mainsare placed along the slope. When it is necessaryto run laterals along the slop, mainlines arelocated on upper side of ridge of the field so as toavoid aligning the lateral uphill. It is alsodesirable to locate mainlines so that laterals mayoperate on either side of them.
Classification of sprinklers and their adaptability
Parameters Low pressure Moderate Intermediate High pressure Hydraulic or Under tree Perforated0.35-1 kg/cm2 pressure pressure 3.5-7 kg/cm2 giant low angle pipe
1-2 kg/cm2 2-4 kg/cm2 5.6-8.4 kg/cm2 7-3.5 kg/cm2 0.28-14 kg/cm2
General Special thrust Usually Either single Either single One large Designed to Portablecharacteristics springs or single nozzle or dual nozzle or dual nozzle nozzle with keep stream irrigation with
reaction-type oscillating design design smaller trajectories pipe with linesarms or long-arm supplemental below fruit and of small
dual- nozzle nozzles to fill in foliage by perforations indesign pattern gaps. lowering the upper third of
Small nozzle nozzle angle pipe perimeter.rotates thesprinkler
Rang of 6 to 15 m 18 to 24 m 23 to 37 m 33 to 70 m 60 to 120 m 12 to 27 m Rectangularwetted strips 3 to 15 mdiameters
Recommended 1.0 cm/hr. 0.50 cm/hr. 0.62 cm/hr. 1.25 cm/hr. 1.6 cm/hr. 0.83 cm/hr. 1.25 cm/hr.minimumapplication rate
Jet Water drops Water drops Water drops Water drops Water drops Water drops are Water largecharacteristics are large due are fairly are well are well broken are extremely fairly well due to low(assuming to low pressure well broken broken over over entire well broken broken pressureproper entire wetted wetted diameterpressure-nozzle diametersize relations)
Moisture Fair Fair to good Very good Good except Acceptable in Fairly good Good. Patterndistribution at upper limits where wind calm air. Diamond is rectangularpattern of pressure velocities Severely patterns(assuming range exceed 6 km distorted by recommendedproper spacing per hour wind where lateralsand pressure are spacedrelations) more than one
tree inter space
Adaptations Smaller Primarily for For all field Same as for Adaptable to For all orchards For low-and limitations acreages. under tree. crops and intermediate close-growing or citrus groves. growing crops
Confined to Can be used most pressure crops that In orchards only. Limitedsoils with for field crops irrigable sprinklers provide a where wind to soils withintake rates and vegetables soils well except where good ground will distort relatively highexceeding 3 cm adapted to wind is cover. over tree intake rates.per hour and over tree excessive For rapid sprinkler Best adaptedto good ground sprinkling coverage patterns. In to small areascover on in orchards and for odd- orchards of high valuemedium-to and groves shaped areas. where available crops. Low coarse-texture and to Limited to pressure is not operatingsoils tobacco shades soils with high sufficient for pressure
intake rates operation of permits use ofover tree gravity orsprinklers municipal supply.
(Source : Hurd, 1969)
Type of Sprinklers

106 Manual on Enhancing Water Use Efficiency in Canal Commands
Irrigated area is subdivided into sets or units andeach unit is irrigated separately. One cycle ofirrigation is completed when all units areirrigated. Set length is the time required to applythe desired water to a set. The number of lateralsrequired for a set can be calculated from theequation:
N = N1p/Ns
Ns = W(II) / H
H = Tsl + Tm
Where,
N = Number of laterals operating on a set
Nip = Number of lateral positions in the irrigatedarea
Ns = Number of sets
II = Irrigation interval (days)
W =Working hours per day
H = Hours between successive irrigation of a setposition
Tsl = Set length (hr)
Tm = Time needed to move the set from oneposition to another in irrigated area
8.1.3.4 Nozzle discharge
The capacity of individual sprinkler is calculatedusing the equation
360= 21 SxS
Iq
Where
Q = Required average discharge of individualsprinker (m3/hr)
S1 = Spacing between sprinkler (m)
S2= Spacing between laterals or lateral position (m)
l= Rate of application (mm/hr)
An optimum arrangement of the mains andlaterals is made based on land slope and irrigationinterval. Then the spacing and discharge ofsprinklers are determined by trial and errormethod. For example, if the field has to be
irrigated once in seven days and the laterals isrequired to be moved four times a day, then 28moves are required with one lateral and 14 moveswith the two laterals to irrigate the entire field.
8.1.3.5 Size of lateral
The diameter of the lateral pipes has to beminimum for economy and ease in handling,consistence with good sprinkler performance. Apressure variation of about 20 percent betweenthe first and last sprinkler nozzle on a lateral ispermissible in design. A 20 percent difference inpressure results in 10 percent variation indischarge of a nozzle. The quantity of waterflowing at the beginning of the lateral becomesless at each successive outlet. Therefore, thefriction losses in a sprinkler lateral graduallyreduce as water moves away from the mainline.To determine the pressure loss in a lateral, thefriction loss is first computed as in a lateral pipeline without multiple outlets. Computation canbe made by the use of Scobey’s formula:
11
91
592= .
.
sf DLV
K.H
Where,
Hf = Friction loss in the line (m/1000m)
Ks = Coefficient of retardation based on the pipematerial
L = Pipe length (m)V = Velocity of flow (m/s)D = Diameter of pipe (m)
Friction losses computed based on Scobey’sformula are presented in Table 8.1.6. The frictionloss is then multiplied by a factor (F) based onthe number of outlets or sprinklers (N) in thelateral. The empirical equation for computing theF factor is
261−+
21+
1+1=
Nm
NmF
Where
m = 1.0 of velocity exponent in Scoby’s formulaN = Number of outlets in the lineF = Factor values are calculated and presented inTable 8.1.5.

Manual on Enhancing Water Use Efficiency in Canal Commands 107
Table 8.1.5 : Scoby’s pipe friction coefficient (Ks)
Table 8.1.6 : Friction loss (m/100m) in lateral pipeline of portable aluminum pipe with coupling of9m length (based on Scobey's formula)
Flow (l/s) Diameter of pipe (cm)
5.0 cm 7.5 cm 10.0 cm 12.5 cm 15 cm(Ks = 0.34) (Ks = 0.33) (Ks = 0.32) (Ks = 0.32) (Ks = 0.32)
(1) (2) (3) (4) (5)1.26 0.321.89 2.532.52 4.49 0.56 0.1303.15 6.85 0.86 0.1983.79 9.67 1.21 0.2804.42 12.90 1.63 0.376 0.1225.05 16.70 2.10 0.484 0.1575.68 20.80 2.63 0.605 0.1966.31 25.40 3.20 0.738 0.240 0.0997.57 4.54 1.04 0.339 0.1408.83 6.09 1.40 0.454 0.18810.10 7.85 1.80 0.590 0.24211.36 9.82 2.26 0.733 0.30212.62 12.00 2.76 0.896 0.37013.88 14.4 3.30 1.07 0.44315.14 16.9 3.90 1.26 0.52216.41 19.7 4.54 1.47 0.60818.93 25.9 5.96 1.93 0.70022.72 36.6 8.40 2.74 0.79823.98 40.9 9.36 3.03 0.84625.24 44.7 10.30 3.34 0.90426.50 11.30 3.66 1.0227.76 12.3 4.0 1.1329.03 13.4 4.35 1.2630.29 14.6 4.72 1.3831.55 15.8 5.10 1.51
Type of pipe material Ks
Asbestos-cement plastic 0.32
Cement-lined cast iron, dipped and wrapped steel 0.36
Unprotected steel (new), alminium pipe with couplings 0.40
Slightly used steel 0.44
15-year old steel or iron 0.48
Rough interior 0.54
Very rough interior 0.60

108 Manual on Enhancing Water Use Efficiency in Canal Commands
34.70 18.9 6.12 1.6637.86 22.2 7.22 1.8041.00 25.9 8.40 1.9544.17 29.8 9.68 2.1247.32 33.8 11.0 2.5250.48 12.5 2.9853.63 14.0 3.4656.79 15.6 3.9959.94 17.3 4.5463.10 19.0 5.15
8.1.3.6 Pressure in the lateral
The sprinkler pressure refers to the averagepressure in the middle of the laterals. There is aloss of pressure in laterals due to friction loss.About 75 percent of total friction loss occurs inthe first half of the line and 25 percent in secondhalf. The pressure of the last sprinkler is obtainedby subtracting the pressure equivalent of 25percent of lateral loss from the average designpressure. For finding the pressure in the firstsprinkler, an equivalent of 75 percent of the lateralloss is added to the average design pressure alongthe lateral. The maximum and minimumpressures on sprinkler heads on a lateral are thusdetermined. These pressures should be within thepermissible pressure range of sprinkler, specifiedby the manufacturer.
8.1.3.7 Selection of size of main line, lateral lineand calculation of friction head loss: The sizesof main line and lateral line are selected as perthe discharges carried through them and thefriction loss corresponding to these discharges.
Discharge through lateral line (q)
q = sprinkler nozzle discharge x number ofsprinkler nozzle in one lateral line
Discharge through main line, Q (total dischargeof sprinkler system)
Q = Sum of the discharge through all the lateraloperating at any time
The size of diameter of pipelines is selected bygenerally a trial and error procedure, by strikinga balance between the cost of pipe and frictionlosses. Standard tables and charts are referred tofor estimating friction losses for the givendischarge, size, length of pipeline and numberof nozzles used in the line. The step by stepprocedure is given below:
Step 1 Select a given size of pipe diameter
Step 2 Assume the flow in the pipe through theentire length without sprinklers/nozzles anddetermine the friction loss
Step 3 Multiply the friction loss as in step 2above by the correction factor (Table) obtainedcorresponding to the number of sprinkler on thelateral line
Step 4 To step 3 above, add the elevationdifference if the lateral goes uphill of subtract ifit goes downhill
Step 5 Check whether the head loss computedin step 4 is within the allowable limit of 20 percentof operating head. If it is within the limit, the sizeof the pipe diameter selected in step1 above isacceptable. Otherwise another value for thediameter of the pipe is selected and the step 1through step 5 is repeated. When the value ofhead loss as obtained in step 4 is far less than theallowable value, than a smaller size of pipe, fromamong the available sizes, is considered.Otherwise, larger size is adopted

Manual on Enhancing Water Use Efficiency in Canal Commands 109
The friction loss in lateral lines can also becalculated with the help of Hazen Williamequation (for plastic pipe) and Scobey’s formula(for aluminum pipes). The friction loss calculatedfor lateral lines should be corrected withcorrection factor for multiple outlets (Table 8.1.7).An allowance pressure variation of 20 percentresults in 10 percent loss/reduction in nozzledischarge, which is an acceptable norm of design.
8.1.3.8 Size of pumping unit
The size of pumping unit depends on the totaldischarge carried through the system and totalpressure head.
Total pressure head (H,m) = Hf + Ho + Hs + Hr
Where,
Hf = Pressure head drop due to friction in lateralline + pressure head drop due to friction in mainline + pressure head changes due to elevation of
land surface ± friction head loss through fittingssuch as bend, joints etc., m
Ho = Operating pressure head required at nozzle, m
Hs = Total static head, m
Hr = Height of riser, m
The required water horse power is calculated as:
WHP = Q*H/75
Where,
Q = Total discharge, lps
H = Total head, m
The horse power of the pump, HP is given by
HP = WHP/ Ep x Em
Where,
Ep = Efficiency of pump
Em = Efficiency of motor
Table 8.1.7 : Correction factor of F for computing friction loss in a pipeline with multiple outlets
Number of outlets Value of F Number of outlets Value of F
1 1.000 16 0.377
2 0.634 17 0.375
3 0.528 18 0.373
4 0.480 19 0.372
5 0.451 20 0.371
6 0.433 21 0.370
7 0.419 22 0.369
8 0.410 23 0.368
9 0.402 24 0.367
10 0.396 25 0.366
11 0.392 26 0.365
12 0.388 27 0.364
13 0.384 28 0.363
14 0.381 29 0.362
15 0.379 30 0.360

110 Manual on Enhancing Water Use Efficiency in Canal Commands
Micro-irrigation is the universal term for drip,tickle or micro spray irrigation system. It is agrowing technology, which has the potential toenhance crop productivity, conserves soil, waterand fertilizer resources while also protecting theenvironment. Micro-irrigation is able to managehigh water potential continuously and minimizefluctuation in soil water contents in the effectiveroot zone and holds the promise of increasingcrop yields and quality of produce. It alsoprovides opportunity of judicious use of water,fertilizer and other inputs, and requires lessenergy for irrigation. Thus, microirrigation haswide adaptability in the regions where water
supply is limited and scares.
Microirrigation is being used extensively forwidely spaced row crops, with plastics or organicmulched crops, orchards, gardens, greenhousesand nurseries. It is adaptable with almost all typeof crop and almost all type of land.Microirrigation systems have shown their utilityfor problematic soils and even poor quality watercan be utilized which otherwise not possible withother irrigation methods. It can also be installedas either a surface or subsurface water applicationsystem. Types of micro irrigation differ based onthe emission devices. The most important benefitsof micro-irrigation is summed up below :
Table 8.2.1 : Water use efficiency with microirrigation system
Crop Yield increase (%) Water saving (%) Increase in water use
efficiency (%)
Water melon 88 36 195
Pomegranate 45 45 167
Sugarcane 33 56 204
Tomato 50 31 119
Banana 52 45 176
Chilly 45 63 291
Grapes 23 48 136
Groundnut 91 36 197
Sweet lime 50 61 289
Source : INCID (1994), Drip in India, New Delhi
8.2 MICRO IRRIGATION SYSTEMS (MIS)
Saving of water : The high water applicationefficiency in micro irrigation offers opportunityto use available water judiciously, effectively andefficiently (Table 8.2.1). An application efficiencyof 90% could easily be achieved for drip irrigationas compared to 60-80% for sprinkler and 40-60%for surface irrigation.
Fertilizer economy : The crop response to thefertilizer is better in the presence of propermoisture in the soil. Drip irrigation offers theopportunity of using fertilizer with irrigationwater (fertigation). Fertigation enables users toput the fertilizers in plant root zone in desired
frequency, amount and concentration atappropriate time. Various research studiesconducted in different parts of the world haveproved that supplying liquid/ soluble fertilizersthrough drip system can lead to 40-60% savingsin fertilizer application without affecting the yieldand a much higher application efficiencycompared to the conventional methods. This isin addition to the savings in water applied whichcould be anywhere from 50 to 70 per cent, besidesimprovement in quality of produce being addedadvantages.

Manual on Enhancing Water Use Efficiency in Canal Commands 111
Farmers of canal-irrigated areas are even morereluctant to adopt this technology because of lackof information and additional investmentrequired to ensure regular water supply foroperation of the system. In summer, canal isusually closed for 2-3 weeks for cleaning andrepair or due to shortage of water at heads etc.The authorities distribute water among thefarmers and the turn for canal water supplyhardly comes once in a week. The situation atthe tail of canal is more severe as water supply ismore erratic. Construction of a water storagereservoir of sufficient capacity is required tomaintain the water supply during canal offperiods to operate the microirrigation system.Since, water scarcity is increasing day by day, thefarmers need to be convinced to adopt microirrigation system in order to utilize efficiently andeffectively the limited water resource availablefor the irrigation.
8.2.2 Secondary reservoir for storage of canalwater
Water management assumes paramountimportance to reduce the wastage of water,increase water use efficiency and ensure equitabledistribution. Unscientific and injudicious use ofcanal water resulted in heavy conveyance andwater application losses, and cause water loggingand salinity in canal command. Besides this, canalwater supply is not regular throughout the year.Further, the authorities distribute water amongthe farmers and the turn for canal water supplyhardly comes once in a week. The situation atthe tail of canal is more severe as water supply ismore erratic. Construction of a water storagereservoir of sufficient capacity is required tomaintain the water supply during canal off-periods for higher water productivity. Secondaryreservoirs are storage structures (ponds) locatedin irrigated areas that allow farmers to store apart of canal water and use judiciously. Sometime, during lean period or in rainy season when
canal water is not needed for irrigation can alsobe stored in secondary reservoir for using duringcritical periods. Similarly, in period of scarcity,even underground water can also be used bymixing with canal water. Storage of canal waterin service reservoir (pond) and judiciousutilization of stored water provide an excellentopportunity to enhance the water productivityand save water to enable bringing more areaunder cultivation in canal command. Hence,service reservoir can be an integral componentof irrigation system in canal command to provideensured irrigation for higher productivity.Further, introduction of microirrigation in theseareas can further improve the water productivityby growing high value crops from the storedprecious water. In South-west Punjab, WesternHaryana and Northern Rajasthan, where canalwater is being used for irrigation, the technologyof secondary service reservoir is gainingpopularity and many farmers are constructedsecondary reserior (ponds) for storage of canalwater.
8.2.3 Components of drip irrigation System
A typical drip irrigation system and differentcomponents of the system are shown in Fig 1 and2. Components of microirrigation system are:
Water source
Filter
Fertiligation unit
Main and submain pipes
Lateral pipes
Emitters
a) Water Source : For the present case, the watersource is a service reservoir, which is fed by waterflow from canal distributary / minor or watercourse. The water from the reservoir is pumpedto main line to create necessary pressure head tooperate the system.
8.2.1 MICRO IRRIGATION IN CANAL COMMAND

112 Manual on Enhancing Water Use Efficiency in Canal Commands
b) Filter : Filters are used to minimize or preventinflow of possible suspended material in thewater to the pipeline and dripper network. Thetypes of filters are: Sand filter, Media filter, orScreen filter. Screen filters are popular becausethey are relatively less expensive, easy to installand take up less space than a media filter. Screenfilters can be used as primary or secondary filterand can be operated either manually or byautomatic controls. Screen filters usually workwell with low to moderate loading of inorganiccontaminants and where virtually no organic orchemical contaminants are present.
c) Main and sub-main pipe : Rigid PVC andHDPE pipes are used as main pipe to minimizecorrosion and clogging. The main pipe isgenerally laid underground and supply water tosub-main pipes. Diameter of main and sub mainpipes depend on the water requirement of cropand size of the fields. Both main and sub mainlines are provided with flush valve at the outletsto occasionally flush the pipes to removesediments from the pipes. Normally, pipes of 65mm diameter and above with a pressure ratingof 4 to 10 kg/cm2 are recommended for mainpipes. Rigid PVC, HDPE or low-densitypolyethylene (LDPE) is used as sub main pipe.Pipes having an outer diameter ranging from 32mm to 75 mm with a pressure rating of 6.0 kg/cm2 are used as sub main pipe.
d) Lateral pipe : Laterals are the pipes on whichdrippers are connected or drippers are made partof lateral e.g. for inline drippers. Lateral lines are
usually made of linear low-density polyethylene(LLDPE) ranging from 10 mm to 20 mm diameterwith wall thickness varying from 1 to 3 mm witha pressure ratings of 2.5 kg/cm2. Lateral pipesshould be flexible, non-corrodible and resistantto solar radiation. LLDPE gives better protectionagainst ultra violet rays and longer life thanLDPE. Each lateral is connected to either the mainor a sub main pipe. Water flow in each lateraldepends upon the number of drippers on thatlateral and the pressure head provided.
e) Emitters : Emitters are the devices that areused to apply the required amount of wateruniformly from the lateral to the root zone of theplants. The drippers on the basis of theirapplication are classified into three types namely,point source, line source and disc source.
i) Point source drippers discharge water fromindividual or multiple outlets. They are widelyused for fruit crops.
ii) Line source drippers are used primarily onsmall fruits, vegetables or other closely spacedcrops.
iii)Disc source drippers include micro sprinklers,micro sprayers and bubblers, which can be usedfor close-growing crops and small fruit plants.
f) Fittings and accessories
PVC pipes can be joined using PVC resin andHDPE pipes can be joined using heat butt-welding. Polyethylene tubing are normally notcementable, and are connected with barbed orcompression fittings. Common PVC fittings are
Fig. 1. Typical drip irrigation system Fig 2 Different components of the micro irrigation system

Manual on Enhancing Water Use Efficiency in Canal Commands 113
elbows, reducer, tees, straight connector, end capand gate valve. Accessories include gate valve,tee, joiner, elbow, end caps and grommet takeoffetc. All these components are available in 4, 10,12, 16 and 20 mm sizes. These takeouts/starterand rubber grommet are used for taking outlaterals lines from sub-main, connector, bend andend caps are used in drip laterals.
8.2.4 Design of drip system
8.2.4.1 Estimation of Water and PowerRequirement
Knowledge about the irrigation scheduling i.e.amount and time of water application isimportant to realize the benefits of drip irrigationsystem and saving of water with better yield andquality of produce. For this, crop waterrequirement is to be estimated which needs to besupplemented through irrigation.
water requirement for fully grown plant can becalculated as
A.C.K.K.EV ccpp= (1)
Net volume of irrigation to be applied is givenby
Vn = V- Re.A (2)
If Vn is negative, then Vn=0. Total time of dripirrigation application to meet the waterrequirement is estimated as
q
VT n=
(3)
Where, V is the Water requirement (L/day/plant); Ep is the Evaporation from Class A pan(mm/day); Kp is the pan factor; Kc is the Cropfactor as given in Table 8.2.2; Cc is the Canopyfactor (Cc=1 for closed spaced field crops, Cc=wetted area/plant); A is the area covered by eachplant (m2); Re is the effective rainfall (mm); and qis the emitter discharge (L/h).
However, water application may be decided asdaily, alternate day or any other frequency asrecommended for the location for a given cropin a particular month, the time of operation ofthe system is estimated using eq (3) bymultiplying T by irrigation interval (days).
8.2.4.3 Design of laterals, main
Normally, pump is used to create the pressurehead required to operate the system. In anefficient drip irrigation system all the drippers(or orifices) are considered to deliver the samevolume of water in a given irrigation time. Thedripper flow variation caused by water pressureand head loss due to the friction in the pipes canbe controlled by hydraulic design.
Flow in different components:
Flow carried by laterals, pel n.n.qQ = (4)
Flow carried by submain,
llsm n.QQ =
(5)
Flow carried by main,
msmm n.QQ =
(6)
Where n is the numbers of units, and subscriptse, p, l, sm, and m are used for emitters, emittersper plant, lateral, submain and main,respectively.
Crop Cropcoefficient
Beans, green 0.90Cabbage 0.80Corn, sweet 0.95Onion, dry 0.90Onion, green 0.80Pea 0.95Peper 0.80Watermelon 0.85Citrus, Kinnow 0.60Grapes 0.70Pecans, almonds, apricots, 0.75plums, peaches, pomegranateWalnuts, apples 0.85Melons, peanuts, lettuce 0.95Carrots, beans 1.00Cotton, potato, tomato, peas 1.00Corn, sugar-beet 1.10
Table 8.2.2 : Crop coefficients of selected crop
8.2.4.2 Irrigation scheduling
Water requirement of crops (WR) is a function ofnature of plant, area covered by the plant andpotential evapotranspiration rate. Irrigationwater requirement has to be calculated for eachplant and thereafter for the whole plot based onplant population for different seasons. The daily

114 Manual on Enhancing Water Use Efficiency in Canal Commands
The friction head loss in pipes (hf) in m, can beestimated by using the following formula
d75.4
75.1
f F.LD
Q78900h ⎥
⎦
⎤⎢⎣
⎡=
(7)
where L is length of pipe (m); Q is discharge (L/s); Fd is factor for multiple outlet (Table 8.2.3); Dis diameter of pipe.
Total friction head drop can be calculated as
Hf = hfm + hfsm + hfl (8)
Where hfm is friction loss in main (m); hfsm isfriction head loss in sub-mains (m); and hfl isfriction head loss of laterals (m).
Total Pumping Head can be calculated as
H = Hf + He + Hs (9)
Where He is the operating pressure head requiredat the dripper (m); and Hs is suction head (m)
8.2.4.4 Slection of pump
The capacity of pump required to create requiredpressure head (H) is estimated in HP as
η5.7
d.H.P.H m= (10)
Where dm is the discharge for mainline (L/s); andh is the pump overall efficiency in (fraction).
The design of lateral pipe involves selection ofpipe for a given length, which can deliverrequired quantity of water to the plant. Indesigning the lateral, the discharge and operatingpressure at drippers are required to be knownand accordingly, the allowable head can bedetermines by the same formula as the main line.However, the following criterion needs to befulfilled while designing the system.
1. The head loss in the lateral between the firstand last emitter should be within 10 per centof the head available at the first emitter.
2. The friction head loss in the mainline shouldnot exceed 1m/ 100m length of the mainline.Friction head loss for various discharges isgiven in Table 8.2.4.
Table 8.2.4 : Friction head losses in Meters per 100 m Pipe Length
Table 8.2.3 Correction factor (F) for frictionlosses with multiple outlets
Outlets number Correction factor, Fd
1 1.002 0.634 0.486 0.438 0.4112 0.3916 0.3820 0.37>20 0.36
Flow Inside diameter (mm)
(L/s) 9.2 11.7 12.7 13.9 15.8 18.0 19.0200 10.2 5.2 2.5 1.7 0.8 0.4 0.3400 39.0 18.0 8.6 5.7 2.7 1.6 1.1600 39.0 18.0 13.0 5.9 3.2 2.5800 30.0 21.0 10.0 5.5 4.11000 42.0 30.0 16.0 8.3 6.21200 45.0 21.0 11.0 8.8 6.41400 56.0 28.0 16.0 11.01600 36.0 20.0 15.01800 45.0 25.0 19.02000 54.0 30.0 23.0

Manual on Enhancing Water Use Efficiency in Canal Commands 115
8.2.5 Example of design of a drip system
1.) A Farmer propose to install drip irrigationsystem for a new pomegranate plantationon a 1 ha plot.
Given : Area – 1.0 ha (100 x 100 m2) of nearly flatland;
Water source – farm pond with water level 5mbelow ground level;
Crop – Pomegranate at 4m x 3m spacing in dryhot climate (peak pan evaporation 8.58 mm/day)in sandy loam soil (Table 8.2.5).
Crop co-efficient for pomegranate, Kc = 0.75; Panco-efficient, Kp = 0.75; Cc = 0.48
No. of plants (np) = 10000/(4x3)= 833
Estimation of water requirements
For the designing of an irrigation system, waterrequirement is determined with the peak valueof evapotranspiration.
V = 8.58 x 0.75 x 0.75 x 0.48 x 12 = 27.80 L/day orsay 28 L/day per plant
Irrigation requirement per day for 1 ha
Vp = V x 833 = 28 x 833 = 23324 L/day/ha
Capacity of service reservoir
Assuming water application efficiency, h = 90%
Hence, actual irrigation water requirement =23324/0.90 = 25916 = 25.91 m3/day/ha
Since farmer gets his turn once in a week, hence,the weekly water requirement = 25.91 x 7 = 181.37say 181 m3
Considering for canal closer for longer periods,dead storage need, and other factors, the volumeneeds to be multiplied with safety factor. A valueof safety factor as 2 may conveniently be assumedfor the present case. Assuming 10% evaporationlosses, the total volume of water to be stored inservice reservoir = 181 x 2 x (1+10/100) =398 m3
or 400 m3.
If reservoir is proposed to be constructed withtrapezoidal section (3:1) of square shape anddepth is restricted to 2 m because of high groundwater table and poor quality
The surface area of the pond = 400 /2 = 200 m2
Number of emitters
Water requirement per plant is 28 L/day. If weuse emitter of 4 L/s discharge and four emittersaround each plant, then the number of emittersrequired for 1 ha = 833 x 4 = 3332
Time of emitter operations = 4x4
28= 1.75 hr or
one hour 45 min.
System capacity
Mainline Capacity (flow rate) = 3600
4x3332 = 3.70
lps
Lateral
For one hectare area, 50 laterals, 25 on each sideof the main pipe will be laid having a length of49 m each.
Capacity of each lateral = 50
70.3 = 0.074 lps
Table 8.2.5 Montly average pan evaporation(for Abohar, Punjab)
8.2.5 EXAMPLE OF DESIGN OF A DRIP SYSTEM
Month of the year Pan evaporation (mm)
January 1.16February 2.50March 4.36April 6.01May 8.58June 8.30July 4.96August 4.52September 4.81October 4.81November 2.87December 1.21
Diameter of lateral
Length of each lateral, L = 49 m
Flow rate of each lateral, Q= 0.074 lps

116 Manual on Enhancing Water Use Efficiency in Canal Commands
Lateral is a multiple out let pipe with 16 outlet
Hence Fd = 0.38
Head loss due to friction (by using equitation (3)
Let the diameter of lateral pipe (D) = 12 mm
Hf = 789000x 49 x (0.074) 1.75 x 12-4.75x 0.38= 1.15 m
Elevation head = 0 (flat)
Total head loss = 1.15 +0 = 1.15 m
Total head loss in a lateral is 1.15 m (this is greaterthan 10%) of normal operating pressure in thelaterals i.e. 1 kg/cm2 or 10 m of water head.Hence, the 12 mm size of the pipe is notacceptable.
Therefore, take bigger diameter,
Since, the next higher size available in the marketis 16 mm
Let assume the lateral Diameter (D) is 16 mm fordesign.
Head loss due to friction in 16 mm lateral (byusing equitation (3)
Hf = 789000x 49 x (0.074) 1.75 x 16-4.75x 0.38 = 0.29 m
Elevation head = 0 (flat)
Total head loss = 0.29 +0 = 0.29 m
Total head loss in a lateral is 0.29 m (this is lessthan 10%) of normal operating pressure in thelaterals i.e. 1 kg/cm2 or 10 m of water head.Hence, the 16 mm size of the lateral pipe isacceptable.
Diameter of main pipe
Let the diameter of main pipe be 50 mm.
Length of main pipe = 100 m
Main is also multi out let pipe with 50 outlets (50laterals on either side) and hence
Fd = 0.36
Hence, head loss in pipe due to friction (by usingequitation (3)
Hf = 789000x (3.70)1.75 x (50) - 4.75 x 100 x 0.36 = 2.38m
Elevation head = 0
Total head loss in main pipe = 2.38 + 0 = 2.38 m(this is greater than 10% of normal operatingpressure.
Therefore, the pipe of 50 mm diameter is notacceptable for use as a main pipe.
Since, the next higher size available in the marketis 63 mm
Let assume the main diameter (D) is 63 mm fordesign.
Head loss due to friction in 63 mm pipe (by usingequitation (3)
Hf = 789000x (3.70)1.75 x (63) - 4.75 x 100 x 0.36 = 2.38m
Elevation head = 0
Total head loss in main pipe = 0.80 + 0 = 0.80 m(this is less than 10% of normal operatingpressure.
Therefore, the pipe of 63 mm diameter isacceptable as a main pipe.
Size of pumping unit:
i) Suction head – 5 m
ii) Head loss in fiting and accessories = 2m
iii) Head required for operation = 10 m
iv) Friction loss in lateral pipes = 0.29 x 50 =14.50 m
v) Friction loss in main pipes = 0.80
Total friction loss = 15.30 m
Total head = (5+2+10+15.30) = 32.30 m
Let the overall efficiency of pump
E = 60% (Electric pump)
HP = 60.075
30.3270.3
××
= 2.65 say 3.0 hp

Manual on Enhancing Water Use Efficiency in Canal Commands 117
2) A Farmer propose to install drip irrigationsystem for a new kinnow plantation on a 1ha
plot
Basic data available is:
Area = 1 ha (100 x 100 m2)
Topography = nearly flat
Water to be pumped from a farm pond and waterlevel in the pond in 5 m below the level of thefarm
Crop = Kinnow
Details about designing of drip irrigation system for 1 ha pomegranate orchard
Sr. No. Components Specification
1. Capacity of water storage tank 400 m3
2. Pumping unit 3.0 hp (H=35m)3. Sand filter (6.48 m3/hr) 16.0 m3/h4. Screen filter (6.48 m3/hr) 16 m3/hr5. Pressure gauge 0-2 kg/cm2 2 nos6. Gate valve 63 mm, 3 Nos7. Main pipe 63 mm diameter, PVC, 100 m long8. Laterals 16 mm diameter, LLDPE, 2500 m9. Laterals for loop around the plant 12 mm diameter, LLDPE, 3270 m10. Drippers 4.0 lph, 3333 nos11. Fittings (Tee, Bend, connector, end cap, As per requirements
grommet, air release valve & thresh valve)
Spacing = 6 m x 6 m
Climate = dry hot
Soil type = Sandy loam
Pan evaporation (peak) = 8.58 mm
Crop co-efficient for kinnow, Kc = 0.6 (Table 1)
Pan co-efficient, Kp = 0.75
Lateral spacing = 6 m
Cc = 0.56
No. of plants (np) = 278
Design procedure is same as in example 1.
The Detail requirement for adopting drip irrigation system in 1 ha kinnow orchard is as follow
Sr. No. Components Specification
1. Capacity of water storage tank 371 m3
2. Pumping unit 2.0 hp (H=35m)3. Sand filter 10.0 m3/h4. Screen filter 10 m3/hr5. Pressure gauge 0-2 kg/cm2 2 nos6. Gate valve 63 mm, 3 Nos7. Main pipe 63 mm diameter, PVC, 100 m long8. Laterals 16 mm diameter, LLDPE, 1670 m9. Laterals for loop around the plant 12 mm diameter, LLDPE, 1390 m10. Drippers 8.0 lph, 834 nos11. Fittings (Tee, Bend, connector, end cap, As per requirements
grommet, air release valve & thresh valve)

118 Manual on Enhancing Water Use Efficiency in Canal Commands
9.0 DR9.0 DR9.0 DR9.0 DR9.0 DRAINAAINAAINAAINAAINAGE SYSTEM FOR WAGE SYSTEM FOR WAGE SYSTEM FOR WAGE SYSTEM FOR WAGE SYSTEM FOR WATERLTERLTERLTERLTERLOGGED SALINEOGGED SALINEOGGED SALINEOGGED SALINEOGGED SALINESOILS IN CANAL COMMANDSSOILS IN CANAL COMMANDSSOILS IN CANAL COMMANDSSOILS IN CANAL COMMANDSSOILS IN CANAL COMMANDSM.J.M.J.M.J.M.J.M.J. KKKKKaledhonkaledhonkaledhonkaledhonkaledhonkar and ar and ar and ar and ar and SSSSSaaaaatyendrtyendrtyendrtyendrtyendra a a a a KKKKKumarumarumarumarumar
Irrigation induced waterlogging and soil salinityproblems are generally observed in irrigationcommands of large irrigation projects in manystates of India as result of over irrigation, flattopography with lack of natural outlet or heavynature of soil impeding natural drainage. Theseproblems adversely affect the production andproductivity as well as threaten the sustainabilityof irrigated agriculture. It has been estimated that8.5 million ha land has been affected by salinityand alkalinity (Singh, 1996). As per revisedestimate the salt soils are estimated as 6.73 M ha.The alluvial soils of Indo-Gangetic plains ofnorth- west India are very deep and thetopography is flat. The climate is semi-arid toarid. Waterlogging and secondary salinisationproblems are extending steadily over the yearsin various irrigation basins of these plains. About0.7 to 1.0 million ha semi –arid part of Punjab,Haryana, North- western Rajastan and WesternUttar Pradesh is affected by these problems andaffected area is increasing alarmingly (IPTRID,1993). It is also observed that large areas inGangetic plain of north India suffer from criticaland semi-critical waterlogging. Waterlogging iscalled as critical, if watertable fluctuates between0- 2 m below ground surface. It is treated as semi-critical, if fluctuates between 2-3 m below groundsurface. Critical and semi-critical waterloggedareas, in the Gangetic plains of Uttar Pradesh, are3.3 and 4.6 million ha, respectively (Rai, 2003).Waterlogging and soil salinity problems are alsoreported in irrigation commands in states ofMaharashtra, Karnataka, Andhra PradeshMadhya Pradesh and Gujarat due to heavy natureof soils, which have low permeability values.These problems are also reported in non-command areas of these states due to cultivationof sugar cane crop with lift irrigation schemes.
Drainage is the artificial removal of water inexcess of the quantity required for the crop.Drainage includes removal of excess surface andsubsurface water in the root zone. Irrigation anddrainage go together and are not mutuallyexclusive. Irrigation system aims at supplyingoptimum quantities of water throughout the cropperiod. Drainage system aims at removing excessquantity of water in a short time. Often, both maybe required together to assure sustained and highlevel of production of crops. In the planning ofmost of the existing irrigation projects in ourcountry, provision was not made for adequatedrainage in the command areas. Water table builtup steadily due to high seepage and percolationlosses, consistent over irrigation, spillage fromcanal systems and not using groundwater.Waterlogging and salinisation have thrownconsiderable acreage in the command area outof production. The importance of providingadequate drainage in command area of projectsneeds no emphasis.
Most of the saline soils in irrigation commandsare underlain by poor quality ground waters.Studies have shown that in these circumstancesvertical drainage by tube well have limitedapplication. Subsurface (horizontal) drainageappears as promising under these situations asthe drainage effluent disposal problem isminimized. A subsurface drainage systemconstitutes the laterals, the collectors and themain drains. The following subsections providedetails related drainage investigations, designcriteria, envelope material and installation,operation and maintenance of subsurfacedrainage system. The post drainage managementaspects are also covered in details.
9.1 Drainage Investigations
The pre-drainage investigations can be conductedat three levels i.e. the reconnaissance, the semi-

Manual on Enhancing Water Use Efficiency in Canal Commands 119
detailed and detailed surveys of the area. Thereconnaissance survey helps in determining thetechnical and economic feasibility of the proposedproject. The semi-detailed survey corresponds tothe level of feasibility studies, which enable todecide the optimal plan, for execution. A detailedsurvey involves the collection of all relevant fielddata (Such as topographical map, Temporalground water table depth and quality
information, Spatial groundwater composition,Soil details, Cropping pattern, Irrigation sourcesand methods of irrigation, Sources of excesswater, soil hydrological characteristics(hydraulic conductivity, drainable pore space,infiltration rate) that allows an effective designof the drainage system. The brief details ofexpected output of these surveys are given inTable 9.1.
9.1.1 Drainage Criteria
The agricultural drainage criteria is defined asthe state to which the original waterlogging onor in the soil is to be reduced by a drainage systemso that the maximum agricultural benefit of thesystem is attained. When designing a system fora particular area, the drainage engineer must usecertain criteria to determine whether or not wateris in excess. Drainage engineer, besidesagricultural drainage criteria, should alsoemploy:
Technical drainage criteria (for theminimization of the cost of system whilemaintaining the agricultural criteria),
Environmental criteria (for the minimizationof the environmental damage), and
Economic drainage criteria (for themaximization of the net benefits)
9.1.2 Subsurface Drainage Coefficient
It is the depth excess water in cm to be drainedoff from a given area in 24 hours. It is the mostimportant parameter that decides the lateral drainspacing, size of the laterals and collectors and
capacity of the pump to dispose off the drainageeffluent. The drainage coefficient for some of thesites in India has been observed to be in the rangeof 1-5 mm (Table 9.2) and guidelines on type ofclimate are given in Table 9.3. Drainagecoefficient can be estimated any area by studyingthe groundwater balance.
9.2 Design of Subsurface Drainage System
a) Depth of laterals
Depth and spacing of laterals should be plannedaccording to agricultural drainage criteria. Thedrain depth is also decided by the selectedconstruction method, the available machineryand drain specifications. Drains need to beinstalled at depths, where chances of damage dueto agricultural operations are less. Drain depthis decided on the basis of depth to water table forproper aeration in the root zone, cost of system,presence of unstable or impermeable layers, soiltexture and strata permeability, land topography,minimum soil grade and outlet conditions. Toprotect the pipes against damage due to passageof heavy machinery, the minimum drain depths
Table 9.1 : Types of drainage investigations
Type of drainage Expected outputinvestigation
Reconnaissance Identification of need for drainage; Mapping/inventory of existing/available surveyinformation (Scale 1:50,000 to 1:250,000); Identification of additional investigation to becarried out.
Semi-detailed Preliminary plan of the future drainage system(Scale 1:10,000 to 1:25,000); survey Roughestimate (to an accuracy of 10 to 20%) of the costs.
Detailed survey Recommended drainage techniques and their layout (Scale 1:2500 to 1:5000);Construction plans and specifications

120 Manual on Enhancing Water Use Efficiency in Canal Commands
have been recommended which vary from onesoil type to another (Table 9.4).
To achieve this depth to water table at the mid-point of the two laterals, depending upon the soiltype and hydraulic characteristic, drain depthshould be kept in the range of 125-150 cm. Thegeneral guidelines for drain depths on the basisof outlet are given in Table 9.5. Apparently, theserecommendations take care of minimum soilcover required against breakage of pipes.
On the basis of experience at CSSRI, Karnal,it is recommended that drains should not belaid less than 1.5 m depth from ground surface.
Table 9.4 : Subsurface drainage coefficients fromdifferent locations (as observed from test plots)
Soil type Minimumsoil cover (cm)
Mineral 60
Deep peat and muck 120
Organic 75
Table 9.2 : Subsurface drainage coefficients from different locations (as observed from test plots)
Site Rainfall Rate Recommended Range(mm) (mm day-1) (mm day-1)
Chambal (Rajasthan) 850* 3.0 2.5 - 3.5
Sampla (Haryana) 600 2.5 2.0 - 3.0
Hisar (Haryana) 400 2.0 1.5 - 2.5
Dabhou (Gujarat) 800 4.0 3.0 - 5.0
Mundlana (Haryana) 500 5.0 5.0 - -
Kailanakhas (Haryana) 500 6.8 5.0 - 7.0
Muraj (Gujarat) 500 2.8 2.0 - 4.0* Variation in the range of 600-1400 mm. Source: Gupta and Gupta (1997)
Table 9.3 : Guidelines on drainage coefficient for subsurface drainage
Climatic conditions Range (mm day-1) Optimum value (mm)
Arid 1-2 1
Semi-arid 1-3 2
Sub-humid 2-5 3
Table 9.5 : Guidelines on drain depth
Outlet conditions Depth of the drains Optimum depth (m)
Gravity 0.9-1.2 1.1
Pumped 1.2-1.8 1.5
Otherwise drains get damaged due toagricultural operations. On the basis ofdesirable minimum average water table depthsfor various types of uses, shallow drains (1.2m – 1.8 m) can be successfully used to maintainwater table at desirable depths. Guidelines foroptimum depth to water table for various cropsand soil types are given in Table 9.6.
On the basis of this discussion in the Indiancontext, shallow drains (depth 1.2 – 1.5 m) couldbe cost effective in reclamation and managementof saline soils.b) Spacing of lateral drainsAssuming the steady state drainage criteria anddepth of laterals, spacing between the laterals canbe computed using Hooghout’s formula.

Manual on Enhancing Water Use Efficiency in Canal Commands 121
Table 9.6 : Guidelines for optimum depth to water table for various crops
Crop Soil type Water table depth (m)
Irrigated annual crops Loamy, sandy loam, silt loam 0.6 -0.8
Perennial crops Clay loam, clay silt 0.8 – 1.0
*Average seasonal depth = 1.0 m
2
248
S
kHkdHq
+=
(1)
where
q = drain discharge (m/d) or unit flow ratethrough plane (m2/d); k = hydraulic conductivityof the soil (m/d); d = depth to impervious layer(m); H = height of watertable at midway betweenthe drains (m); S = drain spacing (m)
Equation (1) can be written as:
2
2
2
48
S
kH
S
kdHq += (2)
If drains are located on the impervious layer (i.e.d=0), the first term of Equation (2) becomesnegligible. In case of d >>H, the second term ofEquation (2) becomes negligible. If d>>H, animaginary impervious layer above real one canbe assumed. The imaginary layer decreases thethickness of layer through which water flowstowards the drains. It is assumed that suchimaginary impervious layer exists at equivalentdepth (de). Hence Equation (2) becomes:
2
2
2
48
S
Hk
S
Hdkq teb += (3)
where
Kt = Hydraulic conductivity of the layer abovedrain level (m/d)
Kb = Hydraulic conductivity of the layer belowdrain level (m/d)
The Equation (3) can be solved through iteration.However, nomographs are also available, whichvalue of de can be read easily.
c) Guidelines on lateral drain spacing and grade
While these equations can be used to design adrainage system for site-specific conditions,design guidelines have been prepared on the
basis of field experiences (Table 9.7) andguidelines for grade are given in Table 9.8.
Table 9.7 : Guidelines on lateral drain spacing
Soil texture Spacing of drains (m)
Light textured 100-150
Medium textured 50-100
Heavy textured
including vertisols 30-50
Table 9.8 : Minimum grade for pipe drains
Drain size (mm) Grade (%)
100 0.10
125 0.07
150 0.05
d) Sizes of lateral, collector and main drain
The areas that can be drained with differentslopes and different diameters of pipes can becomputed with a capacity limitation of 60% forpipes less than 100 mm in diameter and 75% forpipes for more than 100 mm diameter (due to siltdeposition, pipe deflection, etc.) with followingEquation (4) and (5).
Q = q*A = 2.0 * 106 * d 2.67 *i 0.5
if d < = 100 mm (4)
Q = q*A = 2.5 * 106 * d 2.67 *i 0.5
if d > 100 mm (5)
where
Q = drainage volume (m3/d); A = drainable area(m2) ; q = drainage coefficient (m/d); d = internaldiameter of the pipe (m); i = slope of lateral line(m/m)

122 Manual on Enhancing Water Use Efficiency in Canal Commands
9.2.1 Drain Envelope Material
A drain envelope is porous material placedaround a perforated pipe drain to performdifferent functions such as filter, hydraulic andmechanical and bedding functions.
Filter function prevents or limits themovement of soil particles into drainpipe,where they may settle and eventually clogthe drainpipe.
Hydraulic function provides a porous
medium of relatively high permeabilityaround the pipe to reduce entrance resistanceat or near the drain openings.
Mechanical function provides passivemechanical support to the pipe in order toprevent excess deflection and damage to thepipe due to soil load. Bedding function,which is only accomplished by use of a gravelenvelope, provides a stable base to supportthe pipe in order to vertical displacement dueto soil load during and after construction.
i) Types of envelope material
Based on the material used he following types of envelopes can be distinguished.
Granular envelopes Gravel or sand gravel combinations
Organic envelopes Organic materials such as peat or top soil, building paper,hay straw, cloth burlap, corn cobs, leather, wood chips, wirecoir or coconut fibre, etc.
Fabric (synthetic) envelopes Woven and non-woven materials
ii) Layout of Subsurface Drainage System
Drainage systems could be laid out in the field ina number of ways. The basic principles ofdesigning a layout are :
The mains should be put along naturaldrainage line.
Main and laterals should be, as far aspossible, placed in straight lines.
Laterals should be given the greatest fallpossible by running them down the slopeexcept in cases of intercepting seepage water.
Laterals should be in long lengths rather thanshort ones in order to eliminate doubledrainage due to the mains and laterals.
The land should be equally drained.
The number of outlets should be theminimum.
Layout can be classified as random, herringbone,gridiron and interceptor. Combinations of twoor more of these types are frequently required tocomplete drainage of whole area.
9.2.2 Drainage Structures
Manhole: The manhole or sedimentation basinis any type of structure that provides for sedimentaccumulation, thus reducing deposition in thetile. The manhole should be cleaned at regularinterval.
Junction boxes: Junction boxes are used wheretwo or more mains or submains join or whereseveral laterals join at different elevations. Asediment basin should be integral part of thejunction box.
Surface inlets: In some heavy soils water tendsto collect at low spots and it may be desirable toprovide surface inlet to water to get into drainthrough manhole or junction box through siltbasin.
Blind inlets: In case blind inlets, small section ofdrain is constructed by backfilling by stone /gravel. The collected water at low spot passesthrough backfilled material to drain.
Structure for outlet protection: Generally metalpipes are provided at outlet end, where itdischarges into drain. The flap gate is providedfrom top to avoid backwater entry into drain.

Manual on Enhancing Water Use Efficiency in Canal Commands 123
EXAMPLE OF ESTIMATION OF DRAINAGE COEFFICIENT FOR SUBSURFACE DRAINAGE
Location : Hisar
A procedure to decide the drainage criteria is explained here with the help of data of drainage Project at Hisar(Haryana) to reclaim waterlogged saline soils. Rainfall data of Hisar station for monsoon months (July, Augustand September) are analyzed for determining 1, 2, 3 and 4-day duration maximum rainfall for different returnperiods. The results of analysis of 30 years (1950 to 1979) rainfall data for the months of July, August andSeptember are presented in Table.
It can be observed that most likely duration and depth (on 10-year return period basis) for Hisar is 3 days and129 mm, respectively. It is assumed that 80% of amount of such storm may reach to ground water. It meansthat 103 mm of effective rainfall will give rise of 103 cm of water by considering drainable porosity of 0.1. Itmay increase the water table level from 150 cm below ground surface to 50 cm below ground surface. Still thewater level remains safe for crops tolerant to water logging. Thus, it eliminates need of rapid removal of water.
Drainage system is required to remove the recharge contributions of rainwater and deep percolation lossesfrom the applied irrigation water. For this purposes the recharge from rainstorms of July, August and Septemberhave been considered. The average annual rainfall for these months at Hisar is about 336 mm. For Hisar areathe contribution to groundwater has been assumed to be 20% of the total rainfall of the period. The expecteddeep percolation losses from irrigation applications of 132 mm of canal water for same months are taken at35%. With these assumptions the recharge from rainfall and deep percolation losses would be 67.2 and 46.2mm. Neglecting subsurface inflow and capillary rise from watertable during dry periods, the drainage coefficientwould be 1.26 mm/day i.e. 1.5 mm/day. This drainage coefficient is used in design of subsurface drainagesystem.
i) Determination of drain spacing for drainage
Hooghout’s formula i.e. equation (1) as explained earlier is to be used for calculation of drain spacing. Insteadof d, Equivalent depth is to be used.
Available data of site of study are as below:Rainfall depths of different durations at variousreturn periods at Hisar
Duration Rainfall depth, mm(days) Return periods, years
5 10 20
1 63 83 108
2 87 113 138
3 99 129 153
4 103 133 163
q = drain discharge (m/d) = 0.0015 m/day
(Drain discharge is taken equal to drainage coefficientof 1.5 mm/day)
k = hydraulic conductivity of the soil (m/d) = 0.5 m/day
de = equivalent depth to impervious layer (m) = 2.66m (determined using monograph)
The depth of impervious layer was taken as 4.5 m asin some profiles the soil changed from loamy sand tosilt loam in the depth range of 4.5 to 5m and equivalent depth was estimated as 2.66 m from monograph.
H = height of water table at midway between the drains (m) = 0.75 mThe drain spacing (S) in m was determined putting above data in Equation (1). Spacing between the drains wasdetermined as 77.9 m. For field installation, drain spacing of 75 m was adopted.ii) Determination of sizes of lateral, collector and main drain
For this project, though drainage coefficient, , was calculated as 1.5 mm/day, it could rise up to 3.0 mm/daywhen water table reaches to 0.5 m depth below ground level. The areas that can be drained with differentslopes and different diameters of pipes is computed with a capacity limitation of 60% for pipes less than 100mm in diameter and 75% for pipes for more than 100 mm diameter (due to silt deposition, pipe deflection, etc.)by using Equation (4) and (5) already explained in text. The detail of corrugated pipe, lateral drain calculatedfor the project under different slope is given below in Table.

124 Manual on Enhancing Water Use Efficiency in Canal Commands
Capacity of corrugated pipe lateral drain for the project of Hisar
Internal Q (m3/day) Drainage area (ha) Max. length at 75m spacing
diameter (mm) between laterals (m)
Slope (%) Slope (%) Slope (%)
0.1 0.15 0.1 0.15 0.1 0.15
75 62.7 76.5 2.1 2.5 278 339
100 135.2 164.8 4.5 5.5 599 730
125 306.7 374.0 10.2 12.5 1359 1659
150 498.8 608.5 16.6 20.3 2212 2699
Drainage sump: Drainage sump is the open well,where all collectors bring water. Sump is locatedlowest point in the area. Drainage water ispumped from sump at regular interval tomaintain certain water table depth in drainagearea. Pumped water from drain is disposed intosurface drain or into evaporation pond if naturaloutlet is not available. In water logged areas withsandy soils, quick sand may interfere with theinstallations of sump. To overcome the problem,it is suggested to de-water the area around thesump while sinking the structure.
Evaporation pond: The inland basin betweenIndus and Gangetic basins has no natural outletand evaporation pond appears to be as interimoption for management of saline drainageeffluent. An evaporation pond is generallyconstructed as pumped outlet for storage,evaporation or possible reuse of drainage water.
9.3 Installation of Subsurface Drainage System
The installation of subsurface drainage systembegins with construction of outlet. In absencenatural outlet, pumped outlet is constructed. Theinstallation of collectors and laterals follows theconstruction of outlet. Excavation of trenches,lying of lateral pipes along with filter materialand immediate back filling of trenches are done
to avoid any problem in event of rainfall. Properslopes of collectors and laterals are required forgravity flow of water. Manholes (RCC pipe 2.5m length and 0.6m diameter) can be installed andcollectors and laterals are connected to manholesat 20-30cm above their bottom levels so thatmanholes act as sediment trap. Installation couldbe considered as successful when all the lateralsand collectors start functioning in case ofsufficient rainfall or irrigation.
9.3.1 Operation of Subsurface Drainage System
In case of gravity outlet based subsurfacedrainage system, the system worksautomatically. In case of pumped outlet,pumping of drainage effluent is very muchnecessary for effective leaching and consequentreclamation of the waterlogged saline lands. Theoperation of subsurface drainage systemenhances leaching process. The subsurfacedrainage controls water table, reduces salinityand improves the crop yields by providing betterconditions at root zone for growth of crops.
9.3.2 Maintenance of Subsurface DrainageSystem
Pipe drain systems may fail for several reasons;some of these are mentioned below :
S.N. Problem Causes
1 Improper design Size of pipe too small; Soil cover over pipes not deep enough; Notenough surface inlets, catch basin and outlets; Improper design ofenvelopes
2 Poor maintenance Line filled with silt from openings; Watershed out catch basins andsurface inlets; Root growth; Tile not kept open; Erosion at the pipeoutlet
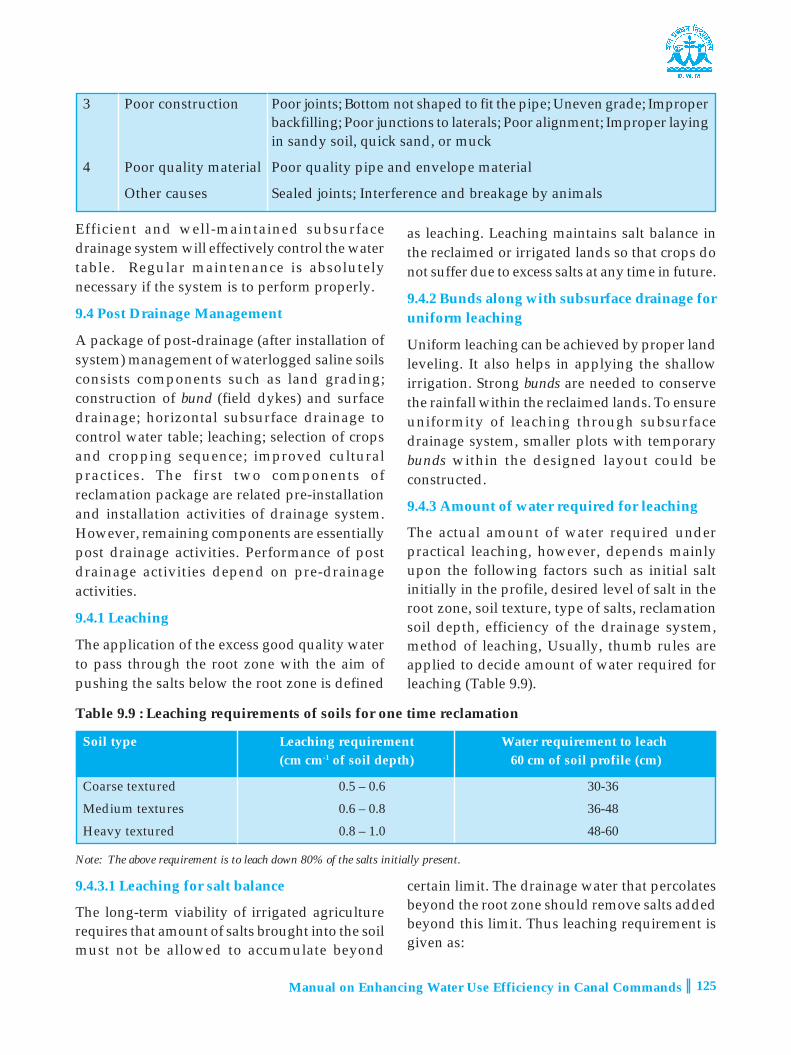
Manual on Enhancing Water Use Efficiency in Canal Commands 125
Efficient and well-maintained subsurfacedrainage system will effectively control the watertable. Regular maintenance is absolutelynecessary if the system is to perform properly.
9.4 Post Drainage Management
A package of post-drainage (after installation ofsystem) management of waterlogged saline soilsconsists components such as land grading;construction of bund (field dykes) and surfacedrainage; horizontal subsurface drainage tocontrol water table; leaching; selection of cropsand cropping sequence; improved culturalpractices. The first two components ofreclamation package are related pre-installationand installation activities of drainage system.However, remaining components are essentiallypost drainage activities. Performance of postdrainage activities depend on pre-drainageactivities.
9.4.1 Leaching
The application of the excess good quality waterto pass through the root zone with the aim ofpushing the salts below the root zone is defined
3 Poor construction Poor joints; Bottom not shaped to fit the pipe; Uneven grade; Improperbackfilling; Poor junctions to laterals; Poor alignment; Improper layingin sandy soil, quick sand, or muck
4 Poor quality material Poor quality pipe and envelope material
Other causes Sealed joints; Interference and breakage by animals
as leaching. Leaching maintains salt balance inthe reclaimed or irrigated lands so that crops donot suffer due to excess salts at any time in future.
9.4.2 Bunds along with subsurface drainage foruniform leaching
Uniform leaching can be achieved by proper landleveling. It also helps in applying the shallowirrigation. Strong bunds are needed to conservethe rainfall within the reclaimed lands. To ensureuniformity of leaching through subsurfacedrainage system, smaller plots with temporarybunds within the designed layout could beconstructed.
9.4.3 Amount of water required for leaching
The actual amount of water required underpractical leaching, however, depends mainlyupon the following factors such as initial saltinitially in the profile, desired level of salt in theroot zone, soil texture, type of salts, reclamationsoil depth, efficiency of the drainage system,method of leaching, Usually, thumb rules areapplied to decide amount of water required forleaching (Table 9.9).
Table 9.9 : Leaching requirements of soils for one time reclamation
Soil type Leaching requirement Water requirement to leach(cm cm-1 of soil depth) 60 cm of soil profile (cm)
Coarse textured 0.5 – 0.6 30-36
Medium textures 0.6 – 0.8 36-48
Heavy textured 0.8 – 1.0 48-60
Note: The above requirement is to leach down 80% of the salts initially present.
9.4.3.1 Leaching for salt balance
The long-term viability of irrigated agriculturerequires that amount of salts brought into the soilmust not be allowed to accumulate beyond
certain limit. The drainage water that percolatesbeyond the root zone should remove salts addedbeyond this limit. Thus leaching requirement isgiven as:

126 Manual on Enhancing Water Use Efficiency in Canal Commands
LR = ECi/ECd (5)
Here ECi and ECd are the electrical conductivityof the irrigation and drainage water, respectively.The LR is the theoretically average requirementof water for leaching, and LF (Leaching Fraction)is the actual fraction of the applied water thatpasses through the root zone.
9.4.4 Selection of crops and cropping sequences
Since complete reclamation is not attained in theinitial years, tolerant or semi-tolerant crops thatcan withstand expected salinity levels arepreferred in the early phase of reclamation(Table 9.10).
Table 9.10 : Crop groups based on response to salt stress
Sensitive Group Resistant Group
Highly sensitive Medium sensitive Medium tolerant Highly tolerant
Lentil Radish Spinach BarleyMash Cow pea Sugarcane Rice (transplanted)Chickpea Broad bean Indian mustard CottonBeans Vetch Rice (direct sowing) Sugar beetPeas Cabbage Wheat TurnipCarrot Cauliflower Pearl millet TobaccoOnion Cucumber Oats SafflowerLemon Gourds Alfalfa TaramiraOrange Tomato Blue panic grass Karnal grassGrape Sweet potato Para grass Date palmPeach Sorghum Rhodes grass BerPlum Minor millets Sudan grass MesquitePear Maize Guava CasuarinaApple Clover, berseem Pomegranate Tamarix
Acacia Salvadora
The recommended cropping sequences for salinesoils are:
Pearl millet-barley; Pearl millet-wheat; Pearlmillet-mustard
Sorghum-wheat or barley; Sorghum-mustard
Cluster bean-wheat or barley
Cotton-wheat or barley
9.4.5 Improved cultural practices
Improved cultural practices for salinitymanagement includes following importantcomponents.
Pre-sowing irrigation
Deep tillage and inversion
Establishing good crop stand
Chemical treatment of seeds
Sowing/Planting Practices
Nutrient Management
Irrigation water management
Alternate Land Use
Grasses for saline soils
Afforestation of saline soils
9.4.6 Effect of Irrigation Efficiencies onWatertable
The process of supplying irrigation water toagricultural fields is usually split into three partsnamely conveyance, distribution and fieldapplication and there is separate efficiency foreach part. The overall efficiency considers allthree efficiencies. If overall irrigation efficiencyis below 60%, the groundwater level rises and

Manual on Enhancing Water Use Efficiency in Canal Commands 127
vice-versa (Fig. 9.1). Thus overall efficiency canbe used as a management indicator to control thegroundwater depth below the soil surface. Thecontrol of watertable is essential to limit capillaryrise, which is responsible for re-salinisation.
9.5 Controlled Drainage
Capillary rise in drainage area is generallyavoided during the reclamation period bymaintaining the downward flux. Capillarymovement increases the soil salinisation, ifgroundwater quality is poor. However, it can beused in beneficial way provided soil hasreclaimed and groundwater quality does not poseany threat of soil salinisation. In such situation,capillary movement of groundwater in root zoneis promoted by blocking lateral drains to reducethe irrigation water requirements of the crops. InIndian scenario, other form of controlled drainage
is also observed, where farmers block the lateraldrains during paddy crop to reduce the leachingand ultimately irrigation water requirement.
9.6 Effectiveness of Subsurface Drainage System
The performance of subsurface drainage systemis evaluated on the basis of its ability to controlwaterlogging, soil salinity and improving cropyields. After reduction in soil salinity andimprovement in drainage water quality,excessive draining is avoided as water solublefertilizers are also leached out with drainagewater. The controlled drainage is more effectivein post reclamation period.
Conclusions
Provision of subsurface drainage and postdrainage management are very important forsuccessful reclamation of waterlogged saline soils
Fig. 9.1. Relation between overall irrigation efficiency of canal water and groundwater fluctuation, monthly averages

128 Manual on Enhancing Water Use Efficiency in Canal Commands
in canal commands. Effective and uniformleaching is required to maintain favourable saltbalance at root zone. The overall irrigationefficiency of drainage project area should beaccording to leaching requirement, water tablefluctuations and crops to be grown. Selection ofcrops and cultural practices should be accordingto soil salinity. Water table and soil salinity datain the drainage area should be used for furtherimprovement in post drainage watermanagement and design assumptions.
References
CSSRI, 2004. Reclamation and Management of SaltAffected Soil Affected Soils. Central Soil SalinityResearch Institute, Karnal 160p.
Gupta, S.K and Gupta, I.C. 1997. Crop Production in
Waterlogged Saline Lands. ScientificPublishers. Jodhpur, 239p.
ILRI, 1994. Drainage Principles and Applications.Publication 16, (Ed. H.P. Ritzema), ILRI,Wageningen, 1125p.
IPTRID, 1993. Proposal for Technology Research inIrrigation and Drainage, World Bank,Washington D.C. 113p.
Personal communication. 2003. Dr. D. Rai, GroundWater Department, Uttar Pradesh.
Singh, N.T. 1996. Land degradation and remedialmeasures with reference to salinity, alkalinity,waterlogging and acidity. In: NaturalResources Management for SustainableAgriculture and Environment (Deb, D.L. Ed.)Angkor Publication, New Delhi, pp. 442.

Manual on Enhancing Water Use Efficiency in Canal Commands 129
10.0 CONJUNCTIVE USE OF SALINE/ SODIC WA10.0 CONJUNCTIVE USE OF SALINE/ SODIC WA10.0 CONJUNCTIVE USE OF SALINE/ SODIC WA10.0 CONJUNCTIVE USE OF SALINE/ SODIC WA10.0 CONJUNCTIVE USE OF SALINE/ SODIC WATER INTER INTER INTER INTER INCANAL COMMANDSCANAL COMMANDSCANAL COMMANDSCANAL COMMANDSCANAL COMMANDS
M.J. KM.J. KM.J. KM.J. KM.J. Kaledhonkaledhonkaledhonkaledhonkaledhonkararararar
The ground water surveys in India indicate thatdifferent states use poor quality water in therange of 32 to 84% of the total ground waterdevelopment. Groundwater of arid regions islargely saline and in semi-arid regions it is sodicin nature. These groundwater resources are usedsolely or in conjunction with canal water forirrigation purpose. Indiscriminate use of the poorquality waters for irrigation deterioratesproductivity of soils through salinity, sodicityand toxic effects. In addition to reducedproductivity, it deteriorates the quality of
produce and also limits the choice of cultivablecrops. No systematic attempts have been madeso far in the country to arrive at the estimate ofpoor quality ground water resources. However,some predictions about use of poor quality waterin various states are given in Table 10.1. It isapproximated that the total area underlain withthe saline ground water (EC>4 dS m-1) is 193438km2 with the annual replenishable recharge of11765 million m3 Yr-1, leaving aside minor patches(CGWB, 1997).
Table 10.1 : Use of Poor quality groundwater in different states
State Utilizable Groundwater Poor quality Salinegroundwater Net draft Development water use groundwater
(M ha-m Yr-1) (%) (M ha-m Yr-1) area >4 dSm-1(km2)
(M ha-m Yr-1)
Punjab 1.47 1.67 98 0.68 3058
Haryana 0.86 0.72 76 0.47 11438
Uttar Pradesh 6.31 2.98 42 1.42 1362
Rajasthan 0.95 0.77 73 0.65 141036
Bihar 2.06 0.82 36 NA NA
W. Bengal 1.77 0.63 32 NA NA
Delhi 0.01 0.01 120 NA 140
Gujarat 1.56 0.85 49 0.26 24300
Karnataka 1.24 0.45 33 0.17 8804
Tamil Nadu 2.02 1.40 63 NA 3300
Madhya Pradesh 2.66 0.73 25 0.20 NA
Maharashtra 2.29 0.88 35 NA NA
Andhra Pradesh 2.70 0.78 26 0.25 NA
India 32.63 13.50 37 193438
(Source: Minhas et al., 2004)

130 Manual on Enhancing Water Use Efficiency in Canal Commands
Poor quality alkali water zones occur in parts ofAgra, Mathura, Aligarh, Mainpuri, Etah, Balliaand several districts of U.P. and parts of Haryana,Punjab and Rajastan. Low to medium RSC watersoccupy about 47% area of Punjab. Highly alkaliwaters are found in Parts of Amritsar, SouthernLudhiana, Ropar, Patiala, Ferozpur, Bhatinda,Faridkot and Sangrur districts covering 25% oftotal area of the state. In Haryana alkali watersare found in Bhiwani, Mahendragarh, Gurgaon,Kaithal, Kurukshetra, Ambala, Karnal andPanipat districts covering almost 21% of the totalarea of the state. Saline area occupies another 36%area in Haryana. In parts of Gujarat, Maharashtra,Karnataka, Andhra Pradesh, Tamil Nadu poorquality sodic and saline waters are observed inthe pockets. Many of these areas have blackcotton soils. In east coast, areas between Krishna
and Godavari rivers have brackish groundwaters.In coastal areas of Sunderban Delta, thegroundwater is saline. Scientific use of thesewaters enhances availability of water resourcesfor irrigation as well as reduces negative impactson soil and agricultural produce.
10.1 Classification of Irrigation Water
Irrigation water is classified based on electricalconductivity (EC), sodium adsorption ration(SAR) and residual sodium carbonate (RSC).However, from management point of view, thegroundwater in different agro-ecological regionscan be grouped into three classes i.e. (a) good, (b)saline and (c) alkali/sodic. Depending on thedegree of restriction, each of the two poor qualitywater classes has been further grouped into threehomogenous subgroups (Table 10.2).
Table 10.2 : Classification of poor quality ground water
Water Quality ECiw (dS m-1) SARiw (mmol-1)½ RSC(meq l-1)
a. Good <2 <10 <2.5
b. Saline
i. Marginally saline 2-4 < 10 <2.5
ii. Saline >4 < 10 <2.5
iii. High-SAR saline >4 >10 <2.5
c. Alkali waters
i. Marginal alkali <4 <10 2.5-4.0
ii. Alkali <4 <10 >4.0
iii. Highly alkali Variable >10 >4.0
10.2 Water Quality Guidelines for Management
of Saline Groundwaters
It has been established that the success with poor
quality water irrigation can only be achieved if
factors such as rainfall, climate, depth to water
table and water quality, soils and crops are
integrated with appropriate crop and irrigation
management practices. The available
management options mainly include the
irrigation, crop, chemical and other culturalpractices but there seems to be no singlemanagement measure to control salinity andsodicity of irrigated soil, but several practicesinteract and should be considered in anintegrated manner. The guidelines for use ofsaline groundwaters are given below (Table 10.3).

Manual on Enhancing Water Use Efficiency in Canal Commands 131
Table 10.3 : Guidelines for use of saline water (RSC < 2.5 meq/1)
Soil texture (% clay) Crop Upper limits of ECiw (dS/m) in rainfall regionstolerance
350 mm 350-550 mm 550-750 mm
Fine (> 30) S 1.0 1.0 1.5
ST 1.5 2.0 3.0
T 2.0 3.0 4.5
Moderately Fine(20-30) S 1.5 2.0 2.5
ST 2.0 3.0 4.5
T 4.0 6.0 8.0
Moderately Coarse(10-20) S 2.0 2.5 3.0
ST 4.0 6.0 8.0
T 6.0 8.0 10.0
Coarse(< 10) S - - 3.0 3.0
ST 6.0 7.5 9.0
T 8.0 10.0 12.5
S, ST and T denote sensitive, semi-tolerant and tolerant crops
10.3 Management Technologies for Use ofSaline Groundwaters
Some of management options have beendescribed as below.
Selection of semi-tolerant to tolerant cropsand crops with low water requirements
Use of crop cultivars having tolerance tosalinity (Table 10.4)
Proper selection of crop sequence
Avoiding saline water use during initialgrowth stages
Table 10.4 : Promising cultivars for saline environment
10.4 Nutrient management for salineenvironment
Additional doses of nitrogenous fertilizersare recommended to compensate forvolatilization losses occurring under salineenvironments
Soils irrigated with chloride rich watersrespond to higher phosphate application,because the chloride ions reduceavailability of soil phosphorus to plants.The requirement of the crop for phosphoricfertilizers is, therefore, enhanced and nearly
Crop Cultivars
Wheat Raj 2325, Raj 2560, Raj 3077, WH 157
P. millet MH269, 331, 427, HHB-60
Mustard CS416,CS330,-1, Pusa Bold
Cotton DHY 286, CPD 404, G 17060, GA, JK276-10-5, GDH 9
Safflower HUS 305, A-1, Bhima
Sorghum SPV-475, 881, 678, 669, CSH 11
Barley Ratna, RL345, RD103, 137, K169

132 Manual on Enhancing Water Use Efficiency in Canal Commands
50 per cent more phosphorus than therecommended dose under normalconditions should be added, provided thesoil tests low in available P.
For sulphate rich waters, no additionalapplication of phosphate fertilizers isrequired and the dose recommended undernormal conditions may be applied.
For micro-nutrients such as zinc, therecommended doses based on soil testvalues should be applied.
Farmyard manure (FYM): FYM and otherorganic materials have not only thenutritive value, but play an important rolein structural improvements, which furtherinfluences leaching of salts and reduce theiraccumulation in the root zone. The otheradvantages of these materials in salinewater irrigated soils are in terms ofreducing the volatilization losses andenhancing nitrogen-use efficiency and theretention of nutrients in organic forms forlonger periods also guards against theirleaching and other losses. Therefore, theaddition of FYM and other organic/greenmanure should be made to the maximumpossible extent.
10.5 Conjunctive Use of Canal and SalineGroundwater
In saline groundwater areas, conjunctive usepractice can ensure judicious use of canal water,which is available in limited quantities along withsaline ground water. Under such situation, twooptions are available with the users. Dilution ormixing of available poor quality water with goodwater in such proportions that resultant EC isacceptable for the range of crops to be grown in agiven area. The salinity of resulting water can beeasily calculated from their respective volumesand salinities.
The management options for use of salinegroundwater for irrigation, mentioned in theearlier section, are also applicable for conjunctiveuse of canal and saline water to maintain the
productivity levels. If canal water (CW) isavailable during initial crop growth stages,maximum possible irrigations are to be given bycanal water before switching to saline water (SW).Suppose wheat crop requires 4 irrigations. The2CW: 2SW mode can be a good option as rootzone salinity under this mode remains low foralmost two months (during initial crop growingperiod). Then CW: SW alternate mode ensureslow salinity for initial month. The mix (1:1) modemight be preferable over SW: CW option. It isobvious that 2SW: 2CW would get the leastpreference. Though the amount of salt load addedunder different conjunctive use modes is same,temporal changes in root zone salinity aredifferent. Therefore, selection of proper mode ofconjunctive use is required for suitable salinitymanagement at the root zone for optimum cropyields. The preference order for conjunctive wateruse for wheat crop requiring 4 irrigations can be2CW: 2SW; CW: SW alternate mode; Mix(1CW:1SW) mode and SW: CW alternate mode(Kaledhonkar and Keshari, 2006). The relativeyield of crop generally remains highest for 2CW:2SW and lowest for SW: CW mode. Thisassumption is violated, in case there is highsalinity at time of germination and crop standgets affected due to salinity. The conjunctive usepreference order prepared for use of canal andsaline groundwater also holds true forconjunctive use canal and alkali groundwater.The relative yields under different conjunctivewater use practices, with reference to canal waterirrigation, are given in the Table 10.5.
Some important suggestions for management ofconjunctive use practices are listed below:
Analysis of saline water to evaluate its usepotential
Selection of crops/ crop varieties that canproduce satisfactory yields with salinewater irrigation
Selection of tree species/ medicinal plantsin adverse condition

Manual on Enhancing Water Use Efficiency in Canal Commands 133
Table 10.5 : Effect of various cyclic modes of post-plant irrigations with canal water and salinewater on mean relative (%) yields of wheat and succeeding pearl millet and sorghum crops
Mode of water application Wheat Pearl millet Sorghum fodder
4 CW 100 100 100CW: SW (alternate) 94.4 97.0 91.8SW: CW (alternate) 91.3 95.5 91.12 CW + 2 SW 94.3 96.4 92.82 SW + 2 CW 88.2 94.9 91.11 CW + 3 SW 83.6 91.9 87.24 SW 73.7 85.0 78.7
CW - Canal water; SW - Saline water
Pre-sowing irrigation by good qualitywater so that germination and seedlingemergence is not affected
Adequate leaching of accumulated salts
Alternating the area/ area switching i.e.irrigate the selected area with saline waterfor 3-4 years and than switch to next area
Improved cultural and nutrientmanagement practices/
10.6 Water Quality Guidelines for Managementof Sodic Groundwaters
Based on field experience and results fromdifferent saline and sodic water use experiments,CSSRI, Karnal in consultation with Scientist fromHAU, Hisar and PAU, Ludhiana has prepared
some guidelines for efficient utilization of sodicwaters. These guidelines emphasize on long-term influence of water quality on cropproduction, soil conditions and farmmanagement with assumption that all rainwaterreceived in field is being conserved for leachingand de-adsorption of Na+ from upper root zone(Table 10.6).
Special considerations
Gypsum application is necessary forsensitive crops if saline water (SAR > 20 and/ or Mg: Ca ratio > 3 and rich in silica)induces water stagnation in rainy season.
Fallowing in rainy season under highsalinity (SAR > 20) is helpful for low rainfallareas.
Table 10.6 : Sodic Groundwaters with RSC > 2.5 meq L-1 and ECiw < 4.0dSm-1
Soil texture Upper limits RSCmeq L-1 Remarks(% clay) of SAR (m mol L-1)1/2
Fine(>30) 10 2.5-3.5 Limits pertain to kharif fallow – rabi croprotation when annual rainfall is 350 –550 mm
Moderately 10 3.5-5.0 When water has Na < 75%, Ca+Mg >25% orfine(20-30) rainfall >550mm, the upper limit of RSC
becomes safe
Moderately 15 5.0-7.5 For double cropping, RSC neutralizationcoarse (10-20) with gypsum is essential based on quantity
of water used during rabi season. Grow lowwater requiring crops during kharif.
Coarse (<10) 20 7.5-10.0

134 Manual on Enhancing Water Use Efficiency in Canal Commands
Fertilization with additional phosphorus isbeneficial especially when C1:SO4 ratio inwaters is > 2.0.
Canal water should be used preferably atearly growth stages including pre-sowingirrigation in conjunctive use mode.
Putting 20% extra seed rate and a quickpost-sowing irrigation (within 2-3 days)will help in better germination.
Accumulation of B, F, NO3, Fe, Si, Se andheavy metals beyond critical limits withirrigation is toxic.
Expert advice prior to use of such water isessential.
Textural criteria should be applicable for all soillayers down to at least 1.5 m depth. In areas,where ground water table reaches within 1.5 mat any time of the year or a hard subsoil layer ispresent in the root zone, the limits of the nextfiner textural class should be used
10.7 Management Technologies for Use of SodicGroundwaters
Water quality researches over past few decadeshave enabled development of technologicaloptions to cope up with the problems of sodicwater use. Possibilities have now emerged tosafely use the water otherwise designated unfit.These options are as below:
Selection of crops (Table 10.7) croppingpatterns and crop varieties (Table 10.8) thatproduce satisfactory yields under theexisting or predicted conditions of sodicity.
Appropriate irrigation scheduling andconjunctive use options with canal water;rain water management and leachingstrategies to maintain a high level of soilmoisture and low level of salts andexchangeable sodium in the rhizosphere.
Use of land management practices toincrease the uniformity of water
Table 10.8 : CSSRI recommended crop varieties for cultivation in sodic soils
Crop pH Varieties
Rice 9.8-10.2 CSR 10
9.4-9.8 CSR 10, CSR 13, CSR23, CSR 27, CSR 30, CSR 36
Wheat 9.2 - 9.3 KRL-1-4, KRL-19, WH 157, Raj. 3077
Mustard Up to 9.3 Pusa bold, Varuna, Kranti, CS-52, CS-54, CS-56
Barley Up to 9.3 CSB 1, CSB 2, CSB 3, DL 200, DL 348. Ratna, BH 97, AZAD
Chickpea Up to 9.0 Karnal chana 1
Table 10.7 : Relative tolerance to sodicity of soils
ESP Crops
10-15 Safflower, Mash, Peas, Lentil, Pigeon-pea, Urd-bean, Banana
16-20 Bengal gram, Soybean, Papaya, Maize, Citrus
20-25 Groundnut, Cowpea, Onion, Pearl-millet, Guava, Bel, Grapes
25-30 Linseed, Garlic, Guar, Palmarosa, Lemon grass, Sorghum, Cotton
30-50 Mustard, Wheat, Sunflower, Ber, Karonda, Phalsa, Vetiver, Sorghum, Berseem
50-60 Barley, Sesbania, Paragrass, Rhoades grass
60-71 Rice, Sugarbeat, Karnal grass

Manual on Enhancing Water Use Efficiency in Canal Commands 135
distribution, infiltration and salt leachingbesides the optimal use of chemicalamendments like agricultural gradegypsum and acidic pyrite at proper timeand mode of their application withjudicious use of organic materials andchemical fertilizers. The gypsum can bedirectly applied before rice crop in soil toplayer or can be used in gypsum bed forpassing sodic groundwater.
The other guidelines pertinent to selecting cropssuitable for sodic waters are:
Fields should be kept fallow during kharifin low rainfall areas (< 400 mm) where goodquality water is not available. However,only tolerant and semi-tolerant crops likebarley, wheat and mustard should begrown during rabi.
Jower-wheat, guar-wheat, pearl millet-wheat and cotton-wheat rotations can besuccessfully grown in areas having rainfall> 400 mm/annum provided that sowingof kharif crops is done with rain or goodquality water and only 2 to 3 sodic waterirrigations can be applied to kharif crops.
In rice-wheat belt of alluvial plains havingrainfall 600 mm, rice-wheat, rice-mustard,sorghum mustard, and dhaincha (GM)-wheat rotations can be successfullypracticed with gypsum application.
Sodic water should not be used for summercrops in the months of April to June.
10.8 Nutrient management for sodic environment
Since sodic waters cause a rise in soil pH thatleads to greater nitrogen losses throughvolatilization and denitrification, extra nitrogenmay have to be added to meet the requirementof the crops. Similarly, the availability of zinc andiron is also low due to their precipitation ashydroxides and carbonates. Some other beneficialtips as regards fertilizer use are.
Application of 25% extra nitrogen is neededas compared to the normal conditions.
Zinc sulphate @ 25 kg ha should be added,particularly to the rabi crop.
Phosphorus, potassium and other limitingnutrients may also be applied on the basisof soil values.
Some sodic waters may be rich in nutrientslike nitrogen, potassium and sulphur suchwaters should be analyzed and the fertilizerdose of concerned nutrient reducedaccordingly as per their composition insuch water.
10.9 Conjunctive Use of Canal and Sodic(Alkali) Groundwater
In case of irrigation by sodic waters, theconjunctive use strategy should either minimizethe precipitation of calcium or maximize thedissolution of precipitated calcium. This isparticularly relevant to the areas, where canalwater supplies are either un-assured or less thanrequired, and farmers often pump sodicgroundwater for crop production. For theefficient use of waters of different qualities, goodquality waters can be used for sensitive crops andsodic waters for tolerant crops. The mostappropriate practice, however, can be theconjunctive use of these waters by: i) blendingin supply network, making appropriate waterquality available for each crop irrespective of soilconditions; ii) alternate use of sodic and canalwater according to availability and crop needs;and iii) switching these water sources during thegrowing season according to critical stages ofcrop growth. The blending of sodic water andcanal water is done in such proportion so thatfinal RSC is maintained below the threshold limitof the crop to be grown. The alternate use ispreferable and has operational advantages. Effectof conjunctive use of sodic groundwater andcanal water on soil properties and crop yields isgiven in Table 10.9.

136 Manual on Enhancing Water Use Efficiency in Canal Commands
Table 10.9 : Effect of cyclic use of sodic and canal waters on soil properties and crop yields
Water quality/mode Adj SAR* pH ESP RIR Average yield (Mg/ha)
Rice Wheat
Canal water (CW) 0.3 8.2 4 100 6.78 5.43
Sodic water (SW) 22.0 9.7 46 14 4.17 3.08
2CW-ISW 8.9 8.8 13 72 6.67 5.22
1CW-ISW 12.8 9.2 18 59 6.30 5.72
1CW-2SW 18.5 9.3 22 34 5.72 4.85
10.10 Policy Issues related to SustainableDevelopment of Saline and Sodic WaterResources under Conjunctive Use Policy
Conserve the available fresh waterresources and make the judicious use offresh water along with saline/ sodic water
Exploit full potential of surface/ canalwater system by improving the overallefficiency
Exploitation of fresh groundwater incoastal areas should be kept withinpermissible limit to avoid seawaterintrusion.
Improve groundwater potential throughrecharge
Develop institutional support forparticipation, development and optimalutilization of poor quality ground waters
Demand management through pricing
Diversification of agriculture
Incentives for water saving and adoptionof improved technologies
Awareness and capacity building
Involve women and children in watermanagement
Educate the farmers about water scarcity,judicious use of water and side effects/losses due to salinity/ sodicity
Legislative measures
Need to create an environment forsustainability of system: use of greenmanuring, FYM, salinity/ sodicity tolerantcrop varieties to be promoted
References
Bajwa, M.S and Josan, A.S. 1989. Prediction ofsustained sodic irrigation effects on soil sodiumsaturation and crop yields. Agricultural WaterManagement. 16: 227-228.
Kaledhonkar, M.J and Keshari, A.K., 2006. Modellingthe effects of saline water use in agriculture.Irrigation & Drainage, 55(2): 177-190.
Minhas, P.S., Sharma, D.R. and Chauhan, C.P.S. 2004.Management of saline and alkali waters forirrigation. In Advances of Sodic LandRecommendation. p121- 62.InternationalConference on Sustainable management of SodicLands held at Lucknow. Feb, 9-14, 2004.
After accounting for 828 and 434 cm of irrigation and rainwater, respectively
Compiled from Bajwa and Josan (1989)

Manual on Enhancing Water Use Efficiency in Canal Commands 137
11.0 PAR11.0 PAR11.0 PAR11.0 PAR11.0 PARTICIPTICIPTICIPTICIPTICIPAAAAATORTORTORTORTORY IRRIGY IRRIGY IRRIGY IRRIGY IRRIGAAAAATION MANATION MANATION MANATION MANATION MANAGEMENT (PIM)GEMENT (PIM)GEMENT (PIM)GEMENT (PIM)GEMENT (PIM)FOR OPTIMUM UTILIZAFOR OPTIMUM UTILIZAFOR OPTIMUM UTILIZAFOR OPTIMUM UTILIZAFOR OPTIMUM UTILIZATION OF IRRIGTION OF IRRIGTION OF IRRIGTION OF IRRIGTION OF IRRIGAAAAATION WATION WATION WATION WATION WATERTERTERTERTER
Souvik Ghosh, RSouvik Ghosh, RSouvik Ghosh, RSouvik Ghosh, RSouvik Ghosh, Rajbir Singh and Pajbir Singh and Pajbir Singh and Pajbir Singh and Pajbir Singh and Parbhakarbhakarbhakarbhakarbhakar Nandar Nandar Nandar Nandar Nandaaaaa
Irrigation facilities are created by the Governmentat huge cost for supplying water to the farmersfor raising crops so as to increase agriculturalproduction. The major and medium irrigationprojects are planned, constructed, managed,operated and maintained by the IrrigationDepartments, wherein certain procedures andrules are evolved and followed in respect ofopening canals, frequency of supply anddistribution of water to the farmers and closingof canals. Creation of such facilities resulted inushering the green revolution in seventies inproduction of food grains and also employmentgeneration in the country there by improving thesocio-economic condition of Indian farmer.However, optimized management of irrigationwater is the key element for sustainabledevelopment of agriculture and livestock. Sincemanagement of water for irrigation is highlylocation specific, depending upon agro-ecologicaland socio-economic conditions, type of irrigationproject and land use pattern, it differ from projectto project and region to region in the country.
11.1 Need for Participatory IrrigationManagement (PIM)
The optimum benefits from irrigation water arenot obtained as it was expected. There isconsiderable wastage of water and over irrigationin upper reaches of the command area withconsequent non-availability of water to the tailend farmers which is a common feature. Thecanal is designed for 24 hrs irrigation watersupply; however, the farmers are accustomed forday time irrigation water supply. Consequentlyone third of water delivered at the outlet iswasted during night time. Injudicious use ofirrigation water has resulted into huge losses inthe command and consequently many irrigationschemes are operating sub-optimally. The projectirrigation efficiency of major projects is less than35%. The average yield of fooodgains is about
2.5 t/ha under irrigation where as it should be atleast 4.5 t/ha.
Another problem in canal command is drainage.In the planning of most of the existing irrigationprojects in our country, provision was not madefor adequate drainage in the command areas.Water table has built up steadily due to highseepage and percolation losses, consistent overirrigation, spillage from canal system and notusing ground water. Water logging andsalinization have thrown considerably acreage inthe command area out of production. About 6.73M ha land has degraded due to water logging,soil salinity and alkalinity by the end of 10th plan.
There are deficiencies in the design, operationand maintenance of the irrigation system. This ismainly due to assuming unrealistic duties forcrops, assuming low seepage losses in thedistribution system, inadequate maintenance ofthe system etc. By and large, the indiscipline ofthe users is the main reason for tail-end fields inlocalized ayacut not receiving water. Further, inorder to irrigate their lands in shortest possibletime, the farmers do not hesitate to damage thesluices or cause breaches in canals. This calls fora holistic approach for efficient irrigationmanagement so that more and more area can beadded under irrigation command which ispossible only when performance of irrigationsystem and management of irrigation isimproved with proper crop planning, increasedcropping intensity and share of food grains ingross cropped area. To achieve this, farmers’active participation in irrigation watermanagement is most essential as the farmers arethe ultimate users of irrigation water and theirparticipation will ensure successful operation,maintenance of the irrigation system andcollection of water rates.

138 Manual on Enhancing Water Use Efficiency in Canal Commands
11.2 Concept of PIM
As a result of the debate over non-performanceof publicly supplied irrigation system in early 90s,PIM has been advocated as a solution. On theconcept of peoples management ofdevelopmental infrastructures that requires localsolution to local problems affecting them, theNational Water Policy of Government of Indiaof 1987 and 2002 stressed on farmers participationin irrigation management. Accordingly, severalstates (like Maharastra, Madhya Pradesh,Gujarat, Andhra Pradesh, Orissa, etc) in Indiahave been implementing the participatoryirrigation management programmes andtransferring the irrigation management to water
State-wise position of WUAs and area covered by them
Sl. Name of State Number of WUAs formed Area covered (*000 ha)No.
1. Andhra Pradesh 10800 4169.002. Arunachal Pradesh 39 9.023. Assam 720 47.044. Bihar 46 147.765. Chattisgarh 1324 1244.566. Goa 57 7.017. Gujarat 576 96.688. Haryana 2800 200.009. Himachal Pradesh 876 35.0010. J & K 1* 1.00*11. Jharkhand NA NA12. Karnataka 2515 1295.1913. Kerala 4126 255.2714. Madhya Pradesh 1687 1691.8015. Maharashtra 1539 667.0016. Manipur 73 49.2717. Meghalaya 123 16.4518. Mizoram NA NA19. Nagaland 23 3.1520. Orissa 16196 1537.9221. Punjab 957 116.9522. Rajasthan 506 619.6523. Sikkim NA NA24. Tamil Nadu 1310 787.9625. Tripura NA NA26. Uttar Pradesh 245 121.2127. Uttaranchal NA NA28. West Bengal 10000** 37.00**
Total 56539 13155.89
* Under verification; Under MI, RIDF scheme(Source: Ministry of Water Resources, Govt. of India, Year: 2007)
user association (WUA) / Pani Panchayat (watercouncil) with a view to providing equitable,timely and assured irrigation. This programmeenvisages making farmers to participate in thewater resources planning and management andto hand over the system to the farmers for whichsuitable legislation has already been done.
A paradigm shift in the policies for irrigationdevelopment and management has beenhappening during the past two decades throughPIM. The centralized control and managementresponsibility of the irrigation resources are beingtransferred to the local farmer groups or waterusers associations (WUAs) for bettermanagement. About 13.16 M ha of irrigated land

Manual on Enhancing Water Use Efficiency in Canal Commands 139
has been covered under 56539 numbers of WUAsin the country till the end of 10th five year plan.
Irrigation is state subject in India and itsmanagement is being done by the State IrrigationDepartments but the involvement of farmers/group of farmers directly or indirectly may notbe denied. The private sector management/contract management approach is not popularparticularly in major or medium irrigationprojects but in case of tube well irrigation it maynot be denied. In India, farmers were managingirrigation projects but after independence themanagement of irrigation was taken over by theIrrigation Departments. It is now realized thatthe PIM through involvement of farmers is theonly answer; however, the introduction of PIMis very slow.
Any farmers’ managed system with full O & Mand regulatory control is rarely found in thecountry. The appropriate approach may be a JointManagement System, wherein the O & M andregulation with ownership of the system maycontinue to remain with Irrigation Departmenttill farmers are fully trained for taking over thesystem. The formal group of farmers calledWater Users’ Association (WUA) may carry outall other functions relating to management ofirrigation in their operational area. Theparticipation of farmers in department managedactivities and the department participation infarmers managed activities should be ensured tillthe performance of WUAs becomes satisfactory.
Various approaches may be adopted suiting tothe local condition or type of project. But it isimportant to understand the functions formanagement of irrigation, which are summarizedas under:
Operation and maintenance of all irrigationsystems and structures viz., head works,main, secondary, minor, tertiary anddrainage systems
Regulation/rostering of main andsecondary system
Equitable distribution of irrigation wateramongst users
Fixation and recovery of water rates
Improvement in water use efficiency
Maintenance of drainage system andprevention of water pollution
Reduction in conveyance, distribution andfield application losses
Economic use of water
Conjunctive use of surface and groundwater
Payment of land and water rates to theDepartment as applicable through theapproach adopted in the transferagreement
To develop a suitable cropping pattern,improve cropping intensity andagricultural production
Conflict resolution
Administrative and financial functions
11.3 Structural Arrangements for PIM
11.3.1 Structure of WUA
The structural arrangements of WUA / PaniPanchayat (Fig. 11.1) indicate the involvement ofboth irrigation and agriculture department tofacilitate proper planning of irrigation andagriculture in the irrigation command.
There is no uniform procedure to form WUAs.Its structural development, size and organizationmay be at the convenience of farmers and theirrigation department. It is usually advocatedthat the size of a WUA may be in between 500 to750 ha on a hydraulic unit preferably a minorcovering one or more villages.
A minor irrigation project may be managed byone WUA-a single tier system. The mediumirrigation project may be managed by a two-tiersystem, having WUAs’ at minor level and Apexbody at project level. In a major Irrigation project,it may a three-tier system, the WUA at minorlevel, a federation or a Distributary Committeeat branch canal/distributary level and apex bodyat project level. In all cases mentioned above,WUA would be the only registered body.

140 Manual on Enhancing Water Use Efficiency in Canal Commands
All farmers in the operational area of the WUAmay become its members. The WUA will alsohave a managing committee, which may consistof a president, vice president, treasurer and asecretary in addition to at least five members.State Irrigation, Agriculture, CAD and RevenueDepartments may also nominate one officer fromeach department to be included in the managingcommittee. They will help managing committeein its functioning. There may be two methods toelect the managing committee.
The WUA will have its by-laws defined asregulations of the society, which may besummarized as follows:
Objective of water users association
Definition of the member
Size of the water users’ association
Functions to be carried out by the WUA
Managing committee-size, function andlegal powers
Fig. 11.1 : Structural arrangements for PIM
Chak : Outlet, Pani Panchayat : WUA, DoWR : Department of Water Resources
DoA : Department of Agriculture, RI : Revenue Inspector , JE : Junior Engineer, AE : Assistant Engineer
E.E : Executive Engineer, JoA : Junior Agricultre Officer, DAO : District Agriculture Officer
Manual on Enhancing Water Use Efficiency in Canal Commands 141
Responsibilities and rights of the WUA
Responsibilities and rights of the members
Details of the general body
Election procedure of the managingcommittee
The structure of the WUA and its internalmanagement
Conducting meeting of the general bodyand managing committee
Amendment of by-laws
Liquidation of WUA
In addition of the by-laws, another importantlegal document is the Transfer Agreement or theMemorandum of understanding between theWUA and the Irrigation Department, wherevernecessary. This agreement contains the termsand conditions of transfer of the system and willclearly spell out the duties and responsibilitiesof Irrigation department and WUA. Handingover of the system, method of its operation andsupply of irrigation water in bulk at agreed timeand quantities in different crop seasons wouldbe included in the agreement.
The transfer agreement/MOU will clearly definethe area of operation of WUA, the details of theirrigation system its present condition and theexisting structures with their technical details.The plan map delineating the area of operation,irrigation distribution network and location ofstructures is to be attached with the transferagreement. Technical details like longitudinaland the cross section of the system is also to beattached with the document. It will also specifythe procedure to be adopted for the managementof irrigation in the operation area.
There will be a legal provision of termination ofagreement but the procedure would be definedin detail in the transfer agreement. Theagreement would be valid for a specified periodbut having been satisfied with the performance;the agreement may be renewed for a furthermutually agreed period. The grounds for
termination of agreement should be clearlymentioned in the agreement.
11.3.1.1 Structure of Distributory Committee
The WUAs at minor level may be federated atthe distributory level to co-ordinate the functionsof WUAs. The federation may be called adistributory committee. The presidents of allWUAs may be the members of the distributorycommittee and these members may elect theirpresident. The state departments may alsonominate their officers to the distributorycommittee.
11.3.1.2 Apex Body
The distributory committees of the project maybe further federated into the project levelcommittee called apex body. The main functionof the apex body would be to suggestimprovement in the O & M of the irrigationsystem, environment of the area andrationalization of water supply to the users otherthan irrigation. The Presidents of the distributorycommittee may be the members of the apex body.These members may elect their president.
11.3.2 Legal framework for PIM
Recognizing the need for sound legal frameworkfor PIM in the country, the Ministry brought outa model act which has been enacted by eight stategovernments, namely, Andhra Pradesh, Goa,Madhya Pradesh, Karnataka, Orissa, Rajasthan,Tamil Nadu and Kerala. The other states alsoneed to work in this direction. Concerted effortsshould be made to involve farmers progressivelyin various aspects of management of irrigationsystems.
11.3.3 Constraints in Implementation of PIM
It is now well established that the irrigationpotential created in 1960s could not be fullyutilised because the management of irrigationwas done by the irrigation agencies which couldnot pay adequate attention. It was strongly feltthat the only answer for managing the irrigationefficiently, involvement of farmers is unavoidable

142 Manual on Enhancing Water Use Efficiency in Canal Commands
as they are the end-users. In almost all states PIMis being implemented in one form or the otherbut following are the constraints being observedin its implementation
Lack of awareness
Absence of clear-cut policy inimplementation of PIM
State-wise position of enactment / amendment of Act
Sl. Name of State Position of issue/ amendment of Irrigation ActNo.
1. Andhra Pradesh Enacted ‘Andhra Pradesh Farmers’ Management of Irrigation System Act,March 1997.
2. Assam The Assam Irrigation Water Users Act, 2004
3. Bihar The Bihar Irrigation, Flood Management and Drainage Rules, 2003. underthe Bihar Irrigation Act, 1997
4. Chhattisgarh Enacted ‘Chhattisgarh Sinchai Prabandhan Me Krishkon Ki BhagidariAdhiniyam, 2006.
5. Goa Enacted ‘Goa Command Area Development Act 1997’ (Goa Act 27 of 1997).
6. Gujarat Gujrat Water Users Participation Management Act. 2007
7. Karnataka Promulgated an Ordinance on 7th June 2000 for amendment of the existingKarnataka Irrigation Act 1957.
8. Kerala Enacted ‘The Kerala Irrigation and Water Conservation Act’, 2003.
9. Madhya Pradesh Enacted ‘Madhya Pradesh Sinchi Prabandhan Me Krishkon Ki BhagidariAdhiniyam’, 1999, during September 1999.
10. Maharashtra The Maharashtra Management of Irrigation System by Farmers Act 2005.
11. Orissa Enacted ‘The Orissa Pani Panchayat Act’, 2002 and Orissa Pani PanchayatRule 2003
12. Rajasthan Passed the Rajasthan Sinchai Pranali Ke Prabandh Me Krishkon KiSahabhagita Adhiniyam, 2000
13. Tamil Nadu Enacted the ‘Tamil Nadu Farmers’ Management of Irrigation System Act.2000.
(Source: Ministry of Water Resources, Govt. of India, Year: 2007)
Lack of legal support.
Financial support
Rehabilitation of irrigation systems.
Socio-economic factor.
Resistance from Irrigation Agency.
Attitude of big and head reach farmers.
Lack of leadership.
Inadequate number of NGOs to assist inimplementation of PIM
No incentive to the farmers initially.
Lack of political will.

Manual on Enhancing Water Use Efficiency in Canal Commands 143
11.4 PARTICIPATORY IRRIGATION MANAGEMENT: A CASE STUDY OF HARYANA
Haryana has played a great role to bring the‘Green Revolution’ in India and is second toPunjab for its contribution to the national pool offood grains. The state is ideally suited for PIMdue to number of factors such as consolidatedholdings, well defined equitable distributionsystem for irrigation water, geographically smallarea, a well-developed and efficient irrigationinfrastructure, an old and established irrigationagency and last but not the least well-awarestakeholders. It has only been conceptualizedduring the last two years and launched as a majorprogram also. The state is also in the process ofplanning reforms in water sector and the issue ofPIM is on the top of the agenda. The State isreaching its limits of agricultural expansion andscope for further development of irrigatedagriculture is very limited. The condition ofirrigation infrastructure, existing since long, isalso deteriorating due to lack of adequatemaintenance. Economical use and conservationof water, improving efficiency in conveyancesystem and diversification of crop to less waterconsuming crops are some of the possiblesolutions for this difficult situation. Therefore, apartnership needs to be evolved with water usersas all the possible solutions relate only to them.The forum of water users’ association (WUA) canbe very effectively utilized underlining theurgency of PIM with proactive role ofstakeholders in irrigation management.
11.4.1 PIM in Haryana
Participation of stakeholders in irrigationmanagement essentially consists of two majorcomponents - equitable distribution of irrigationwater for all users and efficient management ofinfrastructure.
a) Warabandi- equitable distribution of water:According to Canal & Drainage Act (1974), thereis a provision for equitable distribution ofirrigation water called Warabandi i.e., water-turnin Haryana, After the Warabandi is fixed, notifiedand published, it is practically implemented infield by the shareholders by mutual consent.
b) Management issues: The second aspect ofPIM is the management of irrigationinfrastructure which includes planning, design,construction and O & M. During the constructionstage, shareholders are given the responsibilityto keep vigil on quality of work, which theygenerally assume readily and perform well. Thisaspect has resulted in an overall improvement inthe quality of works.
c) Maintenance of watercourses: There arenumber of provisions in the Act starting from themandatory maintenance of the watercourse bythe stakeholders and the government will notbear the cost of maintenance of watercourses.Practically also stakeholders have beenmaintaining the watercourses till state’sintervention by way of lining of watercourses.Therefore, historically the participation ofstakeholders at watercourse level has been quitesuccessful.
11.4.2 Model Bye-laws
In the year 1998, the state government approvedModel Bye-Laws (To be adopted by a WUA atthe time of forming of WUA with appropriatesuitable amendments) and Draft MOU (To besigned at the time of turning over managementto WUA on completion of modernization orrehabilitation of a watercourse), for effectiveimplementation of the program in the state.These bye-laws brought a uniform code in all theWUAs and the MOU practically transferredrights to the stakeholders.
11.4.3 Guidelines for PIM
The comprehensive guidelines issued by thegovernment in August 2000 contain generaloutline of the WUA, rules, regulations, duties,functions, resources etc,. A procedure forformation of WUA has been suggested in theguidelines, which is based on the social,economical, political and practical aspects of thestate. The guidelines also lay down the roles andresponsibility of officers/officials of serviceagency. It was felt that HID should be in the lead

144 Manual on Enhancing Water Use Efficiency in Canal Commands
role for transfer of irrigation management asHSMITC was engaged in modernization &rehabilitation of watercourses.
11.4.4 Core Group on PIM
In order to accelerate and coordinate the program,a Core Group on PIM was formed in HaryanaIrrigation Department, which had members of allthe implementing agencies such as HSMITC,HAD, HIRMI. The results of implementation ofPIM at primary level have been quite encouragingand a framework is being prepared fortransferring the management at secondary leveli.e. Distributary level to stakeholders.
11.4.5 Legal Status of WUA
There are two issues regarding legal status ofWUAs- the provisions which enable the state toentrust the entire management to stakeholderswithout any legal complications, and theownership right of the WUAs so far as thewatercourse is concerned. In this model, WUAwill have the ownership of watercourse and allother related works jointly with other farmers.It implies that WUA is a legal entity (dulyregistered), has mandatory obligation formanagement of watercourse and acquiresownership right apart from number of otherrights on signing of MOU between the state andWUA. The working details of this model are asunder: -
When a scheme for modernization ofwatercourse is taken up, consultations areheld with the stakeholders for their viewsand suggestions.
Public hearing of all the stakeholders is heldto decide all the features of the scheme suchas alignment, length etc.
WUA is formed there and then byconsensus and is got registered underIndian Societies Act by the managingcommittee of WUA.
On decision of the scheme, design anddetailed estimate is prepared by the agencyand there is another consultation with theWUA so that detailed design is explained.
WUA among itself constitutes a committeeto supervise the construction work.
WUA is made aware of every aspect ofconstruction including quality controlaspects by the agency.
Supervision committee regularlysupervises the work and checks the qualityof work, duly recording its observations inthe official records. WUA thus becomequality control managers.
Once the scheme is completed, WUA,agency staff carries out a joint ‘Walk-through’ for inspection and hydraulic testof the watercourse.
Upon satisfactory result of the walk-through, MOU is signed between WUAand agency effecting the transfer of thewatercourse to WUA.
Funds are collected by WUA generally atthe rate of Rs. 20 per acre of holding but insome cases Rs. 100 is also collected.
These funds are being utilized by someWUAs for maintenance and routine repair.
Field staff is given training and generalawareness about the concept of PIM byHIRMI frequently and recently, a masstraining program for all line staff at alldistrict headquarters was organized.
Field training to WUA is being impartedby line staff apart from workshops beingorganized by HIRMI.
Three tier-monitoring infrastructure forPIM has been put in place and the job ofthis infrastructure is to foster PIM program,monitor the process and suggestimprovements in the program.
11.4.6 Impact of PIM
An impact study conducted at 66 watercourseswhere WUAs were functional after lining ofwatercourse and 18 outlets where there was noWUA. The comparison of functional WUA andnon-existence of WUA, the studies establishes

Manual on Enhancing Water Use Efficiency in Canal Commands 145
the fact that the Haryana model is not onlyworkable but also exclusive to its owncircumstances and needs. The followingconclusions have been drawn:
i) Functional WUA
The condition of watercourses where noWUA exists was very poor as compared tothose watercourses, where WUAs are inplace.
WUAs are fully involved in constructionactivities and are performing the role ofquality control managers and has broughtin improved quality of construction.
The level of awareness has gone up andwith active partnership, an incipient senseof ownership has also been noticed.
Tail enders got benefited.
No conflicts have been reported ondistribution of water.
Desilting, deweeding and cleaningfunctions have been adopted by WUAs astheir primary functions.
The process of walkthrough, decision-making and identification as a hydrologicalgroup are there to take cognizance.
Most of the watercourses were badlydamaged and severely silted.
ii) Non-existent WUA
In 70 % cases water was not reaching thetail ends while in 30 % cases, it was inmeagre quantity.
There was no involvement of farmersgroups and they expected the governmentto take care of maintenance.
The level of maintenance ranged fromextremely poor to no maintenance.
The comparison of both the studiesestablishes the fact that the Haryana modelis not only workable but also exclusive toits own circumstances and needs.
11.4.7 Missing links in Haryana model
i) Financial sustainability: WUA is working onits contribution of share money from membersand no other source has either been identified orfixed. It is true that the share money if collectedin time and made an annual feature will beenough for routine maintenance work. But forlong-term sustainability, a definite source ofrevenue needs to be identified.
ii) Assessment, collection and sharing ofrevenue: The present practice is assessment ofirrigated area by Canal Patwari (IrrigationBooking Clerk) and prepares the charges duefrom the shareholders of a particular watercourse.The revenue so accrued is collected by the districtcollector through a separate infrastructure.Though there are provisions for exercise of acontrol but the system can be simplified andmade more transparent with active involvementof WUAs.
iii) Democratic process of WUAs: The electionsof WUAs office bearers are by consensus andnomination in the present set up. Consensus andunanimity are the essence of democracy but thereis scope for domination of WUAs by powerfulsocial groups and suppression of weaker ordisadvantaged groups in the presentarrangement.
iv) Powers to WUAs for penal action: All thepenal provisions for offences relating to water,its application, use, management etc. have vestedthe powers with the HID officers. WUAs canapply motivation, persuasion, social pressure etc.to work as a control mechanism. Now this is amissing link, which can become a stumblingblock in the long run.
v) Conflict resolution mechanism: The WUAsin the saddle for irrigation management, lack ofconflict resolution mechanism. A system has tobe put in place to provide for an effective conflictresolution mechanism vested in WUAs. This willhelp in establishing the usefulness of WUAs inthe social context also.

146 Manual on Enhancing Water Use Efficiency in Canal Commands
11.4.8 Suggestions for Better Functioning of WUA
The state has the definite advantage ofconsolidated command areas, a well-developedirrigation infrastructure, long-establishedmechanism for equitable distribution of irrigationwater, a sound agricultural know-how andstatutory provisions to take the lead in the fieldof PIM. A detailed analysis of the model andimpediments clearly indicate the need for somesolution and strategy. The PIM program needsto be made sustainable at the inception only anda little push will take this program ahead. Thefollowing suggestions are given for the positiveimprovement in the PIM program in Haryana:
i) Political patronage: Political patronage forownership of the program and spreading themessage across will provide necessary impetusto the program. PIM will have a better massappeal, when elected representatives promote it.
ii) Institutional options: Second important issueis institutional. The need is to make the HaryanaIrrigation Department fully responsible forWUAs right from the beginning, fostering andnurturing it all along till it becomes selfsustainable.
iii) Share of stakeholders in investment: Stakescan be made feasible by a suitable design in theform of share in the initial investment, which canbe nominal and a percentage and can possiblybe made initial capital for WUAs for O & Mactivities later on.
iv) Financial sustainability: Financialsustainability needs to be developed byentrusting the job of realization of revenue and acut in it and a percentage in the revenue realizedfor O & M works.
v) Democratic process: A democratic process forWUAs will have to be provided by means ofelections of WUAs.
vi) Penal powers to WUAs: The WUAs must beprovided with penal powers for offences such aswastage or theft of water, non-contribution in theaffairs of WUA, neglect of maintenance aspect,damage to property, obstruction of irrigation ordrainage system etc
vii) Conflict resolution mechanism: It essentialto devise a suitable conflict resolution mechanismvested with WUAs. This will become an effectivetool for making the entity of WUAs moreacceptable, as the conflicts are bound to increasein the initial stages.
viii) Agricultural extension: There is an urgentneed for developing an institutional arrangementfor providing agricultural know-how at the levelof WUA by providing awareness, training andworkshops.
ix) PIM at distributary level: For IMT atsecondary, a mass awareness program and acomprehensive training program needs to bedeveloped and implemented at distributary level.Detailed statewide public consultation must betaken up before designing and implementingstructure for secondary level IMT. Use of mediaand other modes need to be designed andlaunched. Need-based training program for PIMwithin the framework of Haryana model will goa long way in launching this program as a majorinitiative for one of the major reforms in watersector.
11.5 PARTICIPATORY IRRIGATION MANAGEMENT – A CASE STUDY OF ORISSA
Conforming to the policy guidelines of Nationalwater Policy (1987) and State Water Policy ofOrissa (1994), the government of Orissa with aview to providing equitable, timely and assuredirrigation has introduced the concept of Panipanchayat for PIM. PIM was introduced in thestate during 1995 on pilot basis in four projectswith the assistance of World Bank. Due topositive response from farmers at large, during
2000, the programme was named “PaniPanchayat” and was extended to all commandsof major, medium, minor and lifts irrigationprojects. This programme envisages makingfarmers to participate in the water resourcesplanning and management and to hand over thesystem to the farmers for which suitablelegislation has already been done. The Orissa Panipanchayat Act-2002 and Orissa Pani panchayat

Manual on Enhancing Water Use Efficiency in Canal Commands 147
Rules-2003 are concrete steps in this direction(DoWR, Govt. of Orissa, 2004). The PaniPanchayat is registered under SocietyRegistration Act, 1860 and recognized by OrissaPani Panchayat Act, 2002 and Orissa Pani
Panchayat Rules, 2003. The geographical extentof the participatory irrigation managementprogramme covers the entire State comprising ofabout 17.79 lakh hectares of irrigation commandunder different irrigation systems (Table 11.1).
Table 11.1 : Status of Pani panchayats under PIM programme in Orissa till March 2009
Projects Total target Formed Handed over
Number Area covered Number Area covered Number Area covered(L ha) (L ha) (L ha)
Major and medium 2562 11.25 2358 10.35 1324 5.71
Minor (flow) 1883 3.28 1883 3.26 1883 3.26
Minor (lift) 14174 3.16 13705 3.07 13681 3.06
Total 18619 17.79 17946 16.68 16888 12.03
Source: Annual Report (2006-07), Department of Water Resources. Govt. of Orissa
Pani Panchayat is an association of all personsowing land within a hydraulically delineatedportion of the command area ranging in sizeapproximately from 300-600 hectare in case ofmajor/ medium/ minor irrigation project. In caseof lift irrigation or minor flow irrigation project,the area is limited to the project command areawhere the area is less than 300 hectare. In thepresent concept of PIM, the responsibility ofO&M of the reservoir, dam, sluices, spill way,distribution networks (primary and secondary)rests with the Department of Water Resources(DoWR), whereas the responsibility of the O&Mof the tertiary system (below minor/sub-minor)is with the Pani Panchayat. The rights andresponsibilities of the Pani Panchayat will begoverned by an agreement between the PaniPanchayat and the Department of WaterResources.
11.5.1 Objective
The principle aim of the Pani Panchayat/ WaterUse Association is to maintain the canals, receivewater in bulk from Water Resources Departmentand distribute the water among themselvesefficiently by adopting suitable croppingprogramme and rotational use of water.
11.5.2 Key activities
O&M of minors and sub-minors
Equitable distribution and management ofirrigation water
Promote economy in the use of water
Assist the government in the preparationof demand and collection of water rates
Resolve disputes, if any, between themembers and water users in its area ofoperation and raise resources for O&M
Distribution of seeds, pesticides, fertilizersand other agricultural inputs
Actively participate in all agriculturaldemonstration programmes within itsboundary.
11.5.3 Funding pattern
Total funding pattern is managed by stategovernment of Orissa. Pani Panchayat will havea bank account of its own. A Pani Panchayat of amajor, medium or minor irrigation project willordinarily be provided with grant-in-aid equalto the number of hectares within its boundarymultiplied by Rs. 35 every year. The grant-in-aidwill be admissible after all the farmers within the

148 Manual on Enhancing Water Use Efficiency in Canal Commands
boundary become members of the PaniPanchayat. No grant-in-aid will be paid wherefarmers are exempted from payment of water
rate. When water rates are revised in future,appropriate enhancement of the amount of grant-in-aid will be considered.
11.5.4 Strengthening PIM through Biju Krushak Vikash Yojana
To strengthen Pani Panchayat and to give a boostto extension of irrigation network, theGovernment of Orissa launched an innovativescheme, known as BKVY, in 2001-02. Under thescheme, stress has been laid on attracting people’sparticipation in planning and implementation ofsmall irrigation projects by revival of derelictirrigation systems as well as construction of newprojects. Under this scheme, the operation andmaintenance of the project is taken up by the PaniPanchayat which collects appropriate usercharges from the beneficiaries.
11.5.4.1 Objective
To encourage user-initiative andparticipation in construction andmanagement of new and derelict lift andflow irrigation projects.
To stimulate mobilization of the farmers tomake them self-reliant.
To strengthen and expand the irrigationinfrastructure to accelerate the rate ofgrowth of income, output and employmentin the rural areas, and to remove regionalimbalance in irrigation coverage.
11.5.4.2 Funding pattern: The assistance will belimited to 80 percentages of the estimated capitalcost and contribution of Pani Panchayat shall be20 percentages of the cost. In case of tribal sub-plan areas and KBK (Koraput, Blangir,Kalahandi) districts, the assistance may be raisedto 90 percent of the capital cost. The PaniPanchayat may contribute its share either in cashor in terms of labour or in the form of land etc.The farmers will not pay water tax to thegovernment. The Pani Panchayat will fix thewater tax and collect it from the users, and depositin the bank account of Pani Panchayat. Tosafeguard against the natural calamity,government provides necessary assistance as perthe provisions of relief code.
11.5.4.3 Target group: A group of at least sevenfarmers with cultivable land of minimum 4 haand willing to form a Pani Panchayat can go fora lift or flow irrigation project. Priority is givento small marginal farmers, women farmers, SC/ST/OBC farmers and farmers of areas withoutirrigation facilities.
11.5.4.4 Procedure for application: Thebeneficiaries of the programmes will form a PaniPanchayat by registering as per the SocietyRegistration Act, 1860. This body will submit theproject proposal to the collector in the prescribedformat giving details of water source, list of users,the appropriate ayacut area, village, GramPanchayat, block, tehsil and district. After receiptof the application the collector sends theapplication to the surveying agencies as detailedbelow for study of technical feasibility.Responsibility of lift irrigation projects lies withExecutive Engineer, Orissa Lift IrrigationCorporation (OLIC) or District Manager, OAICwhile that in case of Minor irrigation projects withcommand area less than 40 ha is under DistrictRural Development Agency (DRDA) /ITDA/Soilconservation. Minor flow irrigation projects withcommand area more than 40 ha are underExecutive Engineer, Minor Irrigation. If theproject is found suitable after survey, proposalsare sent by the collector to the Water ResourceDepartment indicating a priority order. A statelevel screening committee accepts or rejects theproposal after due scrutiny within one month.Then, financial assistance for execution of theproject is released to the concerned executiveagencies in a phased manner as per the estimateof the project.
11.5.5 Impact of PIM
PIM has been implemented in the state of Orissasince 1995-96 with funding from various agencies,where the differential functioning and

Manual on Enhancing Water Use Efficiency in Canal Commands 149
effectiveness of WUAs under different types ofirrigation system are observed. Farmersperceived adequacy of irrigation water andoverall performance of minor irrigation systemrelatively better in Orissa. The impact ofrehabilitation and irrigation management transferto the farmers group is found positive withrespect to cultivated area, cropping intensity,irrigated area, irrigation intensity, cropdiversification and crop productivity in thesampled minor irrigation systems (Koska inNayagarh district, Devijhar in Ganjam districtand Analaberini in Dhenkanal district) in Orissa.There is a major shift from paddy to non paddycrops in kharif that might be the result of assuredwater availability and trainings received by thefarmers from different agencies during theprocess of PIM. During rabi season, pulses likegreen gram, horse gram, black gram and bengalgram; oilseeds like sunflower and groundnut andvegetables like pointed gourd and brinjal aregrown by the farmers that led to a reduction infallow area.
11.6 Sustainability of PIM
Water Users’ Associations like any otherorganization may sustain only when
The earning is more than the expenditurefunds available as and when required
It has some reserve fund at its disposal
Ensured supply of irrigation water from thesystem
Effective operation plan of the project
Equitable distribution of water
Improvement in recovery of water chargesfrom the farmers
Recovery of water charges for using othersource of water in the operational area
Honesty, dedication and sacrifice
Willingness of the farmers and irrigationagency to make it a success
Conclusion
Farmer’s involvement in irrigation is not new inIndia. Many irrigation works were constructedand managed by the farmers. During the 19th
century, a number of modern irrigation schemeswere implemented by various departmentalagencies without the involvement of farmers. Theirrigation department is left with the only optionto implement PIM, if they want to improve theperformance of irrigation. All state governmentshave to frame their policy considering the typeof irrigation projects and the socio-economicstatus of farmers. For the sustainability of thefarmer groups, adequate administrative financialand legal provisions would be necessary. Toobserve the performance of the farmers managedsystem, it would be essential to have a monitoringcommittee. The objectives and the functions areto be evaluated in the light of the performanceindicators like increase in irrigated area and theagricultural production. Improvement in theeconomic condition of the farmers would beanother indicator. The most ideal situation maybe when the demand of taking over ofmanagement of irrigation system comes stronglyfrom the farmers.

150 Manual on Enhancing Water Use Efficiency in Canal Commands
12.0 ON-F12.0 ON-F12.0 ON-F12.0 ON-F12.0 ON-FARM WAARM WAARM WAARM WAARM WATER MANATER MANATER MANATER MANATER MANAGEMENT FORGEMENT FORGEMENT FORGEMENT FORGEMENT FORENHANCED WENHANCED WENHANCED WENHANCED WENHANCED WAAAAATER USE EFFICIENCTER USE EFFICIENCTER USE EFFICIENCTER USE EFFICIENCTER USE EFFICIENCYYYYY
RRRRRajbir Singh and Pajbir Singh and Pajbir Singh and Pajbir Singh and Pajbir Singh and Parbhakarbhakarbhakarbhakarbhakar Nandar Nandar Nandar Nandar Nandaaaaa
The success of the physical development of waterresources for irrigation is well recognized for itssignificant contribution in attaining all roundagricultural development, but at the same time,it has created problems of secondary soilsalinization leading to degradation of eco-systems due to adoption of unscientific watermanagement practices. Significant improvementin efficiency of irrigation and water use isrequired for prevention and alleviation of theseproblems for which technological innovationsand their adoptions are important ingredients.There has been a growing realization by theplanners and irrigation development andmanagement agencies for adoption of innovativetechnologies of water management on variantaspects for improving the efficiency of irrigationwater which may lead to sustainable agriculturalproduction.
There is a growing awareness of the scarcity valueof water under the conditions of increasing waterdemand from agricultural, domestic andindustrial sectors. Scope of expanding watersupplies through development of new waterresources is limited since suitable dam sites arefewer, development cost are prohibitive andenvironmental concerns are too strong. This hasled to the realization that saving in the use ofwater is the best option for expanding watersupply.
12.1 AICRP on Water Management
After independence, the major irrigation projectswere taken up to increase the irrigated area sothat the food production can be improved. Aftercommissioning of the major projects like Bhakra,Hirakud and Tungabhadra etc, need of scientificuse of irrigation water was apprehended forjudicious use for higher productivity. In view ofthis, conceptualization of systematic andscientific research was realized to generate data
on different aspects of water management andto develop practices and systems for efficient useof irrigation water commensurate with increasedagricultural production and sustained soilproductivity. Looking into above, national levelcoordinated research project was initiated in latesixties in major commands. The All IndiaCoordinated Project on Water Management wassanctioned by the Indian Council of AgriculturalResearch (ICAR) during 1967 with three centresfor three major river valley projects viz. Bhakra,Hirakud and Tungabhadra to conduct researchon different aspects of water management.During the 4th Five Year Plan, the CoordinatedProject on Soil Salinity, Irrigation, Drainage, SoilScience and Water Management (sanctionedduring the later part of Third Five Year Plan) wasmerged with it expanding the jurisdiction of thenew project namely “AICRP on WaterManagement and Soil Salinity” to 16 centres.During 5th Fivr Year Plan, the sphere of theAICRP on Water Management and Soil Salinityproject was further extended to 23 centres bymerging it with another Fourth Plan Project“AICRP on New Cropping Patterns and WaterUse in selected Irrigation Commands”. In the 6th
Five Year Plan (1980-85), the ICAR sanctioned theAll India Coordinated Research Project on WaterManagement for operation at 34 centres bymerging with it the on-going “CoordinatedProject for Research on Water Management inHigh Rainfall Areas and Temperate Hill Zones”with 7 centres; addition of 8 new centres inhitherto uncovered irrigation commands; andtransfer of four centres (which had emphasis onsoil salinity and saline water) to the “CoordinatedProject on Management of Salt Affected Soils andUse of Saline Water in Agriculture”. In the 7th
Five Year Plan (1985-90), the project was elevatedto the level of Project Directorate, however, dueto financial constraints and poor performance,

Manual on Enhancing Water Use Efficiency in Canal Commands 151
nine centres were discontinued during SeventhYear Plan period. The sanctioned ProjectDirectorate was established at Rahuri, Distt.Ahmednagar (Maharashtra) in October 1990.Thus during the 8th Five Year Plan, the AICRPon Water Management was continuing with 25Centres. Now, the Coordinating Unit of AICRPon Water Management is now fully functional atDirectorate of Water Management (DWM),Bhubaneswar and efforts are being made to bringall research work on water management underone umbrella to avoid duplicity and checkwastage of research energy.
The AICRP (WM) since its inception has beencatering to the research needs of waterapplication in agriculture across the country. Theproject has been emphasizing on increasing wateruse efficiency across the crops and regions in thecountry through on station, on-farm andparticipatory mode of water managementprojects spread over twenty five centers in thecountry. The coordinating centers have beenrepresenting diversified agro economic and geohydrological situations.
12.1.1 Progress and salient findings of the project
All India Coordinated Research Project on WaterManagement has made spectacular progress indeveloping a variety of strategies andtechnologies for improving sustainable use,planning and management of available waterresources. During last four decades of itsoperation, the project has taken a lead role toevolve and evaluate location-specific improvedwater management practices and to promotetheir farm-level adoption. The majorachievements of the project are summarizedbelow:
Assessed water demand and supply atdistributary/minor/sub-minor levels indifferent reaches of 18 major commandareas located in different agro-climaticsituations. Crop plans/cropping systemshave been suggested for existing supplysituations and canal reschedulingsuggested for proposed cropping systems.
Proposed crop plans and rescheduling ofcanal system help bringing 22-28 percentadditional cultivated area under irrigation.Proposed cropping systems have thepotential to enhance farm productivity by17-27 percent and net income by 20-30percent in different agro-ecologicalsituations.
Developed canal delivery schedules fordifferent reaches in arid, semi-arid, sub-humid and humid situations of the country.Proposed canal delivery schedules ensurecrop water demand and help in equitabledistribution of water in different reaches.Also moisture availability for subsequenttimely sown crop is ensured with modifiedoperation schedules.
Developed water managementtechnologies/strategies to suit watersupply situations in different commandareas. Alternate crop plans for existingwater supply situations in differentcommand areas. Alternate crop plans forexisting water supply situation aresuggested in Mula, Malprabha, Jayakwadi,Chambak, Lower Bhawani, Ramnagar andTawa command areas. Proposed alternatecrop plans help enhance crop productivityby 15-20 percent in kharif and 21-27 percentin rabi season.
The water management technologiesconsisting of optimum irrigation schedules,proper land layouts, appropriate methodof irrigation and judicious use of otherproduction inputs such as quality seeds,adequate and balanced fertilizers and plantprotection measures have beendemonstrated through on-farm researchprogramme of the project in 18 commandareas, two tube well command areas, onetank command area. Results show thatimproved water management practicesincreases 15-37% crop yields and saves 28-40% irrigation water. This water saving canhelp enhance irrigated area by 15 -17%. It

152 Manual on Enhancing Water Use Efficiency in Canal Commands
is estimated that the improved watermanagement technologies can be used on10 million hectares.
Techno-economic feasibility of dripirrigation in fruits and vegetables and highwater requiring cash crops such assugarcane and banana has been establishedin different agro climatic regions.Developed technologies for drip irrigationalong with other inputs for orchards andplantation crops. Benefits of drip irrigationwere obtained in terms of 20-40 percentwater saving and 15-20 percent yieldincrease.
Drip fertigation technology has beendeveloped, refined and standardized forcash crops such as sugarcane, cotton,banana, groundnut, fruits and vegetablesin different agor-climatic conditions of thecountry. Drip fetigation saved 15-40percent irrigation water, 25-50 percent ofN and K fertilizers and obtained 17-25percent higher yield over surface irrigation.
Developed modified crop geometry andproduction techniques to minimize the costof drip irrigation system. Modified cropgeometries reduced the cost of drip systemby 30-50 percent without significantreduction of crop productivity and netincome.
Developed drip irrigation technology tosuit its adoption in intensive croppingsystems without winding up the dripirrigation system. This system issuccessfully demonstrated and deployedon farmers’ fields in Tamil Nadu andKarnataka states.
Developed and standardized irrigationschedule for 10 fruit crops, 15 vegetables, 5spices, 4 plantation crops, 5 cash crops and6 high value crops for drip, sub-surfacedrip, micro sprinkler, overhead sprinklerand raingun systems.
Developed low-cost drip irrigation systemwhich works efficiently with low energy
requirement (LEPA) for adoption inplantation crops in place of micro-sprinklers. KAU micro-sprinklerdeveloped by Chalakudy centre hastremendous demand in Kerela and TamilNadu state. New devise require 0.3 to 1.0kg/cm2 pressure, less than one HP pump,less clogging susceptibility, more uniformdistribution, 50 percent less cost thanconventional micro-sprinkler system.
Developed the resource conservationtechnologies, which helped enhancingwater, nutrient and other input useefficiency in maize-wheat, soybean-wheatand rice-wheat cropping system in submountaneous Himalaya conditions. Zerotillage in rice-wheat cropping system alongwith optimum irrigation schedule enhancescrop yield by 10-17 percent , ensure timelysowing of wheat and increases water useefficiency of the system by 15 – 25 percent .
Determined water requirement, stage-wisecrop co-efficients and critical growth stagesof 15 cereals, 7 pulses and 5 oilseed cropsunder different agro-ecological situations.
In high water table areas, contribution ofground water-table towards cropevaporation has been quantified andirrigation water requirement isconsiderably reduced. Critical water-tabledepths have been quantified for differentcrops under different agro-climaticsituations. In different crop studies, 30-40,20-22 and 5-8 percent contribution of water-table towards crop ET was observed undershallow, medium and deep water tableconditions respectively on varying texturalsoils.
Studied drainage requirement of differentsoils to leach out the salts form root zonesof the corps. At Hisar, Bhatinda andSriganganagar, drainage requirementsquantified along with gypsum requirementon silt loam, sandy loam, silt clay loam andsandy clay loam soils. At Chiplima,Gayeshpur and Jorhat centres, drainage

Manual on Enhancing Water Use Efficiency in Canal Commands 153
requirement quantified along with limerequirement on sandy loam and sandyloam soils.
Developed techniques/agro-techniques/measures to ameliorate irrigation inducedsaline and waterlogged soils in differentcommand areas of the country.Technologies consisting preventive andameliorative measures have been deployedon farmers fields. Green manuring bySusbenia @20kg seed/ha has been found tobe highly effective on all textured soils. Useof sulphonated press mud for ameliorationirrigation induced saline and waterloggedsoils resulted in fast reclamation of clay andclay loam soils.
Studies the long term effects of faultyirrigation practices on the hydro-physicalbehavior (soil moisture characteristics,saturated hydraulic conductivity,infiltration rate, soil-water diffusivity andsorptivity) of different soil types. This hasbeen studied in Mula, Jayakwadi,Malparbha, Sharda Sahayak, Ramnagar,IGNP, Chambal, Rawi-Tawi, Tawa, LowerBhawni command areas.
Optimum irrigation schedules have beendeveloped for major cereals, pulses,oilseeds, vegetables, fruits, spices, cashcrops, fodder crops, aromatic andmedicinal crops and cut flowers in relationto optimum nutrient, tillage, mulches andother input requirements. Efficient watermanagement technologies for 14 agro-ecological regions consisting of optimumirrigation schedules, optimum depth ofirrigation, proper irrigation methods, soil-specific land layouts and judicious use ofassociated inputs for different cereals,pulses, oilseeds, vegetables and otherimportant crops have been developed andstandarized.
Identified water-use efficient croppingsystems and intercropping systems fordifferent soil types in consideration with
socio-economic needs and marketability ofthe produce. Water requirement ofdifferent intercropping systems have beenevaluated under optimum, sub-optimallevels of water availability in about tenagro-ecological zones of the country.
Developed irrigation schedules for cropsand cropping systems for shallow, mediumand deep water-table conditions in humidand sub-humid climatic situations. Water-use efficient rice-based, sugarcane based,soybean based, cotton based and maizebased cropping systems suggested foroptimum, sub-optimum and sub-sub-optimal water availability situations inview of their social relevance in differentagro-ecological situations.
Water-use efficient corps and cropsequences have been identified. Low waterdemanding sequences have beenintroduced in traditional crop sequenceareas and evaluated for economic returnand water use.
Design specifications of various surfaceirrigation methods like border-strip, furrowand check-basin have been standardizedunder varying soil and agro-climaticsituations in water scarcity areas. Irrigationin alternate furrows has producedencouraging results and need to bepracticed for wide-row spaced crops.Alternate furrow irrigation in maize-chickpea cropping system saved 35 percentirrigation water on black clay soil atBelwatgi. This method has become highlypopular in North Karnataka. Alternatelyalternate method of irrigation with highSAR waters developed by Bhatinda centrereceived attention of farmers of centralPunjab.
12.2 On-Farm Water Management Research
During the last three decades, considerable effortshave been initiated for the development ofsuitable irrigation water management practicesfor agroclimatically diverse irrigated areas. Most

154 Manual on Enhancing Water Use Efficiency in Canal Commands
of the research has however, been conducted onexperimental research stations as on station trialsunder controlled and location specific condition.This has generated tremendous useful data whichcould eventually contribute to the establishmentof a network of empirically derived relationshipdetermining crop water requirements. Theserelationships however, should be tested underoperational conditions for further modificationand possible improvements in order that they canbe used as tools to improve the operation ofexisting projects modernization andrehabilitation of the schemes currently beingimplemented. Controlled water management isimportant in projects with limited water supplyas well as in scheme with abundant water supply.Over irrigation is the common feature which hasresulted in high water tables, water logging,secondary salinization and subsequentdegradation of the physical and chemicalcharacteristics of irrigated soils.
For field testing of the validity and adoption ofthe water management technologies in irrigationcommands, the On-Farm Water ManagementResearch (OFWMR) was initiated in differentcommands. The feedback on effectiveness of thetechnologies and constraints in their adoptionformed the basis of the research agenda to beaddressed through future and collaborativeresearch project. In this context, technologiesdeveloped by the centres of AICRP on WaterManagement in terms of efficient irrigationschedules, optimally designed surface irrigationmethods, pressurized irrigation methods,fertigation, use of saline/good quality water,efficient crop planning and improved cropmanagement towards substantial savings ofirrigation water will form the best way ofdissemination of technology.
The OFWMR on continuing basis is necessary toimprove the operation and management ofexisting irrigation systems, the efficiency of whichis generally low. It is also important to providelocation specific information for planning of newirrigation projects. The OFWMR is warranted for
to improve the design criteria for new projects.For example, lack of analysis of knowledge ofinternal drainage, properties of soils, thehydrology of shallow ground water tables,effectiveness of rainfall probability, rainfalldistribution and critical crop water irrigation anddrainage requirements has contributed toinadequate design and operation of the irrigationprojects. This lack of understanding of the basicclimatic and soil parameters has resulted inoveruse of water and often caused an alarmingrise in ground water tables and even waterlogging in many commands.
12.2.1 Major findings of OFWM
In order to study the effect of scientific irrigationschedule and excess water removeal onagricultural production, On Farm WaterManagement Research (OFWMR) in onetubewell and 10 major canal irrigation commandsof the country has been conducted under aegisof AICRP on WM with the active support ofCommand Area Development Authority(CADA), Ministry of Water Resources,Government of India. The project aimed toquantitatively demonstrate to the farmers as tohow the right decision about when to irrigate andhow much water to apply to different cropsaffected the water saving and crop yields on theirfarms. Thus it was the first step in efficientoperation and management of the tubewell andcanal waters. The methodology of OFWMRconsisted of selected the command of one or twooutlets of a minor/distributary representingmajor farming situations of the irrigation systemfollowed by diagnostic survey about water andother production constraints, and prescribing andadoption package intervention. The summary ofthe results in a few commands are presented inTable 12.1 to 12.4.
In the command of Bichpuri minor of Sahidistributary of Sharda Sahayak Canal (UP), theremoval of water congestion by surface drainageand channelization of excess water to naturaldrainage system along with adoption of the watermanagement technology considerably improved

Manual on Enhancing Water Use Efficiency in Canal Commands 155
the yield of rice and wheat (Table 12.1). Improvedirrigation practices to rice comprised 5 irrigations,each after 3 DAD. Farmers generally preparedlarge size irrigation checks of 800 to 1000m2 intheir wheat fields. In order to improve applicationand distribution efficiencies, the large checkswere converted into border strips of 5.5 x 50 m.Adoption of this practice reduced the depth ofeach irrigation from 10.6 cm to 6.2 cm. Drainagefacilitated timely sowing of rabi crops,particularly wheat by advancing the date ofsowing by 15 to 45 days.
The OFWM studies were conducted in thecommand of outlet No.2 of Rampuri and 6 ofPathera distributaries of Mohindergarh canal,Jawaharlal Nehru Lift Canal (Haryana) on sevencrops for 3 years (1993-94 to 1995-96). In cotton,the impact of heavy pre-sowing irrigation of 8-10 cm depth or 2 irrigation of 5-6 cm depth each,followed by first irrigation at 40-45 DAS andtermination of irrigation in the last week ofSeptember; irrigation in furrow made at 40-45DAS, irrigation at square and boll formationstages in case of low rainfall was evaluated. Incase of pearl millet, the impact of two irrigationsone at tillering and another at antheses wasstudied. In pigeon pea and mung bean, thecomponent technology trial consisted of sowingand irrigation in furrows; irrigation at criticalstages i.e., flowering and pod formation. Inwheat, the component technology trials consistedof light irrigation of 4 to 5 cm depth withsprinkler; irrigation at critical stages i.e. CRI,anthesis and grain development; and use ofbrackish ground water in conjunction with good
quality water. In raya and chickpea, watermanagement technology consisted of heavy pre-sowing irrigation at 8-10 cm depth with goodquality water subsequently irrigation in raya withbrackish water; and irrigation at critical stagesi.e. pre-flowering and pod formation.
The results were compared with farmers’practices of application of invariably higher depthof irrigation in improperly leveled and large sizedplots. It was observed that adoption of improvedirrigation practices improved the crop yields from20 to 63 percent and saved about 5-28 percentirrigation water over farmers’ practices (Table12.2). Maximum increase in grain yield andsaving in irrigation was observed in the case ofpigeon pea and minimum in case of chickpea.
On-Farm Water Management studies wereconducted in the command of D-10,Mettupalayam distributary of Lower BhawaniProject (Tamil Nadu) on two major crops, rice andground nut. The command has shallow welldrained soils. In short duration rice (ADT 38), theeffect of 5 cm irrigation one day afterdisappearance of poded water (DAD) normallycoressponding to irrigation once in four days wasdemonstrated in study block. Rice (IR-20) andfarmers applied heavier depth of irrigation (6-7cm). The data (Table 12.3) indicated that grainyield of rice increased by 25 percent in study blockas compared to control block and saved 22.6percent irrigation water. In ground nut,application of irrigation of 5 cm depth at 10-12days interval which corresponds to IW/CPE =0.6increased the pod yield by about 18 percent andwater saving of 21.6 percent over farmers’practice of heavier irrigation depth.
Table 12.1 : Effect of water management technology on crop yield and water saving in the commandof Bichpuri minor
Crop No. of Yield (t/ha) Increase in Saving indemonstrations yield (%) irrigation water
Farmers’ Improvedpractice practice
Rice 5 6.14 8.13 32.1 38
Wheat 7 3.20 4.17 30.3 42

156 Manual on Enhancing Water Use Efficiency in Canal Commands
Table 12.2 : Impact of water management practices on crop yield (t/ha) and water saving (%) in thecommand of Jawaharlal Nehru Lift Irrigation Canal in Haryana
Crop No. of Yield (t/ha) Increase Water use Saving in(cm) trials Farmers’ Improved in yield Farmers’ Improved water over
practice practice over practice practice farmersfarmers’ practicepractice (%) (%)
Cotton 67 0.74 1.09 47.2 22.5 17.1 24.0
Pigeon pea 35 0.76 1.25 63.1 15.4 11.0 28.5
Pearl millet 85 1.35 1.86 38.0 8.3 7.5 10.6
Mungbeam 25 0.53 0.73 38.4 8.2 7.2 12.1
Wheat 65 4.06 4.86 19.8 44.8 40.1 10.5
Raya 58 1.73 2.17 26.2 15.8 13.9 12.0
Chickpea 12 1.36 1.66 22.2 7.2 6.8 5.5
Table 12.3 : Impact of water management on rice and groundnut yield in Lower Bhawani Command
Crop Crop yield (t/ha) Irrigation (cm) Rainfall Increase Water(mm) in yield saving
(%) (%)
Rice 6.96 5.57 96 124 450 24.9 22.6
Groundnut 2.06 1.74 53.5 68.2 20 18.4 21.6
On-Farm Water Management studies wereimplemented in the commands of Kalady andKarukutty distributaries of Chalakudy IrrigationProject (Kerela). The command area receives highrainfall of over 3000 mm from south-west andnorth-east monsoons. Package interventions wereintroduced in a compact block of 45 ha of wettedand a nearby upland area of nearly 50 habelonging to 200 farm families. A nearby area of15 ha was slelected as control. In kharif, due tothe abundance of rainfall, though canal water isnot required for irrigation, yet the canals remainopen since the system is rub-of-the river type.Consequently, in low lying area of Chalakudycommand, flooding is a severe problem. Oftenthe depth of flooding exceeds 20 cm during thecrop season. The studies were conducted tochannelize the excess water to drains and toregulate the depth of submergence to about 5cm.The provision of surface drain produced 92.6percent higher grian yuiled of rice compared to
no drainage treatments. In rabi, application ofirrigation of 7 cm depth 1-2 days afterdisappearance of ponded water wasdemonstrated against field to field irrigation withdeeper submergence in rice in control block.Earhten filed channels were provided tochannelize irrigation. The improved irrigationregime produced a grain yield of 2.7 t/ha of rice(Cv. Chittni), 77 percent higher than that undertraditional practice of field to field irrigationadopted in the control block besides a saving of79 percent of water (Table 12.4). In summer rice,the schedule of one irrigation of 7 cm depth 3DAD was adopted against the traditional practiceof field to field irrigaton. The results indicatedsimilar trends on grain yield of rice, as in rabiseason. Application of one irrigation 3 DADincreased rice yield by 67 percent with a savingof of 87 percent of irrigation water over field tofield irrigation.

Manual on Enhancing Water Use Efficiency in Canal Commands 157
Table 12.4 : Rice grain yield and water use in farmers’ fields in Chalakudy irrigation command
Water management practice No. of Grain Irrigation Relative Saving infarmers yield (t/ha) depth (cm) grain yield irrigation
water
Kharif (Cv.Red Triveni)
Surface drainage 10 2.92 - 162.60 -
No drainage 5 1.52 - 100.00 -
Rabi (Cv. Chittni)
7 cm irrigation after 1-2 days 10 2.80 153 177.20 79of drainage
Control (field to field irrigation) 5 1.58 720 100.00 -
Summer (Cv. Red Triveni)
7 cm irrigation after 3 days 10 3.35 54 167.00 87of drainage
Control (field to field irrigation) 5 2.01 420 100.00 -
12.3 Operational research in water management
Generally water management research confinedto SAU, institutes and research stations. Theagricultural scientists of these organizations didnot have much opportunity to interact withirrigation engineers and farmers in tackling onfarm management problems. This created a gapbetween the available research findings and theirutilization for improving the design andoperations of irrigation systems. There is a greatneed for establishing empirically derived designcriteria for irrigation projects.On the farmer’sfields, the degree of experimental control will beless and variations in physical and farmmanagement factors will be considerably greaterthan in traditionally on-station experimentation.Therefore, important change in researchmethodology, observations and interpretationtechnique will be warranted. Without thisexpansion of research accomplishments andthereby alterations in the research methodology,most of the crop/soil water management researchwill remain location specific and its results willbe limited relevance to farmers conditions.
Operational research is most needed at presentso that the research findings should be relevantto farmers need. It should not only be a functionof needs as perceived by farmers who areultimate beneficiaries of the irrigation system, butshould also respond to the project limitations andto the concerns of the irrigation department whomanages it. For this purpose it is necessary todiagnose operational constraints for improvingmanagement and use of water; measure theimpact of changes in water management oncropping pattern and consequently on the timingof farm operations; establish crop growth andyield responses to different levels of water supplyover the full growing period for specific cropsand crop sequences; and monitor and recordfactors influencing the supply of water whichcould disturb and change the underlyingassumptions for designing water deliveryschedule.
Taking into considerations of the above facts,different centers under AICRP on WaterManagement have been carrying out OperationalResearch Project (ORP) in collaboration with line

158 Manual on Enhancing Water Use Efficiency in Canal Commands
departments, irrigation department and otheragencies with active participation of farmers.
The technologies interventions like adoption ofefficient cropping pattern as per availability ofwater, use of field channels and drainage undercanal commands, appropriate tillage practices forbetter moisture conservation and weed control,irrigation application as per crop water demand,irrigation scheduling for optimization ofproduction and productivity, application ofpressurized irrigation system under differentcropping sequence, introduction of high valuecrops under different water managementregimes, mulching, adoption of a croppingpattern suiting to canal water supply undermajor, medium and minor irrigation projectshave been demonstrated in participatory mode.The active participation of farmers in ORP hasled to the adoption of new or improvedtechnologies for higher and sustainableproductivity. The success stories of ORP atdifferent places have been helping other farmers
to adopt the technologies and up-scaling it inlarger areas under similar agro economicconditions. The centers have been monitoring theimpacts of the ORP and the results have beenreported and documented for policy planning.The feedbacks from the farmers have beenexamined by the scientists and suitablerefinements have been done suiting agroecological and socio-economic conditions in theORP areas. The scientists have also analyzedbenefit and cost of the new technology at farmers’condition and advocated for the upscaling ofprofitable technologies. Under the process ofassessment, refinement and transfer oftechnologies, the scientists have been propagateda number of agricultural water managementtechnologies that are under process of adoptionat different locations across the country. Thesalient findings on enhanced crop productivityand water use efficiency in selected majorcommands of different regions are presented incoming chapters as selected case studies.

Manual on Enhancing Water Use Efficiency in Canal Commands 159
13.0 IMP13.0 IMP13.0 IMP13.0 IMP13.0 IMPAAAAACT OF CONJUNCTIVE USE ON WCT OF CONJUNCTIVE USE ON WCT OF CONJUNCTIVE USE ON WCT OF CONJUNCTIVE USE ON WCT OF CONJUNCTIVE USE ON WAAAAATERTERTERTERTERPRODUCTIVITY APRODUCTIVITY APRODUCTIVITY APRODUCTIVITY APRODUCTIVITY ACROSCROSCROSCROSCROSS A CS A CS A CS A CS A CANAL COMMAND OFANAL COMMAND OFANAL COMMAND OFANAL COMMAND OFANAL COMMAND OF
BHAKRBHAKRBHAKRBHAKRBHAKRA IRRIGA IRRIGA IRRIGA IRRIGA IRRIGAAAAATION SYSTEMTION SYSTEMTION SYSTEMTION SYSTEMTION SYSTEMRRRRRaaaaavish Chandrvish Chandrvish Chandrvish Chandrvish Chandraaaaa
By nature, Haryana state is in a disadvantageousposition with regard to rainfall, surface waterquantum and ground water quality. About 50%of the area of the state constituting the easternzone has a semi-arid climate while the remaining50% constituting the western zone has an aridclimate. The utilizable potential both from surfaceand ground water resources has been estimatedat 2.75 m ha-m (surface 1.51 m ha-m and groundwater, including marginal quality 1.24 m ha-m),which is just about 60 % of the irrigationrequirement (Anonymous, 2008). The statereceives an effective rainfall of about one m ha-m to meet the consumptive use demand of crops.The net irrigated area in the state is 2.89 m ha;almost 50-50% each from surface and groundwaters. The entire area is covered under threebasins: Yamuna basin (16,330 Km2), Ghaggarbasin (1,067 Km2) and internal basin (17,207 Km2).In the north of the state, the land area slopes fromnorth-east to south-west, whereas in the south, itslopes from south-west to north-west along theDelhi-Rohtak-Hisar-Sirsa axis. Thisphysiographic situation makes a depressionalsaucer shape zone around this axis and is mainlyresponsible for the problem of flooding,waterlogging, high water table conditions andsalinity of roughly 15,318 Km2 area in the inlanddrainage basin (Anonymous, 2008).
The West Yamuna and Bhakra canals are the twomajor canal irrigation systems in Haryana. Theground water is exploited through a battery ofmainly shallow tubewells. The Western YamunaCanal system supplies surface water to easternand southern parts and Bhakra Canal System tothe western parts of the state. These canal systemscomprises of canals, distributaries, minors, subminors and watercourses. In about 88% of
culturable command area (CCA) of these canalsystems, topography allows gravity flow. In thisregion fresh water from canals is suppliedthrough a rotational Warabandi system (Malhotra,1982) which has been designed to provideequitable water supplies. Irrigation intensity isaround 50% (4960 m3/ha) in Western Yamunacommand, 62% (6070 m3/ha) in Bhakracommand. Canal water allowance, however, isgenerally not sufficient to irrigate the totallandholding of the farmer. Substantial seepagefrom earthen distribution channels and illegal useof canal water by head-end farmers create largevariations in supply, spatially as well astemporally. Because of this variation in supplyand the low reliability of canal water supplies,groundwater has become important, includingin the irrigated canal command of Bhakra system.Shallow and deep tube wells irrigate an areaequal to or greater than the area irrigated by canalwater (Economic and Statistical Organization1995). Twenty-four percent of the command areais underlain by marginally saline to saline water,and in the last two decades, the water table hasrisen substantially (5 to 10 m) in a large portion(64%) of the command. The continuing rise inwater tables in these areas is one of the majorproblems in the command. But in Kaithal,Kurukshetra, and Ambala districts, due toextensive development of good qualitygroundwater, the water table has droppedsubstantially. Such an overdependence ongroundwater and weak regulatory mechanismsfor water use have resulted in growing waterscarcity and an increasing threat to thesustainability of water-intensive croppingsystems. The challenge for irrigated agriculturewill be to grow more food with less water (Guerra
CASE STUDY

160 Manual on Enhancing Water Use Efficiency in Canal Commands
et al., 1998). The old notion of increased inputapplications will have to be changed, and newparadigms of optimized resource use insustainable ways need to be evolved. The focusof improving land productivity has to be shiftedtoward improving water productivity. Thereforeit is extremely important to address some of theissues at the field level. Studies were conductedto determine the impact of conjunctive use onwater productivity in a rice-wheat croppingsystem at the real field level in ‘Pabnawa Minor’of Bhakra canal command of Haryana. This studyalso tried to assess profitability of farmers acrossthe canal command and the contribution ofgroundwater in total irrigation across the canalcommand.
13.1 Detail of Study area
The study area is the command area of Pabnawaminor (tertiary canal) of Bhakra irrigation system,located in the semiarid tropics in Haryana, Indiaat 29°31' - 30°12' N and 76°10' – 76°43' E. Averageannual rainfall is 625 mm, about 80% of which isreceived during the monsoon period (July toSeptember). Average evapotranspiration is about
1550 mm. For this study, villages (Jyotisar andRaogarh) at the head of the Pabnawa minor,Barna in the middle, Pabnawa at the far middle,and Faral in the tail stretch of the Pabnawa minorwere selected. Details of four watercoursessupplying canal water to them are summarizedin Table 13.1. Fields of 122 farmers (at least 30farmers in each of the four stretches–with at least10 located in the head, middle, and tail reachesof each watercourse) were selected for detaileddata collection. Information on agriculturalpractices, irrigation water supply from tubewellsand canal water, cropping pattern, cost ofcultivation, and yields were collected throughspecifically designed questionnaires. The primarydata for this study were collected for rabi 2006-07and kharif 2007. Gauge readings of the canal werecollected for the last 3 years from KurukshetraIrrigation division. Discharges of tubewells wereestimated using the coordinate method (Michael,1978). Historical data regarding the canalirrigated area, water table fluctuations andvarious other data related to groundwater werecollected from Kurukshetra Irrigation Division,Agriculture Department and Groundwater Cell.
Table 13.1 : Details of selected watercourses
Watercourse (stretch of canal) Design discharge (m3/sec) Gross command area (ha)
Pabnawa 2820R (Head ) 0.028 231.6
Pabnawa 23400R (Middle) 0.040 213.6
Pabnawa 53705L (Far Middle) 0.041 320.2
Pabnawa 80000L (Tail) 0.052 283.0
13.2 Salient achievements
i) Groundwater use
Crop production is directly related to canal watersupply. The rigid schedule of water distributionand the inadequacy of the canal water supply donot provide much scope to the farmers fordecision making in respect of canal waterutilization. Their decisions are mostly limited tomanaging the readily available groundwater. Thecanal irrigated area in Pabnawa minor isshrinking due to management inadequacies.From 1995 to 2005, the canal irrigated area
decreased in the middle reach by 11 to 65%during the kharif season and by 11 to 44% duringthe rabi season. Tubewell water use is very highin the tail and far middle reaches in both seasons(Table 13.2).ii) Water productivity at field levelWater productivity (WP) refers to the benefitsderived from use of water. It is expressed in termsof kg/m3 of water or Rs/m3 of water.Productivity of total irrigation water (canal +groundwater) increases from head to tailstretches for paddy (2007), Basmati (2007), anddecreased from head to tail for wheat (2006-07)

Manual on Enhancing Water Use Efficiency in Canal Commands 161
(Table 13.3). The irrigation water productivity forcoarse paddy and basmati paddy is higher by 35and 21% for the tail stretch as compared to thehead stretch. This is probably because of wastageof low-cost canal water in the upper reaches, andcareful use of groundwater in the tail stretch.Electricity is supplied every alternate day for 6-7hours, and hence the tail end farmers have to usethese electricity supply hours judiciously. Thesame phenomenon is found for irrigation waterproductivity within the stretch. For wheat,irrigation water productivity is lower by 12% inthe tail stretch and by 2.5% in the far middlestretch than in the head stretch. This wasunexpected as the wheat crop in the tail stretchwas badly affected due to heavy rain in February2007 (216 mm). The soil in the tail stretch is clayloam, which encourages water stagnation and
yield loss. Water productivity of paddy andwheat for different sources of irrigation is givenin Table 13.4. The highest irrigation waterproductivity for paddy is for tubewell irrigatedfarmers, followed by conjunctive users and thenby canal-irrigated farms. Irrigation waterproductivity is Rs 3.63/m3 for coarse rice, Rs5.62/m3 for basmati rice, and Rs14.87/m3 for wheat.The information gives an impression that farmersare cheaply using water for paddy as comparedto wheat. But it is worth noting that farmers tendto maximize their crop income and basmati ricegives the highest gross margin per hectare,followed by coarse rice and wheat. Thisemphasizes the challenge of enhancing waterproductivity while increasing or sustaining theeconomic benefits to the farmer.
Table 13.3. Water productivity for wheat (2006-07), coarse paddy, and basmati paddy (2007).
Season Sources of irrigation Head Middle Far Middle Tail
Rabi(wheat) Canal 6.8 10.0 3.1 0.84
Groundwater 18.3 12.8 19.5 19.8
Kharif (Paddy) Canal 61.7 97.3 40.3 3.2
Groundwater 94.3 55.9 101 116
Table 13.2. Use of canal water and groundwater for irrigation (cm) during rabi and kharif seasonin 2006-07.
Crop Location of Irrigation water Total water productivitywatercorse productivity(Rs/m3) (Rs/m3)
Paddy Head 3.30 2.56
Middle 3.31 2.57
Far Middle 3.44 2.60
Tail 4.48 3.18
Basmati paddy Head 5.54 4.32
Middle 4.49 3.95
Far Middle 5.57 4.34
Tail 6.88 5.03
Wheat Head 15.08 7.17
Middle 16.42 7.39
Far Middle 14.73 6.84
Tail 13.25 5.79Price of crops is of year of study

162 Manual on Enhancing Water Use Efficiency in Canal Commands
Table 13.4. Water productivity of paddy and wheat for different sources of irrigation.
Crop Sources of irrigation Irrigation water Total waterproductivity (Rs/m3) productivity(Rs/m3)
Paddy Canal irrigation 2.19 1.77
Conjunctive Irrigation 3.07 2.43
Tubewell Irrigation 4.21 3.06
Basmati paddy Canal irrigation 4.13 3.39
Conjunctive Irrigation 4.44 3.80
Tubewell Irrigation 6.63 4.93
Wheat Canal Irrigation 18.40 7.96
Conjunctive Irrigation 15.10 7.15
Tubewell Irrigation 14.30 6.46
iii) Profitability
The profitability of crop production depends onthe crop yield, output price, and cost ofproduction. The cost of production is highest forbasmati rice and lowest for wheat (Table 13.5).The average cost of production is Rs15065/ha forbasmati paddy, Rs13301/ha for coarse paddy,and Rs12495/ha for wheat. The gross value ofproduct is calculated using the minimum supportprices for coarse paddy and wheat. For basmatipaddy the average prices received by the farmerswere used. The gross margin is highest forbasmati rice, followed by coarse rice and wheat.The gross margins for basmati paddy and coarse
paddy are 3.2 and 1.7 times higher than the grossmargin of wheat. The average G.M/ C.O.P. ratiois 4.55 for Basmati paddy, 2.76 for coarse paddycompared to 1.76 for wheat. The gross margin ofbasmati rice cultivation in tail watercourse was14% less than the gross margin at the head . Grossmargin for coarse rice was 11% less at Pabnawatail compared to the head end watercourses. Butin the case of wheat the gap in gross marginbetween the tail and head was 59%. The flat tarifffor electricity (based upon the HP of the pumpand not the actual pumping hours) helpsmaintain the higher profitability of rice for thefarmers. If the cost of water were different forrice and wheat, this would change.
Table 13.5. Profitability of crop production (rabi, 2006-07, kharif, 2007).
Crop Location Cost of production Gross value of Gross margin GM/COP(COP) (Rs/ha) product (Rs/ha) (GM) (Rs/ha)
Basmati paddy Head 15705 87771 72066 4.59Middle 14562 84522 69960 4.80Far Middle 15718 84233 68515 4.36Tail 14275 77047 63452 4.45
Coarse paddy Head 13309 51719 38409 2.89Middle 12523 51149 38626 3.08Far Middle 13571 48536 34965 2.58Tail 13800 48398 34558 2.50
Wheat Head 13098 36550 23452 1.79Middle 11925 36852 24778 2.08Far Middle 12452 35022 22834 1.83Tail 12506 27248 14742 1.18
Price of output taken as of 2007: Coarse paddy-Rs 7.5/kg, Basmati paddy-Rs 25/kg, Wheat-Rs 8.5/kg

Manual on Enhancing Water Use Efficiency in Canal Commands 163
The profitability of crop production was alsodetermined for different sources of irrigation(Table 13.6). The cost of cultivation washighest for conjunctive irrigation compared totubewell and canal irrigation alone. But thegross value of product was also highest forconjunctive irrigation compared to other
sources of irrigation, resulting in higher grossmargin for conjunctive irrigation of basmatipaddy and coarse paddy. This analysissuggests that with the flat rate of electricityand higher return of paddy, high water usewill continue. There is an urgent need to lookinto this serious issue.
Table 13.6. Profitability of crop production under different sources of irrigation
Crop Sources of Cost of Gross value Gross margin GM/COPirrigation production of product (GM) (Rs/ha)
(COP) (Rs/ha) (Rs/ha)
Basmati paddy Canal 11399 40218 28819 2.53Conjunctive 13673 51201 37528 2.74Tubewell 13334 50062 36728 2.75
Coarse paddy Canal 14568 82550 67982 4.67Conjunctive 15942 84373 68431 4.29Tubewell 14297 82544 68247 4.77
Wheat Canal 12330 36703 24373 1.98Conjunctive 12512 36828 24207 1.93Tubewell 12521 31424 18903 1.51
Price of output taken as of 2007: Coarse paddy-Rs 7.5/kg, Basmati paddy-Rs 25/kg, Wheat-Rs 8.5/kg
13.3 Options for improvement
i) Artificial recharge of groundwater
Harnessing surplus monsoon flows and canalflows to recharge the aquifer system could, inprinciple, augment groundwater resources.Artificial groundwater recharge should be doneon a priority basis, through rooftop rainwaterharvesting and a combination of recharge shaftsand injection wells (CGWB, 2004). The impactassessment of artificial groundwater recharge bycombination of recharge shafts and injection wellsin Haryana has 3.45 M m3 runoff water rechargedin one year and the rate of water table declinereduced from 1.175 m/year to 0.25 m/year.Recharging of confined aquifers by injectiontubewells in Kurukshetra district indicates waterrecharges at the rate of 7.2 m3/day/tubewell(Kaledhonkar et al., 2003). In 2002-03 manyfarmers of this area changed from centrifugal tosubmersible pumps. The abandoned wells andpipes are still there and can be modified and usedfor groundwater recharge.
ii) Conjunctive use of water
Conjunctive use of water from different sources
is considered to be a valuable tool to overcomethe constraints of the surface and groundwatersystems, if operated independently. A typicalcanal irrigator in this area gets surface water 12-18 times a year. Most of these head-end farmersalso have tubewells for supplemental irrigation.The ratio of canal water and tubewell water forhead-end farmers is about 70:30. But if this ratiocan be reversed to 30:70 and the surplus canalwater can be transferred to tail-end farmers it willminimize tubewell water use. The lining ofwatercourses is also essential for conjunctive useof water. The lining of watercourse no. 23400Rof Pabnawa minor has increased the irrigated areafrom 18 ha to 40 ha. This lined watercourse canalso be used while irrigating from tubewell.Conjunctive use planning requires establishmentof firm water supplies and their distribution anduse of groundwater and allocation of water todifferent users.
iii) Promotion of resource conservationtechnologies
The use of resource conservation technologiesneeds to be encouraged by providing subsidiesto farmers to adopt technologies such as zero

164 Manual on Enhancing Water Use Efficiency in Canal Commands
tillage, bed planting, laser leveling, and SRItechnique for growing paddy. It will improvegroundwater use efficiency. Chandra et al. (2007)suggest superiority of zero tillage overconventional tillage in wheat in terms ofirrigation water productivity, land productivity,and profitability of crops. Similarly, bed plantingand laser leveling have great potential. At thesame time there should be some incentives forfarmers to save water.
13.4 Conclusions and recommendations
In the canal water distribution system, a gapbetween head and tail farm gate supply alwaysexists, and the system investigated is noexception. The inadequate, inequitable, andirregular canal water supply has led to shrinkageof the canal irrigated area over time andgroundwater is playing an important role in cropproduction. Groundwater accounts for more than50% of the total irrigation water use in thePabnawa canal command.
Water productivity increases from head to tailwatercourses for coarse and basmati rice. Thistrend is due to wastage of low-cost canal waterupstream and judicious use of costlygroundwater at the tail end. The gross margin ishighest for basmati rice, followed by coarse riceand wheat. The higher profitability of rice andflat rate electricity charges result in high wateruse for canal and groundwater, causing watertable decline. This system of intensive irrigatedagriculture is unsustainable in the long run,because of declining water tables and high useof energy. In the short term, food security, poorlydesigned electricity tariffs, and high minimumsupport price for rice need to be rationalized.Conjunctive use farmers have the highestprofitability and moderate water productivitycompared to tubewell irrigators and canalirrigators. Conjunctive use of water from differentsources is considered to be a valuable tool toovercome the constraints of the surface andgroundwater systems, if operated independently.
This study produced some important policyrecommendations:
There is an urgent need to enactgroundwater legislation to stopindiscriminate exploitation. A state
groundwater body should be set up toregulate and control groundwaterdevelopment and management on asustainable basis.
There should be strong incentives to thefarmers for establishing artificialgroundwater recharge structures in the formof waiving electricity costs.
Conjunctive use planning requires theestablishment of firm water supplies andtheir distribution, effects of waterdevelopment and use of groundwater, andallocation of water to different users.
Resource conservation technologies need tobe encouraged by providing subsidies tofarmers to adopt technologies such as zerotillage, bed planting, laser leveling, and SRItechnique for growing paddy which willimprove water use efficiency.
Artificial groundwater recharge should bedone on a priority basis, through rooftoprainwater harvesting, and combination ofrecharge shafts and injection wells.
References
Anonymous. 2008. Enhancing water productivity inHaryana. (Eds.) Dhindwal, A S., Phogat, V K andHooda, I S. Department of Soil Science, CCS H A U,Hisar
Central Ground Water Board, CGWB. 2004. Watersecurity through groundwater management inHaryana. North Western Region, Chandigarh.
Chandra, R, Sikka, A. , Singh, S., Gupta, R.,Upadhyaya, A.K and Sakthivadivel. R. 2007. Impactof resource conserving technologies on water use andwater productivity in Pabnawa minor of Bhakra canalsystem. Rice-Wheat Consortium Technical Bulletin 10.
Guerra, L.C., Bhuiyan, S.I., Tuong, T.P and Barker,R. 1998. Producing more rice with less water fromirrigated systems. SWIM Paper 5. Sri Lanka, Colombo:International Water Management Institute.
Kaledhonkar, M.J., Singh, O.P., Ambast, S.K., Tyagi,N.K and Tyagi, K.C. 2003. Artificial groundwaterrecharge through recharge tubewells: a case study, IE(I) Journal-AG, 84: 28-32.
Malhotra, S.P. 1982. Warabandi system and itsinfrastructure. Central Board of Irrigation and Power.Publication No.146. New Delhi, India.
Michael, A.M. 1978. Irrigation: Theory and Practice.Vikash Publication, New Delhi, India.

Manual on Enhancing Water Use Efficiency in Canal Commands 165
14.0 ENHANCING W14.0 ENHANCING W14.0 ENHANCING W14.0 ENHANCING W14.0 ENHANCING WAAAAATER PRODUCTIVITY THROUGHTER PRODUCTIVITY THROUGHTER PRODUCTIVITY THROUGHTER PRODUCTIVITY THROUGHTER PRODUCTIVITY THROUGHCCCCCANAL WANAL WANAL WANAL WANAL WAAAAATER HARVESTING AND BTER HARVESTING AND BTER HARVESTING AND BTER HARVESTING AND BTER HARVESTING AND BY INTRODUCINGY INTRODUCINGY INTRODUCINGY INTRODUCINGY INTRODUCING
MICROIRRIGMICROIRRIGMICROIRRIGMICROIRRIGMICROIRRIGAAAAATION IN TTION IN TTION IN TTION IN TTION IN TAIL-ENDAIL-ENDAIL-ENDAIL-ENDAIL-END
RRRRRajbir Singh, Saajbir Singh, Saajbir Singh, Saajbir Singh, Saajbir Singh, Satyendrtyendrtyendrtyendrtyendra Ka Ka Ka Ka Kumar and Ashwani Kumar and Ashwani Kumar and Ashwani Kumar and Ashwani Kumar and Ashwani Kumarumarumarumarumar
About 31% of total geographical area of India fallsunder arid and semi-arid region whereagriculture is dependent either upon rain orsurface and underground water resources. Thelimited availability of water is the most limitingfactor for crop diversification in these areas andproblem further aggravates if underground wateris also not fit for irrigation. Though, canalnetwork has been developed in many such areas,but the problem of water logging, salinity andloss of nutrients have appeared due tounscientific manner of water applicationparticularly at heads of the canal command(Agarwal et al. 2009). However, at the middle andtail end, many times water supply is notadequate. Besides this, canal water supply is notregular throughout the year and authoritiesdistribute water among the farmers and the turnfor canal water supply hardly comes once in aweek. The overall efficiency of canal irrigationsystem worldwide is very low. This leads to poorutilization of irrigation potential, created at ahuge cost. The average overall project efficiencyof several canal irrigation projects has beenestimated as 23 – 40 %. Navalwala (1991)reported that 71 % of the irrigation water is lostin the conveyance from source head to the actualfield. The wastage occurring during conveyanceand application ultimately results in delivery ofonly 30-35% of stored water for plant uptake(Anbumozhi et al., 2001). Moreover, conventionalmethod is more of supply driven than crop-demand driven causing a mismatch betweenneed of the crop and the quantity of watersupplied. Hence, inadequate water supply andrequirements for higher agricultural productivitynecessitates improving water use efficiency.Therefore, shifting from traditional to drip system
would result in higher water productivity andminimize problems associated with traditionalirrigation methods (Kumar et al., 2007).
Microirrigation in conjunction with secondaryreservoir may be an alternate for cropdiversification with fruits and vegetables in canalcommand by providing ensured irrigation withlimited available water. Research studies carriedout in India and abroad categorically exhibitedbeneficial effect of microirrigation, which cansave precious water with enhancement of yieldof different crops under varied agro-climaticconditions (Hanson et al., 1997; Kumar et al., 2007,2008.; Singh et al.,2009). Secondary reservoirs arestorage structures (ponds) located in irrigatedareas that allow farmers to store whole or a partof canal water and use judiciously throughmicroirrigation (Kumar et al., 2008). During leanperiod or in rainy season when canal water is notneeded for irrigation, can also be stored and beingused during critical periods. Despite of numerousbenefits and government financial support(subsidy), farmers are hesitant to adoptmicroirrigation in canal command. Perhaps, thegreatest barrier is the lack of information aboutthe techno-economic feasibility of microirrigationwith secondary reservoir. Information about theuse of microirrigation in fruit and vegetables incanal command is limited while in conjunctionwith water storage facility is perhaps notavailable. In order to breeze the information gapand to answer whether crop diversification withfruits and vegetables using microirrigation incanal-irrigated areas is profitable, the study wasplanned.
CASE STUDY

166 Manual on Enhancing Water Use Efficiency in Canal Commands
14.1 Detail of case study
a) Experimental site: Investigations were carriedout at the research farm of Central Institute ofPost Harvest Engineering and Technology,Abohar (30o 09’ N ; 74o 13’ E; 185.6 m MSL).Abohar is situated in southwest parts of Punjab,India. The topography of experimental field wasflat. Soil was sandy loam with the bulk densityof 1.55 Mg m-3 and available soil moisture of 0.125cm3 cm-3. The site is located in a semi-arid (dry)monsoonal region with mean annual rainfall of< 400 mm, of which 70-80 % is received in July,August and September months. Groundwater isinadequately available and not suitable forirrigation due to salinity (14.7 dS m-1). Hence,agriculture in this area depends only upon canalwater supply. The minimum and maximumtemperature, humidity, pan evaporation andwind speed during the study period rangedbetween 5 and 48oC, 29 and 96%, 0.5 and 10.0 mmday-1, and 1.0 and 3.6 m s-1, respectively. May andJune are the hottest and December and Januaryare the coolest months of the region.
b) Water resource development for drip system:Regular water supply is pre requisite to havemaximum benefits from adoption of microirrigation system. A dugout pond (secondaryreservoir) of 1500 m3 capacity was constructed atthe research farm for harvesting canal water andlined with LDPE sheet (250-micron) to eliminateseepage losses. Reservoir was fed with goodquality canal water (pH 8.2 and electricalconductivity 0.51 dS m-1) from Punjawa minor ofAbohar distributory under Sirhind Canal System.Stored water subsequently used by drip system.A line-sketch of canal-fed secondary reservoir,pumping unit and drip system is illustrated inFig 14.1. The same secondary reservoir was usedto irrigate other crops at the research farm. Therequired capacity of secondary reservoir wasestimated as 400 m3 per hectare on the basis ofpeak irrigation water demand. Though farmersget the canal water supply once in a week,capacity of reservoir was estimated on the basisof irrigation water requirements of the crops forthe period of two weeks to cover risk. The same
capacity was utilized for the purpose ofestimation of cost of service reservoir for theeconomic analysis.
Fig. 14.1 Line sketch of service reservoir connected withsource of water supply of Micro-irrigation system
c) Installation of micro irrigation systems forselected crops: Vegetables and fruit crops wereplanned in place of traditional cotton crop undercrop diversification plan. Selected vegetable cropswere onion, potato, tomato and capsicum; andhorticultural crops were pomegranate, guava,strawberry and kinnow. Micro sprinkler wasplanned for onion and potato. Drip was plannedfor tomato, capsicum and other fruit crops. Thelayouts of micro irrigation (micro sprinklers)systems for onion and potato crops wereprepared considering source of irrigation, slopeand shape of field. The field was divided into twoparts with sub main of 90 mm diameter at thecentre of the field and laterals of 16 mm diameteron the both sides of sub main. The spacingbetween two micro sprinklers in case of onionand potato was kept as 3 m. The drip irrigationsystem was preferred for tomato and capsicum.Spacing for inline drip laterals was 0.90 m and0.5 m for tomato and capsicum, respectively.Emitters were placed at distance of 0.50 m forboth the crops. Crop geometry of potato, onion,tomato and capsicum was 60 x 10, 15 x 10, 90 x 50

Manual on Enhancing Water Use Efficiency in Canal Commands 167
and 50 x 50 cm, respectively. In case of fruit cropssuch as pomegranate, guava and kinnow, sub-main passed through the centre of the field andlaterals of 16 mm were laid out on both sides ofthe sub-main along the row of fruit trees. Fouremitters, each of 4-lph discharge, were fixedaround the tree stem in circular loop, made of 12mm lateral pipe to maintain the equidistancebetween two adjacent emitters. Plant to plantspacing of pomegranate, guava, and kinnoworchard was 3.5 x 3.5, 6 x 6 and 6.6 x 6.5 m,respectively. Drip system was installed in oneyear old plantation of pomegranate and guavawhile it was installed in 3 years old orchard incase of kinnow.
d) Growing of selected crops by surfaceirrigation method: As the basic aim of theresearch was to assess the feasibility of dripsystem in conjunction with service reservoirunder irregular/ limited canal water supplyconditions, crops were also grown with thesurface irrigation methods for the purpose ofcomparison as per farmers’ practice. As far asirrigation scheduling is concerned, farmersirrigate the fruit crops twice in a month duringMay and June and rest of the year once in amonth, if canal is running and there is no rainfall.Some times during the hot summer months, treesdo not get irrigation for the period of fortnightdue to lack of canal supply. Flowering and fruitbearing are affected particularly in Kinnow andpomegranate orchards due to moisture stress.Sometimes, farmers give preference to cottoncrop over fruit crops in case of limited canalsupply assuming that fruit crop can withstandmoisture stress for longer time.
e) Irrigation scheduling of different crops underMIS : Irrigation of different crops was scheduledon the basis of previous day pan evaporationdata. Reference crop evapotranspiration wascalculated by using FAO-24 pan evaporationmethod (Doorenbos and Pruitt, 1977). The actualevapotranspiration was estimated by multiplyingreference evapotranspiration and cropcoefficients for different months based on growthstages. The daily net irrigation water requirement
of different vegetable crops for drip irrigationsystem was estimated by using the followingrelationship:
).()..( 0 ec RAAKEV −= (1)
Where V is net irrigation water requirement onvolumetric basis (litre/day/plant); E0 is referencecrop evapotranspiration (mm/day), which wasestimated as E0 equal to Pan evaporation (Ep)
multiplied by pan factor (Kp); Kc is crop factor; Ais area to be irrigated, m2 (i.e. spacing betweenrows multiplied by spacing between plants); andRe is effective rainfall (mm/day). Pan factor (Kp)for calculating reference crop evapotranspirationwas adopted on the basis of Doorenbos and Pruitt(1977) considering pan siting, prevailing windspeed and relative humidity. In case of dripsystem, estimated amount of irrigation water wasapplied on alternate days during hot summer(April, May and June) while it was scheduledtwice in a week during remaining period of theyear. The same schedule was followed for micro-sprinkler system.
In case of fruit crops, net water requirement onvolumetric basis under drip irrigation system wasestimated by using the following equation, wherecanopy coverage of plant was considered.
)..()...( 0 eccc RACACKEV −=
(2)
Where Cc is canopy factor and other parametersare the same as mentioned above. The Cc, forestimation of crop water requirement of tree, wasdetermined as per Allen et al.. (1998). The Kc forestimating actual crop water demand for differentfruit crops were considered on the basis of Allenet al.. (1998). In case of fruit crops, irrigation wasapplied twice in a week during peak summer i.e.April, May, and June and once in a week duringthe remaining year to meet water requirementas estimated by using equation 2.
Irrigation production efficiency (IPE) wasestimated to assess the production per unitvolume of water applied by using the followingrelationship.

168 Manual on Enhancing Water Use Efficiency in Canal Commands
)()ha/m(appliedwaterIrrigation
)ha/kg(yieldCrop)m/kg(efficiencyproductionIrrigation 3= 3
3
f) Economic Evaluation: In case of economicevaluation, production cost, gross return and netreturn of produce for different irrigation systemswere estimated with assumption that salvagevalue of the different components of irrigationsystems will be zero after their useful life. Usefullife of motor and sand filter was assumed as 12years. It was taken as 20 years for storage watertank and 8 years for other components ofirrigation system. Fixed and operating costs wereconsidered during the analysis. The annual fixedcosts of different components used for waterstorage, pumping and irrigation systems werecalculated using the approach of James and Lee(1971) as given below.
CRF = ( )( ) 11
1
−++
n
n
i
ii(4)
Where CRF = capital recovery factor, i = interestrate (fraction) at 9%, n = useful life of thecomponent (years). Annual fixed cost/ha wasestimated as CRF multiplied by fixed cost/ha.
The operating cost included labour charges(system installation and agronomic practices suchas land preparation, irrigation, planting, hoeing,application of fertilizers and chemicals,harvesting, etc) land rent, fertilizers andchemicals cost, electricity charges, repair andmaintenance cost. The gross return wascalculated considering the produce yield andcurrent wholesale price. Subsequently, the netreturn and benefit-cost ratio, payback periodwere calculated considering total cost ofproduction (fixed and operating) and grossreturn. Pay back period of this technology wasestimated as the number of years by which thenet return equaled to the establishment cost ofdrip system in conjunction with service.Additional income was estimated as income withdrip system over conventional system whichincluded income from additional area cultivatedwith saved water by drip as well as increase inyield by adoption of the technology.
14.2 Results of the study
Studies were conducted in important fruits(guava, pomegranate, kinnow and strawberry)and vegetables (tomato, capsicum, potato andonion) of Northern India under different spacingto determine the effect of micro irrigation onwater saving and economics by storing canalwater in secondary reservoir. Effect of irrigationsystem on irrigation production efficiency andeconomics of fruits and vegetables in NorthernIndia is presented in Table 14.1. The detail ofresult is presented crop wise:
14.2.1 Effect of microirrigation on guava: Thedetail of water applied and fruit yield of guavais presented in Table 14.1 which clearly indicatedsignificant water saving with the use of dripirrigation in guava. About 29.05 and 29.10 cmirrigation water was applied in drip irrigatedguava under 6 x 6 m 5 x 5 m crop geometry,respectively, as compared to 40.90 cm ofconventionally irrigated guava. The plantsmaintained under drip irrigation system startedbearing in 3rd year of planting whereas in floodirrigation fruit production started one year lateri.e., 4th year. For analysis, 4th year data areconsidered. The drip irrigation produced about69 and 67 percent higher fruit yield under 6 x 6m 5 x 5 m crop spacing respectively overconventional irrigation system which resultedinto better irrigation production efficiency (Table14.1). Extra income due to drip irrigation wasfound to be Rs.44,835 and 81,566 per ha under 6x 6 m 5 x 5 m crop spacing respectively. Henceguava cultivation with drip irrigation isprofitable, and can be popularized in large scalein canal irrigated area of the arid to semi-arid eco-system of the country.
14.2.2 Effect of microirrigation on pomegranate:The amount of water applied to pomegranate was29.37 and 29.98 cm under drip irrigation ascompared to 43.8 and 44.2 cm respectively inbasin system under 3.5 x 3.5 and 4 x 3 m plantspacing (Table 14.1). Saving of irrigation waterallowed bringing about 0.49 and 0.47 ha morearea under pomegranate with drip irrigation. The

Manual on Enhancing Water Use Efficiency in Canal Commands 169
yield of crop was about 21.64 and 22.04 t/hacompared to 17.39 and 17.70 t/ha in basin methodof irrigation for 3.5 x 3.5 and 4 x 3 m plant spacing,respectively. Further, it was worth mentioningthat the quality in the form of fruit size wasuniform than conventionally irrigated fruits. Thenet per ha extra income due to drip irrigation overconventional irrigation was about to Rs.134158and 150915 in 3.5 x 3.5 and 4 x 3 m plant spacing,respectively. The investment required foradopting drip irrigation in canal irrigated areawas about Rs. 136393 and 136060 per ha withplant geometry of 3.5 x 3.5 and 4 x 3 m,respectively. The interesting observation inpomegranate was that drip irrigation helped inregulating the flowering in such a way that cropcould be harvested before the start of greaterfluctuation in day and night temperature i.e.
before 15 October which resulted into lesscracking of fruits which is a serious problem inthis region.
14.2.3 Effect of microirrigation on kinnow: Theirrigation production efficiency of kinnow wasfound to be 5.39 and 5.68 kg/m3 with dripirrigation as compared to 3.07 and 2.73 kg/m3
under 6 x 6 m 6.5 x 6.5 m plant geometry,respectively. Investment of about 1,12,732 Rs/hain 6 x 6 m plant spacing and Rs. 1,05,732 Rs/hain 6.5 x 6.5 m spaced orchard is required tointroduce drip irrigation system (including waterstorage facility etc.) in Kinnow orchard (Table14.1). The net extra income Rs 1,35,791 and1,74,581per ha was recorded due to adoption ofdrip irrigation system over conventionalirrigation system under the plant spacing of 6 x 6m and 6.5 x 6.5 m, respectively.
Table 14.1 : Effect of irrigation system on irrigation production efficiency and economics of fruitcrops in Northern India
Particulars Drip Surface
GuavaPlant spacing (m x m) 6 x 6 5 x 5 6 x 6 5 x 5Water applied (cm) 29.05 29.10 40.90 40.90Yield (t/ha) 14.90 21.60 8.80 12.90Benefit cost ratio 1.58 1.86 1.17 1.23Irrigation production efficiency , Kg/m3 5.13 7.42 2.15 3.15Net extra income due to drip irrigation system over 44835 81566 - -conventional irrigation system (Rupees)PomegranatePlant spacing (m x m) 3.5 x 3.5 4 x 3 3.5 x 3.5 4 x 3Water applied (cm) 29.37 29.98 43.80 44.20Yield (t/ha) 21.64 22.07 17.39 17.70Benefit cost ratio 2.96 2.94 3.04 2.88Irrigation production efficiency , Kg/m3 7.28 7.36 3.97 4.00Net extra income due to drip irrigation system over 134158 150915 - -conventional irrigation system (Rupees)KinnowPlant spacing (m x m) 6 x 6 6.5 x 6.5 6 x 6 6.5 x 6.5Water applied (cm) 82 71.05 126 126Yield (t/ha) 44.20 40.40 37.9 34.5Benefit cost ratio 1.92 1.95 1.55 1.69Irrigation production efficiency , kg/m3 5.39 5.68 3.07 2.73Net extra income due to drip irrigation system over 135791 174581 - -conventional irrigation system (Rupees)

170 Manual on Enhancing Water Use Efficiency in Canal Commands
The important point is that pest and diseaseattack was very less in the orchard irrigated withdrip system compared to conventional methoddue to better micro-climate. The number offungicide sprays significantly reduced from 7 to2 in case of drip irrigated orchard compared toconventional irrigated. It was found that duringpeak summer, when irrigation water is limited,sufficient amount of water can be provided bydrip system which otherwise result into waterstress in conventional system. This helps inmitigating water stress in drip irrigation systemat any point of time and result into normalbearing (less flower drop in May-June and lessfruit drop in November-December). Hence,application of water through drip can bemanaged according to climatic conditions forbetter and uniform fruit retention. Drip systemreduces fruit drop due to constant supply ofwater by mitigating water stress during adverseclimatic conditions. Normal bearing resulted into higher yield for drip irrigated Kinnow orchardas compared to conventional irrigation method.
14.2.4 Effect of microirrigation on strawberry:Strawberry being a low surface creeping herbhaving shallow root system, hence watermanagement is one of the most crucial factors forits cultivation in canal conman area, particularlyin arid and semi-arid regions. Use of MIS (dripsystem + microsprinkler system) is well suitedfor proper growth and development of the plantwater application through MIS helps insupplying precise water to the crop according tothe stage of growth of the crop. Microsprinklerduring early stage ensure early and easyestablishment of runners besides vigorousgrowth of the plant. During reproductive phase
(flowering and fruiting), micro-sprinkler systemis replaced by drip irrigation which provideuniform & timely irrigation and facilitatefertigation. In traditional method, irrigation isgiven through furrow irrigation which resultsinto fluctuation in soil moisture result into poorgrowth and fruit yields. Significant water savinghas been recorded by introducing MIS instrawberry cultivation. In general, 31.6 cmirrigation water was applied in MIS comparedto 54 cm in traditional method or irrigation thusshaving about 70 percent of water and 49 percentincrease in fruit yield of strawberry (Table 14.1).Economic analysis of strawberry cultivationclearly show better B:C ratio of 2.03 compared to1.66 under traditional method of furrowirrigation. Besides saving in water, with the useof microirrigation system, plastic mulch can alsobe used efficiently which help in moistureconservation, check weed growth and better fruityield and quality of fruits. In brief, strawberrycultivation can be revolutionized with the use ofmicroirrigation for higher productivity andprofitability under arid and semi-arid regions.
14.2.5 Effect of microirrigation on tomato andcapsicum: Tomato is the most importantvegetable crop in term of area and production.Irrigation with drip system result into saving of39 percent of water besides 47 percent increasein yield (Table 14.2). Adoption of drip irrigationin tomato can result in to increase in about 40percent area, which can be put under cultivationwith the use of drip system. Economic analysisof tomato production under drip irrigationsystem clearly indicate higher B:C ratio of 1.57.Besides higher fruit yield, the quality of theproduce was also excellent into term of TSS,
StrawberryDrip + Microsprinkler Surface
Water applied (cm) 31.60 54.0Yield (t/ha) 14.10 8.30Benefit cost ratio 2.03 1.66Irrigation production efficiency , Kg/m3 4.46 1.54Net extra income due to drip irrigation system over 439344 -conventional irrigation system (Rupees)

Manual on Enhancing Water Use Efficiency in Canal Commands 171
acidity and ascorbic acid content. Similarly, dripirrigation in capsicum result in to qualityproduction of fruits, which can fetch higher pricesin the market. Irrigation with drip system resultinto saving of 46 percent of water besides 30 %increases in yield. Adoption of drip irrigation incapsicum can result in to increase in about 45%area, which can be put under cultivation with theuse of drip system. It has also been observed thatadoption of drip system in tomato and capsicum
resulted into saving of crop from frost duringwinter. Further, precise application of waterthrough drip system also helps in controllingweeds, less disease incidence and less damagedue to fruit rotting result into higher productivityand consequently higher profitability. The studyclearly indicated that tomato and capsicumproduction with micro irrigation can facilitatebetter utilization of resources and higherproductivity.
Table 14. 2 : Effect of irrigation methods on water productivity and economics of capsicum and tomato
Items Capsicum Tomato
Drip Surface Drip Surface
Water productivity (kg/m3) 7.32 3.85 13.1 6.43
Total cost of cultivation (Rs/ha) 96852 71900 97525 76500
Net returns (Rs/ha) 228148 178100 67475 36000
B:C ratio 3.36 3.47 1.69 1.47
Payback period (years) 2 - 4 -
Additional income due to adoption of technology 155096 - 57790 -
14.2.6 Effect of microirrigation on potato andonion: The seasonal water requirement of potatowas found to be 25.75, 22.45 and 28.15 cm,respectively with microsprinkler, drip andsurface irrigation methods. The yield of potatowas about 32.1, 29.8 and 22.6 t/ha respectively,for microsprinkler, drip and surface irrigationmethods. Further, it is possible to get the crop 7
to 10 days earlier in the market withmicroirrigation system than conventionalirrigation method. The net return was highest inmicrosprinkler, while it was minimum in surfaceirrigated potato. The additional income due tomicrosprinkler and drip irrigation overconventional method is about Rs. 31,024 and18,770 per ha, respectively (Table 14.3).
Table 14.3 : Effect of irrigation methods on water productivity and economics of potato and onion
Items Potato Onion
MS* D** S*** MS* D** S***Water productivity (kg/m3) 12.5 13.3 8.03 8.1 7.1 4.7Total cost of cultivation (Rs/ha) 59190 65833 47892 54543 61669 38352Net returns (Rs/ha) 56473 42152 33920 53011 43113 33042B:C ratio 1.94 1.64 1.71 1.97 1.70 1.86Payback period (years) 4 7 - 5 8 -Additional income due to 31024 18770 - 27391 11365 -adoption of technology
*MS: Microsprinkler; **D: Drip system; ***S: Surface irrigation
The seasonal irrigation water applied to onionwas recorded as 43.26, 47.75 and 49.36 cm,respectively under microsprinkler, drip and
surface irrigation methods. It has been observedthat crop got matured about 10- 15 days earlierthan conventional irrigation methods due to

172 Manual on Enhancing Water Use Efficiency in Canal Commands
faster growth during early stages. Additional areacultivated due to saving of water by virtue ofadoption of microsprinkler and drip was 0.14 and0.03 ha. The extra income due to microsprinklerand drip irrigation over conventional method isabout Rs. 27,391 and 11,365 per ha, respectively.It is clear that onion production withmicrosprinkler and drip irrigation systems wereprofitable than traditional irrigation method,however, microsprinkler was found to be themost appropriate irrigation technique tomaximize the profit from per unit cropped areaby storing canal water in secondary reservoir.Further, since, in the present experiment,conventional irrigation method also had ensuredwater supply from stored water formicroirrigation, but in actual condition, there isuncertainty in canal water availability, whichmay lead to further water stress and yieldreduction. Hence, comparative economics maybe even better than this in favour of introducingmicroirrigation systems in canal irrigated areas.
Conclusions
Study indicated that microirrigation technologiesrecorded significant improvement inproductivity over the conventional methods ofirrigation for all the test crops. Drip system wasfound most suitable for irrigating fruit crops andtomato and capsicum in a canal command bystoring water in secondary reservoir. However,the yield response to the microsprinkler systemwas superior to that of drip system for onion andpotato. Out come of the study suggests thatmicroirrigation with secondary reservoir istechnically feasible and economically viablealternate for crop diversification at the tail endof a canal command for higher water useefficiency and profitability. The same model canbe adopted with some element of creativity forenhancing water productivity in other tail-endof the canal commands for sustainabledevelopment.
References
Aggarwal, R., Kaushal, M. P., Kaur , S and Marwaha,B. 2009. Water resource management forsustainable agriculture in Punjab. Water Scienceand Technology. 60 (11): 2905-2911.
Allen, R.G, Pereira, L.S, Raes, D and Smith, M. 1998.Crop evapotranspiration-guidelines for computingcrop water requirements. Food and AgriculturalOrganization of United Nation (FAO),irrigation and drainage paper No. 56.
Anbumozhi, V, Matsumoto, K and Yamaji, E. 2001.Towards improved performance of irrigationtanks in semi-arid regions of India:modernization opportunities and challenges.Irrigation and Drainage System 15(4), 293-309
Doorenbos, J and Pruit, W.O. 1977. Guidelines forpredicting crop water requirement. Food andagricultural Organization of United Nation. FAOirrigation and drainage paper. No.24, 144.
Hanson, B.R., Schwanki, L.J., Schulbach, K.F. andPettygove, G. S. 1997. A Comparison of furrow,surface drip and subsurface drip irrigation onlettuce yield and applied water. AgriculturalWater Management. 33: 139-157.
James, L.D and Lee, R.R.1971. Economics of waterresources planning. McGraw Hill, New Delhi.P: 20.
Kumar S., Singh Rajbir., Bhatnagar P.R., GuptaR.K.and Nangare D.D. 2008. Microirrigation inconjunction with service reservoir in canalcommand. Technical Bulletin APA/Pub/03/2008.Central Institute of Post Harvest Engineeringand Technology, Ludhiana.
Kumar, S., Imtiyaz, M., Kumar, A. and Singh, Rajbir.2007. Response of onion (Allium cepa L.) todifferent levels of irrigation water. AgriculturalWater Management. 89 (1-2): 161-166.
Navalwala, B.N .1991. Waterlogging and its relatedissues in India. J Irrigation and Power 55–64.
Singh, R., Kumar, S., Nangare, D.D. and Meena, M.S.2009. Drip irrigation and black polyethylenemulch influence on growth, yield and WUE oftomato. African Journal of Agricultural Research4 (12): 1427-1431.

Manual on Enhancing Water Use Efficiency in Canal Commands 173
15.0 ENHANCING CROP PRODUCTIVITY AND W15.0 ENHANCING CROP PRODUCTIVITY AND W15.0 ENHANCING CROP PRODUCTIVITY AND W15.0 ENHANCING CROP PRODUCTIVITY AND W15.0 ENHANCING CROP PRODUCTIVITY AND WAAAAATERTERTERTERTERUSE EFFICIENCUSE EFFICIENCUSE EFFICIENCUSE EFFICIENCUSE EFFICIENCY IN JLN LIFT IRRIGY IN JLN LIFT IRRIGY IN JLN LIFT IRRIGY IN JLN LIFT IRRIGY IN JLN LIFT IRRIGAAAAATION PROJECTTION PROJECTTION PROJECTTION PROJECTTION PROJECT
A.S Dhindwal and VA.S Dhindwal and VA.S Dhindwal and VA.S Dhindwal and VA.S Dhindwal and V.K. Phog.K. Phog.K. Phog.K. Phog.K. Phogaaaaattttt
The growth in population combined with theexpected increase in prosperity will putenormous pressure on water resources in morethan 60% of the world. The availability andutilization pattern of water varies with respectto time and space. Water being a finite naturalresource, enhancing water productivity byproducing more food per drop of water is the onlyavailable option to feed ever-increasingpopulation. Scarcity and gradual decrease in theshare of water for agriculture in semi-arid regionsnecessitate adoption of efficient technologies, andintegrated management of available waterresources at farm and regional scale. Therefore,water management in India is going to play acrucial role in shaping the national economy.
Haryana is basically a water resources deficitstate. About 75% areas have an aridity index ofless than -40. In spite of the fact that two third ofthe ground waters are of poor quality itsexploitation has reached an alarming level ofmore than 90%. At present, the total utilizablewater resources fall short by over 40% and thereis limited possibility to further increase theirrigation potential. This gap will further widenas the share of water for irrigation is likely toreduce from 82% at present to 75% by 2025 dueto competition from other sectors. Productivityof water is extremely low at farm and regionalscale. During the last four decades, locationspecific technologies for water resource scarceregions have been developed to improve thewater productivity. However, their real timeadoption is not very encouraging owing to manyfactors. Identification, dissemination andadoption of efficient water management andother production technologies suiting to varyingsocio-economic and agro-ecological conditionsand their refinement at various levels will leadto considerable improvement in the water
productivity, maintain hydrological balance andsoil health. The study aimed at reconciliation ofwater supply and crop demand, testing theefficient water management practices on theselected ditstriburaries of the JLN command insouthern Haryana and assessing their impact onwater productivity.
15.1 The detail of study
The study area, a compact block of about 1800ha, covering mainly the arid and semi-arid partsof southern Haryana was located between 27º48' N and 28º 28' N latitude and 75º 55' and 76º53.5' longitude (Fig.15.1). It represented the entirecommand with regard to cropping pattern,irrigation water resources, weather conditionsand soil characteristics. Studies were taken upfrom 1992 to 2000 on eight outlets located at head,middle and tail reaches of the two representativedistributaries namely Rampuri and Patheraunder the command of JLN Lift Irrigation Project,details of which are given in Table 15.1.
The area was faced with following major watermanagement problems:
Untimely and inadequate canal irrigationwater supplies.
Unauthorized pumping of canal waterfrom canal and upper reaches ofdistributaries.
Non-implementation of warabandi (supplybased on area by rotation) system.
Very poor maintenance of water courses.
High seepage losses in watercourses anddistributaries
Brackish ground waters andoverexploitation of ground waters
CASE STUDY

174 Manual on Enhancing Water Use Efficiency in Canal Commands
Fig. 15.1 Irrigation map of Haryana, JLN lift irrigation project and the study area

Manual on Enhancing Water Use Efficiency in Canal Commands 175
Mis-match between cropping pattern andwater supplies
Ineffective water users’ associations and
Non-judicious use of irrigation water by thefarmers
15.2 Water balance of the study area
The various water balance parameters wereestimated at field, farm and regional scale duringthe study period. Effective rainfall was estimatedusing USDA Soil Conservation Service method.Reference ET was computed according toPenman-Monteith approach. Crop and irrigationrequirements, and scheme water supply wereestimated by using CROPWAT model. Thismodel provided the irrigation calendar for theentire season, the efficiency of irrigation schedule,efficiency of rainfall, total and gross irrigation andactual water use by crops, and the reduction inyield. Ground water exploitation was worked outon the basis of tube-well discharge and therunning hours. Discharge at the head ofdistributary and outlets and running hours wereused to calculate the actual canal wateravailability. RWSCWR is the total water supply (i.e.,rainfall + canal + ground water) as a percentageof the net crop water requirement. RWSIWR is thetotal irrigation water supply (i.e., canal + groundwater) as a percentage of the net irrigationrequirement. Water productivity of each crop wasworked out by taking into account the economic
yield and water used. The water availability ispresented in Fig. 15.2.
The combined RWSCWR of kharif and rabi seasonswas more than 80% in 1997-98, around 74% in1996-97 and 1998-99, around 70% in 1995-96,around 63% in 1993-94 and 1994-95 and 54% in1999-2000. RWS IWR fluctuated between 45.3% and37.3% (Fig. 15.3).
Fig. 15.2 Water availability in the study area differentsources
Fig. 15.3 Availability and deficit of water and relativewater supply in the study area
15.3 Yield and Water Productivity
With the adoption of recommended cropproduction and water management practices, theaverage yield of wheat increased by about 9%,raya, pearlmillet and clusterbean by 16%, andchickpea by 24% as compared to the farmers’practices (Table 15.1). Cotton, pigeonpea,mungbean and fenufgreek registered about 30%increase in yield. Hussein et al. 2003 observedyield variations with the amount of irrigation andthe timing of water stress. The amount ofirrigation water used was substantially reducedas result of these interventions. Thus, a saving of10% irrigation water in wheat, around 15% inraya and clusterbean, around 17% in chickpeaand cotton, around, 20% in mungbean andpearlmillet, and 28% in pigeonpea was recorded(Table 15.1). Higher yield and water saving indifferent crops were observed with improvedwater management practices at farmers’ fields insemi-arid region. At farmers’ fields substantialincrease in water productivity of all the crops wasachieved with the improved practices incomparison with farmers’ practices. It increasedby 21.6, 35.7, 48.8, 56.9, 47.3, 37.8, 60.6, 93.4 and

176 Manual on Enhancing Water Use Efficiency in Canal Commands
Table 15.1 : Yield, water used and WP of different crops under farmers’ and efficient practices
Crops Number Yields (kg/ha) Irrigation water used Water productivityof trials (ha cm) (kg/m3)
Farmers Efficient Farmers Efficient Farmers Efficient
Wheat 252 3953 4324 40.0 36.0 0.99 1.20
Raya 217 1504 1745 14.5 12.4 1.04 1.41
Chickpea 65 531 657 7.7 6.4 0.69 1.03
Fenugreek 52 363 471 8.1 6.7 0.45 0.70
Pearl millet 100 979 1140 5.7 4.5 1.78 2.53
Cl. bean 121 706 827 6.0 5.1 1.18 1.62
Cotton 69 535 715 18.0 15.0 0.30 0.48
Pigeon pea 32 503 703 7.2 5.2 0.70 1.35
Mungbean 45 348 457 5.3 4.3 0.66 1.06
Table 15.2 : Adoption level of WM technologies by the farmers of the study area
Crops Adoption level of technology (%) Irrigation Mean grainLand Irrigation Irrigation Conjunctive (no. and yield, kg/ha
levelling method scheduling use amount)
Clusterbean 64 78 56 27 2.4 (17.2) 1376
Pearlmillet 62 78 61 56 2.1 (14.3) 1739
Cotton 87 81 73 64 4.5 (27.4) 812
Mungbean 92 62 76 35 2.4 (14.2) 735
Wheat 96 96 86 88 5.8 (32.8) 4302
Raya 94 93 75 92 2.2 (14.5) 2102
Chickpea 65 45 64 71 1.8 (12.8) 645
61.8% in wheat, raya, chickpea, fenugreek,pearlmillet, clusterbean, cotton, pigeonpea, andmungbean, respectively. Hamdy et al., 2003 alsoreported increased water productivity underdeficit irrigation.
The total amount of water which could be savedby the adoption of improved water management
practices in the study area varied from 19.4 in1995-96 to 51.4 ha m in 1998-99 (Fig. 15.4). Incertain years, no irrigation was applied in kharifcrops due to good rains and hence no saving ofirrigation water. Depending upon the area undera particular crop, the water saving varied from0.45 ha m in pigeonpea to 14.71 ha m. Due to

Manual on Enhancing Water Use Efficiency in Canal Commands 177
package interventions, about 40 ha m water couldbe saved in the study area, annually. The waterthus saved can be used to either enhance theirrigation potential of the area or to provideoptimum irrigation, without stress, to the existingcrops. This will ultimately improve the total cropand water productivity.
15.4 Adoption Level of Improved WaterManagement Technologies
The efficient WM technologies, demonstrated inthe selected outlet command of Rampuri andPathera distributaries during the study period,were evaluated for their adoption by the farmers.
Fig. 15.4 Averaged crop wise and year wise water saved (ha-m) in the study area
Adoption of land leveling was more than 90%in mungbean, wheat and raya crops (Table 15.2).It was 87% in cotton and more than 65% in othercrops. The adoption of appropriate irrigationmethod was more than 90% in wheat and raya,around 80% in kharif crops, except mungbean(62%), chickpea (45%). Irrigation scheduling asper crop water requirement was highest inwheat (86%) and lowest in clusterbean (56%)and was around 75% in other crops. Conjunctiveuse of ground water with canal water wasgreater in rabi crops (71-92%) as compared tokharif crops (27 to 64%).

178 Manual on Enhancing Water Use Efficiency in Canal Commands
West Bengal with 2.7 per cent of geographicalarea and 7.5 per cent of water resource canmitigate the demands of 8 per cent of thecountry’s population. In the state, water is goingto be the limited commodity in near future dueto the competing demands from the other sectorsas a result of rapid industrialization andurbanization and economic development. Out ofthe available water resource of 14.75 mham, thesurface water resources is 13.29 mham of whichless than 40 percent i.e. about 5.31 mham isutilized. The available ground water resourceaccounts for 1.46 mham, which is fully utilizable.The present water crisis is largely due to misuseor abuse of water and lack of adequate reservoirsto harvest the excess rainfall. The greatest culpritis the agricultural sector which consumes thelargest quantity of water especially afterintroduction of high yielding boro paddy. Thegangetic basin once described as the areas ofexcess water now suffers from acute dearth ofwater especially during the lean summer months.The spatial and temporal variability of rainfall isuneven and erratic and so wide that it causes thetwin menaces of flood and drought in one regionor others. Out of six agro-climatic zones in thestate, the Deep Tube Well command (DTW)encompassing the New Alluvial Zone is of muchrelevance.
The DTW command is the largest andagriculturally most potential fertile tract of thestate. The cultivable area is 17.274 lakh ha. Theland topography in general is flat alluvial floodplain characterized with many concave basins ordepressions. The areas are criss-crossed withmany rivers such as Bhagirathi (Hooghly),Mahananda, Ichamati, Churni, Jalangi andSaraswati etc. All types of agricultural crops are
grown with assured supply irrigation water. Themain water resources are canal, river liftirrigation, and shallow and deep tube wells.However, chronic or temporary inundation of theflat land by ravaging floods almost in every yearseriously impairs the agricultural activity ingeneral and the socio-economic fabric as a whole.Waterlogging occurred at varying degree in thedistricts like Nadia and parts of Malda,Murshidabad, Hooghly, Howrah, Burdwan andNorth-West Dinajpur. This adverse situation isassociated with prolonged siltation, impededdrainage and reduction of the hydraulic capacityof the rivers and the drainage canals. In the rainymonths, the water level of almost all rivers risesup to dangerous level due to rainfall-runoff wateraccumulation. The water release from these riversand upper catchments causes inundation of thecrop lands, which situational locations lies eitherat a same level or below the nearest river bed flowline. Besides, the structural design of most of theembankments is not strong enough to withstandthe high pressure of stagnated water level. Thisresults in the release of vast quantity of excesswater either by overtopping or by breakingembankments or through sluice gates. As aconsequence, a huge land mass is flooded everyyear. However, the depth and duration of landsubmergence varies considerably according tothe land topography and natural drainagebehaviour.
16.1 AICRP on WM
The AICRP on Water Management, BCKV,Gayespur center developed various technologypackages for higher water use efficiency indifferent crops. The some of the important arementioned below:
16.0 ENHANCING CROP PRODUCTIVITY AND W16.0 ENHANCING CROP PRODUCTIVITY AND W16.0 ENHANCING CROP PRODUCTIVITY AND W16.0 ENHANCING CROP PRODUCTIVITY AND W16.0 ENHANCING CROP PRODUCTIVITY AND WAAAAATER USETER USETER USETER USETER USEEFFICIENCEFFICIENCEFFICIENCEFFICIENCEFFICIENCY IN DEEP TUBE WELL COMMAND (DTW)Y IN DEEP TUBE WELL COMMAND (DTW)Y IN DEEP TUBE WELL COMMAND (DTW)Y IN DEEP TUBE WELL COMMAND (DTW)Y IN DEEP TUBE WELL COMMAND (DTW)
S.K. PS.K. PS.K. PS.K. PS.K. Paaaaatrtrtrtrtra and A. Zamana and A. Zamana and A. Zamana and A. Zamana and A. Zaman
CASE STUDY

Manual on Enhancing Water Use Efficiency in Canal Commands 179
a) Conversion of earthen irrigation channelsinto low-cost bamboo reinforcement puccachannel and use of PVC pipes for deliveringwater in the crop field were well acceptedby local farmers to avoid conveyance anddeep percolation losses and increasing theirrigated areas.
b) Conventionally summer rice is raisedunder continuous submergence withexcessive amount of irrigation water andlower water use efficiency. However, underconstraints situation, the water useefficiency can be increased with lowerirrigation requirement when irrigation isgiven intermittently at 5 cm depth, 1 dayafter disappearance of ponded water. This
could save about 15% of costly irrigationwater. This finding is highly accepted bythe boro rice growers, the highest consumerof irrigation water, for significant savingsof irrigation water withoutcompromisation of yield and profitabilityof rice.
c) The AICRP on Water Management, BCKVcenter developed different irrigationscheduling criteria for different crops(Table 16.1) based on the differentphysiological stages of the crop or soilmoisture depletion or pan evaporationreading with a view to considerably savingof irrigation water.
Table 16.1 : Different irrigation scheduling criteria for different crops
Crop Phenological stages Moisture tension (Bar) IW:CPE
Wheat CRI, Till, Fl, Gr-fill 0.6 1.0
Potato - 0.33 (20 cm) 1.2
Mustard Br, Fl 0.8 0.6
Groundnut Fl, Pod dev 0.6 0.6-1.0
Maize Ini, Tass, Milk 0.55 (veg), 0.35 (repro) 1.2
Cabbage Ini, Head dev 0.6 1.5
Cauliflower Ini, Curd dev 0.6 1.5
Onion Ini, Veg, Ma 0.5 1.2
d) On long-term field trials, IrrigationCalendar was also developed based on IW/CPE ratio under different dates of plantingof crops (Table 16.2). This 'IrrigationCalender' was recommended for the DTWcommand in alluvial zone.
The AICRP on Water Management developednumerous water management technologies on
different field crops including fruits, vegetablesand flowers under assured supply of irrigationwater in deep tube well command with a viewto increasing crop and water productivity andnutrient efficiency for onward transmission andadoption in the farmers' fields. Some promising,adoptable and remunerative technologies arehereunder:
Table 16.2 : Irrigation calendar in the deep tube well command for efficient water use
Crop Date of Day of irrigation after sowingplanting 1 2 3 4 5 6 7 8
Wheat 1st Nov 21 47 77 100
15th Nov 24 53 80 106
1st Dec 27 50 75 94

180 Manual on Enhancing Water Use Efficiency in Canal Commands
Potato 1st Nov 7 20 33 51 69 84 98 108
15th Nov 5 15 29 47 64 79 91 103
1st Dec 5 16 34 52 67 79 90 107
Mustard 15th Oct 23 53 89
1st Nov 27 58 93
Groundnut 1st Feb 31 53 67 84 100
(Summer) 15th Feb 26 47 66 79 96
1st Mar 23 42 59 72 89
Cabbage & 1st Sep 43 63
Cauliflower 15th Sep 28 48 77
1st Oct 13 20 29 49 50 64
Rice (kharif) 3 days after disappearance of ponded water
Rice (boro) 1 day after disappearance of ponded water
Water Management Technologies generation for enhanced WUE in DTW Command
Summer Rice Continuous submergence of 5±2 cm water gave the highest grain yield of rice(Transplanted) with 100 kg N/ha (6.08 t/ha). WUE increased with lesser number of irrigation
and found maximum when irrigation was given at 5 cm depth, 1day afterdisappearance of ponded water which could save about 42% of irrigation water.
Wheat Irrigation with IW/CPE 1.2 at 5 cm depth (cv.UP 262) with 100 kg N/ha gave thehighest grain yield of 28.75 q/ha.
Rice-wheat Practice of shallow intense puddling of rice followed by normal tillage of 15 cmdepth by tractor drawn cultivator gave maximum productivity of wheat up to31.66 q/ha with a water use efficiency of 0.755 kg/ha/cm
Crop Sequences Rice-potato-moong showed the maximum benefit:cost ratio while it was minimumwith rice-mustard-sesame sequence, although showing maximum water useefficiency.
Potato Three irrigations, one each at weekly interval before furrow making followed bythree irrigations one each at 20 days intervals (IW/PE 0.9 at 5 cm irrigation) wasthe best irrigation schedule for potato.
In lowland rice ecosystem, single irrigation at IW/CPE 0.6 with 4 cm depthproduced 11.26 t/ha tuber yield showing water use efficiency of 9.69 kg/ha/mm. Mulching with paddy straw enhanced potato yield.
Mustard The grain yield of mustard was recorded highest when two-irrigation at IW/CPE of 0.6 with 5 cm depth of irrigation applied at branching (33 DAS) andflowering (55 DAS) stage with 80 kg N/ha.

Manual on Enhancing Water Use Efficiency in Canal Commands 181
Winter Maize The grain yield of maize performed better when irrigation was applied at IW/CPE of 1.2 with 5 cm irrigation depth compared to irrigation at 0.6 IW/CPE. Thecrop significantly responded to increasing levels of nitrogen up to 160 kg N/ha.Water use and water use efficiency values were also found to respondaccordingly.
Cauliflower Curd yield of cauliflower was increased by 23% when it was irrigated at IW/PEof 1.2 at the irrigation depth of 5 cm each which required 5 irrigations at about 15days interval.
Cabbage Irrigation at 20 mm cumulative pan evaporation (CPE) with 120 kg N/ha gavethe highest head yield of cabbage to the tune of 41.92 t/ha with water useefficiency value of 1.8 t/ha/cm
Onion Three irrigations at IW/PE of 1.2 ratio (5 cm depth each) found optimum formaximum crop yield. The crop was transplanted in December after harvestinglowland rice.
Soil Water Balance The capillary contribution towards the evapotranspiration of various arable cropswas estimated to be 15 to 20% of the total actual ET contributed from groundwatersource when the depth of water table lying within 2 m which reduced to 5% if itremained below 2 m depth.
Coriander Four irrigations at an interval of 12-16 days (ø = 0.03 Mpa soil-water suction) with60 kg N/ha gave the highest yield of 7.94 q/ha with WUE of 2.52 q/ha/mm.
Garlic In alluvial sandy loam soils, irrigation at 25 mm CPE with 5 cm water produced4.3 t/ha of bulb yield with water use efficiency of 15.8 kg/ha/mm. Mulchingwith paddy straw or water hyacinth saved considerable water and enhancedyield.
Sunflower The contingent crop cultivated on residual soil moisture after kharif rice andirrigated at IW/CPE 1.2 produced 5.25 t/ha seed yield and water use efficiencyof 19.94 kg/ha/cm. Sowing within second fortnight of December was favourablefor higher seed yield.
Tomato Five Irrigations at 15 days interval at 25 mm CPE with black polythene mulchregistered maximum yield of tomato (cv. Rocky, F1 hybrid) to the tune of 47.0 t/ha with water use efficiency of 2.64 q/ha/mm.
Field pea The crop cv. B-22 irrigated at ø = -0.03 Mpa soil-water suction at 20 cm depth(three irrigation at 20-23 days interval) and fertilized with 60 kg P2O5/ha produced1.47 t/ha seed yield and water use efficiency of 6.31 kg/ha/mm.
Chilli Three irrigations one each at 1.2 IW/CPE (5 cm irrigation depth) was foundoptimum to get highest yield of green chilli to the tune of 5.87 t/ha with wateruse efficiency of 44.54 kg/ha/cm.
Rajmash The crop cv. Contender irrigated at ø = -0.04 Mpa soil-water suction at 20 cmdepth (two irrigations at 25 days interval) and fertilized with 60 kg P2O5/haproduced 8.74 q/ha seed yield and WUE of 5.26 kg/ha/mm.

182 Manual on Enhancing Water Use Efficiency in Canal Commands
16.2 Impact of water technologies adopted bythe farmers
The pattern of adoption and non-adoption of thewater management technologies in the farmers’field and its corresponding benefit in terms ofsocio-economic goal in different command areas(Mayurakshi, DVC or DTW irrigated command)have shown positive impact and now farmers insmall groups have taken interest to adopt theproven technologies in their fields and arebenefited substantially. The adoption of provenwater saving technologies in the farmers’ plotsreflected higher crop production compared totheir traditional methods. The technologiesgenerated increased the water use efficiency andprevented application and conveyance losses.Selection of appropriate crop(s) and cropsequence(s) played an important role forenhancement of water use efficiency. The successgave encouragement and impetus to the fellowfarmers to keep the process towards adoptionthrough formation of various Water Users’Committees. Following are the most importantchanges:
Rice was the dominant crop during rainyseason in the study area. There was nodifference in yield of rice under farmers’practice and experimental blocks due tosufficient amount of well-distributedrainfall. But there was difference in yieldof Aus paddy in farmers’ practices andexperimental block. The fertilizer responsewas variable because of differential depthof submergence followed by the end-users.The farmers’ practice to use more fertilizerswith more depth of submergence wasresisted.
The farmers traditionally followed potatocultivation with high doses of fertilizersand more water. The intervention to applyoptimal fertilizers as well as irrigation foryield maximization of the crop wassucceeded.
With recommended water managementpractices, grain yield of mustard was
increased by 9% with water use efficiencyof more than 36%.
Summer groundnut was introduced withrecommended water managementpractices wherein the farmers achievedhigher seed yield, more WUE andremunerative value.
About 36% of potato growers, 25% ofrapeseed-mustard growers and 50% ofsummer rice growers followed the provenwater management technologies to achievehigher water use efficiency. Low water-requiring crops like onion and groundnutgained popularity over summer riceresulting in considerable saving ofirrigation water during the lean summerseason.
16.3 Case study of enhanced WUE in ORP
The center has made stupendous effort in theadoption of proven water managementtechnologies in the farmers’ field with aparticipatory mode. A large number of site-specific and need based technologies like raisedbed-furrow irrigation on tomato, cabbage andcauliflower; use of polythene channel lining andpolythene pipes (PVC) to reduce the conveyanceand application losses of irrigation water;intermittent ponding of summer rice (boro) forsaving of irrigation water to the extent of 30%;scheduling of irrigation for wheat and mustard;spout-wise rotational water supply to rice andwheat grown simultaneously and minimal tillagein wheat and mustard were adopted in thefarmers’ fields successfully. The cost-effectivewater management technologies that areaffordable and acceptable to the farmingcommunity are given below:
i) Zero-tillage wheat in lowland rice ecosystem
The transplantation and harvesting of kharif ricein lowland ecosystem is delayed due to latemonsoon rain. The excessive wetness of soilposes difficulty in achieving proper soil workablecondition and maintaining timeliness of fieldoperation, thereby sowing of rabi crops in time.

Manual on Enhancing Water Use Efficiency in Canal Commands 183
Under these circumstances, sowing crops likewheat and mustard using minimal or zero tillagetechnique is a good proposition and better optionto exploit the available residual soil moisture forseed germination.
Sowing of wheat was done immediately afterkharif rice harvest with zero-tilled seed drillmachine in lowland under prevailing sufficientresidual soil moisture preferably within the firstweek of December.
The results in Table 16.3 showed that zero-tilled(ZT) wheat with three irrigations recorded thegrain yields ranging from 1160 to 2460 kg/haobtained by the eighteen farmers with an average
of 1536 kg/ha. On the contrary, the conventionaltillage (CT) with three irrigations recorded thegrain yields ranging from 1720 to 2800 kg/hawith an average of 2020 kg/ha. Wheatcultivation under conventional tillage inlowland clay soil was not feasible due todrainage congestion and water excessespecially at CRI stage on applied irrigationcausing yellowing of plant leaf. Water useefficiency of ZT wheat was 6.16 to 11.60 kg/ha/mm, while CT showed the highest WUE of12.20 kg/ha/mm. Farmers’ acceptance forgrowing wheat under zero tilled conditionswas mainly attributed to higher benefit-costratio compared with conventional tillage.
ii) Water management of wet seeded rice duringkharif season (drum seeder)
Drum seeding of wet rice in well-drainedmedium upland was done during kharif season.Shallow puddling using one pass of power tillerfollowed by a bullock drawn country plough was
adequate for drum seeding in clay soil. Sproutedseeds and Philippines 12-row plastic drum seederinvolving two farmers were used in the adaptivetrial. The crop performances under wet directseeding (DR) and transplanted rice (TR) methodsis given in Table 16.4 as follows:
Table 16.4 : Crop performances of drum seeding technique during kharif season
Item Case study 1 Case study 2
DR TR DR TR
Date of sowing 27.7.06 27.7.06 27.706 27.7.06
Variety used Ratna Ratna IET 4094 IET 4094
NPK (kg/ha) 60:30:30 60:30:30 60:30:30 60:30:30
Date of harvesting 2.11.06 8.11.06 2.11.06 8.11.06
Grain yield (t/ha) 4.30 3.53 3.90 3.40
Straw yield (t/ha) 6.05 4.70 5.40 4.85
DR: wet direct seeding, TR: transplanted rice
Table 16.3 : Yield and water use efficiency of wheat under zero tillage situation
Parameter Zero tillage Conventional *
Case 1 Case 2 Case 3 Average
Area covered (ha) 0.13 0.06 0.09 0.13
Grain yield (q/ha) 24.6 18.2 11.6 20.2
No. of irrigation 3 3 2** 3
Water used (mm) 226 214 189 243
WUE (kg/ha/mm) 8.71 8.50 6.16 7.20
* Two passes of harrowing done by tractor and seeds were broadcasted, ** No irrigation at CRI

184 Manual on Enhancing Water Use Efficiency in Canal Commands
The above results showed that the grain andstraw yields of wet seeded rice in the commandwas superior to transplanted one. The increasein grain yield was 22.8 and 14.7% for Ratna andIET 4094, respectively. Harvesting of wet seededrice was completed one week earlier thantransplanted one. Hence, the resource poorfarmers accepted the drum seeding techniquewell especially during the period of low rainfall.However, there is a limitation of this technologyin water stagnated condition under high rainfallcondition because of the difficulty in theoperational mechanism as well as plantemergence problem.
iii) Residual moisture utilization through pairacropping (Utera) in rice with mustard and toria
Aman rice is generally harvested in the middle ofNovember leaving behind a significant amount
of residual soil moisture in lowland ecosystem.Brown mustard (rai) and toria (rapeseed) werebroadcasted over the standing rice 10-15 daysbefore harvest of winter rice. Complex fertilizerlike Suphala @ 150 kg/ha and seeds @ 7.5 kg/haeach were applied. One irrigation at maturity fortoria and two irrigations at branching andflowering for mustard were given. Crops wereharvested within February to first week of March.About 20-27 farmers participated in theprogramme over the years 2006-2010 and the areacoverage was 2.30 to 2.84 ha. The yields ofmustard and toria amongst 27 farmers variedbetween 580-1150 kg/ha with an average of 760kg/ha. In Paira cropping with lowland rice, theresidual moisture utilization pattern was 39.1 to50.1 mm in clayey soil. The performances of bothcrops are given in Table 16.5 as below:
Table 16.5 : Performances of mustard and toria as paira crops in standing rice
Item Mustard Toria
Date of seeding 3//11/05 5/11/05
Irrigation number 23/12, 15/1 23/12
Plant height (cm) 96.3 56.0
Seed yield (q/ha) 11.5 7.5
Water used (cm) 17.8 12.5
WUE (kg/ha/mm) 6.46 6.0
Paira cropping of mustard and toria was verypromising for residual moisture utilization afterrice harvest especially where irrigation watersupply was scarce or limited. One and two
irrigations were sufficient for successful raisingof toria and mustard. Water use efficiency ofmustard and toria varied between 4.63 to 6.46 kg/ha/mm.

Manual on Enhancing Water Use Efficiency in Canal Commands 185
17.0 ENHANCING CROP PRODUCTIVITY AND W17.0 ENHANCING CROP PRODUCTIVITY AND W17.0 ENHANCING CROP PRODUCTIVITY AND W17.0 ENHANCING CROP PRODUCTIVITY AND W17.0 ENHANCING CROP PRODUCTIVITY AND WAAAAATER USETER USETER USETER USETER USEEFFICIENCEFFICIENCEFFICIENCEFFICIENCEFFICIENCY IN PERIYY IN PERIYY IN PERIYY IN PERIYY IN PERIYAR VAIGAR VAIGAR VAIGAR VAIGAR VAIGAI COMMANDAI COMMANDAI COMMANDAI COMMANDAI COMMAND
S. KrishnasS. KrishnasS. KrishnasS. KrishnasS. Krishnasamyamyamyamyamy
CASE STUDY
The Periyar Vaigai Irrigation System is one of theoldest irrigation systems in India existing since1898. It is the second largest irrigation project inTamilnadu next only to the Cauvery System. Thecommand area of the project is located in theplains of the Southern districts of Tamil Nadubetween 9°45’ and 10° 15’ N latitudes and 77°.0’and 78° 10’ E longitudes. It extends over parts ofMadurai, Theni, Dindigul and Sivagangaidistricts. It is bounded on the north byCoimbatore and Tiruchi districts, on the east byBay of Bengal, on the west by the State of Keralaand Coimbatore district and on the south bySivagangai and Virudunagar districts. Periyar-Vaigai System is the first exercise in the interstatetransbasin transfer of west flowing rivers to theeast wherein the waters from the Periyar Basinin Kerala are diverted to the Vaigai Basin in TamilNadu. The system consists of two reservoirs viz.,Periyar and Vaigai Reservoirs, the commandarea in Cumbum valley and the downstream areaof Vaigai Reservoir.
17.1.1 Periyar Reservoir
The Periyar River originates in Kerala State onthe western slopes of the Western Ghats andflows in a northerly direction for a length of 57.6km (36 miles) in the hilly tract and ends up in
Arabian Sea. Across an inaccessible gorge at thisplace, a solid masonry gravity dam was built in1895. Given the technical constraints of the periodof construction and the nature of terrain, it isindeed a great engineering marvel. The dam is158’ (47.4 m) in height and 1440’ (432 m) in length.The storage capacity is 443.5 million cubic meters(15660.43 million cubic feet – 15.66 TMC).
17.1.2 Vaigai Reservoir
The River Vaigai originates on the eastern slopesof the Western Ghats, flows through Madurai,Theni, Sivagangai and Ramanathapuramdistricts and ends up in the Bay of Bengal. It hasmany tributaries, the major ones being Suruliyar,Theniar, Varattar, Nagalar, Pambar, Varaganathi,Marudhanathi, Manjalar, Sirumalaiyar, Sathiarand Uppar. The river basin extends over 7031sq.km and is one of the 17 major river basins ofTamil Nadu. The basin receives an annual rainfallof 882 mm of which 291 mm is received duringSouth West monsoon and 402 mm during NorthEast monsoon. The Vaigai Dam stores the waterdiverted from Periyar Reservoir as well as thewater from the catchment of Vaigai river. Out ofthe total storage capacity of Vaigai dam, Periyarcredit is 4000 M.cu.ft (4 TMC) and Vaigai creditis 2800 M cu ft (2.8 TMC).
Salient features of reservoirs
Periyar Reservoir
1. Full Reservoir Level (FRL) 46.33 m (152.00 ft *)
2. Minimum Draw Down Level (MDDL) 31.70 m (104.00 ft)
3. Reservoir capacity at FRL 443.50 MCM (15660.43 Mcft)
4. Reservoir capacity at MDDL 144.20 MCM (5091.85 Mcft)
5. Tunnel Discharge Capacity 3.92 MCM/day (1600.00 Cusec)
* Elevation with reference to MSL 2861.1 ft

186 Manual on Enhancing Water Use Efficiency in Canal Commands
17.1.3 Command area of Periyar – VaigaiIrrigation System (PVIS)
Prior to the construction of Periyar Reservoir andVaigai Reservoir, the command area in the twobasins was only 5263 ha in Cumbum valley and55104 ha in the erstwhile Madurai andRamanathapuram Districts. But after theirconstruction, the net irrigated area has risen to81809 ha. The Periyar Vaigai Command as ondate consists of the area irrigated in Cumbumvalley, a pre-project area and the extension areacreated after structural improvements effectedin the distribution network through the WorldBank assisted Periyar Vaigai modernization
Programme. The total area irrigated by PVISincluding the pre-project area, extension areaand Cumbum valley is put at 81069 ha. Variousestimates of the command area have howeverbeen reported in different sources. The PeriyarVaigai command area consists of five segments.
The Cumbum Valley
Periyar Main Canal Pre-project Area
Periyar Main Canal Extension Area
Thirumangalam Main Canal Pre-projectArea
Thirumangalam Main Canal Extension Area
Geographical location of PVIS Command Area
Vaigai Reservoir
1. Full Reservoir Level (FRL) 21.64 m (71.00 ft)
2. Minimum Draw Down Level (MDDL) 0 m (0 ft)
3. Reservoir capacity at FRL 194.79 MCM (6878.00 Mcft)
4. Reservoir capacity at MDDL 1.46 MCM (51.39 Mcft)
5. Water spread Area at FRL 24.20 Sq. M
6. Periyar Credit 113.28 MCM (4000.00 Mcft)
7. Vaigai Credit 79.30 MCM (2800.00 Mcft)
Zone District Taluks Command area (ha)
I – Cumbum valley Theni Uthamapalayam 5594Periakulam 397
II- Periyar Main Canal Madurai Melur 26325Madurai North 20893Vadipatti 9468
Dindigul Nilakottai 2014Sivagangai Tirupathur 3614
Sivagangai 8320III Thirumangalam Main canal Theni Usilampatti 5556
Madurai Thirumangalam 1769
17.1.4 Details of command
Soils of the command area are of sandy loam to
clay loam. They are of shallow to medium soil –
depth with slow to medium infiltration rate and
hydraulic conductivity. The soils have low
availability of N, medium availability of P and K
and low organic matter content.
The cropping system followed in the commandis as follows:
Double crop lands : rice – rice – pulse or gingerly
Single crop lands : rice – pulse or gingerly
The third crop of pulse or gingerly is growndepending on the water availability after two ricecrops with carry over soil moisture and summerrains.

Manual on Enhancing Water Use Efficiency in Canal Commands 187
In places where wells are used in conjunctionwith canal water the following cropping systemis also practiced.
i) Sugarcane – ratoon sugarcane – rice(2 years rotation)
ii) Wetland banana – rice (1 ½ year duration)
17.2 AICRP on Water Management
AICRP on Water Management at the AgriculturalCollege and Research Institute, Maduraideveloped improved water managementtechnologies for different crops for enhancedwater use efficiency. The generated technologieshave yielded many useful and practical resultsfor effective water management in agriculturalproduction. In this process not only the improvedwater management technologies are tested at on-farm levels but also the field level situation isstudied thoroughly for necessary feed back andimprovement of the technology.
17.2.1 Major technologies developed by thecentre to improve WUE in command
1. Irrigation to rice one day afterdisappearance of ponded water
2. Integrated water management technologyfor rice
3. Rotational water supply and stressmanagement for rice
4. SRI for rice
5. Drum seeding of rice
6. Drip fertigation technology under pairedrow, pit and sub surface method of plantingto sugarcane
7. Micro irrigation and fertigation for fieldand horticultural crops
17.3 Operational Research Project
Crop management technologies developed at theresearch stations have to be tested in farmers’fields to validate their suitability, to improve theawareness about the technologies amongfarmers, to identify any constraints for theiradoption and to refine the technology suitablyso as to ensure early adoption by farmers.. Withthese objectives an Operational Research Project(ORP) was initiated from 1980-81 for on-farmtesting and demonstration of the improved watermanagement technologies, especially for rice,developed by the centre. The ORP was conducted
Periyar Vaigai Command area

188 Manual on Enhancing Water Use Efficiency in Canal Commands
in direct canal command as well as in indirecttank command.
Manthikulam–Direct cannal command andindirect tank command (1980 – 1989)
Kodimangalam–Direct cannal command(1990 – 1995)
Andaman–1996–2003–Indirect tankcommand
Mathur – 2004 – 2009 tank command
17.3.1 ORP in Direct command
The enormous losses of irrigation water throughdeep percolation and seepage under thetraditional practice of continuous submergenceirrigation to the rice crop can be minimized byfollowing improved irrigation practice ofirrigating rice fields to 5 cm depth one day afterdisappearance of previously ponded water (1DADPW). This improved irrigation practicesaves water, improves the grain yields andincreases the water use efficiency in rice. The testverification of this improved irrigation practicewas conducted in the farmers’ holdings over alarger area at a sluice level in direct canalcommand area.
Mandikulam village: During 1980-81Mandikulam village along the Madurai – Nathamroad was chosen for this study. Continuoussubmergence of 5 cm was compared with the
improved irrigation regime of irrigation to 5 cmon disappearance of ponded water during kharifand rabi seasons. During kharif the improvedirrigation regime saved 9% of water with only amarginal reduction in yield (1.9 %). During rabiwater saving by adoption of the improvedirrigation schedule was 21% but yield wasunaffected.
Kodimangalam village: During 1983 – 1988 and1990-1994 the direct commands of sluices 14 Rand 15 L of 6th branch canal of Periyar Main Canal(PMC) in Kodimangalam and Maruni villages ofMadurai North taluk were taken up for on-farmwater management studies. Fields irrigated fromsluice 14R covering an area of 14.7 ha were treatedas control under traditional irrigationmanagement of continuous submergence. Anarea of 15.8 ha commanded by sluice 15L wastaken for demonstrating the improvedtechnology of irrigation of 5 cm one day afterdisappearance of ponded water (I DAD). Resultsobtained during 1983-1988 indicated that totalwater used under improved technology ofirrigating rice one day after disappearance ofponded water varied from 64.5 cm to 106.6amount the highest average yield obtained was5575 Kg/ha (Table 17.1). The improved watermanagement technology conserved water by 15to 20% and improved the water use efficiency bymore than 20%.
Table-17.1 : Year wise experimental results of one day after disappearance of ponded water andfarmers method of irrigation
Year Total water applied (cm) Grain yield (kg/ha) WUE (Kg/ha/cm)
1 DAD Conventional 1 DAD Conventional 1 DAD Conventional
1983-84 64.5 79.5 4850 4950 75.0 62.4
1984-85 75.7 90.4 2422 2358 32.0 26.1
1985-86 106.6 119.5 6060 5575 56.8 46.6
1986-87 69.9 82.1 5495 5193 79.6 63.2
1987-88 84.2 126.5 5394 5071 64.0 40.0
1 DAD - One day after disappearance of ponded wate; Conventional - Farmers practice

Manual on Enhancing Water Use Efficiency in Canal Commands 189
Results from five seasons of on-farm testingestablished the superiority of the improvedtechnology of irrigation of 5 cm one day afterdisappearance of ponded water (1DAD) over thetraditional irrigation management of continuoussubmergence. Total water use under theimproved water management ranged from 81.6to 107.0 cm which amounted to a saving of 13.4to 19.7 per cent over continuous submergence
which required 97.9 to 127.7 cm (Table 17.2).Grain yield of rice was higher (5810 kg/ha) by7.1 per cent under irrigation 1 DADPW overcontinuous submergence (5424 kg/ha). Lesserwater use and higher yield led to higher wateruse efficiency of 52.53 kg/ha-cm with improvedirrigation method as compared to 42.47 kg/ha-cm under continuous submergence.
Table- 17.2 : Water use and rice yield under improved irrigation scheduling in direct canal commandof PVC – Kodimangalam village (1990-94)
Mean of 5 seasons
Particulars Control Improved technology
Irrigation depth (cm) 115.2 98.1
Effective rainfall (cm) 12.5 12.5
Total water use (cm) 127.7 110.6
Saving in water (%) - 13.4
Grain yield kg/ha 5424 5810
Increase in yield (%) - 7.1
WUE (kg/ha-cm) 42.47 52.53
Control: Farmers practice; Improved technology: I DAD
The existing water use efficiency for rice underfarmers conditions of continuous sub mergencevaried from 40 to 50%. The improved watermanagement technology of irrigating rice oneday disappearance of ponded water increasedthe water use efficiency upto 60 to 80%. Similarlyunder drum seeding and SRI system of plantingthe water use efficiency increased to 5.71 and 4.54Kg/ha/mm when compared to traditionalplanting which resulted in 3.8%.
17.3.2 ORP in Indirect Command (TankCommand)
The success of the demonstration of improvedwater management technologies through ORP indirect (canal) command over 5 years in educatingthe farmers prompted the initiation of suchdemonstrations in tank command areas also.Tanks command a considerable share of irrigatedrice area in Periyar Vaigai irrigation system. Anoperational research project in a tank commandarea is useful to demonstrate the improved
irrigation management technology as well asassociated component technologies in riceproduction to the farmers to enable adoption ofthe technologies. For the purpose, a system tankin the village of Andaman was selected for theORP during 1996 to 2000. The Andaman tank isfed by 27 (R) sluice of Periyar Main Canal (PMC)by gravitational flow. Irrigation is regulatedthrough three outlets (sluices) with a totalcommand area of 66.06 ha. Tank water supply issupplemented by twelve wells in the commandarea. Well water is used for advance rice nurserypreparation, irrigation requirements duringscarcity situations and for summer cropping.
The percolation and run off losses estimated byusing drum culture technique in rice field werehigh under continuous submergence (traditionalmethod), accounting for 264 and 520 mmrespectively (Table 17.3). The lowest percolationand run off were noticed in the treatmentreceiving Rotational Water Supply (RWS). Under

190 Manual on Enhancing Water Use Efficiency in Canal Commands
irrigation to 5 cm one day after disappearance ofponded water, the percolation and run off losseswere considerably reduced by 62 and 54 mm incomparison with continuous submergence.
Data collected over five years (1996 -2000) of on-farm testing in the Andaman tank commandestablished the superiority of irrigation to 5 cm1DADPW over continuous submergence in termsof water saving (6.8%), higher yield (6.6%) and
increased water use efficiency. Averaged over fiveseasons, water use under irrigation 1 DADPW was89.4 cm as against 95.9 cm for continuoussubmergence. Grain yield under irrigation 1DADPW was 5506 kg/ha compared with 5163 kg/ha with continuous submergence (Table 17.4).Rotational water supply also recorded comparableyield (5172 kg/ha) with continuous submergencebut with reduced water use (90.6 cm).
Table -17.3 : Percolation (mm) and run off (mm) in drum culture studies
Treatments Percolation Reduction Run off Reduction(mm) (mm) (mm) (mm)
Continuous submergence (CS) 264 — 520 —-
Irrigation to 5 cm one DADPW 202 62 466 54
Rotational Water Supply 184 80 438 82DADPW : Days after Disappearance of ponded water
Table-17.4 : Effect of improved irrigation management for rice in Andaman tank command (1995-2000)
Particulars Mean of 5 seasons (1995-2000)
Conventional 1DAD RWS
Area (ha) 15.4 25.3 15.9
Irrigation given (cm) 75.1 68.6 69.8
Effective Rainfall (cm) 20.8 20.8 20.8
Total water use (cm ) 95.9 89.4 90.6
Water saving (%) - 6.8 5.5
Yield (kg/ha) 5163 5506 5172
Increase in yield(%) — 6.6 0.2
WUE (Kg/ha-cm) 53.8 61.6 57.1
Conventional - Farmers method; 1 DAD - One day after disappearance of ponded water; RWS: Rotational water supply
17.3.3 Interventions for matching water supplyin tank commands
The most appropriate water managementtechnology is the one which enables a matchbetween water supply from the irrigation sourceand water demand of the production system.Water management technologies developed atresearch institutes need to be tested extensivelyunder farmers’ field conditions to verify whetherthey help to achieve this objective of matchingdemand and supply through irrigationmanagement. This formed the theme of the
Operational Research Project of AICRP-WMduring 2001 to 2005. The ORP was conducted inindirect (tank) command area. The objectives ofthe study were the following:
collection of basic data about the tankirrigation system
water availability through surface andground water flows
assessment of water demand and supply
devising interventions like changes incropping pattern, irrigation methods,

Manual on Enhancing Water Use Efficiency in Canal Commands 191
irrigation scheduling, agronomicalmanipulation and conjunctive use of water
optimizing production after reconciliationof gaps in supply and demand
development of alternate operationalschedule to improve the systemperformance in the tank command
17.3.4 Description of the ORP area
The Operational Research Project area is locatedin the command area of a chain of four irrigationtanks viz., Mathur East tank, Mathur West tank,Vadakundam tank and Mudaliyendal tank. All
the four tanks are system tanks fed by Periyar-Vaigai Irrigation System. The Mathur east andwest tanks are fed by 5 (L) sluice of 8th branchchannel (8th B.C.) of Periyar Main Canal (PMC).There is a balancing culvert between these twotanks. The Vadakundam tank receives the drainflow of the command area of Mathur west tankapart from some drain flow from the directcommand of 7(L) sluice of 8th B.C. TheMudaliyendal tank receives the drain flow fromthe direct command of 7(L) sluice. Tank capacityand command area of all the four tanks is givenbelow :
Tank Capacity and Command Area
Name of tank Command area Designed Capacity Full tank level
sluices Hectare M cft L m3 ft m
Mathur West 5 68.47 2.16 2.01 5.00 1.524
Mathur East 2 59.33 4.61 4.28 6.00 1.829
Vadakundam 3 26.19 7.52 6.99 6.00 1.829
Mudaliyendal 1 15.14 4.71 4.38 4.00 1.219
The existing cropping system in the tankcommands is the sequence of rice (Sep. -Feb.) –Fallow in single crop wetlands and rice (June –Sep.) – rice (Oct. - Feb.) in the double cropwetlands. The ORP was conducted from 2000 to2004. Basic data on weather conditions, soils, tankand groundwater availability and demand andsocio-economic aspects were collected andanalyzed. Interactions with farmers on irrigationrelated constraints and other crop managementproblems revealed the existence of the followingconstraints.
Uncertainty regarding time of release ofwater from branch channel for filling thetanks
Inadequate water supply at the end ofcropping season
Insufficient water supply to tail end area
Ineffective control over water distributionamong users
Ipomea weed encroachment in the waterspread area of tank
Silting of tanks and reduction in storagecapacity
Defective sluice shutters
Leaks and seepage loss in distributionchannels
Poor drainage and water logging
Increasing cost of inputs and non-remunerative price of paddy
Insufficient institutional support ontechnical and administrative issues
Unethical practices in water distribution bya few users.
a) Interventions designed in ORP : Based on theconstraint analysis, interventions were designedunder three categories as shown below. Theseinterventions were tested / refined /demonstrated in the farmers’ holdings during thefive years of experimentation.

192 Manual on Enhancing Water Use Efficiency in Canal Commands
a) Augmentation of water storage
Assessment of actual storage capacity of thetanks
Removal of encroachment by Ipomea weed
Repairs to feeder channel from branch canal
Deepening of tank bed
b) Improving distribution of water amongusers
Repairs to sluice shutters
Closing breaches in distribution channelsfrom various sluices
Revival of water user association formanaging distribution
Formation of separate distribution channelfor tail end areas
c) Conservation of water and increasingwater use efficiency
Demonstration of improved irrigationscheduling in large area
Integrated Water ManagementTechnology (IWM)
Varietal evaluation in rice to suit watersupply
Training and technical guidance to farmers
Farmers’ meetings/seminars
Survey and Impact assessment
b) Demand - supply gap
Water supply measurements were done in eachtank throughout irrigation season to assess thedemand-supply gap. Water requirement for therice crop was assessed based on mean fortnightly
weather data by estimation of reference cropevapotranspiration based on Thornthwaitemethod and crop coefficient for rice based ongrowth stage. The deficit in tank water supplyduring 2002-03 season was estimated to varyfrom 60 to 86 % in the four tanks underobservation. During 2003-04 season the deficit intank water supply for potential command areavaried from 83 to 100 per cent in the four tanks.During 2004-05 season the tank water demandestimated for normal command area showed asupply deficit of 44 to 76 % in the four tanks underobservation
17.3.5 Results of on-farm testing of technologyinterventions
a) Improved irrigation scheduling to rice
Improved irrigation scheduling of irrigation of 5cm water one day after disappearance of pondedwater (1DA) was demonstrated in a largecontiguous block of farmers’ fields in Mathur Eastand West tank commands during 2000 – 01 and2001-02. Parshall flumes were installed in thesupply channel to measure irrigation water inputfor the demonstration plots. Graduated markerbamboo sticks were placed in each field to enableirrigation to designed depth. Daily watermeasurements were made to schedule irrigation.Other fields adjacent to this block were treatedas control plots with farmers’ practice ofcontinuous submergence. The improved practiceconserved water and increased the rice grainyield by 11 % over continuous submergenceduring the two seasons (Table 17.5).
Table- 17.5 : Grain yield of rice (kg/ha) with improved irrigation scheduling
Rice variety Continuous submergence Irrigation of 5 cm 1 DADPW Yield increase (%)
ADT 39 4568 4792 4.9Co 43 4107 4265 3.8Ponni 3942 4950 25.6Mean 4206 4669 11.0
b) Integrated Water Management Technology
Irrigation method or irrigation schedule may notyield the desired results if other components
associated with these technologies are notfollowed. As in nutrient management, pestmanagement or weed management, integratedadoption of many component technologies as a

Manual on Enhancing Water Use Efficiency in Canal Commands 193
package is warranted in water management also.Accordingly an Integrated Water ManagementTechnology package termed as ‘IWaM’ wasdesigned and tested through on farm trials inMathur east and Mathur west tanks every season
during 2000-01 to 2004-05. The components ofIWaM (water management and associatedtechnologies) included in the technology packageare described below.
Integrated Water Management (IWaM)technology improved the yield of rice grownunder various establishment systems such astransplanting, wet-seeding (drum seeding) andsemi-dry rice by 3.5 to 22.1 per cent duringdifferent years. IWaM Technology resulted in 4.6to 8.3 % saving in irrigation water requirement
and increase in yield by 3.5 to 12.5 % overtraditional method (Table 17.6). Waterproductivity and water use efficiency with IWaMtechnology were increased over traditionalmethod of irrigation management throughcontinuous submergence of 4 – 5 cm.
Water management Associated technologyLand leveling Closer plantingChoice of variety according to water availability. Split application of N and KIrrigation to 5cm 1DADPW Herbicide applicationMidseason drainage at maximum tillering ZnSO4 applicationDraining water before fertilizer topdressingNo moisture stress at flowering to milky stageDraining water one week before harvest
c) Selection of varieties for higher WUE
In order to identify and recommend rice varietiescapable of high yield potential under theprevailing soil conditions and water availabilitysituations in the tank commands, yieldassessment of various rice varieties grown by thefarmers was done every year. Short durationvarieties were recommended under conditions
Table-17.6 : Grain yield of rice (kg/ha) with Integrated Water Management Technology (IWaM)
Establishment Mathur East tank command Mathur West tank command
system Traditional IWaM % increase Traditional IWaM %increase
Transplanted rice
2000-01 5305 5942 12.0 5252 5848 11.3
2001-02 5244 5748 9.6 5119 6194 21.0
2002-03 4944 6036 22.1 4481 4685 4.6
2003-04 — — — 3960 4120 4.0
2004-05 — — — 4290 4538 5.8
Wet seeded rice — — — 2276 2357 3.5
2003-04
Semi dry rice — — — 2778 3126 12.5
2003-04
of delayed release of water, inadequate storagein tanks, reduced duration of water supply in thetanks and terminal stress due to early closure ofwater supply from the irrigation project to thetanks. Sustained efforts to promote short durationvarieties were made through individual contacts,group meetings, information bulletins, noticeboards in the villages and demonstrations infarmers’ fields. Consequent on the continuous

194 Manual on Enhancing Water Use Efficiency in Canal Commands
promotional efforts under AICRP–WM, there isa pronounced shift in preference towards shortduration rice varieties (105 -115 days) instead ofmedium and long duration varieties (130 – 140
days) from 0-5% in 2000 to 44 – 76% in 2004during single crop season and second cropseason in all the tank commands of the ORP area(Table 17.7).
Table 17.7 : Trend in choice of rice varieties in the Mathur East tank command (% coverage)
Season 2000-01 2001-02 2002-03 2003-04 2004-05
SD MD SD MD SD MD SD MD SD MD
First crop 100 — 100 — — — — — 100 —Second crop — 100 — 100 — — — — 44 56Single crop 100 3 97 36 64 — 100 72 28Single crop season 3 97 — 100 36 64 38 62 40 60
SD - Short duration varieties MD- Medium duration varieties
Rice establishment system for efficient water use
Change in rice establishment system fromconventional transplanting to wet-seeding inpuddle and System of Rice Intensification (SRI)is being recommended for reducing waterrequirement in rice culture. In order to test andvalidate this technology, on-station trials and on-
farm trials were laid out during 2004-05 season.In both the locations higher grain yield with lesswater use was recorded under drum seedingmethod of rice culture. It was followed by Systemof Rice Intensification. The lowest water useefficiency and productivity were recorded underconventional planting (Table 17.8).
Water use and water productivity of rice under different establishment systems
Details OFT at Mathur East tank Experimental Farm
C DS SRI C DS SRI
Grain yield (kg/ha) 3931 6187 5500 3428 4571 3857
Irrigation water use (mm) 600 500 550 600 500 550
Water saving over traditional planting (%) - 11.0 5.5 — 16.7 8.4
Water productivity (Rs/m3 ) 2.16 3.82 3.20 0.46 1.82 1.17
Water use efficiency(kg/ha-mm) 4.32 7.65 6.40 3.80 5.71 4.54
C: Conventional; DS: Drum seeded method; SRI: System of Rice INtensification
e) Drip irrigation for sugarcane
Sugarcane, one of the most important commercialcrops is being grown in an area of around 3.0 lakhhectare in Tamil Nadu with an averageproductivity of 106 Mt ha-‘1. Under the presentwater scarce conditions, efficient use of irrigationwater becomes an important means to increasethe cane productivity per unit quantity of appliedirrigation water. Unlike flood irrigation, the waterand nutrient use efficiency are higher in dripfertigation, since the technology helps to supplythe required quantity of irrigation water and
nutrients directly to root zone of the crop on needbase. Generally drip fertigation offers the scopeto cultivate cane crop with 25 to 40 less waterbesides increasing the cane yield substantially.
Drip irrigation regimes and intervals werecompared with surface irrigation throughfurrows in sugarcane from 1998 to 2000 in plantand ratoon canes. The results proved thesuperiority of drip irrigation over surfaceirrigation in terms of higher cane yield and savingin water. Drip irrigation at 40% ETc (cropevapotranspiration) resulted in cane yield on par

Manual on Enhancing Water Use Efficiency in Canal Commands 195
with surface irrigation in both plant and ratooncanes but water use with drip was less by 36%.Drip irrigation at 100, 80 and 60 % ETc resultedin yield increase by 14 to 18 % in plant cane and11 to 18 % in ratoon cane over surface irrigation.There was no difference in yield due to dripirrigation interval at one or three days. Watersaving with drip irrigation was in the range of7% at 80% ETc , 22% at 60% ETc and 36% at 40%ETc. Because of the comparable cane yield andgreater savings in water, drip irrigation at 60%
Etc at 3 day interval is recommended.
i) Pit method of sugarcane planting: In generalincrease in irrigation water levels resultedreduced water use efficiency and percent watersaving. The highest water use efficiency of 169.5Kg/ha/mm was recorded in 1.5 x 1.5 M spacingwith 60 cm dia pits (4444 pits / ha) irrigated with50% irrigation regime. In conventional methodof planting the water use efficiency was 48.4 Kg/ha/mm as given below :
Method of planting Yieldt/ha Total water Water use efficiencyused (mm) (Kg/ha/mm)
Conventional planting 114.3 2362 48.4
1.5 x 1.5 M spacing with 60 cm dia pits 195.4 1150 169.5
irrigated with 50% irrigation regime
ii) Paired row method of Sugarcane planting:The highest water use efficiency (143.5 Kg/ha/mm) was recorded in 50% Etc irrigationlevel with paired row planting at a spacing of75 cm (25x25x25cm)/120cm. The results also
indicated that a saving of 45.6% of irrigationwater can be obtained under 50% Etc level.The lowest water use efficiency of 43.7 Kg/ha/mm was recorded under surface irrigationas given below :
Method of planting Yieldt/ha Total water Water useused (mm) efficiency (Kg/ha/mm)
Conventional planting 98.5 2250 43.7
Paired row with a spacing of 75 cm 215.3 1500 143.5(25x25x25cm)/120cm
iii) Sub surface method of sugarcane planting:The results on water use studies revealed thatthe treatment 75% Etc with 100% RDF as watersoluble fertilizers under sub surface method ofsugarcane planting ( 6 feet lateral to lateralspacing with double row sett planting in 40 cm
width trenches) recorded the highest water useefficiency (178.3 Kg/ha/mm). Theconventional method of sugarcane plantingrecorded the lowest water use efficiency(63.8Kg/ha/mm) as given below :
Method of planting Yieldt/ha Total water Water useused (mm) efficiency
(Kg/ha/mm)
Conventional planting 105.1. 2350 63.8
75% Etc with 100% RDF as water soluble fertilizers 240.7 1350 178.3
f) Drip irrigation and fertigation in chillies(Capsicum annuum)
Drip irrigation (DI) at 100%, 75% or 50 % of PE incombination with 75%, 100% or 125% N and K
through fertigation was evaluated with gravityirrigation (S1) of 6 cm at 0.9 IW/CPE ratio infurrows as check. Drip irrigation and fertigationimproved the pod yield of chillies substantially

196 Manual on Enhancing Water Use Efficiency in Canal Commands
to the extent of 50 to 67% over surface irrigationwith soil application of fertilizers. Drip irrigationregimes of 50, 75 and 100% PE were at par inimproving the growth and yield of chillies andfertigation of 100% NK was more advantageous.
Total water use was 443 mm and 590 mm with dripirrigation at 50% and 75% PE as compared to 702mm with surface irrigation resulting in water savingof 19 to 37%. Water use efficiency was higher withdrip irrigation and fertigation as given below :
Comparison of drip irrigation – Fertigation with furrow irrigation in chillies
Irrigation Pod yield % over Water use- WUE(kg/ha) SI mm Kg/ha/mm
Gravity irrigation in furrows (SI) 1327 — 702 1.89Drip irrigation + fertigation 2106 58.7 593 3.55
g) Micro irrigation in groundnut
To encourage farmers to use groundwater duringsummer, water saving technology ofmicroirrigation was demonstrated through an on-farm trial on microsprinkler fertigation togroundnut TMV 7 during July to November, 2004
at Alagapuri village. Microsprinkler irrigation at100% PE along with application of 50% NK asbasal and remaining 50% as fertigation in fourequal splits on 15, 30, 45 and 60 DAS produced7% higher pod yield over surface irrigation andsoil application of entire NK. Water saving withmicrosprinkler irrigation was 20.5 % (Table 17.9).
Table 17.9 : Groundnut growth and yield under surface irrigation and microsprinkler irrigation
17.5 Major challenges and problems to improveWUE in the Periyar Vaigai irrigation command
Monsoon failures
Uncertainty in water release
Late release of waterTerminal stressSmall holdingsField to field irrigationSeepage and percolation losses inconveyanceHigh cost for micro irrigation
17.6 Future thrust area for enhanced WUE incommand
Improving irrigation efficiency bymodernizing the irrigation structures
If there is sufficient storage and supply ofwater to the entire cropping period due tonormal rainfall, water saving technologies inrice like alternate wetting and drying and SRImethod can be unanimously followed in thecommand.
In the water scarced situation, the microirrigation can be strictly followed for thecultivation of irrigated dry crops under wellcommands
Crop diversification
Particulars Microsprinkler Surface irrigationin check basins
Pod yield (kg/ha) 1933 1813Yield increase (%) 6.7 —-Irrigation water applied (mm) 318 400Saving in irrigation water use (%) 20.5 —Water use efficiency (kg/ha-mm) 4.54 3.57Water productivity (Rs/m3) 6.80 5.35

Manual on Enhancing Water Use Efficiency in Canal Commands 197
Mula and Kukadi projects are the major irrigationprojects situated entirely in Ahmednagar andPune districts of Maharastra. The command areafalls in scarcity tract of Maharashtra havingaverage annual rainfall of 520 mm. The majorcrops of the region are sorghum, groundnut,pearl millet, pigeon pea and soybean duringkharif and wheat, gram and sunflower during rabiwhereas sugarcane and cotton are major cashcrops of the command area. The Mula dam wasconstructed on the Mula River in the early 1970snear the village Bargaon Nandur in Rahuri tehsilof Ahmednagar district of Maharastra. Thecatchment area of the dam is about 2274 km2. Thisis an earthen type of dam which is 2857 m longand has gross storage capacity of 736 Mm3. Thecommand area is divided into Mula Right Bankcanal (58 km) and Mula Left Bank canal (24 km).
Mula command area caters the irrigation needsof Rahuri, Newasa, Shevgaon and Patharditehsils of Ahmednagar district of Maharashtrastate. Soil types near the canals are medium soil,black cotton soil and hard murum. Kukadi damis constructed on Kukadi river and is a group offive dams with a catchment of 1139 km2. Kukadicommand area caters the irrigation needs ofAmbegon, Junnar, Sirur, Parner, Shrigonda,Karjat, Karmala tahsils of Pune, Ahmednagarand Solapur of Maharashtra state covering about251 villages. Soil types near the canals aremedium soil, black cotton soil and hard murum.The cropping patterns in the study area arediverse, and the major crops are sugarcane,sorghum, fodder grass, chickpea, onion,groundnut and wheat. The details regarding theMula and Kukadi projects are indicated below:
Brief description of irrigation commands
Mula Kukadi
1. Location On Mula river in the area On Kukadi river of villages
of village Baragaon nandur, Yedgaon, Manikdoh, Dimbhe,
Tal.Rahuri., (Ambegaon) Wadaj and
Dist- Ahmednagar. Ahmednagar Pimpalgaon joga,
Tal-Junner, Dist-Pune.
2. Year of Construction 1968-1969 1972-1973
a. Catchment area 2274km2 1139 km2
b. Annual rainfall 5080 mm in Ghat area and 508 4850 mm in Ghat and 850 mm in
mm in catchment catchment
c. Year of release of water 1971-72 1989-90
d. Year of full development 1975-76 1990-91
3. Dam
a. Type Earthen Earthen
b. Length 2857 m Group of 5 dams
c. Main river basin Godavari Krishna
18.0 ENHANCING CROP PRODUCTIVITY AND W18.0 ENHANCING CROP PRODUCTIVITY AND W18.0 ENHANCING CROP PRODUCTIVITY AND W18.0 ENHANCING CROP PRODUCTIVITY AND W18.0 ENHANCING CROP PRODUCTIVITY AND WAAAAATER USETER USETER USETER USETER USEEFFICIENCEFFICIENCEFFICIENCEFFICIENCEFFICIENCY IN MULY IN MULY IN MULY IN MULY IN MULA AND KUKA AND KUKA AND KUKA AND KUKA AND KUKADI COMMANDSADI COMMANDSADI COMMANDSADI COMMANDSADI COMMANDS
M.B. Dhonde and B.D. BhakM.B. Dhonde and B.D. BhakM.B. Dhonde and B.D. BhakM.B. Dhonde and B.D. BhakM.B. Dhonde and B.D. Bhakareareareareare
CASE STUDY

198 Manual on Enhancing Water Use Efficiency in Canal Commands
d. Sub-basin Mula Bhima
4. Command MRBC MLBC KLBC
a. G.C.A.(ha) 110183 17004 232480
b. C.C.A.(ha) 103749 14453 224699
c. ICA (ha) 70690 10120 146053
d. Canal length (km) 58 18 KLBC-253;DLBC-60SinaLBC-19;Sina RBC-29
5 Districts benefitted Ahmendangar Part of Pune,Ahmednagar andSolapur.
6. a. Area coverd 1,27,187 ha 1,46,053
b. Tehsils benefited Rahuri Newasa Ambegon, Junnar, Sirur,
Shevgaon Pathardi Parner, Shrigonda,Karjat, Karmala
c. Village benefitted 149 251
18.1 AICRP on Water Management
AICRP on Water Management, Rahuri centre isthe pioneer in developing and demonstrating theappropriate water management technologies forthis region along with the selection of crops andcropping system for enhanced water useefficiency in the command. On-Farm WaterManagement (OFWM) demonstrations werecarried out in Mula and Kukadi commands onfarmers’ fields to demonstrate the scientific watermanagement techniques for higher productivityand sustainability. The various crop componentinterventions, package of practices, use ofpressurized irrigation, adoption of soilreclamation techniques for improvement ofproblematic soils, monitoring seepage lossesthrough earthen field channels and minors weretried in the study areas. In order to assess theimpact of these interventions, the surveyapproach was adopted by preparing exhaustivequestionnaire and distributed among the farmerbeneficiaries both at study area of Mula andKukadi command were selected. They were alsopersonally interviewed for assessing the impactof adoption of water management technology.
18.2 Technologies intervention in Mulacommand
The highlights of the research findings emergedfrom the studies as indicated above aresummarized below.
18.2.1Component Crop Technology
a) Cereals
In this programme, six interventions werestudied on pearlmillet in Kharif and wheat in Rabiseasons. The inerventionwise results are asfollow:
Adoption of improved layout for irrigation(border method) in wheat crop (27locations) resulted into 19 per cent highergrain yield and about 22 percent saving inwater compared with farmers conventionalpractice. In case of pearl millet (3 locations),exhibited the yield increment to the tuneof 22 per cent with 4 percent saving inwater.
Adoption of improved agronomic packageof practices including layout for irrigationwater in wheat (29 locations) increased thegrain production by 46 per cent with savingin irrigation water by 13 percent over thecontrol (20 locations), while the

Manual on Enhancing Water Use Efficiency in Canal Commands 199
corresponding values for pearl millet were34 and 9 per cent.
Scheduling of irrigation at critical growthstages of wheat (7 locations) improved thegrain yield by 14 per cent with saving inirrigation water to the extent of 15 per centcompared to traditional schedulingadopted by the farmers.
Adoption of improved variety of wheat(HD 2189 and HD 2380) on 32 locationsindicated the increment in yield by 10 percent, while the use of improved variety ofpearlmillet (MLBH 104 and RHRBH 8609)exhibited the increase in grain yield by 25per cent compared to traditional varietiesused by farmers.
Land leveling with iron leveler (Keni) priorto sowing of wheat (2 locations) broughtout the increment in yield by 70 per centwith saving in irrigation water by 27 percent compared to unleveled fields.
Use of recommended dose of fertilizers(120:60:60 kg NPK/ha for wheat and100:50:50kg. NPK/ha for pearl millet)coupled with application of irrigation waterat critical growth stages (18 locations), yieldwas increased by 24 and 31 per cent inwheat and pearl millet respectivelycompared with farmers level of fertilizerapplication.
Adoption of package of improvedtechnology comprised of efficient lay out,appropriate scheduling of irrigation andrecommended dose of fertilizers (66locations) revealed that wheat yieldsincreased by 132 per cent with saving inirrigation water by 29 per cent and resultedinto 187 per cent increase in net returns.Similar studies on pearl millet (11 locations)increased the grain yield by 107 per centwith increased in net profit to the tune of177 per cent. The same set of interventionstested in combination on Adsali sugarcane,increased the cane production by 25 percent with increased net monetary returns
by 32 per cent. The corresponding valuesfor ratoon sugarcane and suru sugarcanewere 26 and 30 per cent for productivityand 32 and 36 per cent for increment in netreturns.
b) Pulse and Oilseed Crops
Improved layout (border method) whenadopted and compared with traditionallayout for irrigation in crops viz, chick pea,groundnut (summer) and pigeon pea on20,13 and 7 farmers fields revealed that, thegrain production of these crops wasincreased by 30, 21 and 28 per cent withsaving in irrigation water by 15, 23 and 3per cent, respectively.
Adoption of improved package of practiceson chick pea tested at 14 locations revealedthat the grain yield was increased by 32 percent with saving in irrigation water by 14per cent compared to traditional methodadopted by farmers.
Use of recommended dose of fertilizer forchick pea (25+50kg NP ha-1), summergroundnut (25+50 kg NP ha-1) and pigeonpea (37.5 +75kg NP ha-1) revealed that theyield increase in these crops was 21, 22 and28 per cent, respectively compared tofarmers practices.
Use of improved variety of chickpea (PG12 and PG 5) and summer groundnut (SBXI and ICGS 11) on 8 and 5 locationindicated that yield was 34 and 45 percenthigher respectively in chickpea andgroundnut respectively compared totraditional varieties adopted by farmers.
In summer groundnut, the broad bed andfurrow (BBF) layout was compared withborder layout of irrigation at 3 locations andit was observed that the pod yield wasincreased by 34 per cent in BBF layoutcoupled with saving in irrigation water by15 per cent over border method.
Comparative performance of mustard, anewly introduced high value oilseed crop

200 Manual on Enhancing Water Use Efficiency in Canal Commands
and traditional crop of wheat revealed thatthe mustard crop fetched 267 per centhigher net frugal returns, over wheat, withsaving in irrigation water by 11 per cent.
Introduction of sunflower in lieu ofgroundnut in summer, soybean in lieu ofpearl milliet and groundnut in place ofpearl millet in Kharif fetched 12, 377 and535 per cent increased net returns over theirrespective counter parts, while pigeon pea+ its ratoon when compared withsugarcane (suru) reduced the net returns by36 per cent but saved 78 per cent irrigationwater.
A set of improved layout + scheduling ofirrigation water at the critical growth stagesof different crops + fertilizer use atrecommended level when tested incombination and compared with theapplication of these inputs at farmers levelon various crops like chick pea, mustard inRabi, groundnut and sunflower in summerand groundnut, sunflower, pigeon pea andsoybean in Kharif, revealed that, theadoption of these interventions increasedthe productivity of these crops coupledwith saving in irrigation water andresultantly increased the net monetarygains from crops. The yield increment indifferent crops ranged from 22 to 272 percent. Saving in irrigation water ranged from20 to 25 per cent, barring Kharif crops, whilethe increase in net monetary gains was inthe range of 18 to 230 per cent.
Adoption of improved layout for irrigationas a single intervention resulted inincreasing the yield of Rabi corps viz. chickpea and mustard and Kharif pigeon pea tothe extent of 16, 112 and 27 per cent,respectively over their controls. The savingof irrigation water for Rabi crops was from14 to 24 per cent. This intervention alonecould increase the net monetary gains tothese crops over their traditional practiceof irrigation. The gains from chick pea were
increased by 18 per cent while the samewere 118 and 38 per cent in the case ofmustard and pigeon pea, respectively.
Thus, it could be inferred that the adoption ofinterventions like improved irrigation layouts,scheduling of irrigation at critical growth stagesof crops and adjusting same with conjunctive useof well water during closer of canal, applicationof fertilizer at recommended dose, use ofimproved variety of crops, etc. when tried eitherin isolation or in combination, increased theproductivity, net monetary returns of the cropsirrespective of season, while the saving inirrigation water was significant especially duringRabi and summer season.
18.2.2 Package demonstrations
The aspect of package demonstrations in variouscrops was introduced especially to convince thefarmers for the benefits accrued from improvedcrop technology. D.O.No.19, outlet No. 2 R wasidentified for the purpose. The cropping patternof the cultivators was not altered but the cropsraised on the selected outlet were grown on fieldsof identified farmers in different seasons byadopting the improved package of practices ofthese crops. This package of practice included theinterventions like timely seeding of improvedhigh yielding varieties, maintaining the optimumplant population and geometry from seeding toharvest, irrigation layouts with schedule of thesame at the critical growth stages of the respectivecrops, fertilizer use at recommended levelsinclusive of use of organic manures, inter-cultivation with appropriate plant protectioncover and was compared with these crop plotsas a control grown in adjoining outlet.
Amongst the Rabi crops tested, wheat instudy area produced 83 percent highergrain yield with saving in irrigation waterby 26 per cent. The economic advantagewas 111 per cent over control. The chick-pea and mustard registered 145 and 123 percent higher yield with 23 and 17 per centsaving in irrigation water as compared tocontrol, respectively. The net gains were in

Manual on Enhancing Water Use Efficiency in Canal Commands 201
the order of 232 and 149 per cent higherthan control in these crops.
In the case of Adsali sugarcane (18 months),the improved package of practicesincreased the cane yield by 49 per cent with15per cent irrigation water saving whencompared with traditional method ofirrigation. This eventually increased the netmonetary gains by 61 per cent. Theproduction of Adsali ratoon cane was alsofound increased by 29 per cent with 13 percent water saving and 37 per centadditional monetary gains when comparedwith the control.
Adoption of the package of improvedpractices increased the pod yield of latesummer groundnut by 49 per cent withadditional net returns of 66 per cent whencompared to traditional method. Theirrigation water saving in thisdemonstration was marginal as theeffective rains received compensated theeffects. In the case of Kharif groundnut, theyield increment due to adoption ofimproved practices was 40 per cent with50 per cent additional increased netmonetary gains.
Adoption of the package of improvedpractices on Kharif crops viz., pearlmilletand pigeon pea increased the grain yieldof these crops by 147 and 58 per cent. Thenet monetary returns of these corps wereincreased due to improved technologypackage in the order of 162 and 78 per cent.
18.2.3 Development of water logged and saltaffected soils in command
Due to over irrigation and unscientific use ofirrigation water, the problem of water loggingand secondary salanization has become a seriousproblem in Mula and Kukadi commands. During1970-72, the problematic area under waterlogging and salinity was 259 ha which increasedto 6604 hectares during 1979-80. However,thereafter, the area under problematic situationis decreasing year after year. This is because of
tendency of farmers to grow short duration, lowwater requiring crops in place of sugarcane whichwas over irrigated during earlier years and hadcaused the rise in water table and thereby hastenthe water logging and soil salinity problems.Farmers are now getting educated about thewater management technology and have realizedthe ill effects of over irrigation both on productionand productivity of their lands. The depth ofwater table is now decreasing year by year dueto judicious use of irrigation water and also moreuse of groundwater from wells especially duringscarcity conditions. Moreover, water logged soilswere inspected during the months of Novemberto February, where salt affected soils weredemarked during March to April every year.Water logging condition was visualized byobserving well water levels of selected sites. Thewater table hazards to the crop was within thelimit of 1.2 m. To overcome the problematicsituation, DIRD opened the drains andmaintained it wherever possible.
Contrary to the observations recorded in Mulacommand, the land affected due to water loggingand secondary salinizations was very meager inKukadi command. This may be due to shallowto medium type of soils and new introduction ofcanal water in the command.
18.2.4 Reclamation of problematic soils
The reclamation of salt affected soils was carriedout on an area of 15.2 ha. of 16 farmers on D.O.18 by adopting the techniques like, opening ofsuitable lateral and link drains, green manuringwith Dhaincha , growing of suitable salt tolerantcrops and leaching of soluble salts with canalwater after ponding. The results revealedfollowing observations :
There was reduction in water table upto adepth of 3m by opening of lateral drains.The growing of green manuring crop likeDhaincha in Kharif resulted intoimprovement of phisico-chemicalproperties of soil like basic infiltration rate,hydraulic conductivity, organic carbon,available N, P and K but there was

202 Manual on Enhancing Water Use Efficiency in Canal Commands
reduction in bulk density, pH, ECe, SARand ESP. Growing of salt tolerant crops likewheat and mustard in Rabi after greenmanuring revealed that there wasincrement in yield by 46 and 61 per centwith saving in irrigation water by 27 and13 per cent, respectively.
The leaching of soluble salts with 223 cmof good quality canal water (LR) afterponding in summer indicated that, therewas reduction in pH from 8.41 to 8.33, ECefrom 7.27 to 5.95 dSm-1, ESP from 14.25 to12.42 and SAR from 12.09 to 10.28,indicating reduction in salinity of soils.Growing of salt tolerant crops likepearlmillet in Kharif followed by wheat inRabi compared with control (withoutleaching) indicated that there was not onlyincrement in grain yields by 14 and 101 percent but also saving in irrigation water by12 and 27 per cent, respectively.
Growing of salt tolerant crops like mustard,sugarcane and lucerne by adoptingimproved agronomic package viz., righttime of seeding/planting, improvedirrigation layout, fertilizer use and plantprotection measures when compared withcontrol with traditional practice revealedthat, there was increment in yield of cropsby 46, 48 and 63 per cent with saving inirrigation water by 28, 3 and 16 per cent,respectively.
Thus, it is implicit that, it is not only possible toameliorate the saline soils but also dilate theproductivity of soils/crops by adopting the soilreclamation techniques like opening of drains,leaching of salts by good quality water, growingof green manuring and salt tolerant crops.
18.2.5 Estimation of seepage losses
Seepage losses of water through minor and fieldchannels as estimated by inflow and outflowmethods during kharif, rabi and summer seasonsindicated that
There were comparatively more seepagelosses of water (21.44 lph/m2) in kharif andminimum in rabi (18.79 lph/m2).
Between the uncleaned field channel thehigher seepage losses (33.67 lph/m2) wererecorded by uncleaned field channel inKharif season and minimum in Rabi seasons(27.69 lph/m2).
Comparison of seepage losses amongstlined, cleaned and uncleaned field channelsin various seasons indicated that lining ofchannel resulted into minimum ( 11.64 lph/m2) loss of water through seepage followedby cleaned field channel and maximumwas due to uncleaned field channel (30.24lph/m2).
Thus, it can be inferred that by simple cleaningof field channel, the seepage losses could bereduced by 40 per cent over uncleaned channel.Due to lining of field channel, the seepage lossescould be reduced by 35.8 and 61.5 per cent overcleaned and uncleaned field channels,respectively.
18.3. Technologies intervention in Kukadicommand
In this command, the crops like pearlmillet,wheat, onion, groundnut and vegetables withlocal varieties were grown as ruling crops withtraditional local practices, the new cropsintroduced were soybean (MACS-124), Pigeonpea (ICPL-87), mustard (Sita and Pusa bold ). Inaddition, improved cultivars of pearlmillet(RHRBH-8609), wheat (HD-2189), onion (N-2-4-1), gram (Vishal, Vijay), ground nut (SB-XI) werealso tried. These crops were grown by adoptingimproved water management packagescomprised of seed treatment, timely seeding,appropriate seed rate, proper plant architecture,irrigation layout, scheduling of irrigation as perCGS, recommended dose of fertilizers and plantprotection covers. These were compared withtraditional method adopted by farmers. Theresults are summarized below:

Manual on Enhancing Water Use Efficiency in Canal Commands 203
Introduction of pigeon pea along withimproved package augmented the grainyield in the range of 33 to 74 per cent, watersaving by 15 per cent, increasing net profitby 8.5 folds and B:C ratio 2.51 over localvariety with traditional practices.
Introduction of improved high yieldingcrop cultivar like pearlmillet (RHRBH-8609) along with improved watermanagement package increased the grainyield in the range of 50 to 173 per cent, netprofit by 168 per cent, WUE in the range of37 to 93.9 kg/ha cm and B:C ratio 1.23 overthe local variety coupled with traditionalpractices.
By introduction of improved cultivar ofwheat (HD-2189) along with improvedpackage resulted in to increased in grainyield in the range of 93 to 104 per cent, netprofit by 168 per cent, B:C ratio in the rangeof 2.4 to 2.6 and WUE 34.7 to 92.6 kg./hacm over the local cultivar cultivated byadopting local practices.
By introduction of new crops like chickpea(Vijay & Vishal), mustard ( Pusa bold) andpigeon pea (ratoon) (ICPL-87) yielded18.91, 26.32 , 11.43 and 12.86 q/ha and WUEby 85.2, 87.7, 54.4 and 71.4 kg./ha cm. netprofit accured was in the order of 16783,27716, 10995 and 13718 Rs./ha respectively.This has fetched more monetary returnsover that of ruling crops.
Growing of improved ground nut cultivar(SB XI) sown in right time (first week ofFeb.) with improved water managementtechnologies resulted into increase inproductivity by 63 per cent, saving inirrigation water by 13 per cent and WUEby 86.43 per cent over control. Even by mereadoption of improved package underconditions of delayed sowing resulted intoincreasing in productivity by 39 per cent,WUE by 86 per cent, water saving by 25per cent over that of control. This hasindicated that, by mere adoption of non
cash input like timely sowing, theproductivity increased was 23 per cent overthat of delayed sowing.
18.4 Impact assessment of on farm watermanagement
After completion of on farm water managementstudies in Mula and Kukadi, 60 to 99 per centwith an average of 94.8 per cent farmers in Mulacommand and 17 to 89 per cent with an averageof 56.2 per cent in Kukadi command haveadopted different improved water managementtechnologies including improved cropproduction package. This has reflected inimproving the socio economic conditions of thepeasants.
18.4.1 Irrigation layouts : Irrigation layout ofappropriate sizes are very essential for properdistribution of irrigation water, encouragesuniform crop growth, reduces water losses, helpsin soil and water arrestation along with nutrientconservation. It has been noticed that farmers donot adopt the suitable layouts as per the croprequirements. Usually, restricted flooding isfollowed. In the case of rabi sorghum, usually nolayout is prepared since the crop receives only 2-3 irrigation at late stage (usually boot stage). Thisleads to uneven distribution of water whichreflects on growth. The studies on these aspectsrevealed that at least 20-25% yield could beincrease by layout. Usually borders (Sara) of 3 mwidth and 25 m length are recommended. Butmodification can be done looking to the slope andinfiltration rate of soil. To make the formation ofborder easy, a device called “Sarayantra” isprovided which can be drawn by a pair of animalsimmediately after seeding. No wastage of landis noticed. Farmers are also seen to fabricate theimplement locally.
Demonstration conducted in Mula commandwith intervention like adoption of improvedlayout for irrigation (border) when comparedwith farmers practice on wheat (cv.HD-2189) at27 locations increased grain yield by 19 per centand saved irrigation water by 22 percent over

204 Manual on Enhancing Water Use Efficiency in Canal Commands
control (Table 18.1). In case of pearlmillet (13locations) yield increase was to the tune of 22 percent with saving in irrigation water by 4 percentcompared to tradition method adopted byfarmers. While, the crops like chickpea, mustard,
pigeonpea and summer groundnut tried in thisintervention, the productions were increased by16, 112, 28 and 27 per cent with saving inirrigation water by 14, 24, 3 and 21 per cent,respectively.
Table 18.1 : Effect of layout on yield and water saving by different crops in Mula command during1989-94.
Crop Yield (q/ha) Yield Water
increase (%) saving (%)
Improved Traditional
layout layout
Wheat (Avg.27 trials) 26.06 21.84 18.92 21.81
Pearl millet (Avg. 3 trails) 13.88 11.36 22.18 04.55
Chickpea (Avg. 2 trails) 05.83 05.03 15.90 14.00
S. Groundnut (Avg. 18 trails) 20.62 16.53 24.77 21.38
Mustard (Avg. 9 trails) 05.69 02.67 112.35 24.20
Pigeonpea (Avg. 7 trails) 11.57 09.06 27.84 0.3.30
The problem however, is the availability ofirrigation water at right time. As per the systemprevailing, farmers have to submit applicationin advance for irrigation water. Unless it is done,irrigation water is not released. Farmers do notrealize how much they are loosing due todryspell. It is, therefore, appropriate to educatethe farmers to application in advance forirrigation. At the same time, irrigation policyneeds to be changed to release water whenfarmers demand. This could possibly happen incase decision is taken to release water onvolumetric basis to collect the appropriaterevenue.
18.4.2 Fertilizer management : Fertilizationapplication is an important aspect of irrigationwater management. The time and method ofapplication are equally important. Rarely, it isrealized that farmers in irrigated areas have usedthe appropriate fertilizer combination.
Rabi sorghum is a major crop in Mula commandareas. It would be very difficult to understand asto why the farmers do not apply fertilizer. It has
been demonstrated that application ofrecommended dose of fertilizers along withscientific water management resulted intodoubling the grain yield of rabi sorghum. Thefull utilization of irrigation could only be possibledue to improving the crop management practices,particularly fertilizers. Where farmers usefertilizers, they need to be educated in balanceduse. This is particularly so for legume crops.Unlike the cereals, legumes require morephosphate and less of nitrogen. Survey indicatedthat even for legumes, farmers have practice totop dress the crop with N, which is highlyundesirable.
The balance fertilizer use and thereby enhancingfertilizer use efficiency can be achieved by itsapplication based on soil test. The anticipatedmaximum targeted yield can be achieved byusing fertilizer prescription equations based onsoil test (Table 18.2). In the Kukadi command,the yields of pearl millet, pigeon pea, onion,wheat and groundnut (summer) obtained were48.8, 28.3, 401, 43.1 and 41.6q/ha as againstanticipated yield target of 50,30,450,50 and 45 q/ha indicating validation of yield targeting

Manual on Enhancing Water Use Efficiency in Canal Commands 205
equations. This has increased the yields of thesecrops in the order of 116,190,129,123 and 186 percent and water saving by 25,0, 7,15 and 33 percent, respectively, over that of conventionalfarmer’s practice.
18.4.3 Appropriate and remunerative cropsequences/crop: Adoption of appropriate andremunerative crop sequences is yet anotheraspect of adaptive research. By introducing seedproduction in Mula command area, the entireeconomy of farmers changed. The Kaike villageand near by villages have become a pocket ofcertified seed production giving attractive returnsto the farmers. Besides this, certain remunerativecrop sequences have also been identified. Theresearch experiments on identified cropsequences (Table 18.3) were conducted in Kukadicommand during and the data revealed thatamong the identified crop sequences, thesequences like pearl millet-onion and soybean-onion achieved maximum monetary returns withthe benefit cost ratio of 5.12 and 5.07, respectively,closely followed by pigeon pea-wheat sequenceas compared to green gram- sorghum. Thesoybean and pigeon pea were the newlyintroduced crops in the sequence.
18.5 Impact of improved package of practices
A. Mula command
Adoption of improved package of practices(improved irrigation layout, timely sowing,
appropriate seed rate, improved variety,irrigation scheduling at critical growth stages ofcrop, balance fertilizer use and plant protectionmeasures etc) when compared to the traditional
Table 18.2 : Yield maximization of different crops as influenced by use of yield targeting equationsand water management practices
Sr. Name of crop Yield (q/ha) Yield Water BenefitNo. increase saving (%) over (F.P.)
(%) (Rs./ha)Yield Farmerstarget practice
achieved
1. Pearl millet 48.48 22.65 115.63 25.00 12525
2. Pigeonpea 28.28 09.75 190.01 — 25975
3. Onion (Rabi) 400.10 175.00 129.10 7.00 54932
4. Wheat 43.07 19.28 123.40 15.00 11632
5. Groundnut (Summer) 41.60 14.53 186.30 33.33 32044
Table 18.3 : Remunerative crop sequences inKukadi command
Season and Crop sequence Benefit: cost ratio
Kharif RabiSoybean Wheat 2.97Pearl millet Onion 5.12Pigeonpea Wheat 3.71Soybean Onion 5.07Green gram Sorghum 1.81Onion Wheat 1.97
practice of growing wheat (29 locations),increased grain production by 46 per cent withsaving of irrigation water by 13 per cent overcontrol, whereas the corresponding increase invalues for chickpea, pearl millet, mustard,summer groundnut and sunflower were32,34,272,38 and 174 per cent with saving ofirrigation water by 14,9,20,31 and 25 per cent,respectively (Table 18.4). Similarly, in sugarcane(Adsali, Suru and ratoon), the increase in yieldwas to the tune of 25, 30 and 26 per cent andirrigation water saving was 16, 17 and 11 per cent,respectively. The Kharif groundnut, sunflowerand soybean were tried and achieved theproduction potential by 9.37,18.75 and 11.25 q/

206 Manual on Enhancing Water Use Efficiency in Canal Commands
ha in study plots which was increased by 166,44and 50 per cent over control. The pigeon peagrown on 23 farmers’ fields, increased the grainyield by 90 per cent over control and kharif hybridpearl millet cultivar RHRBH-8609 grown on 11fields, the grain yield was increased by 107.30 percent over the local control.
B. Kukadi command
Employment of improved package interventionas that of Mula command, the yield increase dueto the crops like gram, pearl millet, mustard andpigeon pea were 142, 98, 95, 101 and 53 per centrespectively, over the conventional practices of
Table 18.4 : Effect on yield, water saving and yield increase in different crops due to adoption ofpackage of practices in various irrigation commands
Crop Yield (q/ha) Yield Waterincrease saving
(%) (%)
Improved Traditionalpackage Method
Mula Command
Wheat (Avg. 29 trials) 29.20 20.57 45.99 13.00Chickpea (Avg. 14 trails) 26.70 17.90 31.77 14.15Pearl millet (Avg. 3 trails) 15.03 11.20 33.92 9.17Mustard (Avg. 30 trails) 9.98 2.67 272.25 20.21S.Groundnut (Avg. 5 trails) 19.38 14.00 38.43 31.41S.Sunflower (Avg.2 trails) 22.50 8.20 174.40 25.00Sugarcane (Ad)-(Avg. 2 trails) 1375 1100 25.00 16.00Sugarcane (R) )-(Avg. 2 trails) 820 650 26.20 10.90Sugarcane (Suru) )-(Avg. 2 trails) 1080 830 30.10 17.20Sunflower (K) (Avg.4 trials) 9.37 3.75 116.50 25.19K.Groundnut (Avg. 3 trails) 18.75 13.65 44.40 —Soybean (Avg. 2 trails) 11.25 7.50 50.00 —Pigeonpea (Avg. 23 trails) 14.30 9.25 90.30 —Pearl millet (Avg.11 trails) 31.10 15.00 107.30 —Pearl millet (Avg. 2 trails) 58.10 35.00 66.00 —Kukadi CommandPigeonpea (Avg. 4 trails) 15.33 10.00 53.50 15.00Pearl millet (Avg. 7 trails) 24.41 12.50 95.28 —Wheat (Avg. 6 trails) 31.38 15.80 98.60 27.00Chickpea (Avg. 4 trails) 26.32 10.84 142.80 —Mustard (Avg. 2 trails) 11.43 5.67 101.58 13.20Pigeonpea (Ratoon) 12.86 7.27 76.89 10.00
farmers. Further, it is added that the water savingfor wheat, mustard and pigeon pea crops were 27,13 and 15 per cent respectively, over theconventional practices. Further, monitoring wasdone through the studies on one of the adjoiningcontrol outlets regarding efficient utilization ofwater in Mula command. The data are reported
in Table 18.5. It was observed that waterapplication is reduced due to proper layouts. Atthe same time the yield is improved resulting intobetter water use efficiency. This was increased by37.4%. Thus, the adaptive research has been foundto be useful to improve the production potentialand water use efficiency.
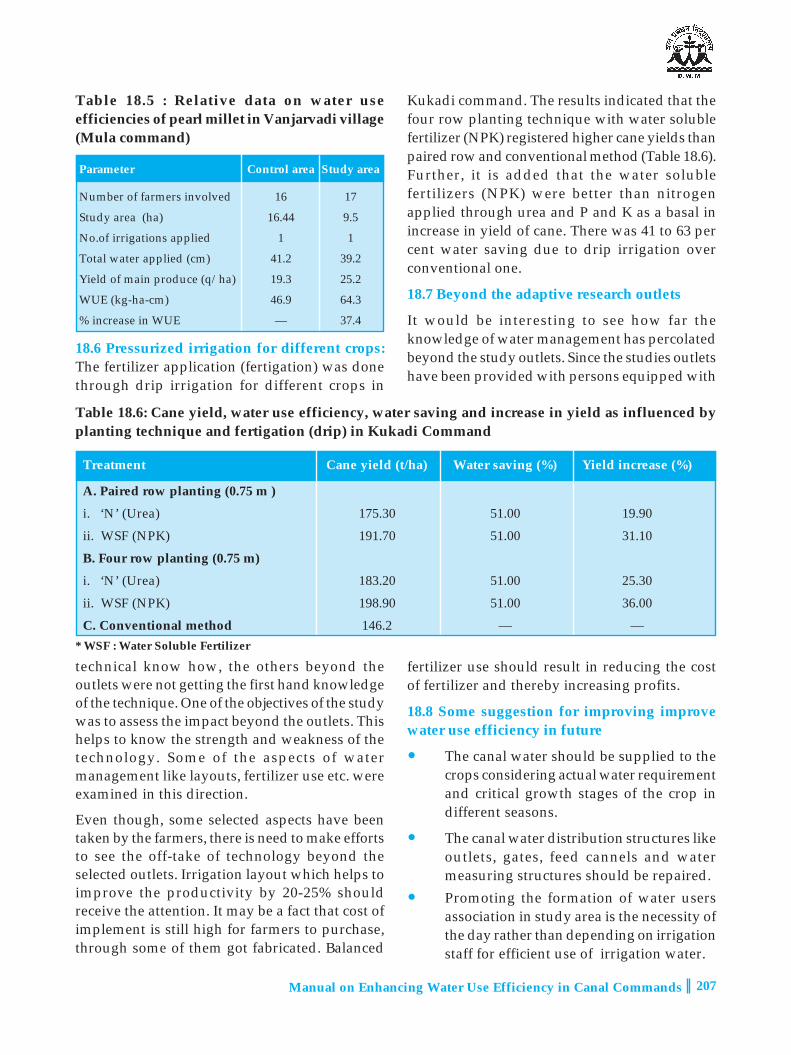
Manual on Enhancing Water Use Efficiency in Canal Commands 207
Kukadi command. The results indicated that thefour row planting technique with water solublefertilizer (NPK) registered higher cane yields thanpaired row and conventional method (Table 18.6).Further, it is added that the water solublefertilizers (NPK) were better than nitrogenapplied through urea and P and K as a basal inincrease in yield of cane. There was 41 to 63 percent water saving due to drip irrigation overconventional one.
18.7 Beyond the adaptive research outlets
It would be interesting to see how far theknowledge of water management has percolatedbeyond the study outlets. Since the studies outletshave been provided with persons equipped with
Table 18.5 : Relative data on water useefficiencies of pearl millet in Vanjarvadi village(Mula command)
Parameter Control area Study area
Number of farmers involved 16 17
Study area (ha) 16.44 9.5
No.of irrigations applied 1 1
Total water applied (cm) 41.2 39.2
Yield of main produce (q/ha) 19.3 25.2
WUE (kg-ha-cm) 46.9 64.3
% increase in WUE — 37.4
18.6 Pressurized irrigation for different crops:The fertilizer application (fertigation) was donethrough drip irrigation for different crops in
Table 18.6: Cane yield, water use efficiency, water saving and increase in yield as influenced byplanting technique and fertigation (drip) in Kukadi Command
Treatment Cane yield (t/ha) Water saving (%) Yield increase (%)
A. Paired row planting (0.75 m )
i. ‘N’ (Urea) 175.30 51.00 19.90
ii. WSF (NPK) 191.70 51.00 31.10
B. Four row planting (0.75 m)
i. ‘N’ (Urea) 183.20 51.00 25.30
ii. WSF (NPK) 198.90 51.00 36.00
C. Conventional method 146.2 — —* WSF : Water Soluble Fertilizer
technical know how, the others beyond theoutlets were not getting the first hand knowledgeof the technique. One of the objectives of the studywas to assess the impact beyond the outlets. Thishelps to know the strength and weakness of thetechnology. Some of the aspects of watermanagement like layouts, fertilizer use etc. wereexamined in this direction.
Even though, some selected aspects have beentaken by the farmers, there is need to make effortsto see the off-take of technology beyond theselected outlets. Irrigation layout which helps toimprove the productivity by 20-25% shouldreceive the attention. It may be a fact that cost ofimplement is still high for farmers to purchase,through some of them got fabricated. Balanced
fertilizer use should result in reducing the costof fertilizer and thereby increasing profits.
18.8 Some suggestion for improving improvewater use efficiency in future
The canal water should be supplied to thecrops considering actual water requirementand critical growth stages of the crop indifferent seasons.
The canal water distribution structures likeoutlets, gates, feed cannels and watermeasuring structures should be repaired.
Promoting the formation of water usersassociation in study area is the necessity ofthe day rather than depending on irrigationstaff for efficient use of irrigation water.

208 Manual on Enhancing Water Use Efficiency in Canal Commands
There should be bottom up approach ratherthan top down approach so as to increasethe direct association of the farmers in themanagement of irrigation waterdistribution system.
There should be reliability and timelydelivery of water to the farmers. Theirrigation water at least should be releasedby the irrigation engineers in consulationwith the technical staff from agriculture.
The seepage and conveyance losses ofwater should be minimized by lining,cleaning of water courses so as to increasethe efficiency of irrigation project.
The field channel/ distributaries/ minorsshould be cleaned/ maintained by theestablished water users association forwhich the compensatory funds should beprovided by the irrigation department.
The structures of outlets / minors at thehead, middle and tail reaches ofdistributory are not in a proper workingcondition. As such, this has reflected inuneven distribution of irrigation water. Thestructures should also be maintained by thewater users’ association.
The sugarcane is the dominate crop in themost of the irrigation commands. As such,the farmers are habituated to irrigate thecrop by adopting overland flow of waterespecially during night hours. This hasresulted into development of secondarysalinity. In order to hault such degradationof soils to certain extent, it is necessary toincrease area of sugarcane under dripespecially under well irrigation. Similarlythe suitable remunerative crop sequencesshould be followed by keeping thesugarcane as a base crop.
The problematic soils viz., saline, saline-alkali and alkali should be reclaimed byadopting suitable amelioration techniqueon prority basis. The irrigation departmentshould give subsidy to the farmers fordigging out drains and outletsdevelopments.
In utilization of saline water, cyclic use ofground water with canal water should beencouraged. This will help not only inimprovement in the problematic soils butalso increased the crop production andproject irrigation efficiency.