Enhancing the Sniper simulator with thermal measurement
6
Enhancing the Sniper Simulator with Thermal Measurement Adrian Florea, Claudiu Buduleci, Radu Chiș, Arpad Gellert, Lucian Vințan Computer Science and Electrical Engineering Department “Lucian Blaga” University of Sibiu Sibiu, Romania [email protected], [email protected], [email protected], [email protected], [email protected] Abstract—This paper presents the enhancement of the Sniper multicore / manycore simulator with thermal measurement possibilities using the HotSpot simulator. We present a plugin that interacts with Sniper to retrieve simulation data (integration areas and power consumptions) and calls HotSpot to compute the corresponding thermal results. The plugin also builds a two dimensional floorplan for the simulated microarchitecture. Furthermore we plan to integrate the simulation methodology presented here into an automatic design space exploration process using the multi-objective optimization tool called FADSE. Keywords—multicore; simulator; power consumption; thermal; HotSpot; Sniper I. INTRODUCTION Nowadays the voltage supply has significantly decreased along with the integration area for everyday microelectronic chips. The visible effect of those diminutions can be observed in the speed of clock frequency of the chips. The frequency has increased a lot over time and this led to the creation of some high performance microelectronic chips that can execute our programs faster. However, a physical barrier in increasing the clock frequency has been encountered. Since the clock frequency is getting higher and the chip area smaller, in contrast the power consumption density increases. For sure this is not an ideal technology scaling. Higher power consumption and a smaller chip means that the power needs to dissipate in a smaller area and this leads to a “cooking-aware” chip. It means that the chip will have very high temperatures and the conventional cooling methods (air-cooled heat sink, heat pipe, etc.) are not efficient. The temperature is limited to 111.8 ° C; above this threshold the chips start to melt. This is why thermal measurement is critical in today’s microprocessor’s design. An attempt to mitigate this issue was by introducing the multicore systems. Nowadays more CPUs, usually with lower frequency, are integrated in one single silicon chip. At first were dual core chips (2 cores on a chip), later appeared four cores and now we have 64 or more cores for general usage on a single silicon chip. As an example, TILE64 is a multicore processor produced by Tilera company and has 64 cores on a single chip. But the power wall still remains and there are a lot of techniques for preventing the chip overheating. For example, dynamic voltage and frequency scaling are the most commonly used technological solutions for reducing power consumption and preventing the chip to overheat. Unfortunately, those techniques are implying a reduction in global performance of the system. These days the temperature metric has gained a ramp up in academic research and it is a very active and attractive area of investigation. A public open source simulator that was built for chip temperature analysis is HotSpot [3] and was developed at the University of Virginia by Wei Huang in his PhD dissertation under the supervision of Professor Mircea Stan and Professor Kevin Skadron (thesis co-advisor). The main purpose of this paper is to enhance the Sniper multicore simulator [4] with a thermal analysis possibility provided by HotSpot. Developing a plugin that interacts with Sniper and HotSpot, observing the thermal behavior of the simulated microarchitecture along with the chip area, performance and energy consumption forms the main goals of this paper. Adding temperature measurement possibilities to the Sniper simulator will involve for sure more realistic design space explorations during the optimization processes. The organization of the rest of this paper is as follows. Section 2 describes a short theoretical background related to thermal analysis of computer microarchitectures, whereas Section 3 presents an overview of our plugin. Section 4 illustrates the simulation methodology and some preliminary simulation results. Finally, Section 5 suggests directions for future work and concludes the paper. II. RELATED WORK Thermal measurement is an important metric for nowadays microprocessors. Many powerful software applications that simulate the thermal behavior of a given microarchitecture over time are continuously developed and maintained. In [6] the authors show the importance of collaboration between the thermal engineering and computer architecture communities. It is shown that different thermal constraints require different approaches in order to optimize the microarchitecture. Various thermal management methods for multicore systems were exploited in [7]. One important aspect presented in this paper is the necessity of hardware-software collaboration for controlling the chip temperatures. The most popular simulator for such purpose is HotSpot [3]. It contains a block-model method which is based on the analogy between electric circuits and heat conduction theory. A network of thermal “resistances” and “capacitances” are Proceedings of the 18th International Conference on System Theory, Control and Computing, Sinaia, Romania, October 17-19, 2014 ISBN 978-1-4799-4602-0 ©2014 IEEE 31
-
Upload
independent -
Category
Documents
-
view
1 -
download
0
Transcript of Enhancing the Sniper simulator with thermal measurement
Enhancing the Sniper Simulator with Thermal
Measurement
Adrian Florea, Claudiu Buduleci, Radu Chiș, Arpad Gellert, Lucian Vințan
Computer Science and Electrical Engineering Department
“Lucian Blaga” University of Sibiu
Sibiu, Romania
[email protected], [email protected], [email protected], [email protected],
Abstract—This paper presents the enhancement of the Sniper
multicore / manycore simulator with thermal measurement
possibilities using the HotSpot simulator. We present a plugin
that interacts with Sniper to retrieve simulation data (integration
areas and power consumptions) and calls HotSpot to compute the
corresponding thermal results. The plugin also builds a two
dimensional floorplan for the simulated microarchitecture.
Furthermore we plan to integrate the simulation methodology
presented here into an automatic design space exploration
process using the multi-objective optimization tool called FADSE.
Keywords—multicore; simulator; power consumption; thermal;
HotSpot; Sniper
I. INTRODUCTION
Nowadays the voltage supply has significantly decreased along with the integration area for everyday microelectronic chips. The visible effect of those diminutions can be observed in the speed of clock frequency of the chips. The frequency has increased a lot over time and this led to the creation of some high performance microelectronic chips that can execute our programs faster. However, a physical barrier in increasing the clock frequency has been encountered. Since the clock frequency is getting higher and the chip area smaller, in contrast the power consumption density increases. For sure this is not an ideal technology scaling. Higher power consumption and a smaller chip means that the power needs to dissipate in a smaller area and this leads to a “cooking-aware” chip. It means that the chip will have very high temperatures and the conventional cooling methods (air-cooled heat sink, heat pipe, etc.) are not efficient. The temperature is limited to 111.8
°C;
above this threshold the chips start to melt. This is why thermal measurement is critical in today’s microprocessor’s design.
An attempt to mitigate this issue was by introducing the multicore systems. Nowadays more CPUs, usually with lower frequency, are integrated in one single silicon chip. At first were dual core chips (2 cores on a chip), later appeared four cores and now we have 64 or more cores for general usage on a single silicon chip. As an example, TILE64 is a multicore processor produced by Tilera company and has 64 cores on a single chip. But the power wall still remains and there are a lot of techniques for preventing the chip overheating. For example, dynamic voltage and frequency scaling are the most commonly used technological solutions for reducing power consumption and preventing the chip to overheat. Unfortunately, those
techniques are implying a reduction in global performance of the system.
These days the temperature metric has gained a ramp up in academic research and it is a very active and attractive area of investigation. A public open source simulator that was built for chip temperature analysis is HotSpot [3] and was developed at the University of Virginia by Wei Huang in his PhD dissertation under the supervision of Professor Mircea Stan and Professor Kevin Skadron (thesis co-advisor).
The main purpose of this paper is to enhance the Sniper multicore simulator [4] with a thermal analysis possibility provided by HotSpot. Developing a plugin that interacts with Sniper and HotSpot, observing the thermal behavior of the simulated microarchitecture along with the chip area, performance and energy consumption forms the main goals of this paper. Adding temperature measurement possibilities to the Sniper simulator will involve for sure more realistic design space explorations during the optimization processes.
The organization of the rest of this paper is as follows. Section 2 describes a short theoretical background related to thermal analysis of computer microarchitectures, whereas Section 3 presents an overview of our plugin. Section 4 illustrates the simulation methodology and some preliminary simulation results. Finally, Section 5 suggests directions for future work and concludes the paper.
II. RELATED WORK
Thermal measurement is an important metric for nowadays microprocessors. Many powerful software applications that simulate the thermal behavior of a given microarchitecture over time are continuously developed and maintained.
In [6] the authors show the importance of collaboration between the thermal engineering and computer architecture communities. It is shown that different thermal constraints require different approaches in order to optimize the microarchitecture. Various thermal management methods for multicore systems were exploited in [7]. One important aspect presented in this paper is the necessity of hardware-software collaboration for controlling the chip temperatures.
The most popular simulator for such purpose is HotSpot [3]. It contains a block-model method which is based on the analogy between electric circuits and heat conduction theory. A network of thermal “resistances” and “capacitances” are
Proceedings of the 18th International Conference on System Theory, Control and Computing, Sinaia, Romania, October 17-19, 2014
ISBN 978-1-4799-4602-0 ©2014 IEEE 31

created internally in order to compute the temperatures. An interesting study has been made in [1]. This study compares HotSpot with other two thermal simulators that use a different approach to compute the temperatures based on power input. The first solver is ATMI [5] and it is based on classical analytical methods that do not rely on space discretization and provides the exact solution. The second solver is FreeFEM3D [12], a general purpose finite-element solver that offer temperature results “close” to the actual solution. In [1] some accuracy issues of HotSpot have been found. The authors show that those accuracy issues can occur in some special circumstances. Furthermore the accuracy of HotSpot was improved in [2] by the authors. Functional blocks are divided into sub-blocks in order to obtain a better accuracy, the heat transfer between the heatsink and environment is more detailed and closer to reality. They also improved the equation used to compute the lateral thermal resistance of a block and the transient thermal modeling.
We have not found any studies regarding thermal measurements integrated into the Sniper simulator. A step to integrate HotSpot in Sniper was made by Wim Heirman, one of the Sniper developers. He created a floorplan for a 64-core system and called in parallel with Sniper a slightly modified version of HotSpot to compute only one time step at a time [4]. The HotSpot modification consists in writing out all internal temperatures in order to allow the simulation of one time step.
Our approach is different because we use a more detailed and flexible floorplan with a granularity of 5 functional units per core instead of a floorplan at a core-level granularity. We are interested on which unit from the core the hotspot occurs. Another difference is that we call HotSpot after the Sniper simulation is finished, not in parallel because the current version of HotSpot 5.02 does not officially support this feature. Also our plugin automatically generates the floorplan for the simulated microarchitecture based on the integration areas provided by MCPAT [14] and the number of cores. Due to the automatic thermal analysis allowed by the automatic floorplan creation, our method is more efficient than the previous methods which through manual floorplan creation were limited to manual thermal analysis on selected architectural configurations. This improvement makes it possible to integrate thermal analysis into any automatic design space exploration process. Our goal is to achieve a thermal qualitative accuracy as high as possible. As far as we know, we are the first researchers investigating a 4-D (Performance, Energy, Area and Temperature) multi-objective optimization approach into a multicore architecture.
III. INTEGRATION OF HOTSPOT INTO SNIPER AS A PLUGIN
A. Plugin overview
Sniper is a fast and accurate simulator for multicore microprocessors [4]. This simulator is modeling the Nehalem microarchitecture and was validated against this microarchitecture. We developed a plugin that calls the HotSpot simulator at a certain parameterized time interval (e.g. 500µs) during the Sniper’s simulation process. The plugin also generates the floorplan of the simulated architecture and collects averages of dynamic power consumptions for each functional unit for the current time interval. An overview of
how this plugin interacts with Sniper and HotSpot can be seen in Fig. 1.
The HotSpot plugin is developed in the Python programming language and it lies in the scripts folder inside the Sniper simulator. In order to use it simply add “-s hotspot:500000:block” to the Sniper command line. Parameters signification:
• First parameter – “500000”, sets the calling interval of the HotSpot plugin in nanoseconds;
• Second parameter – “block”, informs the HotSpot simulator about the used thermal simulation method (block or grid).
Fig. 1. HotSpot plugin interaction
The script implements a method that is automatically called by the Sniper simulator at a given interval. In this method, the MCPAT modeling framework [9] is called and the power consumption results are added to the power trace file. After the simulation ends the HotSpot simulator is called using the given simulation method (block or grid) and the corresponding temperature trace is generated.
We chose the power sampling interval to be 500 microseconds because the HotSpot authors state that if extremely short intervals (e.g. nanoseconds) are used then the simulator could produce inaccurate results. They recommend sampling intervals at the order of hundreds of microseconds, milliseconds or longer. Those values are more in line with chip/package thermal time constants.
B. Challenges
The main challenges for this topic are the following:
• How to arrange the CPU functional units (branch predictor, caches, execution units, etc.) in a certain floorplan?
• How to run the HotSpot simulator in parallel with Sniper in order to save simulation time?
32

• How to call HotSpot if we analyze a heterogeneous architecture where cores have different frequencies or if the cores adjust dynamically the frequency?
C. Building the floorplan
In order to solve the first challenge we started by answering the following question: “How functional units of the Nehalem microarchitecture are positioned in a floorplan for one core?” The floorplan structure is based on the Nehalem architecture described in [8]. In Fig. 2 it can be seen how the functional units are positioned inside a core. The positioning is naturally justified mainly by the communication distance between the components. The distance between the components that communicate with each other needs to be as small as possible in order to have the smallest communication latency. For example, the general purpose CPU registers must be as close as possible to the execution units.
Fig. 2. Single-core Nehalem [8]
We collected all the integration areas obtained with MCPAT (integrated out-of-the-box in the Sniper simulator package). MCPAT is an integrated power, area, and timing modeling framework for multithreaded, multicore and manycore architectures [9]. Some functional unit values generated by MCPAT also include values regarding functional modules interconnections (wires, multiplexers, etc.) that cannot be seen in Fig. 2.
Fig. 3. Floorplan associations
Taking into consideration the pipeline processing phases of the microprocessor and the compact presentation of the simulation results by Sniper we have merged (as in Fig. 3) the following functional units:
• “Instruction Decode and Microcode” merged together with “Branch Prediction” and “Instruction Fetch & Level one Instruction Cache” units;
• “Execution Units” were merged with “Instruction Reordering, Scheduling and Retirement”;
• “Level one Data Cache” merged with “Memory Ordering and Execution”.
The association that we made can be seen in Fig. 3. For the
power trace generation we compute the sum of the merged
architectural components into one functional unit component.
Our plugin automatically generates the floorplan based on the
areas provided by MCPAT and the number of cores. For a
microarchitecture with 4 cores the floorplan is created exactly
like the floorplan presented in Fig. 1. If the simulated
microarchitecture has more than 4 cores, the first 4 cores are
placed on the first line and additional cores are placed under
the last line of cores (maximum 4 cores per line).
D. HotSpot parameters
In Fig. 4 it can be seen that the width of microprocessors highly increases along with the number of cores. The ALPHA 21264 microarchitecture has the aspect ratio of the chip equal to one (square shape). The aspect ratio of the Nehalem microarchitecture is 1.5 (rectangular shape). The width of a Nehalem chip is get according to the following formulas:
���������� � �������� .� ���� (1)
��������� � ������������������
���� (2)
This fact automatically implies adjusting the heat sink and heat spreader size for each configuration individually, in order to obtain a better accuracy in thermal simulation.
Fig. 4. Chip width vs. number of cores
It can be seen that the chip width of the Nehalem microarchitecture with 32 cores is about three times higher than that of a single-core Nehalem. In other words, it will be harder for a smaller heat sink and heat spreader to handle the heat transfer of a bigger architecture.
The heat is transferred from the silicon chip into the heat sink via the heat spreader. It is also known from the second law of thermodynamics [3] that the heat flows in the direction where the temperature decreases. The first law of thermodynamics [3] states that the heat produced by a hot region has to be equal to the heat absorbed by the cold region. Hence the chip area increases significantly along with the number of cores and based on the two laws shortly stated above, we chose to adjust the heat sink and the heat speeder in
Execution Units
+Instruction Reordering
Scheduling & Retirement
L1 Data Cache
+Memory
Ordering & Execution
Instruction Decode & Microcode +
Branch Prediction +Instruction Fetch & L1 Cache
L2 Cache & Interrupt Servicing
Paging
Instruction Fetch Unit:Area = 5.860 mm^2
Instruction Cache:Area = 3.146 mm^2
Branch Target Buffer:Area = 0.649 mm^2
Branch Predictor:Area = 0.138 mm^2
Global Predictor:Area = 0.043 mm^2
Local Predictor:L1_Local Predictor:Area = 0.025 mm^2
L2_Local Predictor:Area = 0.015 mm^2
Chooser:Area = 0.0435mm^2
RAS:Area = 0.010 mm^2
Instruction Buffer:Area = 0.022 mm^2
Instruction Decoder:Area = 1.857 mm^2
Renaming Unit:Area = 0.369 mm^2
Int Front End RAT:Area = 0.114 mm^2
FP Front End RAT:Area = 0.168 mm^2
Free List:Area = 0.041 mm^2
Execution Unit:Area = 8.204 mm^2
Register Files:Area = 0.570 mm^2
Integer RF:Area = 0.362 mm^2
Floating Point RF:Area = 0.208 mm^2
Instruction Scheduler:Area = 2.179 mm^2
Instruction Window:Area = 1.009 mm^2
FP Instruction Window:Area = 0.328 mm^2
ROB:Area = 0.841 mm^2
Integer ALUs (Count: 6):Area = 0.470 mm^2
Floating Point Units:Area = 4.658 mm^2
Complex ALUs (Mul/Div) :Area = 0.235 mm^2
Results Broadcast Bus:Area Overhead = 0.044 mm^2
L2
Area = 4.533 mm^2
Memory Management Unit:
Area = 0.434 mm^2
Itlb:Area = 0.301 mm^2
Dtlb:Area = 0.087 mm^2
Load Store Unit:Area = 8.80969 mm^2
Data Cache:Area = 6.8453 mm^2
LoadQ:Area = 0.0836 mm^2
StoreQ:Area = 0.3220 mm^2
33

the following way. We measured the difference between the ALPHA 21264 chip width and the width of the heat spreader and heat sink, respectively.
���������� !"#$"!#%" � 277%
�����()��*�)�� !"#$"!#%" � 88%
The following formulas will be applied to the HotSpot simulator’s heat sink and heat spreader parameters:
����-�./����� � ��������� 0 1��������� ∗ ����-�./�.����3�����4
����-������������ � ��������� 0 1��������� ∗ ����-��������.����3�����4
Along with these parameters we also modified the following:
• sampling_interval = calling_interval [s]
• base_proc_freq = CPUfrequency [Hz]
where calling_interval [s] is the time interval at which the average dynamic power consumption is calculated (e.g. 500µs) and CPUfrequency [Hz] is the actual clock frequency for the simulated homogenous architecture.
IV. SIMULATION METHODOLOGY AND EXPERIMENTAL
RESULTS
A. Running HotSpot
The main goal is to get the most accurate thermal results with less possible simulation time. Time is a very important factor because we plan to run a multi-objective automatic design space exploration using FADSE [13], Sniper and HotSpot. Targeted objectives are: performance (IPC – instructions per cycles), chip area, energy consumption and chip temperature.
HotSpot has two main simulation cases: a block level thermal model and a more accurate grid thermal model. The second one offers a better accuracy regarding the first thermal model but at the cost of processing time. We simulated for testing purposes both methods. At the grid model we set the granularity of 128 rows and 128 columns.
Fig. 5. Temperature variation over time for FFT benchmark on one core
Legend interpretation:
• GRID_128_HSS – simulated with a 128x128 grid and with heat sink and spreader adjusted according to chip area;
• BLOCK_HSS – block level simulation heat sink and spreader adjusted according to chip area;
• GRID_128 – simulated with a 128x128 grid and with the default heat sink and spreader parameters.
Fig. 5 shows that the accuracy provided by the block method is between the two grid methods. A simulation with the grid model for a 128x128 grid matrix takes about 2 hours using our simulation environment (see below). For the block model the simulation takes about 30 seconds.
Based on the temperature variation over time from Fig. 5 and on the two points stated above we decided to use the block level granularity for simulating the temperatures with HotSpot. The tradeoff between accuracy and simulation time is acceptably fair. The maximum temperature difference between the methods is about 0.5°C.
B. Simulation environment
The simulation environment is composed by the Sniper 5.3 and HotSpot 5.02 simulators and the Splash2 suite of parallel benchmarks using large Datasets (~3.5 billion dynamic instructions per benchmark). The simulated microarchitecture is Intel Nehalem-EP [10], which may include between 1 to 16 cores, each of them running at 2.66GHz. We installed and run this environment on Ubuntu 13.10, disposing an Intel Quad Core I7, CPU at 4.4 GHz, with 16 GB RAM and SSD hard drive. In our evaluation, the simulation time ranges between 414 million and 8293 million cycles for one simulated configuration, depending on the benchmark and the number of cores of the Nehalem-EP microarchitecture. Also, the number of simulated cycles decreases by increasing the number of cores.
C. Preliminary results
In Fig. 6 it can be seen that the computing performance measured in instructions per cycle increases along with the number of cores. This processing speed increase is given mainly by the programs ability to run on multiple cores. More exactly, it is given by the parallelizing degree of the concurrent code portions from the simulated benchmark.
Fig. 6. Performance variation according to number of cores
48
48,2
48,4
48,6
48,8
49
Tim
e [m
s]
108
.5
217
325
.5
434
542
.5
651
759
.5
868
976
.5
108
5
119
3.5
130
2
141
0.5
151
9
162
7.5
173
6
Tem
per
atu
re [°C
]
Core_0_ExecUnit_GRID_128_HSSCore_0_ExecUnit_BLOCK_HSSCore_0_ExecUnit_GRID_128
0
5
10
15
20
Per
form
an
ce [
IPC
]
1 core 2 cores 4 cores 8 cores 16 cores
34

Therefore, the computing performance can be increased by parallelising our applications and increasing the number of cores. Even though the performance is increasing along with the number of cores, the average IPC/core is decreasing (Fig. 7). This fact occurs due to the application and system scalability, and the quantity of communication through shared variables (implied by the communication between cores). In other words, due to the efficiency of the system, the programs are executed (in average) faster if more computing resources are available to run the same program. Also the executed program needs to have the ability to use more computing resources in parallel.
Fig. 7. Average IPC/core variation according to number of cores
The formulas used for computing the total power consumption (Ptotal) and the average power consumption (Pavg) per core are the following:
5�6� �∑ 8∑ 5�9:99; <:��; :�
�=� (5)
5�>��? � ∑ @∑ 5�9:99A B:��A �=� (6)
where:
• Nc – the number of cores;
• Nu – the number of functional units within a core (in our case is 5);
• Pcu – the average dynamic power consumption for functional unit u from core c.
An interesting fact is that the average dynamic power consumption per core (Pavg) is decreasing along with the number of cores (Fig. 8). This fact is well-correlated with the average IPC/core decrease presented in Fig. 7 (lower performance per core involves lower power consumption per core).
Also, in an opposite direction, the total dynamic power consumption (Ptotal) of the chip is highly increasing along with the number of cores (Fig. 9). This increase is given by the fact that we use on the same chip more homogenous resources (cores) to run our application. This is well-correlated with the global IPC growth presented in Fig. 6.
Fig. 8. Average power consumption per core according to the cores number
Fig. 9. Total power consumption according to the number of cores
We also determined the total energy consumption of the simulated microprocessor depending on the simulated benchmark and the number of cores. The total energy consumption is defined as follows:
C�>��? � 5D6� ∗ :� ∗ :�E�?�3�= ∗ F����E�?�3� (7)
where:
• Both Pavg and Nc are defined in equation 5;
• Ncycles –the number of simulated cycles;
Fig. 10. Total energy consumption according to the number of cores
The total energy consumption trend can be observed in Fig. 10 and in average it is slightly increasing along with the number of cores. It is interesting to observe that comparing with the global performance, which significantly increases from one to 16 cores (Fig. 6), the total energy consumption increases in a modest manner; this represents a positive fact.
0
0,5
1
1,5
2
IPC
/core
1 core 2 cores 4 cores 8 cores 16 cores
0
2
4
6
8
10
12
14
Aver
ag
e p
ow
er [
W]
1 core 2 cores 4 cores 8 cores 16 cores
0
50
100
150
Tota
l p
ow
er [
W]
1 core 2 cores 4 cores 8 cores 16 cores
0
10000
20000
30000
40000
50000
To
tal
ener
gy
[W*
Meg
aC
ycl
es]
1 core 2 cores 4 cores 8 cores 16 cores
35
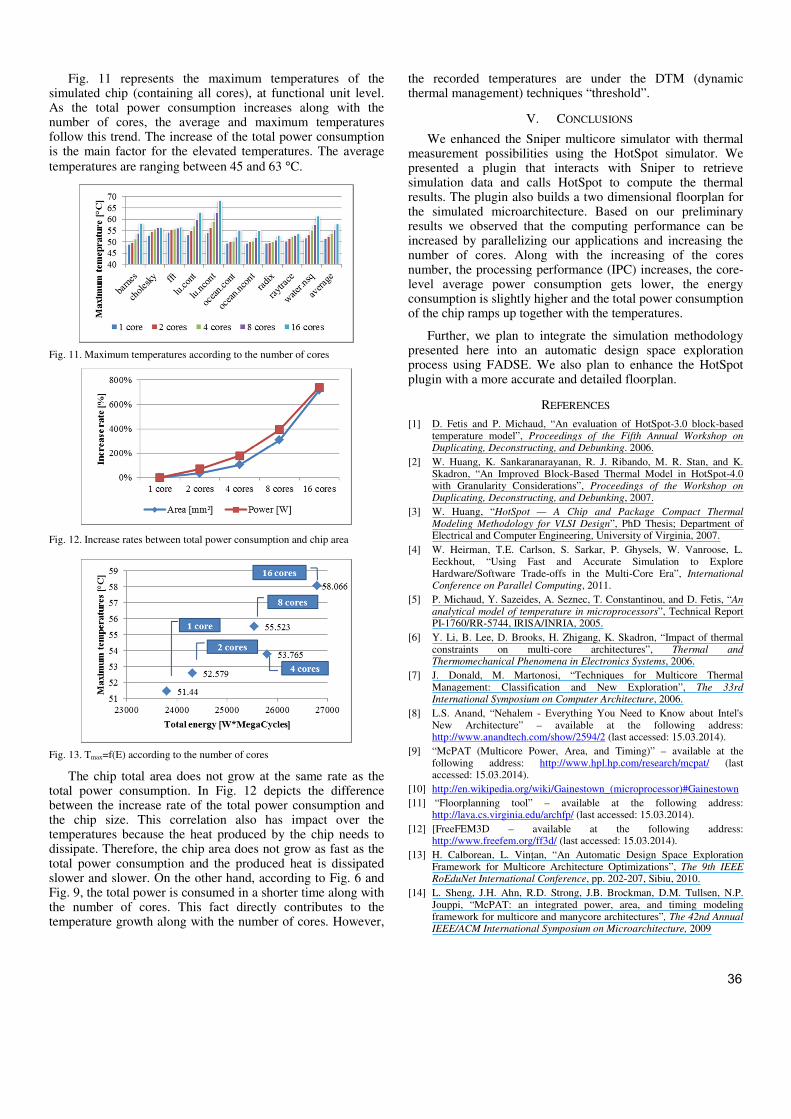
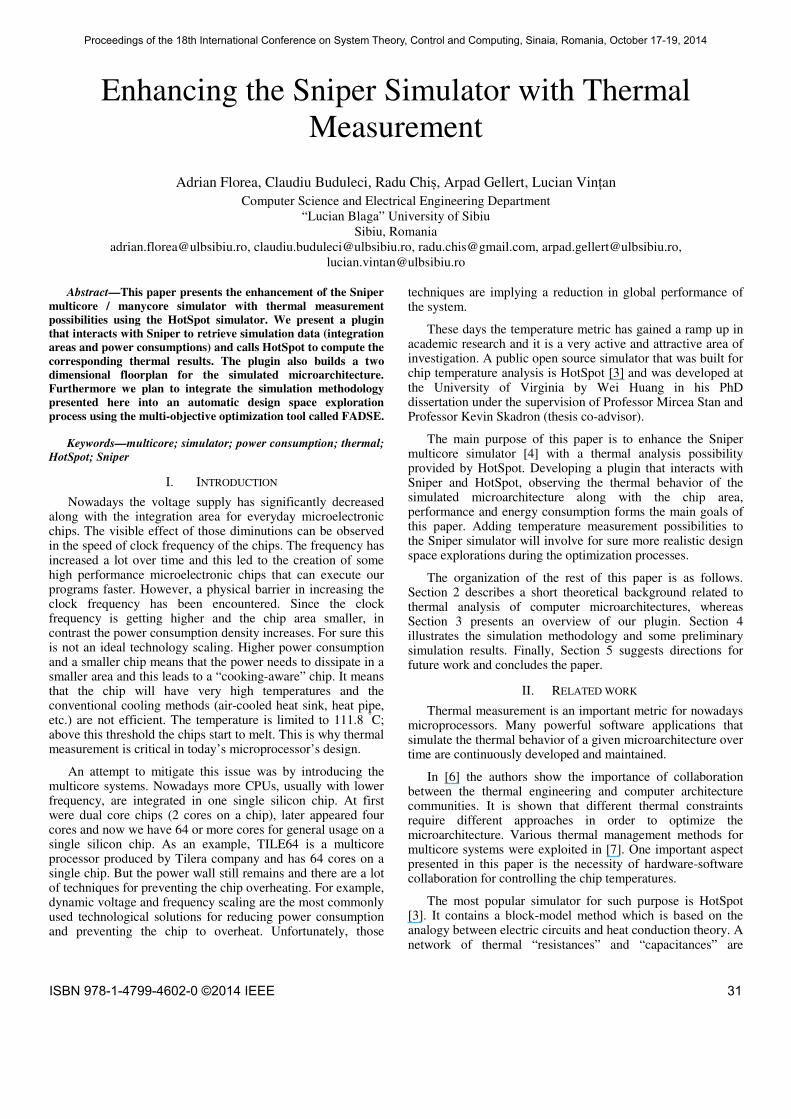
Fig. 11 represents the maximum temperatures of the simulated chip (containing all cores), at functional unit level. As the total power consumption increases along with the number of cores, the average and maximum temperatures follow this trend. The increase of the total power consumption is the main factor for the elevated temperatures. The average
temperatures are ranging between 45 and 63 °C.
Fig. 11. Maximum temperatures according to the number of cores
Fig. 12. Increase rates between total power consumption and chip area
Fig. 13. Tmax=f(E) according to the number of cores
The chip total area does not grow at the same rate as the total power consumption. In Fig. 12 depicts the difference between the increase rate of the total power consumption and the chip size. This correlation also has impact over the temperatures because the heat produced by the chip needs to dissipate. Therefore, the chip area does not grow as fast as the total power consumption and the produced heat is dissipated slower and slower. On the other hand, according to Fig. 6 and Fig. 9, the total power is consumed in a shorter time along with the number of cores. This fact directly contributes to the temperature growth along with the number of cores. However,
the recorded temperatures are under the DTM (dynamic thermal management) techniques “threshold”.
V. CONCLUSIONS
We enhanced the Sniper multicore simulator with thermal measurement possibilities using the HotSpot simulator. We presented a plugin that interacts with Sniper to retrieve simulation data and calls HotSpot to compute the thermal results. The plugin also builds a two dimensional floorplan for the simulated microarchitecture. Based on our preliminary results we observed that the computing performance can be increased by parallelizing our applications and increasing the number of cores. Along with the increasing of the cores number, the processing performance (IPC) increases, the core-level average power consumption gets lower, the energy consumption is slightly higher and the total power consumption of the chip ramps up together with the temperatures.
Further, we plan to integrate the simulation methodology presented here into an automatic design space exploration process using FADSE. We also plan to enhance the HotSpot plugin with a more accurate and detailed floorplan.
REFERENCES
[1] D. Fetis and P. Michaud, “An evaluation of HotSpot-3.0 block-based temperature model”, Proceedings of the Fifth Annual Workshop on Duplicating, Deconstructing, and Debunking. 2006.
[2] W. Huang, K. Sankaranarayanan, R. J. Ribando, M. R. Stan, and K. Skadron, “An Improved Block-Based Thermal Model in HotSpot-4.0 with Granularity Considerations”, Proceedings of the Workshop on Duplicating, Deconstructing, and Debunking, 2007.
[3] W. Huang, “HotSpot — A Chip and Package Compact Thermal
Modeling Methodology for VLSI Design”, PhD Thesis; Department of Electrical and Computer Engineering, University of Virginia, 2007.
[4] W. Heirman, T.E. Carlson, S. Sarkar, P. Ghysels, W. Vanroose, L. Eeckhout, “Using Fast and Accurate Simulation to Explore Hardware/Software Trade-offs in the Multi-Core Era”, International Conference on Parallel Computing, 2011.
[5] P. Michaud, Y. Sazeides, A. Seznec, T. Constantinou, and D. Fetis, “An
analytical model of temperature in microprocessors”, Technical Report PI-1760/RR-5744, IRISA/INRIA, 2005.
[6] Y. Li, B. Lee, D. Brooks, H. Zhigang, K. Skadron, “Impact of thermal constraints on multi-core architectures”, Thermal and Thermomechanical Phenomena in Electronics Systems, 2006.
[7] J. Donald, M. Martonosi, “Techniques for Multicore Thermal Management: Classification and New Exploration”, The 33rd International Symposium on Computer Architecture, 2006.
[8] L.S. Anand, “Nehalem - Everything You Need to Know about Intel's New Architecture” – available at the following address: http://www.anandtech.com/show/2594/2 (last accessed: 15.03.2014).
[9] “McPAT (Multicore Power, Area, and Timing)” – available at the following address: http://www.hpl.hp.com/research/mcpat/ (last accessed: 15.03.2014).
[10] http://en.wikipedia.org/wiki/Gainestown_(microprocessor)#Gainestown
[11] “Floorplanning tool” – available at the following address: http://lava.cs.virginia.edu/archfp/ (last accessed: 15.03.2014).
[12] [FreeFEM3D – available at the following address: http://www.freefem.org/ff3d/ (last accessed: 15.03.2014).
[13] H. Calborean, L. Vințan, “An Automatic Design Space Exploration Framework for Multicore Architecture Optimizations”, The 9th IEEE RoEduNet International Conference, pp. 202-207, Sibiu, 2010.
[14] L. Sheng, J.H. Ahn, R.D. Strong, J.B. Brockman, D.M. Tullsen, N.P. Jouppi, “McPAT: an integrated power, area, and timing modeling framework for multicore and manycore architectures”, The 42nd Annual IEEE/ACM International Symposium on Microarchitecture, 2009
36