Enhancing Operational Efficiency through Value Chain Analysis
18
Philippine Management Review 2014, Vol. 21, 69-86. Philippine Open Pit Copper Operations: Enhancing Operational Efficiency through Value Chain Analysis Jesus C. Cinco, Jr. * University of the Philippines Cebu College, Gorordo Avenue, Lahug Cebu City 6000 Analysis of a selected large-scale Philippine open pit copper operation’s value chain, specifically the grade control aspect, was undertaken to assess the potential of enhancing its operating efficiency. Over 5,200 copper assays from blast holes were processed to determine the average grade continuity along three dimensions. Results indicated that modification of the existing sampling pattern of blast holes can translate to enhanced operating efficiency without losing operating effectiveness. This modified pattern is expected to translate to a 73% reduction in total variable costs mainly attributed to lower sampling and analytical costs. A trade-off equivalent to an insignificant 5% average increase in grade variability expressed in semi-variance is anticipated with the modified sampling pattern. Potential savings of PHP5.1 to PHP8.1 million annually is possible for a 42,000 to 60,000-tonne per day operation at a 2.14 waste:ore ratio. These results provide an insight into the potential savings that may be generated if applied to large-scale Philippine metallic mining projects currently operating or under development. Furthermore, the gains in operating efficiency can translate to enhanced revenues for government. Keywords: value chain analysis, operations management, blast hole spacing optimization, semi- variogram, Philippine copper mines 1 Introduction MacFarlane (2001) defined Mineral Resource Management as an “integrated activity involving the application of sound management principles that maximize the value of the mineral asset in order to grow shareholder value” (p. 1069). One of its two main objectives was to enhance value through optimization of processes. Figure 1 provides a strategy map of how management’s intent to provide long-term shareholder value can be achieved through increased productivity and growth (Kaplan & Norton, 2004). Figure 1. Strategy Map (Kaplan & Norton, 2004) Long-term Shareholder Value Productivity Strategy Growth Strategy Improve Cost Structure Enhance Customer Value Expand Revenue Opportunities Increase Asset Utilization The management of firms usually focuses on enhancing effectiveness and increasing the execution efficiency of core processes in the organization in order to gain a competitive advantage over competitors. While this may be true in general, the mining industry is slightly different in the sense that players compete primarily against themselves rather than against their co-players in the domestic * Correspondence: [email protected]
-
Upload
khangminh22 -
Category
Documents
-
view
3 -
download
0
Transcript of Enhancing Operational Efficiency through Value Chain Analysis

Philippine Management Review 2014, Vol. 21, 69-86.
Philippine Open Pit Copper Operations: Enhancing Operational Efficiency through Value Chain Analysis
Jesus C. Cinco, Jr.* University of the Philippines Cebu College, Gorordo Avenue, Lahug Cebu City 6000
Analysis of a selected large-scale Philippine open pit copper operation’s value chain, specifically the grade control aspect, was undertaken to assess the potential of enhancing its operating efficiency. Over 5,200 copper assays from blast holes were processed to determine the average grade continuity along three dimensions. Results indicated that modification of the existing sampling pattern of blast holes can translate to enhanced operating efficiency without losing operating effectiveness. This modified pattern is expected to translate to a 73% reduction in total variable costs mainly attributed to lower sampling and analytical costs. A trade-off equivalent to an insignificant 5% average increase in grade variability expressed in semi-variance is anticipated with the modified sampling pattern. Potential savings of PHP5.1 to PHP8.1 million annually is possible for a 42,000 to 60,000-tonne per day operation at a 2.14 waste:ore ratio. These results provide an insight into the potential savings that may be generated if applied to large-scale Philippine metallic mining projects currently operating or under development. Furthermore, the gains in operating efficiency can translate to enhanced revenues for government. Keywords: value chain analysis, operations management, blast hole spacing optimization, semi-variogram, Philippine copper mines
1 Introduction
MacFarlane (2001) defined Mineral Resource Management as an “integrated activity involving the application of sound management principles that maximize the value of the mineral asset in order to grow shareholder value” (p. 1069). One of its two main objectives was to enhance value through optimization of processes. Figure 1 provides a strategy map of how management’s intent to provide long-term shareholder value can be achieved through increased productivity and growth (Kaplan & Norton, 2004).
Figure 1. Strategy Map (Kaplan & Norton, 2004)
Long-term
Shareholder Value
Productivity
StrategyGrowth
Strategy
Improve Cost
StructureEnhance Customer
Value
Expand Revenue
Opportunities
Increase Asset
Utilization
The management of firms usually focuses on enhancing effectiveness and increasing the execution efficiency of core processes in the organization in order to gain a competitive advantage over competitors. While this may be true in general, the mining industry is slightly different in the sense that players compete primarily against themselves rather than against their co-players in the domestic
* Correspondence: [email protected]

70 Philippine Open Pit Copper Operations: Enhancing Operational Efficiency through Value Chain Analysis
or international arena. Mining has been described as a “highly competitive business wherein the supplier (the mining company) has no ability to influence the price of its product (the mineral) and hence, must continually strive to reduce its cost” (International Mining and Exploration Committee, 1996, p. 7). Similarly, Laurence (2011) described mines as being “price takers not price makers and management could only control the cost-side of the business” (p. 281). In order to ensure its competitiveness and to sustain its operations, mining companies innovate to increase efficiency and invest annually in state-of-the-art technology in all key operational aspects from mineral exploration to environmental protection.
The metallic mining sector of the Philippine mining industry has been recognized as one of the world’s major suppliers of minerals. The country’s high geological prospectivity for minerals per unit area (National Statistics Coordinating Board, 2012) has also kept the Philippines consistently in the radar of foreign junior and major exploration/mining companies. This global investor interest has kept the Philippines in the top ten countries for mining investment with roughly US$17 billion invested in 2011 (Ericsson & Larsson, 2012). A disclosure by the Philippine Mines and Geosciences Bureau was quoted in a recent review (Global Business Report, 2013), which stated that the “archipelago contains more than $840 billion worth of untapped mineral wealth” (p. 64) and that the size of the mining sector in terms of the gross production value ($3 billion in 2011) is small in the context of the country’s large mineral potential, having been ranked 2nd in the world for gold and 3rd in copper resources (Arangkada Philippines, 2013).
The Mining Industry is also one of the Seven Big Winner Sectors identified by the Joint Foreign Chambers of Commerce in the Philippines (JFC) that need to be developed rapidly in order to create “$75 billion in new foreign investment, 10 million jobs and over one trillion pesos in revenue for the Philippine economy within this decade” (Arangkada Philippines, 2013, p. 1).
According to Monsod (2012), the metallic mining sector contributed an average of 0.91% to the country’s GDP from 2000 to 2009. In 2010, it contributed 1.3% to GDP. Furthermore, he added that the industry paid a total of PHP64.2 billion from 1997 to 2010 in taxes, fees and royalties, which represent about 7.6% of the total production value from the sector for the same period. In terms of the sector’s share to total employment, it averaged at 0.376% from 2000 to 2009 and increased to 0.5% in 2010. If the Philippine government is able to resolve the present legal and revenue-sharing issues confronting the industry, Finance Secretary Purisima expects that the industry “can contribute one to two percentage points to the Philippines’ economic growth” (Celis, 2013, p. 1).
2 Research Objectives
Considering today’s more conducive environment (i.e., in terms of availability of computer hardware and software and relatively better understanding of geostatistics in the local setting), the application of geostatistics to enhance the value chain of mine operations was revisited with the intent of identifying activities that will improve the profitability of an open pit mining operation without having to allocate significant capital expenditures. This paper focused on the following research objectives:
1. to identify the relevant activities of the value chain for the selected open pit mine sub-operation (i.e., grade control) and identify the key cost driver (s) based on the existing sampling pattern of blast holes
2. to optimize the existing sample spacing practice for blast holes in the selected open pit mine; 3. to assess the technical and economic impacts of any potential recommendations on the
existing operating effectiveness and efficiency of the selected mine considering its cost leadership strategy, and the strategic implications of the results on the Philippine metallic mining sector
Among the four operating copper mines in the Philippines, the study focused on Carmen Copper Corporation (CCC) since it is the current leader in the Philippine copper mining sub-sector. Results of this study are expected to translate to increased operating efficiencies for its existing and future open pit operations which can translate to sustained long-term growth in shareholder value. The improvement in operating efficiency is expected to be generated mainly from a reduction in unit

Jesus C. Cinco, Jr. 71
variable cost per metric ton of in-situ ore and waste material mined. Other improvements in efficiency resulting from better utilization of existing assets have not been considered.
Furthermore, fixed costs arising from the need to expand the capacity of its in-house assay laboratory to match the anticipated increase in output from the open pits are expected to be kept at practically the same level because of the potential reduction in the number of samples that may need to be analyzed daily to support the grade control requirements of the open pit mining operation. CCC is currently progressing towards increasing its capacity from 42,000 metric tons per day (MTPD) to 60,000 MTPD. Its strategic capacity plan (Atlas Cons. Mining & Dev. Corporation, 2011) is considering a further increase from 60,000 MTPD to 100,000 MTPD (see Appendix A).
For other players in the metallic mining sector, the results will hopefully encourage a review of existing sampling practices for mines that utilize blast hole samples for grade control purposes with the end view of sustaining shareholder value.
With an improved contribution margin and a minimal, if any, change in fixed costs resulting from capital investments related to expanding assaying and other related support facilities, mining operations could become more competitive in the context of fluctuating metal prices and other key external forces that can have an adverse impact on its profitability. Furthermore, increased competitiveness will translate to higher utilization of the country’s natural resources. Considering that the state is the owner of the mineral resources as provided for in the Regalian Doctrine (Republic of the Philippines, 1987), it presently receives excise taxes equivalent to at least 2% of the value of minerals sold on top of income and other taxes. Thus, any increase in the utilization of the available mineral resource would be beneficial to the state.
3 Theoretical Framework
This study adopted the Value Chain Analysis (VCA) as its main framework in identifying opportunities, both value-adding and non-value adding activities, to enhance effectiveness of the mine operations value chain. Furthermore, inasmuch as mining industry participants tend to focus on being a cost leader or a low-cost provider, they employ process optimization and kaizen/continuous improvement approaches, among others, to attain higher efficiency levels. Earlier mining-related studies in Northern Chile and West Africa employed an optimization approach using the Theory of Regionalized Variables by Matheron (1972) to improve financial returns.
3.1 Value Chain Analysis Framework Value Chain Analysis is a tool used in assessing the value-creating activities of an organization and
their interdependencies with the objective of identifying, analyzing and enhancing, if possible, the areas where the organization has sources of sustainable competitive advantage. VCA involves breaking up the organization into its primary and secondary activities in order to gain an understanding of the corresponding assets and costs attached to each of these value-creating activities and to determine if any of these activities is an existing, if not potential, source of competitive advantage (Porter, 1985; Thompson, Strickland, & Gamble, 2007). Primary activities are undertaken to essentially create value for the target market while secondary activities provide the necessary support to efficient execution of the different primary activities.
To allow analysis of the costs attached to each key activity, the activity is further subdivided into discrete activities with its corresponding cost components (i.e., labor, materials and supplies, services cost). Inasmuch as the output/costs of these sub-activities are linked to the succeeding sub-activities, especially in the case of the primary activities, this is likely to have an impact on the effectiveness and efficiency of implementing the succeeding sub-activity(ies). Thus, any intervention to improve the effectiveness and/or efficiency of a sub-activity is likely to translate to increased margins (Porter, 1985).
3.2 Generic Competitive Strategies Porter (1980) introduced three generic strategies to allow organizations to cope with the five
competitive forces that define an industry’s attractiveness in terms of profit potential, namely a) overall cost leadership, b) differentiation and c) focus.

72 Philippine Open Pit Copper Operations: Enhancing Operational Efficiency through Value Chain Analysis
Thompson et al. (2007), who expanded Porter’s typology by including a Best-Cost Provider Strategy that straddles the four quadrants, referred to Porter’s “Overall Cost Leadership” strategy as a “Low-Cost Provider Strategy”. For this specific strategy, Thompson identified two major approaches to achieve a cost advantage that will be difficult for rivals to duplicate, namely a) enhance efficiency of undertaking the value chain activities relative to the firm’s rivals, and b) reconfigure the value chain by assessing activities that the firm can discontinue without significantly affecting its effectiveness. The first approach includes initiatives to take advantage of economies of scale and economies of learning, increasing capacity utilization of major operating assets, increasing sales to spread out fixed costs, and others. The second approach includes removing intermediaries, the use of existing or new technology to reengineer processes, enhancing the efficiency of operations by “eliminating low-value added or unnecessary work steps and activities” (p. 140), relocating manufacturing facilities to allow key suppliers to be proximate to the plant, and others.
3.3 Kaizen “Kaizen” or continuous improvement is a Japanese philosophy that emphasizes the importance of
reassessing periodically all factors (e.g., raw materials, processes, equipment and human resources) related to the transformation of inputs into outputs so that the necessary interventions can be designed and implemented to attain better organizational effectiveness and/or efficiency. In relation to Thompson’s second approach to being a Low Cost Provider, continuous improvement can be applied to improving the efficiency of operations by eliminating unnecessary steps without having to allocate any capital expenditure. Using this approach to enhance efficiency may likely be more attractive to Low-Cost Provider focused firms whenever significant gains can be still be attained through process modification rather than undertaking a reengineering approach.
3.4 Theory of Regionalized Variables Matheron’s (1972) Theory of Regionalized Variables states that the incremental change between
values of a specific variable located within a relatively homogeneous region or domain can be modeled and that the estimation of points within the domain whose values are unknown is possible based on the modeling of these incremental changes.
As far as geologic applications is concerned, David (1977) pointed out that “grade values are much less continuous than most of the biological or ecological data considered by biometricians” (p. 91) and that “mines are truly three-dimensional bodies and samples are not “points” ” (p. 91), unlike those in forest studies. Furthermore, he highlights the fact that the value (i.e., grade, thickness, specific gravity) of equal-sized samples is a regionalized variable, however the function defining these variables is “usually highly variable and non-continuous and cannot be studied directly” (p. 92). To address this, the structural analysis focused on studying the incremental change plotted against distance.
David (1977) described the semi-variogram as a graphical tool that allows one to understand the spatial correlation between samples, located within a relatively homogeneous area referred to as a “domain”, that are “d” distance away from each other along a specific direction. Given that this spatial correlation analysis is done within a single domain, “the precision of an estimation procedure for a given geometrical pattern depends only on the pattern and not on the particular location in the homogeneous area” (p. 73). Furthermore, it quantifies the range of influence and direction of geological/mineralogical continuity and as such can be used to investigate and support geological interpretation. Mathematically, it is expressed as follows:
γ(h) =∑(Xi − Xi+h)
2
2n (1)
where h = lag between members of a sample pair Xi = grade of first member Xi+h = grade of the second member, and n = number of pairs

Jesus C. Cinco, Jr. 73
Similar optimization work involving the use of semi-variograms in investigating the spatial variability of the water table surface in Northwest Kansas was done in 1979 (Sophocleous, Paschetto, & Olea, 1982). This was undertaken to assess the effectiveness of the existing well network and to identify an appropriate well spacing to allow proper monitoring of the ground water level. Results indicated that the current spacing of wells, averaging 5.8 kilometers apart over a 12,950-square km area, could be increased to about 6.4 kilometers (regular network) without affecting adversely the accuracy of monitoring.
At the El Tesoro manto-type copper carbonate mine in northern Chile (Ortiz, Magri, & Libano, 2012), the use of geostatistics to improve financial returns through geostatistical simulation and the optimization of advance drilling grids was undertaken using Down-the-Hole (DTH) drilling equipment. Advance drilling refers to blast hole drilling to collect mine planning data in order to enhance short-term mine planning decisions. Simulation of advance drilling grids (i.e., 6 x 6 m, 8 x 8 m, 10 x 10 m 12 x 12 m, 14 x 14 m) revealed that the present “advance drilling grid of 8 x 8 m is appropriate” (Ortiz, Magri & Libano, 2012, p. 22) and that a reduction in sampling error could have a favorable impact of about US$5 million based on the current annual ore production rate of 10.5 MMT (~28,700 MTPD) over a four to five-year production period.
In Ashanti Goldfields Company’s Sansu Open Pit Gold Mines located in Ghana, geostatistics was applied to “optimize grade control ripline sampling” in three of its six open pit mines (Adofo, 1994, p. 1). Essentially, the geostatistical processing of gold values gathered from riplines or shallow narrow trenches confirmed that the existing 10-m by 2-m sampling interval was adequate for two of the three gold deposits. In the case of the third deposit, it was noted that there was no difference in precision between a 2-m sampling interval and a 1-m sampling interval. Thus, it was suggested that a 2-m sampling interval be adopted.
4 Methodology
This research involved the collection of data from blast holes (n ~ 5,200) drilled covering the period May 2008 to April 30, 2010. Furthermore, key informant discussions were conducted to gather operating and financial data associated with the selected primary activities in the open pit mine operations value chain (see Appendix B).
Appendix C shows the general location of blast holes relative to the known major geologic structures within the Lutopan open pit mine. About 1000 holes or 20% of the total blast holes was drilled on B150 (Elevation 150 m) while the least percentage was drilled on B285. At the time of this study, the bottom of the mine was at B75 or 75 meters above sea level.
Characterization of copper content was done by generating descriptive statistics categorized by elevation/bench. Assays ranging from 0.1%Cu up to 0.7%Cu were subsequently processed to characterize the average grade continuity and other characteristics of the copper mineralization using semi-variograms.
5 Results and Discussion
5.1 Metallic Mining Sector of the Philippine Mining Industry As of 2012, the Philippine metallic mining sector consists of 33 operating mines—four of which are
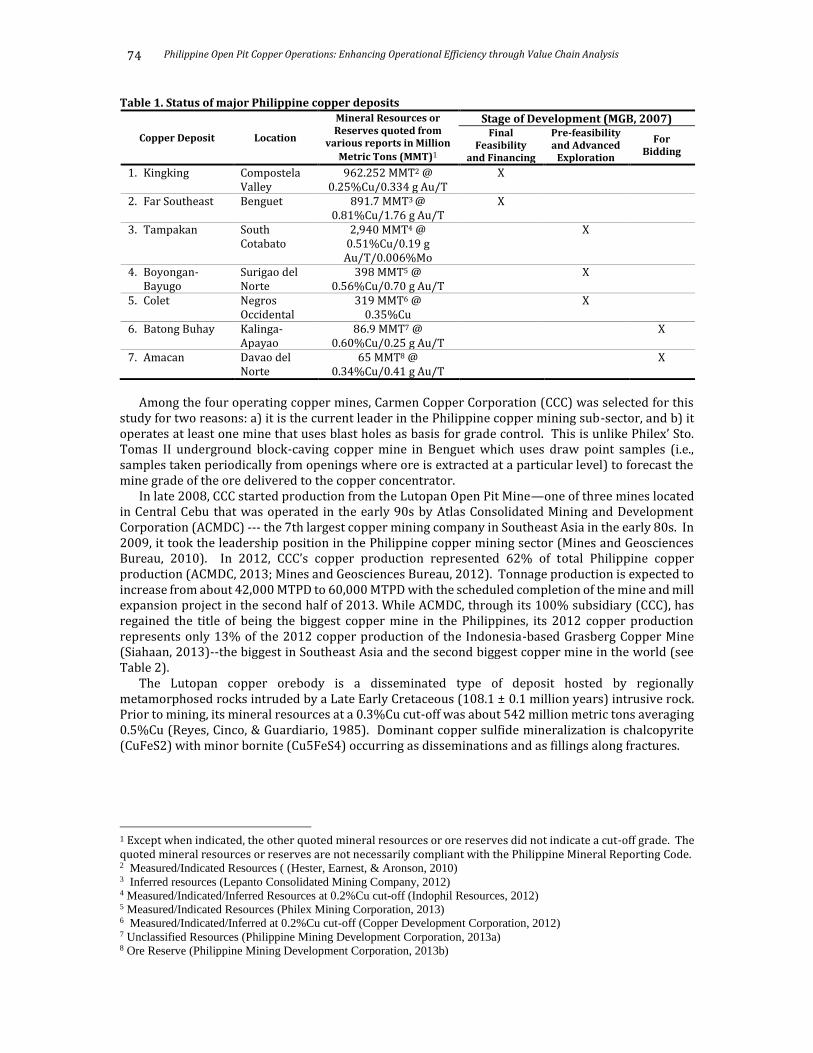
primary copper producers. Due to the geologic nature of most Philippine copper deposits (i.e., large low-grade disseminated mineralization) these are usually developed and operated using bulk-mining methods which involve the movement of very large volumes of rock with one mine currently moving about 130,000 MTPD. In terms of material movement (ore plus waste material) for a single open pit mine, the copper mining sub-sector stands out in the Philippine mining industry. In a presentation made by the Philippine DENR-Mines and Geosciences Bureau (2007), it identified major copper projects at various stages of development (see Table 1). Four of these seven deposits, including the world-class Tampakan deposit, are likely to be mined using the open pit method.
74 Philippine Open Pit Copper Operations: Enhancing Operational Efficiency through Value Chain Analysis
Table 1. Status of major Philippine copper deposits
Copper Deposit Location
Mineral Resources or Reserves quoted from
various reports in Million
Metric Tons (MMT)1
Stage of Development (MGB, 2007) Final
Feasibility and Financing
Pre-feasibility and Advanced
Exploration
For Bidding
1. Kingking Compostela Valley
962.252 MMT2 @ 0.25%Cu/0.334 g Au/T
X
2. Far Southeast Benguet 891.7 MMT3 @ 0.81%Cu/1.76 g Au/T
X
3. Tampakan South Cotabato
2,940 MMT4 @ 0.51%Cu/0.19 g
Au/T/0.006%Mo
X
4. Boyongan-Bayugo
Surigao del Norte
398 MMT5 @ 0.56%Cu/0.70 g Au/T
X
5. Colet Negros Occidental
319 MMT6 @ 0.35%Cu
X
6. Batong Buhay Kalinga-Apayao
86.9 MMT7 @ 0.60%Cu/0.25 g Au/T
X
7. Amacan Davao del Norte
65 MMT8 @ 0.34%Cu/0.41 g Au/T
X
Among the four operating copper mines, Carmen Copper Corporation (CCC) was selected for this study for two reasons: a) it is the current leader in the Philippine copper mining sub-sector, and b) it operates at least one mine that uses blast holes as basis for grade control. This is unlike Philex’ Sto. Tomas II underground block-caving copper mine in Benguet which uses draw point samples (i.e., samples taken periodically from openings where ore is extracted at a particular level) to forecast the mine grade of the ore delivered to the copper concentrator.
In late 2008, CCC started production from the Lutopan Open Pit Mine—one of three mines located in Central Cebu that was operated in the early 90s by Atlas Consolidated Mining and Development Corporation (ACMDC) --- the 7th largest copper mining company in Southeast Asia in the early 80s. In 2009, it took the leadership position in the Philippine copper mining sector (Mines and Geosciences Bureau, 2010). In 2012, CCC’s copper production represented 62% of total Philippine copper production (ACMDC, 2013; Mines and Geosciences Bureau, 2012). Tonnage production is expected to increase from about 42,000 MTPD to 60,000 MTPD with the scheduled completion of the mine and mill expansion project in the second half of 2013. While ACMDC, through its 100% subsidiary (CCC), has regained the title of being the biggest copper mine in the Philippines, its 2012 copper production represents only 13% of the 2012 copper production of the Indonesia-based Grasberg Copper Mine (Siahaan, 2013)--the biggest in Southeast Asia and the second biggest copper mine in the world (see Table 2).
The Lutopan copper orebody is a disseminated type of deposit hosted by regionally metamorphosed rocks intruded by a Late Early Cretaceous (108.1 ± 0.1 million years) intrusive rock. Prior to mining, its mineral resources at a 0.3%Cu cut-off was about 542 million metric tons averaging 0.5%Cu (Reyes, Cinco, & Guardiario, 1985). Dominant copper sulfide mineralization is chalcopyrite (CuFeS2) with minor bornite (Cu5FeS4) occurring as disseminations and as fillings along fractures.
1 Except when indicated, the other quoted mineral resources or ore reserves did not indicate a cut-off grade. The quoted mineral resources or reserves are not necessarily compliant with the Philippine Mineral Reporting Code. 2 Measured/Indicated Resources ( (Hester, Earnest, & Aronson, 2010) 3 Inferred resources (Lepanto Consolidated Mining Company, 2012) 4 Measured/Indicated/Inferred Resources at 0.2%Cu cut-off (Indophil Resources, 2012) 5 Measured/Indicated Resources (Philex Mining Corporation, 2013) 6 Measured/Indicated/Inferred at 0.2%Cu cut-off (Copper Development Corporation, 2012) 7 Unclassified Resources (Philippine Mining Development Corporation, 2013a) 8 Ore Reserve (Philippine Mining Development Corporation, 2013b)

Jesus C. Cinco, Jr. 75
Table 2. Philippine copper production (2009 - 2012)
Company Name of Deposit Kilotonnes Copper Produced
CAGR 2012 2011 2010 2009
Carmen Copper Corporation Lutopan/Carmen, Cebu 40.8 32.2 27.2 18.3 31%
Philex Mining Corporation Sto. Nino II, Benguet 10.1 17.2 16.2 15.3 -13%
Oceana Gold Philippines Inc. Didipio, Nueva Vizcaya 0.2 - - -
TVI Resource Development Canatuan, Zamboanga del Norte 6.8 7.6 9.0 9.4 -10%
Rapu-Rapu Processing Inc. Rapu-Rapu, Albay 7.8 6.8 6.0 6.2 8%
Total Philippine Cu Production 65.7 63.8 58.3 49.3 10%
Freeport-McMoran Grasberg, Indonesia 315.2 383.7 554.3 640.5 -21%
CCC Cu Production relative to Total Philippine Cu Production 62% 50% 47% 37%
CCC Cu Production relative to Grasberg Cu Production 13% 8% 5% 3%
Total Philippine Cu Production relative to Grasberg Cu Production 21% 17% 11% 8%
5.2 CCC—Its Business Strategy Given the global nature of the industry and its inherent characteristics, CCC has adopted mainly
cost leadership as a business strategy to sustain profitability throughout its anticipated mine life. Figure 2 highlights CCC’s four strategic initiatives to reduce its cash cost from $2.47/lb in 2011 to $1.50/lb by 2014 to increase profitability and reduce the adverse impact of any medium to long-term decline in copper prices.
Figure 2. Cash cost reduction strategy (ACMDC, 2013)
Ca
sh
Co
st o
f $
2.4
7/lb
Ca
sh
Co
st o
f U
S$
1.5
0/lb
Cash Cost Reduction Strategy
2011
$2/lb
$1/lb
By-Product
CreditsScale
Copper
Grade
Optimizing
Costs 2014· Institute a culture of cost
consciousness
· Secured a power supply
contract with favorable
costing options
· High copper
grade at Carmen
orebody
· Mill expansion
from 40 KTPD to
60 KTPD
· Gold, silver, pyrite,
molybdenum and
magnetite
extraction
Appendix D shows the fluctuation of copper prices in the past five years—swinging from a low of US$1.30 per pound of copper in late 2008 to a high of about US$4.50/pound in the first quarter of 2011. Ever since the copper price peaked in the first quarter of 2011, a declining trend has apparently set in with US$3.02/lb as the lowest price recorded as of 22 October 2013 (Infomine, 2013). With the Chinese economy (main global consumer of copper) experiencing weakness in nine of the past 10 quarters, coupled with a projected 2 million MT increase in copper supply from mines by 2015 (equivalent to three times the existing copper inventory monitored by the London Metal Exchange) (Troszkiewicz, 2013), the recovery of copper prices to 2011 levels is unlikely in the medium term.

76 Philippine Open Pit Copper Operations: Enhancing Operational Efficiency through Value Chain Analysis
5.3 CCC Operations Processes Overview and Existing Blast Hole Sampling Practice
Appendix E provides an overview of the processes involved in mining operations (excludes the milling operation). It starts with the discovery of a mineral deposit and the subsequent generation of a computerized mineral resource block model—a key output of the Geology Department. The Geology Department’s output becomes a key input to the Mine Engineering Department which is tasked to evaluate the resource model’s technical and economic feasibility and to develop if feasible the corresponding strategic, tactical and operating plans. Given the multi-dimensionality of mining, it is imperative to integrate the various disciplines in order to attain an optimum solution. Thus, the execution, monitoring and control of the operating plan require effective coordination among several disciplines like geology, mine survey, assay, metallurgy, and grade control.
Inasmuch as most of CCC’s employees are former ACMDC employees, most of the processes in its open pit mining operations, particularly those involved in grade/”quality” control, have been retained as these have been tried and tested during the Atlas days. Essentially, grade control is done by analyzing representative samples taken from all blast holes drilled in an offset pattern.
To attain proper fragmentation of the ore from the open pit mine operation, CCC’s Drilling and Blasting Department drills rows of 18-m deep vertical blast holes using an offset pattern. The upper 15-m section is sampled while the lower 3-m section is referred to as “sub-grade” and is usually not sampled. Hole spacing between columns is six meters while spacing between rows is five meters (see Figure 3). A typical mineral resource block (30 m x 30 m x 15 m) contains 30 blast holes (circles and stars) given this blast hole spacing pattern. At a specific gravity of 2.67, a resource block would represent 36,045 dry metric tons (DMT) of mineralized material or a tonnage factor of about 1,201 DMT per blast hole.
Figure 3. Idealized offset blast hole pattern for a 30 x 30 x 15-m resource block
30
m
Row 1
Row 2
Row 3
Row 4
Row 5
5 m
Row 6
30 m
6 m
Co
l A
Co
l B
Co
l C
Co
l D
Co
l E
Co
l F
Co
l G
Co
l H
Co
l I
Co
l J
At the current ore schedule of 42,000 MTPD with a corresponding waste:ore ratio of 2.14 (includes only the in-situ waste), approximately 110 blast holes will have to be sampled daily based on the computed tonnage factor per blast hole. At the planned expanded rate of 60,000 MTPD of ore, about 157 blast holes will have to be sampled.
Thus, the existing density of sampling used by the Grade Control Section to delineate ore/waste boundaries for production control has become a function of the density of blast holes. In essence, the approach to sampling is based on maximizing the number of samples available from blast holes rather than adopting an optimized approach to sampling.
5.4 Results of the Optimization Experiment
5.4.1 Descriptive Statistics of Blast Hole Assays Figure 4 summarizes the distribution of copper values derived from all blast holes. The median
copper content is lowest at B285 and gradually increases until it peaks at B105. The boxplot highlights

Jesus C. Cinco, Jr. 77
the bench-by-bench variability in copper grades and the presence of what may be considered as outliers/extreme values for all benches except for Bench 75.
Figure 4. Box-and-Whiskers plot of all copper assays by bench (n=5,189)
5.4.2 Variability and Continuity of Copper Mineralization An average semi-variogram was generated based on a compass direction/tolerance of 0°±90° and
a dip/tolerance angle of 0°±90°. A separation distance between samples (lag) of 6 m ± 3 m was adopted to determine continuity over a horizontal distance equivalent to 21 lag increments. Based on the omnidirectional experimental semi-variogram (see Figure 5), the nugget effect or the variability at zero distance between samples was estimated to be 0.0048 gammas or ±0.069%Cu. Furthermore, the range or the maximum distance between samples that showed continuity was determined to be 95 meters. In effect, samples that are spatially apart by more than 95 meters are not statistically correlated or do not have any influence over the other.
Figure 5. Omni-directional semi-variogram of all copper assays

78 Philippine Open Pit Copper Operations: Enhancing Operational Efficiency through Value Chain Analysis
5.5 Value Chain and Relative Change in Total Variable Cost In this study, the mine operations value chain was reviewed with particular emphasis on the
sampling of blast holes for grade control purposes. As Porter (1985) pointed out, each organization’s activities and the manner by which it performs
these activities is somehow influenced by “its history, its strategy, its approach to implementing its strategy, and the underlying economics of the activities themselves” (p. 36). At CCC, a significant proportion of its existing operating practices and processes in the primary and secondary activities of its value chain have some semblance of, if not adopted 100%, ACMDC’s practices considering that CCC has re-employed a significant number of former ACMDC personnel in key management positions. In addition, the several boom/bust price cycles that ACMDC has been through during its almost 40-year operating history has validated the adoption by CCC of cost leadership as its dominant business strategy. Given the context of volatile metal prices, fluctuations in the local currency relative to the US dollar, increased energy costs, increased environmental awareness, increased level activism of stakeholders towards the mining industry, climate change, and difficulty in financing projects (Deloitte Touche Tohmatsu, 2009), mining companies in general have had to adopt cost leadership as a dominant strategy to sustain their operations. This is notwithstanding the fact that the Philippine mining industry today faces a more demanding legal and fiscal framework where the Philippine government is considering a 10% share of the gross revenue and a 50/50 share of the net income (Mayuga, 2013), resource nationalism, presence of substitutes, and the less than 1% success rate of converting exploration projects into a commercial operation. To attain the lowest cost per pound of copper produced, this will require continuous assessment of the effectiveness and efficiency of existing key activities and the implementation of either incremental improvement (kaizen) or a radical innovation approach or ”kakushin” (Watanabe, Steward, & Raman, 2008) to enhance these key activities.
Figure 6 shows the activities for a sub-operation, specifically grade control, of the Mine Operations value chain indicating the expected changes in total variable costs relative to existing practice. Horizontally-disposed segments with arrows on both ends indicate that no significant change is expected while downward pointing arrows indicate the expectation of a significant reduction in total variable costs.
Among the eight activities, three are expected to contribute to reducing total variable cost if a procedural change involving a widening of the existing distances between samples is implemented. Among the three, the key activity responsible for a significant proportion of the total cost reduction is the sample preparation (i.e. drying, crushing, pulverization) and the subsequent in-house laboratory analysis for copper using Atomic Absorption Spectrometry.
Figure 6. Expected relative changes in Total Variable Cost
NA
Selected Activities in the Value Chain
Sample
blast
hole
cuttings
Deliver
samples
to Assay
Lab
Prepare
and
analyze
copper
content
Prepare
and
analyze
copper
content
Retrieve
assay
results
Encode
results on
grade
control
maps
Define ore
and waste
composites
Resource
monitoring
and
reconciliation
Delineate
ore/waste
stakes in
the field
Expected Change in Total Variable Cost relative to Existing Practice
Labor
Materials
Services
CCC’s unit cost of sample preparation and laboratory analysis is PHP281 and PHP78, respectively. Thus, total cost per sample is PHP359. Inasmuch as the intent is to reduce the number of holes to be sampled and analyzed, what will be considered is the variable cost component for the two aforementioned activities. Figures 7 and 8 depict the fixed and the variable cost components for

Jesus C. Cinco, Jr. 79
sample preparation and laboratory analysis, respectively. Of the total sample preparation cost, about 41% is variable. In the case of analytical cost, roughly 70% is variable.
Figure 7. Sample preparation cost - Mine samples
Figure 8. AAS analytical cost - Mine samples
5.6 Cost/Semi-Variance Trade-off To evaluate the likely performance of the proposed sampling alternative and its operational trade-
off, the expected cost reduction was reviewed vis-à-vis the increase in the semi-variance. Figure 9 depicts clearly that the total variable cost line related to the activity identified to be mainly responsible for the cost reduction (i.e., sampling and analysis cost) drastically changes in slope (negative slope) with increasing sampling distance (from ~6m to ~12 m) between holes. In contrast, the semi-variance or the variability of copper content for samples spaced “h” meters apart shows a gently sloping line (positive slope) over the same distance range.
In effect, the modification in the sampling pattern (from 30 to 8 holes for each 30 x 30 x 15 m resource block) is expected to translate to a significant reduction in the total variable cost per resource block with minimal increase in the average semi-variance between samples at a particular lag distance.

80 Philippine Open Pit Copper Operations: Enhancing Operational Efficiency through Value Chain Analysis
Figure 9. Trade-off between sampling/analytical cost per resource block and its semi-variance
6 Conclusion
Results of this study indicate that the activity in the grade control sub-operation that has the most potential for enhancing efficiency involves the laboratory preparation and analysis of the samples. Representative samples taken by the grade control crew from blast holes (the number of which is a function of the total ore and waste material mined) are delivered daily to the in-house laboratory for mechanized sample preparation and analyzed subsequently using Atomic Absorption Spectrometry (AAS). Essentially, a higher number of samples prepared and analyzed by the assay laboratory will translate to higher total variable costs. Costs incurred by the laboratory to service the grade control function will subsequently be charged to the cost of mining operations, thereby increasing total operating costs.
Reduction of total variable operating costs can be expected if a modified offset sampling pattern of blast holes is adopted (see Figure 10) vis-à-vis the current offset spacing of blast holes without having a significant adverse impact on grade control effectiveness. The existing offset blast hole drilling pattern will be retained because the blast hole drilling design is primarily a function of the need to produce the appropriate fragmentation for subsequent handling and processing.
Figure 10. Recommended offset sampling pattern for blast holes (dark gray circles, even-numbered rows deleted)
30
m
Row 1
Row 2
Row 3
Row 4
Row 5
5 m
Row 6
30 m
6 m
Co
l A
Co
l B
Co
l C
Co
l D
Co
l E
Co
l F
Co
l G
Co
l H
Co
l I
Co
l J
11.7
m
12 m

Jesus C. Cinco, Jr. 81
This modified sample spacing pattern will translate to a 73% reduction in the number of blast holes to be sampled and transported by the Grade Control crew to the in-house assay laboratory where it has to be subsequently prepared and analyzed. Compared to Figure 3, only eight out of the possible 30 holes for each resource block would be necessary for grade control purposes (i.e., effective delineation of ore/waste boundaries and computation of the average copper grade for ore composites).
At a 42,000-MTPD ore production and a life-of-mine waste:ore ratio of 2.14 (includes only in-situ waste), the reduction in blast hole samples (from 110 to 30) is estimated to reduce sample preparation/analysis costs by 73% or about PHP5.07 million annually. At a 60,000-MTPD ore production, potential maximum savings of about PHP8.13 million is estimated. This does not include other potential savings from two other activities in the value chain (see Figure 6), the additional cost of labor to support an additional shift to conduct sample preparation and the unquantified twin benefits of timely availability and better quality of assay results.
The variability of the values between holes spaced about 12 m apart will increase from 0.0056 gammas (0.075%Cu) to 0.0063 gammas (0.079%Cu) as estimated from the modeled omnidirectional experimental semi-variogram. This 5.3% increase is considered negligible in the context of the financial benefit presented.
7 Recommendations
7.1 Technical Related The modified offset blast hole sampling pattern for the remaining life of the Lutopan Orebody is
recommended for adoption in consonance with CCC’s cost leadership strategy. This will support CCC’s Cash Cost Reduction Strategy’s (see Figure 2) objective, specifically through cost optimization, to reduce its cash costs from US$2.47 per pound of copper to US$1.50/lb of copper (roughly coincident with the price trough in the late 2008) by 2014. While the omni-directional semi-variogram shows a relatively constant slope in variability over lag distance from 6 to 30 m, decreasing the sampling density further (or increasing the distance between blast hole samples) or beyond the recommended spacing is expected to result in a significant loss in grade control effectiveness (i.e., ineffective delineation of the ore/waste boundaries or fences).
A similar study is recommended at CCC’s Carmen Orebody which is located about two kilometers northeast of the Lutopan Orebody. In 2012, the Carmen Pit started ore deliveries to the Carmen Concentrator. By early 2014, the Carmen Pit will become the major source of copper ore as mining at Lutopan Pit tapers off (Atlas Cons. Mining & Dev. Corporation, 2013). Inasmuch as the sampling pattern modification is dependent on the continuity of copper mineralization, the Carmen Orebody’s geology will need to be considered in the study.
Additional work that considers the use of both kriging efficiency and the slope of regression (Coombes, 2008) as bases for optimizing further the sample spacing pattern is recommended.
7.2 Project Management Related Firstly, phased implementation is recommended to allow CCC’s sampling personnel to cope with
the change in operating procedures. Also, actual results should be monitored in terms of grade control effectiveness (i.e., proper definition of ore/waste boundaries and the average grade for ore composites). This will allow the development of a more responsive SOP given the realities in the field. Lastly, actual savings should be compared to estimated savings. This will enhance estimation of potential savings if a similar study is conducted.
7.3 Industry Related The application of this optimization approach, coupled with the suggested geostatistical
enhancement, is recommended to reduce cash operating costs in the Philippine metallic mining sector. Specifically, it will apply to open pit mines as well as future underground mines that may utilize a similar extraction methodology (i.e., blast hole open stoping in large deep underground mines). In the context of the Regalian Doctrine, any improvement in the competitiveness of large-scale metallic

82 Philippine Open Pit Copper Operations: Enhancing Operational Efficiency through Value Chain Analysis
mines, not only copper mines, will benefit the country in terms of a) increased utilization of its natural resources, b) increased income taxes, as well as c) an increase in mine life which will translate to better sustainability and/or growth of jobs generated directly or indirectly by the industry. The potential industry savings that may be generated to enhance the competitiveness of Philippine metallic mines can be appreciated in the context of the size of the identified major copper mines that may be put into operation in the near future.
Acknowledgments
This study was made possible by a research grant from the University of the Philippines Visayas, the grant of a research load credit by UP Cebu and the cooperation of Carmen Copper Corporation (CCC). In particular, I wish to thank Mr. Rodrigo C. Cal, VP - Resident Manager of CCC, for permission to publish this study and the warm technical assistance and cooperation extended by site personnel to the author during the site visits.
References
Adofo, R. A. (1994, September 27). A geostatistical approach to the optimization of grade control sampling at Sansu mines. Obuasi, Ghana. doi:123456789/3329
Arangkada Philippines. (2013). Mining. Retrieved from Arangkada Philippines: http://www.investphilippines.info/arangkada/seven-winners/mining/
Atlas Cons. Mining & Dev. Corporation. (2011, April 6). Investor Centre. Retrieved from http://www.atlasphilippines.com
Atlas Cons. Mining & Dev. Corporation. (2013, March). Investor Presentation. Retrieved from http://www.atlasphilippines.com
Celis, A. (2013, January 22). Mining can lift growth by 2 percentage points. Malaya Business Insight. Retrieved from http://www.philippineminingclub.com/news/january-22nd-mining-can-lift-growth-by-2-percentage-points
Coombes, J. (2008). The art and science of resource estimation: A practical guide for geologists and engineers. Perth: Coombes Capability.
Copper Development Corporation. (2012, April). Company update. David, M. (1977). Geostatistical ore reserve estimation. Amsterdam: Elsevier Scientific Publishing
Company. Deloitte Touche Tohmatsu. (2009). Tracking the trends 2010: A look at 10 of the top issues mining
companies will face. Canada: Deloitte Touche Tohmatsu. Retrieved from http://www.deloitte.com/energy
DENR-Mines and Geosciences Bureau. (2007). Philippine mining development projects profile. [Powerpoint]. Quezon City: Department of Environment and Natural Resources.
Ericsson, M., & Larsson, V. (2012). E & MJ's annual survey of global mining investment. Engineering & Mining Journal, 24-29.
Global Business Report. (2013). The Philippines: An overview. Engineering & Mining Journal, 64-74. Retrieved from http://gbreports.com/admin/reports/Philippines_Mining_2013.pdf
Hester, M. G., Earnest, D. F., & Aronson, J. G. (2010, October 12). King-king copper-gold project, Mindanao, Philippines. Retrieved from http://www.sedar.com
Indophil Resources. (2012). Projects. Retrieved from http://www.indophil.com/projects/tampakan/resources-reserves
Infomine. (2013). Mining intelligence and technology. Retrieved from http://www.infomine.com/investmentmine/metal-prices/copper/5-year/
International Mining and Exploration Committee. (1996). The Philippine mining industry: An international perspective. Metro Manila: International Mining and Exploration Committee.
Kaplan, R. S., & Norton, D. P. (2004). Strategy maps--Converting intangible assets into tangible outcomes. Boston: Harvard Business School Publishing Corporation.

Jesus C. Cinco, Jr. 83
Laurence, D. (2011). Establishing a sustainable mining operation: An overview. Journal of Cleaner Production, 19(2-3), 278-284. Retrieved from http://www.sciencedirect.com/science/article/pii/S0959652610003471
Lepanto Consolidated Mining Company. (2012). Corporate disclosure. Retrieved from Lepanto Consolidated Mining Company: http://www.lepantomining.com/docs/2012/12-09-13%20Update%20on%20the%20FSE%20Project.pdf
Macfarlane, A. S. (2001). Mineral resource management and economic value added. Geological Society of South Africa, 1069-1098.
Matheron, G. (1972). The theory of regionalized variables. Cahiers du Centre Morphologie Mathematique de Fontainebleau, 5.
Mayuga, J. L. (2013, July 29). Government eyeing 50/50 sharing scheme in mining revenues, says DENR's Paje. Business Mirror. Retrieved from http://www.investphilippines.info/arangkada/government-eyeing-5050-sharing-scheme-in-mining-revenues-says-denrs-paje/
Mines and Geosciences Bureau. (2010, February 19). Statistics-Philippine copper production. Retrieved from Philippine Mining Almanac: http://www.philippinemining.imaginet.com.ph
Mines and Geosciences Bureau. (2012). Statistics-Metallic production. Retrieved from http://198.57.185.212
Monsod, C. (2012, March 3). Mining--A social justice issue. ABS-CBN News web site Retrieved from: http://www.abs-cbnnews.com/-depth/03/03/12/christian-monsod-mining-socia...
National Statistics Coordinating Board. (2012). Philippine economic-environmental and natural resources accounting. Retrieved rom National Statistics Coordinating Board: http://www.nscb.gov.ph/peenra/results/mineral/
Ortiz, J. M., Magri, E. J., & Libano, R. (2012). Improving financial returns from mining through geostatistical simulation and the optimized advance drilling grid at El Tesoro Copper Mine. Journal of the South African Institute of Mining and Metallurgy. Retrieved from http://www.scielo.org.za/pdf/jsaim/v112n1/v112n1a07.pdf
Philex Mining Corporation. (2013). About Us: Projects. Retrieved from Philex Mining Corporation web site: http://www.philexmining.com.ph/about-us/our-projects/silangan
Philippine Mining Development Corporation. (2013a). Projects. Retrieved from Philippine Mining Development Corporation web site: http://www.pmdc.com.ph/projects-batongbuhay.htm
Philippine Mining Development Corporation. (2013b). Projects. Retrieved from Philippine Mining Development Corporation web site: http://www.pmdc.com.ph/projects-ndmc.htm
Porter, M. (1985). Competitive advantage: Creating and sustaining superior performance. New York: The Free Press.
Porter, M. E. (1980). Competitive strategy. New York: Free Press. Republic of the Philippines. (1987). The 1987 Constitution of the Republic of the Philippines-Article XII.
Retrieved from http://www.gov.ph/the-philippine-constitutions/the-1987-constitution-of-the-republic-of-the-philippines/the-1987-constitution-of-the-republic-of-the-philippines-article-xii/
Reyes, A. N., Cinco, J. C., & Guardiario, J. D. (1985). Geology of the Atlas Copper District, Cebu, Philippines. Asian Mining '85. Manila: The Institution of Mining and Metallurgy.
Siahaan, T. S. (2013, January 25). Freeport suffers decline in gold-copper output from Grasberg Mine. The Jakarta Globe.
Sophocleous, M., Paschetto, J. E., & Olea, R. A. (1982). Groundwater network design for northwest Kansas, using the theory of regionalized variables. Ground Water, 48-58.
Thompson, A. A., Strickland, A. J., & Gamble, J. E. (2007). Crafting & executing strategy: The quest for competitive advantage (15th ed.). New York: McGraw-Hill/Irwin.
Troszkiewicz, A. (2013, July 19). Copper declines on concern demand will slow as economies falter. Bloomberg. Retrieved from http://www.bloomberg.com/news/2013-07-19
Watanabe, K., Steward, T. A., & Raman, A. P. (2008). Lessons from Toyota's long drive: A conversation with Katsuaki Watanabe. Harvard Business Review on Manufacturing Excellence at Toyota. Boston: Harvard Business School Publishing Corporation.

84 Philippine Open Pit Copper Operations: Enhancing Operational Efficiency through Value Chain Analysis
Appendix A
CCC's strategic capacity plan (Modified from ACMDC, 2011)
42 Ktpd
60 Ktpd
3rd
Quarter
2013
80 Ktpd
100 Ktpd
Today
Carmen Copper Corporation
Expansion Plan Under Study and
Projected Number of Mine Samples
based on a Life-of-Mine W:O of 2.14
110 samples
157 samples
209samples
261samples
Appendix B
Value chain - Grade control at CCC's open pit mining operation
Marg
in
Prim
ary
Activitie
sS
eco
nd
ary
Activitie
s
General Administration
Human Resources Management
Product R&D, Technology and Systems
Development
Marg
in
Op
era
tio
ns
Su
pp
ly C
ha
in
Ma
na
ge
me
nt
Dis
trib
utio
n
Sa
les &
Ma
rke
tin
g
Se
rvic
e
Op
en
Pit
Op
era
tio
ns
Sample
blast hole
cuttings
Deliver
samples to
Assay Lab
Prepare
and analyze
copper
content
Retrieve
assay
results
Encode
results on
grade control
map
Define ore
and waste
composites
Delineate
ore/waste
stakes in the
field
Resource
monitoring
and
reconciliation
Gra
de
Co
ntr
ol
Co
nce
ntr
ato
r
Op
era
tio
ns

Jesus C. Cinco, Jr. 85
Appendix C
Spatial distribution of blast hole assays
Appendix D
Price per pound of copper from January 2008 to October 2013 (Infomine, 2013)

86 Philippine Open Pit Copper Operations: Enhancing Operational Efficiency through Value Chain Analysis
Appendix E
Processes and departments involved in CCC's mining operation (excludes milling)
Process Manager
Mine Eng’g
Department
Geologic Mapping
Updating/Monitoring
Mine Survey
Updating/Monitoring Assay Lab
Quality Assurance and
Control
Metallurgical Lab
Process Control
Grade Control
Quality Control and
Monitoring
Planning Extraction
Mineral Resource
Model
Mine Planning
Operational
Tactical
Strategic
Geology
Department
Mine Operations
Execution
Monitoring
Control
Mine
Department