Enhanced PDR-BLE Compensation Mechanism Based on ...
31
sensors Article Enhanced PDR-BLE Compensation Mechanism Based on HMM and AWCLA for Improving Indoor Localization Harun Jamil 1 , Faiza Qayyum 2 , Faisal Jamil 2 and Do-Hyeun Kim 2, * Citation: Jamil, H.; Qayyum, F.; Jamil, F.; Kim, D.-H. Enhanced PDR-BLE Compensation Mechanism Based on HMM and AWCLA for Improving Indoor Localization. Sensors 2021, 21, 6972. https:// doi.org/10.3390/s21216972 Academic Editor: Joanna Kolodziej Received: 3 September 2021 Accepted: 5 October 2021 Published: 21 October 2021 Publisher’s Note: MDPI stays neutral with regard to jurisdictional claims in published maps and institutional affil- iations. Copyright: © 2021 by the authors. Licensee MDPI, Basel, Switzerland. This article is an open access article distributed under the terms and conditions of the Creative Commons Attribution (CC BY) license (https:// creativecommons.org/licenses/by/ 4.0/). 1 Department of Electronics Engineering, Jeju National University, Jejusi 63243, Korea; [email protected] 2 Department of Computer Engineering, Jeju National University, Jejusi 63243, Korea; [email protected] (F.Q.); [email protected] (F.J.) * Correspondence: [email protected] Abstract: This paper presents an enhanced PDR-BLE compensation mechanism for improving indoor localization, which is considerably resilient against variant uncertainties. The proposed method of ePDR-BLE compensation mechanism (EPBCM) takes advantage of the non-requirement of linearization of the system around its current state in an unscented Kalman filter (UKF) and Kalman filter (KF) in smoothing of received signal strength indicator (RSSI) values. In this paper, a fusion of conflicting information and the activity detection approach of an object in an indoor environment contemplates varying magnitude of accelerometer values based on the hidden Markov model (HMM). On the estimated orientation, the proposed approach remunerates the inadvertent body acceleration and magnetic distortion sensor data. Moreover, EPBCM can precisely calculate the velocity and position by reducing the position drift, which gives rise to a fault in zero-velocity and heading error. The developed EPBCM localization algorithm using Bluetooth low energy beacons (BLE) was applied and analyzed in an indoor environment. The experiments conducted in an indoor scenario shows the results of various activities performed by the object and achieves better orientation estimation, zero velocity measurements, and high position accuracy than other methods in the literature . Keywords: ePDR-BLE compensation mechanism (EPBCM); unscented Kalman filter (UKF); Kalman filter (KF); received signal strength indicator (RSSI); hidden Markov model (HMM); Bluetooth low energy (BLE) 1. Introduction Indoor location-based services (LBS) have always been of great importance because people live and work in indoor environments most of their lives. Massive wireless networks are built according to the IEEE 802.11 wireless Ethernet standard [1]. LBS are the backbone of indoor mobile positioning techniques [2]. Global navigation satellite systems (GNSS) and global positioning systems (GPS) have helped us provide accurate location services for outdoor environments. Still, these services are impeded by signal absorption and hamper in specific environments (e.g., dense forests, mountainous regions, underground facilities, and high-rise buildings) [3]. GNSS and GPS take the user’s three-dimensional information (i.e., longitude, altitude, and latitude) [4]. The accuracy of these services depends upon the line of sight, and if the precision is good, object detection is possible within meters. Therefore, to come up with an overall location service, a number of technologies have emerged for indoor positioning; for instance, radio frequency identification (RFI) [5], pseudo-satellites [6], indoor ultrasonic positioning (UIP) [7], indoor positioning approach using iBeacon [8], ultra-wideband (UWB) technology allows micro-positioning of objects along with obstacles [9], and indoor positioning based on ZigBee [10]. A large variety of reconfigured wireless devices (RWD) are already in use, namely Bluetooth low energy (BLE) beacons, smartphones, Wi-Fi, ultra-wideband (UWB) bea- cons, and digital cameras for indoor positioning [11,12]. For purpose-built installations, Sensors 2021, 21, 6972. https://doi.org/10.3390/s21216972 https://www.mdpi.com/journal/sensors
-
Upload
khangminh22 -
Category
Documents
-
view
0 -
download
0
Transcript of Enhanced PDR-BLE Compensation Mechanism Based on ...
sensors
Article
Enhanced PDR-BLE Compensation Mechanism Based on HMMand AWCLA for Improving Indoor Localization
Harun Jamil 1, Faiza Qayyum 2, Faisal Jamil 2 and Do-Hyeun Kim 2,*
�����������������
Citation: Jamil, H.; Qayyum, F.;
Jamil, F.; Kim, D.-H. Enhanced
PDR-BLE Compensation Mechanism
Based on HMM and AWCLA for
Improving Indoor Localization.
Sensors 2021, 21, 6972. https://
doi.org/10.3390/s21216972
Academic Editor: Joanna Kolodziej
Received: 3 September 2021
Accepted: 5 October 2021
Published: 21 October 2021
Publisher’s Note: MDPI stays neutral
with regard to jurisdictional claims in
published maps and institutional affil-
iations.
Copyright: © 2021 by the authors.
Licensee MDPI, Basel, Switzerland.
This article is an open access article
distributed under the terms and
conditions of the Creative Commons
Attribution (CC BY) license (https://
creativecommons.org/licenses/by/
4.0/).
1 Department of Electronics Engineering, Jeju National University, Jejusi 63243, Korea;[email protected]
2 Department of Computer Engineering, Jeju National University, Jejusi 63243, Korea;[email protected] (F.Q.); [email protected] (F.J.)
* Correspondence: [email protected]
Abstract: This paper presents an enhanced PDR-BLE compensation mechanism for improvingindoor localization, which is considerably resilient against variant uncertainties. The proposedmethod of ePDR-BLE compensation mechanism (EPBCM) takes advantage of the non-requirement oflinearization of the system around its current state in an unscented Kalman filter (UKF) and Kalmanfilter (KF) in smoothing of received signal strength indicator (RSSI) values. In this paper, a fusion ofconflicting information and the activity detection approach of an object in an indoor environmentcontemplates varying magnitude of accelerometer values based on the hidden Markov model (HMM).On the estimated orientation, the proposed approach remunerates the inadvertent body accelerationand magnetic distortion sensor data. Moreover, EPBCM can precisely calculate the velocity andposition by reducing the position drift, which gives rise to a fault in zero-velocity and heading error.The developed EPBCM localization algorithm using Bluetooth low energy beacons (BLE) was appliedand analyzed in an indoor environment. The experiments conducted in an indoor scenario showsthe results of various activities performed by the object and achieves better orientation estimation,zero velocity measurements, and high position accuracy than other methods in the literature .
Keywords: ePDR-BLE compensation mechanism (EPBCM); unscented Kalman filter (UKF); Kalmanfilter (KF); received signal strength indicator (RSSI); hidden Markov model (HMM); Bluetooth lowenergy (BLE)
1. Introduction
Indoor location-based services (LBS) have always been of great importance becausepeople live and work in indoor environments most of their lives. Massive wireless networksare built according to the IEEE 802.11 wireless Ethernet standard [1]. LBS are the backboneof indoor mobile positioning techniques [2]. Global navigation satellite systems (GNSS)and global positioning systems (GPS) have helped us provide accurate location services foroutdoor environments. Still, these services are impeded by signal absorption and hamperin specific environments (e.g., dense forests, mountainous regions, underground facilities,and high-rise buildings) [3]. GNSS and GPS take the user’s three-dimensional information(i.e., longitude, altitude, and latitude) [4]. The accuracy of these services depends uponthe line of sight, and if the precision is good, object detection is possible within meters.Therefore, to come up with an overall location service, a number of technologies haveemerged for indoor positioning; for instance, radio frequency identification (RFI) [5],pseudo-satellites [6], indoor ultrasonic positioning (UIP) [7], indoor positioning approachusing iBeacon [8], ultra-wideband (UWB) technology allows micro-positioning of objectsalong with obstacles [9], and indoor positioning based on ZigBee [10].
A large variety of reconfigured wireless devices (RWD) are already in use, namelyBluetooth low energy (BLE) beacons, smartphones, Wi-Fi, ultra-wideband (UWB) bea-cons, and digital cameras for indoor positioning [11,12]. For purpose-built installations,
Sensors 2021, 21, 6972. https://doi.org/10.3390/s21216972 https://www.mdpi.com/journal/sensors
Sensors 2021, 21, 6972 2 of 31
these RWDs are placed strategically throughout a defined space. IPS uses different lo-calization mechanisms, including the position estimation of tagging devices from nearbyanchor nodes, such as BLE, UWB, and Wi-Fi access points (AP) with known fixed positions.Weighted centroid localization (WCL) [13], distance vector hop (DV-Hop) localization [14],trilateration-based localization, context-recognition aided-based PDR localization [15],and fingerprinting-based localization techniques are also used [16]. In recent years, re-searchers have focused on related technologies and methods that provide high precisionpositioning services.
Pedestrian dead reckoning (PDR) is an independent approach, and its primary prin-ciple is to calculate the step length, determine walking direction, and step size by usinginertial sensors (IS) (i.e., accelerometer, gyroscope, and geomagnetic meter) to calculate themoving target information and positions [17]. Bluetooth low energy beacon is pulled in forindoor localization technology because of low energy communication via the Bluetoothbeacons and broadcasting low-energy Bluetooth signals in a given range. BLE beaconssend out an ID number via BLE channels triggering a specific action relevant to the loca-tion approximately ten times every second [18]. The distance between BLE beacons andsmartphones was computed based on the received signal strength indicator (RSSI) values.To estimate the position, we used the centroid localization algorithm (CLA) and weightedcentroid localization algorithm (WCLA) proposed by [17–19], which uses the BLE beaconcoordinations to estimate the position of the smartphone. The position accuracy usingCLA is very low in WCLA when using weight to improve position accuracy. In AWCLA,location accuracy is increased, but still, the error accuracy is high. Different filters wereused to get the precise output, e.g., complementary filter, low-pass filter, Butterworth filter,Kalman filter, extended Kalman filter, unscented Kalman filter, alpha–beta filter, Gaussianfilter, etc. These filters are used in the literature as data fusion filters, responsible for re-moving noise from sensor values and producing an estimate of the system’s state by takingthe average of the new measurement and the system’s predicted state using a weightedaverage. Furthermore, different machine learning-based models were also developedto estimate the position in an indoor environment. Still, due to the massive amount ofsensing data, these systems cannot provide a real-time position estimation because of highcomputational requirements. Due to advanced and sophisticated machine learning tech-niques, it is therefore required to estimate the real-time position of an object in an indoorenvironment by using a lightweight, intelligent solution. Machine learning techniqueshave been utilized in many fields, such as healthcare, finance, irony detection, citationclassification, effective waste management, energy consumption forecasting, boreholesdata analysis, groundwater resource planning, and education, to name of a few [20–25].
In this study, EPBCM was developed to track the position of an object in an indoorenvironment. Quaternions and their conversion to Euler angles are explained. Smartphone-based inertial measurement unit (IMU) sensors were used for the data collection. A com-plementary filter was used to integrate the information of pitch, roll, and angular velocityto obtain orientation tracking. The state vector used for the estimation of orientation inUKF contains the prior gyros bias errors and Euler angle errors. The HMM-based activitydetection approach was developed to recognize the various activities (running, walking,writing on a whiteboard, working on the computer, walking upstairs) performed by thesmartphone user. The state transitions probability matrix and observation probabilitymatrix were calculated based on the changing magnitudes of the accelerometer values.The compensation mechanism increases the position accuracy by reducing the drift error.KF was used for smoothing RSSI measurements obtained from the BLE beacon. The av-erage weighted centroid localization algorithm (AWCLA) was used for the proximitycalculation between the smartphone and fixed BLE beacon position. Various performanceanalyses were used to evaluate the significance of the proposed EPBCM based on HMMand AWCLA, such as clustering of raw data to know about the activities performed, com-parison of position accuracy of PDR, BLE, and EPBCM, indoor localization visualizationusing IMU sensor data, and orientation estimation based on AHRS and UKF.
Sensors 2021, 21, 6972 3 of 31
The notable contributions of the proposed study is as follows:
• Developed mechanism based on complementary filter to integrate roll, pitch, andangular velocity information to obtain orientation tracking information.
• Developed HMM-based activity detection approach to recognize the various per-formed activities.
• Smoothing of RSSI measurements by passing through the Kalman filter to removenoise and enhance the accuracy of distance calculation between the beacon and mobilephone user.
• Weight assignment based on the power of RSSI measurements and use of AWCLA forthe proximity calculation between the BLE beacon and smartphone.
• Furthermore, different evaluation metrics were utilized to evaluate the effectivenessof the proposed EPBCM based on HMM and AWCLA, such as a comparison, in termsof position accuracy, confirmation of activity detection by clustering the sensor datato visualize the performed activities and compare with HMM-based activity detectionapproach, and comparison of the orientation estimation approach based on AHRSand UKF.
The rest of the paper is divided into the following sections. Section 2 presents therelated works; Section 3 presents enhanced PDR-BLE compensation mechanism based onHMM and AWCLA for Improving indoor localization. Section 4 presents Compensationmechanism based on AWCLA. Section 6 discusses experimental design, implementationenvironment, comparison of proposed system with state-of-the-art-techniques, and perfor-mance analysis. Section 7 concludes the paper with possible future directions.
2. Related Work
The internet of things is an evolving field, attracting much attention from the researchcommunity [26–43]. The systems pertaining to location tracking and intelligent navigationare widely employed to handle specific scenarios related to security, logistic medicine,and mission-critical indoors. Indoor Localization is deemed one of the quintessentialareas among all of them because of excessive location-based services [44]. Therefore,indoor positioning is a popular topic that is gaining popularity. It is a network of devicesused to locate objects or people where global navigation satellite system (GNSS) andglobal positioning system (GPS) technologies lack exactness or are completely unsuccessful,particularly parking garages, underground locations, multistory buildings, railway stations,and airports. The dependency of multiple computing concepts on positionings, such aslocation and context-aware systems and ubiquitous computing, shows how important theindoor positioning systems (IPS) hold [45]. To find the accurate location where the GPSsignal is lost, radio-frequency signals have been developed. When compared to the classicBluetooth, Bluetooth low energy beacons are low in cost, low in energy consumption,and small in size [18]. Distance computation between beacons and smartphones can bedone by using BLE beacons. To determine a single point in a two-dimensional space,a minimum of three beacons are required if considering the trilateration scenario [46].Indirect distance computation involves the measurement of RSSI values.
A microelectromechanical systems (MEMS) are used to offer beacon-free solutions,consisting of a gyrometer, an accelerometer, and magnetometer. Due to the lightweight,smaller size, and lower cost of MEMS, sensors are often employed for the PDR system. Con-ventionally, the indirect estimation of walking speed and walking direction is conductedby using the PDR approach [47]. PDR can only obtain relative positioning results, has highposition accuracy, and cumulative errors. However, PDR is a self-confined approach, butwill produce a growing drift as the walking distance increases [48]. To reduce the errors,bias, and bias instability that accumulate through the navigation equation at the outputof MEMS sensors can be contained by attaching inertial measurement sensors (IMU) onfoot and other body parts to recognize particular activities and by using the zero-velocityupdate (ZVU) algorithm to predict the position [49,50]. The velocity and the accelerationintegral of the foot are practically zero when the stance phase occurs during the motion of

Sensors 2021, 21, 6972 4 of 31
the pedestrian [51]. Therefore, an error in the foot orientation increases the position’s errorto grow linearly with time. Similarly, the calculation of the non-gravitational acceleration isaffected by the attitude errors. If the orientation and attitude errors are not tackled rightly,the combined result induces a worse position estimation. The erroneous step increasedposition error. Therefore, a low false detection rate, in estimating each step’s start andend is conducive to improve accuracy. In [52], for precise human body part orientationtracking, the author reviewed the filtering techniques and main sensor fusion. The authorin [53] deals with the nonlinear attitude prediction system and linearization of the currentlyestimated points of the model in the PDR system by using the extended Kalman filter (EKF).For attitude estimation, the author in [54] proposed the hidden Markov model (HMM)based EKF. To enhance the results of the roll, pitch, and yaw for orientation tracking,the author developed a double-stage Kalman filter (KF) in [55]. In attitude estimation ofPDR, when the nonlinear characteristic is extreme, for instance, environmental magneticvariation, variation in acceleration based on human motion, the attitude dynamics, etc.,causes divergence of the EKF and degrades the accuracy. To enhance the performance ofPDR by using a sophisticated ZVU algorithm in [56], the author achieved ∼4% distanceerror by incorporating the two outputs of the maximum bounds at the stance phase byimplementing a binary decision-making rule. The study in [57] shows that the authorknows the sensor data, based on sensor knowledge, examines the acceleration-magnitudedetector, acceleration-moving variance detector, and the angular rate energy detector.The paper shows that all detectors can be derived by using the general likelihood ratiotest (LRT) framework. To accurately distinguish stance phases, the author in [57] proposeda clustering algorithm. In [58,59], the authors suggest that HMM chains classify humanactivities, and [60] show that there are more computational costs for the hierarchicallystructured approaches. The author in [61] used a smartphone-based IMU sensor for activityrecognition to facilitate the people who had chronic neurodegenerative diseases, such asAlzheimer’s.
To identify and track objects automatically, various technologies related to indoorpositioning include Wi-Fi, ultra wide band (UWB), radio frequency identification (RFID),and BLE. To achieve better positioning accuracy and to reduce the positioning system costbased on RFID, the authors in [62] presented a hyperbolic positioning algorithm and in [63]convert paths that are non-line of sight (NLOS) to the paths which are line of sight (LOS) byemploying a hybrid method based angel of arrival (AOA) and phase difference of arrival(PDOA). Positioning using BLE beacons in an indoor environment, the author suggesteda hybrid method, combining dead reckoning and trilateration [64]. In [65], the authorssuggested KF, to smooth the RSSI measurements obtained from the installed BLE beaconsand developed an android application to locate a user inside a building. There were highcomputational and processing times in the UWB-PDR-based localization algorithm. Dueto the increased numbers of anchors in the localization algorithm, the system cost alsoincreased [66]. In [67], WCL and fingerprint techniques are used for indoor localizationbased on the least square method. Improvements are being made in the WCL localizationalgorithm by [68]. However, the estimated error is still significantly high.
To predict and measure the motion of the body based on IMU wearable devices, manymachine learning algorithms are used. To reduce the error in an indoor environment,a deep neural network fingerprinting based indoor positioning approach is used [69].In [70], the author used inertial sensor data to detect step length and step detection byusing ANN and RNN. In another paper, the author used the feed-forward NN approach toget the location at the output [71]. Similarly, in [72], based on RSS measurements of Wi-Fiaccess point nodes, the author suggested a radial basis function to find the location of auser. As mentioned above in Table 1, the critical analysis of indoor localization based onthe BLE-beacon, PDR machine learning algorithms, and the combined hybrid approachhas many drawbacks in system performance and accuracy. To predict and identify theobject or location, these approaches directly use sensor data as an input to the machine
Sensors 2021, 21, 6972 5 of 31
learning algorithm. The drifting error and bias in sensor readings affect the accuracy of theposition estimation.
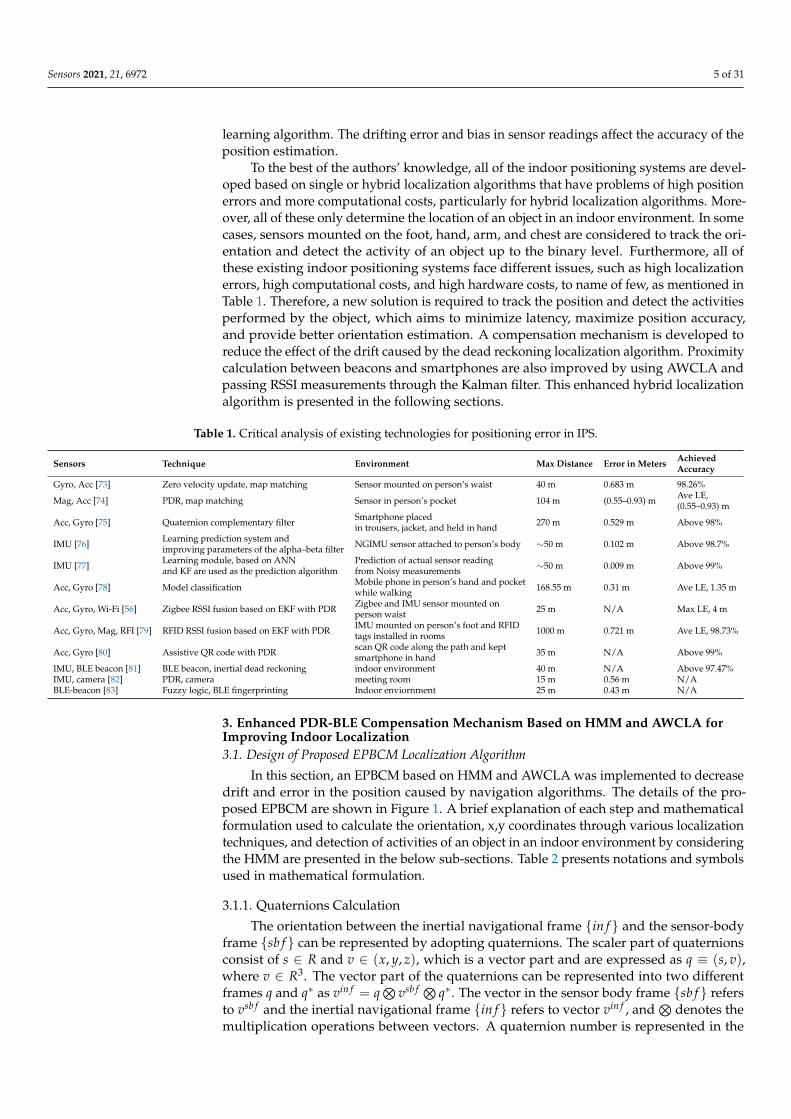
To the best of the authors’ knowledge, all of the indoor positioning systems are devel-oped based on single or hybrid localization algorithms that have problems of high positionerrors and more computational costs, particularly for hybrid localization algorithms. More-over, all of these only determine the location of an object in an indoor environment. In somecases, sensors mounted on the foot, hand, arm, and chest are considered to track the ori-entation and detect the activity of an object up to the binary level. Furthermore, all ofthese existing indoor positioning systems face different issues, such as high localizationerrors, high computational costs, and high hardware costs, to name of few, as mentioned inTable 1. Therefore, a new solution is required to track the position and detect the activitiesperformed by the object, which aims to minimize latency, maximize position accuracy,and provide better orientation estimation. A compensation mechanism is developed toreduce the effect of the drift caused by the dead reckoning localization algorithm. Proximitycalculation between beacons and smartphones are also improved by using AWCLA andpassing RSSI measurements through the Kalman filter. This enhanced hybrid localizationalgorithm is presented in the following sections.
Table 1. Critical analysis of existing technologies for positioning error in IPS.
Sensors Technique Environment Max Distance Error in Meters AchievedAccuracy
Gyro, Acc [73] Zero velocity update, map matching Sensor mounted on person’s waist 40 m 0.683 m 98.26%
Mag, Acc [74] PDR, map matching Sensor in person’s pocket 104 m (0.55–0.93) m Ave LE,(0.55–0.93) m
Acc, Gyro [75] Quaternion complementary filter Smartphone placedin trousers, jacket, and held in hand 270 m 0.529 m Above 98%
IMU [76] Learning prediction system andimproving parameters of the alpha–beta filter NGIMU sensor attached to person’s body ∼50 m 0.102 m Above 98.7%
IMU [77] Learning module, based on ANNand KF are used as the prediction algorithm
Prediction of actual sensor readingfrom Noisy measurements ∼50 m 0.009 m Above 99%
Acc, Gyro [78] Model classification Mobile phone in person’s hand and pocketwhile walking 168.55 m 0.31 m Ave LE, 1.35 m
Acc, Gyro, Wi-Fi [56] Zigbee RSSI fusion based on EKF with PDR Zigbee and IMU sensor mounted onperson waist 25 m N/A Max LE, 4 m
Acc, Gyro, Mag, RFI [79] RFID RSSI fusion based on EKF with PDR IMU mounted on person’s foot and RFIDtags installed in rooms 1000 m 0.721 m Ave LE, 98.73%
Acc, Gyro [80] Assistive QR code with PDR scan QR code along the path and keptsmartphone in hand 35 m N/A Above 99%
IMU, BLE beacon [81] BLE beacon, inertial dead reckoning indoor environment 40 m N/A Above 97.47%IMU, camera [82] PDR, camera meeting room 15 m 0.56 m N/ABLE-beacon [83] Fuzzy logic, BLE fingerprinting Indoor enviornment 25 m 0.43 m N/A
3. Enhanced PDR-BLE Compensation Mechanism Based on HMM and AWCLA forImproving Indoor Localization3.1. Design of Proposed EPBCM Localization Algorithm
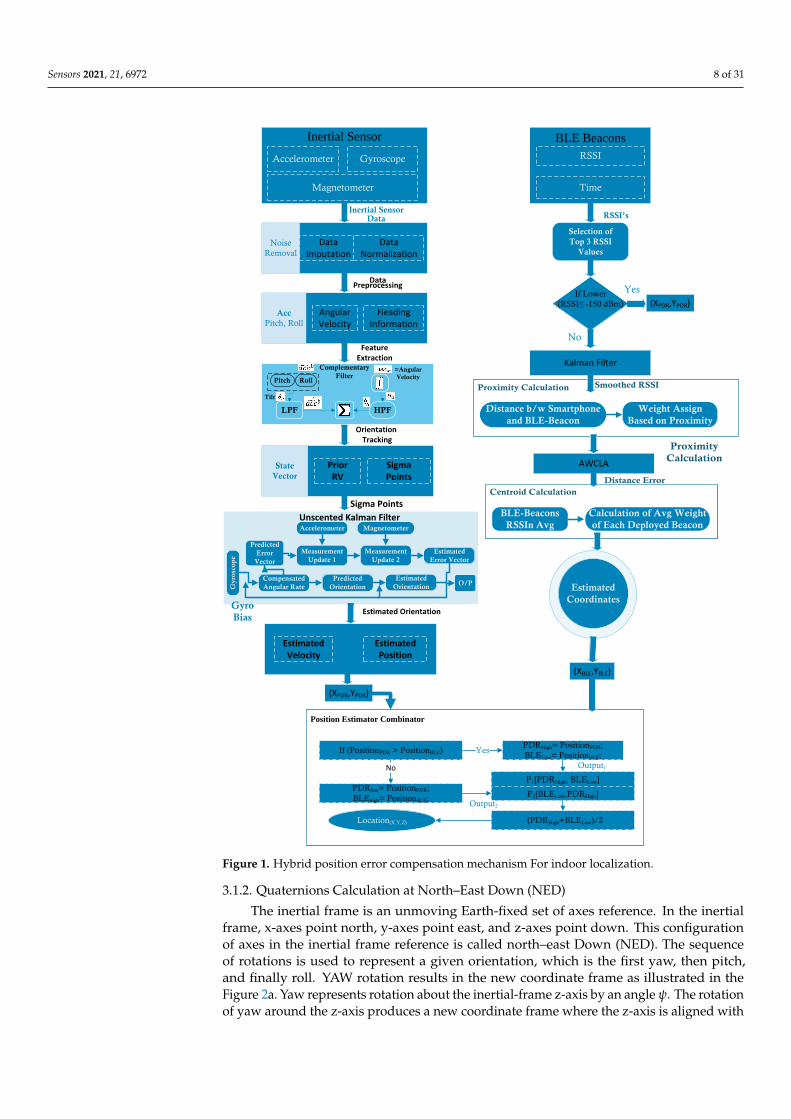
In this section, an EPBCM based on HMM and AWCLA was implemented to decreasedrift and error in the position caused by navigation algorithms. The details of the pro-posed EPBCM are shown in Figure 1. A brief explanation of each step and mathematicalformulation used to calculate the orientation, x,y coordinates through various localizationtechniques, and detection of activities of an object in an indoor environment by consideringthe HMM are presented in the below sub-sections. Table 2 presents notations and symbolsused in mathematical formulation.
3.1.1. Quaternions Calculation
The orientation between the inertial navigational frame {in f } and the sensor-bodyframe {sb f } can be represented by adopting quaternions. The scaler part of quaternionsconsist of s ∈ R and v ∈ (x, y, z), which is a vector part and are expressed as q ≡ (s, v),where v ∈ R3. The vector part of the quaternions can be represented into two differentframes q and q∗ as vin f = q
⊗vsb f ⊗ q∗. The vector in the sensor body frame {sb f } refers
to vsb f and the inertial navigational frame {in f } refers to vector vin f , and⊗
denotes themultiplication operations between vectors. A quaternion number is represented in the
Sensors 2021, 21, 6972 6 of 31
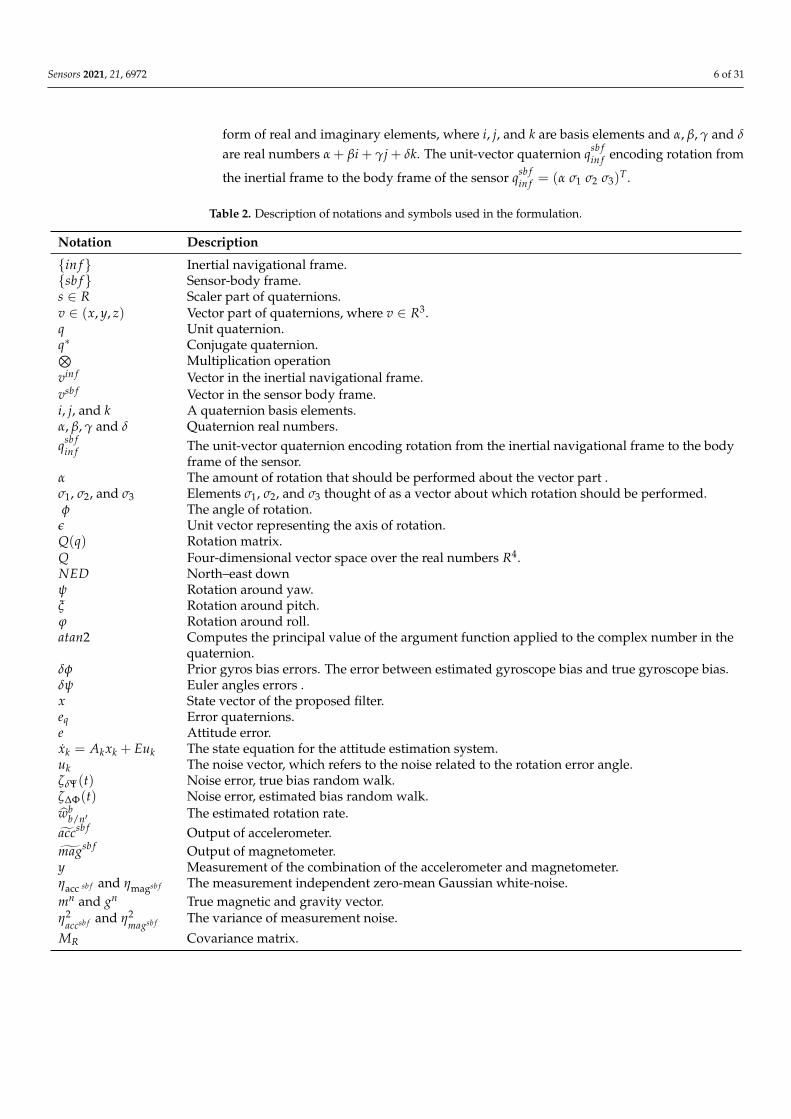
form of real and imaginary elements, where i, j, and k are basis elements and α, β, γ and δ
are real numbers α + βi + γj + δk. The unit-vector quaternion qsb fin f encoding rotation from
the inertial frame to the body frame of the sensor qsb fin f = (α σ1 σ2 σ3)
T .
Table 2. Description of notations and symbols used in the formulation.
Notation Description
{in f } Inertial navigational frame.{sb f } Sensor-body frame.s ∈ R Scaler part of quaternions.v ∈ (x, y, z) Vector part of quaternions, where v ∈ R3.q Unit quaternion.q∗ Conjugate quaternion.⊗
Multiplication operationvin f Vector in the inertial navigational frame.vsb f Vector in the sensor body frame.i, j, and k A quaternion basis elements.α, β, γ and δ Quaternion real numbers.qsb f
in f The unit-vector quaternion encoding rotation from the inertial navigational frame to the bodyframe of the sensor.
α The amount of rotation that should be performed about the vector part .σ1, σ2, and σ3 Elements σ1, σ2, and σ3 thought of as a vector about which rotation should be performed.φ The angle of rotation.
ε Unit vector representing the axis of rotation.Q(q) Rotation matrix.Q Four-dimensional vector space over the real numbers R4.NED North–east downψ Rotation around yaw.ξ Rotation around pitch.ϕ Rotation around roll.atan2 Computes the principal value of the argument function applied to the complex number in the
quaternion.δφ Prior gyros bias errors. The error between estimated gyroscope bias and true gyroscope bias.δψ Euler angles errors .x State vector of the proposed filter.eq Error quaternions.e Attitude error.xk = Akxk + Euk The state equation for the attitude estimation system.uk The noise vector, which refers to the noise related to the rotation error angle.ζδΨ(t) Noise error, true bias random walk.ζ∆Φ(t) Noise error, estimated bias random walk.wb
b/n′ The estimated rotation rate.accsb f Output of accelerometer.magsb f Output of magnetometer.y Measurement of the combination of the accelerometer and magnetometer.ηacc sb f and ηmagsb f The measurement independent zero-mean Gaussian white-noise.mn and gn True magnetic and gravity vector.η2
accsb f and η2magsb f The variance of measurement noise.
MR Covariance matrix.
Sensors 2021, 21, 6972 7 of 31
Table 2. Cont.
Notation Description
h(q) Represents the nonlinear equations that convert the magnetometer reference vector rmag ∈ R3
and accelerometer reference vector racc ∈ R3 from INF to the SBF.ρ Sigma points.λ Represents the scaling parameter that shows the sigma points spread around the column vectors
of the covariance matrix.Kprior
xj The prior estimates of covariance.ρ’ Posterior sigma points.Wm
i and W ji Used to calculate the mean and covariance of the posterior sigma points.
µ Determines the spread of the ρ around xpriork and β accentuate the weighting on the zeroth ρ.
(y) Residual error.D(.) Distribution constructed by the kernel density estimate.wO,t (.) Weight assigned to each activity performed in the various dedicated zones Zi.
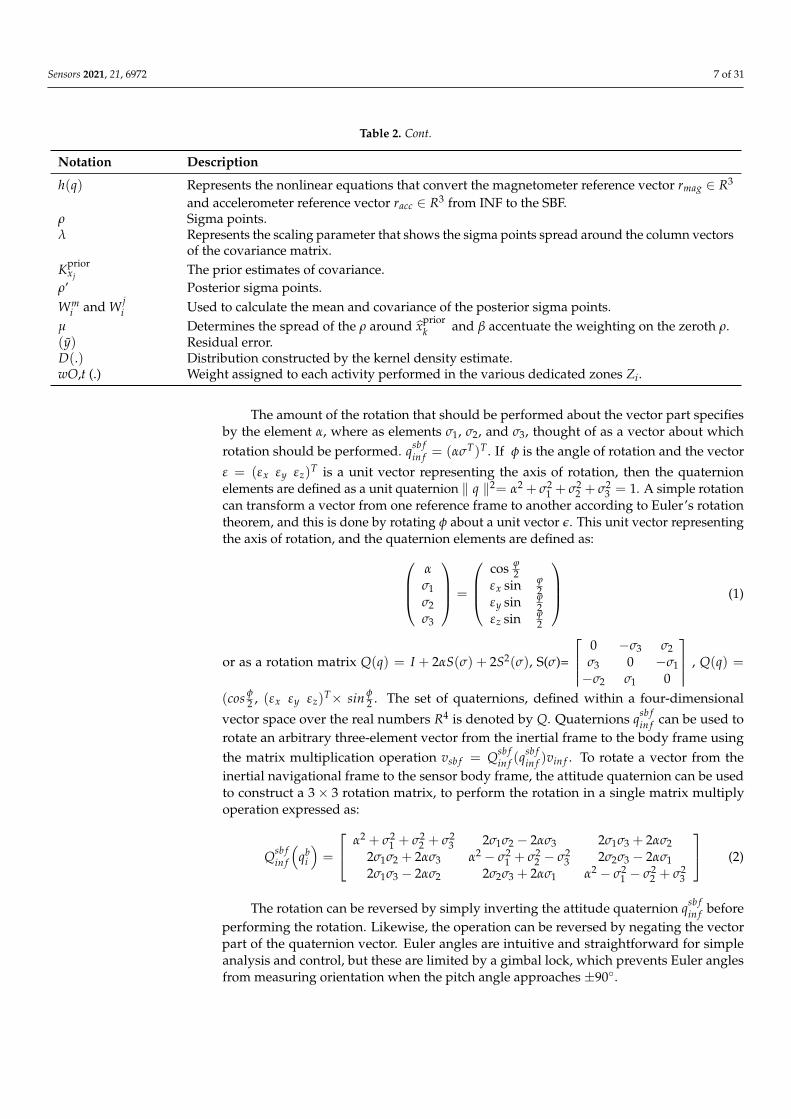
The amount of the rotation that should be performed about the vector part specifiesby the element α, where as elements σ1, σ2, and σ3, thought of as a vector about whichrotation should be performed. qsb f
in f = (ασT)T . If φ is the angle of rotation and the vector
ε = (εx εy εz)T is a unit vector representing the axis of rotation, then the quaternionelements are defined as a unit quaternion ‖ q ‖2= α2 + σ2
1 + σ22 + σ2
3 = 1. A simple rotationcan transform a vector from one reference frame to another according to Euler’s rotationtheorem, and this is done by rotating φ about a unit vector ε. This unit vector representingthe axis of rotation, and the quaternion elements are defined as:
ασ1σ2σ3
=
cos ϕ
2εx sin ϕ
2εy sin ϕ
2εz sin ϕ
2
(1)
or as a rotation matrix Q(q) = I + 2αS(σ) + 2S2(σ), S(σ)=
0 −σ3 σ2σ3 0 −σ1−σ2 σ1 0
, Q(q) =
(cos φ2 , (εx εy εz)T× sin φ
2 . The set of quaternions, defined within a four-dimensional
vector space over the real numbers R4 is denoted by Q. Quaternions qsb fin f can be used to
rotate an arbitrary three-element vector from the inertial frame to the body frame usingthe matrix multiplication operation vsb f = Qsb f
in f (qsb fin f )vin f . To rotate a vector from the
inertial navigational frame to the sensor body frame, the attitude quaternion can be usedto construct a 3× 3 rotation matrix, to perform the rotation in a single matrix multiplyoperation expressed as:
Qsb fin f
(qb
i
)=
α2 + σ21 + σ2
2 + σ23 2σ1σ2 − 2ασ3 2σ1σ3 + 2ασ2
2σ1σ2 + 2ασ3 α2 − σ21 + σ2
2 − σ23 2σ2σ3 − 2ασ1
2σ1σ3 − 2ασ2 2σ2σ3 + 2ασ1 α2 − σ21 − σ2
2 + σ23
(2)
The rotation can be reversed by simply inverting the attitude quaternion qsb fin f before
performing the rotation. Likewise, the operation can be reversed by negating the vectorpart of the quaternion vector. Euler angles are intuitive and straightforward for simpleanalysis and control, but these are limited by a gimbal lock, which prevents Euler anglesfrom measuring orientation when the pitch angle approaches ±90◦.
Sensors 2021, 21, 6972 8 of 31
Position Estimator Combinator Position Estimator Combinator
Inertial Sensor
Accelerometer Gyroscope
Magnetometer
Inertial Sensor Data
Noise
Removal
DataImputation
DataNormalization
Data Preprocessing
Acc
Pitch, Roll
AngularVelocity
HeadingInformation
Feature Extraction
HPF
Complementary
Filter=Angular
VelocityPitch Roll
LPF
Tilt ( )
Orientation Tracking
State
Vector
PriorRV
SigmaPoints
Sigma Points
Estimated Orientation
Unscented Kalman Filter
Predicted
Error
Vector
Measurement
Update 1
Accelerometer
Measurement
Update 2
Magnetometer
Estimated
Error Vector
Compensated
Angular Rate
Predicted
Orientation
Estimated
OrientationGyro
sco
pe
O/P
Estimated Velocity
Estimated Position
(XPDR,YPDR)
BLE Beacons
RSSI
Time
Selection of
Top 3 RSSI
Values
RSSI’s
If Lower
(RSSI≤ -150 dBm) (XPDR,YPDR)
Yes
No
Kalman Filter
AWCLA
Distance b/w Smartphone
and BLE-Beacon
Weight Assign
Based on Proximity
BLE-Beacons
RSSIn Avg
Calculation of Avg Weight
of Each Deployed Beacon
Estimated
Coordinates
(XBLE,YBLE)
If (PositionPDR > PositionBLE)PDRHigh= PositionPDR;
BLELow= PositionBLE;Yes
PDRlow= PositionPDR;
BLEhigh= PositionBLE;
No
P1[PDRHigh, BLELow]
P2[BLELow,PDRHigh]
Location(X,Y,Z)
Output2
Output1
(PDRHigh+BLELow)/2
Gyro
Bias
Figure 1. Hybrid position error compensation mechanism For indoor localization.
3.1.2. Quaternions Calculation at North–East Down (NED)
The inertial frame is an unmoving Earth-fixed set of axes reference. In the inertialframe, x-axes point north, y-axes point east, and z-axes point down. This configurationof axes in the inertial frame reference is called north–east Down (NED). The sequenceof rotations is used to represent a given orientation, which is the first yaw, then pitch,and finally roll. YAW rotation results in the new coordinate frame as illustrated in theFigure 2a. Yaw represents rotation about the inertial-frame z-axis by an angle ψ. The rotationof yaw around the z-axis produces a new coordinate frame where the z-axis is aligned with

Sensors 2021, 21, 6972 9 of 31
the inertial frame, and the yaw angle ψ rotates the x and y axes The orientation of the newcoordinate frame after the rotation of yaw is shown in Figure 2b.
(a)
X (old)
X1 (New Frame)
𝜓 (yaw)
Y1 (New Frame)
Y (old)
Z (old)=Z1 Down
(b)
Figure 2. Quaternions calculation at north–east down (NED) reference. (a) Quaternions calculation at inertial frame;(b) Quaternions calculation at new frame.
Qnew f 1in f (ψ) =
cos(ψ) sin(ψ) 0− sin(ψ) cos(ψ) 0
0 0 1
(3)
Similarly, if the rotation around pitch represents ξ and the pitch is not rotating aboutthe inertial frame Y-axis as shown in Figure 2, it is because that change in orientation occursdue to the changing in frames. This can be seen in Equations (4) and (5).
Qnewf2newf 1(ξ) =
cos(ξ) 0 − sin(ξ)0 1 0
sin(ξ) 0 cos(ξ)
(4)
Qnewf 1in f (ξ, ψ) = Qnew f 2
new f 1 (ξ)Qnewfinf (ψ) (5)
Performing rotation around the newf2 x-axis, SBF is obtained. The SBF contains yaw, pitch, and roll, and the rotation matrix
for moving from the newf2 to SBF is given by:
Qsb fnewf 2(ϕ) =
1 0 00 cos(ϕ) sin(ϕ)0 − sin(ϕ) cos(ϕ)
. (6)
To complete the rotation matrix for moving from the inertial frame to the body frame—it is shown in Equation (7)
Qsb fin f = (ϕ, ξ, ψ) = Qsb f
new f 2(ϕ)Qnew f 2new f 1(ξ)Q
new f 1in f (ψ). (7)
To get the accurate angular rates in the proper frames, the x-axis IMU output mustbe rotated into the newf2 frame, the y-axis IMU output must be rotated into the newf1
Sensors 2021, 21, 6972 10 of 31
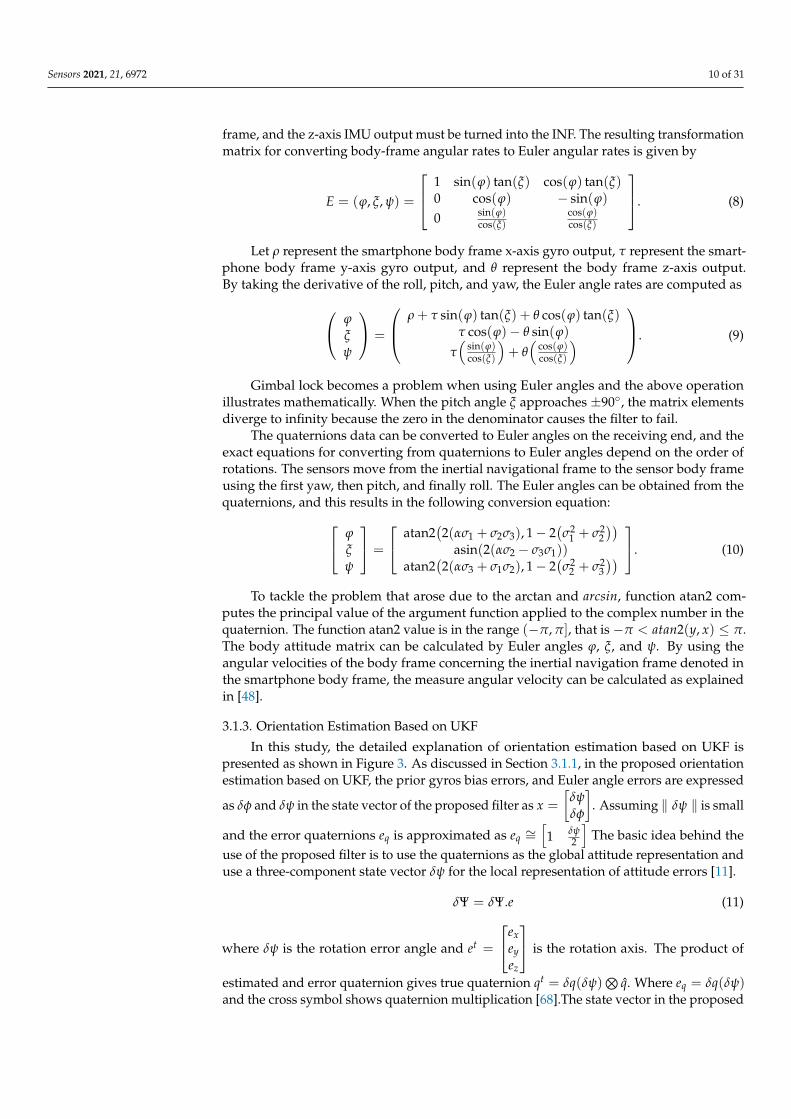
frame, and the z-axis IMU output must be turned into the INF. The resulting transformationmatrix for converting body-frame angular rates to Euler angular rates is given by
E = (ϕ, ξ, ψ) =
1 sin(ϕ) tan(ξ) cos(ϕ) tan(ξ)0 cos(ϕ) − sin(ϕ)
0 sin(ϕ)cos(ξ)
cos(ϕ)cos(ξ)
. (8)
Let ρ represent the smartphone body frame x-axis gyro output, τ represent the smart-phone body frame y-axis gyro output, and θ represent the body frame z-axis output.By taking the derivative of the roll, pitch, and yaw, the Euler angle rates are computed as ϕ
ξψ
=
ρ + τ sin(ϕ) tan(ξ) + θ cos(ϕ) tan(ξ)τ cos(ϕ)− θ sin(ϕ)
τ(
sin(ϕ)cos(ξ)
)+ θ(
cos(ϕ)cos(ξ)
). (9)
Gimbal lock becomes a problem when using Euler angles and the above operationillustrates mathematically. When the pitch angle ξ approaches ±90◦, the matrix elementsdiverge to infinity because the zero in the denominator causes the filter to fail.
The quaternions data can be converted to Euler angles on the receiving end, and theexact equations for converting from quaternions to Euler angles depend on the order ofrotations. The sensors move from the inertial navigational frame to the sensor body frameusing the first yaw, then pitch, and finally roll. The Euler angles can be obtained from thequaternions, and this results in the following conversion equation: ϕ
ξψ
=
atan2(2(ασ1 + σ2σ3), 1− 2
(σ2
1 + σ22))
asin(2(ασ2 − σ3σ1))atan2
(2(ασ3 + σ1σ2), 1− 2
(σ2
2 + σ23)). (10)
To tackle the problem that arose due to the arctan and arcsin, function atan2 com-putes the principal value of the argument function applied to the complex number in thequaternion. The function atan2 value is in the range (−π, π], that is −π < atan2(y, x) ≤ π.The body attitude matrix can be calculated by Euler angles ϕ, ξ, and ψ. By using theangular velocities of the body frame concerning the inertial navigation frame denoted inthe smartphone body frame, the measure angular velocity can be calculated as explainedin [48].
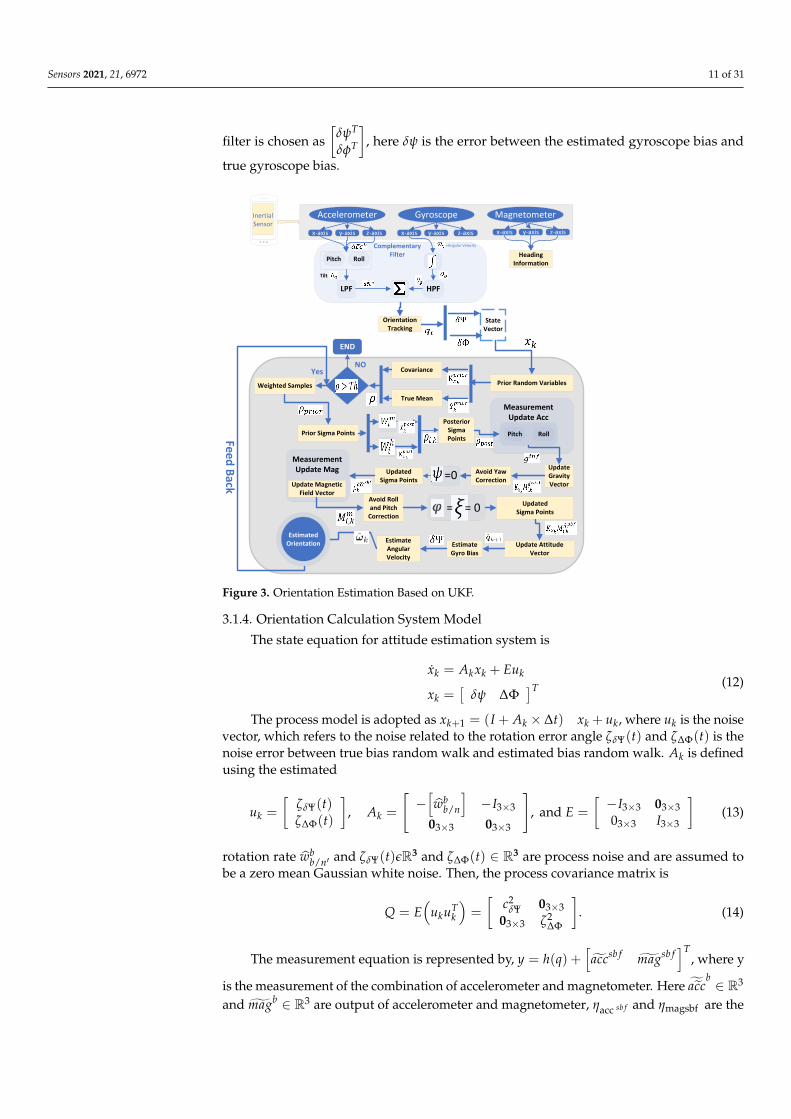
3.1.3. Orientation Estimation Based on UKF
In this study, the detailed explanation of orientation estimation based on UKF ispresented as shown in Figure 3. As discussed in Section 3.1.1, in the proposed orientationestimation based on UKF, the prior gyros bias errors, and Euler angle errors are expressed
as δφ and δψ in the state vector of the proposed filter as x =
[δψδφ
]. Assuming ‖ δψ ‖ is small
and the error quaternions eq is approximated as eq ∼=[1 δψ
2
]The basic idea behind the
use of the proposed filter is to use the quaternions as the global attitude representation anduse a three-component state vector δψ for the local representation of attitude errors [11].
δΨ = δΨ.e (11)
where δψ is the rotation error angle and et =
exeyez
is the rotation axis. The product of
estimated and error quaternion gives true quaternion qt = δq(δψ)⊗
q. Where eq = δq(δψ)and the cross symbol shows quaternion multiplication [68].The state vector in the proposed
Sensors 2021, 21, 6972 11 of 31
filter is chosen as[
δψT
δφT
], here δψ is the error between the estimated gyroscope bias and
true gyroscope bias.
Accelerometer Gyroscope Magnetometer
x-axis y-axis z-axis x-axis y-axis z-axis
Inertial Sensor
HPF
Complementary Filter
Orientation Tracking
=Angular Velocity
Pitch Roll
LPF
Tilt ( )
x-axis y-axis z-axis
Heading Information
Prior Random Variables
State Vector
Covariance
True Mean
Weighted Samples
Prior Sigma Points
Posterior Sigma Points
Update Gravity Vector
Measurement Update Acc
Pitch Roll
Avoid YawCorrection
Updated Sigma Points
Measurement Update Mag
Update Magnetic Field Vector
=0
Avoid Roll and Pitch
Correction= = 0 Updated
Sigma Points
Update Attitude Vector
EstimateGyro Bias
EstimateAngular Velocity
EstimatedOrientation
Fee
d B
ack
Yes
END
NO
Figure 3. Orientation Estimation Based on UKF.
3.1.4. Orientation Calculation System Model
The state equation for attitude estimation system is
xk = Akxk + Euk
xk =[
δψ ∆Φ]T (12)
The process model is adopted as xk+1 = (I + Ak × ∆t) xk + uk, where uk is the noisevector, which refers to the noise related to the rotation error angle ζδΨ(t) and ζ∆Φ(t) is thenoise error between true bias random walk and estimated bias random walk. Ak is definedusing the estimated
uk =
[ζδΨ(t)ζ∆Φ(t)
], Ak =
[−[wb
b/n
]−I3×3
03×3 03×3
], and E =
[−I3×3 03×303×3 I3×3
](13)
rotation rate wbb/n′ and ζδΨ(t)εR3 and ζ∆Φ(t) ∈ R3 are process noise and are assumed to
be a zero mean Gaussian white noise. Then, the process covariance matrix is
Q = E(
ukuTk
)=
[c2
δΨ 03×303×3 ζ2
∆Φ
]. (14)
The measurement equation is represented by, y = h(q) +[
accsb f magsb f]T
, where y
is the measurement of the combination of accelerometer and magnetometer. Here accb∈ R3
and magb ∈ R3 are output of accelerometer and magnetometer, ηacc sb f and ηmagsbf are the

Sensors 2021, 21, 6972 12 of 31
measurement independent zero-mean Gaussian white-noise and can be expressed as thetrue magnetic and gravity vector mn and gn.
accsb f = e∗q ⊗ q∗ ⊗−gin f ⊗ q⊗ eq + accsb f + ηaccsb f (15)
magsb f = e∗q ⊗ q∗ ⊗min f ⊗ q⊗ eq + accsb f + ηmagsb f (16)
The variance of measurement noise is η2accsb f and η2
magsb f and its covariance matrix
expressed as MR =
[η2
accsb f × I3×3 03×3
03×3 η2magsb f .I3×3
], and h(q) represents the nonlinear
equations that convert the magnetometer reference vector rmagεR3 and accelerometerreference vector raccεR3 from INF to the SBF. The values of racc and rmag are constantswhose specific values can be found using the method in [84].
3.1.5. Time and Sigma Points Update
For calculating the posterior first and second order statistics of a random variable,which undergoes the unscented transformation. By using a minimal set of deterministicallychosen weighted sample points, the state distribution is again represented by a Gaussianrandom variable (GRV). Covariance and true mean completely capture the prior randomvariable by using the weighted sample points called sigma-points. In this case, the errorstate x contains the orientation information q and the gyro bias φ and has zero mean x.The following scheme is used to calculate the sigma points ρ.
ρj−1 =
[x2
j−1 + λ(Kj−1
) 12 xj−1 − λ
(Kj−1
) 12
](17)
where, λ represents the scaling parameter that shows the Sigma points spread around thecolumn vectors of the covariance matrix K and x.
λ = (ι + γ)12 , and γ = µ(ι + κ)− ι (18)
whereas, the augmented state vector dimension is represented by l, µ = (10−3, 1], andK = 0. To yield each point of a set, which is expressed through the Equation (52), and trans-formed samples ρi,j|j−1 = f
(ρi,j−1|j−1
). Here the ith column of the matrix represent i.
The prior estimates of covariance Kpriorxj and state xprior
j are given through the ρ as ex-pressed in equation
xpriorj =
2l
∑i=0
Wmi
[ρi,j|j−1
](19)
Kpriorxj =
2l
∑i=0
W ji
[ρi,j|j−1 − xprior
j
]2+ Qj. (20)
In the above two equations Wmi and W j
i are used to calculate the mean and covarianceof the posterior ρ’, respectively, as follows:
Wm0 =
γ
(l + γ)′, W j
0 =γ
(l + γ)+(
1−(
µ2 + β)
(21)
Wmi =
12(l + γ)
, W ji =
12(l + γ)
(22)
To determine posterior covariance, µ determines the spread of the ρ around xpriork ,
where β accentuate the weighting on the zero ρ [85]. The value of optimal β is obtainedfrom [86].
Sensors 2021, 21, 6972 13 of 31
3.1.6. Measurement Update
Magnetic measurement and gravity vector are not good choices for the reckoning ofthe horizontal component of the state vector. Moreover, yaw correction is not possible byusing a gravity vector. Due to the described issues and to ensure gravity correction, it doesnot act on the yaw estimate, and as magnetic anomalies only influence the pitch estimatesand roll, we divide the measurement update into two steps. For the case of gravity vectormeasurement update:
Maccsb fi,j|j−1 = ha
(ρi,j|j−1
)(23)
We set the third part of δψ to zero after the first update step, as qe,j[xj]= 0 and
based on the update K the ρ should be recalculated. Similarly, the magnetic field vectormeasurement equation can be written as Mm
i,j|j−1 = hm
(ρi,j|j−1
)and the first two part of δψ
are set to zero after the second update as qe,k[2, 3] = 0. In UKF compared to EKF, the systemaround its current state does not need to linearize.
To adaptively adjust the measurement covariance R, diagonal covariance inflation (CI)approach in [87] is implemented. In this approach, for the residual error (y), the measure-ment update of the low-confidence hypothesis will inflate in all directions. The proposedcovariance inflation approach always guaranteed the Mahalanobis distance r < 1. The CIapproach can resolve the inconsistency between the low-confidence hypothesis observationand the proposed filter prediction. The measurement update for the accelerometer andmagnetometer is
y = q∗ ⊗ gn ⊗ q− ab (24)
The determination of the error covariance Rk is the main issue of implementingthis method
Rak = c× y2 + ζ2
a (25)
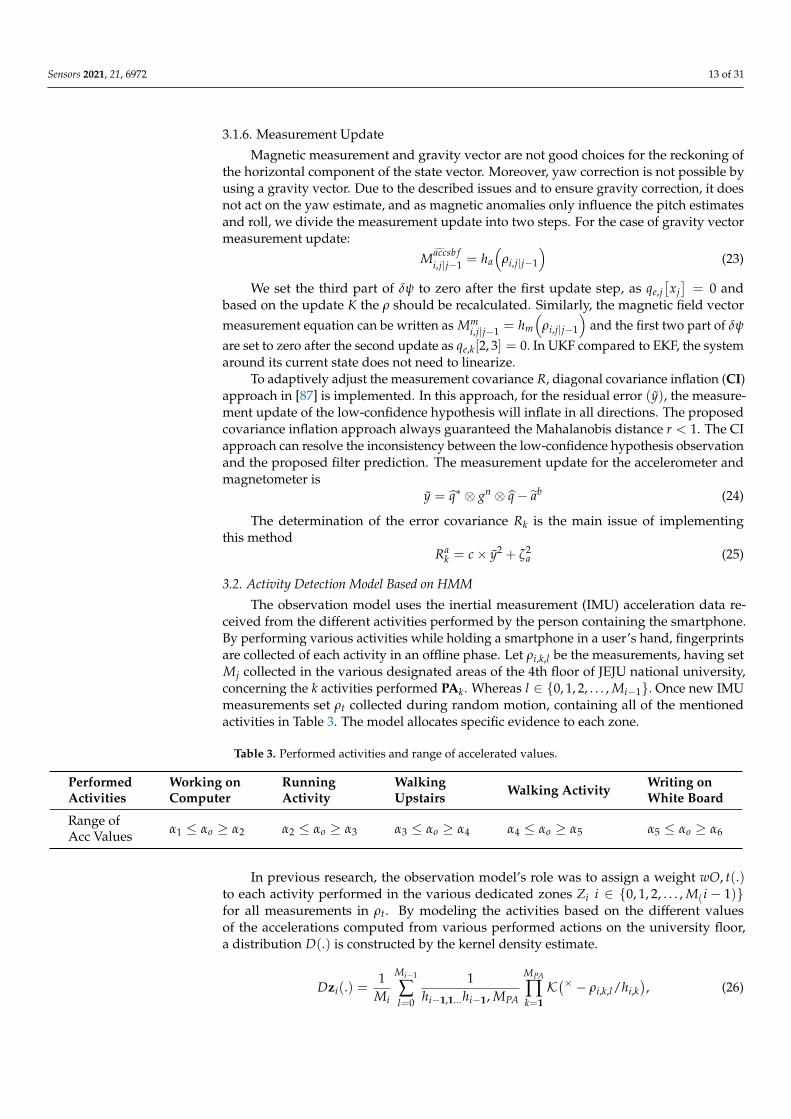
3.2. Activity Detection Model Based on HMM
The observation model uses the inertial measurement (IMU) acceleration data re-ceived from the different activities performed by the person containing the smartphone.By performing various activities while holding a smartphone in a user’s hand, fingerprintsare collected of each activity in an offline phase. Let ρi,k,l be the measurements, having setMj collected in the various designated areas of the 4th floor of JEJU national university,concerning the k activities performed PAk. Whereas l ∈ {0, 1, 2, . . . , Mi−1}. Once new IMUmeasurements set ρt collected during random motion, containing all of the mentionedactivities in Table 3. The model allocates specific evidence to each zone.
Table 3. Performed activities and range of accelerated values.
PerformedActivities
Working onComputer
RunningActivity
WalkingUpstairs Walking Activity Writing on
White Board
Range ofAcc Values α1 ≤ αo ≥ α2 α2 ≤ αo ≥ α3 α3 ≤ αo ≥ α4 α4 ≤ αo ≥ α5 α5 ≤ αo ≥ α6
In previous research, the observation model’s role was to assign a weight wO, t(.)to each activity performed in the various dedicated zones Zi i ∈ {0, 1, 2, . . . , M(i − 1)}for all measurements in ρt. By modeling the activities based on the different valuesof the accelerations computed from various performed actions on the university floor,a distribution D(.) is constructed by the kernel density estimate.
Dzi(.) =1
Mi
Mi−1
∑l=0
1hi−1,1...hi−1, MPA
MPA
∏k=1K(× − ρi,k,l/hi,k
), (26)

Sensors 2021, 21, 6972 14 of 31
To each PA in each zone K(.) is the kernel and hi,k is the bandwidth of the kernel. Dueto the facility of analytical derivations, the Gaussian kernel is considered, and the shape ofthe kernel has no impact on the model [88].
K(u) = 1(2π)1/2 e−1/2u2
(27)
By maximizing the pseudo-likelihood leave-one-out cross-validation, the bandwidthof hi,k is estimated. hi,k = argmaxh NLi,k(h) where NLi,k(h) is computed as,
NLi,k(hi,k) =1
Mi
Mi−1
∑l=0
log
∑l 6=l
K(
ρi,k,l − ρi,k,l
hi,k
)− log[(Mi − 1)hi,k]. (28)
The allocation of weight by the observation model to each performed activity at anytime t is computed as the output of the kernel density estimate of each zone followed by anormalization phase,
w0, t(Zi) =Dzi(ρt)
∑Mz−1j=0 Dzi(ρt)
. (29)
In this activity detection approach, based on the hidden Markov model, the mobilitymodel is constructed. To determine the confidence level that the sensor resides in eachzone, the probability is assigned based on the measurements of the accelerometer andcombined with the evidence given by the observation model. At first, we provide a generaloverview of the HMMs and the confidence-based zone estimation combined with theobservation model.
3.2.1. Hidden Markov Models
A probabilistic model that can be used to represent observations, and these sequenceof observations can either be independent, time-dependent, continuous, or discrete [89].Let the SN HMM model be denoted by H, and the total states S = {S1, S2, . . . , SN}. The ob-jective of the Nth order HMM model is to determine the corresponding state sequenceS = {S1, S2, . . . , Sα}, whenever the sequence of length α and R = {R1, R1, . . . , Rα} is given.For each present state, the probability of arriving at the next state is designated by thetransition probability and termed as matrix A. The actual states are hidden from the ob-server and determine the likelihood that each type of observation is in each state by usingobservable data and termed as emission probabilities forming matrix B. Probabilities ofstarting at different states in HMM are represented as T. Based on the prior knowledge,it can be either random, any vector generated, or uniform. Thus any HMM can be repre-sented as H = (A, B, T). The transition probability from the state a to b can be denotedby Paba, b ∈ {1, 2, . . . , SN} and forming the matrix A. The output probability distributionforming the matrix B, and can be represented as Pa(R), a ∈ {1, 2, . . . , SN}. The completeexplanation is in [90].
3.2.2. Activity Detection Approach Architecture
In an indoor environment, the objective is to detect a change in the sensor state fromone zone to another in a specific period. To determine the likelihood that the sensor has fol-lowed some trajectory, we use the HMMs. Since the states are hidden S = {S1, S2, . . . , Sα},we can observe a sequence R = {R1, R1, . . . , Rα}, corresponding to a vector of accelerationmagnitude measurements at each state. To observe the sequence R, we are interested indetermining the probability P(R|H). The probability obtained by the observation model iscombined with P(R|H) to determine a confidence level of having the accelerometer sensorvalues residing in each zone. The transition between two zones Zi to Zj can be representedby SN state HMM Hi,j, whereas a set of HMMs denoted as Hi,j, i, j ∈ {1, 2, . . . , Mz}. In eachtransition region, the number of states chosen by the user is represented as SN .

Sensors 2021, 21, 6972 15 of 31
Figure 4 shows the transition region between each pair of neighboring zones in theoffline phase. This region is divided into the number of states chosen by the user in eachtransition region. In each transition region, Γ = SN × σaccmag measurements were gathered.Random selections of measurements from each state made the change in the frequency ofthe accelerometer values. Every kind of variation in the accelerometer values is consideredas a database for each HMM. For each HMM Hi,j = (A, B, Γ), the parameters are calculatedas follows,
• Except for the first and the last state, where there are only two options, the accelerom-eter sensor values can move to the state upfront, behind, or retain their positions.The transition matrix ASN×SN .
• The activity detection model of each sequence is computed by modeling the of-fline collected accelerometer sensor measurements of each sequence with the multi-dimensional distribution Pa(R) = QΓ(Pa), j ∈ {1, 2, . . . , Mz}. For example, to modelobservation ρa using the accelerometer sensor measurements Γ for all the PAs, the dis-tribution QΓ(ρa) which is the output of the distribution Q(.) is used.
• The vector T is defined as[
1SN
, ..., 1SN
], unless information of prior knowledge is
given regarding the starting of the state vector.
Zone4
Zone7
Zone 1 Zone2 Zone3
Zone5 Zone6
Zone8 Zone9
Running
Activity
Walking
Upstairs
Walking
Activity
Writing on
White-Board
Working on
Computer
Transition Zone
Figure 4. Transitions Regions between all performed Activities.
3.2.3. Weight Assignment
The aim is to evaluate the probability of observing the sequence P(R|H), given anobservation R and SN state HMM model H. When we know the parameters of the HMM,this is a problem for evaluating the observed sequence. For the evaluation purpose ofP(R|H), it can be broken down as follows. We can compute the joint probability of thestate sequence and the observed sequence, given a state sequence S = {S1, S2, . . . , Sα},and the range of α values in different zones are α1 ≤ αo ≥ α2, α2 ≤ αo ≥ α3, α3 ≤ αo ≥ α4,α4 ≤ αo ≥ α5, α5 ≤ αo ≥ α6,
P(R, S|H) = P(R|S, )× P(S|H) (30)
In (30) is the product of the probability of the state sequence S given the modelH andthe likelihood of the observation sequence R given the state sequence S. The first term isobtained from the activity detection matrix B as follows,
P(Rαi | H) =αi
∑α=1
αi
∏a=1
Psa(Ra) (31)

Sensors 2021, 21, 6972 16 of 31
From the transition matrix A, the second term is obtained as,
P(S | H) =αi
∏a=1
Psa−1sa(Ra) (32)
By taking the summation of P(R, S|H) over all possible state sequences SN, we canthen derive P(R|H) [91],
P(R | H) = ∑For all S
P(R, S | H) = ∑For all S
αi
∏a=1
Psa−1sa Psa(Ra) (33)
The computational cost and feasibility of the system depend on the range of α. To ob-tain the probability P(R|H) and reduces the computational burden, a forward–backwardalgorithm can be used. Thus, (33) can be transformed as
P(R | H) =SN
∑y=1
P(
R1, R2,×, Ra, sa = P′/H)· P(
Ra+1, Ra+2, . . . , Rαi |, sa = P,H)
ga(P) = P(
R1, . . . , Ra, sa = P | H) (34)
ha(P) = P(
Ra+1, . . . , Rα | sa = P,H)
(35)
The probabilities ga(P) and ha(P) mentioned in (35) can be recursively computed;therefore, the probability P(R|H) is given by,
P(R | H) =SN
∑P
ga(P)ha(P). (36)
In the (36), when a transition between Zi to Zj took place, the objective of the proposedHMM-based activity detection model is to assign evidence. Each HMM Hi,j allocate alikelihood based on a sequence R = {R1, R1, . . . , Rα}. For each HMM Hi,j, the proba-bilities P
(R|Hi,j
), i, j ∈ {1, 2, . . . , Mz} are computed. Based on that, the probabilities of
the transitions between different zones are calculated. The probability is zero where notransition is possible. The coefficient of transition ci,j, i, j ∈ {1, 2, . . . , Mz} between zonesZi to Zj is as follows,
ci,j =
{P(
R | Hi,j), if i 6= j
1−∑MZi=1 P
(R | Hi,j
), if i = j.
(37)
Probabilities that the sensor moves from Zi to Zj are a complement to the probabilitieswhere the likelihood for transition is zero. The calculation for the evidence wM,t (.) isas follows,
wM,t(Zi) =Mz
∑j=1
wO,t−1(Zj)× ci,j. (38)
The weight associated with the observation model O(.) is wO,t−1. The coefficient ci,jwill be large if there is no transition Zi to Zj. All coefficient ci,j values in the case for i = jwill be significant. This problem does not cause any issue if we put the values of coefficientsin the above equation and, thus, evidence is based on the observation model wO,t−1
(Zj).
3.2.4. Zone-Based Confidence Estimation
The evidence was allocated by the mobility model and the observation model com-bined to get the confidence Ct(.). The confidence level shows the zones based on theaccelerometer sensor values.
Ct(Zi) =w0,t(Zi)× wM,t(Zi)
∑Mzx=1 w0,t(Zx)× wM,t(Zx)
(39)
Sensors 2021, 21, 6972 17 of 31
Based on the accelerometer sensor values, the zone with the highest confidence levelchosen is shown in (39).
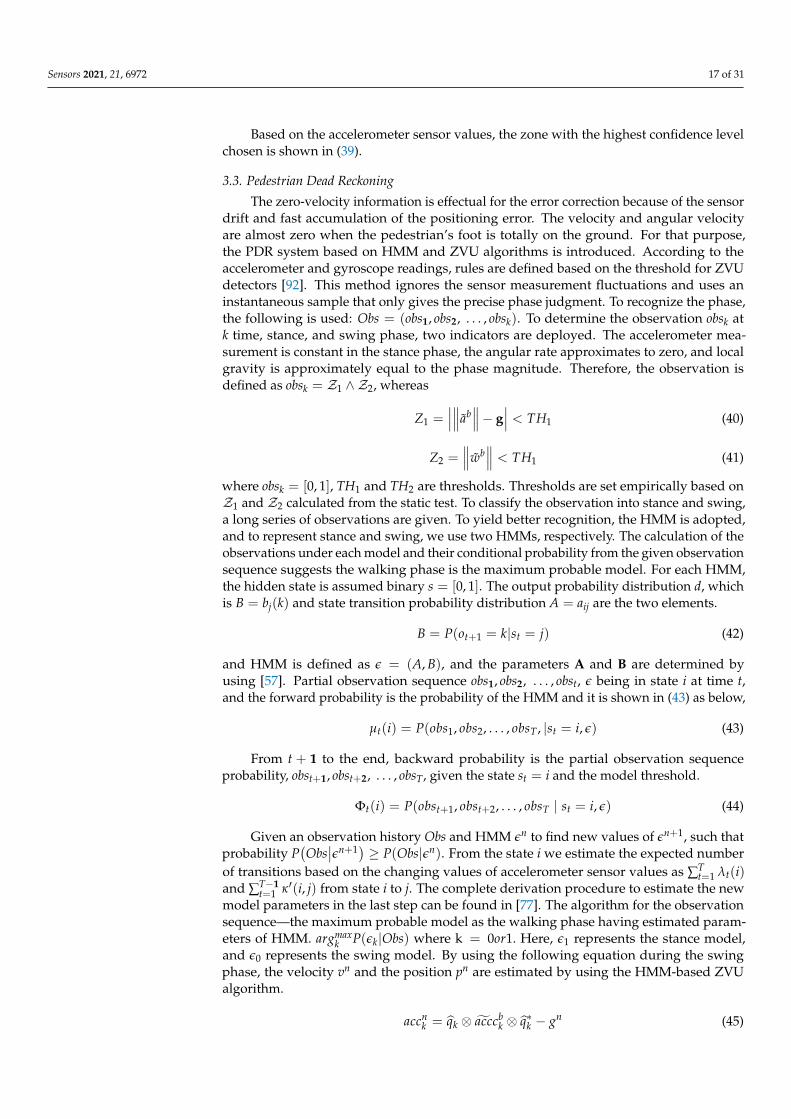
3.3. Pedestrian Dead Reckoning
The zero-velocity information is effectual for the error correction because of the sensordrift and fast accumulation of the positioning error. The velocity and angular velocityare almost zero when the pedestrian’s foot is totally on the ground. For that purpose,the PDR system based on HMM and ZVU algorithms is introduced. According to theaccelerometer and gyroscope readings, rules are defined based on the threshold for ZVUdetectors [92]. This method ignores the sensor measurement fluctuations and uses aninstantaneous sample that only gives the precise phase judgment. To recognize the phase,the following is used: Obs = (obs1, obs2, . . . , obsk). To determine the observation obsk atk time, stance, and swing phase, two indicators are deployed. The accelerometer mea-surement is constant in the stance phase, the angular rate approximates to zero, and localgravity is approximately equal to the phase magnitude. Therefore, the observation isdefined as obsk = Z1 ∧ Z2, whereas
Z1 =∣∣∣∥∥∥ab
∥∥∥− g∣∣∣ < TH1 (40)
Z2 =∥∥∥wb
∥∥∥ < TH1 (41)
where obsk = [0, 1], TH1 and TH2 are thresholds. Thresholds are set empirically based onZ1 and Z2 calculated from the static test. To classify the observation into stance and swing,a long series of observations are given. To yield better recognition, the HMM is adopted,and to represent stance and swing, we use two HMMs, respectively. The calculation of theobservations under each model and their conditional probability from the given observationsequence suggests the walking phase is the maximum probable model. For each HMM,the hidden state is assumed binary s = [0, 1]. The output probability distribution d, whichis B = bj(k) and state transition probability distribution A = aij are the two elements.
B = P(ot+1 = k|st = j) (42)
and HMM is defined as ε = (A, B), and the parameters A and B are determined byusing [57]. Partial observation sequence obs1, obs2, . . . , obst, ε being in state i at time t,and the forward probability is the probability of the HMM and it is shown in (43) as below,
µt(i) = P(obs1, obs2, . . . , obsT , |st = i, ε) (43)
From t + 1 to the end, backward probability is the partial observation sequenceprobability, obst+1, obst+2, . . . , obsT, given the state st = i and the model threshold.
Φt(i) = P(obst+1, obst+2, . . . , obsT | st = i, ε) (44)
Given an observation history Obs and HMM εn to find new values of εn+1, such thatprobability P
(Obs
∣∣εn+1) ≥ P(Obs|εn). From the state i we estimate the expected numberof transitions based on the changing values of accelerometer sensor values as ∑T
t=1 λt(i)and ∑T−1
t=1 κ′(i, j) from state i to j. The complete derivation procedure to estimate the newmodel parameters in the last step can be found in [77]. The algorithm for the observationsequence—the maximum probable model as the walking phase having estimated param-eters of HMM. argmax
k P(εk|Obs) where k = 0or1. Here, ε1 represents the stance model,and ε0 represents the swing model. By using the following equation during the swingphase, the velocity vn and the position pn are estimated by using the HMM-based ZVUalgorithm.
accnk = qk ⊗ acccb
k ⊗ q∗k − gn (45)
Sensors 2021, 21, 6972 18 of 31
velocity nk = velocity n
k−1 + accnk ∆t (46)
position nk = position n
k−1 + velocity nk−1∆t +
12
accnk ∆t2 (47)
The sampling interval of the inertial sensors is 4t and gn and the gravity vector ininertial navigational frame {in f } is gn.
4. Compensation Mechanism Based on AWCLA
In the case for the compensation mechanism based on AWCLA, we used iBeaconEstimote version Bluetooth 4.0 smart as a fixed device, and its detail is mentioned inTable 4. A 32-bit ARM® Cortex M0 is a small computer accompanied by a temperaturesensor and accelerometer. Bluetooth low energy beacon uses ultra-high 2.4 GHz radiofrequency. The CR2477 battery power source is used to power the BLE estimate for threeyears if used in the default condition. The range of the ideal Beacon is around 70 m,and in an indoor environment where signals can interfere, diffracted, or be absorbed bythe walls and human body, the range is reduced to 30–40 m. The iBeacon sent informationin an advertisement packet containing RSSI values, advertising intervals, measured power,and broadcasting power.
Table 4. Implementation environment.
Component Description
BLE Beacon model EstimoteCPU 32-bit ARM® Cortex M0Power source CR2477Battery life 3 yearsIdeal beacons range 70 m (230 feet)Practical beacons range 30–40 mRadio frequency 2.4 GHz UHFVersion Bluetooth 4.0 SmartSensors embedded Accelerometer, temperature
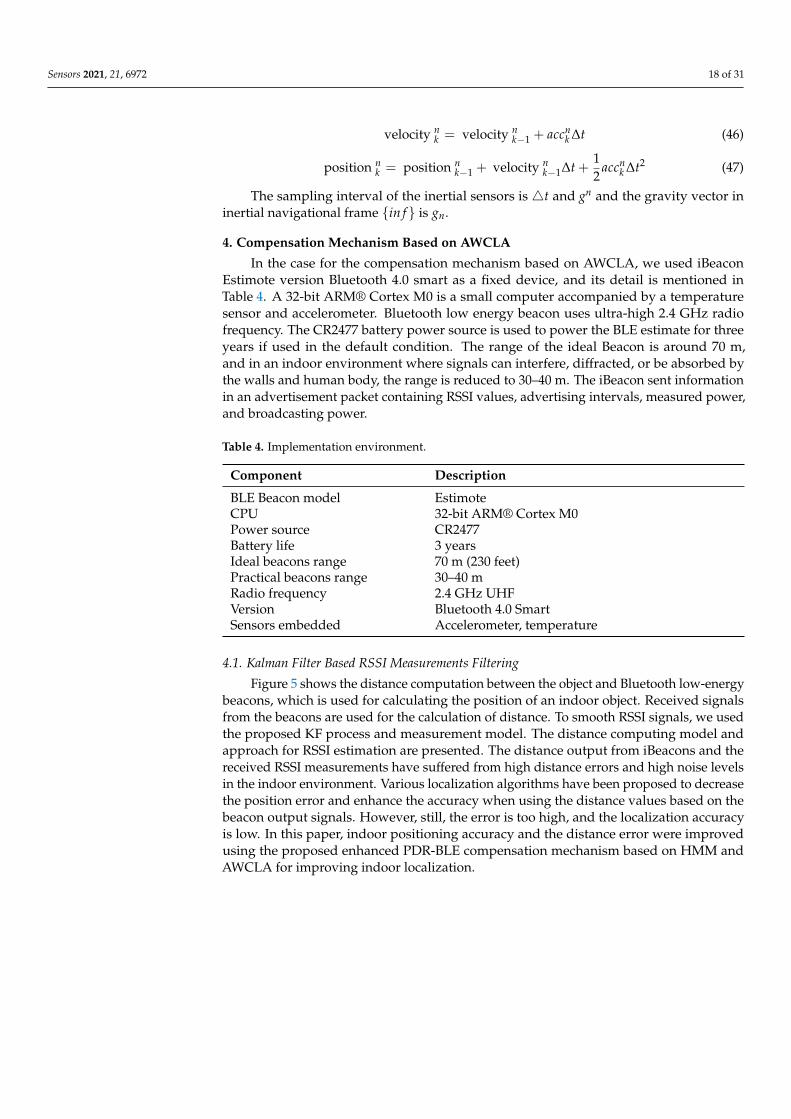
4.1. Kalman Filter Based RSSI Measurements Filtering
Figure 5 shows the distance computation between the object and Bluetooth low-energybeacons, which is used for calculating the position of an indoor object. Received signalsfrom the beacons are used for the calculation of distance. To smooth RSSI signals, we usedthe proposed KF process and measurement model. The distance computing model andapproach for RSSI estimation are presented. The distance output from iBeacons and thereceived RSSI measurements have suffered from high distance errors and high noise levelsin the indoor environment. Various localization algorithms have been proposed to decreasethe position error and enhance the accuracy when using the distance values based on thebeacon output signals. However, still, the error is too high, and the localization accuracyis low. In this paper, indoor positioning accuracy and the distance error were improvedusing the proposed enhanced PDR-BLE compensation mechanism based on HMM andAWCLA for improving indoor localization.
Sensors 2021, 21, 6972 19 of 31
Beacon
NodesRSSIn Pathloss Model State of Interest
Compute Kalman Gain
KT
Time Update
Current
State
Error
Covariance
Localization
Algorithm
Error Cov
Update
Process Model
Observation
Model
Measurement
Smoothed RSSIn
RSSIn
Distance b/w Smartphone
and BLE-Beacon
Weight Assign
Based on Proximity
Distance Error
State Estimate
Update
BLE-Beacons
RSSIn Avg
Calculation of Avg Weight
of Each Deployed Beacon
Calculation of
Centroid Points
Estimated
Coordinates
Figure 5. BLE-beacon Compensation Mechanism Based on Kalman Filter and AWCLA.
4.2. Path-Loss Model-Based Measuring Distance
The nature of the medium and the distance are factors that cause an attenuation whenwireless signals are transmitted. The signal is reflected, diffracted, refracted, and scatteredwhen experiencing objects during transmission. In the case of LOS or NLOS, directattenuated signal is due to other physical effects and indirect attenuated signals suchas refraction, reflection, scattering, and diffraction [93]. In the simplest path loss model,there is no multi-path components and signal strength decreases by 1
d1 .The amount ofpower transmitted compared to the power received is calculated using Friis free spaceequation [94].
received P = transmitted PTxGRxGλ2
(4πD)2 . (48)
The path loss is expressed in dB and it takes place exponentially with distance asshown in Equation (49)
Sensors 2021, 21, 6972 20 of 31
Ploss(d) = Ploss(d0) + 10nlog(dd0
). (49)
The relation between distance and RSSI in [80] can be described by the log-distancepath loss model.
RSSI = −10nlog10(
dd0
)+ r0 (50)
The above equation can be rewritten as:
d = 10((Txs−RSSI)
10n ) (51)
where, the strength of the transmitted signal is Txs. The process model for smoothing RSSIusing the Kalman Filter is shown below in Equation (52):
xt+1 = Axt−1 + But + wt (52)
The relationship is modeled through matrices A and B, and it is among the controlunit, current state, and previous state. At time step t, the state of interest is xt+1, whereasthe previous state is xt−1 , wt is the process noise, and the control input is ut. The KF basedobservation model is expressed as:
mt = TXt + vt (53)
where, at time step t mt is the measurement , the transformation matrix is represented as T,and noise measurement is vt.
Likewise, the steps update and prediction based on the Kalman filter are as follows
xt = xt−1 + But (State prediction) (54)
Pt = APt−1AT + Q (Error Covariance) (55)
GK = P−t TT(
TP−t TT + K)−1
(Gain Calculation) (56)
xt = x−t + Gt(mt − GtT)P−t (Estimate update) (57)
Pt = (I − GtT)P−t (Error covariance update) (58)
We define RSSI signals as the state of interest xt. For certain time frames, the mobileand position are set as static; hence, the RSSI measurements in that time frame remainconstant, and the rest of the parameters are taken as process noise. The model can beconstructed by setting A to an identity matrix and ignoring control input ut.
The RSSI estimation is computed in three steps. Step 1: xt = RSSI(t). Step 2: xt =Axt + wt (Kalman filter process model). Step 3: rssim = Txt + Vt, observation are designedby using the received RSSI measurements and the relationship between the state of interest.For the state of interest updates and the KF, we use a time step from t− 1 to t, variancefrom the time step t− 1 to t, and Kalman Gain (KG).
4.3. Position Estimation Using Beacon Weights
To find the mobile position the centroid location algorithm uses, while using theweight of each Beacon, the weighted centroid location WCL estimates the mobile location.In this paper, we explored the Beacon’s importance in terms of weight to estimate themobile position based on CLA by using the deployed beacons. The accuracy of the centroidlocalization algorithm is poor, so different modifications are proposed to decrease theposition error. To improve the object’s position, the proximity between the mobile devicesand the Beacons are considered in terms of weights for each beacon. The relationshipbetween the weight and distance is directly proportional, while the impacts of propinquity

Sensors 2021, 21, 6972 21 of 31
between the mobile devices and the beacons are inversely proportional. Based on (59), thevalue of Beacon weight is calculated using equation
wij =1
(dij)g , (59)
where the estimated distance between the mobile device and beacon is denoted by dijand the adjustable degree depends on the environments, and it is referred to g. To es-timate the unknown mobile position, the weighted centroid localization algorithm usesEquations (60) and (61) based on the known Beacon position.
x =∑n
i=1 wi × xi
∑ni=1 wi
(60)
y =∑n
i=1 wi × xi
∑ni=1 wi
(61)
Here x, y are the estimated x and y coordinate. The weight of each Beacon calculatesusing the signal power per Equation (62)
wij =(
ref(x, y)× 10(RSSI
20 ))g
(62)
Calculations of smartphone locations in indoor surroundings based on KF, whichintegrates the smoothed RSSI measurements based on the beacon weight. In the proposedalgorithm based on KF, RSSI measurements are pre-processed and integrated. The proposedbeacon-based localization eliminates noise and smooth RSSI values. By using the estimatedfiltered RSSI values, the distance between the deployed beacons and smartphones iscalculated. The strength of the received RSSI signal is directly proportional to the powerdelivered to the beacon. The calculation of the actual distance between the deployedbeacons and smartphones by using centroid points of beacons.
dactualn = ((xn − x0)2+(yn − y0)
2)12 (n = 1, 2, . . . , m) (63)
The error in distance is calculated using equation4dn = dn− dactualn(n = 1, 2, . . . , m).The position error between the BLE beacon and smartphone is denoted by4dn. The es-timated smartphone coordinates are calculated using weights of BLE beacons, and theaverage of the BLE beacons used to calculate the position. The estimated position of thesmartphone is calculated as follows.
xest =∑m
n=1 wnavg ×(xcij)
∑mn=1 wnavg
(i&j = a, b, c) and i 6= j (64)
yest =∑m
n=1 wnavg ×(ycij)
∑mn=1 wnavg
(i&j = a, b, c) and i 6= j (65)
Ep =((xest − x0)
2 + (yest − y0)2)1/2
(66)
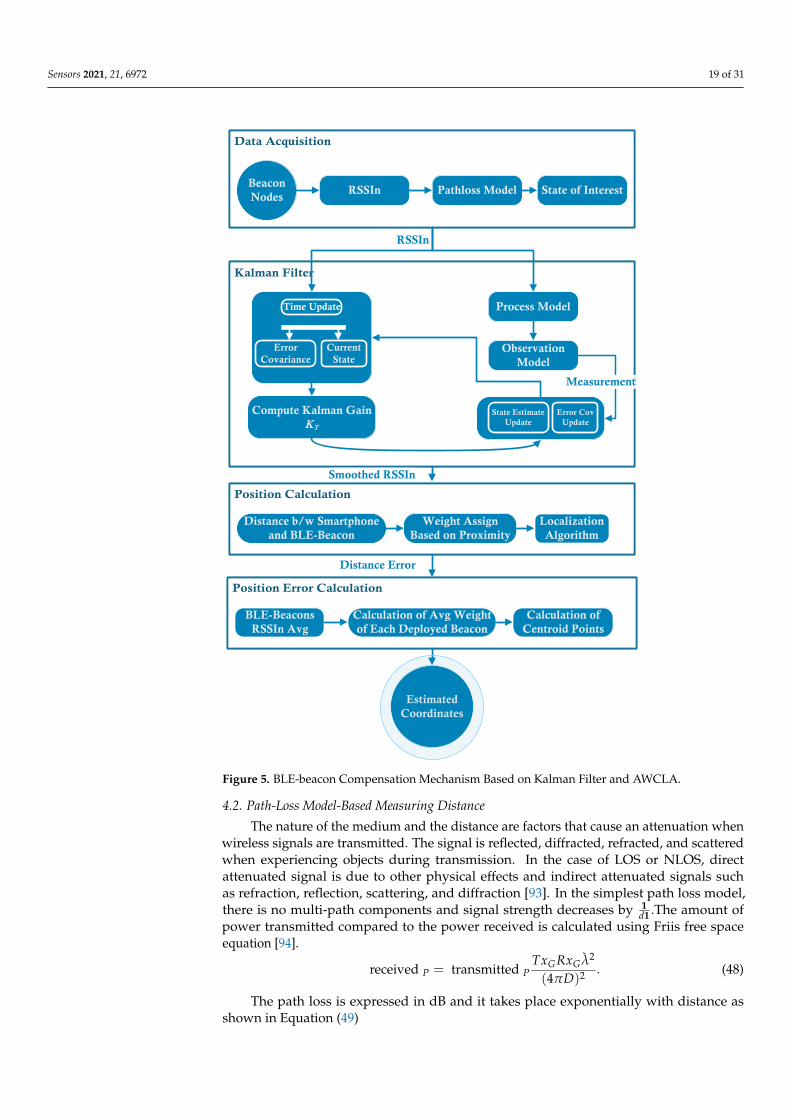
Figures 6 and 7 shows the activities performed by an object in an indoor environment.In Figure 6, various performed activities are shown, which include working on a computeror idle activity, running activity, walking upstairs, walking on a plain surface, and writingon board. The change in the magnitude of accelerometer sensor values clearly illustrates theactivities start and end times. It also shows how the change in the frequency also changesas the change in activity occurs. The high magnitude and high frequency in activitywriting onboard show the frequent movement of the test object in an indoor environment.
Sensors 2021, 21, 6972 22 of 31
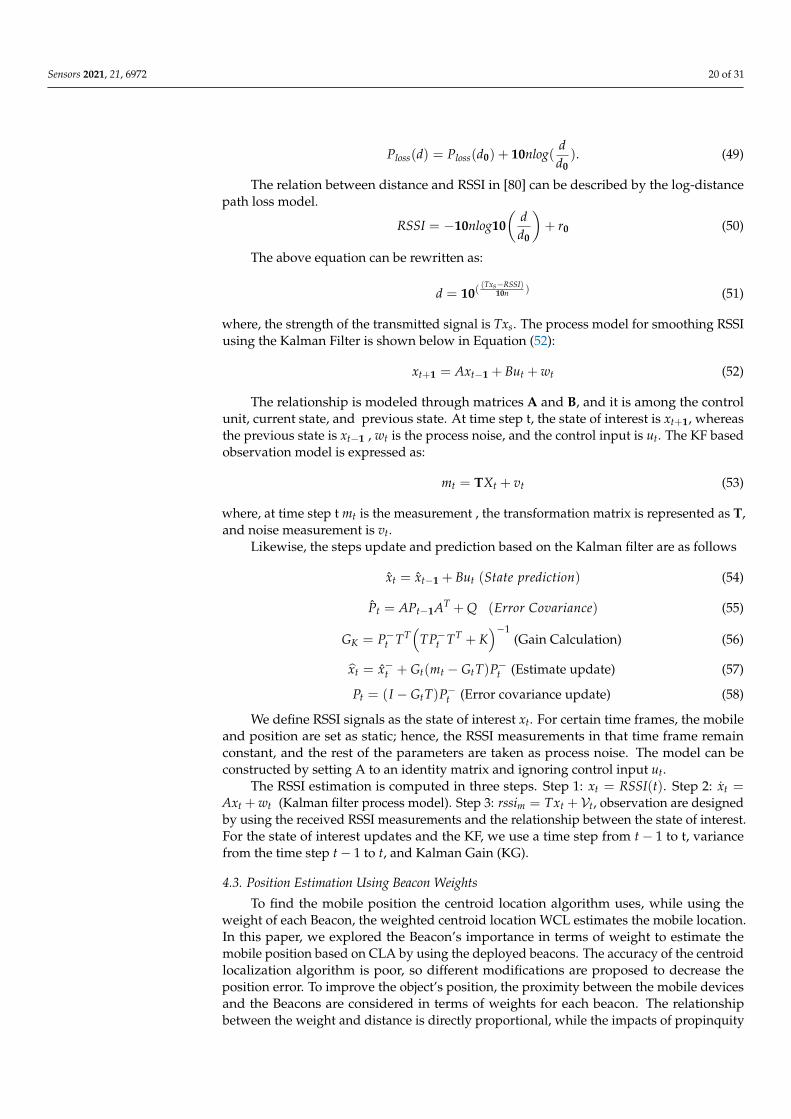
On the other hand, Figure 7 demonstrates the raw data information obtained from the IMUsmartphone-based sensor.
Figure 6. Activity detection using measurements of accelerometer sensor data.
Figure 7. Clustering of IMU sensor data.
5. Experimental Results and DiscussionDevelopment Environment
Experiments were conducted on a Windows PC with 12GB RAM. A front end (desktopapplication) was developed using Java, and the clustering techniques were applied inpython. Well-know python libraries, including NumPy, SkLearn, and Scipy, were used forclustering experiments. In addition, NCSS was used for the visualization of data in PC.Furthermore, the simulation time for acquiring data for every instance was one minute(60 s). The required software and hardware components are listed in Table 5.

Sensors 2021, 21, 6972 23 of 31
Table 5. Implementation environment.
Component Description
Operating system Android OSHardware BLE-beacon ARM® Cortex®-M4 32-bit processor
with FPU, Smartphone, Intel(R) Core(TM) i5-8500CPU @ 3.00GH
Memory DDR4-16GB RAM, 64 kB RAMLibraries Google API, Android Graph Library, Android Posi-
tion LibraryFront end framework Swing based GUICore programming language JavaIDE Android StudioSimulation time 60 s (1 min)
6. Results and Discussion
To validate our enhanced PDR-BLE compensation mechanism based on HMM and AW-CLA for improving indoor localization, the person moves in an indoor environment with aBluetooth enabled smartphone. The mobile was tested in seven different locations. Actualsmartphone coordinates were compared with the estimated positions. Seven Bluetoothlow energy beacons with known coordinates named C1(x1, y1), C2(x2, y2), . . . Cn(xn, yn)(n− 1, 2, . . . 6) placed in the entry and exit points of the fourth floor of Jeju National Uni-versity, South Korea. To validate our approach, at eleven different locations, the positionof the smartphone was calculated. The RSSI values of the BLE-beacon, as shown in thefigure, were calculated in the android application. The positioning system in this paperis three-dimensional. In this paper, we considered two floors of Jeju National Universityengineering building 4. We used a 3D navigation approach to localize object movement inan indoor environment.
By using the Kalman filter in the proposed algorithm, the collected RSSI valueswere then smoothed, and for position estimation of the smartphone, the weight of eachBLE-beacon was used. The figure shows various smartphone and deployed BLE beacon po-sitions.
6.1. Error Reduction Using Kalman Filter in RSSI Measurement
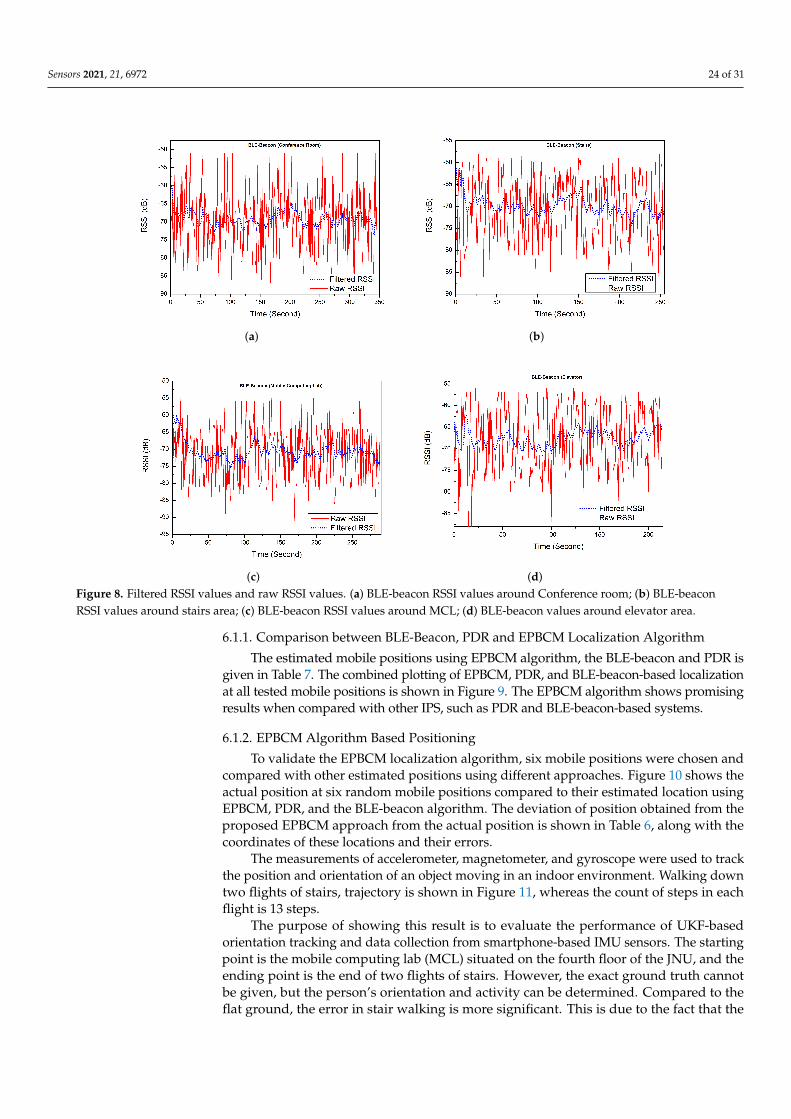
To validate our KF approach mentioned in Section 4, RSSI measurements passedthrough KF to reduce errors. The result of smoothed RSSI values obtained after passingraw RSSI measurements through the Kalman filter from different smartphone locationsis mentioned in Table 6. On separate entry and exit points of the floor, the estimatedBLE-beacon RSSI values and raw BLE-beacon RSSI values are shown in Figure 8. Thesmoothed BLE-beacon RSSI values are further used to calculate the distance.
Table 6. Comparion in Position Error-Reference and EPBCM.
Reference Position XTrueMeters
YTrueMeters
XEPBCMMeters
YEPBCMMeters Position Error
Elevator Area 6 1.2 6.06 1.26 0.08Conference Room 3 1.9 3.11 1.89 0.11Stairs Area 10 2.4 10.32 2.36 0.32Mobile Computing Lab 1 1 1.01 1.005 0.01Networking Lab 15 3.74 15.65 3.66 0.65Rest Area 20 5.32 20.11 5.4 0.14
Sensors 2021, 21, 6972 24 of 31
(a) (b)
(c) (d)Figure 8. Filtered RSSI values and raw RSSI values. (a) BLE-beacon RSSI values around Conference room; (b) BLE-beaconRSSI values around stairs area; (c) BLE-beacon RSSI values around MCL; (d) BLE-beacon values around elevator area.
6.1.1. Comparison between BLE-Beacon, PDR and EPBCM Localization Algorithm
The estimated mobile positions using EPBCM algorithm, the BLE-beacon and PDR isgiven in Table 7. The combined plotting of EPBCM, PDR, and BLE-beacon-based localizationat all tested mobile positions is shown in Figure 9. The EPBCM algorithm shows promisingresults when compared with other IPS, such as PDR and BLE-beacon-based systems.
6.1.2. EPBCM Algorithm Based Positioning
To validate the EPBCM localization algorithm, six mobile positions were chosen andcompared with other estimated positions using different approaches. Figure 10 shows theactual position at six random mobile positions compared to their estimated location usingEPBCM, PDR, and the BLE-beacon algorithm. The deviation of position obtained from theproposed EPBCM approach from the actual position is shown in Table 6, along with thecoordinates of these locations and their errors.
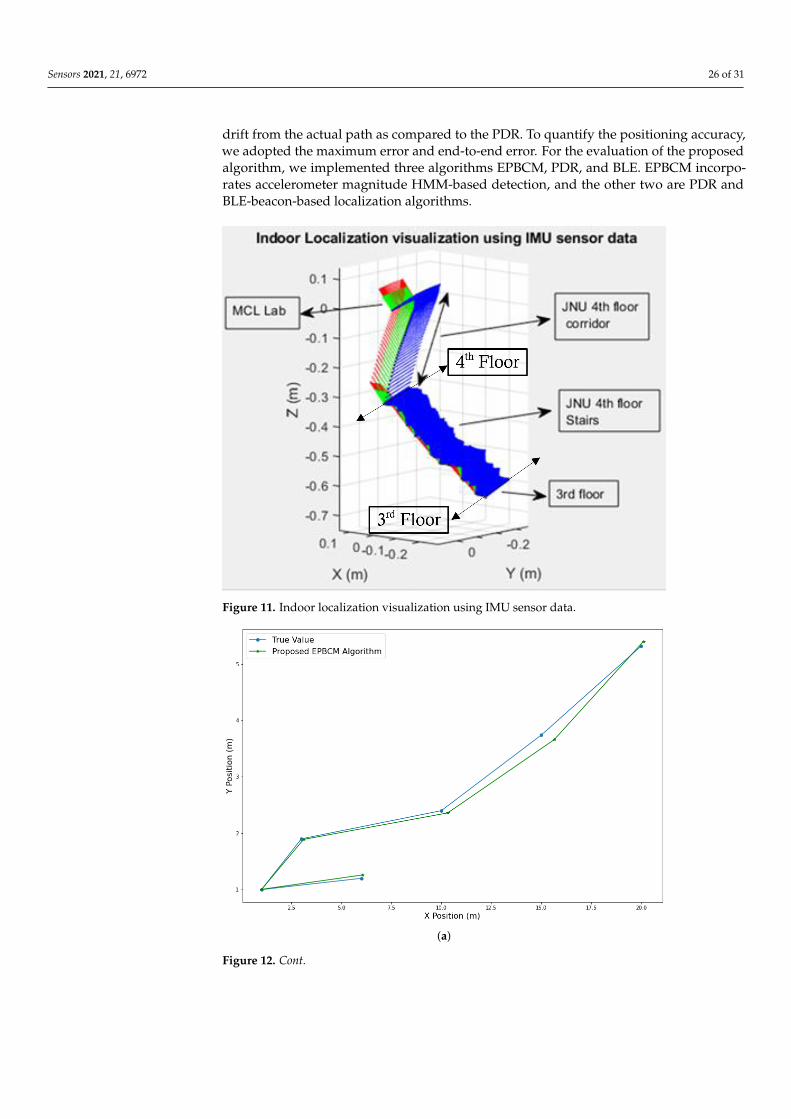
The measurements of accelerometer, magnetometer, and gyroscope were used to trackthe position and orientation of an object moving in an indoor environment. Walking downtwo flights of stairs, trajectory is shown in Figure 11, whereas the count of steps in eachflight is 13 steps.
The purpose of showing this result is to evaluate the performance of UKF-basedorientation tracking and data collection from smartphone-based IMU sensors. The startingpoint is the mobile computing lab (MCL) situated on the fourth floor of the JNU, and theending point is the end of two flights of stairs. However, the exact ground truth cannotbe given, but the person’s orientation and activity can be determined. Compared to theflat ground, the error in stair walking is more significant. This is due to the fact that the

Sensors 2021, 21, 6972 25 of 31
calculations of vertical acceleration in stair walking has to be calculated for this scenarioand it must include gravitational acceleration.
Table 7. Comparison of reference position with EPBCM, PDR, and BLE-beacon-based localization algorithms.
Reference Position XTrueMeters
YTrueMeters
XEPBCMMeters
YEPBCMMeters
XBLE−beaconMeters
YBLE−beaconMeters
XPDRMeters
YPDRMeters
Elevator Area 6 1.2 6.06 1.26 6.13 1.27 6.07 1.39Conference Room 3 1.9 3.11 1.89 3.08 1.98 3.1 2.04Stairs Area 10 2.4 10.32 2.36 10.7 2.47 11.3 2.54Mobile Computing Lab 1 1 1.01 1.005 0.99 1.01 1.03 1.04Networking Lab 15 3.74 15.65 3.66 15.09 3.33 16.2 3.64Rest Area 20 5.32 20.11 5.4 21.4 5.53 21.89 5.62
Figure 9. Position Calculation based on EPBCM, PDR, and BLE-beacon at different mobile locations.
Figure 10. Mobile position estimation using BLE-beacon, PDR, and the EPBCM algorithm.
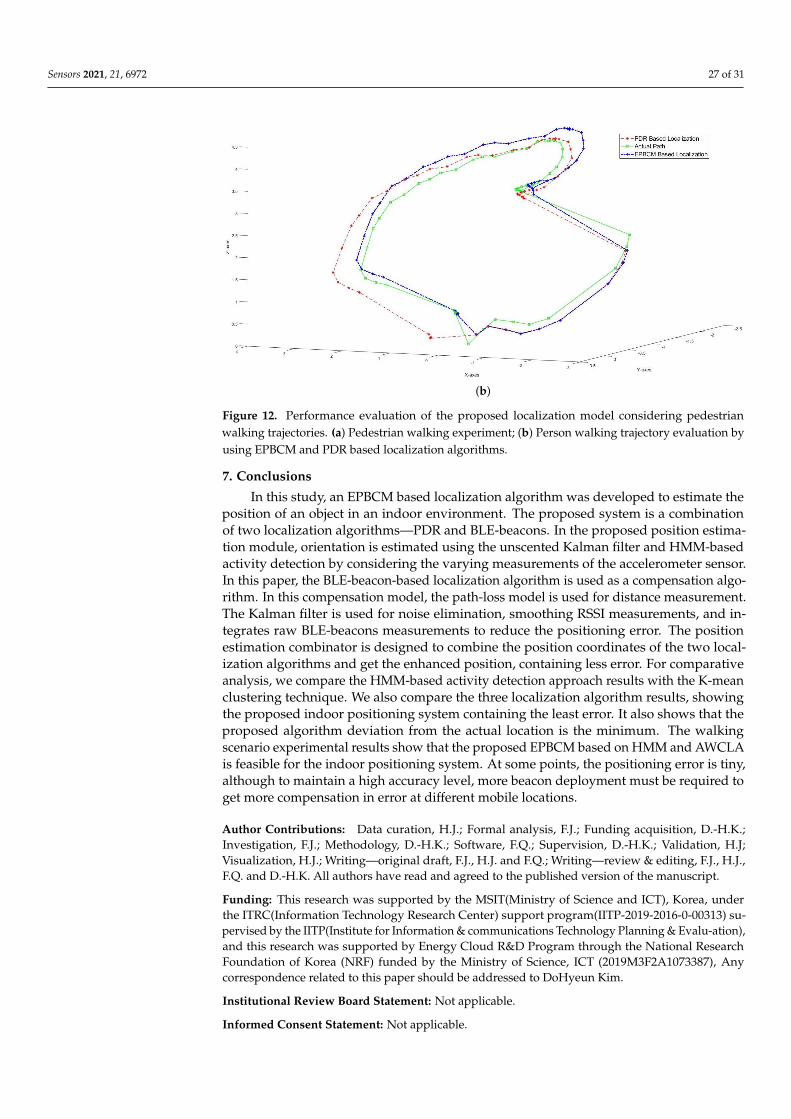
In this experiment, several pedestrian walking experiments were conducted in theengineering building of JNU, and the final results are shown in Figure 12. In addition,walking experiments were conducted to assess the performance further, and the smart-phone’s position was compared with the various reference points at the path of the testsubject. Figure 12a shows pedestrian walking experiment conducted on the fourth floor ofJeju National University. It is clearly seen that the localization trajectory based on the pro-posed EPBCM algorithm follows the ground truth values. Figure 12b shows the completeround trip foot trajectory of walking along a corridor, walking down two flights of stairs,containing multiple turns, and the total distance covered is around 220.35 m. The trajectorycomputed with the proposed algorithm is compared with the PDR localization algorithmand actual trajectory. The proposed localization algorithm shows a clear decrease in the
Sensors 2021, 21, 6972 26 of 31
drift from the actual path as compared to the PDR. To quantify the positioning accuracy,we adopted the maximum error and end-to-end error. For the evaluation of the proposedalgorithm, we implemented three algorithms EPBCM, PDR, and BLE. EPBCM incorpo-rates accelerometer magnitude HMM-based detection, and the other two are PDR andBLE-beacon-based localization algorithms.
Figure 11. Indoor localization visualization using IMU sensor data.
(a)
Figure 12. Cont.
Sensors 2021, 21, 6972 27 of 31
(b)
Figure 12. Performance evaluation of the proposed localization model considering pedestrianwalking trajectories. (a) Pedestrian walking experiment; (b) Person walking trajectory evaluation byusing EPBCM and PDR based localization algorithms.
7. Conclusions
In this study, an EPBCM based localization algorithm was developed to estimate theposition of an object in an indoor environment. The proposed system is a combinationof two localization algorithms—PDR and BLE-beacons. In the proposed position estima-tion module, orientation is estimated using the unscented Kalman filter and HMM-basedactivity detection by considering the varying measurements of the accelerometer sensor.In this paper, the BLE-beacon-based localization algorithm is used as a compensation algo-rithm. In this compensation model, the path-loss model is used for distance measurement.The Kalman filter is used for noise elimination, smoothing RSSI measurements, and in-tegrates raw BLE-beacons measurements to reduce the positioning error. The positionestimation combinator is designed to combine the position coordinates of the two local-ization algorithms and get the enhanced position, containing less error. For comparativeanalysis, we compare the HMM-based activity detection approach results with the K-meanclustering technique. We also compare the three localization algorithm results, showingthe proposed indoor positioning system containing the least error. It also shows that theproposed algorithm deviation from the actual location is the minimum. The walkingscenario experimental results show that the proposed EPBCM based on HMM and AWCLAis feasible for the indoor positioning system. At some points, the positioning error is tiny,although to maintain a high accuracy level, more beacon deployment must be required toget more compensation in error at different mobile locations.
Author Contributions: Data curation, H.J.; Formal analysis, F.J.; Funding acquisition, D.-H.K.;Investigation, F.J.; Methodology, D.-H.K.; Software, F.Q.; Supervision, D.-H.K.; Validation, H.J;Visualization, H.J.; Writing—original draft, F.J., H.J. and F.Q.; Writing—review & editing, F.J., H.J.,F.Q. and D.-H.K. All authors have read and agreed to the published version of the manuscript.
Funding: This research was supported by the MSIT(Ministry of Science and ICT), Korea, underthe ITRC(Information Technology Research Center) support program(IITP-2019-2016-0-00313) su-pervised by the IITP(Institute for Information & communications Technology Planning & Evalu-ation),and this research was supported by Energy Cloud R&D Program through the National ResearchFoundation of Korea (NRF) funded by the Ministry of Science, ICT (2019M3F2A1073387), Anycorrespondence related to this paper should be addressed to DoHyeun Kim.
Institutional Review Board Statement: Not applicable.
Informed Consent Statement: Not applicable.

Sensors 2021, 21, 6972 28 of 31
Data Availability Statement: Not applicable.
Conflicts of Interest: The authors declare no conflict of interest.
References1. Ometov, A.; Shubina, V.; Klus, L.; Skibinska, J.; Saafi, S.; Pascacio, P.; Flueratoru, L.; Gaibor, D.Q.; Chukhno, N.; Chukhno, O.; et al.
A Survey on Wearable Technology: History, State-of-the-Art and Current Challenges. Comput. Netw. 2021, 193, 108074. [CrossRef]2. Subedi, S.; Pyun, J.Y. A Survey of Smartphone-Based Indoor Positioning System Using RF-Based Wireless Technologies. Sensors
2020, 20, 7230. [CrossRef] [PubMed]3. Hofmann-Wellenhof, B.; Lichtenegger, H.; Collins, J. Global Positioning System: Theory and Practice; Springer Science & Business
Media: Berlin/Heidelberg, Germany, 2012.4. Catania, P.; Comparetti, A.; Febo, P.; Morello, G.; Orlando, S.; Roma, E.; Vallone, M. Positioning Accuracy Comparison of GNSS
Receivers Used for Mapping and Guidance of Agricultural Machines. Agronomy 2020, 10, 924. [CrossRef]5. Roberts, C.M. Radio frequency identification (RFID). Comput. Secur. 2006, 25, 18–26. [CrossRef]6. Zhao, H.; Yan, Y.; Shi, X. A Dynamic Localization Network for Regional Navigation under Global Navigation Satellite System Denial
Environments; SAGE publisher: California, CA, USA, 2019.7. Ijaz, F.; Yang, H.K.; Ahmad, A.W.; Lee, C. Indoor positioning: A review of indoor ultrasonic positioning systems. In Proceedings
of the 2013 15th International Conference on Advanced Communications Technology (ICACT), PyeongChang, Korea, 27–30January 2013; pp. 1146–1150.
8. Fard, H.K.; Chen, Y.; Son, K.K. Indoor positioning of mobile devices with agile iBeacon deployment. In Proceedings of the2015 IEEE 28th Canadian Conference on Electrical and Computer Engineering (CCECE), Halifax, NS, Canada, 3–6 May 2015;pp. 275–279.
9. Alarifi, A.; Al-Salman, A.; Alsaleh, M.; Alnafessah, A.; Al-Hadhrami, S.; Al-Ammar, M.A.; Al-Khalifa, H.S. Ultra WidebandIndoor Positioning Technologies: Analysis and Recent Advances. Sensors 2016, 16, 707. [CrossRef]
10. Uradzinski, M.; Guo, H.; Liu, X.; Yu, M. Advanced Indoor Positioning Using Zigbee Wireless Technology. Wirel. Pers. Commun.2017, 97, 6509–6518. [CrossRef]
11. Markley, F.L.; Crassidis, J.L. Attitude Control. In Fundamentals of Spacecraft Attitude Determination and Control; Markley, F.L.,Crassidis, J.L., Eds.; Space Technology Library; Springer: New York, NY, USA, 2014; pp. 287–343.
12. Obeidat, H.; Shuaieb, W.; Obeidat, O.; Abd-Alhameed, R. A review of indoor localization techniques and wireless technologies.Wirel. Pers. Commun. 2021, 119, 289–327. [CrossRef]
13. Chen, Y.; Pan, Q.; Liang, Y.; Hu, Z. AWCL: Adaptive weighted centroid target localization algorithm based on RSSI in WSN. InProceedings of the 2010 3rd International Conference on Computer Science and Information Technology, Chengdu, China, 9–11July 2010; Volume 9, pp. 331–336.
14. Mora-Becerra, F.J. Error Mitigation in RSSI-Based Fingerprinting Localization Using Multiple Communication Channels. Master’sThesis, University of Nebraska-Lincoln, Lincoln, NE, USA, 2016.
15. Jian Yin, L. A New Distance Vector-Hop Localization Algorithm Based on Half-Measure Weighted Centroid. Mob. Inf. Syst. 2019,2019, e9892512. [CrossRef]
16. Shi, Y.; Shi, W.; Liu, X.; Xiao, X. An RSSI Classification and Tracing Algorithm to Improve Trilateration-Based Positioning. Sensors2020, 20, 4244. [CrossRef]
17. Qiu, S.; Wang, Z.; Zhao, H.; Qin, K.; Li, Z.; Hu, H. Inertial/magnetic sensors based pedestrian dead reckoning by means ofmulti-sensor fusion. Inf. Fusion 2018, 39, 108–119. [CrossRef]
18. Townsend, K.; Cufí, C.; Akiba.; Davidson, R. Getting Started with Bluetooth Low Energy: Tools and Techniques for Low-PowerNetworking; O’Reilly Media, Inc.: Sebastopol, CA, USA, 2014.
19. Arun, M.; Sivasankari, N.; Vanathi, D.P.T.; Manimegalai, D.P. Analysis of Average Weight Based Centroid Localization Algorithm forMobile Wireless Sensor Networks; Research India Publications: Delhi, India, 2017; Volume 10, pp. 757–780.
20. Iqbal, N.; Rizwan, A.; Khan, A.N.; Ahmad, R.; Kim, B.W.; Kim, K.; Kim, D.H. Boreholes Data Analysis Architecture Based onClustering and Prediction Models for Enhancing Underground Safety Verification. IEEE Access 2021, 9, 78428–78451. [CrossRef]
21. Rizwan, A.; Iqbal, N.; Ahmad, R.; Kim, D.H. WR-SVM Model Based on the Margin Radius Approach for Solving the MinimumEnclosing Ball Problem in Support Vector Machine Classification. Appl. Sci. 2021, 11, 4657. [CrossRef]
22. Imran.; Ahmad, S.; Kim, D.H. Quantum GIS Based Descriptive and Predictive Data Analysis for Effective Planning of WasteManagement. IEEE Access 2020, 8, 46193–46205. [CrossRef]
23. Qayyum, F.; Afzal, M. Identification of important citations by exploiting research articles’ metadata and cue-terms from content.Scientometrics 2018, 118, 21–43. [CrossRef]
24. Khan, A.N.; Iqbal, N.; Rizwan, A.; Ahmad, R.; Kim, D.H. An Ensemble Energy Consumption Forecasting Model Based onSpatial-Temporal Clustering Analysis in Residential Buildings. Energies 2021, 14, 3020. [CrossRef]
25. Ahmed, U.; Zafar, L.; Qayyum, F.; Arshad Islam, M. Irony Detector at SemEval-2018 Task 3: Irony Detection in English Tweetsusing Word Graph. In Proceedings of the 12th International Workshop on Semantic Evaluation, New Orleans, LA, USA, 5–6 June2018; Association for Computational Linguistics: New Orleans, LA, USA, 2018; pp. 581–586.
26. Zaabar, B.; Cheikhrouhou, O.; Jamil, F.; Ammi, M.; Abid, M. HealthBlock: A secure blockchain-based healthcare data managementsystem. Comput. Netw. 2021, 200, 108500.

Sensors 2021, 21, 6972 29 of 31
27. Ahmad, S.; Ali, J.; Jamil, F.; Whangbo, T.K.; Kim, D. Complex Problems Solution as a Service Based on Predictive Optimization and TasksOrchestration in Smart Cities; Tech Science Press: Henderson, NV, USA, 2021.
28. Ibrahim, M.; Imran, M.; Jamil, F.; Lee, Y.J.; Kim, D.H. EAMA: Efficient adaptive migration algorithm for cloud data centers(CDCs). Symmetry 2021, 13, 690. [CrossRef]
29. Jamil, F.; Kim, D. Enhanced Kalman filter algorithm using fuzzy inference for improving position estimation in indoor navigation.J. Intell. Fuzzy Syst. 2021, 40, 1–15.
30. Iqbal, N.; Ahmad, R.; Jamil, F.; Kim, D.H. Hybrid features prediction model of movie quality using Multi-machine learningtechniques for effective business resource planning. J. Intell. Fuzzy Syst. 2021, 40, 1–22.
31. Mehmood, F.; Ahmad, S.; Ullah, I.; Jamil, F.; Kim, D. Towards a Dynamic Virtual iot Network Based on User Requirements; TechScience Press: Henderson, NV, USA, 2021.
32. Jamil, F.; Qayyum, F.; Alhelaly, S.; Javed, F.; Muthanna, A. Intelligent Microservice Based on Blockchain for HealthcareApplications. CMC-Comput. Mater. Contin. 2021, 69, 2513–2530. [CrossRef]
33. Ali, A.; Iqbal, M.M.; Jamil, H.; Qayyum, F.; Jabbar, S.; Cheikhrouhou, O.; Baz, M.; Jamil, F. An Efficient Dynamic-Decision BasedTask Scheduler for Task Offloading Optimization and Energy Management in Mobile Cloud Computing. Sensors 2021, 21, 4527.[CrossRef] [PubMed]
34. Bin Waheed, M.H.; Jamil, F.; Qayyum, A.; Jamil, H.; Cheikhrouhou, O.; Ibrahim, M.; Bhushan, B.; Hmam, H. A New EfficientArchitecture for Adaptive Bit-Rate Video Streaming. Sustainability 2021, 13, 4541. [CrossRef]
35. Jamil, F.; Kahng, H.K.; Kim, S.; Kim, D.H. Towards Secure Fitness Framework Based on IoT-Enabled Blockchain NetworkIntegrated with Machine Learning Algorithms. Sensors 2021, 21, 1640. [CrossRef] [PubMed]
36. Jamil, F. Energy Service Architecture based on SECaaS and AIoT for Energy Trading and Resource Management in SmartNanogrid. Ph.D. Thesis, JEJU National University, Jeju-do, Korea, 2021.
37. Ahmad, S.; Ullah, I.; Jamil, F.; Kim, D. Toward the Optimal Operation of Hybrid Renewable Energy Resources in Microgrids.Energies 2020, 13, 5482. [CrossRef]
38. Jamil, F.; Kim, D. Payment mechanism for electronic charging using blockchain in smart vehicle. Korea 2019, 30, 31.39. Jamil, F.; Hang, L.; Kim, K.; Kim, D. A novel medical blockchain model for drug supply chain integrity management in a smart
hospital. Electronics 2019, 8, 505. [CrossRef]40. Jamil, F.; Ahmad, S.; Iqbal, N.; Kim, D.H. Towards a remote monitoring of patient vital signs based on IoT-based blockchain
integrity management platforms in smart hospitals. Sensors 2020, 20, 2195. [CrossRef]41. Jamil, F.; Iqbal, M.A.; Amin, R.; Kim, D. Adaptive thermal-aware routing protocol for wireless body area network. Electronics
2019, 8, 47. [CrossRef]42. Ahmad, S.; Jamil, F.; Khudoyberdiev, A.; Kim, D. Accident risk prediction and avoidance in intelligent semi-autonomous vehicles
based on road safety data and driver biological behaviours. J. Intell. Fuzzy Syst. 2020, 38, 4591–4601. [CrossRef]43. Jamil, F.; Cheikhrouhou, O.; Jamil, H.; Koubaa, A.; Derhab, A.; Ferrag, M.A. PetroBlock: A blockchain-based payment mechanism
for fueling smart vehicles. Appl. Sci. 2021, 11, 3055. [CrossRef]44. Kunhoth, J.; Karkar, A.; Al-Maadeed, S.; Al-Ali, A. Indoor positioning and wayfinding systems: A survey. Hum.-Centric Comput.
Inf. Sci. 2020, 10, 18. [CrossRef]45. Mendoza-Silva, G.M.; Torres-Sospedra, J.; Huerta, J. A Meta-Review of Indoor Positioning Systems. Sensors 2019, 19, 4507.
[CrossRef]46. Marques, J.P.P.; Cunha, D.C.; Harada, L.M.; Silva, L.N.; Silva, I.D. A cost-effective trilateration-based radio localization
algorithm using machine learning and sequential least-square programming optimization. In Computer Communications; Elsevier:Amsterdam, The Netherlands, 2021.
47. Beauregard, S. Omnidirectional Pedestrian Navigation for First Responders; IEEE: Piscataway, NJ, USA, 2007; pp. 33–36.48. Kok, M.; Hol, J.D.; Schön, T.B. Using Inertial Sensors for Position and Orientation Estimation. Found. Trends Signal Process. 2017,
11, 1–153. [CrossRef]49. Navigation Using Inertial Sensors [Tutorial]. Available online: https://ieeexplore.ieee.org/document/7081494 (accessed on 1
February 2015).50. Jiménez, A.R.; Seco, F.; Zampella, F.; Prieto, J.C.; Guevara, J. PDR with a Foot-Mounted IMU and Ramp Detection. Sensors 2011,
11, 9393–9410. [CrossRef]51. Lee, G.T.; Seo, S.B.; Jeon, W.S. Indoor Localization by Kalman Filter based Combining of UWB-Positioning and PDR. In
Proceedings of the 2021 IEEE 18th Annual Consumer Communications Networking Conference (CCNC), Las Vegas, NV, USA,9–12 January 2021; pp. 1–6.
52. Sabatini, A.M. Estimating Three-Dimensional Orientation of Human Body Parts by Inertial/Magnetic Sensing. Sensors 2011,11, 1489–1525. [CrossRef]
53. Wang, Y.; Soltani, M.; Hussain, D.M.A. An Attitude Heading and Reference System for Marine Satellite Tracking Antenna. IEEETrans. Ind. Electron. 2017, 64, 3095–3104. [CrossRef]
54. Tong, X.; Li, Z.; Han, G.; Liu, N.; Su, Y.; Ning, J.; Yang, F. Adaptive EKF Based on HMM Recognizer for Attitude Estimation UsingMEMS MARG Sensors. IEEE Sensors J. 2018, 18, 3299–3310. [CrossRef]
55. Sabatelli, S.; Galgani, M.; Fanucci, L.; Rocchi, A. A Double-Stage Kalman Filter for Orientation Tracking With an IntegratedProcessor in 9-D IMU. IEEE Trans. Instrum. Meas. 2013, 62, 590–598. [CrossRef]
Sensors 2021, 21, 6972 30 of 31
56. Zhang, R.; Xia, W.; Jia, Z.; Shen, L. The indoor localization method based on the integration of RSSI and inertial sensor.In Proceedings of the 2014 IEEE 3rd Global Conference on Consumer Electronics (GCCE), Tokyo, Japan, 7–10 October 2014;pp. 332–336.
57. Skog, I.; Handel, P.; Nilsson, J.O.; Rantakokko, J. Zero-Velocity Detection—An Algorithm Evaluation. IEEE Trans. Biomed. Eng.2010, 57, 2657–2666. [CrossRef]
58. Trabelsi, D.; Mohammed, S.; Chamroukhi, F.; Oukhellou, L.; Amirat, Y. An Unsupervised Approach for Automatic ActivityRecognition Based on Hidden Markov Model Regression. IEEE Trans. Autom. Sci. Eng. 2013, 10, 829–835. [CrossRef]
59. Seitz, J.; Vaupel, T.; Meyer, S.; Boronat, J.G.; Thielecke, J. A Hidden Markov Model for pedestrian navigation. In Proceedings ofthe Navigation and Communication 2010 7th Workshop on Positioning, Dresden, Germany, 11–12 March 2010; pp. 120–127.
60. Ryu, S.J.; Kim, J.H. Classification of long-term motions using a two-layered hidden Markov model in a wearable sensor system.In Proceedings of the 2011 IEEE International Conference on Robotics and Biomimetics, Karon Beach, Thailand, 7–11 December2011; pp. 2975–2980.
61. Ahmad, N.; Han, L.; Iqbal, K.; Ahmad, R.; Abid, M.A.; Iqbal, N. SARM: Salah activities recognition model based on smartphone.Electronics 2019, 8, 881. [CrossRef]
62. Ma, H.; Wang, Y.; Wang, K.; Ma, Z. The Optimization for Hyperbolic Positioning of UHF Passive RFID Tags. IEEE Trans. Autom.Sci. Eng. 2017, 14, 1590–1600. [CrossRef]
63. Ma, Y.; Wang, B.; Pei, S.; Zhang, Y.; Zhang, S.; Yu, J. An Indoor Localization Method Based on AOA and PDOA Using VirtualStations in Multipath and NLOS Environments for Passive UHF RFID. IEEE Access 2018, 6, 31772–31782. [CrossRef]
64. Huang, K.; He, K.; Du, X. A Hybrid Method to Improve the BLE-Based Indoor Positioning in a Dense Bluetooth Environment.Sensors 2019, 19, 424. [CrossRef]
65. Ozer, A.; John, E. Improving the Accuracy of Bluetooth Low Energy Indoor Positioning System Using Kalman Filtering. InProceedings of the 2016 International Conference on Computational Science and Computational Intelligence (CSCI), Las Vegas,NV, USA, 15–17 December 2016; pp. 180–185.
66. Lee, M.S.; Ju, H.; Song, J.W.; Park, C.G. Kinematic Model-Based Pedestrian Dead Reckoning for Heading Correction and LowerBody Motion Tracking. Sensors 2015, 15, 28129–28153. [CrossRef]
67. Wang, Y.; Yang, X.; Zhao, Y.; Liu, Y.; Cuthbert, L. Bluetooth positioning using RSSI and triangulation methods. In Proceedings ofthe 2013 IEEE 10th Consumer Communications and Networking Conference (CCNC), Las Vegas, NV, USA, 11–14 January 2013;pp. 837–842.
68. Ji, M.; Kim, J.; Cho, Y.; Lee, Y.; Park, S. A novel Wi-Fi AP localization method using Monte Carlo path-loss model fitting simulation.In Proceedings of the 2013 IEEE 24th Annual International Symposium on Personal, Indoor, and Mobile Radio Communications(PIMRC), London, UK, 8–11 September 2013; pp. 3487–3491.
69. Zhao, Y.; Li, X.; Wang, Y.; Xu, C.Z. Biased Constrained Hybrid Kalman Filter for Range-Based Indoor Localization. IEEE Sens. J.2018, 18, 1647–1655. [CrossRef]
70. Wang, X.; Gao, L.; Mao, S.; Pandey, S. CSI-Based Fingerprinting for Indoor Localization: A Deep Learning Approach. IEEE Trans.Veh. Technol. 2017, 66, 763–776. [CrossRef]
71. Gu, F.; Khoshelham, K.; Yu, C.; Shang, J. Accurate Step Length Estimation for Pedestrian Dead Reckoning Localization UsingStacked Autoencoders. IEEE Trans. Instrum. Meas. 2019, 68, 2705–2713. [CrossRef]
72. Wagstaff, B.; Kelly, J. LSTM-Based Zero-Velocity Detection for Robust Inertial Navigation. In Proceedings of the 2018 InternationalConference on Indoor Positioning and Indoor Navigation (IPIN), Nantes, France, 24–27 September 2018; pp. 1–8.
73. Lan, K.C.; Shih, W.Y. On Calibrating the Sensor Errors of a PDR-Based Indoor Localization System. Sensors 2013, 13, 4781–4810.[CrossRef]
74. Bao, H.; Wong, W.C. A Novel Map-Based Dead-Reckoning Algorithm for Indoor Localization. J. Sens. Actuat. Netw. 2014,3, 44–63. [CrossRef]
75. Mikov, A.; Moschevikin, A.; Fedorov, A.; Sikora, A. A localization system using inertial measurement units from wirelesscommercial hand-held devices. In Proceedings of the International Conference on Indoor Positioning and Indoor Navigation,Montbeliard, France, 28–31 October 2013; pp. 1–7.
76. Jamil, F.; Kim, D.H. Improving Accuracy of the Alpha-Beta Filter Algorithm Using an ANN-Based Learning Mechanism inIndoor Navigation System. Sensors 2019, 19, 3946. [CrossRef]
77. Jamil, F.; Iqbal, N.; Ahmad, S.; Kim, D.H. Toward Accurate Position Estimation Using Learning to Prediction Algorithm in IndoorNavigation. Sensors 2020, 20, 4410. [CrossRef]
78. Tian, Q.; Salcic, Z.; Wang, K.I.K.; Pan, Y. An enhanced pedestrian dead reckoning approach for pedestrian tracking usingsmartphones. In Proceedings of the 2015 IEEE Tenth International Conference on Intelligent Sensors, Sensor Networks andInformation Processing (ISSNIP), Singapore, 7–9 April 2015; pp. 1–6.
79. Jimenez Ruiz, A.R.; Seco Granja, F.; Prieto Honorato, J.C.; Guevara Rosas, J.I. Accurate Pedestrian Indoor Navigation by TightlyCoupling Foot-Mounted IMU and RFID Measurements. IEEE Trans. Instrum. Meas. 2012, 61, 178–189. [CrossRef]
80. Chirakkal, V.V.; Park, M.; Han, D.S. Exploring Smartphone-Based Indoor Navigation: A QR Code Assistance-Based Approach.IEIE Trans. Smart Process. Comput. 2015, 4, 173–182. [CrossRef]
81. Meliones, A.; Sampson, D. Blind MuseumTourer: A System for Self-Guided Tours in Museums and Blind Indoor Navigation.Technologies 2018, 6, 4. [CrossRef]
Sensors 2021, 21, 6972 31 of 31
82. Zhou, Y.; Zheng, X.; Chen, R.; Xiong, H.; Guo, S. Image-Based Localization Aided Indoor Pedestrian Trajectory Estimation UsingSmartphones. Sensors 2018, 18, 258. [CrossRef]
83. Al-Madani, B.; Orujov, F.; Maskeliunas, R.; Damasevicius, R.; Venckauskas, A. Fuzzy Logic Type-2 Based Wireless IndoorLocalization System for Navigation of Visually Impaired People in Buildings. Sensors 2019, 19, 2114. [CrossRef]
84. Wang, Y.; Hussain, A.; Soltani, M. A MEMS-based adaptive AHRS for marine satellite tracking antenna. IFAC-PapersOnLine 2015,48, 121–126. [CrossRef]
85. Wan, E.A.; Van Der Merwe, R. The unscented Kalman filter for nonlinear estimation. In Proceedings of the IEEE 2000 AdaptiveSystems for Signal Processing, Communications, and Control Symposium (Cat. No. 00EX373), Lake Louise, AB, Canada,4 October 2000; pp. 153–158.
86. Julier, S.J.; Uhlmann, J.K. Unscented filtering and nonlinear estimation. Proc. IEEE 2004, 92, 401–422. [CrossRef]87. Ghobadi, M.; Singla, P.; Esfahani, E.T. Robust attitude estimation from uncertain observations of inertial sensors using covariance
inflated multiplicative extended Kalman filter. IEEE Trans. Instrum. Meas. 2017, 67, 209–217. [CrossRef]88. Eckert-Gallup, A.; Martin, N. Kernel density estimation (KDE) with adaptive bandwidth selection for environmental contours of
extreme sea states. In Proceedings of the OCEANS 2016 MTS/IEEE Monterey, Monterey, CA, USA, 19–23 September 2016; pp.1–5.
89. Rabiner, L.; Juang, B. An introduction to hidden Markov models. IEEE ASSP Mag. 1986, 3, 4–16. [CrossRef]90. Oudelha, M.; Ainon, R.N. HMM parameters estimation using hybrid Baum-Welch genetic algorithm. In Proceedings of the 2010
International Symposium on Information Technology, Kuala Lumpur, Malaysia, 15–17 June 2010; Volume 2, pp. 542–545.91. Yen, Y.; Fanty, M.; Cole, R. Speech recognition using neural networks with forward-backward probability generated targets. In
Proceedings of the 1997 IEEE International Conference on Acoustics, Speech, and Signal Processing, Munich, Germany, 21–24April 1997; Volume 4, pp. 3241–3244.
92. Yang, W.; Xiu, C.; Zhang, J.; Yang, D. A novel 3D pedestrian navigation method for a multiple sensors-based foot-mountedinertial system. Sensors 2017, 17, 2695. [CrossRef] [PubMed]
93. Brena, R.F.; García-Vázquez, J.P.; Galván-Tejada, C.E.; Muñoz-Rodriguez, D.; Vargas-Rosales, C.; Fangmeyer, J. Evolution ofindoor positioning technologies: A survey. J. Sens. 2017, 2017. [CrossRef]
94. Friis, H.T. A note on a simple transmission formula. Proc. IRE 1946, 34, 254–256. [CrossRef]