Unlock the power of girls now (Accessible Executive Summary)
Upload
khangminh22Category
view
0download
0
�����������������
Citation: Shin, K.; McConville, R.;
Metatla, O.; Chang, M.; Han, C.; Lee,
J.; Roudaut, A. Outdoor Localization
Using BLE RSSI and Accessible
Pedestrian Signals for the Visually
Impaired at Intersections. Sensors
2022, 22, 371. https://doi.org/
10.3390/s22010371
Academic Editor: Arturo de la
Escalera Hueso
Received: 17 November 2021
Accepted: 28 December 2021
Published: 4 January 2022
Publisher’s Note: MDPI stays neutral
with regard to jurisdictional claims in
published maps and institutional affil-
iations.
Copyright: © 2022 by the authors.
Licensee MDPI, Basel, Switzerland.
This article is an open access article
distributed under the terms and
conditions of the Creative Commons
Attribution (CC BY) license (https://
creativecommons.org/licenses/by/
4.0/).
sensors
Article
Outdoor Localization Using BLE RSSI and AccessiblePedestrian Signals for the Visually Impaired at IntersectionsKiyoung Shin 1,2 , Ryan McConville 3 , Oussama Metatla 2, Minhye Chang 1 , Chiyoung Han 4, Junhaeng Lee 4
and Anne Roudaut 2,*
1 RSS Center, Korea Electrotechnology Research Institute, Ansan 15588, Korea; [email protected] (K.S.);[email protected] (M.C.)
2 Department of Computer Science, University of Bristol, Bristol BS8 1TR, UK; [email protected] Department of Engineering Mathematics, University of Bristol, Bristol BS8 1TR, UK;
[email protected] Corporate Affiliated Research Institute, Human Care Co., Ltd., Ansan 15258, Korea;
[email protected] (C.H.); [email protected] (J.L.)* Correspondence: [email protected]
Abstract: One of the major challenges for blind and visually impaired (BVI) people is traveling safelyto cross intersections on foot. Many countries are now generating audible signals at crossings forvisually impaired people to help with this problem. However, these accessible pedestrian signals canresult in confusion for visually impaired people as they do not know which signal must be interpretedfor traveling multiple crosses in complex road architecture. To solve this problem, we propose anassistive system called CAS (Crossing Assistance System) which extends the principle of the BLE(Bluetooth Low Energy) RSSI (Received Signal Strength Indicator) signal for outdoor and indoorlocation tracking and overcomes the intrinsic limitation of outdoor noise to enable us to locate theuser effectively. We installed the system on a real-world intersection and collected a set of data fordemonstrating the feasibility of outdoor RSSI tracking in a series of two studies. In the first study,our goal was to show the feasibility of using outdoor RSSI on the localization of four zones. Weused a k-nearest neighbors (kNN) method and showed it led to 99.8% accuracy. In the second study,we extended our work to a more complex setup with nine zones, evaluated both the kNN and anadditional method, a Support Vector Machine (SVM) with various RSSI features for classification. Wefound that the SVM performed best using the RSSI average, standard deviation, median, interquartilerange (IQR) of the RSSI over a 5 s window. The best method can localize people with 97.7% accuracy.We conclude this paper by discussing how our system can impact navigation for BVI users in outdoorand indoor setups and what are the implications of these findings on the design of both wearableand traffic assistive technology for blind pedestrian navigation.
Keywords: visually impaired; localization at an intersection; pedestrian navigation; BLE RSSI
1. Introduction
APS (Accessible Pedestrian Signals) has been developed to help blind and visuallyimpaired (BVI) people cross the road safely. Such systems involve the end-user pressing abutton at the crossroads to get information about the traffic. Such information comes in anaudible and/or vibrotactile form. Although such systems are widespread, they suffer fromsome limitations, including the difficulties of locating a traffic signal pole and activatingthe APS system, and uncertainties around crossing cycles [1].
One way to improve APS is to use walking navigation technologies which mainly useGPS (Global Positioning System) to determine the location of users [2–4]. However, thissolution has limitations. The standalone GPS determines position with an accuracy of 5 to10 m [5], but this can go up to 7 to 13 m coverage position error using a Smartphone in anurban environment [6]. In many countries, the width of a single carriageway with two lanes
Sensors 2022, 22, 371. https://doi.org/10.3390/s22010371 https://www.mdpi.com/journal/sensors

Sensors 2022, 22, 371 2 of 15
is 5.5 to 7.3 m and the width of a dual carriageway with two lanes is 14.6 m [7,8]. Becausethe width of these roads is within the margin of error of the GPS, it is not possible to knowwhich sidewalk a pedestrian is on. Additionally, some of the applications required forsuch systems (e.g., lane-level positioning system, collision warning system and GeographicInformation System (GIS)) require far better accuracy than that given by the standaloneGPS [9].
Another solution is to use Bluetooth, such as Bluetooth Low Energy (BLE), for po-sitioning. Such systems have started appearing in a few countries such as Korea [10,11],France [12], and the US [13]. The pedestrian using a remote control, that pairs with aBluetooth beacon using Bluetooth Low Energy (Bluetooth 4.0), placed at the beginningand end of a crossing, can know when to cross the road. The estimated distance from eachnearby beacon is calculated by analyzing the Received Signal Strength Indicator (RSSI)from the network of beacons that are deployed at the given location. One way to mea-sure the distance using RSSI is to calculate the distance in meters within the radius of theBluetooth beacon [14]. However, although such a system can be efficient in the case of asingle road crossing, it becomes more challenging for the end-users in the case of complexroad architectures that are typical in larger cities. In such cases, it can be challenging forpedestrians to identify which Bluetooth beacon the signal comes from, potentially leadingto unsafe crossings. In order that BVI people can cross an intersection, more information isrequired by the system, such as recognizing the location of the intersection, recognizing thedirection of pedestrians, and recognition of pedestrian signals [15].
In this paper, we studied a method to overcome the problems of the Bluetooth systemto enable accurate positioning outdoors. We experimentally verified various features withk-Nearest Neighbors (kNN) and Support Vector Machine (SVM) classifiers, which areamong the most widely used machine learning classifiers, and various RSSI window sizesfor moving average filter to reduce the noise of RSSI, discovering which method results inthe best performance. An initial survey with end-users shows indeed that a technology thathas a short response time would be beneficial, thus motivating our use of RSSI Bluetooth.After presenting our system we investigate how to tune our algorithm in a series of twostudies. In the first study, we divided an intersection into four zones to test the feasibility.We achieved 99.8% accuracy using kNN with the features being the average values of eachRSSI over a sliding 3 s window for moving average. In a second study, we investigated anadditional machine learning classifier, the SVM, the features of which performed best whenclassifying the location of the person at the intersection within nine zones. We installed thesystem at a real-world intersection and collected data. We achieved 97.7% accuracy usingan SVM with the features being the average values of each RSSI, the standard deviation,median, and IQR using a 10-point moving average. Thus, we found that the area where aBVI person is located can be detected with high accuracy in this way, using our CrossingAssistance System (CAS) measured through a smartphone. Through this, it is possibleto deploy the APS to provide core information to BVI people for walking navigation bycalculating their location information.
In summary, our contributions are: (1) an improvement of APS that localizes a pedes-trian using RSSI Bluetooth outdoors; (2) An initial survey demonstrating that BVI pedestri-ans need a rapid response for such scenarios; (3) a series of two studies to tune the algorithmshowing we can detect the location of people with 97.7% accuracy at a real-world intersec-tion; (4) a discussion on considerations to to move this work further and design implicationsfor wearable and traffic assistive technology for blind navigation/intersection crossing.
2. Related Works2.1. Accessible Pedestrian Signals
Accessible pedestrian signals (APS), as shown in Figure 1, let pedestrians who areblind or visually impaired know precisely when the walk interval begins by providingaudible and/or vibrotactile information coinciding with visual pedestrian signals [16].
Sensors 2022, 22, 371 3 of 15
Sensors 2022, 21, x FOR PEER REVIEW 3 of 16
2. Related Works 2.1. Accessible Pedestrian Signals
Accessible pedestrian signals (APS), as shown in Figure 1, let pedestrians who are blind or visually impaired know precisely when the walk interval begins by providing audible and/or vibrotactile information coinciding with visual pedestrian signals [16].
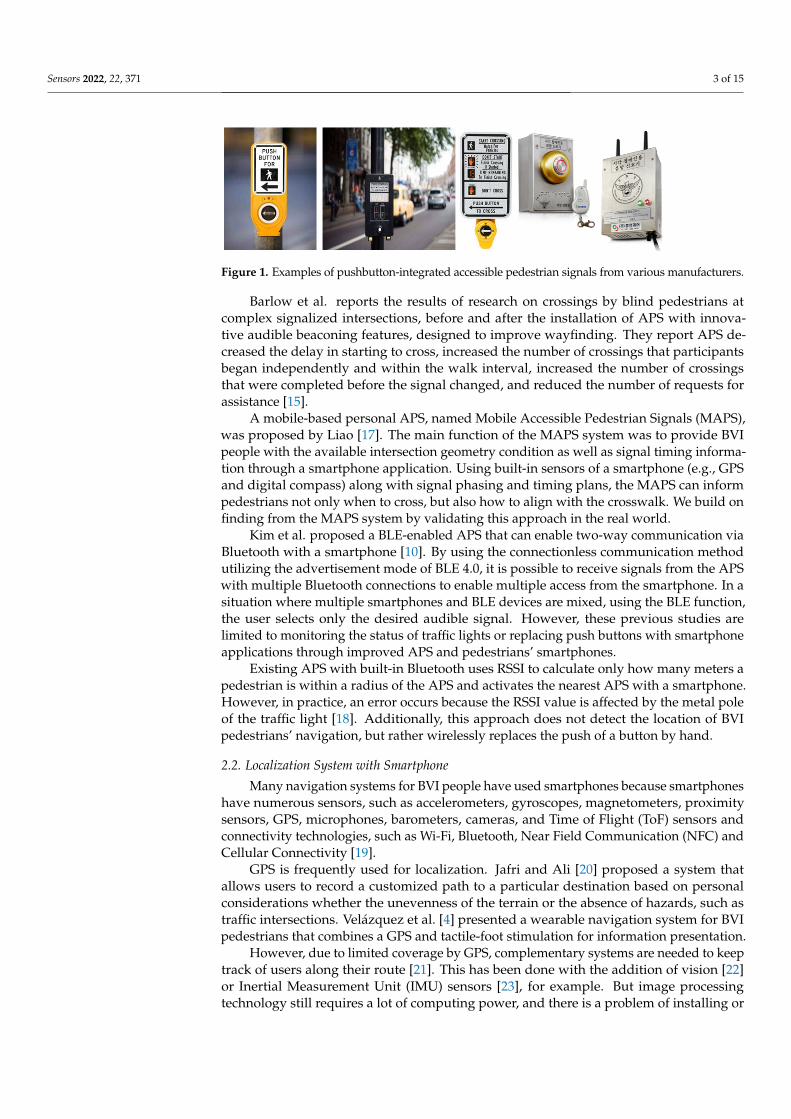
Figure 1. Examples of pushbutton-integrated accessible pedestrian signals from various manufacturers.
Barlow et al. reports the results of research on crossings by blind pedestrians at com-plex signalized intersections, before and after the installation of APS with innovative au-dible beaconing features, designed to improve wayfinding. They report APS decreased the delay in starting to cross, increased the number of crossings that participants began independently and within the walk interval, increased the number of crossings that were completed before the signal changed, and reduced the number of requests for assistance [15].
A mobile-based personal APS, named Mobile Accessible Pedestrian Signals (MAPS), was proposed by Liao [17]. The main function of the MAPS system was to provide BVI people with the available intersection geometry condition as well as signal timing infor-mation through a smartphone application. Using built-in sensors of a smartphone (e.g., GPS and digital compass) along with signal phasing and timing plans, the MAPS can in-form pedestrians not only when to cross, but also how to align with the crosswalk. We build on finding from the MAPS system by validating this approach in the real world.
Kim et al. proposed a BLE-enabled APS that can enable two-way communication via Bluetooth with a smartphone [10]. By using the connectionless communication method utilizing the advertisement mode of BLE 4.0, it is possible to receive signals from the APS with multiple Bluetooth connections to enable multiple access from the smartphone. In a situation where multiple smartphones and BLE devices are mixed, using the BLE function, the user selects only the desired audible signal. However, these previous studies are lim-ited to monitoring the status of traffic lights or replacing push buttons with smartphone applications through improved APS and pedestrians’ smartphones.
Existing APS with built-in Bluetooth uses RSSI to calculate only how many meters a pedestrian is within a radius of the APS and activates the nearest APS with a smartphone. However, in practice, an error occurs because the RSSI value is affected by the metal pole of the traffic light [18]. Additionally, this approach does not detect the location of BVI pedestrians’ navigation, but rather wirelessly replaces the push of a button by hand.
2.2. Localization System with Smartphone Many navigation systems for BVI people have used smartphones because
smartphones have numerous sensors, such as accelerometers, gyroscopes, magnetome-ters, proximity sensors, GPS, microphones, barometers, cameras, and Time of Flight (ToF) sensors and connectivity technologies, such as Wi-Fi, Bluetooth, Near Field Communica-tion (NFC) and Cellular Connectivity [19].
GPS is frequently used for localization. Jafri and Ali [20] proposed a system that al-lows users to record a customized path to a particular destination based on personal
Figure 1. Examples of pushbutton-integrated accessible pedestrian signals from various manufacturers.
Barlow et al. reports the results of research on crossings by blind pedestrians atcomplex signalized intersections, before and after the installation of APS with innova-tive audible beaconing features, designed to improve wayfinding. They report APS de-creased the delay in starting to cross, increased the number of crossings that participantsbegan independently and within the walk interval, increased the number of crossingsthat were completed before the signal changed, and reduced the number of requests forassistance [15].
A mobile-based personal APS, named Mobile Accessible Pedestrian Signals (MAPS),was proposed by Liao [17]. The main function of the MAPS system was to provide BVIpeople with the available intersection geometry condition as well as signal timing informa-tion through a smartphone application. Using built-in sensors of a smartphone (e.g., GPSand digital compass) along with signal phasing and timing plans, the MAPS can informpedestrians not only when to cross, but also how to align with the crosswalk. We build onfinding from the MAPS system by validating this approach in the real world.
Kim et al. proposed a BLE-enabled APS that can enable two-way communication viaBluetooth with a smartphone [10]. By using the connectionless communication methodutilizing the advertisement mode of BLE 4.0, it is possible to receive signals from the APSwith multiple Bluetooth connections to enable multiple access from the smartphone. In asituation where multiple smartphones and BLE devices are mixed, using the BLE function,the user selects only the desired audible signal. However, these previous studies arelimited to monitoring the status of traffic lights or replacing push buttons with smartphoneapplications through improved APS and pedestrians’ smartphones.
Existing APS with built-in Bluetooth uses RSSI to calculate only how many meters apedestrian is within a radius of the APS and activates the nearest APS with a smartphone.However, in practice, an error occurs because the RSSI value is affected by the metal poleof the traffic light [18]. Additionally, this approach does not detect the location of BVIpedestrians’ navigation, but rather wirelessly replaces the push of a button by hand.
2.2. Localization System with Smartphone
Many navigation systems for BVI people have used smartphones because smartphoneshave numerous sensors, such as accelerometers, gyroscopes, magnetometers, proximitysensors, GPS, microphones, barometers, cameras, and Time of Flight (ToF) sensors andconnectivity technologies, such as Wi-Fi, Bluetooth, Near Field Communication (NFC) andCellular Connectivity [19].
GPS is frequently used for localization. Jafri and Ali [20] proposed a system thatallows users to record a customized path to a particular destination based on personalconsiderations whether the unevenness of the terrain or the absence of hazards, such astraffic intersections. Velázquez et al. [4] presented a wearable navigation system for BVIpedestrians that combines a GPS and tactile-foot stimulation for information presentation.
However, due to limited coverage by GPS, complementary systems are needed to keeptrack of users along their route [21]. This has been done with the addition of vision [22]or Inertial Measurement Unit (IMU) sensors [23], for example. But image processingtechnology still requires a lot of computing power, and there is a problem of installing or
Sensors 2022, 22, 371 4 of 15
holding a camera that can look ahead. The IMU sensor using dead reckoning requires anadditional process to remove the accumulated error.
While GPS is mostly used outdoors, Bluetooth is used indoors where GPS is notavailable [24–27]. After installing several Bluetooth beacons, the method calculated theuser’s position using the fingerprint method [27], triangulation [26] method, etc. Since thewidth of the intersection is within the error range of the GPS, it is not easy to know exactlywhich sidewalk BVI pedestrians are on. This calls for the need to investigate the use of BLERSSI at the intersection to increase the accuracy of localization for the visually impaired.
2.3. RSSI-Based Bluetooth Analysis
Positioning or localization technology using Bluetooth Low Energy (BLE) RSSI has beenactively studied until recently in an indoor environment that GPS does not cover [28–32]. In-door positioning methods usually require a dataset of collected RSSI data and the associatedlabeled position. This dataset is called the reference set, or the fingerprint database. Then,the methods estimate the current user position using the knowledge from the referenceset. Some popular indoor positioning techniques use machine learning algorithms such asHidden Markov Models (HMMs), kNN, SVM, and Deep Neural Networks (DNN) [30] toperform this estimation automatically and accurately.
The set of RSSI values measured from each beacon is used to train the machine learningalgorithm, while the output of the model is predicted location. Since the RSSI value issensitive to the surrounding environment, e.g., due to the movement of people or vehicles,noise-canceling methods such as the Kalman filter [33], particle filter [34], Mean and Medianfilter [29], and the moving average filter [35] are typically used to improve performance.
3. CAS System Implementation
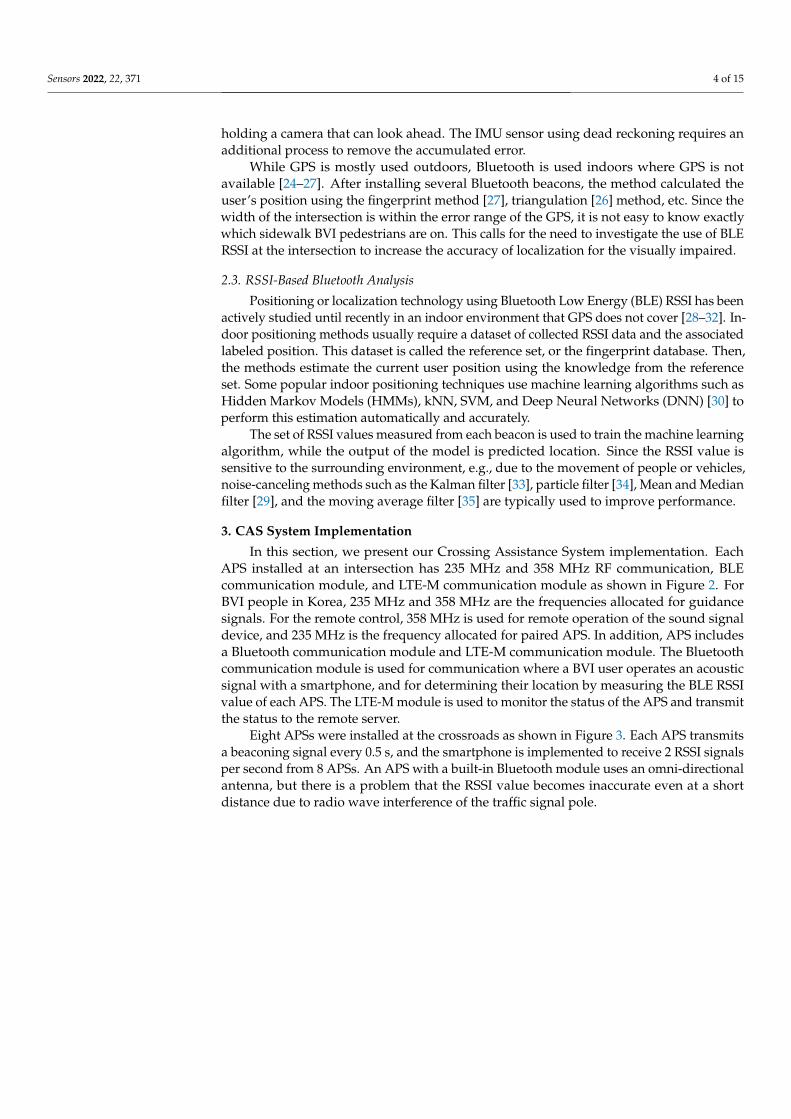
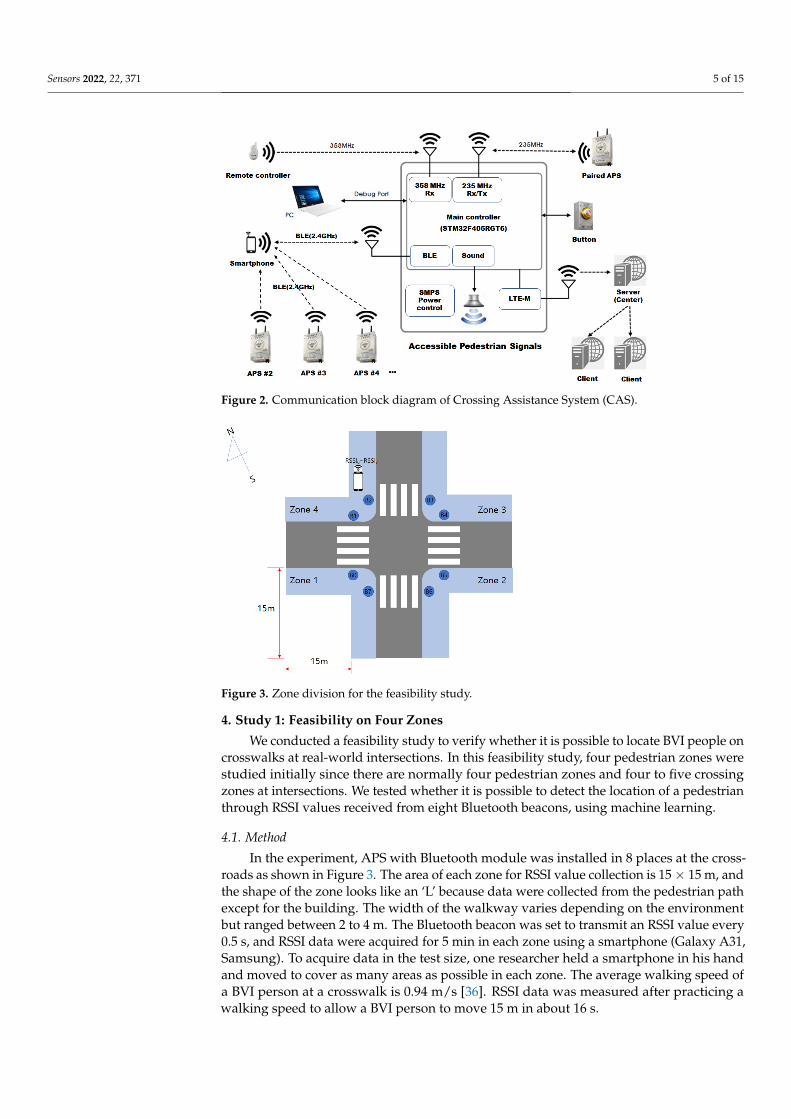
In this section, we present our Crossing Assistance System implementation. EachAPS installed at an intersection has 235 MHz and 358 MHz RF communication, BLEcommunication module, and LTE-M communication module as shown in Figure 2. ForBVI people in Korea, 235 MHz and 358 MHz are the frequencies allocated for guidancesignals. For the remote control, 358 MHz is used for remote operation of the sound signaldevice, and 235 MHz is the frequency allocated for paired APS. In addition, APS includesa Bluetooth communication module and LTE-M communication module. The Bluetoothcommunication module is used for communication where a BVI user operates an acousticsignal with a smartphone, and for determining their location by measuring the BLE RSSIvalue of each APS. The LTE-M module is used to monitor the status of the APS and transmitthe status to the remote server.
Eight APSs were installed at the crossroads as shown in Figure 3. Each APS transmitsa beaconing signal every 0.5 s, and the smartphone is implemented to receive 2 RSSI signalsper second from 8 APSs. An APS with a built-in Bluetooth module uses an omni-directionalantenna, but there is a problem that the RSSI value becomes inaccurate even at a shortdistance due to radio wave interference of the traffic signal pole.
Sensors 2022, 22, 371 5 of 15Sensors 2022, 21, x FOR PEER REVIEW 5 of 16
Figure 2. Communication block diagram of Crossing Assistance System (CAS).
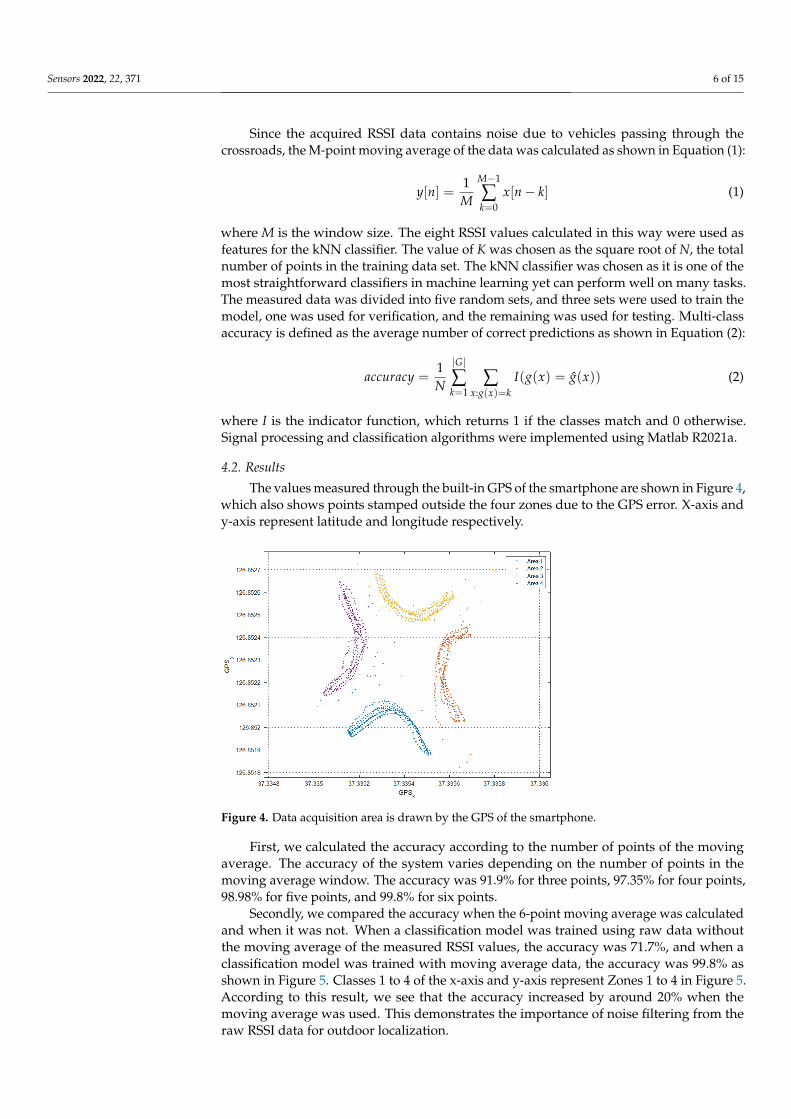
Figure 3. Zone division for the feasibility study.
4. Study 1: Feasibility on Four Zones We conducted a feasibility study to verify whether it is possible to locate BVI people
on crosswalks at real-world intersections. In this feasibility study, four pedestrian zones were studied initially since there are normally four pedestrian zones and four to five cross-ing zones at intersections. We tested whether it is possible to detect the location of a pedestrian through RSSI values received from eight Bluetooth beacons, using machine learning.
4.1. Method In the experiment, APS with Bluetooth module was installed in 8 places at the cross-
roads as shown in Figure 3. The area of each zone for RSSI value collection is 15 × 15 m, and the shape of the zone looks like an ‘L’ because data were collected from the pedestrian path except for the building. The width of the walkway varies depending on the environ-ment but ranged between 2 to 4 m. The Bluetooth beacon was set to transmit an RSSI value every 0.5 s, and RSSI data were acquired for 5 min in each zone using a smartphone (Gal-axy A31, Samsung). To acquire data in the test size, one researcher held a smartphone in his hand and moved to cover as many areas as possible in each zone. The average walking speed of a BVI person at a crosswalk is 0.94 m/s [36]. RSSI data was measured after prac-ticing a walking speed to allow a BVI person to move 15 m in about 16 s.
Figure 2. Communication block diagram of Crossing Assistance System (CAS).
Sensors 2022, 21, x FOR PEER REVIEW 5 of 16
Figure 2. Communication block diagram of Crossing Assistance System (CAS).
Figure 3. Zone division for the feasibility study.
4. Study 1: Feasibility on Four Zones We conducted a feasibility study to verify whether it is possible to locate BVI people
on crosswalks at real-world intersections. In this feasibility study, four pedestrian zones were studied initially since there are normally four pedestrian zones and four to five cross-ing zones at intersections. We tested whether it is possible to detect the location of a pedestrian through RSSI values received from eight Bluetooth beacons, using machine learning.
4.1. Method In the experiment, APS with Bluetooth module was installed in 8 places at the cross-
roads as shown in Figure 3. The area of each zone for RSSI value collection is 15 × 15 m, and the shape of the zone looks like an ‘L’ because data were collected from the pedestrian path except for the building. The width of the walkway varies depending on the environ-ment but ranged between 2 to 4 m. The Bluetooth beacon was set to transmit an RSSI value every 0.5 s, and RSSI data were acquired for 5 min in each zone using a smartphone (Gal-axy A31, Samsung). To acquire data in the test size, one researcher held a smartphone in his hand and moved to cover as many areas as possible in each zone. The average walking speed of a BVI person at a crosswalk is 0.94 m/s [36]. RSSI data was measured after prac-ticing a walking speed to allow a BVI person to move 15 m in about 16 s.
Figure 3. Zone division for the feasibility study.
4. Study 1: Feasibility on Four Zones
We conducted a feasibility study to verify whether it is possible to locate BVI people oncrosswalks at real-world intersections. In this feasibility study, four pedestrian zones werestudied initially since there are normally four pedestrian zones and four to five crossingzones at intersections. We tested whether it is possible to detect the location of a pedestrianthrough RSSI values received from eight Bluetooth beacons, using machine learning.
4.1. Method
In the experiment, APS with Bluetooth module was installed in 8 places at the cross-roads as shown in Figure 3. The area of each zone for RSSI value collection is 15× 15 m, andthe shape of the zone looks like an ‘L’ because data were collected from the pedestrian pathexcept for the building. The width of the walkway varies depending on the environmentbut ranged between 2 to 4 m. The Bluetooth beacon was set to transmit an RSSI value every0.5 s, and RSSI data were acquired for 5 min in each zone using a smartphone (Galaxy A31,Samsung). To acquire data in the test size, one researcher held a smartphone in his handand moved to cover as many areas as possible in each zone. The average walking speed ofa BVI person at a crosswalk is 0.94 m/s [36]. RSSI data was measured after practicing awalking speed to allow a BVI person to move 15 m in about 16 s.
Sensors 2022, 22, 371 6 of 15
Since the acquired RSSI data contains noise due to vehicles passing through thecrossroads, the M-point moving average of the data was calculated as shown in Equation (1):
y[n] =1M
M−1
∑k=0
x[n− k] (1)
where M is the window size. The eight RSSI values calculated in this way were used asfeatures for the kNN classifier. The value of K was chosen as the square root of N, the totalnumber of points in the training data set. The kNN classifier was chosen as it is one of themost straightforward classifiers in machine learning yet can perform well on many tasks.The measured data was divided into five random sets, and three sets were used to train themodel, one was used for verification, and the remaining was used for testing. Multi-classaccuracy is defined as the average number of correct predictions as shown in Equation (2):
accuracy =1N
|G|
∑k=1
∑x:g(x)=k
I(g(x) = g(x)) (2)
where I is the indicator function, which returns 1 if the classes match and 0 otherwise.Signal processing and classification algorithms were implemented using Matlab R2021a.
4.2. Results
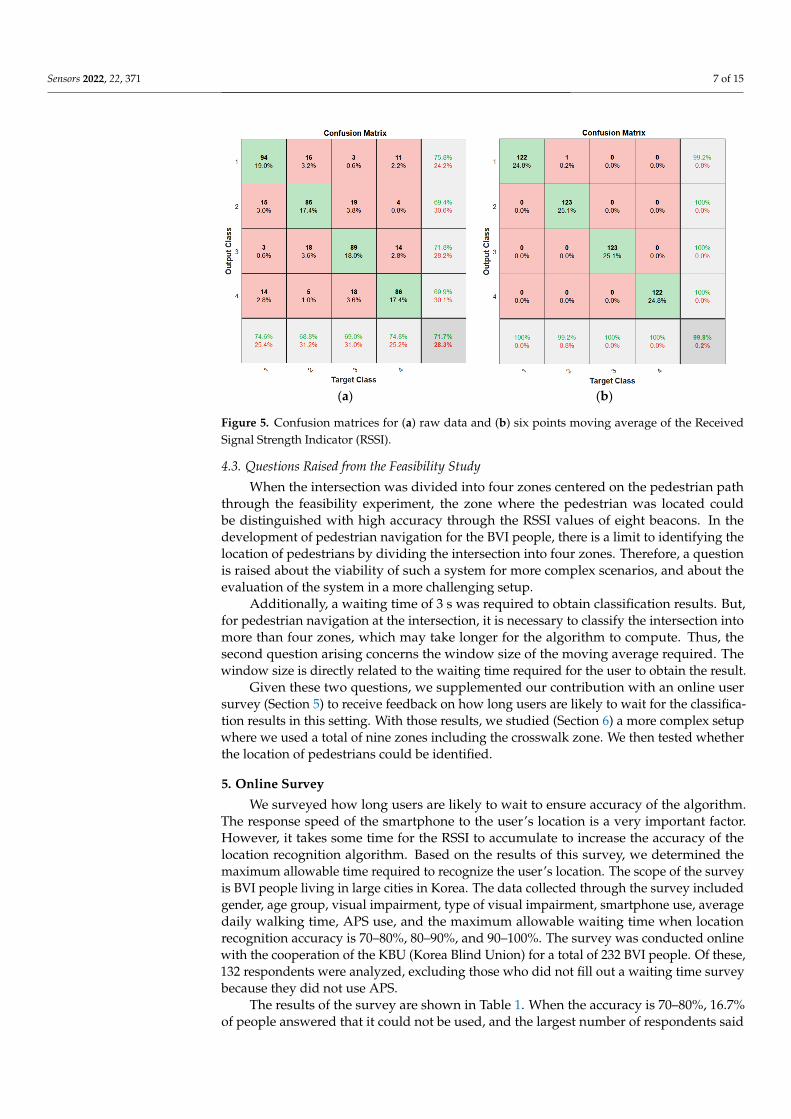
The values measured through the built-in GPS of the smartphone are shown in Figure 4,which also shows points stamped outside the four zones due to the GPS error. X-axis andy-axis represent latitude and longitude respectively.
Sensors 2022, 21, x FOR PEER REVIEW 6 of 16
Since the acquired RSSI data contains noise due to vehicles passing through the cross-roads, the M-point moving average of the data was calculated as shown in Equation (1):
𝑦[𝑛] = 1𝑀 𝑥[𝑛 − 𝑘] (1)
where M is the window size. The eight RSSI values calculated in this way were used as features for the kNN classifier. The value of K was chosen as the square root of N, the total number of points in the training data set. The kNN classifier was chosen as it is one of the most straightforward classifiers in machine learning yet can perform well on many tasks. The measured data was divided into five random sets, and three sets were used to train the model, one was used for verification, and the remaining was used for testing. Multi-class accuracy is defined as the average number of correct predictions as shown in Equa-tion (2):
𝑎𝑐𝑐𝑢𝑟𝑎𝑐𝑦 = 1𝑁 𝐼(𝑔(𝑥 = 𝑔(𝑥 ): ( )| |
(2)
where I is the indicator function, which returns 1 if the classes match and 0 otherwise. Signal processing and classification algorithms were implemented using Matlab R2021a.
4.2. Results The values measured through the built-in GPS of the smartphone are shown in Fig-
ure 4, which also shows points stamped outside the four zones due to the GPS error. X-axis and y-axis represent latitude and longitude respectively.
Figure 4. Data acquisition area is drawn by the GPS of the smartphone.
First, we calculated the accuracy according to the number of points of the moving average. The accuracy of the system varies depending on the number of points in the moving average window. The accuracy was 91.9% for three points, 97.35% for four points, 98.98% for five points, and 99.8% for six points.
Secondly, we compared the accuracy when the 6-point moving average was calcu-lated and when it was not. When a classification model was trained using raw data with-out the moving average of the measured RSSI values, the accuracy was 71.7%, and when a classification model was trained with moving average data, the accuracy was 99.8% as shown in Figure 5. Classes 1 to 4 of the x-axis and y-axis represent Zones 1 to 4 in Figure 5. According to this result, we see that the accuracy increased by around 20% when the moving average was used. This demonstrates the importance of noise filtering from the raw RSSI data for outdoor localization.
Figure 4. Data acquisition area is drawn by the GPS of the smartphone.
First, we calculated the accuracy according to the number of points of the movingaverage. The accuracy of the system varies depending on the number of points in themoving average window. The accuracy was 91.9% for three points, 97.35% for four points,98.98% for five points, and 99.8% for six points.
Secondly, we compared the accuracy when the 6-point moving average was calculatedand when it was not. When a classification model was trained using raw data withoutthe moving average of the measured RSSI values, the accuracy was 71.7%, and when aclassification model was trained with moving average data, the accuracy was 99.8% asshown in Figure 5. Classes 1 to 4 of the x-axis and y-axis represent Zones 1 to 4 in Figure 5.According to this result, we see that the accuracy increased by around 20% when themoving average was used. This demonstrates the importance of noise filtering from theraw RSSI data for outdoor localization.
Sensors 2022, 22, 371 7 of 15Sensors 2022, 21, x FOR PEER REVIEW 7 of 16
(a) (b)
Figure 5. Confusion matrices for (a) raw data and (b) six points moving average of the Received Signal Strength Indicator (RSSI).
4.3. Questions Raised from the Feasibility Study When the intersection was divided into four zones centered on the pedestrian path
through the feasibility experiment, the zone where the pedestrian was located could be distinguished with high accuracy through the RSSI values of eight beacons. In the devel-opment of pedestrian navigation for the BVI people, there is a limit to identifying the lo-cation of pedestrians by dividing the intersection into four zones. Therefore, a question is raised about the viability of such a system for more complex scenarios, and about the evaluation of the system in a more challenging setup.
Additionally, a waiting time of 3 s was required to obtain classification results. But, for pedestrian navigation at the intersection, it is necessary to classify the intersection into more than four zones, which may take longer for the algorithm to compute. Thus, the second question arising concerns the window size of the moving average required. The window size is directly related to the waiting time required for the user to obtain the re-sult.
Given these two questions, we supplemented our contribution with an online user survey (Section 5) to receive feedback on how long users are likely to wait for the classifi-cation results in this setting. With those results, we studied (Section 6.) a more complex setup where we used a total of nine zones including the crosswalk zone. We then tested whether the location of pedestrians could be identified.
5. Online Survey We surveyed how long users are likely to wait to ensure accuracy of the algorithm.
The response speed of the smartphone to the user’s location is a very important factor. However, it takes some time for the RSSI to accumulate to increase the accuracy of the location recognition algorithm. Based on the results of this survey, we determined the maximum allowable time required to recognize the user’s location. The scope of the sur-vey is BVI people living in large cities in Korea. The data collected through the survey included gender, age group, visual impairment, type of visual impairment, smartphone use, average daily walking time, APS use, and the maximum allowable waiting time when location recognition accuracy is 70–80%, 80–90%, and 90–100%. The survey was conducted online with the cooperation of the KBU (Korea Blind Union) for a total of 232 BVI people. Of these, 132 respondents were analyzed, excluding those who did not fill out a waiting time survey because they did not use APS.
Figure 5. Confusion matrices for (a) raw data and (b) six points moving average of the ReceivedSignal Strength Indicator (RSSI).
4.3. Questions Raised from the Feasibility Study
When the intersection was divided into four zones centered on the pedestrian paththrough the feasibility experiment, the zone where the pedestrian was located couldbe distinguished with high accuracy through the RSSI values of eight beacons. In thedevelopment of pedestrian navigation for the BVI people, there is a limit to identifying thelocation of pedestrians by dividing the intersection into four zones. Therefore, a questionis raised about the viability of such a system for more complex scenarios, and about theevaluation of the system in a more challenging setup.
Additionally, a waiting time of 3 s was required to obtain classification results. But,for pedestrian navigation at the intersection, it is necessary to classify the intersection intomore than four zones, which may take longer for the algorithm to compute. Thus, thesecond question arising concerns the window size of the moving average required. Thewindow size is directly related to the waiting time required for the user to obtain the result.
Given these two questions, we supplemented our contribution with an online usersurvey (Section 5) to receive feedback on how long users are likely to wait for the classifica-tion results in this setting. With those results, we studied (Section 6) a more complex setupwhere we used a total of nine zones including the crosswalk zone. We then tested whetherthe location of pedestrians could be identified.
5. Online Survey
We surveyed how long users are likely to wait to ensure accuracy of the algorithm.The response speed of the smartphone to the user’s location is a very important factor.However, it takes some time for the RSSI to accumulate to increase the accuracy of thelocation recognition algorithm. Based on the results of this survey, we determined themaximum allowable time required to recognize the user’s location. The scope of the surveyis BVI people living in large cities in Korea. The data collected through the survey includedgender, age group, visual impairment, type of visual impairment, smartphone use, averagedaily walking time, APS use, and the maximum allowable waiting time when locationrecognition accuracy is 70–80%, 80–90%, and 90–100%. The survey was conducted onlinewith the cooperation of the KBU (Korea Blind Union) for a total of 232 BVI people. Of these,132 respondents were analyzed, excluding those who did not fill out a waiting time surveybecause they did not use APS.
The results of the survey are shown in Table 1. When the accuracy is 70–80%, 16.7%of people answered that it could not be used, and the largest number of respondents said

Sensors 2022, 22, 371 8 of 15
that they can wait up to 5 s. When the accuracy is 80–90%, 8.3% of respondents said that itcannot be used, and 30.3% of respondents said that it can wait up to 5 s. Even with 90–100%accuracy, 29.5% of respondents reported that they could wait up to 5 s, followed by 3 s.It is interesting that with an accuracy of 90–100%, 10.6% of respondents said they couldwait up to 10 s and 18.2% of respondents wanted results in less than a second. Since thelow accuracy is not of practical help to BVI people and there was no “can’t use” feedbackresponse, we set the target accuracy as 90–100% and set the target within 5 s, which wasthe highest frequency in overall accuracy.
Table 1. Maximum allowable waiting time according to location classification accuracy.
Waiting Time(s) 70–80% 80–90% 90–100%
Can’t use 22 11 01 8 10 242 15 23 173 33 30 254 4 3 65 36 40 396 1 1 17 0 0 08 13 14 69 0 0 010 0 0 14
Total 132 132 132
6. Study 2: Nine Zones Classification
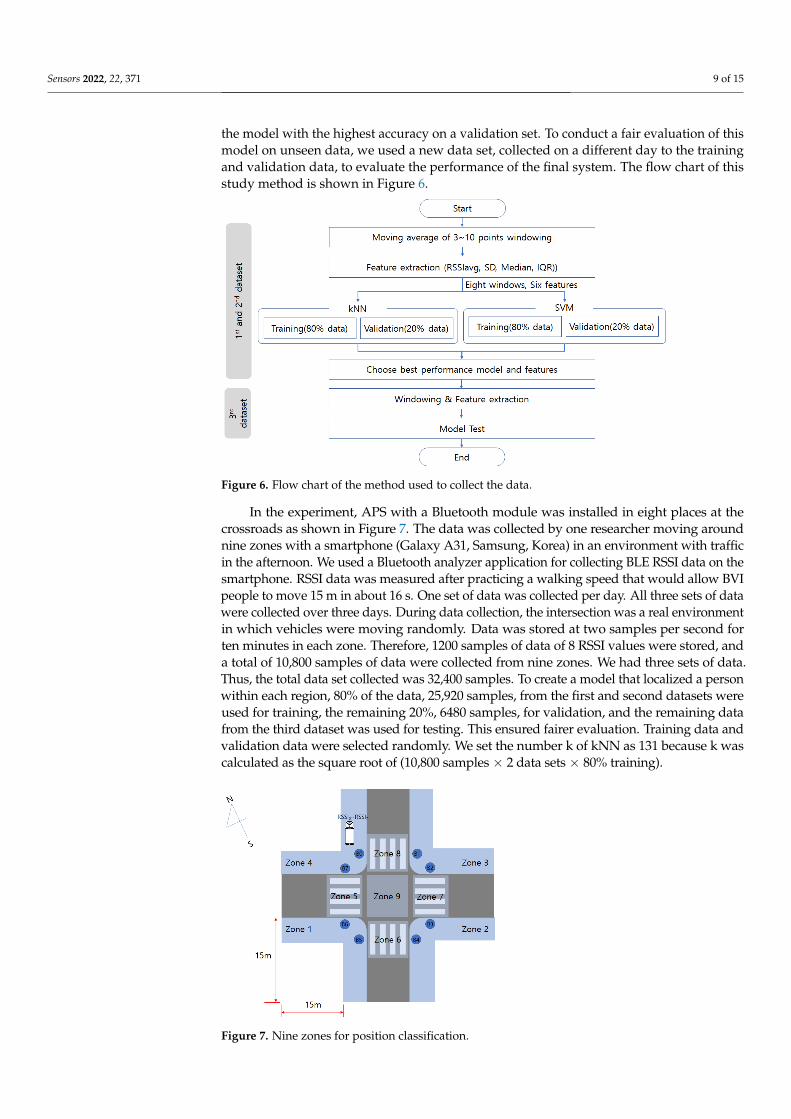
In this study, we tested for a more complex scenario to evaluate the system in a morechallenging setup. Navigation for BVI pedestrians, as well as sighted pedestrians, couldbe improved by providing guidance based on the exact location of the user, especially atintersections. BVI people can only cross the street if they have information about pedestriansignals on the crosswalk in the direction they want to go. Further, when crossing the road, theguidance voice or vibration feedback should be different depending on whether the user ison the crossing or completed the crossing. Therefore, in this study, we used a total of ninezones: four pedestrian zones and four crosswalk zones at intersections, and one zone fordiagonal intersections. As with prior studies, eight APSs with built-in Bluetooth were installedat intersections to study whether a pedestrian’s current locations could be identified throughsmartphones. In the feasibility study, the kNN classifier and moving average values of eightRSSIs were used as features. To classify nine zones, however, in this study, we want to furtherstudy the choice of the classifier by also including an SVM, and feature extraction methodsbeyond taking the average of the RSSIs.
6.1. Method
We selected kNN and SVM classifiers as they are among the most widely used meth-ods for classification. For feature extraction, we calculated the average RSSIs, standarddeviation, median, and IQR of each RSSI in an overlapped window as features. A totalof six features sets were used: moving average, moving average + standard deviation,median, median + IQR, moving average + median, moving average + standard deviation+ median + IQR. The number of points for the moving average was set from three to tento derive the initial result within five seconds because the smartphone can receive 2 RSSImeasurements per second from each APS. The value k of kNN is typically chosen as thesquare root of N, the total number of points in the training data set [37], and we used theEuclidean distance metric. We selected SVM binary learners and one-vs-one strategies formulti-class classification in SVM using an error-correcting output codes model. kNN andSVM were implemented using the fitcknn and fitcecoc functions provided in MATLAB(MATLAB R2021a, MathWorks). All algorithmic procedures were implemented offlineon a standard computer. We trained and validated a total of 96 model combinations (twomodels, six different sets of features, and eight windows for moving average), and selected
Sensors 2022, 22, 371 9 of 15
the model with the highest accuracy on a validation set. To conduct a fair evaluation of thismodel on unseen data, we used a new data set, collected on a different day to the trainingand validation data, to evaluate the performance of the final system. The flow chart of thisstudy method is shown in Figure 6.
Sensors 2022, 21, x FOR PEER REVIEW 9 of 16
Euclidean distance metric. We selected SVM binary learners and one-vs-one strategies for multi-class classification in SVM using an error-correcting output codes model. kNN and SVM were implemented using the fitcknn and fitcecoc functions provided in MATLAB (MATLAB R2021a, MathWorks). All algorithmic procedures were implemented offline on a standard computer. We trained and validated a total of 96 model combinations (two models, six different sets of features, and eight windows for moving average), and se-lected the model with the highest accuracy on a validation set. To conduct a fair evaluation of this model on unseen data, we used a new data set, collected on a different day to the training and validation data, to evaluate the performance of the final system. The flow chart of this study method is shown in Figure 6.
Figure 6. Flow chart of the method used to collect the data.
In the experiment, APS with a Bluetooth module was installed in eight places at the crossroads as shown in Figure 7. The data was collected by one researcher moving around nine zones with a smartphone (Galaxy A31, Samsung, Korea) in an environment with traffic in the afternoon. We used a Bluetooth analyzer application for collecting BLE RSSI data on the smartphone. RSSI data was measured after practicing a walking speed that would allow BVI people to move 15 m in about 16 s. One set of data was collected per day. All three sets of data were collected over three days. During data collection, the intersec-tion was a real environment in which vehicles were moving randomly. Data was stored at two samples per second for ten minutes in each zone. Therefore, 1200 samples of data of 8 RSSI values were stored, and a total of 10,800 samples of data were collected from nine zones. We had three sets of data. Thus, the total data set collected was 32,400 samples. To create a model that localized a person within each region, 80% of the data, 25,920 sam-ples, from the first and second datasets were used for training, the remaining 20%, 6480 samples, for validation, and the remaining data from the third dataset was used for test-ing. This ensured fairer evaluation. Training data and validation data were selected ran-domly. We set the number k of kNN as 131 because k was calculated as the square root of (10,800 samples * 2 data sets * 80% training).
Figure 6. Flow chart of the method used to collect the data.
In the experiment, APS with a Bluetooth module was installed in eight places at thecrossroads as shown in Figure 7. The data was collected by one researcher moving aroundnine zones with a smartphone (Galaxy A31, Samsung, Korea) in an environment with trafficin the afternoon. We used a Bluetooth analyzer application for collecting BLE RSSI data on thesmartphone. RSSI data was measured after practicing a walking speed that would allow BVIpeople to move 15 m in about 16 s. One set of data was collected per day. All three sets of datawere collected over three days. During data collection, the intersection was a real environmentin which vehicles were moving randomly. Data was stored at two samples per second forten minutes in each zone. Therefore, 1200 samples of data of 8 RSSI values were stored, anda total of 10,800 samples of data were collected from nine zones. We had three sets of data.Thus, the total data set collected was 32,400 samples. To create a model that localized a personwithin each region, 80% of the data, 25,920 samples, from the first and second datasets wereused for training, the remaining 20%, 6480 samples, for validation, and the remaining datafrom the third dataset was used for testing. This ensured fairer evaluation. Training data andvalidation data were selected randomly. We set the number k of kNN as 131 because k wascalculated as the square root of (10,800 samples × 2 data sets × 80% training).
Sensors 2022, 21, x FOR PEER REVIEW 10 of 16
Figure 7. Nine zones for position classification.
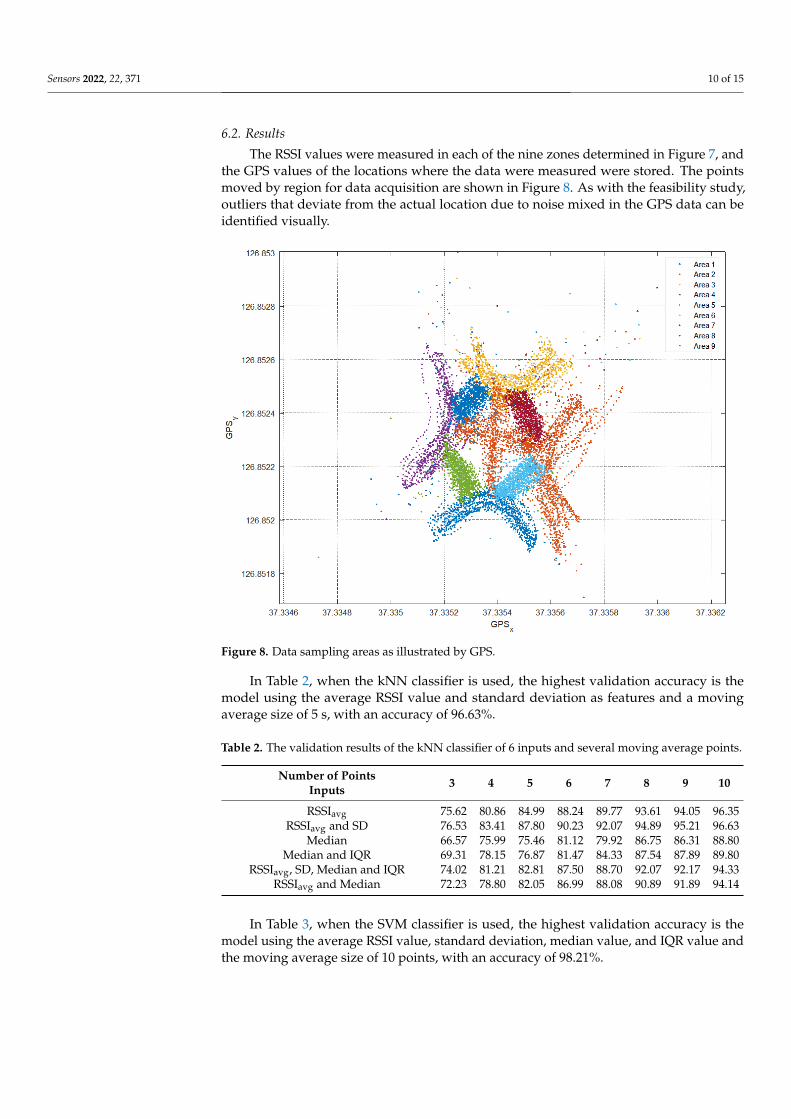
6.2. Results The RSSI values were measured in each of the nine zones determined in Figure 7, and
the GPS values of the locations where the data were measured were stored. The points moved by region for data acquisition are shown in Figure 8. As with the feasibility study, outliers that deviate from the actual location due to noise mixed in the GPS data can be identified visually.
Figure 8. Data sampling areas as illustrated by GPS.
In Table 2, when the kNN classifier is used, the highest validation accuracy is the model using the average RSSI value and standard deviation as features and a moving average size of 5 s, with an accuracy of 96.63%.
Figure 7. Nine zones for position classification.
Sensors 2022, 22, 371 10 of 15
6.2. Results
The RSSI values were measured in each of the nine zones determined in Figure 7, andthe GPS values of the locations where the data were measured were stored. The pointsmoved by region for data acquisition are shown in Figure 8. As with the feasibility study,outliers that deviate from the actual location due to noise mixed in the GPS data can beidentified visually.
Sensors 2022, 21, x FOR PEER REVIEW 10 of 16
Figure 7. Nine zones for position classification.
6.2. Results The RSSI values were measured in each of the nine zones determined in Figure 7, and
the GPS values of the locations where the data were measured were stored. The points moved by region for data acquisition are shown in Figure 8. As with the feasibility study, outliers that deviate from the actual location due to noise mixed in the GPS data can be identified visually.
Figure 8. Data sampling areas as illustrated by GPS.
In Table 2, when the kNN classifier is used, the highest validation accuracy is the model using the average RSSI value and standard deviation as features and a moving average size of 5 s, with an accuracy of 96.63%.
Figure 8. Data sampling areas as illustrated by GPS.
In Table 2, when the kNN classifier is used, the highest validation accuracy is themodel using the average RSSI value and standard deviation as features and a movingaverage size of 5 s, with an accuracy of 96.63%.
Table 2. The validation results of the kNN classifier of 6 inputs and several moving average points.
Number of PointsInputs 3 4 5 6 7 8 9 10
RSSIavg 75.62 80.86 84.99 88.24 89.77 93.61 94.05 96.35RSSIavg and SD 76.53 83.41 87.80 90.23 92.07 94.89 95.21 96.63
Median 66.57 75.99 75.46 81.12 79.92 86.75 86.31 88.80Median and IQR 69.31 78.15 76.87 81.47 84.33 87.54 87.89 89.80
RSSIavg, SD, Median and IQR 74.02 81.21 82.81 87.50 88.70 92.07 92.17 94.33RSSIavg and Median 72.23 78.80 82.05 86.99 88.08 90.89 91.89 94.14
In Table 3, when the SVM classifier is used, the highest validation accuracy is themodel using the average RSSI value, standard deviation, median value, and IQR value andthe moving average size of 10 points, with an accuracy of 98.21%.

Sensors 2022, 22, 371 11 of 15
Table 3. The validation results of the SVM classifier of 6 inputs and several moving average points.
Number of PointsInputs 3 4 5 6 7 8 9 10
RSSIavg 74.44 79.01 85.76 88.66 90.54 93.03 93.84 96.09RSSIavg and SD 78.66 83.58 88.29 90.91 93.96 94.82 96.21 97.79
Median 64.07 71.68 74.11 78.59 80.78 87.33 84.66 88.75Median and IQR 67.08 76.64 75.81 82.49 84.22 88.45 89.07 91.63
RSSIavg, SD, Median and IQR 77.66 84.23 87.75 91.14 93.93 95.30 97.30 98.21RSSIavg and Median 73.49 80.58 84.34 89.05 91.91 93.24 94.26 96.56
When Tables 2 and 3 were compared, the classifier had the highest accuracy with theSVM method, the number of moving averages was 10 points, and with all four features,achieved an accuracy of 98.21% on the validation set. Figure 9 shows the confusion matrixon the withheld testing set used with the trained model on the average RSSIs, standarddeviation, median, and IQR of the 10-point moving average with the SVM model havingthe highest accuracy. The accuracy achieved was 97.7%.
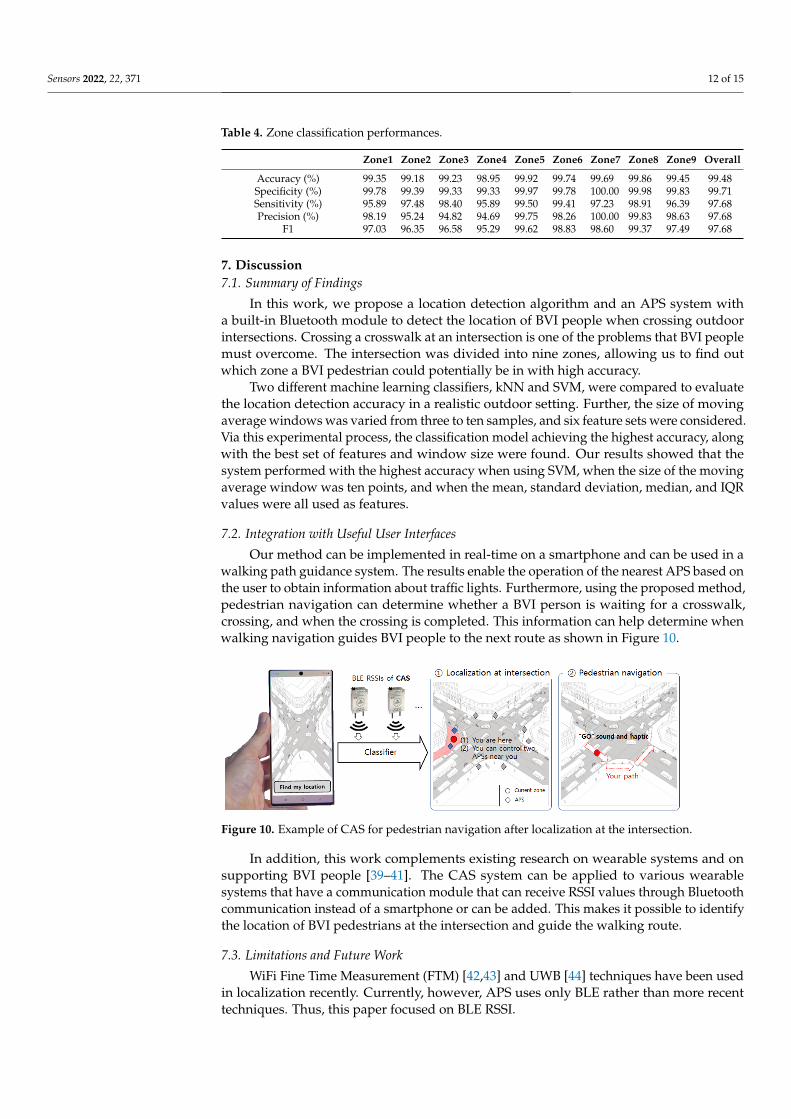
The confusion matrix of Figure 9 is presented in Table 4, where five different perfor-mance estimators are reported: accuracy, specificity, sensitivity, precision, and F1 score.These parameters were evaluated for each class separately and in overall terms as follows:Accuracy = (TP + TN)/(TP + TN + FP + FN), Sensitivity = TP/(TP + FN), Specificity =TN/(TN + FP), Precision = TP/(TP + FP), F1 = TP/(TP + 0.5 × (FP + FN)) where TP standsfor true positives (correct classification of data window as part of the selected class), TNare true negatives (correct classification of data window as not being part of the selectedclass), FP are false positives (wrong classification of data window as part of the selectedclass), and FN are false negatives in the classification (wrong classification of data windowas not being part of the selected class). Overall accuracy was evaluated as the trace of theconfusion matrix divided by the total number of classified windows [38]. Overall speci-ficity, sensitivity, precision, and F1 score were obtained by summing TP, TN, FP, and FNvalues obtained for each class. The overall accuracy was 99.48% and specificity, sensitivity,precision, and F1 score were above 90% for all zones.
Sensors 2022, 21, x FOR PEER REVIEW 12 of 16
Figure 9. Confusion matrix for the nine-zone classification task.
The confusion matrix of Figure 9 is presented in Table 4, where five different perfor-mance estimators are reported: accuracy, specificity, sensitivity, precision, and F1 score. These parameters were evaluated for each class separately and in overall terms as follows: Accuracy = (TP + TN) / (TP + TN + FP + FN), Sensitivity = TP / (TP + FN), Specificity = TN / (TN + FP), Precision = TP / (TP + FP), F1 = TP / (TP + 0.5 × (FP + FN)) where TP stands for true positives (correct classification of data window as part of the selected class), TN are true negatives (correct classification of data window as not being part of the selected class), FP are false positives (wrong classification of data window as part of the selected class), and FN are false negatives in the classification (wrong classification of data window as not being part of the selected class). Overall accuracy was evaluated as the trace of the confusion matrix divided by the total number of classified windows [38]. Overall speci-ficity, sensitivity, precision, and F1 score were obtained by summing TP, TN, FP, and FN values obtained for each class. The overall accuracy was 99.48% and specificity, sensitiv-ity, precision, and F1 score were above 90% for all zones.
Table 4. Zone classification performances.
Zone1 Zone2 Zone3 Zone4 Zone5 Zone6 Zone7 Zone8 Zone9 Overall Accuracy (%) 99.35 99.18 99.23 98.95 99.92 99.74 99.69 99.86 99.45 99.48 Specificity (%) 99.78 99.39 99.33 99.33 99.97 99.78 100.00 99.98 99.83 99.71 Sensitivity (%) 95.89 97.48 98.40 95.89 99.50 99.41 97.23 98.91 96.39 97.68 Precision (%) 98.19 95.24 94.82 94.69 99.75 98.26 100.00 99.83 98.63 97.68
F1 97.03 96.35 96.58 95.29 99.62 98.83 98.60 99.37 97.49 97.68
7. Discussion 7.1. Summary of Findings
In this work, we propose a location detection algorithm and an APS system with a built-in Bluetooth module to detect the location of BVI people when crossing outdoor
Figure 9. Confusion matrix for the nine-zone classification task.
Sensors 2022, 22, 371 12 of 15
Table 4. Zone classification performances.
Zone1 Zone2 Zone3 Zone4 Zone5 Zone6 Zone7 Zone8 Zone9 Overall
Accuracy (%) 99.35 99.18 99.23 98.95 99.92 99.74 99.69 99.86 99.45 99.48Specificity (%) 99.78 99.39 99.33 99.33 99.97 99.78 100.00 99.98 99.83 99.71Sensitivity (%) 95.89 97.48 98.40 95.89 99.50 99.41 97.23 98.91 96.39 97.68Precision (%) 98.19 95.24 94.82 94.69 99.75 98.26 100.00 99.83 98.63 97.68
F1 97.03 96.35 96.58 95.29 99.62 98.83 98.60 99.37 97.49 97.68
7. Discussion7.1. Summary of Findings
In this work, we propose a location detection algorithm and an APS system witha built-in Bluetooth module to detect the location of BVI people when crossing outdoorintersections. Crossing a crosswalk at an intersection is one of the problems that BVI peoplemust overcome. The intersection was divided into nine zones, allowing us to find outwhich zone a BVI pedestrian could potentially be in with high accuracy.
Two different machine learning classifiers, kNN and SVM, were compared to evaluatethe location detection accuracy in a realistic outdoor setting. Further, the size of movingaverage windows was varied from three to ten samples, and six feature sets were considered.Via this experimental process, the classification model achieving the highest accuracy, alongwith the best set of features and window size were found. Our results showed that thesystem performed with the highest accuracy when using SVM, when the size of the movingaverage window was ten points, and when the mean, standard deviation, median, and IQRvalues were all used as features.
7.2. Integration with Useful User Interfaces
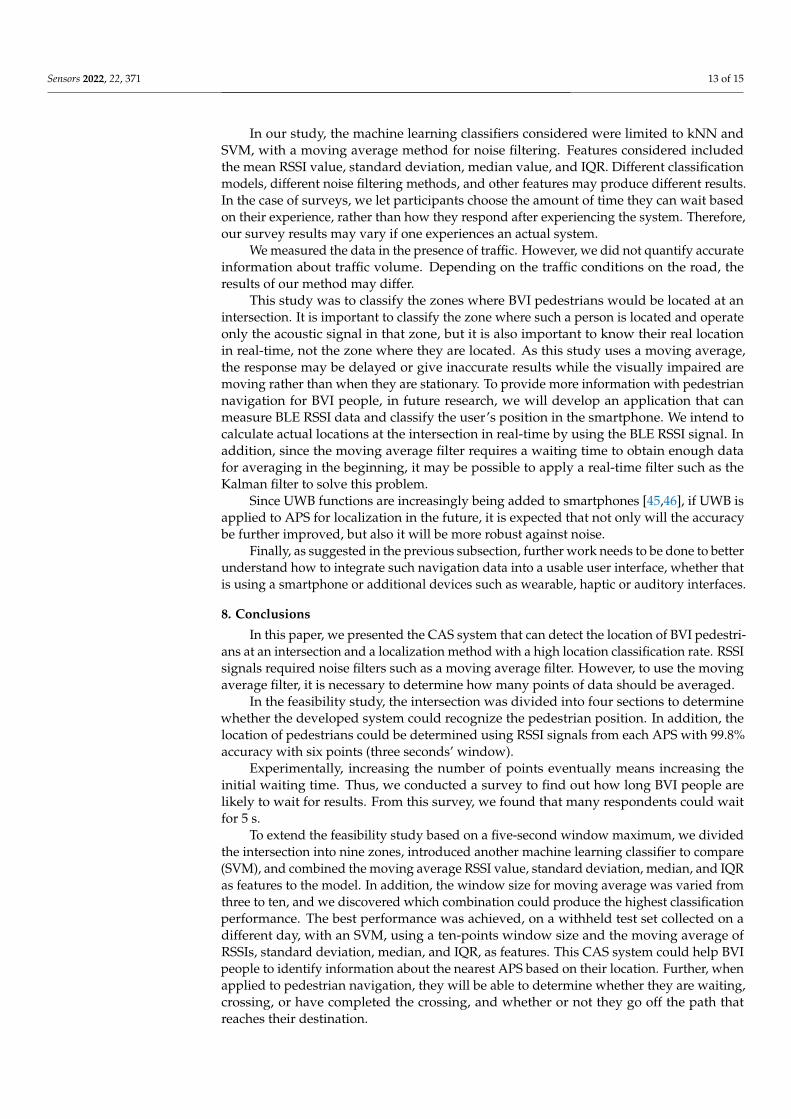
Our method can be implemented in real-time on a smartphone and can be used in awalking path guidance system. The results enable the operation of the nearest APS based onthe user to obtain information about traffic lights. Furthermore, using the proposed method,pedestrian navigation can determine whether a BVI person is waiting for a crosswalk,crossing, and when the crossing is completed. This information can help determine whenwalking navigation guides BVI people to the next route as shown in Figure 10.
Sensors 2022, 21, x FOR PEER REVIEW 13 of 16
intersections. Crossing a crosswalk at an intersection is one of the problems that BVI peo-ple must overcome. The intersection was divided into nine zones, allowing us to find out which zone a BVI pedestrian could potentially be in with high accuracy.
Two different machine learning classifiers, kNN and SVM, were compared to evalu-ate the location detection accuracy in a realistic outdoor setting. Further, the size of mov-ing average windows was varied from three to ten samples, and six feature sets were con-sidered. Via this experimental process, the classification model achieving the highest ac-curacy, along with the best set of features and window size were found. Our results showed that the system performed with the highest accuracy when using SVM, when the size of the moving average window was ten points, and when the mean, standard devia-tion, median, and IQR values were all used as features.
7.2. Integration with Useful User Interfaces Our method can be implemented in real-time on a smartphone and can be used in a
walking path guidance system. The results enable the operation of the nearest APS based on the user to obtain information about traffic lights. Furthermore, using the proposed method, pedestrian navigation can determine whether a BVI person is waiting for a cross-walk, crossing, and when the crossing is completed. This information can help determine when walking navigation guides BVI people to the next route as shown in Figure 10.
Figure 10. Example of CAS for pedestrian navigation after localization at the intersection.
In addition, this work complements existing research on wearable systems and on supporting BVI people [39–41]. The CAS system can be applied to various wearable sys-tems that have a communication module that can receive RSSI values through Bluetooth communication instead of a smartphone or can be added. This makes it possible to iden-tify the location of BVI pedestrians at the intersection and guide the walking route.
7.3. Limitations and Future Work WiFi Fine Time Measurement (FTM) [42,43] and UWB [44] techniques have been
used in localization recently. Currently, however, APS uses only BLE rather than more recent techniques. Thus, this paper focused on BLE RSSI.
In our study, the machine learning classifiers considered were limited to kNN and SVM, with a moving average method for noise filtering. Features considered included the mean RSSI value, standard deviation, median value, and IQR. Different classification models, different noise filtering methods, and other features may produce different re-sults. In the case of surveys, we let participants choose the amount of time they can wait based on their experience, rather than how they respond after experiencing the system. Therefore, our survey results may vary if one experiences an actual system.
We measured the data in the presence of traffic. However, we did not quantify accu-rate information about traffic volume. Depending on the traffic conditions on the road, the results of our method may differ.
This study was to classify the zones where BVI pedestrians would be located at an intersection. It is important to classify the zone where such a person is located and operate only the acoustic signal in that zone, but it is also important to know their real location in
Figure 10. Example of CAS for pedestrian navigation after localization at the intersection.
In addition, this work complements existing research on wearable systems and onsupporting BVI people [39–41]. The CAS system can be applied to various wearablesystems that have a communication module that can receive RSSI values through Bluetoothcommunication instead of a smartphone or can be added. This makes it possible to identifythe location of BVI pedestrians at the intersection and guide the walking route.
7.3. Limitations and Future Work
WiFi Fine Time Measurement (FTM) [42,43] and UWB [44] techniques have been usedin localization recently. Currently, however, APS uses only BLE rather than more recenttechniques. Thus, this paper focused on BLE RSSI.
Sensors 2022, 22, 371 13 of 15
In our study, the machine learning classifiers considered were limited to kNN andSVM, with a moving average method for noise filtering. Features considered includedthe mean RSSI value, standard deviation, median value, and IQR. Different classificationmodels, different noise filtering methods, and other features may produce different results.In the case of surveys, we let participants choose the amount of time they can wait basedon their experience, rather than how they respond after experiencing the system. Therefore,our survey results may vary if one experiences an actual system.
We measured the data in the presence of traffic. However, we did not quantify accurateinformation about traffic volume. Depending on the traffic conditions on the road, theresults of our method may differ.
This study was to classify the zones where BVI pedestrians would be located at anintersection. It is important to classify the zone where such a person is located and operateonly the acoustic signal in that zone, but it is also important to know their real locationin real-time, not the zone where they are located. As this study uses a moving average,the response may be delayed or give inaccurate results while the visually impaired aremoving rather than when they are stationary. To provide more information with pedestriannavigation for BVI people, in future research, we will develop an application that canmeasure BLE RSSI data and classify the user’s position in the smartphone. We intend tocalculate actual locations at the intersection in real-time by using the BLE RSSI signal. Inaddition, since the moving average filter requires a waiting time to obtain enough datafor averaging in the beginning, it may be possible to apply a real-time filter such as theKalman filter to solve this problem.
Since UWB functions are increasingly being added to smartphones [45,46], if UWB isapplied to APS for localization in the future, it is expected that not only will the accuracybe further improved, but also it will be more robust against noise.
Finally, as suggested in the previous subsection, further work needs to be done to betterunderstand how to integrate such navigation data into a usable user interface, whether thatis using a smartphone or additional devices such as wearable, haptic or auditory interfaces.
8. Conclusions
In this paper, we presented the CAS system that can detect the location of BVI pedestri-ans at an intersection and a localization method with a high location classification rate. RSSIsignals required noise filters such as a moving average filter. However, to use the movingaverage filter, it is necessary to determine how many points of data should be averaged.
In the feasibility study, the intersection was divided into four sections to determinewhether the developed system could recognize the pedestrian position. In addition, thelocation of pedestrians could be determined using RSSI signals from each APS with 99.8%accuracy with six points (three seconds’ window).
Experimentally, increasing the number of points eventually means increasing theinitial waiting time. Thus, we conducted a survey to find out how long BVI people arelikely to wait for results. From this survey, we found that many respondents could waitfor 5 s.
To extend the feasibility study based on a five-second window maximum, we dividedthe intersection into nine zones, introduced another machine learning classifier to compare(SVM), and combined the moving average RSSI value, standard deviation, median, and IQRas features to the model. In addition, the window size for moving average was varied fromthree to ten, and we discovered which combination could produce the highest classificationperformance. The best performance was achieved, on a withheld test set collected on adifferent day, with an SVM, using a ten-points window size and the moving average ofRSSIs, standard deviation, median, and IQR, as features. This CAS system could help BVIpeople to identify information about the nearest APS based on their location. Further, whenapplied to pedestrian navigation, they will be able to determine whether they are waiting,crossing, or have completed the crossing, and whether or not they go off the path thatreaches their destination.
Sensors 2022, 22, 371 14 of 15
Author Contributions: Conceptualization, K.S. and A.R.; methodology, K.S. and R.M.; software,C.H. and J.L.; validation, O.M., M.C. and R.M.; formal analysis, K.S.; investigation, A.R. and R.M.;resources, C.H.; data curation, J.L. and C.H.; writing—original draft preparation, K.S.; writing—review and editing, O.M., R.M. and A.R. All authors have read and agreed to the published versionof the manuscript.
Funding: This work was supported by ‘Ansan-si Hidden Champion Fostering and Support Project’funded by Ansan-si (city).
Conflicts of Interest: The authors declare no conflict of interest.
References1. The CNIB Foundation. Available online: https://www.clearingourpath.ca/4.2.4-accessible-pedestrian-signals_e.php#limit
(accessed on 2 July 2021).2. Makino, H.; Ishii, I.; Nakashizuka, M. Development of navigation system for the blind using GPS and mobile phone combination.
In Proceedings of the 18th Annual International Conference of the IEEE Engineering in Medicine and Biology Society, IEEE,Amsterdam, The Netherlands, 31 October–3 November 1996. [CrossRef]
3. Balachandran, W.; Cecelija, F.; Ptasinski, P. A GPS based navigation aid for the blind. In Proceedings of the 17th InternationalConference on Applied Electromagnetics and Communications (ICECom 2003), Dubrovnik, Croatia, 1–3 October 2003. [CrossRef]
4. R Veázquez, R.; Pissaloux, E.; Rodrigo, P.; Carrasco, M.; Giannoccaro, N.I.; Aime, L.E. An outdoor navigation system for blindpedestrians using GPS and tactile-foot feedback. Appl. Sci. 2018, 8, 578. [CrossRef]
5. Xu, G. GPS, Theory, Algorithms and Applications; GPS Observables; Springer: Berlin, Germany, 2007; pp. 37–42.6. Krista, M.; Pete, B. Smartphone GPS accuracy study in an urban environment. PLoS ONE 2019, 14, e0219890. [CrossRef]7. Manual for Streets. Department for Transport. ISBN 978-0-7277-3501-0. 2007. Available online: https://assets.publishing.service.
gov.uk/government/uploads/system/uploads/attachment_data/file/341513/pdfmanforstreets.pdf (accessed on 26 July 2021).8. National Academies of Sciences, Engineering, and Medicine. A Guide for Reducing Collisions Involving Pedestrians; The National
Academies Press: Washington, DC, USA, 2004. [CrossRef]9. Hu, Q.; Xu, L.; Cheng, X. A CORS-Based Differential Correction Approach for AIS Mobile Stations. Sensors 2018, 18, 3626. [CrossRef]10. Kim, J.W.; Kim, J.; Na, D.G.; Kim, H.S. Bidirectional BLE enabled Audible Pedestrian Signal for visual impaired pedestrian. J.
Korea Inst. Inf. Commun. Eng. 2017, 21, 99–106. [CrossRef]11. Kim, H.S.; Kim, J.; Jang, I.S. Development and Application of BLE-Based Audible Pedestrian Signal (APS) for Intersection Safety
Crossing of Blind People. J. Inf. Technol. Serv. 2017, 16, 223–234. [CrossRef]12. Polara’s Website. Available online: https://polara.com/ins-inavigator-accessible-pedestrian-signals (accessed on 3 September 2021).13. Barlow, J.M.; Alan, C.S.; Billie, L.B. Audible Beaconing with Accessible Pedestrian Signals. AER J. 2009, 2, 149–158. [PubMed]14. Li, G.; Geng, E.; Ye, Z.; Xu, Y.; Lin, J.; Pang, Y. Indoor positioning algorithm based on the improved rssi distance model. Sensors
2018, 18, 2820. [CrossRef]15. Barlow, J.M.; Billie, L.B.; Tamara, B. Blind Pedestrians and the Changing Technology and Geometry of Signalized Intersections:
Safety, Orientation, and Independence. J. Vis. Impair. Blind. 2005, 99, 587–598. [CrossRef]16. Billie, L.B.; Lee, S.T. Accessible Pedestrian Signals. U.S. Access Board. 1998. Available online: https://cce.oregonstate.edu/sites/
cce.oregonstate.edu/files/acc_signalsreport.pdf (accessed on 3 September 2021).17. Liao, C.F. Using s smartphone application to support visually impaired pedestrians at signalized intersection crossings. Transp.
Res. Rec. J. Transp. Res. Board 2013, 2393, 12–20. [CrossRef]18. Turner, J.S.C.; Harun, A.; Yasin, M.N.M.; Ali, N.; Bakar, S.A.; Fadzilla, M.A.; Murad, S.A.Z.; Hambali, N.A.M.A.; Razlan, Z.M.;
Hashim, M.S.M.; et al. Modeling on impact of metal object obstruction in urban environment for internet of things application invehicular communication. AIP Conf. Proc. 2020, 2203, 020053. [CrossRef]
19. Kuriakose, B.; Shrestha, R.; Sandnes, F.E. Smartphone Navigation Support for Blind and Visually Impaired People-A Compre-hensive Analysis of Potentials and Opportunities. In Universal Access in Human-Computer Interaction. Applications and Practice,Proceedings of theHCII 2020, Copenhagen, Denmark, 19–24 July 2020; Lecture Notes in Computer Science; Antona, M., Stephanidis,C., Eds.; Springer: Cham, Switzerland, 2020; pp. 568–583. [CrossRef]
20. Jafri, R.; Ali, S.A. A GPS-Based Personalized Pedestrian Route Recording Smartphone Application for the Blind. In HCI 2014: HCIInternational 2014 Posters, Part II, CCIS 435; Springer: Cham, Switzertland, 2014; pp. 232–237. [CrossRef]
21. Valdes, S.R.; Araujo, A. Navigation Systems for the Blind and Visually Impaired: Past Work, Challenges, and Open Problems.Sensors 2019, 19, 3404. [CrossRef]
22. Treuillet, S.; Royer, E. Outdoor/indoor vision-based localization for blind pedestrian navigation assistance. Int. J. Image Graph.2010, 10, 481–496. [CrossRef]
23. Smith, T.G.; Rose, C.; Nolen, J.; Pierece, D.; Sherman, A. Interactive Navigation System with Auditory and Haptic Cues inCrosswalks, Indoors and Urban Areas. In HCI International 2015-Posters’ Extended Abstracts; Springer: Cham, Switzerland, 2015;pp. 539–545.
Sensors 2022, 22, 371 15 of 15
24. Karabtcev, S.N.; Khorosheva, T.A.; Kapkov, N.R. BLE Beacon Interaction Module and Mobile Application in the Indoor-NavigationSystem. In Proceedings of the 2019 International Science and Technology Conference “EastConf”, Vladivostok, Russia, 1–2 March2019; pp. 1–6. [CrossRef]
25. Lim, B.L.; Smitha, K.G.; Sharad, S. Smart Nation: Indoor Navigation for the Visually Impaired. In Proceedings of the 2019 4thInternational Conference on Intelligent Transportation Engineering (ICITE), Singapore, 6–8 September 2019. [CrossRef]
26. Samuel, M.; Nazeem, N.; Sreevals, P.; Resmi, R.; Careena, P. Smart indoor navigation and proximity advertising with androidapplication using BLE technology. Mater. Today Proceeding 2021, 43, 3799–3803. [CrossRef]
27. McConville, R.; Archer, G.; Craddock, I.; Kozlowski, M.; Piechocki, R.; Pope, J.; Raul, S.R. Vesta: A digital health analyticsplatform for a smart home in a box. Future Gener. Comput. Syst. 2021, 114, 106–119. [CrossRef]
28. Atashi, M.; Malekzadeh, P.; Salimibeni, M.; Zohreh, H.M.; Konstantinos, N.P.; Arash, M. Orientation-Matched Multiple Modelingfor RSSI-Based Indoor Localization via BLE Sensors. In Proceedings of the 2020 28th European Signal Processing Conference(EUSIPCO), Amsterdam, The Netherlands, 24–28 August 2020. [CrossRef]
29. Venkatesh, R.; Vikas, M.; Hrudaya, T. Indoor Localization in BLE Using Mean and Median Filtered RSSI Values. In Proceedings ofthe 5th International Conference on Trends in Electronics and Informatics (ICOEI), Tirunelveli, India, 3–5 June 2021. [CrossRef]
30. Ramadhan, H.; Yustiawan, Y.; Kwon, J. Applying Movement Constraints to BLE RSSI-Based Indoor Positioning for ExtractingValid Semantic Trajectories. Sensors 2020, 20, 527. [CrossRef]
31. Surian, D.; Kim, V.; Menon, R.; Dunn, A.G.; Sintchenko, V.; Coiera, E. Tracking a moving user in indoor environments usingBluetooth low energy beacons. J. Biomed. Inform. 2019, 98, 103288. [CrossRef]
32. Li, M.; Zhao, L.; Tan, D.; Tong, X. BLE Fingerprint Indoor Localization Algorithm Based on Eight-Neighborhood TemplateMatching. Sensors 2019, 19, 4859. [CrossRef]
33. Alsmadi, L.; Kong, X.; Sandrasegaran, K.; Fang, G. An Improved Indoor Positioning Accuracy using Filtered RSSI and BeaconWeight. IEEE Sens. J. 2021, 21, 18205–18213. [CrossRef]
34. Momose, R.; Nitta, T.; Yanagisawa, M.; Togawa, N. An accurate indoor positioning algorithm using particle filter based onthe proximity of bluetooth beacons. In Proceedings of the 2017 IEEE 6th Global Conference on Consumer Electronics (GCCE),Nagoya, Japan, 24–27 October 2017. [CrossRef]
35. Sadowski, S.; Spachos, P. Optimization of BLE Beacon Density for RSSI-Based Indoor Localization. In Proceedings of the 2019IEEE International Conference on Communications Workshops (ICC Workshops), Shanghai, China, 20–24 May 2019. [CrossRef]
36. Lee, B.C.; Lee, D.W.; Bae, K.S. The Characteristics of Walking-Speed for the Visual Handicapped. Traffic Saf. Res. 1997, 19, 55–63.37. Nadkarni, P. Chapter 10—Core Technologies: Data Mining and "Big Data"; Clinical Research Computing; Academic Press: Boca
Raton, FL, USA, 2016; pp. 187–204. [CrossRef]38. Mannini, A.; Angelo, M.S.; Stephen, S. Intille. Accelerometry-based recognition of the placement sites of a wearable sensor.
Pervasive Mob. Comput. 2015, 21, 62–74. [CrossRef]39. Lee, K.; Sato, D.; Asakawa, S.; Kacorri, H.; Asakawa, C. Pedestrian detection with wearable cameras for the blind: A two-way
perspective. In Proceedings of the 2020 CHI Conference on Human Factors in Computing Systems, Honolulu, HI, USA, 25–30April 2020; pp. 1–12. [CrossRef]
40. Techiquin, R.; Velazquez, R.; Carolina, D.V.S.; Carlos, A.G.; Carrasco, M.; Roberto, D.F.; Andres, T.L.; Visconti, P.; Fernando, V.V.Wearable urban mobility assistive device for visually impaired pedestrians using a smartphone and a tactile-foot interface. Sensors2021, 21, 5274. [CrossRef] [PubMed]
41. Cheng, R.; Wang, K.; Yand, K.; Long, N.; Bai, J.; Liu, D. Real-time pedestrian crossing lights detection algorithm for the visuallyimpaired. Multimed. Tools Appl. 2017, 77, 20651–20671. [CrossRef]
42. Bullmann, M.; Fetzer, T.; Ebner, F.; Ebner, M.; Deinzer, F.; Grzegorzek, M. Comparison of 2.4 GHz WiFi FTM- and RSSI-BasedIndoor Positioning Methods in Realistic Scenarios. Sensors 2020, 20, 4515. [CrossRef] [PubMed]
43. Horn, B.K. Doubling the Accuracy of Indoor Positioning: Frequency Diversity. Sensors 2020, 20, 1489. [CrossRef]44. Bocus, J.J.; Paulavicius, J.; McConville, R.; Raul, S.R.; Piechocki, R.J. Low cost localisation in residential environments using high
resolution cir information. In Proceedings of the 2020 IEEE Global Communications Conference (GLOBECOM), Taipei, Taiwan,7–11 December 2020.
45. Apple Webpage. Available online: https://support.apple.com/en-us/HT212274 (accessed on 6 September 2021).46. Samsung Webpage. Available online: https://insights.samsung.com/2021/08/25/what-is-ultra-wideband-and-how-does-it-
work-3/ (accessed on 25 August 2021).
Copyright © 2022 FDOKUMEN