Performance of Biofuels and Biofuel Blends - Department of ...

Electronic copy available at: http://ssrn.com/abstract=1927127
ADB Economics Working Paper Series
Energy Security and Economics of Indian Biofuel Strategy in a Global Context
Herath Gunatilake, David Roland-Holst, Guntur Sugiyarto, and Jenn BakaNo. 269 | August 2011

Electronic copy available at: http://ssrn.com/abstract=1927127

Electronic copy available at: http://ssrn.com/abstract=1927127
ADB Economics Working Paper Series No. 269
Energy Security and Economics of Indian Biofuel Strategy in a Global Context
Herath Gunatilake, David Roland-Holst, Guntur Sugiyarto, and Jenn Baka August 2011
Asian Development Bank6 ADB Avenue, Mandaluyong City1550 Metro Manila, Philippineswww.adb.org/economics
©2011 by Asian Development BankAugust 2011ISSN 1655-5252Publication Stock No. WPS
The views expressed in this paperare those of the author(s) and do notnecessarily reflect the views or policiesof the Asian Development Bank.
The ADB Economics Working Paper Series is a forum for stimulating discussion and eliciting feedback on ongoing and recently completed research and policy studies undertaken by the Asian Development Bank (ADB) staff, consultants, or resource persons. The series deals with key economic and development problems, particularly those facing the Asia and Pacific region; as well as conceptual, analytical, or methodological issues relating to project/program economic analysis, and statistical data and measurement. The series aims to enhance the knowledge on Asia’s development and policy challenges; strengthen analytical rigor and quality of ADB’s country partnership strategies, and its subregional and country operations; and improve the quality and availability of statistical data and development indicators for monitoring development effectiveness.
The ADB Economics Working Paper Series is a quick-disseminating, informal publication whose titles could subsequently be revised for publication as articles in professional journals or chapters in books. The series is maintained by the Economics and Research Department.

Contents
Abstract v
I. Introduction 1
II. Biofuels and Trends in Energy Markets 2
III. The CGE Model and Policy Scenarios 7
IV. Simulation Results 8
A. Biofuels Intervention 8 B. Energy Efficiency Improvements 11 C. Food Productivity Increase 12
V. Conclusions 14
Appendix: Model Summary 16
References 24


Abstract
The emergence of biofuel as a renewable energy source offers opportunities for climate change mitigation and greater energy security for many countries. At the same time, biofuel represents the possibility of substitution between energy and food. For developing countries like India, which imports over 75% of its crude oil, fossil fuels pose two risks—global warming pollution and negative economic impacts of oil price hikes. This paper examines India’s options for managing energy price risk in three ways: biofuel development, energy efficiency promotion, and food productivity improvements. The overall results suggest that biodiesel shows promise as a transport fuel substitute that can be produced in ways that fully utilize marginal agricultural resources and hence promote rural livelihoods. First-generation bioethanol, by contrast, appears to have a limited ability to offset the impacts of oil price hikes. Combining the biodiesel expansion policy with energy efficiency improvements and food productivity increases proved to be a more effective strategy to enhance both energy and food security, help mitigate climate change, and cushion the economy against oil price shocks.


I. Introduction
New sources of renewable energy like biofuels offer opportunities for reducing reliance on fossil fuels and climate change mitigation. At the same time, biofuel represents the possibility of substitution between two essential but very different commodities: food and energy. The ability to reduce reliance on fossil fuels has dramatically heightened interest in biofuel particularly in high petroleum-importing countries (Alston et al. 2009). Rising concerns about the need for climate stabilization and rapid innovation to reduce greenhouse gas (GHG) emissions have also stimulated a new agribusiness energy industry, particularly in high-income economies with more energy-intensive expenditure (Farrel et al. 2006, Berndes et al. 2003). At the same time, diversion of agricultural resources to energy production has implications for food production that are of special concern to developing countries whose expenditure patterns are most food-intensive (Dreze and Sen 1989, OECD 2006, Wagonner 1995). Both commodities are essential to human well-being.
This paper analyzes the economywide impacts of biofuels production and use in India using a global general equilibrium model. Currently, India uses petroleum products to meet 95% of its transportation energy needs and is increasingly reliant on imports to meet this demand (GOI 2009b). In 2007–2008, India imported approximately 77% of its crude oil needs (GOI 2009b); the majority of which came from the Middle East and Africa. The International Energy Agency projected imports could rise to as much as 90% by 2030 if present consumption trends continue (IEA 2007a). This heavy dependency on imported petroleum products forces India to examine the feasibility of using alternative energy sources.
The Government of India has been actively exploring its biofuel potential since 2001 (GOI 2005 and 2006). The biofuel policy adopted in 2009, an important milestone of India’s biofuels initiatives, envisages 20% blending of both biodiesel and bioethanol by 2017. Bioethanol in India is currently produced from molasses (a byproduct of sugar manufacturing) and India is considering the possibilities of using sugarcane juice to increase bioethanol production. It also hopes to increase energy security by launching one of the world’s biggest nonedible oilseed-based biodiesel industries. Jatropha and Pongamia are the two prominent oilseed plants undergoing experimentation for biodiesel production (Altenburg et al. 2009).

India, with a growing population and a fixed amount of arable lands already under cultivation, places its utmost importance on food security. Growing rural incomes and frequent weather fluctuations experienced in the recent past add to India’s worry on supply–demand balance of food and food price inflation. Therefore, it has clearly enunciated in its biofuel policy not to promote comestible feedstock or diversion of conventional farmland to biofuel production. Therefore, the biodiesel strategy considers use of waste or fallow lands, estimated at 55 million hectares nationwide. If about 32 million hectares of waste lands can be cultivated as oilseed plantations, together with modest productivity improvements, about 20 billion liters of biodiesel can be produced. This amount is sufficient to replace 20% of the national petroleum diesel requirement in 2017 (Gunatilake 2011). Molasses ethanol has other lucrative uses, but whose current production is not sufficient to meet 20% blending target. Sugarcane juice or cultivation of other feedstock such as tropical sugar beet or sweet sorghum is required to meet the desired target. At the current level of productivity, the bioethanol target cannot be met without compromising food production (Gunatilake and Abeygunawardena 2011).
Biofuels will remain an important option in the renewable energy mix in India. However, the macroeconomic implications of allocating a large amount of wastelands to produce biodiesel, or diverting sugarcane or other croplands for bioethanol production in India, are unknown. Gunatilake et al. (2011) study the economywide impact of biodiesel production in India using a computable general equilibrium (CGE) model and show that biodiesel has the potential to enhance energy security, generate significant employment, and achieve inclusive growth without adverse impacts on the other sectors of the economy. In this paper we broaden this analysis considering both bioethanol and biodiesel and using a global CGE model incorporating other available policy options such as energy efficiency and food productivity improvements to understand the role of biofuels in India within a broader policy framework.
II. Biofuels and Trends in Energy Markets
Globally, biofuel investments in 2008 accounted for almost 13% of the total global renewable energy investment ($16.2 billion) and were lower than wind (42% or $50.4 billion) and solar (32% or $38.4 billion) (Somerville 2007, Msangi 2007, REN21 2009). Geographically the major thrust for biofuels came from North America, Europe and South America with major capacity addition in the United States (US), Brazil, and Argentina. Ethanol production in 2008 increased by 34% over 2007 to touch 67 billion liters (REN21 2009) and has more than doubled between 2004 (30 billion liters) and 2008. The major impetus came from the US and Brazil. Brazil dramatically ramped up production in 2008 to touch 27 billion liters, up from 18 billion liters in 2006. This was also seen in the consumption of auto fuel in Brazil, where more than 50% of the total fuel consumption in the nondiesel vehicle fuel segment came from ethanol. The US remained the global
2 | ADB Economics Working Paper Series No. 269

leader in ethanol production with 34 billion liters in 2008, up from 2.1 billion liters in 2002. Many other countries like the People’s Republic of China, Germany, France, Spain, Sweden, and Thailand are also implementing major national programs for biofuels (IEA 2007b).
Biodiesel saw an even more dramatic rise than ethanol (see Rajagopal and Zilberman 2007 and Tyner 2007). Global biodiesel production increased six fold between 2004 and 2008, from 2 billion liters to more than 12 billion liters. The European Union (EU) contributed more than two thirds of this production. In the EU, the top producers were Germany, France, Italy, and Spain. Aside from the EU, the main biodiesel producers were the US, Argentina, Brazil, and Thailand. Brazil introduced mandatory biodiesel blending of 2% in January 2008 and set a target of 5% in 2013, started blending 3% in July 2008 and increased it to 4% in July 2009 and 5% in January 2010.
India initiated biofuel production nearly a decade ago to reduce its dependence on foreign oil and thus improve energy security (Ministry of Petroleum and Natural Gas 2007). The country began 5% ethanol blending (E5) pilot programs in 2001 and formulated a National Mission on Biodiesel1 in 2003 to achieve 20% biodiesel blends by 2011–2012 (GOI 2002 and 2003). Similar to many countries around the world, India’s biofuel programs have experienced setbacks, primarily because of supply shortages and global concerns over food security. To strengthen and formalize its commitment to promoting a sustainable biofuels industry, India adopted a National Policy on Biofuels in December 2009. The program proposed (i.e., not mandatory) 20% indicative blending targets for both biodiesel and ethanol by 2017 (GOI 2008 and 2009b). The December 2009 policy document outlines a broad strategy for the biofuel program and briefly catalogs policy measures being considered to support the program. Although the policy contains limited specifics on how the program will be implemented, the country’s intention to avoid conflicts with food security is firmly stated throughout the policy document. The policy specifically requires the use of nonfood feedstocks grown on marginal lands unsuitable for agricultural production. However, no details on how this requirement will be enforced are contained in the policy.
Over the last generation, global energy and food prices have followed opposing trends, with energy prices rising and food prices falling nearly monotonically (Jha et al. 2010). Now that biofuel substitution offers significant linkage between the two markets, this divergence can be expected to reverse or at least be attenuated. For energy prices, this is a welcome shift from the perspective of the world’s majority (energy consumers). A large share of the world population, however, will have the opposite reaction to rising food prices.
On a global scale, the energy–food tradeoff can be thought of in terms of a single production possibility frontier, shifting resources to balance price extremes between the
1 National mission on biodiesel was, however, not implemented.
Energy Security and Economics of Indian Biofuel Strategy in a Global Context | 3

two products. For an individual country, however, the decision framework is very different, depending on the relative sizes of domestic and foreign markets. Because India imports over two thirds of its conventional energy and produces most of its own food to meet basic needs of a poor majority, it has limited control over conventional fuel prices and little flexibility to substitute with agricultural capacity. While India can develop significantly greater hydro, solar, and some other renewable energy alternatives to produce power, biofuels remain as the major source of local source for transport fuels. Given the food security concerns explained above, biofuels production is constrained primarily to land classified as marginal for biofuel production.
Apart from a surge in 2007, current food prices have been relatively stable in many countries. India, however, experienced a surge in food prices in 2010. Apart from food price inflation, there is an important indirect threat to affordable food from energy price trends. If energy prices escalate significantly in the long run, the livelihood impact of this on the poor could be adverse overall, particularly with respect to food. Both energy and food are essential commodities, and price inflation in the former will undermine purchasing power for the latter. India may not be able to influence energy prices with its biofuel agenda, but it may be more effective in offseting this by promoting agricultural productivity growth, both in terms of the same marginal land use and across the food economy generally. This approach will have two additional benefits, supporting food security and higher incomes from traditional resource use patterns, while at the same time accommodating the demand-side management benefits of higher energy prices. Put more simply, this policy response would increase the food content of gross domestic product (GDP) while lowering its energy content—perhaps a more appropriate path for a low-income economy to achieve sustainable development.
To better understand the implications of such an approach, we review global energy market conditions going forward, comparing official estimates with our own projections of long-term adjustments. The figure below shows IEA projections of demand. In their reference scenario, around 93% of the growth of energy demand will come from outside the Organisation for Economic Co-operation (OECD) countries, primarily the PRC and India (Figure 1). Of this total demand, 77% will be with conventional fossil fuels (Figure 2), goods for which India has only limited market power.
As shown in Figure 2, OECD countries will reduce their dependency on coal and oil to some limited extent while non-OECD countries will increase coal, oil, and natural gas use significantly. Use of biomass and other renewable energy sources will increase in both OECD and non-OECD countries but the magnitude is much smaller compared to increase in the use of coal, oil, and gas. Meanwhile, global energy scarcity will lead to intensified competition from net importers (Figure 3). On the global supply side, the market share of OPEC is expected to rise substantially (Figure 4).
4 | ADB Economics Working Paper Series No. 269

Figure 1: World Primary Energy Demand 12,000
10,000
8,000
6,000
4,000
2,000
1980 1990 2000
PRC and IndiaRest of Non-OECDOECD
2010 2020 20300
mtoe = million ton of oil equivalent, OECD = Organisation for Economic Co-operation and Development.Source: IEA (2007b).
Figure 2: Fuel Composition of New Energy Demand, 2030 (mtoe)
Coal
Oil
Gas
Nuclear
Hydro
Biomass
Other Renewables
−500 0 500 1,000 1,500 2,000
OECDNon-OECD
mtoe = million ton of oil equivalent, OECD = Organisation for Economic Co-operation and Development.Source: IEA (2007b).
Energy Security and Economics of Indian Biofuel Strategy in a Global Context | 5

Figure 3: Average Annual Net Imports of Oil and Gas, 2008 ($ billion)
1%1%
1%2%
2%
600
500
400
300
200
100
0
2%
3%
3%
0.4%
3%
6%
3%
EuropeanUnion
UnitedStates
PRC Japan
1971–20082008–2030
India ASEAN
Note: Percentages represent share of gross domestic product.Source: IEA (2007b).
Figure 4: Oil Production by Source (mb/d)
11 mb/d
16 mb/d
36mb/d
120
100
80
60
40
20
02008 Reference
Scenario 2030450 Scenario
2030
Non-OPEC
OPEC
OECD = Organisation for Economic Co-operation and Development, mb/d = million barrels per day.Source: IEA (2007b).
Taken together, these trends imply that global conventional petroleum product prices will experience unprecedented pressures from a combination of demand growth and market concentration. Most of the available predictions show that oil prices may increase by 50%–100% from 2010 to 2030. Assuming that significant price increases result, the
6 | ADB Economics Working Paper Series No. 269

appropriate response for each country will depend on a variety of conditions. In the case of India, energy price increases have the adverse effect of lowering real incomes but the benefit of promoting energy efficiency. Rather than fighting the real income effect directly, it is reasonable to ask if biofuel development would more effectively address the real income effect, without eliminating the efficiency incentive. In the next section, we use a global forecasting model to assess these impacts and alternative policy responses.
III. The CGE Model and Policy Scenarios
As stated earlier, the link between food and energy securities through biofuels opens up an important policy challenge, and its importance is magnified for a country like India for two major reasons. First, India has a very large population living in poverty who spend a large proportion on their income on food, and as their income increases, food demand will increase substantially (Carter and Barrett 2006). Moreover, population growth will add to the increasing food demand. Second, much of India’s arable land is already under cultivation and to meet growing food demand, local food production will require increased productivity.2
An economy the size of India cannot ignore global market conditions, but neither does it need to accept them as given. In the case of conventional fuel energy, India’s long-term position may be that of a price taker, but in terms of domestic food production capacity, India can significantly buffer itself against external shocks. This is true, in fact, both for direct (food price) and indirect (other essential commodity) price shocks, as will be seen below. Many scenarios that examine biofuels from a climate perspective do not consider the price risks in conventional energy markets, but the trends examined in the previous section suggest these may be very serious.
To assess India’s policy options with respect to global energy price trends, a global dynamic forecasting model is applied, calibrated to a custom version of the GTAP 7 database. The model is described schematically in the Appendix and fully documented elsewhere. The data set begins with the standard GTAP 7 system, but disaggregates two biofuels (sugarcane ethanol, nonedible oil-based biodiesel) and byproducts by country; and then adds more data on emissions, demographics, etc. obtained from independent sources.
To better understand the influence of global energy price uncertainty on the Indian economy and options available to policy makers, five basic scenarios are considered. The first of these is a business-as-usual reference case, calibrated to independent consensus growth rates around the world and assuming no change in the real prices of primary commodities. In the reference scenario, global oil and gas prices are 2 See, for example, Gopinathan and Sudhakaran (2009), Friends of the Earth Europe (2009), and Martinot (2005) for
diverse perspectives.
Energy Security and Economics of Indian Biofuel Strategy in a Global Context | 7

assumed to both rise 50% by 2030,3 reflecting the lower bounds that have been widely publicized in independent media and discussed by official agencies like IEA and the US Department of Energy. In this study, the base case oil price was the March 2010 price ($80/barrel). In response to this scenario, three types of domestic policy are considered: biofuel deployment, energy efficiency standards, and agrofood productivity growth. In the first cases, government policies are assumed to target 20% biodiesel transport fuel substitution for diesel (S2) and ethanol deployment is added to this in S3. The next assumption is that a combination of policy and private technology diffusion leads to annual gains in overall conventional fuel use efficiency of 1% per annum over 2010–2030, a demand-side management target that has been achieved or exceeded in many economies. For comparison, in the fifth scenario, it is assumed that a combination of agricultural policies leads to a 1% annual growth of agricultural productivity. The results of all these for the Indian economy are then assessed by using a variety of macroeconomic indicators.
Table 1: Policy Scenarios
S1: Reference case, global oil price increase by 50%, 2010–2030
S2: Scenario 1 with 20% biodiesel and standards
S3: Scenario 2 with 20% biodiesel and ethanol standards
S4: Scenario 3 with 1% annual energy efficiency gains
S5: Scenario 4 with 1% food productivity growth
IV. Simulation Results
A. Biofuels Intervention
Table 2 summarizes the macroeconomic impacts of an oil price increase by 50% on the Indian economy during 2010–2030. As mentioned earlier, most of the predictions expect 50%–100% increase in oil prices between 2010 and 2030. The lower bound is used for the analysis. The reference scenario (S1) shows that a 50% increase in oil prices during the next 2 decades will have significant negative macroeconomic impacts on India.4 All the macroeconomic indicators show a decline and their interpretation should be made in comparison to the scenario without an oil price increase. For example, real GDP growth being less by 4.8% would mean that the potential growth without oil price increase will be
3 Predictions show that oil prices will increase by about 50%–100%. The simulation used both lower and upper bounds of the predictions. Biodiesel however can effectively counteract the impacts of only up to a 50% oil price increase. Therefore the discussion is limited to a 50% oil price increase. Impacts from a 100% oil price increase is similar to those of 50% but the magnitude is higher.
4 A 2.6% drop in food CPI is due to lower household incomes and consequent drop in consumption. Note that real consumption drops by 6.6%.
8 | ADB Economics Working Paper Series No. 269
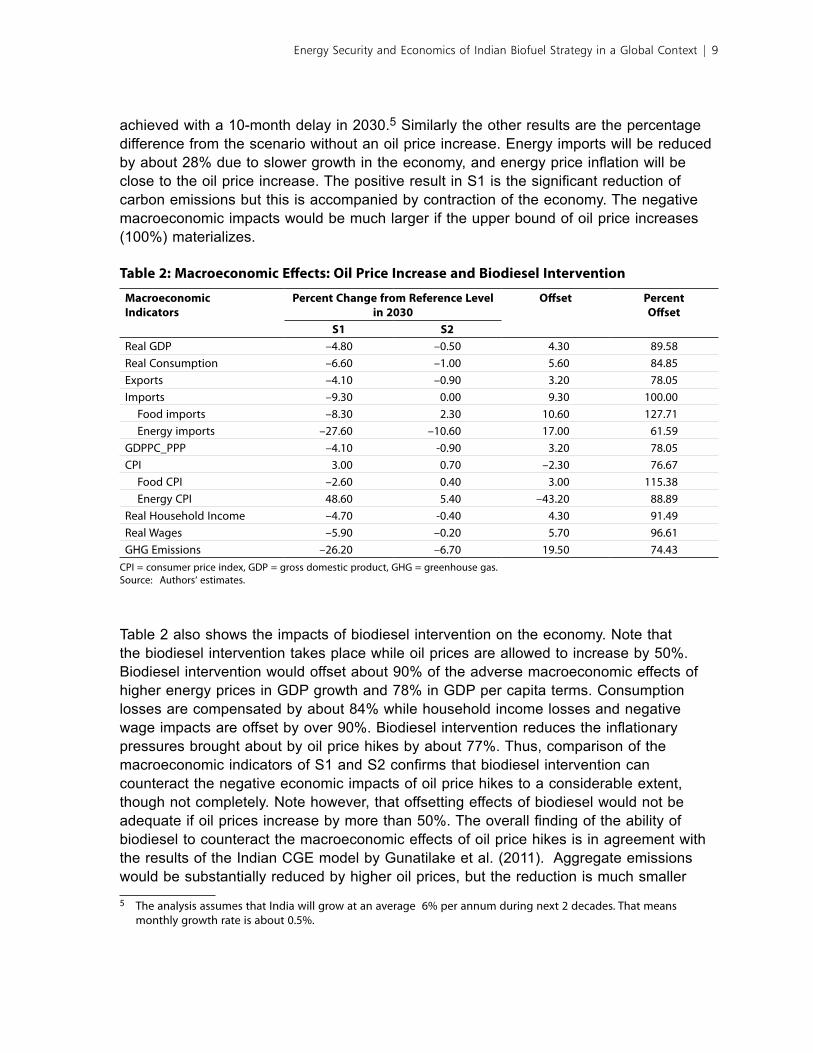
achieved with a 10-month delay in 2030.5 Similarly the other results are the percentage difference from the scenario without an oil price increase. Energy imports will be reduced by about 28% due to slower growth in the economy, and energy price inflation will be close to the oil price increase. The positive result in S1 is the significant reduction of carbon emissions but this is accompanied by contraction of the economy. The negative macroeconomic impacts would be much larger if the upper bound of oil price increases (100%) materializes.
Table 2: Macroeconomic Effects: Oil Price Increase and Biodiesel Intervention
Macroeconomic Indicators
Percent Change from Reference Level in 2030
Offset Percent Offset
S1 S2Real GDP –4.80 –0.50 4.30 89.58Real Consumption –6.60 –1.00 5.60 84.85Exports –4.10 –0.90 3.20 78.05Imports –9.30 0.00 9.30 100.00 Food imports –8.30 2.30 10.60 127.71 Energy imports –27.60 –10.60 17.00 61.59GDPPC_PPP –4.10 -0.90 3.20 78.05CPI 3.00 0.70 –2.30 76.67 Food CPI –2.60 0.40 3.00 115.38 Energy CPI 48.60 5.40 –43.20 88.89Real Household Income –4.70 -0.40 4.30 91.49Real Wages –5.90 –0.20 5.70 96.61GHG Emissions –26.20 –6.70 19.50 74.43
CPI = consumer price index, GDP = gross domestic product, GHG = greenhouse gas.Source: Authors‘ estimates.
Table 2 also shows the impacts of biodiesel intervention on the economy. Note that the biodiesel intervention takes place while oil prices are allowed to increase by 50%. Biodiesel intervention would offset about 90% of the adverse macroeconomic effects of higher energy prices in GDP growth and 78% in GDP per capita terms. Consumption losses are compensated by about 84% while household income losses and negative wage impacts are offset by over 90%. Biodiesel intervention reduces the inflationary pressures brought about by oil price hikes by about 77%. Thus, comparison of the macroeconomic indicators of S1 and S2 confirms that biodiesel intervention can counteract the negative economic impacts of oil price hikes to a considerable extent, though not completely. Note however, that offsetting effects of biodiesel would not be adequate if oil prices increase by more than 50%. The overall finding of the ability of biodiesel to counteract the macroeconomic effects of oil price hikes is in agreement with the results of the Indian CGE model by Gunatilake et al. (2011). Aggregate emissions would be substantially reduced by higher oil prices, but the reduction is much smaller
5 The analysis assumes that India will grow at an average 6% per annum during next 2 decades. That means monthly growth rate is about 0.5%.
Energy Security and Economics of Indian Biofuel Strategy in a Global Context | 9

with biodiesel intervention. The former is contractionary, while the latter is expansionary: biodiesel is a growth catalyst, but still a greening one.
The results in Table 3 show the macroeconomic indicators when both biodiesel and ethanol interventions are applied together. A comparison of the results in S3 with S2 shows that ethanol intervention makes marginal or no improvements in the economy. For example, GDP growth, per capita GDP, and household income do not show any improvements with ethanol intervention. Gunatilake and Abeygunawardena (2011) show, using a cost-benefit analysis, that sugarcane ethanol production does not improve social welfare, i.e., social costs exceeds the benefits. Moreover, they show that only molasses ethanol shows a positive net present value when there is no opportunity cost due to diversion of other uses such as potable and industrial uses. Simply put, sugar is more valuable as food compared to transport fuel in India. The results of this paper further confirm that first-generation bioethanol, which competes for agricultural resources, has a limited scope in India. The impact on the agriculture sector can be seen in a significant (5.3%) food import increase and a modest (0.2%) food CPI increase.
Table 3: Macroeconomic Effects: Bioethanol Intervention
MacroeconomicIndicators
Percent Change from Reference Level in 2030
Offset (%)
S2 S3Real GDP –0.50 –0.50 0.00Real Consumption –1.00 –1.00 0.00Exports –0.90 –1.00 –0.10Imports 0.00 –0.10 –0.10 Food Imports 2.30 3.00 0.70 Energy Imports –10.60 –12.50 –1.90GDPPC_PPP –0.90 –0.90 0.00CPI 0.70 0.80 0.10 Food CPI 0.40 0.60 0.20 Energy CPI 5.40 5.80 0.40Real Household Income –0.40 –0.40 0.00Real Wages –0.20 –0.30 –0.10GHG Emissions –6.70 –7.50 –0.80
CPI = consumer price index, GDP = gross domestic product, GHG = greenhouse gas.Source: Authors‘ estimates.
The results clearly show that biodiesel has a potential to offset the negative economic impacts of oil price hikes. One key assumption used in the analysis is that biodiesel crops will be grown in waste or fallow lands and there is no displacement of food crops. This approach has merit in a stable market environment, but if the prices of food, land, or both were to escalate significantly, marginal or waste lands may be reclaimed to produce food. Incentives and a stable, conducive business environment for biodiesel may induce conversion of food lands for biodiesel crops, undermining food security. Likewise, today’s
10 | ADB Economics Working Paper Series No. 269

food cropland could be expanded if the relative price of food is high enough to justify investments in land reclamation, forest conversion, or other expansion of farming. To a growing extent, these dynamics may be driven by forces external to India as an emerging middle class triggers greater food import dependence. Therefore, any program to support biodiesel should factor this and incorporate additional policy measures to ensure that food security is not affected by biodiesel expansion
B. Energy Efficiency Improvements
An alternative approach to energy security is to recognize the rationing signal embodied in escalating energy prices and to promote demand-side solutions like energy efficiency. Development and diffusion of more efficient technologies may entail costs, but the benefits can be adequate to justify the costs. Even with modest improvements, like 1% annually, energy efficiency can be a potent catalyst for employment creation and growth. The conventional energy supply chain in any country is less employment-intensive than most other consumption categories. Thus, if you can save a household Rupee 1 on energy, this money will then be diverted to customary expenditure categories (largely food and services), which can be an order of magnitude that is more job-intensive. Moreover, efficiency moderates energy price inflation and adverse real income effects while creating jobs elsewhere in the economy.
The demand-side approach is illustrated in Scenario S4, where we assume 1% annual energy efficiency gains across the economy (Table 4). While the cost/price distortion from biofuels remains in place, real incomes, consumption, and employment all rise as households and firms save money on energy. Overall trade increases in both directions, but energy imports fall even more. Food security appears to be undermined as food imports increase with domestic purchasing power, but have assumed static food productivity in this scenario. The general price level of the economy also increases significantly. One very important gain is a 18.1% reduction in economy wide GHG emissions, nearly three times the benefit attributed to the biodiesel expansion. Again, with the right combination of demand- and supply-side policies, just less than 1 month’s delay in growth over 20 years enables the economy to achieve significant climate mitigation.
Energy Security and Economics of Indian Biofuel Strategy in a Global Context | 11

Table 4: Macroeconomic Effects: Biofuels and Energy Efficiency Improvements
Macroeconomic Indicators
Percent Change from Reference Level in 2030
Offset(%)
PercentOffset
S1 S2 S4Real GDP –4.80 –0.50 –0.40 4.40 91.67Real Consumption –6.60 –1.00 1.60 8.20 124.24Exports –4.10 –0.90 2.40 6.50 158.54Imports –9.30 0.00 2.70 12.00 129.03 Food Imports –8.30 2.30 9.50 17.80 214.46 Energy Imports –27.60 –10.60 –19.00 8.60 31.16GDPPC_PPP –4.10 –0.90 1.30 5.40 131.71CPI 3.00 0.70 4.60 1.60 –53.33 Food CPI –2.60 0.40 1.90 4.50 173.08 Energy CPI 48.60 5.40 –9.00 –57.60 118.52Real Household Income –4.70 –0.40 2.30 7.00 148.94Real Wages –5.90 –0.20 3.70 9.60 162.71GHG Emissions –26.20 –6.70 –18.10 8.10 30.92
CPI = consumer price index, GDP = gross domestic product, GDPPC_PPP = GDP per capita at purchasing power parity, GHG = greenhouse gas.
Source: Authors‘ estimates.
C. Food Productivity Increase
One of the drawbacks in the biofuels cum energy efficiency scenario (S4) is the adverse impact on food security: food imports increase by 9.5% and the food price index increases by 1.9%. A third line of attack, addressing both energy and food security, is captured in the scenario S5, where public resources are targeted at both energy demand management and increasing food productivity by 1% yearly. Simulation results in Table 5 show that all the macroeconomic indicators have improved; real GDP, consumption, employment, and all other living standard-related macro to aggregates rise substantially. At the same time, food imports fall by about 30%, food prices are substantially lower, and national health indicators can be expected to improve accordingly. Moreover, GHG emission reduction is also very high although slightly lower than that for scenario S4. Energy imports still fall relative to the baseline, but somewhat less because of economic expansion. Overall, however, there is a virtuous cycle of greater national self-sufficiency in food and energy, higher incomes and employment, lower GHG emissions, and full economic accommodation of the biofuel agenda. Therefore biodiesel expansion together with energy efficiency and food productivity improvements provides a win-win option for India to counteract the negative impacts of energy price hikes.
12 | ADB Economics Working Paper Series No. 269

Table 5: Macroeconomic Effects: Biofuels, Energy Efficiency, and Food Productivity Improvements
Macroeconomic Indicators
Percent Change from Reference Levelin 2030
Offset
S1 S2 S4 S5Real GDP –4.80 –0.50 –0.40 2.90 7.70%Real Consumption –6.60 –1.00 1.60 6.20 12.80%Exports –4.10 –0.90 2.40 1.30 5.40%Imports –9.30 0.00 2.70 3.20 12.50% Food Imports –8.30 2.30 9.50 –29.50 –21.20% Energy Imports –27.60 –10.60 –19.00 –13.00 14.60%GDPPC_PPP –4.10 –0.90 1.30 5.10 9.20%CPI 3.00 0.70 4.60 1.70 –1.30% Food CPI –2.60 0.40 1.90 –11.90 –9.30% Energy CPI 48.60 5.40 –9.00 0.40 –48.20%Real Household Income –4.70 –0.40 2.30 4.20 8.90%Real Wages –5.90 –0.20 3.70 7.90 13.80%GHG Emissions –26.20 –6.70 –18.10 –15.60 10.60%
CPI = consumer price index, GDP = gross domestic product, GDPPC_PPP = GDP per capita at purchasing power parity, GHG = greenhouse gas.
Source: Authors‘ estimates.
The increase in food imports in S2 is also partly due to higher incomes among the rural populations who spend a larger share of their incomes on food. Note that in S1 we keep food productivity constant at the 2010 level. Scenario 5 addresses this challenge constructively, since only moderate productivity growth would neutralize this impact. It must be recalled, however, that we are assuming the vast majority of biofuel, nonedible oilseed-based diesel, is produced on marginal land that does not compete directly with food (Achten et al. 2008, Global Exchange for Social Investment 2008). If this were not the case, the fuel–food impact would be much more adverse.
The growth effects of the combined strategy are dramatic not only because of expansion in the primary sector of the world’s second most populous economy, but because they again reverse the net effects of substantial energy price inflation. Because they are combined with energy efficiency policies, the real output gains from productivity growth lead to falling resource costs, greater international competitiveness, and even higher real incomes across India’s vast low-income rural sector.
How feasible are the last two scenarios? Data on other country experiences with energy efficiency suggest there is plenty of low-hanging fruit for India to harvest such improvements. For agricultural productivity, history also suggests that the right policy initiatives can do as well or better than we have assumed. As historical values suggest, (Table 6) this improvement is well within historical potential in the region.
Energy Security and Economics of Indian Biofuel Strategy in a Global Context | 13

Table 6: Average Annual Growth in Agricultural Output
Region/Country 1970–79 1980–89 1990–99 2000–06Latin America and the Caribbean 3.07 2.37 2.87 3.13Brazil 3.83 3.73 3.29 4.41People’s Republic of China 3.09 4.60 5.17 3.87Southeast Asia 3.68 3.59 3.13 3.54South Asia 2.56 3.39 3.00 2.19India 2.69 3.52 2.94 2.00Developing Countries 2.82 3.46 3.64 3.09
Sources: UN (2001), FAO (2005), and World Bank (2008).
In a very real sense then, combined policies of this kind lead to sustainable energy, environmental security, and food security. Demand-side solutions are promoted on the energy fuel side, where India has a relatively limited market power as a supplier. This attenuates and even reverses energy price escalation, averting resource pulls to this activity that would simply promote greater energy use. At the same time, promoting productivity growth across the country’s still dominant food economy increases output and employment, and lowers relative prices of this essential category to substantially offset price increases in energy commodities.
V. Conclusions
Energy is closely linked with historical prosperity, but energy dependence also confers important risks such as global warming pollution from conventional energy use and risks to real incomes from higher energy prices. This paper examines these issues for India from the perspective of global market forces and domestic policy responses. Overall, we find convincing evidence that, if conventional energy prices establish substantially higher trends over the next 2 decades, it could have significant adverse effects on the Indian economy. At the same time, however, India has some flexibility in addressing this challenge.
In particular, our analysis supports the wisdom of policy packages that combine supply-side energy solutions, like biodiesel development together with demand-side management, and inflation hedging in other essential commodities through productivity improvements. On the supply side, our results suggest that biodiesel can provide energy price insurance from a source that promotes domestic economic growth, fuller resource utilization and more inclusive development of the rural sector. In contrast to bioethanol, it is apparent that biodiesel would be limited in its competition with other food production activities. The main challenge for promoting biodiesel is to develop its supply chains, which are still in their infancy in the Indian economy, by developing significant
14 | ADB Economics Working Paper Series No. 269

public commitments to agricultural extension, enterprise and technology promotion, and regulation, including credible measures to prevent arable lands from being used for biodiesel production. First-generation bioethanol however has limited or no capacity in cushioning the Indian economy against energy price inflation.6
More indirect approaches to protecting against energy price shocks were also considered, including energy efficiency promotion and improvements in agrofood productivity. In the former case, we show that promoting energy use efficiency can save households and enterprises money, create more jobs elsewhere in the Indian economy, and stem erosion of real incomes from more expensive imported energy or less efficient domestic substitutes, while at the same time reducing long-term environmental risks. A more indirect response to energy price inflation is to promote agrofood productivity growth. This has the primary benefit of reinforcing food security and traditional livelihoods across the country, but indirectly it also disciplines prices of another essential commodity group, food, which deflation can substantially offset energy price inflation in the budgets of poor households. Even modest assumptions about energy efficiency and agrofood productivity gains can reverse negative shocks to per capita (PPP) incomes for the majority of India’s population.
6 Koplow (2006), Taheripour and Tyner (2007), Reddy et al. (2005).
Energy Security and Economics of Indian Biofuel Strategy in a Global Context | 15

Appendix: Model SummaryThis paper uses a version of the World Bank’s Linkage Model, a global, multiregion, multisector, dynamic applied general equilibrium model (Van der Mensbrugghe 2005). The base data set—GTAP Version 7.0—is defined across 118 country and/or region groupings and 57 economic sectors. For this paper, the model has been defined for an aggregation of 13 country and/or regions and 10 sectors, including sectors of importance to the poorer developing countries—grains, textiles, and apparel. The regional and sectoral concordances can be found in the main text. The remainder of this section outlines briefly the main characteristics of supply, demand, and the policy instruments of the model.
Production
All sectors are assumed to operate under constant returns to scale and perfect competition. Production in each sector is modeled by a series of nested CES production functions that are intended to represent the different substitution and complementarity relations across the various inputs in each sector. There are material inputs that generate the input/output table, as well as factor inputs representing value added.
Three different production archetypes are defined in the model—crops, livestock, and all other goods and services. The CES nests of the three archetypes are graphically depicted in Appendix Figures 1–3. Within each production archetype, sectors will be differentiated by different input combinations (share parameters) and different substitution elasticities. Share structures are largely determined by base year data, and the elasticities are given values by the modeler.
The key feature of the crop production structure is the substitution between intensive cropping versus extensive cropping, i.e., between fertilizer and land (Appendix Figure 1). Livestock production captures the important role played by feed versus land, i.e., between ranch-fed versus range-fed production (Appendix Figure 2). Production in the other sectors more closely matches the traditional role of capital/labor substitution, with energy introduced as an additional factor of production (Appendix Figure 3).
In each period, the supply of primary factors—capital, labor, and land—is usually predetermined. However, the supply of land is assumed to be sensitive to the contemporaneous price of land. Land is assumed to be partially mobile across agricultural sectors. Given the comparative static nature of the simulations that assume a longer-term horizon, both labor and capital are assumed to be perfectly mobile across sectors (though not internationally).
Model current specification has an innovation in the treatment of labor resources. The GTAP data set identifies two types of labor skills—skilled and unskilled. Under the standard specification, both types of labor are combined together in a CES bundle to form aggregate sectoral labor demand, i.e., the two types of labor skills are directly substitutable. In the new specification, a new factor of production has been inserted, human capital. It is combined with capital to form a physical cum human capital bundle, with an assumption that they are complements. On input, the user can specify the percentage of the skilled labor factor to allocate to the human capital factor.
Once the optimal combination of inputs is determined, sectoral output prices are calculated assuming competitive supply (zero-profit) conditions in all markets.
16 | ADB Economics Working Paper Series No. 269

Consumption and Closure Rules
All income generated by economic activity is assumed to be distributed to a single representative household. The single consumer allocates optimally his or her disposable income among the consumer goods and saving. The consumption/saving decision is completely static: saving is treated as a “good” and its amount is determined simultaneously with the demands for the other goods, the price of saving being set arbitrarily equal to the average price of consumer goods.
Government collects income taxes; indirect taxes on intermediate and final consumption; taxes on production, tariffs, and export taxes; and/or subsidies. Aggregate government expenditures are linked to changes in real GDP. The real government deficit is exogenous. Closure therefore implies that some fiscal instrument is endogenous in order to achieve a given government deficit. The standard fiscal closure rule is that the marginal income tax rate adjusts to maintain a given government fiscal stance. For example, a reduction or elimination of tariff rates is compensated by an increase in household direct taxation, ceteris paribus.
Each region runs a current account surplus (deficit) that is fixed (in terms of the model numéraire). The counterpart of these imbalances is a net outflow (inflow) of capital, subtracted from (added to) the domestic flow of saving. In each period, the model equates gross investment to net saving (equal to the sum of saving by households, the net budget position of the government, and foreign capital inflows). This particular closure rule implies that investment is driven by saving. The fixed-trade balance implies an endogenous real exchange rate. For example, removal of tariffs, which induces increased demand for imports, is compensated by increasing exports—which is achieved through a real depreciation.
Foreign Trade
The world trade block is based on a set of regional bilateral flows. The basic assumption in Linkage is that imports originating in different regions are imperfect substitutes (Appendix Figure 4). Therefore in each region, total import demand for each good is allocated across trading partners according to the relationship between their export prices. This specification of imports—commonly referred to as the Armington specification—implies that each region faces a downward-sloping demand curve for its exports. The Armington specification is implemented using two CES nests. At the top nest, domestic agents choose the optimal combination of the domestic good and an aggregate import good consistent with the agent’s preference function. At the second nest, agents optimally allocate demand for the aggregate import good across the range of trading partners.
The bilateral supply of exports is specified in parallel fashion using a nesting of constant-elasticity-of-transformation (CET) functions. At the top level, domestic suppliers optimally allocate aggregate supply across the domestic market and the aggregate export market. At the second level, aggregate export supply is optimally allocated across each trading region as a function of relative prices.
Trade variables are fully bilateral and include both export and import taxes and/or subsidies. Trade and transport margins are also included; therefore world prices reflect the difference between free on board versus cost, insurance, and freight pricing.
Energy Security and Economics of Indian Biofuel Strategy in a Global Context | 17

Prices
The linkage model is fully homogeneous in prices, i.e., only relative prices are identified in the equilibrium solution. The price of a single good, or of a basket of goods, is arbitrarily chosen as the anchor to the price system. The price (index) of the Organisation for Economic Co-operation and Development (OECD) manufacturing exports has been chosen as the numéraire, and is set to 1.
Elasticities
Production elasticities are relatively standard and are available from the authors. Aggregate labor and capital supplies are fixed, and within each economy they are perfectly mobile across sectors.
Equivalent Variation Aggregate National Income
Aggregate income gains and/or losses summarize the extent to which trade distortions are hindering growth prospects and the ability of economies to use the gains to help those whose income could potentially decline.
Real income is summarized by Hicksian equivalent variation (EV). This represents the income consumers would be willing to forego to achieve postreform well-being (up) compared to baseline well-being (ub) at baseline prices (pb):
EV E p u E p ub p b b= ( ) − ( ), ,
where E represents the expenditure function to achieve utility level u given a vector of prices p (the b superscript represents baseline levels, and p the postreform levels). The model uses the extended linear expenditure system (ELES), which incorporates savings in the consumer’s utility function. The discounted real income uses the following formula:
CEV EV Ytta
t
ttd
t
= −( )
=
−( )
=∑ ∑b b2004
2005
20152004
2005
2015
/
where CEV is the cumulative measure of real income (as a percentage of baseline income), b is the discount factor (equal to 1/(1+r) where r is the subjective discount rate), Yd is real disposable income, and EVa is adjusted equivalent variation. The adjustment to EV extracts the component measuring the contribution of household saving, since this represents future consumption. Without the adjustment, the EV measure would be double counting. The saving component is included in the EV evaluation for the terminal year. Similar to the OECD, a subjective discount rate of 1.5% is assumed in the cumulative expressions.
18 | ADB Economics Working Paper Series No. 269

Specification of Endogenous Productivity Growth
Productivity in manufacturing and services is the sum of three components:
(i) a uniform factor used as an instrument to target gross domestic product growth in the baseline simulation
(ii) a sector-specific fixed shifter that allows for relative differentials across sectors (for example, manufacturing productivity 2 percentage points higher than productivity in the services sectors)
(iii) a component linked to sectoral openness as measured by the export-to-output ratio
The openness component takes the following functional form:
γ χη
ie
ii
i
EX
=
0
(1)
where g e is the growth in sectoral productivity due to the change in openness, c 0 is a calibrated parameter, E and X represent respectively sectoral export and output, and h is the elasticity. The parameter c 0 has been calibrated so that (on average) openness determines roughly 40% of productivity growth in the baseline simulation, and the elasticity has been set to 1.
In agriculture, productivity is fixed in the baseline, set to 2.5% per annum in most developing countries. However, a share of the fixed productivity is attributed to openness, using equation (1).
In the baseline, GDP growth is given. Agricultural productivity is similarly given, and equation (1) is simply used to calibrate the shift parameter, c 0, so that a share of agricultural productivity is determined by sectoral openness. Average productivity in the manufacturing and services sectors is endogenous and is calibrated in the baseline to achieve the given GDP growth target. The economywide (excluding agriculture) productivity parameter is endogenous. Equation (1) is used to calibrate the same c 0 parameter, under the assumption that some share of sectoral productivity is determined by openness, for example 40%.
In policy simulations, the economywide productivity factor, along with other exogenous productivity factors (sector-specific shifters) are held fixed, but the openness-related part of productivity is endogenous and responds to changes in the sectoral export-to-output ratio. In the manufacturing and services sectors, the elasticity is set at 1. In the agricultural sectors it is set to 0.5.
Say sectoral productivity is 2.5%, and that 40% of it can be explained by openness, i.e., 1.0%, with the residual 1.5% explained by other factors. Assume sectoral openness increases by 10%. If the elasticity is 1, this implies that the openness-related productivity component will increase to 1.1% and total sectoral productivity will increase to 2.6% (implying that the total sectoral productivity increases by 4% with respect to the 10% increase in sectoral openness).
Energy Security and Economics of Indian Biofuel Strategy in a Global Context | 19
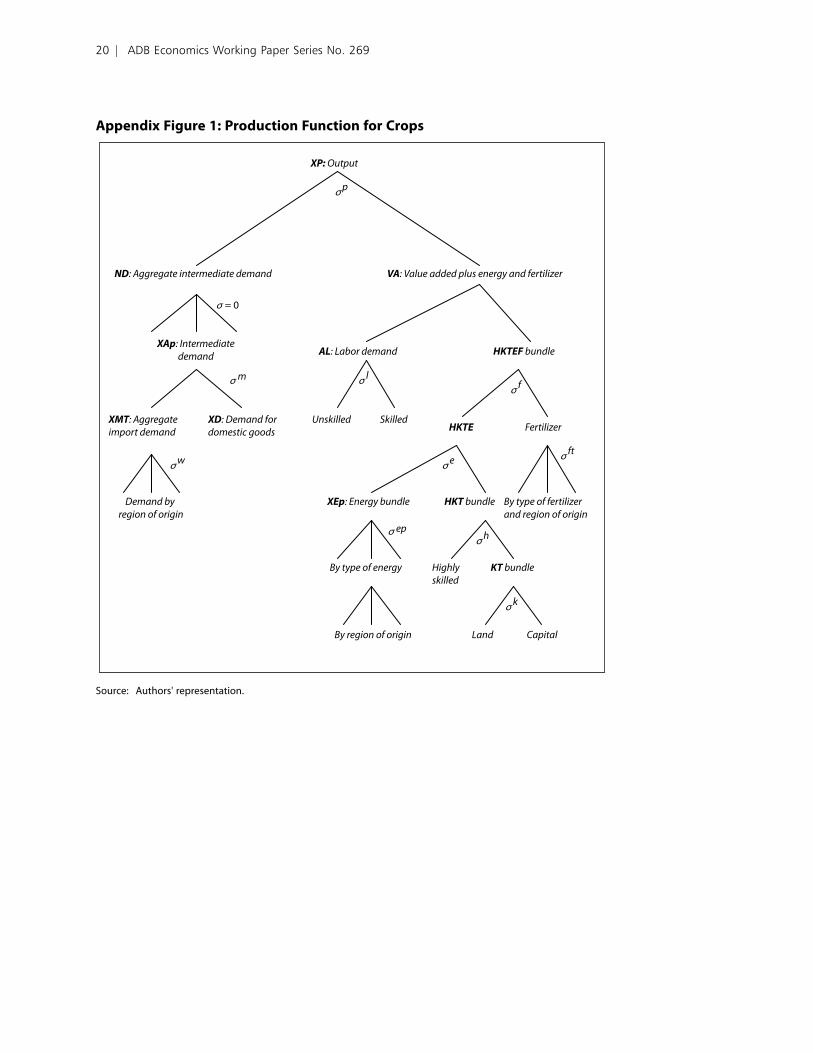
Appendix Figure 1: Production Function for Crops
σ p
Highlyskilled
KT bundle
Land Capital
σ = 0
σ m
σ w
σ ep
σ k
σ h
σ l
σ e σ ft
σ f
HKT bundle
VA: Value added plus energy and fertilizer
XMT: Aggregateimport demand
ND: Aggregate intermediate demand
XP: Output
XAp: Intermediatedemand
Demand by region of origin
XD: Demand fordomestic goods
AL: Labor demand
Unskilled Skilled
HKTEF bundle
HKTE Fertilizer
By type of fertilizerand region of origin
XEp: Energy bundle
By type of energy
By region of origin
Source: Authors' representation.
20 | ADB Economics Working Paper Series No. 269

Appendix Figure 2: Production Function for Livestock
σepσh
σ fd
σ f
σ eσ l
σ v
σ w
σ m
Feed AL: Labor demand
XMT: Aggregateimport demand
XP: Output
ND: Aggregate intermediate demand
XAp: Intermediate demand
XD: Demand fordomestic goods
WTF: Demand by region of origin
VA: Value added plus energyand feed
TFD: Land and feed bundle KTEL bundle
HKTEbundle
XEp: Energy bundle
HKTbundle
Unskilled Skilled
Energy demandby type of energy
and region of origin
Feed demandby type of feedand region of
origin
Capital Highlyskilled
Land
σ p
σ = 0σ = 0
Source: Authors' representation.
Energy Security and Economics of Indian Biofuel Strategy in a Global Context | 21

Appendix Figure 3: Production Function for Nonagriculture
XP: Output:
ND: Aggregate intermediatedemand
VA: Value added plus energy
XAp: Intermediatedemand
XD: Demand fordomestic goods
XMT: Aggregate import demand
WTF: Demand byregion of origin
AL: Labordemand
Unkilled Skilled
HKTEbundle
HKTbundle
XEp: Energybundle
KTbundle
Highly skilled
By type ofenergy
By region oforigin…
σ p
Sector-speci�cfactor
σ v
σ e
σ hσ ep
σ m
σ w
σ l
σ = 0
σ k
Capital
Source: Authors' representation.
22 | ADB Economics Working Paper Series No. 269

Appendix Figure 4: Trade Aggregation
XA: Armington demand
XDd: Domestic demandfor domestic production
XDs: Local production suppliedto domestic market
XMT: Aggregateimport demand
WTFd: Import demandby region of origin
WTFs: Local production suppliedby region of destination
ES: Aggregate export supply
σ m
σ w
σ x
σ z
XP: Domestic supply
Constant-elasticity-of-transformation supply
speci�cation
Constant-elasticity-of-substitution demand
speci�cation
Source: Authors' representation.
Energy Security and Economics of Indian Biofuel Strategy in a Global Context | 23

ReferencesAchten, W., L. Verchot, et al. 2008. “Jatropha Biodiesel Production and Use.” Biomass and
Bioenergy 32(12):1063–84 .Alston, J. M., J. M. Beddow, and P. G. Pardey. 2009. Mendel versus Malthus: Research,
Productivity and Food Prices in the Long Run. Staff Papers 53400, Department of Applied Economics, University of Minnesota, Minneapolis.
Altenburg, T., H. Dietz, M. Hahl, N. Nikolidakis, C. Rosendahl, and K. Seelige. 2009. Biodiesel in India: Value Chain Organisation and Policy Options for Rural Development. Studies.Deutsches Institut fuer Entwicklungspolitik, Deutsches Institut fuer Entwicklungspolitik, Bonn.
Berndes G., M. Hoogwijk, and R. van den Broek. 2003. “The Contribution of Biomass in the Future Global Energy Supply: A Review of 17 Studies.” Biomass Bioenergy 25:1–28.
Carter, M. R., and C. B. Barrett. 2006. “The Economics of Poverty Traps and Persistent Poverty: An Asset-Based Approach.” Journal of Development Studies 42(2):178–99.
Drèze, J., and A. K. Sen. 1989. Hunger and Public Action. Oxford, England, New York: Oxford University Press.
FAO. 2005. The State of Food Insecurity in the World. Food and Agriculture Organization, Rome.Farrell, A. E., R. J. Plevin, B. T. Turner, A. D. Jones, M. O’Hare, and D. M. Kammen. 2006.
“Ethanol can Contribute to Energy and Environmental Goals.” Science 311:506–8. Friends of the Earth Europe. 2009. Losing the Plot: The Threats to Community Land and the Rural
Poor through the Spread of the Biofuel Jatropha in India. Brussels.Global Exchange for Social Investment. 2008. Global Market Study on Jatropha: Final Report.
London/Berlin.Gopinathan, M., and R. Sudhakaran. 2009. “Biofuels: Opportunities and Challenges in India.” In
Vitro Cellular & Developmental Biology - Plant 45(3):350–71.Government of India. 2002. Ministry of Petroleum and Natural Gas Resolution No.
P-45018/28/2000-C. C. Ministry of Petroleum and Natural Gas, New Delhi.———. 2003. Report of the Committee on the Development of Biofuel. Planning Commission, New
Delhi.———. 2005. Bio-Diesel Purchase Policy. Ministry of Petroleum and Natural Gas, New Delhi.———. 2006. Integrated Energy Policy. Planning Commission, New Delhi.———. 2008. The National Policy on Bio-Fuel. Ministry of New and Renewable Energy, New Delhi.———. 2009a. Memorandum of Understanding between the Ministry of New and Renewable
Energy of the Republic of India and the Department of Energy of the United States of America on Cooperation in the Development of Biofuels. Ministry of New and Renewable Energy, New Delhi.
———. 2009b. National Policy on Biofuels. Ministry of New and Renewable Energy, New Delhi.Gunatilake, H. 2011. “Food Security, Energy Security and Inclusive Growth in India: the Role of
Biofuels.” Asian Development Bank, Manila. Processed.Gunatilake, H., and P. Abeygunawardena. 2011. Energy Security, Food Security, and Economics of
Sugarcane Bioethanol in India. ADB Economics Working Paper Series No. 255, Economics and Research Department, Asian Development Bank, Manila.
Gunatilake H., S. Pohit, and G. Sugiyarto. 2011. Economywide Impacts of Biofuel Production and use in India: A CGE Model Assessment. Technical Assistance Report to India for the Study on Cross-Sectoral Implications of Biofuel Production and Use. Asian Development Bank, Manila.
IEA. 2007a. International Energy Agency Global Renewable Fact Sheet. International Energy Agency, Paris.
———. 2007b. World Energy Outlook. International Energy Agency, Paris.
24 | ADB Economics Working Paper Series No. 269

Jha, S., D. Roland-Holst, S. Sriboonchitta, and D. Behnke. 2010. Regional Trade Opportunities for Asian Agriculture. ADB Economics Working Paper Series No. 191, Economics and Research Department, Asian Development Bank, Manila.
Koplow, D. 2006. Biofuels at What Cost? Government Support for Ethanol and Biodiesel in the United States. Available: www.globalsubsidies.org.
Martinot, E. 2005. Renewables 2005: Global Status Report. Worldwatch Institute, Washington, DC. Ministry of Petroleum and Natural Gas, 2007. “All India Launch of 5% Ethanol Blended Petrol
Programme.” Hyderabad Press Information Bureau, New Delhi.Msangi, S. 2007. “Global Scenarios for Biofuels: Impacts and Implications.” Paper presented at the
International Conference on Linkages between Energy and Water Management for Agriculture in Developing Countries, International Food Policy Research Institute, ICRISAT, Hyderabad.
OECD. 2006. “Agricultural Market Impacts of Future Growth in the Production of Biofuels.” OECD Papers 6:1–57.
Rajagopal, D., and D. Zilberman. 2007. Review of Environmental, Economic and Policy Aspects of Biofuels Policy. Research Working Paper Series 4341, The World Bank, Washington, DC.
Reddy, B. V. S., S. Ramesh, S. P. Reddy, B. Ramaih, P. M. Salimath and R. Kachapur. 2005. “Sweet Sorghum—A Potential Alternative Raw Material for Bio-ethanol and Bio-energy.” Int. Sorghum Millets Newsletter 46:79–86.
REN21. 2009. Renewables Global Status Report: 2009 Update. REN21 Secretariat, Paris.Somerville. C. 2007. “Biofuels.” Current Biology 17:115–9. Taheripour, F., and W. Tyner. 2007. “Ethanol Subsidies, Who Gets the Benefits?” Paper presented
at the Biofuels, Food and Feed Tradeoffs Conference, 12–13 April, St. Louis, Missouri. Tyner, W. E. 2007. “US Ethanol Policy—Possibilities for the Future.” Department of Agricultural
Economics, Purdue University.UN. 2001. Indicators of Sustainable Development: Guidelines and Methodologies. United Nations
Division for Sustainable Development. Available: www.un.org/esa/sustdev/natlinfo/indicators/isd.htm.
Van der Mensbrugghe, D. 2005. LINKAGE Technical Reference Document Version 6.0. Development Prospects Group (DECPG). The World Bank, Washington, DC.
Waggoner, P. E. 1995. “How Much Land can Ten Billion People Spare for Nature? Does Technology Make a difference.” Technology in Society 17:17–34.
World Bank. 2008. World Development Indicators. Washington, DC. Available: www.worldbank.org/data.
Energy Security and Economics of Indian Biofuel Strategy in a Global Context | 25

About the PaperHerath Gunatilake, David Roland-Holst, Guntur Sugiyarto, and Jenn Baka Energy write that biodiesel expansion, when combined with energy efficiency improvements and food productivity increases, could provide India much better opportunities for enhanced energy security, food security, and climate change mitigation. Biodiesel expansion for 20% blending by 2017 can offset the significant negative impacts on the Indian economy of price increases. However, bioethanol does not have the ability to counteract the impacts of oil price increases.
About the Asian Development BankADB’s vision is an Asia and Pacific region free of poverty. Its mission is to help its developing member countries reduce poverty and improve the quality of life of their people. Despite the region’s many successes, it remains home to two-thirds of the world’s poor: 1.8 billion people who live on less than $2 a day, with 903 million struggling on less than $1.25 a day. ADB is committed to reducing poverty through inclusive economic growth, environmentally sustainable growth, and regional integration. Based in Manila, ADB is owned by 67 members, including 48 from the region. Its main instruments for helping its developing member countries are policy dialogue, loans, equity investments, guarantees, grants, and technical assistance.
Asian Development Bank6 ADB Avenue, Mandaluyong City1550 Metro Manila, Philippineswww.adb.org/economicsISSN: 1655-5252Publication Stock No. WPS113900
Printed on recycled paper
Printed in the Philippines
< 0 1 1 3 9 0 0 6 >
Copyright © 2022 FDOKUMEN