Energy efficiency analysis of styrene production by adiabatic ...
12
Polish Journal of Chemical Technology, 20, 1, 35—46, 10.2478/pjct-2018-0006 Energy efficiency analysis of styrene production by adiabatic ethylbenzene dehydrogenation using exergy analysis and heat integration Emad Ali, Mohamed Hadj-Kali King Saud University, Chemical Engineering Department, Riyadh, Saudi Arabia 11421 * Corresponding author: e-mail: [email protected] Styrene is a valuable commodity for polymer industries. The main route for producing styrene by dehydrogenation of ethylbenzene consumes a substantial amount of energy because of the use of high-temperature steam. In this work, the process energy requirements and recovery are studied using Exergy analysis and Heat Integration (HI) based on Pinch design method. The amount of steam plays a key role in the trade-off between Styrene yield and energy savings. Therefore, optimizing the operating conditions for energy reduction is infeasible. Heat integration indicated an insigni ficant reduction in the net energy demand and exergy losses, but 24% and 34% saving in external heating and cooling duties, respectively. When the required steam is generated by recovering the heat of the hot reactor ef fluent, a considerable saving in the net energy demand, as well as the heating and cooling utilities, can be achieved. Moreover, around 68% reduction in the exergy destruction is observed. Keywords: Styrene production, Ethylbenzene dehydrogenation, Exergy analysis, Heat Integration, Pinch Analysis, Heat Recovery. INTRODUCTION Styrene (ST) is the second principal monomers in the chemical industries because it is a key raw material of polymers. It is used to produce versatile polymeric materi- als, the main products being poly-styrene, styrene-acrylo- nitrile, styrene-butadiene latex and acrylonitrile-butadiene styrene resins (ABS) 1 . The utilization of styrene-based plastics is growing quickly. Currently, polystyrene is the least expensive thermoplastics in terms of a cost-per- volume basis 2 . The major commercial process to produce styrene is the dehydrogenation of ethylbenzene (EB), in which adiabatic dehydrogenation accounts to 90% of the commercial production 1, 3 . In 2010 the total annual production of styrene reached 26.4 million metric tons 4 . The expected worldwide consumption of styrene in 2020 is expected to increase to 41 million metric tons 5 . Sufficient work on kinetics and reactor modeling for Styrene production by dehydrogenation of ethylbenzene is available in the literature. Snyder and Subramniam 6 developed a heterogeneous model to investigate the effect of using a novel, packed-bed, reverse flow reactor for the endothermic dehydrogenation of ethylbenzene to styrene. They showed that dividing the steam injection over various locations gives near isothermal bed tempe- ratures. Desirable overall ethylbenzene conversion and styrene selectivity are obtained due to isothermal ope- ration. Similarly, Haynes et al. 7 extended the concept of the reverse flow reactor to endothermic reactions such as dehydrogenation of ethylbenzene. They showed that higher conversions than conventional systems can be achieved by the periodic alternation of a reactant and a regenerating medium counter currently over a fixed bed of catalyst. Abdalla et al. 8 developed kinetics mo- del of an industrial catalyst for the dehydrogenation of ethylbenzene to styrene. The rigorous heterogeneous model is validated using industrial reactor data based on the Stefan-Maxwell equations for multicomponent diffusion in porous catalyst pellets. Hossain et al. 9 pro- posed another phenomenological-based kinetics model for the dehydrogenation of ethylbenzene to styrene over a FeOx-meso-Al 2 O 3 catalyst based on a joint surface science and engineering approach. Tamsilian 10 presented a mathematical model for ethylbenzene dehydrogenation consists of nonlinear simultaneous differential equations with multiple dependent variables. They concluded that application of the proposed catalyst increases ethylbenze- ne conversion and decreases necessary inlet temperature. Zarubina 11 screened high throughput catalyst involving catalysts based on bare commercial carriers, metal-based counterparts, carbon-based materials, and P-promoted catalysts. The purpose was to achieve conversion higher than the conventional one. Lee 12 developed a mathe- matical model for the ethylbenzene dehydrogenation based on validated kinetics model using experimental data. The comprehensive model is used to estimate the steam to ethylbenzene ratio that leads to optimum operating conditions. The current conventional styrene production by steam dehydrogenation suffers from several disadvantages: (1) High energy consumption due to the use of superheated steam, (2) The reaction is thermodynamically limited to 50–65%, which demands a considerable reactant recycle, (3) Separation of EB and ST is problematic due to a similar boiling point of 136 o C and 145 o C, respectively 11, 13–16 . Alternately, the oxidative dehydro- genation of ethylbenzene (EB) has been proposed to overcome equilibrium limitation regarding conversion when operating at lower temperatures with an exother- mic reaction 17 . However, this process suffers from loss of styrene selectivity due to the production of carbon oxides and oxygenates 14 . In addition, the use of oxidant compromises the process safety as it should always ope- rate outside of the flammability limits of ethylbenzene 11 . Isothermal dehydrogenation of ethylbenzene to styrene is also studied. However, this approach is not widely spread and has limited production capacity 10 . To alleviate the energy consumption due to the use of steam, efforts to replace the steam with CO 2 are studied. It is believed that utilization of CO 2 instead of steam will have beneficial advantages such as energy saving
-
Upload
khangminh22 -
Category
Documents
-
view
0 -
download
0
Transcript of Energy efficiency analysis of styrene production by adiabatic ...

Pol. J. Chem. Tech., Vol. 20, No. 1, 2018 35Polish Journal of Chemical Technology, 20, 1, 35—46, 10.2478/pjct-2018-0006
Energy effi ciency analysis of styrene production by adiabatic ethylbenzene dehydrogenation using exergy analysis and heat integration
Emad Ali, Mohamed Hadj-Kali
King Saud University, Chemical Engineering Department, Riyadh, Saudi Arabia 11421*Corresponding author: e-mail: [email protected]
Styrene is a valuable commodity for polymer industries. The main route for producing styrene by dehydrogenation of ethylbenzene consumes a substantial amount of energy because of the use of high-temperature steam. In this work, the process energy requirements and recovery are studied using Exergy analysis and Heat Integration (HI) based on Pinch design method. The amount of steam plays a key role in the trade-off between Styrene yield and energy savings. Therefore, optimizing the operating conditions for energy reduction is infeasible. Heat integration indicated an insignifi cant reduction in the net energy demand and exergy losses, but 24% and 34% saving in external heating and cooling duties, respectively. When the required steam is generated by recovering the heat of the hot reactor effl uent, a considerable saving in the net energy demand, as well as the heating and cooling utilities, can be achieved. Moreover, around 68% reduction in the exergy destruction is observed.
Keywords: Styrene production, Ethylbenzene dehydrogenation, Exergy analysis, Heat Integration, Pinch Analysis, Heat Recovery.
INTRODUCTION
Styrene (ST) is the second principal monomers in the chemical industries because it is a key raw material of polymers. It is used to produce versatile polymeric materi-als, the main products being poly-styrene, styrene-acrylo-nitrile, styrene-butadiene latex and acrylonitrile-butadiene styrene resins (ABS)1. The utilization of styrene-based plastics is growing quickly. Currently, polystyrene is the least expensive thermoplastics in terms of a cost-per-volume basis2. The major commercial process to produce styrene is the dehydrogenation of ethylbenzene (EB), in which adiabatic dehydrogenation accounts to 90% of the commercial production1, 3. In 2010 the total annual production of styrene reached 26.4 million metric tons4. The expected worldwide consumption of styrene in 2020 is expected to increase to 41 million metric tons5.
Suffi cient work on kinetics and reactor modeling for Styrene production by dehydrogenation of ethylbenzene is available in the literature. Snyder and Subramniam6 developed a heterogeneous model to investigate the effect of using a novel, packed-bed, reverse fl ow reactor for the endothermic dehydrogenation of ethylbenzene to styrene. They showed that dividing the steam injection over various locations gives near isothermal bed tempe-ratures. Desirable overall ethylbenzene conversion and styrene selectivity are obtained due to isothermal ope-ration. Similarly, Haynes et al.7 extended the concept of the reverse fl ow reactor to endothermic reactions such as dehydrogenation of ethylbenzene. They showed that higher conversions than conventional systems can be achieved by the periodic alternation of a reactant and a regenerating medium counter currently over a fi xed bed of catalyst. Abdalla et al.8 developed kinetics mo-del of an industrial catalyst for the dehydrogenation of ethylbenzene to styrene. The rigorous heterogeneous model is validated using industrial reactor data based on the Stefan-Maxwell equations for multicomponent diffusion in porous catalyst pellets. Hossain et al.9 pro-posed another phenomenological-based kinetics model for the dehydrogenation of ethylbenzene to styrene over
a FeOx-meso-Al2O3 catalyst based on a joint surface science and engineering approach. Tamsilian10 presented a mathematical model for ethylbenzene dehydrogenation consists of nonlinear simultaneous differential equations with multiple dependent variables. They concluded that application of the proposed catalyst increases ethylbenze-ne conversion and decreases necessary inlet temperature. Zarubina11 screened high throughput catalyst involving catalysts based on bare commercial carriers, metal-based counterparts, carbon-based materials, and P-promoted catalysts. The purpose was to achieve conversion higher than the conventional one. Lee12 developed a mathe-matical model for the ethylbenzene dehydrogenation based on validated kinetics model using experimental data. The comprehensive model is used to estimate the steam to ethylbenzene ratio that leads to optimum operating conditions.
The current conventional styrene production by steam dehydrogenation suffers from several disadvantages: (1) High energy consumption due to the use of superheated steam, (2) The reaction is thermodynamically limited to 50–65%, which demands a considerable reactant recycle, (3) Separation of EB and ST is problematic due to a similar boiling point of 136oC and 145oC, respectively11, 13–16. Alternately, the oxidative dehydro-genation of ethylbenzene (EB) has been proposed to overcome equilibrium limitation regarding conversion when operating at lower temperatures with an exother-mic reaction17. However, this process suffers from loss of styrene selectivity due to the production of carbon oxides and oxygenates14. In addition, the use of oxidant compromises the process safety as it should always ope-rate outside of the fl ammability limits of ethylbenzene11. Isothermal dehydrogenation of ethylbenzene to styrene is also studied. However, this approach is not widely spread and has limited production capacity10.
To alleviate the energy consumption due to the use of steam, efforts to replace the steam with CO2 are studied. It is believed that utilization of CO2 instead of steam will have benefi cial advantages such as energy saving

36 Pol. J. Chem. Tech., Vol. 20, No. 1, 2018
by avoiding high loss of water latent heat, and lower reaction temperature due to the ability to overcome the thermodynamic equilibrium. Mimura et al.18 pointed that the energy required for the CO2-based process for the dehydrogenation of ethylbenzene to produce styrene was found to be substantially less than that of the steam--based commercial process because CO2 remain gaseous throughout the process. Mimura and Saito15, 16 studied the relationship between the yield of styrene and the energy required for separation by distillation when CO2 is used for styrene production from ethylbenzene. Park and Chang14, demonstrated the use of CO2 as an oxidant in the dehydrogenation of ethylbenzene to styrene to reduce energy consumption and overcome equilibrium limitation. However, no process for styrene production using CO2 has been commercialized to date.
To increase ethylbenzene conversion beyond the ther-modynamic equilibrium several authors have suggested the use of selective membranes to remove hydrogen from the reaction mixture and hence to suppress the reverse reaction. Abdalla & Elnashaie19, investigated the use of a rigorous heterogeneous model to study the effect of using selective membranes over porous support materials for the removal of hydrogen on the conversion of ethylbenzene to styrene by dehydrogenation. Similarly, Hermann et al.3 showed that the kinetic limitation can be overcome and ethylbenzene conversion can be increased to above 90% without compro-mising styrene selectivity. This can be obtained by increasing the reactor pressure in the membrane reactor. Vaezi et al.20 studied the catalytic dehydrogenation of ethylbenzene to styrene in a simulated tubular membrane reactor. It is reported that Ethylbenzene conversion and styrene yield can be increased to 3.45% and 8.99%, respectively which is attributed to the effect of hydrogen removal from reaction side. In the same line, Akpa et al.1 developed fi rst-principles models to estimate the ethylbenzene conversion and the product’s selectivity in a catalytic membrane reactor for the dehydrogenation of ethylbenzene. The adequacy of the resulted models was verifi ed against industrial plant data. The models were afterward used to study the impact of the reactor inlet conditions.
Clearly, the main challenge of the traditional styrene process lies in the economic production. Most of the alternative technologies discussed earlier either not yet commercialized and/or suffer from other shortcomings. Bearing in mind that styrene demand is increasing (Ne-derlof, 2012), small enhancements in the effi ciency of the existing plant operation can generate a large profi t. Therefore, it might be worthwhile to enhance the present technology by maximizing the steam utilization while optimizing styrene selectivity and/or retrofi t the heat recovery system for the existing plant. Therefore, the objective here is to seek energy-effi cient confi guration of the current styrene process by utilizing heat integration and judicious exergy analysis. Heat integration is widely used in many industrial sectors such as, but not limited to, oil & gas, chemical & petrochemical, pulp & paper, metal production, dairies, breweries, and pharmaceu-ticals21. Specifi cally, Yoon et al.22 studied retrofi tting Ethylbenzene production by alkylation of Benzene and Ethylene using Pinch analysis. The proposed Heat Exchanger Network can reduce the annual energy cost by 5.6%. The attempt to reduce the energy consumption
of the existing Styrene plant will cause relevant countless returns and achieve sustainable development against circumstantial challenges.
PROCESS DESCRIPTION
Styrene is produced traditionally by catalytic dehy-drogenation of ethylbenzene. The chemical reaction is highly endothermic carried out in the vapor phase at a temperature ranging between 500 and 700oC11. An excess of superheated steam of 720oC is added to the reactant mixture with steam/EB molar ratios of 6–13:111 with higher values such as 15:1 to 20:1 are also repor-ted23, 24. Steam provides the required heat of reaction, avoids excessive coking or carbon deposition, shifts the equilibrium of the reversible reaction toward the selected products, and scrubs the catalyst from any existing carbon. Benzene (B), toluene (T), methane, and ethylene (E) are the main byproducts. Because the reaction is endothermic and reversible, it involves the evolution of a number of gaseous moles. Thus, high conversion necessitates elevated temperatures and a low EB partial pressure25.
The typical fl ow sheet for production of Styrene from Ethylbenzene by adiabatic dehydrogenation is shown in Figure 1, which represents typical commercial plants26. The fl ow sheet contains the operating temperature and pressure as well as the vapor fraction of each stream as taken from open literature27. These operating conditions will be considered fi xed as the baseline conditions. Nor-mally, the solution of the mass balance equations will not be affected by these operating conditions unless the resulted mole fraction does not reproduce the nominal vapor fraction at the given pressure and temperature. In this case, vapor-liquid equilibrium model will be so-lved to fi nd the new stream’s temperature that makes the corresponding vapor fraction matches the nominal baseline. Combined fresh and recycled Ethylbenzene is fed to the adiabatic reactor after mixing with high-tem-perature steam at a specifi c ratio. The steam raises the feed temperature to the required reaction temperature and provides the necessary energy for the endothermic reactions. EB conversion to Styrene takes place in two reactors in series (R-101 and R-102). The resulted gases are cooled and then separated in three separation co-lumns in series to produce fresh Styrene. The light gases such as hydrogen, methane, and ethylene are separated from the rest of components in a three-phase separator (S-101). Liquid water is also extracted in this column. The remaining hydrocarbon components are separated in the subsequent distillation columns based on their corresponding boiling point. Saturated steam at 42.4 bar is super-heated to desired temperature in a fi red--heater (F101) before being fed to the reactor. The saturated steam is usually supplied from a steam turbine. However, for carrying the exergy and heat integration, we introduced a typical heat exchanger to generate the saturated steam The Chemical reactions that take place in the reactors are given as follows6, 10:

Pol. J. Chem. Tech., Vol. 20, No. 1, 2018 37
With the kinetics of the reactions are given a s fol-lows6, 10:
(1)
(2)
(3)
(4)
Figure 1. Styrene Production fl ow sheet
38 Pol. J. Chem. Tech., Vol. 20, No. 1, 2018
Where T in Kelvin, R=1.987 cal/mol . K, and ri in mol/m3 . s Note that the fi rst reaction is limited by thermo-dynamic equilibrium which is given as10:
(5)and
(6)
Where T in Kelvin and P in bar. Therefore, r1 and r1r can be combined as follows:
(7)
NUMERICAL SOLUTION METHODOLOGY
To determine the mass/mole rate for each stream in the fl ow sheet, the mass balance equation for the entire process must be solved for given constraints. This step requires fi xing the degrees of freedom of the process fl ow sheet. The process has 38 unknowns comprises all component’s molar rate in the entire process. In addition, the extent of the chemical reactions presents additional 3 unknowns to make the total unknown va-riables equal 41. On the other hand, 34 relations are
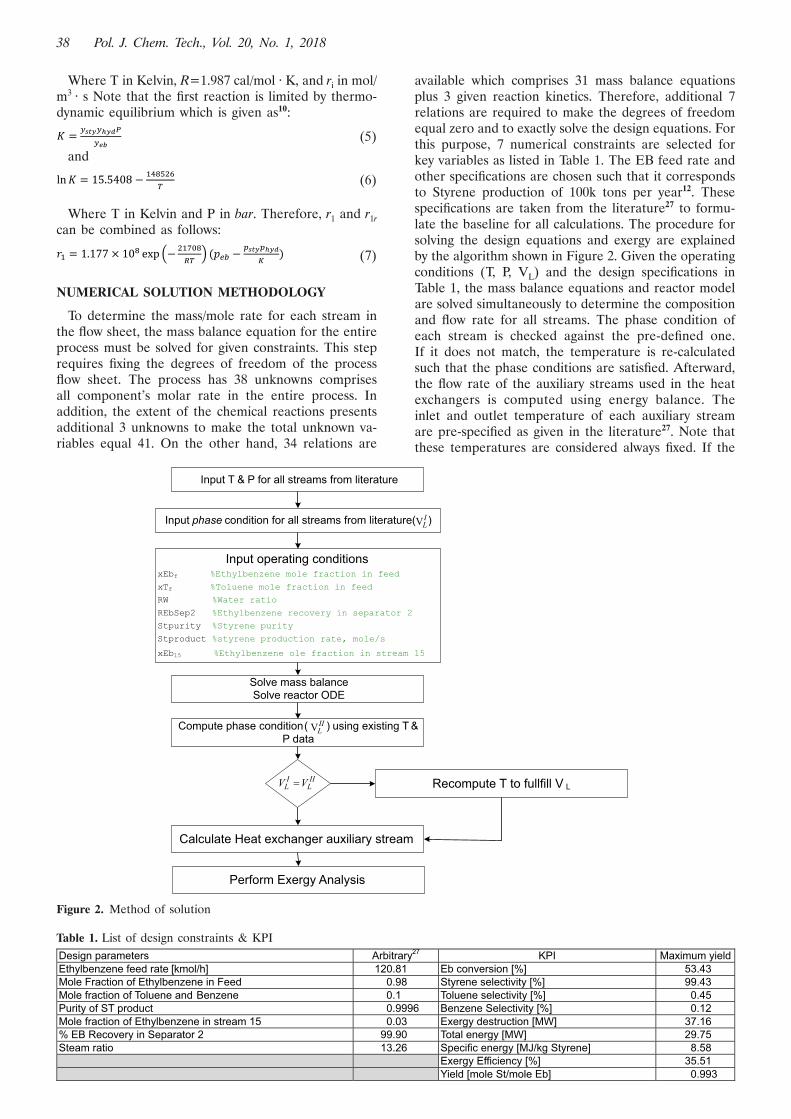
available which comprises 31 mass balance equations plus 3 given reaction kinetics. Therefore, additional 7 relations are required to make the degrees of freedom equal zero and to exactly solve the design equations. For this purpose, 7 numerical constraints are selected for key variables as listed in Table 1. The EB feed rate and other specifi cations are chosen such that it corresponds to Styrene production of 100k tons per year12. These specifi cations are taken from the literature27 to formu-late the baseline for all calculations. The procedure for solving the design equations and exergy are explained by the algorithm shown in Figure 2. Given the operating conditions (T, P, VL) and the design specifi cations in Table 1, the mass balance equations and reactor model are solved simultaneously to determine the composition and fl ow rate for all streams. The phase condition of each stream is checked against the pre-defi ned one. If it does not match, the temperature is re-calculated such that the phase conditions are satisfi ed. Afterward, the fl ow rate of the auxiliary streams used in the heat exchangers is computed using energy balance. The inlet and outlet temperature of each auxiliary stream are pre-specifi ed as given in the literature27. Note that these temperatures are considered always fi xed. If the
Figure 2. Method of solution
Table 1. List of design constraints & KPI

Pol. J. Chem. Tech., Vol. 20, No. 1, 2018 39
algorithm shown in Figure 2 involves estimation of the phase condition. The phase condition is determined by the following algorithm28:Case 1: if T > Tcj for all components, then VL= 1Case 2: if T < Tcj for all components, then check Tdp and Tbp for the mixture: If T > Tdp, then VL = 1 If T < Tbp, then VL = 0 If , then check VLE using fl ash calculations.Case 3: If T > Tcj from some components and T < Tcj for others, then check Tdp: If T > Tdp, then VL = 1 If T < Tdp, then check VLE using flash calculations
It should be noted that dew point, bubble point, and fl ash calculations can be carried out using typically Raoult’s law and Antione equations for vapor pressure estimation.
EXERGY PRINCIPLES
Exergy is a scientifi c tool helpful for sustainable design and development. It is driven from the second law of thermodynamic principles. Exergy balance of a system can provide valuable knowledge on its effectiveness. This knowledge can identify regions in which technical and other improvements should be sought. Determination of exergy losses and its sources can supply profound perception of the process performance analysis. Such analysis enables locating the component with extreme exergy destruction. Thus, improving these components lead to effi ciency enhancement and optimization. Cur-rently, exergy analysis became an engineering device for decisions making towards sustainable development29, 30. Indeed, Exergy is a powerful tool to assess the energy effi cacy for different confi gurations of an existing process.
Exergy is defi ned as the available work that can be obtained from a fl uid when it is in steady state with its surrounding environment. It is computed mathematically from29, 30:
(23)H0 and S0 represent the enthalpy and entropy values
at the reference temperature T0, which is usually equal to 298 K. H and S represent the enthalpy and entropy at a specifi ed temperature, T (K).
In general, chemical processes transform energy and exploit exergy, hence high effi ciency is of important potential. This inquires well utilization of exergy the application of effective tools. Unlike energy which is always balanced, exergy is never balanced for real pro-cesses because of irreversibilities, i.e. exergy destruction. The exergy destruction, ΔE, presents available work that can be further utilized for feasible process advancements. In Engineering applications, the exergy fl ows through a process can be represented by several fl ow diagrams, from which the scenario with the least exergy destruction can be chosen.
The exergy destruction or loss is generally expressed mathematically as follows:
(24)
heat exchanger conditions changed, only the fl ow rate is re-computed to meet the energy balance constraints. Exception is for HE-109 where the steam fl ow rate is fi xed while its outlet temperature can be altered to meet any perturbation in the heat exchanger balance. When the fl ow rate, vapor fraction, temperature, and pressure are determined for all streams, the exergy balance will be carried out. In addition, the energy load for every heat exchanger using external energy as well as compressors and pumps will be calculated.
Solving the mass balance equation requires solving the reactor model. The reactor model is assumed as plug fl ow reactor and its design equations are formulated as follows10:
(8)
(9)
(10)
(11)
Note that the subscript “0” denotes the feed conditions. Given the reactor feed condition, the ODE (Eq. 8–11) can be solved numerically over the reactor volume which is specifi ed as 25 m3 (for each reactor) to obtain the exit temperature and conversion (Xi) for each reaction. Therefore, the molar rate of each component exiting the reactor can be found from:
(12) (13)
(14) (15) (16)
(17) (18)
The pressure of the gases exiting the reactor can be found from:
(19)
Where nt is the total outlet molar rate and the overall volumetric fl ow rate, v is calculated by:
(20)Where ζi is the extent of each reaction whereas the
inlet volumetric fl ow rate, v0 is computed from the ideal gas law as follows:
(21)
The reactor ODE model is solved numerically using Euler method. To guarantee accuracy and stability of Euler method a step size of 0.1 is used. The reaction rates are given in Eq. 1–4 are a function of the component’s partial pressure, therefore, they can be reformulated in terms of reaction conversion by expressing the partial pressure as follows:
(22)
It should be noted that developing a rigorous model is not of interest here. The purpose is to use a reasonable model to carry out the energy analysis. The solution

40 Pol. J. Chem. Tech., Vol. 20, No. 1, 2018
mi and mo denote the input and output mass fl ow of the system, Q is heat infl ow to the system, Ei and Eo represent the specifi c Exergy for input and output stre-ams respectively, and W work done on the system. n is the number of input streams and k is the number of output streams.
For adiabatic system (Q = 0) and where no work is involved (W = 0), then Eq. (24) becomes:
(25)
Martinaitis et al.31 pointed that selection of the refe-rence temperature plays a key role in exergy analysis. Indeed, the reference state in this paper is considered as T0 = 298 K; P0 = 25 kPa. Such conditions should simulate the ambient conditions. Exception is for the reference pressure where it selected to be the lowest value in the process fl ow sheet. Exergy effectiveness can be better measured and compared by exergy effi ciency. Usually, the universal exergy effi ciency is defi ned as31:
(26)
RESULTS AND DISCUSSION
Optimizing the Operating ConditionsThe process design parameters given in Table 1 are
chosen arbitrary. Hence, it could be benefi cial to look for optimal operating conditions for the plant. For this reason, the process operating conditions can be optimized to capitalize specifi c objective function such as styrene yield, energy requirement or specifi c energy require-ments. The optimization problem can be formulated mathematically as follows:
(27)Subject to
(28)
(29)
The objective function, can be the styrene yield, or the total energy consumption or the specifi c energy requirement. When the objective function represents energy, will be given a negative sign to transform the optimization problem into minimization instead of ma-ximization. u is the design parameters which represent the design variables listed in Table 1. Note that the fi rst three variables, i.e. the Eb feed molar rate, Eb molar fraction in the feed and the mole fraction of Benzene in the feed are kept constant because they are the given feed conditions. The lower bound on the design parameters must be zero to avoid negative values. Note the optimization problem is constrained by the physical bounds imposed by the mass balance equations. This constraint is represented by the function f in Eq (29). The optimization problem is solved numerically using MATLAB software. Sequential solution method is used, i.e. in each optimization iteration, the mass balance equations and the reactor model are solved iteratively till the limits (Eq. 29) are satisfi ed. It turns out that the optimum operating condition that maximize the styrene yield does not differ signifi cantly than the arbitrary con-ditions given in Table 1. The obtained key performance index (KPI) for the process at the optimal conditions is
also listed in Table 1. The resulted KPI will be discussed later. On the other hand, when the optimization problem is carried out to minimize the total energy or specifi c energy consumption lead to undesirable Styrene yield. Figure 3 demonstrates how minimization of energy consumption cause unfavorable operating conditions in terms of Styrene yield. The fi gure shows the variation of process KPI with steam to Eb molar ratio. The molar ratio is chosen for the sensitivity analysis because it is the most effective parameter among the rest listed in Table 1. As the molar ratio increases, the reactor feed temperature increases accordingly leading to higher reaction conversion. The selectivity will improve mar-ginally because it is already reached a thermodynamic equilibrium. Furthermore, the energy requirement will also increase due to the amplifi ed steam consumption. Therefore, this trend is not favorable economically. On the other hand, decreasing the molar ratio will reduce the energy consumption considerably due to less steam requirements but a sharp drop in the reaction conversion and styrene yield will be obtained. Hence this direction is also undesirable. It is clear in Figure 3 that the net energy demand drops sharply at low steam ratio levels and smoothly at higher ratios. At low steam ratio levels, the energy demand declines abruptly due to two factors; the reduction in steam amount and increased cooling demand in HE105. The latter is enlarged because of the growth of Eb in the purge (stream 15) and recycle due to reduction in the reaction conversion. At high steam ratio levels, the net energy demand inclines sluggishly because of the combined surge of the heating duty of HE110 and cooling duty of HE104. In fact, the process performance is overlapping as increasing Steam to Eb ratio improves styrene selectivity but increases the separation and utility costs. Moreover, rising reaction temperature by the additional steam favors equilibrium conversion towards styrene but in the same time the side reactions become signifi cant. As a conclusion, the arbitrary conditions for the process design variables shown in Table 1 will be considered as the optimal operating condition for yield maximization and will be used as the baseline for further process reconfi guration to enhance the energy demand and exergy effi ciency which is the main goal of this work.
Figure 3. Process operation sensitivity against variation in the steam to Eb molar ratio
Pol. J. Chem. Tech., Vol. 20, No. 1, 2018 41
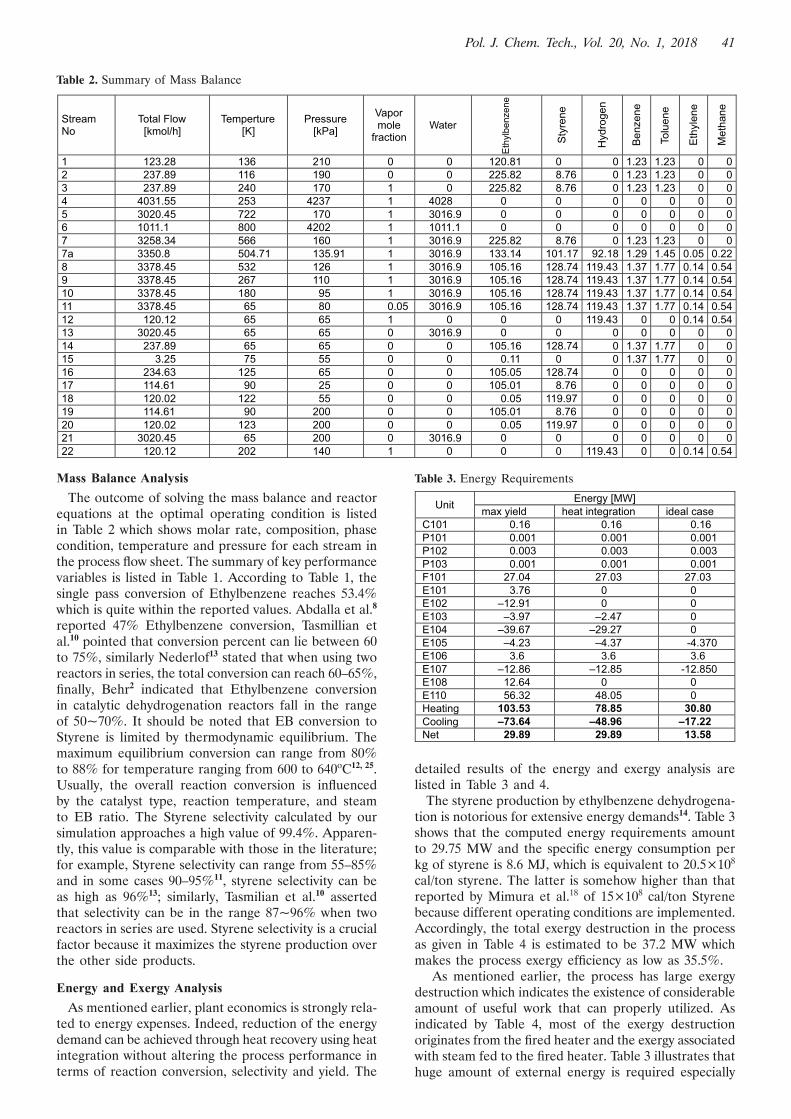
Mass Balance AnalysisThe outcome of solving the mass balance and reactor
equations at the optimal operating condition is listed in Table 2 which shows molar rate, composition, phase condition, temperature and pressure for each stream in the process fl ow sheet. The summary of key performance variables is listed in Table 1. According to Table 1, the single pass conversion of Ethylbenzene reaches 53.4% which is quite within the reported values. Abdalla et al.8 reported 47% Ethylbenzene conversion, Tasmillian et al.10 pointed that conversion percent can lie between 60 to 75%, similarly Nederlof13 stated that when using two reactors in series, the total conversion can reach 60–65%, fi nally, Behr2 indicated that Ethylbenzene conversion in catalytic dehydrogenation reactors fall in the range of 50~70%. It should be noted that EB conversion to Styrene is limited by thermodynamic equilibrium. The maximum equilibrium conversion can range from 80% to 88% for temperature ranging from 600 to 640oC12, 25. Usually, the overall reaction conversion is infl uenced by the catalyst type, reaction temperature, and steam to EB ratio. The Styrene selectivity calculated by our simulation approaches a high value of 99.4%. Apparen-tly, this value is comparable with those in the literature; for example, Styrene selectivity can range from 55–85% and in some cases 90–95%11, styrene selectivity can be as high as 96%13; similarly, Tasmilian et al.10 asserted that selectivity can be in the range 87~96% when two reactors in series are used. Styrene selectivity is a crucial factor because it maximizes the styrene production over the other side products.
Energy and Exergy AnalysisAs mentioned earlier, plant economics is strongly rela-
ted to energy expenses. Indeed, reduction of the energy demand can be achieved through heat recovery using heat integration without altering the process performance in terms of reaction conversion, selectivity and yield. The
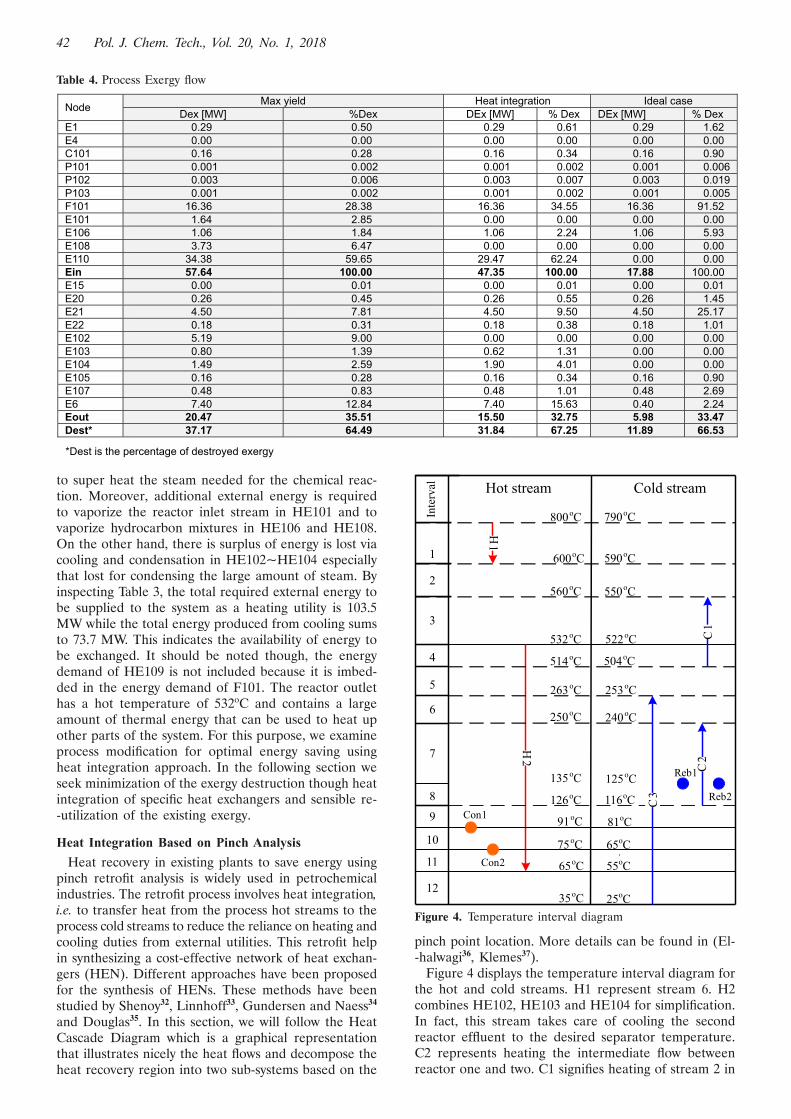
detailed results of the energy and exergy analysis are listed in Table 3 and 4.
The styrene production by ethylbenzene dehydrogena-tion is notorious for extensive energy demands14. Table 3 shows that the computed energy requirements amount to 29.75 MW and the specifi c energy consumption per kg of styrene is 8.6 MJ, which is equivalent to 20.5×10⁸ cal/ton styrene. The latter is somehow higher than that reported by Mimura et al.18 of 15×108 cal/ton Styrene because different operating conditions are implemented. Accordingly, the total exergy destruction in the process as given in Table 4 is estimated to be 37.2 MW which makes the process exergy effi ciency as low as 35.5%.
As mentioned earlier, the process has large exergy destruction which indicates the existence of considerable amount of useful work that can properly utilized. As indicated by Table 4, most of the exergy destruction originates from the fi red heater and the exergy associated with steam fed to the fi red heater. Table 3 illustrates that huge amount of external energy is required especially
Table 2. Summary of Mass Balance
Table 3. Energy Requirements
42 Pol. J. Chem. Tech., Vol. 20, No. 1, 2018
to super heat the steam needed for the chemical reac-tion. Moreover, additional external energy is required to vaporize the reactor inlet stream in HE101 and to vaporize hydrocarbon mixtures in HE106 and HE108. On the other hand, there is surplus of energy is lost via cooling and condensation in HE102~HE104 especially that lost for condensing the large amount of steam. By inspecting Table 3, the total required external energy to be supplied to the system as a heating utility is 103.5 MW while the total energy produced from cooling sums to 73.7 MW. This indicates the availability of energy to be exchanged. It should be noted though, the energy demand of HE109 is not included because it is imbed-ded in the energy demand of F101. The reactor outlet has a hot temperature of 532oC and contains a large amount of thermal energy that can be used to heat up other parts of the system. For this purpose, we examine process modifi cation for optimal energy saving using heat integration approach. In the following section we seek minimization of the exergy destruction though heat integration of specifi c heat exchangers and sensible re--utilization of the existing exergy.
Heat Integration Based on Pinch AnalysisHeat recovery in existing plants to save energy using
pinch retrofi t analysis is widely used in petrochemical industries. The retrofi t process involves heat integration, i.e. to transfer heat from the process hot streams to the process cold streams to reduce the reliance on heating and cooling duties from external utilities. This retrofi t help in synthesizing a cost-effective network of heat exchan-gers (HEN). Different approaches have been proposed for the synthesis of HENs. These methods have been studied by Shenoy32, Linnhoff33, Gundersen and Naess34 and Douglas35. In this section, we will follow the Heat Cascade Diagram which is a graphical representation that illustrates nicely the heat fl ows and decompose the heat recovery region into two sub-systems based on the
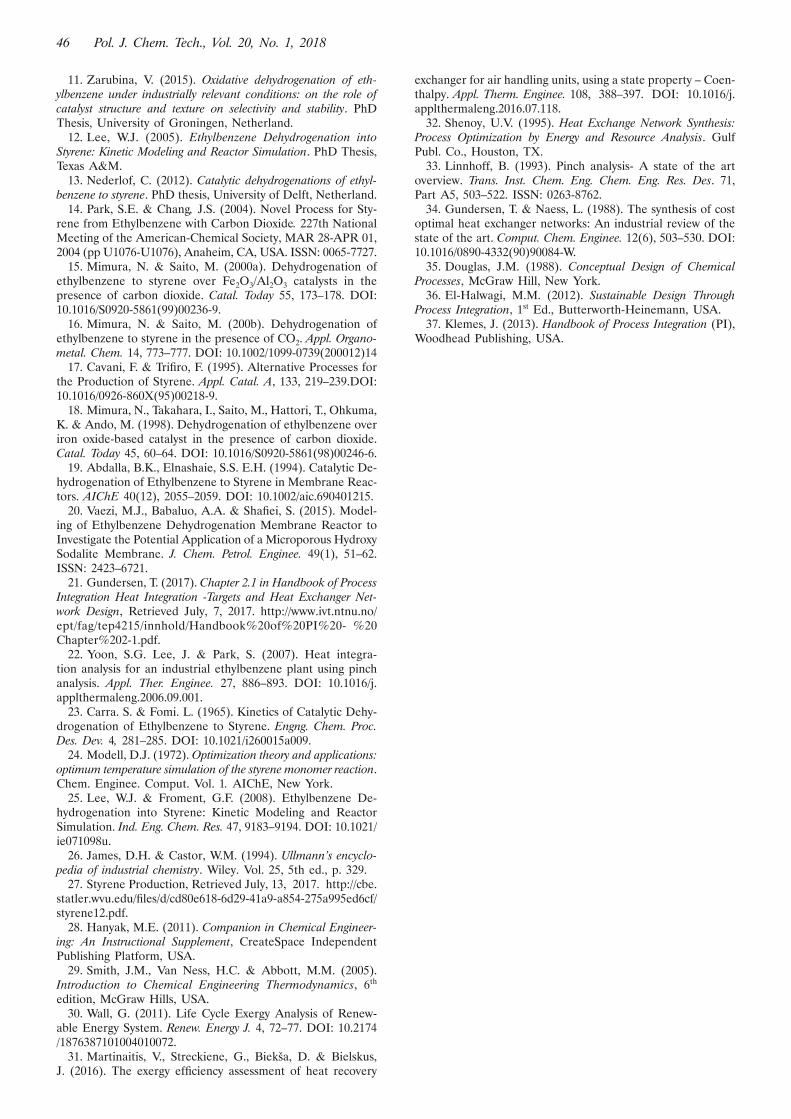
pinch point location. More details can be found in (El--halwagi36, Klemes37).
Figure 4 displays the temperature interval diagram for the hot and cold streams. H1 represent stream 6. H2 combines HE102, HE103 and HE104 for simplifi cation. In fact, this stream takes care of cooling the second reactor effl uent to the desired separator temperature. C2 represents heating the intermediate fl ow between reactor one and two. C1 signifi es heating of stream 2 in
Figure 4. Temperature interval diagram
Table 4. Process Exergy fl ow

Pol. J. Chem. Tech., Vol. 20, No. 1, 2018 43
HE101. C3 denotes HE110 responsible for generating the high-pressure steam. In fact, the latter step requires multiple heat exchangers because it inquires large amount of energy. It is lumped in one heat exchanger for simpli-fi cation. The use of heat exchanger to generate steam is customary practice in industry despite its cost and com-plicated design. ∆Tmin = 10oC is used here36. ∆Tmin is the minimum driving force for feasible heat transfer between the hot and cold streams such that the second law of thermodynamic is satisfi ed. Rigorous value for ∆Tmin can be found by optimizing both the investment and operating costs. The corresponding cascade diagram is generated and shown in Figure 5. The cascade is developed be establishing heat balance around each interval and the surplus heat is transferred as heat residuals to the next interval with lower temperature. The tenth interval has the largest negative residual. Since negative residual is not allowed because it leads to infeasible heat exchanger design, the absolute value of the largest negative residual should be added to the top of the cascade to make all residuals non-negative. Therefore, this bottleneck locates the pinch point and the residual of 51.22 MW, which is the minimum required external heating util-ity. Consequently, the required external cooling utility is estimated to be 46.3 MW. Hence, the process pinch is identifi ed to be at 116oC for cold stream and 126oC for hot stream. The next logical step is to transfer heat from the hot stream as heat source to the cold stream as heat sink as illustrated in Figure 6. Above the pinch,
H1 and C1 is obviously matched which is the current practice in the fl ow sheet. Above the pinch, H1 has heat energy of 18.93 MW which is not suffi cient to heat up C3 although the common practice is to match the pinch streams fi rst. Instead, this amount of heat is recovered to provide energy to C2 and reboiler 2 (HE108). The remaining energy is 2.53 MW which is enough to supply energy for Reboiler 1 (HE106). The remaining heat-ing requirement is 3.6 + 48.05 = 51.65 MW which is equivalent to the minimum external heating utility. Below the pinch point, the thermal energy associated with the condensers cannot be utilized to heat up C3, instead por-tion of H2 is transferred to C3. The remaining external cooling demand is 29.29 + 12.85 + 4.37 = 65.4 MW. The modifi ed heat exchanger network that correspond to the matching process is shown in Figure 7. Note that Figure 7 depicts part of the overall process fl ow sheet to save space. In this case, the second reactor effl uent exchanges its heat fi rst with the fi rst reactor infl uent, i.e. to vaporize the reactant stream. Secondly, the remaining energy is utilized to provide necessary heat for vaporiza-tion in HE108. Afterward it is cooled down in HE103 to the pinch temperature and then heat up stream 4 to the pinch temperature. Lastly, the reactor effl uent must be cooled down in HE104 to the target temperature of the fi rst separator. The effect of the proposed heat ex-changer network on energy and exergy is given in Table 3 and 4. Although, the external energy requirements of some heat exchangers is either eliminated or reduce, the gross energy demand, which is defi ned as the difference between heating and cooling demands, remains almost the same. However, the heating and cooling duties were reduced to 79 and 49 MJ, respectively. It should be noted that HI reduces the external heating and cooling duties by the same amount via transferring energy from the hot stream to the cold stream. Therefore, the net energy requirement will remain the same. As far as exergy is concerned, small improvement in exergy destruction is obtained as the lost work is reduced from 37.16 MW to 31.84 MW. Based on the heat integration rule, heat fl ow across the pinch line is not allowed to avoid amplify-ing the external utilities usage. This limits the energy recovery scenarios. Idealistically, Figure 8, shows the heat sources and sinks above the ambient temperature without considering the pinch line. The process has two major hot streams that can provide heat energy to other
Figure 6. Stream matching above and below the pinch point
Figure 5. Heat Cascade Diagram

44 Pol. J. Chem. Tech., Vol. 20, No. 1, 2018
parts of the system which are the hot reactor effl uent and the superheated steam in stream 6. On the other hand, the process has fi ve ports where energy is required to heat up its streams. A perfect match exists between H2 and C3. Furthermore, the superheated steam is not well utilized. Heat balance calculations indicate that it is of potential to utilize the steam energy to heat up C1, C2 and HE108 sequentially. Afterward, the steam losses most of its energy and leaves HE108 as liquid at a tem-perature of 115oC. At this low temperature, utilizing the steam to exchange heat with HE106 is infeasible. The resulting heat exchanger layout is illustrated in Figure 9. Accordingly, the impact of the modifi ed heat exchanger structure is apparent on the process energy and exergy characteristic as listed in Table 3 and 4. This confi gura-tion helped in reducing the net energy demand by 54%. Moreover, the destroyed exergy inside the system is minimized by 68% from 37.16 to 11.89 MW. The latter confi rms as mentioned earlier the use of steam in this process is the main source of energy ineffi ciency. Any
Figure 7. Heat Exchanger network based on Heat Integration
Figure 8. Energy requirement of the entire process
Figure 9. Heat Exchanger network based on Idealistic Heat Integration

Pol. J. Chem. Tech., Vol. 20, No. 1, 2018 45
attempt to enhance the process energy-effectiveness should tackle this issue.
CONCLUSIONS
Styrene is an important industrial commodity produced largely by adiabatic dehydrogenation of Ethylbenzene. This process is criticized for intensive energy consump-tion. This work aims at analyzing the energy effectiveness of the process using exergy analysis and seeks energy saving by heat integration based on pinch analysis. Simu-lation of the process fl ow sheet revealed the strong effect of the steam to Eb ratio and consequently the reactor temperature on the Styrene selectivity and production. Therefore, saving energy consumption by minimizing the steam use or its temperature may sacrifi ce the process performance in terms of Styrene yield. Exergy analysis indicated that the saturated steam is responsible for the largest exergy losses which amount to 60% of the total. This is because the energy produced via the steam con-densation is lost without utilization. Using Pinch analysis, the minimum required external heating utility is around 52 MW mainly due to steam generation. Modifi cation of the Heat exchanger network using heat integration approach showed insignifi cant improvement in the net energy demand and exergy destruction but a substantial enhancement in cooling and heating utilities. If the considerable thermal energy associated with the reactor effl uent which contains a large amount of steam is reco-vered to generate the needed steam, remarkable saving of energy and exergy losses can be achieved.
ACKNOWLEDGEMENT
The project was supported by King Saud University, Deanship of Scientifi c Research, College of Engineering Research Center.
NOMENCLATURE
Cp heat capacity, cal/moke.KE specifi c Exergy, kJ/kgH, H0 enthalpy and reference enthalpy, respectively, kJ/kgK reaction equilibrium constantm mass rate, kg/sni molar rate of component i, kmol/hn0 total molar rate fed for reactor 1, kmol/hnt total molar rate, kmol/hf nonlinear functionpi partial pressure for component i, bar P total pressure, barP0 Reactor 1 feed pressure, barri reaction rate for reaction i, mol/m3.sR ideal gas constantS, S0 Entropy and reference entropy, respectively, kJ/kg.KT Temperature in KelvinT0 Reactor 1 feed temperature also reference temperature for exergy, KTcj Critical temperature for component j, KTdp dew point, KTbp bubble point, Ku design parameter
V reactor volume, m3
VL Vapor fractionv total volumetric fl ow rate, m3/hv0 reactor 1 feed volumetric fl ow rate, m3/hXi reaction i conversion x vector of component molar rateyi vapor mole fraction for component, i
Greek letterζi stoichiometry of reaction i objective functionη exergy effi ciency
SubscriptB BenzeneE EthyleneEb EthylbenzeneH, hyd Hydrogeni inputM Methaneo outputr revers reactionS, sty Styrene0 reactor 1 feed
LITERATURE CITED1. Akpa, J.G. (2012). Simulation of an Isothermal Catalytic
Membrane Reactor for the Dehydrogenation of Ethylbenzene, Chem. Proc. Enginee. Res. 3, 14–28, ISSN 2225–0913.
2. Arno Behr. (2017). Styrene production from ethyl benzene, Retrieved July 13, 2017 from (http://www.tc.bci.tu- dortmund.de/Downloads/Praktika/tc30_styrene_english.pdf.
3. Hermann, Ch., Quicker, E. & Dittmeyer, R. (1997). Mathematical simulation of catalytic dehydrogenation of eth-ylbenzene. J. Memb. Sci. 136, 161–172. DOI: 10.1016/S0376-7388(97)81990-4.
4. PRWeb, World Styrene Market Dynamics Reviewed. Retrieved July, 13, 2017, from http://www.prweb.com/releas-es/2012/9/prweb9930130.htm.
5. PRLog, Styrene Global Markets to 2020. Retrieved July, 13, 2017, from http://www.prlog.org/11727607-styrene-global-markets-to-2020-substitution-of-polystyrene-by-polypropylene.
6. Snyder, J.D. & Subramaniam, B. (1994). Novel Reverse Flow Strategy for Ethylbenzene Dehydrogenation in A Packed bed Reactor. Chem. Enginee. Sci. 49(24), 5565–5601. DOI: 10.1016/0009-2509(94)00287-8.
7. Haynes, T.N., Georgakis, C. & Caram, H.S. (1992). The Application of Reverse Flow Reactors to Endothermic Reactions. Chem. Enginee. Sci. 47(9–11), 2927–2932. DOI: 10.1016/0009-2509(92)87153-H.
8. Abdalla, B.K., Elnashaie, S.S.E.H., Alkhowaiter, S. & Elshishini, S.S. (1994). Intrinsic kinetics and industrial reactors modelling for the dehydrogenation of ethylbenzene to styrene on promoted iron oxide catalysts. Appl. Catal. A: General 113, 89–102. DOI: 10.1016/0926-860X(94)80243-2.
9. Hossain, M.M., Atanda, L., Al-Yassir, N., Al-Khattaf, S. (2012). Kinetics modeling of ethylbenzene dehydrogenation to styrene over a mesoporous alumina supported iron cata-lyst. Chem. Enginee. J. 207–208, 308–321. DOI: 10.1016/j.cej.2012.06.108.
10. Tamsilian, Y., Ebrahimi, A.N., Ramazani, S.A. & Abdol-lahzadeh, H. (2012). Modeling and sensitivity analysis of styrene monomer production process and investigation of catalyst behavior. Comp. Chem. Enginee. 40, 1–11. DOI: 10.1016/j.compchemeng.2012.01.014.
46 Pol. J. Chem. Tech., Vol. 20, No. 1, 2018
11. Zarubina, V. (2015). Oxidative dehydrogenation of eth-ylbenzene under industrially relevant conditions: on the role of catalyst structure and texture on selectivity and stability. PhD Thesis, University of Groningen, Netherland.
12. Lee, W.J. (2005). Ethylbenzene Dehydrogenation into Styrene: Kinetic Modeling and Reactor Simulation. PhD Thesis, Texas A&M.
13. Nederlof, C. (2012). Catalytic dehydrogenations of ethyl-benzene to styrene. PhD thesis, University of Delft, Netherland.
14. Park, S.E. & Chang, J.S. (2004). Novel Process for Sty-rene from Ethylbenzene with Carbon Dioxide. 227th National Meeting of the American-Chemical Society, MAR 28-APR 01, 2004 (pp U1076-U1076), Anaheim, CA, USA. ISSN: 0065- 7727.
15. Mimura, N. & Saito, M. (2000a). Dehydrogenation of ethylbenzene to styrene over Fe2O3/Al2O3 catalysts in the presence of carbon dioxide. Catal. Today 55, 173–178. DOI: 10.1016/S0920-5861(99)00236-9.
16. Mimura, N. & Saito, M. (200b). Dehydrogenation of ethylbenzene to styrene in the presence of CO2. Appl. Organo-metal. Chem. 14, 773–777. DOI: 10.1002/1099-0739(200012)14
17. Cavani, F. & Trifi ro, F. (1995). Alternative Processes for the Production of Styrene. Appl. Catal. A, 133, 219–239.DOI: 10.1016/0926-860X(95)00218-9.
18. Mimura, N., Takahara, I., Saito, M., Hattori, T., Ohkuma, K. & Ando, M. (1998). Dehydrogenation of ethylbenzene over iron oxide-based catalyst in the presence of carbon dioxide. Catal. Today 45, 60–64. DOI: 10.1016/S0920-5861(98)00246-6.
19. Abdalla, B.K., Elnashaie, S.S. E.H. (1994). Catalytic De-hydrogenation of Ethylbenzene to Styrene in Membrane Reac-tors. AIChE 40(12), 2055–2059. DOI: 10.1002/aic.690401215.
20. Vaezi, M.J., Babaluo, A.A. & Shafi ei, S. (2015). Model-ing of Ethylbenzene Dehydrogenation Membrane Reactor to Investigate the Potential Application of a Microporous Hydroxy Sodalite Membrane. J. Chem. Petrol. Enginee. 49(1), 51–62. ISSN: 2423–6721.
21. Gundersen, T. (2017). Chapter 2.1 in Handbook of Process Integration Heat Integration -Targets and Heat Exchanger Net-work Design, Retrieved July, 7, 2017. http://www.ivt.ntnu.no/ept/fag/tep4215/innhold/Handbook%20of%20PI%20- %20Chapter%202-1.pdf.
22. Yoon, S.G. Lee, J. & Park, S. (2007). Heat integra-tion analysis for an industrial ethylbenzene plant using pinch analysis. Appl. Ther. Enginee. 27, 886–893. DOI: 10.1016/j.applthermaleng.2006.09.001.
23. Carra. S. & Fomi. L. (1965). Kinetics of Catalytic Dehy-drogenation of Ethylbenzene to Styrene. Engng. Chem. Proc.Des. Dev. 4, 281–285. DOI: 10.1021/i260015a009.
24. Modell, D.J. (1972). Optimization theory and applications: optimum temperature simulation of the styrene monomer reaction.Chem. Enginee. Comput. Vol. 1. AIChE, New York.
25. Lee, W.J. & Froment, G.F. (2008). Ethylbenzene De-hydrogenation into Styrene: Kinetic Modeling and Reactor Simulation. Ind. Eng. Chem. Res. 47, 9183–9194. DOI: 10.1021/ie071098u.
26. James, D.H. & Castor, W.M. (1994). Ullmann’s encyclo-pedia of industrial chemistry. Wiley. Vol. 25, 5th ed., p. 329.
27. Styrene Production, Retrieved July, 13, 2017. http://cbe.statler.wvu.edu/fi les/d/cd80e618-6d29-41a9-a854-275a995ed6cf/styrene12.pdf.
28. Hanyak, M.E. (2011). Companion in Chemical Engineer-ing: An Instructional Supplement, CreateSpace Independent Publishing Platform, USA.
29. Smith, J.M., Van Ness, H.C. & Abbott, M.M. (2005). Introduction to Chemical Engineering Thermodynamics, 6th edition, McGraw Hills, USA.
30. Wall, G. (2011). Life Cycle Exergy Analysis of Renew-able Energy System. Renew. Energy J. 4, 72–77. DOI: 10.2174/1876387101004010072.
31. Martinaitis, V., Streckiene, G., Biekša, D. & Bielskus, J. (2016). The exergy effi ciency assessment of heat recovery
exchanger for air handling units, using a state property – Coen-thalpy. Appl. Therm. Enginee. 108, 388–397. DOI: 10.1016/j.applthermaleng.2016.07.118.
32. Shenoy, U.V. (1995). Heat Exchange Network Synthesis: Process Optimization by Energy and Resource Analysis. Gulf Publ. Co., Houston, TX.
33. Linnhoff, B. (1993). Pinch analysis- A state of the art overview. Trans. Inst. Chem. Eng. Chem. Eng. Res. Des. 71, Part A5, 503–522. ISSN: 0263-8762.
34. Gundersen, T. & Naess, L. (1988). The synthesis of cost optimal heat exchanger networks: An industrial review of the state of the art. Comput. Chem. Enginee. 12(6), 503–530. DOI: 10.1016/0890-4332(90)90084-W.
35. Douglas, J.M. (1988). Conceptual Design of Chemical Processes, McGraw Hill, New York.
36. El-Halwagi, M.M. (2012). Sustainable Design Through Process Integration, 1st Ed., Butterworth-Heinemann, USA.
37. Klemes, J. (2013). Handbook of Process Integration (PI), Woodhead Publishing, USA.