ENERGY DIVISION RESOLUTION E-4952 October 11, 2018
84
Date of Issuance – October 12, 2018 232459122 1 PUBLIC UTILITIES COMMISSION OF THE STATE OF CALIFORNIA ENERGY DIVISION RESOLUTION E-4952 October 11, 2018 RESOLUTION Resolution E-4952. Approval of the Database for Energy-Efficient Resources updates for 2020 and revised version 2019 in Compliance with D.15-10-028, D.16-08-019, and Resolution E-4818. PROPOSED OUTCOME: Revise DEER2019 Update (effective 1/1/2019) DEER2020 Update (effective 1/1/2020) Revise the DEER Peak Period definition (effective 1/1/2020) SAFETY CONSIDERATIONS: This Resolution has no impact on safety. ESTIMATED COST: This Resolution is not expected to immediately result in additional cost, however, revisions to the DEER Peak Period definition may have cost implication that cannot be known at this time. By Energy Division’s own motion in Compliance with D.15-10-028. SUMMARY This Resolution approves updates to the Database for Energy-Efficient Resources (DEER) for program year (PY) 2020 and a revised version of DEER for PY 2019 in Compliance with D.15-10-028 and Resolution E-4818. This update also adjusts the DEER Peak Period definition to be used in energy efficiency portfolio planning, reporting and evaluation.
-
Upload
khangminh22 -
Category
Documents
-
view
0 -
download
0
Transcript of ENERGY DIVISION RESOLUTION E-4952 October 11, 2018
Date of Issuance – October 12, 2018
232459122 1
PUBLIC UTILITIES COMMISSION OF THE STATE OF CALIFORNIA
ENERGY DIVISION RESOLUTION E-4952
October 11, 2018
R E S O L U T I O N
Resolution E-4952. Approval of the Database for Energy-Efficient
Resources updates for 2020 and revised version 2019 in Compliance with
D.15-10-028, D.16-08-019, and Resolution E-4818.
PROPOSED OUTCOME:
Revise DEER2019 Update (effective 1/1/2019)
DEER2020 Update (effective 1/1/2020)
Revise the DEER Peak Period definition (effective 1/1/2020)
SAFETY CONSIDERATIONS:
This Resolution has no impact on safety.
ESTIMATED COST:
This Resolution is not expected to immediately result in additional
cost, however, revisions to the DEER Peak Period definition may
have cost implication that cannot be known at this time.
By Energy Division’s own motion in Compliance with D.15-10-028.
SUMMARY
This Resolution approves updates to the Database for Energy-Efficient Resources
(DEER) for program year (PY) 2020 and a revised version of DEER for PY 2019 in
Compliance with D.15-10-028 and Resolution E-4818. This update also adjusts the
DEER Peak Period definition to be used in energy efficiency portfolio planning,
reporting and evaluation.
Resolution E-4952 October 11, 2018
DEER2020 and Revised DEER2019
2
All of the updated DEER assumptions, methods, values and supporting
documentation are available on the DEEResources.com website.1
BACKGROUND
DEER Peak Period Definition
CPUC Decision 06-06-063 first adopted the DEER Peak Period definition for use
in energy efficiency portfolios.
“Until further notice of this Commission, the definition of peak kilowatt
(kW) contained in the 2005 Database for Energy Efficient Resources
(DEER) shall be used for the purpose of verifying energy efficiency
program and portfolio performance. As discussed in this decision, DEER
defines peak demand as the average grid level impact for a measure
between 2 p.m. and 5 p.m. during the three consecutive weekday period
containing the weekday temperature with the hottest temperature of the
year.”2
DEER2008 version 2.05, adopted by CPUC Decision 09-09-047,3 updated the
definition of demand reduction to clarify and expand the method used to select
the Peak Period and to remove the alternate three consecutive weekday period
that was used for some educational facilities.4 The Peak Period definition in
DEER2008 has not since been updated and is summarized below.
The current DEER demand reduction is defined as the average kWh
reduction over a 9-hour window. The nine-hour window is from 2p.m. to 5
p.m. over a three consecutive weekday “heat wave”. The three consecutive
weekday “heat wave” is chosen based on these criteria:
occurs between June 1st and September 30th,
1 See Main MenuDEER VersionsDEER2020 on http://DEEResources.com 2 CPUC Decision 06-06-063 OP 1. 3 DEER2008 was first adopted by CPUC Decision 09-09-047 OP 48, and was reaffirmed by CPUC Decision
10-12-054 OP 1, and again by CPUC Decision 11-07-030 OP 1. 4 2008 DEER Update - Summary of Measure Energy Analysis Revisions, December 2008, Version
2008.2.05 for 2009-2011 Planning/Reporting,
http://deeresources.com/files/deer0911planning/downloads/DEER2008UPDATE-
EnergyAnalysisMethodsChangeSummaryV9.pdf
Resolution E-4952 October 11, 2018
DEER2020 and Revised DEER2019
3
does not include weekends or holidays,
has the highest value for the sum of:
o the average temperature over the three-day period, plus
o the average temperature from noon to 6 p.m. over the three-
day period, plus
o the peak temperature over the three-day period.
The weather data utilized for selecting the three consecutive weekday period is
data specified for energy use calculation in the California Energy Commission
(CEC) adopted Title 24 Building Energy Efficiency Standards (Title 24).5 Title 24
weather data sets represent a typical year of weather with a specified year to use
to establish the day-of-week sequencing. Title 24 typical weather data, including
the year for the day-of-week sequencing, was updated for the 2013 Title 24.6 The
2013 Title 24 became effective July 1, 2014. The adopted DEER2014 version was
updated to reference the updated weather data.7
Resolution E-4795, issued on August 18, 2016, approved the DEER updates for
2017 and 2018 and reaffirmed the definition of the Peak Period. However, the
Resolution recognized the comments from the California Independent System
Operator Corporation (CAISO) that suggested the 2 p.m. to 5 p.m. hour range in
the DEER definition “is no longer technically accurate as the Peak Period is now
observed to be later in the day” and inconsistent with the period used in other
CPUC proceedings.8 PG&E’s comments on the Resolution also indicated support
for updating the definition of demand reduction and suggested record
development on the issue. Resolution E-4795 affirmed that some shift in the 2
p.m. to 5 p.m. time range may be appropriate but that the methodology of
selecting the three consecutive weekday period appeared to still be accurate.9
Resolution E-4867, issued August 24, 2017, which approved the DEER2019
update and revisions to DEER2017 and DEER2018, ordered the utilities to
5 California Code of Regulations, Title 24 Part 6 and the associated administrative regulation of Part 1. 6 2013 Reference Appendices, The Building Energy Efficiency Standards for Residential and
Nonresidential Buildings. 7 DEER2014* — Codes and Standards Update for the 2013-14 Cycle, February 2014. “CTZ2 weather files
replaced with CZ2010, as specified in the 2013 Title-24” 8 Resolution E-4795 at 6 9 Resolution E-4795, Attachment Section 6.3.

Resolution E-4952 October 11, 2018
DEER2020 and Revised DEER2019
4
establish a working group to propose adjustments to the definition of the Peak
Period.
The utilities shall initiate a working group process to develop one or more
proposals on how the DEER Peak Period methodology should be adjusted.
The proposals shall be served on the following service lists by Dec 20,
2018. The working group should consider what existing Commission
policy directives in various related proceedings* are most relevant to the
DEER Peak Period proposal update.
*Including but not limited to: Resource Adequacy proceeding, Time-of-Use
OIR, GRC Phase 2 proceedings10
This working group convened two meetings, which occurred April 3 and 16,
2018, and produced a report on May 4, 2018.11
The working group’s report recommends defining the Peak Period for each
climate zone within California as 4 p.m. to 9 p.m. on the three costliest days of
the year as determined through the Avoided Cost Calculator. This
recommendation allows for non-consecutive costliest days and would rely on the
annually adopted avoided cost data. The current version of the avoided cost
calculator uses a different recent year of weather rather than a typical year.
The working group also recommends a longer-term adjustment, called a “no-
peak” methodology, which would involve eliminating the peak kilowatt savings
reporting. The approach would rely upon the measure electric benefit calculation
from the cost effectiveness calculator to provide accurate relative valuation of
measures. However, the accuracy of this approach is limited by the availability of
measure hourly savings profiles for the range of measures in the portfolio.
Two stakeholders, Natural Resources Defense Council (NRDC) and 350 Bay
Area, submitted comments to the working group’s report.12 NRDC emphasizes
that the current hourly measure savings profiles are relatively aggregated, which
can result in inaccurate predictions of demand savings, because measures could
have very different hourly savings profiles rather than the characterized single
10 CPUC Resolution E-4867. Ordering Paragraph 3. 11 “Refreshing DEER’s Peak Period.” May 4, 2018.
https://pda.energydataweb.com/#!/documents/2036/view 12 https://pda.energydataweb.com/#!/documents/2036/comments/list
Resolution E-4952 October 11, 2018
DEER2020 and Revised DEER2019
5
hourly profile. NRDC states that these hourly profiles should be updated and
expanded, and agrees with the working group’s assessment that the Peak
Periods should be based on “when energy savings are most valuable to the grid,”
as “determined through the avoided cost calculator.”13 350 Bay Area agrees with
some of the working group’s recommendations. However, they express dissent
regarding the recommended definition of the Peak Period as described above,
favoring a Peak Period between 3 p.m. and 6 p.m. Their proposed definition
would also be based on the annual costliest days determined using the avoided
cost calculator.14
DEER2020 Update and DEER2019 Revisions
DEER updates flow into the portfolio development process by providing new
savings estimates for program design. New savings estimates, and underlying
assumptions, methods, and values inform the direction of current programs.
These allow Program Administrators (PAs) to shift program eligibility
requirements and incentive support mechanisms to deliver cost-effective savings.
DEER updates may also reflect new market conditions. Program Administrators
are required to factor in new assumptions and values by a) knowing there is an
update, b) understanding the fundamental assumptions for the update, and c)
identifying necessary shifts to their programs to capture cost effective savings.
Updates to DEER methods apply in workpaper development and custom project
savings estimates as well as program deployment decisions.
Decision D.15-10-028, Ordering Paragraph 17: “Commission Staff shall propose
changes to the Database of Energy Efficient Resources once annually via
Resolution, with the associated comment/protest period provided by General
Order 96-B. However, Commission staff may make changes at any time without
a Resolution to fix errors or to change documentation.” Decision D.15-10-028,
retains the direction from D.12-05-015 that DEER values be updated to be
consistent with existing and updated state and federal codes and standards while
incorporating these changes into the annual DEER update.15 Decision
13 NRDC Comments on DEER Peak Period Report, May 18, 2018. 14 Comments on “Refreshing the DEER Peak Period.”, 350 Bay Area, May 18, 2018. 15 D.16-10-28, at 80, states “D.12-05-015 allowed additional mid-cycle changes if there are new state and
federal codes and standards that affect DEER values. Specifically, the decision stated in Conclusion of

Resolution E-4952 October 11, 2018
DEER2020 and Revised DEER2019
6
D.15-10-028 also retains previous direction on Commission staff latitude in
updating DEER.16 Additionally Resolution E-4818 Ordering Paragraph 26
required Commission staff to make any necessary updates to the DEER savings
estimates to reflect the baseline policy summarized in this Resolution.
DISCUSSION
1. Updates Based on New Peak Period Definition
The timing of peak load is modified to 4:00 p.m. to 9:00 p.m. without a change
in methodology to calculate days for which the savings values are averaged
over the peak hours.
The working group’s report on proposals for adjusting the DEER definition of
demand reduction focuses on two distinct aspects of the DEER definition
methodology:
Changes to the range of hours during which peak demand savings is
determined;
Changes to the days over which the savings values during the range of
hours are averaged.
All participants in the activity agreed that a change in the hours was appropriate.
Two recommendations were presented: 4 p.m. to 9 p.m. and 3 p.m. to 6 p.m.
Most participants preferred the 4 p.m. to 9 p.m. alternative while some
participants favored the 3 p.m. to 6 p.m. alternative.
The report discusses several alternatives for selecting the days over which the
values during the range of hours are averaged. The report favors using the three
costliest days of the year as determined through the Avoided Cost Calculator,
allowing for non-consecutive costliest days and potentially updating the selected
Law 84: “We generally agree with parties’ request that ex ante values should be adopted and held
constant throughout the portfolio cycle. However, mid-cycle updates of ex ante values are warranted if
newly adopted codes or standards take effect during the cycle.” 16 D.16-10-28, at 80, quotes from D.12-05-015: “Conclusion of Law 80 states: ‘Our Staff should have
significant latitude in performing DEER and other policy oversight functions and, absent specific
directives to the contrary, should not be required to consult with or otherwise utilize any other groups
to perform this work.”

Resolution E-4952 October 11, 2018
DEER2020 and Revised DEER2019
7
days annually. NRDC agrees with the report that the selection of days should be
based on “when energy savings are most valuable to the grid,” as “determined
through the avoided cost calculator.”17
The change in peak load timing is influenced by two important considerations.
First, there is the consideration of grid resources, both generation resources and
transmission and distribution resources. The transmission and distribution
resource requirements are generally driven by the gross demand on the grid
which varies regionally but is generally in the very early evening.18 The
generation resources energy efficiency savings should target are fossil generation
sources thus focusing on obtaining a reduction in GHG emissions. This priority
means that any Peak Period selection must consider the grid net load which
occurs later than the gross grid load.19, 20
Second, the Investor-Owned Utilities (IOUs) each employ time-of-use pricing, as
required by the Commission, applying the highest rates during the “on-peak”
periods.21 For the largest customer sectors Peak Period generally coincide with
the later time proposed by the working group. Examples of these rate are PG&E
residential22 and small business,23 SCE residential24 and small business,25 and
SDG&E residential26 and small Business.27 For these reasons, we agree with the
4 p.m. to 9 p.m. hour range for the DEER demand reduction definition proposed
by the working group and adopt this Peak Period.
17 NRDC Comments on DEER Peak Period Report. Mohit Chhabra. May 18, 2018. 18 The peak gross load is the peak of the total load delivered through the electric grid to customer meters
from all generation sources. CAISO data confirms that this peak is currently generally occurring
between 5 p.m. and 6 p.m.
http://www.caiso.com/planning/Pages/ReliabilityRequirements/Default.aspx#Historical 19 The net grid load is the total load delivered though the electric grid to customer meters from non-
renewable generation sources. 20 http://www.caiso.com/planning/Pages/ReliabilityRequirements/Default.aspx#Historical 21 http://www.cpuc.ca.gov/General.aspx?id=12194 22 https://www.pge.com/en_US/residential/rate-plans/rate-plan-options/time-of-use-base-plan/not-
enrolled.page 23 https://www.pge.com/en_US/business/rate-plans/rate-plans/time-of-use/time-of-use.page 24 https://www.sce.com/wps/portal/home/residential/rates/Time-Of-Use-Residential-Rate-Plans 25 https://www.sce.com/wps/portal/home/business/rates/time-of-use/ 26 https://www.sdge.com/residential/pricing-plans/about-our-pricing-plans/time-use-plans 27 https://www.sdge.com/businesses/pricing-plans/time-use-tou-pricing-plans-business
Resolution E-4952 October 11, 2018
DEER2020 and Revised DEER2019
8
The adjustments to definition methodology for selecting the days as
recommended by the working group does not lend itself to the purposes of the
DEER, which must be readily extensible for new measures and workpapers, as
well as calculation tools for custom projects. The method of selection should be
stable for program planning, implementation, and evaluation. The use of a
normalized weather year has provided stability and proven readily calculable for
measures once hourly usage profiles are generated. Furthermore, the
requirement that peak days be consecutive weekdays based on weather rather
than avoided cost has ensured coincidence with the types of peaks which strain
the grid, without over-valuing the demand savings. Thus, the current
methodology for selecting peak days is better aligned with the purpose of the
demand savings estimation. Finally, a limited adjustment to the hour range
would be reasonably simple to implement within the year, allowing the update
of the DEER, the utilities and third-party implementers to update all
workpapers, the update of custom calculation methods, as well as the necessary
education of the large number of individuals involved in delivering and
evaluating the energy efficiency portfolio in time for program planning for 2020.
Additionally, the report suggests that the CPUC consider a “no peak” option,
which would eliminate the reporting of demand reduction values. The values of
demand reduction under this option would be embedded in the cost
effectiveness calculation which would utilize hourly savings profiles along with
hourly electric avoided costs applied to the annual savings. While many
participants advocated for this solution, the group acknowledged numerous
technical barriers to implementing it at this time. In light of these technical
barriers we will not consider this change at this time. However, this option
should be further investigated, and action should be taken to improve the
available hourly efficiency measure savings profiles for use in the cost
effectiveness calculations. These steps were ordered in Decision 06-06-063 and
are reiterated here.28
2. DEER 2020 Update
Pursuant to D.15-10-28, the Energy Division published a scoping memo on the
proposed list of updates for DEER2020 and revised DEER2019 on May 9, 2018.
28 CPUC Decision 06-06-063 OP 11, 12, 13 and 14.
Resolution E-4952 October 11, 2018
DEER2020 and Revised DEER2019
9
Based upon the scoping memo and comments received on the scoping memo, the
priority updates are summarized below and as described in detail in the
Attachment to this Resolution:
A. Addition of New Measures
A new set of measures has been added for both residential and commercial
building types to consider the energy savings due to the use of an electrically
commutated motor (ECM) in a furnace unit instead of a permanent split capacity
(PSC) motor. This measure was considered as both a stand-alone motor
replacement and in combination with a furnace efficiency upgrade.
New measures have also been added for liquid chilling machine (chiller)
efficiency. In previous DEER versions chiller efficiency measures were defined
for specific tier levels, and the application of the DEER values resulted in
challenges for equipment that did not exactly match the tier level efficiencies.
Consequently, a new calculation workbook is developed to enable PAs to
calculate DEER impacts for a wide range of efficiency values. In addition, a new
chiller measure has been added in which only the lead chiller in the chiller plant
is upgraded to a higher efficiency level. Also, in response to requests from PAs, a
new extended hours building prototype has been added to DEER for the chiller
measures to capture the higher savings per unit of chiller capacity for an
industrial building with high load activity areas and long hours of operation.
B. Updates to Underlying Methodology or Correction of Errors
Since changing the Peak Period definition requires updating all active DEER
measures, a number of other methodology changes are implemented that had
previously been deferred due to the significant effort required. The most
significant of these changes is the reconfiguration of the commercial building
prototypes based on the evaluation of lighting M&V and California Commercial
Saturation Survey (CSS) data that was done in conjunction with DEER2016. The
activity area types and distribution for each prototype have been updated for
DEER2020 based on the findings of the DEER2016 update.
A second major methodology change for DEER2020 is the consolidation of
building vintage definitions and updates to vintage values. The primary change
is the definition of a “median” vintage, which represents buildings with lighting
and HVAC systems that cover the range of their effective useful life (EUL)
values. The median vintage is the basis for the “existing” building in the
Resolution E-4952 October 11, 2018
DEER2020 and Revised DEER2019
10
DEER2020 database. The age range for the median vintage is 1995 to 2005 for
mobile homes and 2002 to 2016 for all other building types. As a part of the
vintage consolidation, several characteristics of multi-zone and central plant
HVAC systems were updated to account for equipment upgrades that would
likely have occurred in those buildings. All motor efficiencies and controls,
supply air temperature controls, and duct insulation levels have been updated
for the oldest two vintages to bring them up to the level of the 1996 vintage.
Three error corrections were implemented in the DEER2020 update. These
corrections were not implemented into DEER2019 as staff did not consider the
errors of sufficient magnitude to justify updating all impacted measures at the
time, but instead chose to include these into DEER2020 since all values require
updating due to other mythological changes. The first is a change to occupant
density and outdoor air ventilation requirements based on specifications in the
California Title 24 Alternative Compliance Manual. The correction results in a
median decrease of occupant density of 25% and increase in ventilation
requirement of 50%.
The second error correction pertains to the area of windows in the residential
prototypes, which were oversized by 18% in DEER2017.
The third error correction also applies only to residential prototypes, and
comprises a 15% increase in fan power for two speed air conditioner and heat
pump measures operating in the low speed mode.
C. New Code Revisions or Code Revisions Not Covered in Previous DEER Updates
Residential hot water heater measures are updated in DEER2020 based on code
pertaining to the previously effective change to the federal standard for the
rating of residential hot water heaters.
Additional updates in the 2019 Title-24 requirements for commercial buildings
include expanded ventilation (outdoor-air flow) rates by activity area, increased
exhaust-air flow rates for some activity areas and increased values for cooling
tower efficiency. These updates, which have been incorporated into the 2020
DEER building vintage and the new construction DEER building vintage
prototype models, are expected to have minor effects on measure savings.
Updates in the 2019 Title-24 requirements for residential buildings include
changes to the roof insulation configuration in single-family buildings along with
Resolution E-4952 October 11, 2018
DEER2020 and Revised DEER2019
11
lower framed wall U-value for single-family buildings and improved window
specifications for single-family and multi-family buildings.
D. Updates Based on Evaluation Study Results
Commission Staff reviewed recent Evaluation, Measurement, and Verification
(EM&V) findings and updated net-to-gross (NTG) values where they indicate a
substantial difference from current DEER values. Additionally, pursuant to
Commission Decision 16-08-019 and Resolution E-4818, Commission Staff
assessed available data sources for updates to add appropriate NTG values for
use in accelerated replacement (AR) and normalized metered energy
consumption (NMEC) measure and project installations.29 These updates
followed methods and assumption adopted for use in establishing energy
savings goals for the IOUs as adopted in D.17-09-025 which differentiated the
above-code and to-code net savings values.30
Custom measures and projects rely upon PA-, implementer-, or customer-
developed gross savings estimates for both the payment of incentives as well as
PA ex ante savings claim filings to the Commission. The Commission adopted a
custom measure and project review process in Decision 11-07-30 to provide
Commission staff the opportunity to review proposed savings values prior to the
PA entering into payment agreements with customers.31 However, since
Commission staff only reviews a small percentage of custom measures and
projects, a default gross realization rate (GRR) was adopted to account for the
fact that the ex ante custom gross savings claims were generally over-estimated
compared to ex post evaluation results. The default GRR direction and values,
set to 0.90 for kW, kWh, and therm savings for all utilities, are found in
Attachment B of D.11-07-030.32 There has been no update to the default GRR
values since 2011, although D.12-05-015 noted that the 2006-2008 evaluation
results were substantially lower than the default values adopted by
29 Prior DEER version do not specify applicability of NTG values to AR or NMEC measures or projects.
CPUC Decision 16-08-019 Finding of Fact 23 “AB 802’s requirements related to normalized metered
energy consumption will necessitate some changes to the EM&V activities.” Resolutions E-4818 also
references AR and NMEC measures and projects and classifies NMEC as a custom activity. 30 CPUC Final Decision 17-09-025, Appendix 1, pages 17-20. 31 CPUC Decision 11-07-030 Attachment A. 32 D.11-07-030, Attachment B, at B6.
Resolution E-4952 October 11, 2018
DEER2020 and Revised DEER2019
12
D.11-07-030.33 A more recent analysis based on current evaluation results,
summarized in Section 5.3 of the Attachment to this Resolution, indicates a
consistent discrepancy between the default and evaluated GRR values across
several years. An update to the default GRR values is within the scope of this
Resolution; however, the values defined in D.11-07-030 must be modified
through a process outside this Resolution.34
Other Consideration for the DEER2020 Update
CPUC Decision 12-05-015 noted “that similar measures delivered by similar
activities should have single statewide values unless recent evaluations show a
significant variation between utilities and that difference is supported by a
historical trend of evaluation results.”35 The Decision directed Commission Staff
to “strive for uniform statewide Net-to-Gross planning values that represent
typical expected results in the DEER update for the next planning cycle for
measures in which the variation between utilities is not significant.”36 In response
to this direction, Commission Staff determined that DEER ex ante values shall
not be updated if the change is less than five percent in one year. However,
values can be updated if there is evidence from two or more consecutive
evaluations that the change represents a directional shift that will persist into the
future rather than normal year-to-year variance in participation or measure mix.
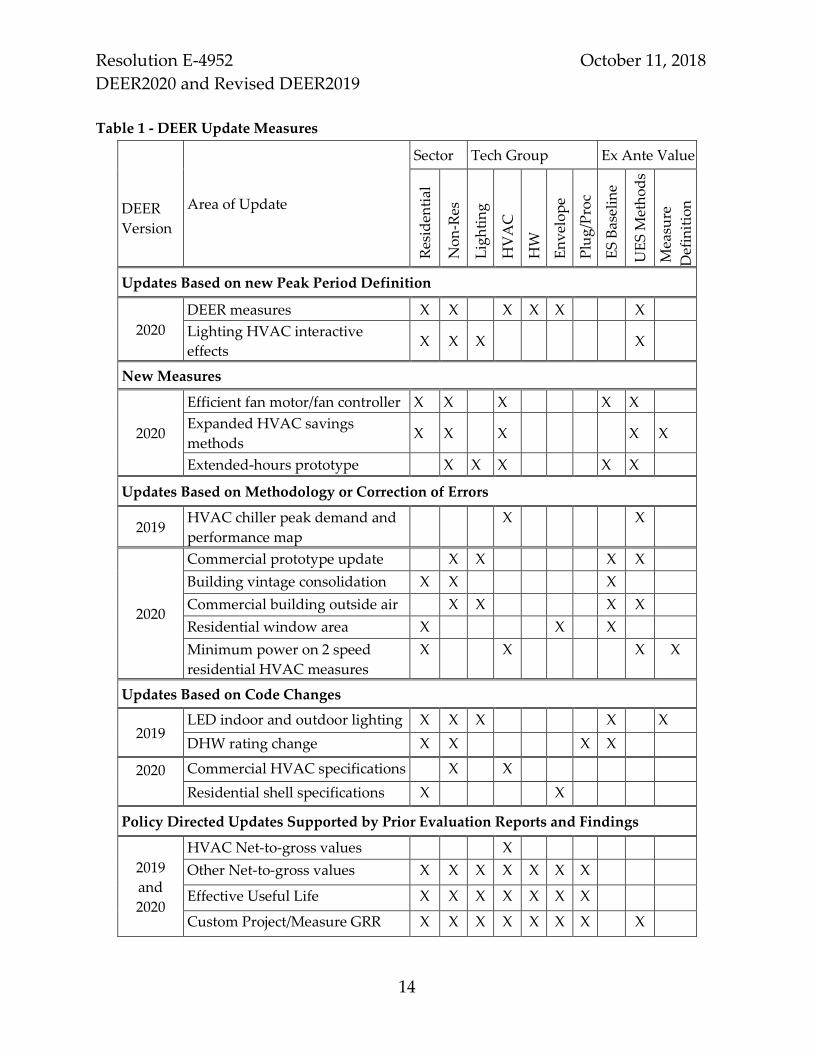
DEER updates and adjustments considered comments received from the
stakeholders. This Resolution approves the final updates for DEER2020 and
revised DEER2019. The final updated measures are listed in Table 1 with a more
detailed description of the changes and additions provided in the Attachment to
this Resolution. Complete documentation and supporting material on the
updated assumptions and methods, a summary response to comments on the
33 D.12-05-015 at 343 listed values varying by utility and kW, kWh and therm from 0.54 to 0.79 34 Solicitation for Comments on Scope – Database of Energy Efficiency Resources (DEER). May 9, 2018.
Section 5.2. 35 D.12-05-015 at 54. 36 Ibid.

Resolution E-4952 October 11, 2018
DEER2020 and Revised DEER2019
13
scoping memo, and all updated DEER values are available at
DEEResources.com.37
37 Supporting material is available under the main menu/DEER Version/DEER2020. The updated values
are in the ex-ante database and accessible for review and download via the Remote Ex Ante Data
Interface (READI) tool which is also available for download.
Resolution E-4952 October 11, 2018
DEER2020 and Revised DEER2019
14
Table 1 - DEER Update Measures
Area of Update
Sector Tech Group Ex Ante Value
DEER
Version
Res
iden
tial
No
n-R
es
Lig
hti
ng
HV
AC
HW
En
vel
op
e
Plu
g/P
roc
ES
Bas
elin
e
UE
S M
eth
od
s
Mea
sure
Def
init
ion
Updates Based on new Peak Period Definition
2020
DEER measures X X
X X X
X
Lighting HVAC interactive
effects X X X
X
New Measures
2020
Efficient fan motor/fan controller X X X X X
Expanded HVAC savings
methods X X X X X
Extended-hours prototype X X X X X
Updates Based on Methodology or Correction of Errors
2019 HVAC chiller peak demand and
performance map
X X
2020
Commercial prototype update X X X X
Building vintage consolidation X X X
Commercial building outside air X X X X
Residential window area X X X
Minimum power on 2 speed
residential HVAC measures
X X X X
Updates Based on Code Changes
2019 LED indoor and outdoor lighting X X X X X
DHW rating change X X X X
2020 Commercial HVAC specifications X X
Residential shell specifications X X
Policy Directed Updates Supported by Prior Evaluation Reports and Findings
2019
and
2020
HVAC Net-to-gross values X
Other Net-to-gross values X X X X X X X
Effective Useful Life X X X X X X X
Custom Project/Measure GRR X X X X X X X X

Resolution E-4952 October 11, 2018
DEER2020 and Revised DEER2019
15
Resolution E-4952 October 11, 2018
DEER2020 and Revised DEER2019
16
COMMENTS
Public Utilities Code section 311(g)(1) provides that this Resolution must be
served on all parties and subject to at least 30 days of public review and
comment prior to a vote of the Commission. Section 311(g)(2) provides that this
30-day period may be reduced or waived upon the stipulation of all parties in the
proceeding.
The 30-day public review period for the draft of this Resolution was neither
waived nor reduced. Accordingly, the draft Resolution was mailed to parties for
comments on August 28, 2017.
Thirteen stakeholders, including all four IOUs, submitted a total of 66 comments
to the draft Resolution. Below are the issues raised most frequently in the
comments:
The proposed removal of the default net-to-gross ratio for programs which
target Hard-to-Reach customers;
The application of an adjustment factor for below-code savings for
Accelerated Replacement measures;
The updated definition of the peak period hours for demand savings
estimation;
The application of a net-to-gross ratio for Normalized Metered Energy
programs and projects
We respond to comments on each of these topics, as well as those regarding less
commonly raised issues, in Section 7 of the Attachment to this Resolution. All
substantive changes to the Resolution in response to comments are also
highlighted in Section 7.
FINDINGS
1. Decision D.15-10-028 requires that Commission Staff propose changes to the
Database of Energy Efficient Resources once annually via Resolution, with the
associated comment/protest period provided by General Order 96-B.
2. Decision D.15-10-028 retains the direction from D.12-05-015 that DEER values
be updated to be consistent with existing and updated state and federal codes
and standards.
Resolution E-4952 October 11, 2018
DEER2020 and Revised DEER2019
17
3. Decision D.15-10-028 also states that Commission staff may make changes at
any time without a Resolution to fix errors or to change documentation.
4. The proposed updates to the DEER values are a result of a) Updates Based on
The Recent Commission Resolution on Existing Baselines, b) New Code
Update or Code Update Not Covered in Previous DEER Updates, c) Updates
to Underlying Methodology or Correction of Errors, d) Addition of New
Measures, e) Updates Based on Evaluation Study Results, and f) the update to
the peak demand definition.
5. Decision 16-08-019 requires that the adopted baseline policy apply to energy
efficiency programs and projects beginning January 1, 2017.38
6. The time of peak demand has shifted later in the day since the DEER
definition of demand reduction was adopted in D.06-06-063.
7. The current DEER definition of demand reduction based on 2 p.m. to 5 p.m. is
poorly aligned with either the peak grid net load time period or the rate
schedule on-peak time period for most IOU customers. A time focused on the
peak grid net load reduction rather than just gross load reduction provides
better alignment with state GHG reduction goals. A time period focused on
customer highest costs provides better alignment with providing the highest
energy efficiency value to customers.
8. A shift in the time period used in the DEER definition of demand reduction
from 2 p.m. to 5 p.m.to 4 p.m. to 9 p.m. is both feasible and reasonable.
9. A shift in the selection of days in the DEER definition of demand reduction is
not feasible in the time available, or the resources and information available
for a January 1, 2020 effective date. Additionally, such a shift is not
adequately supported by the record at this time.
10. There is a consistent discrepancy between the evaluated GRR and default
GRR values adopted in D.11-07-030 across several years for custom measures
and projects.
38 Decision 16-08-019 Conclusions of Law 37 and Ordering Paragraph 3.
Resolution E-4952 October 11, 2018
DEER2020 and Revised DEER2019
18
THEREFORE IT IS ORDERED THAT:
1. Effective January 1, 2020 the DEER demand reduction shall be defined as the
average demand impact as would be “seen” at the electric grid level for a
measure averaged across 15 hours from 4 p.m. to 9 p.m. during the three
consecutive weekday period containing the highest algebraic sum of: the
average temperature over the three-day period, the average temperature from
noon to 6 p.m. over the three day period, and the peak temperature within the
three-day period. The three Peak Period days shall not include a holiday, and
shall fall within the dates of June 1 through September 30, inclusive. Holidays
within the possible peak dates include the nearest weekday to the Fourth of
July, and Labor Day. A Peak Period shall be selected for each of the 16
California climate zones, based on the most current weather data sets and
day-of-week sequencing adopted for the California Title 24 Building Energy
Efficiency Standards, as published by the California Energy Commission.
2. The DEER2020 and Revised DEER2019 Updates, listed in Table 1, as
described in the Attachment and supporting documentation available on the
DEEResources.com website, are approved with effective dates as listed.
3. Pacific Gas and Electric Company (PG&E), Southern California Electric
Company (SCE), Southern California Gas Company (SoCalGas), and San
Diego Gas & Electric (SDG&E), the San Francisco Bay Area Regional Energy
Network (BayREN), Southern California Regional Energy Network
(SoCalREN), Tri-County Regional Energy Network (3CREN), Local
Government Sustainable Energy Coalition (LGSEC), Lancaster Choice Energy
(LCE), and Marin Clean Energy (MCE) must use the updated assumptions,
methods and values for 2019 savings claims and 2020 planning,
implementation and reporting.
This Resolution is effective today.

Resolution E-4952 October 11, 2018
DEER2020 and Revised DEER2019
19
I certify that the foregoing Resolution was duly introduced, passed and adopted
at a conference of the Public Utilities Commission of the State of California held
on October 11, 2018; the following Commissioners voting favorably thereon:
/s/ALICE STEBBINS
ALICE STEBBINS
Executive Director
MICHAEL PICKER
President
CARLA J. PETERMAN
LIANE M. RANDOLPH
MARTHA GUZMAN ACEVES
CLIFFORD RECHTSCHAFFEN
Commissioners

Resolution E-4952 October 11, 2018
DEER2020 and Revised DEER2019
A-1
Attachment
DEER2020 and Revised DEER2019 Update Statement
Contents
1. Update to the DEER Peak Demand Definition and Methodology ..................... 4
1.1. Background .......................................................................................................... 4
1.2. Update to the DEER peak demand Definition ............................................... 4
1.3. Update of the kW impacts for DEER Measures ............................................. 5
1.4. Update of the DEER Lighting HVAC Interactive Effects Values ................ 7
2. Updates to Add New Measures ............................................................................ 15
2.1. Furnace Fan Efficiency and Efficient Fan Operation ................................... 15
2.2. Expanded HVAC Savings Methods ............................................................... 17
2.3. Extended-hours Prototype ............................................................................... 19
3. Updates Based on Methodology and Correction of Errors ............................... 19
3.1. Correction to Commercial Building Activity Areas .................................... 19
3.2. Consolidation of Building Vintage Definitions ............................................ 20
3.3. Commercial Building Outside Air Specifications ........................................ 22
3.4. Residential Window Area ................................................................................ 23
3.5. Residential Two Speed Fan Power ................................................................. 23
3.6. Chiller Peak Demand Savings and Performance Maps .............................. 23
4. Updates Based on Energy Code (2019 or 2020) ................................................... 24
4.1. Water Heater Ratings Change ......................................................................... 24
4.2. Lighting Baseline Update and Lighting Power Density in Commercial
Buildings ....................................................................................................................... 25
4.3. Update to Commercial HVAC Specifications ............................................... 34
4.4. Update to Residential Building Shell Specifications .................................... 34
4.5. Net-to-Gross for Lighting Measures .............................................................. 34
5. Policy-Directed Updates Supported by Prior Evaluation Findings ................. 35
5.1. Net-to-Gross for HVAC Measures ................................................................. 35
5.2. Effective-Useful Life Updates ......................................................................... 36

Resolution E-4952 October 11, 2018
DEER2020 and Revised DEER2019 Attachment
A-2
5.3. Default Gross Realization Rate for Custom Measures and Projects.......... 39
5.4. Net-to-Gross for Accelerated Replacement Measure .................................. 42
5.5. Net-to-Gross for Normalized Metered Energy Consumption Projects .... 44
5.6. Net-to-Gross for Expanded Measure Application Types ........................... 45
5.7. Net-to-Gross for Direct-Install Delivery to Hard-to-Reach Customers .... 47
5.8. Net-to-gross Table Format and Simplification Updates ............................. 50
6. Comments on DEER2020 Scoping Memo and Commission staff DEER team
Responses ......................................................................................................................... 51
6.1. Peak Demand Update....................................................................................... 51
6.2. Weather Files ..................................................................................................... 52
6.3. MASControl3 ..................................................................................................... 52
6.4. Furnace Fan Efficiency and Efficiency Fan Operation ................................ 53
6.5. Extended Hours Prototype .............................................................................. 54
6.6. Timing of Water Heater Ratings Change ...................................................... 54
6.7. Timing of Updates to Commercial Lighting, HVAC and Residential Shell
Specifications ................................................................................................................ 55
6.8. Net-to-Gross ....................................................................................................... 55
6.9. Gross Realization Rate ...................................................................................... 56
6.10. Effective Useful Life (EUL) of Window Films .............................................. 57
7. Comments on the Draft Version of This Resolution .......................................... 57
7.1. Removal of the Default Net-to-Gross for Direct-Install to Hard-to-Reach
Customers ..................................................................................................................... 58
7.2. Net-to-Gross for Accelerated Replacement Measures ................................. 58
7.3. Net-to-Gross Ratio for Normalized Metered Energy Consumption
Projects ........................................................................................................................... 59
7.4. Updating Load Shapes for New Peak Period ............................................... 59
7.5. Effective-Useful Life for Behavioral, Retrocommissioning, and
Operational Measures ................................................................................................. 60
7.6. Net-to-Gross Ratio for HVAC Measures ....................................................... 61
7.7. The Process by which the DEER is Updated ................................................ 61
7.8. Applicability to Codes and Standards, Randomized Control Trials, and
Strategic Energy Management ................................................................................... 62

Resolution E-4952 October 11, 2018
DEER2020 and Revised DEER2019 Attachment
A-3
7.9. Updates to the Construction Dates and Characteristics of Building
Simulation Prototypes ................................................................................................. 62
7.10. Reporting Requirement Consistency with Commission Databases .......... 63
7.11. LED Baseline for Lighting Measures .............................................................. 63
7.12. Gross Realization Rate for Custom Programs .............................................. 64
7.13. Required efficiency over Title 24 baseline for Chiller Full and Partial
Loadings ........................................................................................................................ 64
7.14. Lancaster Choice Energy requests to be included in Evaluation Planning
Process ........................................................................................................................... 64
7.15. Corrections and Clarifications ......................................................................... 65

Resolution E-4952 October 11, 2018
DEER2020 and Revised DEER2019 Attachment
A-4
1. Update to the DEER Peak Demand Definition and Methodology
1.1. Background Resolution E-4795 examined recent CAISO load data and noted that some shift in the DEER
Peak Period may be warranted, but also, that such an adjustment requires a thorough process
with broad stakeholder input. That Resolution noted that the analysis of adjustments to the
Peak Period definition is a complex and highly technical task. Implementing such changes
would result in DEER, workpaper and custom project calculation changes as well as changes to
energy efficiency goals and likely changes to program implementation details.
As ordered by Resolution E-4867, the utilities initiated a working group process to develop one
or more proposals on how the DEER peak demand period methodology should be adjusted.
The utilities served a report, published on Energy Division's Public Document Area (PDA)
covering the activities of that working group including alternatives and recommendations.1
Comments on the report filed May 18, 2018, are available on the PDA.2 Considering prior DEER
Resolutions, the recommendations and the related issues discussed in the report and the
comments filed by the parties on the working group report, a DEER peak demand period
definition adjustment has been considered and adopted by this DEER update Resolution. The
adopted definition update will be applicable to all DEER measures, all workpaper measures, all
custom measure and project calculations as well as future potential and goals studies.
1.2. Update to the DEER peak demand Definition The DEER Peak Period demand definition is updated to shift the peak hours from 2 p.m.-5 p.m.
to 4 p.m.-9 p.m. Aside from the adjusted times during which peak demand savings is
calculated, the methodology for selecting the peak days is unchanged from Resolution E-4795.
The full, updated definition is below:
Peak Demand Savings is the average demand impact as would be “seen” at the electric
grid level for a measure averaged across 15 hours from 4 p.m. to 9 p.m. during the three
consecutive weekday period containing the highest algebraic sum of:
o The average temperature over the three day period,
o The average temperature from noon to 6 p.m. over the three day period, and
o The peak temperature within the three-day period.
The Peak Period shall fall within the dates of June 1 through September 30, inclusive.
The three Peak Period days shall not include a holiday. Holidays within this window of
dates include The Fourth of July, or the nearest weekday to July 4th, and Labor Day.
1 DEER Peak Hours Workshop Report was served by Southern California Edison, lead for the working
group, to parties of R.14-08-013, R.14-10-003, R.15-12-012, R.16-02-007 R.13-11-005 on 05/04/2018. 2 The DEER Peak Period Report is available at https://pda.energydataweb.com/#/ and parties comments
are available in the Comments area.
Resolution E-4952 October 11, 2018
DEER2020 and Revised DEER2019 Attachment
A-5
A Peak Period shall be selected for each of the 16 California building climate zones,
based on the most current weather data sets and day-of-week sequencing adopted for
the California Title 24 Building Energy Efficiency Standards as published by the
California Energy Commission.
1.3. Update of the kW impacts for DEER Measures Peak demand savings for DEER measures were re-evaluated based on a decision by the CPUC
to update the Peak Period definition. All previous DEER measures with no expiration date, or
with an expiration date after December 31, 2019 have peak demand savings based on the new
Peak Period definition. These measures include:
Commercial HVAC Measures
Commercial Lighting Measures
Commercial Water-heating Measures
Residential HVAC Measures
Residential Lighting Measures
Residential Exterior Wall and Attic Insulation Measures
Residential Water-heating Measures
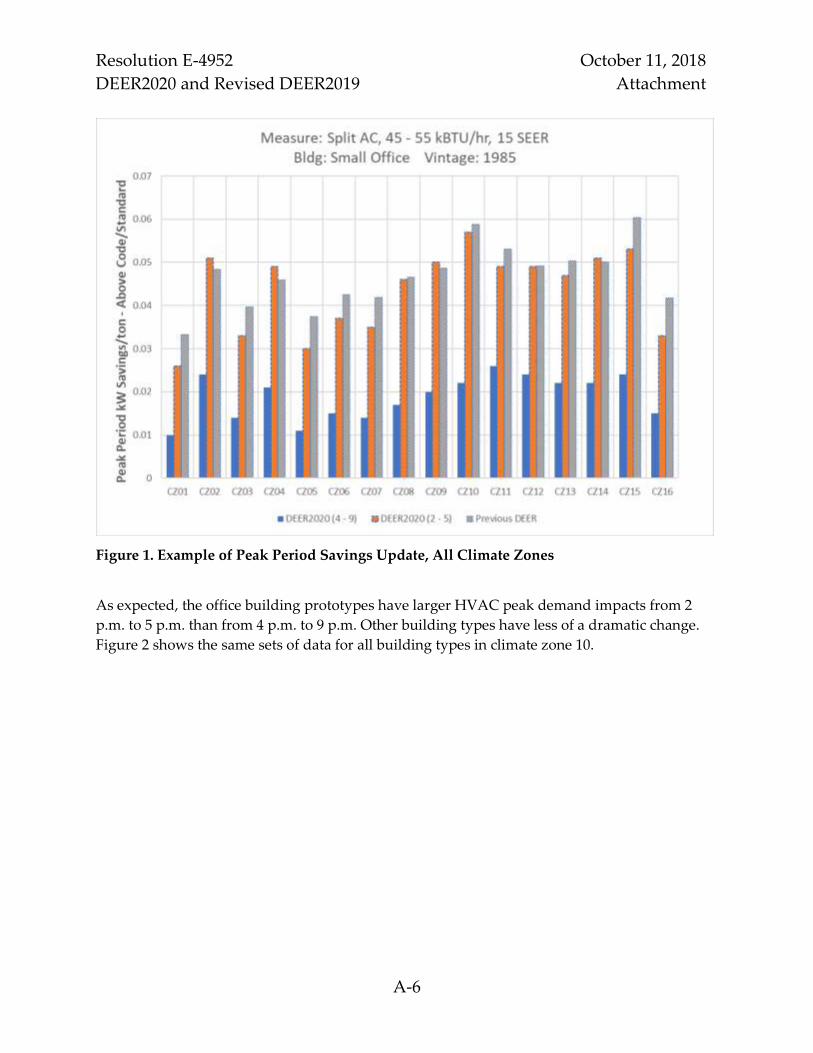
Updated measure analysis software (MASControl3) was used to determine the new peak
demand savings.3 The figures below show how the DEER demand savings changed based on
the new peak demand definition as well as the other updates and fixes described in this
document. The figures show the above pre-existing Peak Period demand savings for an HVAC
measure. Figure 1 shows the demand impacts for a 1985 vintage small office building across all
climate zones. The differences between the DEER2020 (2 p.m. to 5 p.m.) and the Previous DEER
data are due to updates and error corrections applied to the small office prototype for
DEER2020. These changes are described in detail in the following sections of this document. The
differences between the DEER2020 (2 p.m. to 5 p.m.) and the DEER2020 (4 p.m. to 9 p.m.) data
are due to the Peak Period shift from the 2 p.m. to 5 p.m. period in previous versions of DEER
to the 4 p.m. 9 p.m. period in the updated Peak Period definition.
3 MASControl3 is a new updated version of the DEER measure analysis software, which was used to run
all of the DEER2020 simulations. The software is included in the file MASControl3.zip in the DEER2020
supporting files.
Resolution E-4952 October 11, 2018
DEER2020 and Revised DEER2019 Attachment
A-6
Figure 1. Example of Peak Period Savings Update, All Climate Zones
As expected, the office building prototypes have larger HVAC peak demand impacts from 2
p.m. to 5 p.m. than from 4 p.m. to 9 p.m. Other building types have less of a dramatic change.
Figure 2 shows the same sets of data for all building types in climate zone 10.
Resolution E-4952 October 11, 2018
DEER2020 and Revised DEER2019 Attachment
A-7
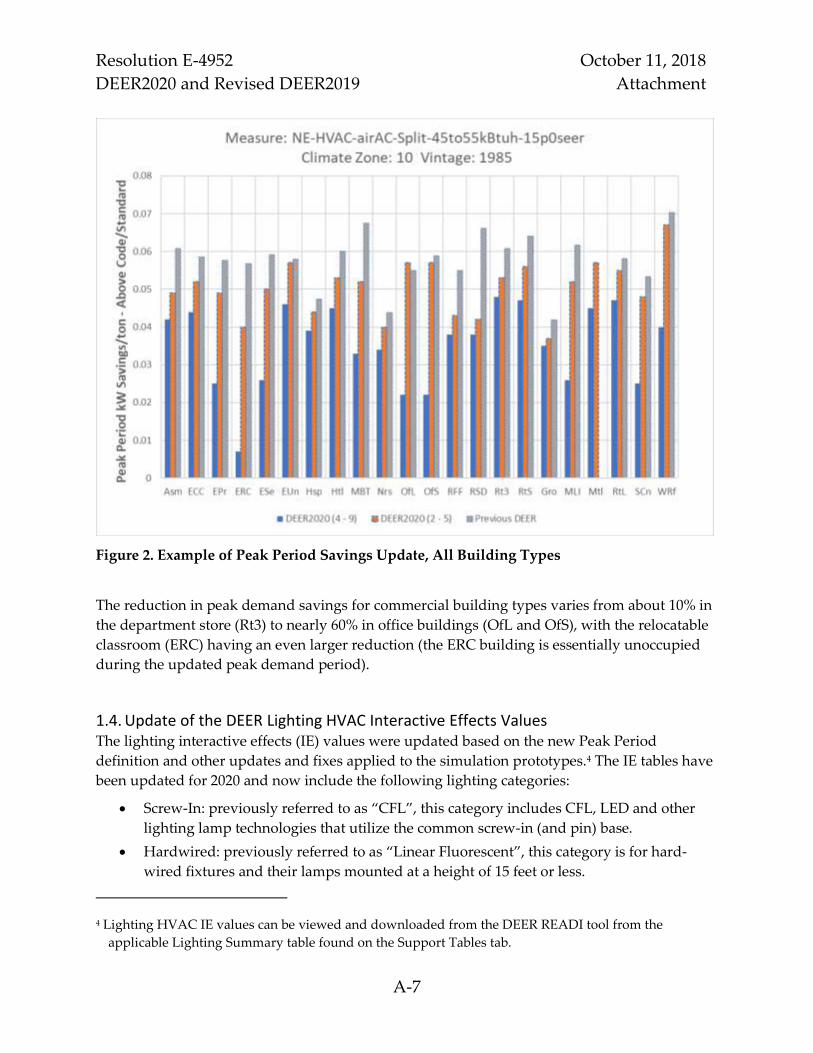
Figure 2. Example of Peak Period Savings Update, All Building Types
The reduction in peak demand savings for commercial building types varies from about 10% in
the department store (Rt3) to nearly 60% in office buildings (OfL and OfS), with the relocatable
classroom (ERC) having an even larger reduction (the ERC building is essentially unoccupied
during the updated peak demand period).
1.4. Update of the DEER Lighting HVAC Interactive Effects Values The lighting interactive effects (IE) values were updated based on the new Peak Period
definition and other updates and fixes applied to the simulation prototypes.4 The IE tables have
been updated for 2020 and now include the following lighting categories:
Screw-In: previously referred to as “CFL”, this category includes CFL, LED and other
lighting lamp technologies that utilize the common screw-in (and pin) base.
Hardwired: previously referred to as “Linear Fluorescent”, this category is for hard-
wired fixtures and their lamps mounted at a height of 15 feet or less.
4 Lighting HVAC IE values can be viewed and downloaded from the DEER READI tool from the
applicable Lighting Summary table found on the Support Tables tab.
Resolution E-4952 October 11, 2018
DEER2020 and Revised DEER2019 Attachment
A-8
High bay: this category is for hard-wired fixtures and their lamps mounted at a height
greater than 15 feet.
Prior to this update, high-bay lighting systems utilized the same HVAC IE values as the hard-
wired (a.k.a. the linear fluorescent) lighting system. Note that the commercial lighting systems
measures no longer include exit lighting, as high-efficiency exit lighting has become standard
practice due to state and federal building code changes that were enacted in January 2006.
The figures below show an example of the changes in the HVAC interactive effects values from
the previous version. For the large office building, the overall kWh IE values have not changed
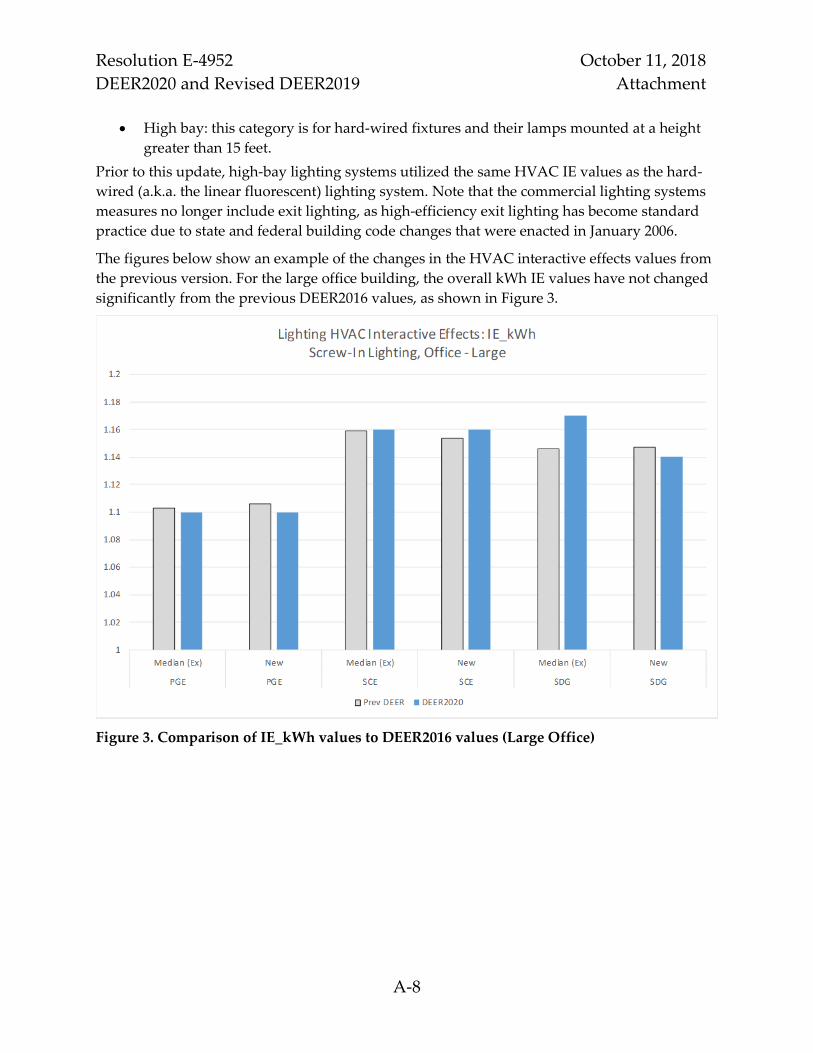
significantly from the previous DEER2016 values, as shown in Figure 3.
Figure 3. Comparison of IE_kWh values to DEER2016 values (Large Office)
Resolution E-4952 October 11, 2018
DEER2020 and Revised DEER2019 Attachment
A-9
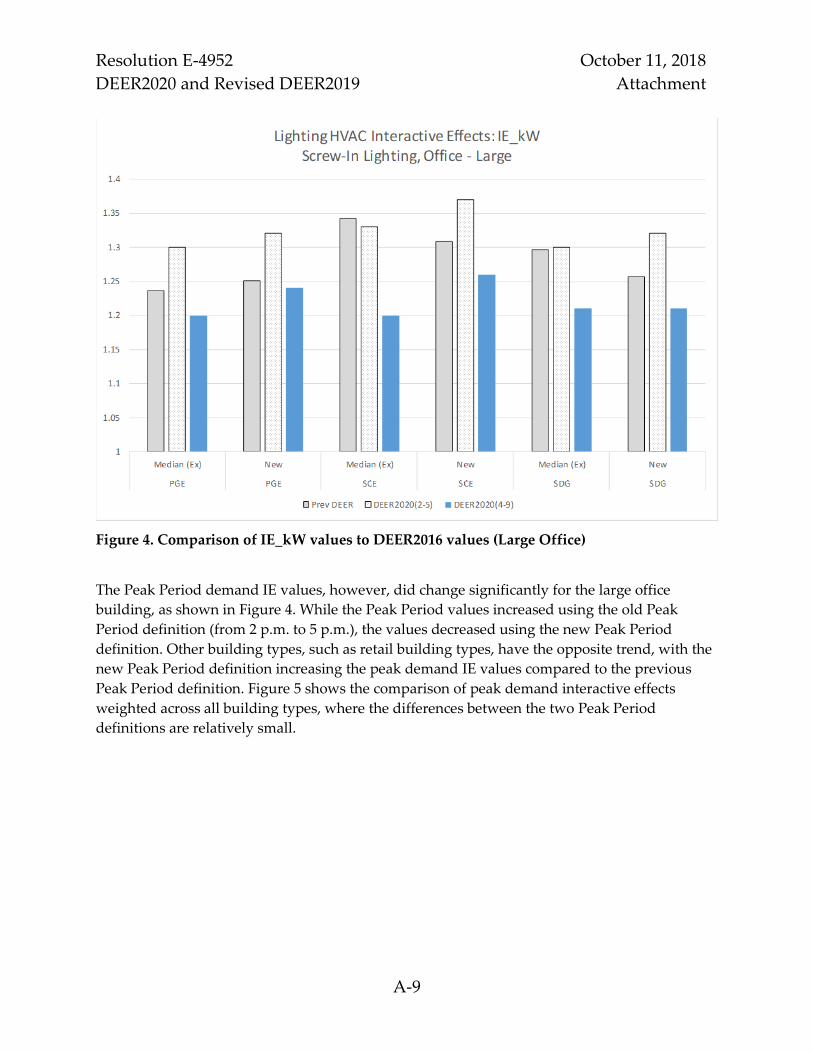
Figure 4. Comparison of IE_kW values to DEER2016 values (Large Office)
The Peak Period demand IE values, however, did change significantly for the large office
building, as shown in Figure 4. While the Peak Period values increased using the old Peak
Period definition (from 2 p.m. to 5 p.m.), the values decreased using the new Peak Period
definition. Other building types, such as retail building types, have the opposite trend, with the
new Peak Period definition increasing the peak demand IE values compared to the previous
Peak Period definition. Figure 5 shows the comparison of peak demand interactive effects
weighted across all building types, where the differences between the two Peak Period
definitions are relatively small.
Resolution E-4952 October 11, 2018
DEER2020 and Revised DEER2019 Attachment
A-10
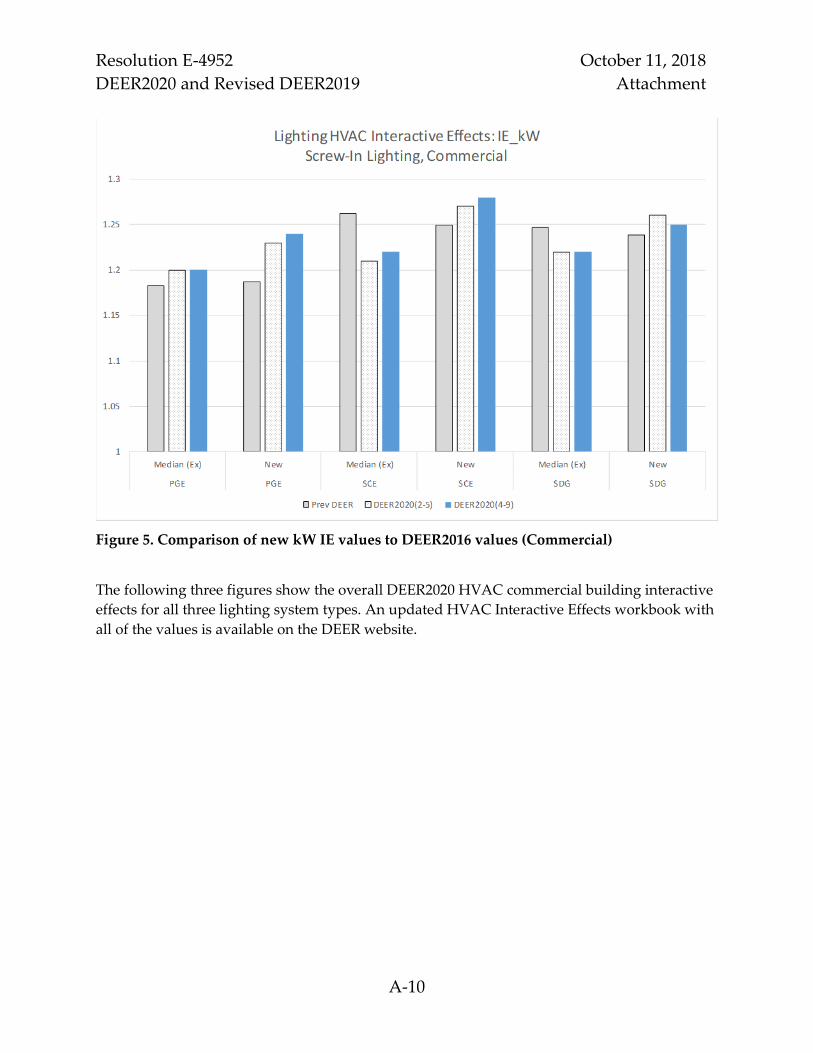
Figure 5. Comparison of new kW IE values to DEER2016 values (Commercial)
The following three figures show the overall DEER2020 HVAC commercial building interactive
effects for all three lighting system types. An updated HVAC Interactive Effects workbook with
all of the values is available on the DEER website.

Resolution E-4952 October 11, 2018
DEER2020 and Revised DEER2019 Attachment
A-11
Figure 6. Weighted DEER2020 IE-kWh values for Commercial Buildings
Figure 7. Weighted DEER2020 IE-kW values for Commercial Buildings
Resolution E-4952 October 11, 2018
DEER2020 and Revised DEER2019 Attachment
A-12
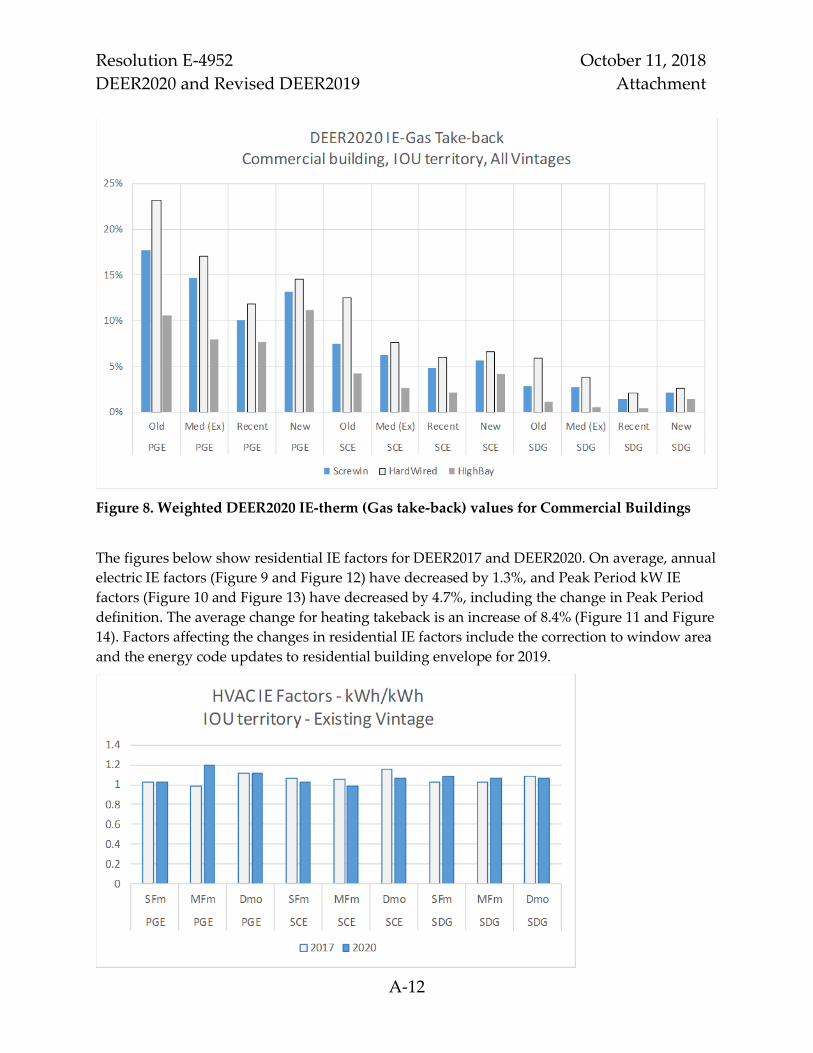
Figure 8. Weighted DEER2020 IE-therm (Gas take-back) values for Commercial Buildings
The figures below show residential IE factors for DEER2017 and DEER2020. On average, annual
electric IE factors (Figure 9 and Figure 12) have decreased by 1.3%, and Peak Period kW IE
factors (Figure 10 and Figure 13) have decreased by 4.7%, including the change in Peak Period
definition. The average change for heating takeback is an increase of 8.4% (Figure 11 and Figure
14). Factors affecting the changes in residential IE factors include the correction to window area
and the energy code updates to residential building envelope for 2019.

Resolution E-4952 October 11, 2018
DEER2020 and Revised DEER2019 Attachment
A-13
Figure 9. Weighted DEER2020 IE-kWh values for Existing Residential Buildings
Figure 10. Weighted DEER2020 IE-kW values for Existing Residential Buildings
Figure 11. Weighted DEER2020 IE-therm (Gas take-back) values for Existing Residential
Buildings
Resolution E-4952 October 11, 2018
DEER2020 and Revised DEER2019 Attachment
A-14
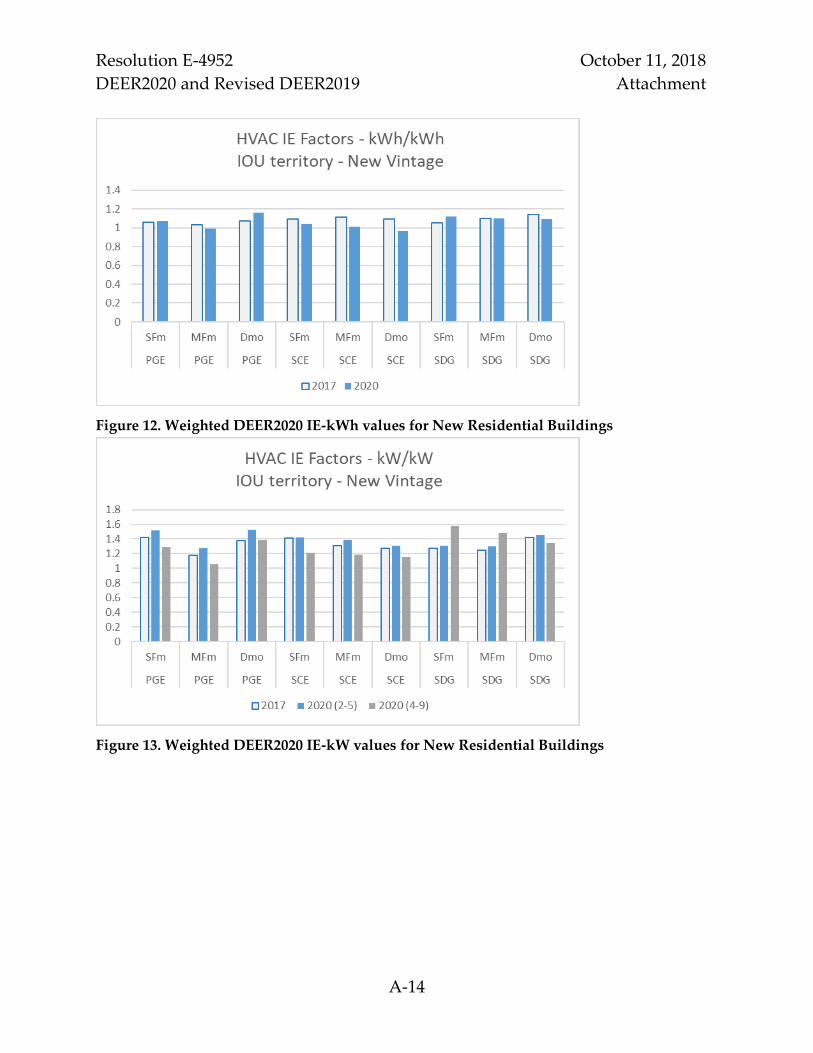
Figure 12. Weighted DEER2020 IE-kWh values for New Residential Buildings
Figure 13. Weighted DEER2020 IE-kW values for New Residential Buildings

Resolution E-4952 October 11, 2018
DEER2020 and Revised DEER2019 Attachment
A-15
Figure 14. Weighted DEER2020 IE-therm (Gas take-back) values for New Residential
Buildings
2. Updates to Add New Measures
2.1. Furnace Fan Efficiency and Efficient Fan Operation The commercial and residential furnace measures were updated and augmented to include the
option of higher efficiency supply-air fan motors. The previous furnace efficiency measures
include only impacts to the gas consumption of the higher-efficiency furnace. The DEER2020
furnace efficiency measures include:
Furnace burner efficiency only: Annual Fuel Utilization Efficiency (AFUE) of 90 through
98
Furnace burner efficiency and Electronically Commutated Motors (ECM) supply fan
motor: AFUE 90 through 98
ECM supply fan only
The updated DEER measures have a start date of January 1, 2020.
The ECM furnace fan motor was estimated to save 18% on average compared to the baseline
Permanent Split Capacitor (PSC) motor. The derivation of this estimate is provided in the DEER
supporting files.5
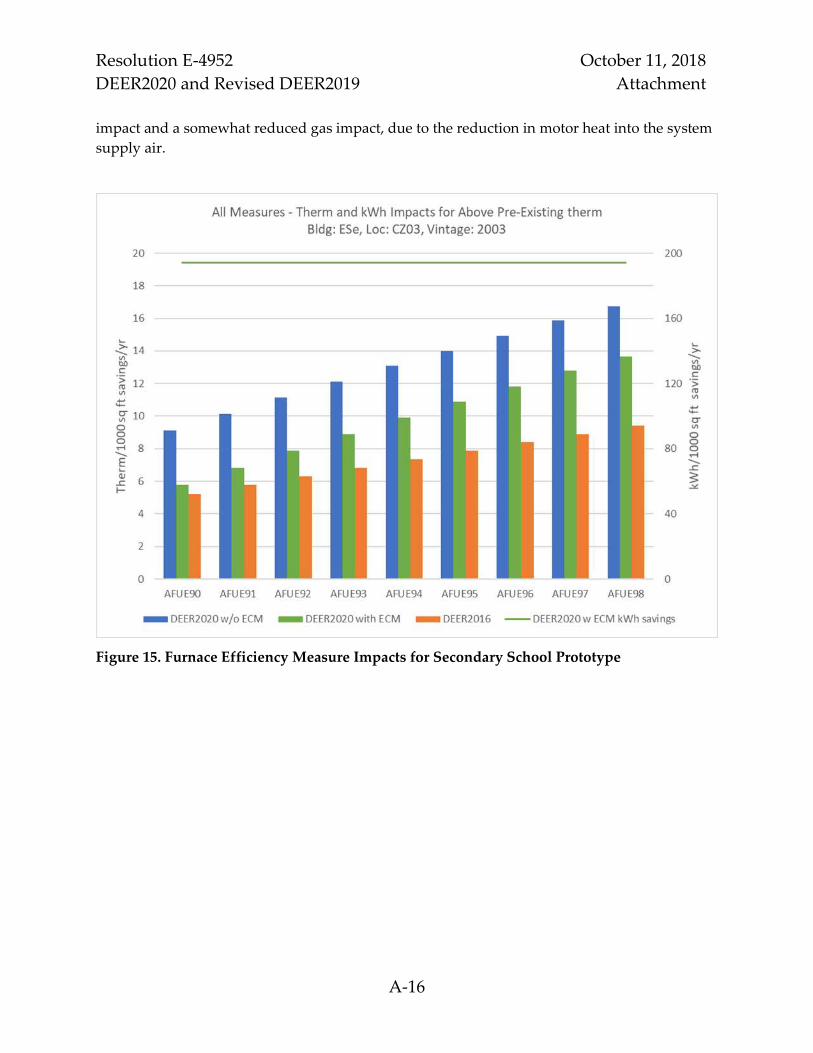
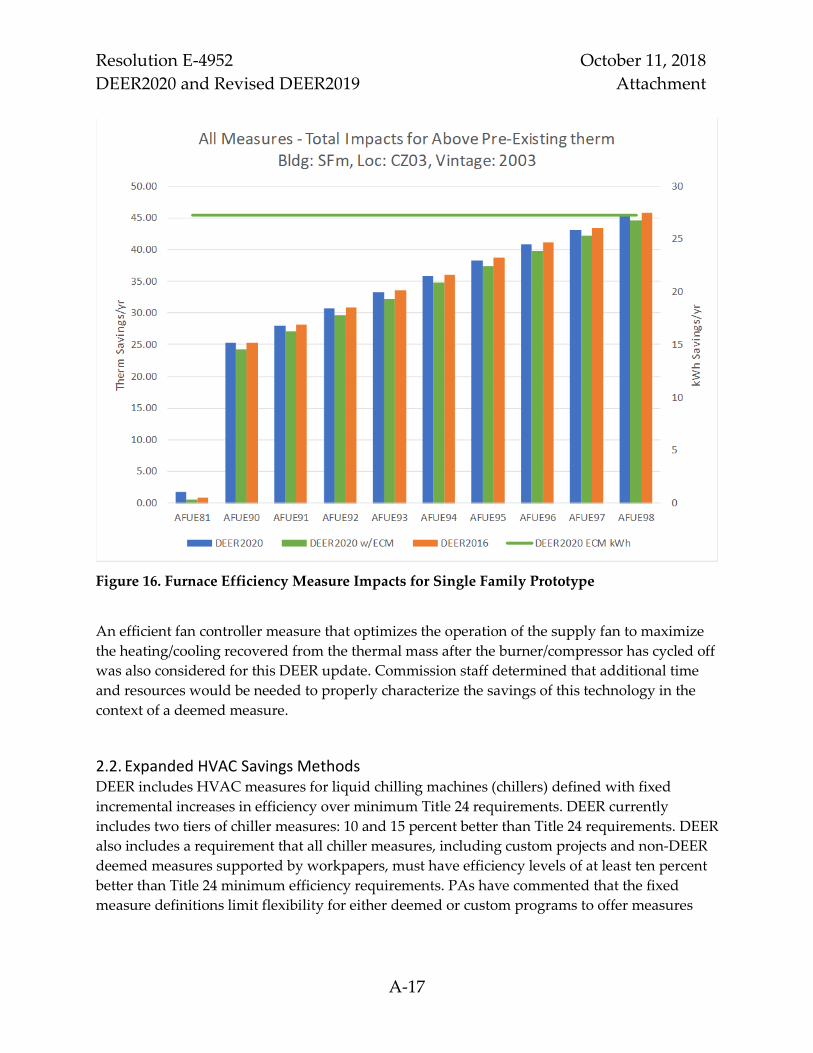
Sample results for the furnace measures are shown in Figure 15 and Figure 16. In general,
impacts for a given efficiency tier have increased compared to previous DEER. When the
furnace efficiency measure is combined with the ECM measure, there is an added electrical
5 DEER supporting files: DEER2020_FurnaceFan.xlsx
Resolution E-4952 October 11, 2018
DEER2020 and Revised DEER2019 Attachment
A-16
impact and a somewhat reduced gas impact, due to the reduction in motor heat into the system
supply air.
Figure 15. Furnace Efficiency Measure Impacts for Secondary School Prototype
Resolution E-4952 October 11, 2018
DEER2020 and Revised DEER2019 Attachment
A-17
Figure 16. Furnace Efficiency Measure Impacts for Single Family Prototype
An efficient fan controller measure that optimizes the operation of the supply fan to maximize
the heating/cooling recovered from the thermal mass after the burner/compressor has cycled off
was also considered for this DEER update. Commission staff determined that additional time
and resources would be needed to properly characterize the savings of this technology in the
context of a deemed measure.
2.2. Expanded HVAC Savings Methods DEER includes HVAC measures for liquid chilling machines (chillers) defined with fixed
incremental increases in efficiency over minimum Title 24 requirements. DEER currently
includes two tiers of chiller measures: 10 and 15 percent better than Title 24 requirements. DEER
also includes a requirement that all chiller measures, including custom projects and non-DEER
deemed measures supported by workpapers, must have efficiency levels of at least ten percent
better than Title 24 minimum efficiency requirements. PAs have commented that the fixed
measure definitions limit flexibility for either deemed or custom programs to offer measures
Resolution E-4952 October 11, 2018
DEER2020 and Revised DEER2019 Attachment
A-18
that are slightly different than the DEER measures.6 Since many chillers covered by the program
have very large capacities and are large energy users, small increases in energy efficiency over
the DEER measure definitions (e.g. 12% vs 10%) can represent significant absolute energy
savings that cannot be claimed (or incented).
To support development of alternative measure definitions for chillers, and to extend the DEER
chiller savings calculation methods to custom projects, DEER now includes a chiller savings
calculation workbook. The DEER Chiller Savings Workbook (“DEER2020_Chiller_Workbook-
v1.xlsx”) utilizes the DEER chiller simulation results to develop savings of chiller measures that
incorporate the following non-DEER measure characteristics:
Primary operating or typical operating chiller (see below for additional requirements)
Mixtures of building types and building vintages
Full-load (kW/ton or EER) and blended part-load (IPLV or NPLV) rated values that
differ from the specific DEER measure, code/standard practice or existing technology
definitions
Chiller rating conditions that are different from those used in the DEER simulation
methods
Explicit specification for existing chillers for use in accelerated replacement measure
application types
The workbook includes all simulation results used to develop the DEER2020 chiller measures.
Results for user input chillers (measure, code/standard practice, existing) are developed by
scaling the DEER results by the difference in user input full-load efficiency and the full-load
efficiency used to generate the DEER results. Scaled simulation results are then subtracted to
determine savings for the user input chiller definitions. Detailed guidelines for project inputs,
chiller inputs and calculation results are provided the document “DEER2020_Chiller_Workbook
Guide.”
A set of chiller efficiency measures has been added for the scenario in which a single chiller in a
multi-chiller cooling plant is replaced with a higher efficiency unit, and that unit is operated as
the lead chiller throughout the year. The “lead chiller” has much higher operating hours and
therefore these measures will have higher savings per ton. Lead chiller measures may only be
6 Decision 12-05-015
OP 143: “Pacific Gas and Electric Company, Southern California Edison Company, San Diego Gas &
Electric Company, and Southern California Gas Company shall utilize Database for Energy Efficient
Resources (DEER) assumptions, methods, and data in the development of non-DEER values whenever
appropriate, and shall follow Commission Staff direction relating to the determination of appropriate
application of DEER to non-DEER values.”
OP 147 “Pacific Gas and Electric Company, Southern California Edison Company, San Diego Gas &
Electric Company, and Southern California Gas Company shall ensure that custom measure and project
calculation tools or methods are consistent with the adopted Database of Energy Efficient Resources
values and assumptions as applicable.”

Resolution E-4952 October 11, 2018
DEER2020 and Revised DEER2019 Attachment
A-19
utilized in custom programs and shall not be used in deemed downstream rebate, upstream
incentive or direct install programs. Custom programs for lead chiller measures shall include
pre- and post-installation measurement and verifications that support the measure chiller is
installed and operating as the lead chiller.
2.3. Extended-hours Prototype A new commercial building prototype was contemplated to be added to DEER which would
include extended hours of operation of high load activity areas, such as clean rooms, a
manufacturing process or a data center, and which utilizes a central chiller as the main cooling
source. However, this prototype was not included in the final DEER2020 release.
3. Updates Based on Methodology and Correction of Errors
3.1. Correction to Commercial Building Activity Areas The commercial building prototypes were updated to align with the DEER2016 commercial
lighting hours-of-use update. The DEER2016 update expanded the definition of activity areas in
the commercial building prototypes and distinguished the hours-of-use of high-bay lighting
systems from low-bay and screw-in lighting systems. The DEER2016 effort was limited to an
update of lighting hours-of-use and coincident demand values, delivered as several tables in a
workbook. Time and resource limitations prevented the update of the underlying commercial
building prototypes for the DEER2016 release. For the DEER2020 update, the commercial
energy simulation prototypes were updated to account for all the lighting systems and activity
areas defined in the DEER2016 update. The lighting systems were also updated to
accommodate the lighting power density (LPD) and baseline updates described in section 3.2
below.
Development of the updated prototypes also led to several changes to the building model
assumptions. Some of these changes were needed to support the expanded activity area
definitions and others are a result of the more flexible modeling framework of the new
prototypes. The notable changes include:
The assembly building has a larger total area; this is needed to accommodate the greater
number of activity areas defined in the DEER2016 update.
The following building types no longer require the entire model to be repeated with
different orientations to make them orientation neutral: all education prototypes,
hospital, nursing home, hotel, motel, and both restaurant prototypes.
The extensive re-development of the prototypes also led to critical review and updates of
several model parameters. These changes, which are listed in the DEER supporting files,
generally will have relatively minor effects on measure impacts.7
7 DEER Supporting Files: DEER2020_Prototype_Changes.xlsx, sheet MscChanges.
Resolution E-4952 October 11, 2018
DEER2020 and Revised DEER2019 Attachment
A-20
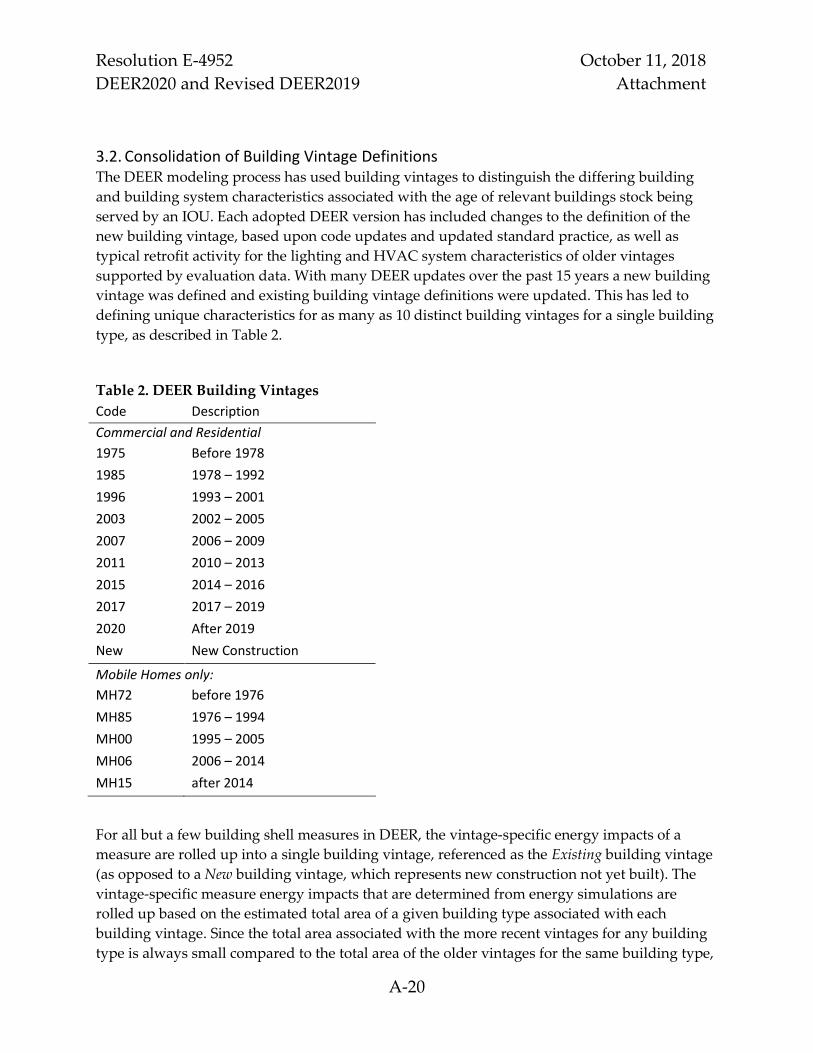
3.2. Consolidation of Building Vintage Definitions The DEER modeling process has used building vintages to distinguish the differing building
and building system characteristics associated with the age of relevant buildings stock being
served by an IOU. Each adopted DEER version has included changes to the definition of the
new building vintage, based upon code updates and updated standard practice, as well as
typical retrofit activity for the lighting and HVAC system characteristics of older vintages
supported by evaluation data. With many DEER updates over the past 15 years a new building
vintage was defined and existing building vintage definitions were updated. This has led to
defining unique characteristics for as many as 10 distinct building vintages for a single building
type, as described in Table 2.
Table 2. DEER Building Vintages
Code Description
Commercial and Residential
1975 Before 1978
1985 1978 – 1992
1996 1993 – 2001
2003 2002 – 2005
2007 2006 – 2009
2011 2010 – 2013
2015 2014 – 2016
2017 2017 – 2019
2020 After 2019
New New Construction
Mobile Homes only:
MH72 before 1976
MH85 1976 – 1994
MH00 1995 – 2005
MH06 2006 – 2014
MH15 after 2014
For all but a few building shell measures in DEER, the vintage-specific energy impacts of a
measure are rolled up into a single building vintage, referenced as the Existing building vintage
(as opposed to a New building vintage, which represents new construction not yet built). The
vintage-specific measure energy impacts that are determined from energy simulations are
rolled up based on the estimated total area of a given building type associated with each
building vintage. Since the total area associated with the more recent vintages for any building
type is always small compared to the total area of the older vintages for the same building type,
Resolution E-4952 October 11, 2018
DEER2020 and Revised DEER2019 Attachment
A-21
the existing vintage is overwhelmingly representative of the older building vintage energy
impacts.
While the older building vintages play the dominant role in determining the existing vintage
measure energy impacts, the building and system characteristics associated with the older
vintages are the most difficult to determine. For the older vintages (1996 and earlier) the age of
the building itself is greater than the effective useful life (EUL) of all the lighting and HVAC
system components within the building. As such, the older vintage buildings are defined with
HVAC and lighting systems that are at or past their EUL. For example, the oldest building
vintage represents buildings more than 40 years old and includes HVAC and lighting systems
that are assumed to have been installed or upgraded 15 to 20 years ago. . For these oldest
vintages, only the building shell is assumed to be typical of 40-year old construction. However,
the building shell may also have been updated in remodeling and retrofit activities, especially
in residential building types.
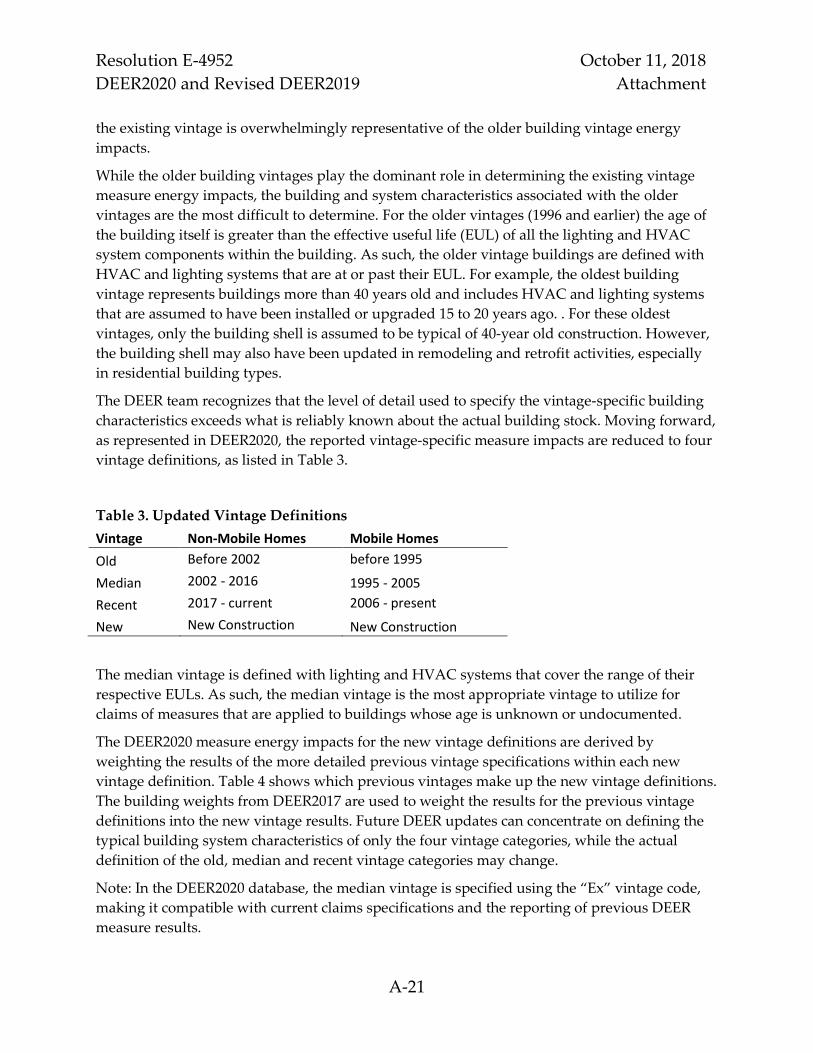
The DEER team recognizes that the level of detail used to specify the vintage-specific building
characteristics exceeds what is reliably known about the actual building stock. Moving forward,
as represented in DEER2020, the reported vintage-specific measure impacts are reduced to four
vintage definitions, as listed in Table 3.
Table 3. Updated Vintage Definitions
Vintage Non-Mobile Homes Mobile Homes
Old Before 2002 before 1995
Median 2002 - 2016 1995 - 2005
Recent 2017 - current 2006 - present
New New Construction New Construction
The median vintage is defined with lighting and HVAC systems that cover the range of their
respective EULs. As such, the median vintage is the most appropriate vintage to utilize for
claims of measures that are applied to buildings whose age is unknown or undocumented.
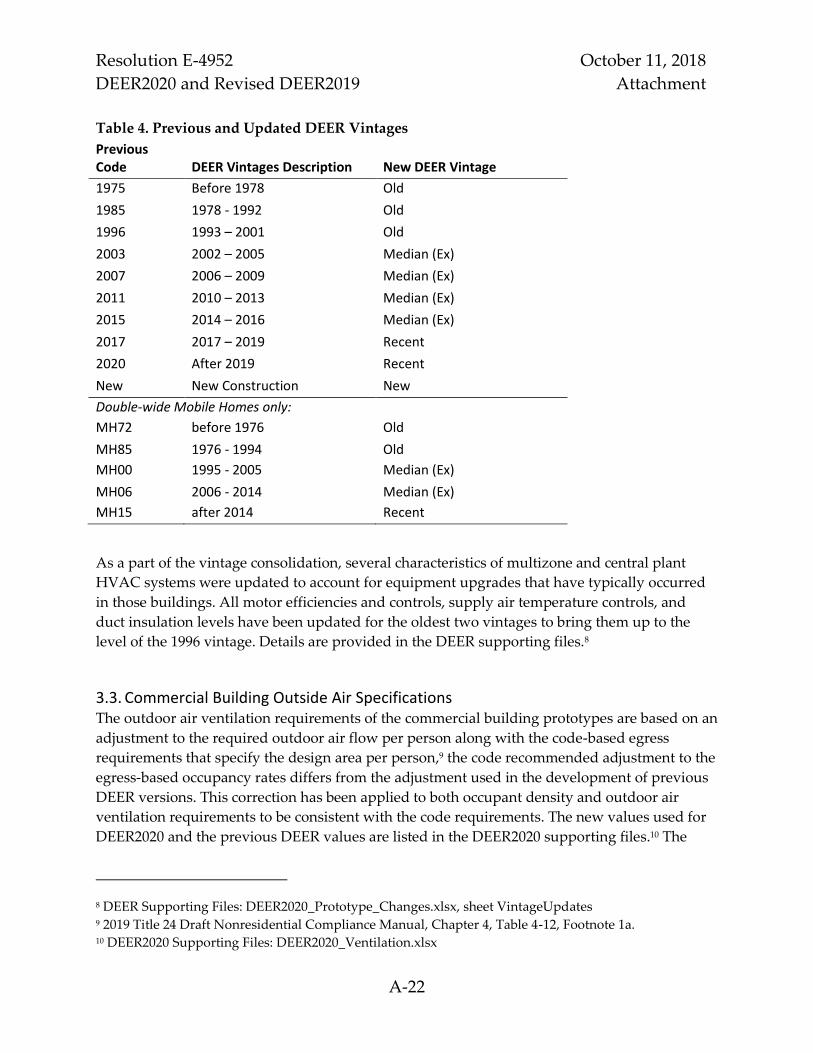
The DEER2020 measure energy impacts for the new vintage definitions are derived by
weighting the results of the more detailed previous vintage specifications within each new
vintage definition. Table 4 shows which previous vintages make up the new vintage definitions.
The building weights from DEER2017 are used to weight the results for the previous vintage
definitions into the new vintage results. Future DEER updates can concentrate on defining the
typical building system characteristics of only the four vintage categories, while the actual
definition of the old, median and recent vintage categories may change.
Note: In the DEER2020 database, the median vintage is specified using the “Ex” vintage code,
making it compatible with current claims specifications and the reporting of previous DEER
measure results.
Resolution E-4952 October 11, 2018
DEER2020 and Revised DEER2019 Attachment
A-22
Table 4. Previous and Updated DEER Vintages
Previous Code DEER Vintages Description New DEER Vintage
1975 Before 1978 Old
1985 1978 - 1992 Old
1996 1993 – 2001 Old
2003 2002 – 2005 Median (Ex)
2007 2006 – 2009 Median (Ex)
2011 2010 – 2013 Median (Ex)
2015 2014 – 2016 Median (Ex)
2017 2017 – 2019 Recent
2020 After 2019 Recent
New New Construction New
Double-wide Mobile Homes only:
MH72 before 1976 Old
MH85 1976 - 1994 Old
MH00 1995 - 2005 Median (Ex)
MH06 2006 - 2014 Median (Ex)
MH15 after 2014 Recent
As a part of the vintage consolidation, several characteristics of multizone and central plant
HVAC systems were updated to account for equipment upgrades that have typically occurred
in those buildings. All motor efficiencies and controls, supply air temperature controls, and
duct insulation levels have been updated for the oldest two vintages to bring them up to the
level of the 1996 vintage. Details are provided in the DEER supporting files.8
3.3. Commercial Building Outside Air Specifications The outdoor air ventilation requirements of the commercial building prototypes are based on an
adjustment to the required outdoor air flow per person along with the code-based egress
requirements that specify the design area per person,9 the code recommended adjustment to the
egress-based occupancy rates differs from the adjustment used in the development of previous
DEER versions. This correction has been applied to both occupant density and outdoor air
ventilation requirements to be consistent with the code requirements. The new values used for
DEER2020 and the previous DEER values are listed in the DEER2020 supporting files.10 The
8 DEER Supporting Files: DEER2020_Prototype_Changes.xlsx, sheet VintageUpdates 9 2019 Title 24 Draft Nonresidential Compliance Manual, Chapter 4, Table 4-12, Footnote 1a. 10 DEER2020 Supporting Files: DEER2020_Ventilation.xlsx
Resolution E-4952 October 11, 2018
DEER2020 and Revised DEER2019 Attachment
A-23
median change in occupant density is a decrease of 25%, and the median change in ventilation
requirement is a 50% increase as compared with previous DEER versions. This will tend to
increase heating and cooling loads, which will result in somewhat greater savings for HVAC
measures, and greater takeback for lighting measures.
3.4. Residential Window Area Residential windows in DEER2017 were oversized by 18% due to an error in the application of
window frame width. The correction will tend to reduce peak cooling and heating loads, and
may increase overall heating in some climates due to a reduction in solar gain.
3.5. Residential Two Speed Fan Power The fan power relationship for two speed AC and HP measures was incorrect in DEER2017. The
correction for DEER2020 results in fan power reduction in the low speed mode of
approximately 15%.
3.6. Chiller Peak Demand Savings and Performance Maps DEER2017 chiller measures included peak demand savings based on an out-of-date demand
period. Additionally, the performance map for the variable speed screw chiller included an
error in the development of the performance curve that sets the chiller power input as a
function of part-load-ratio, entering condenser temperature and leaving chilled water
temperature. The corrections to the DEER2017 chiller measures are covered in the following
files, available from DEEResources.com:
“DEER2017-2018ErrorCorrection-v1-ChillerMeasures_28Sep2018.xlsm” includes
updated impacts for all chiller measures included in the DEER2017 update adopted in
2016.
“DEER2017-2018ErrorCorrection-v2-ChillerMeasures_28Sep2018.xlsm includes updated
impacts for all chiller measures included in the DEER2017 June 2017 update adopted in
2017
“DEER2017-2018ErrorCorrectionChillerModels.7z” includes all eQUEST batch
processing directives and simulation files used to generate chiller impacts.
Resolution E-4952 October 11, 2018
DEER2020 and Revised DEER2019 Attachment
A-24
4. Updates Based on Energy Code (2019 or 2020)
4.1. Water Heater Ratings Change In June of 2017, federal requirements for rating of small and residential use water heaters
changed from Energy Factor (EF) to Uniform Energy Factor (UEF).11 At the time of issuance of
the DEER update Resolution E-4867 in August 2017, available product databases published by
the CEC and The Air Conditioning Heating and Refrigeration Institute (AHRI) did not include
sufficient quantities of UEF rated water heaters to develop typical code baseline and measure
level performance criteria. Therefore, DEER measure definitions were not revised at that time
and instead were left using the older, now obsolete EF ratings.
CPUC staff issued a Phase 1 disposition of workpapers for 2018 that directed PAs to use UEF
for code/ standard practice baseline and measure definitions for small gas storage and small
instantaneous water heaters.12 At the time of the development of the disposition, there were
sufficient numbers of UEF rated water heaters listed in available databases to develop
reasonable code/ standard practice baseline and measure performance criteria for the following
water heater classes:
30, 40 and 50 gallon residential gas storage water heaters with medium and high draw
ratings
Small residential gas tankless water heaters with low, medium and high draw ratings
Based upon the change in rating procedures and the Phase 1 disposition direction it is
appropriate to consider adding UEF rated water heater measures to DEER database in place of
existing obsolete measures. Additionally, the DEER team reviewed available databases of water
heater specifications to determine if additional UEF rated water heater types, updated
code/standard practice and measure performance characteristics and measure efficiency tiers
should be added to DEER. The DEER2020 update includes the following technologies and
measure tiers:
11 The Uniform Energy Factor (UEF) is based on a new method of testing of a water heater that is different
from older methods used to establish an Energy Factor (EF) Similar to EF, UEF methods require a 24-
hour simulated use test (SUT), but unlike the EF method of testing, the new method uses one of four
draw patterns (very low, low, medium, and high) to determine a water heater's UEF. The draw pattern
varies in the following ways: number of draws, length of draws, timing, and flow rates. The
appropriate draw pattern to be used for testing is determine based on a maximum gallon per minute
(tankless water heaters) or first-hour rating test (storage water heaters). The UEF method also uses a
125 deg. F tank setpoint compared to 135 deg. F required for the older EF method. The UEF test
methods have also been expanded over the EF methods to cover many additional products including
heat pump and light commercial water heaters. 12 DEER2020 incorporates analysis used to develop the 2018 Phase 1 disposition for water heaters rated
with Uniform Energy Factor (UEF). The methodology is documented in the Phase 1 disposition
“2018ResidentialWaterHeaters-1March2018.pdf” included in the full disposition archive
“2018ResidentialWaterHeaters-1March2018.zip” available at http://deeresources.net/ on the Workpaper
Disposition Archive page. Search for “D2018-ResidentialWaterHeaters”.
Resolution E-4952 October 11, 2018
DEER2020 and Revised DEER2019 Attachment
A-25
EnergyStar 30, 40 and 50 gallon residential gas storage water heaters with minimum and
high draw ratings
Residential gas tankless water heaters with low, medium and high draw ratings
o EnergyStar rated
o Code/ standard practice efficiency level13
The DEER2020 version of the water heating workbook calculates savings based on UEF, which
will support the PAs efforts to develop addition non-DEER water heating measures. The
DEER2019 water heating analysis is covered in the workbook DEER-WaterHeater-Calculator-
v3.2_rev25Sep2018.xlsm. The DEER2020 water heating analysis is covered in the following files:
“DEER2020 CEC+AHRI_water_heater_binning_for_UEF_calcs.xlsx”: Analysis of CEC
and AHRI databases to determine Code/ standard practice and Measure technology
performance characteristics
“DEER-WaterHeater-Calculator-v3.2.xlsm”: Water heater impacts calculation workbook.
This workbook has been updated to reflect revised measure technology definitions and
updated DEER2020 building population weights by building type, climate zone and
Program Administrator (PA) service territory
4.2. Lighting Baseline Update and Lighting Power Density in Commercial Buildings The recently adopted 2019 California Title 24 Building Energy Standards reduces interior
lighting power allowances based largely on the use of LED technologies.14 The 2016 DEER
update revised the second baseline, used in accelerated replacement measure applications for
all exterior lighting, to be LEDs. The proposed 2019 Title 24 updates indicate that the second
baseline, used in accelerated replacement measure applications for interior lighting, should also
be revised to LEDs.15
Recent Commission staff workpaper dispositions for many types of LED lighting technologies
and collaborative efforts between CPUC staff and PG&E have resulted in the establishment of
all LEDs, (or a significant fraction of LEDs) as the standard practice baseline for Normal
Replacement (NR), New Construction (NC), Capacity Expansion (CE), and Replace-on-Burnout
13 DEER includes measures for Code/ISP level tankless water heaters with a baseline of a storage water
heaters. Savings from these measures are largely attributable to tankless water heaters not having a
storage tank (and operating “on demand”) therefore eliminating standby by losses between the storage
tank and the surrounding space. Since the measure technology efficiency is equal to the Code/ISP level,
little or no savings is due to improved burner efficiency. Therefore, the savings are due to a change in
technology, rather than improvement of efficiency over the baseline technology. 14 See Title 24 2019 Section 140.6 tables B, C, and D, and Section 140.7 tables A and B. 15 Ibid, Note: the second baseline for accelerated replacement is the code effective or standard practice
expected at the end of the remaining useful life of the replaced equipment.
Resolution E-4952 October 11, 2018
DEER2020 and Revised DEER2019 Attachment
A-26
(ROB) measures in exterior, interior high-bay and interior low-bay lighting applications.16 This
direction was effective January 1, 2018 for exterior and parking garage lighting measures, and
April 1, 2018 for interior high and low bay lighting measures. Recent Commission staff
workpaper disposition also updated standard practice baselines for screw-in lamps and can-
retrofits to include fractions of LEDs, effective July 1, 2018.17 Furthermore, the CPUC staff
direction on baselines for NR, NC and ROB measure application types is applicable to both
custom and deemed measures. Development of revised baselines for exterior fixtures is covered
in the workbook “DEER2020-OutdoorLtgGarageUpdate-27Aug2018.xlsx”. Development of
revised baselines for interior high-bay and low-bay lighting fixtures is included in the
workbook “DEER2020-HighLowBayLtgUpdate-27Aug2018.xlsx”.
Prior to this DEER update, most values for annual operating hours of exterior lighting were
developed through workpapers and were not included in DEER. Only general exterior lighting
for residential building types (single family, muti-family and manufactured home) was
included in DEER. For the DEER2020 update, approved workpaper values other exterior
lighting are adopted as part of DEER. Annual operating hours are added for 2019, and
coincident demand factors (CDF) are added for 2020 that align with the revised peak demand
period. Development of outdoor lighting operating hours and CDF values is included in the
workbook “DEER2020-ExtLtgUpdate-27Aug2018”.
The DEER2019 update incorporates the standard practice baselines from the recent dispositions
covering exterior, interior low-bay, interior high-bay, screw-in and can-retrofit lighting.
Measures that are currently identified in the Preliminary Ex Ante Review database (PEARdb)
will be migrated to the Ex Ante database (EAdb) and identified as DEER2019 measures. In
addition to incorporating measures covered by recent workpaper dispositions, DEER2019
updates the standard practice baseline for all other NR, NC, ROB and AR measures to be based
on LED technologies. This includes LED ceiling, troffer and retrofit kits measures that have
previously been defined with T8 linear fluorescent baselines.
The code/ standard practice baseline for ceiling fixture, grid fixtures and retrofit kits assumes a
performance equal to the 25th percentile, in terms of all fixtures in the Lighting Facts database.18
This is the same performance level assumed in the Phase 1 disposition for outdoor and parking
garage lighting. Table 5 shows the results of the performance analysis of six different types of
LED technologies from the Lighting Facts database. Nearly all available technologies exceed an
efficacy level of 100 lumens per watt. Therefore, the code/ standard practice baseline for hard-
wired fixtures that were not previously covered by 2018 Phase 1 dispositions shall be 100
lumens per watt. This level shall apply to all measure application types including accelerated
replacement, normal replacement, and new construction starting January 1, 2019. The detailed
16 See www.deeresources.net file names: “D2018-OutdoorLighting.7z” and “2018OutdoorLightingPhase1-
22May2018-Correct.zip”. 17 See www.deeresources.net file names: “D2018-ScrewInLampSavingsMethods.7z” 18 See https://www.lightingfacts.com/products, the data used for Table 5 was download 20 July 2018

Resolution E-4952 October 11, 2018
DEER2020 and Revised DEER2019 Attachment
A-27
development of the baseline efficacy for ceiling fixtures, grid fixtures and retrofit kits included
in the workbook “DEER2020-LtgFactsAnalysis-TrofferRetroKit-24Aug2018.xlsx”.

Resolution E-4952 October 11, 2018
DEER2020 and Revised DEER2019 Attachment
A-28
Table 5. Performance Analysis of LED Fixtures Te
chn
olo
gy
Size
Cal
cula
tio
n
Per
cen
tile
Output Range (lumens)
0 to
2000
2001 to
3000
3001 to
4000
4001 to
5000
5001 to
6000 >6000
Fixt
ure
1x4
Per
cen
tile
25 99 98 96 101 106 102
50 108 106 103 109 119 114
75 113 115 112 118 127 123
90 118 123 125 126 132 129
Qu
anti
ty
Un
der
25 13 58 148 135 47 27
50 26 115 296 270 92 53
75 39 172 445 405 136 79
90 46 207 530 486 163 95
Qu
anti
ty
Ove
r
25 38 172 442 405 136 79
50 26 115 295 270 93 53
75 14 58 150 135 47 27
90 6 23 59 54 19 11
Fixt
ure
2x2
Per
cen
tile
25 97 92 94 101 107 106
50 105 101 102 109 116 116
75 111 114 114 120 127 128
90 121 125 126 127 132 135
Qu
anti
ty
Un
der
25 20 185 407 274 64 45
50 40 370 814 548 127 89
75 56 553 1220 818 187 133
90 68 663 1465 982 224 159
Qu
anti
ty
Ove
r
25 57 554 1220 819 187 133
50 40 376 814 548 125 89
75 19 185 407 273 63 45
90 10 74 164 110 25 18
Fixt
ure
2x4
Per
cen
tile
25 123 99 100 98 102 100
50 126 108 111 106 111 112
75 127 119 128 123 125 126
90 129 130 132 130 131 133
Qu
anti
ty
Un
der
25 2 23 182 305 225 292
50 3 45 357 610 448 583
75 4 67 543 914 672 879
90 4 82 646 1097 807 1049
Qu
anti
ty
Ove
r
25 4 67 539 914 673 874
50 3 45 357 612 448 583
75 2 23 183 305 224 295
90 1 11 78 122 92 117

Resolution E-4952 October 11, 2018
DEER2020 and Revised DEER2019 Attachment
A-29
Tech
no
logy
Size
Cal
cula
tio
n
Per
cen
tile
Output Range (lumens)
0 to
2000
2001 to
3000
3001 to
4000
4001 to
5000
5001 to
6000 >6000
Ret
rofi
t K
it
1x4
Per
cen
tile
25 109 110 111 111 115 113
50 117 120 117 117 132 118
75 124 130 132 134 133 120
90 135 135 134 134 135 123
Qu
anti
ty
Un
der
25 5 9 10 8 7 2
50 10 18 20 15 13 4
75 17 27 30 22 20 6
90 20 32 37 28 24 7
Qu
anti
ty
Ove
r
25 15 27 30 22 19 6
50 10 18 20 15 13 4
75 6 9 10 8 8 2
90 3 4 6 5 4 1
Ret
rofi
t K
it
2x2
Per
cen
tile
25 109 100 103 105 108 116
50 116 111 112 111 123 122
75 124 122 127 126 132 128
90 125 127 132 130 137 129
Qu
anti
ty
Un
der
25 14 51 52 25 8 4
50 28 103 103 50 15 7
75 42 152 154 73 22 10
90 50 182 184 87 27 13
Qu
anti
ty
Ove
r
25 42 152 154 73 22 10
50 28 109 103 50 15 7
75 14 51 52 25 8 6
90 6 21 21 10 3 3
Ret
rofi
t K
it
2x4
Per
cen
tile
25 84 117 110 110 116 120
50 92 131 126 124 127 127
75 100 143 134 131 135 136
90 105 144 142 136 142 140
Qu
anti
ty
Un
der
25 1 18 61 63 42 31
50 1 35 122 126 84 63
75 1 54 184 188 128 94
90 1 63 219 226 153 110
Qu
anti
ty
Ove
r
25 1 52 183 188 126 92
50 1 35 122 126 84 62
75 1 18 62 63 43 32
90 1 8 25 26 18 13

Resolution E-4952 October 11, 2018
DEER2020 and Revised DEER2019 Attachment
A-30
2019 Codes and Standards Study – Indoor Lighting Power Densities.19 As part of the 2019
update to Title 24, the IOU’s Codes and Standards Indoor Lighting Power Densities study
revised lighting power densities for all building and space types as listed in Table 6. While the
2013 Codes and Standards Study “Indoor Lighting Controls” assumed the use of high
performance lighting technologies including “high performance” linear fluorescent lamps and
reduced light output ballasts, the 2019 Study assumes LED technology for all lighting and as a
result the proposed lighting power density have been significantly reduced. The study not only
proposed to revise lighting power densities, it also proposed to include new building types (e.g.
“Sports arena”) as well as new space types (e.g. for “Aging Eye/Low-vision). The lighting
power densities were determined using on target foot-candles based on guidance form
ASHRAE 90.1-2016, ASHRAE 189.1-2017, the IES handbook and the IES Recommended
Practices. The 2019 Study proposals were adopted into 2019 Title 24.
Table 6. Luminaire Description by Building Type20
Building Type Space Type Description Luminaire Description
All Buildings Medical/Industrial Research Laboratory
Narrow linear LED surface/suspended
Education Laboratory Narrow linear LED surface/suspended
Corridor/Transition Downlight
Classroom/Lecture/Training Linear LDE lensed troffer
Electrical/Mechanical Industrial LED channel – surface or suspended
Dining Area Downlight
Food Preparation Narrow linear LED surface/suspended
Lounge/Recreation Linear LED lensed troffer
Stairway Wall mount linear LED (up/down light)
Stairway Linear LED lensed troffer
Restrooms Wall mount linear LED (up/down light)
Lobby Indirect pendant – Linear LED
Office – Enclosed Linear LED direct/indirect troffer
Office – Open plan Linear LED suspended direct/indirect distribution
19 Codes and Standards Enhancement (CASE) Initiative, 2019 California Building Energy Efficiency
Standards, Indoor Lighting Power Densities – Final Report, August 2017 20 Ibid, Table 4.
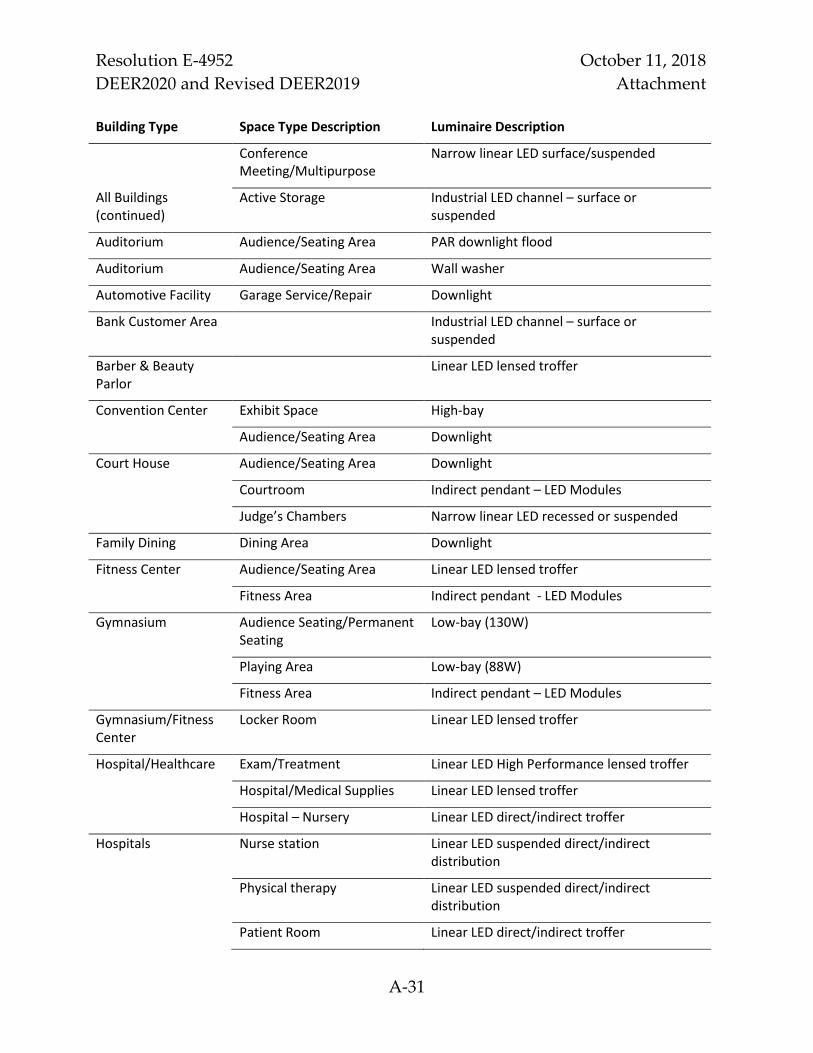
Resolution E-4952 October 11, 2018
DEER2020 and Revised DEER2019 Attachment
A-31
Building Type Space Type Description Luminaire Description
Conference Meeting/Multipurpose
Narrow linear LED surface/suspended
All Buildings (continued)
Active Storage Industrial LED channel – surface or suspended
Auditorium Audience/Seating Area PAR downlight flood
Auditorium Audience/Seating Area Wall washer
Automotive Facility Garage Service/Repair Downlight
Bank Customer Area Industrial LED channel – surface or suspended
Barber & Beauty Parlor
Linear LED lensed troffer
Convention Center Exhibit Space High-bay
Audience/Seating Area Downlight
Court House Audience/Seating Area Downlight
Courtroom Indirect pendant – LED Modules
Judge’s Chambers Narrow linear LED recessed or suspended
Family Dining Dining Area Downlight
Fitness Center Audience/Seating Area Linear LED lensed troffer
Fitness Area Indirect pendant - LED Modules
Gymnasium Audience Seating/Permanent Seating
Low-bay (130W)
Playing Area Low-bay (88W)
Fitness Area Indirect pendant – LED Modules
Gymnasium/Fitness Center
Locker Room Linear LED lensed troffer
Hospital/Healthcare Exam/Treatment Linear LED High Performance lensed troffer
Hospital/Medical Supplies Linear LED lensed troffer
Hospital – Nursery Linear LED direct/indirect troffer
Hospitals Nurse station Linear LED suspended direct/indirect distribution
Physical therapy Linear LED suspended direct/indirect distribution
Patient Room Linear LED direct/indirect troffer
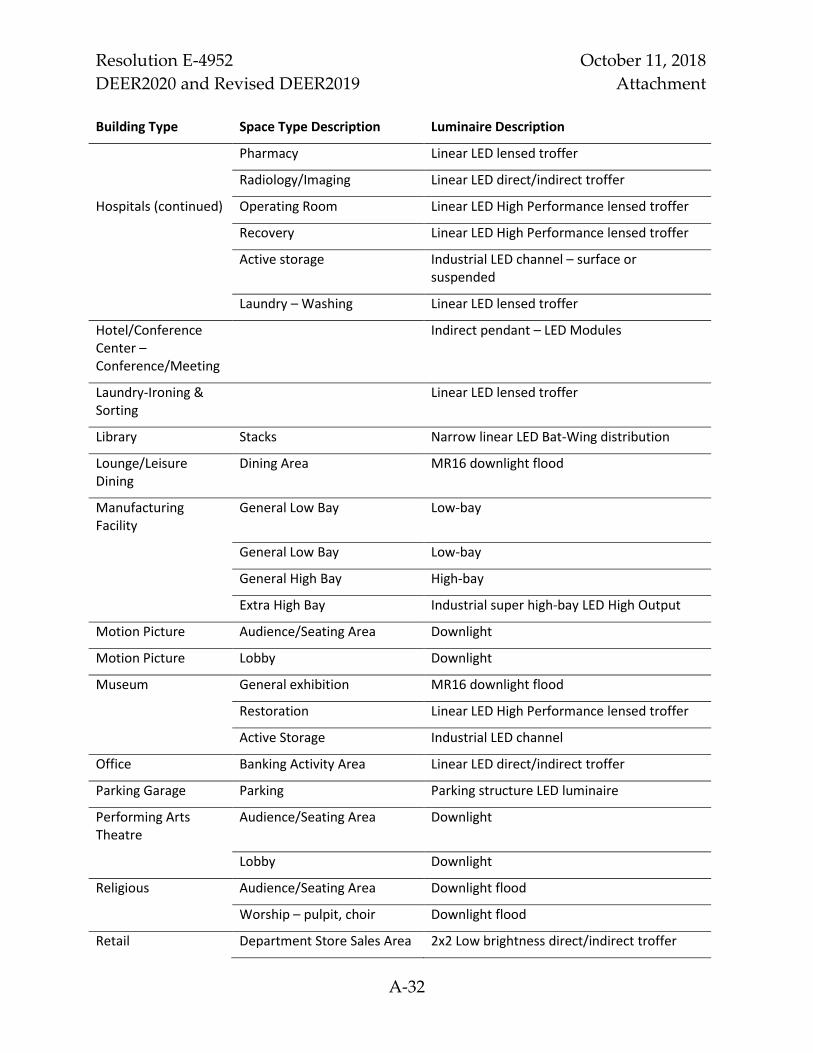
Resolution E-4952 October 11, 2018
DEER2020 and Revised DEER2019 Attachment
A-32
Building Type Space Type Description Luminaire Description
Pharmacy Linear LED lensed troffer
Radiology/Imaging Linear LED direct/indirect troffer
Hospitals (continued) Operating Room Linear LED High Performance lensed troffer
Recovery Linear LED High Performance lensed troffer
Active storage Industrial LED channel – surface or suspended
Laundry – Washing Linear LED lensed troffer
Hotel/Conference Center – Conference/Meeting
Indirect pendant – LED Modules
Laundry-Ironing & Sorting
Linear LED lensed troffer
Library Stacks Narrow linear LED Bat-Wing distribution
Lounge/Leisure Dining
Dining Area MR16 downlight flood
Manufacturing Facility
General Low Bay Low-bay
General Low Bay Low-bay
General High Bay High-bay
Extra High Bay Industrial super high-bay LED High Output
Motion Picture Audience/Seating Area Downlight
Motion Picture Lobby Downlight
Museum General exhibition MR16 downlight flood
Restoration Linear LED High Performance lensed troffer
Active Storage Industrial LED channel
Office Banking Activity Area Linear LED direct/indirect troffer
Parking Garage Parking Parking structure LED luminaire
Performing Arts Theatre
Audience/Seating Area Downlight
Lobby Downlight
Religious Audience/Seating Area Downlight flood
Worship – pulpit, choir Downlight flood
Retail Department Store Sales Area 2x2 Low brightness direct/indirect troffer

Resolution E-4952 October 11, 2018
DEER2020 and Revised DEER2019 Attachment
A-33
Building Type Space Type Description Luminaire Description
Supermarket Sales Area Narrow linear LED surface/suspended
Retail (continued) Mass Merchandising Sales Area
2x4 LED low-brightness direct/indirect basket
Mall Concourse Downlight flood
Dressing/Fitting Room Downlight
Merchandising Sales Area Downlight
Sports Arena Audience/Seating Area Indirect pendant – LED Modules
Class 1 – Court Sports Area High-bay
Class 2 – Court Sports Area High-bay
Class 3 – Court Sports Area Low-bay (130W)
Class 4 – Court Sports Area Low-bay (236W)
Transportation Air/Train/Bus – Baggage Area Narrow linear LED surface/suspended
Terminal – Ticket counter Narrow linear LED surface/suspended
Warehouse Fine Material Industrial LED channel – surface or suspended
Medium/Bulky Material High-bay
Workshop Workshop Industrial LED channel – surface or suspended
2019 Codes and Standards Study – Outdoor Lighting Power Allowances.21 As part of the 2016
update to Title 24, the IOU’s Codes and Standards Enhancement (CASE) program proposed
revisions to Title 24 outdoor lighting power allowances (2016 CASE Outdoor Study). The report
proposed that all lighting power allowances (LPA values) in Title 24 be reduced based on the
standard practice usage of LED technologies. The final adopted Title 24 requirements only
incorporated the recommendations for general hardscape lighting and did not reduce
allowances for additional specialty lighting use categories such as vehicle service stations,
outdoor sales lots, building facades, canopies and tunnels. Rejection of some of the changes was
due to a lack of cost-effectiveness. However, now, all changes proposed in the most recent
CASE Study are cost effective. The proposed changes include general hardscape lighting power
allowance (varying based on the parking surface type for two of the five lighting zones) and for
specific applications.
21 Codes and Standards Enhancement (CASE) Initiative, 2019 California Building Energy Efficiency
Standards, Outdoor Lighting Power Allowances – Final Report, August 2017
Resolution E-4952 October 11, 2018
DEER2020 and Revised DEER2019 Attachment
A-34
2019 Codes and Standards Study- Indoor Lighting Alterations.22 As part of the 2019 update to
Title 24, the IOU’s Codes and Standards Lighting Alterations report proposes that the power of
replacement lighting fixtures, where the entire lighting system is not being redesigned in all
building types be at least 50 percent lower at full light output compared to the replaced
luminaires rather than 50 percent only in office retail and hotel and 35 percent in all other
occupancies in 2016 update.
4.3. Update to Commercial HVAC Specifications Updates in the 2019 Title-24 requirements for commercial buildings include expanded
ventilation (outdoor-air flow) rates by activity area, increased exhaust-air flow rates for some
activity areas and increased values for cooling tower efficiency. These updates, which have been
incorporated into the 2020 DEER building vintage and the new construction DEER building
vintage prototype models, are expected to have minor effects on measure savings. Details of the
updated values are listed in the DEER supporting files.23
4.4. Update to Residential Building Shell Specifications Updates in the 2019 Title-24 requirements for residential buildings include changes to the roof
insulation configuration in single-family buildings along with lower framed wall U-value for
single-family buildings and improved window specifications for single-family and multi-family
buildings.24 These updates have been incorporated into the 2020 DEER building vintage
prototype models. Overall, wall insulation increases about 7%, and window performance
increases about 5%. Attic radiant barrier requirements have been removed from several climate
zones, and roof insulation requirements are slightly more stringent, and will result in reduced
savings from duct loss measures. Details of the updated values are listed in the DEER
supporting files.25
4.5. Net-to-Gross for Lighting Measures As discussed in Section 4.2, DEER updates and several workpaper dispositions have updated
the code and standard practice baselines for lighting measures to include all or a significant
fraction of LEDs. Prior to the DEER2019/2020 update, these updates have covered screw-in
lamps, exterior lighting fixtures, interior high-bay fixtures and interior low-bay fixtures. At this
time, other fixtures such as linear fluorescent retrofit kits, ceiling mounted LED fixtures and
22 Codes and Standards Enhancement (CASE) Initiative, 2019 California Building Energy Efficiency
Standards, Nonresidential Indoor Lighting Alterations – Final Report, August 2017 23 DEER Supporting Files: DEER2020_CodeUpdate.xlsx and DEER2020_Ventilation.xlsx 24 See insulation requirements of Title 24 2019 in Section 150.1(c)1. A. Roof and Ceiling and Section
150.1(c)1. B. Walls. 25 DEER Supporting Files: DEER2020_CodeUpdates.xlsx
Resolution E-4952 October 11, 2018
DEER2020 and Revised DEER2019 Attachment
A-35
ceiling grid fixtures have savings estimates based on linear fluorescent code or standard
practice baselines. This DEER version updates, effective January 1, 2019, baselines for these
remaining lighting fixture types to be entirely LED technologies. With this change, it is
reasonable to raise the NTG value for these measures to 0.91, which is the same value directed
by 2018 Phase 1 workpaper dispositions for exterior, interior high-bay and interior low-bay
fixtures. This NTG value is allowed for only normal replacement (NR) and new construction
(NC) measure application types, and is considered the above-code NTG as described in Section
5.4. Below-code savings are subject to the NTG adjustment factor described in Section 5.4.
5. Policy-Directed Updates Supported by Prior Evaluation Findings
5.1. Net-to-Gross for HVAC Measures Updates to reflect recent ex post evaluations: Since the last DEER update, two new HVAC
evaluation reports have become available for consideration in the DEER2020 update (HVAC126
and HVAC327). HVAC1 reports a NTG value result of 0.64 for commercial upstream package
HVAC programs, while the current DEER value is 0.75. HVAC3 reports an overall NTG for
commercial HVAC maintenance measures of 0.42. In DEER, commercial maintenance measures
receive an NTG of 0.73 for refrigerant charge adjustment and the default of 0.60 for all other
maintenance measures. It a review of SDG&E residential maintenance programs, HVAC3 also
notes that NTG for most residential QM programs is not significantly different from zero. For
residential programs, Commission staff does not believe evaluation results for a single PA
should drive a revision any dramatic reductions to NTG values. Therefore, Commission staff
removes NTG values for residential QM programs, and directs the use of the DEER default
value of 0.55. Table 7 summarizes the revisions to DEER HVAC NTG values.
26 Impact Evaluation of 2015 Upstream HVAC Programs (HVAC 1), prepared for California Public
Utilities Commission, prepared by DNVGL, CALMAC ID CPU0116.03, April 4, 2017. 27 Impact Evaluation of 2015 Commercial Quality Maintenance Programs (HVAC3), prepared for
California Public Utilities Commission, prepared by DNVGL, CALMAC ID CPU0117.03, April 7, 2017.
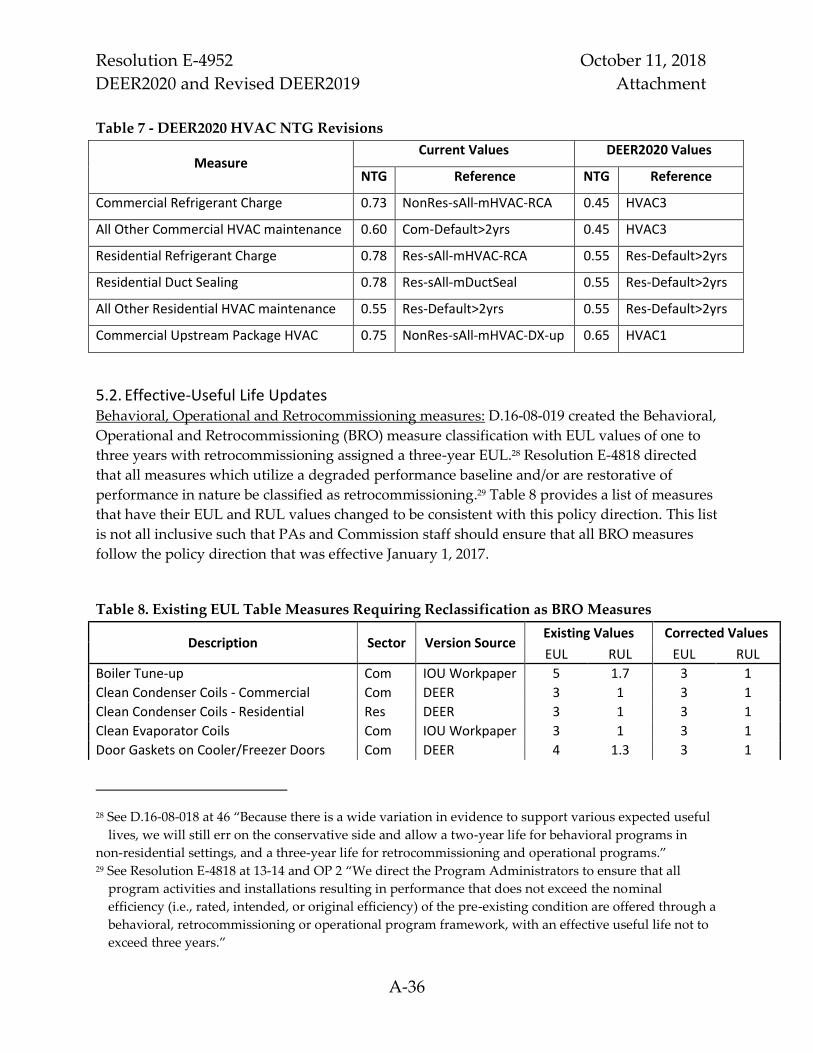
Resolution E-4952 October 11, 2018
DEER2020 and Revised DEER2019 Attachment
A-36
Table 7 - DEER2020 HVAC NTG Revisions
Measure Current Values DEER2020 Values
NTG Reference NTG Reference
Commercial Refrigerant Charge 0.73 NonRes-sAll-mHVAC-RCA 0.45 HVAC3
All Other Commercial HVAC maintenance 0.60 Com-Default>2yrs 0.45 HVAC3
Residential Refrigerant Charge 0.78 Res-sAll-mHVAC-RCA 0.55 Res-Default>2yrs
Residential Duct Sealing 0.78 Res-sAll-mDuctSeal 0.55 Res-Default>2yrs
All Other Residential HVAC maintenance 0.55 Res-Default>2yrs 0.55 Res-Default>2yrs
Commercial Upstream Package HVAC 0.75 NonRes-sAll-mHVAC-DX-up 0.65 HVAC1
5.2. Effective-Useful Life Updates Behavioral, Operational and Retrocommissioning measures: D.16-08-019 created the Behavioral,
Operational and Retrocommissioning (BRO) measure classification with EUL values of one to
three years with retrocommissioning assigned a three-year EUL.28 Resolution E-4818 directed
that all measures which utilize a degraded performance baseline and/or are restorative of
performance in nature be classified as retrocommissioning.29 Table 8 provides a list of measures
that have their EUL and RUL values changed to be consistent with this policy direction. This list
is not all inclusive such that PAs and Commission staff should ensure that all BRO measures
follow the policy direction that was effective January 1, 2017.
Table 8. Existing EUL Table Measures Requiring Reclassification as BRO Measures
Description Sector Version Source Existing Values Corrected Values
EUL RUL EUL RUL
Boiler Tune-up Com IOU Workpaper 5 1.7 3 1
Clean Condenser Coils - Commercial Com DEER 3 1 3 1
Clean Condenser Coils - Residential Res DEER 3 1 3 1
Clean Evaporator Coils Com IOU Workpaper 3 1 3 1
Door Gaskets on Cooler/Freezer Doors Com DEER 4 1.3 3 1
28 See D.16-08-018 at 46 “Because there is a wide variation in evidence to support various expected useful
lives, we will still err on the conservative side and allow a two-year life for behavioral programs in
non-residential settings, and a three-year life for retrocommissioning and operational programs.” 29 See Resolution E-4818 at 13-14 and OP 2 “We direct the Program Administrators to ensure that all
program activities and installations resulting in performance that does not exceed the nominal
efficiency (i.e., rated, intended, or original efficiency) of the pre-existing condition are offered through a
behavioral, retrocommissioning or operational program framework, with an effective useful life not to
exceed three years.”
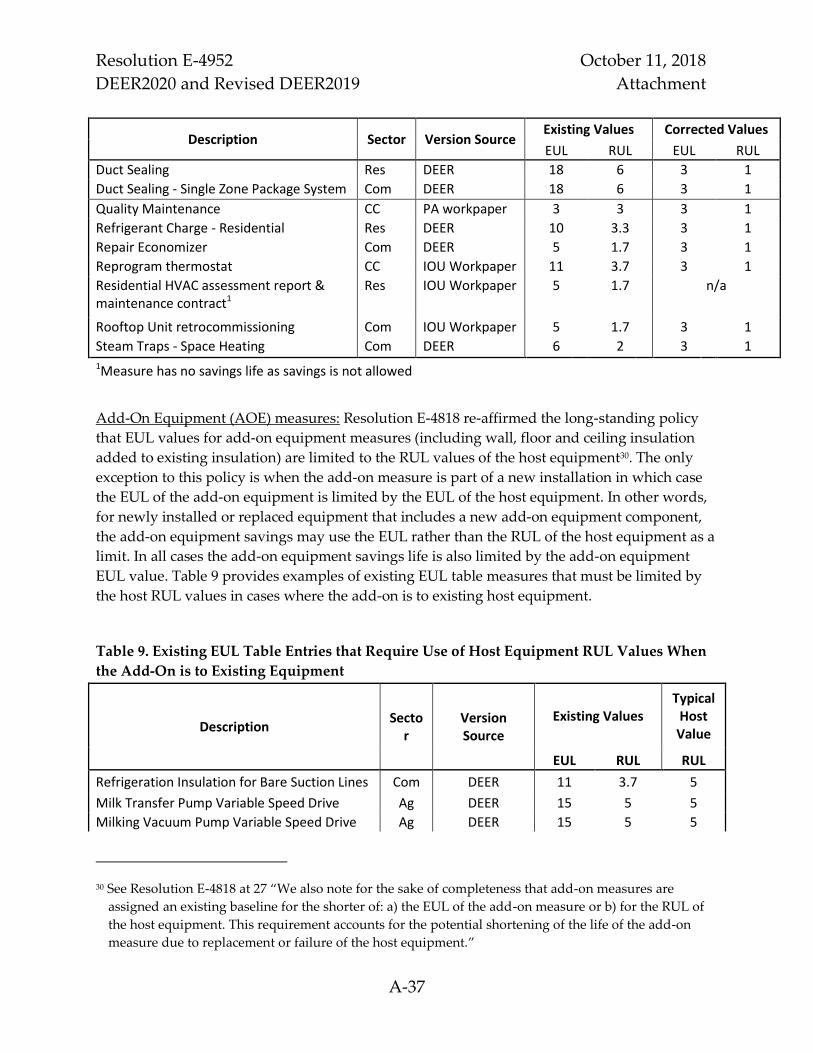
Resolution E-4952 October 11, 2018
DEER2020 and Revised DEER2019 Attachment
A-37
Description Sector Version Source Existing Values Corrected Values
EUL RUL EUL RUL
Duct Sealing Res DEER 18 6 3 1
Duct Sealing - Single Zone Package System Com DEER 18 6 3 1
Quality Maintenance CC PA workpaper 3 3 3 1
Refrigerant Charge - Residential Res DEER 10 3.3 3 1
Repair Economizer Com DEER 5 1.7 3 1
Reprogram thermostat CC IOU Workpaper 11 3.7 3 1
Residential HVAC assessment report & maintenance contract1
Res IOU Workpaper 5 1.7 n/a
Rooftop Unit retrocommissioning Com IOU Workpaper 5 1.7 3 1
Steam Traps - Space Heating Com DEER 6 2 3 1 1Measure has no savings life as savings is not allowed
Add-On Equipment (AOE) measures: Resolution E-4818 re-affirmed the long-standing policy
that EUL values for add-on equipment measures (including wall, floor and ceiling insulation
added to existing insulation) are limited to the RUL values of the host equipment30. The only
exception to this policy is when the add-on measure is part of a new installation in which case
the EUL of the add-on equipment is limited by the EUL of the host equipment. In other words,
for newly installed or replaced equipment that includes a new add-on equipment component,
the add-on equipment savings may use the EUL rather than the RUL of the host equipment as a
limit. In all cases the add-on equipment savings life is also limited by the add-on equipment
EUL value. Table 9 provides examples of existing EUL table measures that must be limited by
the host RUL values in cases where the add-on is to existing host equipment.
Table 9. Existing EUL Table Entries that Require Use of Host Equipment RUL Values When
the Add-On is to Existing Equipment
Description Secto
r Version Source
Existing Values Typical
Host Value
EUL RUL RUL
Refrigeration Insulation for Bare Suction Lines Com DEER 11 3.7 5
Milk Transfer Pump Variable Speed Drive Ag DEER 15 5 5
Milking Vacuum Pump Variable Speed Drive Ag DEER 15 5 5
30 See Resolution E-4818 at 27 “We also note for the sake of completeness that add-on measures are
assigned an existing baseline for the shorter of: a) the EUL of the add-on measure or b) for the RUL of
the host equipment. This requirement accounts for the potential shortening of the life of the add-on
measure due to replacement or failure of the host equipment.”
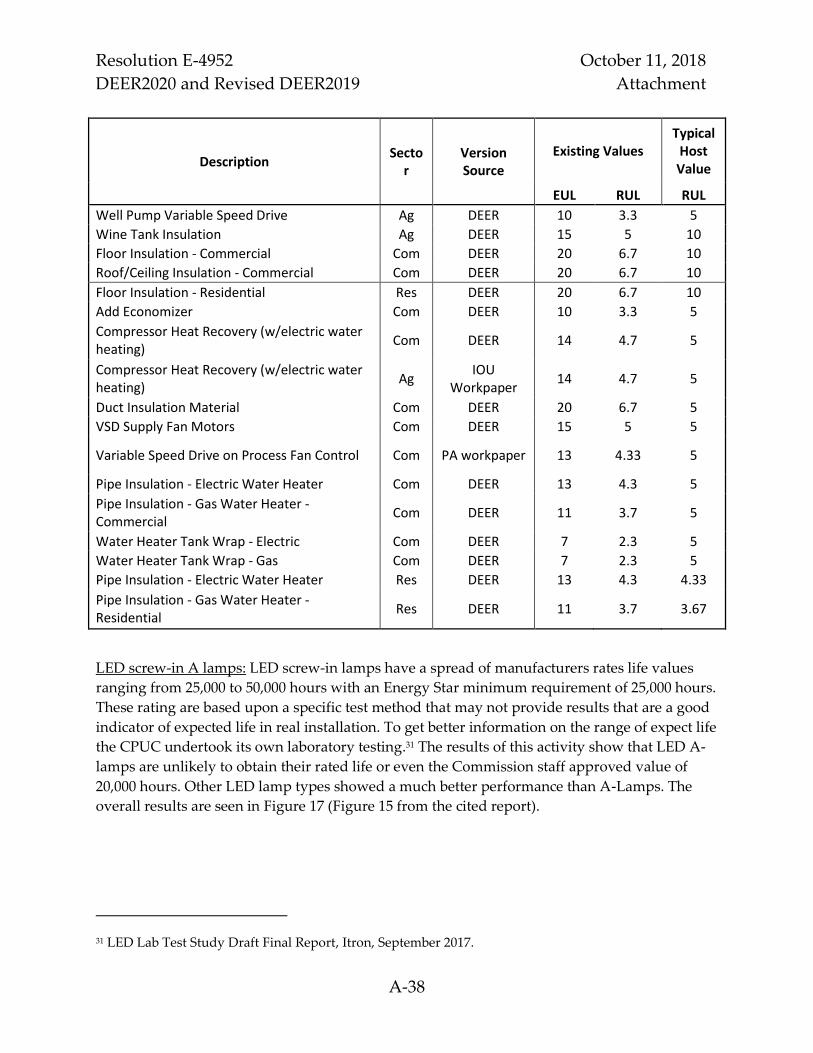
Resolution E-4952 October 11, 2018
DEER2020 and Revised DEER2019 Attachment
A-38
Description Secto
r Version Source
Existing Values Typical
Host Value
EUL RUL RUL
Well Pump Variable Speed Drive Ag DEER 10 3.3 5
Wine Tank Insulation Ag DEER 15 5 10
Floor Insulation - Commercial Com DEER 20 6.7 10
Roof/Ceiling Insulation - Commercial Com DEER 20 6.7 10
Floor Insulation - Residential Res DEER 20 6.7 10
Add Economizer Com DEER 10 3.3 5
Compressor Heat Recovery (w/electric water heating)
Com DEER 14 4.7 5
Compressor Heat Recovery (w/electric water heating)
Ag IOU
Workpaper 14 4.7 5
Duct Insulation Material Com DEER 20 6.7 5
VSD Supply Fan Motors Com DEER 15 5 5
Variable Speed Drive on Process Fan Control Com PA workpaper 13 4.33 5
Pipe Insulation - Electric Water Heater Com DEER 13 4.3 5
Pipe Insulation - Gas Water Heater - Commercial
Com DEER 11 3.7 5
Water Heater Tank Wrap - Electric Com DEER 7 2.3 5
Water Heater Tank Wrap - Gas Com DEER 7 2.3 5
Pipe Insulation - Electric Water Heater Res DEER 13 4.3 4.33
Pipe Insulation - Gas Water Heater - Residential
Res DEER 11 3.7 3.67
LED screw-in A lamps: LED screw-in lamps have a spread of manufacturers rates life values
ranging from 25,000 to 50,000 hours with an Energy Star minimum requirement of 25,000 hours.
These rating are based upon a specific test method that may not provide results that are a good
indicator of expected life in real installation. To get better information on the range of expect life
the CPUC undertook its own laboratory testing.31 The results of this activity show that LED A-
lamps are unlikely to obtain their rated life or even the Commission staff approved value of
20,000 hours. Other LED lamp types showed a much better performance than A-Lamps. The
overall results are seen in Figure 17 (Figure 15 from the cited report).
31 LED Lab Test Study Draft Final Report, Itron, September 2017.
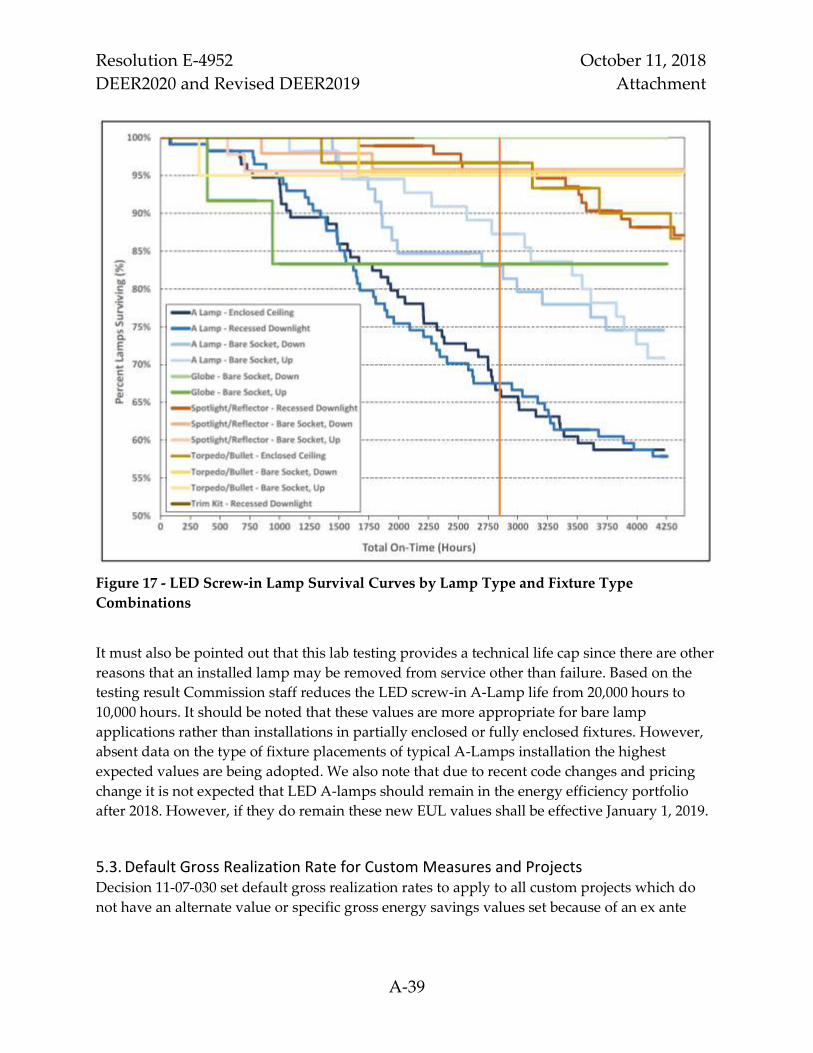
Resolution E-4952 October 11, 2018
DEER2020 and Revised DEER2019 Attachment
A-39
Figure 17 - LED Screw-in Lamp Survival Curves by Lamp Type and Fixture Type
Combinations
It must also be pointed out that this lab testing provides a technical life cap since there are other
reasons that an installed lamp may be removed from service other than failure. Based on the
testing result Commission staff reduces the LED screw-in A-Lamp life from 20,000 hours to
10,000 hours. It should be noted that these values are more appropriate for bare lamp
applications rather than installations in partially enclosed or fully enclosed fixtures. However,
absent data on the type of fixture placements of typical A-Lamps installation the highest
expected values are being adopted. We also note that due to recent code changes and pricing
change it is not expected that LED A-lamps should remain in the energy efficiency portfolio
after 2018. However, if they do remain these new EUL values shall be effective January 1, 2019.
5.3. Default Gross Realization Rate for Custom Measures and Projects Decision 11-07-030 set default gross realization rates to apply to all custom projects which do
not have an alternate value or specific gross energy savings values set because of an ex ante

Resolution E-4952 October 11, 2018
DEER2020 and Revised DEER2019 Attachment
A-40
review process disposition.32 This value was chosen for the 2010-2012 program years as the
Commission decided there were no recent evaluation results to support an alternate value.
Decision 12-05-015 recounted the 2006-2008 overall custom project gross realization rates varied
by utility, but were generally between .55 and .80 across energy savings values and utility.33
However, the use of a single set of evaluation results for the three-year recent program cycle
was not considered sufficient evidence considering that the utilities and their implementer may
have implemented program changes to address the issue.34 For these reasons the use of a 0.90
gross realization rate default value was retained for the 2013-2014 program years pending more
evaluation results.35
Results for the 2010-2012 and 2013-2015 program cycle evaluations are now available, in
addition to the 2006-2008 gross realization rate values previously discussed in D.12-05-015. The
most recent results, from program years 2013-2015 discussed below, indicate that, overall, the
gross realization rates for the custom program activities have not improved but instead have
decreased further in some cases.
We also note that there was limited direction in the past on the use of gross realization rates for
custom projects. It was generally accepted that projects subject to ex ante review would have
the values resulting from that review applied to both customer and implementer incentive
payments as well as utility claims filed with the Commission. However, when no ex ante review
was performed and the default gross realization rate was applied, the utilities have not used the
savings values adjusted by the gross realization rates for any incentive calculation, but rather
just for reporting to the Commission. The intention of the ex ante adjustment was to ensure that
both reported values were accurate, and that incentive payment were more reflective of the
eventual evaluated results.
The most recent, as well as the weighted average of three most recent years’ non-residential
custom evaluation results for both first year and lifecycle gross realization rates, are in Table 10
below. Each of these values is below the default gross realization rate of 0.90.
32 D.11-07-030 at 37. The CPUC staff recommended values of 0.7-0.8 were not adequately supported by
evidence and the IOU recommended value of 1.0 was also not supported by evidence. At the time there
were not yet final evaluation reports available for the most recent three years of custom program
offering. 33 See D.12-05-015 at 343 table 1. 34 D.12-05-015 at 343 “As noted above, in comments the utilities and others claim in their comments that
changes have already been made to program rules and implementation activities to raise these values.
However, we have not been provided quantitative evidence that supports claims.” And at 344 “We
expect the utilities to respond to Commission Staff reviews by taking steps to change the program
activities to improve both gross and net results. “ 35 D.12-05-015 at 344 “Additionally, we direct the utilities to make programmatic changes to their custom
programs per the recommendations and findings in recent evaluation studies. However, we retain the
current default Gross Realization Rate (GRR) value of 0.90 for use in the 2013-2014 transition portfolio.”

Resolution E-4952 October 11, 2018
DEER2020 and Revised DEER2019 Attachment
A-41
Table 10. 2013-2015 Non-Residential Custom Evaluation Results for Gross Realization Rates
First Year Gross Realization Rate Lifecycle Gross Realization Rate
IOU kW kWh Therm kW kWh Therm
IALC 2015
Evaluation
Results36
PG&E 0.64 0.54 0.54 0.50 0.47 0.47
SCE 0.50 0.55 0.55 0.40 0.41 0.41
SDG&E 0.77 0.51 0.52 0.73 0.47 0.47
SoCalGas 0.51 0.50
IALC 2013-2015
Weighted
Evaluation
Results37
PG&E 0.75 0.68 0.68 0.74 0.64 0.64
SCE 0.54 0.57 0.57 0.46 0.48 0.48
SDG&E 0.79 0.68 0.68 0.80 0.62 0.62
SoCalGas
0.61
0.52
Custom
Lighting 2015
Evaluation
Results38
PG&E 0.85 0.79 0.79 0.85 0.84 0.84
SCE 0.96 0.79 0.79 1.07 0.85 0.85
SDG&E 0.69 0.74 0.74 0.44 0.67 0.67
Custom
Lighting 2013-
2015 Evaluation
Results39
PG&E 0.84 0.79 0.79 0.75 0.72 0.72
SCE 0.80 0.77 0.77 0.73 0.76 0.76
SDG&E 0.82 0.82 0.82 0.67 0.67
The primary residential custom activities are through the single family and multi-family home
upgrade programs. The results from the most recent evaluations of these programs are
presented in Table 11.40 Although these evaluations also indicate low gross realization rates,
residential custom offerings in program shall also retain the 0.90 default value until recent
Commission Staff-led evaluation results are available, at which time the DEER will be updated.
36 2015 CUSTOM IMPACT EVAL UATION INDUSTRIAL, AGRICULTURAL, AND LARGE
COMMERCIAL, Final Appendices, Itron, May 3, 2017 37 2013-2015 Ex-Post Evaluation Study for IALC Claims, Itron, 2017-12-18 38 2015 Nonresidential ESPI Custom Lighting Impact Evaluation, April 2017 39 Weighted average of values from 2015 Nonresidential ESPI Custom Lighting Impact Evaluation, April
2017, 2014 Nonresidential Downstream Custom ESPI Lighting Impact Evaluation Report, March 2016,
and 2013 Nonresidential Downstream Custom Lighting Impact Evaluation Report, Itron, March 2015 40 2015 Home Upgrade Program Impact Evaluation, DNV-GL, June 2017 and 2015 Multifamily Focused
Impact Evaluation, DNV-GL, June 2017

Resolution E-4952 October 11, 2018
DEER2020 and Revised DEER2019 Attachment
A-42
Table 11. Residential Home Upgrade 2015 Custom Evaluation Results
Residential Single Family Home Upgrade Multi-Family Home Upgrade1
IOU kW kWh Therm kW kWh Therm
Evaluation Gross Realization Rate
PG&E 0.25 0.12 0.10 0.01 0.00 0.62
SCE 0.24 0.21 0.48 044 0.36
SDG&E 0.18 0.24 0.21 0.85 0.85 0.85
SoCalGas 0.12 0.36
Statewide 0.25 0.14 0.11 0.19 0.09 0.61
Notes for Table 11: 1 Multi-family evaluation sample included three electric plus gas
sites and three gas only sites for PG&E, one electric and gas site for SCE/SCG, two
electric plus gas sites for SDG&E.
Although an update to the default gross realization rate for custom measures and projects is
within the scope of this Resolution, Staff determined that the values established by Decision
12-05-015 may not be modified through Resolution, thus remain 0.90 at this time.
5.4. Net-to-Gross for Accelerated Replacement Measure Decision 16-08-019 and Resolution E-4818 established an expanded framework for applying the
accelerated replacement dual baseline approach where savings are estimated above the existing
baseline for the RUL and above the standard practice or code baseline for the post-RUL period
(equal to the EUL minus the RUL of the replaced equipment). Historically, evaluation results at
either the measure level or program activity level have been presented as a single net-to-gross
value that was not differentiated based on the measure application type (such as accelerated
replacement or normal replacement) or baseline (i.e. existing conditions, standard practice or
code). The most recent “Energy Efficiency Potential and Goals Study for 2018 and Beyond”
(Potential Study) notes that savings for equipment “that is turning over on a regular basis has
its below-code savings already captured through [codes and standards].”41 Next, the Potential
Study considers the possibility of free ridership in the below-code savings (the savings
occurring during the remaining useful life – or RUL – of the early removed equipment). In other
words, some portion of the early replaced equipment (a fraction of the installations and
resultant “to-code” savings) was likely influenced by factors other than a PA’s efficiency
program. The decision to replace equipment prior to the end of its ability to provide the desired
41 D.17-09-025 OP 1: “We adopt energy efficiency goals for 2018 and beyond based on the modified Total
Resource Cost with a greenhouse gas adder that reflects the State’s 2030 greenhouse gas reduction
goals, referred to as the “mTRC (GHG Adder #1) Reference” scenario in the final draft of the post-2017
Potential Study.” Appendix 1: “Energy Efficiency Potential and Goals Study for 2018 and Beyond Final
Public Report” prepared for California Public Utilities Commission” by Navigant Consulting, Inc.
September 25, 2017. See pages 17-20 for adopted method to address the above-code and to-code portion
of a measure NTG value.

Resolution E-4952 October 11, 2018
DEER2020 and Revised DEER2019 Attachment
A-43
service is considered separate from a customer choice to purchase equipment that exceeds code
or standard practice efficiency levels. Therefore, the above-code and to-code portion of the
savings require separate treatment in the NTG determination. Figure 18, from the Potential
Study, illustrates the difference between below-code and above code free ridership.
Figure 18 - Below-Code NTG Illustration42
PA energy efficiency programs will likely have little influence over a decision toward
accelerated replacement if the incentives are small relative to the overall cost of the project, such
as HVAC equipment replacements or larger home upgrade projects. On the other hand,
programs oriented toward replacement “Stranded Potential” may have a lower incidence of free
ridership since the program is targeting a specific population who are not motivated on their
own to replace inefficient equipment.43 Nevertheless, NTG values for below-code savings must
42 See Figure 7 on page 18: “Energy Efficiency Potential and Goals Study for 2018 and Beyond Final Public
Report” prepared for California Public Utilities Commission” by Navigant Consulting, Inc. September
25, 2017. 43 The Potential Study defines Stranded Potential as “the opportunities for energy efficiency that are not
currently captured by either PA rebate programs or codes and standards. Stranded Potential is below-
code savings that is not materializing in the market because there is no incentive for the customer to
upgrade their existing equipment given current program rebate policy. Under AB802, PAs could start
offering rebates for bringing existing equipment up to code thus motivating a whole new subset of
customers to install energy efficiency and capturing the Stranded Potential.”

Resolution E-4952 October 11, 2018
DEER2020 and Revised DEER2019 Attachment
A-44
represent an average of the entire market, similar to past CPUC methods for developing
forward looking NTG values.
The Potential Study included an adjustment factor applied to the below-code savings as shown
in the equation below:
NTGBC = NTGAC x NTGAdjustment Factor
The Potential Study recommended the following below-code adjustment factors:
data centers: 0.25
HVAC: 0.50
Lighting: 0.75
Water Heating: 0.50
All others: 0.50
There are few if any evaluations or analyses that have been focused on identifying specific free-
ridership aspects of accelerated replacement decisions. Commission staff recommends a 0.50
default adjustment factor for all measure types. The DEER team notes that direction in
Resolution E-4818 retains previous direction that an accelerated replacement assignment may
be utilized whenever there is a preponderance of evidence (PoE) that the program activity
caused the replacement to be accelerated.
The preponderance of evidence standard requires the examination of evidence in both
directions (supporting and refuting the program influence and likely continued in-place service
of the equipment to be replaced) and making the determination that the program induced
replacement is more likely than not correct. This PoE standard only requires a 50% probability
that the accelerated retirement assignment is correct. We thus establish an adjustment factor of
0.75 for accelerated replacement to be applied to all NTG values for the below-code portion of
savings. This is a default value, and alternative values may be proposed as part of a workpaper
or for a custom project if that project is undergoing an ex ante review by Commission staff.
In both these cases an explicit disposition issued by Commission staff must be provided that
accepts the proposed alternate. A proposed alternate is not allowed unless explicitly review and
approved by Commission staff. In other words, passed thought workpaper and custom project
alternative values are not allowed.
It should be noted that the overall lifecycle NTG for accelerated replacement project will
depend on the combination of first and second period savings, the RUL and EUL and the
above-code NTG and the accelerated replacement NTG adjustment factor. So there are no
overall accelerated replacement NTG values in the NTG table as this value would be calculated,
automatically, using the above-code NTG, the adjustment factor and the other savings values
mentioned previously.
5.5. Net-to-Gross for Normalized Metered Energy Consumption Projects Projects that use Normalized Metered Energy Consumption (NMEC) to calculate energy
savings are authorized to utilize an existing conditions baseline for energy savings
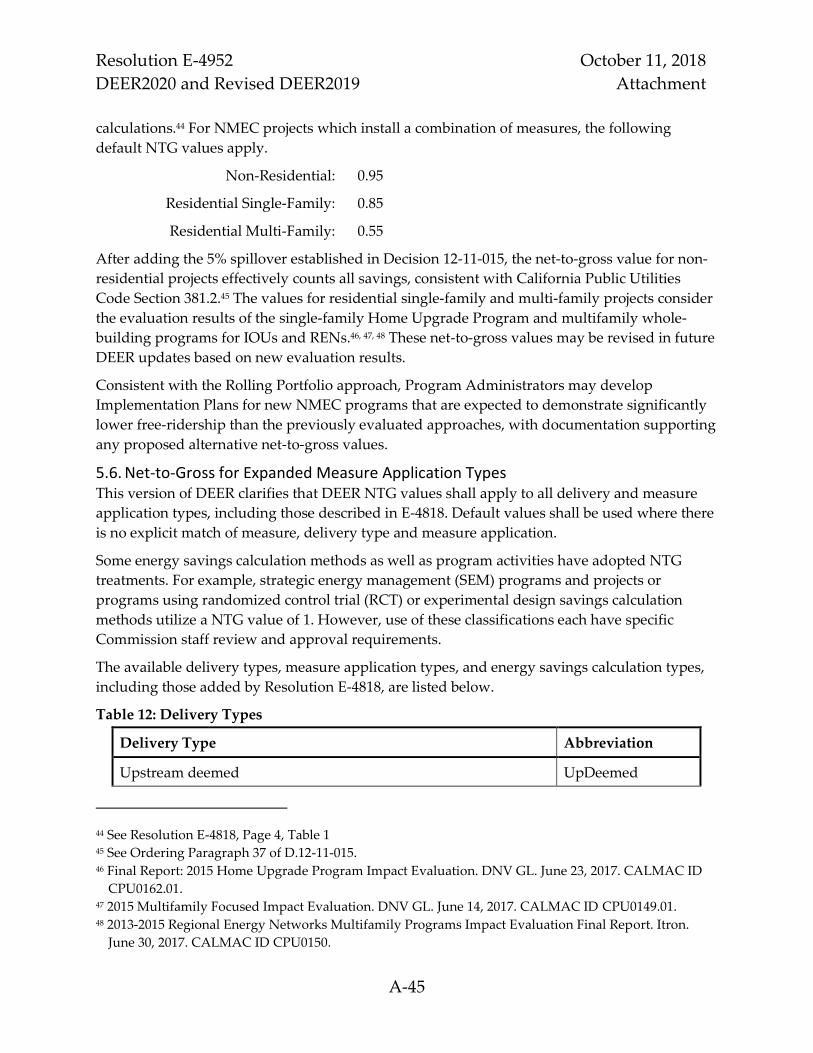
Resolution E-4952 October 11, 2018
DEER2020 and Revised DEER2019 Attachment
A-45
calculations.44 For NMEC projects which install a combination of measures, the following
default NTG values apply.
Non-Residential: 0.95
Residential Single-Family: 0.85
Residential Multi-Family: 0.55
After adding the 5% spillover established in Decision 12-11-015, the net-to-gross value for non-
residential projects effectively counts all savings, consistent with California Public Utilities
Code Section 381.2.45 The values for residential single-family and multi-family projects consider
the evaluation results of the single-family Home Upgrade Program and multifamily whole-
building programs for IOUs and RENs.46, 47, 48 These net-to-gross values may be revised in future
DEER updates based on new evaluation results.
Consistent with the Rolling Portfolio approach, Program Administrators may develop
Implementation Plans for new NMEC programs that are expected to demonstrate significantly
lower free-ridership than the previously evaluated approaches, with documentation supporting
any proposed alternative net-to-gross values.
5.6. Net-to-Gross for Expanded Measure Application Types This version of DEER clarifies that DEER NTG values shall apply to all delivery and measure
application types, including those described in E-4818. Default values shall be used where there
is no explicit match of measure, delivery type and measure application.
Some energy savings calculation methods as well as program activities have adopted NTG
treatments. For example, strategic energy management (SEM) programs and projects or
programs using randomized control trial (RCT) or experimental design savings calculation
methods utilize a NTG value of 1. However, use of these classifications each have specific
Commission staff review and approval requirements.
The available delivery types, measure application types, and energy savings calculation types,
including those added by Resolution E-4818, are listed below.
Table 12: Delivery Types
Delivery Type Abbreviation
Upstream deemed UpDeemed
44 See Resolution E-4818, Page 4, Table 1 45 See Ordering Paragraph 37 of D.12-11-015. 46 Final Report: 2015 Home Upgrade Program Impact Evaluation. DNV GL. June 23, 2017. CALMAC ID
CPU0162.01. 47 2015 Multifamily Focused Impact Evaluation. DNV GL. June 14, 2017. CALMAC ID CPU0149.01. 48 2013-2015 Regional Energy Networks Multifamily Programs Impact Evaluation Final Report. Itron.
June 30, 2017. CALMAC ID CPU0150.
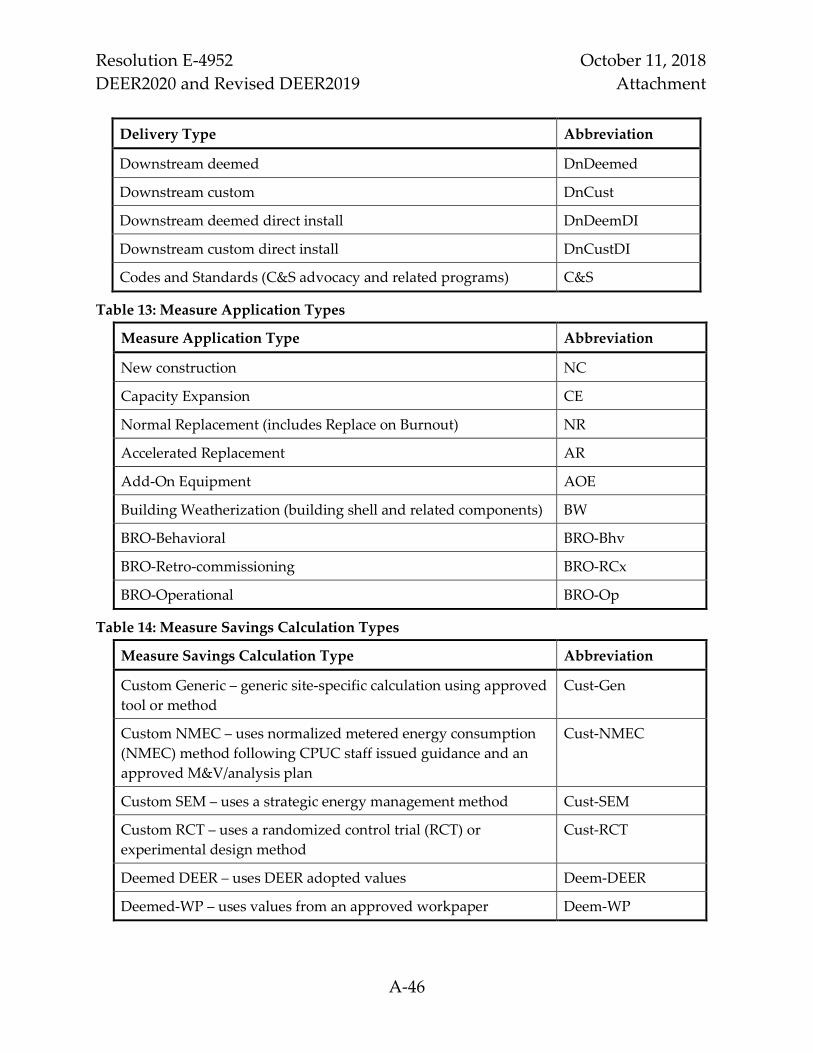
Resolution E-4952 October 11, 2018
DEER2020 and Revised DEER2019 Attachment
A-46
Delivery Type Abbreviation
Downstream deemed DnDeemed
Downstream custom DnCust
Downstream deemed direct install DnDeemDI
Downstream custom direct install DnCustDI
Codes and Standards (C&S advocacy and related programs) C&S
Table 13: Measure Application Types
Measure Application Type Abbreviation
New construction NC
Capacity Expansion CE
Normal Replacement (includes Replace on Burnout) NR
Accelerated Replacement AR
Add-On Equipment AOE
Building Weatherization (building shell and related components) BW
BRO-Behavioral BRO-Bhv
BRO-Retro-commissioning BRO-RCx
BRO-Operational BRO-Op
Table 14: Measure Savings Calculation Types
Measure Savings Calculation Type Abbreviation
Custom Generic – generic site-specific calculation using approved
tool or method
Cust-Gen
Custom NMEC – uses normalized metered energy consumption
(NMEC) method following CPUC staff issued guidance and an
approved M&V/analysis plan
Cust-NMEC
Custom SEM – uses a strategic energy management method Cust-SEM
Custom RCT – uses a randomized control trial (RCT) or
experimental design method
Cust-RCT
Deemed DEER – uses DEER adopted values Deem-DEER
Deemed-WP – uses values from an approved workpaper Deem-WP

Resolution E-4952 October 11, 2018
DEER2020 and Revised DEER2019 Attachment
A-47
Note on deemed values: a deemed must be taken from a DEER version or workpaper
effective at the earlier of permit issuance (if the installation requires a permit or approval
from a regulatory agency) or installation completion.
5.7. Net-to-Gross for Direct-Install Delivery to Hard-to-Reach Customers Decision 18-05-041 reaffirmed the Resolution G-3497 clarified definition of hard-to-reach
customers49 and added a second geographic criteria to that definition50 with the currently
adopted version of the definition as recounted below. It must be noted that the definition of
hard-to-reach is for a customer not a building. Thus, the designation of business versus
residential refers to the customer not the installation site. For example, a multi-family building
may be occupied by residential customer while the building is owned by a business. If a
measure is installed into a site owned by a business while occupied by either one or more
business or residential customers, the ratepayer customer who pays for the energy use impacted
by the measure installation is the customer to consider when applying the hard-to-reach
definition below.
Decision 18-05-014 definition of hard-to-reach customers
Specific criteria were developed by staff to be used in classifying a customer as hard-to-reach.
Two criteria are considered sufficient if one of the criteria met is the geographic criteria defined
below. There are common, as well as separate, criteria when defining hard-to-reach for
residential versus small business customers. The barriers common to both include:
• Those customers who do not have easy access to program information or generally do
not participate in energy efficiency programs due to a combination of language, business
size, geographic, and lease (split incentive) barriers. These barriers to consider include:
o Language – Primary language spoken is other than English, and/or
o Geographic –
1) Businesses or homes in areas other than the United States Office of Management
and Budget Combined Statistical Areas of the San Francisco Bay Area, the
Greater Los Angeles Area and the Greater Sacramento Area or the Office of
Management and Budget metropolitan statistical areas of San Diego County; or
2) Businesses or homes in disadvantaged communities, as identified by CalEPA
pursuant to Health and Safety Code Section 39711.
• For small business added criteria to the above to consider:
o Business Size – Less than ten employees and/or classified as Very Small (Customers
whose annual electric demand is less than 20kW, or whose annual gas consumption
is less than 10,000 therm, or both) , and/or
49 D.18-05-041 at 42. 50 D.18-05-041 at 48 and FOF 14.

Resolution E-4952 October 11, 2018
DEER2020 and Revised DEER2019 Attachment
A-48
o Leased or Rented Facilities – Investments in improvements to a facility rented or
leased by a participating business customer
• For residential added criteria to the above to consider:
o Income – Those customers who qualify for the California Alternative Rates for
Energy (CARE) or the Family Electric Rate Assistance Program (FERA), and/or
o Housing Type – Multi-family and Mobile Home Tenants (rent and lease)
Notes to hard-to-reach definition
The United States Office of Management and Budget (OMB) has designated a 12-county
Combined Statistical Area (CSA) titled the San Jose-San Francisco-Oakland, CA Combined
Statistical Area which includes the nine counties of Alameda, Contra Costa, Marin, Napa, San
Francisco, San Mateo, Santa Clara, Solano, and Sonoma which border the San Francisco Bay
plus the three counties of San Joaquin, Santa Cruz, and San Benito that are economically tied to
the nine counties that that border the San Francisco Bay.
The OMB definition of this CSA includes Los Angeles, Orange, San Bernardino, Riverside and
Ventura counties.
The OMB definition of this CSA includes Sacramento, Yolo, El Dorado, Placer, Sutter, Yuba, and
Nevada counties.
Information on the CalEnviroScreen tool used to identify SB 535 disadvantaged communities
can be found at
https://oehha.ca.gov/calenviroscreen/report/calenviroscreen-30
and the current map of disadvantaged communities can be found at
https://oehha.maps.arcgis.com/apps/webappviewer/index.html?id=4560cfbce7c745c299b2d0
cbb07044f5
Discussion of evaluation results relating to direct install to hard-to-reach customers
Since the 2008 version, DEER has included a higher NTG value of 0.85 for direct-install deemed
measures into hard-to-reach customers.51 The NTG label itself, hard-to-reach (HTR), implies that
the markets underserved by the utility energy efficiency programs relative to other markets.
The Commission staff logic in assigning the elevated NTG values grew from the expectation
that the PAs’ efficiency programs would have greater influence over customer decisions,
resulting in lower instances of free-ridership compared to other programs targeting markets
that are not underserved. At the time the higher NTG values were adopted there was no
evidence (no directed evaluation efforts) to determine the veracity of the higher NTG value for
these deemed measures. The elevated value was supported by the DEER team opinion alone.
51 D.18-05-041 at 41-46 and FOF 14 define hard-to-reach customer classes and COL 27 clarifies that HTR
programs “should prioritize the most underserved customers or customer segments, because they are
likely hardest to reach.”

Resolution E-4952 October 11, 2018
DEER2020 and Revised DEER2019 Attachment
A-49
Commission staff believes the opinion in this matter must be reviewed using the evidence
gained thought almost ten years of collected evaluation results. In review of the most recent
evaluation results along with overall 2017 deemed claims, Commission staff finds no support
for the use of a higher NTG value for direct install programs into HTR markets versus the
general market. However, Commission staff retains this NTG value subject to review of future
evaluation results.
The recent comprehensive summary of commercial and other nonresidential programs shows
that program-wide and statewide NTG results are in the range of current DEER values.52 For
example, Figure 19 shows that shows that statewide results across program groups are only
slightly higher than the DEER default of 0.60 for the direct install gross program group. Other
program groups such as local government and third party also have direct installation
components, but those overall NTG values are slightly lower than the DEER default value.
Figure 19 - Overall Statewide 2013-2015 Commercial NTG Results53
When looking at customer size, Figure 20 shows that small customers (those most likely to be
identified as hard-to-reach) also show an overall NTG slightly less than the DEER default value.
A review of 2017 claims shows that over 50% of HTR NTG claims are for lighting lamp or
fixture measures.54 The 2019 revisions to DEER, combined with previous workpaper
dispositions, set the NTG value for all LED lighting measures at either 0.85 or 0.91. The
remaining claims are split about evenly between residential and
commercial/industrial/agricultural sectors.
Figure 20 - Overall Statewide 2013-2015 Commercial NTG Results by Sector55
52 “2013-2015 Program Performance Assessment of the Nonresidential Downstream Programs,” prepared
for California Public Utilities Commission, prepared by Itron, December 21, 2017 53 Ibid, table 4-5. 54 See supporting document 2017-HTRNTG-DeemedClaims-21Aug2018.xlsx 55 “2013-2015 Program Performance Assessment of the Nonresidential Downstream Programs,” prepared
for California Public Utilities Commission, prepared by Itron, December 21, 2017, Table 4-4

Resolution E-4952 October 11, 2018
DEER2020 and Revised DEER2019 Attachment
A-50
Overall, the above discussion demonstrates a possible lack of support for an elevated NTG
value for direct installation into hard-to-reach (DI-HTR) customer versus the general market.
However, as noted earlier, the DI-HTR NTG values will be retained pending further review
based on additional evaluation results.
5.8. Net-to-gross Table Format and Simplification Updates Commission staff have completed a comprehensive review of the DEER NTG values along with
NTG values that have been assigned to deemed measures through recent workpaper
dispositions. Many NTG values are now revised, removed or combined with other NTG values
to reflect most recent workpaper dispositions, evaluation results or code changes. The complete
revised table of NTG values are included in the workbook “SupportTable-NTG2020.xlsx”.
Descriptions of each category of revision are provided below.
Expired NTG values: All NTG values with an expiration date on or before December 31, 2018
have been removed from the NTG table.
Out-of-date measure criteria: Some measures have incorrect measure specifications and in some
cases there are no current evaluation results to support an NTG value that is different from the
DEER default. One example is the NTG of 0.23 for gas water heaters rated with Energy Factor
(EF) values in the range of 0.62 to 0.65. As noted in Section 4.1, EF was superseded by Uniform
Energy Factor (UEF) in December of 2017. This NTG value has been removed. Since there have
been no recent evaluations of water heater measures, the DEER default values are the most
appropriate.
Another example is the NTG values for CFL lamps, where the 2018 Phase 1 dispositions revised
all baselines to include larger fractions of LEDs and CFLs and much smaller fractions of
incandescent lamps. Additionally, PAs have been directed to remove CFLs from their measure
offerings by December 31, 2018. Commission staff has removed CFL NTG values from the NTG
table effective January 1, 2019.
Values that are not significantly different from the DEER defaults: In some cases, measure
specific NTG values do not differ significantly from the DEER defaults. For example, the DEER
NTG value for chillers in downstream applications is 0.58, but the DEER default is 0.60. In
previous DEER revisions, Commission staff has noted an intention to simplify the NTG table
and remove or combine values where differences are less than 0.05. For the specific case of
chillers, the NTG value has been removed, meaning the DEER default becomes the applicable
value moving forward.

Resolution E-4952 October 11, 2018
DEER2020 and Revised DEER2019 Attachment
A-51
Lighting NTG values to reflect recent dispositions: The 2018 Phase 1 lighting dispositions
updated NTG values for all LED measures. The DEER2019 expands on these dispositions to
revise the code/standard practice baseline for all hardwired LED fixtures to be a typical
performing LED fixture as discussed in Section 4.5, above. Commission staff have directed the
use of these revised standard practice baselines and NTG values for all measure application and
delivery types in both deemed and custom measures. Effective January 1, 2019, the NTG values
for all LED lighting measures are updated to disposition values of 0.91 for hard-wired fixtures
and 0.85 for screw-in lamps, can retrofits and other low-wattage fixtures with savings calculated
using a wattage reduction ratio (WRR). These values shall be used for normal replacement, new
construction and above-code savings of accelerated replacement measures. The NTG for below-
code savings shall be adjusted according to Section 5.4, above.
Table simplification: Commission staff have revised the NTG table to remove most descriptive
fields and substituted in direction in the comments section that describes under what
circumstances an NTG value shall be used. Criteria include measure type (deemed, custom,
etc.), application type (NC, NR, AR, etc.) or delivery type (downstream, upstream, downstream
DI, etc) and any measure technology requirements.
6. Comments on DEER2020 Scoping Memo and Commission staff DEER team Responses
On May 9, 2018 Commission staff published to the Energy Efficiency Proceeding R.13-11-005 a
memo outlining the intended scope of the planned update to the Database of Energy Efficiency
Resources (DEER) and a solicitation of comments on that proposed scope. Comments were filed
by Southern California Edison, San Diego Gas and Electric, Southern California Gas, and the
International Window Film Association. Those comments are each summarized below with a
response from the Commission staff DEER team.
6.1. Peak Demand Update San Diego Gas and Electric (SDG&E):
The Scope states, “[T]he peak demand savings for DEER measures will be reevaluated in a
manner that provides hourly impact details to allow the updating of measure peak demand
values.” SDG&E requests that the study clarify if the updated hourly impacts details will
replace the existing load shapes for the measures as listed on page 4 and if it will be done by
building type.
DEER Team response:
Updating the measure impact profiles by building type and climate zone is an important next
step with or without an update to DEER peak demand definition. A possible next step after the
DEER update is to incorporate the newly created DEER measure impact profile that contains

Resolution E-4952 October 11, 2018
DEER2020 and Revised DEER2019 Attachment
A-52
8,760 (hourly) values for a year of savings into a format that allows integration with the CPUC-
approved cost effectiveness calculations (the Cost Effectiveness Tool application).
Southern California Edison (SCE):
MASControl/eQUEST currently reports the highest plant demand for a building simulation.
With Commission Staff’s update of MASControl/eQUEST, SCE requests that reporting
capabilities be expanded to include peak DEER demand for the forthcoming adjusted DEER
peak demand definition. Additionally, SCE requests that coincident demand factors for non-
DEER measures are also updated to align with the shift in Peak Period(s).
DEER Team response:
The updated MASControl process will store 8,760 hourly demand data based on a weather-
normalized year for each climate zone in California and will be capable of determining the peak
demand impact for all updated measures.
6.2. Weather Files San Diego Gas and Electric (SDG&E):
Will 2020 DEER use the current CZ2010 weather files, or will a different set be used such as the
weather files used in the development of the adopted Avoided Costs?
DEER Team response:
The DEER2020 update will use the current CZ2010 weather files.
6.3. MASControl3 San Diego Gas and Electric (SDG&E):
The Scope indicates that MASControl3 will be used to determine the new peak demand savings.
Will other analysis software be used to support and validate results developed by
MASControl3?
DEER Team response:
Initial validation will be accomplished by comparisons to previous DEER versions. Some
changes are anticipated due to updates and improvements to baseline assumptions, vintage
updates, error corrections, and energy code updates.
The updated MASControl process will store 8,760 hourly demand values based on a weather-
normalized year for each climate zone in California. Verification of the calculated peak demand
impacts for the defined peak demand period can be done by any party using the data created by
the process.
Southern California Edison (SCE):

Resolution E-4952 October 11, 2018
DEER2020 and Revised DEER2019 Attachment
A-53
MASControl currently incorporates 2008 and 2013 code baselines prototypes. SCE recommends
adding 2016 and 2019 Title 24 baselines as part of updated prototypes.
DEER Team response:
The DEER 2017 through 2019 updates included 2016 Title 24 baselines. The current update will
include 2019 Title 24 baselines.
Southern California Gas (SCG):
In addition to the building vintage consolidation plan addressed in Section 3.3 of the scoping
memo, SCG suggests consideration of consolidating the various energy impacts from different
program administrators (PAs) that are within the same climate zone. There are 16 climate zone
energy impacts represented by 33 impact values due to overlapping climate zones in different
PA service territories. For example, CZ05 has three energy impacts for Pacific Gas & Electric
Company (PG&E), Southern California Edison (SCE), and SoCalGas; and CZ08 also has three
energy impacts for SCE, San Diego Gas & Electric Company (SDG&E), and SoCalGas. The
DEER team should evaluate whether it’s appropriate to have one energy impact for one climate
zone without loss of accuracy.
DEER Team response:
The issue that SCG raises is acknowledged, however there are concerns that a more granular
division of impacts by utility for each climate region would greatly increase the complexity of
the results and number of values. However, more importantly, the data needed to implement
this more granular set of results is not available at this time. This issue should be investigated
for the next DEER update.
6.4. Furnace Fan Efficiency and Efficiency Fan Operation San Diego Gas and Electric (SDG&E):
The Scope states, “The updated DEER measures will have a start date of 1/1/2019.” SDG&E
recommends that the start date of 1/1/2020 be used instead so that it aligns with "New
Measures" in Table 1 DEER date of 2020?
The Scope states, “A separate efficient fan controller measure will be considered that optimizes
the operation of the supply fan to maximize the heating/cooling recovered from the thermal
mass after the burner/compressor has cycled off.” Will existing workpapers for this type of
measure become invalid or considered "expired" after the start date of this new DEER measure?
DEER Team response:
The start date for the measure in the text has been changed to January 1, 2020. Measures
covered by this measure will need to use the DEER values beginning on the DEER start date.
Southern California Edison (SCE):

Resolution E-4952 October 11, 2018
DEER2020 and Revised DEER2019 Attachment
A-54
SCE requests that this new DEER measures includes both logic-based efficient fan controllers
and user-programmable efficient fan controllers in determining the savings and baseline data.
DEER Team response:
The measure will be based on the best-available information at the time that can support a
deemed-measure impact. Current investigations involve residential products that are
automated and less subject to occupant adjustments such as scheduling.
6.5. Extended Hours Prototype San Diego Gas and Electric (SDG&E):
The Scope states, “A new commercial building prototype is under consideration to be added
that includes 24‐hour operation of high load activity areas…” SDG&E recommends that this
prototype be applicable to hospitals and prisons as well, since they're also 24-hour operation
facilities. Alternatively, another commercial building prototype could be developed for
hospitals and prisons if the new prototype will not be applicable to hospitals or prisons.
Southern California Edison (SCE):
SCE recommends inclusion of Indoor Parking Garages as a part of the evaluation of 24-hour
operation of high load activity areas.
DEER Team response:
Commission staff envisions a 24-hour prototype that can be used for a broad range of chiller
and chiller plant efficiency measures where the cooling load profile reasonably matches the
assumptions for the new prototype and will likely be appropriate for many building types. In
addition to the savings estimates, CPUC staff plans to include, in the DEER update,
requirements and direction for application of the extended hours savings estimates. The DEER
prototype for hospital includes continuous operation areas such as wards and emergency
rooms. At this time, there are no plans to add additional building types such as prisons or
parking garages. D.12-05-015, via Attachment A, incorporates guidelines for PAs to propose
new building types.
6.6. Timing of Water Heater Ratings Change San Diego Gas and Electric (SDG&E):
SDG&E: There was a Phase 1 disposition and change in rating procedures in 2018. If the 2020
DEER updates will account for the EF to UEF conversion but these updates will occur in 2019,
then 2020 DEER should clarify if implementers will be able to continue utilizing existing DEER
IDs that have EF ratings. If the EF ratings will still be applicable, it would imply that there
would be no need to updates to 2018 workpapers until 2019.
DEER Team response:

Resolution E-4952 October 11, 2018
DEER2020 and Revised DEER2019 Attachment
A-55
Since the UEF rating system in the federal requirements have been in place since August 2017,
and the Phase 1 disposition was issued on March 1, 2018, implementers are expected to utilize
the UEF ratings beginning in 2019.
6.7. Timing of Updates to Commercial Lighting, HVAC and Residential Shell Specifications Southern California Edison (SCE):
Table 1 identifies four areas that will be updated this year. SCE recommends that only “DHW
rating change” should be updated for 2019. The other three areas (LED indoor and outdoor
lighting, Commercial HVAC specifications, and Residential shell specifications) are 2019 Title
24 Code changes. Since the 2019 Title 24 Code changes are scheduled to be effective January 1,
2020, SCE recommends that the three other areas be updates for DEER2020 and not 2019 as
listed.
San Diego Gas and Electric (SDG&E):
Table 1‐Draft DEER Update Priorities shows the Commercial HVAC specifications under the
2019 DEER Version. However, updates to 2019 Title 24 will be effective January 1, 2020. SDG&E
requests clarification for the effective date of the updates.
Table 1‐Draft DEER Update Priorities shows the Residential Building Shell specifications under
the 2019 DEER Version. However, updates to 2019 Title 24 will be effective January 1, 2020.
SDG&E requests clarification for the effective date of the updates.
DEER Team response:
Commission staff acknowledges that 2019 Title 24 updates are effective January 1, 2020. At a
minimum, second baselines for AR measures will be updated to incorporate these changes.
However, Commission staff will consider Title 24 updates and other available research in
updating standard practice baselines, effective January 1, 2019, for all measure application types
including AR, NR and NC. Commission staff notes that D.12-05-015 specifically considers the
possibility that standard practice may exceed and, in those case, should be reflected in the
baseline assumptions.
Since recent Commission staff workpaper dispositions specify changes to standard practice
baselines effective January 1, 2018 for exterior high bay lighting and April 1, 2018 for interior
low bay and high bay lighting, the DEER update for lighting is appropriately scheduled for
2019.
The commercial HVAC and residential shell updates for the 2019 Title-24 were incorrectly
identified as changes for DEER 2019 and will be re-categorized as DEER 2020.
6.8. Net-to-Gross Southern California Edison (SCE):
Resolution E-4952 October 11, 2018
DEER2020 and Revised DEER2019 Attachment
A-56
SCE recommends that findings from Opinion Dynamics’ PY2015 California Statewide On-Bill
Finance Impact Evaluation Study (CALMAC Study ID CPU0181) should be considered to adjust
the net-to-gross (NTG) values for On-Bill Financing (OBF) projects.
SCE suggests that the NTG values for OBF should be increased, per the findings in the Impact
Evaluation Study noted above, which noted that the level of customer engagement, influence,
and additional diligence that the customer must undertake warrant an increase in the NTG.
“By PA, NTGRs range from 0.64 for SCE to 0.68 for SDG&E (Table 1-6),” the study notes.
“PG&E has a higher NTGR for lighting projects, while SCE has a higher NTGR for non-lighting
projects (both differences are statistically significant at 90% confidence).”56
Since many measures use a default NTGs ranging from 0.55 to 0.60, OBF projects are worthy of
a higher NTG to match study findings.
Southern California Gas (SoCalGas):
SoCalGas agrees on the Net-To-Gross (NTG)updates with most recent CPUC impact evaluation
findings available. However, in addition to “2015 Nonresidential Downstream ESPI Deemed
Pipe Insulation Impact Evaluation” listed, SoCalGas suggests examining the 2014
Nonresidential Downstream Deemed ESPI Pipe Insulation Impact Evaluation Report in
addition to 2015 impact evaluation as each study presents accurate and substantiated values.
SoCalGas recommends consolidating the results of both studies if an update is to be considered.
DEER Team response:
Commission staff agrees that OBF activity may have an impact on NTG and is examining the
OBF results for compatibility with other evaluation NTG results.
Commission staff will review all recent evaluation results for possible inclusion into the DEER
update.
6.9. Gross Realization Rate Southern California Gas (SoCalGas):
Changes to the Gross Realization Rate (GRR) for custom measures and projects based solely on
2015 custom impact evaluation reports may be premature based on changes being made by PAs
to energy efficiency programs which affect both ex-ante savings claims and ex-post evaluation
(e.g., NMEC, 3rd party focus, etc.).
If the GRR is to be considered for updates, use of the 2015 Custom Impact Evaluation Industrial,
Agricultural, and Large Commercial (IALC) evaluation report referenced in the DEER 2020
Scoping Memo should consider the granularity of IOU-specific values as the 2015 IALC report
was designed and reports on IOU-specific values instead of an aggregate statewide value.
56 See CALMAC Study ID CPU0181, p. 6. Also see Table 1-5, p. 6.
Resolution E-4952 October 11, 2018
DEER2020 and Revised DEER2019 Attachment
A-57
Aggregation of gas and electric results may be problematic and does not support the preference
for increased granularity indicated in Decision (D.) 11-07-030 which set the current default GRR
value. [D.11-07-030, p. 35, Table 1 and p. 37] The aggregation of all natural gas savings (therms)
results presented in the 2015 IALC report may lead to less precise results. [2015 Custom Impact
Evaluation Industrial, Agricultural, and Large Commercial (IALC) Final Report, p. 1-7, Table 1-
4. See sampling strategy discussion based on combined MMBtu contribution for combined fuel
utilities PG&E and SDG&E on page 2-3 of the 2015 IALC Report. This limits the number of gas
only points that can be included in the sample.]
Given the changes in the evaluation cycles and the desirability of expanding the sample size
across years, results contained in the 2015 evaluation report for years prior to 2015 (2010-12,
2013, and 2014) should be considered in any updates. This may be accomplished with a simple
(vs. weighted) average. Other considerations would be to employ a conservative approach, as
used in D.11-07-030, and use values that are the averages over the four evaluation periods of the
upper values in the 90% confidence intervals presented in the 2015 IALC report, especially
considering the high error ratios for all evaluation results.
DEER Team response:
Commission staff agrees that default GRR values should reflect the expected results for each
IOU if recent evaluations indicate a significant differential. Commission staff will recommend
differential values by IOU, or activity type, if the sample and analysis of the recent evaluation
results support such differentiation. Any adjustments to the default values established through
Decision 11-07-030 will be made through a process separate from this Resolution.
6.10. Effective Useful Life (EUL) of Window Films International Window Film Association (IWFA):
Proposes increase of window film EUL from 10 to 15 years. Also proposes increase of window
EUL from 20 years to 30 years as it relates to the fact that the RUL of the window limits the EUL
of the window film product. See IWFA memo for background supporting these changes.
DEER Team response:
The DEER values must represent typical expected values. There will be a variation in expected
performance persistence or degradation among products and also the market factors
influencing implementing customers. These types of add-on measures also have an element of
accelerating customer action - that the customer would take action at a later date whereas the
program accelerated that action.
7. Comments on the Draft Version of This Resolution
Thirteen parties submitted a total of 66 comments in response to the public draft of this
resolution. Energy Division staff organized these comments by subject, below. Where possible,
we respond to groups of comments. Unique concerns, however, are addressed individually.
Our responses are presented in by the number of comments submitted in regards thereto.
Resolution E-4952 October 11, 2018
DEER2020 and Revised DEER2019 Attachment
A-58
7.1. Removal of the Default Net-to-Gross for Direct-Install to Hard-to-Reach Customers The Draft Resolution proposes to remove the default net-to-gross ratio for Direct-Install
programs and projects targeting Hard-to-Reach customers. The history of the default value is
presented in Section 5.7 of this attachment. Without a default net-to-gross, savings estimates
would use the net-to-gross ratios defined at a measure level for non-Hard-to-Reach
applications.
The City and County of San Francisco, Synergy Companies, the Joint Parties, Rising Sun, SCE,
SDG&E, SoCalGas, the California Energy and Demand Management Council, and the Public
Advocates Office submitted a total of 12 comments regarding the proposed removal of the
default net-to-gross ratio for programs targeting Hard-to-Reach customers. Many of these
comments express dissatisfaction with the justification for removing the default value. Several
commenters observe that there has not been an impact evaluation which studies Hard-to-Reach
customers as a group, and the evaluation of downstream commercial programs cited as partial
justification for the change was not designed to draw conclusions about the category.
Additionally, commenters note that the definition of the Hard-to-Reach category has changed
since the evaluation was conducted. Others remarked upon the expected impact on the
programs which serve Hard-to-Reach populations, and the communities that benefit from these
programs. The Public Advocates Office supports the proposed change, noting that the best
available information suggests that the net-to-gross for direct install Hard-to-Reach customers is
not substantially different from the general population.
While we remain convinced that there is insufficient evidence to suggest the default net-to-gross
of 0.85 is correct, we recognize that, because there have been no studies of the net-to-gross for
Direct-Install to Hard-to-Reach customers, and because the definition of Hard-to-Reach has
changed, we retain the default for this update of the DEER.
7.2. Net-to-Gross for Accelerated Replacement Measures The Draft Resolution proposes to apply an adjustment factor of 0.5 to the net-to-gross ratio for
below-code savings of Accelerated Replacement measures. The proposed framework for
calculating savings for Accelerated Replacement aligns with the Commission’s Potentials and
Goals Study, incorporates which uses varying below-code adjustment factors based on the
measures installed.
CLEAResult, Rising Sun, the Joint Parties, PG&E, SCE, and SoCalGas submitted a total of nine
comments on the subject of the below-code net-to-gross adjustment factor for Accelerated
Replacement measures. All comments reflect opposition to the implementation generally of a
savings framework which distinguishes between below-code and above-code savings, and
specifically of the net-to-gross adjustment factor of 0.5. Several comments argue that the
framework used in the Potentials and Goals study was not intended and is not appropriate for
the ex-ante process, and that it adds unnecessary complication to evaluation.
We disagree that the savings framework used in the Potentials and Goals study was intended to
be limited to savings forecasting and planning purposes, and that the split between above-code
and below-code savings is unnecessarily complicated. Instead, we affirm that the framework
was developed with both savings potential and program implementation in mind. We agree

Resolution E-4952 October 11, 2018
DEER2020 and Revised DEER2019 Attachment
A-59
that the adjustment factor value of 0.5 is substantial and not supported by evaluation data.
However, we maintain that the above/below-code framework is useful and necessary for
accurate savings accounting, and that a net-to-gross adjustment is appropriate. Thus, we set the
adjustment factor for below-code savings for Accelerated Replacement measures to 0.75, rather
than 0.5.
7.3. Net-to-Gross Ratio for Normalized Metered Energy Consumption Projects The Draft Resolution proposes to apply project-level net-to-gross ratios for Normalized Metered
Energy Consumption (NMEC) based on weighted, aggregated estimated savings for the
installed measures. The weighted values would be based on the net-to-gross ratios for the
remaining useful life of the equivalent Accelerated Replacement measures with an existing
conditions baseline.
CLEAResult, the Joint Parties, the California Efficiency and Demand Management Council,
PG&E, and SCE each submitted a comment about the application of a net-to-gross ratio for
NMEC projects. CLEAResult suggests that NMEC programs are still new and should be
allowed to innovate before applying the same rules as custom projects. CLEAResult, as well as
the Joint Parties, the Council, and SCE suggest that the issue should be deliberated in
proceeding A.17-01-013 et al, rather than this Resolution. PG&E recommends applying a default
net-to-gross ratio for NMEC, rather than an aggregated measure-based approach.
We agree with PG&E’s recommendation, and observe that a default net-to-gross will facilitate
easier implementation and evaluation. We disagree, however, with the comments suggesting to
discuss the net-to-gross in the Energy Efficiency proceeding, as reasonable values and
methodologies are needed in the interim as the issue is discussed. Thus, we update the
proposed framework from the Draft Resolution to apply sector-level default net-to-gross ratios
for NMEC projects as discussed in Section 5.5. We believe this framework is consistent with
prior Commission direction, and will allow program implementers to innovate and
demonstrate the utility of NMEC as a savings calculation tool.
7.4. Updating Load Shapes for New Peak Period The Draft Resolution introduces an update to the peak period used for calculating peak kW
savings. While previous versions of the DEER applied a peak period of 2:00 pm to 5:00 pm on
the three hottest consecutive weekday, this update would shift the peak times to between 4:00
pm and 9:00 pm, while using the same methodology to calculate the peak days. This update had
been discussed in a series of workshops with multiple stakeholders earlier in 2018, but isn’t
identical to the approach the working group recommended, which would have changed the
methodology to select the three non-consecutive costliest days as determined from the Avoided
Cost Calculator.
CLEAResult, SCE, and SDG&E, and the Pubic Advocates Office submitted a total of 5
comments about the peak period update. The comments generally agree that the update is
appropriate, but could be improved. Some comments reflect the need to update the load shapes
for all measures. Others reiterate the working group’s recommendation to use the costliest,
rather than hottest days.
Resolution E-4952 October 11, 2018
DEER2020 and Revised DEER2019 Attachment
A-60
The peak demand values are obtained from the measure impact profile 8760 and that profile is
not affected by the change of the peak hours. However, the measure impact profile is developed
by subtracting the measure 8760 use profile from the baseline use profile to create the impact
profile 8760. Since the DEER prototypes, measure definitions and weather files have changed
since the last DER impact profile update it is reasonable to undertake to update those 8760
profiles. This can be done by processing the DEER measure impact profiles into typical profiles
for groups very similar measure. Previously the number of DEER impact profiles was very
limited due to their use in cost effectiveness tools implemented into excel workbooks. Space
limitation were a major constraint. However, the current cost effectiveness tools are
implemented in a database format that should allow greatly expanding the number of profiles
available to better match the profiles with the range of measures. Developing these new profiles
will take substantial effort, but that work should be able to be completed by the next DEER
update allowing the new profile to be available by the time the updated peak demand
definition is in use for 2020.
We retain the methodology for selecting the peak days from previous DEER periods for a
number of reasons. We believe it is better-aligned with the goals for peak reduction in an
energy efficiency context than the costliest days, maximizing program benefits to both
customers and utilities. We also believe the existing methodology allows for better program
stability across years by basing the peak savings on load shapes normalized to the Title 24
typical weather year, while the Avoided Cost Calculator is not normalized, thus peak savings
would vary drastically from year to year. For these reasons, we adopt the peak period definition
as presented in the Draft Resolution.
7.5. Effective-Useful Life for Behavioral, Retrocommissioning, and Operational Measures The Draft Resolution reclassifies several measures as Behavioral, Retrocommissioning, and
Operational measures, resulting in decreased effective-useful life of at most 3 years to several
measures as listed in Section 5.2.
CLEAResult, Synergy Companies, the California Efficiency and Demand Management Council,
and SoCalGas submitted a total of 5 comments in response to the new effective-useful life
values. These comments focus on the consideration that physical interventions such as duct
sealing, pipe insulation, and gasket installation have expected useful lives significantly longer
than the 3 years for retrocommissioning measures as required in Decision 16-08-019. The
California Efficiency and Demand Management Council observes that the Decision invites
Program Administrators to provide evidence to support a higher effective-useful life. The
Council also recognizes that the Draft Resolution intends to remind of an existing requirement
rather than propose a new value, and requests the proposed text be removed as insubstantial.
We agree with the comments that certain physical measures are useful longer than the effective-
useful life mandated in D.16-08-019. However, Commission Staff notes that Program
Administrators have repeatedly miscategorized such measures and attempted to claim a longer
effective-useful life of a non-retrocommissioning intervention. Consequently, we find that it is
important and necessary to include full text of the Draft Resolution.
Resolution E-4952 October 11, 2018
DEER2020 and Revised DEER2019 Attachment
A-61
7.6. Net-to-Gross Ratio for HVAC Measures The Draft Resolution proposes updated net-to-gross values for residential and commercial
refrigerant change measures, residential duct sealing, commercial upstream package HVAC,
and other commercial HVAC maintenance. These updates are responsive to the most recent
residential and commercial HVAC impact evaluations.
CLEAResult, Synergy Companies, SCE, and SoCalGas each submitted a comment pertaining to
the proposed net-to-gross ratios in the Draft Resolution. CLEAResult and SoCalGas recommend
that the most recent impact evaluation results for the residential and commercial HVAC Quality
Maintenance Program not be used in establishing DEER values, pointing to incompleteness in
the studies and flaws in the study designs. Similarly, SCE recommends that further study be
performed prior to updating the net-to-gross ratio for residential and commercial HVAC
programs. Synergy Companies specifically expresses concerns about reducing the net-to-gross
ratio for duct sealing measures.
Despite the commenters’ concerns, we are confident that the results of the cited impact
evaluations are applicable as proposed in the Draft Resolution. We therefore adopt the updated
values as proposed and presented in Section 5.1.
7.7. The Process by which the DEER is Updated CLEAResult, the Joint Parties, the California Efficiency and Demand Management Council, and
Lancaster Choice Energy submitted comments regarding the DEER update process. These
comments are varied and are addressed individually.
Lancaster Choice Energy notes that the annual DEER Resolutions are finalized after the
Program Administrators submit their Annual Budget Advice Letters (ABALs), and
recommends that the timing of the Resolution process be revised to allow the Program
Administrators to incorporate changes prior to submitting the Advice Letters. We note that the
ABALs submitted prior to finalizing this update to the DEER are for program year 2019, and
that this Resolution primarily concerns program year 2020. We note, however, that updates to
the DEER for 2019 included in this Resolution are disruptive to the programs they impact. The
Commission’s intent in these updates is to correct errors, and we strive to keep late changes to a
minimum.
The Joint Parties recommend that the Commission review and adopt best practices from other
regions, and reflecting processes already implemented for energy efficiency evaluation within
California, to improve transparency and accuracy in the annual ex ante savings parameters
update processes. The Commission appreciates the Joint Parties’ comment, and may consider
certain possible process adjustments for future program years.
CLEAResult recommends limiting the DEER update to five specific items: the DEER peak
period, DEER values for new measures, updates in response to new codes and standards,
correcting errors in DEER values and documentation, and updates in response to evaluation
results. They further recommend that changes to baselines without supporting market evidence,
reclassification of measures resulting in reduced effective-useful life, and “savings derating
factors, such as the to-code NTG adjuster” should be omitted in this Final Resolution. We

Resolution E-4952 October 11, 2018
DEER2020 and Revised DEER2019 Attachment
A-62
believe that changes made to this Resolution based on other comments are responsive, in part,
to this, though some issues remain unresolved. In the case of the lighting baseline, we believe
the updates are reasonable and in alignment with both the newest Title 20 standards and the
projected market for 2020. In regards to the matter of reduced effective-useful life, we observe
that this update only reiterates prior Commission guidance in Decision 16.08.019, which
determined both the categorization and the effective-useful life of Behavioral,
Retrocommissioning, and Operational measures.
The California Efficiency and Demand Management Council similarly suggests that the Draft
Resolution includes policy decisions which go beyond its scope, particularly with respect to
updated effective-useful life values, net-to-gross ratios for Accelerated Replacement measures
and Normalized Metered Energy Consumption projects, and expanded measure application
types. As with CLEAResult’s comment above, we believe changes in this Final Resolution
partially address the issues the Council raises. We believe that, while certain technical decisions
must be made in lieu of precise data, the DEER update is appropriately within its policy scope.
7.8. Applicability to Codes and Standards, Randomized Control Trials, and Strategic Energy Management
The Draft resolution listed Codes and Standards and Randomized Control Trials among the
downstream delivery types added by Resolution E-4818 which would be subject to the
proposed updates in net-to-gross. PG&E, SCE, and SDG&E submitted comments to oppose
applying a new net-to-gross ratio for Codes and Standards programs, while Oracle, PG&E, and
SCE commented in opposition of applying a default net-to-gross for Randomized Control Trial
programs. SDG&E further submitted a comment requesting clarification on the applicability of
a net-to-gross ratio for Strategic Energy Management, in response to the inclusion of
Normalized Metered Energy Consumption on the same list.
The DEER update was not intended to over-ride the default net-to-gross ratios for Codes and
Standards, Randomized Control Trial, and Strategic Energy Management programs, and the
values will remain unchanged from prior versions of the DEER. We further clarify that the net-
to-gross ratios for Emerging Technologies programs are also unchanged. We have revised
Section 5.6 to clarify.
7.9. Updates to the Construction Dates and Characteristics of Building Simulation Prototypes
The Draft Resolution proposes a number of alterations to the building prototypes, including
revised building vintage categories and assumed equipment. CLEAResult and SCE submitted
comments in response to the prototype definitions, and they are addressed separately, below.
CLEAResult expresses concern that the use of supply air temperature and chilled water
temperature reset control strategies assumed in the pre-1996 building vintage prototype is
unsubstantiated and does not reflect actual building characteristics.
The DEER prototype baselines do not impact custom measures in cases where the custom
project can use an existing conditions baseline, and the existing controls are different than the
DEER prototype baseline. The DEER prototype baseline does not render HVAC controls

Resolution E-4952 October 11, 2018
DEER2020 and Revised DEER2019 Attachment
A-63
measures ineligible for deemed treatment. Eligibility of such measures would be determined by
other factors, such as code requirements, ISP studies or CPUC policy regarding repairs,
baselines.
SCE recommends that the “median” building vintage should exclude 2007, 2011, and 2014
vintages.
The DEER building weights for vintages 1996 and earlier represent 74-80% of the existing
building stock. For this reason, the previous “existing” vintage included in DEER represented
mostly a 20 plus year old building and thus there was no representation of the 5-20 year old
buildings. The purpose of separating the existing vintage into the older and median groups
would be defeated by including the 1996 vintage into the median building vintage. Such a
change would cause the median vintage to be more representative of 20-plus year old buildings.
However, excluding vintages 2007 and 2011 for installations in 2020 and beyond, would exclude
building from 9-13 years old which is not reasonable. It may be reasonable to exclude 2014;
however, that exclusion would not change the median vintage values more than a few percent
and would require substantial reworking of the DEER results. It is thus neither practical nor
appropriate at this time. The median vintage definitions may be revisited for the next DEER
update.
7.10. Reporting Requirement Consistency with Commission Databases SDG&E one comment regarding the integration of the Commission’s data and reporting
requirements. In particular, SDG&E requests that the Commission ensure consistency across its
data systems, particularly CEDARS, and that they are updated according to the DEER updates
in time to allow proper reporting.
Energy Division staff are aware of the data reporting implications of this Resolution and will
endeavor to ensure the Commission’s data systems are updated accordingly in a timely fashion.
7.11. LED Baseline for Lighting Measures The Draft Resolution proposes revising most baselines for interior and exterior lighting to the
lowest performing LEDs currently in the marketplace and also raises the net-to-gross to 0.91 in
acknowledgement that nearly all high efficiency LED upgrades, above an LED baseline, are
program induced. Current evaluated net-to-gross values range from 0.45 for outdoor LED
lighting to 0.60 for indoor LED lighting.
Rising Sun and PG&E submitted comments to express concern that an all-LED baseline is not
practical, as it is not yet standard practice. Setting the baseline in advance of full adoption will
disallow some savings as the market transitions to LED.
We first note that all net-to-gross values for lighting are based on the assumption that the
standard practice baseline is older technologies such as high pressure sodium for exterior
lighting, and T8 linear fluorescents and pulse start metal halide for interior lighting.
The proposed baselines for 100% LED lighting were directed in 2018 Phase 1 dispositions for
outdoor lighting and interior high bay and low bay lighting. The DEER update expands the
100% LED baseline along with the increased net-to-gross value to cover all hard-wired lighting
including interior ambient fixtures such as ceiling- and grid-mounted troffers. Removing the
Resolution E-4952 October 11, 2018
DEER2020 and Revised DEER2019 Attachment
A-64
baseline change would also require removal of the increased net-to-gross value since baselines
would revert back to out-of-date assumptions. Furthermore, all current LED lighting measures
would expire at the end of 2018 and program administrators would have to submit new
workpapers that included revised baselines and savings calculations. The proposed baseline
and NTG values will ensure that approved values will be in place for the coming program year
and that the gross baseline and net-to-gross values are aligned.
The proposed DEER baseline of 100% LED net-to-gross value of 0.91 applies to normal
replacement and new construction measure application types. Program Administrators may
submit workpapers or custom project proposals for accelerated replacement measures where
the existing baseline is of higher energy use than the DEER standard practice or code baseline.
These proposals shall include all evidence, documentation and analysis to support the claim of
accelerated replacement.
7.12. Gross Realization Rate for Custom Programs CLEAResult and SCE each submitted a comment regarding the gross realization rates for
custom programs. The two comments are addressed separately below.
CLEAResult expresses support of the Draft Resolution’s proposed deferral of a default gross
realization rate, while recommending further examination if realization rates do not improve in
future cycles. The Commission appreciates the recommendation and will take it into
consideration in planning evaluations and preparing future DEER updates.
SCE recommends that the DEER apply gross realization rates for custom measures at the
Program Administrator level, rather than statewide. While we refrain from implementing this
change in the current DEER update, we will consider it in future updates.
7.13. Required efficiency over Title 24 baseline for Chiller Full and Partial Loadings The Draft Resolution proposes to continue a requirement from previous versions of the DEER
that HVAC measures for liquid chilling machines be rated at least 10% more efficient than
Title 24 minimum efficiency requirements both at full-loading and as indicated by the
Integrated Part Load Value.
In one comment, SCE recommends reevaluating this requirement, instead allowing lower full-
load efficiency for “Path B” compliant equipment.
Staff determined that establishing a threshold for efficiency based on the Integrated Part Load
Value alone would required considerable new research which is impractical for this update.
Future evaluations may recommend a methodology for establishing such a threshold, or
propose alternative requirements, but for the Final Resolution we adopt the requirements for
chillers as proposed in the Draft.
7.14. Lancaster Choice Energy requests to be included in Evaluation Planning Process Lancaster Choice Energy submitted a comment expressing interest in participation in the
Evaluation, Measurement, and Verification (EM&V)planning process, in order to ensure any
studies of net-to-gross for Direct Install commercial programs are designed appropriately.

Resolution E-4952 October 11, 2018
DEER2020 and Revised DEER2019 Attachment
A-65
Lancaster Choice Energy is welcome to attend the EM&V stakeholder meetings held quarterly,
and may contact stakeholders including staff directly to get information about joining the
proper planning team.
7.15. Corrections and Clarifications SDG&E requests corrections of errors identified in the draft DEER update, and clarifications on
certain issues. These are discussed individually below.
1. SDG&E provided a set of clarifying questions to Commission Staff prior to its September
10, 2018 webinar discussing the draft resolution. SDG&E appreciates Commission Staff’s
responses to all of SDG&E’s questions. SDG&E recommends Commission Staff provide
filtering capability for the “Source Description” field to allow users to identify all
updates resulting from this resolution. Below are summaries of the Commission’s
response to SDG&E’s questions/clarifications during the webinar and in follow-up
discussions that should be reflected in the final resolution and DEER2020.
Response: The source description column in the Measure table in READI can be filtered
for multiple values to get all of the DEER2019 and DEER2020 updates.
2. An error was identified in the PEAR database that shows chiller measures for 2020 with
a start date of 1/1/2018 and Status = Proposed. It will be corrected in the final release to a
start date of 1/1/2020."
Response: Chiller StartDate and ExiryDate corrected in PEAR database on 9-11-2018
3. The PEAR database legacy DEER 2015/2017 measures based on EF rating still reflect a
Status = Available with no expiry date. SDG&E recommends that this be clarified in the
final DEER.
Footnote #13, which only mentions Residential UEF, should be updated to clarify
whether this is applicable to Non-Residential measures.
Response: NTG values were updated on September 20, 2018.
4. For Table 5 Performance Analysis of LED Fixtures, the "NormUnits" have changed from
"Kilolumen" to "Fixture" or "Lamp." Commission Staff has clarified that the PEAR
database will be updated to Kilolumen.
Response: Normalizing units for these measures were updated on September 9, 2018.