Endurable SSD Cache for Deduplication-based Primary Storage
22
PLC-Cache: Endurable SSD Cache for Deduplication-based Primary Storage Jian Liu, Yunpeng Chai, Yuan Xiao Renmin University of China Xiao Qin Auburn University Speaker: Tao Xie MSST, June 5, 2014
-
Upload
khangminh22 -
Category
Documents
-
view
5 -
download
0
Transcript of Endurable SSD Cache for Deduplication-based Primary Storage

PLC-Cache: Endurable SSD Cache for Deduplication-based Primary Storage
Jian Liu, Yunpeng Chai, Yuan Xiao Renmin University of China
Xiao Qin Auburn University
Speaker: Tao Xie
MSST, June 5, 2014

Deduplication
• Age of Big Data – Bad news:
• Goble data will be more than 40 ZB in 2020 [IDC]; • Capacity and price of disks changes slowly after reaching TB-level
– Good new: • 75% data is redundant [IDC]
• Dedup improves space-efficiency – Secondary Dedup: backup, archive systems (most of previous work on
dedup) – Primary Dedup: online storage systems (e.g., email, database, web, etc.)
[iDedup@FAST’12, ZFS, SDFS, LessFS, LBFS]
Presenter
Presentation Notes
ZFS, SDFS, LessFS, LBFS: practical industrial products or open-source file systems integrating dedup technique. Primary dedup extends the benefits of dedup to a wider range of storage systems.

Primary Deduplication
• Reasons of limited performance of Dedup – Additional metadata accesses – Data Fragmentation on disks
• Defragmentation: – Limited containers of each file [Capping@FAST’13] – Storing sequence of chunks [iDedup@FAST’12]
• SSD data cache to boost [SAR@NAS’12] (focus of this paper) – Large, Fast, Energy-efficient
Presenter
Presentation Notes
primary storage is sensitive to latency, but the performance of dedup is not very good. We want to explain the reasons, and focus on the second one – SSD data cache to boost. Container: storing many small data chunks (e.g. 4KB) in one container (e.g. 2MB). When restoring one file, the containers storing the related data chunks of the file are read as a whole. Maybe we read some more data than we needed, but the count of disk head seeking is reduced to improve performance, especially when the file data locates in only several containers. Capping: each file is only related to limited number containers. Thus the seeking operations of restoring each file is limited, although the deduplication rate drops a bit. iDedup: storing some continuous data chunks as sequence in disks. We can read these chunks with only one seeking operation. SSD is large, fast and energy-efficient.
SSD Cache to Boost
• Container-level caching instead of chunk-level caching [e.g. SAR] – Reading less containers from HDD (as the example) – Write amplification reduction
• Containers size match erase unit of Flash chips (several MB)
Presenter
Presentation Notes
SAR is a chunk-level caching method. It caches the data chunks related to the most files during the process of backup (used in secondary dedup). However, in primary storage, we can not estimate which data chunk is accessed the most, so SAR is not very appropriate. The example in this figure explains why contain-level caching is usually better than the chunk-level caching. Size of container matches the size of erase unit in flash chips (both several MB). When replacing container 0 with container 2 in SSD cache, the entire container 0 is erased, and re-written with the contents of container 2. Ideally, there will not be write amplification any more.

Challenge of SSD Cache
• Too much writes on SSD cache leads to – Low performance caused by request congestion; – Importantly, VERY SHORT lifetime of SSD cache
Cache Algorithms
The measured writing speed of SSD
Expected 60GB Intel 520 SSD lifetime
Expected 60GB Intel 910 SSD lifetime
FIFO 56.7 MB/s 7.6 Days 162 Days
LRU 50.7 MB/s 8.5 Days 181 Days
LFU 53.1 MB/s 8.1 Days 173 Days
Intel 520 SSD, 60 GB TBW: 36 TB (used in experiment)
Intel 910 SSD, 400 GB TBW: 5 PB (enterprise SSD)
Results are from an experiment based on a dedup system with 60GB SSD cache
Presenter
Presentation Notes
TBW: total bytes written, the max written amount before broken. We made an experiment based on a dedup system with 60GB SSD cache (Intel 520 SSD), and measured the average writing bandwidth of FIFO, LRU and LFU. And then, according to the TBW of Intel 520, we calculated the expected lifetime of SSD cache (i.e. the third column) under continuous usage. For Intel 910 SSD, the enterprise SSD, its TBW is 5 PB for 400 GB capacity. Then the TBW for 60 GB capacity is 768 TB. We use 768TB to estimate the lifetime of Intel 910, i.e. the values in the fourth column. An reasonable lifetime of a device is 3-5 years, but we only get a week or half a year for an experiment of small scale. The situation in practical storage systems will be worse.

Analysis
• Analyze the composition of written data set – Is all the written data NECESSARY?
• Four quadrants – Caching target:
• PLC data (Best): QA – NOT necessary
• QC/QD: few benefits • QB: repeat writes Loop: evict-enter-evict-enter-…
Presenter
Presentation Notes
Our objectives: Reduce amount of written data Keep high cache hit rate 2) We first need to analyze the composition of the entire written data set of SSD cache, before reducing the amount of SSD written data. 3) Repeat writes means the times of writing the same block into SSD cache during the entire service time. It’s bad for SSD. 4) PLC data (i.e. QA) data is the best, because it stays long in SSD cache to contribute many cache hits, but it is seldom evicted and cached again. The best situation for a SSD cache is only caching PLC data.

Analysis (Cont.)
• Trace Analysis – PLC data (QA): low
percentage – Chunk -> container:
• QA (PLC data) • QC+QD • QB
– FIFO, LRU, LFU have similar results
Other real-world traces lead to similar observations
Presenter
Presentation Notes
1) The figures in the first column are chunk-level caching, whereas the others are container-level caching. The are under the same trace. 2) The trace rucserver shown in the figures is a synthetic trace of randomly accessing the collected data from the servers of Renmin University of China under the Zipf distribution. 3) We also use other real-world traces, including buildserver (a Windows build server trace), cctvvod (a video-on-demand trace from cctv.com), and hive-select, which is collected by running BigDataBench [39] to perform a cloud database test. The results of these real-world traces lead to similar observations. 4) The reasons of QA, QC+QD drop, and QB increases lie in: * The proportion of QA data in container-level caching is smaller compared with chunk-level, because some data chunks from QB or QD mixed with QA data chunk makes the entire container locate in QB. * The proportion of QC+QD data in container-level caching becomes smaller too, because mixing some QD data chunks together, mixing QC/QD data chunks with QB ones, or mixing QD data chunks with QA ones will all make the entire container locate in QB too. * Therefore, the proportion of QB obviously increases.

Basic Idea
• Strategies to cache PLC data – Exclude QC and QD data with low benefits – Convert QB1 data with long-term hot potential to PLC data – Exclude QB2 data with similar popularity with cached one
Presenter
Presentation Notes
Results: Total amount of SSD written data is much reduced; The proportion of PLC data will be much larger, meaning SSD cache can supply cache hits with less write operations.

PLC-Cache
• Three modules (steps) 1. Popularity Filter excludes QC and QD data; 2. Delayed Eviction converts QB1 data into PLC data 3. In-Out Comparison excludes QB2 data
Presenter
Presentation Notes
Popularity Filter: only the block with relatively large access count can pass through this filter to enter SSD cache; Delayed Eviction: the eviction of cached data is delayed for a while to stay longer in SSD cache. Thus QB1 data can be turned into PLC data. In-Out Comparison: comparison between new incoming data block and the internal block to be evicted. Only when the external block is significantly better than the internal one, the cache replacement happens.

Example (Popularity Filter)
• A missed container b – b.ac < PF.thr: not replace – b.ac >= PF.thr:
• SSD Cache is not full -> b enter SSD cache; • SSD cache is full -> …
Container’s properties: ac: access_count
Presenter
Presentation Notes
b.ac=7 > PF.thr=5, so b passes through PF.

Example (Delayed Eviction)
• Selecting victim in SSD cache – Pointer scans, a.ip-- – a.ip == 0:
• a.dc--; – a.dc > 0 -> not replace – a.dc == 0 -> …
Container’s properties: ac: access_count ip: inter_priority dc: delay_count
+1 when hit
Presenter
Presentation Notes
Pointer of clock scans for a victim. Each time it pass a cached container, the container’s ip decreases by one. If a.ip=0, a is selected. Then a.dc--. After that, if a.dc==0, a is selected as victim; otherwise, the cache replacement process is stopped, and container b is discarded.
Example (In-Out Comparison)
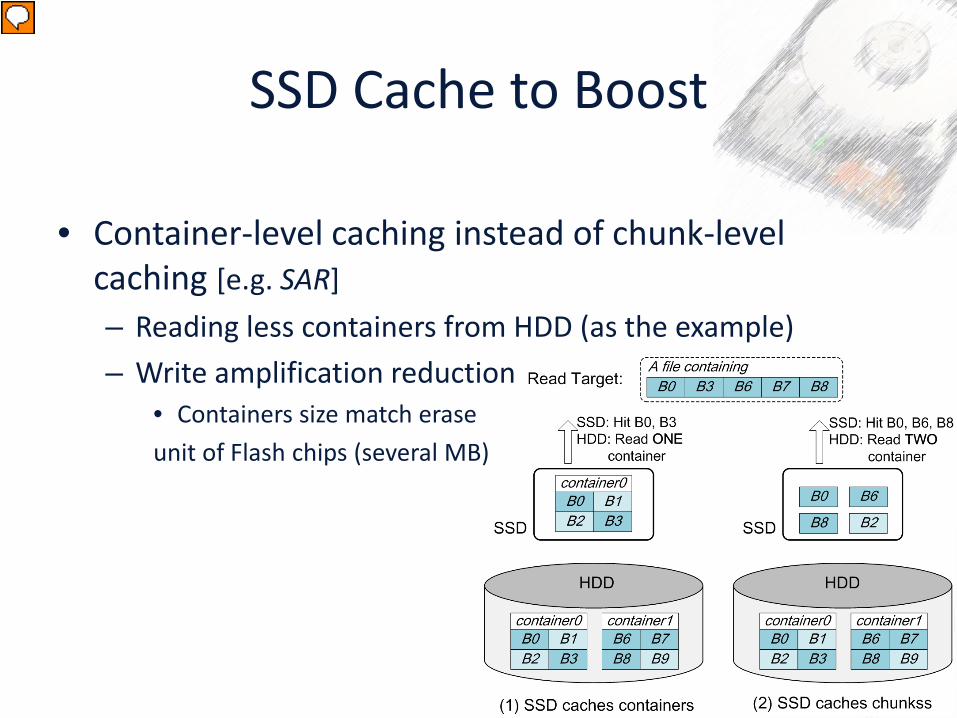
• Comparison between container b and a – (b.rc > a.rc) or (b.ac > IOC.m*a.ac) -> replace – else -> not replace
Container’s properties: ac: access_count ip: inter_priority dc: delay_count rc: reference_count
Related file count of dedup
Presenter
Presentation Notes
b.ac=7 < IOC.m*a.ac=9 But b.rc=23 > a.rc=20 so container b can replace a.
Evaluations
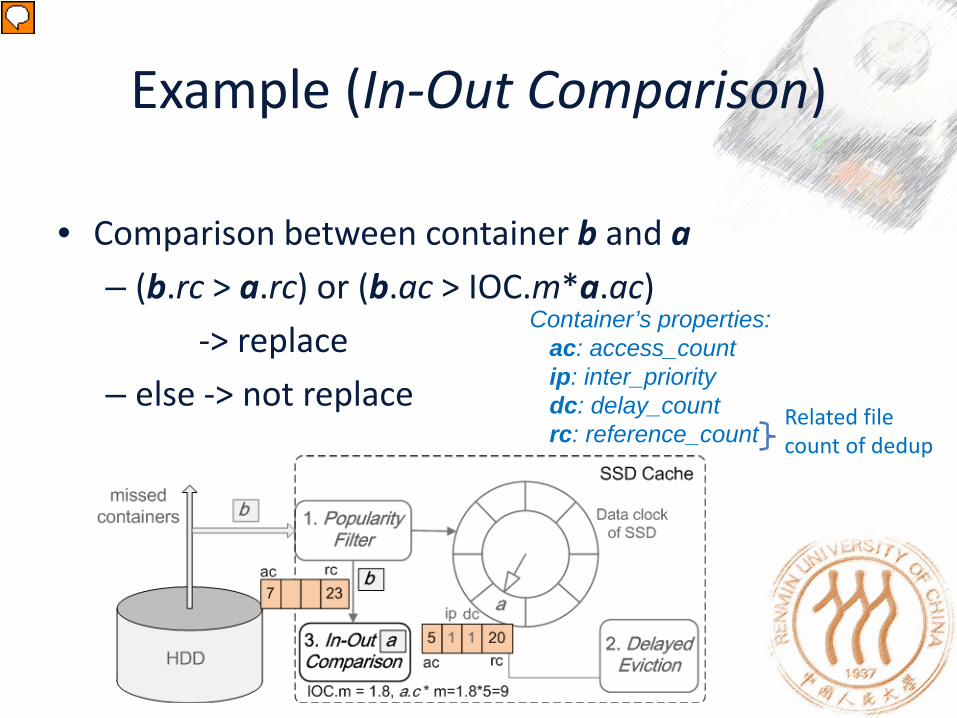
• Experiment Setup – Platform
• Primary dedup enhancement based on Destor
– Hardware • Intel Core(TM) i7-2600 quad-core CPU, 3.40GHz • 4GB RAM, 2TB Western Digital hard disk • 60GB Intel 520 SSD
– Data • Collected in the laboratory server of RUC, 200GB
– Access • Randomly read 520GB data (Zipf distribution)
(https://github.com/fomy/destor)
Presenter
Presentation Notes
Destor is developed by HUST

Overall Results
• PLC-Cache vs. HDD-only – Performance: 41.9% – SSD: 20% capacity of HDD data
• PLC-Cache vs. traditional Cache – Performance: 23.4% – SSD written amount: >15x

Distributions of four quadrants
• Amount of SSD written data – LRU: 48.77 GB – PLC-Cache: 3.18 GB – 15.34x
• Four quadrants
– QA (PLC data): 0% 81.63% – QB: 26.23% 18.37% – QC+QD: 73.77% 0%
LRU
PLC-Cache

Under Various SSD Cache Size
• Performance – PLC-Cache always outperforms LRU
• Amount of SSD written data – PLC-Cache is steadily very low – LRU writes less for larger SSD, because
of high hit rate.

Under Various α of Zipf
• Performance – PLC-Cache always outperforms LRU – Higher performance for a larger α (i.e.
more concentrated access)
• Amount of SSD written data
– PLC-Cache is steadily very low

Under Various Container Size
• Performance – PLC-Cache is better than LRU – Bad performance for too large
container
• Amount of SSD written data – PLC-Cache is always much lower than
LRU
• Container-level caching
– Reduce erase operations by 54.4% compared with SAR
– By reading S.M.A.R.T. info of SSD before and after experiment.
Presenter
Presentation Notes
1) Too large container means the valid data percentage for the target file is lower. Thus we need to read more data from HDD (the entire container), and SSD cache can’t store many containers in this case. Both of the reasons lead to worse performance for too large container. 2) PLC-Cache is container-level caching; SAR is chunk-level caching. So PLC-Cache can reduce write amplification and erase operations inner SSD compared with SAR.

Under Various Chunk Size
• PLC-Cache outperforms LRU in both performance and SSD writes.
• Chunk size does not have obvious impacts – Only too small chunk leads to worse
performance, because of more metadata to access for more chunks

Impacts of PF threshold
• Low threshold of PF means more QC/QD data enters SSD cache – More SSD writes – Request congestion
• Performance and SSD writing
amount exhibit similar pattern

Summarizing SSD-age caching • Previous cache algorithms
– Unlimited write: • FIFO, LRU, LFU, MQ, LIRS, ARC, …
– Simply remove some writes: • LARC, SieveStore, EMC FastCache, SUN L2ARC
• PLC-Cache: – Comprehensive analysis of cache’s written data set – A series method to improve distribution of 4 quadrants
– Excellent results: • performance 23.4% • amount of SSD written data 15x