Enabling teachers to explore grade patterns to identify individual needs and promote fairer student...
19
Enabling teachers to explore grade patterns to identify individual needs and promote fairer student assessment Sorelle A. Friedler * ,1 , Yee Lin Tan, Nir J. Peer, Ben Shneiderman Department of Computer Science, University of Maryland, A.V. Williams Building, College Park, MD 20742, USA Received 27 August 2007; received in revised form 23 January 2008; accepted 29 January 2008 Abstract Exploring student test, homework, and other assessment scores is a challenge for most teachers, especially when attempting to identify cross-assessment weaknesses and produce final course grades. During the course, teachers need to identify subject weaknesses in order to help students who are struggling with a particular topic. This identification often needs to happen across multiple assessment data points and should be considered in comparison to the class’s progress as a whole. When determining grades, fairness to all is essential, but there are special needs for students who did poorly on one exam or had a steadily increasing grasp of the subject. We present eduViz, a visualization tool designed to help teachers explore and assign grades. Teachers can see the trajectory of student scores, the relationship of a particular student to the class, and use categories they have defined in order to filter their assessment information. Query response is immediate and all logical comparisons are possible. Teachers can easily compare their query to the class or per student average as well as view scores by raw point total or percentage. Additionally, eduViz provides a grade assignment interface which allows teachers to view sorted student scores in a scatterplot. This scatterplot is coupled with a unique partition slider which allows users to move color coordinated bands on the scatterplot to indicate grade ranges. As these grade ranges are set, a histogram is updated to show the number of students assigned to each grade range. These features give teachers new and powerful ways to explore and assign grades so that they can better understand student strengths and weaknesses and make the most of the time they have available. Interviews with 16 expert teachers indicate that eduViz is a success across fields, provides teachers with a useful tool to understand and help their classes, and encourages reflective practice. Ó 2008 Elsevier Ltd. All rights reserved. Keywords: Human–computer interface; Improving classroom teaching; Evaluation methodologies; Pedagogical issues; Teaching/learning strategies 0360-1315/$ - see front matter Ó 2008 Elsevier Ltd. All rights reserved. doi:10.1016/j.compedu.2008.01.005 * Corresponding author. E-mail addresses: [email protected] (S.A. Friedler), [email protected] (Y.L. Tan), [email protected] (N.J. Peer), [email protected] (B. Shneiderman). 1 For help videos and code access see http://www.cs.umd.edu/ sorelle/eduviz/. The work of Sorelle Friedler has been supported by the AT&T Labs Fellowship Program. Available online at www.sciencedirect.com Computers & Education 51 (2008) 1467–1485 www.elsevier.com/locate/compedu
Transcript of Enabling teachers to explore grade patterns to identify individual needs and promote fairer student...
Available online at www.sciencedirect.com
Computers & Education 51 (2008) 1467–1485
www.elsevier.com/locate/compedu
Enabling teachers to explore grade patterns to identifyindividual needs and promote fairer student assessment
Sorelle A. Friedler *,1, Yee Lin Tan, Nir J. Peer, Ben Shneiderman
Department of Computer Science, University of Maryland, A.V. Williams Building, College Park, MD 20742, USA
Received 27 August 2007; received in revised form 23 January 2008; accepted 29 January 2008
Abstract
Exploring student test, homework, and other assessment scores is a challenge for most teachers, especially whenattempting to identify cross-assessment weaknesses and produce final course grades. During the course, teachers needto identify subject weaknesses in order to help students who are struggling with a particular topic. This identification oftenneeds to happen across multiple assessment data points and should be considered in comparison to the class’s progress as awhole. When determining grades, fairness to all is essential, but there are special needs for students who did poorly on oneexam or had a steadily increasing grasp of the subject. We present eduViz, a visualization tool designed to help teachersexplore and assign grades. Teachers can see the trajectory of student scores, the relationship of a particular student to theclass, and use categories they have defined in order to filter their assessment information. Query response is immediate andall logical comparisons are possible. Teachers can easily compare their query to the class or per student average as well asview scores by raw point total or percentage. Additionally, eduViz provides a grade assignment interface which allowsteachers to view sorted student scores in a scatterplot. This scatterplot is coupled with a unique partition slider whichallows users to move color coordinated bands on the scatterplot to indicate grade ranges. As these grade ranges areset, a histogram is updated to show the number of students assigned to each grade range. These features give teachersnew and powerful ways to explore and assign grades so that they can better understand student strengths and weaknessesand make the most of the time they have available. Interviews with 16 expert teachers indicate that eduViz is a successacross fields, provides teachers with a useful tool to understand and help their classes, and encourages reflective practice.� 2008 Elsevier Ltd. All rights reserved.
Keywords: Human–computer interface; Improving classroom teaching; Evaluation methodologies; Pedagogical issues; Teaching/learningstrategies
0360-1315/$ - see front matter � 2008 Elsevier Ltd. All rights reserved.
doi:10.1016/j.compedu.2008.01.005
* Corresponding author.E-mail addresses: [email protected] (S.A. Friedler), [email protected] (Y.L. Tan), [email protected] (N.J. Peer), [email protected]
(B. Shneiderman).1 For help videos and code access see http://www.cs.umd.edu/ sorelle/eduviz/. The work of Sorelle Friedler has been supported by the
AT&T Labs Fellowship Program.

1468 S.A. Friedler et al. / Computers & Education 51 (2008) 1467–1485
1. Introduction
Teachers spend between a third and a half of their time preparing, administering, or grading assessments(Stiggins, 1999). The remainder of their time is spent in front of the classroom, preparing classes, talking toparents, helping students individually, performing administrative duties, and doing many other tasks neces-sary during the school day (lunch duty, hall monitoring, etc.). School districts, administrators, parents, andthe teachers themselves hope and expect that after all these tasks are completed, the teachers will still havetime to review assessment results to identify student and class strengths and weaknesses so that strong studentscan be challenged, weak students can be helped, and extra credit can be added to compensate for unusuallydifficult tests. It has long been understood that teacher reflection on student assessment can help students learn(Garfield, 1994). In reality, however, many teachers lack the needed training to effectively assess their students(Doolittle, 2002). Potential reasons for this general lack of understanding include a fear of ‘‘incomprehensiblestatistics and esoteric concepts (Popham, 1998).” eduViz allows teachers to visually explore assessmentgrades so that they can make the most of the information and time available.
Our own interest in this work comes from our experiences as students and as teachers. The first authorspent a year teaching middle school math and all the authors have taught or been teaching assistants forundergraduate courses. Our hope as students is that our work will be examined thoroughly and help willbe offered when appropriate. As teachers, we aim to identify and understand our students’ struggles and suc-cesses. These experiences helped us to appreciate the vast amounts of data teachers attempt to process and theneed for tools to help teachers easily analyze and understand the meaning behind the numbers.
Given the necessity for ease of use and for flexibility of queries based on a teacher’s current interest, therewere some unique spreadsheet and database design issues. Our solutions are explained in Sections 2 and 3.eduViz supports two main functions. The first is grade exploration. In this section, users are able to com-
pare students by any combination of three categories and see the results immediately displayed in bar graphform with markers indicating student or class average. For example, a math teacher could choose to view all ofAlice’s grades organized by assignment and data for word problems and compare her progress to the classaverage. Two exploration components are shown next to each other on the screen so that teachers can easilycompare two queries. For example, a teacher may wonder if the final exam grades for their students were rep-resentative of their progress overall – these two graphs could be examined side-by-side. Grade explorationfunctionality and implementation is described in more detail in Section 4.1.
The second eduViz function is grade assignment. Teachers can create statistics which will weight assign-ments as they prefer – for example, the final exam could be weighted as 30% of the grade. The resulting totalwill be displayed as a scatterplot with student grades sorted in ascending order. Letter grades can then beassigned based on these total scores. A novel multiple ranges slider, partition slider, is provided where eachsliding marker represents a division between grades, and intervals between markers correspond to graderanges. Dragging any marker resizes the corresponding bands of color on the scatterplot, indicating which stu-dents fall within the grade ranges with values below and above the marker. At the same time, the numericalgrades are updated in a visible table and a histogram is updated indicating how many students or what percentof the class is currently assigned each letter grade. To our knowledge, eduViz is the only tool to supportvisual grade manipulation. More information about grade assignment options can be found in Section 4.2.
Though we all have teaching experience, we sought the advice of 16 professional teachers. These werejunior, intermediate, and senior teachers in computer science, biology, and math, and intermediate and seniorteachers in non-technical subjects (e.g. dance, math, education, etc.). Their experiences using eduViz andtheir thoughtful suggestions for improvement are detailed in Section 5. These comments suggest that whileeduViz has room for improvement, it is ultimately a success.
For help videos and code access see our website listed on the bottom of the title page.
1.1. Related work
For the most part, use of computers in computer science education has fallen into two categories; the use ofcomputers to aid student understanding (Byrne, Catrambone, & Stasko, 1999; Chang, Sung, & Chen, 2001;Dewhurst, MacLeod, & Norris, 2000; Kreijns, Kirschner, & Jochems, 2003; Weller, 1996), and the use of
S.A. Friedler et al. / Computers & Education 51 (2008) 1467–1485 1469
computers to help teachers by automatically grading student assignments (for a survey of the second see Dou-ce, Livingstone, & Orwell (2005) Cheang, Kurnia, Lim, & Oon, 2003; Edwards, 2003; Jackson & Usher, 1997;Naur, 1964; Page, 1994; Spacco et al., 2006). eduViz is a tool to aid in teacher understanding of studentgrades, and so it falls into a category of its own with no precisely comparable existing research literature.However, as this is an area of great importance, there are many existing commercial tools.
Existing comparable tools fall mainly into two categories; general use tools with similar capabilities whichare not specifically for an educational context, and electronic grade book tools. Two such general use tools areSpotfire and Excel (Ahlberg, 1996; Microsoft, 2007). Spotfire is an information visualization tool withgreat flexibility. It is capable of generating all the desired graphs. Its drawbacks are that it is not accessible toteachers, since it is designed for industry use. It would also require teachers to create separate spreadsheets notin standard grade book format for each query, which would not easily allow for spur of the moment explo-ration. Excel is a highly useful and accessible spreadsheet application. It is probably used by many teachersalready to create and maintain class information. One great advantage of this tool is that more advanced userscan add logic which would allow them to, for example, drop the lowest quiz grade. Excel has visualizationtools requiring some but not extensive training built in which could help to visualize the already present data.However, these visualization tools also do not allow for equivalent spur of the moment exploration and, whenusing a standard grade book setup, require extra spreadsheet manipulation for visual or numerical comparisonacross categories.
Electronic grade books are now very common. Some examples which mirror most basic Excel capabilities,but add a few teacher specific features like per student progress reports are MyGradeBook, Gradelink,OnCourse Systems, Class Action Gradebook, and MathZone (CalEd Software, 2007; Gradelink,2007; McGraw-Hill Higher Education, 2007; Oncourse Systems for Education, 2007; Pearson Education,2007). These tools have the advantage of being designed to perform the tasks that teachers desire, so teachersdo not need to perform additional steps or reformat the data in order to get the information they need. Someof these tools (Class Action Gradebook and MathZone) also perform basic visualization actions – theyallow student progress to be viewed as bar graphs or pie charts. However, they do not allow easy comparisonof a student against the whole class. Turnitin (iParadigms LLC, 2007) is another grade book tool, howeverits visualization options are more extensive. Along with basic bar graphs and pie charts, it allows teachers toview individual student grades over time as compared to the class average and maximum possible points. Thisis the most advanced existing grade visualization tool that we know of. However, the view which includes theclass average and maximum is graphed over discrete time or assignment intervals, but uses a line graph so thatthere is a misleading impression that there is a class average at intermediate time values. Turnitin also hasthe limitation that it does not allow teachers to dynamically explore their grades and design their own queries.
Extensive research has also been done on the decision making process. For a grade book and visualizationapplication, decision making literature is relevant when letter grades are assigned. One of the best known andoften used choice methods is the analytic hierarchy process (McCaffrey, 2005). This process requires users todetail their hierarchy of desires and weight these wishes. For example, when deciding on a vacation, you mightweight minimizing the cost as three times more important than the location. These weights are then put into amatrix and analyzed using linear algebra techniques to help decision makers arrive at a logical choice. In aneducational and grading context, the hierarchy is often collapsed so that test grades are based only on one levelof the hierarchy (the questions on the test) and final grades are also based on only one level of the hierarchy(the tests). The complete hierarchy process is therefore not required, but the idea of weighting options (tests)differently is frequently used by teachers. eduViz allows teachers to easily manipulate these percentages andresults are immediately displayed in a context which allows teachers to examine the consequences of thesechoices and change their minds accordingly. In this way eduViz also supports the sense-making loop: Usersbegin by giving their students assessments (gathering information), then examine their information using theexploration tools (they re-represent it), then begin to understand their students’ strengths and weaknesses(develop insight) and finally assign grades (produce results) before starting the loop again (Thomas & Cook,2005).
Range sliders have long been used in visualization applications. Traditional range sliders (Ahlberg & Shnei-derman, 1994; Li & North, 2003) allow a subrange on the slider to be specified by confining it between highand low draggable markers. Data visualization sliders (Eick, 1994) utilize the space inside the slider to convey
1470 S.A. Friedler et al. / Computers & Education 51 (2008) 1467–1485
additional information about the selected data linked to the slider. They also support defining multiple inter-vals dynamically. Treemap (Chintalapani, Plaisant, & Shneiderman, 2004) uses a color binning slider which iscloser in spirit to our approach. It allows dynamically adding and removing draggable bin separators as wellas precisely setting their position by specifying their value in an associated edit box.
1.2. Main contributions
eduViz addresses the limitations of current general visualization tools by allowing teachers to do gradebook specific tasks and to view information by categories that they have assigned without needing to do addi-tional data manipulation. Thus, eduViz is more teacher-friendly than a general tool. eduViz also improveson existing teacher focused grade book tools by allowing advanced visualizations and visual exploration ofdata. Teachers are not limited to a particular set of options, but can view any subset or combination of thedata in which they are interested. In addition, they can compare data using our two exploration panels placedside-by-side or by viewing the data against the class or per student average. Our emphasis on the tools andease of use the teacher needs, combined with the flexibility and power of a general visualization tool makeeduViz unique.
In addition, there are several distinguishing attributes of our partition slider. First, our slider is applicableto general partition selection situations and it makes efficient use of space allowing the placement of multiplesuch sliders within one view. This compact form naturally extends to potentially turning any axis of a Carte-sian coordinate system into a partition slider. For example, making the y-axis of a scatterplot a partition slidercould be useful, though we do not extend the slider in this way in eduViz. Second, in our design the rangesbetween markers are first class objects, each having a distinct color. Thus, the movement of each marker canbe visually correlated with selection in other widgets (e.g., the bands in the grades scatterplot with the corre-sponding color). Finally, our placement of the marker grip closer to the axis will improve the accuracy of par-titioning using the mouse, as it avoids eye movement. To our knowledge, this is the first use of a partitionslider of this form.
2. Spreadsheet design
Our user input spreadsheet format is designed to accommodate both manual and automatically generatedinput. It mimics common grade book formats for easy import. User input is in the form of a.csv spreadsheet inwhich the first column contains student names and the first three rows contain category information. Thefourth row contains the total number of points possible for that entry. All other cells contain scores whichpertain to that student in those categories. If users do not want to use all three category possibilities theycan leave the extra row(s) blank. See the spreadsheets in Fig. 1 for examples.
The categories referred to here are user defined. For example, users may choose to record informationabout the type of assignment (test, quiz, project, etc.), the question number, and the subject tested. Or, theymay wish to record the date of an assignment instead. We leave these choices up to the users to allow for thegreatest flexibility of use – they may choose and enter information about any three categories of data that theyhave recorded. However, we do restrict this number to three, which is a reasonable restriction to the depth ofcategorization of a score given the domain. In future versions, we hope to allow this number to be dynamicallyset by creating an interface which would allow users to enter their data directly into eduViz.
3. Database design
The database allows three user defined categories as well as students, scores, and maximum possible pointsto be tracked. These categories were made purposefully independent – no hierarchical assumptions are made.It is important for this application to maintain this independence so that teachers can use eduViz for thelargest number of queries. For example, a teacher may want to know how all students did on the latest testand want to see that broken down by category within the test or they may want to see how students did on asubject and want to see that broken down by test within that subject. Our database design is correspondinglyindependent. Each score is stored in its most basic, most specific form. The unit which is stored in the scores
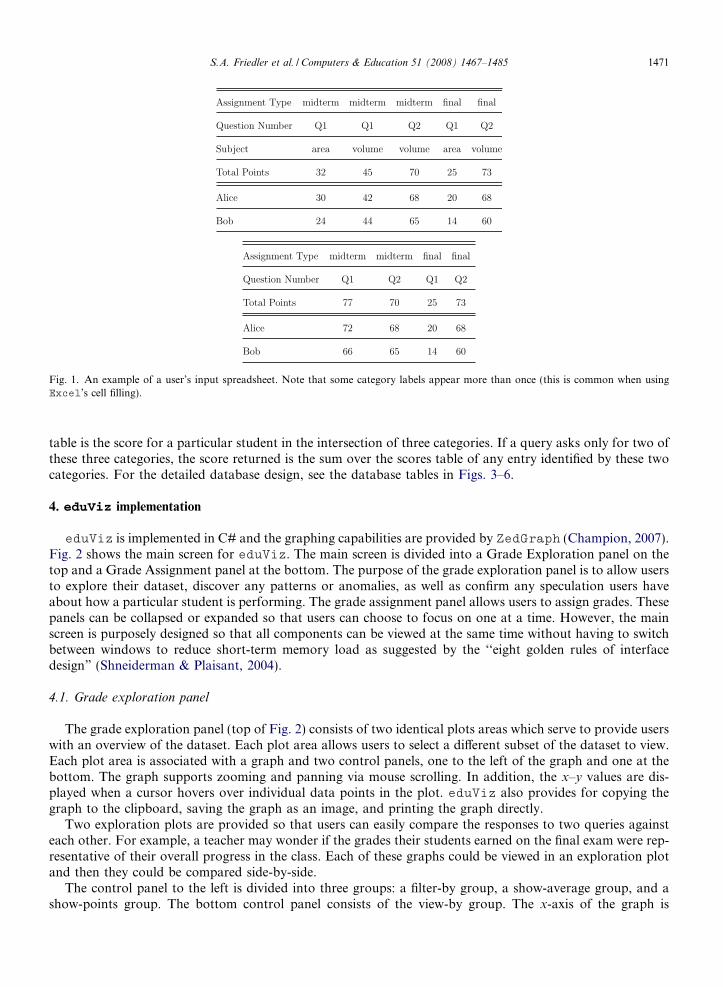
Fig. 1. An example of a user’s input spreadsheet. Note that some category labels appear more than once (this is common when usingExcel’s cell filling).
S.A. Friedler et al. / Computers & Education 51 (2008) 1467–1485 1471
table is the score for a particular student in the intersection of three categories. If a query asks only for two ofthese three categories, the score returned is the sum over the scores table of any entry identified by these twocategories. For the detailed database design, see the database tables in Figs. 3–6.
4. eduViz implementation
eduViz is implemented in C# and the graphing capabilities are provided by ZedGraph (Champion, 2007).Fig. 2 shows the main screen for eduViz. The main screen is divided into a Grade Exploration panel on thetop and a Grade Assignment panel at the bottom. The purpose of the grade exploration panel is to allow usersto explore their dataset, discover any patterns or anomalies, as well as confirm any speculation users haveabout how a particular student is performing. The grade assignment panel allows users to assign grades. Thesepanels can be collapsed or expanded so that users can choose to focus on one at a time. However, the mainscreen is purposely designed so that all components can be viewed at the same time without having to switchbetween windows to reduce short-term memory load as suggested by the ‘‘eight golden rules of interfacedesign” (Shneiderman & Plaisant, 2004).
4.1. Grade exploration panel
The grade exploration panel (top of Fig. 2) consists of two identical plots areas which serve to provide userswith an overview of the dataset. Each plot area allows users to select a different subset of the dataset to view.Each plot area is associated with a graph and two control panels, one to the left of the graph and one at thebottom. The graph supports zooming and panning via mouse scrolling. In addition, the x–y values are dis-played when a cursor hovers over individual data points in the plot. eduViz also provides for copying thegraph to the clipboard, saving the graph as an image, and printing the graph directly.
Two exploration plots are provided so that users can easily compare the responses to two queries againsteach other. For example, a teacher may wonder if the grades their students earned on the final exam were rep-resentative of their overall progress in the class. Each of these graphs could be viewed in an exploration plotand then they could be compared side-by-side.
The control panel to the left is divided into three groups: a filter-by group, a show-average group, and ashow-points group. The bottom control panel consists of the view-by group. The x-axis of the graph is

Fig. 3. Contains the list of all students taken from column 1 of the input spreadsheet.
Fig. 2. The main screen of eduViz. The top panel allows side-by-side exploration of grades based on user defined categories (Date,Assignment, and Subject in this example). Information can be filtered and distinct views chosen so that the user can compare grades asdesired. The bottom panel allows grade assignment using the partition slider shown on the bottom left. The resulting grades are shown inthe scatterplot (bottom left) and histogram (bottom right).
1472 S.A. Friedler et al. / Computers & Education 51 (2008) 1467–1485
determined by the user’s selection in the view-by group while the y-axis is determined by the selection in theshow-points group.
4.1.1. Control panel
(1) The filter-by group allows users to filter the dataset by any combination of student and the three cate-gories in the dataset.
(2) The show-average group allows users to determine, for a given view, whether the average for the class orthe student is displayed.

Fig. 4. Contains the list of all categories taken from row 1 of the input spreadsheet. For example, all assessments the class was graded on.The description is taken from the first cell of row 1. Tables for categories 2 and 3 are constructed similarly.
Fig. 5. Contains a list of the maximum scores which could be earned in each subcategory. For example, the maximum points that could beearned on the midterm on question 4 for computation.
Fig. 6. Contains a list of the scores given to students for each category.
S.A. Friedler et al. / Computers & Education 51 (2008) 1467–1485 1473
(3) The show-points group of radio buttons allows users to plot either the raw data values or percentages.(4) The view-by group provides users with the option of projecting the filtered data onto different views and
to selectively see each of the views.
4.1.2. Supported functionality
We will illustrate how the functionalities provided by the graph exploration panel can be used to achieve afew example tasks using a sample dataset collected for a period for three months where each student hasgrades for assignments which are identified by date, assignment type, and subject. Multiple assignmentscan be assigned for each date, and assignments can be of different types (e.g. homework, daily quiz, test cor-rection, etc.). Subject refers to the material covered by the assignment. The date, assignment type, and subjectmap naturally to unique categories in eduViz.
Users who are exploring this dataset may be interested to see how the class as whole did in each assignmenttype. eduViz supports this by allowing users to view the (unfiltered) dataset by assignment type. Alterna-tively, users may also want to see how the class did by subject material. This can be accomplished by selectingthe subject view on the same (unfiltered) dataset.
Users may also want to see how a particular student, say Amy, is doing in class. Users can filter the datasetby Amy and then select either the assignment type or the subject view depending on whether they are inter-ested in seeing Amy’s performance in the different types of assignments or material covered in class. Users can
1474 S.A. Friedler et al. / Computers & Education 51 (2008) 1467–1485
compare Amy’s performance on each of the components of the assignment type (or subject) category to theclass by selecting to show the class average. The class average for each of the category components will beplotted on the same graph. Alternatively, users can compare Amy’s performance on various assignments orin various subjects to her own average by selecting to view the student average. In this case, the student aver-age is simply a straight line across the graph.
4.2. Grade assignment panel
The grade assignment panel (bottom of Fig. 2) consists of two plot areas, a scatterplot and a histogram.The scatterplot is based on a derived statistic while the histogram shows the number or the percentage of stu-dents that fall in each grade category. Both the scatterplot and grades histogram are displayed after users spec-ify a derived statistic on which the grades would be assigned.
One of the main design objectives was to use a unified color scheme for the different parts of the gradeassignment panel. By having the scatterplot, histogram, partition slider, and grades grid all ‘‘speak” the samecolor language, the coordination between them is significantly enhanced and emphasized. Using consistentcolors for different grades makes it easier to correlate various views of the same data. The multiple views worktogether by having changes reflect in all of them simultaneously. For example, manipulating the partition sli-der makes the grade bands in the scatterplot resize accordingly, the values in the grades grid update, and thehistogram bins show the current grade distribution. Our choice of colors was based on the convention of usingred to signify caution, or in our case a failing grade. Green was chosen to symbolize a grade of A since it hasgood and desirable connotations. Matching colors for the other grades were chosen using Color Brewer (Har-rower & Brewer, 2003).
4.2.1. Scatterplot with bands
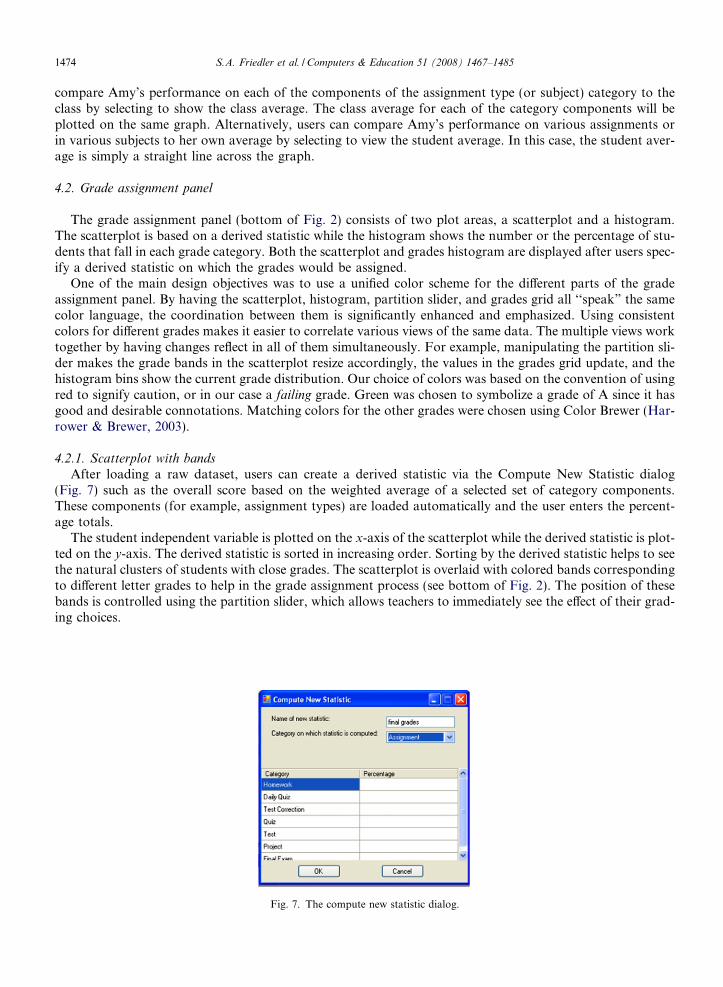
After loading a raw dataset, users can create a derived statistic via the Compute New Statistic dialog(Fig. 7) such as the overall score based on the weighted average of a selected set of category components.These components (for example, assignment types) are loaded automatically and the user enters the percent-age totals.
The student independent variable is plotted on the x-axis of the scatterplot while the derived statistic is plot-ted on the y-axis. The derived statistic is sorted in increasing order. Sorting by the derived statistic helps to seethe natural clusters of students with close grades. The scatterplot is overlaid with colored bands correspondingto different letter grades to help in the grade assignment process (see bottom of Fig. 2). The position of thesebands is controlled using the partition slider, which allows teachers to immediately see the effect of their grad-ing choices.
Fig. 7. The compute new statistic dialog.

S.A. Friedler et al. / Computers & Education 51 (2008) 1467–1485 1475
4.2.2. Partition slider
eduViz currently provides a default set of five grade categories (A, B, C, D, and F). Correspondingly, thereare four markers on the partition slider interspersed between five color bands. Coordinated color bands arealso overlaid on the scatterplot, showing the boundaries of each grade category (see Fig. 8). These bands helpusers visualize the cutoff points for the grades. The range for each grade category can be manipulated using thepartition slider since each band separation in the scatterplot is synchronized with one marker on the slider.That is, dragging a marker on the slider, updates the position of the two corresponding bands on thescatterplot.
The numerical values in the grades data grid as well as underneath each marker in the slider show the cutoffscores for each grade category. The grades grid also shows the letter grades corresponding to the differentscore ranges. Manipulating the partition slider causes the histogram and bands in the scatterplot to be updatedas shown in Fig. 8 part A (before, with markers set at 60, 70, 77, and 84) and part B (after, with markers set at60, 68, 82, and 88). All parts of the display are updated dynamically as the markers are being dragged.
The scatterplot superimposed with bands helps users who do not want to know just the percentage of stu-dents that fall into each category, but also if there are any clusters that might be divided into two when a gradecutoff is set. For instance, in the scatterplot section of Fig. 8, if there is an obvious cluster of students withoverall scores between 77 and 83, and a cluster of students with overall scores between 70 and 76, the usermay, on looking at the cutoff scores, decide that it is not desirable to break the 77–83 cluster at 80 and wouldrather give every student in that cluster a B grade. Similarly, selecting the A grade at the range of 84–100 isshown to be a logical choice because it preserves a cluster at about 84–86 that is significantly different fromthe next lower cluster of scores.
Fig. 8. Manipulating the partition slider updates the histogram and scatterplot dynamically. Top (A) and bottom (B) show the view beforeand after the change, respectively.

1476 S.A. Friedler et al. / Computers & Education 51 (2008) 1467–1485
4.2.3. Histogram
The purpose of the grades histogram (Fig. 8) is to help users see the number or percentage of students thatfall into each grade category based on the ranges specified using the partition slider. This visualization is par-ticularly helpful to users who are grading on a curve, as it allows them to adjust the slider to achieve thedesired grades distribution.
5. Domain expert consultations
While constructing and testing eduViz, we had the opportunity to work with 16 teaching domain experts.The goal of these interviews was not experimental, but to glean informal advice, criticism, and suggestionswhich would allow eduViz to evolve and improve and would allow us to assess the achievement of our goals.These expert reviews were conducted in the vein of the ‘‘cognitive walkthrough” as described in (Shneiderman& Plaisant, 2004) where experts carry out the common tasks of the software and meet with the developers todiscuss their experience.
The 16 experts we interviewed fell into three categories based on their years of teaching and grading expe-rience; those at Associate or Full Professor rank or with more than 7 years of experience (who we will refer toas ‘‘senior experts”), those with between 6 semesters and 7 years of experience (who we will refer to as ‘‘inter-mediate experts”), and education students who have completed student teaching (who we will refer to as‘‘junior experts”). These experts were diverse in their subject field of expertise. Among the eight senior experts,half were from technical fields (including computer science and mathematics) and half were from social sci-ences or humanities (including dance, german, education, etc.). The six intermediate experts were similarlysplit, with half from technical fields and half from social sciences and humanities. The two junior experts weretraining to be teachers of mathematics. We met with each of these experts once individually towards the end ofour development process. Half of these 16 experts were interviewed in a first round of interviewing; half wereinterviewed after software updates were made.
5.1. Discussion format
Our discussions with these 16 experts were somewhat structured, though they allowed for frequent interjec-tions and guidance by the experts. We interviewed these experts one-on-one for a total of 30 min to an houreach. One developer and one expert were present at each interview, and the developer took observational notesby hand. While exploring, the experts were encouraged to talk about what they were experiencing and doingand were prompted to do so when they fell silent. The general format was as follows:
(1) Explanation and introduction to eduViz: First we explained our basic goals which were to allow teachersto explore grades and get an understanding of their students’ strengths and weaknesses and allow teach-ers to assign grades. Next we described the example dataset that we used to demonstrate the tool. Thiswas a detailed grade book spreadsheet from three months of an 8th grade math class which the firstauthor taught in Spring 2005. The dataset includes three categories associated with each grade – the datethe assignment was due, assignment type, and subject covered on that assignment. The total and indi-vidual scores were also provided in the spreadsheet format given in Section 2. Student names were chan-ged to provide anonymity.
(2) Guided introduction to eduViz: To provide users a basic introduction to the tool, we explained how todo the following tasks and asked them to perform the actions. Each action was accompanied by anexplanation of the general interface and the current display.
(a) Load file.(b) Choose a specific student to view.(c) Choose to view-by assignment.(d) Choose to show the average per class.(e) Create a new statistic for the class total scores.(f) Use the partition slider to manipulate grades and make the histogram change.
S.A. Friedler et al. / Computers & Education 51 (2008) 1467–1485 1477
(3) Guided exploration of eduViz: Our experts were then given some suggestions of questions they could tryto answer about the dataset. This was done so that they could see for themselves the kinds of explorationand discoveries that are possible with eduViz. When experts had trouble viewing the information in theway they wished, we reminded them of the options and basic functions and helped them find the appro-priate solution. Here are some examples of the questions we offered.
(a) Find a student who was below the class average for every assignment type.(b) Find a student who did much worse on geometry than their usual progress.(c) Did the final exam grades reflect students’ progress throughout the class?(d) Why is the class average for March 22nd lower than usual?(4) Unguided exploration and feedback: Finally, we allowed experts to explore the tool on their own whilethinking about any feedback they had for us. In order to elicit a more extended, thoughtful, and consis-tent response from all experts, we made sure to ask each expert the following questions.
(a) What do you think of the exploration section?...of the grade assignment section?(b) What else would you like the tool to have?(c) What was confusing?(d) What was beneficial?(e) How does eduViz compare to other tools that you’ve used or know about? Benefits/disadvantages?(f) Is there anything else we should think about or that you want to share?
5.2. Expert feedback
Throughout this section we will use a naming system to provide information about which experts made thefollowing comments. The first set of one or two letters refer to the experience level of the expert (‘‘SR” forsenior experts, ‘‘I” for intermediate experts, and ‘‘JR” for junior experts). The second set of letters refer tothe discipline in which that expert teaches (‘‘T” for technical fields and ‘‘NT” fields in the social sciences orhumanities). The suffix contains one number which distinguishes between multiple experts with the same back-ground and one letter which distinguishes between the two rounds of interviews (‘‘A” for experts interviewedin the first round of interviews, ‘‘B” for experts from the second). A full naming might be ‘‘SR_NT_2B” for anexpert interviewed in the second round of interviews who was the second senior expert in a non-technical field.We begin by categorizing the expert responses thematically and then move to more anecdotal descriptions andanalyses of the interviews based on these categorizations.
Using thematic interview analysis (Rubin & Rubin, 2004; Kvale, 1996) we categorize the feedback given bythe experts with the codes as described in Fig. 9. This coding scheme allows categorization of general com-ments as well as comments specific to the grade exploration, assignment, and help sections. Within these spe-cific areas comments were additionally described as positive, negative, or suggestive improvement commentson specific features a s well as a few descriptive usage comments.
For additional analysis, the codes were grouped according to their broader categorizations – positive, neg-ative, or suggestive improvement comments. These broader categories included the codes ending in ‘‘GOOD,”‘‘BAD,” and ‘‘IMPROV” respectively, except for the codes beginning in ‘‘COMPETITOR,” since the goal ofthis analysis is to evaluate eduViz. These broader groupings were then analyzed for trends based on the dif-fering expert characteristics. A chart giving the number of comments of each type as normalized based on thetotal number of experts with the given characteristic is shown in Fig. 10.
5.2.1. General impressions
General feedback and impressions of eduViz by our 16 expert consultants were positive. They includedthe comments ‘‘I like this program” and ‘‘It is something I would consider purchasing” (SR_NT_2B), ‘‘Iwould use this” (I_T_3B), ‘‘I like the concept” (SR_NT_3B), and other similarly positive comments. Oneexpert additionally expressed the desire to get the final version to share with colleagues (SR_NT_1A). These

Fig. 9. The code names and associated descriptions used to categorize interview comments.
Fig. 10. Numbers of comments for type of comment and characteristic of expert. Normalized by dividing the total number of commentsby the number of experts with that characteristic. Parenthesized values indicate total number of experts or comments per category.
1478 S.A. Friedler et al. / Computers & Education 51 (2008) 1467–1485
general positive comments were coded as ‘‘EDUVIZ-GOOD,” and there were 61 such comments overall, anaverage of 3.8 comments per expert. Despite these comments, some experts were worried that parts of the toolmight not be useful for their needs and encouraged us to make improvements. This interest in our tool led theexperts to make a total of 93 suggestive comments about eduViz. These were skewed so that that seniorexperts had more recommendations to offer than those with less teaching experience – this trend held for inter-mediate experts as compared to junior experts as well. Overall, the teachers seemed excited and interested in

S.A. Friedler et al. / Computers & Education 51 (2008) 1467–1485 1479
the prospect of a new tool which could potentially make assessment easier, but wary that the tool would actu-ally cause more work than their current method. A few also commented that because their classes are smallthey do not need information of this detail (SR_T_4B, SR_NT_4B), though SR_T_4B later commented thateduViz might be a tool which initially seems unnecessary but once available becomes something you use allthe time. Perhaps this observation is more simply summed up by JR_T_1A’s comment that ‘‘this is fun!”
The experts we spoke to were enthusiastic about the possibility of being able to visualize their student data.A benefit of the simplified analysis process is that it supports in-depth and exploratory student evaluation. Itallows teachers not just to assign grades, but also focus attention and intervene to assist students. One pro-fessor of education wanted to make sure that eduViz made these links to the real world clear and suggestedincorporating these options into the help videos (SR_NT_3B). The experts envisioned many other ways to useeduViz as well. Two experts mentioned the advantages of being able to compare a current class against pre-vious classes’ performance on comparable assignments (SR_NT_1A, I_T_1A) – this is something that edu-Viz can do if the class semester is chosen as one of the three optional categories. Another expert commentedsimilarly that it would be useful to compare multiple sections of the same class against each other, especially ifworried about the comparative grading of different sections’ teaching assistants (I_T_3B). SR_T_4B suggestedthat eduViz could be used to investigate disparity in performance between tests and homework, when stu-dents complain that they ‘‘freeze” under the pressure of exams. Another use he suggested was middle or highschool teachers using eduViz to prepare for parent teacher conferences. Finally, he identified three wayseduViz could be used to increase teacher effectiveness: identify individual student problems, see problemsthat the class is having as a whole, and see issues that the teacher is having. One expert, who studies educationprofessionally and is interested in teacher training, said that eduViz will encourage teachers to be ‘‘reflectivepractitioners” and that it motivated her to change her practices (I_NT_2B). Expert SR_NT_3B also saweduViz as a tool that could be used in teacher training programs and commented that it could also be usedfor more general research by rendering descriptive demographic displays which are not necessarily gradesrelated.
While some experts were skeptical about this tool, worried that it would create more or unnecessary work,others found it appealing that eduViz saved them a lot of calculations. Data analysis that is normally laborintensive was made easy. ‘‘Since you do not have to average or calculate anything, it is really useful, and younever need to do anything other than input (I_NT_1B).” I_NT_3B commented that eduViz ‘‘does the com-puting for you” and presents an ‘‘easy visual so you do not have to consider numbers.” Other experts havecommented that for the benefit it provides it would not take too much extra time and so would be possibleto use (I_T_3B, I_NT_3B), though they did not comment directly on the benefit provided by the automaticcalculations. Many of these experts already have established methods and tools for avoiding manual laboriouscalculations – they mostly use Excel or another competitor tool to help calculate averages and other classstatistics.
In addition to the critiques we received about eduViz, our experts had a plethora of suggestions forenhancing eduViz. Many of these suggestions are given below in the context of the specific section to whichthey refer. However, some suggestions are more broadly applicable and we include those here. Several inter-viewees wanted to see greater intelligence injected into eduViz, bordering sometimes with an expert systemapproach. This included suggesting a selection of interesting views to look at (I_NT_2B, I_T_3B) and a listof suggested real world remedies (SR_NT_3B). I_NT_1B recommended automatic grade anomaly detectionto find grade input mistakes, and SR_T_2A and SR_NT_2B wanted the means to readily see which studentsimproved most. Several experts wanted to be able to view and edit grades directly from within eduViz
(I_NT_2B, SR_NT_4B) and also synchronize with other software (e.g., Excel or specialized gradebook sys-tems). Synchronization with online servers would be useful for students to track their own performanceand progress (I_T_3B, SR_NT_2B). In addition there were a number of smaller requests inherent to the dis-cipline: SR_T_2A, SR_NT_2B, and SR_T_4B desired native support for extra credit that does not go into theoverall percentage, and the ability to select multiple students for comparison was requested by SR_NT_3B.The excitement over the tool and the ability to suggest electronic teaching needs to a receptive audience alsoled to many suggestions outside the scope of this project which would push eduViz to become an all-in-onetool to help teachers manage everything from attendance to communication with students to complex statis-tical analyses (SR_T_2A, SR_T_3A, SR_NT_1A, I_NT_1B, SR_NT_2B).

1480 S.A. Friedler et al. / Computers & Education 51 (2008) 1467–1485
5.2.2. Comparison with other tools
Currently, the 16 experts we interviewed use Excel, Blackboard, WebCT, department run grading andsubmit servers, and paper grading books as their tools of choice. One professor who was especially impressedby eduViz mentioned that she had tried other tools, but found them frustrating to learn and use(SR_NT_1A). In general, users of Excel did not use the graphing feature since they found it to be too timeconsuming and confusing (SR_NT_1A, I_T_2A, JR_T_2A, SR_NT_2B). One expert commented that hisdepartment’s grades server can assign grades but does not show the histogram which would be useful(SR_T_1A), though another expert who uses the same grades server said that the functionality is sufficientfor the level of effort in evaluation he can afford to spend (SR_T_4B). Two users of the Blackboard systemindicated that the statistics are given numerically, making any visual comparison of student performance hardto do (I_NT_1B, I_NT_2B) since the graphing capabilities of Blackboard are restricted and do not exist forgrades (I_NT_1B). While WebCT does include graphing capability, I_T_3B commented that its visualizationchoices are not as dynamic or ‘‘intuitive” as those provided by eduViz. However, eduViz does not allow forcomplex cell formulas as Excel does (I_T_2A) or for students to access their grades as they are entered into thespreadsheet as Blackboard, WebCT, and the department run servers do (I_NT_1B) and some experts notedthat these functions are also desirable (I_T_3B).
Though some experts commented that figuring out how to best use eduViz would take some time, they feltpractice would make the usage clear (I_T_3B, JR_T_2A). Other experts found the point and click interface‘‘inviting” (I_NT_2B) and disagreed with the idea that using eduViz would take practice saying, ‘‘I like thatit is so intuitive and you do not have to go back to the help pages (I_NT_3B).” One professor verified theresearch which shows that teachers spend much of their time grading assessments by her comments that ‘‘Ireally struggle because I know that whether I say B+ or A- makes a big difference” and ‘‘my guess is that thisis where a lot of professors spend their time.” She was especially excited that eduViz would save her time andallow her to reason about and justify her grades more effectively (SR_NT_1A). Overall, eduViz couldempower these teachers to perform comparisons and analysis that they rarely do (I_NT_2B).
5.2.3. Spreadsheet, database, and visual design
Our spreadsheet design was purposefully made to be similar to a grade book so that teachers would find iteasy to input grades in their usual format. Our experts verified that we had chosen an appropriate formatwhich mimicked the grade books that they keep. We also designed our database with a great amount of hier-archical flexibility. Many of the experts commented on this flexibility, appreciating that eduViz is ‘‘capableof doing logical comparisons by anything you want (SR_T_3A),” that you can ‘‘tailor it to what you want tosee (I_T_3B),” that eduViz is flexible and allows comparisons ‘‘across all parameters (I_NT_3B),” and thatyou can compare ‘‘anything (I_NT_2B).” One commented that it is necessary to have this level hierarchy inorder to examine the strengths and weaknesses of individual students (SR_NT_1A). Our experts strongly sup-ported our database design choices.
The 16 experts also appreciated many of our design choices. We especially concentrated on reducing short-term memory load by creating a single screen display as suggested by the eight golden rules of (Shneiderman &Plaisant, 2004). This single screen display and the logical grouping within it was specifically complimented byI_T_3B and SR_T_3A. In addition, several experts complimented the ‘‘clean, simple interface (SR_T_4B),”saying that it ‘‘looks pretty and clear (SR_NT_4B),” and appreciating the easy access to different graph plots(JR_T_2A, I_T_2A).
5.2.4. Grade exploration panelThe experts we spoke to made many specific comments about the grade exploration section regarding gen-
eral layout, functionality, and specific features. We will not list all of these comments here, but will give a gen-eral sense of the trend of the issues and benefits of the current version of eduViz. Many experts commented,as mentioned earlier, that they appreciated the functionality of the grade exploration panel – allowing them toevaluate individual student performance on particular topics (SR_T_4B), compare students against themselvesand the class (SR_NT_2B), and examine different slices of the data (SR_T_2B, SR_NT_4B).
Some users were confused about the difference between the data selection options and the view-by optionsand could not figure out how to find the view they wanted (SR_T_1A, I_NT_1B, I_NT_2B, SR_NT_4B). The
S.A. Friedler et al. / Computers & Education 51 (2008) 1467–1485 1481
interaction of these data viewing and filtering options can lead to degenerate graphs that are of little interest –expert I_NT_1B suggested that eduViz could warn users if they were going to reach one of those views. How-ever, as noted earlier, experts commented that after practice they believed this would become easier and somecontradicted the negative comments by stating that the interface is intuitive. To address this confusion, wereorganized the layout to make the view-by buttons more visible and added help videos. Several experts alsocommented that the side-by-side comparison requires back-and-forth eye movement and this could be avoidedby using double bars (SR_NT_2B, SR_NT_3B, I_NT_2B, and SR_NT_4B). One expert commented on thecurrent default value of zero which is given to any missed assignments (a student with no homework scoreis by default given a zero) (SR_T_2). We had originally thought that this could be a useful way for teachersto identify students with missing work; a student with an unusually low score for an assignment as comparedto the class average may have never turned it in. However, after discussion with this expert, it seems that thisuse is not readily apparent. If eduViz is also used as a grading tool, this assumption of zero may even beunfair to the student. In future versions of eduViz we will allow the teacher to choose if the default valueshould be zero or if a flag should be set so that missing work is clearly and visually marked. In addition tothese comments, there were also suggestions about general panel organization (I_NT_1B, I_T_3B,SR_NT_4B) and additional data filtering options (SR_NT_3B, SR_NT_2B).
5.2.5. Grade assignment panel
Several experts appreciated the visual clarity of the grade assignment panel – I_NT_2B found the bottompanel easy to process immediately, aided by the choice of colors, and I_T_3B also singled out the color schemeas a useful feature. The control of the grade divisions by the partition slider was also complimented (I_NT_1B,JR_T_1A). The ability to easily visualize grade distribution is also a valuable contribution of this section(I_T_3B).
Several suggestions for improvement were proposed. SR_NT_2B would like to be able to automatically seewhere to break the grades in order to achieve a normal curve, and visualize how far the chosen grade binning isfrom a normal curve. SR_T_4B, more generally, suggested superimposing different statistics. Experts alsowanted more individualized manipulation of grading statistics. For example, SR_T_3A wanted to be ableto drop a student’s lowest quiz grade and SR_T_1A would like support for curving individual assignmentsbefore averaging the grades, due to variations in standard deviation between assignments. In future versionswe will address this by allowing teachers to overwrite the general class assignment weights with differentweights for individual students as well as by adding a basic programming language. We also had a few requestsfrom our first round of interviews to sort the grades in the scatterplot by ascending order so that clusterswould be more apparent (JR_T_1A, SR_T_1A, SR_T_2A) and to change our original cutoff lines to bandsof color showing grade ranges (I_T_2A, SR_T_2A). We changed this section and accompanying partition sli-der and histogram accordingly.
Our discussions with the experts crystallized the distinct user types of eduViz and their varying needs.Experts felt that for users who grade by curve the grade assignment part of the interface would be particularlyhelpful, especially if it saved them manual Excel work (I_NT_3B). These users were treating the grading pro-cess as an approximate clustering algorithm, trying to assign the same letter grade to a group of students withsimilar overall grade. For these users, usually the ability to change weighting of different assignments is of littlevalue, since instead of using this repetitive trial-and-error process they can more conveniently move the gradescutoffs to achieve the desired effect (SR_T_1A).
Other users, who use fixed cutoffs, required the weighting manipulation interface. However, even they com-mented that they are bound by published weights for each assignment category (e.g., for quizzes, projects,homework, etc.) but can manipulate freely the weighting of individual assignments within each category(I_T_1A). Some of these users pointed out that eduViz could help them better choose test questions inthe long run, allowing them to spot aberrations that may point to problematic questions or topics that needto be taught differently (Walvoord & Anderson, 1998) (I_T_1A).
5.2.6. Usability
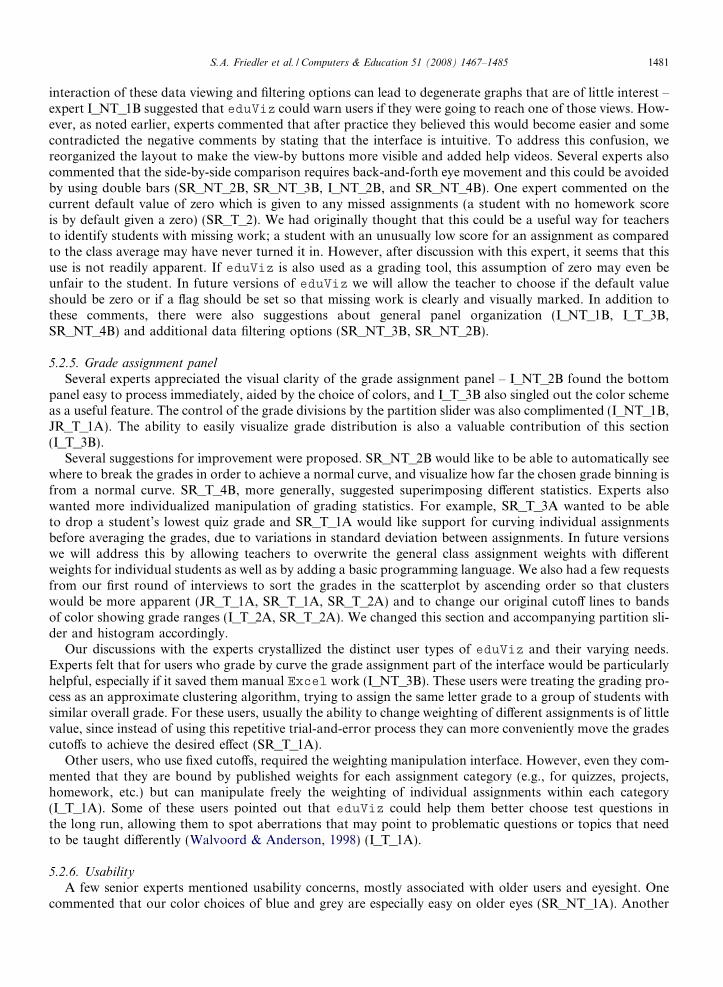
A few senior experts mentioned usability concerns, mostly associated with older users and eyesight. Onecommented that our color choices of blue and grey are especially easy on older eyes (SR_NT_1A). Another

1482 S.A. Friedler et al. / Computers & Education 51 (2008) 1467–1485
mentioned that the radio buttons being used to change views were too small to see easily (SR_T_3). There arealso usability concerns with respect to platform, since eduViz is written in C# and so works only on Win-dows machines. Experts who work on a Macintosh were especially disappointed by this(SR_NT_1A,.SR_NT_2B).
5.2.7. Scalability
Another problem which has the potential to limit usability is the issue of scalability. Two experts in the firstround of interviews worried that eduViz would not be able to handle the datasets they work with containing,potentially, 100–200 students and numerous assignments (I_T_1A, SR_T_2). We have since tested eduViz ona dataset of over 100 students and found the response times to be observably similar to the times for smallerdatasets. While the bars on the graphs for this larger dataset were very thin, they were still able to fit on thescreen and eduViz has zoom capability for users who want to see individual bars more clearly (Fig. 11 showsthe effect of using zoom on a large dataset). The default layout splits the screen into four sections with onegraph per section, but these sections can be hidden (i.e. collapsed) or resized to cover the entire screen. Largerdata sets can also be understood by using the filtering and sorting options provided. Given the applicationdomain and therefore, the constraints on the number of students or assignments, this amount of scalabilityseems reasonable. The constraint that is more likely to limit the usage of eduViz under scalability is the con-straint on the teacher’s time. In future versions, we hope to implement a rank-by-feature framework to helpidentify struggling students (Seo & Shneiderman, 2005). This would allow teachers to avoid searching throughlarge class data themselves for unusual or troubling grades. Still, as noted by one of our experts, even withoutthe rank-by-feature framework, eduViz could prove useful to professors who have teaching assistants do
Fig. 11. Using zoom (top-right view) on a large dataset.

S.A. Friedler et al. / Computers & Education 51 (2008) 1467–1485 1483
their grading and therefore can sometimes lack insight into understanding their students’ progress. Since edu-Viz can handle large classes, this exploration could be very useful to the teacher (I_T_1A). In our secondround of interviews, multiple experts pointed out that eduViz would actually be especially useful when deal-ing with many data points (students or assignments) since it would help to filter and understand the data(SR_NT_4B, I_NT_1B). The only skeptic in the second round of interviews (I_NT_1B) was convinced afterbeing shown an example with many students that eduViz would still be useful for large classes.
5.2.8. Expert characteristics analysis
One interesting pattern we noticed while speaking to experts was that they fell clearly into the marketingcategories outlined by Moore (1999). The younger (junior and intermediate) experts and the experts who teachnon-technical subjects were generally more excited about the tool and interested in adopting it in their ownassessment practices as reflected by their higher normalized number of GOOD comments (see Fig. 10).Although these users had many comments about ways in which eduViz could be improved, the overallimpression they conveyed to us was positive. These are characteristics of what Moore calls ‘‘early adopters,”users who are comfortable enough with the tool so that they can and are willing to make up for any deficien-cies they find. In contrast, the senior experts and experts from technical fields were much more interested inknowing if eduViz had the functionality that their current grading methods did. They were less interested inthe grade exploration aspects. One commented that he had too many students in lower-level classes to actuallyhave time to explore students’ grades (SR_T_1A). Another wanted ways to drop the lowest quiz grade, givethe student a higher grade if they did well on the final exam, or perform other, less generic manipulations ofstudent grades (SR_T_3A). These experts said they were unlikely to adopt the use of eduViz unless thesefeatures were available. The impression they conveyed was that they were interested in the tool, but wouldnot use it unless it was more polished, had all the features they wanted, and would obviously save them timeand effort. Many of the senior experts also felt that their current methods of grading were sufficient for theirpurposes, and so saw no reason to adopt new strategies (SR_T_4B, SR_NT_3B, SR_NT_4B). These are char-acteristics of what Moore calls ‘‘pragmatists,” users who will not use the tool until it is fully functional and inmainstream use. Since eduViz is still in production, it makes sense that while ‘‘early adopters” would beexcited by what they see, ‘‘pragmatists” would still be skeptical.
6. Future work
During our consultations with the experts, it became apparent that they often look for certain phenomenain the data. For example, it would be interesting to find students who had an exceptional grade in a specificassignment, students that are below/above class average, etc. Considering the significant workload of teachers,it is improbable that they would have time to look for these patterns manually, especially in bigger classes.Therefore, a system that could flag situations corresponding to preset queries could improve teaching qualitywithout imposing an additional burden on teachers. We think that adding a rank-by-feature capability coulddirect and improve the quality of the data exploration (Seo & Shneiderman, 2005). Since we are dealing withexploration of a specific type of dataset, it will be easier to categorize certain queries as representing desiredsituations and other as needing special attention. Ultimately, we envision a system that calls teachers’ atten-tion to any potential problem and then allows them to explore the data to determine whether intervention isneeded and get further insight for devising a plan of action. To automate this warning system, we intend toprovide a basic internal macro language to automate certain processing. The challenge would be to providethis advanced programming interface without alienating novice users.
Currently, eduViz defines weighting of grades in a uniform manner for all students. This does not leaveroom for special consideration due to personal student circumstances which may affect the student’s perfor-mance. Also, there is no way to benefit a student that is showing improvement. Finally, it does not considerless quantifiable grade components such as class participation. We would thus like to support individualstudent statistics that will override the class statistics based on the teacher’s judgment. A related topic is thatof missing work. These may sometimes be counted as a zero grade in a specific assignment and in other occa-sions, other strategies would fit better. eduViz needs to provide this flexibility in order to gain wideacceptance.

1484 S.A. Friedler et al. / Computers & Education 51 (2008) 1467–1485
7. Conclusion
We have presented eduViz, a teacher aid for grade exploration and assignment. eduViz aims to trans-form raw evaluation in the form of grades into actionable insight that allows teachers to spot areas of diffi-culties in the subject matter, assist students, and provide more appropriate feedback. We see greatpotential in the application of Information Visualization techniques to evaluation processes and believe itcan improve assessment accuracy as well as the teaching process itself. The 16 expert teachers who we inter-viewed verified this potential and provided many suggestions for the future improvement of eduViz.
References
Ahlberg, C., Shneiderman, B. (1994). Visual information seeking: Tight coupling of dynamic query filters with starfield displays. In Human
factors in computing systems. Conference proceedings CHI’94 (pp. 313–317).Ahlberg, C. (1996). Spotfire: An information exploration environment. ACM SIGMOD, 25(4), 25–29.Byrne, M. D., Catrambone, R., & Stasko, J. T. (1999). Evaluating animations as student aids in learning computer algorithms. Computers
and Education, 33, 253–278.CalEd Software (2007). Class action gradebook. <www.classactiongradebook.com>.Champion, J. (2007) Zedgraph. <www.zedgraph.org>.Chang, K.-E., Sung, Y.-T., & Chen, S. F. (2001). Learning through computer-based concept mapping with scaffolding aid. Journal of
Computer Assisted Learning, 17, 21–33.Cheang, B., Kurnia, A., Lim, A., & Oon, W.-C. (2003). On automated grading of programming assignments in an academic institution.
Computers and Education, 41, 121–131.Chintalapani, G., Plaisant, C., Shneiderman, B. (2004). Extending the utility of treemaps with flexible hierarchy. In Proceedings of the
international conference on information visualization (pp. 335–344).Dewhurst, D. G., MacLeod, H. A., & Norris, T. A. M. (2000). Independent student learning aided by computers: An acceptable
alternative to lectures? Computers and Education, 35, 223–241.Doolittle, A. E. (2002). Classroom assessment: What teachers need to know (2nd ed.). Journal of Educational Measurement, 39(1), 85–90.Douce, C., Livingstone, D., & Orwell, J. (2005). Automatic test-based assessmed of programming: A review. Journal on Educational
Resources in Computing (JERIC), 5, page Article No. 4.Edwards, S. H. (2003). Teaching software testing: Automatic grading meets test-first coding. In Companion of the 18th annual ACM
SIGPLAN conference OOPSLA (Vol. 18, pp. 318–319).Eick, S. G. (1994). Data visualization sliders. In UIST’94: Proceedings of the 7th annual ACM symposium on user interface software and
technology (pp. 119–120). New York, NY, USA: ACM Press.Garfield, Joan B. (1994). Beyond testing and grading: Using assessment to improve student learning. Journal of Statistics Education, 2(1).Gradelink (2007). Gradelink. <www.gradelink.com>.Harrower, M., & Brewer, C. A. (2003). Colorbrewer.org: An online tool for selecting colour schemes for maps. The Cartographic Journal,
40, 27–37<http://www.colorbrewer>.iParadigms LLC (2007). Turnitin: Digital assessment suite. <www.turnitin.com>.Jackson, D., Usher, M. (1997). Grading student programs using assyst. In Proceedings of the SIGCSE technical symposium on computer
science education (Vol. 28, pp. 335–339).Kreijns, K., Kirschner, P. A., & Jochems, W. (2003). Identifying the pitfalls for social interaction in computer-supported collaborative
learning environments: A review of the research. Computers in Human Behavior, 19, 335–353.Kvale, S. (1996). Interviews: An introduction to qualitative research interviewing. Sage Publications Inc. (pp. 187–209).Li, Q., North, C. (2003). Empirical comparison of dynamic query sliders and brushing histograms. In Proceedings of the IEEE symposium
on information visualization (pp. 147–154).McCaffrey, J. (2005). Test run: The analytic hierarchy process, 20(6), 139–144.McGraw-Hill Higher Education (2007). Mathzone. <www.mhhe.com/math/mathzone>.Microsoft (2007). Excel. <http://office.microsoft.com/excel>.Moore, G. A. (1999). Crossing the chasm: Marketing and selling high-tech products to mainstream customers, Harper business.Naur, P. (1964). Automatic grading of students’ algol programming. BIT, 4, 177–188.OnCourse Systems for Education (2007). Oncourse: Systems for education. <www.oncoursesystems.com>.Page, E. B. (1994). Computer grading of student prose, using modern concepts and software. Journal of Experimental Education, 62,
127–142.Pearson Education (2007). Mygradebook. <www.mygradebook.com>.Popham, W. J. (1998). Classroom assessment: What teachers need to know (2nd ed.). Prentice Hall.Rubin, H. J., & Rubin, I. S. (2004). Qualitative interviewing: The art of hearing data (2nd ed.). Sage Publications Inc.Seo, J., & Shneiderman, B. (2005). A rank-by-feature framework for interactive exploration of multidimensional data. Information
Visualization, 4(2), 99–113.Shneiderman, B., & Plaisant, C. (2004). Designing the user interface: Strategies for effective human–computer interaction (4th ed.). Addison
Wesley.

S.A. Friedler et al. / Computers & Education 51 (2008) 1467–1485 1485
Spacco, J., Hovemeyer, D., Pugh, W., Hollingsworth, J., Padua-Perez, N., & Emad, F. (2006). Experiences with marmoset: Designing andusing an advanced submission and testing system for programming courses. In ITiCSE’06: Proceedings of the 11th annual conference on
Innovation and technology in computer science education. 1-59593-055-8. ACM Press.Stiggins, R. J. (1999). Evaluating classroom assessment training in teacher education programs. Educational measurement: Issues and
practice, 18(1), 23–27.Thomas, J. J., Cook, K. A. (Eds.) (2005). Illuminating the path: The research and development agenda for visual analytics. US DOH
National Visualization and Analytics Center.Walvoord, B. E., & Anderson, V. J. (1998). Effective grading: A tool for learning and assessment. Jossey-Bass Publishers.Weller, H. G. (1996). Assessing the impact of computer-based learning in science. Journal of Research on Computing in Education, 28,
461–485.