EMPLOYMENT AND EARNINGS IN THE URBAN INFORMAL SECTOR OF IBADAN, NIGERIA
239
EMPLOYMENT AND EARNINGS IN THE URBAN INFORMAL SECTOR OF IBADAN BY ISAIAH OLURANTI OGUNRINOLA B.SC. (ECONS. UNIVERSITY OF IFE, 1983) M.SC. (ECONS. IFE; 1986) A THESIS SUBMITTED IN PARTIAL FULFILMENT OF THE CONDITIONS OF THE AWARD OF THE DEGREE OF DOCTOR OF PHILOSOPHY IN ECONOMICS OF THE OBAFEMI AWOLOWO UNIVERSITY ILE-IFE, NIGERIA. 1
-
Upload
covenantuniversity -
Category
Documents
-
view
0 -
download
0
Transcript of EMPLOYMENT AND EARNINGS IN THE URBAN INFORMAL SECTOR OF IBADAN, NIGERIA

EMPLOYMENT AND EARNINGS IN THE
URBAN INFORMAL SECTOR
OF IBADAN
BY
ISAIAH OLURANTI OGUNRINOLAB.SC. (ECONS. UNIVERSITY OF IFE, 1983)
M.SC. (ECONS. IFE; 1986)
A THESIS SUBMITTED IN PARTIAL FULFILMENT OF THECONDITIONS OF THE AWARD OF THE DEGREE OF DOCTOR OFPHILOSOPHY IN ECONOMICS OF THE OBAFEMI AWOLOWO
UNIVERSITY ILE-IFE, NIGERIA.
1

1991
ACKNOWLEDGEMENTS
I wholeheartedly give all glory to God for giving me both the opportunity
and the ability to undertake and complete this study.
My sincere gratitude goes to my supervisor, Mr. A.O. Olaloye whose
incisive criticisms, helpful suggestions and untiring guidance helped me at
various stages of writing this thesis. I am also indebted to Dr. S.I. Oladeji who
stimulated my interest in the study of urban informal sector. His assistance at
every stage of this study is gratefully appreciated. Furthermore, the constructive
criticisms of Dr. Olanrewaju, Dr. Alade and Dr. Ikhide on the earlier drafts of
this work are appreciated.
The financial assistance towards data collection and the preparation of
this thesis that was generously provided by the council for the Development of
Economic and Social Research in Africa (C.O.D.E.R.I.A.) is gratefully
acknowledged and appreciated. Also, I am grateful both to the Obafemi
Awolowo University , and the Department of Economics that provided a
conducive environment for the conduct of this study. I am grateful to Messrs.
‘Lekan Adegoke and James Odelade for typing and retyping the drafts this
project report.
My wife, ‘Bunmi Ogunrinola, gave me a wonderful and unforgettable
support. Her prayerful, moral and financial supports at all stages of this work
have contributed immensely to its success. Also, the understanding of my
2

children: Ibunkunoluwa, Ifeoluwa and Iyanuoluwa, who missed my fatherly care
at the time they mostly needed it, is also gratefully acknowledged.
Ogunrinola, Isaiah Oluranti
October, 1991.
TABLE OF CONTENTS
PageTitle Page ………………………………………………………………………………… iAcknowledgements………………………………………………………………………. iiTable of Contents………………………………………………………………………… iiiList of Tables …………………………………………………………………………….. viiList of Figures ……………………………………………………………………………. ixAbstract ………………………………………………………………………………….. x
CHAPTER ONE: Introduction 1.1 The Urban Informal Sector ……………………………………………………… 21.2 Statement of Problem …………………………………………………………… 3 1.3 Objectives of the Study …………………………………………………………. 81.3.1 Hypotheses …………….………………………………………………………… 9
CHAPTER TWO: The Urban Labour Market in Nigeria
3

2.1 The Urban Economy: It’s Origin and Growth …………………………………...10
2.2 The Growth of Informal Sector of Ibadan ………… …………………………...14
CHAPTER THREE: Literature Review3.1 Definitional Issues ……………………………………………………………….. 183.2 Some Views on the Urban Informal Sector ………..…........................................ 193.3 Previous Empirical Studies On Nigeria ………………………………….............
213.4 Empirical Studies on other Developing Countries ……………………………….
24
CHAPTER FOUR: Conceptual Framework andMethodology 4.1 Conceptual Framework………………………………………………………….. 294.1.1 The Urban Labour Market………………………………………………………. 294.1.2 Factors Affecting Entry into the Mats Subsector Of Urban Informal Sector
…………………………………………………………………………………… 344.1.3 Urban Labour Demand and Supply Analysis…………………………………….
394.1.4 Employment Condition in the Urban Labour Market…………………………….
434.2 Methodology……………………………………………………………………… 484.2.1 Research Instruments……………………………………………………………... 484.2.2 Planned Coverage and Sampling Procedure………………………………………
494.2.3 Data Collection…………………………………………………………………… 504.2.4 Model Formulation and Analytical Techniques…………………………………..
53
4

CHAPTER FIVE: Structure of Enterprises and Socio-Economic Characteristics of Enterprises
5.1 Structure of Enterprises……………………………………………………… 645.1.1 Ownership Structure and Age of Business…………………………………. 645.1.2 Structure of Capital Employed ……………………………………………… 675.2 Operation Characteristics of Enterprises …………………………………….. 715.3 Socio-Economic Characteristics of Entrepreneurs……………………… 73
CHAPTER SIX: Employment in the Urban Informal Sector
6.1 Employment………………………………………………………………………. 766.2 Generation of New Entrepreneurs through Skill Formation……………..806.3 Employment Functions…………………………………………………………… 866.3.1 Level of Commitment and Satisfaction among Urban Labour Force …………………………………………………………… 896.4 Informal Employment Probability Functions………………………………. 91
CHAPTER SEVEN: Earning and Status Mobility of UrbanInformal Sector Labour Force7.1 Earnings …………………………………………………………………………. 967.2 Occupational and Status Mobility of Urban Informal Labour Force ….
102
CHAPTER EIGHT: Summary of Findings and PolicyRecommendations 8.1 Summary of Findings……………………………………………………………. 1088.1.1 Employment Generation, Skill Development and Utilisation in the Urban
Informal Sector………………………………………………………………….. 1088.1.2 The Urban Informal Sector: Marginal or Dynamic? ……………………. 1098.1.3 The Urban Informal Sector: In Transition? ………………………………………
1128.2 Policy Recommendations………………………………………………………… 1138.3 Problems and Limitations of the Study……………………………………….. 115
5

8.4 Areas for Further Research……...........................................................................116Bibliography…………………………………………………………………….. 117
Appendix A: Survey Questionnaire on Informal Sector Enterprises in Ibadan……..…………………………………………………………………………….. 127
Appendix B: Survey Questionnaire on Employment and Earnings in Ibadan
…………………………………………………………………………………… 134
LIST OF TABLESTablePage1.1 The Nigerian Labour Market……………………………………………………… 44.1 Variables Used in the Probability and Earnings Model ……………………605.1 Distribution of Sample Enterprises…………………………………………… 655.2 Percentage Distribution of Enterprises by Age of Establishment ..............
665.3 Sources Of Initial Capita……………………………………………………. 685.4 Percentage Distribution of Initial Capital by Type Of Enterprise………….
695.5 Percentage Rate of Growth of Capital by Type of Enterprise…………….
695.6 Percentage Distribution of Present Capital by Type of Enterprise……..
705.7 Percentage Distribution of Entrepreneurs by Level of Education and
Type of Enterprise………………………………………………………… 735.8 Percentage Distribution of Entrepreneurs by Age and Type of Enterprise..
746.1 Percentage Distribution of Paid Employees by Type of Enterprise……..
76
6

6.2 Percentage Distribution of Total Number Engaged by Type of Enterprise..77
6.3 Percentage Distribution of Employment Growth by Type of Enterprise…..79
6.4 Present Location and Occupation of Ex-Apprentices ……………………..81
6.5 Percentage Distribution of Apprentices by Future Aspirations……………83
6.6 Annual Rate of Generation of New Entrepreneurs by Type of Enterprise..84
6.7 Percentage Utilisation of Effort by Type of Enterprise…………………... 866.8 Employment Function for the Urban Informal Enterprises Manufacturing
and Technical Services……………………………………………………………. 876.9 Informal Sector Employment Probability Function………………………. 917.1 Mean Monthly Earnings in Ibadan Urban Labour Market………………..
967.2 Percentage Distribution of Urban Labour Force by Monthly Income andBy
Sector of Employment …………………………………………………… 987.3 Earnings Distribution Functions for the Urban Labour Force in Ibadan.
1007.4 Percentage Distribution of Informal Sector Labour Force According to
Job History ………………………………………………………………… 1047.5 Percentage Distribution of Informal Labour Force According to theirPresent
Status, Employment Status in Preceding Job and Type of Enterprise inCurrent
Employment………………………………………………………………………. 1057.6 Percentage Distribution of Informal Labour Force by Current Employment
Status and Labour Market Experience………………………………………. 1067.7 Income Profile (From Job History) of the Self Employed Labour Force
in the Informal Sector………………………………………………………… 107
7

LIST OF FIGUREFigure
Page1 Movements within the Urban Informal Sector ……………………………. 322 Dynamics of Formal – Informal Relations Within the Urban Labour
Market (ULMA)………………………………………………………………… 333 Skill Formation and Entrepreneurship Development Process in the Urban
Informal Sector…………………………………………………………………. 354 Factors Influencing Entrepreneurship Development in the Manufacturing
and Technical Services Enterprises………………………………………… 355 Demand and Supply Curves for Labour………………………………………... 41
ABSTRACT
This study examined the contributions of the urban informal sector of Ibadan toincome, employment generation and skill formation. It also investigatedwhether or not the sector provides permanent employment for some membersof the urban labour force. The methodology of the study involved the use ofquestionnaires to elicit desired information from informal sector enterprises as
8

well as formal and informal sector workers in manufacturing and technicalservices from selected enumeration areas of Ibadan. The analytical techniquesrelied on the use of employment and earning regression models as well asinformal employment probability model. Also, summary statistics like mean,mode, median, ratios and percentages were used. The estimated employmentmodel shows that the level of capital employed, earnings, amount of educationof owner, quality of training of owner and the type of industry where anenterprise operates significantly affect the level of employment. Suchemployment is found to be permanent for 86 percent of informalsector .operators, while 94 percent of the formal sector workers interviewedexpressed strong desire of moving to the informal sector whenever they cansave up the required starting capital. This fact is also confirmed by the informalemployment probability models estimated for the urban labour force of Ibadan.Thus, the result of our study does not uphold the probabilistic migrationhypothesis with respect to the role of informal sector in the urban labour marketof Ibadan. With respect to earnings, the informal sector workers comparefavorably with their formal sector counterparts. Sixty-one percent earn morethan N200 per month while the mean monthly earnings is N583. Our earningsdistribution model estimated shows that variables like sector of employment,migration status, education, quality of training, labour market experience andthe type of industry in which an enterprise operates significantly affect thedistribution of earnings among the urban labour force. In terms of skilldevelopment, the apprenticeship system is the most dominant form. Ninetypercent of current entrepreneurs were thus trained, while a total of 2,200apprentices had been previously trained by these masters. At present, the 544enterprises sampled have a total of 2,119 apprentices that are being trained.However, in terms of the extent of skill utilization, it is found that a considerableamount of underemployment ranging from 21 to 36 percent exists in the sector.Apart from its contributions to employment, earnings and skill formation; thisstudy shows that the urban informal sector, rather than disappearing with time,is a major and growing element of development in the urban labour market ofIbadan. Thus, the government and its agents (e.g. the National Directorate ofEmployment), private formal organizations and researchers are called upon tofocus more attention to the sector to sustain and enhance the sector’scontributions to development.
9

CHAPTER ONE
INTRODUCTION
Economic development literature is replete with the account
of open unemployment as well as various facets of
employment problems in less developed countries. This is
premised on the fact that in many third world cities, as
many as about 15 – 25 percent of the labour force are
openly unemployed with a greater incidence on the educated
youths.
Apart from open unemployment which has received greater
attention, other employment problems in less developed
countries are also more rampant. These employment problems
arise as a result of the imbalance between the size and
growth of the labour force on the one hand, and the
opportunity for economic activity offered by existing
economic structure on the other hand (Joshi and Joshi,
1976). Some of the dimensions of the problems include:
(a)Frustration arising from the type of work available
which are often at variance with aspirations of the
labour force, especially the young educated ones. This
occurs in form of those in ‘wrong’3 joys as well as
those wanting to work longer hours or want to work more
intensively.
10

(b)Low income even when workers are physically busy most of
the working day.
(c)Underutilization or inefficient utilization of efforts.
These problems have received little attention in the
literature as compared to open unemployment (Kritz and
Ramos, 1976). As a matter of fact, scholars have questioned
the applicability of the term ‘unemployment’ to
underdeveloped countries where:-
(a) Majority of the labour force are self – employed, and;
(b) Those that are without full time regular wage jobs do
usually eke out subsistence by engaging in any informal
odd jobs since full – time unemployment is the luxury of
the rich ones (Weeks, 1971; Udall and Sinclair, 1982).
By this, one is not denying the seriousness of
open unemployment with the social and political problems
associated with it. However, the employment problems and
poverty in third world cities equally deserve serious
attention.
For example, given the relatively small size of the
formal economy, most workers in the informal sector (NFS)
are self employed. But their conditions of work have been
of little concern to the government. In spite of this, it
has been reported that most of these workers constitute
crop of new generation of entrepreneurs contributing their
quota to development (Callaway, 1973). That these
entrepreneurs and their enterprises contribute to
11

employment generation for those who would have otherwise
remained unemployed has been supported by I.L.O. (1972).
However, the optimistic conclusion of I.L.O’s study has not
remained unchallenged (Moser, 1978). As such, there
exists controversy as to the contribution of the sector to
development.
However, in a nation where social security system in
form of unemployment benefit is non-existent, the need for
job creation to absorb the ever-increasing labour force
cannot be overemphasized. It is also important that
employment problems be closely looked into to enhance the
level of living of workers. It is our conjecture therefore
that the above could be achieved by evolving policy
measures that will improve the informal sector of the
economy where a significant proportion of Nigerians are
currently making a living.
The fact that the government sector realizes the
importance of this sector (Third National Development Plan)
in terms of its potential contribution to employment makes
this call imperative. Moreover, the skill development
function, in recent times, of the National Directorate of
Employment ( N.D.E.) via the skilled entrepreneurs in the
Informal Sector (NFS) is an indication that the sector
might have to play a much more important role now and in
the future in terms of skill formation, employment and
income generation for most Nigerians. This explains the
topicality of this study.
12

Our study therefore, will focus on employment and
earnings of the informal sector workers. This seems to be a
departure from the usual norm whereby most research efforts
are concentrated on the small- based urban formal sector.
Our study therefore is an attempt to redress this
imbalance.
1.1:THE URBAN INFORMAL SECTORInterest in the study of urban informal sector dates
back to the early 1970’s in an attempt to deal with the so-
called underemployment and unemployment that have assumed
enormous dimension in many third world countries. The term
‘informal sector’ was used by
Hart (1973)10 in his study of employment opportunities in
Ghana. The term has since been popularized by ILO/UNDP’s
employment mission to Kenya (I.L.O., 1972). It was then
used to describe enterprises that are outside government
regulations and operate outside the incentive system
offered by the government and other private institutions.
Thus, the informal sector is synonymous with “unprotected
sector” (Weeks, 1975) since it is not covered by various
government regulations offered to large formal business
organizations.
As Amin (1981) and Joshi, et. al. (1976) have also
observed, operators in this sector are subjects of
harassment and humiliation by government officials. In
Nigeria, this situation became more pronounced during the
Buhari / Idiagbon regime when they launched, and actually
13

carried out the “War Against Indiscipline” between 1984 and
1985. This programme was meant to promote environmental
sanitation and rid cities of illegal structures that had
served as ‘workshops’ to most in formal sector operators.
However, in most developing countries, government’s
attitude to informal sector is changing. This is because
most governments are now realizing the potentials of the
sector in terms of skill development through the age-old
apprenticeship system and employment generation. In
Nigeria, for example, the National Directorate of
Employment works together with master-craftsmen in the
informal sector in giving school leavers.
For the purpose of this study, our notion of informal
sector enterprises refers to all economic activities that
are permissible by the State. However, these activities are
carried on in a way that does not totally comply with
government regulations. For example, such businesses are in
most cases, not registered; they do not pay the legal
minimum wage to their employees (if any) ; their output are
not usually inspected by the Nigeria Standard Organization;
and more often than not, they operate beyond the 40 – hour
working week.
1.2:STATEMENT OF PROBLEMA careful scrutiny of the statistics relating to the
Nigeria labour market (Table 1.1) shows the importance ss
well as the preponderance of the self – account workers.
14

Majority of these are operators in the informal economy of
Nigeria.
TABLE 1.1: THE NIGERIAN LABOUR MARKET, 1970
-1975
1970 1975 1980 1985No
(Million)
Percentage Share
No(Millio
n)Percentage Share
No(Millio
n)Percentage Share
No(Millio
n)Percentage Share
1.Labour Force:
(Made Up of) 26.08 100 29.22 100 32.2 100 36.08 100 a. Unemployment Gap 2.03 7.8 1.31 4.5 4.5 1.4 1.48 4
b. Gainful Employment 24.054 92.2 27.91 95.5 30.8 98.6 34.6 96
2. Those gainfully employed a.
Wage Employment 1.385 5.8 2.18 7.8 3 9.7 3.75 10.8 b. Self-account, unpaid
household workers and unpaid apprentices. 22.669 94.2 25.73 92.2 21.8 90.3 30.85 89.2
Sources: Second, Third and Fourth National Development Plans: 170 - 74; 1975- 80; and 1981 - 85 respectively
In 1970, out of the total gainfully employed of 26 million,
about 23 million are self-account workers while about 1
million are in wage employment. By 1985, the self-employed
15

class has grown to 31 million representing 89 per cent of
the gainfully employed. In contrast, the wage employment in
Nigeria in 1985 was still as low as 4 million representing
10 per cent of total gainful employment.
In spite of their statistical importance and predominance
in the urban labour market, informal workers relative to
their formal counterparts are usually neglected by
government in terms of job and wage protection, enumeration
in official surveys, access to formal capital and product
markets and so on. In contrast the relatively small-based
formal wage employment sector enjoys appreciable government
and union protection in terms of job security, wage
stability and other conducive conditions of work. Worse
still, much emphasis of the government in terms of man
power planning and development is directed away from the
small-scale enterprises, but towards the medium and large
scale establishments of wage sector.
The neglect of the urban informal sector, in most
cases, is in terms of non-implementation of the provisions
made in the development plan documents regarding the
sector. For example, the second National Development Plan
document (1970 – 1974) 15recognised the low absorption rate
of primary school leavers into the secondary school (11.7%)
and as a result provided that young school leavers be
trained in such skills that are designed to improved their
prospects for employment through the apprenticeship scheme.
The plan also provided for the establishment of a National
16

Youth Corps which should provide training in skilled manual
work for young school leavers. These policies were aimed at
removing thousands of youths aged 15-23 from the labour
market through skill improvement schemes that will
eventually create jobs for them as self-employed artisans
and craftsmen in the economy.
The third National Development Plan (1975 – 1980)
made similar provision for creating employment for the
educated youths and even went further to acknowledge the
role the informal sector can play in job-creation process.
In this wise, the plan in unequivocal terms, stated that:
“……..(given the) decline in the employmentpotential of the agriculture sectorAnd ……… the increasing capital intensity ofthe growth sector – (mining and large-scalemanufacturing) – small scale enterprises andthe informal sector may provide the mainopportunity for expansion of employment’ (p.385).
The Fourth National Development Plan (1981 – 1985)
also came up with several elegant provisions for solving
school-leaver unemployment problem which has assumed
enormous dimensions in the urban labour market. It also
provided for ways of upgrading the skills of informal
sector workers. The Plan agrees that increasing primary-
secondary school transition rate alone may not solve the
school-leaver unemployment problem but that they should be
trained toward self-employment. This was supposed to be
17

achieved through the Industrial Training Fund that was
charged with the vocational training programmes for 7,000
unemployed school leavers, artisans and craftsmen in
various industries. Other agencies charged with similar
training functions include the Centre for Management
Development, the Industrial Development Centre, and the
State governments’ employment-oriented training programmes
for unemployed school leavers and artisans.
These provisions have received little or no attention
from the government in spite of the seemingly high priority
they should deserve. Thus, these urban unemployed most of
whom now operate in the informal sector suffer a great
neglect from the government. Furthermore, enterprises in
the sector do not benefit from participating in the
organized product and capital markets.
Similar situation as in Nigeria prevails in most
developing nations (I.L.O; 1972), Apart from neglect,
operators in the informal sector, are, more often than not,
subjected to harassment and humiliation by government
officials for alleged infringement of bye-laws relating to,
say, street-trading, public health, road safety, and so on.
Apart from government neglect, the informal sector
also suffers from the academia. There is paucity of
research into the sector especially in Nigeria. Thus,
little or no effort is being made to address the many
constraints of informal firms and their operators. However,
as shown in chapter three below, the research efforts of
18

Callaway (1964)17 and Fapohunda (1985)18 have shed some light
in these respects.
Recently however, the Nigerian government seems to be
changing its attitude towards the sector. This explains the
recent trend whereby the National Directorate of Employment
collaborates with informal sector master-craftsmen in the
skill development of young school leavers.
Therefore, it is our view that the sector should
benefit more from research in order to be able to asses,
and make relevant policy recommendations for enhancing its
contributions to economic development. This becomes
imperative when it is realized that studies in other
countries (developed and developing) show that small
enterprises (formal and informal) contribute significantly
to growth and employment relative to large-scale
enterprises. For example, between 1969 and 1976 in the
United States of America, small enterprises employing
between zero and twenty persons generate 66 per cent of new
jobs for the same period; while large enterprises employing
at least 500 persons account for 13 per cent of new job
creation (Birtch, 1983, p. 5)19. Similar, Liedholm and Mead
(1988)20 reported that informal sector enterprises in a
dozen developing countries contribute significantly to
income and productive employment.
The promotion of these microenterprises seems greatly
attractive because research outputs show that they grow
even during slack periods. Evidences in America (Bishop,
19

1983)21 support this fact. In the American economy, for
example; despite the oil shock of the 1970’s, significant
new incorporation of small firms was experienced at a time
when many large ones were folding up. Thus the slack labour
markets of the 1970’s and 1980’s have helped to stimulate a
dramatic increase in the number of small businesses.
The fact that competition is relatively high, thus
ensuring wage flexibility in small enterprises, accounts
for the better performance of small scale non-unionized
industries in terms of job creation. In contrast, union
militancy in large-scale enterprises prevent wage decline
in the face of rising costs. Therefore, lay-offs are
unavoidable, but most of these are usually either rehired
at lower wages in small firm sector or set up own
enterprises. Thus, the supply of entrepreneurs in the
informal sector tend to increase with economic downturn.
Given the importance of the informal economy
therefore, it should be the target of policy and project-
focused attention from the government and researchers in
place of current apathy and/or complacency to the plight of
the over four-fifths of the labour market. In their own
submission, Staley and Morse (1965)22 vividly revealed a
part of this problem when they observed that:
………in countries striving to industrialize,small industry has been regarded as aninevitably backward and lagging part of theeconomy, perhaps to be aided for socialreasons and in a rather defensive and
20

protective spirit, but not as a promisingopportunity for development. This is amistake. In most industrialization, too littleattention has been paid to the benefit to begained by helping existing small industry tomodernize and by stimulating the growth ofnew, modern small factories. Thus, a latentresource has been overlooked and neglected’(p.v).
And precisely with respect to Ibadan, Onyemelukwe (1982, p.
133)23 affirms that over 1,000 small industrial units
employing less than 10 persons each contribute
significantly to the economy progress of the city and its
environs. However, he laments that not much is known about
them.
Furthermore, this study is considered relevant to the
present day Nigerian economy on several grounds:
First, due to the high rate of urbanization and the
resultant high labour force growth in Nigerian cities, it
is evident that the urban-based large-scale formal sector
enterprises cannot generate enough jobs for present and
future job seekers (Callaway, 1964, Third National
Development Plan, 1970 – 1975). Thus, there is a need to
intensify research efforts aimed at evolving policy
measures to promote and sustain employment generation in
the urban informal sector.
Second, there is a need to focus attention on the
employment situation of the working poor most of whom have
been identified as informal sector operators (Mazundar,
21

1976; 24 Merrick, 1976; 25 Guisinger and Irfan, 1980)26. Such
studies on informal labour market operators will therefore
provide policy measures to increase productivity and hence,
earnings in the sector.
Third, as a result of the present Federal Government’
efforts in skill development and generating employment for
the young school leavers through the Open Apprenticeship
Scheme, social research aimed at examining the skill
acquisition process and manpower needs of the sector over
time is a step in the right direction.
Fourth, paucity of research effort into the sector
gives an indication that deliberate attempt must be made to
encourage researchers into this area, data problem
notwithstanding.
It is our submission therefore that this neglected
sector should begin to receive greater attention and this
is one of the factors motivating this study.
1.3:OBJECTIVES OF THE STUDY Basically, this research project is aimed at examining
the contribution of the urban informal sector of Ibadan to
income, employment generation and skill formation. This
becomes imperative given the low and dwindling labour
absorptive capacity of the formal sector enterprises and
the associated high level of open and disguised
unemployment within the urban labour market.
22

Specifically, the study is designed to:
(1) Examine the nature and extent of economic
activities in the urban informal sector and find
out how the sector operates given the hostile
policy environment it finds itself.
(2) Examine whether the enterprises in the sector are
characterized by marginal existence or dynamic
growth given resource constraints in the sector.
(3) Examine the importance of the sector in terms of
employment and earnings generation as well as skill
acquisition and entrepreneurial development.
(4) Identify the factors affecting the level of
employment and personal distribution of earnings in
the sector.
(5) Suggest policy guidelines in line with our
findings.
1.3.1 HYPOTHESES
In line with the above-name objectives, the following null
hypothesis are tested;
(i) The informal sector enterprises contribute
significantly to employment generation.
(ii) The enterprises, apart from contributing to employment
generation, also serve as important source of skill and
entrepreneurial development.
(iii) The informal sector operators are temporarily
employed in the formal sector pending the time they
will find the desired formal sector alternative. In23

other words, we are postulating that the probabilistic
migration thesis – (which maintains that the informal
sector employment is a waiting ground for most urban
workers en-route to the formal sector) can be upheld
for our sampled entrepreneurs.
(iv) Earnings of workers in the sector is substantial to the
extent that informal sector labour force cannot be said
to be synonymous with the urban poor.
(v) Irrespective of the sector of employment, human capital
variables, among others, are important factors
affecting distribution of earnings.
CHAPTER TWO
THE URBAN LABOUR MARKET IN NIGERIA
2.1: THE URBAN ECONOMY: Its Origin and Growth
The pre-colonial Nigerian did not find himself tired
to the two cultures of formal and informal labour market
situations. Using the production process later described as
‘unorganized’, he has been producing nothing more than the
necessities for subsistence in the informal labour market
in his settlement, whether rural or urban. In either of
these settlement types, agricultural pursuits are combined
with local or indigenous crafts like dyeing, weaving,
blacksmithing, iron-smelting, pottery, carving and so on,
at the subsistence level.
24

However, the advent of the colonial government brought
about a revolution which led to the polarization of both
the labour market and the labour force. Regional,
divisional and local authority headquarters became the seat
of government which makes these settlements attract a more
than proportionate development efforts relative to
surrounding areas. Moreover, colonial establishments
(public and private) made the demand for wage labour
indispensable in these settlements. Workers were therefore
induced (or at times forced) to accept wage work in these
urban formal establishment (de Briey, p. 1955; Berg, 1965;
Miracle and Fetter, 1970; Browse, J.O. 1977). As a result,
a greater part of the subsistence economy was displaced in
favour of a small and urban-based formal market economy.
From then on, economic activities were classified as
either; traditional’ or ‘modern’. The traditional
activities are those which existed before and continue in
the face of Western Capitalist penetration, while the
modern ones are those which arose from investments by the
colonial administrations and other foreigners; using
imported capital – intensive technology.
As a result of these developments, wage employment in
plantations, mines and industry became important especially
in urban areas which attracted a good number of prospective
wage workers from the rural agricultural settlements. Thus,
in almost all urban centres, it is not common to find the
small-based modern colonial enclaves of formal wage work
25

alongside with traditional self-employment in both farm and
endeavours.
The advent of the colonial administration, therefore,
ushered in what is now commonly known as dualism in all its
ramifications. In general, dualism refers to “economic and
social divisions in an economy such as differences in level
of technology between sectors
or regions, differences in the degree of geographic
development and differences in social customs and
attitudes between an indigenous and an imported social
system” (Thirwall, 1986)31.
Dualism in production is manifested in the imported
capital-intensive technology in the formal high
productivity sector while the informal sector of the
economy still rely on traditional, labour-intensive
technology. In spite of its backwardness relative to the
formal sector, the informal sector is more dominant min
terms of size (Table 1.1). It has been reported that the
proportion of urban labour force making a living in the
informal sector I s about 70 per cent (Fajana, 1981, p.
194). Todaro (1989, p. 267 – 273) writing on the urban
informal sector in developing countries, maintains that
between 20 per cent and 70 per cent of urban labour force
are engaged in the informal sector. For instance, while
Lagos (Nigeria) records 50 per cent, Kumasi (Ghana) and
Calcutta (India) record 60 – 70 per cent and 40 – 50 per
26

cent respectively of urban labour force in the informal
sector.
The supply of labour to the urban labour market
(formal and informal) derives mainly from the surrounding
areas both far and near. The urban-ward migration from the
surrounding areas (notably the rural-urban migration) has
been explained using various models in economic literature.
One of such models is the structural change model which
maintains that as economic development progresses, the
decreasing share of agriculture in the Gross Domestic
Product induces labour transfer to the expanding urban
industrial sector. This is said to be beneficial to the
economy due to the structural shift necessitating
intersectoral labour redistribution in the growth process.
This explanation of the process of urbanward migration
has not been justified in the light of realities in less
developed countries in general and Nigeria in particular.
This is because the rate of growth of wage employment
remains relatively low and has been outstripped by the
rapid rate of growth of labour force. Surplus labour
arising from this imbalance are usually content to stay on
in cities while the rural areas are experiencing labour
shortage.
The urban sector therefore remains a plethora of the
unemployed to a limited extent, as well as the mass of the
underemployed, to a large extent. This situation calls into
27
question the validity of the structural change theory in
the labour allocation process.
The probability migration model views rural-urban
migration as a process of investing in inter-regional or
inter-sectoral movement, information gathering and job
search in order to maximize lifetime stream of earnings.
Thus, migration from low opportunity area to a high
opportunity one to take advantage of employment and
enhanced earnings opportunity is a rational economic
decision. Thus, the critical factor in rural-urban
migration is the higher urban wage which attracts rural
residents among other push and pull factors. And since
wages in urban jobs are rigid in the downward direction,
quantity adjustment rather than wage adjustment is the
norm. The ensuring surplus labour in the urban labour
market may decide to remain openly unemployed or readjust
expectations and take advantage of the informal sector’s
income and employment opportunities. The latter option
seems more relevant to urban surplus labour in Nigeria as
in any other developing nations.
Rural-urban migration for improved economic conditions
in the areas of destination therefore accounts for the
rapid population (and hence labour force) growth in cities.
Such rate of city population growth is usually higher than
national population growth rate. Studies have also
confirmed that a significant proportion of population
growth in cities is accounted for by migration while the
28

rest is due to natural increase (Population Reports,
1983)34.
Between the years 1960 and 1975, the annual rate of
growth of population in Lagos was 8.6 percent while
comparative figure for Ibadan since the 1970’s is 6 percent
(Population Reports, 1983 Table 2; Ayeni, 1982). Fifty-nine
per cent of the growth rate of population in Lagos is
reported to be due to net migration while the rest (41 per
cent) is due to natural increase. Similar situation as in
Nigeria cities prevail in other Third World cities and this
under-scores the importance of migration in the population
growth and hence increasing labour supply to the cities.
Apart from the rural-urban wage differential which
stimulates migrants to move, urban bias in development is
another critical factor. This situation has a historical
antecedent since the colonial days in Nigeria when colonial
settlements like Lagos, Ibadan among others, received a
more proportionate share of development efforts. Apart from
intercity dualism in development, there also exists intra-
city dualism. Thus, it is not a thing of surprise any
longer that Maroko, Ajegunle, Mushin and so on, exist side
by side with Victoria Island, Ikoyi, etc. in Lagos. The
Colonial settlement within the city receives greater
attention than other areas.
Similar development pattern as in Colonial days
continues in post-colonial Nigeria. In a recent study on
Nigeria, Okowa (1987) confirmed the urban bias thesis.
29
Using the per capital allocation of pulic resources between
the urban areas as a proxy variable, he confirmed that the
urban areas where only 30 per cent of Nigerians are
located, have a disproportionate share of per capita public
expenditure allocation since independence.
Such dualistic development pattern cannot but have its
impacts on the urban labour market. The protected and high-
wage formal sector jobs are not growing fast enough to
absorb the labour force attracted from the surrounding
areas. However, the rapid urbanization process makes it
profitable (relative to rural employment) to be engage in
providing goods and services to urban dwellers on own-
account basis in the informal sector. Such informal
enterprises are necessarily small and can therefore quickly
adapt to changing needs of the rapidly growing urban
economy.
For example in the past, the informal sector
enterprises engage principally in providing traditional
goods and services but the dynamic changes in the demands
of urban dwellers have influenced changes in the supply of
services provided by these informal sector enterprises.
Nowadays, most enterprises specialize in motor-vehicle
repairs, tailoring, photography, furniture-making, among
others, as a result of modernization; rather than in dyeing
and potmaking, among other traditional crafts. The sector
is thus responsive to dynamic changes within the urban
economy.
30

These modern informal sector activities in Nigerian
cities are characterized by self-employment, loose
arrangement in wage employment, long hours of work,
‘workshop’ scattered around the town, and in general, the
informality inherent in its operation. The latter is
succinctly described by Callaway (1965, p. 28).
“…… tinsmiths hammer out metal cases andcontainers in intricate tones and rhythms. Atailor on the veranda of his house sews theseams of an agbada on his treadle machine. Atthe side of a main road, a carpenter and hisapprentices are sawing boards and building thebody of a bolekaja (a passenger and producelorry). A mechanic works in an area under thetrees between two buildings; his apprenticescluster around the vehicle being repaired.These self-employed men work long hours ….”
On the other, the formal sector is made up of paid
employees while the few self-employed are the high income
earning professionals in the liberal professions as in law,
medicine, and accountancy; as well as proprietors of formal
small-scale enterprises.
2.2:The Growth of Informal Sector of Ibadan
The rural-urban wage differential, reinforced by urban
bias in development is one of the most important factors
explaining the observed rapid rate of urbanization in
Nigeria. This explains why in the last four decades, the
rate of urbanization has increased phenomenally in Nigeria
(Fapohunda, 1985; p. 3).
31

In 1963, Ibadan, the largest truly indigenous urban
centre in Africa south of Sahara, had a population 627,380.
But by 1988, the population of the city had grown to about
i.4 million people. This means that the city more than
doubles its size in twenty-five years.
Up to 1973, the rate of growth of population of the
city was as modest as 3 per cent per annum. Since 1973,
however, the rate of population growth of the city is
estimated to be about 6 per cent per annum (Filani, 1982).
The city is second to Lagos both in terms of population
size and annual rate of increase. Nevertheless, Ibadan is
reported to be a truly African city characterized by small
non-African population, preserving in an almost
unadulterated form, and all those characteristics of the
typical Yoruba City. Such characteristics include a central
market, a remarkable social structure and a peculiar
pattern of rural-urban migration.
The rural-urban pattern of migration is said to be
peculiar when it is noted that the city is closely
connected economically and politically with its rural
hinterlands. This is because Ibadan is more of a ‘region’
than a city. This probably motivated Filani (1982) to
caption his edited works on Ibadan as ‘Ibadan Region’
rather than ‘Ibadan City’. Moreover, the region of Ibadan
was explicitly defined by Akintola (1963) as “the area
extending for about 55 kilometers from Iroko in the north
to Mamu in the south”. The people of this region usually
32

maintain dual home ownership and residential pattern: one
in Ibadan township and the other in one of the satellites.
Studies have shown that farmers in the rural hinterlands
spend a considerable part of the week in the city and the
rest on the farm (Ayeni, Bola, 1982, p. 80). Such dual
residency pattern is also confirmed by Callaway (1973)7
when he observed that, Ibadan serves as urban home for a
large number of farm families who are linked to about 3,000
satellite villages.
Apart from the peculiar pattern of rural-urban
migration due to the link of Ibadan with other satellite
villages, the historical development of Ibadan shows that
the colonial incursion into the city is an important factor
for population as well as informal sector growth.
Historically, the city of Ibadan started in 1829 as a
war camp for the soldiers of Ife, Ijebu and Oyo after
having successfully destroyed the neighboring kingdom of
Owu. These soldiers and other inhabitants engage in the
informal economic pursuits of trading (in local commodities
and slaves), crafts and farming.
The year 1893 witnessed a new labour market
development in Ibadan, when the British Colonial government
took over the rulership of the city after having signed a
peace treaty with the representatives of the dwellers. From
then on, Ibadan started to emerge as a major administrative
and commercial centre. This is consequent upon the fact
that the city became the seat of government.
33

The labour market development became more pronounced
in the 1900’s when the railways was extended to Ibadan.
This heightened commercial activities as existing European
businesses rapidly expanded while new ones sprang up in
Gbagi, and Dugbe areas that serve as the Central Business
District (CBD) of European and Lebanese businesses. Among
other factors, the relative proximity of these areas of
Ibadan to the railway station influenced their evolution as
the central business district.
These businesses, in contradistinction to existing
informal sector enterprises, were formal in all respects,
as they were characterized by regular wage payment to
employees, and more disciplined work regulations that are
alien to the traditional work arrangement of the informal
sector. The duality ensuring from this development can best
be illustrated by the CBD of Gbagi and its environs and the
informal arrangement of informal businesses in Iba market
(Oja’ba) and other local indigenous market places.
The growth of modern sector business consequent upon
the extension of railways to Ibadan exercised a magnetic
pull on the other ethnic groups in Nigeria. The Hausas,
Fulanis, Ibos, Ibiobios, Edos among others, migrated in
large scale to Ibadan and settled in different parts of it.
The young and educated people from the satellite villages
as well as other Yoruba towns around Ibadan were not left
out in migrating to Ibadan to seek formal work. Majority of
these migrants who did not possess the requisite skills or
34

did not have the opportunity of obtaining formal wage work
in the government or private sector settled down to
informal self-employment in craft or trading activities.
The development of the urban labour market of Ibadan
received additional boost when in 1946 the city became the
headquarters of the defunct Western Region. Increased
employment opportunities in the civil service created an
increased impetus for migrants from the surrounding areas.
The resultant high urban population growth also led to
increased demand for informal sector services. Moreover,
demand for domestic servants by the in-coming expatriates
and the growing class of local elicits employed in the
private and public sectors, increased phenomenally.
Another factor leading to the labour market
development was the economic progress of the post-war
years. This period was marked by high prices for export
crops with a resultant increase in income to farmers. Most
of the farmers and traders (especially the produce buyers)
from the satellite villages and other areas invested their
profits in house-building and transport enterprises, among
other investment outlets. Also, the government increased
its spending and the multiplier effect of such increased
expenditure stimulated both private formal and informal
enterprises.
Thus, Ibadan, apart from Lagos, became not only the
largest but also the most cosmopolitan city in Yoruba land.
Its labour market, especially the formal sector, continued
35

to grow and attract labour from the surrounding areas. One
single most important factor for this development is the
fact that Ibadan has remained the seat of the government
since the advent of Colonial administration. This explains
why the city has highly developed social and economic
infrastructures, why federal and state government’s
institutions are concentrated there, and why many private
formal and informal sector enterprises are located within
the city.
In spite of the increasing importance of formal sector
establishments in the city, informal sector enterprises,
rather than being strangled, are growing in terms of
employment generation and value of capital employed. The
formal sector enterprises due to the labour displacing
technology employed in its production process, cannot
generate enough jobs for the burgeoning labour force with
little or no skill streaming to the urban labour market
(Callaway, 1973). With no social security payment
forthcoming from the government and little or no familial
support in urban destination, those with no formal sector
jobs do, more often than not, settle down to informal jobs.
Thus, rather than go into extinction with increased
formal sector jobs consequent upon the changing
circumstances affecting the labour market, the informal
sector of Ibadan is rather growing (Onyemelukwe, 1982).
However, the magnitude of its impact in recent times is
36

little known, and hence this study is embarked upon to
examine its role in the development process.
CHAPTER THREE
LITERATURE REVIEW
3.1:DEFINITIONAL ISSUESMost of the literature on informal sector activities
starts with the definition of the term ‘informal sector’.
This, we suppose, is due to the fact that the definition
adopted has a tremendous impact on the method of analysis
37

on one hand, and the policy prescription emanating from
such analysis, on the other hand (Compare I.L.O., 1972 with
Moser, 19789).
The term ‘informal sector’ (NFS) was introduced into
economic analyses by Hart (1973) in his study of employment
opportunities in urban areas of Ghana. His definition is
conterminous with the activities of the self-employed in
the traditional sector of urban areas. The sector is
unenumerated in government surveys and due to technology of
production, productivity is low. By his definition,
informal income opportunities might be legitimate or
illegitimate and that the term refers to activities or
roles and not to persons since an individual can be
operative in either or both of the sectors at the same
time.
The term ‘informal sector’ was also adopted, and in
fact, brought to prominence by the I.L.O’s (1972) study on
the Kenyan economy, having borrowed the term from Hart’s
earlier version of his paper presented in a seminar in
1971. The I.L.0.’s study, like Hart’s identified a host of
income generating activities outside the relatively small-
based urban formal sector (FS) and such activities are said
to be concentrated in the ‘unorganised’ sector of the
economy (see also Mazundar, 1976). Such activities are
reported to be dominated by recent migrants, the very
young, the very old, and women, who are unable to obtain
regular employment in the formal sector.
38

According to the I.L.O. group, the informal sector
enterprises are characterized by ease of entry, small-scale
and labour intensive operation. Furthermore, technology is
adapted and skills are acquired outside the formal school
system and they operate in highly competitive labour and
product markets. In his analysis, weeks (1975) adopts the
formal/informal dichotomy but regards the informal sector
as ‘unenumerated’ since it is usually not covered by the
governments’ surveys. Mazundar (1976) regards the sector as
‘unprotected’ because income and employment in the sector
lack appreciable degree of security. In other words,
employment in the sector is viewed as being casual rather
than permanent when compared to the protected (formal)
sector where the actions of trade union, government or of
both acting in concert ensure security of income and
employment.
The dualistic approach to the analysis of the analysis
of the urban labour market (ULMA) as explained above does
not satisfy the Marxian economists. Rather, they conceive
the ULMA to be made up of several subsectors e.g. self-and
wage-employment (at the extremes). In a broader
perspective, therefore, they content that it is more
realistic to think of a continuum of heterogeneous
activities in the labour market, stretching from stable-
wage-work’ to ‘true self –employment’. Between these
extremes are intermediate activities; that is, casual work,
which are equally important as there exists transition from
one to the other during the lifetime of a typical worker in39
the sector. Work in the informal sector is said to be both
unstable and highly dependent on the capitalist sector in
terms of, say, subcontracting or the supply of spares,
capital, and so on, at exploitative prices. Moreover,
whether in true self-employment or wage, informal sector
workers are said to lack security of employment and
stability of income as compared to those in formal
employment (Bromley and Gerry, 1979).
Davies (1979) sees the formal-informal dichotomy in
terms of the differences in the mode of production, which,
he argues, is the single most important factor responsible
for exploitation of the masses of petty producers (i.e. the
informal sector workers) by the relatively few capitalist
class of the formal sector. Thus, it is opined that the
latter thrives on the misery of the former. In this
respect, Moser (1978) was unequivocal in her conclusion
that:-
‘petty production is dependent on capitalismwhile at the same time the capitalist mode ofproduction benefits from the existence andrelative viability of petty production for themaintenance of a low level of subsistence anda low cost of labour reproduction …………Because of the dependent relationship …policysolution designed to assist the latter(informal sector) almost invariably end up bypromoting the later (formal sector).
40

3.2:SOME VIEWS OF THE URBAN INFORMAL SECTORAs stated above, the Marxian economists have a rather
pessimistic view of the informal sector in contributing to
development as it is argued that the dependent nature of
the sector will prevent its transition towards the growth
of small indigenous capitalism. However, most empirical
observations do not lend support to this view (Staley and
Morse, 1965).
The Marxian conclusion notwithstanding, the reality in
most developing nations since the early 60’s that the
formal economy cannot generate enough jobs for its
burgeoning labour force led to an upsurge of research into
the urban informal economy. These are supposed to evolve
policies aimed at: (i) increase absorption of labour force
to keep pace with its rate of growth; (ii) adoption of
technology that is appropriate to resource endowment in
developing countries; and (iii) development of human
resources through the spread of basic skills (Amin, 1981).
One of the pioneering research works on the potentials
of the urban informal sector is that of I.L.O. (1972)
carried out on the Kenyan economy. The result of the study
shows that the informal sector is dynamic and capable of
generating jobs and profits for reinvestment. Therefore,
the report advocates positive government approach towards
the promotion of efficiency in the sector.
41

However, diverse opinions in academic circle have been
expressed as to the credibility/justification or otherwise
of the I.L.O.’s conclusion and recommendations. For
example, Schmitz (1982) believes that the recommendation of
the report have political undertone rather than a result of
sound academic research. In contrast, other eulogized the
research findings which are highly optimistic of the
potentials of the informal sector’s role in providing
opportunities for employment and earnings in the urban
economies of developing nations (Weeks, 1975; Amin, 1981).
Others hold caution optimism of the sectors’ potential role
in development (Mazundar, 1976; Merrick, 1976, Guisinger
and Irfan, 1980); while others hold a pessimistic view
(Moser, 1978; Gerry, 1978, Davies, 1979).
Despite this diversity of opinions, research work on
the sector is growing. Sethuraman (1977) gave a summary
report of a seminar organized in Ghana from 27 March to 2
April, 1977. The purpose of the seminar was to provide a
forum for an exchange of information about the formal
sector with respect to its size, potentials in terms of
income and employment generation; problems and constraints;
the role of government in its development; and so on. This
was done with a view to putting forward necessary policy
recommendations that will assist the sector in combating
the problems facing its growth.
The report supported the view that the sector is a
source of employment generation despite government
42
indifference/neglect/hostility as the case may be in
different countries. Given this finding, a host of policy
recommendations that will enhance optimal allocation of
resources so as to increase the sector’s contribution to
development were highlighted.
3.3:PREVIOUS EMPIRICAL STUDIES ON NIGERIAI n Nigeria, few studies exist on the urban informal
economy and even the existing ones are not very recent as,
for example, the data used for the most recent one
(Fapohunda, 1985) were collected in 1976.
The first known works on the urban informal sector are
those of Callaway (1964, 1965, 1973). These studies were
based on a rather comprehensive survey of all the
indigenous craft enterprises and small industrialists as
well as their apprentices, employees and/or journeymen in
the city of Ibadan. The survey was conducted in 1961, in
which 5, 135 enterprises were covered and from these, 250
apprentices were selected for further questioning in other
to examine the process of skill acquisition through the
apprenticeship system (Callaway, 1964)17. The 1965 study
made use of the same data set, and examined among other
things: the dimensions of the indigenous industries in
Ibadan in the 60’s as well as the nature of employment and
training they provide for young primary and secondary
school leavers. In his 1973 study, the author’s efforts
were concentrated on 225 craft and small-scale enterprises
in the informal sector of Ibadan. The study highlighted
43
various important operational characteristics of informal
sector enterprises in manufacturing, services, building and
printing. His research findings show that the sector
contributes to employment and skill development of young
school leavers who would have otherwise remained
unemployed.
A survey of small-scale industries was undertaken by
the Industrial Research unit of Ife (now Centre for
Industrial Research and Development of Obafemi Awolowo
University, Ile – Ife) in 1972. In the then Western State
(now Oyo, Ogun and Ondo States) 13,592 industrial units
were covered in the 24 divisional headquarters of the
state, while 1,673 industrial units were covered in 25
other towns and villages.
Originally, the industrial survey of the Unit was not
planned for informal sector enterprises alone but for all
small-scale industries in general. However, by the
definition of small-scale industry adopted, which, industry
adopted, which is:
‘one whose total assets in capital equipment,plant and working capital are less than$25,000 (i.e. N50,000) and employment fewerthan 50 fulltime workers. It includes afactory or a non-factory establishment. It maybe a household, a cottage, a craft or afactory industry. It may or may not use motivepower’ (p. vi).
44

One can then infer that the survey includes a reasonable
number of informal sector enterprises.
The study is a comprehensive survey of every
industrial activity that was willing to cooperate with
field workers. The unit was able to achieve a high response
rate of 75 per cent and this success was as a result of
wide publicity engaged in before and during the data
collection exercise. The result of the survey shows that
about 52 per cent of the enterprises were engaged in
tailoring, 10 per cent in carpentry while 5 per cent were
in gold-smithing. Other significant ones are motor-
repairing 4.8 per cent; bicycle and shoe- making, 4.20 per
cent. It is however interesting to learn from the survey
report that the structure of small-scale industries is the
same in both urban and rural centre. It was also reported
that the majority of the industries covered in the survey
render services rather than actually manufacturing.
However, this survey did not cover operators in the
wholesale and retail trades. This subsector of the informal
sector is too significant to be neglected in small-scale
industrial survey.
Adepoju (1975)47 conducted a survey on the non-formal
vocational training in the small-scale industries of
Western Nigeria. His study focuses on the mode of skill
acquisition of the urban youths in the formal sector jobs.
Using part of the data collected by Aluko et. all. (1972)46,
the author was able to find out that the apprenticeship
system is an important mode of vocational training for the45

urban informal small-scale establishments. It is an
alternative to unemployment in cities and farm-work in the
villages. The apprentices, as revealed by the study, were
of low education, young, have low preference for
traditional crafts like pottery, dyeing etc., and quite a
number of them are recent migrants to the cities. The study
also shows the importance of the informal economy in skill
development and labour absorption.
However, one wonders why the researcher did not include
Ibadan, the capital city of Western State which is the
focus of his study, in his analysis.
Using 1976 cross-section data on 2,074 informal sector
enterprises of Lagos, Fapohunda (1985) critically examined
the factor affecting the size and structure of enterprises
in terms of income and employment generation, the extent of
linkages between enterprises and possible constraints
affecting growth. The sampling procedure adopted in the
study is the 2-stage random sampling technique, that is, a
minimum of ten enterprises were selected from each of the
delimited 200 enumerated areas. The analysis of data
revealed that the sector provides a wide range of income
opportunities for those not having the skill and/or the
opportunity of entering the wage formal sector enterprises.
In terms of sample size used, the study is considered
to be an improvement over Callaway’s (1973) that studies
225 enterprises in Ibadan. However, we have a reservation
as to how 1976 data used for the study published in 1985
46

(without any specified modification to the data) could have
possibly revealed present trend in the sector. Also, the
International Standard of Industrial Classification (ISIC)
adopted for the study may be suitable for formal sector
large-scale production units, but its adoption for small
units in the formal sector may not be very adequate. This
is because ISIC does not bring into sharp focus the type of
activities grouped together under the international
classifications of ‘Paper and Paper products’,
‘communications’, ‘utilities’ and ‘Inadequately Defined’,
among others. However, the fact that the study was
conducted on behalf of an International Organization
(I.L.O.) might have motivated the author to adopt ISIC as
this makes international comparison possible.
Mabogunje and Filani (1984) conducted a study of the
informal sector in the city Kano. Like this study on
Ibadan, the Kano study concentrated more on NFS workers in
the manufacturing and technical services enterprises. It
was reported that the 505 enterprises sampled employed a
total of 903 persons including the entrepreneurs. This
gives an average of 1.8 persons per enterprise.
Like any other NFS enterprises, NFS businesses in Kano
were set up mainly to provide employment and income
opportunities for the owners. This is shown by the fact
that about 67 percent of the enterprise did not have any
other worker apart from the owner.
47
In terms of income, it was reported that average
monthly earning of Kano entrepreneurs were higher relative
to those in Lagos. The earnings also compare favorably with
formal sector earnings.
More striking about the Kano study is the evidence
shown by the study that recent migrants had put together
enough capital to establish own enterprises and are earning
modest level of income not lower than the minimum wage
Informal sector has thus contributed to social mobility of
this group given their pre-migration economic conditions.
At first sight, the study gives an impression that the
preponderance of NFS labour force is males and natives of
Kano. However, one needs to take this with caution given
that the study‘s sampled enterprises consists mainly of
manufacturing and technical services where males and
natives are likely to be dominant. A proportional
representation of activity like trading would have shown a
different picture of the sex distribution and migration
status of the NFS labour force.
However, evidences from both Kano and Lagos studies
suggest a substantial employment and income opportunities
in the urban informal sector of Nigeria.
3.4:EMPIRICAL STUDIES ON OTHER DEVELOPING
COUNTRIES
48

In spite of the paucity of research on the NFS
activities in Nigeria, research into employment and
earnings potential or urban informal sector in other
developing countries are numerous. The Kenya study,
(I.L.O., 1972) reports that the sector is dynamic and
capable of generating jobs and profits for reinvestment.
According to the report:
“the bulk of employment in the formal sector,far from being marginally Productive, iseconomically efficient and profit making”.
In line with this conclusion, Sethuraman (1984, p. 35)
maintained that NFS activities are not only profitable, but
they have been reported in several developing countries
(like Kenya, Togo and India, among others) to be generating
surplus even when they are known to be operating within
hostile policy environment. Moreover, such activities have
been shown to be capable of generating more employment and
output for a given level of investment than the FS
enterprises.
A follow-up to the I.L.O.‘s study on Kenya was carried
out by House (1984)51 and its results support those of the
I.L.O. ‘s with minor qualifications. Instead of presenting
a generalized view of the urban informal sector, House
identified two sub-sectors made up of a reservoir of
dynamic entrepreneurs with adequate and growing level of
profit, and second; the ‘community of the poor’ eking out
meager existence in the sector. House, however, did not
offer possible explanations for the observed state of
49

abject poverty of the members of the ‘community of the
poor’. What readily comes to mind as an important factor
influencing the level of living of the ‘community’ is their
uncommitted state within the NFS of the ULMA 52. That this
argument is with some merit can be supported by House’s own
definition of the ‘community of the poor’. They are those
“attached to the city in order to gainentrance to employment in the formal sector.Because they view their current plight astemporary, they maintain hope of admission tothe protected sector” (p. 380).
It can then be argued that their uncommitted state in the
nefs sector or ULMA is a possible explanation for their
living condition and not necessarily because they are
located in the NFS rather than FS.
The findings of Guisinger and Irfan (1980) in their
study of urban informal sector in Pakistan lends support to
the above view. Using the family poverty index 53 as a
benchmark, the study concludes that the NFS and FS do not
seem to be significantly different in terms of the
proportion of poor workers in the two sectors.
Rather than using an aggregate analysis of all urban
NFS labour force, Amin (1981) 12 disaggregate total
employment within the urban NFS of Dhaka City (Bangladesh)
into two categories: the self-employed and the employee.
His study shows that the self-employed enjoy better
economic reward especially in terms of earnings, employment
stability and enhanced scope for upward mobility. For
50

example, not less than a third of all enterprises studied
are reported to have considerable growth potentials as
compared to about a quarter that can be considered
marginal. The others are said to be making at least an
average living within the sector.
Given the rapid labour force growth in most cities of
developing countries it is fast becoming a mirage that
urban formal economy can provide all the required jobs. In
fact in most countries, formal sector jobs are not only
stagnant but are declining. In contrast, evidence in
Lusaka, Scott (1985) reports that the NFS provides self-
employment as marketers, craftsmen, manufacturers and shop
owners for many of the labour force entrants and re-
entrants. These are people that have little or no hope of
being given the bleak employment situation in the formal
economy.
In their study of employment status of migrants into
the labour market of the city of Ludhiana in the Indian
Punjad, Oberai and Singh (1984 p.515) show that one third
are own account workers in the informal economy. Similarly,
Sethuraman (1985) discovered that over 50 per cent of the
non-agricultural workforce are in the informal economy of
urban Indonesia. He maintained that such NFS, units played
a significant role in labour absorption process.
Also, in terms of earning, the study corroborates
others from other countries that income from such urban
informal employment are comparable to those in the formal
51

economy in Indonesia. However, a good number are earning a
very low level of income.
Thus, given its importance in labour absorption and
income opportunities, Sethuraman puts forward a host of
policy prescriptions that are capable of improving the
performance of the sector. Such include more government
involvement in the sector as well as provision of credit to
the entrepreneurs.
The informal sector in Manila, as in any other third
world city, exhibits the preponderance of trading
activities (being at least 60 per cent) relative to others.
A stratified random sampling procedure adopted by Jurado
et. Al. (1984) for the Manila NFS survey led to a heavy
concentration of the sample enterprises in trade activity
(71%). Findings from the subsample of the Manufacturing
(MS) enterprise show that wages are low compared to both
the FS enterprises and national minimum wage. Such low wage
is particularly worse for female members of the labour
force in the NFS.
One important feature of the informal manufacturing
enterprises of Manila is the importance of capital and raw
material recycling among entrepreneurs. This is one of the
NFS approach to solving the problem of capital and raw
material inadequacy. Of equal importance is the efficiency
of these enterprises. For the same amount of investment, it
is revealed that informal manufacturing enterprises
52

generate more employment and value-added as compared to
formal sector manufacturing concerns.
In Freetown, similar impressive report of NFS was
reported by Fowler (1984) 58 in terms of income and
employment generation as well as innovative and adaptive
skills of the entrepreneur. For example, most of the
capital equipment were locally manufactured and are
circulated within the sector, thereby easing capital
constraints. Moreover, rather than being frustrated as
hypothesized by dependency theorists, workers (especially
the self-employed) are reported to be living impressive
social and job mobility. It is also reported that such
phenomenon is dominant among migrants who constitute the
bulk (80 per cent) of the entrepreneurs.
The general trend of argument with respect to
employment and earnings in the urban informal sector seem
to be in two directions. The conventional economic approach
which recognizes the importance of the NFS in terms of its
ability to provide considerable employment and income
opportunities despite some problems within the sector.
To these class of researchers:-
“the informal sector’s role is too importantto be ignored in the prevailing socio-economic conditions…… (as it is) helping toabsorb the growing urban labour force, puttingmaterial resources to their maximum use,adapting a technology that responds to factoravailability and over which the users have
53

command, providing some basic needs ataffordable prices”. (Amin, 1981, p. 108).
The opposite view which is rather based on dependency
theory as postulated by Marxian economists, views the
sector as occupying a subordinate position in relation to
the formal sector and therefore, its growth potential in
terms of employment and earnings is hindered. Vale Souza,
etl al. (1988) among others, using data collected in a
sample survey of Greater Recife argue that hindrances to
growth arises from the disadvantaged position of the
enterprises in NFS relative to those in FS. In line with
this argument, the question of the NFS operators subjecting
themselves to “self-exploitation” rather than being
exploited, do not arise (Amin , 1981). This is said to
arise as a result of several factors hindering growth of
NFS enterprises. These are:
(i) Lack of access to government assistance;
(ii) Price and other constraints in the input market;
(iii) Subcontracting arrangements which severely
limit the scope for setting their own prices
(Vale Souza, et. Al. 1988).
Similar arguments have been put forward, at varying
levels of sophistication, by Bose (1974), Beinefeld (1975),
Moser (1978), Bromley and Gerry (1979); and Gerry (1978),
among others.
The above-mentioned constraints, notwithstanding, not
all studies have supported the dependency theory claim. For
54

example, using multiple regression analysis, House (1984)
established that subcontracting arrangement (an element of
dependence of informal sector enterprises as it
significantly affected the profit level of the NFS
entrepreneur in a positive direction. Thus, reacting to the
exploitative theory, House, among others, concludes that:
“Far from being exploitative …. Linkages withthe formal sector appears to succeed inraising the income of subcontract recipientsabove those of non-recipients” (p. 290).
It is our attention to subject these opposing
theoretical positions to empirical test using data
collected from the urban informal manufacturing and
technical services enterprises in Ibadan.
CHAPTER FOUR
CONCEPTUAL FRAMEWORK AND METHODOLOGY
4.1 CONCEPTUAL FRAMEWORK
4.1.1 The Urban Labour Market (ULMA)
55

Much ink has been split on whether the urban labour
market should necessarily be dichotomized into the formal
and informal segments. While various authors support such
dichotomization (I.L.O., 1972; Mazundar, 1976; Sethuraman,
1976) yet, others have contested such dual classification
(Moser, 1978; Gerry, 1978). Thus, the latter group
perceived the market as a continuum of heterogenous
activities ranging from stable wage work to true self
employment at the entremes. Within these extremes exist
myriads of other activities (Bromley and Gerry, 1976).
Rejecting this contention, Mazundar, (1976) presents two
reasons:
(a)“whether the relevant characteristics represent a
continuum or not is itself a subject of research, and,
if we are to go by casual empiricism, then certainly the
view that the ‘formal’ sector is separated sharply in
some way from the rest of the urban market is more valid
than the contrary one for many LDC urban markets.
(b)Even if the difference between two types of employment
is one of degree rather than of kind; so long as it is
of marked degree the methodology of economics can be
applied successfully by operating with models which
assumes that the market is split into two different
sectors”.
Akin to the above, evidence s of dualism in the mode
of production and employment predominate in urban
economies. Thus it is not uncommon to have well-organised
56

enterprises using capital-intensive production method and
small-scale self-employment, unorganized and labour
intensive activities to exist side by side in the urban
labour market. Evidences from weeks (1975), Hart (1973)
among others support this view. Thus, activities that are
in the unorganized sector and fall outside both the
encouragement and the data-collection activities of the
government are said to belong to the informal sector
(Sethuraman, 1984, p. 11; ILO, 1972, p. 5). On the
contrary, enterprises that are covered by the data-
collection activities of the government, where jobs and
employment conditions are protected and have access to the
organized product and factor markets are said to be in the
formal sector (FS) (Amin, 1981, p. 11; I.L.O, 1972, p. 6).
The nature of protection of jobs and wages in the FS by
government and unions is an important reason for market
segmentation (and possibly distortion), in the urban labour
market and hence the failure of the market to equalize the
marginal social productivity of homogenous labour operating
in different sectors of the market. The union and
government attitudes in the ULMA have contributed to the
observed segmentation in the market. In such a situation,
human capital endowments may not be equally rewarded as a
result of operating in different sectors of employment
within the labour market.
The powers of union in pushing up wages in the FS are
usually influenced by (a) the elasticity of demand for
labour in a particular industry; (b) the size of the57

protected sector relative to the rest of the ULMA, and (c)
the strength and militancy of the union (Berry and Sabot,
1978, p. 1207). Apart from these institutional factors,
these are other factors that can explain the high non-
market clearing wage in the FS. First, for firms to attract
workers committed to organizational goal on a long term
basis, high wage need be offered. This is because low wage
and effective worker commitment are mutually exclusive.
Thus, to induce a more permanent labour, family migrants
having higher supply price (relative to individual migrants
retaining rural ties) need be enticed with higher wage.
Second, even under free market situation, the protected
high wage might still persist in the formal sector. This is
due to the observed direct relationship between the wage
level and the efficiency of a worker. In this respect,
Mazundar (1976 p. 656) maintain that:
“up to a certain point, an icrease in the wageper worker increases efficiency more thanproportionately to the increase in the wage,so that wage cost per unit of work suppliedfalls. After a point, of course, the increasein wage will lead to a less than proportionateincrease in efficiency, and there will be noincentive for management to set the wage levelfor an individual worker higher than thislevel. Thus even in the presence of an excesssupply of labour it will not pay management toset the wage at the lowest level possible. Theestablishment wage will be that which ensurethe minimum wage cost per unit of effortsupplied”.
58
Formal sector firms employing capital intensive modern
technology pay such higher wages to increase and sustain
efficiency and secure worker attachment to the firm. Such
stable body of worker is able to acquire more firm-specific
human capital through learning by doing, and this enhances
efficiency and productivity.
Even in the presence of surplus labour in the ULMA,
such wages are not lowered; rather, firms engage in flating
job requirements in order to select the relatively highly
qualified employees. Others not possessing the requisite
skill and education and therefore cannot cross the entry
barrier are ‘bumped’ out (of the FS) and are therefore
constrained either to operate in the urban NFS, or to join
the queue of the urban unemployed in order to invest
intensively in urban FS job search (Fields, 1975, p. 911)
if the latter course of action is taken, the dual effect of
full-time investment in information and intensive job
search enhances the probability of being employed in the FS
at a later period. However, these groups of the unemployed
are those that are confident of means of support either
through previous savings, familiar support or both. Without
this, full-time investment in job search is not a probable
phenomenon in LDCS due to prevailing level of poverty of
most ULMA operators (Udall and Sinclair, 19826; Blaug,
1974a).
On the supply side, two important ULMA signals to the
surrounding areas encourage urban-ward migration.
59

Additional job opening in the FS, and the demonstration
effect of the ‘success’ of NFS workers who migrated few
years before. In other words, operators in both sectors
send signals back to their origin and these encourage their
peers to migrate.
Apart from rural-urban migration, another important
source of urban labour supply is the rate of natural growth
of the cities themselves with the resultant effect of high
labour force growth. Not less than 60 per cent of urban
population growth is accounted for by natural increase
while the rest are migrants from the surrounding areas
(Population Report, 1983).
The ULMA labour force seeking NFS employment can be
categorized into two broad classes. The first group are
those with some education who initially desired FS
employment but have not succeeded. To support themselves
while prospecting for FS job, they might enter the NFS with
a hope of moving to the FS later. The second group are
those that are either primarily interested in taking up a
job in the NFS or those that have readjusted their
previous unrealistically sanquine labour market expectation
and have later decided to avail themselves
of the income opportunities of the NFS. Most of those in
the latter group are usually interested in acquiring skill
through the apprenticeship system with a view to owning an
enterprises after training.
60

Thus, entrants into the urban NFS, initially can
either be committed (e.g. the second group or uncommitted
(e.g. the first group). In subsequent periods, movements
between committed (C) and uncommitted (U) states are not
uncommon. For example, a person in C state in the NFS in
period one may later be enticed to a steady high wage
employment in the FS in another period, and vice versa.
Also, movements from the FS to the NFS are not uncommon and
workers in such case, more often than not, do occupy the C-
state. However, exception to this rule might occur with
those involuntarily laid off from FS job but are still
interested in re-entering the FS (Figure 1).
In the manufacturing and technical service (MATS)
subsector of the NFS, those that are likely to predominate
in the C state are those with some skill. Having been
trained either through the apprenticeship system or in
their previous formal sector jobs, and have established or
are looking forward to establishing own enterprises,
incentives towards leaving are dampened. They are likely to
stay on until the left (L) state is reached. For those in
the C- state, the L state is reached either through
voluntary withdrawal due to old age or through involuntary
withdrawal as a result of either infirmity or death.
Majority of those in the U-state are more likely as
opportunity presents itself to move to the FS to take up
the much sought-after job, or failing that, go back to
61

Left
UncommittedCommitted
school to acquire further literacy or technical skill that
can enhance their chances of entering the FS.
However, it should be stressed that movements
discussed above is not peculiar to NFS only. Within the
ULMA, dynamic relations exist which ultimately affect
labour allocation. Assuming the ULMA can be neatly
compartmentalized into the FS and NFS then the dynamic
relations as shown in figure 2 below are possible. Supply
of labour to the urban labour market (ULMA) takes place
from the surrounding areas (SA) and from within ULMA
itself. Those from the SA can either enter the FS or the
NFS initially.
Fig.1: MOVEMENTS WITHIN THE URBAN INFORMAL SECTOR
Entrants/Re-Entrants
Movements within the sectors are possible while some
may withdraw from ULMA for further education. These
62

FORMALINFORMAL
URBAN LABOUR MARKETS
EDUCATION
movements between and within subsectors of ULMA and
education sector continue until wastage occurs.
Thus, rather than being static, movements of labour
within and between sectors of ULMA do take place and such
labour allocations and reallocations in line with labour
market signals (real or anticipated) go on constantly in
the ULMA. The resultant effect (as a result of the
structure of FS and NFS) is a downwardly rigid high wage
above the market clearing level in the former; and a
relatively low but market-clearing earning in the latter
which is also characterized by a not-too-difficult entry
and high rate of turnover.
Thus, contrary to Todaro’s hypothesis that entrants
into ULMA are attracted by high-wage FS job, our model
postulates that income opportunities within the NFS itself
is an important source of attraction to workers who may or
may not eventually remain in the sector for a considerable
length of time (I.L.O., 1972, p. 227).
Fig. 2: DYNAMICS OF FORMAL-INFORMAL RELATIONS WITHIN URBAN LABOUR MARKET
FROM SURROUNDING AREAS
63

WASTE
4.1.2 Factors Affecting Entry into the MATS Subsectorof Urban Informal Sector
An important distinguishing factor between the small-
scale enterprises and the NFS enterprises is the mode of
production adopted. According to Sethuraman (1984, p. 17),
most, if not all, of the small-scale enterprises use a mode
of production somewhat similar to that in the FS
enterprises, albeit, on a relatively smaller scale.
However, the NFS enterprises due to shortage of capital use
local or adapted technology and are established primarily
to create employment for their owners (and others if
possible) rather than an opportunity for investment
motivated by short-run profit motive.
Thus, the level of capital, educational attainment and
skill of the entrepreneur are likely to be low in the NFS
compared with the FS.
In contrast to other operators in the NFS, operators in
the MATSs subsector need some level of technical skill
usually acquired through the apprenticeship system or other
64

formal mode of training. On completion of such training
these operators may decide to:
(i)Set up own enterprise immediately if parents/guardians
can afford to provide the necessary initial capital.
(ii) Become journeyman with his master or other master to
be able to raise initial capital for setting up own
enterprise in case parent/guardian are not able to
finance this;
(iii) Secure formal-sector job in the technical or sub-
technical category;
(iv) Engage in casual employment to raise capital.
(v)Return to school (vocational or literary) to obtain
formal education to enhance entry into FS.
These trained workers are much more likely to settle
down as enterprise owners in the FS. The hypothesized mode
of skill development and entrepreneurship development in
the NFS, MATS subsector are depicted in figure 3.
Entry into the MATS subsector for the purpose of skill
acquisition and eventual settlement as enterprise owners
can be posited to be influenced by several factors. These
factors can either be voluntary or involuntary. Voluntary
factors are: the influence of culture
and individual’s response to economic motivation.
Involuntary factors include the influence of education and
the state of the economy, that is, whether the economy is
buoyant or going through a recession/depression. The line
diagram in figure 4 depicts each of these factors as
65

JOURNEYMANFORMAL / INFORMAL WAGE EMPLOYMENT
MASTER / ENTERPRISE OWNER
APPRENTICESHIP FORMAL MODE OF TRAINING
EDUCATIONECONOMIC SITUATION:
NOT BOUYANT
ECONOMIC SITUATION BOUYANT
ENTREPRENEURSHIPDEVELOPMENT
(+)
(+) or (-)
(-) (+)
CULTURE
RESPONSE TO MOTIVATION
(+)
(+)
(+)
(-)
(+)
(-)
Fig. 3: SKILL FORMATION AND ENTREPRENEURSHIPDEVELOPMENT
PROCESS IN THE URBAN INFORMAL SECTOR
Fig. 4: FACTORS INFLUENCING ENTREPRENEURSHIP DEVELOPMENT INTHECRAFT SECTOR
66

Well as our a priori expectation regarding its direction of
influence on entrepreneurship development.
Influence of Culture
Within traditional family structure, the culture of
passing family skills to descendants is widely prevalent.
Thus, families which are known for hunting, carving,
weaving, blacksmithing, native medicine and so on, are
culture-bound to pass such skills to their sons or
daughters who will in turn pass it to their descendants.
This cultural influence is prevalent among rural migrants
and those that were born in the sector and have low
education. A priori, we expect cultural influence to have
positive, though very low, impact on entrepreneurship
development. We expect it to be low because the prevalence
of formal education has a negative impact on it, making
fathers to prefer their sons/daughters to be well-educated
and to go into the formal sector. However, those with
little or no education will still be influenced by cultural
attitude towards entrepreneurship in the informal sector.
Education
Education enhances the opportunity of an individual to
participate in the formal high-productivity sector of the
67

economy. Those with little or no formal education (in an
economy where the rate of growth of labour force exceeds
the rate of job creation) are ‘bumped’ out of the skilled
labour market and are forced either to remain in the formal
sector as applicants or move into the informal sector. As
the educational attainment of applicants increases in the
aggregate, employers tend to inflate educational
requirement for jobs. This worsens the chance of those that
are less educated into being absorbed into the high-wage
formal sector. Given this situation therefore, an applicant
with a relatively low education in the urban economy has
the following options:-
(i) Migrate backwards to the rural sector and get an
agricultural occupation;
(ii) Continue in urban sector job search until a job is
eventually found;
(iii) Engage in urban informal sector activity either
as an employee or an apprentice with a view to owning
an enterprise in the future.
Option (i) is probable but not highly likely as rural
immigrants will be prepared to remain in the urban economy
at all costs given the deplorable conditions of rural life.
Moreover, these people aim at maximizing lifetime utility
by participating in the urban economy. Option (ii) is also
not likely. This is because urban immigrants are often too
poor to afford the luxury of full-time unemployment for a
long time (Blaug, M. 1974a) 65 . Option (iii) seems, the
68
most likely. Those who intend to own their enterprises in
the future, in most cases, get apprenticed to a master for
training while a host of others engage in petty trading or
obtain informal wage employment.
Thus, we expect a priori that educational attainment
and entrepreneurship development in the informal craft
sector to be inversely related. That is to say, the higher
the formal educational attainment of an individual, the
less likely it is for that individual to be motivated
towards entrepreneurship in the informal sector (Aluko,
1966)67. This expectation seems reasonable given the kind of
education that creates aversion for manual work that is
prevalent in developing countries. Moreover, opportunity
for entering the desired highly productive and protected
formal sector increases with education.
Response to Motivation
Motivation towards entrepreneurship may arise from the
independence and pride of ownership associated with owning
one’s enterprise. Also, motivation may result from the
possibility of maximizing life-time income stream in urban
self-employment. Those that are likely to come under this
influence are:
(i) Rural migrants from the traditional sector with little
or no education who are not culture-induced but are
probably influenced by the demonstration effect of
69

home-coming of friends and relatives. This class of
people had previously migrated to the cities to become
enterprise-owners after a few years of apprenticeship.
(ii) Those who initially, with low education, accepted the
urban formal wage employment as clerical workers or
messengers, but were later trained on-the-job as
artisans by their employers.
(iii) Those trained through the apprenticeship system,
but had to work as journeymen or get formal wage
employment in order to obtain initial capital.
Educational attainment of these classes of people is
low, and if given the chance to receive further education,
their orientation will shift from informal sector
employment to formal wage employment. Hence the negative
relationship postulated between education and response to
motivation of becoming an entrepreneur in the urban
informal sector (Fig. 4).
For those in group (i), their interest was stimulated
by those who went into the informal sector before them who
are now ‘successful’. Thus, wanting to be like
predecessors, these youths migrate to the urban sector and
get apprenticed to masters, and all other things remaining
equal, set up own-enterprises after training. Those in
groups (ii) and (iii) are motivated by the ‘successes of
their counterparts who have set up their own businesses. In
most cases, these people maintain a dual role in the urban
labour market. That is, they work for wages in a firm or
70

for a master, and engage in part-time jobs after
office/workshops hours in the informal sector. Their
earnings from such part-time work encourage them to be
thinking of setting up on their account and be proud
enterprise owners free from control associated with their
current employment. Those that are risk-loving tend to give
up current employment even before reaching retirement age
while those that are risk-average may not likely set up
their own enterprises until after retirement from current
employment.
Thus, we expect a positive relationship between
motivations identified and entrepreneurship development.
Economic Situation
Economic situation in terms of whether the economy is
buoyant or going through a recession/depression is expected
to be an important factor in entrepreneurship development.
In each period of boom and depression, income opportunities
open to individual economic unit differs at different costs
and benefits. During a boom, economic activities are
stimulated and employment and income opportunities abound
in both the formal and informal sub-sectors of the urban
labour market. Urban formal jobs are available for many
applicants that are qualified by previous educational
attainment. Also, motivation towards indigenous
entrepreneurship increases for those not qualified to enter
the formal sector jobs.
71

However, during a recession formal urban job creation
may be zero or even negative. Most migrants to the city are
not likely to be employed in the formal sector while there
may be retrenchments and lay-offs in the sector at the same
time. Thus, having no other choice, many of the rural
migrants and those unemployed in the city may be forced to
be apprenticed to a master in the informal with a view to
owning enterprises of theirs after training. Thus, during
economic recession/depression, we expect, a priori, a
strong incentive towards entrepreneurship development in
the informal sector.
We want to mention, albeit briefly, that these factors
are not totally independent of one another. Rather, they
exert influence on each other. As shown in Fig.4, culture
is influenced by education while economic situation exerts
an influence on education and response to motivation. The
directions of influence and their possible impacts are
indicated by arrows and signs (‘+’) for negative impacts
respectively.
4.1.3: Urban Labour Demand and Supply Analysis
Urban labour market analysis attempting to suggest
policy measures to deal with the chronic unemployment
problems in developing nations usually starts with Todaro’s
(1969) migration model. This is a two-sector model dividing
the economy into the rural/traditional and the
modern/industrial sectors. Migration is thus postulated to
be an economic decision taken on a rational basis by the
72

individual migrate s in order to take advantage of better
income opportunity prevailing at the destination. Thus, it
is postulated that migration depends on: (a) the difference
in wages or earnings between areas of destination and
origin, and (b) the chances of finding a job at the
destination. The products of (a) and (b) above gives the
expected gains from migration and an individual will want
to maximize such gains over his lifetime.
The prevalence of wide differential between urban and
rural wage has exacerbated rural-urban migration in
developing nations. This explains the observed rapid urban
growth and urbanization in these nations. Such high rate of
urban growth with its concomitant high rate of urban growth
of labour force compounds employment problem in an economy
where formal-sector employment is low and even negative in
some cases (Todaro, 1989).
In the original formulation of Todaro’s two-sector
model, it is assumed that those that do not have the skill
or the opportunity of being employed in the formal sector
remain openly unemployed. However, a reformulation of the
model recognizes the importance of the informal sector as a
temporary staging post for recent migrants pending the time
they are able to get the desired formal sector job (Harris
and Todaro, 1970; Harberger, 1971).
The informal sector in this situation performs labour
market clearing function in a situation where the
infinitely elastic migration-fed labour supply exceeds the
73

demand in the high wage formal sector. Thus, rather than
remain unemployed, new entrants into the labour market get
engaged in any informal sector jobs such as hawking,
street-vending, shoe-shining and getting apprenticed to
masters in trades like motor-vehicle mechanic, carpentry,
barbing, welding and so on. It is still a controversy in
economic literature whether these migrants merely take up
informal sector in order to invest in formal sector job
search or whether they are permanently settled in the
sector (Banerjee, 1983). For the Nigerian situation, this
has to be empirically verified in this study.
No matter their location in the urban labour market,
it has been reported that migrants usually benefit by their
moves and make more money than before, even at unskilled
jobs (Population Report, 1983). The net effect of this is
to induce migrants peer group in the village to migrate and
the tendency is for this trend to continue as long as urban
bias in regional development and job creation continue
unabated. The resultant increase in urban labour supply
vis-a- vis the increased inability of modern industries to
generate enough jobs, has given rise to high rate of urban
open unemployment.
Economic literature is replete with the analysis of
unemployment since economics as a discipline is concerned
with optimal allocation of scarce resources in a world of
unlimited ends. Therefore some macro-economic theories of
unemployment will be reviewed in order to see how such
74

theories help in explaining and prescribing right policy
measures for the chronic involuntary unemployment in
developing nations.
Macro-Economic Theories of Unemployment
The classical employment analysis was based on the
Walrasian general equilibrium model in which price
flexibility is the key factor in the correction of any
labour market disequilibrium. The flexible ruling market
price also helps to maintain the system-wide market
clearing equilibrium.
Thus, in the labour market, shortages or surplus of
labour is dealt with by wage movement: the wage falling
below the equilibrium to mop up excess labour supply, and
rising above the equilibrium when there are shortages. By
so doing, the incidence of involuntary unemployment is
removed from the classical labour market. However, at the
ruling market clearing wage, unemployment that can exist
are the voluntary and frictional types.
Voluntary unemployment manifests in the economy when,
due to market imperfections or institutional rigidities
(e.g. union influence, minimum wage legislation), workers
are reluctant to take up jobs at the going wage rate.
Frictional unemployment arises as a result of the
imperfection of the market to match labour supply with
demand instantaneously. Imperfections in knowledge and
75

mobility are the chief causes and it is usually of short
duration.
In the classical world of flexible wages, chronic
involuntary unemployment is a misnormal. This is because
the self-regulating character of the economy through
flexible prices can always ensure that no involuntary
unemployment exists. The level of market clearing wage thus
determines the level of employment in the economy.
In Keyne’s analysis, the classical view of wage
flexibility and its acceptance by labour was rejected.
Keynes assumed that workers will not be willing to accept
wage cut to secure more employment even if they will accept
reduction in real wage brought about by rising prices at
constant money wage. His weight of analysis rests on the
level of aggregate demand in the economy.
Given the marginal productivity (i.e. demand) curve
for labour, and the supply intersecting it at a point E
(Figure 5), a fall in aggregate demand will manifest itself
in the labour market in form of reduced demand for
services. Thus, the demand for labour moves up the labour
demand curve to a higher real wage W2 from equilibrium level
of W1. At W
2,
Fig. 5: DEMAND AND SUPPLY CURVES FOR LABOUR
Real Wage D S
L L
76
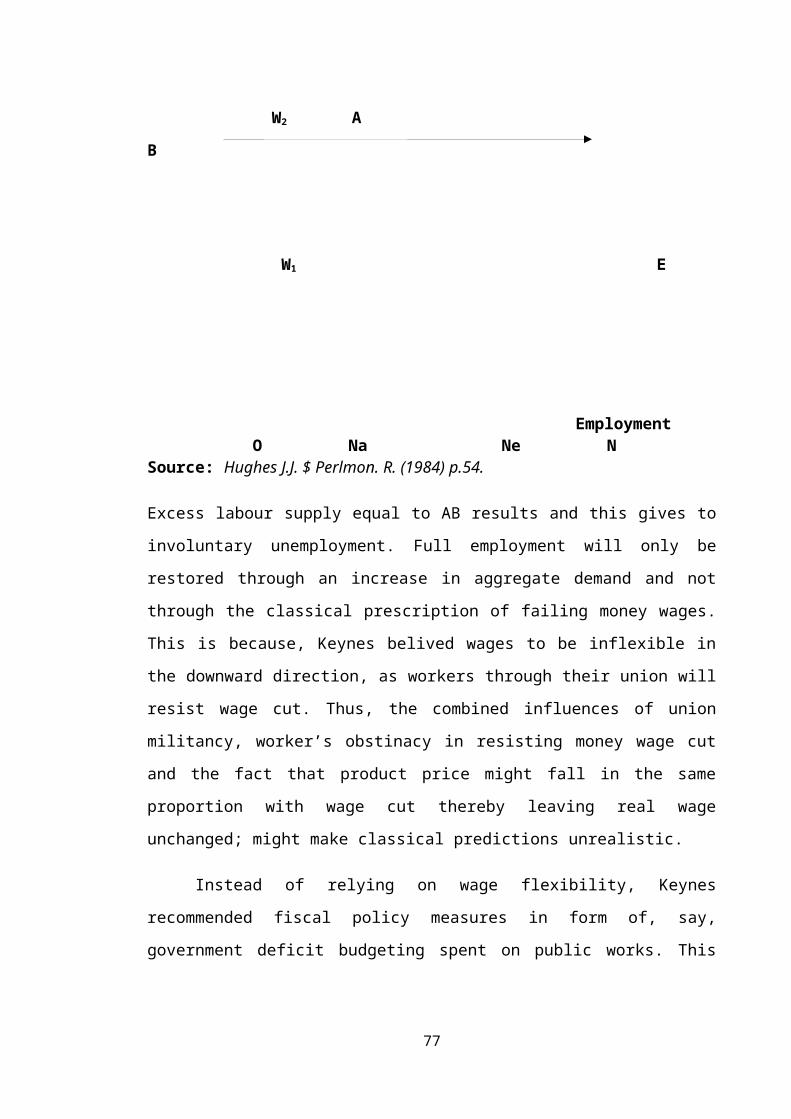
W2 A
B
W1 E
Employment O Na Ne N
Source: Hughes J.J. $ Perlmon. R. (1984) p.54.
Excess labour supply equal to AB results and this gives to
involuntary unemployment. Full employment will only be
restored through an increase in aggregate demand and not
through the classical prescription of failing money wages.
This is because, Keynes belived wages to be inflexible in
the downward direction, as workers through their union will
resist wage cut. Thus, the combined influences of union
militancy, worker’s obstinacy in resisting money wage cut
and the fact that product price might fall in the same
proportion with wage cut thereby leaving real wage
unchanged; might make classical predictions unrealistic.
Instead of relying on wage flexibility, Keynes
recommended fiscal policy measures in form of, say,
government deficit budgeting spent on public works. This
77

has the potentials of increasing aggregate demand and
hence, removing the incidence of involuntary unemployment.
For a developed economy, Keynes remedial policy for
removing involuntary unemployment might be applicable but
its potency for solving unemployment problem in developing
countries are rather very doubtful for two reasons.
First, the nature of unemployment in these countries
differ from that in developed nations. While developing
countries suffer from chronic unemployment for a long
period of time due to either deficiency or inefficient use
of capital and other cooperant factors, unemployment in
developed nations is cyclical resulting from low level of
aggregate demand. Thus unemployment in poor nations might
not be receptive wholly to demand-augmenting policies due
to structural rigidities especially with regards to the
supply of output (Jhingan, 1984) . As a result, increases
in demands will only lead to rising product prices rather
than increasing employment.
Second, Keynes’ policy prescription relates to open
unemployment rather than disguised unemployment which has
assumed enormous dimension in developing nations. However,
this did not receive attention in his analysis since it is
not an important phenomenon in developed nations.
In spite of these, however, Keynes analysis reflects
labour market behaviours in developing nations. For
example, in the formal wage sector of the economy, the
78

market is not usually cleared. This results from too high a
wage level which is policy, rather than market-determined.
Moreover, the actions of unions and government minimum wage
laws help to
keep wages above the market clearing level. In most cases,
this wage does not decline appreciably despite the usually
long queue of the unemployed willing to take up formal
sector jobs. However, with time, workers who are not able
to get formal sector job usually lower their expectations
by taking up informal employment at the going level of
earnings.
4.1.4 Employment Condition in the Urban Informal
Sector
Having reviewed the macroeconomic theories of
employment, it should be emphasized that urban informal
sector is characterized by underemployment rather than open
unemployment. For a good number of jobless educated youths,
temporary engagement in the informal employment may be a
preferred option rather than be openly unemployed. This
situation can be described as a preference for search –
underemployment with a view to investing in urban formal
information and vacancies while holding temporarily to
informal employment.
79

This possibility seems reasonable for the unemployed
in developing countries where there are no doles and where
familial support while in the urban areas may not be
forthcoming. However, it is suspect if those primarily
interested in urban formal jobs will engage in urban
informal skill acquisition in Manufacturing and Technical
services (MATS) subsector while still prospecting for white
collar jobs. Rather, they may be engaged in trading, casual
jobs, or other informal wage employment. Those that have
fully readjusted their expectations are likely to be those
that will invest in the acquisition process of the urban
informal sector with a view to owning an enterprise after
training.
With respect to those that are in the urban informal
sector therefore, there can be none that are openly
unemployed. They may however, be unemployed in disguise or
underemployed as a result of a particular task being
performed by more labour than is necessary (Sen, 1969).
Also, informal workers may be underemployed if engaged in a
work of a sporadic nature, or if the demand for their
services do not fully use their full productive capacity or
if their jobs do not fully use their qualifications and
experience (Kritz and Ramos, 1976).
In general, the concept of underemployment has been
defined in various ways as:
80

(a) The degree to which the worker’s job fails to use his
full productive capacity (Kritz and Famos, 1976 p.
116).
(b) those persons who work on their own account and who are
so numerous, relative to the resources with which they
work, that if a number of them were withdraw for work
in or other sectors of the economy, the total output of
the sector from which they were withdraw would not be
diminished even though no significant reorganization
occurred in the sector (U.N. 1951) 74.
(c) The adoption of inferior jobs by the workers laid off
from their normal jobs due to lack of effective demand
during depression (Robinson, 1936)75
(d) The quantity of labour for which the marginal product
lie below the wage rate (Mohabbat, K.A. 1972, P. 1676
).
(e) Overstaffing in paid employment especially in the
public service (Blaug et. al,. 1969)70
(f) A situation in which numbers of workers, relative to
jobs available are so numerous that they have to work
at a slow pace (Sen, 1960).73
(g) An employment of persons at jobs that call for less
than their highest current level of skill and at wages
less than those to which their skills, if fully
utilized, would normally entitle them.
81

These definitions lay emphasis on the fact that the
underemployed uses less skill than that possessed by him and
as such his contribution to production is less than his
potentials. Also, following from low output is the
probability that the workers may not be satisfied with his
current employment where his skill is under-utilized.
In the past, the concept of disguised unemployment is
usually discussed in relation to the agricultural sector;
however, it has now been extended to cover the urban labour
market of dual economies. With respect to both the
agricultural an urban sectors, the concept represents an
attempt to state the fact that the labour force engaged in a
certain type of economic activity is idle during a part of
the working period, or if working, is unproductive (Myrdal,
1968, p. 2041)77.
From this view, it is implied, and usually pointed out, that
the marginal productivity of surplus labour is lower than
the average productivity, and in some cases, marginal
productivity is zero or even less. Thus, it is always argued
that the withdrawal of surplus labour 78in such activities
is possible without resulting in diminution in total output
(Nurkse, R. 195379; de Navarrete, A. Jr., and de Navarrete,
I. M. 195380; Rosenstein-Rodan, P. N. 195781). Such surplus
labour is thus viewed to be a latent source of capital
formation (Jhingan, 1984, p. 26472). Worried about the
rationality of labour working up to the point when the
82

marginal productivity is zero, Sen (196073) asks; “If
marginal productivity of labour over a wide range is zero,
why is labour being applied at all? Does it not go against
rational behavior?” he provides a clue to this paradoxical
situation when he explains that this confusion arises as a
result of the failure to distinguish between labour and
labourer. Such distinction makes it clear that “it is not
that too much labour is being spent in the production
process, but that too many labourers are spending it”. Thus
it is the marginal productivity of the labourer that is nil
over a wide range while that of labour may be just equal to
zero at the margin (Meier, 1989, p. 118)82.
Myrdal (1968)77, in his own contribution to the
development of the concept of underemployment rejected the
above definitions. He maintained that the concept is defined
in static (comparative) terms as it assumes that under
unchanged conditions of capital input, production techniques
and institutional framework, the same aggregate output could
be obtained even if a part of the labour force was moved (p.
1007). Moreover,the measurement of such surplus labour
bottled up in disguise unemployment is based on external set
of norms that obtain in the developed economies. Such norms
include the performance on farms where labour is intensively
utilized; or the use of standard working hours in formal
sector employment, among others; and such norms are taken as
corresponding to full employment in LDCs. To illustrate his
point, he cited the Robinson’s (1947) definition that used
the concept to denote the conditions of workers pushed out83

of formal wage work into less productive occupation as self-
employed in order to make ends meet. According to Robinson,
disguised unemployment results when a reduction in effective
demand leads to diminution in employment level. The
dismissed worker usually resorts to taking up inferior self
employment occupation such as “planting potatoes if he can
get an allotment, selling match-boxes in the strand, hanging
round railway stations to carry bags to hotels”. Such
disguised employment is viewed as being temporary as workers
will be recalled when the level of aggregate demand, hence
the level of employment, increases.
Myrdal contends however, that the situation in less
developed countries is different from that portrayed by
Robinson and that such differences should be reflected in
the definition of under-employment in such countries. He
argues that in such developing countries, self-employment
predominates and is permanent for workers rather than being
a temporary occupation taken up after being dismissed from
wage employment. Thus to Myrdal, the concept of
underemployment or its various synonyms – ‘hidden’,
‘concealed’, ‘invisible’, ‘disguised’, ‘potential’ and
‘latent’ unemployment refer to:
“The vast and long term underutilization ofhuman resources in which more labourers aretied up permanently and structurally invarious lines of production than are necessaryfor the output of the product”. (p. 2044).
84

His ‘more realistic approach’ to the determination of
the level of underutilization of effort places greater
reliance on the level of average productivity of the
potential labour force. And thus, the level of utilization
of effort is viewed as a product of three ratios:
participation rate i.e. working members divided by the
labour force; duration of work i.e. man-hours divided by
working members and labour efficiency i.e. output divided
by man-hours.
Although Myrdal criticized incisively the use of
external norms in the evaluation of underemployment in
Asia, yet, he came back, full circle, to similar notion in
his new alternative approach. According to him:
“The total labour input achievable throughcomplete participation of the population ofworking age at an assumed standard of workduration can be calculated. First thedifference between the labour input obtainedfrom actual participation and duration and thelabour input maximally achievable under theassumed conditions can be expressed as aproportion of maximum labour input assumed tobe available”. (p. 1014).
The reliance on the ‘assumed standard of work
duration’ implies value judgment, which Myrdal himself
acknowledges. Thus, the recourse to the use of external
norms regarding such standards is highly inevitable as a
second-best option if the value premise will have any
objective base as well as uniformity. Moreover, his measure
85

of the level of idleness as defined earlier relies heavily
on the use of macro-data obtainable through census figures.
Such figures on current basis are not easy to come by in
most third world countries.
However, apart from the question of definition and
measurement, the existence of underemployment in less
developed countries has never been in dispute. The urban
informal sector also exhibits this trait. It is not
uncommon for enterprises to remain open from dawn till dusk
but having not much work to occupy its work force for a
considerable part of the day. The operators are therefore
unemployed in disguise for as long as they are
involuntarily idle. Increased employment for these classes
of workers reveals itself, in the first instance, by the
productive use of idle hours and later by increase in the
number of workers.
The above reveals the basic difference between
employment situation between the formal and the informal
sector operators. Motivated by profit consideration, formal
sector entrepreneur will not engage labour that are likely
to be idle for a considerable part of the day. In contrast,
the formal sector entrepreneur whose business is
established primarily to create employment for himself,
makes himself and his apprentices, if any, available for
work. He is only productively employed for the number of
hours he receives work from his customers. This is because
86

shortage of adequate capital (both fixed and working
capital) precludes his continuous production of goods in
anticipation of demand. Moreover, in most cases, most of
the enterprises are engaged in the production of direct
services (e.g. motor vehicles repair, barbing among others)
which cannot be produced prior to consumer demand.
The foregoing, therefore, leads to the following a
priori reasoning as regards employment and earnings in the
urban informal sector. An increase in the level of
employment comes about as a result of increased demand for
the enterprises goods and/or services. This enables the
entrepreneur to put his current idle productive capacity
into use. More resources (especially labour) can only be
hired if the current man-hours engaged (i.e. those of
himself, apprentices and employees, if any) cannot
effectively cope with the work within the period of which
the work is to be done. Thus in most cases, paid workers
are usually not permanently employed but are engaged for
such period as the project lasts. If the project will not
last a considerable length of time or consumers’ patronage
is sporadic in nature rather than regular, employment
arrangement with journeymen is by day or at most by the
week. However, if such project is of long duration or the
demand situation is constantly high, the paid worker may be
engaged for a longer period but the ensuring employer-
employee contractual obligation is rather informal and
based more on mutual trust and confidence rather than on
formal arrangements.87
Engaging workers especially those in the skilled
category may not be very easy for the entrepreneur. This is
because of the absence of a pool of overtly unemployed
workers standing at his gate from which he can easily draw.
The best he can do is to offer a reasonable earning
arrangement that is able to induce workers currently
underemployed either in self or wage employment in the
formal sector. Therefore, it is not unreasonable to expect
a positive relationship between the level of earnings and
employment level in the urban informal enterprises.
4.2 METHODOLOGYStudies on the urban informal sector have in most
cases been directed to the question of employment
opportunities and income distribution within the sector. As
a result, the target groups are the enterprises,
entrepreneur as well as employees (if any), journeymen, and
apprentices in the informal sector enterprises. Thus our
methodology involved the selection of enterprises and
operators on a sample basis from our enumeration areas.
Like most other studies (Amin, 1981, Merrick 1976;
Callaway, 1964; Fapohunda, 1985), ours is a city study –
the city of Ibadan. The choice of Ibadan derives from the
fact that:
1. Ibadan is one of the most populous cities in Africa.
The city is a typical urban centre in terms of population
and type of economic activities engaged in. as a result,88

urban informal activities in the city will no doubt
reflect the situation in most other cities of the
country.
2. The city of Ibadan looks attractive for this study
because our study will facilitate comparison with the
earlier works of Callaway on craft enterprises as well as
the apprenticeship system of the informal sector of
Ibadan. However, our study will go a little further by
formulating and estimating employment and earnings models
for the sector.
4.2.1 Research Instruments
We have engage two research instruments in obtaining
the necessary information from our respondents. The first
one is the questionnaire addressed to owners of enterprises
in manufacturing and technical services. The questionnaire
sought information relating to the enterprise in the
following areas:
(a) Product of the enterprise
(b) Ownership structure
(c) Capital level (initial and present)
(d) Quantity, age, quality of training, etc. of employees,
journeymen and apprentices.
(e) Operational characteristics of the enterprise
(f) Extent of linkage with formal sector as well as other
informal sector enterprise
(g) Problems facing the enterprise
89
(h) Assistance received/desired from the government or any
of its agencies;
(i) Training and skill development functions of the
enterprise.
The second questionnaire was designed to elicit
information on job histories of selected enterprise owners,
employees, journeymen, apprentices of informal sector
enterprises as well as formal sector employees. Information
sought are, to a great extent, confined to the personal
characteristics and the job history of the respondents.
Some of the information requested include: sex, age, years
of experience on present and previous job, number of jobs
ever held, formal and non-formal education, migration
status, parent’s occupation, reasons for preferring present
job to formal or informal alternative, job satisfaction,
future aspirations, and so on.
Copies of these questionnaires are reproduced in full
in Appendix A and Appendix B.
4.2.2 Planning Coverage and Sampling Procedure
Constrained by time and fund, we were unable to cover
every informal enterprise and operator within the city of
Ibadan. Therefore we had to take a sample of informal
enterprises and operators as well as formal sector
employees in manufacturing and technical services for this
study.
90

To obtain reasonably large and representative sample
of enterprises, a two stage sampling technique was adopted.
The first stage units are the enumeration areas (EAs) while
the second stage units are the enterprises, workers, and
apprentices. We therefore divided the city into thirty-five
enumeration areas from which not less than a third will be
purposively selected. From each of the selected EA, not
less than 50 enterprises were to be interviewed therefore
having not less than 600 enterprises for our study.
After the owners of the selected enterprises had been
interviewed, in order to obtain enterprise-related
variables, we decided to randomly select about 500
operators (owners, employees and journeymen) and 300
apprentices for detailed personal job history. Also for
comparative purposes, 200 formal sector workers in
manufacturing and technical services were to be interviewed
using same questionnaire as for informal sector operators.
The formal sector workers were to be drawn from both the
public and private sector establishments in Ibadan.
4.2.3 Data Collection
Informal Enterprises Survey
The city of Ibadan was divided into 35 enumeration
areas and they are as listed below.
1. Mokola / Sabo
*2. Sango/Polytechnic Road/Eleyele
*3. Agbowo/Orogun/Bodija/Ojoo
91

*4. Ekotedo/Race Course/Adamasingba/Salvation
Army
*5. Oke Padre/Olorisa Oko/Yeosa/Abebi
6. Inalende/Oniyanrin/Ode-olo
7. Idikan
8. Gbagi/Felele
9. Onireke/Dugbe
10. Moor Plantation/Ago Taylor
*11. Apata-Ganga/Owode
12. Oke Bola/Agbokojo
13. Bishop Philips/Monata
14. Agbeni/Amunigun
*15. Oke Foko/Gege/Oke-Ado
16. Aperin/Akanran Road
*17. Molete/Ibuko/Challenge/Felele
18. Isale-Osi/Opopo Yemoja
19. Isale-jebu/Idi Arere/Agbongbon
20. Oja-Oba/Kannike
21. Bere/Mapo/Oritamerin/Alekuso
*22. Oke-Are/Agbede Adodo/Ayeye
*23. Adeoyo/Oke Aremo/Igosun/Yemetu
24. Itutaba/Gbenla
25. Oke-Irefin/Oke Adu
26. Agodi/Idi Ape/Iwo Road
*27. Oluyoro/Loyola/Ife Road
*28. Oje/Oke Ofa/Atipe/Ode Aje
29. Agugu/Idi Obi/Ore Meji/Ogbere
*30. Labiran /Isale-Afa/Beyerunka/Alafara
92

31. Itabale/Olugbode/Oranyan
32. Oja Igbo/Aremo/Aperin
33. Elekuro/Labo/Odinjo
34. Idiaro/Eleta
35. Oke Oluokun/Kudeti
Note: * = Areas selected for the survey
This division almost coincides with that of Callaway’s
(1964) but we have introduced some modifications to take
account of the expansions that have taken place since then.
In preparing the sampling frame, a preliminary visit was
made to each of the EA’s to identify areas of concentration
of MATS activities. Twelve of such EAs were purposively
selected from which enterprises and later, operators were
selected for interview.
With respect to location pattern, two kinds of
enterprises were discovered. The first type is those that
are concentrated within the city and, secondly, those that
are located at the outskirt of the city. The latter kind of
enterprises are those that are either land-intensive like
saw-milling and block-making, or those that have been
forced by the government to leave the city centre e.g.
vehicle repair enterprises. However, some of these are
finding their ways back into the city. The observed
location pattern was considered in the choice of EAs for
the study.
93

With respect to the method of enquiry, the interview
method using well-trained enumerators to administer
questionnaires was used. Our field work on informal sector
enterprises was restricted to those enterprises outside the
organized capital and product markets. Such enterprises are
not formally registered under the Business Registration
Act, and employ between zero and nine full-time paid
workers. In such enterprises, full-time paid employment is
an exception rather than the rule. Production activities of
most of our target enterprises are carried on in temporary,
or at best, semi-permanent structures like rented shops,
uncompleted buildings, open spaces by the roadside, part of
own-rented accommodation and so on. In these enterprises
the entrepreneur himself is physically involved in the
production process.
Individual production unit is regarded as an
enterprise. In this regard, the roadside mechanic or metal
workers with or without employees, journeymen and unpaid
family helpers etc. were regarded as individual
enterprises.
As earlier expressed, sample survey was limited to
enterprises in Manufacturing and Technical Services as
listed below:-
I. Manufacturing
(a) Wood works – Carpentry, Furniture making, wood
Carving, Saw-Milling.
94

(b) Leather works – Shoemaking and Shoe repairing, Car
Upholstery, Bag making.
(c) Cloth and Garment Manufacturing-Tailoring, Weaving,
Knitting.
(d) Metal works – Welding and Metal Fabrication,
Blacksmithing, Goldsmithing.
(e) Blockmaking
(f) Printing.
II Technical Services
(g) Automobile repair works – Auto-mechanic, Auto-
electricians, Panel beating, Vulcanizers, and Vehicle
sprayers.
(h) Electrical works – Electrical repairs, Electrical
installations.
(i) Other Technical Services – Barbing, Hairdressing,
watch Repairing, Dry Cleaning, Sign writing and Glass
Cutting, Plumbing, Photo-framing.
The data collection exercise took place between
February and March, 1990. A good number of the enterprises
owners contracted cooperated with our field workers and
gave the desired information if they were contacted at the
time they were not too busy. Given the level of education
of these entrepreneurs and their openness is highly
unexpected. What probably accounted for this might be the
NDE’s training activity within the informal sector that is
gradually becoming popular among enterprise owners. Since
most of them are desirous of getting involved in the NDE’s
95

apprenticeship programme due to the financial returns to
the trainers, many of the entrepreneurs are thus encouraged
to cooperate with our field workers in order to know more
about the involvement of the government through the NDE in
the hitherto neglected urban informal sector. Also they
sought to know the means by which they can be enlisted as
trainers for NDE.
In contrast to the above, some of the entrepreneurs
refused to answer our questions claiming that previous
similar surveys had yielded no positive returns from the
government. Several others even thought that the survey had
to do with taxation and as such they were not prepared to
divulge any information regarding their enterprise.
In all, five hundred and forty-four enterprises were
successfully interviewed. This gives an achievement rate of
about 91 per cent.
Formal and Informal Labour Force Survey
The informal sector enterprises sampled had 647
owners, 341 workers, 2, 119 apprentices and 106 family
helpers. From these operators, we randomly selected 351
workers (made up of 278 owners, 73 employees and
journeymen) as well as 213 apprentices for a more detailed
interview.
In selecting formal sector workers for interview,
enterprises dealing in activities of interest to the study96

were listed. From the list, a random sample of 7
establishments (4 private and 3 public) was made. From the
list of workers engaged in manufacturing and services, we
were able to interview 111. Forty-nine of these workers
were from private formal sector while the rest (62) were
from the public formal sector.
4.2.4 Model Formulation and Analytical Techniques
1. Structure of Enterprises and Socio-Economic
Characteristics of Operators
The structure of enterprises in terms of size
distribution, year of establishment,
forms of ownership, number engaged, value of initial and
present capital and so on are analyzed.
Also, socio-economic characteristics of owners,
employees and apprentices are analyzed using summary
statistics in form of cross-tabulation, frequency
distributions, percentages and means of relent variables.
2. Skill Development and Utilization
The human capital model postulates that investment in
additional training yields both pecuniary and non-pecuniary
benefits. Apart from the current consumption benefits
derived from education and training, the acquired skill
97

yields future streams of income over the recipients
lifetime.
Thus, the process of acquiring human capital through
the process of skill and entrepreneurship development are
investigated using employment history of our sampled
population. Using data generated from our survey, we
estimated the annual rate of entrepreneurship generation
through the skill formation process in the urban informal
sector.
Let E be the current stock of entrepreneurs in
manufacturing and technical service enterprises and let ∆E
equals change in the level of stock per annum. The
postulation is that change in stock depends on the number
of apprentices in training (N), average number of years
spent in training (T), proportion of apprentices wanting to
establish own enterprise immediately (A) and later (B), and
the average waiting period for those not starting
immediately (t).
That is;
E = f (N, T, A, B, t) …………………… (1)
Assuming a linear and additive relationship, then
equation (1) can be stated as:
Ni Ai Ni Bi ….
………………… (2)
∆Ei = Ti Ti ti
98

Where I stands for an enterprise.
The expressions in equation (2) simply means that
addition to entrepreneurs in enterprise I in one year
equals the average annual rate of producing entrepreneurs
that will immediately set up own enterprises (first term on
the RHS) plus those wanting to delay entry into
entrepreneurship by ‘t’ years (last term on RHS).
Clearing all fractions in (2) and arranging we have:
∆Ei = Ni ( ti Ai + Bi) …………………………. (3)
Ni Ti ti
= ti Ai + Bi = 1 A + Bi or
Ai Bi
Ti ti T ti Ti
Ti + ti
Equation (3) is used to measure the average annual rate of
generation of new entrepreneurs in the urban informal
sector.
The extent of skill utilization, (or its converse,
skill underemployment) of workers in each enterprise are
measured in two ways. Firstly, the number of hours actually
employed in production (HEP) in previous week as compared
to the standard 40 – hour week (SWK) (Oberia and Singh,
1984, p. 519).
SU1 = HEP 100 ………………….. (4)
99

SWK 1
The level of underutilization of effort S’ ul can
then be defined as unity minus Su1. That is:
SU1 = 1 - SU1 ……………………..
(5)
Secondly, the previous peak income (PIP) per week
is compared to the income realized in the week
preceding the survey (PAI) (Kritz and, Ramos, 1976)4.
Thus:
SU2 = PAI 100 ………………
(6)
PIP 1
And 1 - SU2 indicates the extent of
underutilization of effort.
EMPLOYMENT GENERATION FUNCTION
Employment of labour in NFS enterprises depends on a
variety of factors. The effects of such factors can be
measured empirically using an adapted Cobb- Douglas
production function.
Thus, an employment function is specified following Bowers
and Beird (1971)84; Irvin,
(1978)85 Olaloye (1978); and Ndebbio (1987) as
Ei = f (W, K, Z) ………………………………. (7)
Where:-
Ei is the level of employment in firm I.
100

W is the wage rate
K is the level of present capital
Z is the vector of other variables affecting the
level employment.
Two models were tried: one assuming linear
relationship, and the other assuming a non –linear
relationship as shown in equations (8) and (9).
That is: n
Ei = ao + a1w1 + a2ki + a∑ jZi + ui ………………. ……. (8)
And, Ei = +bo w∏ i b1 ki b2zi1
b3 ………. Zij bj exp ( b∑ kzdk +Ui)
………………… (9)Linearising by taking logarithm on both side of
(9), we have:
n
LN Ei = Ln bo + b1 LN Wi + b2LN Ki + ……..+ bj LN Z∑ ij + J+3
m
b∑ kzdk + Ui …………………………. (10)K=1
Where ZdK are other variables expressed as dummies.
For analytical purposes, we have defined employment
level within a given firm in several ways.
EMPT 1: Total number of man hours per week actually put in
to productive use by all worker, paid and unpaid. This is
made up of efforts actually used for production by the
owners (s), paid employee, journeymen, apprentices and
unpaid family helpers within the enterprise.
101

EMPT 2: The homogeneity of different grades of labuor
assume in EMPT 1 is relaxed. Thus, total employment per
enterprise is assumed to be made up of all unweighted
efforts (man power re week) actually used in production by
entrepreneur (s) and employees 88; plus half of those
supplied per week by apprentices one year and over in the
enterprise, plus one- tenth of those supplied by
apprentices who are less than one year old and those
supplied by unpaid family helpers.
EMPT 3: Unweighted sum total of actual efforts used for
production per week by owner, paid workers and all
apprentices per week.
EMPT 4: Total man-hours actually used for production by
owners and all paid
employees per week.
Explanatory variables included in the models are:
VAR 8: Average level of wages.
VAR 2: Skill utilization – both SU1 and SU2 are tried in
a stepwise fashion.
X4: Age of business – this is measured by the numbers of
years the establishment
had been in existence.
102

X11A: This is amount of education received by
enterprise owner. It is measured by the number of years
spent in school by the entrepreneur.
X142: this is dummy variable which takes value 1 if
owner was trained in formal sector and 0, if otherwise. Its
purpose is to measure the impact of the quality of training
received by owners on the level of employment.
X202: this is a dummy variable that takes value. 1 for
TS enterprises and 0, otherwise. It is to measure the
contribution of type of enterprise to the level of
employment.
X27: level of present capital employed. It is expected, a
priori, that coefficient estimate of all, but X202,
variables have positive impacts on the level of employment
while the sign and magnitude of type of industry dummy
(X202) cannot be predetermined.
Formal/Informal Employment Participation Model
The controversy as to whether migrants into the urban
labour market take up informal sector job in the first
instance in order to be able to invest informal sector job
search or whether they are permanently settled in the
sector is still unsettled.
Therefore, in testing the probabilistic migration
hypothesis, we specified an estimated a linear probability
model which is expected to give the characteristics of
urban labour market operators which best allows one to103

predict the probability of remaining in one sector rather
than move to the other sector. The model:-
Pj = bo + b∑ i Xij + Uj ………………….
(11)
i = 1, 2, 3………. n; and j = 1,
2, 3 …, m.
Where i stands for a variable, j stands for an individual
and Xij ……………. Xnj are n-observable characteristics while Uj
is the error term.
Separate models using (11) above were estimated for
formal and informal sector workers respectively. Depended
variables for each of the models are:
Pj1=¿
employment)
(0, Otherwise
Pj2=¿
¿theformalsector ¿
Otherwise
It is often argued that linear probability models are
subject to statistical problems of heteroscedasticity on
one hand, and probability going beyond the range of zero
and unity on the other hand. The effect of these problems
is:
104

1. The standard test of significance may not strictly
hold since the distribution of errors are not
normal; and,
2. The predictive power of the model is severely
restricted.
As a result of these, a more appropriate modelsuggested in the literature is the logit probability modelspecified as 90:
Pj
Log 1-Pj = bo + b∑ iXij + Uj
……………… (12)
Where Pj, and Xij are as defined in (11) above.
The model simply shows the logarithm of odds that
individuals with attributes Xi will choose to stay in the
informal sector. The beauty of the logit model is that it
transforms the problem of predicting probabilities within
(0,1) interval to the problem of predicting the odds of an
events occurring within the range of the entire real line.
However, since (12) is non-linear, the application of
ordinary least squares (OLS) estimating technique is not
without some problems, moreso when P is either 0 or 1. To
facilitate estimation, the data have to be grouped and for
each group, one has to find the frequency, say ri, of
people preferring to stay in the sector relative to the
number, say ni of people in the sub-sample.
Theratiori
ni=P̂i∧(12)becomes:
105

log
ri
ni
1−ri
ni
=logri
ni−ri=bo+∑
i=1
kbiXij+Uj……………………..(13)
¿otherwords:
logPi
1−P̂i=bo+∑
i=1
kbiXij+Uj……………………………………….. (14)
Equation (14) is linear in parameters and can be
estimated using the OLS approach.
Also, estimating (14) using OLS may also throw up
heteroscedasticity problem since Pi does not equal P
identically, thus resulting in the variance of error term
to vary with the number of grouped observations. Therefore,
a better estimating technique suggested in the literature
for (12) is the maximum likelihood procedure which allows
the use of ungrouped data thus allowing each individual
observation within the sample to have a probability
associated with it. However, the dear of estimating
facility for maximum likelihood procedure did not allow us
to use (12). We have, however, tried our best with (11) as
it has been successfully applied in economic research using
OLS estimating technique (Alonzo, 1979).
5. Earning Distribution Function
An analysis of earnings was carried out in order to
determine the pattern as well as the influences of several
explanatory variables on earnings distribution of urban
labour market operators. Basing our analysis on the human
capital variables; migration characteristics, sector of106

employment in ULMA and other relevant variables, we
postulated that these variables explain the distribution of
earnings.
Using the semi-logarithmic earnings function specified as:-
lnYi=Co+∑j=1
nCiXij+Ui…………………………………………….….. (15)
(Mincer, 1970; Blaug, M. 1974; Haque, 1977).
Where j stands for a variable, I stands for an individual
and y is the level of earnings or wage. X1j …… Xnj are n-
observable characteristics (numerical and binary or dummy)
and Ui is the error term.
The list of variables used for the probability models
and the earnings model are as listed in Table 4.1.
TABLE 4.1: VARIABLES USED IN PROBABILITY AND EARNING
MODEL
No. Basic Variables Dummy/Derived Variables
1. Position in the X501 = (1, if
household head
Household (X5) (0, otherwise
107

X502 = (1, if other
household member
(0, otherwise
2. Reasons for being X051 = (1, if personally
interested
In the Sector of (0, otherwise
Employment (X05)
X052 = (1, if influenced by
parents
(0, otherwise
X053 = (1, if job is taken to
survive
(0, otherwise
X054 = (1, if no other job could
be obtained.
(0, otherwise
X055 = (1, if parents cannot
afford higher education
(0, otherwise
X056 = (1, if retrenched in
previous job
(0, otherwise
X057 = (1, if respondent
withdrew from previous job
(0, otherwise
108

X058 = (1, if current job is a
post-retirement exercise
(0, otherwise
No. Basic Variables Dummy/Derived
Variables
3. Monthly Income X11 = (1, if X1 ≤ N100
(X1) (0, otherwise
X12 = (1, if N100<X1≤200
(0, otherwise
X13 = (1, if N200<X1≤500
(0, otherwise
X14 = (1, if X1 > 500
(0, otherwise
4. Sex (X38) X381 = (1, if male
(0, otherwise
X382 = (1, if female
(0, otherwise
5. Marital Status X391 = (1, if Single
X39 (0, otherwise
X392 = (1, if Married
(0, otherwise
X393 = (1, if divorced/Separated
(0, otherwise
6. Previous X121 = (1, if informal self-
employment
Occupation (X12) (0, otherwise
109

X122 = (1, if wage job/schooling
(0, otherwise
X123 = (1, if domestic/Casual Job
(0, otherwise
7. Father’s X521 = (1, if now schooling
Education (X52) (0, otherwise
X522 = (1, if primary Education
(0, otherwise
X523 = (1, if Secondary Education
(0, otherwise
X524 = (1, Post-Secondary
(0, otherwise
No. Basic Variables Dummy/Derived
Variables
8. Migration Status X431 = (1, if born in Ibadan
(0, otherwise
X432 = (1, if Migrant
(0, otherwise
9. Type of informal
Sector Enterprises X201 = (1, if Manufacturing
(0, otherwise
X202 = (1, if technical Services
(0, otherwise
10. Respondent’s X421 = (1, if no Schooling
Education (X42) (0, otherwise
110

X422 = (1, if Primary Education
(0, otherwise
X423 = (1, if Secondary Education
(0, otherwise
X424 = (1, if Post-Secondary
Education
(0, otherwise
11. Form of Employment X031 = (1, if private
Sector
(0, otherwise
X032 = (1, if Public Sector
(0, otherwise
X033 = (1, if Informal Self-
Employment
(0, otherwise
X034 = (1, if Informal Employee
(0, otherwise
No. Basic Variables Dummy/Derived
Variables
12. Quality of Training
(X14) X141 = (1, if Informal
Apprenticeship
(0, otherwise
X142 = (1, if Private Sector
Trained
111

(0, otherwise
X143 = (1, if Civil Service
Trained
(0, otherwise
X144 = (1, if Technical/Vocational
(0, otherwise
13. Labour Market Actual in yearsExperience (X54)
14. Square of Labour Market Experience Actual in years(X55)
15. Weekly Earning(Y)
16. Log of WeeklyEarnings (LNY)
112

CHAPTER FIVE
STRUCTURE OF ENTERPRISES AND SOCIO-ECONOMICCHARACTERISTICS OF ENTREPRENEURS
5.1 STRUCTURE OF ENTERPRISES
The survey of informal sector of Ibadan covered five
hundred and forty-four enterprises. These enterprises have
647 owners, 341 workers, 2, 119 apprentices and 106 unpaid
helpers. In all, the enterprises engaged 3, 213 operators
with an average of about 6 persons per enterprise. The
enterprises sampled are from Manufacturing (53%) and
Technical Services (47%). Table 5.1 shows the distribution
of sampled enterprises.
The manufacturing sub-sector (MS) dominated by cloth
and garment enterprises, has the highest absolute
frequency. In the Technical Services sub-sector (TS)
however, it is the automobile repairs that predominate with
163 establishments out of the total of 256 for the
subsector.
In all, there are 25 different economic activities in
our sample and these have been reclassified into 9 main
branches. Six of these are in the MS while the rest are
classified into the TS.113

5.1.1 Ownership Structure and Age of Business
Majority of the enterprises sampled operate as sole
proprietors. Thus 85 per cent are sole proprietors, 13 per
cent are partnership while the rest are in the ‘others’
TABLE 5.1: DISTRIBUTION OF SAMPLED ENTERPRISESACTIVITIES NUMBER PERCENTAGES
A. MANUFACTURING 288 531.Wood Works 76
Carpentry and Furniture 68 12.50Wood Carvin 02 0.37Saw-milling 06 1.10
2.Leather-Works 40 Foot-wear 29 5.33 Car-Upholstery 08 1.47 Bag-making 03 0.55
3.Cloth and garment 87Tailoring 79 14.52Weaving & Knitting 08 1.47
4.Metal-Works 61Welding 45 8.27Blacksmithing 14 2.57Goldsmithing 02 0.37
5.Block-making 12 12 2.21
114

6.Printing 12 12 2.21
B. TECHNICAL SERVICES 256 477.Auto-Mechanic 87 163 16.00
Auto-Electrician 26 4.78Panel-Beating 18 3.31Vulcanizers (Tyre &
Tube Repair)15 2.76
Auto Sprayers 17 3.12
8.Electrical Works 51Electrical Repairs 48 8.82Electrical Wiring 03 0.55
9.Other Technical Services
42
Barbing/Hairdressing 24 4.41Watch Repairing 08 1.47Signwriting and Glass-cutting
05 0.92
Photo-framing 03 0.55Plumbing 02 0.37
ALL ENTERPRISES 544 544 544 100.0 100
Source: Author’s field survey.
Unclassified category. Most of these enterprises are young
as the average age for all enterprises is about 11 years.
In the MS, the modal age-group is 10 – 15 years to which 34
per cent of enterprises belong. In the TS, however, the
modal age group is 1 – 5 years and this accounts for about
34 per cent of enterprises (Table 5.2). This suggests that
relatively young enterprises predominate in the TS compared
to MS. Either high rate of establishment of new
enterprises, or high attrition rate of existing ones, or
both, are the possible reasons for the observed young age
structure of enterprises in TS.
115

For all enterprises, however, the modal age group is
10 – 15 years. It is therefore suspect if most enterprises
do live beyond 30 years as only 5 per cent in MS and 3 per
cent in TS ever survive above 25 years. Such situation
appears to be dominant in electrical works and cloth-
weaving where zero and 1 per cent respectively are able to
attain to over 25 years of age. In contrast, there is a
considerably high survival rate in blockmaking and metal
work enterprises, as each of these has 13 per cent and 17
per cent of enterprises respectively in over 25 years age
group.
Compared to Callaway’s (1973)7 study of Ibadan where
the modal age of enterprises is 6 – 10 years, there seems
to be an improvement in the survival rate of enterprises in
present times as compared to the late 1950’s and early
1960’s. In his 1976 study of Lagos informal sector
TABLE: 5.2: PERCENTAGE DISTRIBUTION OF ENTERPRISES BY AGE OFESTABLISHMENT
ENTERPRISES 1 –5
6 –9
10 –15
16 –24
25 andOver
MANUFACTURINGWoodLeatherClothMetalBlockPrinting
TECHNICAL SERVICESAuto-Repairs
21.921.125.024.18.425.0
26.929.617.529.926.725.016.718.819.6
33.938.037.529.940.025.033.325.030.1
12.09.812.514.911.78.30.019.216.9
5.31.47.51.113.316.78.33.53.7
116

ElectricalOthers
41.633.530.123.641.3
19.615.2
17.68.7
19.628.3
0.06.5
ALL ENTERPRISES 27.6
23.0 29.6 15.5 4.4
Source: Author’s field survey.Enterprises, Fapohunda (1985)18 notes that the modal age-
group of enterprises is 2 – 5 years. This suggests a lower
survival rate relative to Ibadan’s enterprises in the past
and now.
Several factors can be put forward to explain the
increasing life-span of enterprises in recent times. First,
the low and dwindling absorptive capacity of the formal
economy led to increased unemployment of the educated
youths and most of these have resorted to the urban
informal employment for survival. The ensuing increasing
educational attainment of informal operators has influenced
the managerial ability and hence, income and the life span
of enterprises. Two, the urban informal enterprises are
always quick to respond to the varying demand patterns of
their clientele. As such, there has been a gradual and
increasing shift of emphasis of these enterprises from
traditional/indigenous crafts (e.g. pot-making, dyeing,
wood carving etc. which are less rewarding and attractive
to young educated ones) to modern type of enterprises whose
117

output is being increasingly demanded by urban dwellers. It
is to be remarked, however, that dynamic changes from
modern to traditional goods is not common (e.g. increasing
demand for ‘aso-oke’, that is, traditionally woven cloths;
and ‘adire’ i.e. ‘tie and dye’ cloths) and the informal
sector enterprises do not fail to take advantage of such
opportunities. Third, the high level of commitment of
workers to the sector led to increased emphasis of the
entrepreneurs towards saving and investment. The increasing
availability of credit through informal savings and credit
organizations has therefore led to improved capital
formation among the entrepreneurs in the sector.95
These, among other factors, explain the relatively
longer life-span of enterprises in recent times.
5.1.2 Structure of Capital Employed
One of the major constraints facing informal sector
enterprises is shortage of capital. Due to their relatively
low educational attainment and absence of required
collaterals, many of these entrepreneurs do not have access
to formal banking credit facilities. Thus, in setting up
own enterprises, heavy reliance is usually placed on
informal rather than formal sources of capital. This fact
is revealed in Table 5.3.
Less than 1 per cent of entrepreneurs in our sample
were ever able to obtain loan from formal commercial banks.
Eighty-eight per cent relied on informal sources.
118

It is thus no wonder that initial capitals are
generally very low. For all enterprises, the average level
TABLE 5.3: SOURCES OF INTIAL CAPITALS/N. SOURCES PERCENTAGE OF ENTREPRENEURS
USING SOURCE1.2.3.
4.
5.6.
Gift from Relations/FriendsOwn Informal Saving from Casual WorkLoan from Relation/FriendsTotal Informal SourcesLoan from Commercial BanksTotal Formal SourcesOther (Unclassified Source)Sources not StatedTotal
42.340.85.3
0.4
7.73.5
88.4
0.4
11.2
ALL SOURCES 100.0
Source: Author’s field survey.
Of initial capital is N1, 111 while it is N1,092 and N1,
130 in MS and TS respectively (Table 5.4). Majority of the
enterprises (24%) belong to the N(200-499) group. Average
initial capital is lowest among wood-work enterprises while
it is highest among block-making and printing enterprises.
The latter with relatively high initial capital are
enterprises that require high level of capital. In general,
the TS enterprises seem to be more capital-intensive
initially than MS enterprises.
119

Although these enterprises started with a relatively
low capital, it is however interesting to note that on the
average, a modest rate of growth of capital is observed. TS
enterprises record a higher rate of annual growth of 12.5
percent while MS enterprises have 10 per cent. On the
average, all enterprises grew at an annual rate of 11 per
cent (Table 5.5).
Impressive as this result may seem, it should be
realized that some of these enterprises experience zero and
even negative growth while others experience a somewhat
phenomenal growth. For example, 97 enterprises representing
18 per cent of total enterprises sample experienced
negative and/or zero growth rate, while 25 per cent grew at
over 21 per cent per annum. Disaggregated by type of
enterprises, Table 5.5 shows that a greater number of
enterprises in TS (19%) experienced negative and/or zero
growth rates as compared to MS (17%). However, 42 per cent
of enterprises in each subsector experienced over 11 Per
cent growth rate
TABLE 5.4: PERCENTAGE DISTRIBUTION OF INITIAL CAPITAL BY TYPEOF ENTERPRISE (N)
ENTERPRISESLESSTHANN200
200TO499
500TO999
1000TO2999
3000TO4999
5000ANDOVER
AVERAGECAPITAL(N)
MANUFACTURING Wood WorksLeather ClothMetalBlocPrinting
23.315.530.028.725.016.716.7
24.429.622.529.
18.719.712.520.
23.425.425.018.428.333.316.7
4.97.05.02.35.016.70.0
5.32.85.00.05.025.033.3
1092.00972.001066.00572.001209.002681.003180.00
120

TECHNICAL SERVICEAuto RepairsElectricalOthers
20.520.815.721.8
916.78.316.7
22.723.319.623.9
720.00.016.7
23.527.617.617.4
22.719.029.426.1
6.96.111.84.3
3.83.15.96.5
1130.001009.001500.001174.00
ALL ENTERPRISES 22.0 23.9
21.0
23.0 5.9 4.6 1111.00
Source: Author’s field survey.
TABLE 5.5: PERCENTAGE RATE OF GROWTH OF CAPITAL BY TYPE OF ENTERPRISES
ENTERPRISES NEGATIVE ZERO 1-5 6-10
11-20
31-30
31+ AVERAGE GROWTH
A. MANUFACTURING Woodworks Leather Cloth Metal Block Printing
B. TECHNICAL SERVICES
Auto-Repairs Electrical Others
7.14.210.03.410.08.38.3
8.58.07.815.2
9.57.07.59.28.38.333.3
10.88.017.615.2
25.128.222.520.728.350.00.0
24.623.821.632.6
18.119.720.012.621.78.333.3
14.616.613.78.7
23.325.415.033.316.716.716.7
14.614.713.78.7
5.34.22.510.31.78.38.3
14.29.25.96.5
11.611.322.510.313.40.00.0
8.519.619.613.0
10.411.112.913.46.56.37.8
12.514.210.68.8
ALL ENTERPRISES 7.7 10.1 24.8 16.4
18.9 7.0 15.1
11.4
Source: Author’s field survey.121
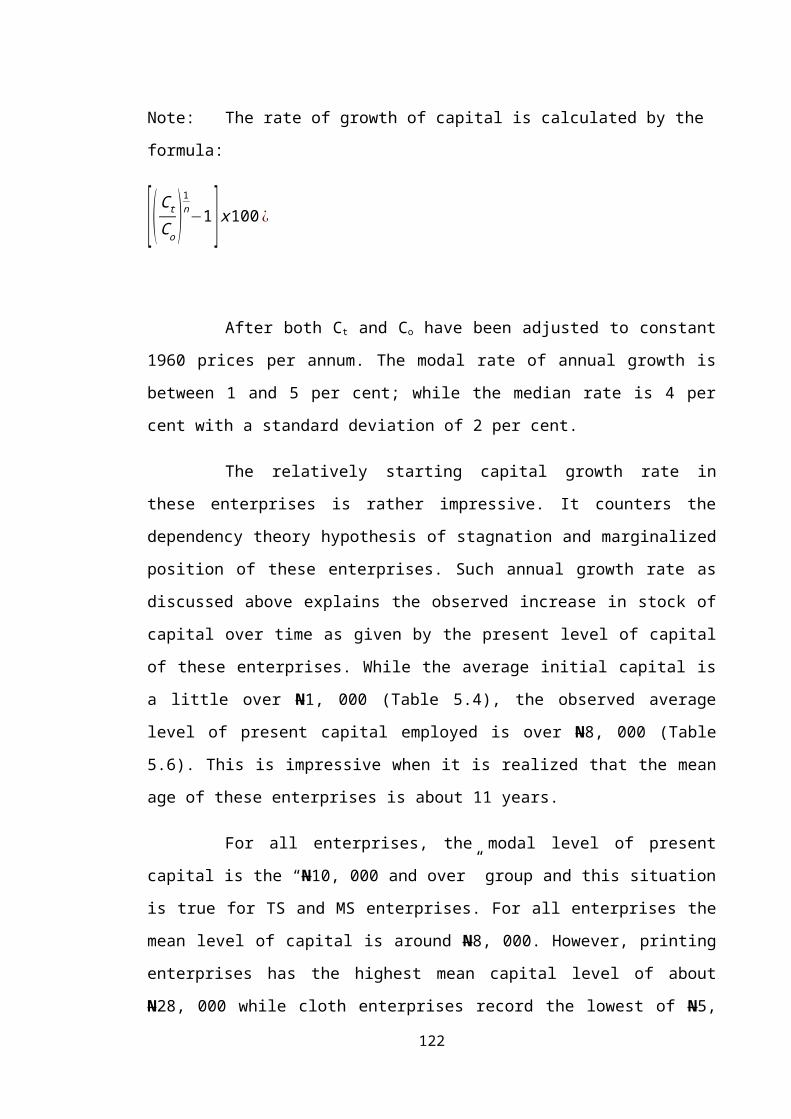
Note: The rate of growth of capital is calculated by the
formula:
[(CtCo )1n−1]x100 ¿
After both Ct and Co have been adjusted to constant
1960 prices per annum. The modal rate of annual growth is
between 1 and 5 per cent; while the median rate is 4 per
cent with a standard deviation of 2 per cent.
The relatively starting capital growth rate in
these enterprises is rather impressive. It counters the
dependency theory hypothesis of stagnation and marginalized
position of these enterprises. Such annual growth rate as
discussed above explains the observed increase in stock of
capital over time as given by the present level of capital
of these enterprises. While the average initial capital is
a little over N1, 000 (Table 5.4), the observed average
level of present capital employed is over N8, 000 (Table
5.6). This is impressive when it is realized that the mean
age of these enterprises is about 11 years.
For all enterprises, the modal level of present
capital is the “N10, 000 and over” group and this situation
is true for TS and MS enterprises. For all enterprises the
mean level of capital is around N8, 000. However, printing
enterprises has the highest mean capital level of about
N28, 000 while cloth enterprises record the lowest of N5,
122

253. It should be noted however that at the tail end of
capital distribution (as shown in Table 5.6) is about 8 per
cent of all enterprises recording a capital level of less
than N500.00.
TABLE 5.6: PERCENTAGE DISTRIBUTION OF PRESENT CAPITAL BY TYPE OF ENTERPRISES
ENTERPRISESLESSTHAN200
200TO499
500TO999
1000TO2999
3000TO4999
5000TO9999
10000
ANDOVER
MEAN(N)
A.MANUFACTURING Wood Works
LeatherClothMetalBlock
Printing
B.TECHNICAL SERVICES Auto RepairsElectrical
Others
5.32.812.54.65.08.38.3
8.56.79.810.8
1.41.45.00.00.00.00.0
0.80.62.02.2
1.12.80.01.11.70.00.0
4.63.72.08.7
23.018.335.027.611.70.025.0
24.227.021.626.1
19.416.912.525.323.38.38.3
15.417.87.813.1
23.022.512.527.630.025.08.3
21.920.925.517.4
26.935.222.513.828.358.350.0
24.623.331.421.7
8510 108627076525380951147227864
81197725102445818
ALL ENTERPRISES 6.9 1.1 2.8 23.6
17.5 22.5
25.8
8320
Source: Author’s field survey.
This class predominates in TS enterprises (9.3%) relative
to the MS enterprises (6.7%). At the other extreme are over
123
48 per cent of all enterprises (50% in MS and 46% in TS)
that are having a moderately high capital level of N5, 000
and over.
5.2 OPERATING CHARACTERISTICS OF INFORMAL
SECTOR ENTERPRISESA considerable number of people are engaged in the
various activities of the informal sector of Ibadan.
Motivated by the sole desire of creating employment for
themselves, these entrepreneurs are found either as
technical service provider, and itinerant sellers,
manufacturers and/or repairmen. Quite a number of them
operate as sedentary enterprises – owners having stalls and
shops in market – places, open spaces and uncompleted
buildings by the roadside while others make use of part of
their rented accommodation as workshops.
In our sample, 14 per cent of the enterprises are
in ‘open sky’ garages, 31 per cent use open shed, 35 per
cent are in rented shops, 8 per cent use part of their
rented accommodation while the rest use their own acquired
premises as workshops. This shows that most of these
enterprises are sedentary and are thus located in temporary
or semi-permanent locations.
In her efforts to maintain clean and healthy urban
environment, the Ibadan Municipal Authority frowns at the
location pattern of these enterprises and in most cases the
enterprise owners are harassed and chased from one location
to the other. This is rampant particularly among those124

using open public spaces by the roadside. This situation
got to a climax during the Buhari – Idiagbon regime.
To this end, all auto-repair enterprises among
others were forced to operate outside the urban areas and
were all illegal ‘shops and workshops’ by the roadside
within the city were destroyed. Now, most of these
‘workshops’ are back in their places and this suggests the
resilience of informal sector enterprises to official
hostility. Moreover, evidence from this study suggests
growth of enterprises and of operators and these are
expected given the low and dwindling absorptive capacity of
the formal sector vis-à-vis the growing urban labour force.
Another important reason for the proliferation of
these enterprises is the low level of capital needed to
start these enterprises. Also, operators do not consider it
necessary to
obtain official permission before commencing such
businesses. For example, none of the enterprises sampled
has any government license. The only thing that is
mandatory for them to do is to register with the
appropriate trade union which is set up and run by
entrepreneurs of each trade within a given area. Failure to
register and participate in union activities attracts
sanctions. Such sanctions range from payment of fines, to
seizure of working tools until union requirements are
complied with. Thus, most of these enterprises operate
without either government licenses or government inspection
125

and assistances. Their existence and prosperity, therefore
depends on how best they can attract and retain their
clienteles’ patronage rather than on government’s (or any
of its institutions) recognition, approval and patronage.
Another important operational characteristic of the
informal sector enterprises is the observed limited
division of labour within a given enterprises. Between
enterprises, there is occupational division of labour.
These entrepreneurs specialize in different occupational
categories. For example in a typical auto-repair garage in
Ibadan, there is the vehicle; the auto-electrician; the
battery reconditioned; the vulcanizer; the spray-painter;
and of course, the blacksmith; specializing in different
aspects of motor vehicle repairs and reconditioning. Each
of these classes of entrepreneurs usually locate in a
particular ‘workshop’ with strict operational non-
interference. The limited division of labour within a firm
stems from the fact that capital is scarce and of
rudimentary type. In terms of number of people engaged per
enterprise, the number is also generally low to permit a
reasonable degree of division of labour. For our sampled
enterprises, the average number of owners plus paid workers
per enterprise is about 2, while the average of total
number engaged per enterprise in 6. Such situation
precludes any extensive division of labour in a typical
enterprise.
In terms of hours of work, these enterprises
operate for a relatively long hours as compared with formal
126

sector enterprises. While 93 per cent of these enterprises
operate for 10 – 15 hours per day, only 7 per cent operate
for 6 – 9 hours. In most cases, they do not go on annual
leave but take as holidays such days that fall on weekly or
annual religious festivals.
While these entrepreneurs and their workers are
usually physically present in their workshops for an
average of 11 hours per day, they rarely have enough work
to engage them for that long. A greater part of this period
is spent waiting for prospective customers. On the average,
these enterprises are engaged for 5 hours per day; with 55
per cent of the enterprises being fully engaged for 2 – 5
hours, 40 per cent for 6 – 9 hours while the rest did not
answer the question.
It is however interesting to note that most of the
entrepreneurs interviewed use their spare time
productively. A good number of them use this slack period
to train apprentices on the theoretical aspect of their
jobs as in electrical repairs and auto-repair works; while
others concentrate on the practical aspects of training of
apprentices as in tailoring where masters teach apprentices
the art of pattern-cutting using thick papers. In some
other enterprises, entrepreneurs and their apprentices
engage in trading or farming while several others maintain
that they do nothing in time of no job but to sit down and
wait for customers to bring jobs. On the average, these
enterprises are usually fully engaged for about 30 hours
127

per week. This contrast with the formal sector
establishments that operates a 40 hour working week.
It is however interesting to note that while
informal sector enterprises are set up with the principal
aim of creating jobs for their owners, the enterprises also
serve as a source of imparting skills to others. An
analysis of the number of apprentices that had been trained
showed that a total of 2160 apprentices had been trained by
these masters, while another 40 has been trained for the
National Directorate of Employment. Moreover, at time of
the survey, these enterprises have a total of 2,119
apprentices that are currently being trained. The time of
operators of enterprises is therefore devoted both to
income generating and skill-formation activities.
5.3 SOCIO-ECONOMIC CHARACTERISTICS OF
ENTREPRENEURSOver 90 per cent of the entrepreneurs sample is
literature with only less than 10 percent who had no formal
education. The ‘no schooling’ category is dominant in MS
enterprises (12 per cent) as compared with TS enterprises
(7 per cent). At a more disaggregated level, 50 per cent of
entrepreneurs in block-making never attended school and
this is followed by those in Leather works (15.4 per cent)
and Metal Works (14.8%).
128

TABLE 5.7: PERCENTAGE DISTRIBUTION OF ENTREPRENUERS BY LEVEL OF EDUCATION AND TYPE OF ENTERPRISES
ENTERPRISES HIGHEST LEVEL OF FORMAL EDUCATION
NO SCHOOLING PRIMARY SECONDARY TECHNICAL NOT STATEDMANUFACTURING Wood Leather Cloth Metal Block Printing
TECHNICAL SERVICES Auto Repairs Electrical Others
11.87.115.45.914.850.00.0
7.57.50.020.0
51.154.343.653.057.516.716.6
47.758.732.033.3
34.535.733.341.126.033.475.1
34.229.842.031.2
2.62.95.10.01.70.08.3
7.14.014.011.1
0.00.02.60.00.00.00.0
3.50.012.04.4
ALL ENTERPRISES 9.7 49.5 34.4 4.7 1.7Source: Author’s field survey.
As shown in Table 5.7, the modal educational level is
the primary education (49.5 per cent). And this is followed
by secondary education (34.4 per cent). It is also
interesting to note that those with higher education are
not left out in taking advantage of the income and
employment opportunities of the informal sector of Ibadan.
About 5 per cent of our sampled entrepreneurs had post-
secondary education. This is rather surprising as economic
literature postulates that informal sector operators are
usually the uneducated, the very young, the very old and
women.25 also, Callaway’s 7 study of Ibadan confirms the
preponderance of those without education and those with
primary education in the urban informal labour marker.
129

In contradistinction to the view that the informal
sector workers are at the extremes of age continuum, the
entrepreneurs in our sample span all age-groups with a
significant proportion of them in their prime. As shown in
Table 5.8, 0.4 per cent and 8 per cent of all entrepreneurs
are less than 15 years and over 50 years respectively. The
remaining 91.6 per cent are between the ages of 15 and 49
years. For the MS enterprises, the entrepreneurial age
distribution is analogous to that for all enterprises. For
the TS however, there is no entrepreneur that is less than
15 years; while only 6 per cent are beyond age 50. This
implies a more youthful age structure. Therefore,
TABLE 5.8: PERCENTAGE DISTRIBUTION OF ENTREPRENUERS BY AGE AND TYPE OF ENTERPRISES
ENTERPRISES LESS THAN 15 YRS
15 – 24
25 –34
35 – 49
50 AND OVER
MANUFACTURINGWood Leather ClothMetalBlockPrinting
TECHNICAL SERVICES Auto-RepairsElectrical Others
0.71.50.00.01.80.00.0
0.00.00.00.0
6.43.02.713.15.38.30.0
8.89.64.28.9
54.162.151.464.349.016.716.6
52.850.070.840.0
29.127.332.421.531.658.333.3
32.032.625.042.2
9.76.113.51.212.316.750.0
6.48.30.08.9
ALL ENTERPRISES 0.4 7.5 53.6 30.5 8.0Source: Author’s field survey.
130

Our observation with regard to entrepreneurs’ age
distribution reveals stability (over time) of age-
distribution as there is no significant difference between
our findings and those of Callaway’s in this regard.
In terms of training, the apprenticeship form of
training is the most prevalent among the entrepreneurs.
While 88.1 per cent are trained by informal-sector masters,
16.9 percent are formal sector trained. Of the latter, 9
per cent are trained 0n-the-job in private firm, 4 per cent
are public sector trained while the rest receive their
training in formal technical/vocational institutions. This
suggests that training through the age-old apprenticeship
system is the most popular form of skill-acquisition in the
informal sector of Ibadan. This finding is consistent with
those of Callaway7 and Fapohunda.18
CHAPTER SIX
131
EMPLOYMENT IN THE INFORMAL SECTOR
6.1 EMPLOYMENTAs argued in Chapter 4, the supply of labour to
the urban informal sector derives from the surrounding
areas to a great extent, and from the city itself.
Employment history of our respondents shows that 43 per
cent of the workers were born in the city of Ibadan,
while the rest (57%) are migrants; that is, they were
born elsewhere before moving to Ibadan. Of the latter,
85 per cent are from other Yoruba-speaking towns of
Ogun, Oyo, Ondo and Lagos state; 4 per cent are from
Bendel State, 3 per cent are from the East, 1 per cent
are from the North while the rest are non-Nigerians.
As shown in Table 6.1, the numbers of wage-
earning employees per enterprises vary from zero to
nine. Three hundred and ninety-two enterprises,
representing 72 per cent of the total, employ no worker.
Thirteen per cent employ one worker each while 8 per
cent and 7 percent employ 2, and 3 to 9 workers per
enterprises respectively.
Disaggregated by type of enterprises, it is
observed that 90 per cent of cloth making enterprises
employs no worker while in woodworking only 54 per cent
have zero workers. Printing enterprises contribute
significantly to wage employment as it has the highest
average number
132
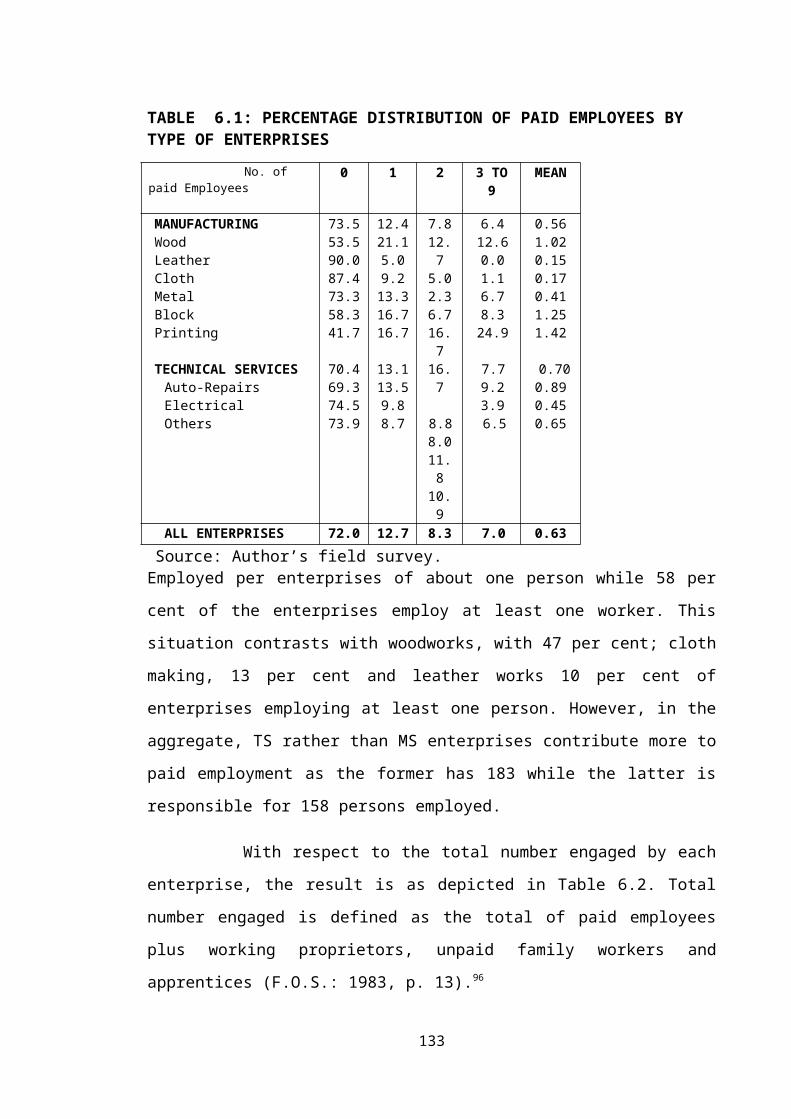
TABLE 6.1: PERCENTAGE DISTRIBUTION OF PAID EMPLOYEES BY TYPE OF ENTERPRISES No. of paid Employees
0 1 2 3 TO9
MEAN
MANUFACTURINGWoodLeatherClothMetalBlockPrinting
TECHNICAL SERVICES Auto-Repairs Electrical Others
73.553.590.087.473.358.341.7
70.469.374.573.9
12.421.15.09.213.316.716.7
13.113.59.88.7
7.812.75.02.36.716.716.7
8.88.011.810.9
6.412.60.01.16.78.324.9
7.79.23.96.5
0.561.020.150.170.411.251.42
0.700.890.450.65
ALL ENTERPRISES 72.0 12.7 8.3 7.0 0.63 Source: Author’s field survey.Employed per enterprises of about one person while 58 per
cent of the enterprises employ at least one worker. This
situation contrasts with woodworks, with 47 per cent; cloth
making, 13 per cent and leather works 10 per cent of
enterprises employing at least one person. However, in the
aggregate, TS rather than MS enterprises contribute more to
paid employment as the former has 183 while the latter is
responsible for 158 persons employed.
With respect to the total number engaged by each
enterprise, the result is as depicted in Table 6.2. Total
number engaged is defined as the total of paid employees
plus working proprietors, unpaid family workers and
apprentices (F.O.S.: 1983, p. 13).96
133

A total number of 3, 213 people; made up of 647
owners representing 20 per cent of the total; 341 employees
(11 per cent), 2119 apprentices (66 per cent) and 106
unpaid family workers (3 per cent) are engaged by the 544
enterprises sampled. On the average, each enterprise
employs about 6 persons.
One- person enterprises (usually made up of their
sole owners) are about 16 per cent of the total and these
are more important in manufacturing (19 per cent).
Enterprises employing between two and five persons
predominate in the sector with an overall average of 49 per
cent. Such enterprises are also more dominant in
manufacturing (54 per cent) than in technical services (44
per cent).
TABLE 6.2: PERCENTAGE DISTRIBUTION OF TOTAL NUMBER ENGAGEDBY TYPE OF ENTERPRISES
ENTERPRISES NUMBER ENGAGED1 2 – 5 6 –
910 –15
16 & ABOVE MEAN
A. MANUFACTURING Wood Works Leather
Cloth Metal Block Printing
B. TECHNICAL SERVICES Auto Repairs Electrical Others
18.715.532.518.411.725.016.7
13.111.03.932.6
53.745.157.551.763.350.066.7
42.241.754.939.1
15.523.97.517.216.78.38.3
22.324.515.715.2
6.47.02.55.78.30.00.0
10.812.315.74.3
5.78.50.07.00.016.78.3
9.610.59.88.8
5.36.52.95.44.87.26.7
6.6 7.27.14.8
ALL ENTERPRISES 16.0 49.3 18.8 8.5 7.5 5.9Source: Author’s field survey.
134
Those enterprises employing between two and five
people are at the peak of the distribution. However, the
frequency distribution of subsequent groups falls
monotonically, and the situation prevails in both MS and TS
industrial subgroups. Enterprises engaging more than 15
persons are about 8 per cent in total. Six per cent of
these enterprises are in manufacturing, while 10 per cent
are in technical services. It is however surprising that
none of the enterprises in leather – and metal-works engage
up to 16 persons. This might be an indication that these
enterprises are not perceived as attractive and rewarding
as others.
With respect to each enterprises; block-making,
auto-repair and electrical repair enterprises have the
greatest (7) average number of people engaged per
enterprises. In contrast, leather-works enterprises have
least of about 3 persons per enterprises. On the aggregate,
while technical services engage about 7 persons per
enterprises, manufacturing subsector has 5 persons per
enterprise.
In general, the distribution of workers between
enterprises, among other factors, can be taken as a proxy
for the relative importance of enterprises within the urban
economy. This is because, the present demand conditions,
and hence the income-generating potentials of a given type
of occupation, shapes the motivation of both the present
and future generation of entrepreneurs in deciding whether
to invest capital (human and material) into such line of
135

business. However, this should not be drawn too far since a
high-income business line may not attract many people if
the job involved is considered ‘dirty’ or generally not
‘modern’ or is hazardous.
For most of the Ibadan informal self-employed, their
current employment is regarded as permanent while most of
those in paid employment are looking forward to
establishing own enterprises in same line of business. This
observation, among others, suggests that employment in the
MATS of urban informal sector is significant and steady,
rather than being temporary and marginal. This view is
buttressed by the fact that the average age of enterprise
is about 11 years old with about 50 per cent having been in
existence for well over 10 years (see Table 5.2 above).
Moreover, rather than contract over time, our sampled
enterprises exhibit substantial growth rate in terms of the
total number of people engaged. This is depicted in Table
6.3 below.
As reported earlier, most of these enterprises
started as single-person units, but over time, the total
number engaged is increasing at an impressive rate. For
example the TS enterprises experienced about 11 per cent
rate of growth per annum. On the aggregate, the enterprises
in the MATS experience a modest rate of growth of 8 per
cent per annum.
TABLE 6.3: PERCENTAGE DISTRIBUTION OF EMPLOYMENTGROWTH BY TYPE OF ENTERPRISE
MEAN
136

ENTERPRISES NEGATIVE ZERO 1-5
6-10 11-20
21-30
31 &OVER
GROWTHRATE
MANUFACTURING Woodworks Leather Cloth Metal Block Printing
TECHNICALSERVICE Auto-Repairs Electrical Others
8.88.510.03.415.016.78.3
7.78.07.86.5
32.223.945.036.628.333.341.7
22.320.211.839.1
21.232.415.019.515.025.08.3
18.117.823.513.0
12.79.910.010.318.30.08.3
9.612.311.86.5
11.714.112.56.9
10.08.3
33.3
20.423.319.61.1
4.62.80.06.98.38.30.0
5.84.97.84.3
8.98.47.517.25.08.30.0
16.113.417.617.3
5.75.53.97.65.54.35.4
10.710.514.97.3
ALL ENTERPRISES 8.3 27.6 19.7
11.2 15.8
5.1 12.3 8.1
Source: Author’s field survey.
In contradistinction to the positive impressive rate
of growth reported above for most enterprises, some other
enterprises experience either contraction or zero rate or
growth. In MS which is worst hit as compared to TS, about 9
per cent remain stagnant. In the TS, 8 per cent suffer a
decline while 22 per cent experience zero rate of growth of
employment over time. In all, 36 per cent of the
enterprises had either zero or negative growth rate.
A host of factors can be attributed, a priori to the
observed growth rate of employment in each enterprise. Some
of these are level of present capital, the age as well as
137

the educational level of the present of the entrepreneur,
the age of business as well as the relative modernity of
the enterprises. The latter variable can be proxied by the
existence or otherwise of electricity and/or electric
machine in the enterprises. Our empirical analysis shows
that to a limited extent, employment growth is shown to
depend on education of entrepreneur as well as the relative
modernity of enterprise. Our inability to include economic
factors discussed below as explanatory variables probably
accounts for the rather very low R2. 97
Apart from those factors mentioned above, the economic
climate in Nigeria is another crucial determinant of
employment growth in these enterprises in recent times.
Most educated youths are increasingly finding it difficult
to be absorbed into the high wage capital-intensive formal
sector enterprises. Since there is no dole from the
government to support these unemployed, while familial
support may be insignificant or even non-existent, most of
those that would have otherwise remained unemployed do
adjust their expectations and take up urban informal
manufacturing and technical works.
The increasing employment size of these enterprises is
an indication that the urban informal MATS subsector has a
tendency to be expanding rather than contracting. This
becomes reasonable when it is realized that the urban
labour force growth rate high and increasing while formal
sector employment growth rate is low and dwindling.
138

6.2: GENERATION OF NEW ENTREPRENEURS THROUGH SKILL
FORMATION
Apart from its significant contribution to
employment generation, the urban informal sector of Ibadan
contributes significantly to the generation of new
indigenous entrepreneurs through the skill formation
process. As mentioned in the previous chapter, the
apprenticeship
system is the single most important source of
entrepreneurship generation. For example, 90 per cent of
the current entrepreneurs were trained by the
apprenticeship system.
The sustenance of the training system derives from the
earnest intention of masters to take on apprentices as they
(the apprentices) contribute to output and income
generation. These are brought about by the fact that
apprentices serve as cheap labour in production, while on
completion of their training these apprentices pay out a
token sum of money to their masters. The apprentices
themselves, most of who have readjusted previous labour
market expectations are also eager to learn a skill and
later set up own enterprises.
An analysis of previous apprentices trained prior to
the time of our survey shows that all enterprises sampled
had trained a total of 2, 160 apprentices taken up by
themselves, while 40 had been trained for the National
139

Directorate of Employment (NDE). In total, 2, 200
apprentices had been trained and this represents four
trained apprentices per enterprise on the average.
The MS entrepreneurs trained a larger number of
apprentices totaling 1, 293 and 18 for themselves and NDE
respectively while similar figures for TS entrepreneurs are
867 and 22 respectively. The recognition and the eventual
utilization of the informal apprenticeship training mode by
the government – sponsored NDE is an indication of the
importance of this system of skill formation and
entrepreneurship development. Our study shows that most of
the trained apprentices are employed either as self-
employed or employees in the labour market. Table 6.4 shows
the present location and preoccupation of trained ex-
apprentices. Sixty-one percent of ex-apprentices arte
currently self-employed in the same line of business where
they received training; 11 per cent are still with their
masters as either journeymen or employees while 4 per cent
are employed in the formal sector enterprises.
TABLE 6.4: PRESENT LOCATION AND OCCUPATION OF EX-APPRENTICES
Percentage
Established own Enterprises 61
With Master as Journeymen/Employee 11
In formal Wage Employment 4
Looking for initial capital 2
Places Unknown 22
140

100 ======
Two percent of these are yet to have enough initial
capital while the rest (22 per cent) cannot be located by
masters. In all, the MATS subsector of Ibadan informal
economy has created employment for 72 per cent of these
trained technicians.
The evidence presented above suggests that training
through on-the job apprenticeship system promotes
entrepreneurship development while some of the trained ones
are considered employable by formal sector employers.
Moreover the capital formation process seems adequate given
the NDE’s patronage of the training system for its Open
Apprenticeship Scheme.
Apart from those previous trained; the enterprises
sampled have a considerable number of apprentices that are
being trained. In all, these enterprises have 2, 119
apprentices with 973 in MS and 1, 146 in TS enterprises. On
the average, each enterprise in MS and TS has about 3 and 4
apprentices respectively. For all enterprises, the average
is about 4.
Of the 213 apprentices selected for detailed study, 13
are found to be NDE trainees while the rest are in informal
apprenticeship system. A detailed study of apprentices
becomes important when it is realized that they are
necessary for future generation of urban informal
entrepreneurs. Moreover, such study will likely elicit
those factors that determine entry into the apprenticeship141

system and the generation of urban skilled workers in the
MATS subsector.
In examining the possible factors for entry into the
informal apprenticeship system, the following results
emerge. Thirteen per cent got into apprenticeship because
their parents could not afford to finance their further
education, 4 per cent cannot obtain desired formal wage
job, and 14 per cent are influenced/forced by parents while
the remaining 69 per cent got into learning a job because
of personal motivation and interest. Moreover the latter
group is interested in becoming self-employed after their
trainings.
Most of these apprentices (87 per cent) are young
school leavers with no previous job experience while the
rest had engaged in one odd job or the other before
becoming apprenticed. In terms of age, 45 per cent of them
are less than 20 years, 44 per cent are between 20 and 29
years while the rest are at least 30 years old. Seventy-
eight per cent of them are male while the rest are female.
An analysis of the educational attainment of these
apprentices shows that 0.9 per cent is without formal
education, 30 per cent had primary education, 63 per cent
had secondary education, 1 per cent had technical education
while the rest did not respond to the question. Such
observed increasing trend of educational attainment of
apprentices is a harbinger of managerial improvement in
informal sector enterprises over time.
142

Given their formal educational attainment, we found it
necessary to ask how satisfactory they feel their training
mode is. Ninety-five percent consider their training mode
(apprenticeship system) to be satisfactory, 1 per cent
express dissatisfaction while the rest did not answer the
question.
As regards the future aspiration of these apprentices,
sixty-seven per cent of these trainees intent to establish
their own enterprises in the survey city immediately after
training. Five per cent intend to stay on with their
masters as journeymen/employee in order to obtain either
more practical experience or part of initial capital before
establishing own enterprises. Another 12 per cent wish to
establish enterprises in another town, 11 per cent prefer
formal wage-employment, while 4 per cent intend to engage
in any odd job to obtain fund for initial capital. From
these apprentices, three broad classifications regarding
future aspirations are identified.
(i) Those wanting to establish immediately after
training either in Ibadan or elsewhere – 79
per cent.
(ii) Those who want to delay establishing own
enterprises either in order to obtain more
practical experience and/or initial capital
– 9 per cent.
(iii) Those preferring wage employment in the
formal sector – 11 per cent.
143

Thus, 88 per cent of the trainees are potential
entrepreneurs in the informal sector. Using the above
tripartite classification, Table 6.5 shows how these
apprentices are distributed by sector of employment.
TABLE 6.5: PERCENTAGE DISTRIBUTION OF APPRENTICES BY FUTUREASPIRATIONS
ESTABLISHIMMEDIATELY
ESTABLISHLATER
FORMALWAGE JOB
NOTSTATED
MANUFACTURING Wood
Leather
Cloth Metal Block Printing
TECHNICAL SERVICES Auto-
Repairs Electrical Others
83.875.080.094.685.080.0100.0
73.470.863.279.0
8.115.76.70.05.010.00.0
9.610.410.515.8
7.26.36.75.410.010.00.0
16.018.826.35.3
0.93.16.70.00.00.00.0
0.00.00.00.0
ALL ENTERPRISES 79.0 8.8 11.2 1.0Source: Author’s field survey.
Apprentices in MS show a greater tendency towards
establishing own enterprises immediately relative to those
in TS. Surprisingly, all trainees in printing works
expressed the intention of establishing immediately while
95 per cent of those in cloth-working express similar
intention. Of those intending to establish later, TS
enterprises have greater percentage (9.6) compared to those
in MS (8.1). Sixteen per cent of trainees in TS are looking
144
forward to formal wage employment as compared to 7 per cent
in MS.
Using some of the information presented above, and
others obtained from our survey, a simple calculation of
the rate of annual addition to the stock of entrepreneurs
can be made using the relationship derived in equation (3).
However, some rather simplifying assumptions are made and
they are as follows:
(i) The distribution of apprentices by future aspiration
(Table 6.5) is stable over time and that such
distribution reflect exactly what apprentices will do,
ceteris paribus, after training;
(ii) The net labour-market movement of entrepreneurs is
zero over time. In other words, the number of informal
sector entrepreneurs withdrawing from the sector
exactly equals those entering and re-entering the
sector in enterprise-owner category;
(iii) The rate of flow of apprentices to a given
enterprise is constant.
Substituting our survey data into equation (3) gives
the result shown in Table 6.6. Our data shows that average
waiting period for those delaying entering into
entrepreneurship is 5.06 years. This compares with 5.7
years obtained by Farouq, et al (1976)98 for apprentices in
the defunct Western State of Nigeria.
145

The annual rate of generating new entrepreneurs per
enterprises is especially high in cloth, block and
electrical enterprises, while it is relatively very low in
leather-making enterprises. For all enterprises the average
is 0.93. the implication of this rate of generation is that
given the number of MATS enterprises in Ibadan to be N, it
means that annual addition to the total stock of
entrepreneurs will be 0.93N.
One important point raised is whether the urban
economy is able to absorb such annual increase of
entrepreneurs productively without increasing the level of
underemployment. As argued earlier, the question of open
unemployment does not arise but that of extent of
utilization.
TABLE 6.6: ANNUAL RATE OF GENERATION OF NEW ENTREPRENEURS BY TYPE OF ENTERPRISESENTERPRISES Ai Bi Ni Ti ti NEW ENTREPRENEUR
TOTAL PER ENTERPRISEMANUFACTURING
WoodworksLeatherClothMetalBlockPrinting
TECHNICAL SERVICEAuto-RepairsElectricalOthers
0.840.750.800.950.850.801.00
0.080.160.070.000.050.100.00
1,039287633522335648
1,080687265129
3.43.73.12.94.13.34.3
3.53.63.32.9
5.023.95.56.14.44.85.4
5.134.85.15.5
2626117115491411
2311395236
0.910.810.411.320.801.170.93
0.900.861.030.86
146

0.730.710.630.79
0.100.100.110.16
ALL ENTERPRISES 0.79
0.09
2,119
3.4 5.06 503 0.93
Source: Author’s field survey.
Note: Ai = Proportion of Apprentices wanting
to establish own enterprises
immediately after training.
Bi = Proportion of Apprenticeswishing to delay establishing ownenterprises.
Ni = Total number of apprentices currentlybeing trained.
Ti = Average number of years those
delaying establishment will spend
before starting own enterprises.
As there are little restraints (apart from initial capital)
to establishing enterprises. Such under-utilization will be
reflected in reduced demand for their services and reduced
average weekly earnings.
However, there is a limit to which one can push this
argument if one considers the extent of innovation of
workers as well as the relative ease of adaption to
changing circumstances by these informal entrepreneurs. In
most cases, the Say’s law which argues that ‘supply creates
its own demand’ can be said to be true for these workers.
147

Since average size of establishment is small, and decisions
can thus be quickly taken, then adaption to changing
circumstances can be quick and easy.
This is so since their major aim is to create jobs
for themselves. Thus, for example, vulcanizers used to
engage in reconditioning punctured tyre tubes. But now,
most of them go further to recondition smooth or blown-out
tyres. The economic situation in Nigeria led to
astronomical increase in price of tyres and this makes the
‘new’ business of reconditioning old tyres a highly paying
job relative to only tube reconditioning. Metal workers now
specialize in small-scale manufacture of nuts and bolts,
stoves, pails, lock-keys and so on, using old discarded
steel rods and sheets. These products compete with the
imported ones that are hardly affordable by most urban
dwellers. To give one example, battery reconditioners not
only service old batteries; but they ‘manufacture’ car
batteries using old and discarded materials in conjunction
with electrolyte. Such adaptations and innovations will end
up creating jobs for these increasing entrepreneurs and
this will likely prevent the state of underemployment to be
worsening with time.
However, in spite of the above, and given the rate
of generation of new entrepreneurs, it will be of interest
to know the level of skill utilization of current
entrepreneurs as this will help to throw light on the level
of underemployment prevailing in the economy; and by
148
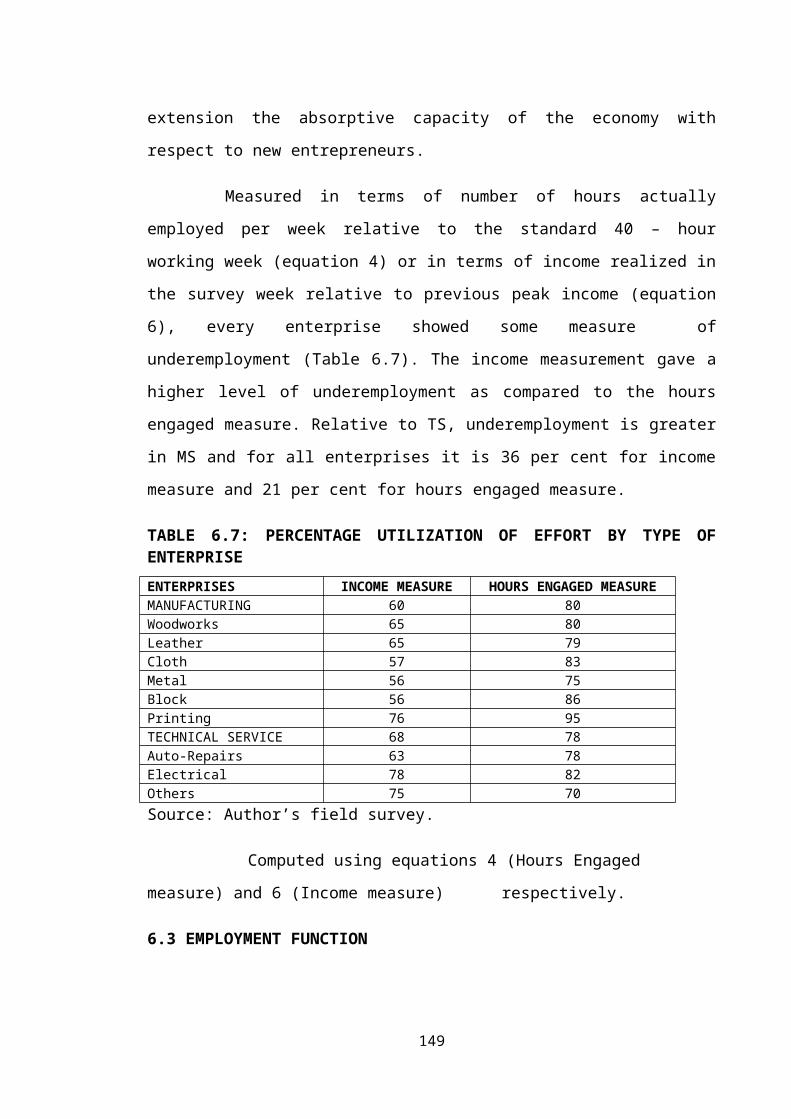
extension the absorptive capacity of the economy with
respect to new entrepreneurs.
Measured in terms of number of hours actually
employed per week relative to the standard 40 – hour
working week (equation 4) or in terms of income realized in
the survey week relative to previous peak income (equation
6), every enterprise showed some measure of
underemployment (Table 6.7). The income measurement gave a
higher level of underemployment as compared to the hours
engaged measure. Relative to TS, underemployment is greater
in MS and for all enterprises it is 36 per cent for income
measure and 21 per cent for hours engaged measure.
TABLE 6.7: PERCENTAGE UTILIZATION OF EFFORT BY TYPE OFENTERPRISEENTERPRISES INCOME MEASURE HOURS ENGAGED MEASUREMANUFACTURING 60 80Woodworks 65 80Leather 65 79Cloth 57 83Metal 56 75Block 56 86Printing 76 95TECHNICAL SERVICE 68 78Auto-Repairs 63 78Electrical 78 82Others 75 70Source: Author’s field survey.
Computed using equations 4 (Hours Engaged
measure) and 6 (Income measure) respectively.
6.3 EMPLOYMENT FUNCTION
149

As discussed in chapter four (under the model
formulation section), it is hypothesized that several
factors affect the level of employment. For analytical
purpose, therefore, we have defined the level of employment
per enterprise in several ways. These are discussed in
section 4.2.4 above.
The ordinary least squares estimating technique was
applied to our basic model specified in equations (8) and
(10) using each of EMPT 4 as dependent variable. The linear
form (equation 8) gave a better fit and the result obtained
is as shown in Table 6.8.
Figures in parentheses beneath the coefficient
estimates are the standard errors of regression for the
variables concerned. In all, except the second regression
result, all variables have positive impacts on the level of
employment. It is also observed that there exists a
relative stability among coefficient estimates of
regressions 1, 2 and 3.
The coefficients of multiple determination lie between
22 per cent (regressions 1 and 3) and 37 per cent
(Regression 4). Regression 4 seems to have given the best
result in terms of both economic and statistical criteria.
As such our discussion will be based more on it.
The explanatory variables of our regression
equation are made up of both quantitative (dummy)
variables. Dummy variables in our regression shows the
150

change in the level (intercept) between equation of the
reference or the excluded category and each of the other
categories.
TABLE 6.8: EMPLOYMENT FUNCTION FOR THE URBAN INFORMAL
ENTERPRISES IN MANUFACTURING AND TECHNICAL SERVICES
EMPT 1
(1)
EMPT 2
(2)
EMPT 3
(3)
EMPT 4
(4)INTERCEPT 6.08 -44.65 5.99 4.86
VAR 2: SKILL 0.19+ 8.76+ 0.20+ 0.23+
Utilization (0.02) (1.18) (0.02) (0.02)
VAR 8: Average Wage 0.12+
(0.03)
10.78+
(1.65)
0.13+
(0.03)
0.18+
(0.02)X4: Age of Business 0.17+
(0.06)
17.16+
(3.52)
0.16+
(0.06)
0.011
(0.05)X27: Present Capital 0.03
(0.027
)
-0.77
(1.54)
0.03
(0.027
)
0.03+
(0.001
)XIIA: Amount of Education of
Owner
0.07+
(0.02)
3.15+
(1.30)
0.06+
(0.02)
0.04
(0.02)
X142: (1, if Owner is
Trained in FS
(0, Otherwise
0.69+
(0.29)
54.73+
(16.34
)
0.62+
(0.029
)
0.62+
(0.23)
X202: (1, if TS) 0.19 25.79+ 0.24 0.19
151

(0, Otherwise) (0.19) (0.72) (0.19) (0.15)
R2
F
N
0.22
21
544
0.24
24
544
0.22
22
544
0.37
45
544
Note: + = Significant at 5% level.
The intercept for the excluded category is represented by
the constant term; while the coefficient of any dummy
variable indicated the amount of vertical shift in
intercept. For example, the difference between the
intercepts or changes in the level between those trained in
the formal sector and those trained other methods (e.g.
apprenticeship system) (variable X142) is 0.62 as shown in
regression 4 of Table 6.8. this interpretation is as a
result of the fact that we have not constrained the
constant term to be equal to zero. For the quantitative
variables, the regression estimates measure the slopes of
the variables concerned.
All the explanatory variables except age of business
(X4) and type of enterprise dummy (X202) are significantly
different from zero at the indicated levels, on their
impacts on the level of employment. The non-significance of
X202 and X4 respectively show that industrial difference as
between TS and MS; as well as age of establishment do not
affect the level of employment in the urban informal sector
. For X202, the result is not surprising as both industries
require a given level of skill before being engaged to work
152

either as employee or journeyman. However, for X4, one
expects greater labour market experience to increase
employment level of a firm. A possible explanation for this
phenomenon is that recently established firms are likely to
be more modern in terms of the type of productive
activities engaged in and the level of education as well as
the quality of training of owners. This might explain
variations in the level of employment, among enterprises.
The fact that relative modernity of enterprises and
educational attainment of entrepreneurs are statistically
significant variables (rather than age of enterprise which
was also tried in the regression) affecting employment
growth gives credence to this explanation.
Variable X142 is a dummy whose differential
coefficient measures employment differentials among
enterprises owner by entrepreneurs trained in the formal
sector relative to those trained by the age-old
apprenticeship system. Our result shows that training
through the formal sector contributes more to employment
relative to those trained in informal apprenticeship
system. This may be due to the fact that those exposed to
formal training are relatively more skilled and are thus
able to attract more customers and apprentices which in
turn will expand the demand of such enterprises for more
workers.
The level of skill utilization also affects employment
positively. Our result shows that an increase in the level
153

of skill utilization by 10 per cent will expand employment
by 2.3 per cent.
The impact of capital level on employment level is
significant at 10 per cent level. However, the observed
magnitude of its coefficient is rather small. In fact it is
the second smallest coefficient. What might probably be
responsible for this is that in most of the enterprises,
capital level is low and it is not uncommon for
entrepreneurs to depend on themselves for inter-firm tools
and machinery borrowing. Thus, what increase in the level
of capital does, most often, is first, to reduce such
inter-firm dependence before it before it begins to, after
a point, significantly influence the level of employment
through increased customer patronage arising from
increasingly improved quality of work.
Average wage and level of employment are found to be
positively related. This seems to be a departure from the
traditional theoretical postulation that posits negative
relationship between the level of wages and employment
demand. But as demonstrated in section 4.1.4, employment
situation in the informal economy is rather peculiar and
does not as such, fall in line with the traditional macro-
models. For instance, employment situation in the formal
sector is both a combination of employment supply (by the
owners themselves) and demand (for employees when owners’
efforts cannot cope with the volume of work at hand). This
is so because entrepreneurs establish their business
154
primarily to create jobs for themselves and if the volume
of work increases, they may employ extra hands to cope with
the job. It is no wonder therefore that paid employment is
an exception rather than the rule.
Also, for those skilled workers in the manufacturing
and technical services, the concept of unemployment is not
relevant. They may however, be underemployed in current
employment. Therefore, an entrepreneurial demand for labour
services might have to be accompanied by increasing wages
to attract workers from current employment. Thus, the
preponderance of enterprise owners supplying their own
effort at increasing wages, and the demand by owners for
employees at higher wages to attract them, explain why
average wage and level of employment are positively
related.
The amount of education (measured by the number of
years spent in the formal schooling system) acquired by
entrepreneur positively affects the level of employment.
This conforms to our a priori expectation as the educated
are expected to be more innovative and adaptive. Moreover,
they are better able to manage their firms, relative to the
uneducated, thereby promoting efficiency and hence the
level of employment.
In summary, all the explanatory variables included in
the model have positive impacts on the level of employment.
However, five of these variables have their coefficient
estimates significantly different from zero at 95 per cent
155

level of confidence; while the rest are not statistically
significant.
6.3.1 Level of Commitment and job Satisfaction Among
Urban Labour Force
In spite of the factors identified as influencing the
level of employment as well as the contribution of
enterprises to skill formation, the study goes further to
examine the level of commitment of workers to their sector
of employment.
Of those currently employed in the informal sector, 64
per cent are totally committed and are satisfied with their
jobs. They are, therefore, not considering formal-sector
alternative. Only 5 per cent are thinking of moving to the
formal sector. Another 22 per cent are engaged in either
wage and/or casual employment in the informal sector in
order to obtain initial capital to set up own enterprises
as soon as possible. The rest did not respond to the
question. Thus, among the informal sector operators
(excluding apprentices and unpaid helpers) 86 per cent are
not prepared to leave the sector since they are satisfied
with current employment.
Among the formal sector workers interviewed, about 5
per cent are satisfied with their current jobs and are not
thinking of leaving until they retire. In contrast, 94 per
cent have a strong desire to quit in order to establish
their own enterprises in line with their current employment
156

in the formal sector. Seventy-two per cent of the latter
are prepared to withdraw from formal sector employment
within a year from the time of the survey to establish own
enterprises, 23 per cent in the next 5 years and the rest
in the next 10 years. Even at present, 85 per cent of these
formal sector workers are engaged in moon – lighting in the
informal sector in order to supplement earnings from
regular employment and to prepare for their eventual set-up
on a full time basis.
The above is in consonance with the view of most
workers (81 per cent) in MATS (formal and informal) that
self-employment is far more rewarding than paid employment.
However, 5 per cent believe otherwise, 9 per cent think
that there is no difference while the rest (5 per cent) did
not respond to the question.
These results suggest that for the skilled workers in
MATS subsector of informal sector, informal employment is
perceived more as a life-long occupation rather than a
casual pre-occupation until formal employment is found. In
fact most of them are not even seeking formal employment.
Also, a significant proportion of those employed in the
formal sector have expressed strong desire to own
enterprises in the formal sector. And in fact, 8 per cent
of entrepreneurs in the informal sector were formerly
employed in the formal sector.
157

Therefore, for our sample workers, the probabilistic
migration hypothesis which maintains that the informal
sector is a staging post for urban workers until a former
sector alternative is found is not upheld.
6.4: INFORMAL EMPLOYMENT PROBABILITY FUNCTIONS
Given our findings in the foregoing section, it will
be of interest to explore those personal characteristics
that allow one to predict the probability of either leaving
one sector for the other; or remaining in the current
sector of employment. To this end, probability functions
were estimated one each for formal (Regression 1) and
informal (Regression 2) sector workers. The result is as
shown in Table 6.9.
Ten basic variables were used in the estimation of the
2 regression equations – but these have been expanded to
thirty-four by the use of dummy variables. Regression 1
relates to the formal sector workers and the estimates are
to be read as the probability, relative to the excluded
group, that a person with given characteristic will prefer
to move to the informal sector rather than remain in the
formal sector. On the other hand, regression 2 relates to
the informal workers and gives the probability, relative to
the excluded group, that a person with a given
characteristics will remain in the informal sector rather
than move to the formal sector.
All variables entered into the regression equation are
dummy (that is: 0, 1 variables) and one category of such
158

basic variable has been excluded in order to prevent dummy
– variable trap. At the same time, the excluded category is
to serve as the control for those in the regression
equation.
TABLE 6.9: INFORMAL SECTOR EMPLOYMENT PROBABILITY FUNCTION
REGRESSION 1** REGRESSION 2*+
VARIABLES/INTERCEPTINTERCEPT
-0.08 0.86
1. HOUSEHOLD POSITION (X5)X501: Head of Household b 0.06+
(0.04)X502: Other Members a a
2. REASONS FOR BEING IN FS/NFS (X05)X051: Head of Household a aX052: Parent’s Influence 0.17+
(0.07)-0.85+
(0.02)X053: Needed a Job to Survive -0.07
(0.05)b
X054: Could not Obtain Other Job. 0.59 (0.52)
-0.21+
(0.09)X055: Parent Cannot Afford Higher
Education-0.81(0.15)
-0.08(0.05)
X056: Retrenched Previous Job b 0.08
159

(0.10)X057: Withdrew from FS Job b bX058: Post-retirement Exercise B 0.11
(0.07)3. MONTHLY INCOME: (XI)
X11: Up to N100 a aX12: N100 – N200 0.44
(0.28)0.03 (0.06)
X13: N201 – N500 0.47+
(0.22)0.08 (0.05)
X14: N501 – and above 0.51+
(0.23)0.12+
(0.06)4. SEX (X38)
X381: Male a aX382: Female -0.18
(0.20)-0.13(0.07)
5. MARITAL STATUS (X39)X391: Single a aX392: Married b bX393: Divorced/Separated 0.42
(0.51)-0.13(0.35)
6. PREVIOUS OCCUPATION (X12)X121: Informal Self Employment a aX122: Wage Job/Schooling 0.05
(0.10)b
X123: Domestic/Casual -0.58+
(0.37)0.15+
(0.09)7. FATHER’S EDUCATION (X52)
X521: No Schooling a aX522: Primary -0.18
(0.11)-0.10(0.10)
X523: Secondary bX524: Post Secondary b
8. MIGRATION STATUS (X43) a aX431: Native -0.08
(0.09)b
X432: Migrants9. TYPE OF ENTERPRISE (X20)
X201: Manufacturing a aX202: Technical Services b -0.01
(0.03)10.
RESPONDENT’S EDUCATION (X42)
X421: No Schooling a aX422: Primary 0.12
(0.10)b
X423: Secondary 0.23 -0.12+
160

(0.17) (0.04)X424: Post-Secondary 0.17
(0.16)-0.07(0.07)
R2 0.27 0.12F 2.0 2.6N 111 350
Note: a = Excluded Variables b = Variables not taken into the model by the
stepwise regression procedure used.+ = Significant at 5% level
** = Regression showing the probability of a formal sectorworker moving into the informal employment.
*+ = Regression showing the probability of an informalsector worker remaining in informal sector employmentrather than move to the formal sector.
The coefficient estimates obtained are the differential
coefficients from the excluded categories. This is because
the constant term was not constrained to be equal to zero.
The effects of the excluded variables have absorbed by the
constant term.
Out of the 24 explanatory variables entered into
regression 1, the stepwise procedure adopted in estimation
dropped eight variables due to low F-level. The remaining
16 variables explained 27 per cent of the variations in the
dependent variable. At 5 per cent level, a significant
association exists between the dependent and the
independent variables using F-statistic’s criterion.
In terms of reasons for entering the formal sector
employment, two dummies (X052 and X053) are significant at
5 per cent and 10 per cent levels respectively. Those
influenced by parents have the highest probability of
leaving the formal sector while those who obtained the job
161

to survive have the least chance of leaving; compared to
those that are personally interested and decided to enter
the sector (X051). The former group might have perceived
the informal employment potential but were probably
forbidden by parents to set up in the informal sector,
whereas the latter group, upon getting the job are prepared
to keep it until retirements.
With respect to variable x1 (monthly income) our
results shows that the probability of leaving the formal
sector varies directly with income; that is, those with
high income having high probability of leaving and vice
versa. The reason for this observation is not far-fetched.
The high income group is likely to be the more educated and
therefore, the more enterprising group. These are then
able, due to their superior training, to perceive and be
prepared to take advantage of the income opportunity in the
informal economy. As reported earlier, most of these
workers have been moo-lighting in the informal sector and
are thus cognizant of their possible enhance earnings, as
well as freedom from control associated with informal self
employment. In contra-distinction to the high income group,
the lower income groups are likely to be less educated and
therefore less enterprising. As such, they might prefer to
be insulated from risk-taking which they abhor, and
therefore want to remain in formal sector employment. Apart
from the factor of education, ability to save from income
in order to generate necessary capital might be another
factor for this observation. While those in high income162

bracket can save towards informal capital formation and
entrepreneurship, this might be difficult (if not
impossible) for low income workers. Thus, they (the low-
income workers) might have lost the hope of ever being able
to generate necessary capital for NFS employment. The only
option open to them under such circumstance is to put up
with formal employment throughout their working life.
It is not unlikely that most of those in low-
education category have moved from informal employment to
formal one and as such they are prepared to remain in the
sector. This position is strengthened by ‘previous
occupation ‘variable. Those previous in domestic/casual
work (but now in FS employment in MATS category) have the
least statistically significant probability of leaving the
formal sector. Thus, the pride of having moved from
casual/domestic job to a blue-collar work in the formal
sector might be all they need to achieve.
The facts discussed above are further reinforced by
the coefficient estimates of variable X42 (Education)
dummies. Only X423 is significant, and given the
preponderance of those with secondary education, those with
post-secondary education are thus negligible. Thus the
significance of X423 suggests that those with secondary
education have the highest probability of leaving the
formal sector relative to others; due to the reasons
proffered above. In considering the social origin of formal
sector workers in relation to their probability of leaving
163

the sector for informal employment, those whose fathers
have primary education relative to those with no schooling
have the least probability of taking up informal sector
employment.
However, it is to be noted that opposition in the
household, sex, marital status, migration status as well as
sector of employment exert no significant influence on the
dependent variable.
In regression 2, 34 variables were entered but only
17 were used in the stepwise procedure while the rest were
dropped. Of the 17 used, 8 were statistically significant
at the levels indicated; and the coefficient of multiple
determinations is 12 per cent. Using F-
statistic criterion at 5 per cent level, there is a
significant association between the dependent and
independent variables.
Relative to other members of the household,
household heads are more disposed, upon entering the
informal sector, to remain there rather than move to the
formal sector.
In terms of the reasons for entering the sector
(variable X05), those who settled for informal
entrepreneurship because they could not obtain the formal
alternative have the least probability of remaining in the
sector. This seems reasonable considering the fact that
entering the informal sector for this group of people was a
164

second best option. It is therefore not unlikely that this
group of people will still be thinking of moving to the
desired jobs in the formal sector. Following this group are
those whose parents cannot afford to sponsor them to the
desired educational level that can guarantee their
obtaining formal sector job, with a differential
coefficient of -0.08. Those whose parents influenced them
in taking entrepreneurial employment in the formal sector
also have a differential coefficient of -0.05 relative to
the control group (X051). In other words these groups have
a lower probability of remaining in informal employment
relative to those that are primarily interested in taking
up informal entrepreneurship.
Unlike the case of the formal sector workers, the
probability of remaining in the informal sector employment
rather than move to the formal is highest for those in the
highest income bracket (X14), while it is lowest for those
in income group N101 – N200, that is dummy variable X12
whose differential coefficient is not statistically
different from zero. This result suggests that higher
earning of informal sector entrepreneurs in MATS subsector
is an incentive towards remaining in the sector on a
permanent basis. The pride of owing an enterprise, freedom
from controls associated with formal wage job as well as
fairly high earning potentials are important factors
towards staying in the informal sector employment.
165

Previous employment also positively influence the
probability of remaining in the NFS as those in the
casual/domestic work before taking up entrepreneurship in
MATs have higher chance of being in the sector perpetually
relative to the control group i.e. those previously in
informal self-employment. Social mobility from domestic
service to self-employed entrepreneur is enough achievement
for these groups of people and when such point is reached,
they remain satisfied and formal sector-ward movement is
thus highly unlikely. It should be noted that these group
of people in the formal sector (Regression 1) also have
relatively low probability of leaving formal employment.
This suggests that whatever sector these groups of people
find themselves after leaving the casual/domestic work,
they tend to remain there perpetually.
Relative to those without formal education, those
with secondary education exhibit lower tendency towards
remaining in the sector. This is expected because, until an
average educated youth has committed himself to informal
employment either through frustration arising from
fruitless formal sector job search or through personal
intention to exploit the informal income-opportunities,
among others, the tendency to leave the sector is still
fairly high.
166

CHAPTER SEVEN
EARNINGS AND STATUS MOBILITY OF INFORMAL SECTORLABOUR FORCE
7.1: EARNINGS
As postulated earlier, one of the motivating
factors for entering the urban informal sector employment
is the possibility of maximizing life-time income stream.
Such informal employment could be through personal167

primary self motivation or as a second best option if
desired formal sector wage is not found. Table 7.1
shows the reported earnings of these workers. The self-
employed as expected99, earn more than the employees
within the urban informal sector. However, both in the
formal and informal sectors, workers in TS earn more than
those in MS. The mean level of earning in TS is N510.00
per month while it is N426.00 in MS. For the self-
employed, the highest monthly earnings is reported by
those in ‘other Technical Services’ with a mean monthly
earnings of N558.00 per month while the lowest earnings
is found among leather workers (N389.00). For all
enterprises, the self-employed earn an average of
N5,532.00 per annum which is about twice the national
minimum wage of N2, 820.00 per annum.
TABLE 7.1: MEAN MONTHLY EARNINGS IN IBADAN URBAN LABOUR MARKET
Sector ofEmployment
Informal Formal All EmployeesSelf
EmployedN
EmployeesN
AllInformal
N
EmployeesN
Formal andInformal N
MANUFACTURING 445 262 426 519 426Printing 455 287 422 431 425Leather 389 360 388 - 388Cloth 401 256 372 - 372Metal 501 228 445 447 445Block 390 305 339 - 339Woodworks 507 282 389 524 485TECHNICALSERVICE 478 391 493 628 510Auto-Repairs 448 354 426 412 422Electrical 472 317 450 805 570Others 558 496 551 778 599ALL ENTERPRISES 461 316 430 583 468AVERAGE ANNUALINCOME (N)
5, 532 3, 792 5, 160 6,996 5,616
168

AVERAGE ANNUAL MINIMUM WAGE
1.96 1.34 1.83
Source: Author’s Field Survey
This is made of:
(a) Basic salaryN
1, 500(b) Transport
Allocation
960
(c) House
Allocation
360
Total 2, 820
The informal sector employees earn considerably less
than the self employed (by about 32 per cent) but the
distribution of earnings is similar to that of the self-
employed. Informal employees in the TS earn more than their
MS counterparts, while workers in the ‘Other Technical
Services’ record the highest mean monthly earning of N496
per month. The cloth workers have the lowest monthly income
of N228 per month. However, the mean aggregate earnings of
the employees is about 1.3 times the national minimum wage.
Our findings regarding the earnings of the informal
urban labour force in Ibadan, therefore, does not support
the view in economic literature that urban informal workers
are the urban poor trying to eke out a meagre existence. In
fact, evidences of significant saving and investment have
169

been provided elsewhere for these class of workers in urban
labour markets (Oladeji and Ogunrinola, 1990; Amin, 1981).
In comparison with informal workers, employees in the
sampled formal enterprises earn more than their
counterparts in the informal sector. Like the earnings
distribution of informal workers, employees in TS earn more
than those in MS. The highest monthly earning is recorded
by electrical workers while wood workers have the lowest
monthly earnings.
Differences in the level of human capital endowment
whether institutional or personal, among others factors
account for the observed differences in formal-informal
earnings. Thus, differences in educational attainment, and
labour market experience, quality of training, as well as
accessibility to superior factors and techniques of
production are possible factors accounting for the observed
earning differential. For example, while the average number
of years spent in school by informal workers is 8 years, it
is 9.5 years for formal workers. While average labour
market experience for formal workers is over 12 years, it
is 9 years for the informal workers. Moreover, most of the
formal sector workers engage in moonlighting in the
informal sector either to supplement their wage income
or/and to prepare for their eventual return to the informal
economy. The resultant effect of all these is a relatively
higher monthly earnings for urban formal workers relative
to informal workers.
170

Table 7.2 gives the percentage distribution of workers
by income group and sector of employment. In spite of the
impressive income level recorded by the urban labour force,
this table shows that some workers are earning very low
level of income.
TABLE 7.2: PERCENTAGE DISTRIBUTION OF URBAN LABOUR FORCE BYMONTHLY INCOME AND BY SECTOR OF EMPLOYMENT.
MANUFACTURING TECHNICAL ALL ENTERPRISESLESS THAN OR EQUALTO N100.00Informal SectorSelf EmployedEmployees Formal Sector
15.315.115.94.3
17.317.24.617.9
16.24.516.716.1
N101 – N200Informal SectorSelf EmployedEmployees Formal Sector
22.420.129.56.5
23.522.428.67.7
22.921.229.27.7
N201 – N500Informal SectorSelf EmployedEmployees Formal Sector
38.837.443.269.6
33.333.632.149.2
36.236.038.457.7
N501 AND OVERInformal SectorSelf employedEmployees Formal Sector
23.527.311.419.6
25.926.921.938.5
24.624.915.130.6
AVERAGE MONTHLY INCOMEInformal SectorSelf EmployedEmployees Formal Sector
426445262519
493528391478
430461583316
Source: Author’s Field Survey.
If we categorize those earning up to N100 as very low
income earners, N101 – N200 as low income earners, N201 –
N500 as medium income group and N501 and above as high
171
income group, we have the following picture. Within the
informal sector, 16 per cent of the workers earn less than
or equal to N100 per month. The incidence of very low
income is greatest among the informal sector employees (17
per cent) while it is 16 per cent for the self employed.
In terms of type of occupation, the informal employees
in TS are worse off as 18 per cent of them are in very low
income group while corresponding figure for MS is 16 per
cent. However, for the formal sector employees, the very
low income group constitute 4.5 per cent with 4.3 per cent
and 4.6 percent in MS and TS respectively.
In essence, a lower proportion of workers in the
formal sector relative to the informal, are within the very
low income bracket. These group of very low income earners
can be said to be the marginal group as the upper level of
their income is just 43 per cent of the minimum wage. It
may thus be difficult for them to maintain minimum level of
living. In other words, they are poor in the absolute sense
since they are below the poverty line as defined by the
national minimum wage.
About 23 per cent of the NFS labour force are in the
low income group. Like the marginal workers, the employees
are dominant in this class with 29 per cent, while the
self-employed are 21 per cent. Twenty-three per cent of
those in TS and 22 per cent of those in MS belong to this
income group. As expected, just about 8 per cent of formal
sector employees are in the low income category with the
172
majority (7.7 per cent) from the Technical Services
enterprises as compared with manufacturing (6.5 per cent).
The medium income group constitute 36 per cent of
informal sector workers with 39 per cent in MS and 33 per
cent in TS enterprises. Like the other two groups discussed
above, it is the employees that predominate (36 per cent).
It is interesting to note that majority of the formal
sector employees belong to this income class (58 per cent)
with the MS enterprises accounting for 70 per cent and TS,
49 per cent. This income class is the modal class for both
the NFS and FS operators. This suggests that the majority
of urban labour force within the skilled categories in our
sample, earn N200 – N500 per month.
Twenty-five percent of those in the high income group
are found in the informal sector while the corresponding
figure for the formal sector is 31 per cent. Within the
informal sector, the self-employed predominate in this
income class. Moreover, this income class is a typical in
the sense that it is the only class where the self-employed
are more dominant as compared to the employees. This
suggests that the self-employed are earning considerably
more than the employees. This assertion is supported by the
higher average monthly earnings of the self employed (N461)
relative to those of the employees (N316). However, the
formal sector employees enjoy higher average monthly income
(N583) relative to those in the informal economy (N430).
173

Table 7.3 presents the regression result of the
earnings distribution function fitted for the urban labour
force in ibadan. Its purpose is to shed light on those
factors affecting the distribution of earnings among
participants. Apart from the structural vaiable (sector of
employment) introduced to test the market segmentation
hypothesis; human capital variables (labour market
experience, education, quality of training and migration
status) as well as other socio-demographic variables were
included. This is to help us determine the impacts of such
variables on distribution of earnings.
Ten basic variables are used in the model but these
have been expanded to 29 by the use of dummy variables. In
all, 20 of these entered into the model while the rest
served as the control-variables. All the variables entered
into the equation are used in the stepwise regression
procedure adopted and 13 of the variables are significantly
different from zero at the levels indicatd. The regressors
explained 43 per cent of the variations in dependent
variable as shown by the magnitude of R2. By the use of F-
statistic, it is observed that there is an association
between the dependent and independent variables.
174

TABLE 7.3: EARNING DISTRIBUTION FUNCTIONS FOR THE URBAN LABOUR FORCE IN IBADAN
DEPENDENT VARIABLE: LOG OF WEEKLY EARNINGS COEFFICIENTS REGRESSION ERROR STANDARD
INDEPENDENT VARIABLES: 3.69 -1.HOUSEHOLD POSITION (X5)
X501: HeadX502: Others
-0.0796(a)
0.209
2.FORM OF EMPLOYMENT (X03)X031: Private SectorX034: Informal EmployeesX033: Self EmploymentX032: Public Sector
(a)0.481+
-0.211-0.974+
0.2850.3590.229
3.SEX: (X38)X381: MaleX382: Female
(a)0.257 0.276
4.MARITAL STATUS (X39)X393: Divorced/SeparatedX392: MarriedX391: Single
(a)-0.1670.129
1.000.210
5.MIGRATION STATUS (X43)X431: Non-MigrantX432: Migrant
(a)0.113+ 0.045
6.FATHER’S EDUCATION (X5)X521: No SchoolingX522: PrimaryX523: SecondaryX524: Post Secondary
(a)0.2390.0520.345
0.1580.4180.355
7.RESPONDENT’S EDUCATION (X42)X421: No SchoolingX424: Post Secondary X423: SecondaryX422: Primary
(a)0.082+
0.193+
0.0752+
0.0440.040.018
175
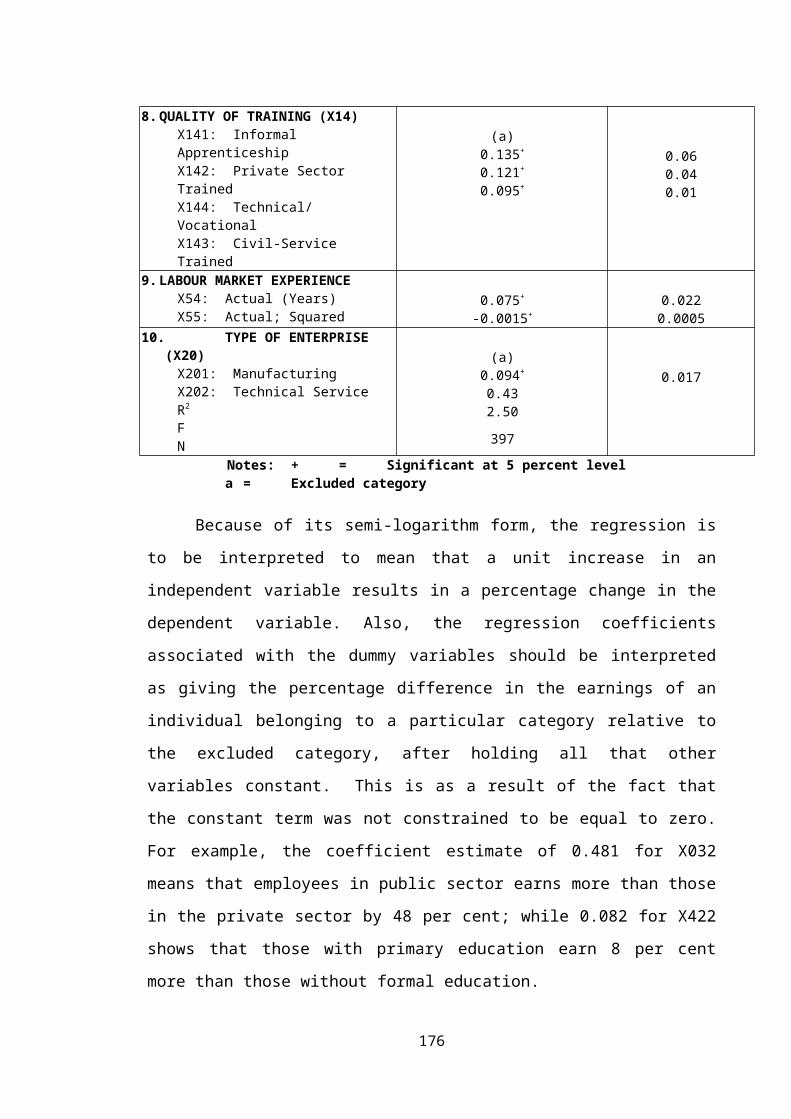
8.QUALITY OF TRAINING (X14)X141: Informal ApprenticeshipX142: Private Sector TrainedX144: Technical/ VocationalX143: Civil-Service Trained
(a)0.135+
0.121+
0.095+
0.060.040.01
9.LABOUR MARKET EXPERIENCEX54: Actual (Years)X55: Actual; Squared
0.075+
-0.0015+0.0220.0005
10. TYPE OF ENTERPRISE (X20)X201: ManufacturingX202: Technical ServiceR2
FN
(a)0.094+
0.432.50
397
0.017
Notes: + = Significant at 5 percent level a = Excluded category
Because of its semi-logarithm form, the regression is
to be interpreted to mean that a unit increase in an
independent variable results in a percentage change in the
dependent variable. Also, the regression coefficients
associated with the dummy variables should be interpreted
as giving the percentage difference in the earnings of an
individual belonging to a particular category relative to
the excluded category, after holding all that other
variables constant. This is as a result of the fact that
the constant term was not constrained to be equal to zero.
For example, the coefficient estimate of 0.481 for X032
means that employees in public sector earns more than those
in the private sector by 48 per cent; while 0.082 for X422
shows that those with primary education earn 8 per cent
more than those without formal education.
176

Both the experience (X54) and the square of experience
(X55) variables are significant at 1 per cent level and
have the expected signs. Given the functional form of the
model, the variables are expected to capture any
nonlinearities in the experience – earning profile. Thus,
holding all other variables constant, the experience –
earnings profile peaks at 25 years.100
The regression result supports our earlier findings
with respect to formal – informal earning distribution
pattern. On the average, formal sector workers earn more
than the informal sector workers. This supports the market
segmentation hypothesis that institutional factors (e.g.
location in the urban labour market) affects distribution
of earnings, ceteris paribus. Within the formal sector, the
self-employed are earning considerably more than the
employees. It is therefore not surprising that 95 per cent
of employees in the informal sector are looking forward to
establishing their own enterprises soon.
Our analysis shows that public sector workers earn
more than those in private sector of the formal economy.
The commitment of the government towards enforcing her own
minimum wage laws while some private sector organization
might not, explains this situation.
Respondents’ education dummies are all statistically
significant and have the expected positive impacts on
earnings distribution. These suggest that earning is an
increasing function of education. Successive level of
education makes increasing contribution to earnings. For
177

example, while primary education increases earning by 8 per
cent, secondary and post-secondary education increases
earnings by 11 per cent and 56 per cent respectively.
The coefficient estimate of type of informal
enterprise variable (X202) shows that being employed in TS
rather than in MS increases earnings by 9 per cent. This
supports our
earlier finding reported in Tables 7.1 and 7.2 above. This
is not surprising considering the higher effort utilization
rate in TS as compared to MS enterprises (Table 6.6).
For the migrants, the result obtained conforms to a
priori expectation. It shows that migrants earn more than
the natives. This is expected as migration is a self-
selection process towards the direction of greater economic
opportunities relative to areas of origin.
The statistical significance of X523 dummy shows that
social origin in terms of fathers’ educational attainment
influences earnings distribution. Thus, workers whose
fathers are educated up to primary school level have an
earning differential of about 24 per cent relative to off-
springs of fathers without formal education. One is however
surprised regarding the non-significance of the other two
education dummies: X523 and X524 i.e. fathers with
secondary education and those with post-secondary education
respectively.
With respect to the quality of training received and
earnings distribution, it is observed that quality of
178

training exerts fairly high and positive influence on
earnings distribution. Relative to those trained by the
age-old apprenticeship system, those trained on-the-job in
the formal private sector earn considerably more.
Similarly, other modes of training contribute more to
earning than the apprenticeship system; but the formal-
sector training (private or public), positively affects
earnings most. This is not surprising as formal sector
trainees and workers have access to more advance capital
equipment and other better training facilities as compared
to those in the formal sector. Such superior training
cannot but enhance productivity potentials and hence,
earnings.
Other socio-demographic variables included in the
model do not have statistically significant impact on
earnings distribution. Nevertheless, the model has been
able to explain 42 per cent of variations in earnings
distribution of urban labour force in Ibadan. It is,
however, interesting to note that for these group of
workers, human capital variables (experience, education,
quality of training, migration status) as well as
institutional variables (sector of employment) are
important determinants of earnings distribution.
7.2: OCCUPATIONAL AND STATUS MOBILITY OF URBAN INFORMALLABOUR FORCE
179
The employment history as well as earning analysis of
our respondents, are used to examine the potentials of
informal employment in providing social and occupational
mobility. Such mobility is inherent in formal sector
employment through seniority and promotion possibilities;
as well as inter-occupational movements by workers.
For our entire sample (462 respondents), 56 per cent
in their first employment while the rest had done at least
one other job before. For the subsample of informal sector
workers (351), 54 per cent are on their first job, while
the rest had done at least one other job before current
employment. Disaggregated by status in current employment ,
44 percent of the self-employed and 47 per cent of the
employees had held at least one job prior to current
employment.
Apart from the number of jobs ever held prior to the
time of our survey, status mobility is another interesting
phenomenon that this study seeks to examine. Change in
status from, say, journeyman to self employed or from
casual work to either employee or self-employed is
beneficial to the worker as this implies enhanced status
and earnings. However, those that moved down the ladder
from, say, self-employed to say casual job are likely to be
reported by our data. This situation is not unlikely to
exist in the informal sector. It is assumed that our
inability to capture such cases will not invalidate our
result.
180

Of the informal labour force that have done at least
one other job before embarking on current employment, 79
per cent are currently self employed while the rest are
employees. As shown in Table 7.4, majority of the workers
are on their second job (100 out of 156 or 64 per cent) and
this is more pronounced among the employees
TABLE 7.4: PERCENTAGE DISTRIBUTION OF INFORMAL SECTOR LABOUR
FORCE ACCORDING TO JOB HISTORY
SN. NUMBER OF JOB HISTORIESCURRENT STATUS OF RESPONDENT
(PERCENTAGE)SELF EMPLOYED EMPLOYEE NUMBER
1. One Previous Job 63 67 1002. Two Previous Jobs 27 27 423. Three Previous Jobs 7 6 104. Four and above 3 0 4TOTAL (%)Actual Number (N)
79123
2933
-156
Source: Author’s Field Survey.
(67 per cent) as compared to the self employed (63 per
cent). For the employees, none had held up to five jobs
altogether and for the self employed only 3 per cent are in
this group.
Our analysis is thus made up of (a) 4 people who had
four or more previous job experiences and these are the
self-employed; (b) 10 persons who had three; (c) 42 person
who had two; and (d) 100 persons who had one such
experience before getting employed in present job. For the
rest 195 of our NFS sample, current employment is their
first job. This to some extent, is an indication of
181

occupational mobility in the urban informal manufacturing
and technical services in Ibadan.
In terms of status mobility, Table 7.5 shows that 58
per cent of the current self-employed were employees in
their preceding job; 20 per cent were in casual, and 6 per
cent each in domestic category of jobs respectively. This
result suggests an indication of self – improvement and
upward social mobility since change of employment status
from employee to self-employed implies higher current
income and better future prospects in the informal economy
(see tables 7.1 and 7.2).
It should be remarked, however, that 10 per cent of
those currently self-employed did not change their status
and these are predominant in TS (75 per cent) relative to
MS (25 per cent) enterprises.
182
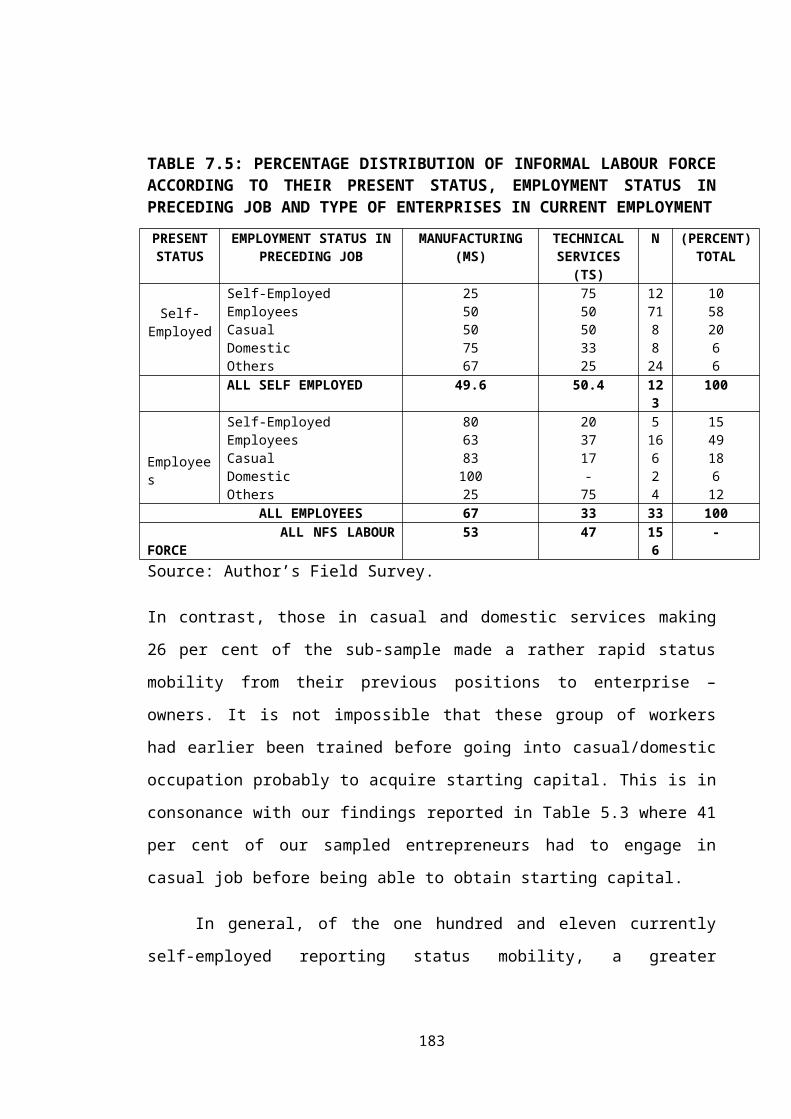
TABLE 7.5: PERCENTAGE DISTRIBUTION OF INFORMAL LABOUR FORCEACCORDING TO THEIR PRESENT STATUS, EMPLOYMENT STATUS INPRECEDING JOB AND TYPE OF ENTERPRISES IN CURRENT EMPLOYMENTPRESENTSTATUS
EMPLOYMENT STATUS INPRECEDING JOB
MANUFACTURING(MS)
TECHNICALSERVICES(TS)
N (PERCENT)TOTAL
Self-Employed
Self-EmployedEmployeesCasualDomesticOthers
2550507567
7550503325
12718824
10582066
ALL SELF EMPLOYED 49.6 50.4 123
100
Employees
Self-EmployedEmployeesCasualDomesticOthers
80638310025
203717-75
516624
154918612
ALL EMPLOYEES 67 33 33 100 ALL NFS LABOURFORCE
53 47 156
-
Source: Author’s Field Survey.
In contrast, those in casual and domestic services making
26 per cent of the sub-sample made a rather rapid status
mobility from their previous positions to enterprise –
owners. It is not impossible that these group of workers
had earlier been trained before going into casual/domestic
occupation probably to acquire starting capital. This is in
consonance with our findings reported in Table 5.3 where 41
per cent of our sampled entrepreneurs had to engage in
casual job before being able to obtain starting capital.
In general, of the one hundred and eleven currently
self-employed reporting status mobility, a greater
183

proportion (52 per cent) are from the manufacturing while
the rest (48 per cent) are from the Technical Services.
Of those that are currently employed in the MATS
subsector of urban informal sector of Ibadan, 24 per cent
reported an enhancement of status from casual and domestic
jobs to informal sector employee status. All the previous
domestic workers are in the manufacturing enterprises,
while 83 per cent of casual workers in preceding job are in
the same industry. For these workers, manufacturing, rather
than Technical Service industry offer a better scope for
upward status mobility.
It is, however, surprising that while 49 per cent of
those in employee category reported no change of status, 15
per cent actually suffered status retrogression from self-
employed to employee status. Of the latter, about four-
fifths are in the manufacturing while the rest are in the
Technical Services enterprises. Also, those reporting no
change in status are predominant in manufacturing (63 per
cent); while the sector is also responsible for the
majority of those reporting status enhancements.
As stated earlier, for those fully commitment to the
informal sector employment, status mobility from employee
to self-employed is the focus. This view gains additional
impetus when years of labour market experience is cross-
tabulated with employment status. This is shown in Table
7.6. it provides an indirect measurement of upward social
mobility over time.
184

Evidences from the table suggest that the chance of
moving from employee to self-employed status increases with
experience in the NFS of urban labour market. For those in
the one to six years in the MATS of Ibadan, 63 per cent are
self employed while the rest are employees. Those in the
self-employed category increased to 87 per cent and 94 per
cent as labour market experience increases from 7 – 15
years to 16 years and over, respectively.
TABLE 7.6: PERCENTAGE DISTRIBUTION OF INFORMAL LABOUR FORCEBY CURRENT EMPLOYMENT STATUS, AND LABOUR MARKET EXPERIENCE YEAR OF EXPERIENCE TOTAL SELF-EMPLOYED EMPLOYEES TOTAL1 – 67 – 1516 and Above
100100100
638794
37136
404020
Total Sample (N=156)
79 21 100
Source: Author’s Field Survey
Such enhanced status as experience increases becomes
reasonable when it is realized that after training, there
is little or no barrier to self-employment status. The
single most important requisite for entry is the starting
capital and probably, some experience on-the-job. Thus, as
post-apprentice experience increases, the required capital
and experience are acquired towards establishing own
enterprises. As noted earlier, the tendency towards self-
employment is likely to be high since self-employment
guarantees both freedom (associated with owning an
enterprise) and enhanced earnings.
Table 7.7 provides chronological average monthly
earnings in preceding and present jobs for those currently
185

in self-employment. The table shows that money income in
preceding job is lower than present one. This suggests that
status improvement and upward social mobility are directly
related.
Earnings increased by as high as a factor of about 6.6
for casual workers who are now self-employed; to 2.3 for
those previously in ‘others’ category before being
currently self-employed even for those that were self-
employed in previous employment, earnings increase by a
factor of 5. This shows that apart from change in status,
experience is another factor affecting the level of
earnings as shown previously.
TABLE 7.7: INCOME PROFILE (FROM JOB HISTORY) OF THE SELF-EMPLOYED LABOUR FORCE IN THE INFORMAL SECTORSTATUS IN RECEDING JOB MEAN MONTHLY INCOME (N)
PRECEDING JOB PRESENT JOB 2 ÷ 11 2 3
Self EmployedEmployeeCasualDomesticOthers
1431619363160
759541618259367
5.33.46.64.12.3
Source: Author’s Field Survey
Evidences from Ibadan informal sector for those employed in
MATS subsector, therefore, suggest a significant job and
status mobility between and within occupations
respectively. It is also shown that such mobility results
in enhanced economic welfare.
186

CHAPTER EIGHT
SUMMARY OF FINDINGS AND POLICY RECOMMENDATIONS
8.1 : SUMMARY OF FINDINGS8.1.1: Employment Generation, Skill Development andUtilization in the Urban
Informal Sector
The findings in this study confirm our first two
hypotheses in section 1.3.1 that the informal sector
contributes significantly to employment generation and
skill development. The observed smallness in size 101 of
these enterprises notwithstanding, they have been found to
be important sources of employment and skill formation.
The 544 enterprises sampled engaged a total number of
3, 213 workers. 102 This represents an average of about 6187

workers per enterprise. Twenty percent of these workers are
owners, 11 per cent are employees, 66 per cent are
apprentices while the rest are unpaid family workers. It is
observed that paid employment is not very popular with this
kind of enterprises. This is because enterprise-owners are
primarily motivated towards creating jobs for themselves.
Apart from the owners and employees, our study reveals
a significant preponderance of apprentices among those
engaged in informal manufacturing and technical services
enterprises. These apprentices, more often than not, are
those young school leavers that have revised their previous
unrealistically sanguine labour market expectations after
having failed to secure the desired labour market jobs.
These apprentices have decided to acquire skills and later
set up own enterprises thereby availing themselves of the
perceived employment and income potentials of the urban
informal sector. It is therefore not surprising that 88 per
cent of them have decided to set up own enterprises after
training. Moreover, the fact that the government through
the National Directorate of Employment is involved in
apprentice training programme points to the perceived
potentials of the informal sector regarding its role in
employment generation and skill development for the
burgeoning urban labour force.
188

With respect to skill development, the informal sector
is playing a prominent role. The apprenticeship mode of
training is the most important. About 90 percent of the
entrepreneurs were thus trained in the informal sector
while these masters have themselves trained a total of
2,200 workers since they established their enterprises.
This represents about 4 trained labour force per
enterprise. Like their masters, these trained labour had a
sole desire of creating jobs for themselves after training.
It is not surprising therefore that 61 per cent of them had
establish own enterprises in line with their training and
11 per cent, are working as journeymen with their masters.
The rest are either on formal wage employment, in casual
job to mobilize starting capital, or their current where
about is not known to masters.
Apart from those that had been earlier trained, the
544 enterprises sampled have a total of 2, 119 apprentices
that are currently undergoing training in various aspects
of manufacturing and technical services. Not only do they
take up train apprentices by themselves, many of the
masters are training apprentices for the NDE. This
underscores the importance of these enterprises towards
skill development. However, in terms of skill utilization,
not a very encouraging result was obtained. The mean level
of skill utilization is 64 and 79 per cent using the
income, and hours engaged measures respectively. This
indicates that the level of underemployment lies between 21
and 36 per cent in the sector.189

8.1.2: The Urban Informal Sector: Marginal or Dynamic?
This study confirms our fourth hypothesis that the
sector is dynamic rather than being marginal. It also
points to several factors responsible for dynamism within
the urban informal enterprises. Evidences of dynamism are
summarized below using several key variables relating
either to the enterprises or the operators.
Earning of Urban Informal Sector Labour Force
In terms of earnings, informal sector operators
compare favourably with their formal sectors counterparts.
This is because majority of the informal workers earn more
than the government minimum wage.
About 61 per cent of the sampled informal sector
workers earn more than N200.00 per month; while comparative
figure for our sampled formal sector workers is 88
per cent. For all categories of workers (formal or
informal), the modal income group is N201 to N500 per
month. However, for the informal sector workers, the means
monthly income is N430.00 while it is N583.00 for the
formal sector workers. Among the informal labour force, it
is observed that the self-employed earn more than the
employees. Each of the two groups earn N461 and N316
respectively on the average per month (Table 7.2).
Evidences presented in Table 7.2 show that 61 per cent
of the informal sector workers enjoy a relatively modest
190

level of the income (above N200 per month) while 16 per
cent can be said to be the marginal group. Those in the
N101 to N200 per month (23%) constitute the intermediate
group.
Earnings analysis using multiple regression approach
shows that the sector of employment (whether formal or
informal), migration status, social origin of respondents
proxied by fathers’ educational attainment, educational
level of respondents, quality of training as well as labour
market experience significantly contribute to earnings
distribution in the urban labour market (Table 7.3).
The Enterprises
Apart from individual earnings of workers, some
striking characteristics of the enterprises also give
indications of dynamism some of which are summarized below.
First, it is observed that most of the enterprises in
our study area are characterized by increasing survival
rate as compared to those in studies carried out in
previous years. For instance while the modal age group of
enterprises in this study is 10 – 15 years, comparative
figure for informal sector enterprise in Lagos is 2 – 5
years.18 For Ibadan in the 1960’s it was 6 – 10 years.7
Second, though the starting capital levels of
enterprises are generally very low, yet enterprises are
able to generate surplus for reinvestment into the
business. This explains why mean capital stock increased to
over N8, 000 per enterprise from the low initial level of
191

about N1, 000 within a period of 11 years which is the mean
age of enterprises. It is therefore not surprising that a
modest capital growth rate of about 11 per cent per annum
on the average is recorded by these informal enterprises.
Third, the number of people engaged in these
enterprises is showing a remarkable increase over time.
While many of these enterprises started as a one-person
business concerns, phenomenal growth has taken place over
time. For all enterprise, the mean annual rate of growth of
people engaged is 8 per cent.
The Entrepreneur
The personal characteristics of the entrepreneur
coupled with his role within the enterprise are major
determining factors of whether the enterprise will be
dynamic or marginal. For instance, his level of education
and commitment to his duties affects the survival as well
as the growth of the enterprise.
For our sampled entrepreneurs, it is observed that the
educational level of operators are moderately increasing as
compared to those in other previous studies in Nigeria. In
Callaway’s study of Ibadan, majority of the entrepreneurs
were in the ‘no schooling’ category. In this study,
however, only 10 per cent of the entrepreneurs had never
attended school, 50 per cent had primary education, 34 per
cent had secondary education and 5 per cent had technical
education.
192

The trend recorded above is also observed among
current apprentices who are the future enterprise owners in
the informal sector. Among them, only 1 per cent had never
attended school, 30 per cent had primary education while
the remaining 69 per cent had at least secondary education.
This trend towards improved formal educational attainment
of informal sector participants is a potent force towards
managerial improvement, hence increased efficiency,
modernization and dynamism of such enterprises over time.
In terms of commitment and job satisfaction of
entrepreneurs and other informal workers, our study shows
that the majority of the workers are strongly committed to
their enterprises. Eight-six per cent of the workforce
(entrepreneurs and other workers) are totally committed to
their jobs and are not considering formal-sector
alternatives. Given such level of commitment, it is thus
not difficult for these workers (especially the
entrepreneurs) to make necessary sacrifice towards the
growth of their businesses. One of such sacrifices is in
term of working long hours, thereby engaging in what Amin
(1981) describes as ‘self-exploitation’ in order to sustain
the enterprise and generate surplus for reinvestment. This
becomes imperative since formal sector credit is, in most
cases, not available for most of the urban informal
enterprises.
Given the above, it is therefore not surprising that a
considerable upward mobility and the resultant enhanced
earnings over time are observed among the workers in the
193
sector. Among the self-employed that have held at least one
other job prior to current employment , 88 per cent
experienced status mobility from employee, casual workers,
domestic servants and other kinds of jobs to self-
employment status. Similar impressive result was obtained
from the employees. Moreover, it was observed that the
scope for upward social mobility increases with the number
of years of labour market experience. These evidences
suggest dynamism of enterprises and operators in the
informal sector of Ibadan.
8.1.3: The Urban Informal Sector: In Transition?
The probabilistic migration model posits that informal
employment is a temporary phenomenon for urban migrants on
their way to formal sector employment. In other words, the
urban informal sector, rather than being a permanent
feature, is considered a temporary staging post to which no
worker is seriously committed since finding the desired
formal sector employment is the goal. By implication, the
informal sector will then cease to exist when the formal
sector is able to generate enough jobs to meet the needs of
urban labour force. Our third hypothesis in section 1.31 is
put forward to test the probabilistic migration thesis. The
result emanating from our study does not uphold the
hypothesis.
Among the informal labour force interviewed for this
study, 86 per cent of operators (workers and owners) and 85
per cent of apprentices view their commitment to informal
194

sector employment as permanent without considering the
formal sector alternative. And surprisingly, as much as 94
per cent of the formal sector employees interviewed in MATS
occupations expressed strong desire of quitting formal
sector jobs to establish own enterprises in the informal
sector. This is premised on the view expressed by majority
(81%) of workers interviewed that informal sector
employment is much more rewarding because, among other
reasons, it guarantees freedom from being controlled by
others as well as pride of owning an enterprise.
Factors that are found to be influencing commitment of
informal sector workers on one hand, and those responsible
for inducing formal sector workers to informal sector
include: level of education attained, social origin of
operators proxied by fathers’ educational attainment,
respondents’ position in the household, level of earnings
per month, previous occupation and reason for entering a
particular sector of employment. The magnitude and
direction of each of these variables are as shown in Table
6.8.
Moreover, as reported in section 8.1.2 above, the
inherent dynamism of the informal sector enterprises in
terms of impressive growth rate of employment and capital,
increasing survival rate, moderately increasing educational
level of operators, technological diffusion as a result of
formal – informal migration of workers, among others, are
factors that will continue to influence the modernization,
195
the scale as well as increasing labour absorption of the
sector. Furthermore, the increasing educational attainment
of operators has the tendency of improving the
organizational techniques, productivity, income and the
capital base (assuming surplus generated are reinvested as
is being done now) of the enterprises. Thus, the transition
possibilities of these informal microenterprises to small-
scale industrial enterprises that are motivated, not only
by self-employment objective, but by investment and
employment objectives will be enhanced. This will increase
the importance of wage employment in the sector.
8.2 : POLICY RECOMMENDATIONS
Our findings suggest that the urban informal workers
are not a disappearing marginal group but a major and
growing element in the urban labour market. It is therefore
relevant to address the implications of these findings for
policy formulation. Policies or support measures are
necessary if the performances of the informal sector
enterprises and their operators are to be improved and
sustained over time.
Employment level in the informal sector varies
directly with income. In this regard, policies aimed at
strengthening formal – informal linkage through subcontract
arrangement as well as direct purchase of goods and
services by government institutions and parastatals from
informal sector enterprises, will increase the level of
196

patronage of these micro-enterprises. This in turn will
increase the level of skill utilization, income and level
of employment. It is also opined that such increased
patronage, has a tendency to increase the standard of goods
produced as the new patrons (government and its agencies)
will be more interested in specifying and enforcing
standards in the sector.
The level of education and quality of on-the-job
training received have positive relationship with the level
of employment and income. As shown in our employment and
earning models, training through the formal sector
contributes more to employment and earnings than informal
apprenticeship form of training. This suggests that for
enhanced personal income as well as greater employment
promotion within enterprises, more formal on-the-job
training should be promoted among current and would-be
informal MATS workers. This has the tendency of enhancing
technological diffusion, better adaptability to change and
improved performance of the informal work force.
In this regard, the efforts of the National
Directorate of Employment (NDE) towards training of
apprentices using the formal and informal sectors is in the
right direction. If encouraged to settle in the formal
sector after training, those trained in the formal
organizations will help diffuse formal technical know-how
through training own apprentices. This diffusion process is
197

expected to be promoted through the multiplier process
within the informal economy.
For masters currently employed in informal MATS
enterprises, as well as those apprentices currently
undergoing informal apprenticeship, their level of skill
and technical know-how could be upgraded through extension
workers’ visit to these enterprises from time to time to
demonstrate to informal operators better methods of doing
their jobs. Moreover, in achieving skill improvement and
technical diffusion, the ‘Mature People’s Scheme’103 of the
NDE could be expanded to include those in paid employment
wanting to opt out (before retirement) of formal employment
to informal jobs but lack the necessary capital. This will
be of particular benefit to many skilled workers in the
MATS category. Our field work shows that 94 per cent of
those interviewed in the formal sector wanted to set-up
informal enterprises but lack the necessary capital.
Encouraging such formal-informal mobility of workers, apart
from promoting skill improvement and technological
diffusion in the formal sector, will create vacancies in
the formal organizations they are leaving. Also those
leaving formal sector employment will create employment for
themselves immediately and later for others.
Another factor that positively influences the level of
employment is the level of present capital. As shown in our
analysis, majority (88%) of the entrepreneurs in the urban
informal sector obtained their initial capital from
informal sources. This is because the formal
198

sources of credit consider them a credit risk as these
entrepreneurs possess no required collaterals. It is not
surprising, therefore, that capital level for these
enterprises are generally very low, especially if compared
with formal sector enterprises.
Therefore, policy measures aimed at allocating greater
credit resource to these enterprises will boost employment
and earnings: in this regard, the newly established
Government Poeples’ Bank can be charged with the
responsibility of mobilizing from, and dispersing credit
among, the organizations of informal sector workers; among
other patrons of the bank. As argued by Oladeji and
Ogunrinola (1990), such arrangement of mobilizing savings
and granting credit through the existing organizations of
craftmen rather than the current practice of using peer
group, will enhance wholesale distribution of credit and
guarantee loan repayment. Such access to loan will widen
capital base and enhance the level of employment, skill
utilization and earnings.
Widening the capital base of informal sector
enterprises has an implication on technology to be adopted
in these organizations. Thus, research institutions should
be encouraged to develop simple, efficient but labour-
intensive technology. Such machines should be affordable,
easy to learn and able to improve product quality. The
resultant effects of increasing product quality and
productivity will lower product prices, widen the market
199

and increase employment opportunities as well as income of
informal sector participants. Moreover, there is a need for
a systematic data-
collation exercise on the urban informal activities. This
will be possible if these enterprises are encouraged to be
registered thus allowing more information necessary for
planning purposes, to be obtained from them.
Having discussed the policy recommendation that will
promote employment and earnings of the urban informal
economy, it will be of relevance to discuss the
implications of promoting the urban informal sector on the
urban environment.
Promotion of employment and earning of urban informal
enterprises has the potential of exacerbating rural-urban
migration. Thus, to avert this outcome, regional
development policies should be geared to the promotion of
economic and social development in the rural areas. Such
areas, if developed, will favour the springing up of non-
farm formal and informal manufacturing and technical
service enterprises. This will reduce the rural-urban
imbalance in economic opportunities and therefore temper
the rate of urban-ward migration and its attendant slum and
squatter settlements in the urban areas.
8.3: PROBLEMS AND LIMITATIONS OF THE STUDY
One single most important problem encountered in the
conduct of this study has to do with data collection. Given
200

the literacy level of our target population, most of them
were suspicious of surveys of this type. They usually
connect it with the government’s attempt at obtaining
information for taxation purpose. However, we succeeded in
allaying such fears entertained by some of the operators
and as such a good number of them cooperated.
Related to the above is the issue of record-keeping by
enterprise-owners from which data could be easily supplied.
Most of our target population either do not bother, or are
not literate enough to keep any systematic record of their
business transactions. As such, they have to rely on their
memory to supply information required. Moreover, given the
secrecy with which income is held among Nigerians, most of
the entrepreneurs that gave information are therefore
likely to have under-reported income level and/or
exaggerated costs.
However, the design of our questionnaire as well as
the training of our enumerators took these problems into
consideration. As such, errors likely to creep into data
collected as a result of these problems were reduced to the
barest minimum.
With respect to limitations of the study, the study
relied on cross-section data. Such data collected at a
point in time did not enable us to know anything about
enterprises that did not succeed and had thus folded up
prior to our survey. This is a limitation to our study as
factors affecting failures of such enterprises could not be
examined. A probable solution to this would have been to
201

embark on a longitudinal survey of selected enterprises
over a given period. However, given the time and fund
available for this study, such approach was not possible.
8.4 AREAS FOR FURTHER RESEARCH
The urban informal sector is vast but suffers
considerable neglect in terms of research. For example, our
study covers two out of about five industrial groups within
the sector. Thus,
enterprises in Trade, Building and Construction, and
Transport were not covered in this study and these also
need adequate study. Further research efforts into factors
determining the direction of growth – vertical or
horizontal – as well as the technological and employment
implications of such growth are of crucial importance.
Also, the policy environment in which the informal sector
participants operate, and their adjustments to these
policies require research attentions. Moreover, the role of
women in the sector needs be studied to examine their
contributions to development within the urban labour
market, given their numerical importance especially in the
trading subsector of the urban informal economy.
202

BIBLOGRAPHY
Adepoju, A. (1975): “Non-formal vocational Training in the
Small-scale Industrial Sector: Its Implications for
Manpower Needs in Nigeria”. Labour Supply and
Utilization in West Africa, Vol. 11 (Ghana, Institute
of Statistical and Economic Research, University of
Ghana).
_________ (1983): ‘Selected Studies on the Dynamics, Patterns and
Consequencies of Migration in Medium-sized Towns in Nigeria: Research
and Policy Prospects’ UNESCO.
203

Adeyemi J. O. (1984): Evaluating Programmes for Meeting the Training
Needs for the Informal Sector of the Nigerian Economy; An
Unpublished M. Phil. Thesis, University of Lagos,
Nigeria.
Agarwala, A.N. and Singh, S.P. (eds) (1973): The Economics of
Under-development; Oxford University Press.
Akintola, P. A. (1963): “The Ibadan Region”, Nigerian
Geographical Journal. Vol. 6, pp. 102 – 15.
Alonzo, R. P. (1979): ‘Employment and Earnings among
College Graduates’. The
Philippine Economic Journal, Vol. XVIII; No. 3, pp. 187 –
227.
Aluko, S. A. (1966): “The Educated in Business: The Calabar
Home Farm – A Case Study”. Nigerian Journal of Economics and
Social Studies, Vol. 8, No. 2, July.
Aluko, S. A.: Oguntoye, A. O.; and Afonja, Y. A. (eds)
(1972): Small-scale Industries: Western State of Nigeria; The
Industrial Research Unit, Dept. of Economics,
University of Ife, Ile-Ife.
Amin, Nurul (1981): ‘Marginalization Vs. Dynamism: A study
of the Informal sector in Dhaka City’. Bangladesh
Development Studies. Vol. IX, No. 4
Atkinson, B. A. (1984): The Economics of Inequality, Clarendon
Press, Oxford.
Ayeni, B. (1982): ‘The Metropolitan Areas of Ibadan: Its
Growth and Structure’ in Filani, M. O. (ed.): Ibadan
Region, Department of Geography, University of Ibadan.
204

Bardoville, R. (1981): “The Sexual Division of Labour in
the Urban Informal Sector: The Case of Some Townships
in Lusaka”. African Social Research, No. 32, pp. 29 – 54.
Barnerjee, B. (1983): ‘The role of the informal sector in
the migration process: A test of the probabilistic
migration models and labour market segmentation for
India: Oxford Economic Papers. Vol. 35, pp. 399 – 422.
Barro, R. J. and Grossman, H. I. (1971): ‘A General
Disequilibrum Model of income and Employment’. American
Economic Review. Vol. 61.
Berg, E. J. (1965): “The Development of a Labour Force in
Sub-Saharan Africa”. Economic Development and Cultural
Change, Vol. XVIII, No. 4, Part 1, July.
Berry, A. and Sabot, R. H. (1978): “Labour Market
Performance in Developing Countries: A Survey”. World
Development, Vol. 6.
Berry, A. (1984): “Unemployment and Economic Development”,
Economic Development and Cultural Change, Vol. 33, pp. 99 –
116.
Bienefeld, M. A. (1975): “The informal Sector and
peripheral capitalism: The Case of Tanzania”, IDS
Bulletin, Vol. 6. No. 3, pp. 53 – 73.
Bienen H. and Diejomaoh, V. P. (eds) (1981): The Political
Economy of Income Distribution in Nigeria, New York, Holmes &
Meier.
Birbeck, C. (1978): ‘Self-employed Proletarians in an
informal factory: The case of Cali’s Garbage dump’
World Development. Vol. 6.
205

Birch, D. (1983): ‘The contribution of small enterprise to growth and
employment’. New Opportunities for Entrepreneurship
Symposium.
Bishop, J. H. (undated): ‘American Job Growth: What
explains it?’ Portfolio: International Economic Perspectives,
Vol. 12, Issue 4.
Blaug, M., Layard, R. and Woodhall, M.: (1969): The
Causes of Graduate Unemployment in India, London,
Penguin Books.
Blaug, M. (1970): An Introduction to the Economic of Education;
Penguin Books.
______ (1974a): Education and Employment Problem in the Developing
Countries. International Labour Organization, Geneva.
Blaug, M. (1974b): “An Economic Analysis of Personal
Earnings in Thailand”. Economic Development and Cultural
Change. Vol. 23.
Bodkin, R. G. (1969): ‘Real Wages and Cyclical Variations
in Employment: A re-examination of the Evidence’.
Canadian Journal of Economics, Vol. 2, August, pp. 353
– 74.
Bose, A. N. (1974): The Informal Sector in the Calcutta Metropolitan
Economy. Working Paper of World Employment Programme,
I.L.O. Geneva.
Bowers, D. and Beird, R. N. (1971): Elementary Mathematical-
Macroeconomics, Englewood Cliff, N. Jersey: Prentice
Hall, p. 199.
206

Bromley, Ray (1978a): “The urban Informal Sector: Why is it
Worth Discussing?” World Development. Vol. 6, pp. 1033 –
1039.
Bromley, Ray (1978b): “Organization, Regulation and
Exploitation in the so-called ‘Urban Informal Sector:
The Street Traders of Cali, Colombia”. World
Development. Vol. 6, pp. 1161 – 1172.
Bromley and Gerry (eds) (1979): Casual work and Poverty, in Third
World Cities, Wiley, New York.
Browne, Orde (1977): “Moral Effects of Wage-Earning and the
Africans” in Konczacki Z. A. and Konczacki, J. M.
(eds). An Economic History of Tropical African. Vol. 2; Frank
Cass.
Callaway, A. (1964): ‘Nigeria’s indigenous education: The
Apprentice System’: ODU, Journal of West African Studies, Vol
1, No. 1.
______ (1965): ‘From Traditional Crafts to Modern
Industries’. ODU, Journal of West African Studies, Vol 2, No. 1.
______ (1973): Nigerian Enterprise and the Employment of Youths: A study
of 225 Businesses in Ibadan, NISER, and Ibadan.
_______ (1979): The Urban Informal Sector; Paper Presented
at the National Conference on Manpower Constraints to
Nigeria’s Economic Development, 29 January to 1
February.
Davies, Rob (1979): ‘Informal Sector or Subordinate mode of Production?
A Model’ in Bromley and Gerry (eds.) (1979) op. cit.
de Briey, P. (1955): “The Productivity of African Labour”.
International Labour Review. Vol. 72.
207

de Navarrete, A. Jr.; and de Navarrete I. M. (1953):
“Under-Employment in Underdeveloped Economies”.
International Economic Papers, No. 3, London, p. 235.
Fajana, O. (1981): Aspects of Income Distribution in the
Nigeria Urban Sector in Bienem, H. and Diejomaoh, V.
P. eds. Op. cit.
Fapohunda, J. (1985): The Informal Sector of Lagos, University
Press Ltd., Ibadan.
Farooq J; Farooq, M.; and Adepoju, A. (1976):’
Characteristics and Employment Generation of Small
scale industries in Western Nigeria’. Pakistan
Development Review. Vol. XV, No. 4, Winter.
Federal Office of Statistics (1980): Industrial Survey 1980 – 83;
F.O.S., Lagos.
Federal Republic of Nigeria: Second, Third and Fourth
Development Plans; 1970, 1975 and 1981 respectively.
Fields, G. S. (1975): “The Private Demand for Education in
Relation to Labour Market Condition in Less- Developed
Countries”. Economic Journal, pp. 906 – 924.
Filani, M. O. (1982): Ibadan Region: Department of Geography
(for the 25th Annual Conference and Silver Jubilee of
the Nigerian Geographical Association), University of
Ibadan.
Fowler, D. A. (1984): “The Informal Sector in Freetown:
Opportunities for Self-employment” in S. V. Sethuramon
(ed.) The Urban informal sector in Developing Countries.
International Labour Office, Geneva.
208

Frank, C. R. (1968): Urban Unemployment and Economic Growth in
Africa. Yale Economic Growth Centre, Paper No. 120, New
Haven.
Geary, P. I. and J. Kenna: (1982) ‘The employment real wage
relationship: An international Study’. Journal of Political
Economy. Vol. 90.
Gerry, C. (1978): ‘Petty Production and Capitalist
Production in Dakar: The crises of the self-employed’.
World Development. Vol. 6.
Glaser, T. (1989): “Small and Medium Sized Enterprises”.
The Courier. No. 115, p. 57.
Gugler, J. (1982): “Over urbanization Reconsidered”.
Economic Development and Cultural Change. Vol. 31 No. 1, pp.
173 – 189.
Guisinger, S. and Irfan, M. (1980): ‘Pakistan’s Informal
Sector’. The Journal of Development Studies. Vol. 16, pp. 412
– 426.
Harberger, A. C. (1971): ‘On measuring the social
opportunity cost of Labour’. International Labour Review.
Vol. 103, pp. 559 – 579.
Harris, J.R. and Todaro, M.B. (1970): ‘Migration,
Unemployment and Development: A Two-sector Analysis’
American Economic Review. Vol. 60, pp. 126 – 42.
Hart, K. (1973): ‘Informal Income Opportunities and urban
Employment in Ghana’ Journal of Modern African Studies. Vol.
11, No. 1, pp. 61 – 89.
209

Haque, N. U. (1977): ‘An Economic Analysis of Personal
Earnings in Rawalpindi City’. Pakistan Development Review.
Vol. XVI, No. 4.
Herman, T. (1956): “The Role of Cottage and Small-Scale
Industries in Asian Economies Development”. Economic
Development And Cultural Change. Vol. 4, pp. 356 – 370.
Hofmann, M. (1986): “The Informal Sector in an Intermediate
City: A Case in Egypt”. Economic Development And Cultural
Change. Vol. 4, pp. 263 – 277.
House, W. J. (1981): Redistribution, Consumer Demand and
Employment in Kenyan Furniture-making’. Journal of
Development Studies. Vol. 17, pp.336 – 356.
House, W. J. (1984): ‘Nairobi’s Informal Sector: Dynamic
Entrepreneurs or surplus labour’. Economic Development
and Cultural Change’. Vol. 32, No. 2.
Hughes, J. J and Perlman, R. (1984): The Economics of
Unemployment. Harvester Press.
I.L.O. (1972): Employment, Income and Equality in Kenya,
International Labour Office, Geneva.
Icamina P. (1988): “Rich Crafts, Poor Returns”. IDRC
Reports Vol. 17, No. 2.
Irvin, Ricky (1978): Labour Employment Generation in Small and Large
Hybrid Corn Farms in Southern Oklahoma. (Graduate Seminar,
Department of Economics, Oklahoma State University,
U.S.A.).
Jhingan, M. L. (1984): The Economics of Development and Planning,
Vikas Publishing House.
210

Jolly, R.; Dekadt, E.;Singer, H. and Wilson, F. (1975):
Third World Employment, Penguin.
Joshi, H. and Joshi V.; (1976): Surplus Labour and the City. Delhi
Oxford University Press.
Joshi, H. and Lubell, H.; and Mouly, J.; (1976): Abijan:
Urban Development and Employment in Ivory Coast; I.L.O. Geneva.
Jurado, M. G.: Alonzo, R. P.; Caulas, D. B.; Ferrer, R. D.;
Tidalgo, R.L.P.; Armas. A. A.; and Castro, J. S.
(1984): “The Manila Informal Sector: In Transition? In Sethuraman
S.V. (ed.). op. cit.
Kannappan, S. (1985): “Urban Employment and the Labour
Market in Developming Nations”. Economic Development
and Cultural Change, Vol. 33, pp. 699 – 730.
Kilby P. (1969): Industrialiazation In An Open Economy:
Nigeria 1945 – 1966. Cambridge University Press.
Kritz, E. and Ramos, J. (1976): “The Measurement of Urban
Underemployment: A Report on three experimental
surveys. International Labour Review. Vol. 113, No 1, Jan. –
Feb. pp. 115-127.
Kuh, E. (1966): ‘Unemployment, Production Functions, and
Effective Demand‘, Journal of Political Economy, Vol. 74, No.
3.
Liedholm, C. and Mead, D., (1988): ‘Small-scale
enterprises: A Profile’. Economic Impact: A Quarterly Review of
World Economics. No. 63, pp. 12 – 17.
Livingstone, I. (1980): ‘Alternative Approaches to small
industry Promotion: Tanzania, Kenya and Botswana’.
211
Discussion Paper ‘No. 62 of the School of Development
Studies, University of Sussex.
Mabogunje, A. L. and Filani, M. O. (1984): “The informal
sector in a small city: The case of Kano. In
Sethuraman, S. V. (1984): “The urban Informal sector
in Developing Countries, International Labour Office,
and Geneva.
Maisch, J. P. (1985): “Peruis Hidden Job Pool”. IDRC Report
Vol. 17, No. 2.
Maunder, W. F. (1960): Employment in an Underdeveloped
Area; New Haven: Yale University Press.
Mazundar, D. (1976): ‘The urban Informal sector’. World
Development. Vol. 4, No. 8, pp.
_______ (1983): ‘Segmented Labour Markets in LDCS’ American
Economic Review, Vol. 73, No. 2, May, pp. 254
– 59.
Maazundar, D.; and Ahmed, M. (1978): Labour Market Segmentation
And the Determination of Earnings: A Case Study. World Bank,
Washington D. C.
Meier, G. M. (1989): Leading Issues in Economic Development
Oxford University Press.
Merrick, T. W. (1979): ‘Employment and Earnings in the
Informal sector in Brazil: The case of Belo
Horizonte’. Journal of Developing Areas, Vol. 10.
Mincer, J. (1970): The Distribution of Labour Incomes: A
Survey”. Journal of
Economic Literature. Vol. 8
212

Miracle M. P. and Fetter, B. (1970): “Backword-Slopping
Labour – Supply Functions and African Economic
Behavior”. Economic Development and Cultural Change. Vol. 18,
No. 2.
Mitra, L. K. (1967): “Employment and Output in small enterprises of
India; Bookland Ltd., India.
Morgan, D. (1989): “Micro-Enterprises and Their Role in the
Development Process”. The Courier, No. 115, pp. 77 – 79.
Moser, C. O. N. (1978): ‘Informal sector or petty commodity
production: Dualism or dependence in urban
development?’ World Development. Vol. 6.
Myrdall, Gunnar (1968): Asian Drama. Pantheon, New York,
Vols. 1, 11 and 111.
Ndebbio, J. E. U. (1987): “Employment Generation and the
size of Industries in Nigeria”. The Case of Cross
River State”. The Nigerian Journal of Economic and Social Studies.
Vol. 29, No. 2, pp. 149 – 168.
Neftci, S. N. (1978): ‘A Time-series analysis of the real
wages-employment relationship’. Journal of Political Economy.
Vol. 86.
Nihan, G.; Demol, E. and Jondoh C. (1979): “The Modern
Informal Sector in Lome”. International Labour Review Vol.
118, No. 5, pp. 631 – 644.
Nihan, G.; and Jourdain, R. (1979): “The Modern Informal
Sector in Nouakchott”. International Labour Review Vol. 117,
No. 6, pp. 709 – 719.
Nurkse, Ragnar (1953): Problems of Capital Formation in
Underdeveloped Countries, Basil Blackwell, Oxford.
213

Oberai, A. S. and Singh, H. K. (1984): “Migration,
Employment and Urban Labour Market: A Study in the
Indian Punjab”. International Labour Review, Vol. 12, No.
4, pp. 507 – 523.
Okowa, W. J. (1987): “Urban Bias in Nigerian Development
Planning”. Nigerian Journal of Economic and Social Studies. Vol.
29, No. 1, pp. 47 – 59.
Oladeji, S. I. (1990): Educated Unemployment in the Less
Developed Countries: The Relevance of the Neo-
Classical Framework and Policy Option to the Nigerian
Experience. Indian Journal of Labour Economics, Vol. 33. No.
2, pp. 119 – 131.
Oladeji, S. I. and Ogunrinola, I. O. (1990): Informal
Savings/Credit and Economic Development: A study of Savings Habit and
Utilization in South-Western Part of Nigeria; Final Report on Ford
Foundation Research Project of the Social Science
Council of Nigeria.
Olaloye, A. O. (1978): ‘Technology Transfer and Employment
in Nigerian Manufacturing Industries’. The quarterly
Journal of Administration. Vol. XII, No. 2, January.
________ (1980): “Manpower Absorption in Nigeria
Manufacturing Industries’. Ife Social Sciences Review. Vol.
3, No. 2, pp. 26 – 36.
Olaloye, A. O. (1989): ‘Employment Growth in Nigerian
Manufacturing Industries’ (mimeo), Dept. of Economics,
O. A. U., Ife.
Onyemelukwe, J. O. C. (1982): “Industries in Ibadan: A State of
knowledge Survey”, in Filani M. O. (ed.) (op. cit).
214
Parameswaran, P. (1988): “Age-Old Craftmanship Responds to
Market Demand”. IDRC Reports. Vol. 17, No. 2.
Perkins, D. (1977): ‘Rural Small-scale industry in the People’s Republic
of China, University of California Press, Los Angeles.
Persaud, V. (1989): ‘Entrepreneurship Need Not is a Problem
in Africa”. The Courier, No. 115, pp. 61 – 63.
Population Reports (1983): Migration, Population Growth, and
Development, the Population Information Program, The
John Hopkins University, U.S.A
Prais, S. J. (1953): Estimation of Equivalent Adult Scales
From Family Budgets”, Economic Journal. Vol. LXIII.
Pyndick, R. S. and Rubinfeld (1985): Econometric Models and
Economic Forests, McGraw-Hill, Second Edition.
Robinson, Joan (1936): “Disguised Unemployment”. Economic
Journal, Vol. XXXXVI, pp. 225 – 237.
_______ (1947): Essays in the Theory of Employment; Basil
Blackwell; Oxford.
Rosenstein-Rodan, P. N. (1957): “Disguised Unemployment and
Underemployment in Agriculture”. Monthly Bulletin of
Agricultural Economics and Statistics, F. A. O., Rome
Vol. VI, No. 7/8, July/August.
Sabot, R. H. (1977): “The Meaning and Measurement of Urban
Surplus Labour”. Oxford Economic Papers, Vol. 29, pp. 389
– 411.
Sabot, R. H. (1979): Economic Development and Urban Migration in
Tanzania 1900 – 1971. Clarendon Press, Oxford.
215

Sargent, T. J. (1978): ‘Estimation of dynamic Labour demand
schedules under rational expectations. Journal of Political
Economy’, Vol. 86.
Schmitz, H. (1982): “Growth Constraints on Small-scale
manufacturing in Developing Countries: A Critical
Review”. World Development, Vol. 10, No. 6, June.
Scott, E. P. (1985): “Lusaka’s Informal Sector in National
Economic Development”. The Journal of Developing Areas. Vol.
20, No. 1, October pp. 71 – 99.
Sen, A. K. (1960): “Choice of Techniques. Basil Blackwell,
Oxford.
Sethuraman, S. V. (1976): “The Urban Informal Sector:
Concept Measurement and Policy”: International Labour
Review. July – August.
_______ (1977): “The Urban Informal Sector in Africa”.
International Labour Review. Vol. 116, No. 3.
Sethuraman, S. V. (1984): The Urban Informal Sector in
Developing Countries. International Labour Office,
Geneva.
_____ (1985): “The Informal Sector in Indonesia:
Policies and Prospects”. International Labour Review. Vol.
124, No. 6, pp.
Sigurdson, J. (1973): ‘Rural Industry and the Internal
Transfer of Technology in China’. Paper presented at a
Conference held on 17 – 23 September, 1972. School of
Oriental and African Studies, University of London.
216

Singh, S. P. (1977): “Some Guidelines on the Use of Dummy
Variables in Regression Models”. Indian Journal of
Economics, Vol. LVII, pp. 277 – 283.
Souza, V.; Neto, G. and De Araujo, P. (1988): “Employment
Implications of Informal Sector Policies: A Case Study
of Greater Recife”. International Labour Review. Vol. 127, No.
2, pp. 243 – 258.
Speare, A. Jr.; Harris, J.; (1986): “Education, Earnings,
and Migration in Indonesia”. Economic Development And
Cultural Change, Vol. 34, No. 2, pp. 223 – 244.
Staley, E. and Morse, R. (1965): Modern Small Industry for
Developing Countries. McGraw-Hill.
Standing, Guy (1981): “The Notion of Voluntary
Unemployment”. International Labour Review. Vol. 120, No. 5,
pp. 563 – 579.
Standing, Guy (1983): “The Notion of Structural
Unemployment”. International Labour Review. Vol. 122, No. 2,
pp. 137 – 153.
Stark, Oded (1982): “Research on Rural-Urban Migration in
LDCs: The Confusion frontier and Why we should Pause
to Rethink Afresh”. World Development, Vol. 10, pp. 63
– 70.
Steel, W. F. and Takagi, Y. (1983): ‘Small enterprise
Development and the employment – output trade-off’.
Oxford Economic Papers. Vol. 35, pp. 423 – 446.
Stuvel, G. and James, S. F. (1950): “Household Expenditure
on Food in Holland”, Journal of the Royal Statistical
Society. A., Vol. 113.
217

Thirlwall, A. P. (1986): Growth and Development, English
Language Book Society and Macmillian.
Todaro, M. P. (1969): ‘A model of Labour migration and
urban unemployment in less developed countries:’
American Economic Review. Vol. 59, No. 1, March.
_______ (1989): Economic Development in the Third World. Longman.
Tokman, V. E. (1978): “An Exploration Into the Nature of
Informal-Formal Sector Relationships”. World Development
Vol. 6, pp. 1065 – 1076.
Udall, A. T. (1976): “The Effects of Rapid Increases in
Labour Supply on Service Employment in Development
Countries”. Economic Development and Cultural Change,
Vol. 14, pp. 765 – 785.
Udall, A. T. and Sinclair, S. (1982): “The Luxury
Unemployment Hypothesis: A Review of Recent Evidence”.
World Development. Vol. 10, No. 1.
Uppal, J. S. (1973): Disguised Unemployment in An Under development
Economy: Its Nature and Measurement, Asia Publishing House,
London.
United Nations, Department of Economic Affairs (1951);
Measures for the Economic Development of
Underdeveloped Countries. Report by a group of Experts
Appointed by the Secretary General of the United
Nations), New York.
Waldorf, S. T. and Waldorf, W. H. (1983): Earnings of Self-
Employment in an Informal Sector. A Case Study of
Bangkok. Economic Development and Cultural Change.
Vol. 31, No. 2.
218

Wasilewski, A. (1988): “Fair share denied”. IDRC Reports
Vol. 17, No. 2.
Weeks, J. (1971): “Does Unemployment Matter?”. Manpower and
Unemployment Research Areas Studies, Montreal, Vol. 4,
No. 1.
___________ (1975): “Policies for Expanding Employment in
the Informal Sector of Developing Countries”.
International Labour Review, Vol. 111, pp. 1 – 13.
APPENDIX A
OBAFEMI AWOLOWO UNIVERSITY, ILE-IFE
DEPARTMENT OF ECONOMICS
SURVEY OF INFORMAL SECTOR ENTERPRISES IN IBADAN
Dear Respondent,
This research questionnaire aims at obtaining
information regarding your enterprises for the purpose of219

private academic research in the Department of Economics of
Obafemi Awolowo University, Ile-Ife.
We appreciate the contributions of businesses like
yours to the Nigerian economy and as such we intend to
research into these firms with the aim of coming up with
policy measures that will enhance the survival and growth
of such firms especially in an austere time like this.
We want to assure you that the work has nothing to do
with the government and/or taxation and as such we will
treat all information obtained with the strictest
confidence.
We sincerely appreciate your cooperation. Thank you.
‘Ranti Ogunrinola,Research Co-ordinator
1. Nature of business (e.g. Carpentry, Barbing, Clerical,
Teaching) ……………………
2. Location/Address: .……………………………………………………………………
3. Status of Respondent:
(i) Owner ………………………………………………………………………
(ii) Worker (Paid Employees)…………………………………………………..
(iii) Apprentice ………………………………………………………………….
(iv) Journeyman …………………………………………………………………
(v) Unpaid Family Worker ……………………………………………………..
220

4. Type of Workshop:
(i) Open sky ……………………………………………………………………
(ii) Open shed ……………………………………………………………………
(iii) Rented shop …………………………………………………………………
(iv) Part of Owner’s rented apartment
………………………………………….
(v) Owner’s premises …………………………………………………………..
(vi) Uncompleted building by the roadside
…………………………………….
(vii) Others ………………………………………………………………………
5. What year was this business established? …………State
number of years …
6. What is the form of business organization?
(i) Sole Proprietorship ………………………………………
(ii) Partnership ………………………………………………
(iii) Family-Owned …………………………………………
(iv) Registered private company……………………………
(v) Others ………………………………………
7. Does this workshop have Yes
No
(i) Electricity/Electric Machine ........
………..
(ii) Water supply ………..
…………
(iv) Telephone ……….. …………
8. Kindly state number of personnel in this enterprise.
Number Number whenNow Established
221

(i) Owners ………………………. ………………………..
(ii) Employees ………………………. ………………………..
(iii) Journeymen ………………………. …………………………
(iv) Apprentices ………………………. ………………………..
(v) Unpaid family workers……………………… ………………………..
9. Kindly state the number of personnel having the
following education:
Owners Paid Journeymen Apprentices Unpaid Family
Employees Workers
a. No. schooling
b. Below full Primary
c. Full Primary
d. Below full secondary
e. Full secondary
f. Technical/Vocational
g. First Degree/HND
h. Others (Specify)
10. Number of hours enterprise opens for work per day
…………………………………
11. On the average, how many hours is the business fully
engaged per day?
(i) Last week ………………………………………………………………………
(ii) In time of high demand ………………………………………………………
(iii) In time of low demand …………………………………………………………222

12. When having low demand, what does the workers do?
…………………………………………………………………………
13. If workers do other jobs, how much per week is
realized? ………………………………………………..
14. Please state mode of vocational training of workers.
NUMBER OF Owners Paid
Journeymen Employees
a. Trained by informal sector masters
Sector masters
b. Trained by the N.D.E.
Trained by private firms e.g. U.T.C.
c. Public Service trained
d. Trained in the Technical School
e. Others (Specify)
15. Please state number of workers in the following age-group:
Owners Paid Journeymen Apprentices
Family
a.
Less than 15 years
b.
15 – 19 years
c.
20 – 24 years
d.
25 – 29 years
e.
30 – 34 years
223

f.
35 – 44 years
g.
45 – 49 years
h.
50 years and above
16. Since established, how many apprentices had this establishment trained? …
17. How many of these were trained for NDE? ……………………………And how many are still being trained for NDE? ………………………………
18. Please, state placement of ex-apprenticesNumber
(i) Started own business…………..
(ii) With master as employee/Journeymen…………..
(iii) Looking for job…………..
(iv) With other masters as employee/journeyman…………..
(v) In formal sector employment e.g. government,Private firms, etc.
…………..(vi) Places unknown
…………..19. (a) With how much capital was this business
established? .................(b) Express initial capital in current prices?
20. Please state how such initial capital was obtained?(i) Gift from friends/relatives …………………………………………..(ii) Own Savings …………… State savings mode ……………………….(iii) Loan from friends/relatives …………………………………………….(iv) Loan from Bank …………………………………..
224

(v) Did casual job until capital was obtained ………………………….(vi) Others (Specify) …………………………………………………….
21. What is the present capital of this business? ………………………………
22. (a) Please state approximate not income realizedLast week N …………………………………………………………
(b) What is average weekly income?(i) This year N …………………………………………………..(ii) Last year N ………………………………………………….
(c) State previous peak income from apprentices N ………………….
23. Please state average annual income from apprentices N………………….
24. Assuming you are fully engaged, how much income can you realize per week?(a) This year N .…………………………………………………………….(b) Last year N ……………………………………………………………..
25. Please state This Last When
Year Year Establisheda. Average value of
Production per week ……….. ………… …………
b. Average value of Raw Materials for one weeks production
............... … ……… ..………..
c. Average value of sales per week ………… ………… ………..
d. Average value of raw materials for one week’s production
......… ………… …………
26. How much per week do you pay as?
225

a. Wages to employees …………………… …………b. Wages to Journeymen …………. ………… …………c. Rent to premises ………… ………… …………d. Cost of raw materials ………… ………… …………e. Cost of fuel …………. …………. …………f. Electricity Charges ………… …………. …………g. Rate/Due to local government ………… ………… ………h. Other production expenses ………… ………… …………
27. How much per week can you attribute to wear and tear of machines and tools N …
28. Assuming you hire your equipment, how much per week will you be paying N ……………
29. Kindly state the main source of your major raw materials(s)a. From formal private company ………………………………b. Informal sector enterprises …………………………………c. Government establishment …………………………………d. Others ……………………………………………………
30. State main products of this firm ……………………………………(b) State Number of firms making similar products in this town ……
31. What kind of people/firms buys your products?(Please rank) a. Private individuals ……………………………………………b. Other Informal sector enterprises……………………………c. Private firms …………………………………………………..d. Government and Parastatals …………………………………e. Others …………………………………………………….
226

32. Has this business ever received subcontract fromYes No
a. Government and/or its Agencies ……… ………
b. Private formal sector firms ……… ………
c. Other informal sector firms ……… ………
d. Other s (Specify) ……… ………
33. If yes, has such subcontract helped your business growth?
a. Yes ……………………………………………………………b. No ………………………………………………………………
34. If No, explain …………………………………………………………………………35. Please state how often you receive any of these
assistances from the government or any of its agencies.
Never Occasionally Always
a. Loanb. Extension servicec. Training/Seminar/Workshop
36. If you have ever received loan, has loan helped the growth of your enterprise?
a. Yes ………………………………………………b. No ……………………………………………….
37. If No, explain ……………………………………………………………38. Which of these assistances will like most to receive
from the government?(Please rank)a. Loan …………………………………………………………………b. Extension service ……………………………………………………
c. Training ……………………………………………………………...d. Subcontract …………………………………………………………e. Favourable legislation ……………………………………………….
227

f. Others (Specify) ……………………………………………………..39. Will you like to organize into cooperative society to
achieve the above?a. Yes ……………………………………………………b. No …………………………………………………….
40. Is your Union doing anything to achieve any of the assistances in No.? (35) Above?
a. Yes ……………………………………………………………b. No …………………………………………………………….
41. Do you consider this business to be growing?a. Yes ……………………………………………………………b. No …………………………………………………………….
42. If No, what are the possible reasons?a. No access to credit ……………………………………………b. Low patronage ……………………………………………….c. Lack of skilled labour………………………………………………………d. Others (Specify) ……………………………………………………………
43. Given the high cost/non availability of spare parts and essential raw materials has this business ever adopted any new method in production in the last three years?a. Yes …………………………………………………………b. No …………………………………………………………………….
44. If Yes, briefly describe such new method …………………………………………………………………………………………………………………………
45. What advice do you have for the government towards improving the conditions of enterprises like this? ……………………………………
Thank you.
FOR OFFICIAL USE ONLY
Name of Interviewer …………………………………………………..…
Zone No. and Area: ………………………………………………………
228

Duration of Interview ………………………………………………………
Signature and Date: ………………………………………………….…
NOTES:
(a) Responses to Open-ended questions should be
marked ‘X’
(b) Answers that are more than one should be ranked.
229

APPENDIX B
OBAFEMI AWOLOWO UNIVERSITY, ILE-IFEDEPARTMENT OF ECONOMICS
SURVEY OF INFORMAL SECTOR ENTERPRISES IN IBADAN
Dear Respondent,
This research questionnaire aims at obtaining
information regarding Employment and earnings for the
purpose of Academic Research in the Department of Economics
of Obafemi Awolowo University.
Your responses will be treated with utmost confidence
and you are being assure that this work has no connection
whatsoever with government and/or taxation purposes.
Your cooperation will be highly appreciated. Please
note that your name and address need not appear on the
questionnaire.
‘Ranti Ogunrinola,Research Co-ordinator
SECTION A: (GENERAL)1. Business Location/Address: …………………………………………………………….2. Field of business (e.g. Carpentry, Barbing, Clerical,
Teaching) ……………………….3. Status of Respondent:
1. Employee in Private formal sector ……………………………………………
230

2. Employee in Public Service ………………………………………………….3. Self Employed Entrepreneur………………………………………………….4. Informal Sector Employee ……………………………………………………5. Journeyman ……………………………………………………………………6. Apprentice ……………………………………………………………………7. Unpaid family Worker ……………………………………………………….8. Others (Specify) ………………………………………………………………
4. What is your impression/attitude towards this job?1. Satisfied …………………………………………………………2. Desired Self Employment ………………………………………………3. Looking for regular wage job …………………………………………………4. Planning to move to other town/business ……………………………………1. The job does not use my full potential
………………………………………6. Limited opportunity for
promotion…………………………………………7. Others (Specify) ………………………………………………………………
5. Why, in the first instance, did you desire to learn/ get engaged in this job?
1. Personally interested ……………………………………………2. Influence by parents …………………………………………………3. Needed a job to survive …………………………………………4. Couldn’t obtain wage job ……………………………………………5. Parents cannot afford higher education
………………………………6. Retrenched …………………………………………………………7. Withdrew from formal job ……………………………………………8. Post retirement exercise ………………………………………………
5 Others (Specify) …………………………………………………………6. Assuming the economic situation were buoyant, will you
still maintain the answer given in (4) above?1. Yes ……………………………… 2. No ……………………
7. If No, please state what your attitude to present job would have been ………
8. In case you prefer wage employment in (4) above
231

(a) How much per month would you like to earn? N……………………
(b) Have you been searching for the job?1. Yes …………………………………….2. No ……………………………………
(c) If Yes, by what method?1. Writing application ……………………………. 2. Visiting possible employers ………………………….3. Through friends and
relatives…………………………….4. Registered in Labour office ……………………….5. Others (Specify) ………………………………………
9. If Craftsman/Apprentice, who decide that you should learn this work? ………
10. What relationship do you have with the master?1. Blood related ………………………………… 2. From the same town/village …………………………3. Not related …………………………………………
11. Please state previous occupation before engaging in learning this job:
1. Farming …………………………………………………………2. Schooling ………………………………………………………3. Trading ………………………………………………………4. Wage job ………………………………………………………..5. Self Employment …………………………………………………6. Domestic Service …………………………………………7. Casual job ……………………………………………8. Others (Specify)…………………………………………
SECTION B: (APPRENTICES SHOULD GO DIRECTLY TO QUESTIONS 27 AND 28)
12. How many years of experience have you had on 1. Present job ………………………………………2. Other jobs relevant to this ………………………………3. Other Jobs ………………………………………………
232

13. (a) If a Craftsman, state number of years you spent in learning this job …………………………………………………………………
(b) Do not belong to your trade association?1. Yes ………………………………2. No ……………………………………
(c) If Yes, about how many members are there? ……………………………………
14. How many jobs have you held in the past before this one? ……………………………………
15. Please, state type of previous jobs, salary/earning, status and reasons for leaving:-
From To Year Average Status* Type of Reason for
Spent Monthly Job Leaving
Earnings
Last Job 2nd Last Job
3rd Last Job4th Last Job
* Please state whether: self employed, employee, casual workers, etc.16. For how many hours are you available for this work per
day? 17. Are you always fully engaged throughout this period?
1. Yes ………………………………….…2. No ……………………………………
18. (a) If No, what do you when not engaged? …………………………………………(b) If you work when not engaged about how much per week do you realize?
233

……………………………………………………………………………………19. Given the current economic situation, do you think it
is necessary to have other job outside one’s regular job?1. Yes ……………………………………2. No ……………………………………
20. What job do you combine with your job? …………………………………………..
21. About how much per week do you realize from such job?1. This year N …………………………………………………………2. Last year N …………………………………………………………
22. Please state your future aspiration with regard to this job.
1. Continue until retirement/old age ………………2. Establish own enterprise soon …………………3. Get wage employment …………………………4. Go back to School ……………………………5. Return to home town/village ……………………6. Others (Specify):………………………………
23. If self employed, how much did you realize from this job?
1. Last week this year …………………………………2. Average earnings per week this
year………………3. Average earnings per week last year .....……………
24. If a regular wage worker:(a) How much per month do you earn in term of
This LastYear Year
a. Basic salaryb. House Allowance
234

c. Transport Allowanced. Other Allowance
(b) State whether you enjoy/have YesNo
a. Paid annual leave ……… ………
b. Employers’ contribution towards social ……… ………Security (e.g. NPF, Gratuity, Pension) ……… ………
c. Paid maternity leave, if applicable ……… ………
d. Employment contract) ……… ………
e. Workers’ union that bargain for Improved working conditions
……… ………
(c) Is your company/government owned or registered bygovernment?
1. Yes …………………………………….2. No ……………………………………
(d) If not a technical worker, state whether you havelearnt any technical skill
1. Yes …………………………………….2. No ……………………………………
(e) If Yes, state the nature of the skill ………………………………………(f) Apart from your official job, do you engaged in
part-time self employment to utilize the skill.1. Yes ……………………………………2. No ……………………………………
(g) If yes, how much did you realize from such part-time work last week?
N …………………
235

(h) When do you hope to be utilizing that skill on full-time self employment? …………………………………………………………………………………
(i) If you answer No, to question (24. d) above, do you intend to learn a job and latter become self employed?1. Yes ………………………………2. No ……………………………………
25. In relation to regular wage work, how do you rank selfemployment (S. E.)1. S. E. is better ……………………………………2. S. E. is worse ……………………………………3. No difference ……………………………………4. Cannot compare ………………………………
26. What advice do you have for government towards improving the lot of the self-employed? ………………………………………………………………
SECTION C: (FOR ALL RESPONDENTS)27. Can you please state?
(i) Your age ……………………………………..(ii) Sex: (1) Male ………………… (2) Female ………………(iii) Marital Status:
1. Single ……………………………………..2. Married ……………………………………3. Divorce/Separated …………………………………………4. Others (Specify) ……………………………………………
(iv) Religion:1. Christian ………………………………………………………..2. Muslim …………………………………………………………3. Traditional Religion ……………………………………………4. Others (Specify) ………………………………………………..
(v) State of origin/country for non-Nigeria …………………………….
(vi) Highest level of education attained:1. No. schooling …………………………………………………..
236

2. Below full Primary ……………………………………………. 3. Full Primary ……………………………………………………
4. Below full secondary …………………………………………..
5. Full secondary ………………………………………………….
6. Technical/Vocational …………………………………………..
2. First Degree/HND ………………………………………………3. Others (Specify) …………………………………………………
(vii) Place of birth ………………………………………………………….(viii) If not born in this town, please state:
1. When you came to this town ……………………………………………… 2. Distance of home town from here
………………………………………… 3. Last occupation before coming to this
town ……………………………… 4. How much per month earned from
such jobs …………………………… 5. What did you plan to do on
reaching this town? ………………………… 6. First occupation in this town
Salary per month N ………………………(IX) Position in the household?
1. Head ………………………………2. Wife ……………………………………
(x) Father’s occupation …………………………………………………(xi) Father’s education …………………………………………………(xii) Average monthly/Annual income of
father N ………………………………
SECTION D: APPRENTICES ONLY 28. (a) For how many years will you learn this job? ……………………… years. (b) How many of these have you spent? …………………………………
237

(c) Do you consider your mode of training to be satisfactory?
1. Yes …………………………………… 2. No ……………………………………
(d) If No, how do you think this training mode can be improved?
……………………………………………………………………………..
(e) How would you compare your training mode with?
My training mode is No Difference Cannot BetterInferior Compare
1. Similar training
With other master craftsmen 2. Training in Technical College3. Training through the N.D.E.
(f) 1. Are you one of NDE trainees? 1. Yes ……………………………… 2. No …………………………………… 2. If Yes, state advantages of this
training mode over the informal apprenticeship type: ………………………………………………………………
(g) State your future aspiration with regard to settlement after training?1. Get regular wage employment
……………………………………… 2. Move to other town to establish
……………………………………. 3. Establish own business in this
town ………………………………...
238

4. Stay with master as employee/journeyman ………………………….
5. Engage in casual job until enough capital is demand ………………..
6. Others (Specify) ……………………………………………………...
(h) How much in total will you pay for this training?N …………………………
(i) Who will be responsible for paying the above?…….…………………………
(j) How much initial capital do you think you need N……………………………
(k) Who will provide initial capital for establishment? ……………………………
(l) How much income per week do you think you will berealized after training? N ………………………………………………
Thank you.
239