Emotions behind Drive-by Download Propagation on Twitter
28
This is an Open Access document downloaded from ORCA, Cardiff University's institutional repository: https://orca.cardiff.ac.uk/132117/ This is the author’s version of a work that was submitted to / accepted for publication. Citation for final published version: Javed, Amir, Burnap, Pete, Williams, Matthew L. and Rana, Omer F. 2020. Emotions behind drive-by download propagation on Twitter. ACM Transactions on the Web 14 (4) , 16. 10.1145/3408894 file Publishers page: http://dx.doi.org/10.1145/3408894 <http://dx.doi.org/10.1145/3408894> Please note: Changes made as a result of publishing processes such as copy-editing, formatting and page numbers may not be reflected in this version. For the definitive version of this publication, please refer to the published source. You are advised to consult the publisher’s version if you wish to cite this paper. This version is being made available in accordance with publisher policies. See http://orca.cf.ac.uk/policies.html for usage policies. Copyright and moral rights for publications made available in ORCA are retained by the copyright holders.
-
Upload
khangminh22 -
Category
Documents
-
view
0 -
download
0
Transcript of Emotions behind Drive-by Download Propagation on Twitter
This is a n Op e n Acces s doc u m e n t dow nloa d e d fro m ORCA, Ca r diff U nive r si ty 's
ins ti t u tion al r e posi to ry: h t t p s://o rc a.c a r diff.ac.uk/132 1 1 7/
This is t h e a u t ho r’s ve r sion of a wo rk t h a t w as s u b mi t t e d to / a c c e p t e d for
p u blica tion.
Cit a tion for final p u blish e d ve r sion:
Jave d, Amir, Bu r n a p, Pe t e, Willia m s, M a t t h e w L. a n d Ra n a, O m e r F. 2 0 2 0.
E motions b e hind d rive-by do w nloa d p rop a g a tion on Twit t er. ACM
Tra n s a c tions on t h e Web 1 4 (4) , 1 6. 1 0.11 4 5/34 0 8 8 9 4 file
P u blish e r s p a g e: h t t p://dx.doi.or g/10.11 4 5/340 8 8 9 4
< h t t p://dx.doi.o rg/10.11 4 5/340 8 8 9 4 >
Ple a s e no t e:
Ch a n g e s m a d e a s a r e s ul t of p u blishing p roc e s s e s s uc h a s copy-e di ting,
for m a t ting a n d p a g e n u m b e r s m ay no t b e r eflec t e d in t his ve r sion. For t h e
d efini tive ve r sion of t his p u blica tion, ple a s e r ef e r to t h e p u blish e d sou rc e. You
a r e a dvise d to cons ul t t h e p u blish e r’s ve r sion if you wish to ci t e t his p a p er.
This ve r sion is b ein g m a d e av ailable in a cco r d a n c e wit h p u blish e r policie s.
S e e
h t t p://o rc a .cf.ac.uk/policies.h t ml for u s a g e policies. Copyrigh t a n d m o r al r i gh t s
for p u blica tions m a d e available in ORCA a r e r e t ain e d by t h e copyrig h t
hold e r s .

Emotions behind Drive-by Download Propagation on
AMIR JAVED∗∗, School of Computer Science and Informatics, Wales
PETE BURNAP, School of Computer Science and Informatics, Wales
MATTHEW L. WILLIAMS, School of Social Science, Wales
OMER F RANA, School of Computer Science and Informatics, Wales
Twitter has emerged as one of the most popular platforms to get updates on entertainment and current events.However, due to its 280 character restriction and automatic shortening of URLs, it is continuously targeted bycybercriminals to carry out drive-by download attacks, where a user’s system is infected by merely visitinga Web page. Popular events that attract a large number of users are used by cybercriminals to infect andpropagate malware by using popular hashtags and creating misleading tweets to lure users to malicious Webpages. A drive-by download attack is carried out by obfuscating a malicious URL in an enticing tweet and usedas clickbait to lure users to a malicious Web page. In this paper we answer the following two questions: Whyare certain malicious tweets retweeted more than others? Do emotions reflecting in a tweet drive virality?We gathered tweets from seven different sporting events over three years and identified those tweets thatwere used to carry to out a drive-by download attack. From the malicious (N=105,642) and benign (N=169,178)data sample identified, we built models to predict information flow size and survival. We define size as thenumber of retweets of an original tweet, and survival as the duration of the original tweet’s presence in thestudy window. We selected the zero-truncated negative binomial (ZTNB) regression method for our analysisbased on the distribution exhibited by our dependent size measure and the comparison of results with otherpredictive models. We used the Cox regression technique to model the survival of information flows as itestimates proportional hazard rates for independent measures. Our results show that both social and contentfactors are statistically significant for the size and survival of information flows for both malicious and benigntweets. In the benign data sample, positive emotions and positive sentiment reflected in the tweet significantlypredict size and survival. In contrast, for the malicious data sample, negative emotions, especially fear, areassociated with both size and survival of information flows.
CCS Concepts: · Security and privacy→ Social network security and privacy.
Additional KeyWords and Phrases: Cyber security, Drive-by download, Malware,Machine learning, Cybercrime
ACM Reference Format:
Amir Javed, Pete Burnap, Matthew L. Williams, and Omer F Rana. 2020. Emotions behind Drive-by DownloadPropagation on Twitter. 1, 1 (June 2020), 27 pages.
Over the last decade, online social networks (OSNs) have become one of the most popular platformson the Internet, attracting billions of users every day. Among the present OSNs, Twitter has emergedas one of the most powerful and widely used platforms, having an active user subscription ofaround 335 million [30]. Twitter’s popularity continues to attract cybercriminals to carry outvarious cyber attacks. Cyber attacks such as distributed denial of service [32], cross-site scripting[22], Trojan attacks [42] and drive-by downloads [28] continue to be major threats on Twitter.
∗I am the corresponding author
Authors’ addresses: Amir Javed, [email protected], School of Computer Science and Informatics, 5, The Parade, Cardiff,Wales, CF243AA; Pete Burnap, School of Computer Science and Informatics, 5, The Parade, Cardiff, Wales, [email protected]; Matthew L. Williams, School of Social Science, Cardiff, Wales, [email protected]; Omer F Rana, School ofComputer Science and Informatics, 5, The Parade, Cardiff, Wales, [email protected].
© 2020
, Vol. 1, No. 1, Article . Publication date: June 2020.

2 Javed et al.
Once a user’s system is infected, sensitive information is exposed to unauthorised users and theirmachines can be used to carry out further attacks. Twitter is particularly susceptible due to the 280character restriction imposed on a tweet. Due to this restriction, a unique resource locator (URL) isautomatically shortened, giving cybercriminals the opportunity to obfuscate a URL pointing toa malicious Web server. An attack of this nature is called a drive-by download and accounts for48% of attacks by exploiting Web-based vulnerabilities [51]. These attacks are not limited to onlinesocial platforms but can also we carried out via Social engineering based phishing where the victimmay receive an unsolicited email with URLs redirecting to malicious Web sites and upon visitationof these websites a vulnerable system may get infected [36].In existing research, propagation models for malware are based either on scanning techniques
or the topology of a network, where the focus of the research has been on the communicationmedium [10, 16], social network topology [16] and the relationship [61] exhibited among users.The underlying assumption while building propagation models has been that the malware is self-propagating. However, the research so far has focused on self-propagating malware, such as aworm, or to understand the propagation of spam. In contrast, our research focuses on malware thatis not self-propagating; that is, the user has to visit the website containing malicious code in orderto get infected. Furthermore, a research gap exists in understanding the propagation of malwarebased on the Twitter network based on Tweet content. Therefore, this study is novel in that weidentify social as well as content factors that contribute to the propagation of tweets containingboth malicious and benign URLs during sporting events.By observing the social and content features of a Tweet, we aim to understand the underlying
factors for drive-by download propagation on Twitter. Social factors such as a number of friendsor followers, give a social profile of the accounts that propagate malware. Furthermore, fromthe content of the tweets, we derive features such as emotions and sentiments that affect thepropagation of malware. It has been well established that people transfer positive and negativemoods to one another [24], in a form of emotional contagion. Through experiments, researchershave shown that emotions representing long-lasting moods like happiness and depression can betransferred through online social networks [17, 24]. Also, one’s emotional state can be used topredict emotional states of connected friends. Kramer et al. showed how posting behaviour of auser varied based on the emotional content received [31]. While it is clear emotions do impactposting behaviour, this study extends this work by identifying what emotions affect the the sharingof Twitter content that is designed to propagate malware.In this paper we uncover factors that cybercriminals use to entice users to retweet content
containing a malicious URL. From a corpus of circa 3.5 million tweets collected around sevendifferent sporting events in 3 years, we created a sub-sample and passed it to a high interactionhoneypot to identify those tweets that contained malicious URLs. We identified 105,642 tweetscontaining malicious URLs and 169,178 tweets containing benign URLs. These data were enteredinto statistical models to estimate the size and survival of ’malicious’ information flows. To buildour statistical models we derived two dependent variables, size and survival. Size is defined bythe number of retweets a tweet receives in the study window, and survival represents the timebetween the first and last retweet in the same window. Independent variables derived from tweetsincluded social (user characteristics) and content (sentiment and emotion) factors. To the best ofour knowledge, this is the first study to identify social and content factors to assess their influenceon the propagation of tweets containing malicious or benign URLs in social networks. This papercontributes to the broader literature on malware propagation by:
, Vol. 1, No. 1, Article . Publication date: June 2020.

Emotions behind Drive-by Download Propagation on Twitter 3
• Determining if tweets that contain negative emotions are statistically associated with thesize and survival of information flows. Furthermore, determining what discrete negativeemotions emerge as the most significant;
• Determining if tweets that contain positive emotions are statistically associated with sizeand survival of information flows.
• Determining if social factors, such as the number of followers a user has are statisticallypositively associated with the size and survival of information flows;
1 RELATED WORK
Malware Propagation on Traditional Networks:- Researchers have studied malware propaga-tion using a range of different methods. Yu et al. proposed a two-layer malware propagation modelfor large networks based on epidemiological principles [71]. Similarly, Zou et al. proposed a modelbased on epidemiology to detect propagation of worms on the Internet [72]. However, their focuswas to detect malware at its early propagation stages. Ganesh et al. combined epidemiology andgraph theory to understand the malware propagation on networks [19]. They observed that if thespectral radius of the graph of the network studied is higher than the ratio of cure to infection,then average epidemic lifetime is of order log n, where n is the number of nodes. However, if thesame ratio is greater than the isoperimetric constant of the graph then the average epidermiclifetime is represented by en
a
, where a is a positive constant. Liu et al. combined an epidemic modelwith transmission theory in order to observe malware propagation in wireless networks [35]. Aconsiderable amount of research has been done to understand malware propagation using epidemi-ological models in traditional networks [48][43], including wireless and Bluetooth. However, withthe growing popularity of OSNs with cybercriminals, attention must turn to propagation that isdependent upon social and content factors.Malware Propagation on Online Social Networks:-With the emergence of OSNs, new tech-
niques have been developed to exploit the social relationship between users to propagate malware.Earlier research on malware propagation related to social networks focused on the communicationmedium such as the mobile device [16], Bluetooth [10] or email [68]. Wherein, for example, toobserve malware propagation in a mobile network, a social network topology was created usingthe contacts saved on the user’s device to evaluate the speed and severity of random contact worms[16]. Such social networks may have some similarities with online social network graphs, but theydiffer regarding the amount of data generated and the amount of time a user spends on the network.This abundant data on a user’s behaviour opens doors to understand malware propagation usingvarious techniques incorporating social behaviour defined by user relationships. Having comparedvirus propagation through emails with the propagation of viruses using messages exchanged onFacebook, Fan et al went on to propose malware propagation models based on the applicationnetwork of Facebook [15]. They investigated two malware propagation strategies, one where thecybercriminal would develop applications designed to carry out attacks or contain vulnerabilitiesfor subsequent exploitation; and the other where a malware is distributed by means of directmessages to users. Their experimental results regarding malicious application showed that even ifthe malicious application is less popular on the OSN platform, it still has the potential to spreadrapidly. Experimenting with user relationships, Sun et al. proposed a human behaviour model basedon game theory to describe the propagation of network worms on social networks [61]. Sanzgririet al. successfully applied epidemiology theory to understand malware propagation on Twitterand showed that even a low degree of connectivity and probability of user clicking links couldcause a large degree of malware dissemination [52]. One of the drawbacks of epidemic models isthat they lack scalability. To overcome the drawback of epidemic models Wang et al. presenteda discrete-time absorbing Markov process to characterise virus propagation [67]. The proposed
, Vol. 1, No. 1, Article . Publication date: June 2020.

4 Javed et al.
model was capable of evaluating virus lifetimes in large networks. Their results revealed that theminimum curing probability for a given extinction rate requirement is independent of the explicitsize of the network. Thus, one can interpret the extinction rate requirement of a big network withthat of a much smaller one, evaluate its minimum curing requirement, and achieve simplificationswith negligible loss of accuracy. Yan et al [69] analysed user activity patterns and OSN structureto narrow down the characteristics of malware propagation in OSNs. For their experiments theyused real-world locations based on OSN data and conducted analysis from the perspectives of userfriendship and activity. Furthermore, they conducted trace driven simulation to observe the initialinfection impact, user click probability, social structures and user activity patterns on malwarepropagation. However, their research assumed that users were active only if they were engaging incertain activities, such as location based check ins, photo updating or posting. Furthermore, theyassumed that each user has the same probability of clicking on a malicious URL, which may not bethe case in real life, some necessarily being more educated than others. Focusing on user behaviouron OSN, Wang et al proposed a malware propagation model based on user behaviour, mainlylooking at user mobility and temporal message processing [66]. One of the key features that theyintroduced was user mobility as one of the main factors to estimate malware propagation. Theyincorporated the idea that a user can be mobile and hence the infection rate can change endlessly. Inmany OSNs, a message recall function was introduced to tackle the malware propagation problem.This feature allowed a user to delete any post that contains a malicious link so that it is no longeraccessible to other connected users. However, users were still in the network that had been infectedbefore the message was recalled and they might continue to spread the malware to their connectedusers. Considering this message recall mechanism Chen et al. proposed a model based on epidemictheory to measure the propagation of infections in a message-recallable OSN [9].Emotion and Sentiment Analysis on Twitter:- Sentiment analysis is concerned with detect-
ing positive, negative or neutral content in written text. Whereas, emotion analysis is concernedwith detecting discrete emotions (e.g. anger, fear, joy, and so on). In Current research sentimentshave been used to detect spam. Wang et al. proposed a spam detection model that uses sentiment asone of the features in detection on Twitter [65]. They showed that by using only four features, onecould achieve satisfactory results compared to previous tools. Similarly, Hu et al. used a networktopology to detect spam showing that the performance of the model increased by the addition ofsentiment data [26]. Focusing on the content only, Berger et al. studied emotions expressed in atweet to identify a relationship between retweeting and emotions [4]. They found that contentthat evokes high arousal like positive emotion (awe) or in negative emotion (anger or anxiety)has a higher probability of propagation than ’deactivating emotions’ such as sadness. In a similarapproach, Vosoughi et al. used emotions to explain the propagation of news on social media [64].They found that news that was false and reflected fear, disgust, and surprise was more likely to beretweeted than actual stories that reflected anticipation, sadness, joy and trust.Technology and malware are constantly evolving. Models investigating malware propagation
have to incorporate new features to tackle the new techniques used by cybercriminals for malwarepropagation. Content based features such as sentiment have been more often used in models todetect spam [26, 65] than to understand their propagation. Features such as emotions are used tounderstand the virality of posts on OSNs [4, 64]. Particularly, content containing negative emotionshave a higher chance to be shared on OSN than positive emotions [4]. This tactic of using negativeemotions to convey a message to a larger audience have been seen in advertisements as well. Forexample, a series of short films called "The Hire" that evoked negative emotions by including astory line that involved a car chase were created by BMW in order to gain millions of views [5].This provoked the question of whether cyber criminals were employing similar tactics by creatingcontagious posts containing negative emotions on OSN to propagate malware. We cannot of course
, Vol. 1, No. 1, Article . Publication date: June 2020.

Emotions behind Drive-by Download Propagation on Twitter 5
presume to know the the mindset or deliberate actions employed by attackers but we can provideevidence to measure the success of emotions in increasing size and survival of malicious URLs onOSNs.
Even though content-based features are being considered in research, they are limited to under-standing the flow of information related to news or to detecting spam. The analysis conducted tounderstand content sharing on OSN use basic emotions as defined by Ekman [14] that identifiesmore negative emotion than positive in its six basic emotions (Anger, Fear, Disgust, Sadness, Sur-prise and Joy). This presents an imbalanced set of positive and negative emotions for analysis. Aresearch gap exist that links emotions and sentiment to malware propagation on OSNs, where theset of emotions used for analysis are balanced in term of positive and negative emotions such asdefined by Plutchik [44] (Anger, Fear, Disgust, Sadness, Anticipation, Surprise, Trust and Joy).To the best of our knowledge this is the first study that correlates emotions expressed in a tweetcontaining malicious URL with its propagation.
2 DATA COLLECTION AND PREDICTIVE MEASURES
2.1 Data Collection
In 3 years, we collected tweets containing URLs around popular sporting events. The rationalefor choosing sporting events was that they are known to attract a large number of social mediausers, thus increasing the probability of a malicious link being clicked. These events also givecybercriminals an excellent opportunity to lure a large number of people to their malicious Websites, by enticing users to retweet the link using compelling content, thus propagating the maliciousURL. To give an idea of how many users interact online around a sporting event, in 2015 the CopaAmerica recorded 14 billion impressions alone [33] and the 2016 Rio Olympics was the top topicthat year - surpassing even the US presidential election [30]. Data for our study were collectedfrom Twitter via the streaming API using the python library Tweepy [49]. We chose Twitter asthe online social network for the study because it supports the free collection of 1% of all dailytweets, which was assumed to be of sufficient bandwidth to collect all tweets explicitly mentioninghashtags or keywords describing the sporting events under study. In 3 years, we collected datafrom seven different sporting events:
(1) Federation Internationale de Football Association (FIFA) World Cup of 2014 : was the 20th
FIFA World Cup for men’s national football team. It took place in Brazil from 12 June to13 July 2014 and 32 teams from different countries participated in the event. During thisperiod 642 million tweets were posted on Twitter related to the event and Brazil vs Germanysemi-final was the most tweeted about event generating 35.6 million Tweets [55].
(2) The American Football Superbowl 2015: was an American football game played betweenthe American Football Conference (AFC) champion New England Patriots and the NationalFootball Conference (NFC) champion Seattle Seahawks, to determine the champion of theNational Football League (NFL) for the 2014 season. A total of 28.4 million tweets wererecorded during the event and it was the most talked about event on Facebook, with 1.36million people commenting every minute during the event [20].
(3) The Cricket World Cup 2015 : was the 11th men’s Cricket World Cup, jointly hosted byAustralia and New Zealand from 14 February to 29 March 2015. A total of 14 teams fromdifferent countries participated in the event and 3.5 million tweets were recorded during theperiod event occured [29]. During which the India vs Pakistan match was the most talkedabout match that generated 1.7 million tweets [58].
(4) Rugby World Cup 2015 was the eighth Rugby World Cup, hosted by England from 18 Septem-ber to 31 October. A total of 20 teams from different nations participated in the event. The
, Vol. 1, No. 1, Article . Publication date: June 2020.
6 Javed et al.
final between New Zealand vs Australia recorded 560,000 tweets with a highest frequency of2,900 tweets per second [57].
(5) The American Football Superbowl 2016 : was an American football game played between theAFC champion Denver Broncos and the NFC champion Carolina Panthers, to determine thechampion of the NFL for the 2015 season. A total of 27 million tweets were reported duringthe event by Twitter and an engagement of 60 million users related to the event was reportedby Facebook [21].
(6) The European Football Championships 2016 : was the 15th International men’s footballchampionship of Europe organised by The Union of European Football Associations (UEFA).It was held in France from 10 June to 10 July 2016 and a total of 24 teams participated in it.Where England vs Iceland was reported to be the most tweeted about programme, generating2.1 million tweets during the match [50].
(7) The Olympics 2016 : was an international multi-sport event that was held from 5 to 21 August2016 in Rio de Janeiro, Brazil. A total of 207 nations participated in the event and it was themost talked about event of 2016, even surpassing the U.S Presidential election [30].
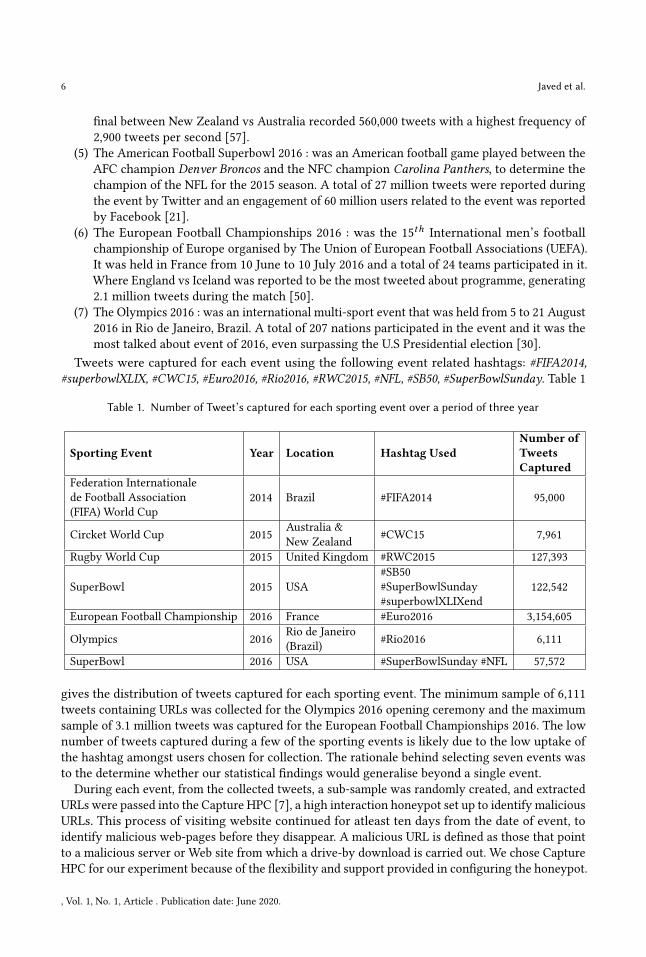
Tweets were captured for each event using the following event related hashtags: #FIFA2014,#superbowlXLIX, #CWC15, #Euro2016, #Rio2016, #RWC2015, #NFL, #SB50, #SuperBowlSunday. Table 1
Table 1. Number of Tweet’s captured for each sporting event over a period of three year
Sporting Event Year Location Hashtag Used
Number of
Tweets
Captured
Federation Internationalede Football Association(FIFA) World Cup
2014 Brazil #FIFA2014 95,000
Circket World Cup 2015Australia &New Zealand
#CWC15 7,961
Rugby World Cup 2015 United Kingdom #RWC2015 127,393
SuperBowl 2015 USA#SB50#SuperBowlSunday#superbowlXLIXend
122,542
European Football Championship 2016 France #Euro2016 3,154,605
Olympics 2016Rio de Janeiro(Brazil)
#Rio2016 6,111
SuperBowl 2016 USA #SuperBowlSunday #NFL 57,572
gives the distribution of tweets captured for each sporting event. The minimum sample of 6,111tweets containing URLs was collected for the Olympics 2016 opening ceremony and the maximumsample of 3.1 million tweets was captured for the European Football Championships 2016. The lownumber of tweets captured during a few of the sporting events is likely due to the low uptake ofthe hashtag amongst users chosen for collection. The rationale behind selecting seven events wasto the determine whether our statistical findings would generalise beyond a single event.
During each event, from the collected tweets, a sub-sample was randomly created, and extractedURLs were passed into the Capture HPC [7], a high interaction honeypot set up to identify maliciousURLs. This process of visiting website continued for atleast ten days from the date of event, toidentify malicious web-pages before they disappear. A malicious URL is defined as those that pointto a malicious server or Web site from which a drive-by download is carried out. We chose CaptureHPC for our experiment because of the flexibility and support provided in configuring the honeypot.
, Vol. 1, No. 1, Article . Publication date: June 2020.

Emotions behind Drive-by Download Propagation on Twitter 7
Fig. 1. Number of Malicious Tweet’s captured for each sporting event
Furthermore, it is open source making it readily available to the research community. The roleof the Capture HPC was to perform dynamic analysis of interaction behaviour between a clientmachine and that of a Web server based on the URL that is passed to it. Capture HPC operatesby visiting each URL that is passed to it through a virtualised sandbox environment - interactingwith the Web page for a pre-defined amount of time. At the end of the interaction period CaptureHPC determines if any system-level operations have occurred including file, process and registrychanges made to the system. Based on these changes it classifies the URL as malicious or benign[46]. The classification is based on three exclusion lists that are created based on known file, process
Fig. 2. File Exclusion List
or registry entries that are targeted by drive-by download attacks. Figure 2 gives a typical exampleof rules from a file exclusion list, where each positive symbol indicates that system activity isallowed and a negative symbol means that it is not allowed and is flagged as malicious. For exampleany exe file that is written or created during the visitation of a Web page is not allowed.One of the biggest challenge faced while analysing URLs pointing to malicious websites was toquickly identify them before they disappear. As, evidence was found in earlier study that thesewebsites were alive for only three days before they disappear/start behaving normally [38] and ittook Twitter around three days to suspend 92% of account that were behaving maliciously [62].Considering the number of tweets posted per minute (on average 350,000 tweets [53]) an epidemicmodel was built by Giri et al [52] that showed how even a small number of infected users can infecta large number of users on Twitter in a short period of time. Giving us a very short window toanalyse and annotate URLs into malicious/benign category. Keeping the short time frame in mind,for our study a data sample of around 300,000 tweets containing both malicious and benign URLs
, Vol. 1, No. 1, Article . Publication date: June 2020.
8 Javed et al.
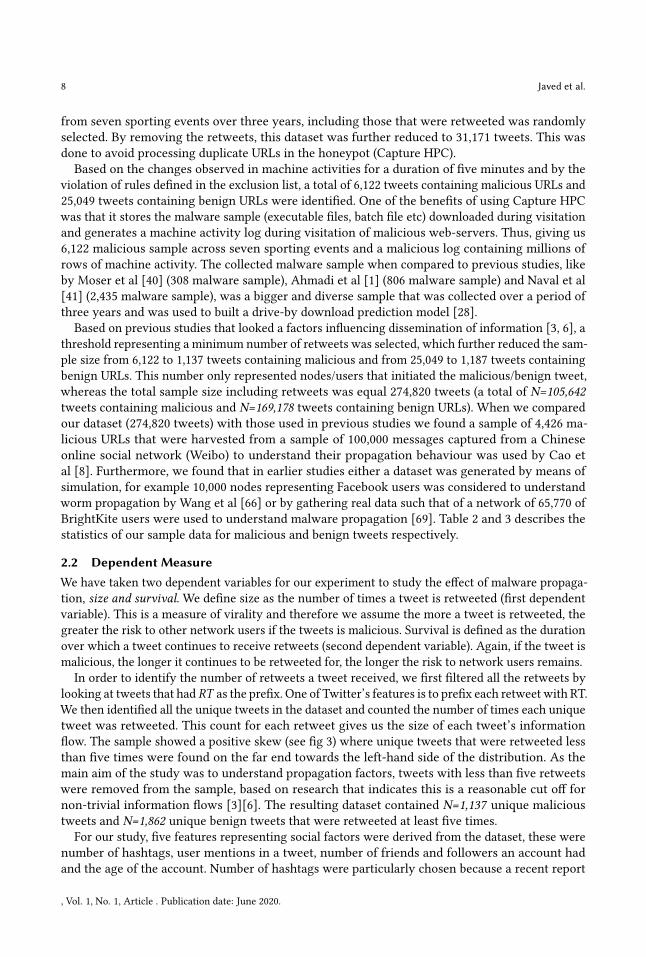
from seven sporting events over three years, including those that were retweeted was randomlyselected. By removing the retweets, this dataset was further reduced to 31,171 tweets. This wasdone to avoid processing duplicate URLs in the honeypot (Capture HPC).Based on the changes observed in machine activities for a duration of five minutes and by the
violation of rules defined in the exclusion list, a total of 6,122 tweets containing malicious URLs and25,049 tweets containing benign URLs were identified. One of the benefits of using Capture HPCwas that it stores the malware sample (executable files, batch file etc) downloaded during visitationand generates a machine activity log during visitation of malicious web-servers. Thus, giving us6,122 malicious sample across seven sporting events and a malicious log containing millions ofrows of machine activity. The collected malware sample when compared to previous studies, likeby Moser et al [40] (308 malware sample), Ahmadi et al [1] (806 malware sample) and Naval et al[41] (2,435 malware sample), was a bigger and diverse sample that was collected over a period ofthree years and was used to built a drive-by download prediction model [28].
Based on previous studies that looked a factors influencing dissemination of information [3, 6], athreshold representing a minimum number of retweets was selected, which further reduced the sam-ple size from 6,122 to 1,137 tweets containing malicious and from 25,049 to 1,187 tweets containingbenign URLs. This number only represented nodes/users that initiated the malicious/benign tweet,whereas the total sample size including retweets was equal 274,820 tweets (a total of N=105,642tweets containing malicious and N=169,178 tweets containing benign URLs). When we comparedour dataset (274,820 tweets) with those used in previous studies we found a sample of 4,426 ma-licious URLs that were harvested from a sample of 100,000 messages captured from a Chineseonline social network (Weibo) to understand their propagation behaviour was used by Cao etal [8]. Furthermore, we found that in earlier studies either a dataset was generated by means ofsimulation, for example 10,000 nodes representing Facebook users was considered to understandworm propagation by Wang et al [66] or by gathering real data such that of a network of 65,770 ofBrightKite users were used to understand malware propagation [69]. Table 2 and 3 describes thestatistics of our sample data for malicious and benign tweets respectively.
2.2 Dependent Measure
We have taken two dependent variables for our experiment to study the effect of malware propaga-tion, size and survival. We define size as the number of times a tweet is retweeted (first dependentvariable). This is a measure of virality and therefore we assume the more a tweet is retweeted, thegreater the risk to other network users if the tweets is malicious. Survival is defined as the durationover which a tweet continues to receive retweets (second dependent variable). Again, if the tweet ismalicious, the longer it continues to be retweeted for, the longer the risk to network users remains.
In order to identify the number of retweets a tweet received, we first filtered all the retweets bylooking at tweets that had RT as the prefix. One of Twitter’s features is to prefix each retweet with RT.We then identified all the unique tweets in the dataset and counted the number of times each uniquetweet was retweeted. This count for each retweet gives us the size of each tweet’s informationflow. The sample showed a positive skew (see fig 3) where unique tweets that were retweeted lessthan five times were found on the far end towards the left-hand side of the distribution. As themain aim of the study was to understand propagation factors, tweets with less than five retweetswere removed from the sample, based on research that indicates this is a reasonable cut off fornon-trivial information flows [3][6]. The resulting dataset contained N=1,137 unique malicioustweets and N=1,862 unique benign tweets that were retweeted at least five times.
For our study, five features representing social factors were derived from the dataset, these werenumber of hashtags, user mentions in a tweet, number of friends and followers an account hadand the age of the account. Number of hashtags were particularly chosen because a recent report
, Vol. 1, No. 1, Article . Publication date: June 2020.

Emotions behind Drive-by Download Propagation on Twitter 9
Table 2. Description of Malicious Sample Data N=1,137
Variable Range Mean Std. Dev
Dependent
Size 5-22,614 86.53 817.19Survival 0-2850416 218,556.40 483,290.60
Independent
Social Factors
Hashtag 0-13 1.90 1.66Mentions 0-6 1.22 0.93Friends 0-784,471 3652.78 28614.25Followers 0-928,4012 168519.50 618537.10Age of Account 562-1,321 918.25 287.17
Emotion
Anger 0-3 0.21 0.48Anticipation 0-7 1.01 1.18Disgust 0-5 0.27 0.60Fear 0-5 0.39 0.67Joy 0-7 0.71 0.95Sadness 0-3 0.28 0.57Surprise 0-10 0.44 0.76Trust 0-5 0.50 0.75
Sentiment
Negative 0-3 0.19 0.46Positive 0-4 0.37 0.67
Fig. 3. Number of Tweet’s captured with malicious URLs for each sporting event
on the engagement of users on online social platforms revealed correlation between number ofhashtags and user engagement [47]. Number of followers and friends have been added as they haveearlier been used to understand malware propagation on Twitter [52]. Number of user mentionswere used because an adversary could make their post visible to an influential user that has high
, Vol. 1, No. 1, Article . Publication date: June 2020.

10 Javed et al.
Table 3. Description of Benign Sample Data N=1,862
Variable Range Mean Std. Dev
Dependent
Size 5-48,875 90.86 1,160.23Survival 0-2,896,989 291,628.00 616,751.50
Independent
Social Factors
Hashtag 0-12 2.02 1.81Mentions 0-7 1.00 0.97Friends 0-481194 2,973.49 16,787.49Followers 0-12,700,000 143,917.60 761,002.80Account Age 933-1635 1,200.09 306.50
Emotion
Anger 0-3 0.07 0.28Anticipation 0-6 0.21 0.51Disgust 0-2 0.05 0.23Fear 0-3 0.09 0.32Joy 0-5 0.17 0.46Sadness 0-2 0.08 0.29Surprise 0-3 0.09 0.32Trust 0-5 0.22 0.51
Sentiment
Negative 0-3 0.14 0.39Positive 0-5 0.34 0.64
number of follower by mentioning them in their post. Similarly, age of account was chosen becauseit has been used as a parameter to identify tweets containing malicious URLs [28]. Both emotionand sentiment were chosen because they have in the past been used to understand propagationof post [5]. Table 2 and 3 give details of both dependent variables, where the range of size for amalicious tweet was 5 - 22,614 retweets and a mean of 87.53 retweets and the size for a benigntweet was 5 - 48,875 and a mean of 90.86 retweets. For survival, we found a malicious tweet had arange of 0 - 2,850,416 seconds with a mean of 218,556.40 seconds, and a benign tweet had a rangeof 0-2,896,989 seconds and a mean of 291,628 seconds. The minimum of zero represents roundingdown to the nearest second where retweets happened within in milliseconds.
2.3 Independent Features
2.3.1 Social Features.
Based on previous research where social features were used to detect malware on OSNs, weextracted the number of friends, number of followers and age of the Twitter account that postedthe initial tweet from metadata. We also calculated the number of hashtags that were included inthe tweet and if the tweet contained a mention.
2.3.2 Content Feature.
In addition to the social factors, we derived eight emotions and two sentiment features. The eightemotion features that we derived from the tweet were based on Plutchik’s [44] conception ofemotion. While others, like Ekman [14] identify six basic emotions (Anger, Fear, Disgust, Sadness,
, Vol. 1, No. 1, Article . Publication date: June 2020.

Emotions behind Drive-by Download Propagation on Twitter 11
Fig. 4. Flow Chart of the Emotion and Sentiment Extraction
Surprise and Joy), Plutchik [44] identifies eight (Anger, Fear, Disgust, Sadness, Anticipation, Sur-prise, Trust and Joy). We do not claim that Plutchik’s eight emotions are more fundamental thanother categorisations; however, we adopted them because they are well-founded in psychologi-cal empirical research, and unlike some other choices, for example, that of Ekman, they are notcomposed of mostly negative emotions. In addition to the eight emotions, positive and negativesentiment were also included.A Java-based script was developed to extract the emotion and sentiment of each tweet. The
program identifies emotion and sentiment based on keywords using dictionaries containing wordsassociated with each of the eight emotions. These dictionaries were built using the WordNet AffectLexicon [59] and NRC-Emolex and Hashtag Emotion Corpus [39, 56], that have all been rigorouslydeveloped in previous research. In addition to these dictionaries, we used emoticons contained in atweet to identify appropriate additional emotions.Figure 4 provides an overview of the core program in the form of a flowchart. The program firstreads a tweet from the dataset then pre-processes it by removing stop words and punctuation. Itthen checks if any emoticons are present and if found it identifies the associated emotion. In thenext step the tweet is split into multiple tokens, and for each token (word) the associated emotionis identified using the three dictionaries. As the WordNet affect lexicon represents emotion in ahierarchical structure, a backward mapping of granular emotions was performed onto Plutchik’stypology. Finally, we identified the sentiment associated with the tweets.
, Vol. 1, No. 1, Article . Publication date: June 2020.

12 Javed et al.
3 MODEL SELECTION
3.1 Model selection for Dependent variable
The dependent variable size, which represented the number of retweets, is a positive non-zeronumber (due to the cutoff of 5 imposed). Thus we considered number of statistical count datamodels. Count data models account for the rate of an event, which in our case was the number oftimes the tweet was retweeted during the observation period. Typically, the Poisson model is usedfor count data modelling, where, the model predicts the incidence rate ratio of an event. One of thecritical assumptions of the Poisson model is that variance and mean of the dependent variable areequivalent, i.e. there is no over-dispersion.
However, on inspection of our data, we observed the dependent variable size mean and variancewere 86.53 and 667,804 respectively for the malicious sample, and 90.86 and 1,160.23 respectivelyfor the benign sample, both indicating over-dispersion. Therefore a negative binomial model wasselected. Given the lack of zeros in the dependent variable we used the zero-truncated variant ofthe negative binomial model (ZTNB).
Pr (yi |yi > 0) =(Γ(yi + α
−1)/yi !Γ(α−1))(α−1/(α−1+ µi ))
α−1(µi/(α
−1+ µi ))
yi
1 − (1 + αµi )α−1 (1)
E(yi |yi > 0) =µi
Pr (yi > 0)=
µi
1 − (1 + αµi )α−1 (2)
Var (yi |yi > 0) =E(yi |yi > 0)
Pr (yi > 0)α[1 − Pr (yi = 0)α+1E(yi |yi > 0)] (3)
L =
N∏
i=1
Pr (yi |yi > 0) (4)
=
N∏
i=1
(Γ(yi + α−1)/yi !Γ(α−1))(α−1/(α−1
+ µi ))α−1
(µi/(α−1+ µi ))
yi
1 − (1 + αµi )α−1 (5)
loд(µi ) = β0 + β1X1i + β2X2i + · · · + βkXki (6)
The zero-truncated models calculate the probability of response variable (size- number of retweetsa tweet got) based on positive count data using Bayes’s Theorem [23, 25, 37]. Above shows theprobability mass function (see equation 1), mean (see equation 2), variance (see equation 3), likeli-hood function (see equation 4) and response surface (see equation 6) of a zero- truncated negativebinomial model. Where Pr (yi |yi > 0) is the probability mass function of the zero truncated neg-ative binomial distribution, E(yi |yi > 0) is the expectation of zero-truncated negative binomialdistribution, Var (yi |yi > 0) is the variance of zero-truncated negative binomial distribution, α Ìĺis the over-dispersion parameter, L is the likelihood function, µi is the estimated retweet countfor the ith observation, yi is the observed retweet count for the ith observation, k is the parametercoefficient of the kth predictor variable (k = 0 for intercept), Xki is the value of the kth predictorvariable ( Hashtag, Mentions, Friends, Followers, Account Age, Anger, Anticipation, Disgust, Fear,Joy, Sadness, Surprise, Trust, Negative, and Positive) for the ith observation.
3.2 Survival model - Cox Proportional hazard regression
Having identified the model to understand the factors behind a retweet, we moved onto identifyfactors that affected the survival of a tweet containing a malicious URL. Survival analysis involvesthe modelling of time to event data; in this context, failure to retweet is considered an "event". Weconducted survival analysis to analyse the duration of time until users stop retweeting a malicious
, Vol. 1, No. 1, Article . Publication date: June 2020.

Emotions behind Drive-by Download Propagation on Twitter 13
or benign URL. This allowed us to understand the factors that increase or decrease hazards tosurvival. For instance, we were interested in identifying if emotions such as anger or fear had anyeffect on the hazard rate for information flow survival. Put another way, does the lifetime of atweet (lifetime is defined as the time from the first tweet to last retweet) increase when anger isexpressed in textual content? In order to identify explanatory factors to model information flowsurvival, we chose Cox’s proportional hazards model [2]. Cox’s model produces a survival functionthat predicts the probability that a retweet is made in the present time frame for the given valuesof the predictor variables. Given the predictor variables X at a given time t the survival functioncan be defined as λ(t |X ) where
λ(t |X ) = λ0(t)exp(β1X1 + β2X2 + .....βnXn) (7)
Based on this, the partial likelihood for X can be calculated using:
L(β) =∑
i :Ci=1
θi∑j :Yj ≥Yi θi
(8)
Where for a given tweet i, Ci is an indicator of the time corresponding to the tweet and θi =
exp(β1X1 + β2X2 + .....βnXn)
3.3 Kaplan-Meier estimation
In order to show the impact of survival rate when an emotion or sentiment is detected, we usedKaplan-Meier estimation model to plot the survival function. The generated plot consists of adeclining horizontal step. The estimator can be represented by :
S(t) = Πti<tni − di
ni(9)
Where ni is the number of tweets that were retweeted and di is the number of tweets that failed tobe retweet at time ti.
4 RESULTS
Table 4 and Table 5 give a summary of the results for the zero-truncated negative binomial modelsbuilt for our dependent variable size using the malicious and benign datasets. Table 6 and Table 7give a summary of the results for the Cox proportional hazard regression models for our dependentvariable survival. The independent variables are divided into the three categories: social, emotionand sentiment factors. Several statistically significant associations are observed between the predic-tor and dependent variables. For count data models in place of coefficients the incident rate ratio(IRR) is shown for each predictor. The IRR is derived by the exponentiation of the zero truncatednegative binomial regression coefficients, allowing for the interpretation of retweet incidence rates(as opposed to logs of expected retweet counts). We can therefore use the IRR to report the strengthof causal associations between certain factors and the information flow size, enabling us to identifyquantitatively which factors are more important than others.
In terms of our results, the magnitude of the effect of our variables of interest (emotions, sentimentand social content) on retweets is expressed as a percentage change in the incident rate of a retweetwhen all other factors in the model are held constant. An IRR of more than one indicates thepercentage change in the incidence of a retweet increases, whereas an IRR of less than one indicatesthe reverse. For example, in Table 4, IRR for Surprise is 1.7851390, which is greater than one. So thepercentage change in the IRR is calculated as:
%increase = (IRR − 1) ∗ 100 = (1.7851390 − 1) ∗ 100 = 78.51390% (10)
, Vol. 1, No. 1, Article . Publication date: June 2020.
14 Javed et al.
Which is interpreted as, by holding all other factors constant tweets that contained more wordsassociated with the emotion Surprise were more likely to be retweeted by 78.51390%. Similarly, inTable 4 percentage change in the incident rate for Hashtag (IRR=0.893171), where IRR is less thanone, is calculated in the following way
%decrease = (1 − IRR) ∗ 100 = (1 − 0.8931710) ∗ 100 = 10.6829% (11)
Which is interpreted as, by holding all other factors constant tweets that contain higher number ofhashtags were less likely to be retweeted by 10.6829%
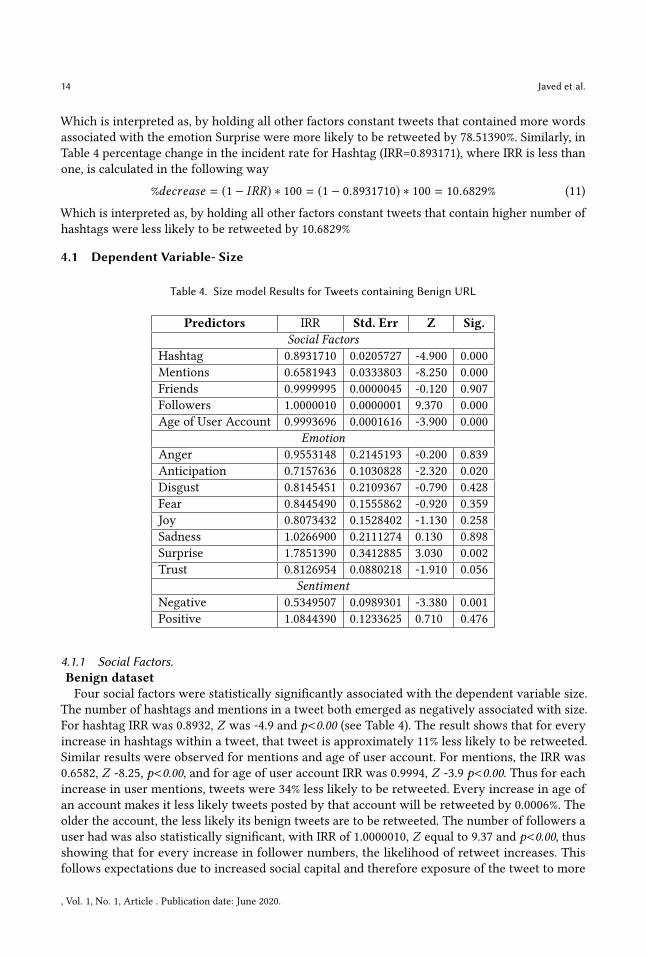
4.1 Dependent Variable- Size
Table 4. Size model Results for Tweets containing Benign URL
Predictors IRR Std. Err Z Sig.
Social Factors
Hashtag 0.8931710 0.0205727 -4.900 0.000Mentions 0.6581943 0.0333803 -8.250 0.000Friends 0.9999995 0.0000045 -0.120 0.907Followers 1.0000010 0.0000001 9.370 0.000Age of User Account 0.9993696 0.0001616 -3.900 0.000
Emotion
Anger 0.9553148 0.2145193 -0.200 0.839Anticipation 0.7157636 0.1030828 -2.320 0.020Disgust 0.8145451 0.2109367 -0.790 0.428Fear 0.8445490 0.1555862 -0.920 0.359Joy 0.8073432 0.1528402 -1.130 0.258Sadness 1.0266900 0.2111274 0.130 0.898Surprise 1.7851390 0.3412885 3.030 0.002Trust 0.8126954 0.0880218 -1.910 0.056
Sentiment
Negative 0.5349507 0.0989301 -3.380 0.001Positive 1.0844390 0.1233625 0.710 0.476
4.1.1 Social Factors.
Benign dataset
Four social factors were statistically significantly associated with the dependent variable size.The number of hashtags and mentions in a tweet both emerged as negatively associated with size.For hashtag IRR was 0.8932, Z was -4.9 and p<0.00 (see Table 4). The result shows that for everyincrease in hashtags within a tweet, that tweet is approximately 11% less likely to be retweeted.Similar results were observed for mentions and age of user account. For mentions, the IRR was0.6582, Z -8.25, p<0.00, and for age of user account IRR was 0.9994, Z -3.9 p<0.00. Thus for eachincrease in user mentions, tweets were 34% less likely to be retweeted. Every increase in age ofan account makes it less likely tweets posted by that account will be retweeted by 0.0006%. Theolder the account, the less likely its benign tweets are to be retweeted. The number of followers auser had was also statistically significant, with IRR of 1.0000010, Z equal to 9.37 and p<0.00, thusshowing that for every increase in follower numbers, the likelihood of retweet increases. Thisfollows expectations due to increased social capital and therefore exposure of the tweet to more
, Vol. 1, No. 1, Article . Publication date: June 2020.

Emotions behind Drive-by Download Propagation on Twitter 15
Table 5. Size model Results for Tweets containing Malicious URL
Predictors IRR Std. Err Z Sig.
Social Factors
Hashtag 1.2493 0.0783 3.5500 0.0000Mentions 0.9678 0.0892 -0.3500 0.7230Friends 1.0000 0.0000 -0.8600 0.3880Followers 1.0000 0.0000 2.7300 0.0060Age of User Account 0.9999 0.0003 -0.4500 0.6540
Emotion
Anger 0.6585 0.1471 -1.8700 0.0610Anticipation 1.2971 0.1122 3.0100 0.0030Disgust 0.9395 0.1492 -0.3900 0.6950Fear 2.4397 0.3817 5.7000 0.0000Joy 0.9353 0.0840 -0.7400 0.4560Sadness 1.3274 0.1731 2.1700 0.0300Suprise 0.6941 0.0471 -5.3800 0.0000Trust 0.6883 0.0699 -3.6800 0.0000
Sentiment
Negative 1.0526 0.2703 0.2000 0.8420Positive 0.9531 0.1278 -0.3600 0.7200
people.Malicious dataset
Two variables from the set of independent variables in social factors were statistically significantlyassociated with the dependent variable size. For hashtags, the IRR was 1.2493, Z 3.55 and p<0.00
(see Table 5). This association showed that for every increase in hashtags in a tweet, the chancesof retweet are increased by around 25%. We also observed that the number of followers that theperson tweeting had, was also statistically significant and we observed IRR of 1.00, Z equal to 2.73and p<0.006. We observed that even though IRR for followers was statistically significant, it did notaffect the retweeting behaviour(IRR=1).
4.1.2 Emotion and Sentiment.
Benign dataset
Two positive emotions out of the eight primary emotions used as the independent variable werefound to be statistically significant. Results showed an IRR of 0.7157636, Z -2.320 and p<0.02 foranticipation. For every increase in words relating to anticipation, the tweet was 28% less likely tobe retweeted However, for every increase in the emotion surprise, tweets were more likely to beretweeted by 78% (IRR=1.7851390,Z=3.030 and p<0.02) when compared to tweets not containingsurprise (see Table 4). Among the independent variables in the sentiment set, negative sentiment(IRR=0.5349507,Z=-3.38 and p<0.001) was statistically significant, showing that for benign tweetsposted during a sporting event, every increase in words containing negative is associated with a47% reduction in retweet likelihood.Malicious dataset
Five out of the eight emotions were found to be statistically significant, whereas no significantassociation was found for sentiment. From the set of negative emotions, fear and sadness werepositively associated with size. Where fear has an IRR of 2.4397, Z of 5.7 and p<0.00, and sadness has
, Vol. 1, No. 1, Article . Publication date: June 2020.

16 Javed et al.
an IRR of 1.3284, Z of 2.17 and p<0.03 (see Table 5). In malicious tweets, for every increase in wordsrelating to fear, the likelihood of retweet increased by 143%. For sadness, each increase is associatedwith a 33% increase in retweet likelihood. Anticipation evokes the feeling of excitement whereassurprise is felt when the unexpected happens and both of them were found to be statisticallysignificant. For anticipation the IRR was 1.2971, Z 3.01 and p<0.03 and for surprise the IRR was0.6941, Z -5.38 and p<0.00 (see Table 5). Meaning malicious tweets that contained anticipation weremore likely to be retweeted by 30% for each additional word containing this emotion, and those thatcontained surprise were less likely to be retweeted by 31%. Interestingly, anticipation had a positiveassociation with the number of retweets whereas surprise had a negative association comparedto results from benign dataset sample. From the set of positive emotions, trust was observed tobe statistically significant. It was observed to have a negative association with information flow,having an IRR of 0.6883, Z of -3.68 and p<0.00. We interpret this as meaning for every increasein text representative of trust, malicious URLs spread less by a factor of 31%. . The Bayesianinformation criterion for the full model was observed to be 10,660.43 and Log-Likelihood to be-5270.41 suggesting a good fit to the data.
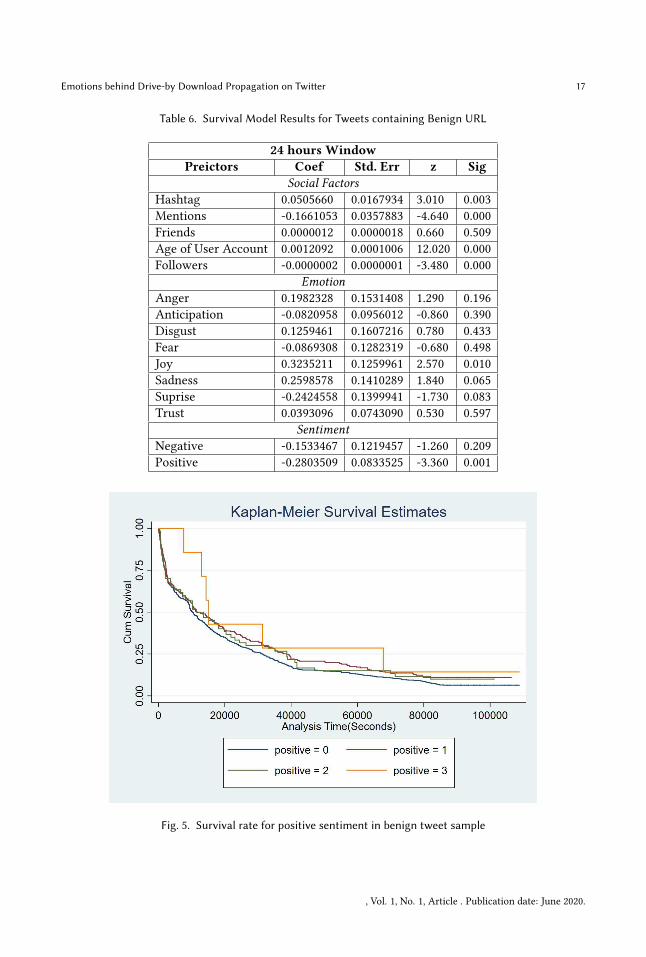
4.2 Dependent Variable -Survival
Table 6 and 7 shows the result obtained from the Cox proportional hazards model for both maliciousand benign tweets. Considering the diversity of each sporting event regarding the length of playtime(from 90 minutes for a football game to around 480 minutes to cricket match), we wanted to seewhich information survived longer than 24 hours when the sporting event was over. Therefore, theCox proportional hazard model was created for the 24 hour time window. Results from the modelindicated several statistically significant association between the dependent variable (survival)and our predictive factors. As the model is used to explain the proportional hazards, a positive βindicate an increase in hazard to survival meaning it reduces the survival of information flow andvice versa.
4.2.1 Social Factors.
Benign dataset
Holding all factors constant we found hashtags(β = 0.05056, z = 3.01) and age of account created(β = 0.0012092, z = 12.02) to be statistically significant and positively associated with hazards tosurvival. The results showed that benign tweets that contained a higher number of hashtags or areposted by accounts that were recently created have less chance of survival - i.e. will be retweetedfor a shorter period than those with less hashtags or with older accounts. We also found usermentions (β = −0.166, z = −4.64) and number of followers a user have (β = −0.0000002, z = −3.48)to statistically significant and negatively associated with hazard of survival.We also found positive sentiment to be statistically significant and associated with decreased
hazards to survival. Figure 5 illustrates using Kaplan-Meir survival estimates that benign tweetswith higher numbers of positive words have an increased chance of survival over longer periods.Malicious dataset
Holding all factors constant we found user mentions (β = 0.13513360, z = 3.17) and a number offollowers a user have (β = 0.00000017, z = 2.76) to be statistically significant in predicting hazardto survival. Both of them were found to be positively associated with hazard of survival. Resultsshowed that the more the cybercriminal uses user mentions in a tweet (e.g. trying to target users)or has an extensive social network (often a sign of bots who buy followers), the more it decreasesthe chance of survival. A negative association was observed by the number of friends a user has(β = −0.00001060, z = −1.970), showing more the number of friends a user has the higher thechances of survival of a tweet.
, Vol. 1, No. 1, Article . Publication date: June 2020.
Emotions behind Drive-by Download Propagation on Twitter 17
Table 6. Survival Model Results for Tweets containing Benign URL
24 hours Window
Preictors Coef Std. Err z Sig
Social Factors
Hashtag 0.0505660 0.0167934 3.010 0.003Mentions -0.1661053 0.0357883 -4.640 0.000Friends 0.0000012 0.0000018 0.660 0.509Age of User Account 0.0012092 0.0001006 12.020 0.000Followers -0.0000002 0.0000001 -3.480 0.000
Emotion
Anger 0.1982328 0.1531408 1.290 0.196Anticipation -0.0820958 0.0956012 -0.860 0.390Disgust 0.1259461 0.1607216 0.780 0.433Fear -0.0869308 0.1282319 -0.680 0.498Joy 0.3235211 0.1259961 2.570 0.010Sadness 0.2598578 0.1410289 1.840 0.065Suprise -0.2424558 0.1399941 -1.730 0.083Trust 0.0393096 0.0743090 0.530 0.597
Sentiment
Negative -0.1533467 0.1219457 -1.260 0.209Positive -0.2803509 0.0833525 -3.360 0.001
Fig. 5. Survival rate for positive sentiment in benign tweet sample
, Vol. 1, No. 1, Article . Publication date: June 2020.

18 Javed et al.
Table 7. Survival Model Results for Tweets containing Malicious URL
24 hours Window
Predictors Coef Std. Err z Sig
Social Factors
Hashtag -0.02988310 0.02786000 -1.070 0.283Mentions 0.13513360 0.04256820 3.170 0.002Friends -0.00001060 0.00000539 -1.970 0.049Age of User Account -0.00008420 0.00014620 -0.580 0.565Followers 0.00000017 0.00000006 2.760 0.006
Emotion
Anger 0.35190140 0.09892910 3.560 0.000Anticipation -0.02911340 0.04077730 -0.710 0.475Disgust -0.00215150 0.07319090 -0.030 0.977Fear -0.19202340 0.06798030 -2.820 0.005Joy 0.01330880 0.04505960 0.300 0.768Sadness 0.04871910 0.07660280 0.640 0.525Suprise 0.00820430 0.05620190 0.150 0.884Trust -0.04157660 0.06243850 -0.670 0.505
Sentiment
Negative 0.02373590 0.11119810 0.210 0.831Positive 0.10034690 0.07497770 1.340 0.181
4.2.2 Emotion and Sentiment.
Benign dataset
Independent variables representing emotion and sentiment in a tweet were derived from thecontents of the tweet based on the words it contained. Survival models were built using theseindependent variables. The results (see table 6) showed that only the positive emotion of joyand positive sentiment were statistically significant in predicting hazard to the survival of theinformation flow. We observed a positive association for joy (β = 0.3235211, z = 2.570) indicatingthat chances of survival reduced if the tweet reflected joy. However, tweets that reflected a positivesentiment showed a negative association (β = −0.2803509, z = −3.360). Results showed that morepositive tweets had a greater chance of survival.Malicious dataset
Sentiment alone was not found to be statistically significant. However, we found two emotionsto be statistically significant in predicting hazard to the survival of information flow. Resultsshowed that anger(β = 0.352, z = 3.56) was positively significantly associated, indicating thechances of survival reduces if the tweet is reflecting anger. However, tweets that reflected fear(β = −0.192, z = −2.82) showed a negative association indicating that chance of survival of amalicious tweet increases if a cybercriminal posts an intimidating tweet.Figure 6 illustrates Kaplan-Meir survival estimates for those tweets that reflect the fear emotion.The levels of fear (0-3) represent the number of words related to this emotion in the tweet. Theresults showed that the more the words associated with fear were used in creating a malicioustweet, the higher were the chances of its survival. Fear spreads longer than any other emotion inmalicious tweets.
, Vol. 1, No. 1, Article . Publication date: June 2020.

Emotions behind Drive-by Download Propagation on Twitter 19
Fig. 6. Survival rate for fear in malicious dataset
5 DISCUSSION
We collected Twitter data around seven sporting events using event-specific hashtags. Sportingevents had been chosen specifically because they attracted a large number of users which gavecybercriminals an opportunity to spread drive-by download attacks by obfuscating malicious URLsin tweets. A sub-sample of 274,820 tweets was randomly created from the collected data sampleof around 3.5 million tweets, that were preprocessed to remove the retweeted tweets before theunique URL was extracted from them. The resultant sample of 31,171 unique URLs was later passedon to Capture HPC, a high interaction honeypot, that was set up to distinguish malicious tweetsfrom benign. Once a URL was passed to the Capture HPC server, it interacted with the Web serverfor a limited period and, based on changes made to the client machine, it classified the URL intomalicious (drive-by download attack occurring from the endpoint of a URL) or benign. The changesmade to the client machine clarified that Capture HPC identified around 6,122 malicious and 25,049benign URLs. Across all the seven events we identified all the tweets that contained these maliciousand benign URLs, including retweets, to understand the propagation of a drive-by download attackon Twitter. The research aimed to identify social and content factors, such as the emotion andsentiment in the tweet, that was associated with the propagation of malicious URLs. With thenature of the sample data in mind, we chose the zero-truncated negative binomial method to modelsize and the Cox proportional hazard model to calculate the survival as the dependent variables -and social and content features as the independent variables.In line with previous research on the virality of news [4, 64] and spam detection [26] in OSNs,
several significant associations for emotions and sentiment were revealed between information sizeand survival. Among the social features, hashtags stood out, being created by users to give contextto their post and link them to related topics to reach a targeted audience, increase traffic to theirpost, and in turn increase interactions and the probability that their tweet will be retweeted. Arecent report on the engagement of users on online social platforms revealed that though hashtags
, Vol. 1, No. 1, Article . Publication date: June 2020.
20 Javed et al.
provide context and are thus important elements in a post, they reduce user engagement if theirnumber increases beyond a threshold [47]. Interestingly, our results for tweets that containedbenign URLs were in line with Clement et al. [47]. Their results show that tweets classified asbenign do not engage users’ interest and are 11% less likely to be retweeted if they contain morehashtags. This contradicted our finding for those tweets that were classified as malicious. Ourresults show that malicious tweets were 24% more likely to be retweeted if they contained morehashtags. One explanation for this could be that hashtags which trigger emotional responses areadded to tweets to gain popularity or to engage users, as has been shown in earlier work where arelationship was identified between emotion and content sharing [4].
5.1 Re-tweetability of a Tweet
For benign tweets the number of followers of the posting user was positively associated with thechances of them being retweeted (see Table 6). However, though followers were statistically signifi-cant in the propagation of malicious tweets, the effect size was very small suggesting cybercriminalsdo not depend heavily on their followers to propagate malware and may seek other techniques forthis purpose, including the use of content features (sentiment or emotion), embedding hashtagsthat highlight the tweet, or using techniques such as paying for retweets [11, 12] from black marketservices such as Like4Like [13] or YouLikeThis[45].Information that is novel attracts people [27] and things that are attractive are worth sharing
on online social platforms [4]. Information that is found novel is also considered valuable andsurprising. Based on this principle, Berger et al. showed that content on OSNs that evokes higharousal emotions such as ’awe’ have a higher probability of being propagated by the action ofsharing [4]. Since the emotion ’awe’ can be derived from the root emotion surprise [59], we foundthat tweets which were classified as benign and contained keywords associated with surprise were78% more likely to be retweeted. Even though a higher number of tweets (33% malicious comparedto 8% benign) contained one or more keywords associated with the emotion surprise in a maliciousdataset, it was not statistically significant for the size of the information flow. This suggests that itwas not one of the driving factors behind a high retweet count. Rather, it was negative emotionssuch as fear and sadness that were found to be statistically significant for the size of the informationflow. The results show fear to have the highest incident rate ratio (2.4), meaning that each tweetthat reflected fear was 114% more likely to be retweeted. A comparison of sample size revealedthat 30% of the tweets from the malicious data sample contained one or more keywords associatedwith fear compared to 8% from the benign data sample, suggesting that a higher number of wordsassociated with the emotion ’fear’ were used in constructing tweets with a malicious link. Eventhough negative emotion was present in the benign dataset it was not found statistically significantfor the size of the information flow in the dataset categorised as benign.To investigate further the choice of keywords used that helped a tweet to gain popularity or
be retweeted, a world cloud (see Figure 7 and Figure 8) was created from the tweets that werecategorised as malicious and and tweets that were categorised as benign . On closer inspectionwords such as "kill", "fight", "shot", "controversy" etc. were frequently observed in tweets thatcontained malicious URLs. Whereas words such "Team", "love", "happy","good", "enjoy","fun" werefound in benign tweets. This suggests that carefully selected words were being used in the formationof these tweets, where a keyword could trigger emotional arousal using negative emotions suchas fear, anger, or sadness that could encourage the propagation of malicious tweets. [4, 64]. Wefurther investigated the number of words used in tweets that created emotional arousal and foundthat tweets that were classified as malicious contained more words associated with emotions thandid the tweets classified as benign (see Figure 9).Even though the collective intensity (total number of words associated with emotions) of positive
, Vol. 1, No. 1, Article . Publication date: June 2020.

Emotions behind Drive-by Download Propagation on Twitter 21
Fig. 7. Word Cloud of Malicious Tweet
Fig. 8. Word Cloud of Benign Tweet
emotions such as anticipation, surprise, trust and joy were higher than those of the negative
, Vol. 1, No. 1, Article . Publication date: June 2020.
22 Javed et al.
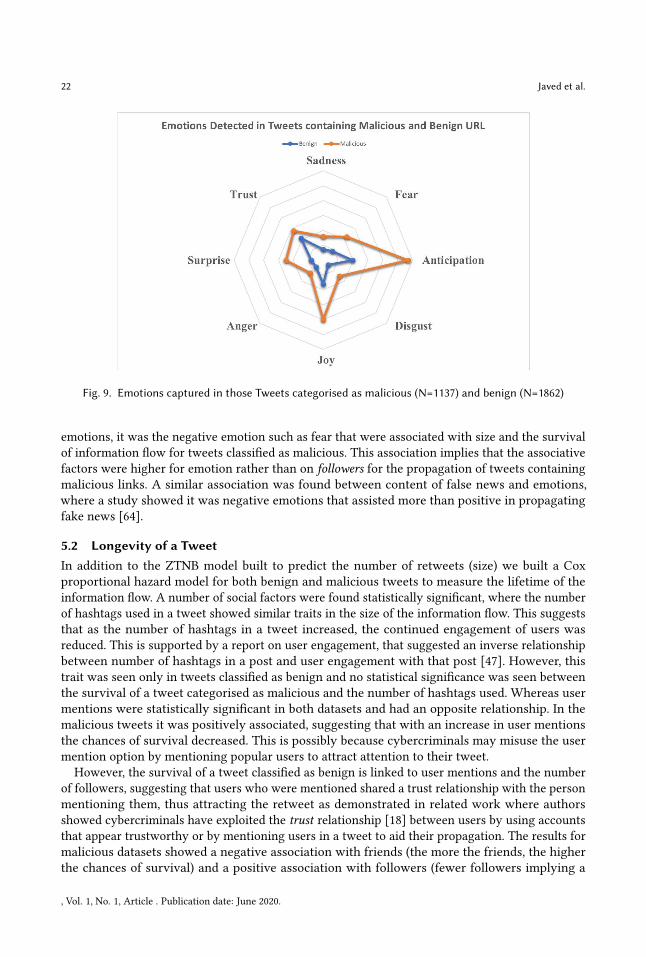
Fig. 9. Emotions captured in those Tweets categorised as malicious (N=1137) and benign (N=1862)
emotions, it was the negative emotion such as fear that were associated with size and the survivalof information flow for tweets classified as malicious. This association implies that the associativefactors were higher for emotion rather than on followers for the propagation of tweets containingmalicious links. A similar association was found between content of false news and emotions,where a study showed it was negative emotions that assisted more than positive in propagatingfake news [64].
5.2 Longevity of a Tweet
In addition to the ZTNB model built to predict the number of retweets (size) we built a Coxproportional hazard model for both benign and malicious tweets to measure the lifetime of theinformation flow. A number of social factors were found statistically significant, where the numberof hashtags used in a tweet showed similar traits in the size of the information flow. This suggeststhat as the number of hashtags in a tweet increased, the continued engagement of users wasreduced. This is supported by a report on user engagement, that suggested an inverse relationshipbetween number of hashtags in a post and user engagement with that post [47]. However, thistrait was seen only in tweets classified as benign and no statistical significance was seen betweenthe survival of a tweet categorised as malicious and the number of hashtags used. Whereas usermentions were statistically significant in both datasets and had an opposite relationship. In themalicious tweets it was positively associated, suggesting that with an increase in user mentionsthe chances of survival decreased. This is possibly because cybercriminals may misuse the usermention option by mentioning popular users to attract attention to their tweet.
However, the survival of a tweet classified as benign is linked to user mentions and the numberof followers, suggesting that users who were mentioned shared a trust relationship with the personmentioning them, thus attracting the retweet as demonstrated in related work where authorsshowed cybercriminals have exploited the trust relationship [18] between users by using accountsthat appear trustworthy or by mentioning users in a tweet to aid their propagation. The results formalicious datasets showed a negative association with friends (the more the friends, the higherthe chances of survival) and a positive association with followers (fewer followers implying a
, Vol. 1, No. 1, Article . Publication date: June 2020.

Emotions behind Drive-by Download Propagation on Twitter 23
higher chance of survival), suggesting that malicious tweets from accounts that have a low ratio offollowers to friends have a higher chance of survival. This could be one of the tactics employed bycybercriminals to prevent detection, since the follower to friend ratio is identified as one of the keyfeatures for flagging an account as malicious [54, 60, 70]. Experimental results show that a tweetcategorised as malicious will survive longer if posted by an account that has many friends and usesfewer user mentions. However, these features were not statistically significant for tweets classifiedas benign.In terms of emotions that were associated with the survival of a tweet, the results were similar
to those on the size of the information flow. For a benign dataset, positive sentiment, which is theemotional effect of the tweet on its reader, was found statistically significant for its survival. Thiswas similar to the size of information flow for benign tweets, where tweets containing emotionswith positive associations were likely to be retweeted. Similarly, it was the negative emotions thatinfluenced the survival of a tweet classified as malicious, where, like the size of the informationflow, fear stood out from the other negative emotions. Tweets that contained keywords associatedwith fear were more likely to survive the twenty-four hour window after the sporting event andmore likely to be retweeted.
5.3 Security Controls Implemented by Twitter
The approach proposed in this work could extend and complement more technically focusedapproaches reported in literature. For instance, Twitter has put in place numerous security controlsto identify and block malicious URLs. These include their in-house detection software, reportingof malicious URLs by users, third-party vendors and their business partners [63]. When a URL isidentified as malicious, a degree of certainty score is given to each URL, based on which a URLcan be blocked or a warning can be associated with the tweet. This degree of certainty is definedby Twitter and is dependent on the content of the Web page pointed to by the URL. Despite thesesecurity measures, it was discovered by Lee and Kim [34] that Twitter’s own algorithm could takeup to a day to identify and block malicious URLs. This was achieved by comparing the performanceof their model based on URL redirects to the detection algorithm used by Twitter. Similarly, Thomaset al. [62] analysed the behaviour and lifetime of around 80 million spam accounts, the campaignsthey execute, and the wide-spread abuse of legitimate web services such as URL shorteners andfree Web hosting. Their results show that 77% of accounts spreading spam/malware are suspendedwithin a day, but also that around 145,000 were active for up to a month. These results show thateven with Twitter’s security measures, there still remains a lag in detecting malicious URLs, whichis big enough to expose millions of users to malware over a short period of time. We posit that ourapproach could significantly speed up this process and reduce the risk to users. Considering thedetection lag, lifetime of malicious websites [38] and the number of tweets generated per minute(on average 350,000 tweets per minute [53]), our predictive model [28] only requires a few secondsto determine ‘maliciousness’. This could provide a step-change in detection approaches.
6 CONCLUSION AND FUTURE WORK
This study has analysed malware propagation across seven different sporting events covering adiverse group of users. Our results show that there is a statistically significant association betweenthe social and emotional factors derived from a tweet captured during a sporting event. In thispaper, it was observed that malware propagation was not strongly associated with the number offollowers that a user had. The stronger association was towards content driven features, such asemotions and the choice of words associated with emotions that were used to compose a tweet orcreate hashtags. Even though the malicious dataset had lower numbers, the cumulative intensity ofemotions (see Figure 9) was much higher than in the tweets containing benign tweets. The results
, Vol. 1, No. 1, Article . Publication date: June 2020.

24 Javed et al.
showed that tweets that contain malicious links are associated with negative emotions, particularlythe emotion fear, for their retweet likelihood (virality) and survival. Whereas, in tweets that areclassified as benign, it was the positive sentiment and high arousal emotions such as surprise thatwere associated with the size and survival of the information flow.
The analysis was conducted solely on the content of the tweet, which was seen by the user.We cannot assume that the user clicked on the URL and visited the Web page before retweeting.Therefore, the Web page content was not considered. We have added this as a consideration forfuture work, but one would need to be able to determine which URLs were visited, and which werenot, which is not trivial. It is important for the rigour of the work that we avoid speculation.Furthermore, our finding could be used to create a filter to segregate those tweets that contain
negative emotions/sentiments as they would have a high probability to be malicious. The aimof the filter would be to reduce the input load to a detection classifier/software. Furthermore,content driven features could also be used to increase the f-measure of drive-by download de-tection/prediction models such as the one developed by Javed et al. [28]. Also, these attributescould be used to understand social network formed by users posting malicious content. However,development of such filters, understanding social networks or building machine learning modelsusing features associate to propagation would be considered as part of future projects.
ACKNOWLEDGMENTS
This work was part-supported by the Economic and Social Research Council grant: "Social DataScience Lab - Continuation of Methods and Infrastructure Development for Open Data Analyticsin Social Research"(grant number: ES/P008755/1) .
REFERENCES
[1] Mansour Ahmadi, Ashkan Sami, Hossein Rahimi, and Babak Yadegari. 2013. Malware detection by behaviouralsequential patterns. Computer Fraud & Security 2013, 8 (2013), 11ś19.
[2] Per Kragh Andersen and Richard David Gill. 1982. Cox’s regression model for counting processes: a large samplestudy. The annals of statistics (1982), 1100ś1120.
[3] Lars Backstrom, Jon Kleinberg, Lillian Lee, and Cristian Danescu-Niculescu-Mizil. 2013. Characterizing and curatingconversation threads: expansion, focus, volume, re-entry. In Proceedings of the sixth ACM international conference on
Web search and data mining. ACM, 13ś22.[4] Jonah Berger and Katherine L Milkman. 2012. What makes online content viral? Journal of marketing research 49, 2
(2012), 192ś205.[5] Jonah Berger and Katherine L Milkman. 2013. Emotion and virality: what makes online content go viral? GfK Marketing
Intelligence Review 5, 1 (2013), 18ś23.[6] Pete Burnap, Matthew L Williams, Luke Sloan, Omer Rana, William Housley, Adam Edwards, Vincent Knight, Rob
Procter, and Alex Voss. 2014. Tweeting the terror: modelling the social media reaction to the Woolwich terrorist attack.Social Network Analysis and Mining 4, 1 (2014), 206.
[7] R. Steenson. C. Seifert. 2017. Capture-HPC. https://projects.honeynet.org/capture-hpc.[8] Jian Cao, Qiang Li, Yuede Ji, Yukun He, and Dong Guo. 2016. Detection of forwarding-based malicious URLs in online
social networks. International Journal of Parallel Programming 44, 1 (2016), 163ś180.[9] Yijin Chen, Yuming Mao, Supeng Leng, Yunkai Wei, and Yuchen Chiang. 2017. Malware propagation analysis in
message-recallable online social networks. In Communication Technology (ICCT), 2017 IEEE 17th International Conference
on. IEEE, 1366ś1371.[10] Shin-Ming Cheng, Weng Chon Ao, Pin-Yu Chen, and Kwang-Cheng Chen. 2011. On modeling malware propagation in
generalized social networks. IEEE Communications Letters 15, 1 (2011), 25ś27.[11] Aditya Chetan, Brihi Joshi, Hridoy Sankar Dutta, and Tanmoy Chakraborty. 2019. CoReRank: Ranking to Detect
Users Involved in Blackmarket-Based Collusive Retweeting Activities. In Proceedings of the Twelfth ACM International
Conference on Web Search and Data Mining. ACM, 330ś338.[12] Hridoy Sankar Dutta, Aditya Chetan, Brihi Joshi, and Tanmoy Chakraborty. 2018. Retweet us, we will retweet you:
Spotting collusive retweeters involved in blackmarket services. In 2018 IEEE/ACM International Conference on Advances
in Social Networks Analysis and Mining (ASONAM). IEEE, 242ś249.
, Vol. 1, No. 1, Article . Publication date: June 2020.

Emotions behind Drive-by Download Propagation on Twitter 25
[13] Edgefluence. 2019. Like4Like - Get FREE real Instagram likes! https://like4like.com [Online; accessed 25. Mar. 2019].[14] Paul Ekman. 1992. An argument for basic emotions. Cognition & emotion 6, 3-4 (1992), 169ś200.[15] W Fan and KH Yeung. 2011. Online social networksâĂŤParadise of computer viruses. Physica A: Statistical Mechanics
and its Applications 390, 2 (2011), 189ś197.[16] Chris Fleizach, Michael Liljenstam, Per Johansson, Geoffrey M Voelker, and Andras Mehes. 2007. Can you infect me
now?: malware propagation in mobile phone networks. In Proceedings of the 2007 ACM workshop on Recurring malcode.ACM, 61ś68.
[17] James H Fowler and Nicholas A Christakis. 2008. Dynamic spread of happiness in a large social network: longitudinalanalysis over 20 years in the Framingham Heart Study. Bmj 337 (2008), a2338.
[18] Sheera Frenkel. 2017. Hackers Hide Cyber attacks in Social Media Posts. N. Y. Times (May 2017). https://tinyurl.com/yy87rbgj
[19] Ayalvadi Ganesh, Laurent Massoulié, and Don Towsley. 2005. The effect of network topology on the spread of epidemics.In INFOCOM 2005. 24th Annual Joint Conference of the IEEE Computer and Communications Societies. Proceedings IEEE,Vol. 2. IEEE, 1455ś1466.
[20] Alexandra Gibbs. 2015. Super Bowl XLIX smashes Twitter records. CNBC (Feb 2015). https://www.cnbc.com/2015/02/02/super-bowl-xlix-and-social-media-most-tweeted-nfl-game-ever.html
[21] Nelson Granados. 2016. Super Bowl Underperforms In TV Audience And Social Media Chatter. Forbes (Feb2016). https://www.forbes.com/sites/nelsongranados/2016/02/09/super-bowl-underperforms-in-tv-audience-and-social-media-chatter/#2a7611a02be3
[22] Shashank Gupta and Brij Bhooshan Gupta. 2017. Cross-Site Scripting (XSS) attacks and defense mechanisms: clas-sification and state-of-the-art. International Journal of System Assurance Engineering and Management 8, 1 (2017),512ś530.
[23] Shiferaw Gurmu. 1991. Tests for detecting overdispersion in the positive Poisson regression model. Journal of Business& Economic Statistics 9, 2 (1991), 215ś222.
[24] Elaine Hatfield, John T Cacioppo, and Richard L Rapson. 1993. Emotional contagion. Current directions in psychological
science 2, 3 (1993), 96ś100.[25] Joseph M Hilbe. 2011. Negative binomial regression. Cambridge University Press.[26] Xia Hu, Jiliang Tang, Huiji Gao, and Huan Liu. 2014. Social spammer detection with sentiment information. In Data
Mining (ICDM), 2014 IEEE International Conference on. IEEE, 180ś189.[27] Laurent Itti and Pierre Baldi. 2009. Bayesian surprise attracts human attention. Vision research 49, 10 (2009), 1295ś1306.[28] Amir Javed, Pete Burnap, and Omer Rana. 2018. Prediction of drive-by download attacks on Twitter. Information
Processing & Management (2018).[29] Apalak Khatua and Aparup Khatua. 2017. Cricket World Cup 2015: Predicting User’s Orientation through Mix Tweets
on Twitter Platform. In Proceedings of the 2017 IEEE/ACM International Conference on Advances in Social Networks
Analysis and Mining 2017. ACM, 948ś951.[30] Ivana Kottasova. [n.d.]. Twitter reveals the top tweeted events of 2016 - Dec. 6, 2016. http://money.cnn.com/2016/12/
06/technology/twitter-top-events-hashtags-2016/index.html. (Accessed on 11/07/2018).[31] Adam DI Kramer, Jamie E Guillory, and Jeffrey T Hancock. 2014. Experimental evidence of massive-scale emotional
contagion through social networks. Proceedings of the National Academy of Sciences (2014), 201320040.[32] Brian Krebs. 2016. Ddos on dyn impacts twitter, spotify, reddit. Krebs on Security.(October 2016). Retrieved June 1 (2016),
2017.[33] Sam Laird. 2015. The top 15 sporting events that blew up Twitter in 2015. http://mashable.com/2015/12/07/2015-top-
sports-events-twitter/#7TVsYNhLQSqN.[34] Sangho Lee and Jong Kim. 2013. Warningbird: A near real-time detection system for suspicious urls in twitter stream.
IEEE transactions on dependable and secure computing 10, 3 (2013), 183ś195.[35] Bo Liu, Wanlei Zhou, Longxiang Gao, HaiBo Zhou, Tom H Luan, and Sheng Wen. 2016. Malware propagations in
wireless ad hoc networks. IEEE Transactions on Dependable and Secure Computing 1 (2016), 1ś1.[36] Liu Liu, Olivier De Vel, Qing-Long Han, Jun Zhang, and Yang Xiang. 2018. Detecting and preventing cyber insider
threats: A survey. IEEE Communications Surveys & Tutorials 20, 2 (2018), 1397ś1417.[37] J Scott Long. 1997. Regression models for categorical and limited dependent variables (Vol. 7). Advanced quantitative
techniques in the social sciences (1997).[38] D Kevin McGrath and Minaxi Gupta. 2008. Behind Phishing: An Examination of Phisher Modi Operandi. LEET 8
(2008), 4.[39] Saif M Mohammad and Peter D Turney. 2013. Crowdsourcing a wordśemotion association lexicon. Computational
Intelligence 29, 3 (2013), 436ś465.[40] Andreas Moser, Christopher Kruegel, and Engin Kirda. 2007. Exploring multiple execution paths for malware analysis.
In 2007 IEEE Symposium on Security and Privacy (SP’07). IEEE, 231ś245.
, Vol. 1, No. 1, Article . Publication date: June 2020.
26 Javed et al.
[41] Smita Naval, Vijay Laxmi, Muttukrishnan Rajarajan, Manoj Singh Gaur, and Mauro Conti. 2015. Employing programsemantics for malware detection. IEEE Transactions on Information Forensics and Security 10, 12 (2015), 2591ś2604.
[42] Danny Palmer. 2016. Is your Android phone being controlled by a rogue Twitter account? Botnet is first to receivecommands via tweets | ZDNet. https://tinyurl.com/y4wbmyor
[43] Romualdo Pastor-Satorras and Alessandro Vespignani. 2001. Epidemic spreading in scale-free networks. Physicalreview letters 86, 14 (2001), 3200.
[44] Robert Plutchik. 2003. Emotions and life: Perspectives from psychology, biology, and evolution. American PsychologicalAssociation.
[45] PorcelainSky LLC. 2019. Get Twitter Followers, YouTube Views, Subscribers - YouLikeHits. https://www.youlikehits.com [Online; accessed 25. Mar. 2019].
[46] Mohammad Puttaroo, Peter Komisarczuk, and Renato Cordeiro de Amorim. 2014. Challenges in developing Capture-HPC exclusion lists. In Proceedings of the 7th International Conference on Security of Information and Networks. ACM,334.
[47] Clement RenÃľ. 2019. Instagram Engagement Report 2019: The more hashtags, the less engagement. https://mention.com/blog/hashtags-engagement-instagram [Online; accessed 25. Mar. 2019].
[48] MG Roberts and JAP Heesterbeek. 2003. Mathematical models in epidemiology. EOLSS.[49] Joshua Roesslein. [n.d.]. Tweepy. http://www.tweepy.org/. (Accessed on 01/07/2018).[50] Charlotte Rogers. 2016. Euro 2016 most tweeted TV of the year. https://www.marketingweek.com/2016/12/14/euros-
tweeted-tv-2016 [Online; accessed 10. Dec. 2018].[51] SANS Institue. 2017. 2017 Threat Landscape Survey: Users on the Front Line. https://www.sans.org/reading-room/
whitepapers/threats/2017-threat-landscape-survey-users-front-line-37910.[52] Ameya Sanzgiri, Jacob Joyce, and Shambhu Upadhyaya. 2012. The early (tweet-ing) bird spreads the worm: An
assessment of twitter for malware propagation. Procedia Computer Science 10 (2012), 705ś712.[53] David Sayce. 2019. The Number of tweets per day in 2019 | David Sayce. https://www.dsayce.com/social-media/tweets-
day [Online; accessed 13. Mar. 2020].[54] Hua Shen, Fenglong Ma, Xianchao Zhang, Linlin Zong, Xinyue Liu, and Wenxin Liang. 2017. Discovering social
spammers from multiple views. Neurocomputing 225 (2017), 49ś57.[55] smfrogers. 2019. Insights into the #WorldCup conversation on Twitter. https://blog.twitter.com/en_us/a/2014/insights-
into-the-worldcup-conversation-on-twitter.html [Online; accessed 14. May 2019].[56] Parinaz Sobhani, Saif Mohammad, and Svetlana Kiritchenko. 2016. Detecting stance in tweets and analyzing its
interaction with sentiment. In Proceedings of the Fifth Joint Conference on Lexical and Computational Semantics.159ś169.
[57] Spotcal. 2019. Healthy TV audiences for final as 2015 Rugby World Cup hailed as ’biggest and best’ yet | FeaturedNews | News | Sportcal. https://www.sportcal.com/News/FeaturedNews/39963 [Online; accessed 14. May 2019].
[58] CricketCountry Staff. 2015. ICC Cricket World Cup 2015: India-Pakistan a Twitter hit, 1.7 million tweets. CricketCountry (Feb 2015). https://www.cricketcountry.com/criclife/icc-cricket-world-cup-2015-india-pakistan-a-twitter-hit-1-7-million-tweets-500296
[59] Carlo Strapparava, Alessandro Valitutti, et al. 2004. Wordnet affect: an affective extension of wordnet.. In Lrec, Vol. 4.Citeseer, 1083ś1086.
[60] Gianluca Stringhini, Christopher Kruegel, and Giovanni Vigna. 2010. Detecting spammers on social networks. InProceedings of the 26th annual computer security applications conference. ACM, 1ś9.
[61] Xin Sun, Yan-Heng Liu, Bin Li, Jin Li, Jia-Wei Han, and Xue-Jie Liu. 2012. Mathematical model for spreading dynamicsof social network worms. Journal of Statistical Mechanics: Theory and Experiment 2012, 04 (2012), P04009.
[62] Kurt Thomas, Chris Grier, Dawn Song, and Vern Paxson. 2011. Suspended accounts in retrospect: an analysis of twitterspam. In Proceedings of the 2011 ACM SIGCOMM conference on Internet measurement conference. 243ś258.
[63] Twitter. 2020. About unsafe links. (Mar 2020). https://help.twitter.com/en/safety-and-security/phishing-spam-and-malware-links
[64] Soroush Vosoughi, Deb Roy, and Sinan Aral. 2018. The spread of true and false news online. Science 359, 6380 (2018),1146ś1151.
[65] Bo Wang, Arkaitz Zubiaga, Maria Liakata, and Rob Procter. 2015. Making the most of tweet-inherent features forsocial spam detection on Twitter. arXiv preprint arXiv:1503.07405 (2015).
[66] Tianbo Wang, Chunhe Xia, Zhong Li, Xiaochen Liu, and Yang Xiang. 2017. The SpatialśTemporal Perspective: TheStudy of the Propagation of Modern Social Worms. IEEE Transactions on Information Forensics and Security 12, 11(2017), 2558ś2573.
[67] Xu Wang, Wei Ni, Kangfeng Zheng, Ren Ping Liu, and Xinxin Niu. 2016. Virus propagation modeling and convergenceanalysis in large-scale networks. IEEE Transactions on Information Forensics and Security 11, 10 (2016), 2241ś2254.
, Vol. 1, No. 1, Article . Publication date: June 2020.
Emotions behind Drive-by Download Propagation on Twitter 27
[68] Sheng Wen, Wei Zhou, Jun Zhang, Yang Xiang, Wanlei Zhou, Weijia Jia, and Cliff C Zou. 2014. Modeling and analysison the propagation dynamics of modern email malware. IEEE transactions on dependable and secure computing 11, 4(2014), 361ś374.
[69] Guanhua Yan, Guanling Chen, Stephan Eidenbenz, and Nan Li. 2011. Malware propagation in online social networks:nature, dynamics, and defense implications. In Proceedings of the 6th ACM Symposium on Information, Computer and
Communications Security. ACM, 196ś206.[70] Chao Yang, Robert Harkreader, and Guofei Gu. 2013. Empirical evaluation and new design for fighting evolving twitter
spammers. IEEE Transactions on Information Forensics and Security 8, 8 (2013), 1280ś1293.[71] Shui Yu, Guofei Gu, Ahmed Barnawi, Song Guo, and Ivan Stojmenovic. 2015. Malware propagation in large-scale
networks. IEEE Transactions on Knowledge and Data Engineering 27, 1 (2015), 170ś179.[72] Cliff C Zou, Weibo Gong, Don Towsley, and Lixin Gao. 2005. The monitoring and early detection of internet worms.
IEEE/ACM Transactions on Networking (TON) 13, 5 (2005), 961ś974.
, Vol. 1, No. 1, Article . Publication date: June 2020.