EMNLP 2017 Second workshop on Natural Language ...
125
EMNLP 2017 Second workshop on Natural Language Processing meets Journalism Proceedings of the Workshop September 7, 2017 Copenhagen, Denmark
-
Upload
khangminh22 -
Category
Documents
-
view
5 -
download
0
Transcript of EMNLP 2017 Second workshop on Natural Language ...

EMNLP 2017
Second workshop onNatural Language Processing meets Journalism
Proceedings of the Workshop
September 7, 2017Copenhagen, Denmark

c©2017 The Association for Computational Linguistics
Order copies of this and other ACL proceedings from:
Association for Computational Linguistics (ACL)209 N. Eighth StreetStroudsburg, PA 18360USATel: +1-570-476-8006Fax: [email protected]
ISBN 978-1-945626-88-3
ii

Introduction
During the years NLP has matured a suites of technologies able to cope with many problems raised bythe contemporary need of global information, and so, it is the high time for the NLP to get engaged inthe mass media process as an active partner for both journalists and readers. The EMNLP workshop- at its second edition after the IJCAI-2016 workshop held on July 10th, 2016 in New York - has thepotential to attract the interest of researchers both in computational linguistics and journalism, and ofprofessionals in the news production system. The main goal is to have a forum in which it will bepossible to share and discuss advancements in natural language processing and real needs in the field ofjournalism. The workshop received an unexpected number of submissions and the program committeeidentified 19 papers of high quality. We are happy to notice that papers submitted to this second editiondisplay a large variety of topics that we consider at the core of our initiative. Many interesting aspectsof journalism in mass-media age, from discovering bias and incongruent headlines in news to analyzingthe content of social media in order to capture hot topics and trends are present. We can confidently saythat fundamental topics of natural language processing have been covered this year, a fact that makesall the effort of organizing this workshop worthwhile. There are four excellent papers running for thebest paper award and we already know it is a close call. Some of the accepted papers are likely to stirvivid debates, which, as the last year experience proves it, will turn into papers next year. In fact, we cansee that some of the ideas that emerged from the papers and the discussions we carried out in the firstedition are properly represented in this second edition. While we cannot partition the papers into threeor four well defined classes, we can see that the NLP researchers have understood and have developedtechnologies able to cope with bias detection, sentiment analysis and relevance of specific information.
In an era in which there is no single point of view and the "objectiveness of information" lacks a unilateralstandard, playing with language register and clarity in a piece of news are powerful instruments atjournalist disposal. NLP may raise some flags on details, and papers such as "Tracking Bias in NewsSources Using Social Media: the Russia-Ukraine Maidan Crisis of 2013–2014", "Incongruent Headlines:Yet Another Way to Mislead Your Readers", "Fake news stance detection using stacked ensemble ofclassifiers", "From Clickbait to Fake News Detection: An Approach based on Detecting the Stance ofHeadlines to Articles", "An NLP Analysis of Exaggerated Claims in Science News" present interestingand efficient ways to warn the reader against possible abuses in the media.
Sentiment analysis is an important component in understanding the impact of a piece of news and fewpapers at this workshop focus on this aspect: "Comparing Attitudes to Climate Change in the Media usingsentiment analysis based on Latent Dirichlet Allocation", "Improved Abusive Comment Moderationwith User Embeddings", "Deception Detection in News Reports in the Russian Language: Lexics andDiscourse", "Using New York Times Picks to Identify Constructive Comments", "Using New York TimesPicks to Identify Constructive Comments", "Predicting News Values from Headline Text and Emotions".
A group of papers deals with a crucial issue of modern journalism, i.e., how to manage the enormousflow of available information: "What to Write? A topic recommender for journalists", "Data-to-textgeneration for tailored soccer journalism“, "Language-based Construction of Explorable News Graphsfor Journalists", "Storyteller: Visual Analytics of Perspectives on Rich Text Interpretations", "Analyzingthe Revision Logs of a Japanese Newspaper for Article Quality Assessment", "Unsupervised EventClustering and Aggregation from Newswire and Web Article", "Semantic Storytelling, Cross-lingualEvent Detection and other Semantic Services for a Newsroom Content Curation Dashboard", "A NewsChain Evaluation Methodology along with a Lattice-based Approach for News Chain Construction".
In conclusion, we are very happy and proud about the high quality papers dealing with essential topicsin modern journalism. We believe that more and more NLP will have an impact on journalism, the forcethat truly and directly represents all us in the confrontation with the social problems.
Octavian Popescu and Carlo Strapparava
iii


Organizers:
Octavian Popescu, IBM Watson Research Center, USACarlo Strapparava, FBK-irst, Italy
Program Committee:
Enrique Alfonseca, GoogleTommaso Caselli, VU Amsterdam UniversityDan Cristea, University of IasiLiviu P. Dinu, University of BucharestElena Erdmann, TU Dortmund UniversitySong Feng, IBM ResearchLorenzo Gatti, FBK-irstMarco Guerini, FBK-irstJames Hamilton, Stanford UniversityMark Hansen, Columbia universityOrin Hargraves, University of ColoradoDaisuke Kawahara, Kyoto UniversityKristian Kersting, TU Dortmund UniversityShervin Malmasi, Harvard Medical SchoolRada Mihalcea, University of MichiganPreslav Nakov, Qatar Computing Research Institute, HBKUVivi Nastase, University of HeidelbergGözde Özbal, FBK-irstMartha Palmer, University of ColoradoSiddharth Patwardhan, IBM Research TJ WatsonPreethi Raghavan, IBM Research TJ WatsonMattia Rigotti IBM Research TJ WatsonPaolo Rosso, Universitat Politecnica de ValènciaAmanda Stent, BloombergSerra Sinem Tekiroglu, FBK-irstNgoc Phuoc An Vo, IBM ResearchMarcos Zampieri, University of CologneTorsten Zesch, University of Duisburg-Essen
v


Table of Contents
Predicting News Values from Headline Text and EmotionsMaria Pia di Buono, Jan Šnajder, Bojana Dalbelo Basic, Goran Glavaš, Martin Tutek and Natasa
Milic-Frayling . . . . . . . . . . . . . . . . . . . . . . . . . . . . . . . . . . . . . . . . . . . . . . . . . . . . . . . . . . . . . . . . . . . . . . . . . . . . . . . 1
Predicting User Views in Online NewsDaniel Hardt and Owen Rambow . . . . . . . . . . . . . . . . . . . . . . . . . . . . . . . . . . . . . . . . . . . . . . . . . . . . . . . . . . 7
Tracking Bias in News Sources Using Social Media: the Russia-Ukraine Maidan Crisis of 2013–2014Peter Potash, Alexey Romanov, Mikhail Gronas, Anna Rumshisky and Mikhail Gronas . . . . . . . . 13
What to Write? A topic recommender for journalistsAlessandro Cucchiarelli, Christian Morbidoni, Giovanni Stilo and Paola Velardi . . . . . . . . . . . . . . 19
Comparing Attitudes to Climate Change in the Media using sentiment analysis based on Latent DirichletAllocation
Ye Jiang, Xingyi Song, Jackie Harrison, Shaun Quegan and Diana Maynard . . . . . . . . . . . . . . . . . . 25
Language-based Construction of Explorable News Graphs for JournalistsRémi Bois, Guillaume Gravier, Eric Jamet, Emmanuel Morin, Pascale Sébillot and Maxime Robert
31
Storyteller: Visual Analytics of Perspectives on Rich Text InterpretationsMaarten van Meersbergen, Piek Vossen, Janneke van der Zwaan, Antske Fokkens, Willem van
Hage, Inger Leemans and Isa Maks. . . . . . . . . . . . . . . . . . . . . . . . . . . . . . . . . . . . . . . . . . . . . . . . . . . . . . . . . . . .37
Analyzing the Revision Logs of a Japanese Newspaper for Article Quality AssessmentHideaki Tamori, Yuta Hitomi, Naoaki Okazaki and Kentaro Inui . . . . . . . . . . . . . . . . . . . . . . . . . . . . . 46
Improved Abusive Comment Moderation with User EmbeddingsJohn Pavlopoulos, Prodromos Malakasiotis, Juli Bakagianni and Ion Androutsopoulos . . . . . . . . . 51
Incongruent Headlines: Yet Another Way to Mislead Your ReadersSophie Chesney, Maria Liakata, Massimo Poesio and Matthew Purver . . . . . . . . . . . . . . . . . . . . . . . 56
Unsupervised Event Clustering and Aggregation from Newswire and Web ArticlesSwen Ribeiro, Olivier Ferret and Xavier Tannier . . . . . . . . . . . . . . . . . . . . . . . . . . . . . . . . . . . . . . . . . . . 62
Semantic Storytelling, Cross-lingual Event Detection and other Semantic Services for a Newsroom Con-tent Curation Dashboard
Julian Moreno-Schneider, Ankit Srivastava, Peter Bourgonje, David Wabnitz and Georg Rehm . 68
Deception Detection in News Reports in the Russian Language: Lexics and DiscourseDina Pisarevskaya . . . . . . . . . . . . . . . . . . . . . . . . . . . . . . . . . . . . . . . . . . . . . . . . . . . . . . . . . . . . . . . . . . . . . . 74
Fake news stance detection using stacked ensemble of classifiersJames Thorne, Mingjie Chen, Giorgos Myrianthous, Jiashu Pu, Xiaoxuan Wang and Andreas Vla-
chos . . . . . . . . . . . . . . . . . . . . . . . . . . . . . . . . . . . . . . . . . . . . . . . . . . . . . . . . . . . . . . . . . . . . . . . . . . . . . . . . . . . . . . . .80
From Clickbait to Fake News Detection: An Approach based on Detecting the Stance of Headlines toArticles
Peter Bourgonje, Julian Moreno Schneider and Georg Rehm . . . . . . . . . . . . . . . . . . . . . . . . . . . . . . . . 84
vii
’Fighting’ or ’Conflict’? An Approach to Revealing Concepts of Terms in Political DiscourseLinyuan Tang and Kyo Kageura . . . . . . . . . . . . . . . . . . . . . . . . . . . . . . . . . . . . . . . . . . . . . . . . . . . . . . . . . . 90
A News Chain Evaluation Methodology along with a Lattice-based Approach for News Chain Construc-tion
Mustafa Toprak, Özer Özkahraman and Selma Tekir . . . . . . . . . . . . . . . . . . . . . . . . . . . . . . . . . . . . . . . 95
Using New York Times Picks to Identify Constructive CommentsVarada Kolhatkar and Maite Taboada . . . . . . . . . . . . . . . . . . . . . . . . . . . . . . . . . . . . . . . . . . . . . . . . . . . . 100
An NLP Analysis of Exaggerated Claims in Science NewsYINGYA LI, Jieke Zhang and Bei Yu . . . . . . . . . . . . . . . . . . . . . . . . . . . . . . . . . . . . . . . . . . . . . . . . . . . . 106
viii

Conference Program
September 7th
Morning
Oral Presentations
Predicting News Values from Headline Text and EmotionsMaria Pia di Buono, Jan Šnajder, Bojana Dalbelo Basic, Goran Glavaš, Martin Tutekand Natasa Milic-Frayling
Predicting User Views in Online NewsDaniel Hardt and Owen Rambow
Tracking Bias in News Sources Using Social Media: the Russia-Ukraine MaidanCrisis of 2013–2014Peter Potash, Alexey Romanov, Mikhail Gronas, Anna Rumshisky and MikhailGronas
What to Write? A topic recommender for journalistsAlessandro Cucchiarelli, Christian Morbidoni, Giovanni Stilo and Paola Velardi
Comparing Attitudes to Climate Change in the Media using sentiment analysisbased on Latent Dirichlet AllocationYe Jiang, Xingyi Song, Jackie Harrison, Shaun Quegan and Diana Maynard
Language-based Construction of Explorable News Graphs for JournalistsRémi Bois, Guillaume Gravier, Eric Jamet, Emmanuel Morin, Pascale Sébillot andMaxime Robert
Storyteller: Visual Analytics of Perspectives on Rich Text InterpretationsMaarten van Meersbergen, Piek Vossen, Janneke van der Zwaan, Antske Fokkens,Willem van Hage, Inger Leemans and Isa Maks
Analyzing the Revision Logs of a Japanese Newspaper for Article Quality Assess-mentHideaki Tamori, Yuta Hitomi, Naoaki Okazaki and Kentaro Inui
Improved Abusive Comment Moderation with User EmbeddingsJohn Pavlopoulos, Prodromos Malakasiotis, Juli Bakagianni and Ion Androutsopou-los
ix
September 7th (continued)
Lunch
Invited TalkCristian Danescu-Niculescu-Mizil - Cornell University
Poster Presentations
Incongruent Headlines: Yet Another Way to Mislead Your ReadersSophie Chesney, Maria Liakata, Massimo Poesio and Matthew Purver
Unsupervised Event Clustering and Aggregation from Newswire and Web ArticlesSwen Ribeiro, Olivier Ferret and Xavier Tannier
Semantic Storytelling, Cross-lingual Event Detection and other Semantic Servicesfor a Newsroom Content Curation DashboardJulian Moreno-Schneider, Ankit Srivastava, Peter Bourgonje, David Wabnitz andGeorg Rehm
Deception Detection in News Reports in the Russian Language: Lexics and Dis-courseDina Pisarevskaya
Fake news stance detection using stacked ensemble of classifiersJames Thorne, Mingjie Chen, Giorgos Myrianthous, Jiashu Pu, Xiaoxuan Wang andAndreas Vlachos
From Clickbait to Fake News Detection: An Approach based on Detecting theStance of Headlines to ArticlesPeter Bourgonje, Julian Moreno Schneider and Georg Rehm
’Fighting’ or ’Conflict’? An Approach to Revealing Concepts of Terms in PoliticalDiscourseLinyuan Tang and Kyo Kageura
A News Chain Evaluation Methodology along with a Lattice-based Approach forNews Chain ConstructionMustafa Toprak, Özer Özkahraman and Selma Tekir
Using New York Times Picks to Identify Constructive CommentsVarada Kolhatkar and Maite Taboada
x

September 7th (continued)
An NLP Analysis of Exaggerated Claims in Science NewsYINGYA LI, Jieke Zhang and Bei Yu
Best paper announcement and Conclusions
xi


Proceedings of the 2017 EMNLP Workshop on Natural Language Processing meets Journalism, pages 1–6Copenhagen, Denmark, September 7, 2017. c©2017 Association for Computational Linguistics
Predicting News Values from Headline Text and Emotions
Maria Pia di Buono1 Jan Snajder1 Bojana Dalbelo Basic1
Goran Glavas2 Martin Tutek1 Natasa Milic-Frayling3
1 TakeLab, Faculty of Electrical Engineering and Computing, University of [email protected]
2 Data and Web Science Group, University of Mannheim, [email protected]
3 School of Computer Science, University of Nottingham, [email protected]
Abstract
We present a preliminary study on predict-ing news values from headline text andemotions. We perform a multivariate anal-ysis on a dataset manually annotated withnews values and emotions, discovering in-teresting correlations among them. Wethen train two competitive machine learn-ing models – an SVM and a CNN – topredict news values from headline text andemotions as features. We find that, whileboth models yield a satisfactory perfor-mance, some news values are more diffi-cult to detect than others, while some profitmore from including emotion information.
1 Introduction
News values may be considered as a system ofcriteria applied to decide about the inclusion orexclusion of material (Palmer, 2000) and aboutthe aspects of the selected material that should beemphasized by means of headlines. In fact, the in-formative value of headlines lays its foundations intheir capability of optimizing the relevance of theirstories for their users (Dor, 2003). To the intent ofbeing optimizers of the news relevance, headlinescarry out a set of different functions while meetingtwo needs: attracting users’ attention and summa-rizing contents (Ifantidou, 2009). In order to attractusers’ attention, headlines should provide the trig-gers for the emotional impact of the news, account-ing emotional aspects related to the participantsof the event or to the actions performed (Ungerer,1997). As far as the summarization of contents isconcerned, headlines may be distinguished on thebasis of two main goals: headlines that representthe abstract of the main event and headlines thatpromote one of the details in the news story (Bell,1991; Nir, 1993). Furthermore, Iarovici and Amel
(1989) recognize two simultaneous functions: “asemantic function, regarding the referential text,and a pragmatic function, regarding the reader (thereceiver) to whom the text is addressed.”
In this work we present a preliminary study onpredicting news values from headline text and emo-tions. The study is driven by two research ques-tions: (1) what are the relations among news valuesconveyed by headlines and the human emotionstriggered by them, and (2) to what extent can a ma-chine learning classifier successfully identify thenews values conveyed by headlines, using merelytext or text and triggered emotions as input? Tothis end, we manually annotated an existing datasetof headlines and emotions with news values. Toanswer the first question, we carried out a multivari-ate analysis, and discovered interesting correlationsamong news values and emotions. To answer oursecond research question, we trained two compet-itive machine learning models – a support vectormachine (SVM) and a convolutional neural net-work (CNN) – to predict news values from head-line text and emotions. Results indicate that, whileboth models yield a satisfactory performance, somenews values are more difficult to detect, some profitfrom including emotion information, and CNN per-forms better than SVM on this task.
2 Related work
Despite the fact that news values has been widelyinvestigated in Social Science and journalism stud-ies, not much attention has been paid to its auto-matic classification by the NLP community. In fact,even if news value classification may be applied inseveral user-oriented applications, e.g., news rec-ommendation systems, and web search engines,few scholars (De Nies et al., 2012; Piotrkowiczet al., 2017) have been focused on this particulartopic. Related to our work is the work on predicting
1

emotions in news articles and headlines, which hasbeen investigated from different perspectives andby means of different techniques. Strapparava andMihalcea (2008) describe an experiment devotedto analyze emotion in news headlines, focusingon six basic emotions and proposing knowledge-based and corpus-based approaches. Kozareva et al.(2007) extract part of speech (POS) from headlinesin order to create different bag of words pairs withsix emotions and compute for each pair the MutualInformation Score. Balahur et al. (2013) test therelative suitability of various sentiment dictionariesin order to separate positive or negative opinionfrom good or bad news. Ye et al. (2012) deal withthe prediction of emotions in news from readers’perspective, based on a multi-label classification.Another strand of research more generally relatedto our work is short text classification. Short textclassification is technically challanging due to thesparsity of features. Most work in this area hasfocused on classification of microblog messages(Sriram et al., 2010; Dilrukshi et al., 2013; Go et al.,2009; Chen et al., 2011).
3 Dataset
As a starting point, we adopt the dataset proposedfor the SemEval-2007 Task 14 (Strapparava andMihalcea, 2007). The dataset consists of 1250headlines extracted from major newspapers such asNew York Times, CNN, BBC News, and GoogleNews. Each headline has been manually annotatedfor valence and six emotions (Anger, Disgust, Fear,Joy, Sadness, and Surprise) on a scale from 0 to100. In this work, we use only the emotion labels,and not the valence labels.
News values. On top of the emotion annotations,we added an additional layer of news value labels.Our starting point for the annotation was the newsvalues classification scheme proposed by Harcupand O’Neill (2016). This study proposes a set of fif-teen values, corresponding to a set of requirementsthat news stories have to satisfy to be selected forpublishing. For the annotation, we decided to omittwo news values whose annotation necessitates con-textual information: “Audio-visuals”, which sig-nals the presence of infographics accompanyingthe news text, and “News organization’s agenda”,which refers to stories related to the news organi-zation’s own agenda. This resulted in a set of 13news value labels.
IAA IAA (adj)
News value κ F1 κ F1 Support
Bad news 0.47 0.526 0.72 0.744 85Celebrity 0.51 0.545 0.74 0.761 82Conflict 0.19 0.245 0.52 0.564 86Drama 0.25 0.383 0.58 0.663 178Entertainment 0.53 0.684 0.76 0.843 351Follow-up 0.10 0.129 0.43 0.451 29Good news 0.23 0.268 0.54 0.563 65Magnitude 0.08 0.121 0.34 0.371 45Shareability 0.05 0.101 0.29 0.335 130Surprise 0.06 0.102 0.38 0.409 43Power elite 0.36 0.472 0.66 0.718 166
Table 1: Original and adjudicated interannotatoragreement (Cohen’s κ and F1-macro scores) andcounts for each news value (agreement scores aver-aged over three annotator pairs and four annotatorgroups; moderate/substantial κ agreement shownin bold).
Annotation task. We asked four annotators toindependently label the dataset. The annotatorswere provided short guidelines and a descriptionof the news values. We first ran a calibrationround on a set of 120 headlines. After calcu-lating the inter-annotator agreement (IAA), wedecided to run a second round of calibration,providing further information about some labelsconceived as more ambiguous by the annotators(e.g., “Bad news” vs. “Drama” vs. “Conflict” and“Celebrity” vs. “Power elite”). For the final anno-tation round, we arranged the annotators into fourdistinct groups of three, so that each headline wouldbe annotated by three annotators. The annotationwas done on 798 headlines using 13 labels. An-notation analysis revealed that two of these labels“Exclusivity” and “Relevance”, have been used ina marginal number of cases so we decide to omitthese labels from the final dataset.
Table 1 show the Cohen’s κ and F1-macro IAAagreement scores for the 11 news value labels. Weobserve a moderate agreement of κ ≥ 0.4 (Lan-dis and Koch, 1977) only for the “Bad news”,“Celebrity”, and “Entertainment” news values, sug-gesting that recognizing news values from head-lines is a difficult task even for humans. To obtainthe final dataset, we adjudicated the annotations ofthe three annotators my a majority vote. The ad-judicated IAA is moderate/substantial, except for“Magnitude”, “Shareability”, and “Surprise”.
Factor analysis. As a preliminary investigationof the relations among news values and emotions in
2

● Surprise
● Entertainment
● SURPRISE
● Magnitude
● Shareability
● JOY
● Good news
● Follow up
● Celebrity
● Drama
● The power elite
● FEAR
● Bad news
● SADNESS
● Conflict
● DISGUST
● ANGER
Figure 1: A dendrogram of the correlations amongfactor loadings for news values and emotions.(Emotions are shown in caps.)
headlines, we carry out a multivariate data analysisusing factor analysis (FA) (Hair et al., 1998). Themain goal of FA is to measure the presence of un-derlying constructs, i.e., factors, which in our caserepresent the correlation among emotions and newsvalues, and their factor loading magnitudes. Theuse of FA is justified here because (1) we deal withcardinal (news values) and ordinal (emotions) vari-ables and (2) the data exhibits a substantial degreeof multicollinearity. We applied varimax, an or-thogonal factor rotation used to obtain a simplifiedfactor structure that maximizes the variance. Wethen inspected the eigenvalue scree plot and choseto use seven factors whose values were larger than1 as to reduce the number of variables without loos-ing relevant information. To visualize the factorstructure and relations among news values and emo-tions, we performed a hierarchical cluster analysis,using complete linkage with one minus Pearson’scorrelation coefficient as the distance measure.
Fig. 1 shows the resulting dendrogram. We canidentify three groups of news values and emotions.The first group contains the negative emotions re-lated to “Conflict” and “Bad news”, and the ratherdistant “Power elite”. The second group containsonly news values, namely “Drama”, “Celebrity”,and “Follow up”. The last group is formed by twopositive emotions, joy and surprise, which are thekernels of two sub-groups: joy is related to “Goodnews”, “Shareability” and, to a lesser extent, to“Magnitude”, while surprise emotions relates to“Entertainment” and “Surprise” news values.
4 Models
We consider two classification algorithms in thisstudy: a support vector machine (SVM) and theCNN. The two algorithms are known for their effi-ciency in text classification tasks (Joachims, 1998;Kim, 2014; Severyn and Moschitti, 2015). Weframe the problem of news values classification asa multilabel task, and train one binary classifier foreach news value, using headlines labeled with thatnews value as positive instances and all other asnegative instances.
Features. We use the same feature sets for bothSVM and CNN. As textual features, we use the pre-trained Google News word embeddings, obtainedby training the skip-gram model with negative sam-pling (Mikolov et al., 2013). For emotion features,we used the six ground-truth emotion labels fromthe SemEval-2007 dataset, standardized to zeromean and unit variance.
SVM. An SVM (Cortes and Vapnik, 1995) is apowerful discriminate model trained to maximizethe separation margin between instances of twoclasses in feature space. We follow the commonpractice of assuming additive compositionality ofthe word embeddings and represent each headlineas one 300-dimensional vector by averaging the in-dividual word embeddings of its constituent words,whereby we discard the words not present in thedictionary. Note that this representation is not sen-sitive to word order. We use the SVM implemen-tation from scikit-learn (Pedregosa et al., 2011),which in turn is based on LIBSVM (Chang and Lin,2011). To maximize the efficiency of the model,we use the RBF kernel and rely on nested 5×5-cross-validation for hyperparameter optimization,with C ∈ {1, 10, 100} and γ ∈ {0.01, 0.1}.CNN. A CNN (LeCun and Bengio, 1998) is afeed-forward neural network consisting of one ormore convolutional layers, each consisting of anumber of filters (parameter matrices). Convolu-tions between filters and slices of the input em-bedding matrix aim to capture informative localsequences (e.g., word 3-grams). Each convolu-tional layer is followed by a pooling layer, whichretains only the largest convolutional scores fromeach filter. A CNN thus offers one important advan-tage over SVM, in that it can detect indicative wordsequences – a capacity that might be crucial whenclassifying short texts such as news headlines.
3

SVM CNN
News value T T+E T T+E
Bad news 0.652 0.763∗ 0.778† 0.848∗†Celebrity 0.553 0.534 0.496 0.526Conflict 0.526 0.487 0.654† 0.659†Drama 0.636 0.637 0.668 0.681Entertainment 0.832 0.783∗ 0.803 0.841∗Good news 0.414 0.513 0.509 0.578Magnitude 0.299 0.515∗ 0.438 0.507Power elite 0.596 0.570 0.695† 0.700†Shareability 0.309 0.318 0.427† 0.425†
Table 2: F1-scores of SVM and CNN news valuesclassifiers using text (“T”) or text and emotions(“T+E”) as features. Best result for each newsvalue are shown in bold. “∗” denotes a statisticallysignificant difference between feature sets “T” and“T+E” for the same classifier, and “†” a statisticallysignificant difference between SVM and CNN clas-sifiers with the same features (p<0.05, two-tailedpermutation test).
In our experiments, we trained CNNs with a sin-gle convolutional and pooling layer. We used 64filters, optimized filter size ({3,4,5}) using nestedcross-validation, and performed top-k pooling withk = 2. For training, we used the RMSProp algo-rithm (Tieleman and Hinton, 2012).
In addition to the vanilla CNN model that usesonly the textual representation of a headline, weexperimented with a model that additionally usesemotion labels as features. For each headline, theemotion labels are concatenated to the latent CNNfeatures (i.e., output of the top-k pooling layer) andfed to the output layer of the network. Let x(i)
T
be the latent CNN vector of the i-th headline text,and x(i)
E the corresponding vector of emotion labels.The output vector y(i), a probability distributionover labels, is then computed as:
y(i) = softmax(W · [x(i)
T ;x(i)E ] + b
)where W and b are the weight matrix and the biasvector of the output layer.
5 Evaluation
Table 2 shows the F1-scores of the SVM and CNNnews values classifiers, trained with textual fea-tures (“T”) or both textual and emotion features(“T+E”). We report the results for nine out of 11news values from Table 1; the two omitted labelsare “Follow-up” and “Surprise”, for which the num-ber of instances was too low to successfully train
the models. Models for the remaining nine newsvalues were trained successfully and outperform arandom baseline (the differences are significant atp<0.001; two-sided permutation test (Yeh, 2000)).
We can make three main observations. First,there is a considerable variance in performanceacross the news values: “Bad news” and “Entertain-ment” seems to be the easiest to predict, whereas“Shareability”, “Magnitude”, and “Celebrity” aremore difficult. Secondly, by comparing “T” and“T+E” variants of the models, we observe thatadding emotions as features improves leads to fur-ther improvements for the “Bad news” and “Enter-tainment” news values (differences are significantat p<0.05) for CNN, and for SVM also for “Mag-nitude”, but for other news values adding emotionsdid not improve the performance. This finding isaligned with the analysis from Fig. 1, where “Badnews“ and “Entertainment” are the two news valuesthat correlate the most with one of the emotions.Finally, by comparing between the two models, wenote that CNN generally outperforms SVM: the dif-ference is statistically significant for “Bad news”,“Conflict”, “Power elite”, “Shareability”, regardlessof what features were used. This suggest that thesenews values might be identified by the presence ofspecific local word sequences.
6 Conclusions and Future Work
We described a preliminary study for predictingnews values using headline text and emotions. Amultivariate analysis revealed a three-way groupingof news values and emotions. Experiments withpredicting news values revealed that both a supportvector machine (SVM) and a convolutional neuralnetwork (CNN) can outperform a random baseline.The results further indicate that some news valuesare more easily detectable than others, that addingemotions as features helps for news values that arehighly correlated with emotions, and that CNNsability to detect local word sequences helps in thistask, probably because of the brevity of headlines.
This works opens up a number of interestingresearch directions. One is to study the relationbetween the linguistic properties of headlines andnews values. Another research direction is the com-parison between headlines and full-text stories asfeatures for news value prediction. It would alsobe interesting to analyze how news values correlatewith properties of events described in text. We in-tend to pursue some of this work in the near future.
4

Acknowledgments
This work has been funded by the Unity ThroughKnowledge Fund of the Croatian Science Foun-dation, under the grant 19/15: “EVEnt RetrievalBased on semantically Enriched Structures for In-teractive user Tasks (EVERBEST)”.
ReferencesAlexandra Balahur, Ralf Steinberger, Mijail Kabad-
jov, Vanni Zavarella, Erik Van Der Goot, MatinaHalkia, Bruno Pouliquen, and Jenya Belyaeva. 2013.Sentiment analysis in the news. arXiv preprintarXiv:1309.6202.
Allan Bell. 1991. The language of news media. Black-well Oxford.
Chih-Chung Chang and Chih-Jen Lin. 2011. LIB-SVM: A library for support vector machines. ACMTransactions on Intelligent Systems and Technology,2:27:1–27:27.
Mengen Chen, Xiaoming Jin, and Dou Shen. 2011.Short text classification improved by learning multi-granularity topics. In Twenty-Second InternationalJoint Conference on Artificial Intelligence.
Corinna Cortes and Vladimir Vapnik. 1995. Support-vector networks. Machine learning, 20(3):273–297.
Tom De Nies, Evelien Dheer, Sam Coppens, DavyVan Deursen, Erik Mannens, and Rik Van de Walle.2012. Bringing newsworthiness into the 21st cen-tury. Web of Linked Entities (WoLE) at ISWC,2012:106–117.
Inoshika Dilrukshi, Kasun De Zoysa, and AmithaCaldera. 2013. Twitter news classification usingsvm. In Computer Science & Education (ICCSE),2013 8th International Conference on, pages 287–291. IEEE.
Daniel Dor. 2003. On newspaper headlines asrelevance optimizers. Journal of Pragmatics,35(5):695–721.
Alec Go, Richa Bhayani, and Lei Huang. 2009. Twit-ter sentiment classification using distant supervision.CS224N Project Report, Stanford, 1(12).
Joseph F Hair, William C Black, Barry J Babin,Rolph E Anderson, Ronald L Tatham, et al. 1998.Multivariate data analysis, volume 5. Prentice hallUpper Saddle River, NJ.
Tony Harcup and Deirdre O’Neill. 2016. What isnews? News values revisited (again). JournalismStudies, pages 1–19.
Edith Iarovici and Rodica Amel. 1989. The strategy ofthe headline. Semiotica, 77(4):441–460.
Elly Ifantidou. 2009. Newspaper headlines and rele-vance: Ad hoc concepts in ad hoc contexts. Journalof Pragmatics, 41(4):699–720.
Thorsten Joachims. 1998. Text categorization with sup-port vector machines: Learning with many relevantfeatures. Machine learning: ECML-98, pages 137–142.
Yoon Kim. 2014. Convolutional neural networksfor sentence classification. In Proceedings ofthe Conference on Empirical Methods in NaturalLanguage Processing (EMNLP), pages 1746–1751,Doha, Qatar. Association for Computational Lin-guistics.
Zornitsa Kozareva, Borja Navarro, Sonia Vazquez, andAndres Montoyo. 2007. Ua-zbsa: a headline emo-tion classification through web information. In Pro-ceedings of the 4th international workshop on se-mantic evaluations, pages 334–337. Association forComputational Linguistics.
J Richard Landis and Gary G Koch. 1977. The mea-surement of observer agreement for categorical data.biometrics, pages 159–174.
Yann LeCun and Yoshua Bengio. 1998. The handbookof brain theory and neural networks. chapter Con-volutional Networks for Images, Speech, and TimeSeries, pages 255–258. MIT Press, Cambridge, MA,USA.
Tomas Mikolov, Ilya Sutskever, Kai Chen, Greg S Cor-rado, and Jeff Dean. 2013. Distributed representa-tions of words and phrases and their compositional-ity. In Advances in neural information processingsystems, pages 3111–3119.
Raphael Nir. 1993. A discourse analysis of news head-lines. Hebrew Linguistics, 37:23–31.
Jerry Palmer. 2000. Spinning into control: News valuesand source strategies. A&C Black.
F. Pedregosa, G. Varoquaux, A. Gramfort, V. Michel,B. Thirion, O. Grisel, M. Blondel, P. Prettenhofer,R. Weiss, V. Dubourg, J. Vanderplas, A. Passos,D. Cournapeau, M. Brucher, M. Perrot, and E. Duch-esnay. 2011. Scikit-learn: Machine learning inPython. Journal of Machine Learning Research,12:2825–2830.
Alicja Piotrkowicz, Vania Dimitrova, and Katja Mark-ert. 2017. Automatic extraction of news values fromheadline text. In Proceedings of EACL. Associationfor Computational Linguistics.
Aliaksei Severyn and Alessandro Moschitti. 2015.Twitter sentiment analysis with deep convolutionalneural networks. In Proceedings of the 38th Inter-national ACM SIGIR Conference on Research andDevelopment in Information Retrieval, SIGIR ’15,pages 959–962, New York, NY, USA. ACM.
5

Bharath Sriram, Dave Fuhry, Engin Demir, Hakan Fer-hatosmanoglu, and Murat Demirbas. 2010. Shorttext classification in twitter to improve informationfiltering. In Proceedings of the 33rd internationalACM SIGIR conference on Research and develop-ment in information retrieval, pages 841–842. ACM.
Carlo Strapparava and Rada Mihalcea. 2007. Semeval-2007 task 14: Affective text. In Proceedings ofthe 4th International Workshop on Semantic Evalu-ations, pages 70–74. Association for ComputationalLinguistics.
Carlo Strapparava and Rada Mihalcea. 2008. Learningto identify emotions in text. In Proceedings of the2008 ACM symposium on Applied computing, pages1556–1560. ACM.
Tijmen Tieleman and Geoffrey Hinton. 2012. Lecture6.5-rmsprop: Divide the gradient by a running aver-age of its recent magnitude. Technical Report 2.
Friedrich Ungerer. 1997. Emotions and emotional lan-guage in english and german news stories. The lan-guage of emotions, pages 307–328.
Lu Ye, Rui-Feng Xu, and Jun Xu. 2012. Emotionprediction of news articles from reader’s perspec-tive based on multi-label classification. In MachineLearning and Cybernetics (ICMLC), 2012 Interna-tional Conference on, volume 5, pages 2019–2024.IEEE.
Alexander Yeh. 2000. More accurate tests for the sta-tistical significance of result differences. In Pro-ceedings of the 18th conference on Computationallinguistics-Volume 2, pages 947–953. Associationfor Computational Linguistics.
6

Proceedings of the 2017 EMNLP Workshop on Natural Language Processing meets Journalism, pages 7–12Copenhagen, Denmark, September 7, 2017. c©2017 Association for Computational Linguistics
Predicting User Views in Online News
Daniel HardtCopenhagen Business School
Owen RambowColumbia University
Abstract
We analyze user viewing behavior on anonline news site. We collect data from64,000 news articles, and use text fea-tures to predict frequency of user views.We compare predictiveness of the headlineand “teaser” (viewed before clicking) andthe body (viewed after clicking). Both arepredictive of clicking behavior, with thefull article text being most predictive.
1 Introduction
With so much news being consumed online, thereis great interest in the way this news is consumed– what articles do users click on, and why? Thedata generated in online news consumption con-stitutes a rich resource for the exploration of newscontent and its relation to user opinions and behav-iors. There are undoubtedly a wide variety of fac-tors that influence reading behavior at online newssights, including the visual presentation of the website. But certainly the language seen by the userplays a central role.
In this paper we experiment with a dataset fromthe online news site of Jyllands-Posten, a majorDanish newspaper.1 The data consists both ofuser logs and news articles. We attempt to pre-dict viewing behavior from the text of articles. Wealso look at the difference in predictiveness of thetext the user sees before clicking, i.e., the headlineand the teaser, vs. the body of the article, whichthe user only sees after clicking, vs. the completetext of the article,
The first question we address is whether a sim-ple lexical representation of articles is predictiveof viewer behavior. We investigate bag of words,word vectors, and article length. A second ques-tion we investigate is the relative predictiveness of
1http://jyllands-posten.dk
the headline and teaser, which are displayed be-fore clicking, and the body of the article, which isof course only seen after the decision to view.
We explore these questions because we seethem as relevant to a fundamental issue in today’smedia landscape: to what extent are news con-sumers manipulated by “clickbait”, as opposed tomaking informed decisions about what news toconsume? While the term clickbait is difficult todefine, we see it as highlighting a potential differ-ence between the promise of a headline or teasercompared to the actual nature of the article beingpointed to. The work discussed in this paper is partof an effort (see for example (Blom and Hansen,2015)) to use large amounts of data and computa-tional methods to understand “clickbait”.
2 Data
Our dataset consists of news articles and userlogs from the online portal of the Danish daily,Jyllands-Posten. User logs have been maintainedsince July 2015. An entry in the user logs is cre-ated each time a user clicks on a new article on thesite. An entry includes the time of the click and thepage ID of the article, as well as a user ID if theuser is registered on the site. It also includes addi-tional information, including the referring page –the page the user was viewing when they clickedon the article. We collected all online articles pub-lished since July 2015, a total of 64,401 articles.The log file includes a total of 213,972,804 articleviews.
Articles are linked from two types of pages onthe Jyllands-Posten website: the start page, andspecialized pages for different subject matters (do-mestic, international, culture, sports, local, etc.).
Jyllands-Posten is a mainstream Danish dailypaper, covering all major news topics,with a some-what right-of center slant. While we have not an-
7

alyzed the distribution of topics covered, table 1gives the most frequent unigrams in the trainingdata, with stopwords manually removed. This list-ing reveals a focus on immigrants and other per-ceived external threats to Denmark.
1136 Denmark652 Danish633 refugees618 EU580 Aarhus (home town of paper)552 USA535 Danish472 Løkke (prime minister)444 killed422 Danish419 DF (Danish anti-immigrant party)367 police361 Syria339 victory339 death331 satire330 Trump325 children323 dead316 Danish315 Turkey306 Europe301 Russia300 Islamic286 attack
Table 1: Most frequent words (translated fromDanish, note that inflectional variants in Danish ofthe word Dansk ‘Danish’ result in Danish appear-ing multiple times)
The articles consist of three distinct parts:
• The headline of the article, which is the textalways displayed as the clickable link to thearticle on the referring page. It is also re-peated on the article page.
• On the article page, there is typically a phraseor short sentence displayed below the head-line, called the teaser. On the referring page,the teaser is sometimes omitted. We do nothave information on whether the teaser waspresent or not on the referring page.
• The body is the text of the actual article,which is only visible after the user has clickedon the headline text.
The text data (headline, teaser, and body) is di-vided into training and development data, as de-scribed in Table 2. (We have a held out test setwhich we will use in future publications.)
Dataset Articles WordsTrain 55,061 25,745,832Development 9,351 4,134,432
Table 2: Text Data: Articles
The average number of views is 3,337, and themedian number of views is 795. See Table 3for the two most viewed headline/teaser combi-nations, and Table 4 for a headline/teaser with amedian number of views (translations from Dan-ish by the authors). There are evident differencesbetween the high and median examples: the highlyviewed example deals with material of immediaterelevance to many readers. The top example con-cerns a garden snail that has preoccupied Danishgardeners for years, and promises a new solution.The second concerns a beloved Danish TV Christ-mas program, in which some off-color languagewas clearly visible during the children’s program.The language used is also more conversational, in-formal and extreme. By contrast, the median ex-ample is purely informative.
H Watch the unfortunate mistake in TV2’s family Christmas calendar
T An attentive viewer caught the writingon the board, which the childrenprobably should not see.
H See the surprising solution in the fightagainst the killer snail
T Nature guide in Herning has made agroundbreaking discovery that benefitsall garden owners.
Table 3: Headline (H)/Teaser(T) for the articleswith the most views (671,480 and 334,820, re-spectively)
3 The Task: Predicting Clicks Based onText
Our task is to predict which articles get the mostuser views. We bin the articles by numbers ofclicks into 2, 3, and 4 bins. This defines threedifferent classification tasks: is the article in the
8

H International agreement: Elections inEast Ukraine this summer
T The goal is to hold local elections inDonetsk and Lugansk before August.Germany and Ukraine are skeptical.
Table 4: Headline (H)/Teaser(T) for an article withmedian views (795 views)
top 50% of clicks, in the top 33.3% of clicks, inthe top 25% of clicks? We use different parts ofthe article text to make the prediction. Specifi-cally, we ask how much each of the text elements(headline, teaser, body) contributes to our abilityto predict the highly clicked articles. Our work-ing hypothesis is that the headline on its own, orthe headline with the teaser, should have higherpredictive power than the article alone. This is be-cause the user sees only the headline (and perhapsthe teaser) before making the decision to click andread the article. We investigate the following com-binations of text elements, to see which providesthe most predictive power:
• Headline only: the reader definitely sees thisbefore clicking.
• Headline and teaser: in most cases, the useralso sees a teaser before clicking.
• Body only: the reader does not see the bodybefore clicking.
• Full article (headline, teaser, body): thereader sees all this information together onlyafter clicking.
We experiment with the following classifiers, allusing the sklearn package: Support Vector Ma-chines with a linear kernel, Logistic Regression(logreg), Random Forests. For all classifiers, weuse the same set of features. For the initial exper-iments we report in this workshop paper, we usethe following set of lexical features:
• Bag of Words (BoW): We construct a bagof words from each article represented as avector whose size is that of the vocabulary.We experiment with three values: a countof occurrences, a weighted count (term fre-quency), and tf-idf values.
• Word Vectors (vec): We also use word vec-tor features for each word in each article
(Mikolov et al., 2013a,b). These vectors werecreated using the Python gensim package, us-ing all of the training data. We then form themean of the word vectors for all words in thetext component we are interested in (head-line, teaser, or body).
• Text length (wc): the length in words.
4 Results
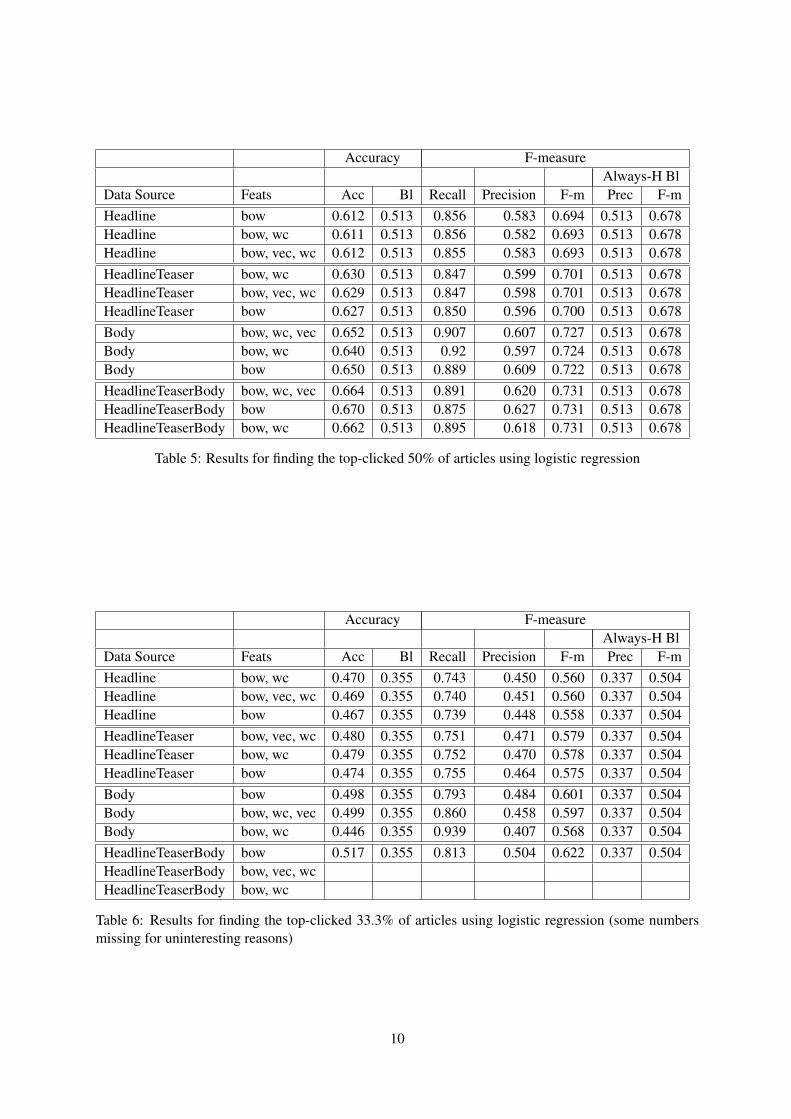
We found consistently that logistic regression out-performs the other classifiers; we therefore onlypresent results using logreg. Furthermore, wefound that term frequency and tf-idf consistentlyperform about equally, and both outperform sim-ple counts; thus, we report only results using termfrequency. These results are shown in Tables 5,6, and 7 for the top 50%, top 33.3% and top 25%classification tasks, respectively. We provide ac-curacy results and f-measure results, but we takethe f-measure results as the relevant result. Thebaselines are always choosing the top-clicked cat-egory.
We observe that the models consistently beatthe baselines (both on accuracy and f-measure).The text features thus are, in general, predictiveof users’ viewing behavior. Furthermore, we ob-serve across the three tasks that the performanceincreases from using only the headline to usingheadline and teaser to using only the body to usingthe whole article. Put differently, more text is bet-ter for this prediction task, contrary to our hypoth-esis that the body would not contribute predictivepower as it is unseen at click time.
In terms of our features, we were surprised tosee that the wc (text length) and vec (word vectors)features do not appear to have much effect. Whilethe results for different feature combinations varysomewhat, we do not see variations greater than0.7% (and usually much less) in the 12 separateexperiments (3 tasks and 4 data sources). Theone exception is using the body for finding thetop 33.3% of clicked articles (Table 6), where thecombination of bag of words and word count leadsto a drop of 3% over the other feature combina-tions. We take this to be noise rather than an inter-esting result.
5 Discussion
Our initial hypothesis was that article body wouldnot be as predictive as headline and particularly
9
Accuracy F-measureAlways-H Bl
Data Source Feats Acc Bl Recall Precision F-m Prec F-mHeadline bow 0.612 0.513 0.856 0.583 0.694 0.513 0.678Headline bow, wc 0.611 0.513 0.856 0.582 0.693 0.513 0.678Headline bow, vec, wc 0.612 0.513 0.855 0.583 0.693 0.513 0.678HeadlineTeaser bow, wc 0.630 0.513 0.847 0.599 0.701 0.513 0.678HeadlineTeaser bow, vec, wc 0.629 0.513 0.847 0.598 0.701 0.513 0.678HeadlineTeaser bow 0.627 0.513 0.850 0.596 0.700 0.513 0.678Body bow, wc, vec 0.652 0.513 0.907 0.607 0.727 0.513 0.678Body bow, wc 0.640 0.513 0.92 0.597 0.724 0.513 0.678Body bow 0.650 0.513 0.889 0.609 0.722 0.513 0.678HeadlineTeaserBody bow, wc, vec 0.664 0.513 0.891 0.620 0.731 0.513 0.678HeadlineTeaserBody bow 0.670 0.513 0.875 0.627 0.731 0.513 0.678HeadlineTeaserBody bow, wc 0.662 0.513 0.895 0.618 0.731 0.513 0.678
Table 5: Results for finding the top-clicked 50% of articles using logistic regression
Accuracy F-measureAlways-H Bl
Data Source Feats Acc Bl Recall Precision F-m Prec F-mHeadline bow, wc 0.470 0.355 0.743 0.450 0.560 0.337 0.504Headline bow, vec, wc 0.469 0.355 0.740 0.451 0.560 0.337 0.504Headline bow 0.467 0.355 0.739 0.448 0.558 0.337 0.504HeadlineTeaser bow, vec, wc 0.480 0.355 0.751 0.471 0.579 0.337 0.504HeadlineTeaser bow, wc 0.479 0.355 0.752 0.470 0.578 0.337 0.504HeadlineTeaser bow 0.474 0.355 0.755 0.464 0.575 0.337 0.504Body bow 0.498 0.355 0.793 0.484 0.601 0.337 0.504Body bow, wc, vec 0.499 0.355 0.860 0.458 0.597 0.337 0.504Body bow, wc 0.446 0.355 0.939 0.407 0.568 0.337 0.504HeadlineTeaserBody bow 0.517 0.355 0.813 0.504 0.622 0.337 0.504HeadlineTeaserBody bow, vec, wcHeadlineTeaserBody bow, wc
Table 6: Results for finding the top-clicked 33.3% of articles using logistic regression (some numbersmissing for uninteresting reasons)
10

Accuracy F-measureAlways-H Bl
Data Source Feats Acc Bl Recall Precision F-m Prec F-mHeadline bow, wc 0.363 0.271 0.673 0.357 0.466 0.242 0.390Headline bow, vec, wc 0.363 0.271 0.672 0.355 0.465 0.242 0.390Headline bow 0.361 0.271 0.665 0.351 0.46 0.242 0.390HeadlineTeaser bow, wc 0.370 0.271 0.659 0.368 0.473 0.242 0.390HeadlineTeaser bow, vec, wc 0.371 0.271 0.659 0.368 0.472 0.242 0.390HeadlineTeaser bow 0.369 0.271 0.662 0.363 0.469 0.242 0.390Body bow, wc, vec 0.424 0.271 0.757 0.401 0.525 0.242 0.390Body bow, wc 0.419 0.271 0.755 0.399 0.522 0.242 0.390Body bow 0.401 0.271 0.763 0.392 0.518 0.242 0.390HeadlineTeaserBody bow, wc 0.421 0.271 0.760 0.406 0.529 0.242 0.390HeadlineTeaserBody bow, wc, vec 0.421 0.271 0.761 0.406 0.529 0.242 0.390HeadlineTeaserBody bow 0.42 0.271 0.765 0.404 0.529 0.242 0.390
Table 7: Results for finding the top-clicked 25% of articles using logistic regression
teaser, since teaser is presumably constructed toinduce clicking behaviors, while the article text it-self is not visible to the user at the time a clickingdecision is made. Thus we find it quite surpris-ing that body is more predictive than headline andteaser, and the model combining headline, teaserand body is the best.
How can it be that the body is more predictivethan the text the user actually sees when decidingto click? Here we offer some hypotheses. First, wenote that some clicks are the result of social me-dia referrals (this information is present in our logdata). In these cases, it makes sense that body datais predictive, since presumably the referrer readthe article before making the referral. Second, itis possible that the headline on its own gives read-ers a lot of semantic information which we are notcapturing with our features, but which the wholearticle does provide. So human readers can “imag-ine” the article before they read it and implicitlybase their behavior on their expectation.
In general, although the bow features are consis-tently predictive, there is little or no improvementfrom the vec and wc features. We expected thatwc (text length) might be relevant in some ways:for example, that short, punchy teasers might tendto be more effective. No such effect has been ob-served however. The vec (word embeddings) fea-ture was used to compute an average vector forthe entire text. Computing an average of wordvectors has been shown effective in other docu-ment classification tasks (Alkhreyf and Rambow,
2017). However, clearly such a vector loses a lotof information about a text, and more fine-grainedmodeling is needed.
6 Plans for Future Work
This work lays the foundation for multi-faceted in-vestigations of news data, language, and user be-havior and preferences. We have extracted aggre-gate totals of article views from the user logs. Thisdataset, which includes logs of all user behaviorsince 2015, has rich potential for further data min-ing. For example, the logs include the referringpage for each user view. We intend to produce sep-arate models for views resulting from social mediareferrals. Our hypothesis is that the body of the ar-ticle is (even) more predictive in these cases, sincethe decision to view is, indirectly, based on a read-ing of the body of the article. We also intend tomine the logs to divide users into different classesbased on their reading behavior. In addition, weplan to examine further our use of word embed-dings, to explore ways in which they could be bet-ter exploited for prediction of views. We will alsoexperiment with topic modeling.
Ultimately, we seek to shed some light on ba-sic questions about online news. In particular, wewould like to characterize the nature of differenttext types in headlines, teasers and article bodies,and in the process to use NLP techniques to helpexplore the difference between clickbait and gen-uine journalistic quality.
11

Acknowledgments
We thank A. Michele Colombo and Ha Le Hgocfor help with the data and experiments. We alsothank Jyllands-Posten for giving us access to thedata.
ReferencesSakhar Alkhreyf and Owen Rambow. 2017. Work
hard, play hard: Email classification on the Avocadoand Enron corpora. In Proceedings of Textgraphs-11, ACL Workshop.
Jonas Nygaard Blom and Kenneth Reinecke Hansen.2015. Click bait: Forward-reference as lure in on-line news headlines. Journal of Pragmatics 76:87 –100.
Tomas Mikolov, Ilya Sutskever, Kai Chen, Greg S Cor-rado, and Jeff Dean. 2013a. Distributed representa-tions of words and phrases and their compositional-ity. In Advances in neural information processingsystems. pages 3111–3119.
Tomas Mikolov, Wen-tau Yih, and Geoffrey Zweig.2013b. Linguistic regularities in continuous spaceword representations. In Hlt-naacl. volume 13,pages 746–751.
12

Proceedings of the 2017 EMNLP Workshop on Natural Language Processing meets Journalism, pages 13–18Copenhagen, Denmark, September 7, 2017. c©2017 Association for Computational Linguistics
Tracking Bias in News Sources Using Social Media:the Russia-Ukraine Maidan Crisis of 2013–2014
Peter Potash, Alexey Romanov, Anna RumshiskyDepartment of Computer Science
University of Massachusetts Lowell{ppotash,aromanov,arum}@cs.uml.edu
Mikhail GronasDepartment of Russian
Dartmouth [email protected]
Abstract
This paper addresses the task of identify-ing the bias in news articles published dur-ing a political or social conflict. We cre-ate a silver-standard corpus based on theactions of users in social media. Specifi-cally, we reconceptualize bias in terms ofhow likely a given article is to be sharedor liked by each of the opposing sides.We apply our methodology to a dataset oflinks collected in relation to the Russia-Ukraine Maidan crisis from 2013-2014.We show that on the task of predictingwhich side is likely to prefer a given ar-ticle, a Naive Bayes classifier can record90.3% accuracy looking only at domainnames of the news sources. The best ac-curacy of 93.5% is achieved by a feed for-ward neural network. We also apply ourmethodology to gold-labeled set of arti-cles annotated for bias, where the afore-mentioned Naive Bayes classifier records82.6% accuracy and a feed-forward neuralnetworks records 85.6% accuracy.
1 Introduction
The proliferation of online information sourcesand the dissolution of the centralized news de-livery system creates a situation where news nolonger comes from a restricted set of reputable (ornot-so-reputable) news organizations, but ratherfrom a collection of multiple distributed sourcessuch as blogs, political columns, and social me-dia posts. In times of social or political con-flict, or when contentious issues are involved, suchsources may present biased opinions or outrightpropaganda, which an unprepared reader is oftennot equipped to detect. News aggregators (such asGoogle News) present the news organized by top-
ics and popularity. But an adequate understand-ing of a news story or a blog post requires weed-ing out the “spin” or “framing”, which reflects thesource’s position on the spectrum of conflictingopinions. In short, we need to know not only thecontent of the story, but also the intent behind it.
Many supervised approaches to bias detectionrely on text analysis (Recasens et al., 2013; Iyyeret al., 2014), effectively detecting words, phrases,and memes characteristic of an ideology or a polit-ical position. All such methods can be character-ized as language-based methods of bias detection.In contrast, the methods that we term reaction-based use human response to a news source inorder to identify its bias. Such response is reg-istered, for example, in social media when userspost links to news sources, or like the posts thatcontain such links. We observe that with respectto divisive issues, users tend to split into cohe-sive groups based on their like streams: peoplefrom conflicting groups will like and pass aroundsources and links that express the opinions and thesentiment common only within their group. Putsimply, reaction-based methods determine the biasof a source by how the communities of politicallylike-minded users react to it, based on the amountof liking, reposting, retweeting, etc., the text getsfrom the opposing groups. Such methods have re-cently been used with success in the context ofliberal/conservative biases in US politics (Conoveret al., 2011; Zhou et al., 2011; Gamon et al., 2008).
We believe the language-based and reaction-based methods are complementary and should becombined to supplement each other. Much workin bias detection relies on pre-existing annotatedcorpora of texts with known conservative and lib-eral biases. Such corpora obviously do not existfor most ideologies and biases found outside ofAmerican or Western discourse. In this work, wepropose to use a reaction-based analysis of biases
13

in news sources in order to create a large silverstandard of bias-marked text that will be used totrain language-based bias detection models. Thisis done by collecting the articles reacted upon(liked/linked/posted) by the members of opposingpolitical groups in social networks. We thus con-ceptualize the bias of a news article in terms ofhow likely it is to be referenced by one of the op-posing groups, following the idea that any public-ity is good publicity, and any reference to a sourcecan in a some sense be considered a positive ref-erence. The resulting “silver” corpus is slightlynoisier than a manually annotated gold standardsuch as the one used in (Iyyer et al., 2014), butmakes up for this deficiency by not being limitedin size.
In this work, we use the Russia-Ukraine Maidanconflict of 2013–2014 as a case study for predict-ing bias in a polarized environment. We collect alarge silver corpus of news articles using the postsin the user groups dedicated to the discussion ofthis conflict in a Russian social media networkVKontakte, and evaluate several methods of usingthis data to predict which side is likely to like andshare a given article. We use features derived bothfrom a source’s URL as well as the text of the ar-ticle. We also analyze the news sharing patternsin order to characterize the specific conflict rep-resented in our case study. Lastly, we annotate asmall corpus of news articles for bias in relationto the Maidan crisis. We are then able to test theeffectiveness of classifiers on gold-standard datawhen trained solely with silver-labeled data.
Our results show that predicting bias based onthe frequency of sharing patterns of users repre-senting opposing communities for our case studyis quite effective. Specifically, a Naive Bayes clas-sifier using only the domain name of a link as afeature (a one-hot input representation) achieves90% accuracy on a bias prediction task. We com-pare an SVM-based classification method with aFeed Forward Neural Network (FFNN), and findthat the best accuracy of 93.5% is achieved by theFFNN.
2 Dataset
In this study, we use data from Russian-speakingonline media, posted during the Ukrainian eventsof 2013-2014. We use the largest Russian so-cial network “VKontakte” (VK)1. According to
1http://vk.com
Domain Google Antimaidan EvromaidanName News groups groups
segodnya.ua 102 95 232unian.net 78 160 2311zn.ua 72 38 395lenta.ru 70 869 146news.liga.net 61 63 777ru.tsn.ua 54 65 809korrespondent.net 52 333 571rbc.ua 34 91 115ria.ru 21 8968 109vestifinance.ru 19 104 6glavred.info 19 12 117forbes.ua 18 11 66rian.com.ua 17 58 11pravda.com.ua 17 197 6307vz.ru 16 2092 8vesti.ru 15 831 54lb.ua 15 18 222biz.liga.net 15 6 56slon.ru 14 29 77gordonua.com 14 34 762gazeta.ru 12 454 94interfax.com.ua 12 45 131obozrevatel.com 11 57 670podrobnosti.ua 10 60 275top.rbc.ru 10 406 118interfax.ru 9 1166 39ntv.ru 8 408 36mk.ru 8 150 44pravda.ru 7 282 4gigamir.net 7 5 16focus.ua 6 8 101forbes.ru 6 54 6nbnews.com.ua 6 27 117ng.ru 6 33 5rosbalt.ru 6 90 61
Table 1: Statistics of the occurrences of domainsextracted from Google News.
liveinternet.ru, VKontakte has 320 million regis-tered users and is the most popular social networkin both Russia and Ukraine. During the conflict,both pro-Russian (also known as “Antimaidan”)and pro-Ukrainian side (also known as “Pro-” or“Evromaidan”) were represented online by largenumbers of Russian-speaking users.
We have built a scalable open stack systemfor data collection from VKontakte using the VKAPI. The system is implemented in Python usinga PostgreSQL database and Redis-based messagequeue. VK API has a less restrictive policy thanFacebook’s API, making it an especially suitablesocial network for research. Our system supportsthe API methods for retrieving the group mem-bers, retrieving all posts from a wall, retrievingcomments and likes for a given post, and so on.
In order to seed the data collection, we selectedthe most popular user groups from the two op-
14

posing camps, the Evromaidan group (154,589members) and the Antimaidan group (580,672members). We then manually annotated othergroups to which the administrators of these twogroups belonged, selecting groups with politicalcontent. This process produced 47 Evromaidan-related groups with 2,445,661 unique membersand 51 Antimaidan-related groups with 1,942,918unique members.
To create a dataset for our experiments, werandomly selected 10,000 links, 5,000 each fromAntimaidan and Evromaidan-related group walls.Links are disregarded if they appear on walls fromboth sides, which is to ensure an unambiguous as-signment of labels. We made a 90%/10% train/testsplit of the data. The labels for the links corre-spond to whether they came from an Antimaidanor Evromaidan related wall. We refer to thesedatasets as our silver-labeled training and test sets.
3 News Sharing Patterns in PolarizedCommunities
In this section we investigate whether the biasof a news article can be detected by examiningthe users who shared or liked this article. Ifthe link to this article is predominantly sharedby Evromaidan users, then it is more likely tocover the events in a way favorable to the Evro-maidan side, and vice versa. Examining thelinks shared by “Antimaidan” and “Evromaidan”groups, we see that they have a very small num-ber of shared links in common. The “Antimaidan”groups have posted 239,182 links and the “Evro-maidan” groups have posted 222,229 links, but thenumber of links that have been posted by bothsides is only 1,888, which are 0.79% and 0.85%of links posted to Antimaidan and Evromaidangroups, respectively, an alarmingly small num-ber. This general mutual exclusion of link shar-ing makes our label assignment strategy realisticfor our case study, since links are rarely shared byboth communities.
In order to check how many links from a newsaggregator are actually posted on the groups walls,we have collected links from the first 5 pagesof Google News Russia by using “maidan” and“Ukraine” query words. This resulted in a total of1,039 links. Out of these, 106 were posted on the“Antimaidan” group walls and 113 on the “Evro-maidan” group walls.
In order to investigate the possibility of charac-
terizing a news source, rather than a specific newsarticle in terms of its bias, we also extracted do-main names from the links collected from GoogleNews, as well as the links from the group walls.This produced 126 unique domain names fromGoogle News, out of which only 7 domains werenot presented on the groups wall, for a total of 14links, or 1.3%. Examining the number of occur-rences of each domain name on each side’s groupwalls is quite instructive, since for most sources aclear preference from one of the sides can be ob-served.
4 Bias Annotation
In order to evaluate our methodology on gold-labeled data, as opposed to the silver-labeleddataset from Section 2, we have annotated thenews articles from Section 3. Of the 1,039 linksfrom the Google News query, only 678 were ac-tive at the time of the annotation. Two differentannotators labeled the articles on a scale from -2 to 2, where -2 is strongly Antimaidan, -1 isweakly Antimaidan, 0 is neutral, 1 is weakly Pro-maidan, and 2 is strongly Promaidan. The annota-tors could also label NA if the article isn’t relatedto the Maidan crisis. We then merged the non-zerolabels to be either Pro or Anti Maidan, like our sil-ver data. In terms of labels where both annotatorsagreed, there are 40 Anti, 95 Pro, and 215 neutralarticles. We test our methodology on the articleswith a Pro or Anti bias (we were unable to scrape3 of the Pro articles, so there are 92 Pro articles fortesting).
5 Predicting Bias
In this section, we describe our experiments forpredicting issue-based bias of links shared online,using the Maidan crisis as a case study.
5.1 Feature Representation
We define a feature representation for each articlethat will use the following types of features:
Domain Name This features is simply thedomain name of the link. There are a total of1,043 domain names in the training set. Theuse of this feature is inspired by the unevendistribution of domain name sharing present inTable 1. Most importantly, this feature provides asingle non-zero value for its representation, whichallows us to evaluate how effective domain names
15
are for predicting bias.
Text-Based Features We initially scrape thefull HTML page from links and strip the HTMLcontent using BeautifulSoup2, followed by to-kenization of the text. We use a bag-of-wordsrepresentation of the text with count-based fea-tures3. We filter the vocabulary to contain wordsthat occur in at least 10 documents and at mostin 90% of documents. This representation has53,274 dimensions.
URL-Based Features Each article appears in oursystem as a link. We conjecture that we can betterdetermine bias using features of this link. Thereare three features taken from the link: 1) domainname, 2) domain extension, and 3) path elements.For example, The URL http://nlpj2017.fbk.eu/business-website-serviceswill have the following features: ‘nlpj2017’ and‘fbk’ will be domain features, ‘eu’ will be anextension feature, and ‘business-website-services’will be a path feature. We use the same vocab-ulary filtering strategy as with the text features– minimum frequency of ten documents and amaximum frequency of 90% of documents4. Thisrepresentation has 277 dimensions.
5.2 Models
Our experiments are a binary classification task.We experimented with three types of classifiers.The first is a Naive Bayes classifier. The secondclassifier is an SVM. Both the Naive Bayes andSVM classifiers are implemented in scikit-learn(Pedregosa et al., 2011) using default settings. Thesecond classifier is a FFNN, implemented in Keras(Chollet et al., 2015). The FFNN has two layers5,each with size 64, and ReLu activation (Nair andHinton, 2010) for the hidden layer.
6 Results and Discussion
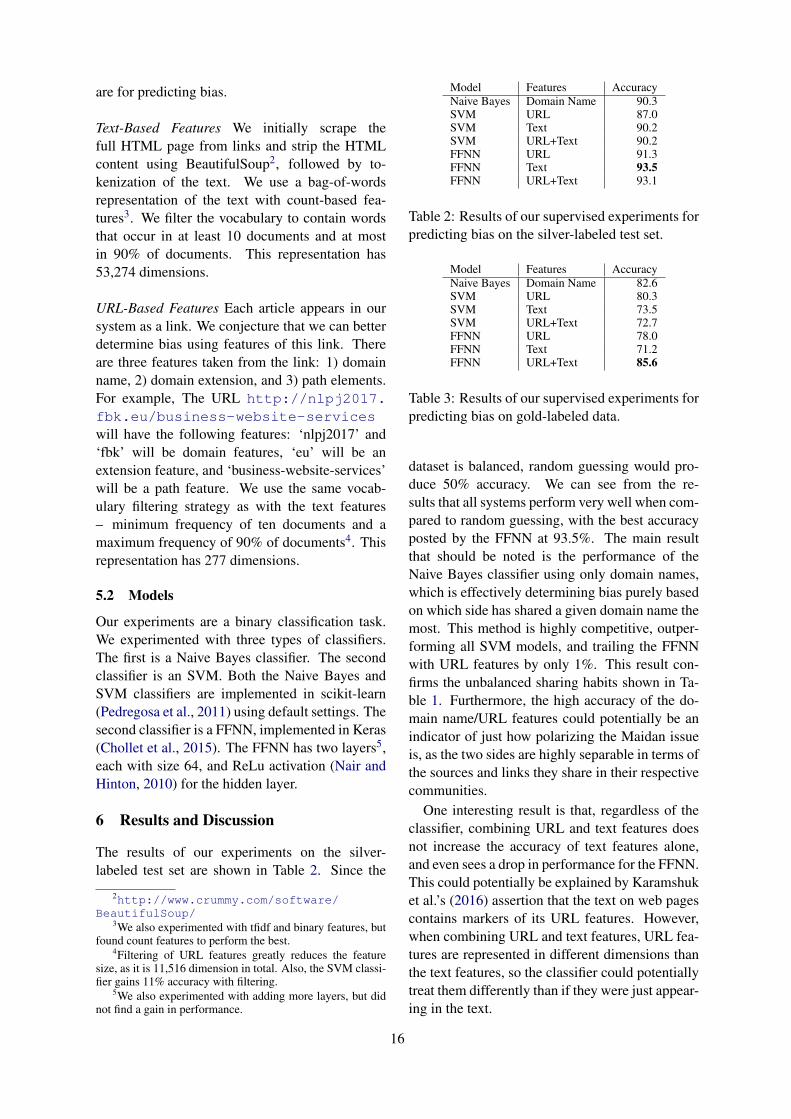
The results of our experiments on the silver-labeled test set are shown in Table 2. Since the
2http://www.crummy.com/software/BeautifulSoup/
3We also experimented with tfidf and binary features, butfound count features to perform the best.
4Filtering of URL features greatly reduces the featuresize, as it is 11,516 dimension in total. Also, the SVM classi-fier gains 11% accuracy with filtering.
5We also experimented with adding more layers, but didnot find a gain in performance.
Model Features AccuracyNaive Bayes Domain Name 90.3SVM URL 87.0SVM Text 90.2SVM URL+Text 90.2FFNN URL 91.3FFNN Text 93.5FFNN URL+Text 93.1
Table 2: Results of our supervised experiments forpredicting bias on the silver-labeled test set.
Model Features AccuracyNaive Bayes Domain Name 82.6SVM URL 80.3SVM Text 73.5SVM URL+Text 72.7FFNN URL 78.0FFNN Text 71.2FFNN URL+Text 85.6
Table 3: Results of our supervised experiments forpredicting bias on gold-labeled data.
dataset is balanced, random guessing would pro-duce 50% accuracy. We can see from the re-sults that all systems perform very well when com-pared to random guessing, with the best accuracyposted by the FFNN at 93.5%. The main resultthat should be noted is the performance of theNaive Bayes classifier using only domain names,which is effectively determining bias purely basedon which side has shared a given domain name themost. This method is highly competitive, outper-forming all SVM models, and trailing the FFNNwith URL features by only 1%. This result con-firms the unbalanced sharing habits shown in Ta-ble 1. Furthermore, the high accuracy of the do-main name/URL features could potentially be anindicator of just how polarizing the Maidan issueis, as the two sides are highly separable in terms ofthe sources and links they share in their respectivecommunities.
One interesting result is that, regardless of theclassifier, combining URL and text features doesnot increase the accuracy of text features alone,and even sees a drop in performance for the FFNN.This could potentially be explained by Karamshuket al.’s (2016) assertion that the text on web pagescontains markers of its URL features. However,when combining URL and text features, URL fea-tures are represented in different dimensions thanthe text features, so the classifier could potentiallytreat them differently than if they were just appear-ing in the text.
16

# Training Ex. Accuracy9,000 90.24,500 89.22,250 88.41,124 86.0
562 83.3280 81.2140 78.5
70 77.134 71.716 49.9
Table 4: Accuracy of the SVM model with textfeatures based on differing amounts of trainingdata. Evaluation is done on silver-labeled test set.
Table 3 shows the results of our models on thegold-labeled test set described in Section 4. First,we establish a trend of domain names being ahighly informative feature. Secondly, we see amodel that makes a dramatic improvement com-bining URL and text features; the FFNN. How-ever, when using either URL or text features indi-vidually, the SVM performs better on this test set.
Effects of Training Set SizeTable 4 Shows the accuracy of the SVM modelwith text features based on differing amounts oftraining data evaluated on the silver-labeled testset. There are several interesting insights fromthese results. First, reducing the initial train-ing set size by 75% reduces accuracy less than2%. Second, even with just 280 training exam-ples, the model still achieves above 80%; simi-larly, the model still achieves above 70% accuracywith only 34 training examples. Lastly, the modelsees its accuracy drop to that of random guessingonly once it is given 16 training examples.
7 Related Work
Most state-of-the-art work on bias detection dealswith known pre-defined biases and relies eitherstrictly on text or strictly on user reactions in orderto determine the bias of a statement. For exam-ple, Recasens et al. (2013) developed a system foridentifying the bias-carrying term in the sentence,using a dataset of Wikipedia edits that were meantto remove bias. The model uses a logistic re-gression classifier with several types of linguisticfeatures including word token, word lemma, part-of-speech tags, and several lexicons. The clas-sifier also looks at the edits that have previouslybeen made on the article. Using the same dataset,Kuang and Davison (2016) build upon previous
approaches by using distributed representations ofwords and documents (Pennington et al., 2014; Leand Mikolov, 2014) to create features for predict-ing biased language.
Iyyer et al. (2014) created a system that de-tects the political bias of a sentence using a re-cursive neural network to create multi-word em-beddings. The model starts with the individualembeddings of the sentence’s words and system-atically combines them to create the sentence em-beddings. These sentence embeddings are thenused as input to a supervised classifier that pre-dicts the author’s political affiliation for the sen-tence. The model is trained on a set of sentencesannotated down to phrase-level for political bias.The authors argue that, unlike bag-of-words mod-els, the sentence embeddings capture the full se-mantic composition of the sentence.
The work most similar to ours is that ofKaramshuk et al. (2016). While both their workand ours seek to predict the bias of a news source,the key difference is in how we construct ourdatasets. Karamshuk et al. manually annotate spe-cific news sources to identify partisan slant, andlabel an article’s bias based on its source. Ourlabeling is based on the sharing patterns of usersin a polarized setting (see Section 2 for a furtherdescription of our dataset). Lastly, Karamshik etal. use a bag of (word vector) means to constructfeatures for their classification experiments, whichhas been shown to be a poor representation for textclassification (Zhang et al., 2015). The authors’best accuracy is 77% in their binary classificationtasks.
A different approach to bias detection consistsin analyzing not the texts themselves, but the waythe texts circulate or are reacted upon within a so-cial network. Examples of such an approach arefound in the work of Gamon et al (2008) who an-alyze the links between conservative and liberalblogs and the news articles they cite, as well as theexpressed sentiment toward each article. Zhou etal (2011) detected and classified the political biasof news stories using the users’ votes at such col-laborative news curation sites as diggs.com. Re-latedly, Conover et al (2011) used Twitter politicaltags to show that retweet patterns induce homoge-neous, clearly defined user communities with ex-tremely sparse retweets between the communities.
17

8 Conclusion
In this paper we address the issue of predicting thepartisan slant of information sources and articles.We use the the Russia-Ukraine Maidan crisis of2013-2014 as a case study, wherein we attempt topredict which side of the issue is likely to sharea given link, as well as its corresponding article.Our best classifier, a FFNN, achieves 93.5% accu-racy on the binary classification task using a BOWrepresentation of the link content, and 91.3% accu-racy using only information from the URL itself.Moreover, a Naive Bayes classifier using only thedomain name of a link can record 90.3% accuracy,outperforming an SVM with more complex fea-tures. This remarkably high accuracy dictates thatthis case study exhibits high polarization in termsof its news sources, as well as its semantic con-tent. We also evaluate our methodology – traininga classifier with silver-labeled data based on useractions – on a gold-labeled test annotated for biasin relation to the Maidan crisis. The classifier us-ing only domain names continues its impressiveperformance, recording an 82.6% accuracy. Con-versely, a FFNN records 85.6% accuracy. For ourcase study, we find that the situation when two op-posing sides share the same links is extremely rare.
Acknowledgments
This work was supported in part by the U.S. ArmyResearch Office under Grant No. W911NF-16-1-0174.
ReferencesFrancois Chollet et al. 2015. Keras. https://github.com/fchollet/keras.
Michael Conover, Jacob Ratkiewicz, Matthew Fran-cisco, Bruno Goncalves, Filippo Menczer, andAlessandro Flammini. 2011. Political polarizationon twitter. In ICWSM.
Michael Gamon, Sumit Basu, Dmitriy Belenko, DanyelFisher, Matthew Hurst, and Arnd Christian Konig.2008. Blews: Using blogs to provide context fornews articles. In ICWSM.
Mohit Iyyer, Peter Enns, Jordan Boyd-Graber, andPhilip Resnik. 2014. Political ideology detectionusing recursive neural networks. In Proceedingsof the Association for Computational Linguistics.pages 1113–1122.
Dmytro Karamshuk, Tetyana Lokot, Oleksandr Pryy-mak, and Nishanth Sastry. 2016. Identifying parti-san slant in news articles and twitter during political
crises. In International Conference on Social Infor-matics. Springer, pages 257–272.
Sicong Kuang and Brian D Davison. 2016. Semanticand context-aware linguistic model for bias detec-tion.
Quoc Le and Tomas Mikolov. 2014. Distributed repre-sentations of sentences and documents. In Proceed-ings of the 31st International Conference on Ma-chine Learning (ICML-14). pages 1188–1196.
Vinod Nair and Geoffrey E Hinton. 2010. Rectifiedlinear units improve restricted boltzmann machines.In Proceedings of the 27th international conferenceon machine learning (ICML-10). pages 807–814.
Fabian Pedregosa, Gael Varoquaux, Alexandre Gram-fort, Vincent Michel, Bertrand Thirion, OlivierGrisel, Mathieu Blondel, Peter Prettenhofer, RonWeiss, Vincent Dubourg, et al. 2011. Scikit-learn:Machine learning in python. Journal of MachineLearning Research 12(Oct):2825–2830.
Jeffrey Pennington, Richard Socher, and Christopher DManning. 2014. Glove: Global vectors for wordrepresentation. In EMNLP. volume 14, pages 1532–1543.
Marta Recasens, Cristian Danescu-Niculescu-Mizil,and Dan Jurafsky. 2013. Linguistic models for an-alyzing and detecting biased language. In ACL (1).pages 1650–1659.
Xiang Zhang, Junbo Zhao, and Yann LeCun. 2015.Character-level convolutional networks for text clas-sification. In Advances in neural information pro-cessing systems. pages 649–657.
Daniel Xiaodan Zhou, Paul Resnick, and Qiaozhu Mei.2011. Classifying the political leaning of news arti-cles and users from user votes. In ICWSM.
18

Proceedings of the 2017 EMNLP Workshop on Natural Language Processing meets Journalism, pages 19–24Copenhagen, Denmark, September 7, 2017. c©2017 Association for Computational Linguistics
What to Write? A topic recommender for journalists
Giovanni Stilo and Paola VelardiSapienza University of Rome, Italy{stilo, velardi}@di.uniroma1.it
Alessandro Cucchiarelli and Giacomo Marangoni and Christian MorbidoniUniversita Politecnica delle Marche, Italy
{a.cucchiarelli, g.marangoni, c.morbidoni}@univpm.it
Abstract
In this paper we present a recommendersystem, What To Write and Why (W 3),capable of suggesting to a journalist, fora given event, the aspects still uncov-ered in news articles on which the read-ers focus their interest. The basic idea isto characterize an event according to theecho it receives in online news sourcesand associate it with the correspondingreaders’ communicative and informativepatterns, detected through the analysis ofTwitter and Wikipedia, respectively. Ourmethodology temporally aligns the resultsof this analysis and recommends the con-cepts that emerge as topics of interest fromTwitter and Wikipedia, either not coveredor poorly covered in the published newsarticles.
1 Introduction
In a recent study on the use of social media sourcesby journalists (Knight, 2012) the author concludesthat ”social media are changing the way newsare gathered and researched”. In fact, a growingnumber of readers, viewers and listeners accessonline media for their news (Gloviczki, 2015).When readers feel involved by news stories theymay react by trying to deepen their knowledgeon the subject, and/or confronting their opinionswith peers. Stories may then solicit a reader’s in-formation and communication needs. The inten-sity and nature of both needs can be measuredon the web, by tracking the impact of news onusers’ search behavior on on-line knowledge basesas well as their discussions on popular social plat-forms. What is more, on-line public’s reaction tonews is almost immediate (Leskovec et al., 2009)and even anticipated, as for the case of planned
media events and performances, or for disasters(Lehmann et al., 2012). Assessing the focus, dura-tion and outcomes of news stories on public atten-tion is paramount for both public bodies and me-dia in order to determine the issues around whichthe public opinion forms, and in framing the issues(i.e., how they are being considered) (Brooker andSchaefer, 2005). Futhermore, real-time analysisof public reaction to news items may provide use-ful feedback to journalists, such as highlighting as-pects of a story that needs to be further addressed,issues that appear to be of interest for the publicbut have been ignored, or even to help local news-papers echo international press releases.
The aim of this paper is to present a news me-dia recommender, What to Write and Why (W 3),for analyzing the impact of news stories on thereaders, and finding aspects – still uncovered innews articles – on which the public has focusedtheir interest. The purpose of W 3 is to supportjournalists in the task of reshaping and extend-ing their coverage of breaking news, by suggestingtopics to address when following up on such newsitems. For example, we have found that a com-mon pattern for news readers is to search events ofthe same type occurred in the past on Wikipedia,which is not surprising per se: however, amongthe many possible similar events, our system isable to identify those that the majority of read-ers consider (sometimes surprisingly) highly as-sociated with breaking news, e.g., searching forthe 2013 CeaseFire program in Baltimore duringEgypt’s ceasefire proposal in Gaza on July 2014.
2 Methodology
Our methodology is in five steps, as shown in theworkflow of Figure 1:
Step 1. Event detection: We use SAX*, anunsupervised temporal mining algorithm that we
19

Intra sourceclustering
C2 C3 C4
C1
Event Detection
t1 t3 t4t2
Intra sourceclustering
C2 C3 C4
C1
Reccomendations based on
Information Needs
Reccomendationsbased on
Communication Needs
Intra sourceclustering
C2 C3 C4
C1
Event Detection
t1 t3 t4t2
Wikipedia page-views
Twitter Stream
News Stream
Event Detection
t1 t3 t4t2
Inter Sourcesalignement
E'1
E'2
E''1
E''2
E'''1
E'''2
E2E1
Classification of
Information Needs
Classificationof
Communication Needs
Figure 1: Workflow of W 3
-1.4
-0.9
-0.4
0.1
0.6
1.1
1.6
2.1
2.6
7/15/1
4
7/16/1
4
7/17/1
4
7/18/1
4
7/19/1
4
7/20/1
4
7/21/1
4
7/22/1
4
7/23/1
4
7/24/1
4
Siberia_Airlines_Flight_1812 Ukraine Malaysia_Airlines_Flight_17
2014_pro-Russian_unrest_in_Ukraine Surface-to-air_missile Pan_Am_Flight_103
2014_Russian_military_intervenKon_in_Ukraine
Figure 2: Cluster of normalized time series of Wikipediapage views for Malaysia Airline crash on July 2014.
introduced in (Stilo and Velardi, 2016), to clustertokens – words, entities, hashtags, page views –based on the shape similarity of their associatedsignals s(t). In SAX*, signals observed in tempo-ral windowsLk are first transformed into strings ofsymbols of an alphabet Σ; next, strings associatedto active tokens (those corresponding to patternsof public attention) are clustered based on theirsimilarity. Each cluster is interpreted as related toan event ei. Clusters are extracted independentlyfrom on-line news (N ), Twitter messages (T ) andWikipedia page views (W ).For example, the cluster in Figure 2 showsWikipedia page views related to the Malaysia Air-line crash on July 2014. We remark that SAX*blindly clusters signals without prior knowledgeof the event and its occurrence date, and further-more, it avoids time-consuming processing of textstrings, since it only considers active tokens.
Step 2. Intra-source clustering: Since clus-ters are generated in sliding windows Lk of equallength L and temporal increment ∆, clusters refer-ring to the same event but extracted in partly over-lapping windows may slightly differ, especiallyfor long-lasting events, when news updates moti-vate the emergence of new sub-topics and the de-cay of others. An example is in Figure 3, show-ing for simplicity a cluster with a unique signals(t) which we can also interpret as the cluster cen-troid. The Figure also shows the string of symbols
a a a a b b a a a a a
a a a a a a a a a b b
a b b a a a a a a b a
a a a a a b a a a a a
a a a a a a a b b a a
1
2
3
4
5
Figure 3: SAX* strings associated to a temporal series s(t)in 5 adjacent or overlapping windows.
associated with the signal in each window (withΣ = {a, b}).
For a better characterization of an event, wemerge clusters referring to the same event and ex-tracted in adjacent windows, based on their sim-ilarity. Merged clusters form meta-clusters, de-noted with mS
i , where the index i refers to theevent and S ∈ {N,T,W} to the data source. Withreference to Figure 3, the signals in windows 1, 2,3 and 4 would be merged, but not the signal inwindow 5.An example from the T dataset is shown in Table1: note that the first two clusters show that ini-tially Twitter users where concerned mainly aboutthe tragedy (clusters C9 and C5), and only laterdid their interest focus on political aspects (e.g.,Barack Obama, Vladimir Putin in C17 and C18).
Step 3. Inter-source alignment: Next, analignment algorithm explores possible matchesacross the three data sources N , T and W . Forany event ei, we eventually obtain three ”aligned”meta-clusters mN
i , mTi and mW
i mirroring respec-tively the media coverage of the considered eventand its impact on readers’ communication and in-formation needs.
Step 4. Generating a recommendation: Theinput to our recommender is the news meta-clusters mN
i related to an event ei first reportedon day d0 and extracted during an interval I :d0 ≤ d ≤ d0+x, where d0+x is the day in whichthe query is performed by the journalist. Thesystem compares the three aligned meta-clusters
20

Table 1: The Twitter meta-cluster capturing the Malaysia Airlines flight crash event and its composing clusters
ClustersC9 [tragic, crash, tragedi, Ukraine 1.0, Malaysia Airlines 0.6, Airline 0.66, Malaysia Airlines Flight 17 0.65, Malaysia 0.60, Russia 0.51, Avia-tion accidents and incidents 0.36, Airliner 0.35, Malaysia Airlines Flight 37 0.28, United States 0.21, Tragedy 0.20, Boeing 777 ... ]
C5 [tragic, tragedi, Airline 1.0, Malaysia Airlines Flight 17 0.97, Malaysia Airlines 0.70, Malaysia 0.58, Ukraine 0.40, Twitter 0.39, Gaza Strip 0.32, CNN 0.26,Tragedy 0.25, God 0.24, Airliner 0.22, Israel 0.22, Malaysia Airlines Flight 370 0.22, Netherlands 0.21,..]
C17 [tragedi, tragic, Malaysia Airlines Flight 17 1.0, Airline 0.89, Malaysia Airlines 0.62, Malaysia 0.54, Gaza Strip 0.42, Twitter 0.38, Ukraine 0.38, Hamas 0.33,Barack Obama 0.32, Israel 0.29, Vladimir Putin 0.27, God 0.26, CNN 0.25, Hell 0.25, Airliner 0.23, Malaysia Airlines Flight 37 0.20,...]
T C18 [tragedi, tragic, Malaysia Airlines Flight 17 1.0, Airline 0.98, Malaysia Airlines 0.80, Tragedy , Malaysia 0.54, Gaza Strip 0.50, Ukraine 0.48, Hamas 0.408,Israel 0.38, Barack Obama 0.7, Twitter 0.37, Vladimir Putin 0.36, CNN 0.32, Airliner 0.28, Malaysia Airlines Flight 370 0.26, Hell 0.252, ...]
Meta-cluster[tragedi 0.22, tragic 0.22, airline 0.20, malaysia airlines flight 17 0.20, ukraine 0.19, malaysia airlines 0.19, malaysia 0.17, russia 0.129, tragedy 0.12, vladimir putin0.12, airliner 0.12, crash 0.12, gaza strip 0.11, barack obama 0.11, aviation accidents and incidents 0.11, cnn 0.106, malaysia airlines flight 370 0.10, god 0.10, ... ]
to identify in mTi and mW
i the set of most rele-vant entities 1, respectively ET
i and EWi . A set
of entities Ei in either T or W is further parti-tioned in Rin news
i and Rnoveli , representing, re-
spectively, the event-related topics already dis-cussed, and those not yet considered in newsitems. The first set is interesting for journal-ists in order to understand which topics mostlyattracted the attention of the public, while thesecond set includes event-related, but still un-covered, topics that W 3 recommends to discuss.For example, the following is a recommenda-tion generated from the analysis of Wikipediapage views, related to Scottish Independence elec-tions on September 17th, 2014: [scotland, wales,alex salmond, united kingdom, scottish nationalparty, flag of scotland, william wallace, coun-tries of the united kingdom, mary queen of sco-ts, tony blair, braveheart, flag of the unitedkingdom, republic of ireland]. When com-paring these entities with the aligned newsmeta-clusters, the set of novel entities Rnovel
i
is: [flag of scotland, william wallace, countriesof the united kingdom, mary queen of scots, tonyblair, braveheart] and all the others are also found
in news.Step 5. Classification of information and
communication needs: In addition to recom-mendations, we automatically assign a categoryboth to event clusters mN
i in news, and to relatedentities in Twitter and Wikipedia aligned meta-clusters mT
i and mWi , in order to detect recur-
rent discussion topics and search patterns in re-lation to specific event types. To do so, we ex-ploit both BabelNet (Navigli and Ponzetto, 2010),
1We used TextRazor https://www.textrazor.com and DataTXT https://dandelion.eu/semantic-text/entity-extraction-demo/to extract entities respectively from Twitter and news items
dataset # clusters #m.clusters
av. sizem.clusters
News 9396 829 122.46Twitter 4737 413 136.76Wikipedia 5450 535 6.44
Table 2: Statistics on data and results
a large-scale multilingual semantic network2, andthe Wikipedia Category graph.
3 Discussion
To conduct our study, we created three datasets:Wikipedia PageViews (W), On-line News (N) andTwitter messages (T). Data was collected during4 months from June 1st, 2014 to September 30th.Table 2 shows some statistics. Note that Wikipediaclusters are smaller, since cluster members areonly named entities (page views).We defined the following evaluation framework:
i) Given an event ei and related news ni ∈ Ni, wegenerate recommendations as explained in Step4, in a selected interval prior to the day of thequery. ii) Automated evaluation: we we select thetop K scored recommendations and measure thesaliency of Rin news
i and serendipity of Rnoveli in
an automated fashion, and we compare the perfor-mance against a primitive recommender, in anal-ogy with (Murakami et al., 2008) and (Ge et al.,2010); ii) Manual evaluation: we select the top Kscored recommendations in Rnovel
i for a restrictednumber of 21 high-impact world-wide events, andwe perform manual evaluation using the Crowd-flower.com platform, providing detailed evalua-tion guidelines for human annotators. Using thisground truth, we measure the global serendipity ofW 3 recommendations.
2http://babelnet.org/about
21

3.1 Automated Evaluation
We first build two primitive recommenders (PRs)for Wikipedia and Twitter, which we use as a base-line. The input to a PR is the same as for W 3 (seeStep 4).Wikipedia PR: The Wikipedia PR is based on find-ing connected components of the Wikipedia hy-perlink page graph (like in (Hu et al., 2009)), whenconsidering only the topmost visited pages in atemporal slot. More precisely, for each day d inthe interval I ′ : d0−x ≤ d ≤ d0+x
3, we se-lect the top H ≥ K visited named entities ofthe day EW
d . Entities are ranked by frequency ofpage views4. Next, we create clusters cdj obtainedby extracting the connected components of EW
d inthe Wikipedia hyperlink graph. Let CI′ be the setof all clusters cI
′j in I ′. From this set, we select
the top r clusters based on the Jaccard similaritywith news meta-clusters mN
i . A ”primitive” rec-ommendation for event ei on day d0+x is the setPRW
i of topmost K ranked entities in the r pre-viously selected clusters. Like in W 3 recommen-dations, PRW
i is a ranked list of entities some ofwhich are also found in mN
i , and some others arenovel.Twitter PR: For each entity e ∈ mN
i we retrieveand recommend the top K co-occurring entities intweets in the considered interval.
Note that both primitive recommenders are farfrom being naive. A hyperlink graph to character-ize users’ intent in Wikipedia search is used in (Huet al., 2009) (although the authors use RandomWalks rather than connected components analy-sis to identify related pages). Co-occurrences withtop ranked news terms has been used in (Weileret al., 2014) to track on Twitter the evolution andthe context around events. We generate recom-mendations using four systems: W 3(T ), W 3(W ),PR(T ) and PR(W ). The first two originate fromWhat To Write and Why when applied to Twitterand Wikipedia, respectively. The second two aregenerated by the two primitive recommenders de-scribed above. For all systems, we consider thefirst K top ranked entities, as we said.
To assess the quality of ”not novel” recom-mended entities in W 3 (and similarly for the othersystems), for any rj ∈ Rin news
i we retrieve all the
3Since rumors on an event can be anticipated wrt the dayd0 in which the first news item is published
4Note that EWd could be straightly used for recommenda-
tion, however it would be an excessively rough strategy.
news Ni related to mNi meta-clusters, and com-
pute the saliency of rj as follows:
saliency (rj , ni) = β × occtitle (rj , ni) + (1− β)× occsnip (rj , ni)
(1)
where ni ∈ Ni, occtitle(rj , ni) is the numberof occurrences of rj in the title of ni, whileoccsnip(rj , ni) is the number of occurrences of rjin the text snippet of ni and β has been experimen-tally set to 0.7. The intuition is that recommendedentities in Rin news
i are salient if they frequentlyoccur in the title and text of news snippets, whereoccurrences in the title have a higher weight. Thetotal saliency of rj is then:
saliency (rj) =∑
ni∈Nisaliency(rj ,ni)
|Ni| × IDF (rj)
(2)
where IDF (rj) is the inverse document fre-quency of rj in all news of the considered tem-poral slot, and is used to smooth the relevance ofterms with high probability of occurrence in alldocuments. The average saliency of Rin news
i is:
saliency(Rin news
i
)=
∑rj∈Rin news
isaliency(rj)
|Rin newsi | (3)
To provide an estimate of the serendipityof novel recommendations, we compute theNASARI similarity (Camacho-Collados et al.,2016) of entities rk ∈ Rnovel
i with in-news entitiesrj ∈ EN
i and we weight these values with thesaliency of rj . The intuition is that serendipitousrecommendations are those concerning topicswhich have not been discussed so far in on-linenews, but are highly semantically related withhighly salient topics in news:
serend.(rk ∈ Rnovel
i
)=
∑rk∈Rnovel
i,rj∈EN
i(NASARI(rk,rj)×saliency(rj))
|RSi |
(4)
Note that this formulation is not conceptuallydifferent from other measures used in literature(e.g, (Tran et al., 2015),(Murakami et al., 2008)),that commonly assign a value to novel recom-mendations proportionally to their relevance andinformativeness, however given the absence ofprior knowledge on users’ choices, we assume thatsemantic similarity with salient entities in newsitems is a clue for relevance.
In Table 3 we summarize the results of our ex-periments, that we run over the full dataset (see
22
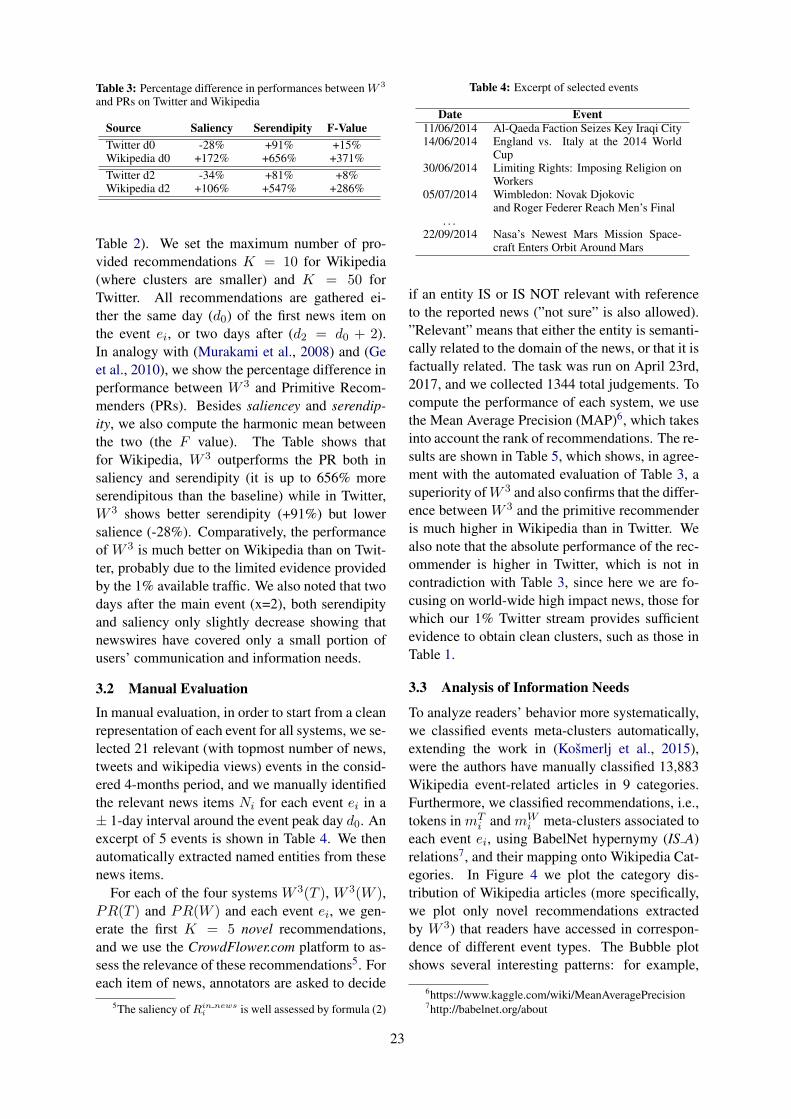
Table 3: Percentage difference in performances between W 3
and PRs on Twitter and Wikipedia
Source Saliency Serendipity F-ValueTwitter d0 -28% +91% +15%Wikipedia d0 +172% +656% +371%Twitter d2 -34% +81% +8%Wikipedia d2 +106% +547% +286%
Table 2). We set the maximum number of pro-vided recommendations K = 10 for Wikipedia(where clusters are smaller) and K = 50 forTwitter. All recommendations are gathered ei-ther the same day (d0) of the first news item onthe event ei, or two days after (d2 = d0 + 2).In analogy with (Murakami et al., 2008) and (Geet al., 2010), we show the percentage difference inperformance between W 3 and Primitive Recom-menders (PRs). Besides saliencey and serendip-ity, we also compute the harmonic mean betweenthe two (the F value). The Table shows thatfor Wikipedia, W 3 outperforms the PR both insaliency and serendipity (it is up to 656% moreserendipitous than the baseline) while in Twitter,W 3 shows better serendipity (+91%) but lowersalience (-28%). Comparatively, the performanceof W 3 is much better on Wikipedia than on Twit-ter, probably due to the limited evidence providedby the 1% available traffic. We also noted that twodays after the main event (x=2), both serendipityand saliency only slightly decrease showing thatnewswires have covered only a small portion ofusers’ communication and information needs.
3.2 Manual Evaluation
In manual evaluation, in order to start from a cleanrepresentation of each event for all systems, we se-lected 21 relevant (with topmost number of news,tweets and wikipedia views) events in the consid-ered 4-months period, and we manually identifiedthe relevant news items Ni for each event ei in a± 1-day interval around the event peak day d0. Anexcerpt of 5 events is shown in Table 4. We thenautomatically extracted named entities from thesenews items.
For each of the four systems W 3(T ), W 3(W ),PR(T ) and PR(W ) and each event ei, we gen-erate the first K = 5 novel recommendations,and we use the CrowdFlower.com platform to as-sess the relevance of these recommendations5. Foreach item of news, annotators are asked to decide
5The saliency of Rin newsi is well assessed by formula (2)
Table 4: Excerpt of selected events
Date Event11/06/2014 Al-Qaeda Faction Seizes Key Iraqi City14/06/2014 England vs. Italy at the 2014 World
Cup30/06/2014 Limiting Rights: Imposing Religion on
Workers05/07/2014 Wimbledon: Novak Djokovic
and Roger Federer Reach Men’s Final. . .
22/09/2014 Nasa’s Newest Mars Mission Space-craft Enters Orbit Around Mars
if an entity IS or IS NOT relevant with referenceto the reported news (”not sure” is also allowed).”Relevant” means that either the entity is semanti-cally related to the domain of the news, or that it isfactually related. The task was run on April 23rd,2017, and we collected 1344 total judgements. Tocompute the performance of each system, we usethe Mean Average Precision (MAP)6, which takesinto account the rank of recommendations. The re-sults are shown in Table 5, which shows, in agree-ment with the automated evaluation of Table 3, asuperiority ofW 3 and also confirms that the differ-ence between W 3 and the primitive recommenderis much higher in Wikipedia than in Twitter. Wealso note that the absolute performance of the rec-ommender is higher in Twitter, which is not incontradiction with Table 3, since here we are fo-cusing on world-wide high impact news, those forwhich our 1% Twitter stream provides sufficientevidence to obtain clean clusters, such as those inTable 1.
3.3 Analysis of Information Needs
To analyze readers’ behavior more systematically,we classified events meta-clusters automatically,extending the work in (Kosmerlj et al., 2015),were the authors have manually classified 13,883Wikipedia event-related articles in 9 categories.Furthermore, we classified recommendations, i.e.,tokens in mT
i and mWi meta-clusters associated to
each event ei, using BabelNet hypernymy (IS A)relations7, and their mapping onto Wikipedia Cat-egories. In Figure 4 we plot the category dis-tribution of Wikipedia articles (more specifically,we plot only novel recommendations extractedby W 3) that readers have accessed in correspon-dence of different event types. The Bubble plotshows several interesting patterns: for example,
6https://www.kaggle.com/wiki/MeanAveragePrecision7http://babelnet.org/about
23

Source W3 BRTwitter 0.934 0.851Wikipedia 0.789 0.363
Table 5: MAP (mean average precision) of compared sys-tems in Crowdflower.com evaluation (on a sample of 21breakings news)
Technology
Television
Actor
Music
VideoGam
e
Character
GeographicArea
Event
Accident
Corpora;on
War
Religion
Science
Poli;cs
RecurringEvents
Terrorism
Literature
Model(person)
Document
Sport
Racing
AircraD
Businessman
Ar;st
MilitaryO
pera;on
ArmedconflictsandaHacks
Artsandculture
Businessandeconomy
Disastersandaccidents
Healthandenvironment
Lawandcrime
Poli;csandelec;ons
Scienceandtechnology
Sport
Figure 4: Bubble plot of event categories and associated in-formation needs (during Summer 2014)
Religion is the main searched category for eventsclassified as Armed Conflicts and Attacks, mir-roring the fact that religion is perceived as be-ing highly related with latest world-wide conflicts.Accordingly, users try to deepen their knowledgeon these aspects. Disasters and accidents mostlyinclude members in the same Wikipedia category(Disasters) and also Aircraft, since the Malaysiacrash was the dominating event in the consideredperiod. Business and Economy draw the atten-tion of readers mostly when related to Technol-ogy, e.g., new devices being launched. Law andCrime events induce in readers the need to findout more about specific laws and treaties (the cat-egory Documents). Finally, we note that Sport isthe event category showing the highest dispersionof information needs. While many of the bubblesin Figure 4 indeed show real information needs(e.g, VideoGames refers to the many sport gameslaunched on the market, Model (person) refers togossip about football players, and in general allpeople and media related categories refer to theparticipation of celebrities in sporting events), anumber of bubbles can be considered as noise,e.g., Literature, Politics. In fact, Sport was thedominating event type during the considered pe-riod (2014 World Football Cup), therefore it is rea-sonable that sport-related clusters are those cumu-lating the highest number of system errors.
ReferencesR. Brooker and T. Schaefer. 2005. Public Opinion in
the 21st Century: Let the People Speak?. New di-rections in political behavior series. Houghton Mif-flin Company.
J. Camacho-Collados, M. Taher Pilehvar, and R. Nav-igli. 2016. Nasari: Integrating explicit knowledgeand corpus statistics for a multilingual representa-tion of concepts and entities. Artificial Intelligence240:36–64.
M. Ge, C. Delgado-Battenfeld, and D. Jannach. 2010.Beyond accuracy: Evaluating recommender systemsby coverage and serendipity. In Proc. of RecSys’10.pages 257–260.
P. J. Gloviczki. 2015. Journalism in the Age of SocialMedia, Palgrave Macmillan US, pages 1–23.
J. Hu, G. Wang, F. Lochovsky, J. Sun, and Z. Chen.2009. Understanding user’s query intent withwikipedia. In Proc. of WWW’09. pages 471–480.
M. Knight. 2012. Journalism as usual: The use of so-cial media as a newsgathering tool in the coverageof the iranian elections in 2009. Journal of MediaPractice 13(1):61–74.
A. Kosmerlj, E. Belyaeva, G. Leban, M. Grobelnik, andB. Fortuna. 2015. Towards a complete event typetaxonomy. In Proc. of WWW’15. pages 899–902.
J. Lehmann, B. Goncalves, J. J. Ramasco, and C. Cat-tuto. 2012. Dynamical classes of collective attentionin twitter. In Proc. of WWW’12. pages 251–260.
J. Leskovec, L. Backstrom, and J. Kleinberg. 2009.Meme-tracking and the dynamics of the news cycle.In Proc. of KDD ’09. pages 497–506.
T. Murakami, K. Mori, and R. Orihara. 2008. Met-rics for evaluating the serendipity of recommenda-tion lists. In Proc. of the 2007 Conf. on New Fron-tiers in AI. Springer, pages 40–46.
R. Navigli and S. P. Ponzetto. 2010. BabelNet: Build-ing a very large multilingual semantic network. InProc. of the 48th Annual Meeting of the ACL. pages216–225.
G. Stilo and P. Velardi. 2016. Efficient temporal miningof micro-blog texts and its application to event dis-covery. Data Min. Knowl. Discov. 30(2):372–402.
T. Tran, C. Niedere, N. Kanhabua, U. Gadiraju, andA. Anand. 2015. Balancing novelty and salience:Adaptive learning to rank entities for timeline sum-marization of high-impact events. In Proc. ofCICM’15. Springer, volume 19, pages 1201–1210.
A. Weiler, M. Grossniklaus, and M.H. Scholl. 2014.Event identification and tracking in social mediastreaming data. In Proc. of the Work. of theEDBT/ICDT’14. CEUR-WS, pages 282–287.
24

Proceedings of the 2017 EMNLP Workshop on Natural Language Processing meets Journalism, pages 25–30Copenhagen, Denmark, September 7, 2017. c©2017 Association for Computational Linguistics
Comparing Attitudes to Climate Change in the Media using sentimentanalysis based on Latent Dirichlet Allocation
Ye Jiang1, Xingyi Song1, Jackie Harrison2, Shaun Quegan3, and Diana Maynard1
1Department of Computer Science2 Department of Journalism Studies
3School of Mathematics and StatisticsUniversity of Sheffield, Western Bank, Sheffield, S10 2TN, UK{yjiang18,x.song,j.harrison,s.quegan,d.maynard}@sheffield.ac.uk
Abstract
News media typically present biased ac-counts of news stories, and different pub-lications present different angles on thesame event. In this research, we inves-tigate how different publications differ intheir approach to stories about climatechange, by examining the sentiment andtopics presented. To understand these at-titudes, we find sentiment targets by com-bining Latent Dirichlet Allocation (LDA)with SentiWordNet, a general sentimentlexicon. Using LDA, we generate topicscontaining keywords which represent thesentiment targets, and then annotate thedata using SentiWordNet before regroup-ing the articles based on topic similar-ity. Preliminary analysis identifies clearlydifferent attitudes on the same issue pre-sented in different news sources. Ongo-ing work is investigating how systematicthese attitudes are between different pub-lications, and how these may change overtime.
1 Introduction
Editorial decisions in newspaper articles are influ-enced by diverse forces and ideologies. News pub-lications do not always present unbiased accounts,but typically present frames reflecting opinionsand attitudes which can heavily influence the read-ers’ perspectives (Spence and Pidgeon, 2010). Cli-mate change is a controversial issue in which thiskind of framing is very apparent. Although biasamong different news sources has been discussedpreviously (Fortuna et al., 2009; Evgenia and vanDer Goot, 2008), sentiment analysis has not beencommonly applied to newspaper articles for thispurpose.
Sentiment analysis is typically implementedon short documents such as Twitter (Pak andParoubek, 2010; Agarwal et al., 2011) and cus-tomer reviews (Pang et al., 2008; Shelke et al.,2017). However, newspaper articles have diversecontext length, so their content is much more com-plicated than other types of sources, especially asthese articles are normally cross-domain. A vari-ety of topics might be discussed in the context ofa particular climate change issue. Thus, we needto understand what the target of the opinion is ineach case, i.e. which aspect of climate change theopinion is about. For instance, using the methodsdescribed in this work, we found in reports aboutthe IPCC 2008 (Intergovernmental Panel on Cli-mate Change) that The Independent talked aboutcarbon dioxide emission, but The Guardian con-centrated on issues of rising sea levels.
Furthermore, unlike with short documentswhere one can just find a single sentiment forthat document, in order to understand the over-all opinion in articles about climate change, weneed to look at each opinion and its target sepa-rately, as multiple targets may be addressed in asingle article. Additionally, even when reportingon the same event and topic, different newspapersources will have diverse focuses. However, un-like with tweets or customer reviews, newspaperarticles must give at least some semblance of ob-jectivity, and often refrain from using explicit pos-itive or negative vocabulary.
In this paper, we examine a set of articles aboutclimate change in four UK broadsheets during thelast decade. It is impractical to manually iden-tify topics and analyse all the opinions about themin this large set. We therefore propose a topicmodelling method to generate topics using LatentDirichlet Allocation (LDA), and then cluster thearticles into groups with similar topics. Then weperform sentiment analysis on each cluster, in or-
25

der to investigate the opinions, how they differ inthe 4 sources, and how they may have changedover time.
2 Related Work
Research on sentiment analysis for news articlesis not entirely new (Yi et al., 2003; Wilson et al.,2005). Henley et al. (2002) analysed violence-related reports in different newspapers and foundthat there is a significant difference between themanner of reporting the same violence-related is-sues. They also found newspaper sentiments re-flecting the corresponding ideologies of the edi-tors. However, they applied their content analy-sis on a limited number of articles, so that the vo-cabulary for the analysis was also small and strict.Wiebe et al. (2004) applied a classification task fordetecting subjectivity and objectivity in newspaperarticles. Their work depended on several newspa-per datasets which were manually labelled.
Sentiment analysis has been more commonlyimplemented on newspaper titles. Strapparavaand Mihalcea (2007) automatically classified ti-tles with a valence indication, while Burget et al.(2011) proposed a method that classified 6 emo-tions in Czech newspapers based on their head-lines. Burscher et al. (2016) proposed selec-tion and baseline approaches to analyse sentimentsin headlines and entire articles respectively, withclustering performed by combining K-means clus-ter analysis and sentiment analysis. Others haveanalysed the quotations in newspaper articles.Balahur et al. (2009) extracted annotated quota-tions from Europe Media Monitor (EMM), andclassified them into positive and negative classesusing several sentiment lexicons and a SupportVector Machine (SVM) classifier. Both quota-tions and headlines are short pieces of text, whichmeans that the sentiment analysis is less noisy, andalso that the source and target of the sentimentcould easily be identified. However, those shortpieces of text could not always reveal the insightsof news, missing much useful information.
LDA is a generative probabilistic model whichhas been used to extract abstract topics from doc-uments. It investigates the hidden semantic struc-ture from large amounts of text without requiringmanual coding, thus reducing time and cost (Bleiet al., 2003). Feuerriegel et al. (2016) applied LDAto extract 40 topics from German financial news-paper articles and found that some topics have an
important effect on the stock price market. Xu andRaschid (2016) also developed two probabilisticfinancial community models to extract topics fromfinancial contracts. However, the implementationof LDA on newspaper articles is less known.
3 Method
3.1 Data
The data for our experiment consists of 11,720newspaper articles collected from 4 UK broad-sheets – The Guardian, The Times, The Telegraphand The Independent – between 2007 and 2016.These articles were extracted from LexisNexis bysearching all four sources for those containing thekeywords “Climate Change” at least 3 times in to-tal.
3.2 Pre-processing
In order to identify the topics that can best rep-resent events and issues with respect to climatechange, we use a part of speech tagger to anno-tate all the words, and only keep the nouns for theLDA model. For the sentiment analysis, all wordsare included.
3.3 LDA model
Typically, the number of topics in the LDA modelis determined by computing the log-likelihood orperplexity. However, Bigelow (2002) has shownthat predictive likelihood (or equivalently, per-plexity) and human judgment are often not corre-lated, and even sometimes slightly anti-correlated.In this paper, we therefore treat the topics as clus-ters, and apply the Silhouette Coefficient instead.This method has been previously used for find-ing the optimal number of topics (Panichella et al.,2013; Ma et al., 2016), and is suitable for our LDAapproach, since LDA is fully unsupervised. Nev-ertheless, in future work, it may be worth eval-uating some probability measures such as log-likelihood and perplexity, and comparing the per-formance using these methods.
Sil =b− a
max(a, b)(1)
where a is the mean distance between a point andother points in the same cluster, and b is the meandistance between a point and other points in thenext nearest cluster. In the silhouette analysis (Maet al., 2016), silhouette coefficients close to +1 in-dicate that the samples in the cluster are far away
26

Sources TopicsThe Guardian copenhagen,world,deal,agreement,summit,president,obama,china,action,treatyThe Times copenhagen, world, cent, deal, president, summit, agreement, conference, china, yearThe Telegraph world, carbon, copenhagen, summit, deal, cent, agreement, energy, time, presidentThe Independent world, carbon, copenhagen, deal, cent, agreement, year, conference, cancun, government
Table 1: Topics in 2009
Topic ID KeywordsTopic 1 0.31*food 0.84*land 0.79*world ...Topic 2 0.53*year 0.98*science 0.03*time ...Topic 3 0.29*world 0.21*car 0.18*weather...
Table 2: Example of Topic list in The Guardian2007
from the neighbouring clusters. In contrast, a neg-ative silhouette coefficient means that the samplesmight have been assigned to the wrong cluster.
In our case, we repeatedly ran the analysis onthe entire dataset with a different number of top-ics (0-30) and added the silhouette value for eachnumber of topics to the plot in Figure 1. We cansee that when the number of topics reaches 20, ithas the highest silhouette coefficient score whichindicates the best clustering result.
Figure 1: Silhouette analysis for LDA model
Once the number of topics has been determinedat 20, the LDA assigns keywords to one of the top-ics of the news article, based on the probability ofthe keywords occurring in the topics. This assign-ment also gives topic representations of all the ar-ticles. We repeatedly updated the assignment for50 iterations to generate both topic distribution inthe articles and word distribution in the topics. Foreach topic in the LDA model, we select the top 10keywords with their distribution to represent thecorresponding topic (see Table 2).
Articles Topic ID DistributionsArticle 1 1 0.519842Article 2 12 0.348175Article 3 7, 12 0.412394, 0.1492813Article 4 2 0.249132
Table 3: Example of topic-document matrix
Each article is assigned to a set of topics, andeach topic generates a set of keywords based onthe vocabulary of the articles. After acquiringthe topics from the LDA model, we convert thebag-of-words model into a topic-document matrix,which can be seen as a lower dimensionality ma-trix (Table 3).
We then select the highest distribution topicamong 20 topics from each news article in differ-ent news sources.
3.4 Applying SentiWordNetTo automatically annotate the articles with senti-ment labels, we use SentiWordNet1, which con-tains roughly 155,000 words associated with posi-tive and negative sentiment scores. The keywordsin each topic indicate the sentiment targets to beannotated with the corresponding score from Sen-tiWordNet. For each article, the scores for all tar-gets are combined and normalised (to a score be-tween -1 and +1) to deal with the fact that someclusters have more articles than others. The dif-ferent attitudes of each news source on the sameclimate change issue can then be analysed once wehave a score for each article. For this, we manuallycheck the keywords in the topic lists in each newssource in each year, and group those topics con-taining at least two of the same keywords. Specif-ically, we analysed every keyword in each topicID from 2007 to 2016 in each news source, andextract the keywords which occur in each topic.Then we also extract the topic IDs based on thosekeywords, and group the IDs based on the top-ics that contain at least two identical keywords.We assume that those news articles have similaror the same topics, as well as sentiment targets,though this also requires verification. We note that
1http://sentiwordnet.isti.cnr.it/
27

Detected SentencesPositiveChina itself defended its crucial role in saving the Copenhagen conference from failure. (The Guardian, 28 Dec, 2009)Don’t panic. Copenhagen really wasn’t such a disaster. (The Independent,15 Dec, 2009)NegativeThe move emerged from the chaotic Copenhagen conference on climate change. (The Telegraph, 21 Dec, 2009)Copenhagen puts nuclear options at risk. (The Times, 23 Dec, 2009)
Table 4: Example sentences with sentiment polarity detected in the four news source in 2009.
the current method of grouping similar topics be-tween news sources manually could introduce hu-man bias. Future work will look at ways to avoidthis.
4 Results and Discussion
We compared the 4 news sources by analysing theclusters we identified. For some years, there wasno single topic that appeared in the clusters (prob-ably because different newspapers attached dif-ferent levels of importance to most topics). Oneexample that stands out, however, is the report-ing by all 4 broadsheets of the Copenhagen Sum-mit in 2009 (see Table 1). The clusters all con-tain the keywords “copenhagen” and “agreement”,which refer to the Copenhagen Summit explicitly.This feature identified the main topics that alsocan be seen as the sentiment targets. We utilisedthis feature to compare the different attitudes to-ward the same issue (Copenhagen Summit) be-tween four news sources. However, the keywordsare mostly different between the sources in otheryears. For instance, some topics in The Guardianand The Times have large numbers of keywordssuch as “gas” and “energy” in 2012, but topics inthe The Telegraph in that year are associated withthe keyword “wind”, while The Independent haskeywords like “government” and “investment”.
In Figure 2, we show how sentiment differs be-tween the reports about the Copenhagen Summitin 2009 in the 4 newspapers. Table 4 gives alsosome examples of positive and negative sentencesfound. A manual check of a random selection ofthe relevant articles confirms the general tendency.Most of the articles used some negative words,such as “failures”, “collapse”, “drastic”. However,Figure 2 indicates that the overall sentiment is rel-atively impartial to positive (the average sentimentscore across all sources is +0.15). The Guardian isthe most positive, while The Times is the most neg-ative. We suspect that some of the keywords maybe a bit misleading (e.g agreement is typically pos-itive), which might influence the sentiment analy-
sis.However, there are some clear indications that
match the automatic analysis results. While TheGuardian does have some quite negative reportsabout the summit, mentioning things like “catas-trophic warming”, it also tries to focus on the hopeaspect (“The talks live. There is climate hope.A bit. Just.”). The Independent tends also to-wards the positive, talking about leaders achieving”greater and warmer agreement”. The Telegraph,on the other hand, plays more on the fear andalarmist aspect, talking about ”drastic action” and”imminent dangerous climate change”, althoughalso about positive steps towards the future. TheTimes, on the other hand, emphasises the roleof honesty; although its overall tone is not over-whelmingly negative, it does mention repeatedlythe fear and alarmist aspect of climate change andsome of the negative points about the summit (forexample that Obama will not be there).
Figure 2: Attitudes of four news sources to theCopenhagen Summit in 2009
In future work, we plan a number of improve-ments. SentiWordNet is not ideal because it doesnot cover all the terminology in the specific do-main of climate change, nor does it deal with con-text (see (Maynard and Bontcheva, 2016) for a dis-cussion on these points). We will therefore de-velop a semi-supervised learning approach, basedon a small corpus of manually annotated newsarticles that we will create, combining lexicon-based and corpus-based methods with co-training,
28
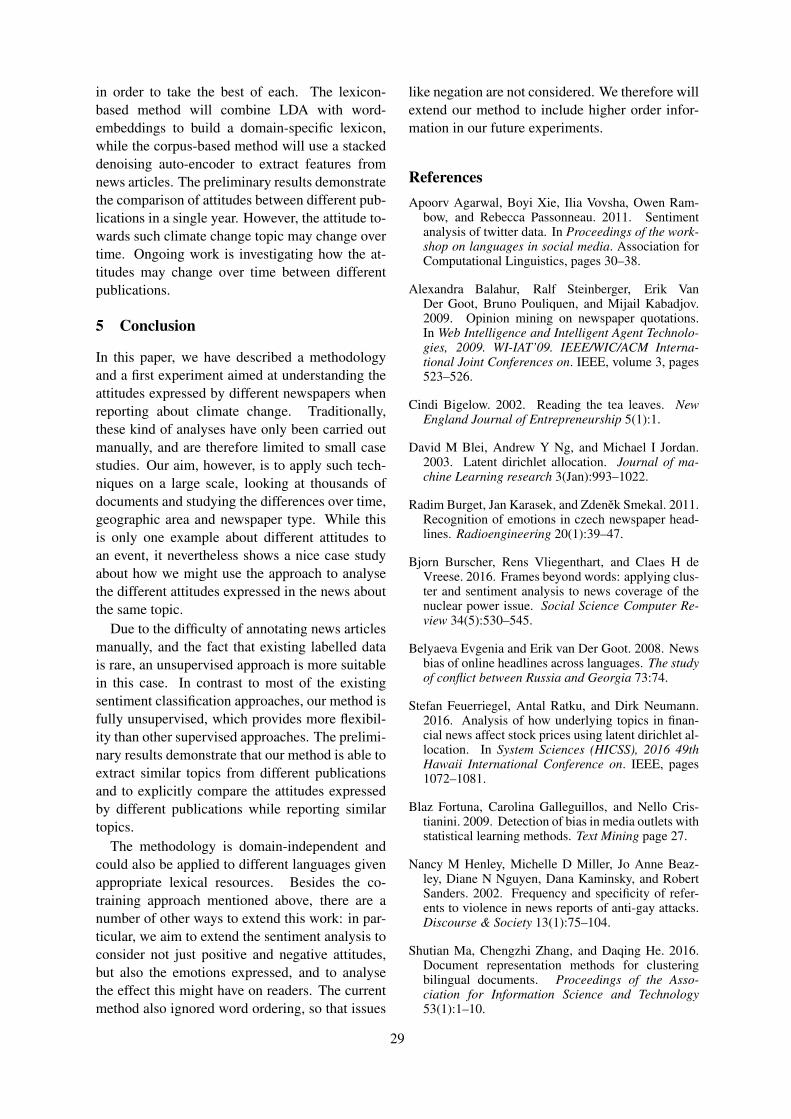
in order to take the best of each. The lexicon-based method will combine LDA with word-embeddings to build a domain-specific lexicon,while the corpus-based method will use a stackeddenoising auto-encoder to extract features fromnews articles. The preliminary results demonstratethe comparison of attitudes between different pub-lications in a single year. However, the attitude to-wards such climate change topic may change overtime. Ongoing work is investigating how the at-titudes may change over time between differentpublications.
5 Conclusion
In this paper, we have described a methodologyand a first experiment aimed at understanding theattitudes expressed by different newspapers whenreporting about climate change. Traditionally,these kind of analyses have only been carried outmanually, and are therefore limited to small casestudies. Our aim, however, is to apply such tech-niques on a large scale, looking at thousands ofdocuments and studying the differences over time,geographic area and newspaper type. While thisis only one example about different attitudes toan event, it nevertheless shows a nice case studyabout how we might use the approach to analysethe different attitudes expressed in the news aboutthe same topic.
Due to the difficulty of annotating news articlesmanually, and the fact that existing labelled datais rare, an unsupervised approach is more suitablein this case. In contrast to most of the existingsentiment classification approaches, our method isfully unsupervised, which provides more flexibil-ity than other supervised approaches. The prelimi-nary results demonstrate that our method is able toextract similar topics from different publicationsand to explicitly compare the attitudes expressedby different publications while reporting similartopics.
The methodology is domain-independent andcould also be applied to different languages givenappropriate lexical resources. Besides the co-training approach mentioned above, there are anumber of other ways to extend this work: in par-ticular, we aim to extend the sentiment analysis toconsider not just positive and negative attitudes,but also the emotions expressed, and to analysethe effect this might have on readers. The currentmethod also ignored word ordering, so that issues
like negation are not considered. We therefore willextend our method to include higher order infor-mation in our future experiments.
ReferencesApoorv Agarwal, Boyi Xie, Ilia Vovsha, Owen Ram-
bow, and Rebecca Passonneau. 2011. Sentimentanalysis of twitter data. In Proceedings of the work-shop on languages in social media. Association forComputational Linguistics, pages 30–38.
Alexandra Balahur, Ralf Steinberger, Erik VanDer Goot, Bruno Pouliquen, and Mijail Kabadjov.2009. Opinion mining on newspaper quotations.In Web Intelligence and Intelligent Agent Technolo-gies, 2009. WI-IAT’09. IEEE/WIC/ACM Interna-tional Joint Conferences on. IEEE, volume 3, pages523–526.
Cindi Bigelow. 2002. Reading the tea leaves. NewEngland Journal of Entrepreneurship 5(1):1.
David M Blei, Andrew Y Ng, and Michael I Jordan.2003. Latent dirichlet allocation. Journal of ma-chine Learning research 3(Jan):993–1022.
Radim Burget, Jan Karasek, and Zdenek Smekal. 2011.Recognition of emotions in czech newspaper head-lines. Radioengineering 20(1):39–47.
Bjorn Burscher, Rens Vliegenthart, and Claes H deVreese. 2016. Frames beyond words: applying clus-ter and sentiment analysis to news coverage of thenuclear power issue. Social Science Computer Re-view 34(5):530–545.
Belyaeva Evgenia and Erik van Der Goot. 2008. Newsbias of online headlines across languages. The studyof conflict between Russia and Georgia 73:74.
Stefan Feuerriegel, Antal Ratku, and Dirk Neumann.2016. Analysis of how underlying topics in finan-cial news affect stock prices using latent dirichlet al-location. In System Sciences (HICSS), 2016 49thHawaii International Conference on. IEEE, pages1072–1081.
Blaz Fortuna, Carolina Galleguillos, and Nello Cris-tianini. 2009. Detection of bias in media outlets withstatistical learning methods. Text Mining page 27.
Nancy M Henley, Michelle D Miller, Jo Anne Beaz-ley, Diane N Nguyen, Dana Kaminsky, and RobertSanders. 2002. Frequency and specificity of refer-ents to violence in news reports of anti-gay attacks.Discourse & Society 13(1):75–104.
Shutian Ma, Chengzhi Zhang, and Daqing He. 2016.Document representation methods for clusteringbilingual documents. Proceedings of the Asso-ciation for Information Science and Technology53(1):1–10.
29

Diana Maynard and K. Bontcheva. 2016. Challengesof Evaluating Sentiment Analysis Tools on SocialMedia. In Proceedings of LREC 2016. Portoroz,Slovenia.
Alexander Pak and Patrick Paroubek. 2010. Twitter asa corpus for sentiment analysis and opinion mining.In LREc. volume 10.
Bo Pang, Lillian Lee, et al. 2008. Opinion mining andsentiment analysis. Foundations and Trends R⃝ in In-formation Retrieval 2(1–2):1–135.
Annibale Panichella, Bogdan Dit, Rocco Oliveto, Mas-similiano Di Penta, Denys Poshyvanyk, and AndreaDe Lucia. 2013. How to effectively use topic modelsfor software engineering tasks? an approach basedon genetic algorithms. In Proceedings of the 2013International Conference on Software Engineering.IEEE Press, pages 522–531.
Nilesh Shelke, Shriniwas Deshpande, and VilasThakare. 2017. Domain independent approach foraspect oriented sentiment analysis for product re-views. In Proceedings of the 5th International Con-ference on Frontiers in Intelligent Computing: The-ory and Applications. Springer, pages 651–659.
Alexa Spence and Nick Pidgeon. 2010. Framing andcommunicating climate change: The effects of dis-tance and outcome frame manipulations. Global En-vironmental Change 20(4):656–667.
Carlo Strapparava and Rada Mihalcea. 2007. Semeval-2007 task 14: Affective text. In Proceedings ofthe 4th International Workshop on Semantic Eval-uations. Association for Computational Linguistics,pages 70–74.
Janyce Wiebe, Theresa Wilson, Rebecca Bruce,Matthew Bell, and Melanie Martin. 2004. Learn-ing subjective language. Computational linguistics30(3):277–308.
Theresa Wilson, Janyce Wiebe, and Paul Hoffmann.2005. Recognizing contextual polarity in phrase-level sentiment analysis. In Proceedings of the con-ference on human language technology and empiri-cal methods in natural language processing. Associ-ation for Computational Linguistics, pages 347–354.
Zheng Xu and Louiqa Raschid. 2016. Probabilistic fi-nancial community models with latent dirichlet allo-cation for financial supply chains. In Proceedings ofthe Second International Workshop on Data Sciencefor Macro-Modeling. ACM, page 8.
Jeonghee Yi, Tetsuya Nasukawa, Razvan Bunescu, andWayne Niblack. 2003. Sentiment analyzer: Extract-ing sentiments about a given topic using natural lan-guage processing techniques. In Data Mining, 2003.ICDM 2003. Third IEEE International Conferenceon. IEEE, pages 427–434.
30
Proceedings of the 2017 EMNLP Workshop on Natural Language Processing meets Journalism, pages 31–36Copenhagen, Denmark, September 7, 2017. c©2017 Association for Computational Linguistics
Language-based Construction of Explorable News Graphs for JournalistsRemi Bois and Guillaume Gravier
CNRS, IRISA & INRIA Rennes263 Avenue General Leclerc
35042 Rennes, France
Eric Jamet and Maxime RobertCRPCC, Universite de Rennes 2Place du recteur Henri Le Moal
35043 Rennes, France
Emmanuel MorinLS2N, Universite de Nantes2 Chemin de la Houssiniere
44300 Nantes, France
Pascale SebillotINSA Rennes, IRISA & INRIA Rennes
263 Avenue General Leclerc35042 Rennes, France
Abstract
Faced with ever-growing news archives,media professionals are in need of ad-vanced tools to explore the informationsurrounding specific events. This problemis most commonly answered by browsingnews datasets, going from article to articleand viewing unaltered original content. Inthis article, we introduce an efficient wayto generate links between news items, al-lowing such browsing through an easilyexplorable graph, and enrich this graph byautomatically typing links in order to in-form the user on the nature of the rela-tion between two news pieces. User eval-uations are conducted on real world datawith journalists in order to assess for theinterest of both the graph representationand link typing in a press reviewing task,showing the system to be of significanthelp for their work.
1 Introduction
With content being massively made accessiblegrows the need for analytics and efficient orga-nization of news collections so as to help userssearch and explore large amounts of content togain knowledge and insight. Entity extraction andlinking, along with topic and event detection, arenow widely available to journalists in order to de-scribe content and help search pieces of informa-tion. While these techniques are instrumental tocontent description and search, they are not suf-ficient to user-friendly exploration and navigationof a collection to gain insight, e.g., to summarizeor to synthesize information. In the absence ofa precise search intent, exploration is much moreadapted than search.
News data have been extensively studied due
to the relatively large accessibility and interestto both media professionals and general public,however mostly from the search angle. Typi-cal search-based approaches consist in organizingdatasets around clusters, in which similar or top-ically close news articles are grouped. The cre-ated clusters can be further processed to be dis-played as threads (Ide et al., 2004), or accordingto temporal relations (Muller and Tannier, 2004).However, pitfalls appear when dealing with largetimeframes, as the number of clusters to displaybecomes overwhelming. In this work, we ratherfocus on an exploration scenario without preciseinformation need, where one has to get a com-prehensive view on a topic in a limited amount oftime, and for which the methods mentioned aboveare not suited. For this scenario, the usual ap-proach consists in creating links between pairs ofdocuments within the collection, allowing users todirectly go from one news piece to another. Byfollowing links, the user is able to navigate thecollection, choosing his next step among a limitedset of links that are related to the news item he iscurrently viewing. Structures created by connect-ing pairs of news pieces can be seen as graphs, inwhich nodes correspond to documents, and edgesare links between document pairs. Such collectionstructuring can lead to interesting applications,such as the ability to find a path connecting twoarbitrary nodes, connecting the dots between twoinformation pieces (Shahaf and Guestrin, 2010).In this context, we put forward the notion of ex-plorable graphs linking news pieces in such a waythat media professionals can easily find all rele-vant information on a topic by browsing the graph.Departing from standard approaches, e.g., E-NNgraphs, we propose a novel nearest neighbor graphconstruction algorithm based on lexical similar-ity that creates links in a reasonable number toavoid user overload and disorientation, yet ensur-
31

ing relevance and serendipitous drift. We furtherpropose a typology of links between news piecesalong with rules for automatic link categorization.These two elements, graph construction and linkcategorization, result in an explorable organizationof large collections of news. We prove the interestof this organization to media professionals, and inparticular that of link categorization, by means ofuser tests, where journalists were asked to write asynthesis on a particular topic in a limited amountof time.
2 Explorable news graph
Related studies on music recommendation haveproven that explorability, or browsing capabilities,have a big impact on user experience (Seyerlehneret al., 2009) but, to the best of our knowledge, noattempts have been made at formalizing a list ofnecessary properties for explorable recommenda-tions. We thus propose a set of intuitive proper-ties that a graph should exhibit to be explorable:Property 1: A link between two nodes indicatesthat those nodes are related in some way. The usershould not be faced with senseless links that wouldlead to disorientation;Property 2: There exists a path between any twogiven nodes. This ensures that the user can driftaway from his original topic of interest and dis-cover new information;Property 3: The shortest path between any twogiven nodes should be reasonably small. The usercan go from one topic to another in a relativelysmall number of steps;Property 4: There is a reasonable amount of out-going links for any given node. This ensures thatthe user is not overloaded by the number of pro-posed links;Property 5: The amount of incoming links is pro-portional to the popularity of the node. The usershould easily get access to the main topics of thecollection.
The two main approaches to create graphs arethe E nearest neighbors (E-NN) and the K nearestneighbors (K-NN). They consist in linking eachnode to its closest neighbors–closeness being cal-culated by means of similarity measures–and relyon a fixed threshold that is either a number ofneighbors K for K-NN or a similarity score E forE-NN. In practice, finding their respective optimalthresholds, K or E , is difficult and requires someannotation to estimate the ratio of irrelevant links,
Figure 1: Illustration of similarity drops betweenclose neighbors and far ones on two real-world ex-amples.
a process that is often complex and subjective (Geet al., 2010). Moreover, graphs created with thosemethods exhibit some strong limitations in termsof explorability. K-NN graphs do not discrimi-nate between news that are heavily discussed, andthat could thus rightfully be linked to many othernews pieces, and news that are reported by only afew medias, with few connections to other items.Using the same threshold K for the whole collec-tion thus leads to links that are too few for somenews items, and too numerous for others. The useof a distance threshold in E-NN graphs skirts thisissue by reducing the number of unrelevant links.However, E-NN graphs tend to create very largehubs (Radovanovic et al., 2010) , with a few nodesbeing connected to hundreds of others, causingnavigation in such structures to be cumbersome.
Since the existence of a unique threshold for theentire collection leads to poorly crafted graphs,we propose a new method allowing to adapt thethreshold on a per node basis, automatically decid-ing on the appropriate number of near neighborsby detecting a large gap in the representation spacebetween close neighbors and far ones. Such gapsare known to happen naturally in large collectionssuch as social graphs (Danisch et al., 2013) and arelinked to the variations of the density of points inthe representation space (Kriegel et al., 2011). Foran item i corresponding to node vi, the gap corre-sponds to a drop in the similarity between item iand other items sorted in descending order of sim-ilarity. Only items appearing before the gap arelinked to item i. In our experiments, standard NLPapproaches are used for lexical similarity scoringand drop detection. First, a tf-idf weighting and acosine similarity measure allow us to obtain effi-cient similarity scores for document pairs. Then,after sorting in descending order all documents ac-cording to their similarity with a node/documentof interest, we detect the largest drop in similar-
32

Figure 2: The LIMAH news exploration and analytics interface
ity among consecutive documents. The shallowlexical representation described above allows usto detect such drops, as illustrated in Figure 1,which do not appear when using semantic vecto-rial representations such as averaged word2vec ordoc2vec (Mikolov et al., 2013).
Even with explorable graphs, the connection ex-isting between two nodes can sometimes be puz-zling to the user. We thus propose to character-ize links between nodes according to a typologyspecifically crafted for news collections. Newsdata depend a lot on chronology, which resulted inmany approaches organizing collections as time-lines so as to be able to follow the evolution ofspecific stories. The temporal relation is clearlythe most important type of relations according tomedia professionals (Gravier et al., 2016). Butit is insufficient alone, in particular when explor-ing large news datasets that include articles withvery similar content from different newswires thattends to clutter timelines. Extending temporal re-lations, we used a typology consisting of 7 typesof oriented links (Bois et al., 2015) defined as fol-lows:Near duplicate identifies a link between twonodes discussing the same event, where the targetnode provides little to no additional informationcompared to the source node;Anterior/Posterior indicates a target node report-ing on an event related to the source that occurredbefore (resp. after) the event of the source node;Summary/Development corresponds to a linkproviding a subset (resp. superset) of information
with respect to the source;Reacts/In reaction to designates a reference(resp. followup) to another news piece in the col-lection.
In order to automatically categorize each linkaccording to the above typology, we apply a setof handcrafted rules. Near duplicates are de-tected first based on a cosine similarity over tf-idfweighted terms. Summaries and developments arethen detected by comparing documents’ lengths.We then assign the reaction type by detecting cuephrases such as ”reacted to”, ”answered to”, or”declared that”. Remaining links are considered astemporal relations and given the anterior/posteriortype depending on publication dates.
3 Explorability evaluation and uservalidation
In order to assess for the explorability of graphscreated with our novel method, we performed ex-periments on dataset (Gasparetti, 2016) composedof a five month monitoring of Google News over4 categories (health, science, business, and enter-tainment), each of them containing around 15,000articles. While this dataset provides a groundtruthbased on clusters rather than pairing of documents,it can be used as a estimation of the correctnessof our approach: elements that we link and be-long to the same cluster can be considered as cor-rect, and elements that we link but do not be-long to the same cluster can be considered as in-correct. Since a perfect precision in these condi-tions would lead to a poorly explorable graph only
33
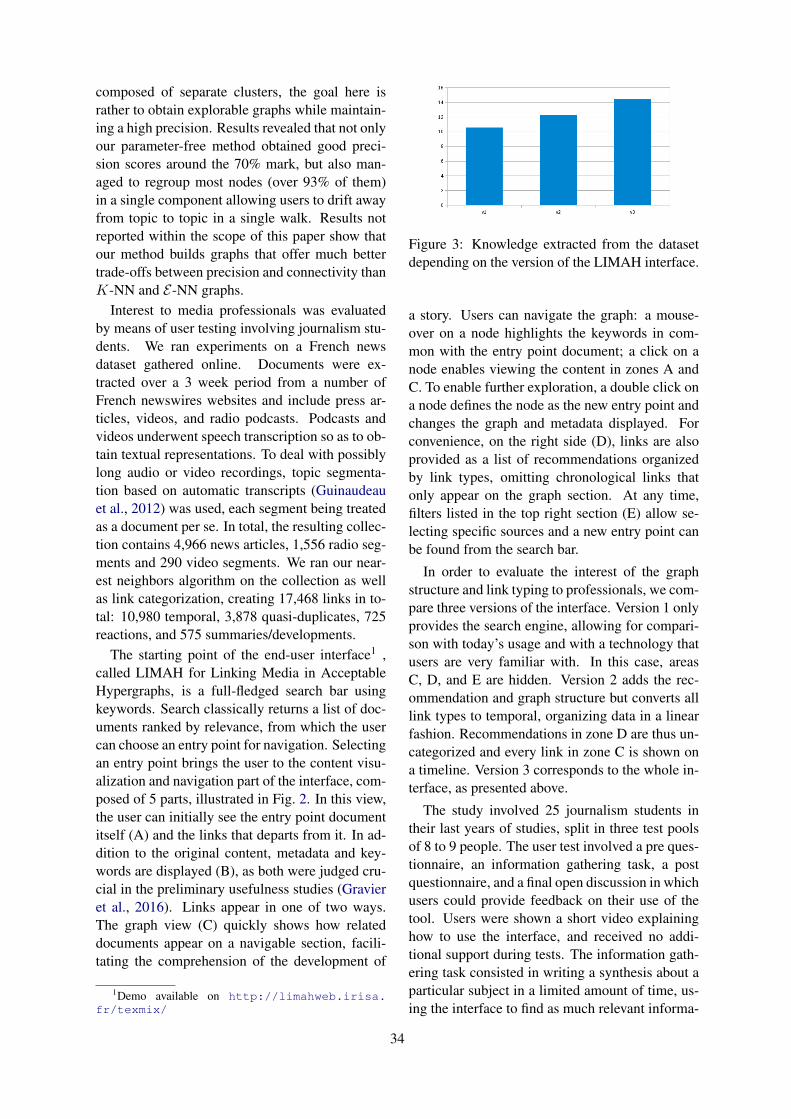
composed of separate clusters, the goal here israther to obtain explorable graphs while maintain-ing a high precision. Results revealed that not onlyour parameter-free method obtained good preci-sion scores around the 70% mark, but also man-aged to regroup most nodes (over 93% of them)in a single component allowing users to drift awayfrom topic to topic in a single walk. Results notreported within the scope of this paper show thatour method builds graphs that offer much bettertrade-offs between precision and connectivity thanK-NN and E-NN graphs.
Interest to media professionals was evaluatedby means of user testing involving journalism stu-dents. We ran experiments on a French newsdataset gathered online. Documents were ex-tracted over a 3 week period from a number ofFrench newswires websites and include press ar-ticles, videos, and radio podcasts. Podcasts andvideos underwent speech transcription so as to ob-tain textual representations. To deal with possiblylong audio or video recordings, topic segmenta-tion based on automatic transcripts (Guinaudeauet al., 2012) was used, each segment being treatedas a document per se. In total, the resulting collec-tion contains 4,966 news articles, 1,556 radio seg-ments and 290 video segments. We ran our near-est neighbors algorithm on the collection as wellas link categorization, creating 17,468 links in to-tal: 10,980 temporal, 3,878 quasi-duplicates, 725reactions, and 575 summaries/developments.
The starting point of the end-user interface1 ,called LIMAH for Linking Media in AcceptableHypergraphs, is a full-fledged search bar usingkeywords. Search classically returns a list of doc-uments ranked by relevance, from which the usercan choose an entry point for navigation. Selectingan entry point brings the user to the content visu-alization and navigation part of the interface, com-posed of 5 parts, illustrated in Fig. 2. In this view,the user can initially see the entry point documentitself (A) and the links that departs from it. In ad-dition to the original content, metadata and key-words are displayed (B), as both were judged cru-cial in the preliminary usefulness studies (Gravieret al., 2016). Links appear in one of two ways.The graph view (C) quickly shows how relateddocuments appear on a navigable section, facili-tating the comprehension of the development of
1Demo available on http://limahweb.irisa.fr/texmix/
Figure 3: Knowledge extracted from the datasetdepending on the version of the LIMAH interface.
a story. Users can navigate the graph: a mouse-over on a node highlights the keywords in com-mon with the entry point document; a click on anode enables viewing the content in zones A andC. To enable further exploration, a double click ona node defines the node as the new entry point andchanges the graph and metadata displayed. Forconvenience, on the right side (D), links are alsoprovided as a list of recommendations organizedby link types, omitting chronological links thatonly appear on the graph section. At any time,filters listed in the top right section (E) allow se-lecting specific sources and a new entry point canbe found from the search bar.
In order to evaluate the interest of the graphstructure and link typing to professionals, we com-pare three versions of the interface. Version 1 onlyprovides the search engine, allowing for compari-son with today’s usage and with a technology thatusers are very familiar with. In this case, areasC, D, and E are hidden. Version 2 adds the rec-ommendation and graph structure but converts alllink types to temporal, organizing data in a linearfashion. Recommendations in zone D are thus un-categorized and every link in zone C is shown ona timeline. Version 3 corresponds to the whole in-terface, as presented above.
The study involved 25 journalism students intheir last years of studies, split in three test poolsof 8 to 9 people. The user test involved a pre ques-tionnaire, an information gathering task, a postquestionnaire, and a final open discussion in whichusers could provide feedback on their use of thetool. Users were shown a short video explaininghow to use the interface, and received no addi-tional support during tests. The information gath-ering task consisted in writing a synthesis about aparticular subject in a limited amount of time, us-ing the interface to find as much relevant informa-
34

tion on the topic as possible. The chosen topic wasSolar Impulse 2, a solar-powered aircraft that cir-cumnavigated the globe from March 2015 to July2016. Bad weather conditions necessitating theplane to land and consequences of this unexpectedhalt are reported in 17 articles in the dataset, rep-resenting a total of 68 distinct information piecesover a long timespan. As the dataset comes froma large set of newswires, some pieces of informa-tion are repeated, while others are mentioned byonly one or two sources. Users had to completethis task in 20 minutes, a time long enough to fullyread a few articles, but short enough to forbid read-ing totally most of them.
A preliminary manual annotation was per-formed on each document related to the Solar Im-pulse topic in order to list all individual facts andthe documents in which they appeared. This an-notation was used to assess for the exhaustivenessof the syntheses created by users. Exhaustivenesswas measured by coding each synthesis accordingto the proportion of the 68 information pieces itcontains. Figure 3 shows the average number ofinformation pieces gathered by users for each ver-sion of the system under test. On average, versions2 and 3 allowed to retrieve more information moreefficiently. Results show that 10.57 (resp. 12.10and 14.44) pieces of information were found forversion 1 (resp. version 2 and version 3). More-over, version 3 allowed to retrieve rarer pieces ofinformation that appear in only a few documentsin the collection. Surprisingly enough, the supe-riority of version 3 is not due to a higher amountof documents viewed by users. Rather, as shownin Figure 4, users of version 3 saw on average lessdocuments than users of version 2, indicating thatthe better explorability lead to a better choice ofwhich articles to read rather than an ability to readmore of them.
During the open discussion following the tests,users from version 3 were mostly positive abouttheir experience with the tool, calling it ”useful”,with a ”good accessibility”, and an ”interestingtake on recommendation”. A few users mentioneda difficulty to handle the back and forth betweenthe graph representation and the search interface.
4 Conclusion
Appropriate graph representations of news articlescan help professionals gather information moreefficiently, as evidenced by the study presented
Figure 4: Number and origin of the articles viewedfor the 3 versions of the LIMAH interface.
in this paper. In particular, we experimentallydemonstrated that categorizing automatically hy-perlinks established between articles further im-proves the amount and quality of the informationretrieved while exploring to gain insight on a par-ticular topic. We also proposed a parameter-freenearest neighbors algorithm that was shown to of-fer a better trade-off between relevance of the linksand their number than standard nearest neighborsgraph construction algorithms. Overall, organiz-ing news collections in this way was proved to behelpful to journalists for their everyday work.
5 Acknowledgments
This work was funded by the CominLabs excel-lence laboratory, and financed by the National Re-search Agency under reference ANR-10-LABX-07-01. We are immensely grateful to ArnaudTouboulic for his key contribution in the designand implementation of the LIMAH interface.
ReferencesRemi Bois, Guillaume Gravier, Pascale Sebillot, and
Emmanuel Morin. 2015. Vers une typologie de liensentre contenus journalistiques. In 22e ConferenceTraitement Automatique des Langues Naturelles.pages 515–521.
Maximilien Danisch, Jean-Loup Guillaume, andBenedicte Le Grand. 2013. Towards multi-ego-centred communities: A node similarity approach.International Journal of Web Based Communities9(3):299–322.
Fabio Gasparetti. 2016. Modeling user interests fromweb browsing activities. Data Mining and Knowl-edge Discovery pages 1–46.
Mouzhi Ge, Carla Delgado-Battenfeld, and DietmarJannach. 2010. Beyond accuracy: evaluating recom-mender systems by coverage and serendipity. In 4th
35
Conference on Recommender Systems. pages 257–260.
Guillaume Gravier, Martin Ragot, Laurent Amsaleg,Remi Bois, Gregoire Jadi, Eric Jamet, Laura Mon-ceaux, and Pascale Sebillot. 2016. Shaping-up mul-timedia analytics: Needs and expectations of mediaprofessionals. In 22nd MMM Conference, Perspec-tives on Multimedia Analytics. pages 303–314.
Camille Guinaudeau, Guillaume Gravier, and PascaleSebillot. 2012. Enhancing lexical cohesion measurewith confidence measures, semantic relations andlanguage model interpolation for multimedia spokencontent topic segmentation. Computer Speech andLanguage 26(2):90–104.
Ichiro Ide, Hiroshi Mo, Norio Katayama, and ShinichiSatoh. 2004. Topic threading for structuring a large-scale news video archive. In International Confer-ence on Image and Video Retrieval. pages 123–131.
Hans-Peter Kriegel, Peer Kroger, Jorg Sander, andArthur Zimek. 2011. Density-based clustering. Wi-ley Interdisciplinary Reviews: Data Mining andKnowledge Discovery 1(3):231–240.
Tomas Mikolov, Ilya Sutskever, Kai Chen, Greg S. Cor-rado, and Jeff Dean. 2013. Distributed representa-tions of words and phrases and their compositional-ity. In Advances in Neural Information ProcessingSystems. pages 3111–3119.
Philippe Muller and Xavier Tannier. 2004. Anno-tating and measuring temporal relations in texts.In 20th International Conference on ComputationalLinguistics. pages 50–56.
Milos Radovanovic, Alexandros Nanopoulos, and Mir-jana Ivanovic. 2010. Hubs in space: Popular nearestneighbors in high-dimensional data. Journal of Ma-chine Learning Research 11(Sep):2487–2531.
Klaus Seyerlehner, Peter Knees, Dominik Schnitzer,and Gerhard Widmer. 2009. Browsing music recom-mendation networks. In 10th International Societyfor Music Information Retrieval Conference. pages129–134.
Dafna Shahaf and Carlos Guestrin. 2010. Connect-ing the dots between news articles. In 16th ACMSIGKDD International Conference on KnowledgeDiscovery and Data Mining. pages 623–632.
36

Proceedings of the 2017 EMNLP Workshop on Natural Language Processing meets Journalism, pages 37–45Copenhagen, Denmark, September 7, 2017. c©2017 Association for Computational Linguistics
Storyteller: Visual Analytics of Perspectives on Rich Text InterpretationsMaarten van Meersbergen
Janneke van der ZwaanWillem van Hage
Netherlands eScience CenterScience Park 140
Amsterdam, The NetherlandsEmail: [email protected]
[email protected]@esciencecenter.nl
Piek VossenAntske FokkensInger Leemans
Isa MaksVU University Amsterdam
De Boelelaan 1081Amsterdam, The Netherlands
Email: [email protected]@[email protected]
Abstract
Complexity of event data in texts makesit difficult to assess its content, espe-cially when considering larger collectionsin which different sources report on thesame or similar situations. We presenta system that makes it possible to visu-ally analyze complex event and emotiondata extracted from texts. We show thatwe can abstract from different data mod-els for events and emotions to a single datamodel that can show the complex relationsin four dimensions. The visualization hasbeen applied to analyze 1) dynamic devel-opments in how people both conceive andexpress emotions in theater plays and 2)how stories are told from the perspectiveof their sources based on rich event dataextracted from news or biographies.
1 Introduction
People frequently write about the changes in theworld and about the emotions that these eventsarouse. Events and emotions typically have com-plex structures and are difficult to detect and repre-sent. According to our estimation, standard newsarticles contain about 200 event mentions on av-erage (Vossen et al., 2016). These events standin complex temporal and causal relations to eachother, while the text can also present different per-spectives on their impact. Especially when consid-ering event data from many different sources thatmay report on the same events, the extracted dataquickly becomes very complex.
Most systems that handle large collections oftext use some kind of topic clustering. Docu-ments are grouped together on the basis of a sim-ilarity measure and clustering technique. In the
case of streaming text, such as news and tweets,topic modeling and clustering is also done dy-namically over time, indicating when a cluster ap-pears and dies out. Dynamic clustering can beseen as a rough approximation of the temporalbounding of a real world event. Although topicmodeling works well as an indicator of trendingreal world events, it does not tell the story in de-tail as a sequence of events with participants andcausal/temporal relations across these events.
In this paper we present Storyteller, a visualanalytics tool for complex multidimensional tex-tual data. Storyteller groups events with multi-ple participants into storylines. As such, it cangive insight into complex relations by providingmultiple perspectives on time-based textual data.We explain the capabilities of Storyteller by ap-plying it to semantically linked news data fromthe NewsReader project,1 using different perspec-tives on the data to visualize complex relations be-tween the events found by its Natural LanguageProcessing (NLP) pipeline. These visualizationsgive more insight into the performance of the sys-tem and how well complex event relations approx-imate the storylines people construct when readingnews. We further show the usability of the Sto-ryteller visualization for general purpose event-based textual data by applying it to other use cases,namely the Embodied Emotions and BiographyNetprojects provided by other humanities experts.
The paper is structured as follows. In Section3, we present the semantic model for events usedin NewsReader. Section 4 explains the Storytellervisualization tool that loads the NewsReader dataand provides different views and interactions. Weshow the capacity of data generalization by thetool by applying it to other projects with biograph-
1http://www.newsreader-project.eu/
37

ical data and emotions in Dutch 17th century the-ater plays in Section 5. Section 2 explains howour work differs from others. Section 6 concludeswith future plans.
2 Related work
Interactive graphics have been used for before toanalyze high dimensional data (Buja et al., 1996;Martin and Ward, 1995; Buja et al., 1991), butfast, web-based and highly interactive visualiza-tions with filtering are a fairly new development.With the advent of the open source libraries D3.js(Bostock et al., 2011), Crossfilter.js (Square, 2012)and DC.js (dcj, 2016), we now have the tools torapidly develop custom visual applications for theweb.
The egoSlider (Wu et al., 2016) uses a simi-lar visualization to our co-participation graph forEgocentric networks. Our visualization can how-ever display co-participation of all participantsrather than just for one. The interactive filtering,our other views on the multidimensional data, andthe immediate link to the original data are also notpresent in egoSlider.
The TIARA system (Liu et al., 2012) visualizesnews stories as theme rivers. It also has a networkvisualization of actor-actor relations. This can beused when the corpus consists of e-mails, to showwho writes about what to whom. In StoryTeller,the relations are not based on metadata but are re-lations in the domain of discourse extracted fromtext.
3 Multi-dimensional event data from text
The NewsReader system automatically processesnews and extracts what happened, who is involved,and when and where it happened. It uses a cascadeof NLP modules including named entity recogni-tion and linking, semantic role labeling, time ex-pression detection and normalization and nomi-nal and event coreference. Processing a singlenews article results in the semantic interpretationof mentions of events, participants and their timeanchoring in a sequence of text.
In a second step, the mention interpretationsare converted to an instance representation ac-cording to the Simple Event Model (Van Hageet al., 2011) or SEM. SEM is an RDF represen-tation that abstracts from the specific mentionswithin a single or across multiple news articles.It defines individual components of events such
as the action, the participants with their roles andthe time-anchoring. A central notion in News-Reader is the event-centric representation, whereevents are represented as instances and all infor-mation on these events is aggregated from all thementions in different sources. For this purpose,NewsReader introduced the Grounded AnnotationFramework (GAF, (Fokkens et al., 2013)) as an ex-tension to SEM through gaf:denotedBy relationsbetween instance representations in SEM and theirmentions represented as offsets to different placesin the texts. Likewise, information that is the sameacross mentions in different news articles gets de-duplicated and information that is different getsaggregated. For each piece of information, thesystem stores the source and the perspective of thesource on the information. The result is a com-plex multidimensional data set in which events andtheir relations are defined according to multipleproperties (Vossen et al., 2015). The Storytellerapplication exploits these dimensions to presentevents within a context that explains them, approx-imating a story.
The following dimensions from the News-Reader data are used for the visualization. Eventrefers to the SEM-RDF ID: the instance identi-fier. The actors in the news article, which are de-scribed using role labels that come from differentevent ontologies, such as PropBank (Kingsburyand Palmer, 2002), FrameNet (Baker et al., 1998),and ESO (Segers et al., 2015). A climax scoreindicating the relevance of the event (normalizedbetween 0 and 100) for a story. The climax scoreis a normalized score based on the number of men-tions of an event and the prominence of each men-tion, where early mentions count as more promi-nent. A group label that uniquely identifies theevent-group to which the event belongs. In News-Reader, groups are formed by connecting eventsby topic overlap of the articles in which they arementioned and by sharing the same actors. Eachgroup also has a groupScore which indicates therelevance of the group or storyline for the wholecollection. For NewsReader, this is the highestclimax score within the group of events normal-ized across all the different groups extracted froma data set. The group’s groupName consists of themost dominant topic within the group in compari-son with all other groups based on IDF*TF. Eventgroups are the basis for event-centric story visual-izations.
38

The labels represent all the different wordingsused to mention the event. The prefLabel is themost-frequent label for the event. Time refers tothe date to which the event is anchored. Mentionsis a list of mentions of the event in source texts.A mention consists of a snippet, the offsets of thelabel in that snippet (snippet char), the URI ofthe source text, and char, the character offsets forthe raw text inside the source. Next we show anabbreviated example of a NewsReader event in theJSON format used in Storyteller:
{ "timeline":"events": [{"actors": {"actor:": [
"dbp:European_Union","dbp:United_Kingdom","dbp:The_Times","dbp:Government_of_the_United_Kingdom"
]},"prefLabel": ["stop"],"time": "20140622","climax": 89,"event": "ev194","groupName": "[Community sanction]","groupScore": "099","labels": ["stop","difficulty","pressure"
],"mentions": [{"char": [ "5665", "5673" ],"perspective": [{
"source": "author:FT_reporters"}],"snippet": [" Sunday Times, said
they were extremely concernedabout the UK’s difficulties instopping the EU from introducingmeasures that continue toerode Britain’s competitiveness"],
"snippet_char": [ 81, 89 ],"uri": ["http://www.ft.com/thing/f2bc1380-fa32-11e3-a328-00144feab7de"]
}, {(...)
4 Storyteller
The Storyteller application consists of 3 main co-ordinated views (Wang Baldonado et al., 2000): aparticipant-centric view, an event-centric view anda data-centric view.
User interaction is a key component in the de-sign. The rich text data are too complex to visual-ize without it, as they contain numerous intercon-nected events, participants and other properties.Given that the estimated processing capacity foraccurate data of human sight is limited to around
500 kbit per second (Gregory and Zangwill, 1987),a large number of connections can make the visualexploration very difficult without filters to slice thedata into humanly manageable portions. This sec-tion presents the 3 views and describes how filter-ing can be applied.
The interactivity focuses mostly on analysisthrough filtering. The user can apply filters byclicking through various components of the charts.These filters are then dynamically applied to theother parts of the application, reducing the amountof data on the screen. This allows a user to drill-down into the data, gaining knowledge of its com-position in the process.
4.1 Participation-centric view
The participation-centric view (Figure 1), whichis our own graph design that we have dubbed aCo-Participation graph, is an interactively filter-able version of the XKCD Movie Narrative Charts(Munroe, 2009). It is placed at the top of the Sto-ryteller page and visualizes the participants of allthe events. The major participants are placed onthe Y-axis and the events they participate in areplaced (as ovals) on a timeline. Each participant’stimeline has a different color. If different partici-pants take part in the same event, the lines are benttowards and joint in this event, showing the co-participation through this intersection. Events re-ceive descriptive labels. Hovering the mouse cur-sor over an event will show further details, such asthe mentions of that specific event.
4.1.1 Axis orderingThe X-axis is a timeline stretching between thefirst of the events shown and the last. The Y-axisis slightly more complicated. The ordering of theparticipants is of great importance to the legibil-ity of the resulting chart. If this is done improp-erly, the resulting chart will be cluttered becauseof many curved lines crossing each other unneces-sarily. We solved this legibility problem by order-ing the elements in such a way that the participantlines travel straight for as long as possible. We dothis by re-ordering the elements on the Y-axis inorder of co-appearance on the timeline, from bot-tom to top. We start by determining the first andbottom-most line. For this, we select the first eventon the timeline and determine the participants ofthis event. We then loop over all events that sharethese participants in order of appearance on thetimeline. Every time a new co-participant is found
39

Figure 1: The Co-Participation graph in its unfiltered state, with a NewsReader dataset loaded
Figure 2: The Co-Participation graph in a filtered state, showing only those events where Apple Inc.co-participates
in one of these events, it is added to the list. Onceall events have been processed in this manner, thealgorithm has clustered events that share partici-pants making the resulting graph much easier toread.
4.1.2 Filtering
An alphabetic list of all of the participantspresent in the dataset is displayed left of the Co-participants graph. The length of the colored barindicates the number of events in which the partic-ipant occurs. This number is shown when hover-ing the mouse over the bar.
Clicking on one of the items in the partic-ipant list applies a filter to the dataset. TheCo-participation graph only shows the lines withevents that involve the selected participant. Thismeans that the line of the selected participantand those of participants that co-participate withthe selected participant are displayed. Selectingmore than one participant reduces the graph tothose events in which all selected participants co-participate.
4.2 Event-centric view
Figure 3 shows the event-centric view. This sec-ond view in the Storyteller demo shows time or-dered sequences of events grouped in differentrows. The grouping can be determined in differ-ent ways and according to different needs.
In NewsReader, each row in the graph approxi-mates the structure of a story, as defined in (Vossenet al., 2015): consisting of one or more climaxevents, preceded by events that build up towardsthe climax and following events that are the conse-quence of the climax defined by prominence (seesection 3). Preceding and following events are se-lected on the basis of co-participation and topic-overlap: so-called bridging relations. The size(and color) of the event bubbles represents the cli-max score of the event.
A climax event together with all bridged eventsapproximate a story, where we expect events to in-crease in bubble size when getting closer to the cli-max event (the biggest bubble in a row) and thengradually decrease after the climax event. Thesize of the events thus mimics the topical devel-opment of for example streaming news, while westill show details on the events within such a topic.The first row presents the story derived from the
40

Figure 3: The event-centric view, with data of the Embodied Emotions project (See: Use Cases).
Figure 4: The same event-centric view, with a filter applied to only show high-climax events from theyear 1740 and onwards.
Figure 5: The same event-centric view, with a filter applied to only show events with the fear emotion.
climax event with the highest score (normalized to100). The next rows show stories based on lowerscoring climax events that are not connected tothe main story. We thus apply a greedy algorithmin which the most prominent events has the firstchance to absorb other events.
Stories are labeled by the climax event’s group-Name (consisting of the topic that is dominant for
the set of events making up the story and the high-est climax score within the event). In addition tothe label, each row has a colored bar that indicatesthe cumulative value of the climax scores of all theevents within a story. Note that the story with thehighest climax event does not necessarily have thelargest cumulative score. If an event is mentioneda lot but poorly connected to other events, the cu-
41

mulative score may still be lower than that of otherstories.
The bottom graph of the second view plots in-dividual events for climax score on the Y-axis sothat events from the same story may end up in dif-ferent rows. Group membership is indicated bysymbols representing the events. This view showshow events from a story are spread over climaxscores and time.
4.2.1 Filtering
The user can select a story by clicking on the in-dex of stories to the left. Unlike the Participation-centric view, selecting more than one group orrow adds data to the representation. This is inten-tionally different from the co-participation graph,where multiple selections intersect (groups can, inthis context, by definition not intersect), becausestories are separated on the basis of lack of over-lap.
In the bottom graph of the event-centric view,the user can make selections by dragging a regionin the Y/X space with the mouse. A region thusrepresents a segment in time and a segment of cli-max scores. This enables both selecting time in-tervals (by dragging a full height box between twoparticular time frames) and selection of the most(or least) influential events, which can be used toexclude outliers in the data but also to select andinspect them.
All filters are applied globally: this means thatparticipant selection in the top view influences theevent-centric visualization and vice-versa.
4.3 Data-centric view
At the bottom of the Storyteller page, we see textsnippets from the original texts that were used toderive the event data. It lists all events visual-ized for a given set of filters. Events are presentedwith the text fragments they are mentioned in andthe event word is highlighted. The event labelsare given separately as well, where synonyms aregrouped together. Furthermore, the table showsthe scores, the date and the group name or story la-bel. No selections can be made through this view.
4.4 The full system
The seven tasks of the Visual Information Seeking Mantra
Overview Gain an overview of the entire collection.
Zoom Zoom in on items of interest.
Filter Filter out uninteresting items.
Details-on-demand Select an item or group and get detailswhen needed.
Relate View relationships among items.
History Keep a history of actions to support undo, replay,and progressive refinement.
Extract Allow extraction of sub-collections and of the queryparameters.
(Shneiderman, 1996)
We designed Storyteller following the (author-itative) Taxonomy for data visualizations (Shnei-derman, 1996), phrased as the 7 tasks of the VisualInformation Seeking Mantra:
We initiate the visualization with the Overviewtask presenting the initial (unfiltered) view. TheFilter and Zoom tasks allow the selection of sub-sets of items in multiple ways through the differ-ent views. The Details-on-demand task providesdetailed mouse-over information boxes as well asa view into the raw data that is maintained whilefiltering. The co-participation graph supports themain Relate task, the filter state displays the His-tory, and finally, the data-view allows users to Ex-tract.
Storyteller is built to be as generic, reusable andmaintainable as possible. We have used only Freeand Open Source (FOSS) software web visualiza-tion tools and libraries and made Storyteller it-self fully FOSS as well. The code is available ongithub2 and a demo is also available.3
5 Expert Panel Use Cases
The Storyteller demo has been used in two usecases other than NewsReader. We briefly describeboth use cases in this section.
5.1 Embodied EmotionsEmbodied Emotions (Zwaan et al., 2015) is a dig-ital history project that investigates the relation
2https://github.com/NLeSC/UncertaintyVisualization/
3http://nlesc.github.io/UncertaintyVisualization/
42

Figure 6: The data-centric view, showing the raw data and offsets for the text snippets, as well as the(colored) labels as found in the text. The data displayed here is from 17th century dutch theatre plays
between body parts and emotions in Dutch stageplays over time (i.e. in what body parts do peo-ple experience emotions, and through which bod-ily acts do they express emotions). In our Story-teller visualization, emotions are events and bodyparts are participants. The visualization can be ap-plied at two levels. First, the X-axis of the Co-participation graph can be used to represent theacts of a single play. Second, the X-axis can beused as a timeline where we plot which emotionsand body parts are linked to each other in playspublished in a specific year.
Intersections indicate when different body partsare associated with the same emotion. The cur-rent online demo shows the second type of visu-alization: emotion/body-part pairs occurrence peryear.4 The climax score in this visualization re-flects the prominence of the emotion (the occur-rence of the emotion related to the number of sen-tences).
5.2 BiographyNet
The BiographyNet (Ockeloen et al., 2013) usecase involves the visual exploration of biographiesof prominent people in Dutch history. The biogra-phies have been processed by a pipeline similar tothe one used for NewsReader. However, the datais radically different: biographies mainly containevents related to the subject of the biography andwe do not find many instances of cross-documentevent co-reference.
The BiographyNet demo5 therefore does not fo-cus on event instances but on event types: we
4http://nlesc.github.io/EmbodiedEmotions/
5http://nlesc.github.io/BiographyNet/
extract all events related to a person that can belinked to a specific year from the biographical textand meta data. The biography subjects are the par-ticipants in our visualization, the event types arethe events. If two people are born in the same year,study during the same year or die in the same year,etc., their lines intersect. The BiographyNet visu-alization thus allows historians to perform genera-tion analyses: what other events have people bornin a specific year have in common? The climaxscore reflects the number of participants involvedin an event. The event-centric visualization thusshows which events are prominent in a given year.
6 Conclusion
The fast and efficient web-based visualizations ofthe output of NLP pipelines allows us to visu-ally analyze complex storylines spanning years.This means that we can now analyze news articleswith much more context, be it by looking at co-participants, co-occurrence or other such criteria.This changes literature study from first having toread all the text to build an overview to first havinga rough overview that allows you to decide whichtext to read later.
Storyteller’s event-based input format makes iteasy to port to new data sources. We describedtwo other projects with different graph-like data(biographies and emotions) that can be served withthe same application thanks to this generic inputformat.
There are many directions in which this re-search could be advanced in the future. First, theinteraction model should be completed. AlthoughStoryteller allows the user to select and filter thedata in almost all graphs, other interactivity could
43
be added. For example, currently, the data table(view 3) only shows the results of filters and se-lections applied in other views. This table couldbe made interactive by adding search functional-ity. This means that the data can be filtered basedon user queries. Another possibility for improvedinteraction is to allow the user to re-order events,participants and groups according to different cri-teria (e.g., based on frequency, or alphabetically).
While we now have a visualization capable ofdisplaying a decently sized data, it cannot handlethe sheer volume of all available news data. Weare currently implementing an interface that gen-erates manageable data structures on the basis ofuser queries from a triple store that contains mas-sive event data from the processed news in RDF(i.e. possibly millions of news articles and bil-lions of triples). The user queries are translatedinto SPARQL requests and the resulting RDF isconverted to the JSON input format. This solu-tion requires that some structures, e.g. the climaxscore and the storylines, need to be computed be-forehand. The user should make a visually sup-ported selection overview, zoom and filter beforequerying the database to obtain all required dataand displaying the current views.
The NewsReader data exhibits various degreesof uncertainty and source perspectives on the eventdata (e.g. whether the source believes the event hasactually happened, or whether it is a positive ornegative speculation or expectation of the source).These are modeled through the RDF representa-tion as well but have not yet been considered in thetool. In the next version of the Storyteller applica-tion, we aim to visualize this data layer as well.
Feedback from domain experts who exploreddata from the three different use cases indicatesthat a proper understanding of the tool and thedata is required in order to get meaningful results.In addition to developing tutorials that help re-searchers to get the most out of Storyteller, we pro-pose two types of user studies. First, we need toevaluate Storyteller’s usability. Second, we needto evaluate to what extent Storyteller generates re-sults (data and views) that are useful for the differ-ent domains.
Acknowledgment
The authors would like to thank the NetherlandsOrganisation for Scientific Research (NWO) andthe Netherlands eScience Center for sponsoring
this research.
References2016. DC.js dimensional charting javascript library.
C. F. Baker, C. J. Fillmore, and J. B. Lowe. 1998. TheBerkeley FrameNet project. In Proc. of ACL, pages86–90.
M. Bostock, V. Ogievetsky, and J. Heer. 2011. D3
data-driven documents. Visualization and ComputerGraphics, 17(12):2301–2309.
A. Buja, D. Cook, and D. F. Swayne. 1996. Interac-tive high-dimensional data visualization. Journal ofcomputational and graphical statistics, 5(1):78–99.
A. Buja, J. A. McDonald, J. Michalak, and W. Stuet-zle. 1991. Interactive data visualization using focus-ing and linking. In Proc. of Visualization’91, pages156–163. IEEE.
Antske Fokkens, Marieke van Erp, Piek Vossen, SaraTonelli, Willem Robert van Hage, Luciano Serafini,Rachele Sprugnoli, and Jesper Hoeksema. 2013.GAF: A grounded annotation framework for events.In The 1st Workshop on Events, Atlanta, USA.
R. L. Gregory and O. L. Zangwill. 1987. The Oxfordcompanion to the mind. Oxford University Press.
P. Kingsbury and M. Palmer. 2002. From treebank topropbank. In LREC. Citeseer.
S. Liu, M. X. Zhou, S. Pan, Y. Song, W. Qian,W. Cai, and X. Lian. 2012. Tiara: Interactive,topic-based visual text summarization and analysis.Transactions on Intelligent Systems and Technology,3(2):25.
A. R. Martin and Matthew O. Ward. 1995. High di-mensional brushing for interactive exploration ofmultivariate data. In Proc. of Visualization’95, page271.
R. Munroe. 2009. Xkcd# 657: Movie narrative charts.
N. Ockeloen, A. Fokkens, S. ter Braake, P. Vossen,V. De Boer, G. Schreiber, and S. Legene. 2013. Bi-ographynet: Managing provenance at multiple lev-els and from different perspectives. In Proc. ofLISC2013, pages 59–71. CEUR-WS. org.
R. Segers, P. Vossen, M. Rospocher, L. Serafini, E. La-parra, and G. Rigau. 2015. ESO: A frame based on-tology for events and implied situations. In Proceed-ings of MAPLEX 2015, Yamagata, Japan.
Ben Shneiderman. 1996. The eyes have it: A task bydata type taxonomy for information visualizations.In IEEE Symposium on Visual Languages, pages336–343.
Square. 2012. Crossfilter.js fast multidimensional fil-tering for coordinated views.
44

W. R. Van Hage, V. Malaise, R. Segers, L. Hollink, andG. Schreiber. 2011. Design and use of the simpleevent model (sem). Web Semantics: Science, Ser-vices and Agents on the World Wide Web, 9(2):128–136.
P. Vossen, T. Caselli, and Y. Kontzopoulou. 2015. Sto-rylines for structuring massive streams of news. InProc. of CNewS 2015, Bejing, China.
Piek Vossen, Rodrigo Agerri, Itziar Aldabe, Agata Cy-bulska, Marieke van Erp, Antske Fokkens, EgoitzLaparra, Anne-Lyse Minard, Alessio Palmero Apro-sio, German Rigau, Marco Rospocher, and RoxaneSegers. 2016. Newsreader: Using knowledge re-sources in a cross-lingual reading machine to gener-ate more knowledge from massive streams of news.Knowledge-Based Systems, 110:60 – 85.
M. Q. Wang Baldonado, A. Woodruff, and A. Kuchin-sky. 2000. Guidelines for using multiple views in in-formation visualization. In Proc. of AVI, pages 110–119. ACM.
Y. Wu, N. Pitipornvivat, J. Zhao, S. Yang, G. Huang,and H. Qu. 2016. egoslider: Visual analysis of ego-centric network evolution. Visualization and Com-puter Graphics, 22(1):260–269.
J. M. van der Zwaan, I. Leemans, E. Kuijpers, andI. Maks. 2015. Heem, a complex model for min-ing emotions in historical text. In Proc. of IEEEeScience, pages 22–30.
45

Proceedings of the 2017 EMNLP Workshop on Natural Language Processing meets Journalism, pages 46–50Copenhagen, Denmark, September 7, 2017. c©2017 Association for Computational Linguistics
Analyzing the Revision Logs of a Japanese Newspaperfor Article Quality Assessment
Hideaki Tamori 1 Yuta Hitomi 1 Naoaki Okazaki 2 Kentaro Inui 3
1 Media Lab, The Asahi Shimbun Company2 Tokyo Institute of Technology
3 Tohoku University{tamori-h, hitomi-y1}@asahi.com, [email protected]
Abstract
We address the issue of the quality ofjournalism and analyze daily article revi-sion logs from a Japanese newspaper com-pany. The revision logs contain data thatcan help reveal the requirements of qualityjournalism such as the types and numberof edit operations and aspects commonlyfocused in revision. This study also dis-cusses potential applications such as qual-ity assessment and automatic article revi-sion as our future research directions.
1 Introduction
Quality journalism deserves serious considera-tion, particularly given the disruptions of exist-ing publishing companies and the emergence ofnew publishing companies, citizen journalism, andautomated journalism. Although no consensusexists for the definition of quality journalism,Meyer (2009) describes several aspects that con-stitute quality journalism; for example, credibility,influence, accuracy, and readability. To the bestof our knowledge, this is the first attempt to ana-lyze the large-scale revision logs of professionalsin the field of journalism. In this study, we exploreaspects of quality journalism through analyses ofthe newspaper article revision logs. More specifi-cally, we analyze the revision processes as editorsrefine the drafts written by reporters so that theyare of publication quality.
While our attempt is still in the early stages, thispaper reports the statistics of the actual revisionsmade by professionals and shows the usefulnessof the revision logs. We also discuss the future di-rections of this research, for example, the potentialto present feedback to reporters, extract guidelinesfor ‘good’ articles, and develop systems for auto-matic revision and sentence merging and spitting.
2 Analysis of revision logs
This section describes the daily activities of anewspaper company needed to publish articles andthe analysis of the revision logs.
2.1 Flow of editing and publishing articles
A reporter drafts an article and sends it to an editor,who has over ten years’ experience as a journalist.The editor proofreads the article and forwards it toa reviewers section. The reviewers in this sectionfact-check the article. Finally, designers adjust thearticle so that they fit in the newspaper and web-site. In this way, a newspaper article is revisedmany times from the original submission.
Figure 1 compares the text from an article writ-ten by a reporter and the same text after it has beenrevised by an editor. The editor revises the textusing insertion, deletion, and replacement. Thisexample also shows the operations of sentence re-ordering and splitting.
2.2 Aligning original sentences with revisedsentences
Revision logs present two versions of an article:the one written by a reporter (the original ver-sion) and the final version revised by an editor(the revised version). However, these logs do notprovide details about the editing process used totransform the original version into the final ver-sion (e.g., individual operations of word inser-tion/deletion, sentence reordering). Hence, we es-timate sentence alignments between the originaland revised versions using the maximum align-ment method (Kajiwara and Komachi, 2016).
The accuracy, precision, recall, and F1 scorewere 0.995, 0.996, 0.951, and 0.957, respectively,on a dataset consisting of 50 articles in which thecorrect alignments were assigned by a human.1
1We chose 0.06 for word similarity threshold and 0.70 for
46

裁判員経験者の意見を生かそうと宇都宮地裁は12日、裁判
員経験者と裁判官、検察官、弁護士による意見交換会を開い
た。
Utsunomiya District Court held a meeting for
exchanging opinions among judges, experienced
citizen judges, judges, prosecutors and lawyers on
November 12th to make use of opinions of
experienced citizen judges.
今年1~8月にかけて裁判員として審理に参加した9人が出席
し、審理日程や評議についての感想や改善点などを話した。
The nine experienced citizen judges, who participated
in hearings from January to August in this month,
attended this meeting and discussed the feedback and
improvements about the schedule of hearings and
deliberations.
参加した裁判員経験者は「社会の中で責任を果たす自覚を
持った」、「貴重な経験ができた」などという前向きな感想
が多かった一方、「弁護士の冒頭陳述がわかりにくかった」
などの課題も指摘された。
While the many comments which the citizen judges
told were active, such as "I had a consciousness of
fulfilling my responsibility in our society," and "I had
valuable experience.", some citizen judges also
pointed out problems to solve, such as " Lawyers'
opening statement was hard to understand.”, and so
on.
(…)
Reporter
(Original version of an article)
Editor
(Revised version of an article)
裁判員経験者の意見を生かそうと宇都宮地裁はが12日、裁
判員経験者と裁判官、検察官、弁護士による意見交換会を開
いた。
Utsunomiya District Court held a meeting for
exchanging opinions among judges, experienced
citizen judges, judges, prosecutors, and lawyers on
November 12th to make use of opinions of
experienced citizen judges.
参加した裁判員経験者からは「社会の中で責任を果たす自覚
を持った」、「貴重な経験ができた」などという前向きな感
想が多かった声が出た一方、「弁護士の冒頭陳述がわかりに
くかった」などのといった課題も指摘された。
While the many comments which the citizen judges
told were active provided active comments, such as "I
had a consciousness of fulfilling my responsibility in
our society," and "I had valuable experience.", some
citizen judges also pointed out problems to solve
issues, such as " Lawyers' opening statement was hard
to understand.”, and so on.
意見交換会は12日に開かれ、今年1~8月にかけて裁判員
として審理に参加した9人が出席し、。
This meeting was organized on November 12th, and
the nine experienced citizen judges, who participated
in hearings from January to August in this month,
attended this meeting and .
審理日程や評議についての感想や改善点などを話した。
They discussed the feedback and improvements about
the schedule of hearings and deliberations.
(…)
Submit to a system
for proofreading and editing
Alignment
Sentence Splitting
Sentence
Reordering
Figure 1: Comparison of the original and revised versions of some text. In the revised version, thestrikethrough and underlined parts indicate deletions and insertions, respectively.
The precision, recall, and F1 score calculated fromonly the sentence pairs that are changed during re-vision were 0.926, 0.895, and 0.910, respectively.There may be some room for improving the per-formance of the alignments but it is sufficient forthis analysis.
2.3 Data analysis of the revision logs
To analyze the details of the revision processes,we inspected articles published from October1, 2015 to September 30, 2016. We appliedMeCab (Kudo et al., 2004), a Japanese morpho-logical analyzer, with the enhanced dictionary NE-ologd2, to split the sentences into words (mor-phemes) and recognize their parts-of-speech.
sentence similarity threshold, optimizing the F1 score on adevelopment set consisting of 150 articles. We used wordembeddings that are pre-trained by the original articles andrevised articles to compute sentence similarity.
2https://github.com/neologd/mecab-ipadic-neologd
The dataset analyzed in this study contains120,331 articles with 1,903,645 original sentencesand 1,884,987 revised sentences. The dataset con-sists of a Japanese newspaper’s articles3, whichhave a mixed domain (genre) of the news, andmost of the articles have the same writing style.We obtained 2,197,739 sentence pairs using thealignment method described in Section 2.2. Thenumber of aligned pairs is larger than that ofthe sentences because an original sentence can bealigned to multiple sentences in the revised ver-sion. About half of the sentence pairs (1,108,750)were unchanged during the revision process, andthe remaining pairs (1,088,989) were changed. Inthis section, we report the statistics of the edit op-erations in the changed pairs. We found that news-paper companies produce a huge number of sen-tences, about half of which are revised, for analy-
3The Asahi Shimbun Company provided this dataset.
47

!
"!!!!!
#!!!!!
$!!!!!
%!!!!!
&!!!!!
'!!!!!
!()*(+ "!()*("+ #!()*(#+ $!()*($+ %!()*(%+ &!()*(&+ '!()*('+ ,!()*(,+ -!()*(-+ +!()*(++ !""#$
Fre
quen
cy
600,000
500,000
400,000
300,000
200,000
100,000
010 20 30 40 50 60 70 80 90 100+
Levenshtein Distance
Figure 2: Distribution of the Levenshtein distanceof changed sentence pairs.
Original sentence:
市場に同じ魚が出回りすぎると、魚の単価が下がってしまう。
If the same kind of fish is distributed in large quantities
in the market, the unit price of the fish manages to decrease.
Revised sentence:
市場に同じ魚が出回りすぎるの水揚げが重なると、魚の単価が
下がってしまうる。
If the same kind of fish is distributed landed in large quantities
in the market, the unit price of the fish manages to decrease
is decreasing.
Figure 3: An example of the original and revisedsentence pair whose Levenshtein distance is 15.
sis just within a year.
Figure 2 presents the distribution of the Lev-enshtein distance between the original and re-vised sentences. The mean of the Levenshteindistances of the revised pairs (15.04) indicatesthat the dataset includes many examples in whichdrafts are deeply edited by the editors. Figure 3is an example of the sentence pair which has themean of the Levenshtein distance of the dataset(15).
Table 1 lists the number of insertions, dele-tions, and replacements, according to the numberof words involved in the edit operations. We foundthat 56.20% of the total edit operations were re-placements for one or two words, and this fact in-dicates that editors revised these articles with im-pressive attention to detail.
Table 2 shows the number of edit operationsseparated by different part-of-speech. The mostfrequent target for revisions is nouns, followed byparticles (postpositions). This result indicates thatrevisions in terms of both content and readabilityare important for improving the quality of articles.
# of words Insertion Deletion Replacement1 139,790 160,975 1,424,1182 118,261 151,641 303,2933 57,397 53,789 115,5254 35,272 31,719 75,9095 21,339 20,435 33,8056 13,295 14,756 21,4197 14,599 13,030 24,4008 8,631 9,301 10,7079 10,196 10,760 8,475Over 10 48,754 60,523 61,387Total 467,534 526,929 2,079,038
Table 1: Number of edit operations with respect tothe number of words involved.
Tag CountNoun 1,255,113Noun + Noun 174,306Particle 157,840Symbol 128,584Noun + Particle 106,548Verb 85,709Symbol + Noun 47,635Particle + Noun 42,714Particle + Verb 41,342Prefix 41,194Noun + Symbol 37,580Verb + Auxiliary 20,836Auxiliary 18,145Noun + Verb 14,153Adverb 9,009Others 101,714
Table 2: Distribution of parts-of-speech as targetsfor the edit operations involving one or two words.
3 Future directions for qualityassessment and automatic articlerevision
There are several possible future directions for theutilization of the revision logs.
3.1 Feedbacks to reporters
We can use the revision logs for improving thewriting skills of reporters. An interesting findingin the revision logs is that the articles of youngreporters (1–3 years’ experience) tend to be re-vised more than those of experienced reporters(31–33 years’ experience): the mean Levenshteindistances of these young and experienced reportersare 15.82 and 12.95, respectively. As exemplifiedby this finding, the revision logs can indicate themain types of revisions that a particular group ofreporters or an individual reporter receives. Wewill explore the potential of the revision logs forassessing the writing quality of a reporter and pre-senting them with feedback.
48

3.2 Establishing guidelines for writingarticles
Most textbooks on Japanese writing (includingthe internal handbook for reporters producedby the newspaper company) recommend that aJapanese sentence should be 40 to 50 characterslong (Ishioka and Kameda, 2006). We could con-firm that the newspaper articles satisfy this crite-rion: the revised sentences are 41.10 characterslong on average. In this way, we can analyze therevision logs to extract various criteria for estab-lishing the guidelines for ‘good’ articles.
3.3 Automatic article revision withinsentences
Another future direction is to build a corpus forimproving the quality of articles. The revision logscollected for a year (excluding duplicates) provide517,545 instances of replace operations, 79,639instances of insertions, and 54,111 instances ofdeletions that involve one or two words. Table 3shows some instances of the replace operations.It may not be straightforward to use the revisionlogs for error correction because some edit opera-tions add new information and remove useless in-formation. Nevertheless, the logs record the dailyactivities of how drafts are improved by the edi-tors. In future, we plan to build an editing sys-tem that detects errors and suggests wording whilethe reporters write drafts. We can use natural lan-guage processing techniques for these tasks be-cause local error correction has been previouslyresearched (Cucerzan and Brill, 2004).
3.4 Automatic sentence merging and splitting
The alignment method found 69,891 instances ofsentence splitting (wherein an original sentence issplit into multiple sentences) and 68,550 instancesof sentence merging (wherein multiple originalsentences are merged into one sentence). Table 4shows examples of sentence splitting and merging.We observe some sentences are also compressedduring sentence merging and splitting. We canuse these instances as a training data for buildinga model for sentence splitting and merging (withcompression), and this may be an interesting taskin the field of natural language processing.
4 Conclusion
In this paper, we explored the potential of the re-vision logs of a newspaper company for assessing
Original Revised同政府関係者 韓国政府関係者this Government offi-cials
Korean Government of-ficials: specification
放射線汚染 放射能汚染contamination by radialray
radiologically contami-nation
破顔し 笑顔で話しbroke into a smile spoke with a smile:
simplificationバラティ バラエティーVarety Variety: typoタンパク質 たんぱく質Protain: written inKatakana and Kanji
Protain: written in Hi-ragana and Kanji
買えた 買えるcould buy can buy
Table 3: Examples of commonly replacedwords/phrases.
Splitting(S1) 新たな窓口を設けるなど内部通報制度も強化し、
通報は問題が発覚する前の 88件 (14年度)から263件 (15年度)と 3倍に増えた。They enhance whistle-blowing systems by provid-ing such as new counseling offices, and the numberof whistle-blowing was increased three times from88 in 2014, in which this issue was found out, to263 in 2015.
(S2) 新たな窓口を設けるなど内部通報制度も強化。通報は 2015年度に 263件と、不正会計問題の発覚前の 14年度の 88件から約 3倍に増えたという。They enhance whistle-blowing systems by provid-ing such as new counseling offices. As a result,the number of whistle-blowing was increased threetimes from 88 in 2014, in which this issue wasfound out, to 263 in 2015.
Merging(M1)同署によると、事務所南側 1階の窓が割られ、室
内にある防犯カメラのモニター 4 台がすべて壊されていた。食器棚も倒され、食器が散乱していたという。Police said that the window on the first floor of theoffice south is broken, and all four displays for thesecurity camera was destroyed. Police also said thatthe cupboard was knocked down, and the dished arescattered in the room.
(M2)署によると、室内の防犯カメラのモニター全 4台が壊され、食器棚が倒れて食器が散乱していた。Police said the all four displays for the security cam-era was destroyed, the cupboard was knocked down,and the dished are scattered in the room.
Table 4: Examples of sentence splitting and merg-ing. Sentences S1 and M1 are the original sen-tences, and S2 and M2 are the revised sentences.In the merging example, we can also observe thesentence compressing; the part “the window on thefirst floor of the office south is broken” was elimi-nated in M2.
the quality of articles. In addition to presentingthe revision logs statistics, we discussed the future
49
directions of this work, which include feedback toreporters, guidelines for ‘good’ articles, automaticarticle revision, and automatic sentence mergingand splitting.
ReferencesSilviu Cucerzan and Eric Brill. 2004. Spelling correc-
tion as an iterative process that exploits the collectiveknowledge of web users. In Proc of EMNLP. pages293–300.
Tsunenori Ishioka and Masayuki Kameda. 2006. Auto-mated Japanese essay scoring system based on arti-cles written by experts. In Proc of ACL. pages 233–240.
Tomoyuki Kajiwara and Mamoru Komachi. 2016.Building a monolingual parallel corpus for text sim-plification using sentence similarity based on align-ment between word embeddings. In Proc of COL-ING. pages 1147–1158.
Taku Kudo, Kaoru Yamamoto, and Yuji Matsumoto.2004. Applying conditional random fields toJapanese morphological analysis. In Proc ofEMNLP. pages 230–237.
Philip Meyer. 2009. The vanishing newspaper : sav-ing journalism in the information age. University ofMissouri Press, Columbia.
50

Proceedings of the 2017 EMNLP Workshop on Natural Language Processing meets Journalism, pages 51–55Copenhagen, Denmark, September 7, 2017. c©2017 Association for Computational Linguistics
Improved Abusive Comment Moderation with User Embeddings
John PavlopoulosProdromos Malakasiotis
Juli BakagianniStraintek, Athens, Greece
{ip, mm, jb}@straintek.com
Ion AndroutsopoulosDepartment of Informatics
Athens University of Economicsand Business, [email protected]
Abstract
Experimenting with a dataset of approxi-mately 1.6M user comments from a Greeknews sports portal, we explore how a stateof the art RNN-based moderation methodcan be improved by adding user embed-dings, user type embeddings, user biases,or user type biases. We observe improve-ments in all cases, with user embeddingsleading to the biggest performance gains.
1 Introduction
News portals often allow their readers to commenton articles, in order to get feedback, engage theirreaders, and build customer loyalty. User com-ments, however, can also be abusive (e.g., bully-ing, profanity, hate speech), damaging the reputa-tion of news portals, making them liable to fines(e.g., when hosting comments encouraging illegalactions), and putting off readers. Large news por-tals often employ moderators, who are frequentlyoverwhelmed by the volume and abusiveness ofcomments.1 Readers are disappointed when non-abusive comments do not appear quickly onlinebecause of moderation delays. Smaller news por-tals may be unable to employ moderators, andsome are forced to shut down their comments.2
In previous work (Pavlopoulos et al., 2017a),we introduced a new dataset of approx. 1.6Mmanually moderated user comments from a Greeksports news portal, called Gazzetta, which wemade publicly available.3 Experimenting on thatdataset and the datasets of Wulczyn et al. (2017),which contain moderated English Wikipedia com-ments, we showed that a method based on a Recur-rent Neural Network (RNN) outperforms DETOX
1See, for example, https://goo.gl/WTQyio.2See https://goo.gl/2eKdeE.3The portal is http://www.gazzetta.gr/. In-
structions to download the dataset will become available athttp://nlp.cs.aueb.gr/software.html.
(Wulczyn et al., 2017), the previous state of the artin automatic user content moderation.4 Our pre-vious work, however, considered only the texts ofthe comments, ignoring user-specific information(e.g., number of previously accepted or rejectedcomments of each user). Here we add user embed-dings or user type embeddings to our RNN-basedmethod, i.e., dense vectors that represent individ-ual users or user types, similarly to word embed-dings that represent words (Mikolov et al., 2013;Pennington et al., 2014). Experiments on Gazzettacomments show that both user embeddings anduser type embeddings improve the performanceof our RNN-based method, with user embeddingshelping more. User-specific or user-type-specificscalar biases also help to a lesser extent.
2 Dataset
We first discuss the dataset we used, to helpacquaint the reader with the problem. Thedataset contains Greek comments from Gazzetta(Pavlopoulos et al., 2017a). There are approxi-mately 1.45M training comments (covering Jan. 1,2015 to Oct. 6, 2016); we call them G-TRAIN (Ta-ble 1). An additional set of 60,900 comments (Oct.7 to Nov. 11, 2016) was split to development set(G-DEV, 29,700 comments) and test set (G-TEST,29,700).5 Each comment has a gold label (‘ac-cept’, ‘reject’). The user ID of the author of eachcomment is also available, but user IDs were notused in our previous work.
When experimenting with user type embed-dings or biases, we group the users into the fol-
4Two of the co-authors of Wulczyn et al. (2017) are withJigsaw, who recently announced Perspective, a system to de-tect toxic comments. Perspective is not the same as DETOX(personal communication), but we were unable to obtain sci-entific articles describing it.
5The remaining 1,500 comments are not used here.Smaller subsets of G-TRAIN and G-TEST are also available(Pavlopoulos et al., 2017a), but are not used in this paper.The Wikipedia comment datasets of Wulczyn et al. (2017)cannot be used here, because they do not provide user IDs.
51

Dataset/Split Gold Label Comments Per User Type TotalAccepted Rejected Green Yellow Red UnknownG-TRAIN 960,378 (66%) 489,222 (34%) 724,247 (50%) 585,622 (40%) 43,702 (3%) 96,029 (7%) 1.45M
G-DEV 20,236 (68%) 9,464 (32%) 14,378 (48%) 10,964 (37%) 546 (2%) 3,812 (13%) 29,700G-TEST 20,064 (68%) 9,636 (32%) 14,559 (49%) 10,681 (36%) 621 (2%) 3,839 (13%) 29,700
Table 1: Comment statistics of the dataset used.
Dataset/Split Individual Users Per User Type TotalGreen Yellow Red UnknownG-TRAIN 4,451 3,472 251 21,865→ 1 8,175
G-DEV 1,631 1,218 64 1,281→ 1 2,914G-TEST 1,654 1,203 67 1,254→ 1 2,925
Table 2: User statistics of the dataset used.
lowing types. T (u) is the number of training com-ments posted by user (ID) u. R(u) is the ratio oftraining comments posted by u that were rejected.
Red: Users with T (u) > 10 and R(u) ≥ 0.66.Yellow: T (u) > 10 and 0.33 < R(u) < 0.66.Green: T (u) > 10 and R(u) ≤ 0.33.Unknown: Users with T (u) ≤ 10.
Table 2 shows the number of users per type.
3 Methods
RNN: This is the RNN-based method of our previ-ous work (Pavlopoulos et al., 2017a). It is a chainof GRU cells (Cho et al., 2014) that transforms thetokens w1 . . . , wk of each comment to the hid-den states h1 . . . , hk (hi ∈ Rm). Once hk hasbeen computed, a logistic regression (LR) layer es-timates the probability that comment c should berejected:
PRNN(reject|c) = σ(Wphk + b) (1)
σ is the sigmoid function, Wp ∈ R1×m, b ∈ R.6
ueRNN: This is the RNN-based method with userembeddings added. Each user u of the training setwith T (u) > 10 is mapped to a user-specific em-bedding vu ∈ Rd. Users with T (u) ≤ 10 aremapped to a single ‘unknown’ user embedding.The LR layer is modified as follows; vu is the em-bedding of the author of c; and Wv ∈ R1×d.
PueRNN(reject|c) = σ(Wphk + Wvvu + b) (2)
teRNN: This is the RNN-based method with usertype embeddings added. Each user type t ismapped to a user type embedding vt ∈ Rd. The
6In our previous work (Pavlopoulos et al., 2017a), we alsoconsidered a variant of RNN, called a-RNN, with an attentionmechanism. We do not consider a-RNN here to save space.
LR layer is modified as follows, where vt is theembedding of the type of the author of c.
PteRNN(reject|c) = σ(Wphk + Wvvt + b) (3)
ubRNN: This is the RNN-based method with userbiases added. Each user u of the training set withT (u) > 10 is mapped to a user-specific bias bu ∈R. Users with T (u) ≤ 10 are mapped to a single‘unknown’ user bias. The LR layer is modified asfollows, where bu is the bias of the author of c.
PubRNN(reject|c) = σ(Wphk + bu) (4)
We expected ubRNN to learn higher (or lower) bu
biases for users whose posts were frequently re-jected (accepted) in the training data, biasing thesystem towards rejecting (accepting) their posts.tbRNN: This is the RNN-based method with usertype biases. Each user type t is mapped to a usertype bias bt ∈ R. The LR layer is modified asfollows; bt is the bias of the type of the author.
PtbRNN(reject|c) = σ(Wphk + bt) (5)
We expected tbRNN to learn a higher bt for the reduser type (frequently rejected), and a lower bt forthe green user type (frequently accepted), with thebiases of the other two types in between.
In all methods above, we use 300-dimensionalword embeddings, user and user type embeddingswith d = 300 dimensions, and m = 128 hiddenunits in the GRU cells, as in our previous experi-ments (Pavlopoulos et al., 2017a), where we tunedall hyper-parameters on 2% held-out training com-ments. Early stopping evaluates on the same held-out subset. User and user type embeddings arerandomly initialized and updated by backpropa-gation. Word embeddings are initialized to theWORD2VEC embeddings of our previous work(Pavlopoulos et al., 2017a), which were pretrainedon 5.2M Gazzetta comments. Out of vocabularywords, meaning words not encountered or encoun-tered only once in the training set and/or wordswith no initial embeddings, are mapped (duringboth training and testing) to a single randomly ini-tialized word embedding, updated by backpropa-gation. We use Glorot initialization (Glorot and
52

System G-DEV G-TESTueRNN 80.68 (±0.11) 80.71 (±0.13)ubRNN 80.54 (±0.09) 80.53 (±0.08)teRNN 80.37 (±0.05) 80.41 (±0.09)tbRNN 80.33 (±0.12) 80.32 (±0.05)
RNN 79.40 (±0.08) 79.24 (±0.05)uBASE 67.61 68.57tBASE 63.16 63.82
Table 3: AUC scores. Standard error in brackets.
Bengio, 2010) for other parameters, cross-entropyloss, and Adam (Kingma and Ba, 2015).7
uBASE: For a comment c authored by user u, thisbaseline returns the rejection rate R(u) of the au-thor’s training comments, if there are T (u) > 10training comments of u, and 0.5 otherwise.
PuBASE(reject|c) ={
R(u), if T (u) > 100.5, if T (u) ≤ 10
tBASE: This baseline returns the following proba-bilities, considering the user type t of the author.
PtBASE(reject|c) =
1, if t is Red0.5, if t is Yellow0.5, if t is Unknown0, if t is Green
4 Results and Discussion
Table 3 shows the AUC scores (area under ROC
curve) of the methods considered. Using AUC al-lows us to compare directly to the results of ourprevious work (Pavlopoulos et al., 2017a) and thework of Wulczyn et al. (2017). Also, AUC consid-ers performance at multiple classification thresh-olds t (rejecting comment c when P (reject|c) ≥ t,for different t values), which gives a more com-plete picture compared to reporting precision, re-call, or F-scores for a particular t only. Accuracy isnot an appropriate measure here, because of classimbalance (Table 1). For methods that involve ran-dom initializations (all but the baselines), the re-sults are averaged over three repetitions; we alsoreport the standard error across the repetitions.
User-specific information always improves ouroriginal RNN-based method (Table 3), but the bestresults are obtained by adding user embeddings(ueRNN). Figure 1 visualizes the user embeddingslearned by ueRNN. The two dimensions of Fig. 1correspond to the two principal components of theuser embeddings, obtained via PCA.The colors andnumeric labels reflect the rejection rates R(u) of
7We used Keras (http://keras.io/) with the Ten-sorFlow back-end (http://www.tensorflow.org/).
Figure 1: User embeddings learned by ueRNN (2principal components). Color represents the rejec-tion rate R(u) of the user’s training comments.
the corresponding users. Moving from left to rightin Fig. 1, the rejection rate increases, indicatingthat the user embeddings of ueRNN capture mostlythe rejection rate R(u). This rate (a single scalarvalue per user) can also be captured by the sim-pler user-specific biases of ubRNN, which explainswhy ubRNN also performs well (second best re-sults in Table 3). Nevertheless, ueRNN performsbetter than ubRNN, suggesting that user embed-dings capture more information than just a user-specific rejection rate bias.8
Three of the user types (Red, Yellow, Green)in effect also measure R(u), but in discretizedform (three bins), which also explains why usertype embeddings (teRNN) also perform well (thirdbest method). The performance of tbRNN is closeto that of teRNN, suggesting again that most ofthe information captured by user type embeddingscan also be captured by simpler scalar user-type-specific biases. The user type biases bt learned bytbRNN are shown in Table 4. The bias of the Redtype is the largest, the bias of the Green type is thesmallest, and the biases of the Unknown and Yel-low types are in between, as expected (Section 3).The same observations hold for the average user-specific biases bu learned by ubRNN (Table 4).
Overall, Table 3 indicates that user-specific in-formation (ueRNN, ubRNN) is better than user-typeinformation (teRNN, tbRNN), and that embeddings(ueRNN, teRNN) are better than the scalar biases(ubRNN, tbRNN), though the differences are small.All the RNN-based methods outperform the twobaselines (uBASE, tBASE), which do not considerthe texts of the comments.
Let us provide a couple of examples, to illus-trate the role of user-specific information. We en-
8We obtained no clear clusterings with tSNE (van derMaaten and Hinton, 2008).
53

User Type bt of tbRNN average bu of ubRNNGreen −0.471 (±0.007) −0.180 (±0.024)Yellow 0.198 (±0.015) 0.058 (±0.022)
Unknown 0.256 (±0.021) 0.312 (±0.011)Red 1.151 (±0.013) 0.387 (±0.023)
Table 4: Biases learned and standard error.
countered a comment saying just “Ooooh, downto Pireaus. . . ” (translated from Greek), which themoderator had rejected, because it is the beginningof an abusive slogan. The rejection probability ofRNN was only 0.34, presumably because there areno clearly abusive expressions in the comment, butthe rejection probability of ueRNN was 0.72, be-cause the author had a very high rejection rate.On the other hand, another comment said “Indeed,I know nothing about the filth of Greek soccer.”(translated, apparently not a sarcastic comment).The original RNN method marginally rejected thecomment (rejection probability 0.57), presumablybecause of the ‘filth’ (comments talking about thefilth of some sport or championship are often re-jected), but ueRNN gave it a very low rejectionprobability (0.15), because the author of the com-ment had a very low rejection rate.
5 Related work
In previous work (Pavlopoulos et al., 2017a), weshowed that our RNN-based method outperformsDETOX (Wulczyn et al., 2017), the previous stateof the art in user content moderation. DETOX
uses character or word n-gram features, no user-specific information, and an LR or MLP classifier.Other related work on abusive content moderationwas reviewed extensively in our previous work(Pavlopoulos et al., 2017a). Here we focus on pre-vious work that considered user-specific featuresand user embeddings.
Dadvar et al. (2013) detect cyberbullying inYouTube comments, using an SVM and featuresexamining the content of each comment (e.g., sec-ond person pronouns followed by profane words,common bullying words), but also the profile andhistory of the author of the comment (e.g., age, fre-quency of profane words in past posts). Waseemet al. (2016) detect hate speech tweets. Their bestmethod is an LR classifier, with character n-gramsand a feature indicating the gender of the author;adding the location of the author did not help.
Cheng et al. (2015) predict which users will bebanned from on-line communities. Their best sys-tem uses a Random Forest or LR classifier, with
features examining the average readability andsentiment of each user’s past posts, the past activ-ity of each user (e.g., number of posts daily, pro-portion of posts that are replies), and the reactionsof the community to the past actions of each user(e.g., up-votes, number of posts rejected). Lee etal. (2014) and Napoles et al. (2017) include simi-lar user-specific features in classifiers intended todetect high quality on-line discussions.
Amir et al. (2016) detect sarcasm in tweets.Their best system uses a word-based Convolu-tional Neural Network (CNN). The feature vec-tor produced by the CNN (representing the contentof the tweet) is concatenated with the user em-bedding of the author, and passed on to an MLP
that classifies the tweet as sarcastic or not. Thismethod outperforms a previous state of the artsarcasm detection method (Bamman and Smith,2015) that relies on an LR classifier with hand-crafted content and user-specific features. We usean RNN instead of a CNN, and we feed the com-ment and user embeddings to a simpler LR layer(Eq. 2), instead of an MLP. Amir et al. discard un-known users, unlike our experiments, and consideronly sarcasm, whereas moderation also involvesprofanity, hate speech, bullying, threats etc.
User embeddings have also been used in: con-versational agents (Li et al., 2016); sentiment anal-ysis (Chen et al., 2016); retweet prediction (Zhanget al., 2016); predicting which topics a user islikely to tweet about, the accounts a user may wantto follow, and the age, gender, political affiliationof Twitter users (Benton et al., 2016).
Our previous work (Pavlopoulos et al., 2017a)also discussed how machine learning can be usedin semi-automatic moderation, by letting modera-tors focus on ‘difficult’ comments and automati-cally handling comments that are easier to acceptor reject. In more recent work (Pavlopoulos et al.,2017b) we also explored how an attention mech-anism can be used to highlight possibly abusivewords or phrases when showing ‘difficult’ com-ments to moderators.
6 Conclusions
Experimenting with a dataset of approx. 1.6M usercomments from a Greek sports news portal, we ex-plored how a state of the art RNN-based modera-tion method can be improved by adding user em-beddings, user type embeddings, user biases, oruser type biases. We observed improvements in
54
all cases, but user embeddings were the best.We plan to compare ueRNN to CNN-based meth-
ods that employ user embeddings (Amir et al.,2016), after replacing the LR layer of ueRNN byan MLP to allow non-linear combinations of com-ment and user embeddings.
Acknowledgments
This work was funded by Google’s Digital NewsInitiative (project ML2P, contract 362826).9 Weare grateful to Gazzetta for the data they pro-vided. We also thank Gazzetta’s moderators fortheir feedback, insights, and advice.
ReferencesS. Amir, B. C. Wallace, H. Lyu, P. Carvalho, and
Mario J. M. J. Silva. 2016. Modelling context withuser embeddings for sarcasm detection in social me-dia. In Proceedings of CoNLL, pages 167–177,Berlin, Germany.
D. Bamman and N.A. Smith. 2015. Contextualized sar-casm detection on Twitter. In Proc. of the 9th In-ternational Conference on Web and Social Media,pages 574–577, Oxford, UK.
A. Benton, R. Arora, and M. Dredze. 2016. Learningmultiview embeddings of Twitter users. In Proc. ofACL, pages 14–19, Berlin, Germany.
H. Chen, M. Sun, C. Tu, Y. Lin, and Z. Liu. 2016.Neural sentiment classification with user and prod-uct attention. In Proc. of EMNLP, pages 1650–1659,Austin, TX.
J. Cheng, C. Danescu-Niculescu-Mizil, andJ. Leskovec. 2015. Antisocial behavior in on-line discussion communities. In Proc. of theInternational AAAI Conference on Web and SocialMedia, pages 61–70, Oxford University, England.
K. Cho, B. van Merrienboer, C. Gulcehre, D. Bah-danau, F. Bougares, H. Schwenk, and Y. Bengio.2014. Learning phrase representations using RNNencoder–decoder for statistical machine translation.In EMNLP, pages 1724–1734, Doha, Qatar.
M. Dadvar, D. Trieschnigg, R. Ordelman, andF. de Jong. 2013. Improving cyberbullying detec-tion with user context. In ECIR, pages 693–696,Moscow, Russia.
X. Glorot and Y. Bengio. 2010. Understanding the dif-ficulty of training deep feedforward neural networks.In Proc. of the International Conference on ArtificialIntelligence and Statistics, pages 249–256, Sardinia,Italy.
9See https://digitalnewsinitiative.com/.
D. P. Kingma and J. Ba. 2015. Adam: A method forstochastic optimization. In ICLR, San Diego, CA.
J.-T. Lee, M.-C. Yang, and H.-C. Rim. 2014. Discov-ering high-quality threaded discussions in online fo-rums. Journal of Computer Science and Technology,29(3):519–531.
J. Li, M. Galley, Chris C. Brockett, G. Spithourakis,J. Gao, and B. Dolan. 2016. A persona-based neuralconversation model. In Proc. of ACL, pages 994–1003, Berlin, Germany.
L. J. P. van der Maaten and G. E. Hinton. 2008. Visual-izing data using t-SNE. Journal of Machine Learn-ing Research, 9:2579–2605.
T. Mikolov, W.-t. Yih, and G. Zweig. 2013. Linguis-tic regularities in continuous space word representa-tions. In NAACL-HLT, pages 746–751, Atlanta, GA.
C. Napoles, A. Pappu, and J. Tetreault. 2017. Automat-ically identifying good conversations online (yes,they do exist!). In Proc. of the International AAAIConference on Web and Social Media.
J. Pavlopoulos, P. Malakasiotis, and AndroutsopoulosI. 2017a. Deep learning for user comment modera-tion. In Proc. of the ACL Workshop on Abusive Lan-guage Online, Vancouver, Canada.
J. Pavlopoulos, P. Malakasiotis, and AndroutsopoulosI. 2017b. Deeper attention to abusive user contentmoderation. In EMNLP, Copenhagen, Denmark.
J. Pennington, R. Socher, and C. Manning. 2014.GloVe: Global vectors for word representation. InEMNLP, pages 1532–1543, Doha, Qatar.
Z. Waseem and D. Hovy. 2016. Hateful symbols orhateful people? Predictive features for hate speechdetection on Twitter. In Proc. of NAACL StudentResearch Workshop, pages 88–93, San Diego, CA.
E. Wulczyn, N. Thain, and L. Dixon. 2017. Exmachina: Personal attacks seen at scale. In WWW,pages 1391–1399, Perth, Australia.
Q. Zhang, Y. Gong, J. Wu, H. Huang, and X. Huang.2016. Retweet prediction with attention-based deepneural network. In Proc. of the International onConference on Information and Knowledge Man-agement, pages 75–84, Indianapolis, IN.
55

Proceedings of the 2017 EMNLP Workshop on Natural Language Processing meets Journalism, pages 56–61Copenhagen, Denmark, September 7, 2017. c©2017 Association for Computational Linguistics
Incongruent Headlines: Yet Another Way to Mislead Your Readers
Sophie Chesney†, Maria Liakata‡, Massimo Poesio† and Matthew Purver†
†Cognitive Science Research GroupSchool of Electronic Engineering and Computer Science
Queen Mary University of London, UK{initial.lastname}@qmul.ac.uk
‡Department of Computer ScienceUniversity of Warwick, Coventry, [email protected]
Abstract
This paper discusses the problem of incon-gruent headlines: those which do not accu-rately represent the information containedin the article with which they occur. Weemphasise that this phenomenon shouldbe considered separately from recognisedproblematic headline types such as click-bait and sensationalism, arguing that ex-isting natural language processing (NLP)methods applied to these related conceptsare not appropriate for the automatic de-tection of headline incongruence, as ananalysis beyond stylistic traits is neces-sary. We therefore suggest a number ofalternative methodologies that may be ap-propriate to the task at hand as a founda-tion for future work in this area. In ad-dition, we provide an analysis of existingdata sets which are related to this work,and motivate the need for a novel data setin this domain.
1 Introduction
The problem of mis- and disinformation in the me-dia is the subject of much recent attention. This isoften given the general label ‘fake news’ – but thisterm can refer to a number of distinct concepts,from fabricated or manipulated content to satire(Wardle, 2017), each of which might have verydifferent requirements for a computational treat-ment. In this paper we highlight a specific problemwithin this realm, that of headline incongruence,show that it is distinct from problems consideredwithin NLP so far, and discuss how it might beapproached. Consider (1), taken from the Express
UK online newspaper1 (Ecker et al., 2014):
(1) Headline: Air pollution now leading causeof lung cancerEvidence within article: “We now knowthat outdoor air pollution is not only a majorrisk to health in general, but also a leadingenvironmental cause of cancer deaths.” Dr.Kurt Straif, of IARC [emphasis added]
As Ecker et al. (2014) highlight, this headlinemisleads the reader by overstating the claim madelater in the article. First, omitting ‘environmen-tal’ from the headline radically generalises theclaim: a leading environmental cause may not bethe leading cause, above all other causes. Second,omitting the indefinite determiner ‘a’ (as is com-mon in English ‘headlinese’, Mardh, 1980) allowsa salient reading with an implicit definite article‘the’, further exaggerating the claim.
The headline therefore significantly misrepre-sents the findings reported in the article itself.While the article reports these accurately, evenquoting another source contradicting the exagger-ated claim (“. . . although air pollution increasesthe risk of developing lung cancer by a smallamount, other things have a much bigger effecton our risk, particularly smoking”), these nuancesare lost in the headline. This seems particularlydangerous in the light of experimental work intoreader behaviour: Ecker et al. (2014) show thateven after reading the article in full, a reader islikely to be left with their initial impression gainedfrom the headline; and Gabielkov et al. (2016)found that c.60% of shared URLs on Twitter arenot clicked on before sharing, suggesting that in
1Tom Rawle (2013): http://www.express.co.uk/life-style/health/437473/Air-pollution-now-leading-cause-of-lung-cancer
56

many cases only headlines are read. Automatic de-tection of these misleading cases could thereforedirectly impact the spread of misinformation.
Indeed, the phenomenon is particularly notice-able on social media, partly due to the practice ofusing different headlines online. Official posts onsocial media from some sources include a differ-ent headline in the social media post preview thanon the article itself, as demonstrated by (2), takenfrom the Independent’s Facebook page.
(2) Social media post copy: Enjoy it while youcanSocial media headline2: Scientists have pre-dicted the end of sexArticle headline3: Sex will be made unnec-essary by ‘designer babies’, professor saysEvidence within article: Professor HenryGreely believes that in as little as 20 years,most children will be conceived in a labora-tory, rather than through sexual intercourse.
This example shows a gradual increase in accu-racy and detail, from the misleading social mediapost to the evidence within the article itself. Thesocial media headline is incongruent with the de-tails of the story, and this is exaggerated furtherwhen combined with the rest of the post. Thisclearly demonstrates that social media can be usedto carefully market stories by exaggerating andtwisting key elements of a story in the headlinein conjunction with copy in the post itself.
It is important to highlight, however, that thisphenomenon is not limited to social media, norto particular sectors of the press (e.g. tabloidpress, press from certain political leanings). Wefound examples from across the political spec-trum, as well as across multiple reputable main-stream sources cross-lingually. Consider exam-ples (3)-(8),4 which discuss a recent announce-ment by Volvo Cars on the production of electriccars. As with (1), the headlines consistently ex-aggerate the claims made in the original press re-lease (8), varying from outright incongruence (3)to subtle quantifier scope ambiguity that leaves in-terpretation open (6)-(8).
2https://www.facebook.com/TheIndependentOn-line/posts/10154972799736636
3Will Worley (2016): http://www.independent.co.uk/news/science/sex-unnecessary-designer-babies-stanford-professor-says-a6957636.html
4Examples labelled with * are translated from Swedish,and independently verified by a native speaker.
(3) Dagens Industri*5: Volvo stops developingcars with internal combustion engines
(4) Independent (Social media headline)6:Petrol cars are dead, say Volvo
(5) Sveriges Radio*7: Volvo becomes electriccar brand
(6) Goteborgs Posten*8: Volvo to only makeelectric cars
(7) Reuters9: Geely’s Volvo to go all electricwith new models from 2019
(8) Volvo Cars Press Release10: Volvo Cars togo all electricEvidence from official press release: VolvoCars, the premium car maker, has announcedthat every Volvo it launches from 2019 willhave an electric motor, marking the historicend of cars that only have an internal com-bustion engine.
The story, which, from the headlines suggeststhat Volvo Cars will completely stop productionof cars with internal combustion engines and onlyproduce electric vehicles, circulated in the main-stream and automotive press. In fact, in-article ev-idence makes clear that, although all new vehiclesproduced after 2019 will contain some electric ele-ment, many will still contain some petrol or dieselcomponent. Importantly, Volvo Cars CEO HakanSamuelsson is quoted to say, “this announcementmarks the end of the solely combustion engine-powered car”, a nuance which is lost in the head-lines above. Interestingly, these examples illus-trate that headline incongruence can occur evenin sources widely considered as reliable and rep-utable, such as Reuters (7), as well as in the verysource of the story, as in the case of Volvo Cars’own press release (8).
Here, we consider whether existing definitionsand NLP techniques can be applied to this phe-nomenon, and if not, how we may define it and ap-proach its detection computationally. This has ap-
5Hakan Matson (2017): http://www.di.se/bil/volvo-slutar-tillverka-bilar-med-forbranningsmotorer/
6https://www.facebook.com/TheIndependentOn-line/posts/10154981271001636
7http://sverigesradio.se/sida/artikel.aspx?programid=83&artikel=6732573
8Ida Johansson (2017): http://www.gp.se/nyheter/ekonomi/volvo-ska-bara-tillverka-elbilar-1.4413878
9Niklas Pollard (2017): https://uk.reuters.com/article/us-volvocars-geely-electric-idUKKBN19Q0BJ
10https://www.media.volvocars.com/global/en-gb/me-dia/pressreleases/210058/volvo-cars-to-go-all-electric
57

plications within news aggregation, as a means ofweighting articles and informing readers, as wellas potential in the incentivisation of journalisticvalues.
2 Existing Definitions
These cases, then, do not involve misinformationor fabricated content within the article, but ratherproperties of the headline and its relation to thecontent. In this section, we examine existing workinto the description and classification of problem-atic types of headline.
2.1 Clickbait
Headlines have traditionally been characterised asshort, ‘telegram’-like, and maximally informativesummaries of the article with which they appear(Van Dijk, 1988; Cotter, 2010). They appearto follow a particular condensed grammar com-monly referred to as ‘headlinese’ (Mardh, 1980;De Lange, 2008), and are often carefully con-structed to attract the attention of a reader (Bell,1984; Ecker et al., 2014). In extreme cases thisresults in ‘clickbait’-style headlines, characteris-tic of tabloids and online-native digital media sitessuch as Buzzfeed11, expressly designed to with-hold information to entice the reader to read on,or in most cases, to click. A recent press releaseby Facebook12 describes clickbait as “headlinesthat intentionally leave out crucial information, ormislead people, forcing people to click to find outthe answer” – see (9)-(11):
(9) You’ll Never Believe Who Tripped and Fellon the Red Carpet. . . (Facebook)
(10) Here’s What Happens When You Put A FewLittle Kids In A Room With 2 Dolls In 2 Dif-ferent Colors. (Chen et al., 2015)
(11) Which Real Housewife Are You Based OnYour Birth Month (Chakraborty et al., 2016)
Clickbait shows characteristic stylistic and lexi-cal features: ‘forward-referencing’, heavy use ofdemonstrative pronouns, adverbs, interrogatives,and imperatives (Blom and Hansen, 2015), as wellas extensive use of personal pronouns (e.g. ‘you’),numbers, and celebrity references (Chen et al.,2015). These features can therefore be used withinstandard NLP methodologies: Chakraborty et al.
11www.buzzfeed.com12https://newsroom.fb.com/news/2017/05/news-feed-fyi-
new-updates-to-reduce-clickbait-headlines/
(2016) achieved 93% classification accuracy on acorpus including 7,500 English clickbait headlinesusing a set of 14 such features in a Support VectorMachine (SVM) classifier.
Returning to our example (1), however, al-though the headline does withhold informationand thereby misleads, it does not fulfil our expec-tation of a clickbait headline. Most importantly,it does not ‘force’ the reader to click to find outthe conclusions of the story, but rather deliversa misleading conclusion up front in the headlinewhich (likely purposefully) misinforms the readeron the details in order to frame the facts in a cer-tain light. Consequently, it lacks the typical ob-servable features of clickbait (e.g. forward refer-encing, demonstrative pronouns, numbers, etc.),and is therefore unlikely to be detected throughthese stylometric means. It is therefore rathermore subtle than archetypal clickbait as targetedby the methods suggested by Chen et al. (2015);Chakraborty et al. (2016).
2.2 Sensationalism
Some examples labelled as clickbait, however,have a different approach to engaging readers.Chen et al. (2015) also identify the use of affectivelanguage and action words, associated with emo-tional engagement, as in (12):
(12) The first lady of swearing! How a ten-year-old Michelle Obama lost out on a ‘bestcamper’ award because she wouldn’t stopcursing (Daily Mail, Chen et al., 2015)
While Chen et al. (2015) refer to this example as‘clickbaiting’, this arguably introduces a complex-ity and inconsistency into their definition. This ex-ample does not force the reader to click by with-holding information or using leading language, butinstead uses techniques more traditionally consid-ered as sensationalism, to dramatise an otherwisenon-dramatic story.
Though many definitions exist, sensationalismcan be considered as “the presentation of stories ina way that is intended to provoke public interest orexcitement, at the expense of accuracy” (OxfordDictionary Online). Sensationalist news is gener-ally considered negatively in the journalism liter-ature (see e.g. Wang and Cohen, 2009), as con-tent which “triggers emotion for the reader (Vette-hen et al., 2008) and treats an issue in a predomi-nantly tabloid-like way” (Kilgo et al., 2016). Al-though traditionally associated with certain topics
58
e.g. sex, scandal, crime and disaster (Grabe et al.,2001; Vettehen et al., 2008), recent work suggeststhat it is now just as likely with political stories(Kilgo et al., 2016). Examples (13)-(15) (Molek-Kozakowska, 2013, originally Daily Mail) showthe characteristic use of exaggeration, emotive lan-guage, and punctuation, and cover a range of top-ics including health, crime, and education:
(13) A sausage a day could lead to cancer: Pan-creatic cancer warning over processed meat
(14) Rise of the hugger mugger: Sociable thieveswho cuddle while they rob
(15) £100 to play truant! Schools accused of brib-ing worst pupils to stay away when Ofstedinspectors call
Molek-Kozakowska (2013) views sensational-ism as a discourse strategy used to repackage in-formation in a more exciting, extraordinary or in-teresting way, via the presence of several discourseillocutions (e.g. exposing, speculating, generalis-ing, warning, and extolling).13 Based on this view,Hoffman and Justicz (2016) propose a methodfor automatic sensationalism detection in scientificreporting, training a supervised Maximum En-tropy classifier on a corpus of 500 annotated newsrecords, with bag-of-words TF.IDF document vec-torisation14. They achieve an average accuracyof 73% over 200 validation instances. Crucially,headline and article were not treated separately, soany nuances between the two components will notbe captured in this model.
Again, though, while our example (1) does sat-isfy several aspects of the definitions of sensation-alism discussed here (e.g. warning, use of emo-tive content), it does not do so through the typi-cal stylistic traits seen in (13)-(15). The vocabu-lary is not particularly inflammatory or emotive,nor is the structure typical of sensationalism. Thisdefines the precise difficulty with the detection ofincongruence in headlines this paper aims to high-light: incongruent headlines do not necessarily ad-here to an identifiable style in their surface form,but rather must be identified in relation to the textthey represent. This presents significant problemsfor the NLP approaches so far discussed.
13As Molek-Kozakowska (2013) used only one newssource (the Daily Mail), this list may be specific to this par-ticular newspaper’s voice and/or the knowledge, subjectivityand demographic range of the annotators.
14See Hoffman and Justicz (2016, Appendices 1-4).
3 Incongruent Headlines: SuggestedMethodology
The relationship between a headline and the arti-cle with which it appears can be conceptualisedin a number of ways. We propose novel meth-ods of incongruence detection which would ex-plore varying aspects of the phenomenon, basedon existing work in other areas. It is clear fromthe cross-source examples (3)-(8) that relying onsource information alone is unlikely to be suffi-cient in determining headline incongruence, giventhat this phenomenon does not seem to be strictlylimited to one section of the press. However, inconjunction with other methodology, the sourceof the headline-article pair may well prove to bea useful feature in the broader classification pro-cess, which we will explore experimentally in fu-ture work.
Arguably, the task of headline incongruence de-tection is best approached in parts: to analysecomplex relationships between a headline and anentire news article is likely to be extremely dif-ficult, not least because of their very differentlengths and levels of linguistic complexity. Thiscould therefore be facilitated with the extractionof key quotes (Pouliquen et al., 2007) or claims(Vlachos and Riedel, 2015; Thorne and Vlachos,2017). Alternatively, one could automatically gen-erate the statistically ‘best’ headline for an arti-cle using existing title and headline generation andsummarisation methods (e.g. Banko et al. (2000);Zajic et al. (2002); Dorr et al. (2003)), and evalu-ate how far away the existing headline is from thisin terms of a number of criteria, such as lexicalchoices, syntactic structure, length, tonality (sen-timent or emotion), and so on.
It may also be interesting to explore existingwork on argument analysis: for example, Stab andGurevych (2017) explore methods for the iden-tification of arguments supported by insufficientevidence. This could be viewed as very close tothe task of the detection of incongruent headlines,where the headline represents an argument whichis not supported by claims in the text. Further,we could approach incongruence as a semanticissue and look to existing work on contradiction(De Marneffe et al., 2008), contrast (Harabagiuet al., 2006) and entailment recognition (Levyet al., 2013). In doing so, we may well discoverseveral sub-types of incongruence which may fallinto different semantic categories.
59

Finally, stance detection (Augenstein et al.,2016; Mohammad et al., 2016) has been appliedin the Fake News Challenge (FNC-1)15 as a meansof exploring whether different articles agree or dis-agree with a given headline or claim, to aid in thetask of fact checking. Stance is certainly relevantto task of incongruence detection, but we arguethat it is not sufficient for our task, as the headline-article relation may be incongruent in ways sepa-rate from (dis)agreement. Beyond the headline-article pair itself, however, stance detection couldbe used to analyse engagement and interactionwith an article on social media, given that early in-dications suggest that users are compelled to alertothers when they notice that a headline is mislead-ing.
4 Existing Data
A number of data sets are available which addressrelated tasks, but none seem directly suited to theincongruence problem. The Clickbait Challenge16
released a data set of 2495 social media posts (ti-tles, articles and social media copy), labelled on afour-point scale (not/slightly/considerably/heavilyclickbaiting) through crowdsourcing. Althoughprecise guidelines for the annotation process arenot provided, it seems that the organisers followa definition of clickbait similar to those discussedin Section 2.1, in which posts are “designed to en-tice readers into clicking an accompanying link”.As already emphasised, this differs from the con-cept of headline incongruence described here, andwe do not expect this annotation to be useful forour task; however, as a source of paired titles andarticles it may provide useful raw data.
Piotrkowicz et al. (2016) present a corpus of11,980 Guardian News headlines automaticallyannotated with news values (prominence, senti-ment, superlativeness, proximity, surprise, anduniqueness). Although this corpus does not con-tain a target class in line with headline incongru-ence, it may provide useful insight in the featureextraction process.
The Fake News Challenge (FNC-1) has releaseda corpus of headline-article pairs which are anno-tated with one of the following four stances:
Agrees: The body text agrees with the headline.Disagrees: The body text disagrees with theheadline.15http://www.fakenewschallenge.org/16http://www.clickbait-challenge.org/
Discusses: The body text discuss the same topicas the headline, but does not take a position.Unrelated: The body text discusses a differenttopic than the headline.Built on the data set described in Ferreira and
Vlachos (2016), which is collected from rumourtracking website, Emergent17, the corpus con-tains approximately 50,000 annotated headline-body pairs. A manual analysis of the first 50 bodyIDs led to a number of observations on the appli-cability of this data set to the problem of head-line incongruence. Firstly, the ‘headline’ in a pairis the claim from the original post on the web-site, and is as such not necessarily a gold-standardheadline. In addition, a single ‘headline’ can occurwith multiple article bodies, and vice versa, whichmeans that the original relation between the two isnot captured. In our task, we are particularly in-terested in how a headline is utilised to (mis)rep-resent the information in an article; it is thereforeimportant that the data we use reflects these sub-tle connections and disconnections, a feature thatmay be lost when pairing a headline (or claim)with an article body at random. The unrelatedclass in this data set is therefore unlikely to be rel-evant, as it appears to reflect a random shuffling ofheadline-body pairs. The disagree class representscontradictions between headline and body, whichis too strong a notion of incongruence for our pur-poses; disagreement represents a direct contrast,whereas incongruence can be a subtle exaggera-tion or misrepresentation of facts but need not rep-resent an opposing view. If this data set containsincongruent headline-body pairs by our definition,it appears that they are not in line with the exist-ing labels, therefore it cannot be used in its currentform.
5 Conclusions
The paper discusses incongruent headlines andhow we may approach their automatic detectionusing existing NLP methods, motivated by experi-mental evidence on reader behaviour (Ecker et al.,2014; Gabielkov et al., 2016). We emphasise thatheadline incongruence, as seen in example (1),cannot be approached through methodology ap-plied to related concepts like clickbait and sen-sationalism, as these use headline-specific stylo-metric features, and do not consider any deepersemantic relation between headline and text that
17http://www.emergent.info/
60

would be critical to the task at hand. We conse-quently suggest a number of potential approachesfor this task, based on existing work in summari-sation and headline generation, stance detection,claim and quote extraction, as well as argumentanalysis. Finally, we discuss a number of exist-ing data sets, but demonstrate that, in their currentforms, none are appropriate for the task discussedhere. This therefore motivates the need for a noveldata set in this domain, which lays the foundationfor the next stages of our future work.
ReferencesI. Augenstein, A. Vlachos, and K. Bontcheva. 2016.
Any-target stance detection on twitter with autoen-coders. In Proc. SemEval.
M. Banko, V. O. Mittal, and M. J. Witbrock. 2000.Headline generation based on statistical translation.In Proc. ACL.
A. Bell. 1984. ‘Good copy-bad news’. the syntax andsemantics of news editing. Applied Sociolinguisticspages 73–116.
J. N. Blom and K. R. Hansen. 2015. Click bait:Forward-reference as lure in online news headlines.Journal of Pragmatics 76:87–100.
A. Chakraborty, B. Paranjape, S. Kakarla, and N. Gan-guly. 2016. Stop clickbait: Detecting and pre-venting clickbaits in online news media. In Proc.IEEE/ACM ASONAM.
Y. Chen, N. Conroy, and V. Rubin. 2015. Misleadingonline content: Recognizing clickbait as false news.In Proc. ACM Multimodal Deception Detection.
C. Cotter. 2010. News talk. Investigating the Lan-guage of Journalism. CUP, Cambridge .
J. De Lange. 2008. Article Omission in Headlines andChild Language: A Processing Approach. Nether-lands Graduate School of Linguistics.
M.-C. De Marneffe, A. N. Rafferty, and C. D. Manning.2008. Finding contradictions in text. In ACL.
B. Dorr, D. Zajic, and R. Schwartz. 2003. Hedge trim-mer: A parse-and-trim approach to headline genera-tion. In Proc. HLT-NAACL.
U. K. Ecker, S. Lewandowsky, E. P. Chang, and R. Pil-lai. 2014. The effects of subtle misinformation innews headlines. Journal of Experimental Psychol-ogy: Applied 20(4):323.
W. Ferreira and A. Vlachos. 2016. Emergent: a noveldata-set for stance classification. In NAACL-HLT .
M. Gabielkov, A. Ramachandran, A. Chaintreau, andA. Legout. 2016. Social Clicks: What and Who GetsRead on Twitter? In ACM SIGMETRICS / IFIP Per-formance 2016.
M. E. Grabe, S. Zhou, and B. Barnett. 2001. Explicat-ing sensationalism in television news: Content and
the bells and whistles of form. Journal of Broad-casting & Electronic Media 45(4):635–655.
S. Harabagiu, A. Hickl, and F. Lacatusu. 2006. Nega-tion, contrast and contradiction in text processing.In AAAI.
S. J. Hoffman and V. Justicz. 2016. Automaticallyquantifying the scientific quality and sensationalismof news records mentioning pandemics: validatinga maximum entropy machine-learning model. Jour-nal of Clinical Epidemiology 75:47–55.
D. K. Kilgo, S. Harlow, V. Garcıa-Perdomo, andR. Salaverrıa. 2016. A new sensation? an interna-tional exploration of sensationalism and social me-dia recommendations in online news publications.Journalism .
O. Levy, T. Zesch, I. Dagan, and I. Gurevych. 2013.Recognizing partial textual entailment. In ACL.
I. Mardh. 1980. Headlinese: On the gram-mar of English front page headlines, volume 58.Liberlaromedel/Gleerup.
S. M. Mohammad, S. Kiritchenko, P. Sobhani, X. Zhu,and C. Cherry. 2016. Semeval-2016 task 6: Detect-ing stance in tweets. Proceedings of SemEval 16.
K. Molek-Kozakowska. 2013. Towards a pragma-linguistic framework for the study of sensational-ism in news headlines. Discourse & Communica-tion 7(2):173–197.
A. Piotrkowicz, V. Dimitrova, and K. Markert. 2016.Automatic extraction of news values from headlinetext. In Proceedings of EACL.
B. Pouliquen, R. Steinberger, and C. Best. 2007. Auto-matic detection of quotations in multilingual news.In Proc. RANLP.
C. Stab and I. Gurevych. 2017. Recognizing insuf-ficiently supported arguments in argumentative es-says. In Proc. EACL.
J. Thorne and A. Vlachos. 2017. An extensible frame-work for verification of numerical claims.
T. A. Van Dijk. 1988. News as discourse. Revisededition. Routledge (2013).
P. H. Vettehen, K. Nuijten, and A. Peeters. 2008. Ex-plaining effects of sensationalism on liking of tele-vision news stories: The role of emotional arousal.Communication Research 35(3):319–338.
A. Vlachos and S. Riedel. 2015. Identification and ver-ification of simple claims about statistical properties.In Proc. EMNLP.
T.-L. Wang and A. A. Cohen. 2009. Factors affectingviewers perceptions of sensationalism in televisionnews: A survey study in Taiwan. Issues and Studies45(2):125–157.
C. Wardle. 2017. Fake news. it’s complicated.First Draft News Retrieved from https://firstdraft-news.com/fake-news-complicated/ on 04/05/2017.
D. Zajic, B. Dorr, and R. Schwartz. 2002. Automaticheadline generation for newspaper stories. In Work-shop on Automatic Summarization.
61
Proceedings of the 2017 EMNLP Workshop on Natural Language Processing meets Journalism, pages 62–67Copenhagen, Denmark, September 7, 2017. c©2017 Association for Computational Linguistics
Unsupervised Event Clustering and Aggregation from Newswireand Web Articles
Swen RibeiroLIMSI, CNRS
Univ. Paris-SudUniversite Paris-Saclay
Olivier FerretCEA, LIST,
Gif-sur-Yvette,F-91191 France.
Xavier TannierLIMSI, CNRS
Univ. Paris-SudUniversite Paris-Saclay
Abstract
In this paper, we present an unsupervisedpipeline approach for clustering news arti-cles based on identified event instances intheir content. We leverage press agencynewswire and monolingual word align-ment techniques to build meaningful andlinguistically varied clusters of articlesfrom the Web in the perspective of abroader event type detection task. We vali-date our approach on a manually annotatedcorpus of Web articles.
1 Introduction
In the context of news production, an event is thecharacterization of a significant enough change ina space-time context to be reported as newsworthycontent. This definition fits with definitions pro-posed in other contexts such as the ACE 2005 andTAC KBP Event evaluations or work such as (Cy-bulska and Vossen, 2014; Mitamura et al., 2015),which generally view each event as “somethingthat happens at a particular place and time”, im-plying changes in the state of the world and in-volving participants. In accordance with ontolo-gies about events such as the Simple Event Model(SEM) ontology (van Hage et al., 2011), eventscan be categorized into different types, for exam-ple “elections” or “earthquakes”, gathering mul-tiple real-life instances, for example the “2017UK General Election” or the “2012 French Pres-idential Election”. These instances are reportedby journalists through varying textual mentions.Event extraction is a challenging task that has re-ceived increasing interest in the past years throughmany formulations such as event identification or
event detection. It is also an important subtask oflarger NLP applications such as document sum-marization and event schema induction. Severalapproaches have been used to tackle the differentaspects of this task, particularly in an unsupervisedfashion, from linguistic pipelines (Filatova et al.,2006; Huang et al., 2016) to topic modeling ap-proaches (Chambers and Jurafsky, 2011; Cheunget al., 2013) and more recently neural networks(Nguyen et al., 2016). While the definition andgranularity of an event varies with the task and ob-jectives at hand, most event identification systemsexploit mentions to produce type-level representa-tions.
We propose to address the unsupervised eventextraction task through two subtasks: first, un-supervised event instance extraction and second,event type extraction. This paper will focus on ourefforts regarding the first step, e.g. unsupervisedevent instance extraction. In this perspective, wepresent a method based on clustering algorithmsleveraging news data from different sources. Webelieve that this first step might act as a bridgebetween the surface forms that are mentions andthe more abstract concept of instances and types ofevents. Moreover, the context of this work is theASRAEL project, which aims at providing opera-tional tools for journalists, and this instance/typesegmentation seems relevant in the perspective offurther event-driven processing developments.
Our clustering approach considers three dimen-sions: time, space and content. A content align-ment system is adapted from Sultan et al. (2014)and a time and space-aware similarity function isproposed in order to aggregate articles about thesame event.
We work with a large collection of English news
62

Figure 1: Overview of the system.
and Web articles, where each article describes anevent: the main topic of the article is a specificevent, and other older events are mentioned in or-der to put it into perspective. Thus, we consider anevent associated with an article.
Our system’s objective is to build clusters of ar-ticles describing the same exact real-life event, e.gthe same event instance. We adopt two definitionsof the relation “same event” (strict and loose) andevaluate through these two definitions.
2 Two-step Clustering
Our approach is structured as a pipeline includ-ing a two-step clustering with an additional filter-ing step at the end. The first step leverages anhomogeneous corpus of news articles for build-ing focused and “clean” clusters corresponding toevent instances. The second step exploits thesefocused clusters for clustering documents comingfrom the Web that are more noisy but also morelikely to bring new information about the consid-ered events. Figure 1 illustrates this pipeline.
2.1 Corpora
The first clustering step (represented in blue onFigure 1) is performed on a corpus from AgenceFrance-Presse (AFP) news agency. Each news ar-ticle comes with several metadata providing addi-tional information about its time-space context ofcreation, such as its UTC time-stamp, and its con-tent, through International Press Telecommunica-tions Council (IPTC) NewsCodes. NewsCodes area standard subject taxonomy created and main-tained by the IPTC, with a focus on text.
From the 1,400+ existing NewsCodes, we se-lected 72 that can be viewed as event types1, cov-
1A user-friendly tree visualization of all the NewsCodes isavailable at http://show.newscodes.org/index.html?newscodes=subj.
ering as many event types as possible withoutoverlapping with one another, and retrieved allnews articles tagged with at least one of theseNewsCodes. This resulted in a corpus of about52,000 documents for the year 2015.
The second clustering step (in orange on Fig-ure 1) takes as input news articles crawled froma list of Web news feeds in English. We used acorpus of 1.3 million Web news articles publishedin 2015, from about 20 different Web news sites(3,700 documents/day in average) including theRSS feeds of the New-York Times, the BBC orthe Wall Street Journal.
In both corpora, we process only the title andfirst paragraph (usually one or two sentences) ofthe documents, under the assumption that they fol-low the journalistic rule of the 5Ws: the lead ofan article must provide information about what,when, where, who and why.
2.2 Approach
2.2.1 Press Agency Clustering
The first clustering step computes the similaritymatrix of the AFP news by the means of the AllPairs Similarity Search (APSS) algorithm (Ba-yardo et al., 2007) and applies to it the MarkovClustering (MCL) algorithm (van Dongen, 2000).News are represented by a bag-of-word repre-sentation including the lemmatized form of theirnouns, adjectives and verbs.
The similarity function between two documentsd1 and d2 is the following:
sim(d1, d2) =cos(d1, d2)eδ/24
where cos(d1, d2) is the cosine similarity andδ is the difference between the documents creationtimes (in hours). This time decay ensures that twosimilar but different events, occurring at differentmoments, will not be grouped together. Only simi-larities above a threshold τ have been considered2.
This first step yields small and instance-focusedclusters of press agency news articles only. Whilethey can be considered high quality content, theyare quite homogeneous and lack variety in theirwording, and could not be used for broader taskssuch as event type-level detection. An example ofoutput for this step is provided in Figure 2.
2A grid search led to τ = 0.5.
63

Hundreds dead in Nepal quake, avalanche triggered on Ever-est. A massive 7.8 magnitude earthquake killed hundreds ofpeople Saturday as it ripped through large parts of Nepal,toppling office blocks and towers in Kathmandu and trigger-ing an avalanche that hit Everest base camp.Nepal quake kills 1,200, sparks deadly Everest avalanche. Amassive earthquake killed more than 1,200 people Saturdayas it tore through large parts of Nepal, toppling office blocksand towers in Kathmandu and triggering a deadly avalancheat Everest base camp.Hundreds dead in Nepal quake, deadly avalanche on Everest.A massive 7.8 magnitude earthquake killed more than 900people Saturday as it ripped through large parts of Nepal,toppling office blocks and towers in Kathmandu and trigger-ing a deadly avalanche that hit Everest base camp.
Figure 2: 3 of 5 AFP news articles clustered to-gether. While they indeed cover the same eventinstance, there are few wording variations betweenthem, limiting their interest for broader event de-tection and assimilated tasks.
2.2.2 Web Article ExtensionIn this step, we aim to alleviate the lack of vari-ability of our AFP news article clusters by leverag-ing their high focus to aggregate Web documentsabout the same event instances.
To do so, we identify the first article publishedin each AFP cluster (using the time-stamp) and re-trieve all Web articles in the next 24 hours. This isbased on the assumption that press agencies area primary source of trustworthy information formost news feeds, so it would be rare to find men-tions of an event instance before an article was re-leased, especially in an international context. Wecall this article the “reference”.
We first perform a first “coarse-grain” ag-glomeration by performing low-threshold cosinesimilarity-based clustering between the AFP ref-erence and all Web articles for the given 24-hourtimespan. This results in smaller subsets of data tofeed the next module in the pipeline.
We then use the monolingual word alignmentsystem described in Sultan et al. (2014). This sys-tem performs a word-to-word alignment betweentwo sentences by applying a series of alignmentmodules focusing each on a specific type of lin-guistic units. The alignment process starts withn-grams of words (with n > 2) including at leastone content word. Then, named entities are con-sidered, followed by content words and finally,stopwords. While alignment of n-grams of wordsand named-entities is based only on string match-ing (exact match for n-grams, partial for namedentities as the system uses Stanford NER to re-solve acronyms and matching partial mentions),
the system also relies on contextual evidence forother linguistic units, e.g: syntactic dependenciesand textual neighborhood. Textual neighborhoodis defined as a window of the next and previous 3content words surrounding each word being con-sidered for an alignment. The system then com-putes a similarity score between each candidatepair available based on this evidence, and selectsthe highest scored pair for a given word as the cho-sen alignment. We adapted the system to betterfit our needs by extending the stopword list, firstaligning unigram exact matches and using the ab-sence of matching content words or named enti-ties as an early stopping condition of the alignmentprocess.
For each AFP cluster, we perform alignment be-tween the reference (earliest article) and each Webarticle from the subset. This allows us to build aword alignment matrix where each column con-tains the words in a document and each line showshow each word of the reference has aligned acrossall documents.
We then compute a score for each document,taking into account how many words in a docu-ment have been aligned with the reference, andhow many times a reference word has found analignment across all documents.
Figure 3 illustrates how this score is computed.We first build the binary alignment matrix Bwhere columns represent documents and rows rep-resent term alignments. If a term i (out of Maligned terms) from document j (out of N docu-ments) has been aligned with a term from the ref-erence, then Bi,j = 1, otherwise Bi,j = 0. Wethen compute a weight for each alignment, lead-ing to a vector Align such as for each term i:
Aligni =N∑j=0
Bi,j
The absolute alignment score of each docu-ment j is then:
sj =M∑i=0
Wi,j
where W = B × Align. Finally, we normalizethese by the scores that the reference itself wouldhave obtained.
Once we have scored the documents of a clus-ter, we sort them and find the greatest gap between
64

Figure 3: Document scoring.
two consecutive scores (scree test). Only the best-ranked documents before this elbow value are keptas event instance driven document clusters.
3 Evaluation and Results
In our evaluation, we focus on assessing the qual-ity of the clusters produced at the end of thealignment filtering step. We performed our ex-periments on the AFP and Web data for thewhole year 2015. Considering that the AFP corpussometimes develops more “France-” and “Europe-centric” content while our Web corpus is more“Anglo-Saxon-centered”, we need to ensure thatwe evaluate on event instances that are coveredin both corpora, which is the case in the resultingoutputs of the coarse-grain agglomeration phase,by construction. We therefore selected 12 of these“pre-clusters” of event instances, based on the no-table events of the year 2015 as per Wikipedia3.This selection is described in Table 1. The Webarticles in these intermediary outputs are sorted bydescending order of their cosine similarity to theAFP reference. This ordering will serve as a base-line to evaluate the capacity of the alignment mod-ule to produce more relevant clusters, the docu-ments processed at both steps being the same.
We ran AFP clustering and “coarse-grain” ag-glomeration, identified the resulting intermediaryoutputs that corresponded to our 12 selected eventinstances (content and time-stamp wise). We thenran the alignment phase, picked the 50 best-rankedWeb articles in each cluster obtained from the se-lected outputs and tagged them manually with arelevance attribute as follows:• 0: The document is not related to the refer-
3https://en.wikipedia.org/wiki/2015
France seizes passports ofwould-be jihadists. Febru-ary 23rd
Protesters clash with policein St Louis, Mo., USA. Au-gust 20th
Cyclone Pam hit Vanuatuarchipelago. March 15th
Facebook vows to combatracist content on Germanplatform. September 14th
UK General Election cam-paign start. March 30th
Wildfires rampage acrossnorthern California.September 14th
Magnitude 7.9 earthquakehits Nepal. April 25th
Paris Attacks. November13th
Pakistan police kill head ofanti-Shiite group. July 7th
Swedish police arrest manfor plotting terror attack.November 20th
ISIS Truck bombing inBaghdad market. August13th
Typhoon Melor causesheavy flooding in Philip-pines. December 16th
Table 1: The 12 events of our gold standard.
ence event considered;• 1: The document has a loose relation to the
reference event;• 2: The document has a strict relation to the
reference event.We define strict and loose relation as follows: astrict relation means that the document is focusedon the event and differ from the reference newsarticle only by its wording or additional/missinginformation; a loose relation designates a docu-ment that is not focused on the event, but providesa news that is so specific to this event that its men-tion is core to the overall information provided.Examples of strict and loose relations are providedin Figure 4.
This distinction was introduced when facingtwo particular types of documents: death toll up-dates and responsibility claims for terrorist at-tacks. In both cases, the causal events (attack ornatural disaster) are first released as they are in-
65
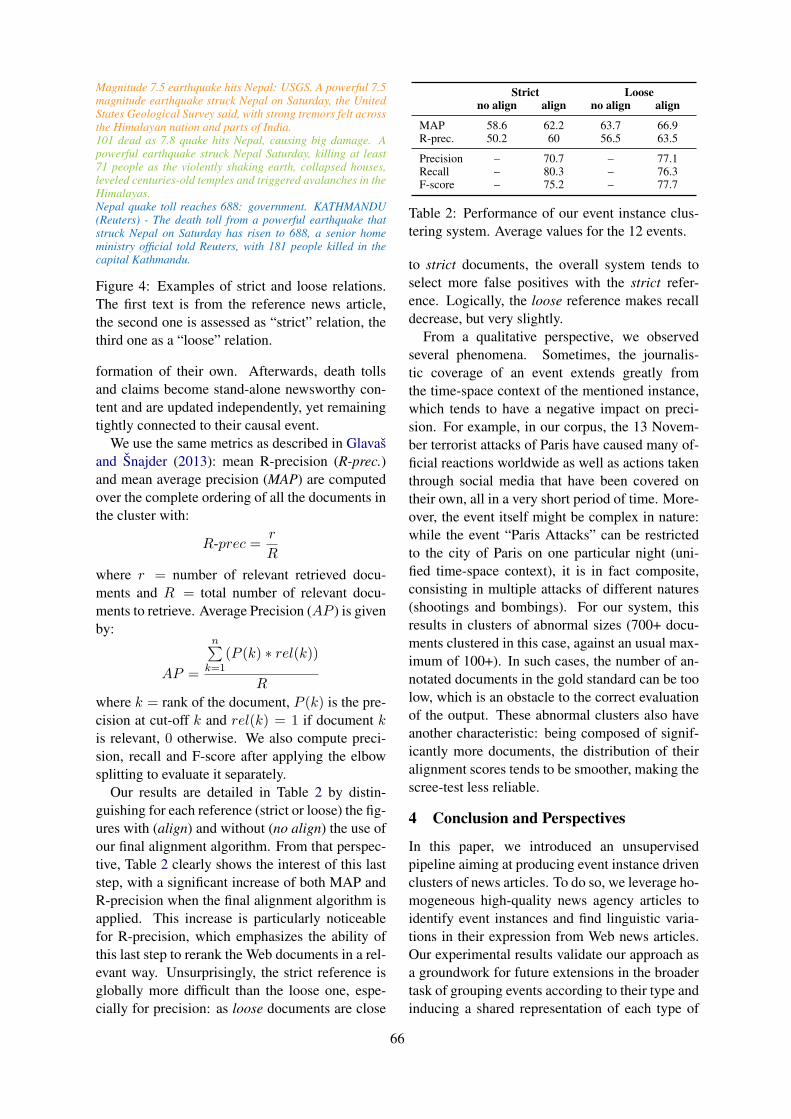
Magnitude 7.5 earthquake hits Nepal: USGS. A powerful 7.5magnitude earthquake struck Nepal on Saturday, the UnitedStates Geological Survey said, with strong tremors felt acrossthe Himalayan nation and parts of India.101 dead as 7.8 quake hits Nepal, causing big damage. Apowerful earthquake struck Nepal Saturday, killing at least71 people as the violently shaking earth, collapsed houses,leveled centuries-old temples and triggered avalanches in theHimalayas.Nepal quake toll reaches 688: government. KATHMANDU(Reuters) - The death toll from a powerful earthquake thatstruck Nepal on Saturday has risen to 688, a senior homeministry official told Reuters, with 181 people killed in thecapital Kathmandu.
Figure 4: Examples of strict and loose relations.The first text is from the reference news article,the second one is assessed as “strict” relation, thethird one as a “loose” relation.
formation of their own. Afterwards, death tollsand claims become stand-alone newsworthy con-tent and are updated independently, yet remainingtightly connected to their causal event.
We use the same metrics as described in Glavasand Snajder (2013): mean R-precision (R-prec.)and mean average precision (MAP) are computedover the complete ordering of all the documents inthe cluster with:
R-prec =r
R
where r = number of relevant retrieved docu-ments and R = total number of relevant docu-ments to retrieve. Average Precision (AP ) is givenby:
AP =
n∑k=1
(P (k) ∗ rel(k))R
where k = rank of the document, P (k) is the pre-cision at cut-off k and rel(k) = 1 if document kis relevant, 0 otherwise. We also compute preci-sion, recall and F-score after applying the elbowsplitting to evaluate it separately.
Our results are detailed in Table 2 by distin-guishing for each reference (strict or loose) the fig-ures with (align) and without (no align) the use ofour final alignment algorithm. From that perspec-tive, Table 2 clearly shows the interest of this laststep, with a significant increase of both MAP andR-precision when the final alignment algorithm isapplied. This increase is particularly noticeablefor R-precision, which emphasizes the ability ofthis last step to rerank the Web documents in a rel-evant way. Unsurprisingly, the strict reference isglobally more difficult than the loose one, espe-cially for precision: as loose documents are close
Strict Looseno align align no align align
MAP 58.6 62.2 63.7 66.9R-prec. 50.2 60 56.5 63.5
Precision – 70.7 – 77.1Recall – 80.3 – 76.3F-score – 75.2 – 77.7
Table 2: Performance of our event instance clus-tering system. Average values for the 12 events.
to strict documents, the overall system tends toselect more false positives with the strict refer-ence. Logically, the loose reference makes recalldecrease, but very slightly.
From a qualitative perspective, we observedseveral phenomena. Sometimes, the journalis-tic coverage of an event extends greatly fromthe time-space context of the mentioned instance,which tends to have a negative impact on preci-sion. For example, in our corpus, the 13 Novem-ber terrorist attacks of Paris have caused many of-ficial reactions worldwide as well as actions takenthrough social media that have been covered ontheir own, all in a very short period of time. More-over, the event itself might be complex in nature:while the event “Paris Attacks” can be restrictedto the city of Paris on one particular night (uni-fied time-space context), it is in fact composite,consisting in multiple attacks of different natures(shootings and bombings). For our system, thisresults in clusters of abnormal sizes (700+ docu-ments clustered in this case, against an usual max-imum of 100+). In such cases, the number of an-notated documents in the gold standard can be toolow, which is an obstacle to the correct evaluationof the output. These abnormal clusters also haveanother characteristic: being composed of signif-icantly more documents, the distribution of theiralignment scores tends to be smoother, making thescree-test less reliable.
4 Conclusion and Perspectives
In this paper, we introduced an unsupervisedpipeline aiming at producing event instance drivenclusters of news articles. To do so, we leverage ho-mogeneous high-quality news agency articles toidentify event instances and find linguistic varia-tions in their expression from Web news articles.Our experimental results validate our approach asa groundwork for future extensions in the broadertask of grouping events according to their type andinducing a shared representation of each type of
66
event by identifying and generalizing the partici-pants of events.
5 Acknowledgment
This work has been partially funded by French Na-tional Research Agency (ANR) under project AS-RAEL (ANR-15-CE23-0018). We would like tothank the French News Agency (AFP) for provid-ing us with the corpus.
ReferencesRoberto J. Bayardo, Yiming Ma, and Ramakrishnan
Srikant. 2007. Scaling up all pairs similarity search.In 16th International World Wide Web Conference(WWW’07). pages 131–140.
Nathanael Chambers and Dan Jurafsky. 2011.Template-based information extraction withoutthe templates. In Proceedings of the 49th AnnualMeeting of the Association for ComputationalLinguistics (ACL 2011). Portland, Oregon, USA,pages 976–986.
Jackie Chi Kit Cheung, Hoifung Poon, and Lucy Van-derwenden. 2013. Probabilistic frame induction. InProceedings of NAACL-HLT 2013. Atlanta, Georgia,USA, pages 837–846.
Agata Cybulska and Piek Vossen. 2014. Using aSledgehammer to Crack a Nut? Lexical Diversityand Event Coreference Resolution. In Ninth In-ternational Conference on Language Resources andEvaluation (LREC’14). Reykjavik, Iceland.
Elena Filatova, Vasileios Hatzivassiloglou, and Kath-leen McKeown. 2006. Automatic creation of do-main templates. In Proceedings of the COL-ING/ACL 2006 Main Conference Poster Sessions.pages 207–214.
Goran Glavas and Jan Snajder. 2013. Recognizingidentical events with graph kernels. In 51st An-nual Meeting of the Association for ComputationalLinguistics (ACL 2013). Sofia, Bulgaria, pages 797–803.
Lifu Huang, Taylor Cassidy, Feng Xiaocheng, Heng Ji,Clare R. Voss, Jiawei Han, and Avirup Sil. 2016.Liberal event extraction and event schema induc-tion. In Proceedings of the 54th Annual Meeting ofthe Association for Computational Linguistics (ACL2016). Berlin, Germany, pages 258–268.
Teruko Mitamura, Yukari Yamakawa, Susan Holm,Zhiyi Song, Ann Bies, Seth Kulick, and StephanieStrassel. 2015. Event Nugget Annotation: Processesand Issues. In 3rd Workshop on EVENTS: Defi-nition, Detection, Coreference, and Representation.Denver, Colorado, pages 66–76.
Thien Huu Nguyen, Kyunghyun Cho, and Ralph Grish-man. 2016. Joint event extraction via recurrent neu-ral networks. In Proceedings of NAACL-HLT 2016.San Diego, California, USA, pages 300–309.
Md Arafat Sultan, Steven Bethard, and Tamara Sum-mer. 2014. Back to Basics for Monolingual Align-ment: Exploiting Word Similarity and ContextualEvidence. Transactions of the Association for Com-putational Linguistics (TACL) 2:219–230.
Stijn van Dongen. 2000. Graph Clustering by FlowSimulation. Ph.D. thesis, University of Utrecht.
Willem Robert van Hage, Veronique Malaise, RoxaneSegers, Laura Hollink, and Guus Schreiber. 2011.Design and use of the simple event model (sem).Web Semantics: Science, Services and Agents on theWorld Wide Web 9(2):128–136.
67

Proceedings of the 2017 EMNLP Workshop on Natural Language Processing meets Journalism, pages 68–73Copenhagen, Denmark, September 7, 2017. c©2017 Association for Computational Linguistics
Semantic Storytelling, Cross-lingual Event Detection and otherSemantic Services for a Newsroom Content Curation Dashboard
Julian Moreno-Schneider, Ankit Srivastava,Peter Bourgonje, David Wabnitz∗, Georg Rehm
DFKI GmbH, Language Technology Lab, Alt-Moabit 91c, 10559 Berlin, Germany∗Kreuzwerker GmbH, Ritterstraße 12-14, 10969 Berlin, Germany
Corresponding author: [email protected]
Abstract
We present a prototypical content curationdashboard, to be used in the newsroom,and several of its underlying semantic con-tent analysis components (such as namedentity recognition, entity linking, sum-marisation and temporal expression analy-sis). The idea is to enable journalists (a) toprocess incoming content (agency reports,twitter feeds, reports, blog posts, socialmedia etc.) and (b) to create new articlesmore easily and more efficiently. The pro-totype system also allows the automaticannotation of events in incoming contentfor the purpose of supporting journalistsin identifying important, relevant or mean-ingful events and also to adapt the contentcurrently in production accordingly in asemi-automatic way. One of our long-termgoals is to support journalists building upentire storylines with automatic means. Inthe present prototype they are generated ina backend service using clustering meth-ods that operate on the extracted events.
1 Introduction
Journalists write and distribute news articles basedon information collected from different sources(news agencies, media streams, other news arti-cles etc.). In order to produce a high-quality piece,a fair bit of research is needed on the topic anddomain at hand. Facts have to be checked, re-quiring at least basic domain knowledge, different
view points considered and information from mul-tiple sources combined in a sensible way. In short,much research is needed to arrive at a piece of con-tent that combines new and surprising informationwith a decent context of the event reported upon.While the amount of available, especially digitalinformation is increasing on a daily basis, the jour-nalist’s ability to read all this information is de-creasing in the little time available. This calls fortools that support journalists in processing largeamounts of incoming information.
There are differences in journalistic reporting,depending on the event being covered. Newsabout a event with global relevance, such as a war,differs from news about the inauguration of a lo-cal cultural centre. When looking at the availablesource material, the amount of background infor-mation, also its diversity, differs significantly inboth cases. Coverage for the global event dependson a much larger amount of readily available infor-mation while the local event coverage depends onsmaller amounts of data that may need a bit of ef-fort in tracking them down (the name of local newssources for example). To address this difference inresearch requirements we describe a prototypicalapproach for cross-lingual semantic analysis, es-pecially event detection, ultimately aimed at sup-porting journalists through semantic storytelling,based on two data sets.
Section 2 briefly describes the content curationdashboard, while Section 3 focuses upon semanticstorytelling. Section 4 describes the use cases andsketches the results of initial experiments on newsdata. Section 5 concludes the paper.
68
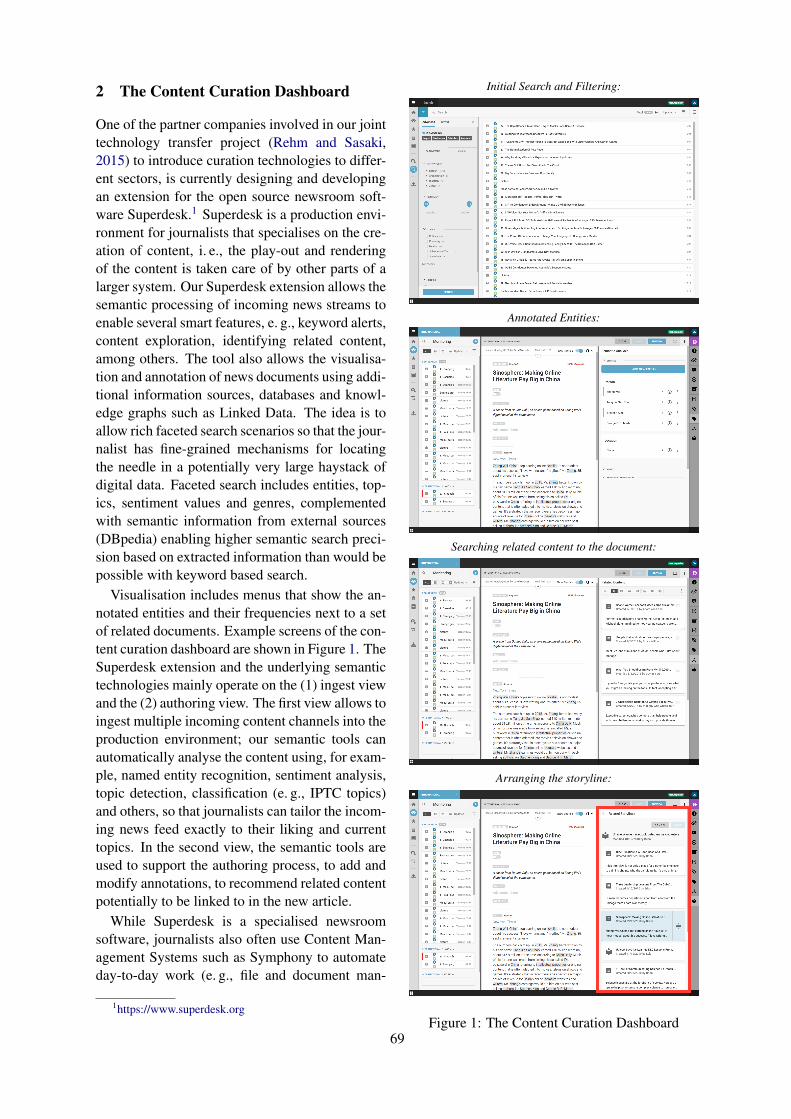
2 The Content Curation Dashboard
One of the partner companies involved in our jointtechnology transfer project (Rehm and Sasaki,2015) to introduce curation technologies to differ-ent sectors, is currently designing and developingan extension for the open source newsroom soft-ware Superdesk.1 Superdesk is a production envi-ronment for journalists that specialises on the cre-ation of content, i. e., the play-out and renderingof the content is taken care of by other parts of alarger system. Our Superdesk extension allows thesemantic processing of incoming news streams toenable several smart features, e. g., keyword alerts,content exploration, identifying related content,among others. The tool also allows the visualisa-tion and annotation of news documents using addi-tional information sources, databases and knowl-edge graphs such as Linked Data. The idea is toallow rich faceted search scenarios so that the jour-nalist has fine-grained mechanisms for locatingthe needle in a potentially very large haystack ofdigital data. Faceted search includes entities, top-ics, sentiment values and genres, complementedwith semantic information from external sources(DBpedia) enabling higher semantic search preci-sion based on extracted information than would bepossible with keyword based search.
Visualisation includes menus that show the an-notated entities and their frequencies next to a setof related documents. Example screens of the con-tent curation dashboard are shown in Figure 1. TheSuperdesk extension and the underlying semantictechnologies mainly operate on the (1) ingest viewand the (2) authoring view. The first view allows toingest multiple incoming content channels into theproduction environment; our semantic tools canautomatically analyse the content using, for exam-ple, named entity recognition, sentiment analysis,topic detection, classification (e. g., IPTC topics)and others, so that journalists can tailor the incom-ing news feed exactly to their liking and currenttopics. In the second view, the semantic tools areused to support the authoring process, to add andmodify annotations, to recommend related contentpotentially to be linked to in the new article.
While Superdesk is a specialised newsroomsoftware, journalists also often use Content Man-agement Systems such as Symphony to automateday-to-day work (e. g., file and document man-
1https://www.superdesk.org
Initial Search and Filtering:
Annotated Entities:
Searching related content to the document:
Arranging the storyline:
Figure 1: The Content Curation Dashboard69
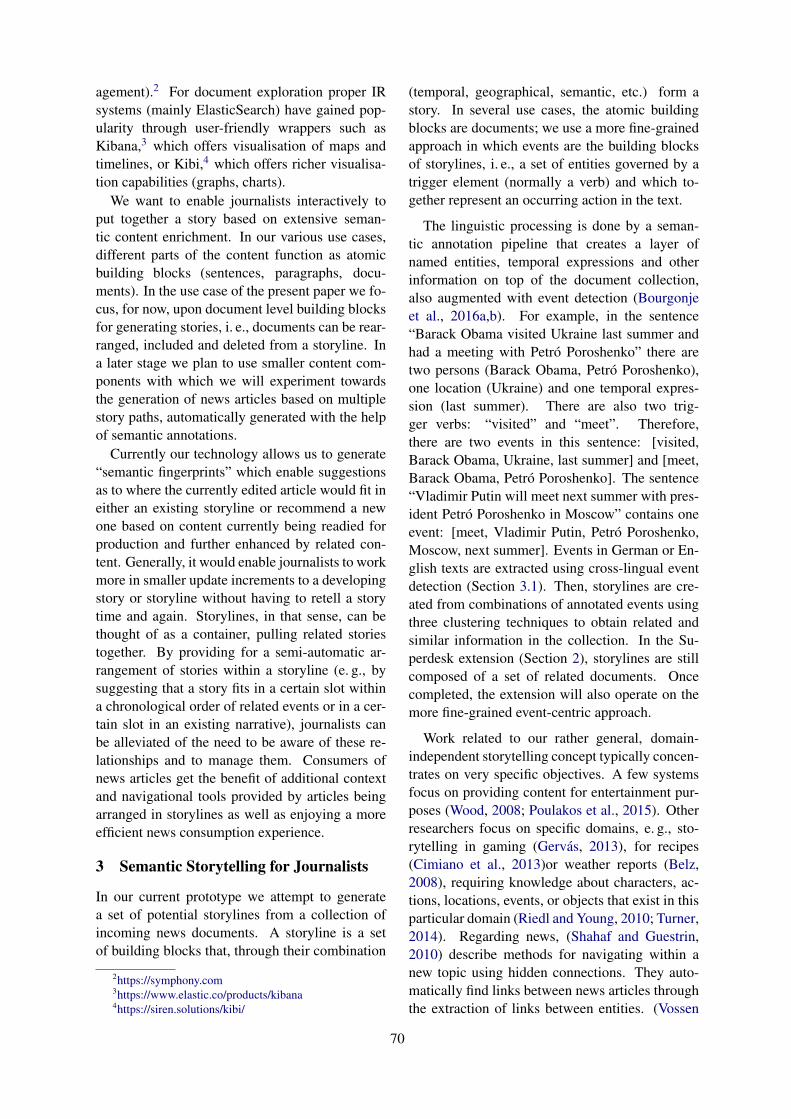
agement).2 For document exploration proper IRsystems (mainly ElasticSearch) have gained pop-ularity through user-friendly wrappers such asKibana,3 which offers visualisation of maps andtimelines, or Kibi,4 which offers richer visualisa-tion capabilities (graphs, charts).
We want to enable journalists interactively toput together a story based on extensive seman-tic content enrichment. In our various use cases,different parts of the content function as atomicbuilding blocks (sentences, paragraphs, docu-ments). In the use case of the present paper we fo-cus, for now, upon document level building blocksfor generating stories, i. e., documents can be rear-ranged, included and deleted from a storyline. Ina later stage we plan to use smaller content com-ponents with which we will experiment towardsthe generation of news articles based on multiplestory paths, automatically generated with the helpof semantic annotations.
Currently our technology allows us to generate“semantic fingerprints” which enable suggestionsas to where the currently edited article would fit ineither an existing storyline or recommend a newone based on content currently being readied forproduction and further enhanced by related con-tent. Generally, it would enable journalists to workmore in smaller update increments to a developingstory or storyline without having to retell a storytime and again. Storylines, in that sense, can bethought of as a container, pulling related storiestogether. By providing for a semi-automatic ar-rangement of stories within a storyline (e. g., bysuggesting that a story fits in a certain slot withina chronological order of related events or in a cer-tain slot in an existing narrative), journalists canbe alleviated of the need to be aware of these re-lationships and to manage them. Consumers ofnews articles get the benefit of additional contextand navigational tools provided by articles beingarranged in storylines as well as enjoying a moreefficient news consumption experience.
3 Semantic Storytelling for Journalists
In our current prototype we attempt to generatea set of potential storylines from a collection ofincoming news documents. A storyline is a setof building blocks that, through their combination
2https://symphony.com3https://www.elastic.co/products/kibana4https://siren.solutions/kibi/
(temporal, geographical, semantic, etc.) form astory. In several use cases, the atomic buildingblocks are documents; we use a more fine-grainedapproach in which events are the building blocksof storylines, i. e., a set of entities governed by atrigger element (normally a verb) and which to-gether represent an occurring action in the text.
The linguistic processing is done by a seman-tic annotation pipeline that creates a layer ofnamed entities, temporal expressions and otherinformation on top of the document collection,also augmented with event detection (Bourgonjeet al., 2016a,b). For example, in the sentence“Barack Obama visited Ukraine last summer andhad a meeting with Petro Poroshenko” there aretwo persons (Barack Obama, Petro Poroshenko),one location (Ukraine) and one temporal expres-sion (last summer). There are also two trig-ger verbs: “visited” and “meet”. Therefore,there are two events in this sentence: [visited,Barack Obama, Ukraine, last summer] and [meet,Barack Obama, Petro Poroshenko]. The sentence“Vladimir Putin will meet next summer with pres-ident Petro Poroshenko in Moscow” contains oneevent: [meet, Vladimir Putin, Petro Poroshenko,Moscow, next summer]. Events in German or En-glish texts are extracted using cross-lingual eventdetection (Section 3.1). Then, storylines are cre-ated from combinations of annotated events usingthree clustering techniques to obtain related andsimilar information in the collection. In the Su-perdesk extension (Section 2), storylines are stillcomposed of a set of related documents. Oncecompleted, the extension will also operate on themore fine-grained event-centric approach.
Work related to our rather general, domain-independent storytelling concept typically concen-trates on very specific objectives. A few systemsfocus on providing content for entertainment pur-poses (Wood, 2008; Poulakos et al., 2015). Otherresearchers focus on specific domains, e. g., sto-rytelling in gaming (Gervas, 2013), for recipes(Cimiano et al., 2013)or weather reports (Belz,2008), requiring knowledge about characters, ac-tions, locations, events, or objects that exist in thisparticular domain (Riedl and Young, 2010; Turner,2014). Regarding news, (Shahaf and Guestrin,2010) describe methods for navigating within anew topic using hidden connections. They auto-matically find links between news articles throughthe extraction of links between entities. (Vossen
70

et al., 2015) handle news streams through a for-mal model for representing storylines. They alsodescribe a first implementation and visualisationthat helps inspecting the generated structures.
3.1 Cross-lingual Event DetectionWe implemented a cross-lingual event detec-tion system, i. e., we automatically translatenon-English documents to English using Moses(Koehn et al., 2007) and detect events in thetranslated documents using a state-of-the-art eventextraction system based on (Yang and Mitchell,2016), trained on the English section of ACE 2005(Doddington et al., 2004). The cross-lingual de-tection of events encompasses a pipeline that endsup with a list of annotated events in every docu-ment (Rehm et al., 2017b).
3.2 Semantic StorytellingExtracted events themselves are not useful to ajournalist who works on a set of documents. Theyhave to be analysed further, summarised, rear-ranged and then presented in a way that speedsup (human) access and understanding. In a previ-ous approach (Schneider et al., 2016) we focusedupon template-filling, using the results of relationextraction to fill (biography) templates to presentthese as content pieces to the knowledge worker.In the present paper, events serve the same pur-pose, delivering content pieces for a news article.
These general clusters of events can providethe logical text structure of a new journalisticpiece. We can also cluster documents based onthe temporal dimension grouping together eventsthat happened in the same period of time (e. g., awar or an award ceremony), or based on locations,using latitude and longitude coordinates. Anotheroption is traditional semantic clustering, obtainingsets of documents that talk about the same eventsand entities. To get semantically related events, wecluster documents based on the entities that appearin the events (entity frequency). Our interpretationof semantically related events are events that shareentities as their participants (subject and object).The cluster information for the two previous ex-amples is shown in Table 1. Once the documentsare clustered, their events are grouped and rankedby frequency. In the previous example there werethree events, one document with two events andone document with one event: d1 = {ev1, ev2}and d2 = {ev3}. If both documents are in thesame cluster, and considering that we use the clus-
ters as storylines, the resulting set of events in thisstoryline will be {ev1, ev2, ev3}.
3.3 VisualisationTo get a better understanding of the data set, theanalysis results, the extracted events and to pre-pare attaching the semantic storytelling back-endto the newsroom content curation dashboard, weimplemented an experimental visualisation proto-type (Figure 2). This prototype provides access tothe full set of semantic analysis information andcan be used interactively to explore and evaluatethe system. The map shows locations involved inextracted events with highlighted annotations. Theslider below the map can be used to filter eventsby time. Additional details and case studies canbe found in (Rehm et al., 2017a; Schneider et al.,2017). We will explore if we can integrate part ofthis prototype tool into the Superdesk extension.
Figure 2: The experimental visualisation tool
4 Evaluation
We performed a qualitative evaluation of severalgenerated storylines (clusters).5 We apply the sto-rytelling generation approach in two journalisticuse cases: domain-specific web-crawled globalnews and general domain regional news. Whilethe basic steps in both cases are the same (collect-ing relevant information, checking facts, writingan article, etc.), there are differences that makethese two cases special: the “global news” articlesare in English and were collected online while the“regional news” articles are in German, distributedby a news agency, so language usage and also reg-ister/style is different. We applied several cluster-ing algorithms to both data sets using fixed andfree cluster sizes; EM provides a rather balanceddistribution along clusters.
5We would have performed the evaluation with the Su-perdesk extension but are still in the process of fully integrat-ing the current prototype.
71

Obama Petro Summer Putin Moscow Ukraine
Document d1 1 1 1 0 0 1
Document d2 0 1 1 1 1 0
Table 1: Using the frequencies of extracted events as features for a clustering algorithm
4.1 Global News: Obama’s Trips
For the global news case we used a data set thatconsists of news articles on the trips of BarackObama (487 files, 24,387 sentences, 897,630 to-kens).6 All documents are English online news,which is why boilerplate cleaning was applied.7.The storytelling backend annotated a total of61,718 entity mentions and 6,752 event triggers.After clustering using EM and the 50 most fre-quent entities as features, we obtain five clusters,i. e., five storylines. The number of documentscontained in each storyline is: 4, 4, 19, 19, 16.The number of events included in each cluster is:472, 1027, 2525, 3785, 2638. In the first clus-ter, there are three documents talking about tripsto Asia (China, Vietnam, Istanbul) and only oneto Germany; the documents in the second clus-ter are grouped together because of remainingHTML tags after the boilerplate cleaning; the thirdcluster is semantically more diverse and containsdocuments talking about trips to South America(Cuba, Argentina, Colombia) and Asia (Beijing,Bangkok, Philippines), but there are some unre-lated documents talking about wars (Syria, Sec-ond World War) and trips to the UK (London);the fourth cluster contains mainly documents talk-ing about trips to Europe to the G20 Summit;the last cluster groups documents mentioning dif-ferent places (Brazil, Egypt, Afghanistan, Japan,etc). Considering the topic diversity, this approachseems to be an interesting initial point for the au-tomatic generation of semantic content for storiesin large collections with topic heterogeneity.
4.2 Regional News
For the second use case we analyse a German gen-eral domain regional news collection (1,037 arti-cles, 716,885 words, avg. number of words 691.3),provided by one of our project partner companies.The storytelling system, working on the automat-
6Based on a list of links to news articles inhttps://en.wikipedia.org/wiki/List of internationalpresidential trips made by Barack Obama
7https://github.com/kohlschutter/boilerpipe
ically translated English documents, annotated atotal of 61,054 entity mentions and 2,571 eventtriggers. The discrepancy in the number of eventsbetween the two data sets can be attributed to dif-ferent writing styles as well as the fact that the lat-ter was translated automatically. After the clus-tering process using EM and the 50 most frequententities as features, we obtain five storylines (with34, 17, 113, 25, 35 documents, and 4167, 2529,11885, 2930, 3284 events, respectively). Aftermanually evaluating the documents and events wecan summarise that the automatic translation ofthe documents, performed with an MT system thathad not been domain-adapted, has had a negativeimpact on the performance of the event extractionsystem and, therefore, the clustering results.
5 Conclusions and Future Work
We present a system based on three main compo-nents: (1) a cross-lingual event detection module;(2) a storyline generation component that can de-termine related events; (3) a newsroom content cu-ration dashboard prototype that helps journalistsin the process of analysing large document col-lections. Regarding the manual evaluation of thegenerated storylines, we observe that the storylinegenerator clearly unveils inherent semantic relat-edness as a basic property of the documents in theglobal news data set, while demonstrating docu-ments in the local news data set to be rather unre-lated. Further improvement of the storyline gen-eration and event detection system is foreseen forfuture work, especially regarding deeper and morefine-grained filtering of the extracted events in or-der to minimise the number of events included in astoryline. A future version of the newsroom cura-tion dashboard will be able to suggest, to the jour-nalist, event-based storylines. We will also includeadditional visualisation, as well as more linkeddata sources. In the semantic backend, additionalprocessing modules will be included, especiallycoreference resolution to improve the coverage ofextracted entity mentions.
72

AcknowledgmentsThe authors wish to thank the anonymous reviewers fortheir helpful feedback. The project “Digitale Kuratierung-stechnologien” is supported by the German Federal Min-istry of Education and Research, Wachstumskern-Potenzial(no. 03WKP45). http://www.digitale-kuratierung.de.
ReferencesAnja Belz. 2008. Automatic Generation of Weather
Forecast Texts Using Comprehensive ProbabilisticGeneration-space Models. Natural Language Engi-neering 14(4):431–455.
Peter Bourgonje, Julian Moreno-Schneider, JanNehring, Georg Rehm, Felix Sasaki, and AnkitSrivastava. 2016a. Towards a Platform for CurationTechnologies: Enriching Text Collections witha Semantic-Web Layer. In H. Sack, G. Rizzo,N. Steinmetz, D. Mladenic, S. Auer, and C. Lange,editors, The Semantic Web. Springer, number 9989in LNCS, pages 65–68.
Peter Bourgonje, Julian Moreno Schneider, GeorgRehm, and Felix Sasaki. 2016b. Processing Doc-ument Collections to Automatically Extract LinkedData: Semantic Storytelling Technologies for SmartCuration Workflows. In A. Gangemi and C. Gar-dent, editors, Proc. of the 2nd Int. Workshop on NLGand the Semantic Web (WebNLG 2016). ACL, Edin-burgh, UK, pages 13–16.
Philipp Cimiano, Janna Luker, David Nagel, andChristina Unger. 2013. Exploiting Ontology Lexicafor Generating Natural Language Texts from RDFData. In Proc. of the 14th European Workshop onNLG. ACL, Sofia, Bulgaria, pages 10–19.
George Doddington, Alexis Mitchell, Mark Przybocki,Lance Ramshaw, Stephanie Strassel, and RalphWeischedel. 2004. The automatic content extraction(ace) program – tasks, data, and evaluation. In Proc.of LREC 2004. ELRA, Lisbon, Portugal.
Pablo Gervas. 2013. Stories from Games: Content andFocalization Selection in Narrative Composition. InI Spanish Symposium on Entertainment Computing.Universidad Complutense de Madrid, Spain.
P. Koehn, H. Hoang, A. Birch, C. Callison-Burch,R. Zens, M. Federico, N. Bertoldi, C. Dyer,B. Cowan, W. Shen, C. Moran, O. Bojar, A. Con-stantin, and E. Herbst. 2007. Moses: Open SourceToolkit for Statistical Machine Translation. ACL,Prague, CZ, pages 177–180.
Steven Poulakos, Mubbasir Kapadia, Andrea Schupfer,Fabio Zund, Robert Sumner, and Markus Gross.2015. Towards an Accessible Interface for StoryWorld Building. In AAAI Conf. on AI and Interac-tive Digital Entertainment. pages 42–48.
Georg Rehm, Jing He, Julian Moreno Schneider, JanNehring, and Joachim Quantz. 2017a. Designing
User Interfaces for Curation Technologies. In S. Ya-mamoto, editor, Human Interface and the Manage-ment of Information: Information, Knowledge andInteraction Design, 19th Int. Conf., HCI Int. 2017.Springer, Vancouver, CA, number 10273 in LNCS,pages 388–406. Part I.
Georg Rehm and Felix Sasaki. 2015. DigitaleKuratierungstechnologien – Verfahren fur die ef-fiziente Verarbeitung, Erstellung und Verteilungqualitativ hochwertiger Medieninhalte. In Proc. ofGSCL 2015. pages 138–139.
Georg Rehm, Julian Moreno Schneider, Peter Bour-gonje, Ankit Srivastava, Jan Nehring, Armin Berger,Luca Konig, Soren Rauchle, and Jens Gerth. 2017b.Event Detection and Semantic Storytelling: Gener-ating a Travelogue from a large Collection of Per-sonal Letters. In T. Caselli, B. Miller, M. van Erp,P. Vossen, M. Palmer, E. Hovy, and T. Mitamura,editors, Proc. of the Events and Stories in the NewsWorkshop. ACL, Vancouver, CA.
Mark Owen Riedl and Robert Michael Young. 2010.Narrative Planning: Balancing Plot and Character.J. Artif. Int. Res. 39(1):217–268.
Julian Moreno Schneider, Peter Bourgonje, JanNehring, Georg Rehm, Felix Sasaki, and Ankit Sri-vastava. 2016. Towards Semantic Story Telling withDigital Curation Technologies. In L. Birnbaum,O. Popescu, and C. Strapparava, editors, Proc. ofNLP meets Journalism (NLPMJ 2016). NY.
Julian Moreno Schneider, Peter Bourgonje, and GeorgRehm. 2017. Towards User Interfaces for Seman-tic Storytelling. In S. Yamamoto, editor, HumanInterface and the Management of Information: In-formation, Knowledge and Interaction Design, 19thInt. Conf, HCI Int. 2017. Springer, Vancouver, CA,number 10274 in LNCS, pages 403–421. Part II.
Dafna Shahaf and Carlos Guestrin. 2010. Connectingthe dots between news articles. In Proc. of 16thACM SIGKDD Int. Conf. on Knowledge Discoveryand Data Mining. ACM, New York, NY, USA, KDD’10, pages 623–632.
S.R. Turner. 2014. The Creative Process: A ComputerModel of Storytelling and Creativity. Taylor & Fran-cis.
Piek Vossen, Tommaso Caselli, and Yiota Kont-zopoulou. 2015. Storylines for Structuring Mas-sive Streams of News. In Proc. of 1st Workshopon Computing News StoryLines (CNewS 2015), co-located with ACL 2015 and ACL-IJCNLP 2015. Be-jing, China.
Mark D. Wood. 2008. Exploiting Semantics for Per-sonalized Story Creation. In Proc. of Int. Conf. onSemantic Computing. Washington, DC, ICSC ’08,pages 402–409.
Bishan Yang and Tom Mitchell. 2016. Joint extractionof events and entities within a document context. InProc. of NAACL 2016. ACL, pages 289–299.
73

Proceedings of the 2017 EMNLP Workshop on Natural Language Processing meets Journalism, pages 74–79Copenhagen, Denmark, September 7, 2017. c©2017 Association for Computational Linguistics
Deception Detection in News Reports in the Russian Language:
Lexics and Discourse
Dina Pisarevskaya [email protected]
Abstract
Different language markers can be
used to reveal the differences between
structures of truthful and deceptive
(fake) news. Two experiments are
held: the first one is based on lexics
level markers, the second one on dis-
course level is based on rhetorical rela-
tions categories (frequencies). Corpus
consists of 174 truthful and deceptive
news stories in Russian. Support Vec-
tor Machines and Random Forest
Classifier were used for text classifica-
tion. The best results for lexical mark-
ers we got by using Support Vector
Ma-chines with rbf kernel (f-measure
0.65). The model could be developed
and be used as a preliminary filter for
fake news detection.
1 Introduction
The research field of deception detection in news
reports and automated fact checking arose in nat-
ural language processing (NLP) rather recently. It
can be applied for linguistic expertise, fact check-
ing tools for newsrooms and news aggregators,
tools for users.
We get information from different sources and
should evaluate the reliability to avoid rumours,
hoaxes and deceptive (fake) information in news
reports. The word 'post-truth' was chosen as the
Oxford Dictionaries Word of the Year 2016 and
points that objective facts can be less influential
than appeals to emotion and personal belief. It re-
gards political and other news of our 'post-truth
era'. In the media community, key persons pay at-
tention to the value of truth in journalism, to the
necessity of fact checking, to the threat of fake
news and to the need for technical systems that
would help diminish the problem: Almar Latour
(The Wall Street Journal, 2016), sir Tim Berners-
Lee (worldwide web inventor, 2017), Tim Cook
(Apple, 2017), and Mark Zuckerberg (Facebook,
2016).
There are three types of fake news: serious fab-
rications, large-scale hoaxes and humorous fakes
(Rubin et al., 2015a). OpenSources
(www.opensources.co) suggests more news types,
fake news among them. They are understood as
fabricated information, disseminated deceptive
content, or grossly distorted actual news reports.
This definition corresponds to serious fabrica-
tions.
In social media, people participate in the propa-
gation of the news that they find interesting. Al-
gorithmic ranking, social bubbles and group po-
larization may lead to intentional or unintentional
viral spread of unreliable news. Big amounts of
news reports with misinformation spread caused
by political reasons in 2016 in the USA (presiden-
tial election) (Allcott and Gentzkow, 2017). For
the Russian language the problem of fake news is
already vital since 2014 (Russian-Ukrainian dis-
course).
2 Related Work
Data science companies, academics, media or-
ganizations are working on computational fact
checking for English: on fake news detection and
real-time detection algorithms. In 2016, Google
gave funding to FactMata and Full Fact project to
develop automated fact checking tools. FactMata's
(UK) project is devoted to fact checking and claim
validation by known statistical databases . The
Full Fact (UK) is developing an automated fact
checking helper, using the logic of question an-
swering machines: facts from social media will be
parsed, compared with curated known-true facts
74

and determined as true or false. Tracer News sys-
tem (0.84 accuracy) is a noise filter for journalists
to discover breaking news in Twitter (Liu et al.,
2016): machine learning models for noise filtering
and event detection are implemented, NLP is also
used. “Fake News” Classifier
(www.classify.news) allows to score the veracity
of an article by entering its URL. The corpus arti-
cles are based on OpenSources labels. The tool
focuses on NLP techniques and considers both
content (bag of words; multinomial Naive Bayes
classifier) and context (sentiment analysis, capital-
ization and punctuation usage; Adaptive Boost-
ing). HeroX Fact Check Challenge
(https://herox.com/factcheck/community) (2016-
2017) and FakeNewsChallenge
(http://www.fakenewschallenge.org/) (2017) com-
petitions were held to help to create fact checking
systems.
As to the winners of HeroX Fact Check Chal-
lenge, Fact Scan (1st place) can check several
types of claims automatically, such as numerical,
position, quote and object property claims. Claim
Buster (2nd place) is also able to check simple
statements; it can match claims, and it is based on
knowledge bases. As regards FakeNewsChal-
lenge, the teams focused on the headline-text body
relationships. Talos Intelligence team (1st place)
used the ensemble classifier (gradient-boosted de-
cision trees and deep convolutional neural net-
work). Word embeddings, based on Google News
pretrained vectors, were used for the neural net-
work. Such features are informative for decision
trees: the number overlapping words between the
headline and body text; similarities measured be-
tween the word count, bigrams and trigrams; simi-
larities measured after TF-IDF weighting and sin-
gular value decomposition. UCL Machine Read-
ing system (3rd place) is based on lexical and sim-
ilarity features fed through a multi-layer percep-
tron with one hidden layer. Features for checking
headline-text body consistency contain three ele-
ments: a bag-of-words term frequency vector of
the headline; a bag-of-words term frequency vec-
tor of the body; the cosine similarity of TF-IDF
vectors of the headline and the text body.
Fake news may be identified on different lev-
els. Usually they are combined, from lexics and
semantics to syntax. Most studies focus on lexics
and semantics and some syntax principles; dis-
course and pragmatics have rarely been consid-
ered (Rubin et al., 2015b) due to their complexity.
On lexics level, stylistic features (part of speech
(POS), length of words, subjectivity terms etc.)
can be extracted that help to apart tabloid news
(they are similar to fake news) with 0.77 accuracy
(Lex et al., 2010). Numbers, imperatives, names
of media persons can be extracted from news
headlines (Clark, 2014); the numbers of these
keywords can be used as features for classification
with SVMs or Naive Bayes Classifier (Lary et al.,
2010). Psycholinguistics lexicons, for instance
LIWC (Pennebaker and Francis, 1999), can be
used in performing binary text classifications for
truthful vs deceptive texts (0.70 accuracy) (Mihal-
cea and Strapparava, 1999) — for example, meth-
ods can be based on frequency of affective words
or action words. On syntax level, Probability Con-
text Free Grammars can be used (0.85-0.91 accu-
racy) (Feng et al., 2012). On pragmatics level,
pronouns with antecedents in text are more often
used in fake news' headlines (Blom and Hansen,
2015). On discourse level, rhetorical structures are
used (Rubin et al., 2015b): vector space modeling
application predicts whether a report is truthful or
deceptive (0.63 accuracy) for English. Corpus
consists of seriously fabricated news stories. So
rhetorical structures and discourse constituent
parts and their coherence relations are possible
deception detection markers in English news.
As to facts in the described event, in (Sauri and
Pustejovsky, 2012) model is based on grammati-
cal fact description structures in English and kin-
dred languages. It is implemented in De Facto, a
factuality profiler for eventualities based on lexi-
cal types and syntax constructions. The FactBank,
annotated corpus in English, was also created.
FactMinder, a fact checking and analysis assistant
based on information extraction, can help to find
relevant information (Goasdoué et al., 2013).
Knowledge networks like Wikipedia can be used
for simple fact checking questions (Ciampaglia et
al., 2015).
In (Hardalov et al., 2016) the combined ap-
proach for automatically distinguishing credible
from fake news, based on different features and
combining different levels, is presented: there are
linguistic (n-gram), credibility-related (capitaliza-
tion, punctuation, pronoun use, sentiment polari-
ty), and semantic (embeddings and DBPedia data)
features. The accuracy is from 0.75 to 0.99 on 3
different datasets.
75

The impact of different features on deception
detection was studied in recent works (Fitzpatrick
et al., 2015; Rosso et al., 2017).
There are no automated deception detection
tools for news reports for Russian, although the
field of deception detection in written texts is
studied on the Russian Deception Bank (226
texts). The majority of research parameters are re-
lated to POS tags, lexical-semantic group, and
other frequencies of LIWC lexicon words. The
classifier's accuracy is 0.68 (Litvinova et al.,
2017). Hence, we should base the research for
Russian on the experience of methods for other
languages, keeping in mind linguistics, social and
cultural circumstances.
3 Research Objective
The aim is to reveal differences between fake and
truthful news reports using markers from different
linguistics levels. We use POS tags, length of
words, sentiment terms, punctuation on the lexics
level. Deception detection requires understanding
of complex text structures, so we use Rhetorical
Structures Theory (RST) relations as markers on
the discourse level. In two experiments we shall
classify the texts from the definite corpus.
4 Data Collection Principles
There are no sources that contain verified samples
of fake and truthful news for Russian, although the
problem of fake news is annually discussed on con-
ference ''Media Literacy, Media Ecology, Media
Education: Digital Media for the Future'' (Moscow).
There are no Factbanks, unbiased fact checking
websites, crowdsourcing projects, lists of truth-
ful/deceptive sources. We can rely only on the pre-
sented facts, on the factuality.
The daily manual monitoring of news lasted 24
months (June 2015-June 2017). Online newspapers
in Russian were used as sources. For balance, texts
were from diverse sources: well-known news agen-
cies’ websites, local or topic-based news portals,
online newspapers from different countries. News
source mention was not included in text annotations
to avoid biases. Blogs and social media texts, ana-
lytic journalism stories based on opinions (not on
facts) were not taken. We selected only serious fab-
rications. News stories were carefully analyzed in
retrospect when the factuality was already known,
to avoid biased evaluation. In case of mutual con-
tradictions in the reports about the same event, a re-
port was added to fake cases if at the same time pe-
riod in online media existed reports with unproven
facts and with their truthful refutation. So it was an
intended fake and not a journalist's mistake caused
by lack of facts.
5 Corpus Details and Data Analysis
The corpus consists of news reports about 48 dif-
ferent topics, with equal number of truthful and
deceptive texts to each topic (not more than 12
texts for one topic). It contains 174 texts. The
whole number of tokens is 33049. The mean
length of texts is 189.04 tokens, the median length
is 168.5 tokens. The whole number of rhetorical
relations in corpus is 3147. Mean number of rhe-
torical relations in text is 18.09, the median num-
ber is 16.5.
The corpus size is conventional for the initial re-
search on the field of automated deception detec-
tion, especially if we use the discourse level of
language analysis, because it still requires manual
annotation. Discourse parsers exist most notably
for English (RASTA, SPADE, HILDA, CODRA
etc.), and researchers do not use them even for
English corpora when they need precise results.
For comparison, the dataset in the paper which
describes automated deception detection for news
reports, based on RST, includes 144 news reports
that were tagged manually (Rubin et al., 2015b).
Corpus in the research about the impact of dis-
course markers on argument units classification
(Eckle-Kohler et al., 2015) consists of 88 docu-
ments, predominantly news texts.
We used the following 18 normalized lexical
markers for each text: average length of tokens;
type-token ratio; frequency of adverbs; frequency
of adjectives; frequency of pronouns-adverbs; fre-
quency of numerals-adjectives; frequency of pro-
nouns-adjectives; frequency of conjunctions; fre-
quency of interjections; frequency of numerals;
frequency of particles; frequency of nouns; fre-
quency of pronouns-nouns; frequency of verbs;
frequency of all punctuation marks; frequency of
quotations; frequency of exclamation marks; fre-
quency of lemmas from a sentiment lexicon.
All POS tags were obtained with MyStem tool
for Russian which is for free use (some form
words were excluded from the analysis). We col-
lected seriously fabricated news reports, so we do
not take capitalization as a feature. As there are no
tools for sentiment polarity for Russian for free
use, we use frequencies of lemmas from a list of
76

5000 sentiment words from reviews (Сhetviorkin
and Loukachevitch, 2012).
As to the discourse part, RST framework (Mann
and Thompson, 1988) represents text as an hierar-
chical tree. Some parts are more essential (nucle-
us) than others (satellite). Text segments are con-
nected to each other with relations. The theory
pretends to be universal for all languages, so we
chose it for our research. There are no discourse
parsers for Russian: tagging and validation were
made manually. We used UAM CorpusTool for
discourse-level annotation. We based the research
on the ''classic'' set by Mann and Thompson and
added to it some more types: so, we created 4
types of Evidence according to the precision of
source of information mention. News reports usu-
ally have a definite template, so a rather small
number of relations was used. We have 33 relation
types: 'Circumstance', 'Reason', 'Evidence1', 'Evi-
dence2', 'Evidence3', 'Evidence4', 'Contrast',
'Restatement', 'Disjunction', 'Unconditional', 'Se-
quence', 'Motivation', 'Summary', 'Comparison',
'Non-Volitional Cause', 'Antithesis', 'Volitional
Cause', 'Non-Volitional Result', 'Joint', 'Elabora-
tion', 'Background', 'Solution', 'Evaluation', 'Inter-
pretation', 'Concession', 'Means', 'Conjunction',
'Volitional Result', 'Justify', 'Condition', 'Exempli-
fy', 'Otherwise', 'Purpose'. To avoid subjectivity of
annotators' interpretation, we had 2 annotators and
tried to solve this problem by preparing a precise
manual for tagging and by developing consensus-
building procedures. We selected Krippendorff’s
unitized alpha (0.78) as a measure of inter-
annotator agreement.
The first dataset is based on statistics data about
frequencies of lexical markers for each news re-
port. The second one is based on statistics data
about types of RST relations and their frequencies
for each news report. In fact, we have a 'bag of re-
lation types', disregarding their order.
We selected two supervised learning methods
for texts classification and machine learning:
Support Vector Machines (SVMs) and Random
Forest, both realized in scikit-learn library for Py-
thon. SVMs were used with linear kernel and with
rbf kernel. In both experiments (for both datasets)
we used 10-fold cross-validation for estimator
performance evaluation.
The baseline for all experiments is 50%, be-
cause there is the equal number of truthful and de-
ceptive texts in the corpus.
6 Statistical Procedures
The results of two experiments are presented in
Table 1.
Table 1: Results for lexical and discourse features
We can evaluate that for the first one the classifi-
cation task is solved better by SVMs (rbf kernel).
The most significant features are: average length of
tokens, frequency of sentiment words, frequency of
particles, frequency of verbs. It was checked with
Student's t-test. Although the results of the first ex-
periment are better, for the second one the classifi-
cation task is solved better by Random Forest Clas-
sifier. The most significant rhetorical relation types
among discourse features are disjunc-
tion/conjunction, non-volitional cause, evaluation,
elaboration. Non-volitional cause, elaboration,
evaluation, conjunction are more typical for decep-
tive texts. Probably authors of fake news pay more
attention to the causation, because they want to ex-
plain an event with the internal logic, without any
inconsistencies.
7 Discussion
Automated deception detection seems to be a
promising and methodologically challenging re-
search topic, and further measures should be taken
to find features for deception/truth detection in
automated news verification model for Russian.
Preci-
sion
Accuracy Recall F-
measure
Support Vector Machines, rbf kernel, 10-fold
cross-validation
Lexical
features
0.62 0.64 0.73 0.65
Discourse
features
0.56 0.54 0.52 0.51
Support Vector Machines, linear kernel, 10-fold
cross-validation
Lexical
features
0.62 0.61 0.62 0.60
Discourse
features
0.54 0.53 0.51 0.50
Random Forest Classifier, 10-fold cross-validation
Lexical
features
0.58 0.56 0.47 0.50
Discourse
features
0.62 0.57 0.52 0.54
77

The model should be developed, learned and test-
ed on larger data collections with different topics.
We should use a complex approach and combine
lexics and discourse methods, also combining
them with other linguistics and statistical methods.
For instance, n-grams, word embeddings, psycho-
linguistics features; syntactic level features on top
of sequences of discourse relations should be
studied. ’The trees’ - hierarchies of RST relation
types in texts should also be considered, to get
better results. The extrapolation of the existing
model to all possible news reports in Russian
would be incorrect. But it can already be used as a
preliminary filter for fake news detection. Results
of its work should be double-checked, especially
for suspicious instances. The model is also re-
stricted by the absence of tools and corpora for
Russian, as typical for NLP tasks for Russian. The
guidelines for gathering a corpus of obviously
truthful/deceptive news should also be improved.
8 Conclusions
News verification and automated fact checking
tend to be very important issues in our world, with
its information warfare. The research is initial. We
collected a corpus for Russian (174 news reports,
truthful and fake). We held two experiments, for
both we applied SVMs algorithm (linear/rbf ker-
nel) and Random Forest to classify the news re-
ports into 2 classes: truthful/deceptive. We used
18 markers on lexics level, mostly frequencies of
POS tags in texts. On discourse level we used fre-
quencies of RST relations in texts. The classifica-
tion task in the first experiment is solved better by
SVMs (rbf kernel) (f-measure 0.65). The model
based on RST features shows best results with
Random Forest Classifier (f-measure 0.54) and
should be modified. In the next research, the com-
bination of different deception detection markers
for Russian should be taken in order to make a
better predictive model.
References
H. Allcott and M. Gentzkow. 2017. Social Media and
Fake News in the 2016 Election. In Journal of
Economic Perspectives. Vol. 31-2: 211-236.
J.N. Blom and K.R. Hansen. 2015. Click bait: For-
ward-reference as lure in online news headlines.
Journal of Pragmatics, 76: 87-100.
I.I. Chetviorkin and N.Y. Loukachevitch. 2012. Ex-
traction of Russian Sentiment Lexicon for Product
Meta-Domain. In Proceedings of COLING 2012:
Technical Papers: 593–610.
GL Ciampaglia, P. Shiralkar, LM Rocha, J. Bollen, F.
Menczer, and A. Flammini. 2015. Computational
Fact Checking from Knowledge Networks. PLoS
ONE 10(6): e0128193.
https://doi.org/10.1371/journal.pone.0128193
R. Clark. 2014. Top 8 Secrets of How to Write an Up-
worthy Headline, Poynter, URL:
http://www.poynter.org/news/media-
innovation/255886/top-8-secrets-of-how-to-write-
an-upworthy-headline/
J. Eckle-Kohler, R. Kluge, I. Gurevych. 2015. On the
Role of Discourse Markers for Discriminating
Claims and Premises in Argumentative Discourse,
In Proceedings of the 2015 Conference on Empiri-
cal Methods in Natural Language Processing
(EMNLP): 2236-2242.
S. Feng, R. Banerjee, and Y. Choi. 2012. Syntactic
Stylometry for Deception Detection. In Proceed-
ings 50th Annual Meeting of the Association for
Computational Linguistics, Association for Com-
putational Linguistics, Vol. 2: Short Papers: 171–
175.
E. Fitzpatrick, J. Bachenko, and T. Fornaciari. 2015.
Automatic Detection of Verbal Deception. Synthe-
sis Lectures on Human Language Technologies.
Morgan & Claypool Publishers.
F. Goasdoué, K. Karanasos, Y. Katsis, J. Leblay, I.
Manolescu, and S. Zampetakis. 2013. Fact Check-
ing and Analyzing the Web. In SIGMOD - ACM In-
ternational Conference on Management of Data,
Jun 2013, New York, United States.
M. Hardalov, I. Koychev, P. Nakov. 2016. In Search
of Credible News. In Artificial Intelligence: Meth-
odology, Systems, and Applications: 172-180.
D.J. Lary, A. Nikitkov, and D. Stone. 2010. Which
Machine-Learning Models Best Predict Online
Auction Seller Deception Risk? American Account-
ing Association AAA Strategic and Emerging
Technologies.
E. Lex, A. Juffinger, and M. Granitzer. 2010. Objec-
tivity classification in online media. In Proceedings
of the 21st ACM conference on Hypertext and hy-
permedia: 293-294.
O. Litvinova, T. Litvinova, P. Seredin, Y. Lyell. 2017.
Deception Detection in Russian Texts. In Proceed-
ings of the Student Research Workshop at the 15th
Conference of the European Chapter of the Associ-
ation for Computational Linguistics: 43-52.
X. Liu, Q. Li, A. Nourbakhsh, R. Fang, M. Thomas,
K. Anderson, R. Kociuba, M. Vedder, S. Pomer-
ville, R. Wudali, R. Martin, J. Duprey, A. Vachher,
W. Keenan, and S. Shah. 2016. Reuters Tracer: A
78
Large Scale System of Detecting & Verifying Real-
Time News Events from Twitter. In Proceedings of
the 25th ACM International on Conference on In-
formation and Knowledge Management. Indianap-
olis, Indiana, USA, October 24-28, 2016: 207-216.
W.C. Mann and S.A. Thompson. 1988. Rhetorical
Structure Theory: Toward a Functional Theory of
Text Organization, Text, vol. 8, no.3: 243-281.
R. Mihalcea and C. Strapparava. 1999. The Lie Detec-
tor: Explorations in the Automatic Recognition of
Deceptive Language. In Proceedings 47th Annual
Meeting of the Association for Computational Lin-
guistics, Singapore: 309-312.
J. Pennebaker and M. Francis. 1999. Linguistic in-
quiry and word count: LIWC, Erlbaum Publishers.
P. Rosso and L. Cagnina. 2017. Deception Detection
and Opinion Spam. In: A Practical Guide to Senti-
ment Analysis, Cambria, E., Das, D., Bandyopadh-
yay, S., Feraco, A. (Eds.), Socio-Affective Compu-
ting, vol. 5, Springer-Verlag: 155-171.
V.L. Rubin, N.J. Conroy, and Y. Chen. 2015a. Decep-
tion Detection for News: Three Types of Fakes.
Conference: ASIS T2015, At St. Louis, MO, USA.
V.L. Rubin, N.J. Conroy, and Y.C. Chen. 2015b. To-
wards News Verification: Deception Detection
Methods for News Discourse. In Proceedings of the
Hawaii International Conference on System Sci-
ences (HICSS48) Symposium on Rapid Screening
Technologies, Deception Detection and Credibility
Assessment Symposium, January 5-8, 11 pages.
R. Sauri and J. Pustejovsky. 2012. Are You Sure That
This Happened? Assessing the Factuality Degree of
Events in Text. In Computational Linguistics: 1-39.
79

Proceedings of the 2017 EMNLP Workshop on Natural Language Processing meets Journalism, pages 80–83Copenhagen, Denmark, September 7, 2017. c©2017 Association for Computational Linguistics
Fake News Detection using Stacked Ensemble of Classifiers
James Thorne Mingjie Chen Giorgos MyrianthousJiashu Pu Xiaoxuan Wang Andreas Vlachos
Department of Computer ScienceUniversity of Sheffield, UK
{j.thorne,mchen33,gmyrianthous1,ppu1,xwang130,a.vlachos}@sheffield.ac.uk
Abstract
Fake news has become a hotly debatedtopic in journalism. In this paper, wepresent our entry to the 2017 Fake NewsChallenge which models the detection offake news as a stance classification taskthat finished in 11th place on the leaderboard. Our entry is an ensemble systemof classifiers developed by students in thecontext of their coursework. We show howwe used the stacking ensemble method forthis purpose and obtained improvementsin classification accuracy exceeding eachof the individual models’ performance onthe development data. Finally, we discussaspects of the experimental setup of thechallenge.
1 Introduction
The distribution of news on social media is an in-fluential factor in the public’s political attitudes(Allcott and Gentzkow, 2017). Social networksoffer platforms in which information and articlesmay be shared without fact-checking or modera-tion. Moderating user-generated content on so-cial media presents a challenge due to both vol-ume and variety of information posted. In partic-ular, highly partisan fabricated materials on socialmedia, fake news, is believed to be an influencingfactor in recent elections (DiFranzo and Gloria-Garcia, 2017). Misinformation spread throughfake news has attracted significant media attentionrecently and current approaches rely on manualannotation by third parties (Heath, 2016) to notifyusers that shared content may be untrue.
One of the challenges in detecting misinforma-tion is that there does not yet exist a unified defi-nition of fake news and the criteria required to la-bel an article as true or false. As a consequence,
there is no community-wide shared task in order tocompare the various approaches proposed. Untilrecently, the evaluations related to fake news havehad relatively little adoption. Even though thereis valid criticism that shared tasks have the risk offocusing the community on a particular task defi-nition and dataset, shared definition and evaluationplatforms such as those developed for example bythe CoNLL shared tasks1 have largely stimulatedprogress.
The 2017 Fake News Challenge2 (FNC) aims toprovide a community-wide shared task and eval-uation platform in order to stimulate progress infake news detection. Acknowledging the com-plexity of the task even for human experts and fol-lowing the task decomposition proposed by Silver-man (2015), they propose to address a subtask infake news detection, namely stance classification.Stance classification is the labeling of whether anarticle agrees with, disagrees with or simply dis-cusses a ‘fact’. It can be considered to be a formof textual entailment (Dagan et al., 2006), whileit also bears similarity with stance classification inthe context of sentiment analysis (e.g. Mohammadet al. (2016)) and . Stance classification serves as afirst step in compiling lists of articles that corrobo-rate or refute claims made on social media, allow-ing end-users to make a better informed judgment.
In this paper, we discuss our entry to the fakenews challenge: an ensemble comprising five in-dividual systems developed by students in the con-text of their natural language processing moduleat The University of Sheffield. We used stacking(Wolpert, 1992) as our ensembling technique as ithas been applied successfully in other tasks (e.g.Riedel et al. (2011)) and show that it increases theensemble score above the performance of any of
1http://www.conll.org/previous-tasks2http://fakenewschallenge.org
80

the individual classifiers. Furthermore, we evalu-ate system accuracy against the upper performancebound of our ensemble, assuming a perfect oracleselecting the correct member of the ensemble toreturn the prediction.
2 The Fake News Challenge
The fake news challenge is a text classificationtask: given a headline and article body - the clas-sifier must first predict whether the two are relatedand if so, must then further assign a stance label- whether the headline agrees with, disagrees withor is discussed by (observing) the article.
The evaluation for the FNC is as follows: foreach stance, 0.25 points are available for correctlyclassifying whether the article and headline arerelated. A further 0.75 points are available forcorrectly labeling the relationship between a re-lated headline-article pair. We report percentagescores as a proportion against the maximum pos-sible score for correctly labeling a dataset.
The task dataset is derived from the Emergentproject (Silverman, 2015) and is an extension ofthe stance classification task proposed by Fer-reira and Vlachos (2016). It consists of 49972labeled stances (headline and body pairs) con-structed from 2582 articles and is publicly avail-able on the organizers’ website. In the FNC base-line, the organizers provide a dataset split betweentraining data and hold-out development evalua-tion dataset (proportions: 0.8 training, 0.2 dev).The article bodies in this dataset split are disjoint,however, the headlines were not. An additionalblind test set containing 25413 stances from 904articles was used for evaluating the final solution.This was not made available until the competitionclosed and the winners were announced.
The official baseline (Galbraith et al., 2017)makes heavy use of task-specific feature engi-neering and applies a gradient boosted decisiontree classifier to the fake news challenge dataset- achieving a score of 79.5% on the dev dataset.Features included in this approach include ngramoverlap between the headline and article and thepresence of refuting words (such as fake or de-bunk) in the headline or the article. While thisbaseline was good in distinguishing between therelated/unrelated classes, the recall for the dis-agree label was poor.
The classification accuracy of the baseline islimited by the range of features used. While fur-
Input Datum
Slave Classifiers
Slave Predictions
Master Classifier
Master Prediction
x
C1 C2 Cn
y1 y2 yn
CM
y
Figure 1: Stacked ensemble classification archi-tecture where circle nodes represent data, rectan-gles represent classifiers and arrows indicate dataflow
ther feature engineering may be used to improveperformance of the classifier, this requires humaneffort and judgment and biases the classifier to thedomain in which the features were observed. Zenget al. (2017) applied and compared three recurrentneural models which negate the need for featureengineering. While these have high FNC scores,they don’t necessarily capture the aspects of thetask that manually engineered features do. Birdet al. (2017) combine a deep convolutional net-work with feature engineering through an evenlyweighted ensemble of two classifiers. Riedel et al.(2017) simply use term-frequency vectors and thetf-idf cosine similarity as features for a shallowmulti-layer perceptron.
3 Our Solution
We present our solution to the Fake News Chal-lenge, a stacked ensemble of five independentclassifiers developed by students in the contextof the natural language processing module assign-ments. The stacked ensemble is a two-layer clas-sifier architecture that leverages predictions fromweaker slave classifiers as features in a strongermaster classifier. The architecture is illustratedin Figure 1. We provide an overview of thefive slave classifiers (C1-C5) and master classifier(CM) used in the ensemble:
C1: Concatenate average word2vec vectors forheadline and article body, cosine similarity be-tween headline and article body tf-idf vectors andcounts of refuting words. 4-way classification us-
81

ing a (300,8) multi-layer perceptron (MLP) withReLU activation function.
C2: Average word2vec embeddings for headlinewords and article words excluding stop words,indicator features for punctuation, word overlap,counts of refuting words. 4-way classification us-ing a (1010,6) MLP with ReLU activation func-tion.
C3: 4-way classification using one-vs-all logis-tic regression with L2 regularization over word un-igram and bigram tf-idf vectors.
C4: Concatenate word2vec embeddings forheadline and article words. 4-way classificationusing (256,128,128) MLP with dropout probabili-ties of (0.5,0.3,0.1) between layers and ReLU ac-tivation function.
C5: Official FNC baseline classifier
CM: Gradient boosted decision tree classifierusing as features the values predicted from C1-C5and all the features from the FNC baseline classi-fier.
The master classifier is trained using 2 foldcross validation using the following regime: Thedataset is randomly split into two equal sizes. Twoinstances of C1-C5 are instantiated and are trainedindependently on each data fold. The predictionsare concatenated to the original input data to formone dataset - the master training data used to trainCM. New instances of C1-C5 are trained on theentire original training dataset and used to provideinput to CM at test time.
4 Results
We present the results for our stacked ensem-ble and slave classifiers trained and evaluated onthe fake news challenge baseline data split (dev)and the final test set in Table 1. In the devsetup, the training set contains 40350 stances over1345 unique articles and we evaluated on 9622stances over 336 unique articles. The article bod-ies were disjoint between the training and devel-opment sets.
Because the test dataset was blinded, the riskof building a biased system was mitigated against.
3(Galbraith et al., 2017)4(Bird et al., 2017)5(Hanselowski et al., 2017)6(Riedel et al., 2017)
System Dev % Test %Official Baseline3 79.53 75.20
SOLAT in the SWEN4 - 82.02Athene5 - 81.97
UCL Machine Reading6 - 81.72C1 88.09 75.77C2 86.68 75.08C3 87.48 77.99C4 87.36 58.69C5 79.25 75.22
Our Ensemble (CM) 90.05 78.04CM Upper Limit 97.25 90.89
Table 1: FNC score comparison on developmentevaluation dataset. The performance differencebetween C5 and the official baseline is caused bydifferent k-fold training regimen.
However, the classification difficulty of the testset was far greater than that of the developmentdata split which impacted results. In the devel-opment data split, article bodies were disjoint butthere was some overlap between article headlines.In the training set, both article bodies and head-lines were entirely disjoint. The more success-ful entries for this competition, such as Riedelet al. (2017), built their own entirely disjoint de-velopment split and used this for cross-validation.We found that cross-validating against the devel-opment split yielded classifiers that were not ableto generalize to the unseen articles in the test set,harming the classification accuracy.
On the development dataset, the ensemble clas-sifier yielded an absolute improvement by at least1.6% over any of the individual constituent slaveclassifiers. This performance gain, however, didnot transfer to the blind test set.
The CM upper limit uses a scoring oracle thatawards FNC score if at least one of the slave clas-sifiers correctly labels the input stance. This actsas a measure that describes the maximum pos-sible score that CM could give assuming that italways selected a correct label from one of theslaves. In this case, the upper limit was 90.89%- exceeding the top ranked system. While this re-sult is encouraging, it highlights the need to build astronger master classifier less prone to over-fittingand more resilient to the noisy predictions madeby the slaves.
The performance of some of the slave classi-fiers (the student projects C1-4) was variable and
82
highly dependent on the network topology, fea-ture selection and dataset/split. The most resilientclassifier, C5, used entirely non-lexical featureswhereas C4, which used only averaged word vec-tors and a large network topology, suffered thegreatest loss in performance on the unseen testdata.
The best performing system (Bird et al., 2017)is an ensemble of a convolutional neural modeland a decision tree classifier. This system simplyaveraged the two predictions with equal weight-ing. The master meta-classifier in our entry lever-ages additional information about which slave pre-dictions to favor given a certain headline and arti-cle pair. While the two classifiers in (Bird et al.,2017) are strong, further improvements could beobtained by incorporating stacking.
5 Conclusions
In this paper, we presented a stacked ensemble of5 classifiers developed by students. The perfor-mance gains observed in the development set didnot materialize in the competition though due to amuch more difficult blind test set. One factor lim-iting our assessment of the ability our model(s) togeneralize is the overlap of headlines between thetraining and development evaluation dataset. Fu-ture evaluations could consider temporal splits, i.e.deriving training, development and test sets fromarticles from different periods, which would alsomimic to an extent how these models might beused in practice.
Acknowledgements
We would like to thank the challenge organizers,Dean Pomerleau and Delip Rao, for their efforts inthis community-wide event. We are looking for-ward to future versions of the challenge address-ing more issues in fake news detection. AndreasVlachos is supported by the EU H2020 SUMMAproject (grant agreement number 688139).
References
Hunt Allcott and Matthew Gentzkow. 2017. Social me-dia and fake news in the 2016 election. Technicalreport, National Bureau of Economic Research.
Sean Bird, Doug Sibley, and Yuxi Pan. 2017. Talos tar-gets disinformation with Fake News Challenge vic-tory .
Ido Dagan, Oren Glickman, and Bernardo Magnini.2006. The pascal recognising textual entailmentchallenge. In Machine learning challenges. evalu-ating predictive uncertainty, visual object classifica-tion, and recognising tectual entailment, Springer,pages 177–190.
Dominic DiFranzo and Kristine Gloria-Garcia. 2017.Filter Bubbles and Fake News. XRDS 23(3):32–35.https://doi.org/10.1145/3055153.
William Ferreira and Andreas Vlachos. 2016.Emergent : a novel data-set for stanceclassification. Naacl2016 (1):1163–1168.https://doi.org/10.18653/v1/N16-1138.
Byron Galbraith, Humza Iqbal, HJ van Veen, DelipRao, James Thorne, and Yuxi Pan. 2017. BaselineFNC implementation. http://github.com/fakenewschallenge/fnc-1-baseline.
Andreas Hanselowski, Avinesh PVS, BenjaminSchiller, and Felix Caspelherr. 2017. Description ofthe system developed by Team Athene in the FNC-1.
Alex Heath. 2016. Facebook is going to use snopesand other fact-checkers to combat and bury ’fakenews’. http://businessinsider.com/facebook-will-fact-check-label-fake-news-in-news-feed-2016-12.[Online; accessed 01-June-2017].
Saif M Mohammad, Svetlana Kiritchenko, ParinazSobhani, Xiaodan Zhu, and Colin Cherry. 2016.SemEval-2016 Task 6: Detecting Stance in Tweetspages 31–41.
Benjamin Riedel, Isabelle Augenstein, George Sp-ithourakis, and Sebastian Riedel. 2017. A simplebut tough-to-beat baseline for the Fake News Chal-lenge stance detection task. CoRR abs/1707.03264.http://arxiv.org/abs/1707.03264.
Sebastian Riedel, David McClosky, Mihai Surdeanu,Christopher D. Manning, and Andrew McCallum.2011. Model combination for event extractionin bionlp 2011. In Proceedings of the NaturalLanguage Processing in Biomedicine NAACL 2011Workshop (BioNLP ’11).
Craig Silverman. 2015. Lies, damn lies and viral con-tent. http://towcenter.org/research/lies-damn-lies-and-viral-content/.
David H Wolpert. 1992. Stacked generalization. Neu-ral networks 5(2):241–259.
Qi Zeng, Quan Zhou, and Shanshan Xu. 2017. Neuralstance detectors for fake news challenge.
83

Proceedings of the 2017 EMNLP Workshop on Natural Language Processing meets Journalism, pages 84–89Copenhagen, Denmark, September 7, 2017. c©2017 Association for Computational Linguistics
From Clickbait to Fake News Detection:An Approach based on Detecting the Stance of Headlines to Articles
Peter Bourgonje, Julian Moreno Schneider, Georg RehmDFKI GmbH, Language Technology LabAlt-Moabit 91c, 10559 Berlin, Germany
{peter.bourgonje,julian.moreno schneider,georg.rehm}@dfki.de
Abstract
We present a system for the detection ofthe stance of headlines with regard to theircorresponding article bodies. The ap-proach can be applied in fake news, es-pecially clickbait detection scenarios. Thecomponent is part of a larger platform forthe curation of digital content; we con-sider veracity and relevancy an increas-ingly important part of curating online in-formation. We want to contribute to thedebate on how to deal with fake news andrelated online phenomena with technolog-ical means, by providing means to separaterelated from unrelated headlines and fur-ther classifying the related headlines. Ona publicly available data set annotated forthe stance of headlines with regard to theircorresponding article bodies, we achieve a(weighted) accuracy score of 89.59.
1 Introduction
With the advent of social media and its increas-ingly important role as a provider and amplifierof news, basically anyone, anywhere, can pro-duce and help circulate content for other peopleto read. Traditional barriers to publishing con-tent (like a press to print newspapers or broadcast-ing time for radio or television) have disappeared,and with this, at least part of traditional qualitycontrol procedures have disappeared as well. Ba-sic journalistic principles like source verification,fact checking and accountability can be easily by-passed or simply ignored by individuals or organ-isations publishing content on Twitter, Facebookor other social networks. The impact of this situ-ation is illustrated by the predominance of termslike “trolls”, “fake news”, “post-truth media” and“alternative facts”. There is evidence that these de-
velopments and their effects are not harmless butcan have a significant impact on real-world events,which is illustrated by a description of the role ofsocial media in the 2016 US presidential electionby (Allcott and Gentzkow, 2017), and by a studyon the effectiveness and debunking strategies ofrumours surrounding the Affordable Care Act by(Berinsky, 2017).
While the cause of this situation may have itsroots in many different aspects of modern soci-ety, and hence needs to be approached from sev-eral different angles, we aim to make a contribu-tion from the angle of Language Technology andNatural Language Processing. We consider fully-automated procedures for fact-checking, clickbaitdetection or fake news classification not feasibleat this point (Rehm, 2017), but aim to support thecommunity by providing means of detecting arti-cles or pieces of news that need to be approachedwith caution, where a human has to make finaldecisions (on credibility, legitimacy etc.), but isaided by a set of tools. The approach describedin this paper can serve as the back-end of such asmart set of tooling around fact-checking and canaugment news coming from both traditional andnon-traditional (social media) sources. We envi-sion the resulting set of tools as a collection ofexpert tools for specific job profiles (like a jour-nalist or a news editor), or in the shape of a sim-ple browser plug-in, flagging unverified or dubiouscontent to the end user.
The work presented in this paper was carriedout under the umbrella of a two-year research andtechnology transfer project, in which a researchcentre collaborates with four SME partners thatface the challenge of having to process, analyseand make sense of large amounts of digital con-tent. The companies cover four different use casesand sectors (Rehm and Sasaki, 2015) includingjournalism. For these partners we develop a plat-
84
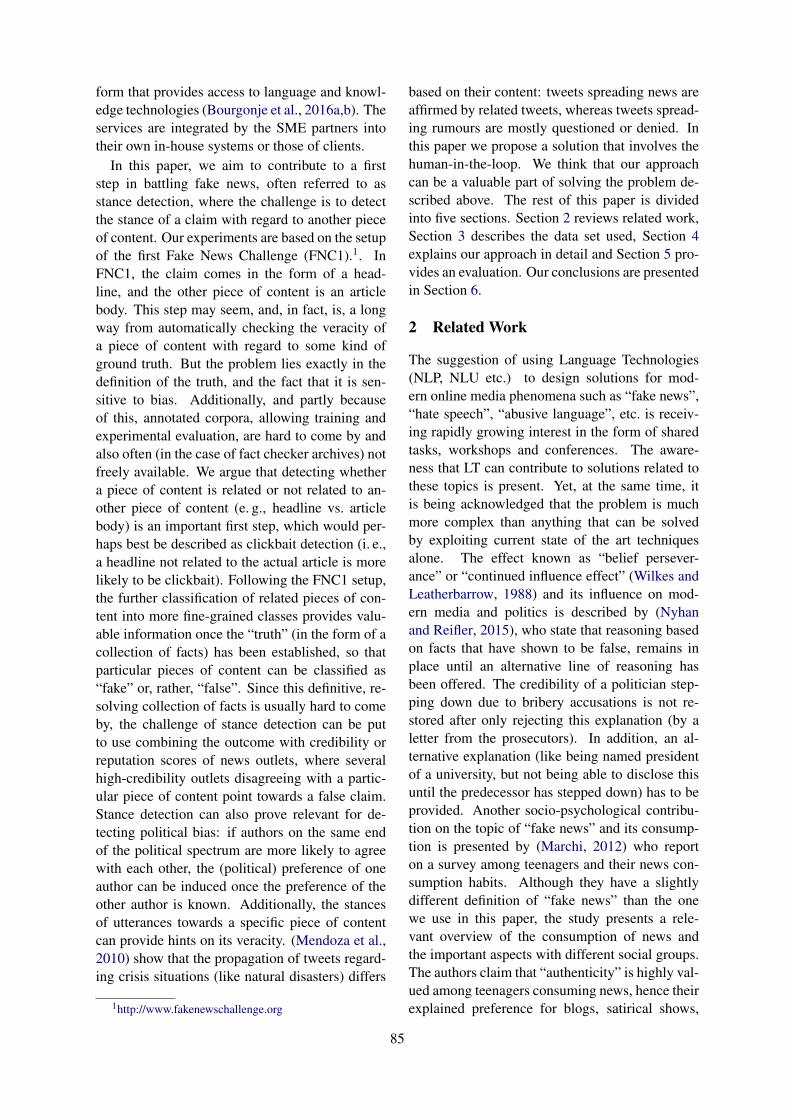
form that provides access to language and knowl-edge technologies (Bourgonje et al., 2016a,b). Theservices are integrated by the SME partners intotheir own in-house systems or those of clients.
In this paper, we aim to contribute to a firststep in battling fake news, often referred to asstance detection, where the challenge is to detectthe stance of a claim with regard to another pieceof content. Our experiments are based on the setupof the first Fake News Challenge (FNC1).1. InFNC1, the claim comes in the form of a head-line, and the other piece of content is an articlebody. This step may seem, and, in fact, is, a longway from automatically checking the veracity ofa piece of content with regard to some kind ofground truth. But the problem lies exactly in thedefinition of the truth, and the fact that it is sen-sitive to bias. Additionally, and partly becauseof this, annotated corpora, allowing training andexperimental evaluation, are hard to come by andalso often (in the case of fact checker archives) notfreely available. We argue that detecting whethera piece of content is related or not related to an-other piece of content (e. g., headline vs. articlebody) is an important first step, which would per-haps best be described as clickbait detection (i. e.,a headline not related to the actual article is morelikely to be clickbait). Following the FNC1 setup,the further classification of related pieces of con-tent into more fine-grained classes provides valu-able information once the “truth” (in the form of acollection of facts) has been established, so thatparticular pieces of content can be classified as“fake” or, rather, “false”. Since this definitive, re-solving collection of facts is usually hard to comeby, the challenge of stance detection can be putto use combining the outcome with credibility orreputation scores of news outlets, where severalhigh-credibility outlets disagreeing with a partic-ular piece of content point towards a false claim.Stance detection can also prove relevant for de-tecting political bias: if authors on the same endof the political spectrum are more likely to agreewith each other, the (political) preference of oneauthor can be induced once the preference of theother author is known. Additionally, the stancesof utterances towards a specific piece of contentcan provide hints on its veracity. (Mendoza et al.,2010) show that the propagation of tweets regard-ing crisis situations (like natural disasters) differs
1http://www.fakenewschallenge.org
based on their content: tweets spreading news areaffirmed by related tweets, whereas tweets spread-ing rumours are mostly questioned or denied. Inthis paper we propose a solution that involves thehuman-in-the-loop. We think that our approachcan be a valuable part of solving the problem de-scribed above. The rest of this paper is dividedinto five sections. Section 2 reviews related work,Section 3 describes the data set used, Section 4explains our approach in detail and Section 5 pro-vides an evaluation. Our conclusions are presentedin Section 6.
2 Related Work
The suggestion of using Language Technologies(NLP, NLU etc.) to design solutions for mod-ern online media phenomena such as “fake news”,“hate speech”, “abusive language”, etc. is receiv-ing rapidly growing interest in the form of sharedtasks, workshops and conferences. The aware-ness that LT can contribute to solutions related tothese topics is present. Yet, at the same time, itis being acknowledged that the problem is muchmore complex than anything that can be solvedby exploiting current state of the art techniquesalone. The effect known as “belief persever-ance” or “continued influence effect” (Wilkes andLeatherbarrow, 1988) and its influence on mod-ern media and politics is described by (Nyhanand Reifler, 2015), who state that reasoning basedon facts that have shown to be false, remains inplace until an alternative line of reasoning hasbeen offered. The credibility of a politician step-ping down due to bribery accusations is not re-stored after only rejecting this explanation (by aletter from the prosecutors). In addition, an al-ternative explanation (like being named presidentof a university, but not being able to disclose thisuntil the predecessor has stepped down) has to beprovided. Another socio-psychological contribu-tion on the topic of “fake news” and its consump-tion is presented by (Marchi, 2012) who reporton a survey among teenagers and their news con-sumption habits. Although they have a slightlydifferent definition of “fake news” than the onewe use in this paper, the study presents a rele-vant overview of the consumption of news andthe important aspects with different social groups.The authors claim that “authenticity” is highly val-ued among teenagers consuming news, hence theirexplained preference for blogs, satirical shows,
85

or basically anything other than traditional me-dia outlets, which they consider “identical”, lack-ing contextual information and any authenticity.The acknowledgment that teenagers increasinglyrely on news coming from non-traditional newssources underlines the need for new ways of deal-ing with challenges related to these alternativesources. (Conroy et al., 2015) present a use-ful overview of recent approaches towards “fakenews” detection using NLP and network analy-ses. The authors include several state-of-the-artfigures and acknowledge the fact that these num-bers are domain-dependent, which is why it isdifficult to arrive at a state-of-the-art figure in-dependent of a specific use case and data set.From an NLP perspective, the challenge of deal-ing with this problem is further exemplified bythe fact that annotated data is hard to find, and, ifpresent, exhibits rather low inter-annotator agree-ment. Approaching the “abusive language” and“hate speech” problem from an NLP angle (Bour-gonje et al., 2017), (Ross et al., 2016) introduce aGerman corpus of tweets and annotate it for hatespeech, resulting in figures for Krippendorff’s αbetween 0.18 and 0.29, (Waseem, 2016) compareamateur (CrowdFlower) annotations and expertannotations on an English corpus of Tweets and re-port figures for Cohen’s Kappa of 0.14, (Van Heeet al., 2015) use a Dutch corpus annotated for cy-berbullying and report Kappa scores between 0.19and 0.69, and (Kwok and Wang, 2013) investigateEnglish racist tweets and report an overall inter-annotator agreement of only 33%.
An approach similar to ours is described by(Ferreira and Vlachos, 2016), who introduce a dataset and three-class classification (“for”, “against”,“observing”). In addition to a logistic regres-sion classifier, the authors exploit dependencyparse graphs, a paraphrase database (Pavlick et al.,2015) and several other features, to arrive at an ac-curacy of 73%. Another related approach is de-scribed by (Augenstein et al., 2016), who applystance detection methods on the SemEval 2016Task 6 data set. Their focus is on learning stancestowards a topic in an unsupervised and weakly su-pervised way using a neural network architecture.(Babakar and Moy, 2016) present a useful and re-cent overview of fact checking approaches.
3 Data Set
Our experiments are conducted on the dataset re-leased by the organisers of the first Fake NewsChallenge (FNC1) on stance detection. The dataset is based on the work of (Ferreira and Vla-chos, 2016) and can be downloaded from the cor-responding GitHub page, along with a baselineimplementation for this task, achieving a score of79.53.2 The data consists of a set of headlines andarticles that are combined with each other (mul-tiple times, in different combinations) and anno-tated for one of four classes: “unrelated”, “agree”,“disagree”, “discuss”, indicating the stance of theheadline towards the content of the article (see Ta-ble 1).
Unique headlines 1.648Unique articles 1.668Annotated pairs 49.972 100%
Class: unrelated 36.545 73%Class: discuss 8.909 18%Class: agree 3.678 7%Class: disagree 840 2%
Table 1: Key figures of the FNC-1 data set
The FNC1 scoring method consists of first veri-fying whether a particular combination of headlineand article has been correctly classified as “unre-lated” (the corresponding class) or “related” (oneof the classes “agree”, “disagree” or “discuss”).Getting this binary classification correct amountsup to 25% of the final, weighted score. The re-maining 75% of the score consists of correctlyclassifying headline article pairs in the three re-maining classes. The setup of our system adheresto this scoring method, and hence applies severalclassifiers sequentially, as explained in Section 4.
4 Approach and Methods
In line with the scoring system of the challenge,we first apply a procedure to decide whether a par-ticular headline/article combination is related orunrelated. This is done based on n-gram match-ing of the lemmatised input (headline or article),using the CoreNLP Lemmatiser (Manning et al.,2014). The number of matching n-grams (wheren = 1..6) in the headline and article is multipliedby length and IDF value of the matching n-gram
2https://github.com/FakeNewsChallenge/fnc-1
86

(n-grams containing only stop words or punctua-tion are not considered), then divided by the totalnumber of n-grams. If the resulting score is abovesome threshold (we established 0.0096 as the op-timal value), the pair is taken to be related.
A formal definition is provided in Equation 1:considering a headline and an article representedby two arrays (H and A) of all possible lemmatisedn-grams when n ∈ [1,6], h(i) and a(i) being the ith
element of arrays H and A, len(·) being a func-tion that computes the length in tokens of a string(n-gram), T Fk
T being the frequency of appearanceof term k in array T and IDFk being the inversedocument frequency of term k in all the articles.
sc =∑len(H)
i=1 T Fh(i) ∗ IDFh(i)
len(H)+ len(A)(1)
where
T Fh(i) = {(T Fh(i)H +T FH(i)
A )∗ len(h(i))} (2)
As shown in Table 1, the majority of “related”instances are of the class “discuss” and simply as-signing this class to all “related” instances leads toan accuracy of 61.51 already (for this portion ofthe data set), as shown in the “Majority vote” col-umn. To improve upon this baseline and to furtherclassify the related pairs into “agree”, “disagree”or “discuss”, we use Mallet’s Logistic Regres-sion classifier implementation (McCallum, 2002)trained on headlines only (without lemmatisationor stop word removal), using the three classes.This resulted in a weighted score of 79.82 (column“3-class classifier”). In subsequent experiments,we introduced a (relative) confidence threshold: ifthe distance between the best scoring class and thesecond-best scoring class is above some thresh-old (we established 0.7 as the optimal value),the best-scoring class is assigned to the pair. Ifthe difference was below the threshold, we usedthree binary classifiers to decide between the bestscoring class and the second-best scoring class(i. e., one binary classifier for “agree”-“disagree”,one for “agree”-“discuss” and one for “discuss”-“disagree”). These classifiers are trained on boththe headline and the article (joined together, with-out lemmatisation or stop word removal). The re-sults are shown in the column “Combined classi-fiers” in Table 2.
This setup leads to the best results on the dataset. In other experiments we used more linguisti-
cally motivated features, some of them inspired bythe work of (Ferreira and Vlachos, 2016). Fromrather basic ones (like a question mark at the endof a headline to detect “disagree” instances) tomore sophisticated ones (like extracting a depen-dency graph, looking for negation-type typed de-pendencies and calculate their normalised distanceto the root node of the graph, and compare thisvalue for headline and article), but these did notimprove upon the final weighted score reported inTable 2.
5 Evaluation
The first step of deciding whether a head-line/article pair is related or not is done based onn-gram matching (of lemmatised n-grams). Thisprocedure is rule-based and only relies on find-ing an optimal value for the threshold, based onthe data. To arrive at an optimal value, we usedall data and did not separate it into training andtest sets. Since the subsequent classification meth-ods are based on machine learning, the followingevaluation figures are the result of 50-fold cross-validation, with a 90-10 division of training andtest data, respectively.
Considering that the combination of headlinesand article bodies has been performed randomlywith many obviously unrelated combinations, therelatedness score of 93.27 can be considered rel-atively low.3 Upon manual investigation of thecases classified as “unrelated” (but that were infact of the “agree”, “disagree” or “discuss” class),we found that the vast majority had headlines withdifferent wordings that were not matching afterlemmatisation. One concrete example with theheadline “Small Meteorite Hits Managua” in itsarticle body mentions “the Nicaraguan capital” butnot “Managua” and “a chunk of an Earth-passingasteroid” instead of “small meteorite”. To improvethe approach for cases such as this one, we pro-pose to include more sophisticated techniques tocapture word relatedness in a knowledge-rich wayas an important part of future work. The otherway round, cases classified as related that werein fact annotated as “unrelated” contained wordsin the headline that were frequently mentioned inthe article body. One example with the headline“SHOCK CLAIM: PGA Golfer Says Tiger WoodsIs Suspended For Failed Drug Test” was combined
3The variation for this row in Table 2 is due to differentruns (on different, random splits of the data).
87
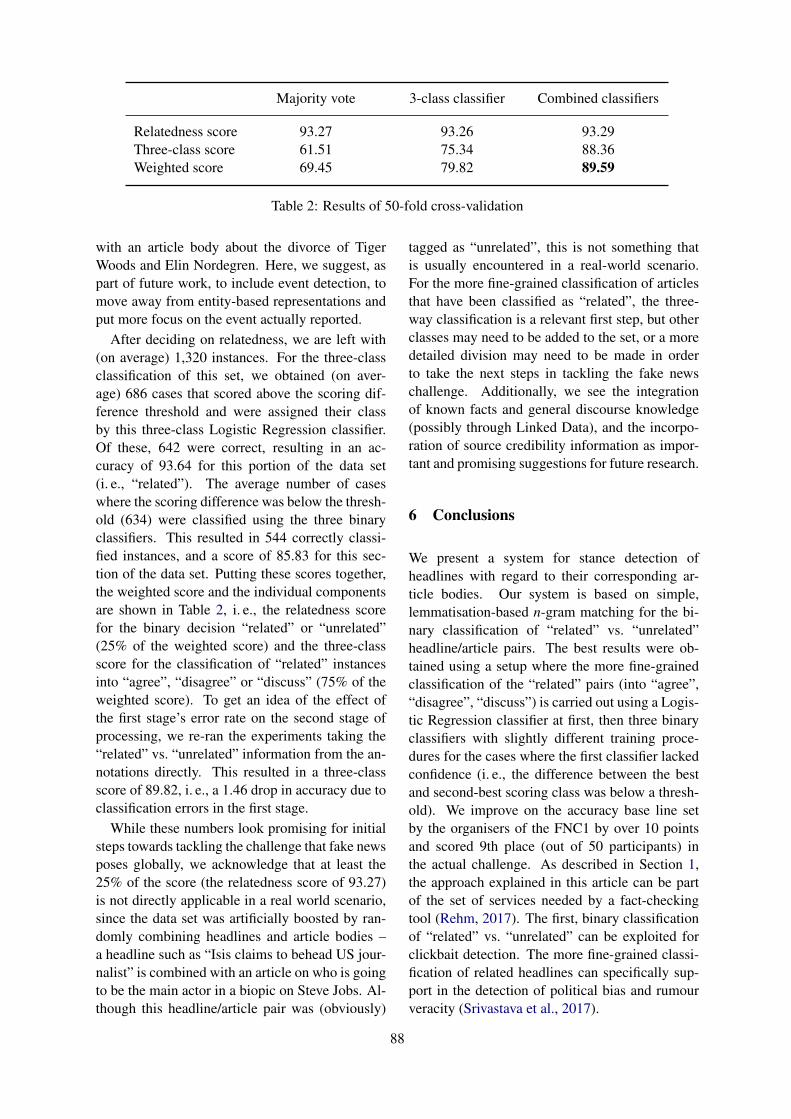
Majority vote 3-class classifier Combined classifiers
Relatedness score 93.27 93.26 93.29Three-class score 61.51 75.34 88.36Weighted score 69.45 79.82 89.59
Table 2: Results of 50-fold cross-validation
with an article body about the divorce of TigerWoods and Elin Nordegren. Here, we suggest, aspart of future work, to include event detection, tomove away from entity-based representations andput more focus on the event actually reported.
After deciding on relatedness, we are left with(on average) 1,320 instances. For the three-classclassification of this set, we obtained (on aver-age) 686 cases that scored above the scoring dif-ference threshold and were assigned their classby this three-class Logistic Regression classifier.Of these, 642 were correct, resulting in an ac-curacy of 93.64 for this portion of the data set(i. e., “related”). The average number of caseswhere the scoring difference was below the thresh-old (634) were classified using the three binaryclassifiers. This resulted in 544 correctly classi-fied instances, and a score of 85.83 for this sec-tion of the data set. Putting these scores together,the weighted score and the individual componentsare shown in Table 2, i. e., the relatedness scorefor the binary decision “related” or “unrelated”(25% of the weighted score) and the three-classscore for the classification of “related” instancesinto “agree”, “disagree” or “discuss” (75% of theweighted score). To get an idea of the effect ofthe first stage’s error rate on the second stage ofprocessing, we re-ran the experiments taking the“related” vs. “unrelated” information from the an-notations directly. This resulted in a three-classscore of 89.82, i. e., a 1.46 drop in accuracy due toclassification errors in the first stage.
While these numbers look promising for initialsteps towards tackling the challenge that fake newsposes globally, we acknowledge that at least the25% of the score (the relatedness score of 93.27)is not directly applicable in a real world scenario,since the data set was artificially boosted by ran-domly combining headlines and article bodies –a headline such as “Isis claims to behead US jour-nalist” is combined with an article on who is goingto be the main actor in a biopic on Steve Jobs. Al-though this headline/article pair was (obviously)
tagged as “unrelated”, this is not something thatis usually encountered in a real-world scenario.For the more fine-grained classification of articlesthat have been classified as “related”, the three-way classification is a relevant first step, but otherclasses may need to be added to the set, or a moredetailed division may need to be made in orderto take the next steps in tackling the fake newschallenge. Additionally, we see the integrationof known facts and general discourse knowledge(possibly through Linked Data), and the incorpo-ration of source credibility information as impor-tant and promising suggestions for future research.
6 Conclusions
We present a system for stance detection ofheadlines with regard to their corresponding ar-ticle bodies. Our system is based on simple,lemmatisation-based n-gram matching for the bi-nary classification of “related” vs. “unrelated”headline/article pairs. The best results were ob-tained using a setup where the more fine-grainedclassification of the “related” pairs (into “agree”,“disagree”, “discuss”) is carried out using a Logis-tic Regression classifier at first, then three binaryclassifiers with slightly different training proce-dures for the cases where the first classifier lackedconfidence (i. e., the difference between the bestand second-best scoring class was below a thresh-old). We improve on the accuracy base line setby the organisers of the FNC1 by over 10 pointsand scored 9th place (out of 50 participants) inthe actual challenge. As described in Section 1,the approach explained in this article can be partof the set of services needed by a fact-checkingtool (Rehm, 2017). The first, binary classificationof “related” vs. “unrelated” can be exploited forclickbait detection. The more fine-grained classi-fication of related headlines can specifically sup-port in the detection of political bias and rumourveracity (Srivastava et al., 2017).
88

AcknowledgmentsThe authors wish to thank the anonymous reviewers fortheir helpful feedback. The project “Digitale Kuratierung-stechnologien” is supported by the German Federal Min-istry of Education and Research, Wachstumskern-Potenzial(no. 03WKP45). http://www.digitale-kuratierung.de.
ReferencesHunt Allcott and Matthew Gentzkow. 2017. Social me-
dia and fake news in the 2016 election. Working Pa-per 23089, National Bureau of Economic Research.
Isabelle Augenstein, Tim Rocktaschel, Andreas Vla-chos, and Kalina Bontcheva. 2016. Stance detec-tion with bidirectional conditional encoding. CoRR,abs/1606.05464.
Mevan Babakar and Will Moy. 2016. The State of Au-tomated Factchecking.
Adam J. Berinsky. 2017. Rumors and health carereform: Experiments in political misinformation.British Journal of Political Science, 47(2):241–262.
Peter Bourgonje, Julian Moreno-Schneider, JanNehring, Georg Rehm, Felix Sasaki, and AnkitSrivastava. 2016a. Towards a Platform for CurationTechnologies: Enriching Text Collections witha Semantic-Web Layer. In The Semantic Web,number 9989 in LNCS, pages 65–68. Springer.
Peter Bourgonje, Julian Moreno Schneider, and GeorgRehm. 2017. Automatic Classification of AbusiveLanguage and Personal Attacks in Various Forms ofOnline Communication. In Language Technologiesfor the Challenges of the Digital Age: Proc. of GSCL2017, Berlin.
Peter Bourgonje, Julian Moreno Schneider, GeorgRehm, and Felix Sasaki. 2016b. ProcessingDocument Collections to Automatically ExtractLinked Data: Semantic Storytelling Technologiesfor Smart Curation Workflows. In Proc. of the2nd Int. Workshop on NLG and the Semantic Web(WebNLG 2016), pages 13–16, Edinburgh, UK.
Niall J. Conroy, Victoria L. Rubin, and Yimin Chen.2015. Automatic deception detection: Methods forfinding fake news. In Proc. of the 78th ASIS&T An-nual Meeting, ASIST ’15, pages 82–82.
W. Ferreira and A. Vlachos. 2016. Emergent: a noveldata-set for stance classification. The 15th AnnualConference of the North American Chapter of theAssociation for Computational Linguistics: HumanLanguage Technologies. ACL.
Irene Kwok and Yuzhou Wang. 2013. Locate the hate:Detecting tweets against blacks. In Proc. of the 27thAAAI Conf. on AI, pages 1621–1622.
Christopher D. Manning, Mihai Surdeanu, John Bauer,Jenny Finkel, Steven J. Bethard, and David Mc-Closky. 2014. The Stanford CoreNLP Toolkit. InACL, pages 55–60.
R. Marchi. 2012. With facebook, blogs, and fake news,teens reject journalistic objectivity. Journal of Com-munication Inquiry, 36(3):246–262.
Andrew Kachites McCallum. 2002. Mallet: A machinelearning for language toolkit.
Marcelo Mendoza, Barbara Poblete, and CarlosCastillo. 2010. Twitter Under Crisis: Can We TrustWhat We RT? In Proc. of the First Workshop onSocial Media Analytics, pages 71–79.
Brendan Nyhan and Jason Reifler. 2015. Displacingmisinformation about events: An experimental testof causal corrections. Journal of Exp. Political Sci-ence, 2(01):81–93.
Ellie Pavlick, Pushpendre Rastogi, Juri Ganitkevitch,Benjamin Van Durme, and Chris Callison-Burch.2015. PPDB 2.0: Better paraphrase ranking, fine-grained entailment relations, word embeddings, andstyle classification. In Proc. of the 53rd AnnualMeeting of the ACL, Beijing, China, Volume 2: ShortPapers, pages 425–430.
Georg Rehm. 2017. An Infrastructure for EmpoweringInternet Users to handle Fake News and other OnlineMedia Phenomena. In Language Technologies forthe Challenges of the Digital Age: Proc. of GSCL2017, Berlin.
Georg Rehm and Felix Sasaki. 2015. Digitale Ku-ratierungstechnologien – Verfahren fur die effizienteVerarbeitung, Erstellung und Verteilung qualitativhochwertiger Medieninhalte. In Proc. of GSCL2015, pages 138–139.
Bjorn Ross, Michael Rist, Guillermo Carbonell, Ben-jamin Cabrera, Nils Kurowsky, and Michael Wo-jatzki. 2016. Measuring the Reliability of HateSpeech Annotations: The Case of the EuropeanRefugee Crisis. In Proc. of NLP4CMC III: 3rdWorkshop on NLP for CMC, pages 6–9.
Ankit Srivastava, Georg Rehm, and Julian MorenoSchneider. 2017. DFKI-DKT at SemEval-2017 Task8: Rumour Detection and Classification Using Cas-cading Heuristics. In Proc. of SemEval-2017, pages477–481, Vancouver, Canada. ACL.
Cynthia Van Hee, Els Lefever, Ben Verhoeven, JulieMennes, Bart Desmet, Guy De Pauw, Walter Daele-mans, and Veronique Hoste. 2015. Detection andfine-grained classification of cyberbullying events.In Proc. of the Int. Conf. Recent Advances in NLP,pages 672–680.
Zeerak Waseem. 2016. Are You a Racist or Am I See-ing Things? Annotator Influence on Hate SpeechDetection on Twitter. In Proc. of the 1st Workshopon NLP and Computational Social Science, pages138–142.
A. L. Wilkes and M. Leatherbarrow. 1988. Editingepisodic memory following the identification of er-ror. The Quarterly Journal of Exp. Psychology,40(2):361–387.
89

Proceedings of the 2017 EMNLP Workshop on Natural Language Processing meets Journalism, pages 90–94Copenhagen, Denmark, September 7, 2017. c©2017 Association for Computational Linguistics
‘Fighting’ or ‘Conflict’? An Approach to Revealing Concepts of Terms inPolitical Discourse
Linyuan Tang and Kyo KageuraGraduate School of Interdisciplinary Information Studies / Interfaculty Initiative in Information Studies
The University of Tokyo, Tokyo, [email protected], [email protected]
Abstract
Previous work on the epistemology offact-checking indicated the dilemma be-tween the needs of binary answers for thepublic and ambiguity of political discus-sion. Determining concepts representedby terms in political discourse can be con-sidered as a Word-Sense Disambiguation(WSD) task. The analysis of politicaldiscourse, however, requires identifyingprecise concepts of terms from relativelysmall data. This work attempts to providea basic framework for revealing conceptsof terms in political discourse with ex-plicit contextual information. The frame-work consists of three parts: 1) extract-ing important terms, 2) generating concor-dance for each term with stipulative defi-nitions and explanations, and 3) agglom-erating similar information of the term byhierarchical clustering. Utterances madeby Prime Minister Abe Shinzo in the Dietof Japan are used to examine our frame-work. Importantly, we revealed the con-ceptual inconsistency of the term Sonritsu-kiki-jitai. The framework was proved towork, but only for a small number of termsdue to lack of explicit contextual informa-tion.
1 Introduction
In October 2016, in the process of diet deliber-ations on assigning Japan’s Self-Defense Forcesmembers to U.N. operations in South Sudan,Japanese Prime Minister Abe Shinzo stated thatthe ‘fighting’ between the government and rebelforces were not to be considered as a ‘military con-flict’1, according to the definition of ‘conflict’ un-
der Japanese peacekeeping law.When domain-specific jargons are used, the
ambiguity between common usage and domain-specific usage becomes inevitable. In addition, thecase above illustrates that the task of political dis-course analysis is different from other scientificdiscourse analysis. In contrast to other scientificdomains, terms used by political figures tend to bevague and ambiguous due to their unwillingnessto explain their opinions or statements sufficientlyclearly to the public. Although social scientistsmay derive certain implications from the ambigu-ities, an intentional misuse of terms by a politicalfigure, which is difficult to recognize, could leadthe public to misinterpretation.
As a prerequisite for fact-checking, therefore, itis essential to reveal concepts represented by termsin political discourse. As we cannot expect politi-cians to do this, it is necessary for the public and/orjournalists to disambiguate concepts of terms. Au-tomatic processing of political texts, namely wordsense disambiguation (WSD), has a potential toassist this process.
The procedure of WSD can be summarized as:‘given a set of words, a techique is applied whichmakes use of one or more sources of knowledge toassociate the most appropriate senses with wordsin context’ (Navigli, 2009). WSD in general relieson knowledge; without knowledge, not only com-puters but also human beings cannot understandword sense. The unwillingness of political figuresto clarify the meaning of their utterances causes atleast two difficulties in WSD specific to politicaldiscourse.
First, there exist few political domain-specificdictionaries or corpora that could serve as a knowl-
1 As in English, there are also various verbal expressions(Sento, Shototsu, etc.) of the act of fighting in Japanese. Sentois the term that generally thought to be parallel to ‘militaryconflict’ as well as ‘military fighting’.
90

edge base, which is desirable for WSD. Generally,in order to facilitate communication, a dictionarydefines standard usage and a corpus exhibits prac-tical usage of terms. On the other hand, politi-cal figures almost always create specific usage ofterms to escape from common understanding.
Second, every term in political discourse couldhave a peculiar concept. It is well known in Japanthat most utterances made in the Diet are draftedby bureaucrats, and there are always subtle nu-ances present in bureaucratese. If necessary, po-litical figures would make every single term be in-dependent of its synonyms, hyponyms and hyper-nyms, even when the terms share a similar surfaceword form2. Therefore, unlike the tasks of doc-ument summarization or simplification, when re-vealing the concept of a term made by politicalfigures, information loss is relatively less accept-able.
The first difficulty could be overcome by creat-ing a domain-specific knowledge base or applyingunsupervised disambiguation or word sense induc-tion (WSI) methods. However, knowledge pro-vided by political knowledge bases, which is nec-essary for further research, could sometimes ob-struct the analysis, because concepts of terms canvary across political figures and scenarios. WSI,on the other hand, while it is also necessary for fur-ther research, suffers from a more practical prob-lem, i.e., it identifies sense clusters rather than as-signing a sense to a word, and ‘a significant gapstill exists between the results of these techniquesand the gold standard of manually compiled wordsense dictionaries’ (Denkowski, 2009).
In view of the urgent need for an accessible andstraightforward approach to practical WSD for po-litical discourse, this ongoing research provides aspringboard by introducing a framework to revealconcepts of terms using only explicit contextualinformation. The method we propose copes withthe balance of the needs of knowledge and the at-tention to the specific usages of terms by creating aconcordance that serves as a temporary knowledgebase. On the other hand, it deals with precision ofconcept generation by keeping as much informa-tion as possible.
We collected utterances made by Prime Minis-ters of Japan in the Diet deliberations as target dis-
2In the example above, according to the government,Sento (fighting) is not defined while Sento-koi (act of fight-ing) is defined by the law, so that these two terms have differ-ent meanings and only the latter can be used.
courses. The concept-revealing framework con-sists of three parts. First, we applied widely-usedtf-idf method to weigh terms and acquired nounswith ranks by their importance. Second, we gener-ated a concordance for each of the important termsin order to collect their stipulative definitions andexplanations offered in the document. Thirdly, fo-cusing on the similarity of concepts rather than thequantity of clusters, we agglomerated similar in-formation by hierarchical clustering.
Theoretically, as our approach extracts informa-tion from given documents without summarizationor simplification, concepts of terms will surely berevealed. Given this, we will show, instead of em-phasizing the overall results, an important obser-vation obtained from the concept of Sonritsu-kiki-jitai3which was identified as one of the most im-portant terms used by Prime Minister Abe Shinzo.Specifically, conceptual inconsistency exists notonly between the speaker and the audience, butalso in the same speaker’s utterances.
2 Related work
The controversy among Uscinski and Butler(2013), Amazeen (2015), and Uscinski (2015)over the epistemology of fact-checking illustratedissues on the methodology of fact-checking.
Uscinski and Butler (2013) made five method-ological criticisms against fact-checking methods:selection effects, confounding multiple facts orpicking apart a whole, causal claims, predictingthe future, and inexplicit selection criteria. Thesechallenges were related to ‘the naıve political epis-temology at work in the fact-checking branch ofjournalism’ (Uscinski and Butler, 2013).
Amazeen (2015) critized Uscinski and Butler(2013) for their overgeneralization of the selectioneffects and failure to offer supportive empiricalquantification. She also demonstrated that therewas a high level of consistency among multiplefact-checkers, and argued that fact-checking is im-portant as long as ‘unambiguous practices of de-ception’ continue (Amazeen, 2015).
The rejoinder then from Uscinski (2015) arguedthat Amazeen’s attempt to infer the accuracy offact-checks failed because of fact-checkers’ pos-sible political biases, and she also ignored the dis-tinction between facts and claims. Fact-checkingwas therefore still a ‘continuation of politics by
3An armed attack against foreign country resulting inthreatening Japan’s survival.
91
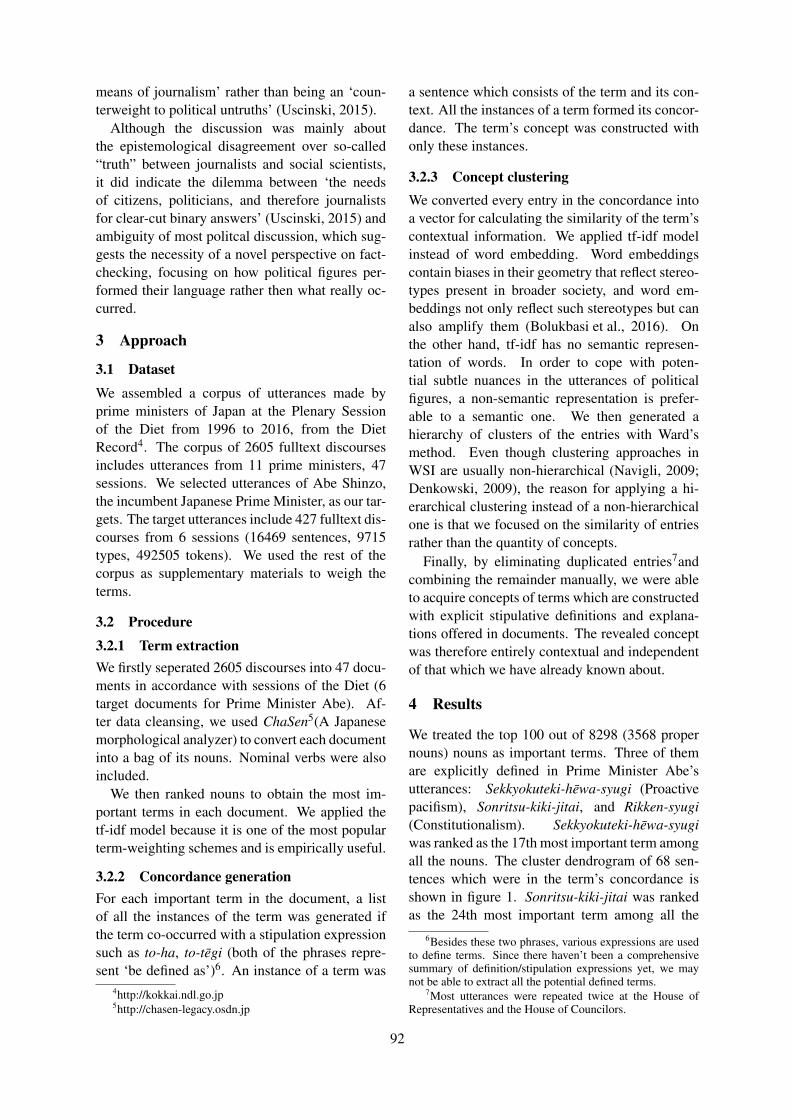
means of journalism’ rather than being an ‘coun-terweight to political untruths’ (Uscinski, 2015).
Although the discussion was mainly aboutthe epistemological disagreement over so-called“truth” between journalists and social scientists,it did indicate the dilemma between ‘the needsof citizens, politicians, and therefore journalistsfor clear-cut binary answers’ (Uscinski, 2015) andambiguity of most politcal discussion, which sug-gests the necessity of a novel perspective on fact-checking, focusing on how political figures per-formed their language rather then what really oc-curred.
3 Approach
3.1 Dataset
We assembled a corpus of utterances made byprime ministers of Japan at the Plenary Sessionof the Diet from 1996 to 2016, from the DietRecord4. The corpus of 2605 fulltext discoursesincludes utterances from 11 prime ministers, 47sessions. We selected utterances of Abe Shinzo,the incumbent Japanese Prime Minister, as our tar-gets. The target utterances include 427 fulltext dis-courses from 6 sessions (16469 sentences, 9715types, 492505 tokens). We used the rest of thecorpus as supplementary materials to weigh theterms.
3.2 Procedure
3.2.1 Term extractionWe firstly seperated 2605 discourses into 47 docu-ments in accordance with sessions of the Diet (6target documents for Prime Minister Abe). Af-ter data cleansing, we used ChaSen5(A Japanesemorphological analyzer) to convert each documentinto a bag of its nouns. Nominal verbs were alsoincluded.
We then ranked nouns to obtain the most im-portant terms in each document. We applied thetf-idf model because it is one of the most popularterm-weighting schemes and is empirically useful.
3.2.2 Concordance generationFor each important term in the document, a listof all the instances of the term was generated ifthe term co-occurred with a stipulation expressionsuch as to-ha, to-tegi (both of the phrases repre-sent ‘be defined as’)6. An instance of a term was
4http://kokkai.ndl.go.jp5http://chasen-legacy.osdn.jp
a sentence which consists of the term and its con-text. All the instances of a term formed its concor-dance. The term’s concept was constructed withonly these instances.
3.2.3 Concept clusteringWe converted every entry in the concordance intoa vector for calculating the similarity of the term’scontextual information. We applied tf-idf modelinstead of word embedding. Word embeddingscontain biases in their geometry that reflect stereo-types present in broader society, and word em-beddings not only reflect such stereotypes but canalso amplify them (Bolukbasi et al., 2016). Onthe other hand, tf-idf has no semantic represen-tation of words. In order to cope with poten-tial subtle nuances in the utterances of politicalfigures, a non-semantic representation is prefer-able to a semantic one. We then generated ahierarchy of clusters of the entries with Ward’smethod. Even though clustering approaches inWSI are usually non-hierarchical (Navigli, 2009;Denkowski, 2009), the reason for applying a hi-erarchical clustering instead of a non-hierarchicalone is that we focused on the similarity of entriesrather than the quantity of concepts.
Finally, by eliminating duplicated entries7andcombining the remainder manually, we were ableto acquire concepts of terms which are constructedwith explicit stipulative definitions and explana-tions offered in documents. The revealed conceptwas therefore entirely contextual and independentof that which we have already known about.
4 Results
We treated the top 100 out of 8298 (3568 propernouns) nouns as important terms. Three of themare explicitly defined in Prime Minister Abe’sutterances: Sekkyokuteki-hewa-syugi (Proactivepacifism), Sonritsu-kiki-jitai, and Rikken-syugi(Constitutionalism). Sekkyokuteki-hewa-syugiwas ranked as the 17th most important term amongall the nouns. The cluster dendrogram of 68 sen-tences which were in the term’s concordance isshown in figure 1. Sonritsu-kiki-jitai was rankedas the 24th most important term among all the
6Besides these two phrases, various expressions are usedto define terms. Since there haven’t been a comprehensivesummary of definition/stipulation expressions yet, we maynot be able to extract all the potential defined terms.
7Most utterances were repeated twice at the House ofRepresentatives and the House of Councilors.
92

4151
46 2
17 6719
2516 22
28 4857
5 3236
14 5223
6421
69 66 59 6218
241 26
3334
15 6027
5010 40
3145 47
42 30 2913 9
5568 65 63 61 58 54 49 46 44 20 39
335 37
7 4338
11 5653 8 12
010
2030
4050
Sentence number
Height
Figure 1: Cluster dendrogram of Sekkyokuteki-hewa-syugi
38
12 33
2 39
36 21
18 19
5 17
26 34
7
3
10
13 23
32 9
15
6 11 22 27
4
25
20 37
14
24
31 8
16
1 29
30
28 35
05
1015
2025
3035
Sentence number
Height
Figure 2: Cluster dendrogram of Sonritsu-kiki-jitai
nouns. The clustering result of 39 sentences isshown in figure 2. Rikken-syugi was ranked as the72nd most important term among all the nouns.The clustering result of 22 sentences is shown infigure 3. Few terms were defined in utterances ofPrime Ministers (15 terms in total).
Mutually contradictory explanations werefound in the concordance of Sonritsu-kiki-jitai.Specifically, this term is currently translatedto ‘an armed attack against foreign countryresulting in threatening Japan’s survival’, andis defined as a situation that ‘an armed attackagainst Japan or a foreign country that is in aclose relationship with Japan occurs, and as aresult, threatens Japan’s survival and poses aclear danger to fundamentally overturn people’sright to life, liberty and pursuit of happiness’ bythe Ministry of Foreign Affairs of Japan. The
4
5
9
21
16
12 14
22 7
17 18
1 6
15 20
3 2
8 19
13
10 1105
1015
2025
Sentence number
Height
Figure 3: Cluster dendrogram of Rikken-syugi
situation is also one of three new conditions bywhich “use of force” as measures for self-defenseis strictly limited8. This definition was mentionedtwo times in Prime Minister Abe’s utterances(the 189th session on 26th May and 27th July,2015). However, it was also mentioned severaltimes that to determine whether a situation isa Sonritsu-kiki-jitai requires a comprehensiveanalysis by the government (18th May, 26thMay, 29th May, 27th July, 2015; 27th Jan, 2016).Concisely, the concept of Sonritsu-kiki-jitai isa ‘clear danger’ that requires a ‘comprehensiveanalysis’ to determine whether it is a clear dangeror not. This conceptual inconsistency turns one ofthe limitations on “use of force” into a mere scrapof paper.
5 Discussion
Political discourse is always vague and ambigu-ous. Nonetheless, we can still recognize in whatmanner it is vague and ambiguous. Even thoughthe mission of fact-checking is ‘not to measurewhich candidate “lies most” but rather to providethe public with information about the accuracy ofstatements’ (Amazeen, 2015), in respect of accu-racy, the information about how political figuresperformed their language is as important as the in-formation about what really occurred.
This ongoing work opens a novel perspectiveon WSD for political discourse as well as fact-checking, by pointing out that a confirmation ofconcepts of terms which formed discourse is a pre-requisite for analyzing formal utterances by polit-ical figures.
Our framework makes it possible for the pub-lic and/or journalists to recognize the most impor-tant terms as well as their stipulative concepts inan objective way. Moreover, we revealed the pos-sibility that conceptual incosistency can also existin a single term as exemplified by revealed conceptof Sonritsu-kiki-jitai. This indicated that there is apossibility that a term could be meaningless due toan inherent self-contradiction in its concept.
Due to inadequate explicit information in PrimeMinister Abe’s utterances, few concepts were re-vealed. This identified a weakness of our ap-proach, i.e., it relies on how explicitly a speakerstipulated a term. Nonetheless, from another per-spective, by focusing on the lack of explicit def-initions and explanations of important terms in
8http://www.mofa.go.jp
93

discourse, The vagueness and ambiguity of utter-ances could be evaluated.
Our work is an ongoing research aims at es-tablishing a practical standard for terminologicalanalysis of political discourse. To start with, weprovided this framework for revealing concepts ofterms in political discourse. It could be techni-cally improved in the following ways: 1) by an-alyzing the structure of documents’ terminologysets and applying suitable term weighting models,we may generate a more applicable term ranking;2) by discovering patterns of stipulative definitionand explanation, we may assemble a more ade-quate concordance of a term from discourse; and3) by applying suitable clustering and summariza-tion methods, we may create a better balance be-tween precision and concision.
Acknowledgments
We would like to thank National Diet Library ofJapan for allowing free use of retrieval system ofthe Diet Record of Japan.
ReferencesMichelle A. Amazeen. 2015. Revisiting the epistemol-
ogy of fact-checking. Critical Review 27(1):1–22.
Tolga Bolukbasi, Kai-Wei Chang, James Y Zou,Venkatesh Saligrama, and Adam T Kalai. 2016.Man is to computer programmer as woman is tohomemaker? debiasing word embeddings. In D. D.Lee, M. Sugiyama, U. V. Luxburg, I. Guyon, andR. Garnett, editors, Advances in Neural Informa-tion Processing Systems 29, Curran Associates, Inc.,pages 4349–4357.
Michael Denkowski. 2009. A survey of techniques forunsupervised word sense induction. Language &Statistics II Literature Review pages 1–18.
Roberto Navigli. 2009. Word sense disambiguation: Asurvey. ACM Computing Surveys 4(2):10.
Joseph E. Uscinski. 2015. The epistemology of factchecking (is still naive): Rejoinder to amazeen.Critical Review 27(2):243–252.
Joseph E. Uscinski and Ryden W. Butler. 2013. Theepistemology of fact checking. Critical Review25(2):162–180.
94

Proceedings of the 2017 EMNLP Workshop on Natural Language Processing meets Journalism, pages 95–99Copenhagen, Denmark, September 7, 2017. c©2017 Association for Computational Linguistics
A News Chain Evaluation Methodology along with a Lattice-basedApproach for News Chain Construction
Mustafa [email protected]
Izmir Institute of Technology,35430, Urla, Izmir, Turkey
Ozer [email protected]
KTH Royal Institute of Technology,Stockholm 100-44, Sweden
Selma [email protected]
Izmir Institute of Technology,35430, Urla, Izmir, Turkey
Abstract
Chain construction is an important re-quirement for understanding news and es-tablishing the context. A news chain canbe defined as a coherent set of articles thatexplains an event or a story. There’s a lackof well-established methods in this area.
In this work, we propose a methodology toevaluate the “goodness” of a given newschain and implement a concept lattice-based news chain construction method byHossain et al.. The methodology part isvital as it directly affects the growth of re-search in this area. Our proposed method-ology consists of collected news chainsfrom different studies and two “good-ness” metrics, minedge and dispersioncoefficient respectively. We assess theutility of the lattice-based news chain con-struction method by our proposed method-ology.
1 Introduction
A news story is a compelling organization of newsto give an overall idea about an event or a set of re-lated events. Generally this organization follows atime order and has topical coherence. The mostcommon approach to construct a news chain iscalled “connecting the dots” (Shahaf and Guestrin,2010). In this approach, there are predeterminedstart and end points and the task is to find a coher-ent sequence of articles between them.
In today’s substantial news flow, tracking allnews to understand an event or establish connec-tions between related events is a challenge. Thus,automated mechanisms are needed to constructnews chains and to support users in making newsstories.
Our intended contribution is thus twofold: First,there’s a need for a methodology in order to assessthe quality of given news chains. Second, we im-plemented a state-of-the-art method that is basedon the concept lattice representation of the newsarticles and evaluated its effectiveness in a moreextensive way than the provided and additionallyusing our methodology.
In order to establish a news chain assessmentmethodology, we refer to two independent “good-ness” metrics that are proposed, and experimen-tally validate and compare them in the same ex-perimental setup. As far as we know, there is nosuch unifying experimental design that has a setof news chains and run of these metrics under thesame conditions. Thus, we provide an evaluationregarding the utility of the proposed metrics in thequality assessment of news chains. Our findingis that minedge metric proposed by (Shahaf andGuestrin, 2010) behaves in a consistent way, butdispersion coefficient metric suggested by (Hos-sain et al., 2011) does not serve the purpose as ex-pected.
As for the task of news chain construction, uti-lizing concept lattice-based representation of newsarticles (Hossain et al., 2011) is in accordance withour intuition. When we considered order relations,the sequence of articles that form a chain has alinear order. This linearity is provided by a totalorder relation. As partial order relations are moregeneric than their total order counterparts, our ideawas to define a partial order relation over the setof articles and obtain a pool of news chain can-didates out of the generated hierarchy. Thus, wecreate partially ordered news articles using theircontent. In this sense, we use a proposed prun-ing and heuristic (Hossain et al., 2011) to extractuseful news chains out of the candidate pool. Weevaluate the “goodness” of the constructed chainsby the use of established methodology.
95

2 Related Work
News chain construction aims to discover hiddenlinks between news articles in large news corpora.There are two main works that utilize the connect-ing the dots approach as the basis.
Connecting the dots approach proposed by Sha-haf et al. (Shahaf and Guestrin, 2010) tries to en-sure a coherent news chain. A coherent news chainis characterized with smooth transitions betweenall articles through the whole chain besides strongpairwise connection between consecutive articles.The problem is formalized as a linear program toput constraints for ensuring strong pairwise asso-ciation and smooth transitions all along the chain.
An alternative method for connecting the dotsbetween news articles is suggested by Hossain etal. (Hossain et al., 2011), which is implementedwithin the scope of this study. The method isbased on Swanson’s complimentary but disjointhypothesis (Swanson, 1991). Swanson character-izes an ideal chain as one that satisfies a distancethreshold between consecutive article pairs whiledoes not oversatisfy the threshold between non-consecutive news articles. The method constructsthe chain out of a concept lattice. Concepts rep-resent closed termsets. An article’s successors areselected from the concept with the largest termsetthat contains this article. The next article in thechain is determined with respect to two criteria:clique size (k), and distance threshold. k neigh-bors are determined with respect to Soergel dis-tance at each step and A* search algorithm is runto find out the chain with the given endpoint.
3 Method
3.1 Methodology on the Evaluation of NewsChains
In literature, there is no well-established method-ology to measure the goodness of a given newschain. Two works propose different, indepen-dent mechanisms to evaluate news chains but theyare not experimentally validated or compared witheach other as part of a methodology. Moreover,there is a lack of ground-truth datasets in this area.
In an effort to establish such a methodology,we were in search of some ground-truth thus wecollected already produced news chains by differ-ent works. Referring to the example chain pro-vided by (Shahaf and Guestrin, 2010), we con-structed that chain by searching the given article
titles in the New York Times Portal. We namedthis chain as Shahaf et. al. news chain. As a con-trol condition, we constructed another chain outof this by putting three copies of the fourth doc-ument (41070964.xml) in its place. We call thisnews chain Shahaf et. al. control 1.
As another published news chain, we referred toAlderwood story (ah Kang et al., 2009) providedas part of the VAST 2006 challenge (Whitinget al., 2009). The dataset (composed of 1182 doc-uments) provides a ground-truth chain of length 19(VAST 2006 Challenge news chain).
In addition to these news chains, three randomnews chains of equal length are produced from theNew York Times Annotated Corpus (Sandhaus,2008).
A news chain evaluation methodology needsmethods to calculate some “goodness metrics”.One such method quantifies a news chain with re-spect to its coherence by using a linear program(Shahaf and Guestrin, 2010). The linear programuses kTrans and kTotal as constraints to com-pute the minedge objective value. Thus, our firstgoodness metric is minedge.
3.1.1 Minedge - Linear ProgrammingApproach
The proposed linear program calculates two kindsof scores for every word in the chain. The firstone is the activation score (act), which is the fre-quency difference of a word in two consecutivedocuments. As for the second; the initiation score(init), the difference between the activation scoresof a word in consecutive document pairs is calcu-lated:
act = freq(i + 1)− freq(i) (1)
init = act(i + 1)-act(i) = freq(i + 2)-2freq(i + 1) - freq(i)(2)
The linear program makes word selection withrespect to these activation and initiation scores. Inother words, the linear constraints are defined interms of activation and initiation variables. Thefirst constraint variable kTotal constrains the sumof initiation scores in the whole chain. The otherconstraint variable, kTrans limits the sum of ac-tivation scores on individual document transitions.
In order to calculate the minedge objectivevalue, the activation score of a word in a documentpair is weighted by the influence of that word in
96

connecting those two documents and the weightedactivation scores are summed. The objective is tomaximize this sum.
The influence of a word in connecting the doc-ument pairs is calculated based on the document-word bipartite graph. In this graph, documents andwords are nodes and normalized word frequenciesare the edge weights. The influence of a word w inconnecting the document d1 to the document d2 iscalculated by the use of the path that connects d1
to d2 over w:
influence(di, di+1|w) = p(w|di).p(di+1|w)(3)
In the original implementation of the minedgemetric value, (Shahaf and Guestrin, 2010) statethat they use random walk on the document-wordbipartite graph to calculate the influence of words.On the other hand, we apply the formula in equa-tion 3 for simplicity.
One of the key issues in this linear program istuning parameters kTotal and kTrans to maxi-mize the minedge value. In order to determinethe best parameter values, we plotted kTotal,kTrans, and minedge values in 3D (Figure 1).As can be seen from the plot, the dark red areasrepresent the maximized values of minedge, thus,we selected kTotal and kTrans values belongingto those areas.
Figure 1: minedge values with respect to kTotaland kTrans.
We use the maximum minedge value to quan-tify the coherence of a given news chain. Thus, inthe given example the coherence score determinedby the minedge value is 0.053625.
3.1.2 Dispersion coefficientAnother proposed metric to measure the qualityof news chains is dispersion coefficient thatis calculated based on Soergel distances (Hossainet al., 2012b).
Soergel distance between two documents is cal-culated considering all the words in the set of doc-uments. The difference between the weights in thefirst and second document is summed for everyword and this sum is normalized by the sum ofthe max. of those two weights for each word:
D(d1, d2) =
∑t|wt,d1 − wt,d2 |∑
tmax(wt,d1 , wt,d2)
(4)
The weight of a word for a document is calcu-lated using a variant of TF-IDF cosine normaliza-tion (Hossain et al., 2012a).
Soergel distance returns 0 for two identical doc-uments and 1 for documents that do not overlap.
The dispersion coefficient metric-based qual-ity evaluation is premised on Swanson’s CBD(complimentary but disjoint) hypothesis (Swan-son, 1991). The method computes a coherencescore on the basis of Soergel distances betweenconsecutive and non-consecutive pairs along thechain.
Dispersion coefficient is computed using thefollowing formula:
V = 1− 1n− 2
n−3∑i=0
n−1∑j=i+2
disp(di, dj) (5)
In the formula, disp dispersion value inside thenested sums becomes positive when the angle be-tween document pairs is above a specified thresh-old (or the distance between document pairs is be-low a specified threshold), otherwise it’s 0. In thecases where it’s positive, if the position differenceof documents of pair is high, it affects by taking ahigher value in other words it reduces the value ofdispersion coefficient in a larger extent:
disp(di, dj) =
{1
n+i−j , if D(di, dj) > Θ
0, otherwise
3.2 News Chain ConstructionIn this paper, we implemented the chain construc-tion method suggested by Hossain et al.. The workconstructs a concept lattice from the inverted indexof documents and represents each closed termset
97

Chain length Minedge valueShahaf et. al. 8 0.02
Shahaf et. al. control 10 0.018VAST 2006 Challenge 19 0.0064Random news chain 1 8 0.0055Random news chain 2 8 0.0036Random news chain 3 8 0.0023
Table 1: Minedge metric values.
by a unique concept. Each concept has termsas extents and documents as intents. We usedCHARM-L algorithm (Zaki and Hsiao, 2005) togenerate this concept lattice structure.
In order to generate promising candidate chainsout of this lattice, an initial document has to bedetermined. The algorithm then proceeds by look-ing for the largest extent size concept that includesthis initial document in its intent set. After that; in-side this concept, candidate chains are sought us-ing local neighborhood-based search. The searchheuristic is defined by two criteria. Clique sizedetermines the maximum number of neighbors toevaluate at each stage whereas distance thresholdcriterion makes a selection out of them.
As we worked with the VAST 2006 Challengedataset, we selected the start document as theinitial document of the VAST 2006 Challengeground-truth chain. Then, we worked with 3clique-size and 10 clique candidates (a total of 103 cliques) in order to find a good set of successors.As a result, we created all candidate chains fromthe VAST dataset.
3.3 Experimental Results
We calculated our goodness metrics for the newschains in our experimental design. In Table 2,minedge metric values are shown. When we lookat the obtained values, we observe that ground-truth chains have higher values than the randomlygenerated ones. Additionally, Shahaf et. al. con-trol 1 gets a lower value compared to its orig-inal chain. Thus, the results support the claimthat minedge metric value behaves in a correctand consistent way in measuring the coherence ofgiven news chains.
As a second part of our experiment, we com-puted the dispersion coefficient values for all thechains by fixing the Soergel distance thresholdvalue as 0.22 and 0.25 respectively.
The obtained dispersion coefficient values donot seem to work well in the quality assessmentof news chains. First of all, Shahaf et. al. control
Chain length Threshold 0.22 Threshold 0.25Shahaf et. al. 8 0.836111 0.483333
Shahaf et. al. control 1 10 0.984375 0.615625Shahaf et. al. control 2 10 0.829167 0.600893VAST 2006 Challenge 19 0.862132 0.571804VAST lattice all avg. 7.5 0.873 0.401Random news chain 1 8 1.0 0.394444Random news chain 2 8 0.883333 0.316666Random news chain 3 8 1.0 0.711111
Table 2: Dispersion coefficient values.
1 has a higher score than Shahaf et. al.. Shahafet. al. control 1 has three copies of the fourthdocument and it is desired to have a lower disper-sion value since repeating exactly the same newswill not contribute to chain coherence. However,the dispersion coefficient approach does not con-sider the repetition of documents as a semantic pa-rameter, it simply penalizes nonconsecutive doc-uments which over-satisfies the distance thresh-old as a document pair. However, for a givenchain we cannot know how close the nonconsec-utive documents are beforehand. In order to ver-ify this idea, we added a second control condi-tion (Shahaf et. al. control 2) in which we re-peated the fourth document at the beginning, mid-dle, and end points, which resulted in lower disper-sion coefficient values since non-consecutive iden-tical document pairs have the distance value 0 andpenalty is higher due to higher index differences.Moreover, random chains (Random news chain 3)can get comparable higher scores for this measure.
As for the lattice-based news construction al-gorithm, the average score for all the constructedchains does not make an important differencewhen compared with the VAST 2006 Challengeground-truth chain.
4 Conclusion
The first goodness metric, minedge gives correctand consistent results. However, the dispersion co-efficient values fail to evaluate the “goodness” ofgiven news chains. The reason can be attributedto disregarding the consecutive document pairs inthe calculation of the coefficient value. Becausepenalizing with respect to far away documents inthe chain is necessary but not sufficient conditionfor a chain definition. At the same time, strongpairwise association must be guaranteed.
When it comes to the lattice-based news chainconstruction algorithm, extensive experimentalvalidation is needed. Moreover, alternative pathtraversal heuristics can be adapted to the con-structed lattice to produce coherent news chains.
98
Acknowledgments
This paper is based on work supported by theScientific and Technological Research Councilof Turkey (TUBITAK) under contract number114E784.
ReferencesYoun ah Kang, Carsten Gorg, and John T. Stasko. 2009.
Evaluating visual analytics systems for investiga-tive analysis: Deriving design principles from a casestudy. In Proceedings of the IEEE Symposium on Vi-sual Analytics Science and Technology, IEEE VAST2009, Atlantic City, New Jersey, USA, 11-16 Oc-tober 2009, part of VisWeek 2009. pages 139–146.https://doi.org/10.1109/VAST.2009.5333878.
M. S. Hossain, J. Gresock, Y. Edmonds, R. Helm,M. Potts, and N. Ramakrishnan. 2012a. Connect-ing the dots between PubMed abstracts. PLoS ONE7(1):e29509.
M Shahriar Hossain, Christopher Andrews, Naren Ra-makrishnan, and Chris North. 2011. Helping intelli-gence analysts make connections. Scalable Integra-tion of Analytics and Visualization 11:17.
M. Shahriar Hossain, Patrick Butler, Arnold P. Boedi-hardjo, and Naren Ramakrishnan. 2012b. Sto-rytelling in entity networks to support intelli-gence analysts. In Proceedings of the 18thACM SIGKDD International Conference on Knowl-edge Discovery and Data Mining. ACM, NewYork, NY, USA, KDD ’12, pages 1375–1383.https://doi.org/10.1145/2339530.2339742.
E. Sandhaus. 2008. The New York Times AnnotatedCorpus. Linguistic Data Consortium, Philadelphia6(12).
Dafna Shahaf and Carlos Guestrin. 2010. Connect-ing the dots between news articles. In Proceedingsof the 16th ACM SIGKDD International Conferenceon Knowledge Discovery and Data Mining, Wash-ington, DC, USA, July 25-28, 2010. pages 623–632.https://doi.org/10.1145/1835804.1835884.
Don R. Swanson. 1991. Complementary structuresin disjoint science literatures. In Proceed-ings of the 14th Annual International ACMSIGIR Conference on Research and Devel-opment in Information Retrieval. ACM, NewYork, NY, USA, SIGIR ’91, pages 280–289.https://doi.org/10.1145/122860.122889.
M.A. Whiting, Chris North, Alex Endert, J. Scholtz,J. Haack, C. Varley, and J. Thomas. 2009.Vast contest dataset use in education. InVisual Analytics Science and Technology,2009. IEEE VAST 2009.. pages 115 –122.https://doi.org/10.1109/VAST.2009.5333245.
Mohammed J. Zaki and Ching-Jui Hsiao. 2005.Efficient algorithms for mining closed item-sets and their lattice structure. IEEE Trans.on Knowl. and Data Eng. 17(4):462–478.https://doi.org/10.1109/TKDE.2005.60.
99

Proceedings of the 2017 EMNLP Workshop on Natural Language Processing meets Journalism, pages 100–105Copenhagen, Denmark, September 7, 2017. c©2017 Association for Computational Linguistics
Using New York Times Picks to Identify Constructive Comments
Varada KolhatkarDiscourse Processing LabSimon Fraser University
Burnaby, [email protected]
Maite TaboadaDiscourse Processing LabSimon Fraser University
Burnaby, [email protected]
Abstract
We examine the extent to which we areable to automatically identify constructiveonline comments. We build several classi-fiers using New York Times Picks as posi-tive examples and non-constructive threadcomments from the Yahoo News Anno-tated Comments Corpus as negative ex-amples of constructive online comments.We evaluate these classifiers on a crowd-annotated corpus containing 1,121 com-ments. Our best classifier achieves a topF1 score of 0.84.
1 Introduction
Online commenting allows for direct communi-cation among people and organizations from var-ious socioeconomic classes on important issues.Popular news articles receive thousands of com-ments, but not all of them are constructive. Belowwe show examples of a constructive and a non-constructive comment on an article about HillaryClinton’s loss in the presidential election in 2016.1
(1) There is something inherently sexist about the as-sumption that women are incorruptible and naturallygroomed to be better leaders than their male counter-parts by virtue of being female. It is troubling to seeintelligent sexist women relay the disturbingly sub-standard notion that despite Hillary Clinton’s deeplyflawed and frankly troubling history, this one heremust be revered at all cost. Women are equal underthe law, and as such should be held to the same legal,ethical, and job performance standards - regardless oftheir gender or power.
(2) If you think she lost because she was a women thenyou are really out to lunch. Gender has nothing to dowith it.
1https://www.theglobeandmail.com/opinion/thank-you-hillary-women-now-know-retreat-is-not-an-option/article32803341/
The first one, which was labelled as construc-tive by our annotators (see Section 3), presentsan argument (that women should be equal inall aspects), a challenge to an assumption (thatwomen are incorruptible), and a protest againstoverlooking Ms. Clinton’s flaws because of hergender. The second comment, labelled as non-constructive, exhibits a dismissive tone (you arereally out to lunch), and provides no supportingevidence for the claim that gender was not a factorin the election.
There is growing interest in automatically or-ganizing reader comments in a sensible way(Napoles et al., 2017; Llewellyn et al., 2014). Oneuseful way to organize comments is based on theirconstructiveness, i.e., by identifying which com-ments provide insight and encourage a healthy dis-cussion. For instance, The New York Times manu-ally selects and highlights comments representinga range of diverse views, referred to as NYT Picks.
In this paper, we focus on this problem of identi-fying constructive comments. We define construc-tive comments as those that contribute to the dia-logue, which provide insights relevant to the arti-cle, perhaps supported by evidence, and developcomputational methods for identifying construc-tive comments.
The primary challenge in developing a com-putational system for constructiveness is the lackof annotated data. There is no systematically-annotated training data available for constructive-ness of individual comments. So we explore theavailable resources: a set of NYT Picks as positiveexamples and non-constructive thread commentsfrom the Yahoo News Annotated Comments Cor-pus (YNACC) (Napoles et al., 2017) as negativeexamples for constructiveness. We train supportvector machine classifiers and bidirectional longshort-term memory networks on this combinationdataset and achieve a top F1 score of 0.84 on an
100

unseen test dataset containing 1,121 constructiveand non-constructive reader comments from thewebsite of a different newspaper, The Globe andMail.2
2 Related work
Napoles et al. (2017) define constructiveness ofcomment threads in terms of ERICs—Engaging,Respectful, and/or Informative Conversations.They train four machine learning models on 2.1kannotated Yahoo News threads and report an F1score of 0.73 as their highest when identifyingconstructive news threads. We deal with a simi-lar problem, but in our case we examine individualcomments, rather than threads, as there is value inidentifying constructive comments as they comein rather than waiting for a thread to degenerate(Wulczyn et al., 2016). Work closer to ours is thatof Park et al. (2016), who explore New York Timescomments extracted using the New York TimesAPI to distinguish between NYT Picks and non-picks. They train an SVM classifier on a skeweddataset containing 94 NYT Picks and 5,174 non-picks and achieve a cross-validation precision of0.13 and recall of 0.60. NYT Picks have alsobeen used to study editorial criteria in commentselection. For instance, Diakopoulos (2015) ana-lyzed 5,174 NYT Picks and found that they showhigh levels of argument quality, criticality, internalcoherence, personal experience, readability, andthoughtfulness.
The data used by Napoles et al. (2017) doesnot contain constructiveness annotations for indi-vidual comments, but only for comment threads.The NYT Picks used by Diakopoulos (2015) andPark et al. (2016) are good representatives of con-structive comments, but non-picks are not nec-essarily non-constructive, as only a few com-ments among thousands of comments are selectedas NYT Picks. We create our training data bycombining these two resources: NYT Picks forpositive examples and non-constructive commentthreads from the YNACC3 for negative examples.
3 Datasets
Training and validation data We propose touse NYT Picks as representative training data forconstructiveness. The New York Times, like manynewspaper sites, provides a platform for readers to
2https://www.theglobeandmail.com3https://webscope.sandbox.yahoo.com
comment on stories posted on the site. The com-ments are manually moderated, by a team of only13 moderators.4 As a result, only about 10% ofthe stories published are open for commenting.5
Comments are classified into three categories: allcomments, readers’ picks, and NYT Picks. NYTPicks are curated by the team of human modera-tors, and are chosen because they are interestingand helpful, but also based on the region or thereader.6 Below we show an example of a NYTpick on an article about a young girl’s suicide dueto cyber-bullying.7 The comment urges readers totake an action against cyberbulling, and does so byencouraging others to discuss the hurtful nature ofattacks online.
(3) All of us — moms, dads, sisters, brothers, and friendsneed to talk about how words hurt. We need to take astronger stance against damaging attacks — Just sayno to texting or saying such hurtful comments, racialepithets, etc. We often lament how electronic com-munication enables uncivil speech, but we need toaddress the root of the problem here — why 12 yearolds (indeed people of any age) are urging anotherperson to kill herself.
Our positive training examples have 15,079NYT Picks extracted using the NYT API.8 Ournegative training examples consist of 15,950comments occurring in negative threads in theYNACC (Napoles et al., 2017), which containsthread-level constructiveness annotations for Ya-hoo News comment threads. Because we are inter-ested in individual comments, rather than threads,we consider all comments from a non-constructivethread to be non-constructive. An example of acomment from a non-constructive thread is shownin (4).
(4) What makes you think that he’s not sleeping with therobots already ;).
The training data is split into training set (90%)and validation set (10%).
4https://www.nytimes.com/times-insider/2014/04/17/a-comments-path-to-publication/?_r=0
5https://www.nytimes.com/interactive/2016/09/20/insider/approve-or-reject-moderation-quiz.html
6https://www.nytimes.com/content/help/site/usercontent/usercontent.html/#usercontent-nytpicks
7http://www.nytimes.com/2013/09/14/us/suicide-of-girl-after-bullying-raises-worries-on-web-sites.html
8https://developer.nytimes.com/
101

Feature Description
Length features (4) Number of tokens in the comment, number of sentences,average word length, average number of words per sentence
Argumentation features (5) Presence of discourse connectives (therefore, due to)Reasoning verbs (cause, lead), modals (may, should)Abstract nouns (problem, issue, decision, reason)Stance adverbials (undoubtedly, paradoxically)
Named-entity features (1) Number of named entities in the commentText quality features (2) Readability score & personal experience description score
Table 1: Constructiveness features.
Test data Our test data consists of 1,121 com-ments downloaded from the site of The Globeand Mail, a Canadian daily. We conducted anannotation experiment using CrowdFlower,9 ask-ing annotators to read the article each commentrefers to (a total of 10 articles), and to label thecomment as constructive or not. For quality con-trol, 100 units were marked as gold: annotatorswere allowed to continue with the annotation taskonly when their answers agreed with our answersto the gold questions. As we were interested inthe verdict of native speakers of English, we lim-ited the allowed demographic region to English-speaking countries. We asked for three judg-ments per instance and paid 5 cents per annotationunit. Percentage agreement for the constructive-ness question on a random sample of 100 anno-tations was 87.88%, suggesting that constructive-ness can be reliably annotated. Other measures ofagreement, such as kappa, are not easily computedwith CrowdFlower data, because many differentannotators are involved. Constructiveness seemedto be equally distributed in our dataset: Out of the1,121 comments, 603 comments (53.79%) wereclassified as constructive, 517 (46.12%) as non-constructive, and the annotators were not sure inonly one case.10 We have made the corpus andannotation guidelines publicly available.11
4 Experiments
We present results of three sets of experiments: 1)identifying constructive comments using supportvector machine classifiers (SVMs) and construc-tiveness features, 2) predicting constructive com-
9https://www.crowdflower.com/10In our experiments we consider this comment as a non-
constructive comment.11https://github.com/sfu-discourse-lab/
Constructiveness_Toxicity_Corpus
Measure Training TestingC NC C NC
Mean 132.06 46.53 100.19 24.06SD 71.36 87.52 81.34 19.08
Table 2: The mean length in words and stan-dard deviation (SD) for constructive and non-constructive comments. C = Constructive and NC= Non-constructive.
ments using bi-directional long-short term mem-ory neural networks (biLSTMs) and word embed-dings, and 3) examining the effectiveness of usingNYT picks as representative positive examples forconstructiveness.
4.1 SVMs with constructiveness features
We train several SVM classifiers with a number ofconstructiveness features, shown in Table 1.
Word features We wanted to examine whethercertain words or phrases are more common in con-structive or non-constructive comments. For thatwe extracted features representing 1- to 4-gramcounts and TF-IDF features.
Length features Constructive comments tend tocontain long sentences and long content words.We include four length features, as shown in Ta-ble 1. Note that this feature class can also serveas a baseline—if the length alone is sufficient toidentify constructiveness, we may not need to ex-plore more sophisticated features for constructive-ness. Table 2 shows the mean length in wordsand standard deviation for constructive and non-constructive comments in our training and testdata. In general, constructive texts tend to belonger and in all cases there is great variation inlength.
102

Argumentation features We postulate a posi-tive correlation between features of argumentativetext and news comments. An argumentative textis one that contains argumentation, i.e., a claimsupported by evidence, and presented as a coher-ent whole. The extensive literature on argumenta-tion has identified linguistics aspects that pinpointto argumentative texts (Biber, 1988; van Eemerenet al., 2007; Moens et al., 2007; Tseronis, 2011;Habernal and Gurevych, 2017). Based on thisresearch, we include argumentation lexical cues,such as discourse connectives and stance adver-bials, in our set of features.
Named-entity features Our hypothesis is thatcomments providing evidence and personal expe-riences (i.e., constructive comments) tend to con-tain named entities (e.g., Hillary Clinton, the Gov-ernment, names of public institutions).
Text-quality features We include two featuresfrom Park et al. (2016), readability score and per-sonal experience score. Park et al. (2016) alsopropose a method to identify high quality com-ments, in their case modelling on NYT Picks andnon-picks. Some of their criteria are external tothe comment (relevance to the article, whether itwas recommended by other readers), but, since wewant to rely exclusively on the comment content,we chose the two criteria that do so, both calcu-lated using their tool.
We trained linear SVM classifiers with severalfeature combinations from the above set of fea-tures using sklearn.12 These models predict con-structive comments in our test data. Some of thebest validation and prediction results of these clas-sifiers are shown in Table 3.
4.2 biLSTMs with word embeddings
We wanted to examine to what extent a neuralnetwork model is able to learn relevant patternsof constructiveness from NYT Picks. We trainedbidirectional long short-term memory networks(biLSTMs) with word embeddings on our trainingdata. We initialized the embedding layer weightswith GloVe vectors (Pennington et al., 2014). ThebiLSTM models are usually used for sequentialpredictions. Although our task is not a sequen-tial prediction task, the primary reason for us-
12http://scikit-learn.org/stable/modules/generated/sklearn.linear_model.SGDClassifier.html
Model Validation TestP R F1 P R F1
Random .51 .50 .50 .49 .50 .49
SVM
Feat
ures wf .84 .83 .83 .81 .80 .80
lf .80 .80 .80 .79 .79 .79af .75 .74 .75 .73 .73 .73tqf .81 .81 .81 .83 .77 .76nef .74 .73 .74 .72 .69 .68af+tqf+nef .80 .78 .79 .84 .84 .84
biLSTM .86 .86 .86 .82 .81 .81
Table 3: Constructiveness prediction results.P=average precision (for constructive and non-constructive
classes), R=average recall, F1=average F1 score, wf=word
(features), lf=length, af=argumentative, tqf=text quality,
nef=named entity.
ing biLSTMs is that these models can utilize theexpanded paragraph-level context and learn para-graph representations directly. They have recentlybeen used in diverse text classification tasks, suchas stance detection (Augenstein et al., 2016), sen-timent analysis (Teng et al., 2016), and medicalevent detection (Jagannatha and Yu, 2016).
We use bidirectional LSTMs as implementedin TensorFlow.13 We trained with the ADAMstochastic gradient descent for 10 epochs. Theimportant parameter settings are: batch size=512,embedding size=200, drop out=0.5, and learningrate=0.001. Results for the biLSTM classifier arealso shown in Table 3. Note that the point of theseresults is to demonstrate the feasibility of automat-ically identifying constructive comments and theparameter setting may not be the optimal one.
4.3 Effectiveness of NYT Picks
To examine the effectiveness of using NYT Picksas representative positive training examples forconstructiveness, we carried out experiments withtraining data containing a homogeneous sam-ple from YNACC, in particular, by consideringcomments from constructive YNACC threads asconstructive examples and comments from non-constructive threads as negative examples. Whentrained on this homogeneous YNACC trainingdata, we observed P, R, and F1 of 0.72, 0.71, and0.71, respectively. These numbers are markedlylower compared to the numbers we obtained whenwe used NYT Picks for training (F1 = 0.81), sug-gesting that using NYT Picks as positive exam-ples for constructiveness does help. NYT Picks
13https://www.tensorflow.org/
103

are chosen by human experts and are better repre-sentatives of constructiveness. Although the per-formance numbers with homogeneous YNACClook similar to the numbers reported in Napoleset al. (2017), recall that Napoles et al. (2017) fo-cus on a different problem of identifying construc-tive conversation threads. A constructive threadmay have a non-constructive comment and vice-versa. Moreover, they report cross-validation re-sults, whereas we are reporting results on our testdata containing reader comments from a differentnews paper.
5 Discussion and conclusion
We have explored several approaches to the prob-lem of detecting constructiveness in online com-ments, focusing specifically on news comments.Constructiveness is a desirable feature in onlinediscussion, and a constructiveness classifier can beuseful for moderation tasks, typically performedby humans. Our methods achieve a top F1 scoreof 0.84, which is probably sufficient to assist newscomments moderators.
We used two sets of available data as positiveand negative examples for the classifiers: NewYork Times Picks as positive examples of con-structiveness, and comments belonging to non-constructive threads from the Yahoo News Anno-tated Comments Corpus. Our test data consistedof 1,121 examples annotated for constructivenessthrough CrowdFlower.
Our methods can be grouped under two maincategories: SVMs with various features and bidi-rectional LSTMs. For SVMs, we considered fiveclasses of features: word, length, argumentation,named entity, and text quality features. Our bestF1 score is 0.84 on the test set with the combina-tion of argumentation, text quality, and named en-tity features. The length features alone give a highF1 score of 0.79. But when we combine them withother features the performance does not increase.On the other hand, argumentation, text quality, andnamed entity features seem to be complementaryand give the best results when combined together.
Our biLSMT model requires only a vector rep-resentation of the text. We use an embedding layerinitialized with GloVe vectors, and achieved anF1 score of 0.81 with this model. Note the sim-ilar performance of SVMs with word features andbiLSTMs. We do not conclude from these exper-iments that either method is superior, since these
are preliminary results and many other parametercombinations are possible. The point of these re-sults is just to demonstrate the feasibility of au-tomating the task of identifying constructivenessin news comments. A more rigourous investiga-tion needs to be carried out in order to compareand understand the differences between SVMs andbiLSTMs for this problem.
We achieved superior results when we usedNYT Picks as positive training examples forconstructiveness, suggesting that human-selectedNYT Picks are better representatives of construc-tiveness.
A number of research avenues are planned forthis project. First, we are interested in exploringother relevant features for constructiveness, suchas the use of emoticons and fine-grained named-entity features (e.g., occurrences of a journalist’sname). Second, we are interested in exploring therelation between constructiveness and toxicity. Fi-nally, we are working towards making our compu-tational system for identifying constructive com-ments robust and easily accessible.
Acknowledgments
We are grateful to Nicholas Diakopoulos forpromptly providing us 5,232 NYT Picks, whichare part of our training data. Thank you to the re-viewers for constructive feedback.
ReferencesIsabelle Augenstein, Tim Rocktaschel, Andreas Vla-
chos, and Kalina Bontcheva. 2016. Stance detec-tion with bidirectional conditional encoding. In Pro-ceedings of the 2016 Conference on Empirical Meth-ods in Natural Language Processing, pages 876–885, Austin, TX.
Douglas Biber. 1988. Variation across Speech andWriting. Cambridge University Press, Cambridge.
Nicholas Diakopoulos. 2015. Picking the NYT Picks:Editorial criteria and automation in the curation ofonline news comments. ISOJ Journal, 6(1):147–166.
Frans H. van Eemeren, Peter Houtlosser, and A. Fran-cisca Snoeck Henkemans. 2007. Argumentative In-dicators in Discourse: A pragma-dialectical study.Springer, Berlin.
Ivan Habernal and Iryna Gurevych. 2017. Argumenta-tion mining in user-generated web discourse. Com-putational Linguistics, 43(1):125–179.
104

Abhyuday N. Jagannatha and Hong Yu. 2016. Bidi-rectional RNN for medical event detection in elec-tronic health records. In Proceedings of the 2016Conference of the North American Chapter of theAssociation for Computational Linguistics: HumanLanguage Technologies, pages 473–482, San Diego,CA.
Clare Llewellyn, Claire Grover, and Jon Oberlander.2014. Summarizing Newspaper Comments. In Pro-ceedings of ICWSM, Ann Arbor, MI.
Marie-Francine Moens, Erik Boiy, Raquel MochalesPalau, and Chris Reed. 2007. Automatic detectionof arguments in legal texts. In Proceedings of the11th International Conference on Artificial Intelli-gence and Law, pages 225–230, Stanford, Califor-nia. ACM.
Courtney Napoles, Joel Tetreault, Aasish Pappu, EnricaRosato, and Brian Provenzale. 2017. Finding goodconversations online: The Yahoo News AnnotatedComments Corpus. In Proceedings of the 11th Lin-guistic Annotation Workshop, EACL, pages 13–23,Valencia.
Deokgun Park, Simranjit Sachar, Nicholas Diakopou-los, and Niklas Elmqvist. 2016. Supporting com-ment moderators in identifying high quality onlinenews comments. In Proceedings of the 2016 CHIConference on Human Factors in Computing Sys-tems, pages 1114–1125. ACM.
Jeffrey Pennington, Richard Socher, and Christo-pher D. Manning. 2014. GloVe: Global vectors forword representation. In Proceedings of the Con-ference on Empirical Methods in Natural LanguageProcessing, pages 1532–1543, Doha, Qatar.
Zhiyang Teng, Duy Tin Vo, and Yue Zhang. 2016.Context-sensitive lexicon features for neural senti-ment analysis. In Proceedings of the 2016 Con-ference on Empirical Methods in Natural LanguageProcessing, pages 1629–1638, Austin, Texas.
Assimakis Tseronis. 2011. From connectives to argu-mentative markers: A quest for markers of argumen-tative moves and of related aspects of argumentativediscourse. Argumentation, 25(4):427–447.
Ellery Wulczyn, Nithum Thain, and Lucas Dixon.2016. Ex machina: Personal attacks seen at scale.arXiv:1702.08138v1.
105
Proceedings of the 2017 EMNLP Workshop on Natural Language Processing meets Journalism, pages 106–111Copenhagen, Denmark, September 7, 2017. c©2017 Association for Computational Linguistics
An NLP Analysis of Exaggerated Claims in Science News
Yingya Li Jieke Zhang Bei Yu
School of Information Studies School of Information Studies School of Information Studies Syracuse University Syracuse University Syracuse University
[email protected] [email protected] [email protected]
Abstract
The discrepancy between science and media has been affecting the effective-ness of science communication. Origi-nal findings from science publications may be distorted with altered claim strength when reported to the public, causing misinformation spread. This study conducts an NLP analysis of ex-aggerated claims in science news, and then constructed prediction models for identifying claim strength levels in science reporting. The results demon-strate different writing styles journal articles and news/press releases use for reporting scientific findings. Prelimi-nary prediction models reached prom-ising result with room for further im-provement.
1 Introduction
On April 18, 2017 many science news agencies reported a new study on peer effects in health behavior (Aral and Nicolaides, 2017). Here are a few examples of the headlines:
AAAS: “Exercise is contagious, especially if you are a men” MIT Sloan press release: “Turns out exercise is contagious” Medscape: “Exercise may be contagious” Gulfnews: “Exercise can be contagious, new social network analysis finds”.
Regardless of the original finding, these news headlines interpreted and thus reported the find-ing with different levels of strength (using differ-ent verbs such as “is”, “may”, and “can”).
This example illustrates a prominent problem in science communication that original scientific findings might be altered or distorted during the information spread process. Different infor-
mation subsidies such as the university press and news releases have been widely used to deliver research findings. However, possibly caused by different writing purposes of scientists and jour-nalists, those paraphrased versions of the original findings in the reporting may not be as accurate. For example, the university press release has been found to be a major source of misinfor-mation (Sumner et al., 2014).
The ways in which information is framed along with how the audiences decode it has powerful impacts on public behaviors. Hence the aforementioned misinformation diffusion can cause misunderstanding of science findings. A possible approach for curbing such misinformation diffusion in science communication is to compare relevant findings reported in science news and the original journal articles, identifying the strength levels of their claims, and thus to warn writers and readers of potential exaggerations in the science reporting.
Such approach requires two steps: “claims pairing” and “claim strength identification”. In this paper we focus on the second task, and leave the first task to future work. We explored the statement of causality in health-related science communication covered by academic journals, university press releases and news stories. We analyzed how causal triggers (i.e., verbs or verb phrases that express causal relations in claims) are associated with different levels of casual rela-tions, using the open-dataset released by Sumner et al. (2014). Also, we developed text classifica-tion models to predict the strength levels of claims in academic papers and news articles.
This study seeks answers to the following re-search questions: (1) What are the linguistic fac-tors distinguishing different reporting styles of journal articles and news/press releases? (2) What are the causal triggers for different levels of claim strength? (3) Is it feasible to automatically identify
106
the strength of claims in science reporting and news? If so, what are the current achievement and challenges?
2 Related Work
In the NLP field scholars have tried to identify misinformation from different perspectives, in-cluding credibility prediction (Castillo et al., 2013), rumor detection (Qazvinian et al., 2011; Zubiaga et al., 2016) etc. Although satisfactory accuracy for automatic misinformation detection could be made, the effectiveness of discrediting misinformation on people’s belief and perception remains unknown. Prior studies found that false information with exaggerated claims is designed to meet emotional needs and often emerges in sit-uations of uncertainty (Silverman, 2015). For people with strong fixed views, encountering con-tradicting claims and arguments can cause them to strengthen their original belief. One possible way to reduce the continuing of misinformation is to explain why the information or myth is wrong by showing the rhetorical techniques such as the spe-cific exaggeration that was used (Cook and Lewandowsky, 2012).
A relevant task of analyzing such rhetorical manipulation in science communication is to iden-tify the strength of claims. Light et al. (2004) built a classifier to predict the levels of speculative lan-guage in sentences from biomedical abstracts. Vlachos and Craven (2010) also developed a clas-sifier to detect the information certainty in bio-medical text, using syntactic dependencies and lo-gistic regression. Blake (2010) proposed a claim framework that tries to capture the ways an author communicates a scientific claim. The framework is built on the certainty of causal relations that were presented, which is closely related to strength identification.
The problem of identifying claim strength is also closely linked to several other science com-munication and science news reporting problems, especially on casual relation and exaggeration de-tection. Though many efforts have been made to analyze causal relations in claims (e.g., Mihaila et al., 2013; Sumner et al., 2014; Khoo et al., 2000), massive diffusion of unverified rumors fosters confusions about causation that could adversative-ly impact the public beliefs and decisions. Under this circumstance, readers’ knowledge and per-sonal judgment for claims of different issues will be challenged greatly.
Unlike previous studies mainly focusing on single domain, in the current work we studied claim strength across multiple domains/genres of both academic publication and news/press releas-es. We tried to automatically identify claim strength in science reporting with special focus on the different types of causal relationship. It is also the first step towards automatic identification of exaggeration and emotion manipulation in science news.
3 Experiment
3.1 Data In this study, we use an open data set (http://dx.doi.org/10.6084/m9.figshare.903704) developed by Sumner et al. (2014). This corpus includes a sample of health-related journal arti-cles and their corresponding press releases and news articles. After manually coding the strength levels of the main claims from the three sources, they found that the press release is a major source of exaggeration in science news reporting.
This open data set includes 462 health-related press releases and their corresponding claims in 668 associated journal articles and news stories. The primary causal claims in the journal articles, press releases and news reports are coded into seven categories with increasing strength of rela-tionship: no mentioned relationship (Category “0”); statement of no relationship (Category “1”), statement of correlation (Category “2”), ambigu-ous statement of relationship (Category “3”), con-ditional statement of causation (Category “4”), statement of “can” (Category “5”), and statement of causation (Category “6”). Table 1 lists the cate-gory definitions and an example for each category.
3.2 Data Preprocessing Adjusting category granularity: The original data set contains 1727 claims in 7 categories (“0”– “6”), with Category 6 (statement of causation) and Category 2 (statement of correlation) as the largest groups, accounting for 49% and 21% respectively. The other categories are relatively smaller.
To create a more balanced data set, we adjusted the category granularity, reducing the number of categories from 7 to 4. Category 0 was removed because it contains only 2 examples. Category 1 (“no relationship”) remains the same. Category 3 is semantically close to Category 2, and thus was
107

IV: independent variable, DV: dependent variable Table 1: Examples of different type of causal claims based on their strength.
merged into Category 2 (“correlation”). Catego-ries 4 and 5 were merged into new Category 4 (“conditional causation”) because both are weaker levels of causal relationships. Liberman (2011) found that although biomedical scientists clearly distinguished “may cause” (Category 4) and “can cause” (Category 5) types of relationships, science journalists seem not to distinguish them anyway. Category 6 (“causation”) remains unchanged as the definitive statement of causation.
After adjusting the claim strength granularity, the original data was converted to four main cate-gories: “no relationship” (Category 1), “correla-tion” (Category 2), “conditional causation” (Cate-gory 4), and “causation” (Category 6). Table 2 shows the distribution of each category before and after merging in the open dataset.
Separating training and testing data: The original data set contains 462 spreadsheets, one for each press release. Each spreadsheet documented the science claims reported in the original journal articles, and their paraphrased versions in the press releases and various news articles. Since all claims in the same spreadsheet involve the same science
topic, we kept all statements from the same spread-sheet altogether either in training or in testing set to ensure the generalizability of the trained classifier. Specifically, statements from the first 300 spread-sheets were used for training and the rest 162 for testing.
Separating statements from journals and news/press: An important feature in academic writing is cautions language, often called “hedg-ing” or “vague language”, which may differ from the writing style in journalism. To test the homo-geneity in writing style, we examined the hedging words in the training data using the Bioscope cor-pus (Szarvas et al., 2008). The Bioscope corpus marked a number of hedging cues in the abstracts of research articles, such as “may”, “suggest”, “indicate that”, “whether”, “appears”. It is the most comprehensive hedging cues collection for biomedical writings we can find so far.
We calculated the document percentage of the statements with hedging words in the training data and consistently higher occurrences in journals than in news/press articles among all categories. See Table 3 for the distribution. The difference is
Category Statement Category No relationship mentioned – No relationship is mentioned
...we report the discovery and characterization of a unique core genome-encoded superantigen, providing new insights into the evolution of pathogenic S. aureus…
0
Statement of no relationship – Explicitly stat-ing there is no relationship
…caesarean section by clinical officers does not result in a significant increase in maternal or perinatal mortality significant increase.
1
Statements of correlation – The IV and DV are associated, but causation cannot be explicitly stated
We found a strong graded relationship between increasing levels of psychological distress and the likelihood of being awarded a new disability pension.
2
Ambiguous statement of relationship – It is unclear what the strength of relationship of these statement is. The statement could mean that IV causes DV, or that the two variables are associated – either would be applicable.
…high levels of a protein called SGK1 are linked with infertility, while low levels of it make a woman more likely to have a miscar-riage…
3
Conditional statement of causation – Causal statements show that the IV directly changes the DV. Conditional causal statements carry an element of doubt in them.
Genetic-screening trial could reduce drug side-effects.
4
Statement of “can” - The word “can” is unique as a statement of relationship in that it implies that the IV always has the potential to directly change the DV. it is a stronger statement than any conditional statement of causation.
Chocolate every day can reduce risk of heart disease.
5
Statements of causation – The strongest state-ments are statements of causation. This state-ment says that the IV directly alters the DV.
…three antiviral agents we studied significantly reduced the levels of Ab and P-tau…
6
108

the highest in Category 1 (“no relationship”), where hedges occurred in 81.5% journal claims but only in 58.6% press/news claims.
Due to the difference in writing style, we fur-ther separated statements in journal articles from those in press/news reports, and prepared training and testing data sets for each genre. Table 4 shows the distribution of statements after training/testing and journal/press separation.
Even though researchers claimed publication and reporting bias against negative findings (Dwan et al, 2008), our data consist of paired statements from different reporting sources; the percentage of the biased reporting should be com-parable in journal articles and press releases. However, the category distribution in Table 4 shows that in journal articles a lot more correla-tions are reported, while in news/press releases more causation relations are reported. This obser-vation along with the hedging words distribution supports our argument for the genre difference be between journal articles and news/press releases, justifying our decision to separate the statements according to their sources.
We did not further separate press release and news article to avoid overly small data sets, as-suming no significant style difference in these two genres.
Claim Strength Original Merged 1 (no relationship) 82 82 2 (correlation) 366
519 3 (ambiguous relation) 153 4 (conditional causation) 163 278 5 (statements of “can”) 115 6 (causation) 846 846 Total 1725 1725 Table 2: Claim strength distribution in the open
dataset before and after category adjusting. Claim Strength Journal
Count (Percentage)
News/press Count (Percentage)
1 (no relationship) .815 .586 2 (correlation) .756 .698 4 (conditional causation)
1.00 .984
6 (causation) .706 .582 Total .759 .690 Table 3: Hedging words distribution in journal
and news/press.
Notes: numbers in the brackets are the percentages. Table 4: Statement distribution after source and
training/testing separation.
3.3 Feature Extraction We constructed four feature vectors using differ-ent representations: 1) BOW: simple bag-of-words; 2) B-BOW: bag-of-words with the bolded linguistic cues that are manually-highlighted in the open data set; 3) N-BOW: bag-of-words with doubled negation words in the statements; 4) E-BOW: bag-of-words enriched with enhanced de-pendency parsing. We did not do stemming in or-der to keep word inflections. We did not remove stopwords because function words are likely style markers, for example “that” could indicate a sub-ordinate clause.
For 2), the bolded linguistic cues (e.g., “associ-ated”, “increased risk”, “appears to offer”) were words/phrases labeled by annotators for identify-ing the claim strength. For 3), we searched for all the negation words (e.g., “no”, “not”) marked in the Bioscope corpus, and then doubled their oc-currences in the statements by appending these words to the end of that statement (e.g. “Water softeners provided no additional benefit to usual care.” becomes “Water softeners provided no ad-ditional benefit to usual care. no”). For 4), we used the Stanford dependency parsing to extract all enhanced dependency relations in the state-ment. Dependency labels like nsubj and depend-ency words are tokenized separately and used as word features alone or combined with BOW to train our model). For example, Original statement from the open data set: “A quick and cheap test could save the lives of babies born with congenital heart defects. (Category 4)” Dependency words: “test- A- test- quick- quick- and- quick- cheap- save- test- save- could- ROOT- save- lives- the- save- lives-
Claim Strength
Journal Train
Journal Test
News/Press Train
News/Press Test
1 27 (.050)
11 (.039)
29 (.048)
15 (.050)
2 213 (.397)
115 (.405)
126 (.208)
65 (.218)
4 51 (.095)
24 (.085)
127 (.209)
76 (.255)
6 245 (.457)
134 (.472)
325 (.535)
142 (.477)
Total 536 284 607 298
109

Claim Strength MNB (tf) SVM (boolean) SVM (tf) Journal Press Journal Press Journal Press
1 (no relationship) .632 .000 .696 .261 .667 .190 2 (correlation) .649 .512 .629 .537 .639 .512 4 (conditional causation) .400 .759 .766 .847 .783 .833 6 (causation) .670 .748 .709 .784 .716 .768 Macro-average F1 score .587 .505 .700 .607 .716 .576
Table 5: Classification accuracy of BOW unigram approach.
Claim Strength Journal (SVM-tf) Press (SVM-boolean) 1 (no relationship) .667 .273 2 (correlation) .648 .508 4 (conditional causation) .826 .825 6 (causation) .730 .780 Macro-average F1 score .718 .596
Table 6: Classification accuracy of BOW unigram+bigram approach (using the best unigram model).
Claim Strength B-BOW N-BOW E-BOW Journal Press Journal Press Journal Press
1 (no relationship) .522 .182 .526 .105 .696 .250 2 (correlation) .642 .542 .636 .512 .626 .545 4 (conditional causation) .727 .821 .766 .836 .766 .831 6 (causation) .702 .780 .716 .761 .704 .770 Macro-average F1 score .648 .581 .661 .554 .698 .599
Table 7: Classification accuracy of B-BOW, N-BOW, and E-BOW approach.
lives- of- of- babies- babies- born- born- with- defects- congenital- defects- heart- with- defects” Dependency tags: “det amod cc conj nsubj aux root det dobj prep pobj vmod prep amod nn pobj” The final vector is a combination of the three parts above.
3.4 Classification Results Unigram features: We built two unigram models using Multinomial Naïve Bayes (MNB) and SVMs (Liblinear) with default settings in the Sci-kit Learn toolkit. Macro F1 scores are reported for evaluating the model performance in Table 5. For journal articles, SVM (with term frequency) has the best performance (F1 score = .716). For press/news articles SVM (with Boolean vectors) performed the best (F1 score = .607). Both models performed significantly better than the random guess baseline .25. Overall the model for the Journal genre performs better than the model for the press/news genre. Category wise the “no rela-tionship” category has the lowest F1 scores, espe-cially for statements in news/press releases. The “conditional causation” category has the highest F1 score among all claim strengths.
Enriched features: We continued to use SVM to build more models with enrich features. Adding
bigrams resulted in slightly higher F1 score (.718) for journal and lower F1 score (.596) for press (as shown in Table 6). Therefore, we kept using the unigram features in later experiments. Table 7 re-ports the best classification results for the rest of each representation method mentioned in Section 3.3. As for B-BOW, we trained our model with bolded words only (with term frequency), bolded words only (with Boolean), and bolded words combined with the original statements (with term frequency).
4 Error Analysis
Error analysis shows that the classifier has a lot more to learn, such as variations in negation and distracting relationships mentioned in subordinate clauses. Analysis on the error cases in both journal articles and press releases shows that the most common disagreement is between categories 2 and 6, even though the two categories are not se-mantically close in the open dataset. This is large-ly caused by the location of the causal triggers for claim strength.
To further test the difficulty of identifying the-se two types of claim strength, we extracted about 50 statements in categories 2 and 6 from our mis-classified cases and then invited two graduate stu-
110

dents to judge their strength. The F1 scores com-pared to the ground truth (labeled score) were .440 and .630, with many Category 6 misjudged into Category 2 and vice versa, which is con-sistent to the machine performance. This low hu-man performance also suggests the challenge of correctly identifying the claim strength even for well-educated readers.
5 Conclusion
In this study, we conducted an NLP analysis of claim strength and constructed prediction models for identifying claim strength levels in science re-porting. Our best models reached .718 F1 score for distinguishing claim strengths in journal articles, and .607 F1 score in news/press releases, with very high performance for identifying conditional causa-tions. Our analysis shows even though scientific writing follows a well-defined style, scientists’ and journalists’ creative use of language still poses sig-nificant challenge to our task. The major challenges are the variations in negation and distracting rela-tionships mentioned in subordinate clauses for correlation and causation statements. We will con-duct deeper syntactic analysis to improve the model performance in our future work.
References Sinan Aral and Christos Nicolaides. 2017. Exercise
contagion in a global social network. Nature Com- munications 8.
Catherine Blake. 2010. Beyond genes, proteins, and abstracts: Identifying scientific claims from full-textbiomedical articles. Journal of biomedical in-formatics 43(2):173–189
Kerry Dwan, Douglas G Altman, Juan A Arnaiz, Jill Bloom, An-Wen Chan, Eugenia Cronin, Eve-lyneDecullier, Philippa J Easterbrook, Erik Von Elm, Carrol Gamble, et al. 2008. Systematic re-view of the empirical evidence of study publication bias and outcome reporting bias. PloS one 3(8): e3081.
John Cook and Stephan Lewandowsky. 2011. The de- bunking handbook. Sevloid Art.
Panagiotis Takis Metaxas Eni Mustafaraj Markus Strohmaier Harald Schoen Gayo-Avello, Daniel Peter Gloor, Carlos Castillo, Marcelo Mendoza, and Barbara Poblete. 2013. Predicting information credibility in time-sensitive social media. Internet Research 23(5):560–588.
Christopher SG Khoo, Syin Chan, and Yun Niu. 2000. Extracting causal knowledge from a medical data-
base using graphical patterns. In Proceedings of the 38th Annual Meeting on Association for Compu- tational Linguistics. Association for Computational Linguistics, pages 336–343.
Marc Light, Xin Ying Qiu, and Padmini Srinivasan. 2004. The language of bioscience: Facts, specula- tions, and statements in between. In Proceedings of BioLink 2004 workshop on linking biological liter-ature, ontologies and databases: tools for users. Association for Computational Linguistics, pages 17– 24.
Claudiu Mihaílâ, Tomoko Ohta, Sampo Pyysalo, and Sophia Ananiadou. 2013. Biocause: Annotating and analysing causality in the biomedical domain. BMC bioinformatics 14(1):2.
Vahed Qazvinian, Emily Rosengren, Dragomir R Radev, and Qiaozhu Mei. 2011. Rumor has it: Identifying misinformation in microblogs. In Pro-ceedings of the Conference on Empirical Methods in Natural Language Processing. Association for Compu- tational Linguistics, pages 1589–1599.
Craig Silverman. 2015. Lies, damn lies, and viral con- tent. how news websites spread (and debunk) online rumors, unverified claims, and misinfor-mation. Tow Center for Digital Journalism.
Petroc Sumner, Solveiga Vivian-Griffiths, Jacky Boi-vin, Andy Williams, Christos A Venetis, Aime e Davies, Jack Ogden, Leanne Whelan, Bethan Hughes, Bethan Dalton, et al. 2014. The associa- tion between exaggeration in health related science news and academic press releases: retrospective ob servational study. Bmj 349:g7015.
György Szarvas, Veronika Vincze, Richárd Farkas, and János Csirik. 2008. The bioscope corpus: an-notation for negation, uncertainty and their scope in biomedical texts. In Proceedings of the Work-shop on Current Trends in Biomedical Natural Language Processing. Association for Computa-tional Linguistics, pages 38–45.
Andreas Vlachos and Mark Craven. 2010. Detecting speculative language using syntactic dependencies and logistic regression. In Proceedings of theFourteenth Conference on Computational Natural Language Learning – Shared Task. Asso-ciation for Computational Linguistics, pages 18–25.
Arkaitz Zubiaga, Maria Liakata, Rob Procter, Gerald-ine Wong Sak Hoi, and Peter Tolmie. 2016. Ana-lysing how people orient to and spread rumours in social media by looking at conversational threads. PloS one 11(3): e0150989.
111


Author Index
Androutsopoulos, Ion, 51
Bakagianni, Juli, 51Bois, Rémi, 31Bourgonje, Peter, 68, 84
Chen, Mingjie, 80Chesney, Sophie, 56Cucchiarelli, Alessandro, 19
Dalbelo Basic, Bojana, 1di Buono, Maria Pia, 1
Ferret, Olivier, 62Fokkens, Antske, 37
Glavaš, Goran, 1Gravier, Guillaume, 31Gronas, Mikhail, 13
Hardt, Daniel, 7Harrison, Jackie, 25Hitomi, Yuta, 46
Inui, Kentaro, 46
Jamet, Eric, 31Jiang, Ye, 25
Kageura, Kyo, 90Kolhatkar, Varada, 100
Leemans, Inger, 37LI, YINGYA, 106Liakata, Maria, 56
Maks, Isa, 37Malakasiotis, Prodromos, 51Maynard, Diana, 25Milic-Frayling, Natasa, 1Morbidoni, Christian, 19Moreno Schneider, Julian, 84Moreno-Schneider, Julian, 68Morin, Emmanuel, 31Myrianthous, Giorgos, 80
Okazaki, Naoaki, 46
Özkahraman, Özer, 95
Pavlopoulos, John, 51Pisarevskaya, Dina, 74Poesio, Massimo, 56Potash, Peter, 13Pu, Jiashu, 80Purver, Matthew, 56
Quegan, Shaun, 25
Rambow, Owen, 7Rehm, Georg, 68, 84Ribeiro, Swen, 62Robert, Maxime, 31Romanov, Alexey, 13Rumshisky, Anna, 13
Sébillot, Pascale, 31Šnajder, Jan, 1Song, Xingyi, 25Srivastava, Ankit, 68Stilo, Giovanni, 19
Taboada, Maite, 100Tamori, Hideaki, 46Tang, Linyuan, 90Tannier, Xavier, 62Tekir, Selma, 95Thorne, James, 80Toprak, Mustafa, 95Tutek, Martin, 1
van der Zwaan, Janneke, 37van Hage, Willem, 37van Meersbergen, Maarten, 37Velardi, Paola, 19Vlachos, Andreas, 80Vossen, Piek, 37
Wabnitz, David, 68Wang, Xiaoxuan, 80
Yu, Bei, 106
Zhang, Jieke, 106
113