Emerging Markets Monthly Highlights - S&P Global
49
Emerging Markets Monthly Highlights Slow Vaccination Keeps Recovery At Risk Credit Research Jose Perez Gorozpe Xu Han Sudeep Kesh Vincent Conti Economic Research Tatiana Lysenko Elijah Oliveros Vishrut Rana May 12, 2021
-
Upload
khangminh22 -
Category
Documents
-
view
4 -
download
0
Transcript of Emerging Markets Monthly Highlights - S&P Global

Emerging Markets Monthly Highlights
Slow Vaccination Keeps Recovery At Risk
Credit Research
Jose Perez Gorozpe
Xu Han
Sudeep Kesh
Vincent Conti
Economic Research
Tatiana Lysenko
Elijah Oliveros
Vishrut Rana
May 12, 2021

Footer : Never change the footer text on individual slides. Change, turn on or off footer by using Insert Header &
Contents
Key Takeaways
Economic And Credit Conditions Highlights
Macro-Credit Dashboards
GDP Summary
Monetary Policy/FX
Financing Conditions Highlights
Ratings Summary
2
S&P Global Ratings believes there remains high, albeit moderating, uncertainty about the evolution of the coronavirus pandemic and its economic effects. Vaccine production is ramping up and rollouts are gathering pace around the world. Widespread immunization, which will help pave the way for a return to more normal levels of social and economic activity, looks to be achievable by most developed economies by the end of the third quarter. However, some emerging markets may only be able to achieve widespread immunization by year-end or later. We use these assumptions about vaccine timing in assessing the economic and credit implications associated with the pandemic (see our research here: www.spglobal.com/ratings). As the situation evolves, we will update our assumptions and estimates accordingly.
Footer : Never change the footer text on individual slides. Change, turn on or off footer by using Insert Header &
3
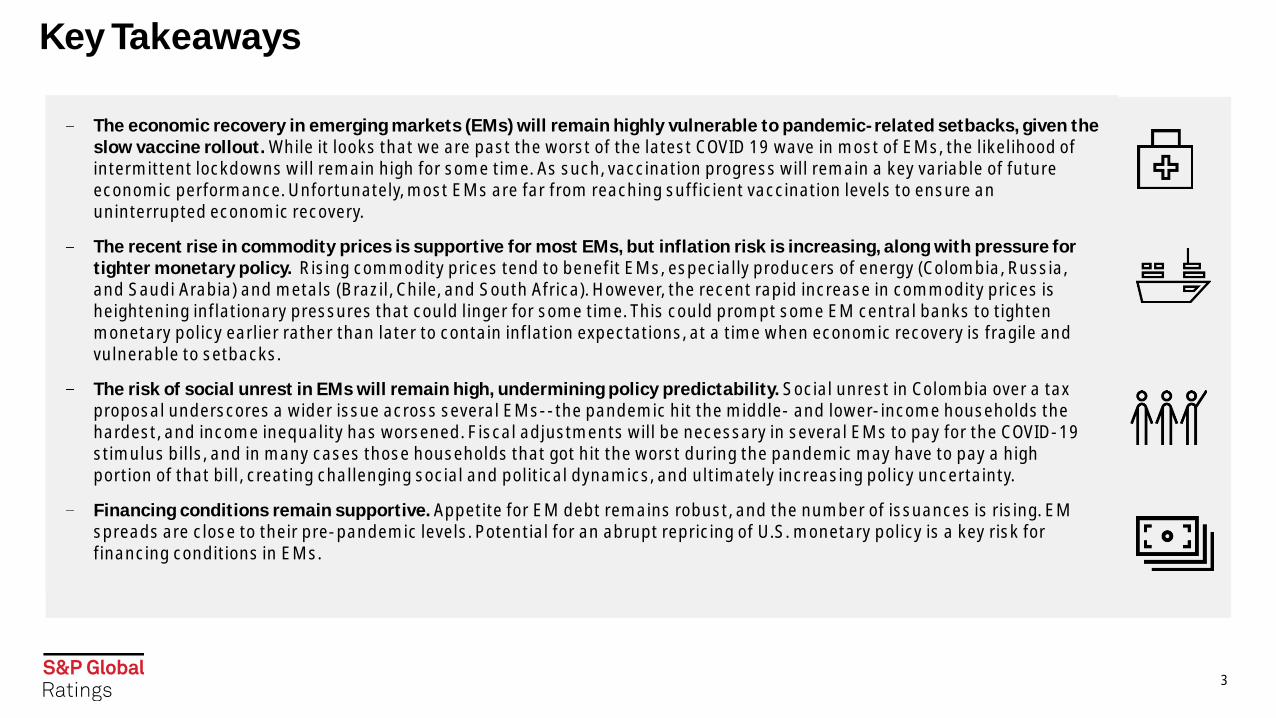
The economic recovery in emerging markets (EMs) will remain highly vulnerable to pandemic-related setbacks, given the slow vaccine rollout. While it looks that we are past the worst of the latest COVID 19 wave in most of EMs, the likelihood of intermittent lockdowns will remain high for some time. As such, vaccination progress will remain a key variable of future economic performance. Unfortunately, most EMs are far from reaching sufficient vaccination levels to ensure an uninterrupted economic recovery.
The recent rise in commodity prices is supportive for most EMs, but inflation risk is increasing, along with pressure for tighter monetary policy. Rising commodity prices tend to benefit EMs, especially producers of energy (Colombia, Russia, and Saudi Arabia) and metals (Brazil, Chile, and South Africa). However, the recent rapid increase in commodity prices is heightening inflationary pressures that could linger for some time. This could prompt some EM central banks to tighten monetary policy earlier rather than later to contain inflation expectations, at a time when economic recovery is fragile and vulnerable to setbacks.
The risk of social unrest in EMs will remain high, undermining policy predictability. Social unrest in Colombia over a tax proposal underscores a wider issue across several EMs--the pandemic hit the middle- and lower-income households the hardest, and income inequality has worsened. Fiscal adjustments will be necessary in several EMs to pay for the COVID-19 stimulus bills, and in many cases those households that got hit the worst during the pandemic may have to pay a high portion of that bill, creating challenging social and political dynamics, and ultimately increasing policy uncertainty.
Financing conditions remain supportive. Appetite for EM debt remains robust, and the number of issuances is rising. EM spreads are close to their pre-pandemic levels. Potential for an abrupt repricing of U.S. monetary policy is a key risk for financing conditions in EMs.
Key Takeaways

Footer : Never change the footer text on individual slides. Change, turn on or off footer by using Insert Header &
Economic Recovery Remains Fragile Due To Slow Vaccination Progress
4
Vaccination rollout remains slow across most EMs less than 3% of the population is fully vaccinated in the median EM. Furthermore, there are concerns about the efficacy of some vaccines. This means that most EMs are unlikely to reach widespread immunity this year and will remain vulnerable to new COVID-19 waves.
The risk of more intermittent lockdowns is high, acting as a drag on the economic recovery. Even in the absence of lockdowns, fear of contagion could keep mobility below pre-pandemic levels for some time.
Seven-day moving average as of May 7th. Information for fully vaccinated in Saudi Arabia is not available. Source: OWID, Google Mobility, and S&P Global Ratings.
Vaccines, COVID-19 Death Rate, And Mobility Trends
0
10
20
30
40
50
60
70
80
90
Total Vaccines Per 100 Fully Vaccinated Per 100
Mobility Improvement (trough to latest, ppts) New Daily COVID Deaths Per Million

Footer : Never change the footer text on individual slides. Change, turn on or off footer by using Insert Header &
5
After several rate hikes last month, more are coming in the next few months. Brazil and Russia lifted their policy rates last month by 75 bps and 50 bps, respectively. Core inflation in both countries is rising, amplified by idiosyncratic factors (fiscal risk in Brazil, geopolitical risk in Russia). Both central banks are likely to tighten monetary policy further in the coming months.
Higher energy prices are likely to keep pressuring headline inflation in the coming months. This
uptick in other key commodities such as food, will keep headline inflation numbers on the higher side in the coming months, and weigh on central banks to remain hawkish.
But EM Asia faces the least pressure for monetary tightening. Unlike in most other major EMs, core inflation remains subdued across much of EM Asia. This is because demand-side pressures saw renewed weakness due to a resurgence in COVID cases. As a result, most central banks in EM Asia are likely to stay put on policy rates this year.
Pressure For More Monetary Tightening Will Ratchet Up
5
Core Inflation (% Year-On-Year)
Note: LatAm includes GDP PPP weighted average of Brazil, Chile, Colombia, and Mexico. EM Asia includes GDP PPP weighted average of Indonesia, Malaysia, the Philippines, and Thailand.policy rate reflects weighted average cost of CBRT funding. Source: Haver Analytics, Datastream, national statistical agencies, and S&P Global Ratings.
Change In Policy Rates In 2021 Versus 2020 (bps)
200150
75
500
-250-200-300
-200
-100
0
100
200
300
400
500
600
Turkey Brazil Russia
Cumulative Rate Hikes In 2021 So Far Net Change In Rates In 2020
02468101214161820
0
1
2
3
4
5
6
Ap
r-1
9
Ma
y-1
9
Jun
-19
Jul-
19
Au
g-1
9
Se
p-1
9
Oc
t-1
9
No
v-1
9
De
c-1
9
Jan
-20
Fe
b-2
0
Ma
r-2
0
Ap
r-2
0
Ma
y-2
0
Jun
-20
Jul-
20
Au
g-2
0
Se
p-2
0
Oc
t-2
0
No
v-2
0
De
c-2
0
Jan
-21
Fe
b-2
1
Ma
r-2
1
Ap
r-2
1
LatAm Russia EM Asia Turkey (right scale)

Footer : Never change the footer text on individual slides. Change, turn on or off footer by using Insert Header &
6
Second
Recoveryimpact in two scenarios based on the
. In a moderate scenario in which the pandemic peaks later this month, GDP for the full fiscal year could 1.2% lower. The GDP drop deepens to 2.8% in a severe scenario.
Current lockdowns have not been as broad based as those last year, while people and firms adapt to the restricted mobility. This means that the impact from the fresh wave is likely to be less severe this time.Still, private demand will see a sharp pullback. GDP growth in the first quarter will have significant base effects for the overall growth number for FY 21/22.
Vishrut Rana, Singapore, +65-6216-1008, [email protected]
Note: Average annual lost output refers to the average level gap between the pre-COVID GDP path and the different economic paths under our March baseline and our scenarios over the forecast horizon out to fiscal 2024. Fiscal 2022 is the 12 months ending March 31, 2022, fiscal 2023 is the 12 months ending March 31, 2023, and so on. Source: S&P Global Ratings.
GDP
Growth FY
21/22 (%)
GDP
growth FY
22/23 (%)
Average annual
lost output (% of
FY 19/20 GDP)
March baseline 11.0 6.1 14.2
Moderate scenario• Pandemic peaks at the end of
May. • Mobility 25% 30% below
normal before starting to recover in September.
9.8 7.8 14.4
Severe scenario• The pandemic peaks in late
June, declines slower.• Mobility 40% below normal,
starts to normalizes by year-end.
8.2 9.6 14.8

Footer : Never change the footer text on individual slides. Change, turn on or off footer by using Insert Header &
Regional Economic Highlights

Footer : Never change the footer text on individual slides. Change, turn on or off footer by using Insert Header &
EM Asia Economics| Milder Lockdowns Across Much Of EM Asia
8
Lockdowns across much of EM Asia have been milder but COVID risks remain. Cases have been rising in Malaysia, declining in the Philippines, and stable in the rest of the region. Thailand has tightened mobility restrictions to lower new cases further. Malaysia broadened lockdown measures to
considerably less strict than those last year.
Indonesia is seeing the benefits from the absence of a fresh COVID wave, and mobility is gradually returning to normal. Consumer demand improved in the first quarter, and greater mobility will strengthen recovery in the second quarter. Further pandemic
of the population is vaccinated.
Note: Baseline refers to the median mobility over the five-week period between Jan. 3, 2020, and Feb. 6, 2020. Data shown are rolling seven-day moving averages. Source: Google Community Mobility Reports and Our World In Data.
Mobility still below normal but improving in parts of EM Asia
Vishrut Rana, Singapore, +65-6216-1008, [email protected]
-100
-80
-60
-40
-20
0
20
% f
rom
ba
se
lin
e
Mobility for retail and recreation
Indonesia Malaysia Philippines Thailand
Footer : Never change the footer text on individual slides. Change, turn on or off footer by using Insert Header &
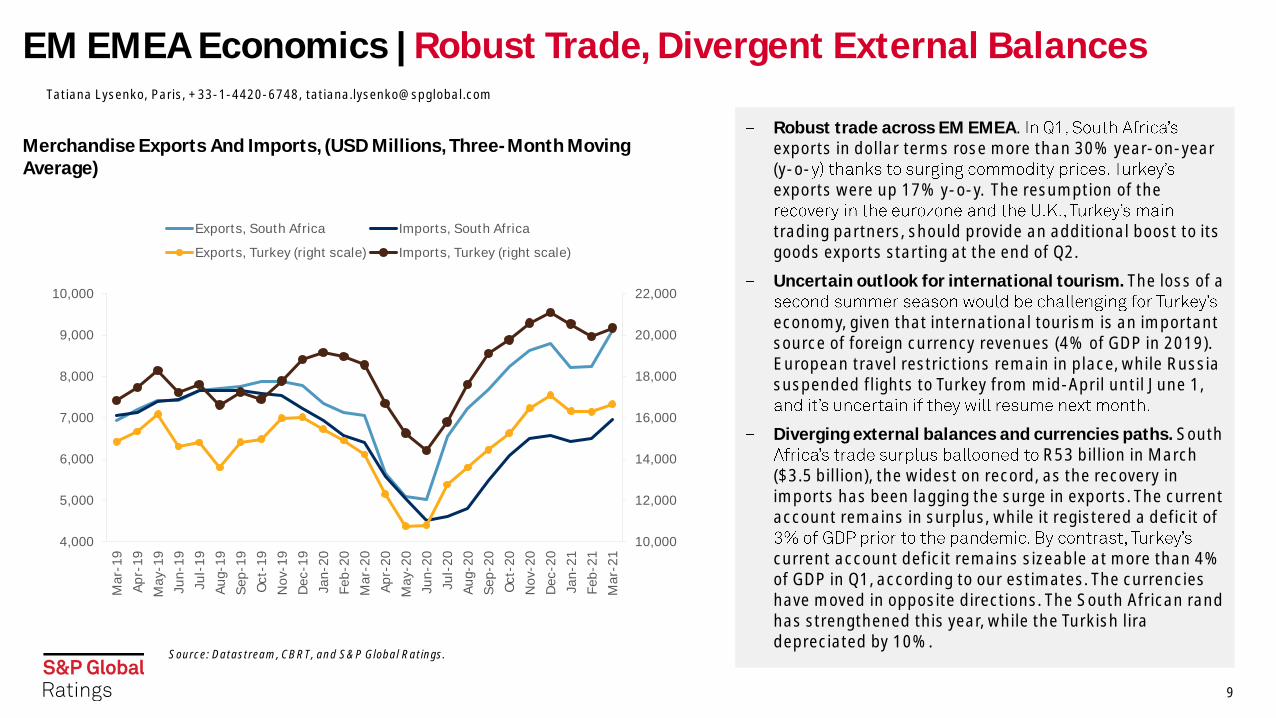
EM EMEA Economics | Robust Trade, Divergent External Balances
9
Robust trade across EM EMEA.exports in dollar terms rose more than 30% year-on-year (y-o-exports were up 17% y-o-y. The resumption of the
trading partners, should provide an additional boost to its goods exports starting at the end of Q2.
Uncertain outlook for international tourism. The loss of a
economy, given that international tourism is an important source of foreign currency revenues (4% of GDP in 2019). European travel restrictions remain in place, while Russia suspended flights to Turkey from mid-April until June 1,
Diverging external balances and currencies paths. South R53 billion in March
($3.5 billion), the widest on record, as the recovery in imports has been lagging the surge in exports. The current account remains in surplus, while it registered a deficit of
current account deficit remains sizeable at more than 4% of GDP in Q1, according to our estimates. The currencies have moved in opposite directions. The South African rand has strengthened this year, while the Turkish lira depreciated by 10%.
Source: Datastream, CBRT, and S&P Global Ratings.
Merchandise Exports And Imports, (USD Millions, Three-Month Moving Average)
Tatiana Lysenko, Paris, +33-1-4420-6748, [email protected]
10,000
12,000
14,000
16,000
18,000
20,000
22,000
4,000
5,000
6,000
7,000
8,000
9,000
10,000
Ma
r-1
9
Ap
r-1
9
Ma
y-1
9
Jun
-19
Jul-
19
Au
g-1
9
Se
p-1
9
Oc
t-1
9
No
v-1
9
De
c-1
9
Jan
-20
Fe
b-2
0
Ma
r-2
0
Ap
r-2
0
Ma
y-2
0
Jun
-20
Jul-
20
Au
g-2
0
Se
p-2
0
Oc
t-2
0
No
v-2
0
De
c-2
0
Jan
-21
Fe
b-2
1
Ma
r-2
1
Exports, South Africa Imports, South Africa
Exports, Turkey (right scale) Imports, Turkey (right scale)

Footer : Never change the footer text on individual slides. Change, turn on or off footer by using Insert Header &
10
Unrest in Colombia erupted over a tax proposal, but it points to broader difficulties in the region. The pandemic-induced economic shock has hit the middle- and lower-income households the hardest. Fiscal adjustments in order to pay for the COVID-19 stimulus bill will take place over the coming years, not just in Colombia. It will be difficult to avoid a bulk of the fiscal bill being paid by this population slice, which risks keeping political and social tensions high.
Lack of progress in income mobility preceded COVID-after the pandemic. GDP per capita convergence with that of developed markets has not improved significantly in recent years in the region, and in some cases it has receded. Income inequality worsened since the pandemic, given the rising poverty levels. A slow economic recovery, due to structural issues, will cause the lower-income households to fall further behind. This will likely keep income inequality wide, and further complicate social and political dynamics.
LatAm Economics | Risk Of Further Social Unrest Remains High
10
GDP Per Capita Convergence To The U.S.*
*In purchasing power parity terms. Source: S&P Global Ratings and Oxford Economics.
Elijah Oliveros-Rosen, New York, +1-212-438-2228, [email protected]
0%
5%
10%
15%
20%
25%
30%
35%
40%
45%
Argentina Brazil Chile Colombia Mexico
2010 2019 (pre-pandemic level) 2024f (end of forecast horizon)

Footer : Never change the footer text on individual slides. Change, turn on or off footer by using Insert Header &
Macro-Credit Dashboards

Footer : Never change the footer text on individual slides. Change, turn on or off footer by using Insert Header &
GDP Summary | The Pandemic Resurgence Weakens 1H 2021 Growth
12
Note: Red means GDP growth is below five-year average (2015-2019). Blue means the opposite. F Forecast. Source: Haver Analytics and S&P Global Ratings.
CountryLatest reading
(y/y)Period
Five-year avg
2019 2020 2021f 2022f 2023f
Argentina -4.3 Q4 -0.2 -2.1 -9.9 6.1 2.5 2.0
Brazil -1.1 Q4 -0.5 1.4 -4.4 3.4 2.5 2.4
Chile 0.0 Q3 2.1 1.0 -6.0 5.9 3.6 3.3
Colombia -3.6 Q4 2.4 3.3 -6.8 6.0 3.5 3.3
Mexico -3.8 Q1 2.0 0.0 -8.5 4.9 2.7 2.2
China 18.3 Q1 6.7 6.0 2.3 8.0 5.1 5.0
India 0.4 Q4 6.7 4.1 -8.0 11.0 6.1 6.3
Indonesia -0.7 Q1 5.0 5.0 -2.1 4.5 5.4 5.1
Malaysia -3.4 Q4 4.9 4.3 -5.6 6.2 5.6 5.0
Philippines -8.3 Q4 6.6 6.0 -9.5 7.9 7.2 7.2
Thailand -4.2 Q4 3.4 2.3 -6.1 4.2 4.5 3.6
Poland -2.7 Q4 4.4 4.6 -2.7 3.4 4.4 3.0
Russia -1.8 Q4 0.8 2.0 -3.0 3.3 2.5 2.0
Saudi Arabia -3.9 Q4 1.6 0.3 -4.1 2.0 2.7 2.2
South Africa -4.1 Q4 0.8 0.2 -7.1 3.6 2.5 1.3
Turkey 5.9 Q4 4.2 0.9 1.8 6.1 3.0 3.0

Footer : Never change the footer text on individual slides. Change, turn on or off footer by using Insert Header &
Monetary Policy/FX | Brazil And Russia Hiked Again Over The Last Month
13
Note: Red means inflation is above the target range, policy is tightening, and exchange rate is weakening. Blue means the opposite. A positive number for the exchange-rate change means appreciation. Argentina's central bank no longer targets inflation, nor does it set the policy rate directly (it is set based on monetary aggregates targeting). For China, we use the PBOC's seven-day reverse repo. Source: Bloomberg, Haver Analytics, and S&P Global Ratings.
CountryPolicy
rateInflation target
Latest inflation
reading
Latest rate decision
Next meeting
April exchange rate chg.
YTD exchange rate chg.
Argentina 38.00% No target 42.6% N/A N/A -1.7% -10.1%
Brazil 3.50% 3.75% +/- 1.5% 6.1% 75 bps hike May 17 3.6% -4.4%
Chile 0.50% 3% +/- 1% 3.3% Hold May 13 1.2% 0.2%
Colombia 1.75% 3% +/- 1% 1.9% Hold May 28 -0.7% -8.1%
Mexico 4.00% 3% +/- 1% 6.1% Hold May 13 0.9% -1.6%
China 2.20% 3% 0.3% N/A N/A 1.2% 0.8%
India 4.00% 4% +/- 2% 5.5% Hold June 4 -1.3% -1.4%
Indonesia 3.50% 3.5% +/- 1% 1.4% Hold May 25 0.6% -2.7%
Malaysia 1.75% No target 1.7% Hold July 8 1.4% -1.7%
Philippines 2.00% 3% +/- 1% 4.5% Hold May 13 0.9% -0.2%
Thailand 0.50% 2.5% +/- 1.5% 3.4% Hold June 23 0.4% -3.8%
Poland 0.10% 2.5% +/- 1% 3.3% Hold June 9 4.2% -1.6%
Russia 5.00% 4.00% 5.5% 50 bps hike June 11 0.6% -1.1%
Saudi Arabia 1.00% 3% +/- 1% 4.9% Hold N/A 0.0% 0.0%
South Africa 3.50% 3%-6% 3.2% Hold May 20 1.9% 1.4%
Turkey 19.00% 5% +/- 2% 17.1% Hold June 17 -0.5% -10.3%

Footer : Never change the footer text on individual slides. Change, turn on or off footer by using Insert Header &
Real Effective Exchange Rates | Social Unrest Battered The Colombian Peso
14
*% change from 10-year average. Note: Data is computed on 10 years of the monthly average data of the J.P. Morgan Real Broad Effective Exchange Rate Index (PPI-deflated). Data as of April 30, 2021. Source: S&P Global Ratings, Haver Analytics, and J.P. Morgan.
Broad Real Effective Exchange Rates*
-40.0
-35.0
-30.0
-25.0
-20.0
-15.0
-10.0
-5.0
0.0
5.0
10.0
BR
L
CO
P
SA
R
TR
Y
PH
P
AR
S
RU
B
MY
R
INR
PL
N
MX
N
CLP
TH
B
IDR
ZA
R
CN
Y
Stronger
Weaker
Footer : Never change the footer text on individual slides. Change, turn on or off footer by using Insert Header &
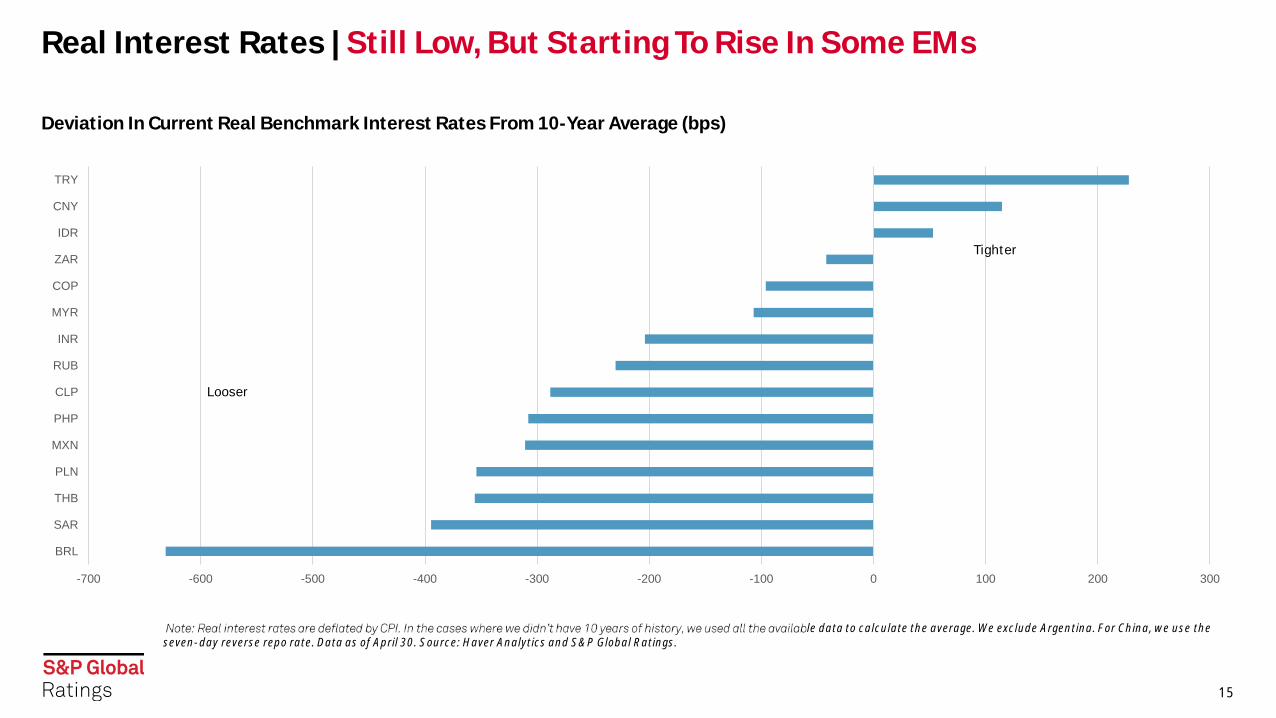
Real Interest Rates | Still Low, But Starting To Rise In Some EMs
15
le data to calculate the average. We exclude Argentina. For China, we use the seven-day reverse repo rate. Data as of April 30. Source: Haver Analytics and S&P Global Ratings.
Deviation In Current Real Benchmark Interest Rates From 10-Year Average (bps)
-700 -600 -500 -400 -300 -200 -100 0 100 200 300
BRL
SAR
THB
PLN
MXN
PHP
CLP
RUB
INR
MYR
COP
ZAR
IDR
CNY
TRY
Tighter
Looser

Footer : Never change the footer text on individual slides. Change, turn on or off footer by using Insert Header &
EM Heat Map

Footer : Never change the footer text on individual slides. Change, turn on or off footer by using Insert Header &
17
Color Coding
Sovereign-- h
Financial Institutions BICRA--The overall assessment of economic risk and industry risk, which ultimately leads to the classification of banking systems int -grade scale. The points range frory 011.
Nonfinancial Corporates-- p °We assess return on capital by using the median of our rated corporates in their respective countries, then we adjust for inflation, we then rank it based on our bal debt monitor with data as of March 2020.
Source: *-IIF 1Q 2020. t - Source: Bangko Sental NG Pilipinas; Corporate Variables Capital IQ 1Q 2020. S&P Global Ratings.

Footer : Never change the footer text on individual slides. Change, turn on or off footer by using Insert Header &
Financing ConditionsHighlights

Footer : Never change the footer text on individual slides. Change, turn on or off footer by using Insert Header &
19
Corporates | EM Leverage Rises Modestly
19
Note: Greater China --- China, Hong Kong, Macau, Taiwan, and Red Chip companies. Data as of May 3, 2021. Source: S&P Global Ratings and S&P Global Market Intelligence.
5.8
5.1
3.5
2.7
5.2
3.2 3.3
3.6
2.6
2.8
3.3
2.5 2.4
1.7
2.63.0
3.2
4.9 4.7
1.2
5.0
2.8
3.73.4
3.1
2.5
3.2
2.0
1.6
2.12.3
3.63.2
4.7
4.7
1.2
5.3
2.4
3.83.1
3.1
2.5
3.2
2.01.6
2.1 2.3 2.7
0
1
2
3
4
5
6
7
Median Debt-EBITDA Ratio (Most Recent) Median Debt-EBITDA Ratio (2020) Median Debt-EBITDA Ratio (2019)
C
(x)

Footer : Never change the footer text on individual slides. Change, turn on or off footer by using Insert Header &
20
EM Credit Spreads| Stable Risk Premium, But Funding Costs Are Rising Overall
20
EM Spreads By Region
Note: Levels, bps. Data as of April 30, 2021. Source: S&P Global Ratings Research, Thomson Reuters, ICE Data Indices, and Federal Reserve Bank of St. Louis.
U.S. And EM Spreads
Note: Levels, bps. Data for EM and U.S. spreads as of April 30, 2021. HY High Yield; IG Investment Grade. Source: S&P Global Ratings Research, Thomson Reuters, ICE Data Indices, and Federal Reserve Bank of St. Louis.
− U.S. spreads remain lower than pre-pandemic levels and continue to contract, helping to mitigate the rising U.S. benchmark yields.
− EM spreads remained close to pre-pandemic levels. Nonetheless, with rising benchmark yields, both foreign and local funding costs are beginning to see upward pressure.
− There is not much differentiation in risk premium trends across regions. As such, the key to watch will be movements in benchmarks both local government and U.S. Treasury yields.
0
200
400
600
800
1000
EM Corp EM Corp Asia EM Corp LatAm EM Corp EMEA
EM Decade High Beg. of 2020 COVID-19, EM Worst Beg. of 2021 Recent
0
500
1000
1500
US IG US HY EM Corp IG EM Corp HY
EM Decade High Beg. of 2020 COVID-19, EM Worst Beg. of 2021 Recent

Footer : Never change the footer text on individual slides. Change, turn on or off footer by using Insert Header &
EM Cumulative Corporate Bond Issuance EM Regional Bond Issuance
EM | Financial And Non-Financial Corporate Issuance
21
Excluding Greater China. Data as of April 30, 2021. Data including not rated and both financial and non-financial entities. Source: S&P Global Ratings Research and Thomson Reuters.
Data as of April 30, 2021, and full year data for 2006-2020, for both financial and non-financial entities. Source: S&P Global Ratings Research and Thomson Reuters.
0
50
100
150
200
250
300
(US
$ B
il.)
2016 2017 2018 2019 2020 2021 YTD
C
0
200
400
600
800
1000
1200
1400
1600
1800
0
20
40
60
80
100
120
2016 2017 2018 2019 2020 2021 YTD
(US
$ B
il.)
(US
$ B
il.)
Year
EMEA (LHS) EM Asia (ex. GC) (LHS)
Latin America (LHS) Greater China (RHS)
C
Footer : Never change the footer text on individual slides. Change, turn on or off footer by using Insert Header &
22
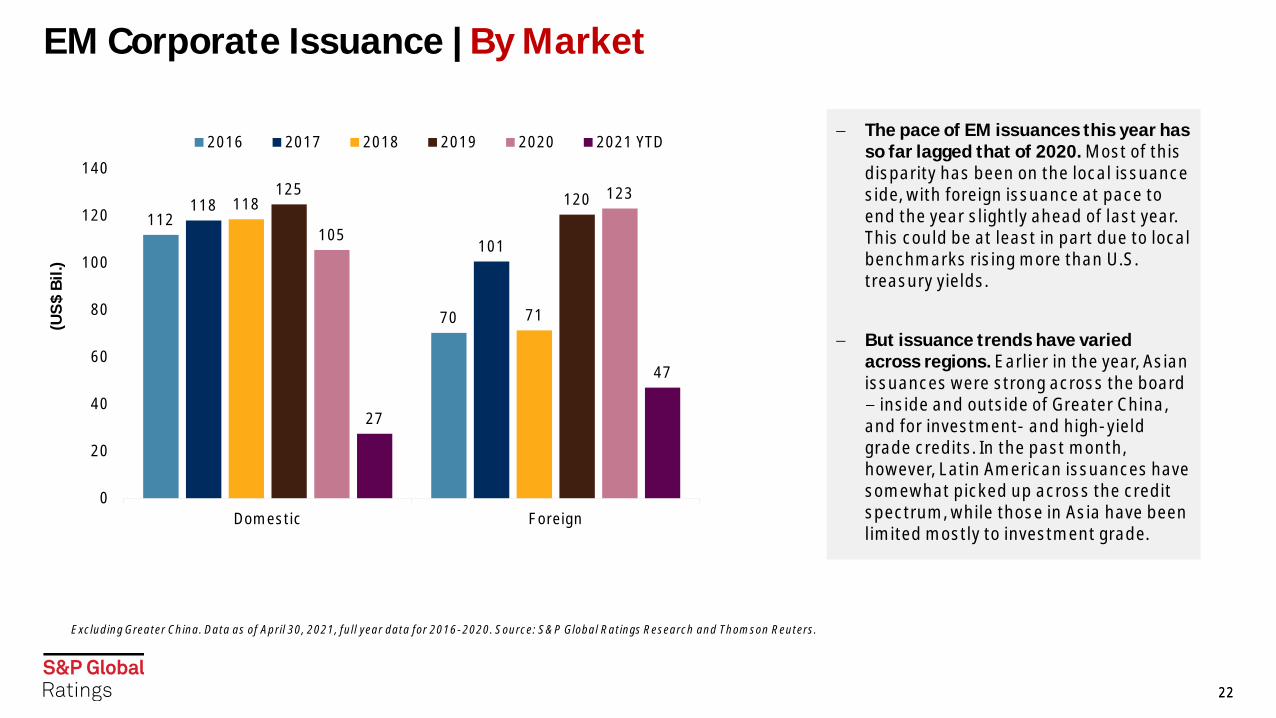
EM Corporate Issuance | By Market
22
Excluding Greater China. Data as of April 30, 2021, full year data for 2016-2020. Source: S&P Global Ratings Research and Thomson Reuters.
112
70
118
101
118
71
125120
105
123
27
47
0
20
40
60
80
100
120
140
Domestic Foreign
(US
$ B
il.)
2016 2017 2018 2019 2020 2021 YTD
C
− The pace of EM issuances this year has so far lagged that of 2020. Most of this disparity has been on the local issuance side, with foreign issuance at pace to end the year slightly ahead of last year. This could be at least in part due to local benchmarks rising more than U.S. treasury yields.
− But issuance trends have varied across regions. Earlier in the year, Asian issuances were strong across the board
inside and outside of Greater China, and for investment- and high-yield grade credits. In the past month, however, Latin American issuances have somewhat picked up across the credit spectrum, while those in Asia have been limited mostly to investment grade.

Footer : Never change the footer text on individual slides. Change, turn on or off footer by using Insert Header &
Issuance | Sovereign Top Deals By Debt Amount In The Past 90 Days
23
Data as of April 30, 2021 (last 90 days); includes local/foreign currencies; EM excludes China. Red means speculative-grade rating , blue means investment-grade rating, and grey means not rated. Source: S&P Global Ratings Research.
Issue date
Issuer CountryMarket place
S&P issue-rating
S&P sovereign rating
(as of April 30, 2021)
Security description
Currency Issuance (mil.)
6-Apr-21 Mexico Mexico U.S. Public BBB BBB 4.280% Sr Unsecurd Nts due '41 USD $ 2,499 19-Apr-21 Colombia Colombia Colombia Public BBB- BBB- 3.250% Senior Notes due '32 USD $ 1,981 30-Mar-21 Chile Chile Foreign Public A A 3.500% Sr Unsecurd Nts due '53 USD $ 1,500 19-Apr-21 Colombia Colombia Colombia Public BBB- BBB- 4.125% Senior Notes due '42 USD $ 985 22-Apr-21 Philippines Philippines Euro Public BBB+ BBB+ 1.750% Sr Unsecurd Nts due '41 EUR $ 952 22-Apr-21 Philippines Philippines Euro Public BBB+ BBB+ 0.250% Sr Unsecurd Nts due '25 EUR $ 777 22-Apr-21 Philippines Philippines Euro Public BBB+ BBB+ 1.200% Sr Unsecurd Nts due '33 EUR $ 777

Footer : Never change the footer text on individual slides. Change, turn on or off footer by using Insert Header &
Issuance | EM Sovereign Debt
24
The EM sovereign debt issuances in 2020 have surpassed the 2019 level. This year has been relatively quiet in the first two months, but issuances picked up recently.
(US $ Bil.)
0
2
4
6
8
10
12
14
16
(US
$ B
il.)
2018 2019 2020 2021 YTD
C
0
50
100
150
200
250
C
Data as of April 30, 2021; includes local/foreign currencies. China includes mainland China and Hong Kong. Source: Refinitiv and Dealogic.

Footer : Never change the footer text on individual slides. Change, turn on or off footer by using Insert Header &
Issuance | EM Financial And Non-Financial Top 20 Deals For The Past 90 Days
25
Data as of April 30, 2021 (last 90 days); excludes sovereign issuances and China. Red means speculative-grade rating , blue means investment-grade rating, and grey means NR (not rated). Table is for foreign currency only without perpetual. Source: S&P Global Ratings Research.
Issue date
Maturity date Issuer Country Sector
Market place
S&P issue rating
Security description Currency Issuance (mil.)
22-Apr-21 28-Apr-61 Petronas Capital Ltd Malaysia Financial InstitutionU.S. Private A-
3.404% Gtd Mdm-Trm Nts due '61 US
$ 1,750
22-Apr-21 28-Jan-32 Petronas Capital Ltd Malaysia Financial InstitutionU.S. Private A-
2.480% Gtd Mdm-Trm Nts due '32 US
$ 1,250
3-Feb-21 9-Feb-26PT Pertamina (Persero) Indonesia Integrated Oil & Gas
U.S. Private NR
1.400% Medium-Term Nts due '26 US
$ 1,000
12-Apr-21 19-Apr-31GENM Capital Labuan Ltd Malaysia Insurance
U.S. Private BBB
3.882% Gtd Sr Unsec Nt due '31 US
$ 1,000
3-Feb-21 9-Feb-31PT Pertamina (Persero) Indonesia Integrated Oil & Gas
U.S. Private NR
2.300% Medium-Term Nts due '31 US
$ 900
22-Apr-21 28-May-28Fomento Econo Mexicano Mexico Consumer Products
Euro Public A-
0.500% Sr Unsecurd Nts due '28 EUR
$ 838
21-Apr-21 28-Apr-31Malaysia Wakala Sukuk Bhd Malaysia Finance Company
U.S. Private A-
2.070% Islamic Finance due '31 US
$ 800
3-Feb-21 10-Feb-26 APICORP Saudi Arabia Finance CompanyEuro Public NR
1.260% Sr Med Term Nts due '26 US
$ 750
17-Feb-21 24-Feb-26 Ozon Holdings PLCRussian Federation Retail/Restaurants
Euro Public NR
1.875% Convertible Bds due '26 US
$ 750
3-Feb-21 10-Feb-31Indian Railway Fin Corp Ltd India Broker
U.S. Private BBB-
2.800% Medium-Term Nts due '31 US
$ 750

Footer : Never change the footer text on individual slides. Change, turn on or off footer by using Insert Header &
Issuance | EM Financial And Non-Financial Top 20 Deals For The Past 90 Days
26
Data as of April 30, 2021 (last 90 days); excludes sovereign issuances and China. Red means speculative-grade rating , blue means investment-grade rating, and grey means not rated. Table is for foreign currency only without perpetual. Source: S&P Global Ratings Research.
Issue date
Maturity date Issuer Country Sector
Market place
S&P issue rating
Security description Currency Issuance (mil.)
24-Feb-21 3-Jun-31 Bharti Airtel Ltd India TelecommunicationsU.S. Private BBB-
3.250% Senior Notes due '31 US
$ 749
11-Mar-21 18-Mar-31Gc Treasury Center Co Ltd Thailand Finance Company
U.S. Private BBB
2.980% Gtd Mdm-Trm Nts due '31 US
$ 691
22-Apr-21 28-May-33Fomento EconoMexicano Mexico Consumer Products
Euro Public A-
1.000% Sr Unsecurd Nts due '33 EUR
$ 596
31-Mar-21 14-Jul-28 Renew Power Pvt Ltd India UtilityU.S. Private NR
4.500% Sr Secured Nts due '28 US
$ 585
2-Feb-21 9-Feb-27Continuum Energy Levanter Pte India Broker
U.S. Private NR
4.500% Senior Notes due '27 US
$ 561
11-Mar-21 18-Mar-51Gc Treasury Center Co Ltd Thailand Finance Company
U.S. Private BBB
4.300% Gtd Mdm-Trm Nts due '51 US
$ 541
21-Apr-21 28-Apr-51Malaysia Wakala Sukuk Bhd Malaysia Finance Company
U.S. Private A-
3.075% Islamic Finance due '51 US
$ 500
3-Feb-21 8-Feb-31Hidrovias Intl Fin S.A R.L Brazil Broker
U.S. Public BB
4.950% Sr Unsecurd Nts due '31 US
$ 500
23-Mar-21 30-Mar-26PT Bk Negara Indonesia (P) Tbk Indonesia Banks
Euro Public NR
3.750% Mdm-Trm Sub Nts due '26 US
$ 500
22-Feb-21 1-Sep-26 Rec Ltd India Financial InstitutionEuro Public NR
2.250% Medium-Term Nts due '26 US
$ 499
Footer : Never change the footer text on individual slides. Change, turn on or off footer by using Insert Header &
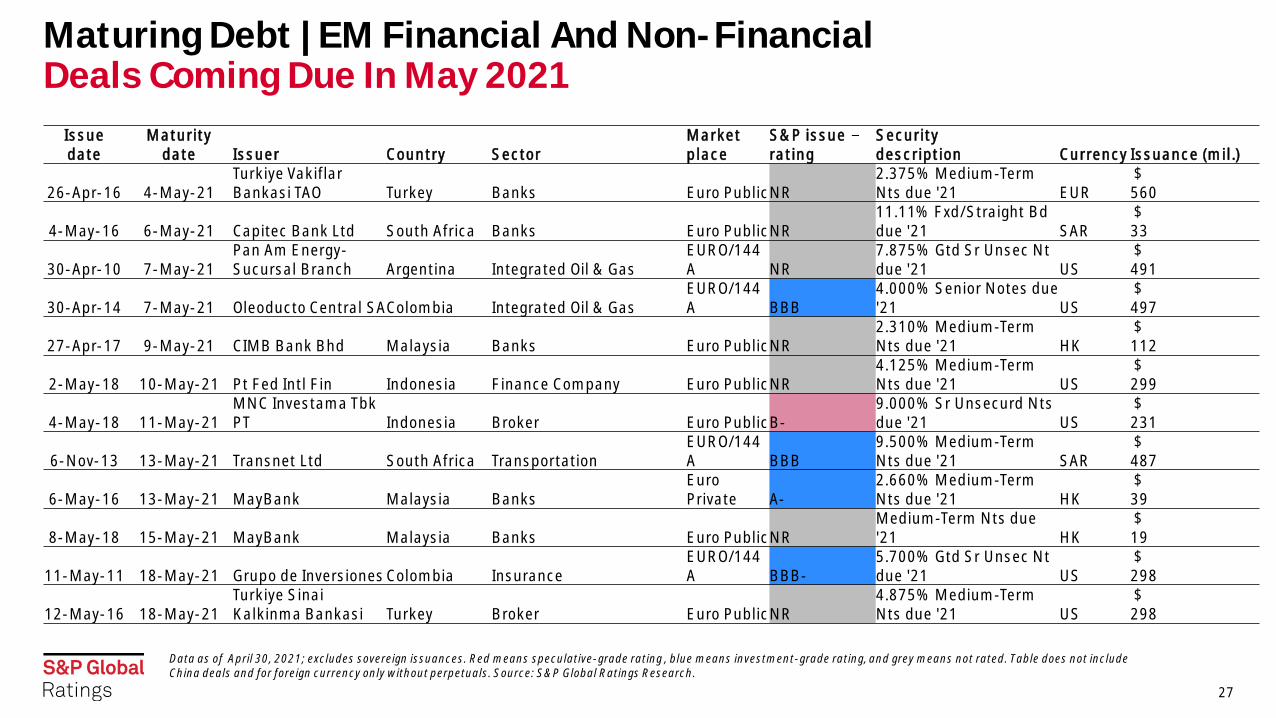
Maturing Debt | EM Financial And Non-Financial Deals Coming Due In May 2021
27
Data as of April 30, 2021; excludes sovereign issuances. Red means speculative-grade rating , blue means investment-grade rating, and grey means not rated. Table does not include China deals and for foreign currency only without perpetuals. Source: S&P Global Ratings Research.
Issue date
Maturity date Issuer Country Sector
Market place
S&P issue rating
Security description Currency Issuance (mil.)
26-Apr-16 4-May-21Turkiye Vakiflar Bankasi TAO Turkey Banks Euro PublicNR
2.375% Medium-Term Nts due '21 EUR
$ 560
4-May-16 6-May-21 Capitec Bank Ltd South Africa Banks Euro PublicNR11.11% Fxd/Straight Bd due '21 SAR
$ 33
30-Apr-10 7-May-21Pan Am Energy-Sucursal Branch Argentina Integrated Oil & Gas
EURO/144A NR
7.875% Gtd Sr Unsec Nt due '21 US
$ 491
30-Apr-14 7-May-21 Oleoducto Central SAColombia Integrated Oil & GasEURO/144A BBB
4.000% Senior Notes due '21 US
$ 497
27-Apr-17 9-May-21 CIMB Bank Bhd Malaysia Banks Euro PublicNR2.310% Medium-Term Nts due '21 HK
$ 112
2-May-18 10-May-21 Pt Fed Intl Fin Indonesia Finance Company Euro PublicNR4.125% Medium-Term Nts due '21 US
$ 299
4-May-18 11-May-21MNC Investama Tbk PT Indonesia Broker Euro PublicB-
9.000% Sr Unsecurd Nts due '21 US
$ 231
6-Nov-13 13-May-21 Transnet Ltd South Africa TransportationEURO/144A BBB
9.500% Medium-Term Nts due '21 SAR
$ 487
6-May-16 13-May-21 MayBank Malaysia BanksEuro Private A-
2.660% Medium-Term Nts due '21 HK
$ 39
8-May-18 15-May-21 MayBank Malaysia Banks Euro PublicNRMedium-Term Nts due '21 HK
$ 19
11-May-11 18-May-21 Grupo de Inversiones Colombia InsuranceEURO/144A BBB-
5.700% Gtd Sr Unsec Nt due '21 US
$ 298
12-May-16 18-May-21Turkiye Sinai Kalkinma Bankasi Turkey Broker Euro PublicNR
4.875% Medium-Term Nts due '21 US
$ 298

Footer : Never change the footer text on individual slides. Change, turn on or off footer by using Insert Header &
Maturing Debt | EM Financial And Non-Financial Deals Coming Due In May And June 2021
28
Data as of April 30, 2021; excludes sovereign. Red means speculative-grade rating , blue means investment-grade rating, and grey means not rated. Table does not include China deals and for foreign currency only without perpetuals. Source: S&P Global Ratings Research.
Issue date
Maturity date Issuer Country Sector
Market place
S&P issue rating
Security description Currency Issuance (mil.)
16-May-11 23-May-21PT Pertamina (Persero) Indonesia Integrated Oil & Gas
EURO/144A BB+
5.250% Fxd/Straight Bd due '21 US
$ 981
17-May-11 24-May-21Automotores Gildemeister SA Chile Automotive
EURO/144A NR
8.250% Sr Unsecurd Nts due '21 US
$ 300
9-Jan-12 24-May-21Automotores Gildemeister SA Chile Automotive
EURO/144A NR
8.250% Senior Notes due '21 US
$ 102
19-May-11 26-May-21 CFE Mexico UtilityEURO/144A BBB
4.875% Sr Unsecurd Nts due '21 US
$ 992
19-May-20 26-May-21Icbc (Thai) Leasing Co Ltd Thailand Finance Company
Malaysia Private NR
1.650% Sr Unsecurd Nts due '21 BA
$ 47
24-May-11 3-Jun-21 Bancolombia SA Colombia BanksEURO/144A NR
5.950% Sr Unsecurd Nts due '21 US
$ 995
26-May-11 3-Jun-21 RosselkhozbankRussian Federation Banks
EURO/144A NR
6.000% Mdm-Trm Sub Nts due '21 US
$ 800
28-Oct-14 4-Jun-21 Firstrand Bank Ltd South Africa Banks Euro PublicNR Flt Rt Sr Bonds due '21 SAR$
18
1-Jun-16 8-Jun-21Hazine Mustesarligi Varlik AS Turkey Finance Company
EURO/144A NR
4.251% Islamic Finance due '21 US
$ 1,000
1-Jun-16 8-Jun-21 MayBank Malaysia BanksEuro Private NR Float Rate Nts due '21 US
$ 20
2-Jun-16 9-Jun-21Banco Santander Chile SA Chile Banks
Euro Private NR
Medium-Term Nts due '21 US
$ 10
4-Jun-17 14-Jun-21Santander Consumer Bank Sa Poland Banks Euro PublicNR Mdm-Trm Fl Nts due '21 SKR
$ 58
Footer : Never change the footer text on individual slides. Change, turn on or off footer by using Insert Header &
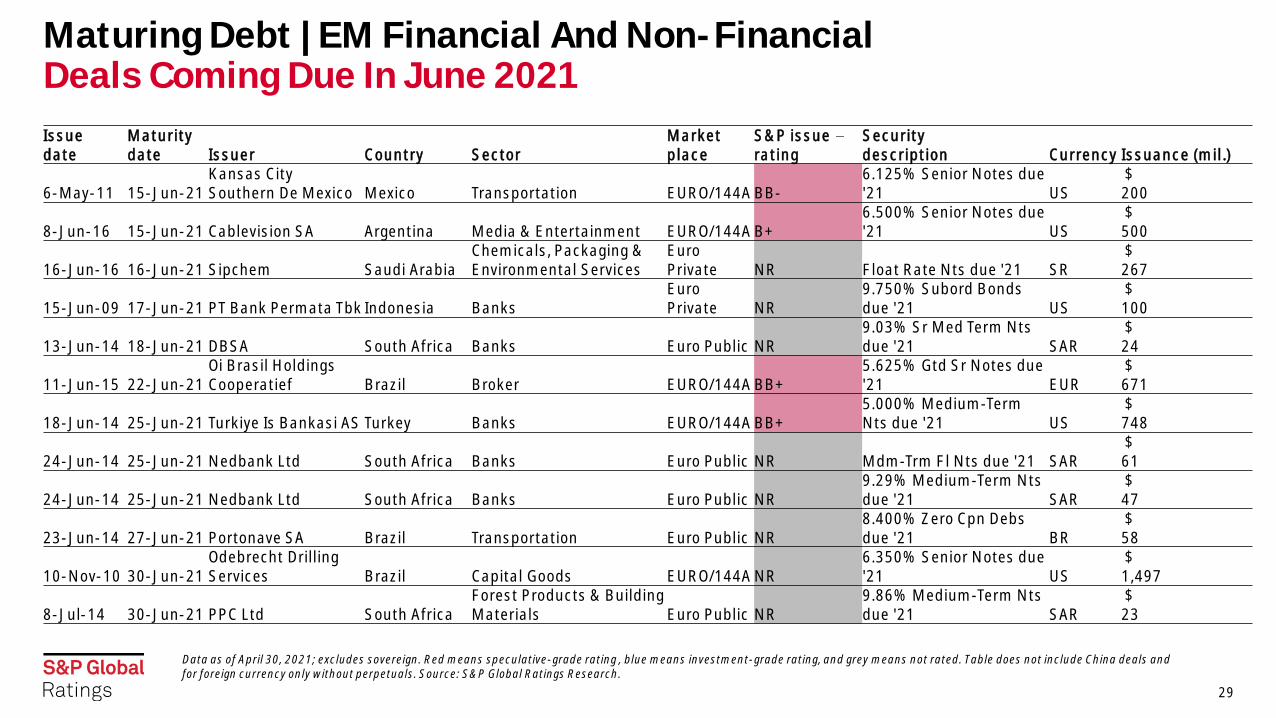
Maturing Debt | EM Financial And Non-Financial Deals Coming Due In June 2021
29
Data as of April 30, 2021; excludes sovereign. Red means speculative-grade rating , blue means investment-grade rating, and grey means not rated. Table does not include China deals and for foreign currency only without perpetuals. Source: S&P Global Ratings Research.
Issue date
Maturity date Issuer Country Sector
Market place
S&P issue rating
Security description Currency Issuance (mil.)
6-May-11 15-Jun-21Kansas City Southern De Mexico Mexico Transportation EURO/144A BB-
6.125% Senior Notes due '21 US
$ 200
8-Jun-16 15-Jun-21 Cablevision SA Argentina Media & Entertainment EURO/144A B+6.500% Senior Notes due '21 US
$ 500
16-Jun-16 16-Jun-21 Sipchem Saudi ArabiaChemicals, Packaging & Environmental Services
Euro Private NR Float Rate Nts due '21 SR
$ 267
15-Jun-09 17-Jun-21 PT Bank Permata Tbk Indonesia BanksEuro Private NR
9.750% Subord Bonds due '21 US
$ 100
13-Jun-14 18-Jun-21 DBSA South Africa Banks Euro Public NR9.03% Sr Med Term Nts due '21 SAR
$ 24
11-Jun-15 22-Jun-21Oi Brasil Holdings Cooperatief Brazil Broker EURO/144A BB+
5.625% Gtd Sr Notes due '21 EUR
$ 671
18-Jun-14 25-Jun-21 Turkiye Is Bankasi AS Turkey Banks EURO/144A BB+5.000% Medium-Term Nts due '21 US
$ 748
24-Jun-14 25-Jun-21 Nedbank Ltd South Africa Banks Euro Public NR Mdm-Trm Fl Nts due '21 SAR$
61
24-Jun-14 25-Jun-21 Nedbank Ltd South Africa Banks Euro Public NR9.29% Medium-Term Nts due '21 SAR
$ 47
23-Jun-14 27-Jun-21 Portonave SA Brazil Transportation Euro Public NR8.400% Zero Cpn Debs due '21 BR
$ 58
10-Nov-10 30-Jun-21Odebrecht Drilling Services Brazil Capital Goods EURO/144A NR
6.350% Senior Notes due '21 US
$ 1,497
8-Jul-14 30-Jun-21 PPC Ltd South AfricaForest Products & Building Materials Euro Public NR
9.86% Medium-Term Nts due '21 SAR
$ 23

Footer : Never change the footer text on individual slides. Change, turn on or off footer by using Insert Header &
Ratings Summary

Footer : Never change the footer text on individual slides. Change, turn on or off footer by using Insert Header &
Ratings Summary | Sovereigns In April
31
Note: Foreign currency ratings. Red means speculative-grade rating, and blue means investment-grade rating. Data and CDS spread are as of April 30, 2021. China median rating includes China, Hong Kong, Macau, Taiwan, and Red Chip companies. Source: S&P Global Ratings Research and S&P Capital IQ.
Country Rating Outlook Five-year CDS spread Median rating financials (OLCW) Median rating non-financials (OLCW)
Argentina CCC+ Stable 1755 CCC+
Brazil BB- Stable 190 BB-
Chile A Stable 53 BBB
China A+ Stable 38 A BBB
Colombia BBB- Negative 126 BBB-
India BBB- Stable 92 BB+
Indonesia BBB Negative 78 B
Malaysia A- Negative 46 BBB+
Mexico BBB Negative 94 BB+ BBB-
Philippines BBB+ Stable 46 BBB+
Poland A- Stable 46 A- BB+
Russia BBB- Stable 98 BB BB+
Saudi Arabia A- Stable 67 BBB BBB+
South Africa BB- Stable 214 BB-
Thailand BBB+ Stable 41 A- BBB+
Turkey B+ Stable 416 BB-

Footer : Never change the footer text on individual slides. Change, turn on or off footer by using Insert Header &
Rating Actions | Top 15 By Debt Amount In The Past 90 Days
32
Data as of April 30, 2021, excludes sovereigns, Greater China and the Red Chip companies and includes only latest rating changes. SD Selective Default. Source: S&P Global Ratings Research.
Rating date Issuer Country Sector To From Action typeDebt amount (mil.)
9-Feb-21 PTT Public Co. Ltd. Thailand Integrated Oil & Gas BBB+ A- Downgrade $ 6,055
25-Mar-21Banco Santander-Chile S.A. (Banco Santander S.A.) Chile Bank A- A Downgrade $ 3,039
26-Feb-21 YPF S.A ArgentinaOil & Gas Exploration & Production SD CC Downgrade $ 2,951
25-Mar-21 Banco del Estado de Chile Chile Bank A A+ Downgrade $ 2,605 25-Mar-21 Empresa de Transporte de Pasajeros Metro S.A. Chile Utilities A A+ Downgrade $ 2,500 25-Mar-21 Empresa Nacional del Petroleo Chile Utilities BB+ BBB- Downgrade $ 2,480 5-Apr-21 Tata Steel Ltd. India Metals, Mining & Steel BB- B+ Upgrade $ 2,300 25-Mar-21 Banco de Credito e Inversiones Chile Bank A- A Downgrade $ 1,657 23-Apr-21 TMK PAO Russia Metals, Mining & Steel B+ BB- Downgrade $ 1,000 22-Mar-21 Arcelik A.S. Turkey Consumer Products BB+ BB Upgrade $ 917 12-Apr-21 Sovcomflot PAO Russia Transportation BBB- BB+ Upgrade $ 750
24-Mar-21Colombia Telecomunicaciones, S.A. E.S.P (Telefonica S.A.) Colombia Telecommunications BB BB+ Downgrade $ 500
28-Apr-21 Future Retail Limited India Retail/Restaurants SD CCC- Downgrade $ 500 13-Apr-21 YPF Energia Electrica S.A. (YPF S.A) Argentina Utilities SD CCC- Downgrade $ 400 10-Feb-21 PT Tower Bersama Infrastructure Tbk. Indonesia Telecommunications BB+ BB Upgrade $ 350 19-Feb-21 Embraer S.A. Brazil Aerospace & Defense BB BB+ Downgrade $ 332 22-Apr-21 Alpha Holding S.A. de C.V. Mexico Financial Institutions CCC B- Downgrade $ 300
5-Apr-21Sixsigma Networks Mexico, S.A. De C.V.(KIO Networks) Mexico High Technology B B+ Downgrade $ 300
17-Feb-21 AES Argentina Generacion S.A (AES Corp. (The)) Argentina Utilities CCC+ CCC- Upgrade $ 300
18-Mar-21 Grupo Cementos de Chihuahua S.A.B. de C.V. MexicoForest Products & Building Materials BBB- BB+ Upgrade $ 260
Footer : Never change the footer text on individual slides. Change, turn on or off footer by using Insert Header &
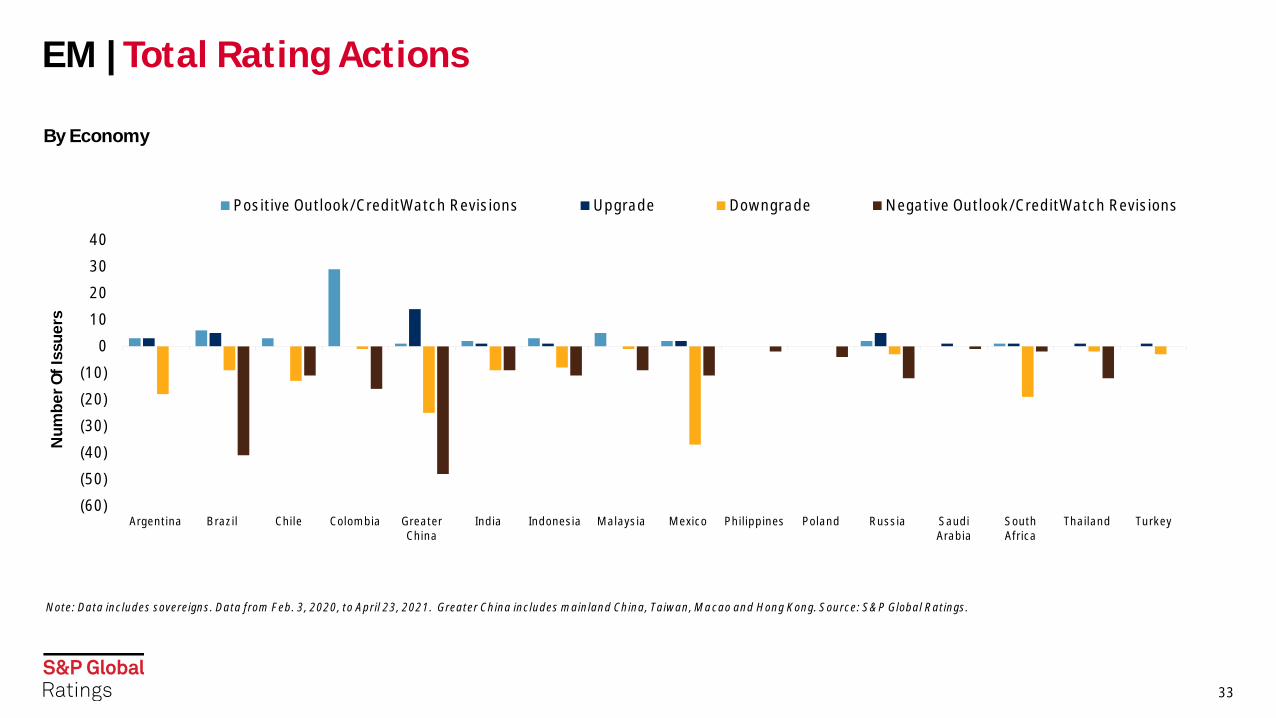
By Economy
EM | Total Rating Actions
33
Note: Data includes sovereigns. Data from Feb. 3, 2020, to April 23, 2021. Greater China includes mainland China, Taiwan, Macao and Hong Kong. Source: S&P Global Ratings.
(60)
(50)
(40)
(30)
(20)
(10)
0
10
20
30
40
Argentina Brazil Chile Colombia GreaterChina
India Indonesia Malaysia Mexico Philippines Poland Russia SaudiArabia
SouthAfrica
Thailand Turkey
Nu
mb
er
Of
Iss
ue
rs
Positive Outlook/CreditWatch Revisions Upgrade Downgrade Negative Outlook/CreditWatch Revisions
C
Footer : Never change the footer text on individual slides. Change, turn on or off footer by using Insert Header &
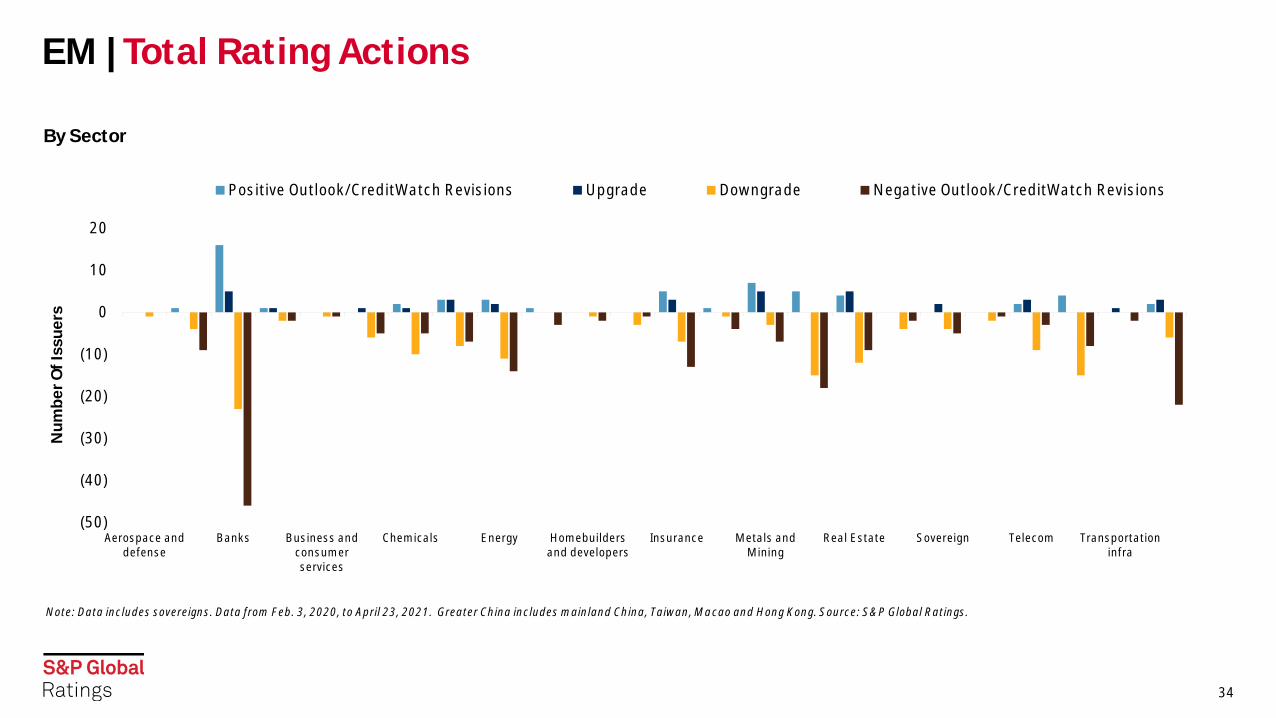
By Sector
EM | Total Rating Actions
34
Note: Data includes sovereigns. Data from Feb. 3, 2020, to April 23, 2021. Greater China includes mainland China, Taiwan, Macao and Hong Kong. Source: S&P Global Ratings.
(50)
(40)
(30)
(20)
(10)
0
10
20
Aerospace anddefense
Banks Business andconsumerservices
Chemicals Energy Homebuildersand developers
Insurance Metals andMining
Real Estate Sovereign Telecom Transportationinfra
Nu
mb
er
Of
Iss
ue
rs
Positive Outlook/CreditWatch Revisions Upgrade Downgrade Negative Outlook/CreditWatch Revisions
C

Footer : Never change the footer text on individual slides. Change, turn on or off footer by using Insert Header &
35
− The largest number of rating downgrades were in May 2020 (35).
− The most CreditWatch listings/outlook revisions to negative occurred in April 2020 (96).
− The rating actions slowed markedly compared with the same period last year. For April 2021 in EM, we saw six downgrades, one CreditWatch listings/outlook revisions to negative, 12 upgrades, and 17 CreditWatch listings/outlook revisions to positive.
EM | Total Rating Actions
35
Data includes sovereigns. Data from Feb. 3, 2020, to April 23, 2021. EMs consist of Argentina, Brazil, Chile, China, Colombia, Mexico, India, Indonesia, Malaysia, Thailand, the Philippines, Poland, Russia, Saudi Arabia, South Africa, and Turkey. Source: S&P Global Ratings.
(140)
(120)
(100)
(80)
(60)
(40)
(20)
0
20
40
Nu
mb
er
Of
Iss
ue
rs
Negative Outlook/CreditWatch Revisions Downgrade
Upgrade Positive Outlook/CreditWatch Revisions
By Month

Footer : Never change the footer text on individual slides. Change, turn on or off footer by using Insert Header &
36
− EM Asia (excluding China). The April 2021 downgrade potential was 36%, slightly lower than for March 2021 (41%), but much higher than both 5- and 10-year historical averages.
− EEMEA. April downgrade (8%) potential was much lower, especially compared with the other EMs.
− LatAm. Downgrade potential in April (43%) stayed above both historical averages.
− Greater China. The April downgrade potential (12%) was slightly below its 5-year average (17%) and 10-year average (18%).
Downgrade Potential | Regional Negative Bias
36
Data as of April 30, 2021 and exclude sovereigns. Latin America: Argentina, Brazil, Chile, Colombia, Mexico. EM Asia: India, Indonesia, Malaysia, Thailand, Philippines. EEMEA: Poland, Russia, Saudi Arabia, South Africa, Turkey. Greater China: China, Hong Kong, Macau, Taiwan, and Red Chip companies. Source: S&P Global Ratings Research.
0%
5%
10%
15%
20%
25%
30%
35%
40%
45%
50%
EM Asia (ex. China) EEMEA Latin America Greater China
Ne
ga
tiv
e B
ias
(%
)
10-Year Average 5-Year Average April. 30, 2021
C

Footer : Never change the footer text on individual slides. Change, turn on or off footer by using Insert Header &
EM Downgrade Potential | By Sector
37
Data as of April 30, 2021 and include sectors with more than five issuers only; excludes sovereigns. EMs consist of Argentina, Brazil, Chile, China, Colombia, Mexico, India, Indonesia, Malaysia, Thailand, Philippines, Poland, Russia, Saudi Arabia, South Africa, and Turkey. Greater China --- China, Hong Kong, Macau, Taiwan, and Red Chip companies. Media/entert -- Media and entertainment, Retail -- Retail/restaurants, CP&ES -- Chemicals, packaging and environmental services, Home/RE -- Homebuilders/real estate companies, Forest -- Forest products and building materials. Source: S&P Global Ratings Research.
The Automotive, And Forest Products And Building Materials Sectors Continued To Lead The Sector Downgrade Potentials In April
0% 10% 20% 30% 40% 50% 60% 70% 80% 90% 100%
Health care (5)
Insurance (21)
Metals/mining/steel (33)
Consumer products (34)
Oil & Gas (20)
High technology (12)
Home/RE (58)
Telecommunications (22)
Media/entert (5)
Capital goods (12)
Transportation (12)
Financial institutions (142)
CP&ES (17)
Utilities (68)
Retail (10)
Forest (9)
Automotive (11)
Negative Bias
Se
cto
r (#
of
Iss
ue
rs)
Current Negative Bias (April 30, 2021) 5-Year Averages
Footer : Never change the footer text on individual slides. Change, turn on or off footer by using Insert Header &
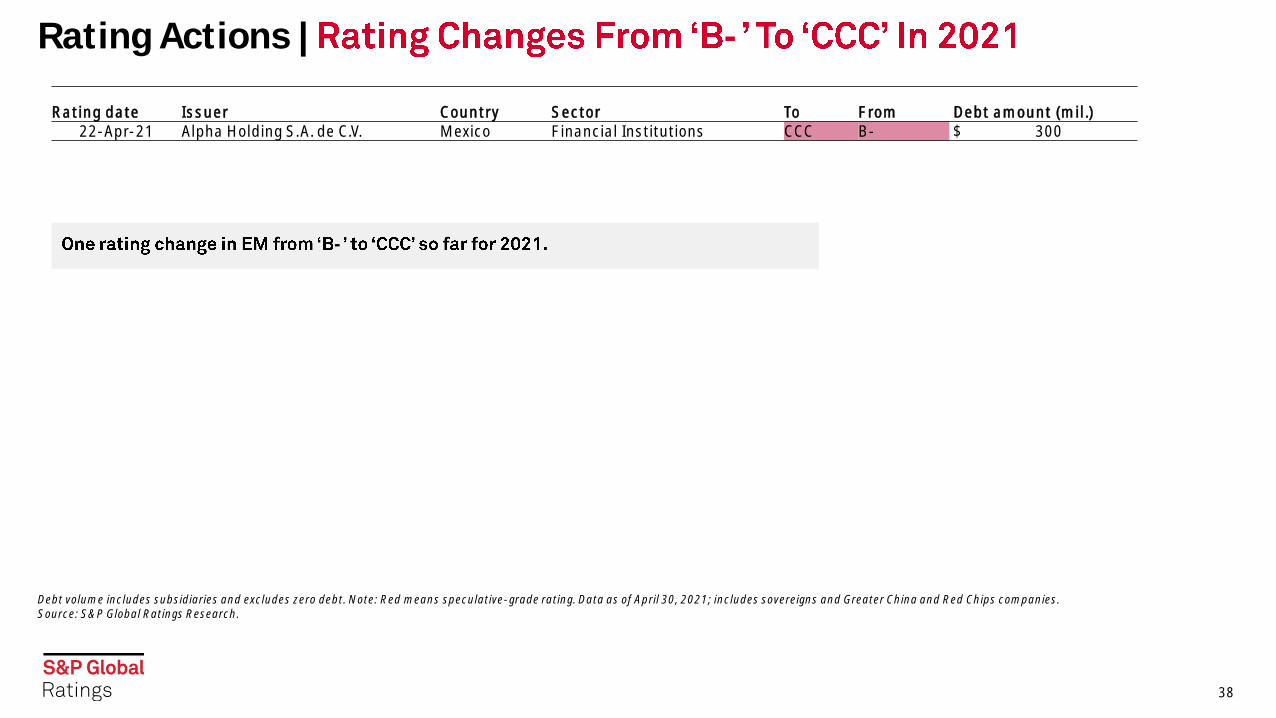
Rating Actions | -
38
Debt volume includes subsidiaries and excludes zero debt. Note: Red means speculative-grade rating. Data as of April 30, 2021; includes sovereigns and Greater China and Red Chips companies. Source: S&P Global Ratings Research.
Rating date Issuer Country Sector To From Debt amount (mil.) 22-Apr-21 Alpha Holding S.A. de C.V. Mexico Financial Institutions CCC B- $ 300
-

Footer : Never change the footer text on individual slides. Change, turn on or off footer by using Insert Header &
Rating Actions | -
39
Debt volume includes subsidiaries and excludes zero debt. Note: Red means speculative-grade rating. Data as of Dec. 31, 2020; includes sovereigns and Greater China and Red Chips companies. Source: S&P Global Ratings Research.
Rating date Issuer Country Sector To FromDebt amount
(mil.)
8-May-20 YPF S.A ArgentinaOil and gas exploration and production CCC+ B- $ 1,969
18-Jun-20 Oi S.A. Brazil Telecommunications CC B- $ 1,654 8-May-20 Pampa Energia S.A. Argentina Utilities CCC+ B- $ 1,550
27-Apr-20 CAR Inc.Cayman Islands Transportation CCC B- $ 557
30-Apr-20 PT Alam Sutera Realty Tbk. Indonesia Homebuilders/real estate CCC+ B- $ 545
8-May-20Transportadora de Gas del Sur S.A. (TGS) (Compania De Inversiones de EnergiaS.A.) Argentina Utilities CCC+ B- $ 500
8-Apr-20 GCL New Energy Holdings Ltd. (GCL-Poly Energy Holdings Ltd.) Bermuda Utilities CCC B- $ 500 17-Mar-20 IRSA Inversiones y Representaciones S.A. (Cresud S.A.C.I.F. y A.) Argentina Homebuilders/real estate CCC+ B- $ 431 8-May-20 Telecom Argentina S.A. Argentina Telecommunications CCC+ B- $ 400 29-Apr-20 Aeropuertos Argentina 2000 S.A. Argentina Utilities CC B- $ 400 19-Jun-20 PT Modernland Realty Tbk. Indonesia Homebuilders/real estate CCC B- $ 390 16-Mar-20 Banco Hipotecario S.A. Argentina Bank CCC B- $ 350 6-Apr-20 Grupo Kaltex, S.A. de C.V. Mexico Consumer products CCC B- $ 320 13-Jan-20 Empresa Distribuidora Y Comercializadora Norte S.A. Argentina Utilities CCC+ B- $ 300
8-May-20 Compania General de Combustibles S.A. ArgentinaOil and gas exploration and production CCC+ B- $ 300
8-May-20 CAPEX S.A. Argentina Utilities CCC+ B- $ 300 8-May-20 AES Argentina Generacion S.A (AES Corp. (The)) Argentina Utilities CCC+ B- $ 300 9-Apr-20 PT Gajah Tunggal Tbk. Indonesia Automotive CCC+ B- $ 250 8-May-20 Banco De Galicia Y Buenos Aires S.A.U. Argentina Bank CCC+ B- $ 250 19-Mar-20 PT MNC Investama Tbk. Indonesia Media and entertainment CCC B- $ 231 8-Apr-20 Pearl Holding III Ltd. China Automotive CCC+ B- $ 175
13-Apr-20Compania de Transporte de Energia Electrica en Alta Tension TRANSENER S.A. Argentina Utilities CCC+ B- $ 99

Footer : Never change the footer text on individual slides. Change, turn on or off footer by using Insert Header &
Rating Actions | Fallen Angels In EM
40
Debt volume includes subsidiaries and excludes zero debt. Note: Red means speculative-grade rating. Data as of April 30, 2021; includes sovereigns and Greater China and Red Chips companies. Source: S&P Global Ratings Research.
Rating date Issuer Country Sector To From
Debt amount (mil.)
15-Jun-20 Embraer S.A. Brazil Aerospace and defense BB+ BBB- $ 500 26-Jun-20 Axis Bank Ltd. India Bank BB+ BBB- $ 1,095 8-Jul-20 Braskem S.A. (Odebrecht S.A.) Brazil Chemicals, packaging and environmental services BB+ BBB- $ 4,150 14-Jul-20 Zijin Mining Group Co. Ltd. China Metals, mining and steel BB+ BBB- $ 350
One EM fallen angel so far in 2021.
Debt volume includes subsidiaries and excludes zero debt. Note: Red means speculative-grade rating. Data as of Dec. 31, 2020; includes sovereigns and Greater China and Red Chips companies. Source: S&P Global Ratings Research.
Rating date Issuer Country Sector To From
Debt amount (mil.)
25-Mar-21 Empresa Nacional del Petroleo Chile Utilities BB+ BBB- $ 2,480
Footer : Never change the footer text on individual slides. Change, turn on or off footer by using Insert Header &
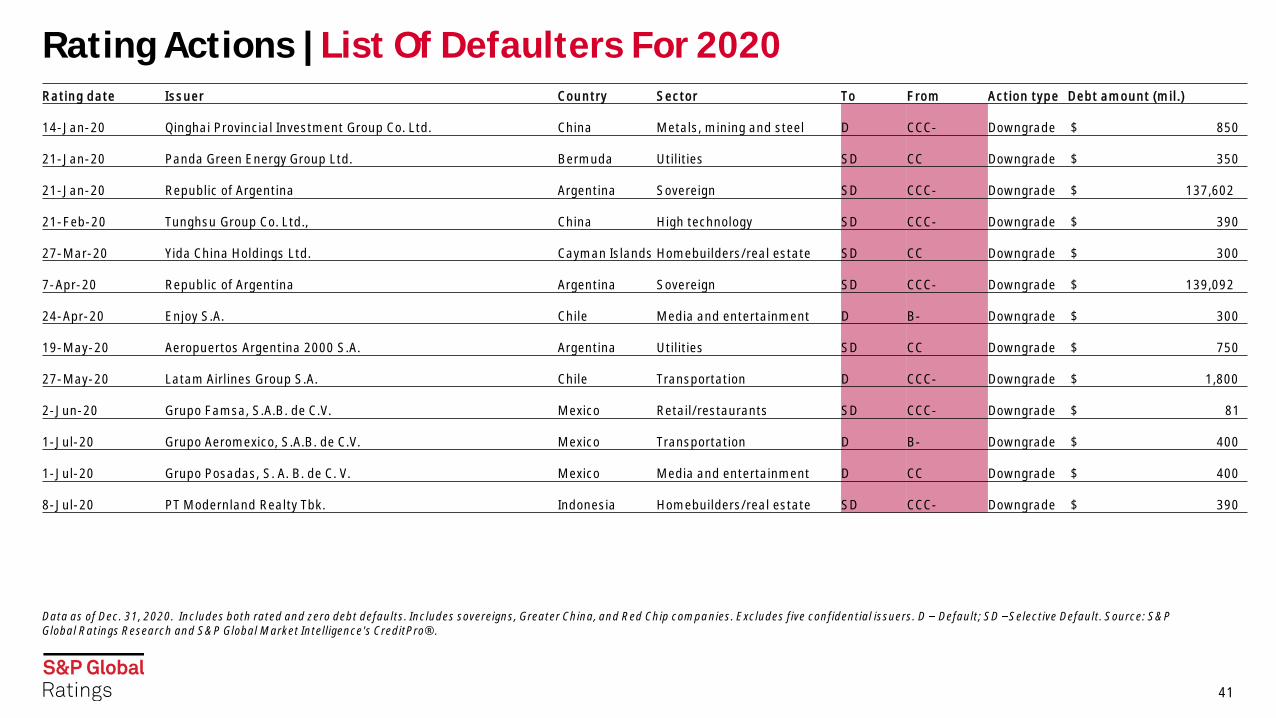
Rating Actions | List Of Defaulters For 2020
41
Data as of Dec. 31, 2020. Includes both rated and zero debt defaults. Includes sovereigns, Greater China, and Red Chip companies. Excludes five confidential issuers. D Default; SD Selective Default. Source: S&P Global Ratings Research and S&P Global Market Intelligence's CreditPro®.
Rating date Issuer Country Sector To From Action type Debt amount (mil.)
14-Jan-20 Qinghai Provincial Investment Group Co. Ltd. China Metals, mining and steel D CCC- Downgrade $ 850
21-Jan-20 Panda Green Energy Group Ltd. Bermuda Utilities SD CC Downgrade $ 350
21-Jan-20 Republic of Argentina Argentina Sovereign SD CCC- Downgrade $ 137,602
21-Feb-20 Tunghsu Group Co. Ltd., China High technology SD CCC- Downgrade $ 390
27-Mar-20 Yida China Holdings Ltd. Cayman Islands Homebuilders/real estate SD CC Downgrade $ 300
7-Apr-20 Republic of Argentina Argentina Sovereign SD CCC- Downgrade $ 139,092
24-Apr-20 Enjoy S.A. Chile Media and entertainment D B- Downgrade $ 300
19-May-20 Aeropuertos Argentina 2000 S.A. Argentina Utilities SD CC Downgrade $ 750
27-May-20 Latam Airlines Group S.A. Chile Transportation D CCC- Downgrade $ 1,800
2-Jun-20 Grupo Famsa, S.A.B. de C.V. Mexico Retail/restaurants SD CCC- Downgrade $ 81
1-Jul-20 Grupo Aeromexico, S.A.B. de C.V. Mexico Transportation D B- Downgrade $ 400
1-Jul-20 Grupo Posadas, S. A. B. de C. V. Mexico Media and entertainment D CC Downgrade $ 400
8-Jul-20 PT Modernland Realty Tbk. Indonesia Homebuilders/real estate SD CCC- Downgrade $ 390

Footer : Never change the footer text on individual slides. Change, turn on or off footer by using Insert Header &
Rating Actions | List Of Defaulters For 2020 And 2021 YTD
42
Data as of April 30, 2021. Includes both rated and zero debt defaults. Includes sovereigns, Greater China, and Red Chip companies. Excludes five confidential issuers in 2020 and one in 2021 YTD. D Default; SD Selective Default. Source: S&P Global Ratings Research and S&P Global Market Intelligence's CreditPro®.
Rating date Issuer Country Sector To FromAction type Debt amount (mil.)
9-Oct-20 Oi S.A. Brazil Telecommunications SD CC Downgrade $ 1,654 14-Oct-20 Banco Hipotecario S.A. Argentina Bank SD CC Downgrade $ 350
16-Oct-20Corp Group Banking S.A. (Inversiones CorpGroup Interhold, Ltda.) Chile Financial institutions D CC Downgrade $ 500
28-Oct-20 PT Alam Sutera Realty Tbk. IndonesiaHomebuilders/real estate companies D CC Downgrade $ 545
12-Nov-20IRSA Inversiones y Representaciones S.A. (Cresud S.A.C.I.F. y A.) Argentina
Homebuilders/real estate companies SD CC Downgrade $ 360
26-Feb-21 YPF S.A ArgentinaOil & gas exploration & production SD CC Downgrade $ 2,900
13-Apr-21 YPF Energia Electrica S.A. (YPF S.A) Argentina Utilities SD CCC- Downgrade $ 400 27-Apr-21 Maxcom Telecomunicaciones, S.A.B. de C.V. Mexico Telecommunications D CCC- Downgrade $ 57 28-Apr-21 Future Retail Ltd. India Retail/restaurants SD CCC- Downgrade $ 500

Footer : Never change the footer text on individual slides. Change, turn on or off footer by using Insert Header &
43
− One fallen angel. Through April 2021, Chile based Empresa Nacional del Petroleo was the only one fallen angel in EM16.
− Potential fallen angel counts decreased when compared with last month. The number of potential fallen angels--and the debt they represent--continues to fall as the economic recovery takes hold and COVID-19 vaccinations roll out.
− Among the current EM potential fallen angels, there were none on CreditWatch, indicating lower immediate downgrade risk, as potential fallen angels with negative outlooks typically have a one-in-three chance of a downgrade within two years of receiving the negative outlook.
− For more information, see Turbulent Year, Rising Stars Once Again Outnumber Fallen AngelsMay 5, 2021.
Rating Actions | Fallen Angels And Potential Fallen Angels
43
One EM Fallen Angel In 2021 YTD, Potential Fallen Angels Level Decreasing Slowly
Data as of April 30, 2021. Parent only. Source: S&P Global Ratings Research.
EM Potential Fallen Angels By Economy
Data as of April 30, 2021. Source: S&P Global Ratings Research.
0
10
20
30
40
2010 2011 2012 2013 2014 2015 2016 2017 2018 2019 2020 2021
Iss
ue
rs
Fallen Angels Year-End Potential Fallen Angels
C
0
2
4
6
8
Brazil Chile GreaterChina
Colombia India Indonesia Mexico
PF
A C
ou
nt
of
Iss
ue
rs
April 30, 2021 PFAs April 30, 2020 PFAs
C

Footer : Never change the footer text on individual slides. Change, turn on or off footer by using Insert Header &
44
− Weakest links. EM saw 14 issuers on the weakest links list (nearly 7% of total speculative-grade issuers), reflecting default prospects for the weakest issuers.
− Default rates. March default rates slightly declined across EMs, except EEMEA which remained stable at 0.97%.
− For more information, see Despite A Pickup In Positive
Rating Actions, The Weakest Links Tally Remains Highpublished May 6, 2021.
Rating Actions | Weakest Links And Defaults
44
Data as of April 30, 2021 (OLCW). Parent only. Source: S&P Global Ratings Research.
Default Rates At High Levels After Reaching Record Level In 2020
CreditPro data as of March 31, 2021. Default rates are trailing 12-month speculative-grade default rates. Source: S&P Global Ratings Research and S&P Global Market Intelligence's CreditPro®.
EM Weakest Links Reached Record Highs In 2020, Pointing To Likely Higher Default Rates In 1H 2021
0%
5%
10%
15%
20%
05
101520253035
Apr-18 Oct-18 Apr-19 Oct-19 Apr-20 Oct-20 Apr-21Nu
mb
er
of
Iss
ue
rs
Weakest Links Count (left scale)
Weakest Link Share of Speculative-Grade Population (%) (right scale)
EM Asia (ex. China), 4.17
EEMEA, 0.97
Latin America, 4.90
Emerging Markets (ex. China), 3.89
0
1
2
3
4
5
6
7
8
De
fau
lt R
ate
(%
)
Month
EM Asia (ex. China) EEMEA Latin America Emerging Markets (ex. China)
C

Footer : Never change the footer text on individual slides. Change, turn on or off footer by using Insert Header &
45
Rating Actions | Defaults
45
*Data as of April 30, 2021. Data has been updated to reflect confidential issuers. Excludes sovereigns, includes Greater China, and Red Chip companies. Sources: S&P Global Ratings Research and S&P Global
Year-End EM 16 Corporate Defaults By Reason
*Data as of April 30, 2021. Data has been updated to reflect confidential issuers. Excludes sovereigns, includes Greater China, and Red Chip companies. Sources: S&P Global Ratings Research and S&P Global
Year-End Global Corporate Defaults By Reason
050
100150200250300
2008 2009 2010 2011 2012 2013 2014 2015 2016 2017 2018 2019 2020 2021 YTD
Nu
mb
er
Of
De
fau
lts
Bankruptcy-Related Distressed Exchanges / Out-Of-Court Restructuring
Missed principal/interest payments and default on financial obligations Regulatory Intervention
Confidential
05
10152025
2012 2013 2014 2015 2016 2017 2018 2019 2020 2021 YTD
Nu
mb
er
Of
De
fau
lts
Bankruptcy-Related Distressed Exchanges / Out-Of-Court RestructuringMissed principal/interest payments and default on financial obligations Regulatory InterventionConfidential

Footer : Never change the footer text on individual slides. Change, turn on or off footer by using Insert Header &
Related Research

Footer : Never change the footer text on individual slides. Change, turn on or off footer by using Insert Header &
EMs | Related Research
Emerging Markets: Returning To Pre-Pandemic GDP Is Only Part Of The Recovery Story, May 6, 2021
Despite A Pickup In Positive Rating Actions, The Weakest Links Tally Remains High, May 6, 2021
COVID-19 Impact: Key Takeaways From Our Articles, May 5, 2021
Second COVID Wave May Derail India's Budding Recovery, May 5, 2021
'BBB' Pulse: After A Turbulent Year, Rising Stars Once Again Outnumber Fallen Angels, May 5, 2021
Global Actions On Corporations, Sovereigns, International Public Finance, And Project Finance To Date In 2021, April 27, 2021
Global Credit Conditions Q2 2021: The Risks Of An Uneven Recovery, March 30, 2021
Credit Conditions Emerging Markets Q2 2021: Brighter Prospects Prone To Setbacks, March 30, 2021
Credit Conditions North America Q2 2021: As Outlook Brightens, Risks Remain, March 30, 2021
Credit Conditions Asia-Pacific Q2 2021: Uneven Recovery, March 30, 2021
Credit Conditions Europe Q2 2021: New Horizons, Old Risks, March 30, 2021
Economic Outlook Emerging Markets Q2 2021: Tailwinds From Stronger Global Growth, But Several Challenges On The Radar, March 30, 2021
Economic Outlook Latin America Q2 2021: Despite Growth Picking Up, Pre-Pandemic Weaknesses Remain, March 25, 2021
Economic Outlook Asia-Pacific Q2 2021: Three-Speed Recovery Will Benefit From Faster Global Growth, March 25, 2021
Economic Research: Orderly Global Reflation Will Support The Recovery From COVID-19, March 22, 2021
Economic Research: Rising Commodity Prices Are Generally Good News For Emerging Markets--But Watch Out For Inflation, March 19, 2021
47

Footer : Never change the footer text on individual slides. Change, turn on or off footer by using Insert Header &
EMs | Contacts
48
Economics Global Paul F Gruenwald, New York, +1-212-438-1710, [email protected]
Asia-Pacific Shaun Roache, Singapore, +65-6597-6137, [email protected]
Emerging Markets Tatiana Lysenko, Paris, +33-1-4420-6748, [email protected]
Europe, Middle-East & Africa Sylvain Broyer, Frankfurt, +49-69-33-999-156, [email protected]
Latin America Elijah Oliveros-Rosen, New York, +1-212-438-2228, [email protected]
North America Beth Ann Bovino, New York, +1-212-438-1652, [email protected]
Research Global Alexandra Dimitrijevic, London, +44-20-7176-3128, [email protected]
Asia-Pacific Terence Chan, Melbourne, +61-3-9631-2174, [email protected]
Credit Market Research Sudeep Kesh, New York, +1-212-438-7982, [email protected]
Digital Research Strategy Gareth Williams, London, +44-20-7176-7226, [email protected]
Emerging Markets Jose Perez-Gorozpe, Mexico City, +52-55-5081-4442, [email protected]
Europe, Middle-East & Africa Paul Watters, London, +44-20-7176-3542, [email protected]
North America David Tesher, New York, +1-212-438-2618, [email protected]
Ratings Performance Analytics Nick Kraemer, New York, +1-212-438-1698, [email protected]
Research Support
Lyndon Fernandes, [email protected]
Nivritti Mishra, [email protected]

Footer : Never change the footer text on individual slides. Change, turn on or off footer by using Insert Header &
49
No content (including ratings, credit-related analyses and data, valuations, model, software or other application or output therefrom) or any part thereof (Content) may be modified, reverse engineered, reproduced or distributed in any form by any
means, or stored in a database or retrieval system, without the prior written permission of Standard & Poor's Financial Services LLC or its affiliates (collectively, S&P). The Content shall not be used for any unlawful or unauthorized purposes. S&P
and any third-party providers, as well as their directors, officers, shareholders, employees or agents (collectively S&P Parties) do not guarantee the accuracy, completeness, timeliness or availability of the Content. S&P Parties are not responsible
for any errors or omissions (negligent or otherwise), regardless of the cause, for the results obtained from the use of the Content, or for the security or maintenance of any data input by the user. The Content is provided on an "as is" basis. S&P
PARTIES DISCLAIM ANY AND ALL EXPRESS OR IMPLIED WARRANTIES, INCLUDING, BUT NOT LIMITED TO, ANY WARRANTIES OF MERCHANTABILITY OR FITNESS FOR A PARTICULAR PURPOSE OR USE, FREEDOM FROM BUGS, SOFTWARE ERRORS
OR DEFECTS, THAT THE CONTENT'S FUNCTIONING WILL BE UNINTERRUPTED, OR THAT THE CONTENT WILL OPERATE WITH ANY SOFTWARE OR HARDWARE CONFIGURATION. In no event shall S&P Parties be liable to any party for any direct,
indirect, incidental, exemplary, compensatory, punitive, special or consequential damages, costs, expenses, legal fees, or losses (including, without limitation, lost income or lost profits and opportunity costs or losses caused by negligence) in
connection with any use of the Content even if advised of the possibility of such damages.
Credit-related and other analyses, including ratings, and statements in the Content are statements of opinion as of the date they are expressed and not statements of fact. S&P's opinions, analyses, and rating acknowledgment decisions
(described below) are not recommendations to purchase, hold, or sell any securities or to make any investment decisions, and do not address the suitability of any security. S&P assumes no obligation to update the Content following publication in
any form or format. The Content should not be relied on and is not a substitute for the skill, judgment and experience of the user, its management, employees, advisors and/or clients when making investment and other business decisions. S&P
does not act as a fiduciary or an investment advisor except where registered as such. While S&P has obtained information from sources it believes to be reliable, S&P does not perform an audit and undertakes no duty of due diligence or
independent verification of any information it receives. Rating-related publications may be published for a variety of reasons that are not necessarily dependent on action by rating committees, including, but not limited to, the publication of a
periodic update on a credit rating and related analyses.
To the extent that regulatory authorities allow a rating agency to acknowledge in one jurisdiction a rating issued in another jurisdiction for certain regulatory purposes, S&P reserves the right to assign, withdraw, or suspend such acknowledgement
at any time and in its sole discretion. S&P Parties disclaim any duty whatsoever arising out of the assignment, withdrawal, or suspension of an acknowledgment as well as any liability for any damage alleged to have been suffered on account
thereof.
S&P keeps certain activities of its business units separate from each other in order to preserve the independence and objectivity of their respective activities. As a result, certain business units of S&P may have information that is not available to
other S&P business units. S&P has established policies and procedures to maintain the confidentiality of certain nonpublic information received in connection with each analytical process.
S&P may receive compensation for its ratings and certain analyses, normally from issuers or underwriters of securities or from obligors. S&P reserves the right to disseminate its opinions and analyses. S&P's public ratings and analyses are made
available on its Web sites, www.standardandpoors.com (free of charge), and www.spcapitaliq.com (subscription) and may be distributed through other means, including via S&P publications and third-party redistributors. Additional information
about our ratings fees is available at www.standardandpoors.com/usratingsfees.
Australia: S&P Global Ratings Australia Pty Ltd holds Australian financial services license number 337565 under the Corporations Act 2001. S&P Global Ratings' credit ratings and related research are not intended for and must not be distributed to
any person in Australia other than a wholesale client (as defined in Chapter 7 of the Corporations Act).
STANDARD & POOR'S, S&P and RATINGSDIRECT are registered trademarks of Standard & Poor's Financial Services LLC.
spglobal.com/ratings