Oxygen isotope systematics in Diploastrea heliopora: new coral archive of tropical paleoclimate
Espacio, Tiempo y Forma, Serie I, Prehistoria y Arqueologfa, t. 13, 2000, pags. 141-159
A Test of the MSEC Method for Paleoclimate and Intersite
Correlations from Late Pleistocene/Holocene Cave Sites in
Southern Europe: Results from Cova de les Cendres, SE Spain
BOOKS B. ELLWOOD \ VALENTIN VILLAVERDE ^ STEPHEN L. BENOIST \ JOAN
BERNABEU ^ FRANCIS B. HARROLD ^ AND PAUL T. THACKER ^
RESUMEN
En los ultlmos diez alios, se han utilizado las mediciones de la
susceptibilidad magnetica (MS) de los sedimentos de los yacimientos
arqueologicos en cueva para establecer correlaciones entre
yacimientos y una estimacion del paleoclima. Ello es posible porque la
MS correspondiente a estos sedimentos es el resultado de los
procesos activos del clima en el exterior de las cavidades y las variaciones en las propiedades
magneticas de los sedimentos, que
ABSTRACT
During the last 10 years or so, magnetic susceptibility (MS) measurements of cave sediments from archaeological sites have been used for intra-site correlation and paleoclimate estimation. This is possible because the MS of these sediments results from climate processes active outside caves causing variations in magnetic properties of the sediments ultimately accumulating inside of caves. Once deposited, these materials are preserved and their stratigraphy
' Department of Geology and Geophysics, Louisiana State University, E235 Howe-Russell Geoscience Complex, Baton Rouge, LA 70803 USA.
^ Departament de Pretiistoria i Arqueologia, Universitat de Valencia, Avenida Blasco Ibahez, 28, 46010 Valencia, Spain.
^ College of Natural and Social Sciences, University of Nebraska at Kearney, Kearney, NE 68849 USA.
141
BROOKS B. ELLWOOD, VALENTIN VILLAVERDE, STEPHEN L. BENOIST, JOAN BERNABEU...
finalmente se acumulan en el interior de las cavidades. Una vez que se ban
depositado, estos materiales son preservados y su estratigraffa
proporciona una informacion sobre el clima que puede ser inferida. En este
trabajo, al usar la magnetosusceptibilidad, el metodo de
cicloestratigrafia (MSEC) y la correlacion grafica, presentamos
informacion sobre la Cova de les Cendres y situamos estos resultados
en un marco paleoclimatico que abarca los ultimos 43.000 anos
(fechas BP sin calibrar) de la Europa meridional. Estos resultados correlacionan bien con otros
indicadores independientes de clima. Ademas, a causa de que los
sedimentos de la parte superior de la Cova de les Cendres se depositaron
relativamente rapidos, es posible observar cambios climaticos de
escala ultra-fina en los dates de esta parte de la secuencia en la cavidad.
provides a climate proxy that can be extracted. Here, using the magnetosusceptibility event and cyclostratigraphy (MSEC) method and graphic correlation, we present data from Cova de les Cendres and place these results into a paleoclimatic framework for the last 43,000 years (uncalibrated BP) for southern Europe. These results correlate well with independent climate indicators. In addition, because sediments in the upper part of Cova de les Cendres were deposited relatively quickly, it is possible to see ultra fine scale climatic changes in the data set from this cave.
KEY WORDS Maguetosusceptibility, samples, climate, sediments, stratigraphy, caves, rockshelters, Spain, Europe.
PALABRAS CLAVE Maguetosusceptibilidad, muestras,
clima, sedimentos, estratigrafia, cuevas, abrigos rocosos, EspaHa,
Europa.
INTRODUCTION
We have used the magnetosusceptibility event and cyclostratigraphy (MSEC) method (Ellwood et al., 2001) along with graphic correlation (Shaw, 1964) to build a MSEC data base for southern Europe. This data base can be used for between site correlations and to estimate paleoclimate. MSEC is based on magnetic susceptibility (MS) measurements of sediment samples of micro-stratigraphic sample sets (continuous samples) recovered from well-documented archaeological sites. We have applied the method to Pleistocene and Holocene archaeological sites in Europe and the United States (e.g. Ellwood et al., 1994; Ellwood et al., 1995; Ellwood et al., 1996; Ellwood et al., 1997; Ellwood et al., 1998). The MSEC method for correlation
142
A Test of the MSEC Method for Paleoclimate and Intersite Correlations from Late...
between cave sites utilizes the independent isotopic and cultural dates available from such sites and is based on the fact that regional, long-term climate cycles control, through pedogenesis, the magnetic material being created in the area. This material is then eroded and deposited within the cave, and the resulting stratigraphy is the source of the MSEC data set.
In unconsolidated samples found in protected archaeological cave sites from southern Europe, MS works as a proxy for climate because climate there controls the magnetic properties of the source sediments, primarily as the result of pedogenesis (see Mullins, 1977, for an early summary and Maher, 1998 for a more recent summary of magnetic products produced during pedogenesis). These sediments acquire an MS signature outside caves and are protected from further pedogenesis once deposited inside caves. At least for southern Europe, pedogenic processes produce abundant magnetic minerals such as maghemite, magnetite, hematite, and possibly greigite (Staniek et al., 1994; Ellwood et al., 1997) during periods when climate is relatively warm' and wet. This increases the MS signature in these sediments.
Clearly, climate is very important in the development of MS variations in many types of sediment. At low latitudes, such as in southern Europe during the Quaternary, climate controls on MS can be attributed to variations in magnetic mineral production during pedogenesis. Work by Tite and Linington (1975) and Singer and Fine (1989) showed that climate (both temperature and moisture) can have a significant effect on the MS, and that in general, warmer/wetter conditions enhanced the MS signature during pedogenesis. Besides maghemite, Maher and Taylor (1989) have shown that magnetite is readily produced during soil formation. (Much of the work concerning the production of ferrimagnetic minerals in soils has been summarized by Fassbinder et al., 1990).
Soils that are formed through pedogenesis outside caves and shelters, along with their magnetic constituents, are eroded, tracked, washed or blown and deposited within caves or deep rock shelters. The stratigraphy of these sediments preserves a signature of climate that potentially can be identified by measuring the MS. However, under special or unusual circumstances, other factors may modify these ratios, either outside the cave before erosion, during mineral transport, or inside the cave after deposition Alteration may be caused by (1) dilution, including the addition of high concentrations of fragmented bone or calcium carbonate pieces created by cryoclastic or anthropogenic processes; (2) dissolution, such as that caused by acidic ground waters; (3) concentration effects other than the production of maghemite during oxidation and pedogenesis, such as the formation of authigenic magnetite by magnetotactic organisms
143
BROOKS B. ELLWOOD, VALENTIN VILLAVERDE, STEPHEN L. BENOIST, JOAN BERNABEU...
(Frankel et al., 1979; Torres de Araujo et al., 1986); (4) some differential erosion effects; and (5) concentration effects resulting from chemical changes to iron-containing mineral phases at the expense of already existing iron phases. Most non-pedogenic alteration effects like those discussed above, either occur only locally, or are controlled by climate. We would argue that only climate can have the same effects at the same times over all of southern Europe, as we demonstrate below.
Climate Signatures in MSEC Studies in Caves
We have conducted a number of tests to see if the MS signature is tracking climate. For example, an interesting aspect of some of our MS sections is what appears to be Neo-glacial climate cycles with a duration of approximately 2,500 years like those discussed by Mitchell (1976). Such cycles have also been reported from Greenland ice core data (O'Brien et al. 1995). These cycles were derived from harmonic analysis of MS curves from Konispol Cave, Albania, and Caldeirao Cave, Portugal (Ellwood et al. 1997; 1998). Harmonic analysis of the Early Upper Paleolithic and Solutrean MS data set from Caldeirao Cave shows well-defined 2,500 year cycles within this interval of sediment accumulation.
Sampling for MSEC in conjunction with archaeological excavations provides data sets tied directly to excavation levels, isotopic dates and cultural associations. Because MS variations appear to be controlled primarily by climate, and because the effects of climate are regional, affecting large areas, MS trends identified at one site or in one excavation unit appear at many sites/units within the region. These trends may be modified locally, but in general the variations in MS trends and magnitudes produced by changing climate provide stratigraphic sequences that can be correlated between excavation units that overlap in age. We have used correlated profiles to develop a composite reference section (CRS) of profiles that in turn represent all the MS variations within an area (Ellwood et al., 2001). This CRS can be used for correlation or to estimate paleoclimate. Thus MSEC has the potential to become another independent methodology, alongside conventional methods such as sedimentology and palynology, that can be used to correlate within and between sites by tracing paleoclimatic change. MSEC avoids many drawbacks of other methods, such as high sensitivity to diagenetic changes, poor pollen preservation in caves, ambiguous isotopic ages and the need to acquire oriented or very large samples (MSEC can be performed on 2-10 gm samples).
144
A Test of the MSEC Method for Paleoclimate and Intersite Correlations from Late...
THE MSEC METHOD
All materials become magnetic when placed in a magnetic field, and MS is an indicator of the strength of this magnetism within a sample. This is very different from remanent magnetism (RM), the intrinsic magnetization that accounts for the magnetic polarity recorded by some materials. In a geoarchaeoiogical context, MS is generally considered an indicator of iron mineral concentration and can be quickly and easily measured on small samples. Essentially, all mineral grains, but especially those containing iron, such as maghemite or magnetite, are «susceptible» to becoming magnetized in the presence of a magnetic field. MS is largely a function of the concentration of the magnetizable material they contain, as well as their composition (mineralogy and grain size or shape) (Nagata, 1961).
Besides its many other qualities, MS has the additional advantages of being quickly and easily measured on small samples using commercially available devices such as balanced coil induction systems (susceptibility bridges), and it is free of problems associated with sample orientation such as those encountered in polarity (reversal) magnetostratigraphy.
We collect continuous sample profiles (each sample covering approximately 2 cm of the vertical section) from excavation units at each site sampled. Each sample is then sieved and the MS for the less-than-1 mm fraction is measured 3 times using the susceptibility bridge in the Paleomagnetism Laboratory at Louisiana State University. The results are calibrated against the U.S. National Bureau of Standards and then interpreted.
Protected Environments: Caves and Deep Rock Shelters
Many archaeological sites are unsuited for MSEC work because they are too complex (Ferrand, 1993) or are affected by physical processes open air sites are not well protected environments (Woodward et al., 1992). From our previous work and the work of others (Woodward and Bailey, 2000), we believe that caves and deep rock shelters are ideal for MS studies of paleoclimate because they are not strongly modified by pedogenic effects after deposition (due to their isolation within caves) and they do record climate as a result of variable rates/intensities of soil formation outside of caves. However, even at open air sites where pedogenesis is active, like those evaluated by Ellwood et al. (1995) in Texas and by Ellwood et al. (1994) in Portugal, useful intrasite correlations were established between excavation units.
145
BROOKS B. ELLWOOD, VALENTIN VILLAVERDE, STEPHEN L. BENOIST, JOAN BERNABEU...
Holocene MSEC Results from Southeastern Europe
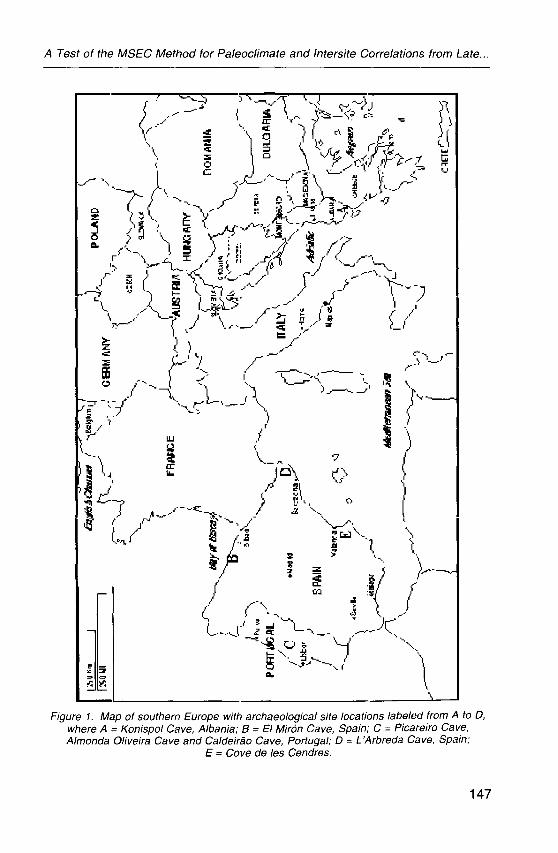
Due to the problems associated with pedogenesis outside of caves and protected rock shelters (discussed above); we are now looking mainly at protected sites located in caves. We have reported results from a number of sites where MS measurements have been employed at cave sites. These sites include 1) Konispol Cave near the town of Konispol in the Sarande district of southwestern Albania (A in Figure 1), El Miron Cave (B in Figure 1), two caves from central Portugal (C in Figure 1), and L'Arbreda Cave (D in Figure 1). In addition, here we report the results from Cove de ies Cendres (E in Figure 1).
It is now clear that warm climates yield high MS values, if there is sufficient availability of moisture for pedogenesis, and that cold climates yield MS lows. In the case of Konispol Cave, the soils produced outside that cave have been washed and blown into the cave and accumulated. It is also important to note that MSEC data represent relative climate. Relative climate is represented by persistent MS trends toward higher or lower values. One would expect that during an overall, long-term warm period (interglacial) that there would be periods of relative cold. These relative changes in climate are represented in the MSEC data sets.
A Test Using Cova de Ies Cendres Samples
As a test of our MSEC work to date we have been investigating the magnetic properties of Cova de Ies Cendres samples. MSEC data can be a very powerful correlation tool but can't stand alone. It is extremely important that independently derived ages be available for the sections sampled. These data, uncalibrated '̂'C dates, are presented for the Cova de Ies Cendres sections, upper and lower levels, in Figures 2 and 3 (see Bernabeu et ai., 1999, for a summary of '̂'C dates and their archaeological implication for neolithic levels, Villaverde et al., 1999, for "̂C dates and sequence of paleolithic levels, and Bernabeu, 1989 for a more detained characterization of neolithic section). Now that an MSEC Composite Reference Section (CRS) has been constructed (Ellwood et al. 2001), with some stratigraphic control from excavations, it is possible to test between site correlations and to resolve dating and other stratigraphic ambiguities. For the purposes of correlation and climatic interpretation, we have included in Figures 2 and 3 bar logs that are simplified representations of the MSEC results. MSEC bar logs are constructed to differentiate between MS highs and lows to divide trend segments. Data of this type can be
146
A Test of the MSEC Method for Paleoclimate and Intersite Correlations from Late...
Y
-. !i^^>
r 'y
-^'uy
Figure 1. Map of southern Europe with archaeological site locations labeled from A to D, where A = Konispol Cave, Albania; B = El Miron Cave, Spain; C = Picareiro Cave, Almonda Oliveira Cave and Caldeirao Cave, Portugal; D = L'Arbreda Cave, Spain;
E = Cove de les Cendres.
147
BROOKS B. ELLWOOD, VALENTIN VILLAVERDE, STEPHEN L. BENOIST, JOAN BERNABEU..
a o
•-a
52 B
0.4
0.5
0.6
0.7
0.8
0.9
1.0
I.l
1.2
1.3
1.4
1.5
1.7
1.8
1.9
2.0
2.1
2.2 4
2.3
Cova de Les Centres Upper Levels
Mixed Sedime ntatio n
14c Ages
5,640-ty'-8
5.790-+/-70
5.320-tV-130
5,930-h'-80 6.010-h'-80
6.150-t/-80
1 X 10^
Magnetic SusceptibQity (m3/kg)
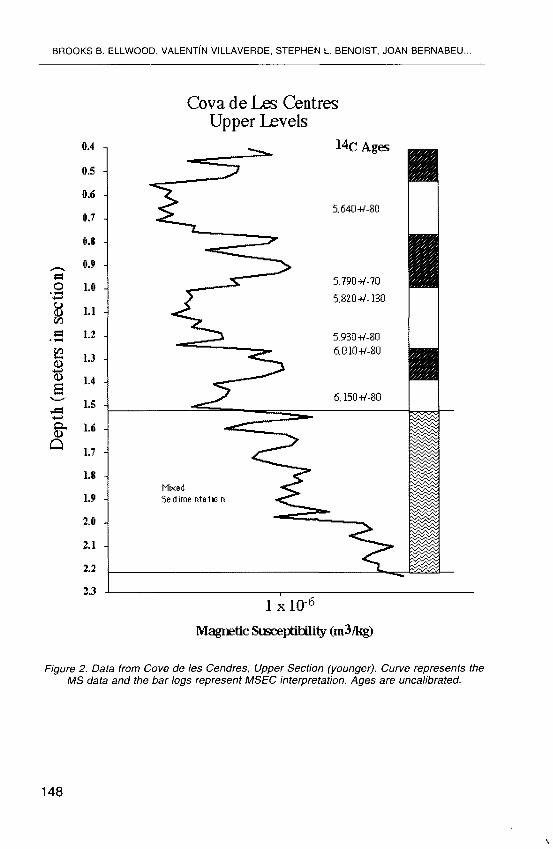
Figure 2. Data from Cove de les Cendres, Upper Section (younger). Curve represents tlie l\/IS data and the bar logs represent MSEC interpretation. Ages are uncalibrated.
148
A Test of the l\/ISEC Method for Paleocllmate and Intersite Correlations from Late..
Cova de les Cendres Lower Levels
Level
I .a
Q
hiatus
hiatus ?
hiatus
hiatus
hiatus
1X10"^ I x W
Magnetic Susoeptibili^ (m3/kg)
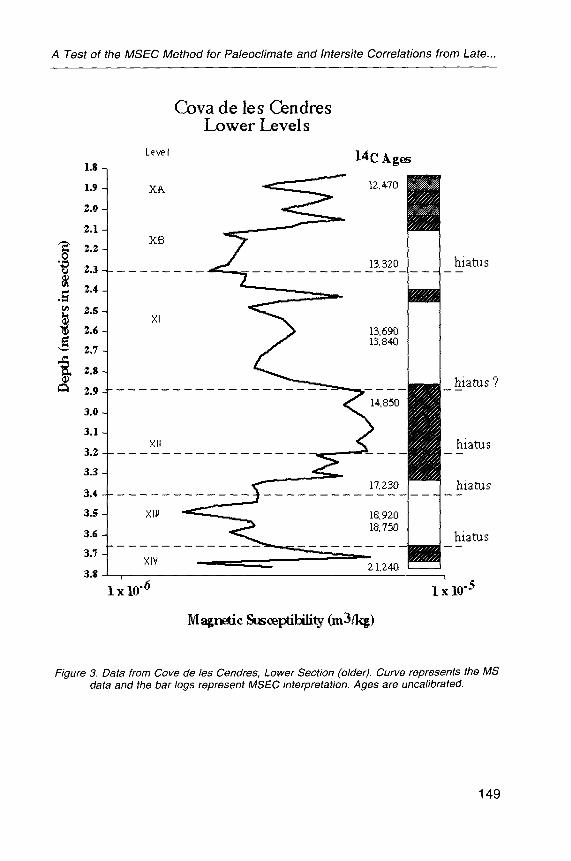
Figure 3. Data from Cove de les Cendres, Lower Section (older). Curve represents the MS data and the bar logs represent IVISEC interpretation. Ages are uncalibrated.
149

BROOKS B. ELLWOOD, VALENTIN VILLAVERDE, STEPHEN L. BENOIST, JOAN BERNABEU...
compared between excavation units and used in developing a CRS. The filled portions of bar logs in the diagram separate MSEC zones of relative high and low MS values. Hatched areas represent higher MS, interpreted to be times of warmer temperatures, while open areas represent lower MS and cooler times. Zones in the bar logs are differentiated based on midpoints between trends in the raw data toward decreasing or increasing MS.
Graphic Correlation
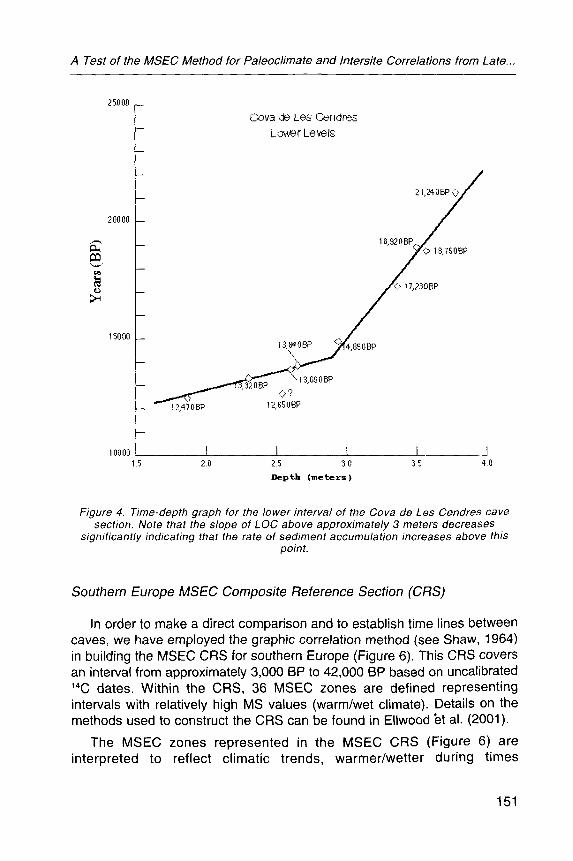
The Cova de Les Cendres section is divided into upper and lower levels that, based on excavation work and carbon dates, are separated by an interval of mixed sedimentation for which MSEC zones could not be established. To provide correlation horizons tied to the composite cave standard (CCS) that has already been defined (Eilwood et al. 2001), MSEC zones for the Cova de Les Cendres sections are defined in the same manner as for the CCS, and '̂'C dates are used to establish time-depth relationships and to fix incremental "̂C ages. For the lower levels, there are sufficient ^X dates so that a line of correlation (LOC) can be placed through the plot of time-versus-depth points (Figure 4). This LOC acts as a datum through which absolute ages in 1,000 year increments from 13,000 to 21,000 BP are fixed for the Cova de Les Cendres lower levels. An important feature in Figure 3 is the marked decrease in LOC slope above approximately 3 meters, indicating that the sedimentation rate increases significantly above this point.
In the graphic correlation of the lower levels at Cova de Les Cendres, compared to the CCS (Figure 5), the bases and tops of MSEC zones SE-19, 21, and 23 (Fig. 6), and '*C ages from 13,000 to 21,000 BP plot on the graph. The position of the base and top of SE-23 and the base of SE-21 are consistent with the linear trend established by the "̂C ages. On the other hand, the top of SE-21, and the base and top of SE-19 diverge from the ^"0 ages, indicating that these MSEC horizons have been placed incorrectly. These misidentifications may have been caused by two hiatuses within the 2.9 to 3.2 meter lower interval at Cova de Les Cendres. These may have acted to merge SE-19 and 21. To create a closer agreement between these MSEC zones and the '̂*C ages, SE-19 is redefined as SE-17 (dashed lines B and C in Figure 5), and the top of SE-21 is redefined as the top of SE-19 (dashed line A in Figure 5). Note that the base of SE-21 requires no change because it is well defined (Figure 5).
150
A Test of the MSEC Mettiod for Paleoclimate and Intersite Correlations from Late..
25000
20000 _
m
15000 _
10000
—
-
-
-
-
-
-
—
12,470BP
1
Cova de Les Cendres Lower Lewe Is
21,J*0BPv?/
18,920BP. / 9<C> 18,750BP
jA> 17,230BP
13,840BP ^ ,850BP
12,650BP
1 1 1 1 1.5 2.5 3.0
Depth (metetrs ) 3.5 4.0
Figure 4. Time-depth graph for the lower interval of the Cova de Les Cendres cave section. Note that the slope of LOC above approximately 3 meters decreases
significantly indicating that the rate of sediment accumulation increases above this point.
Soutfiern Europe MSEC Composite Reference Section (CRS)
In order to make a direct comparison and to establish time lines between caves, we have employed the graphic correlation method (see Shaw, 1964) in building the MSEC CRS for southern Europe (Figure 6). This CRS covers an interval from approximately 3,000 BP to 42,000 BP based on uncalibrated '"C dates. Within the CRS, 36 MSEC zones are defined representing intervals with relatively high MS values (warm/wet climate). Details on the methods used to construct the CRS can be found in Ellwood et al. (2001).
The MSEC zones represented in the MSEC CRS (Figure 6) are interpreted to reflect climatic trends, warmer/wetter during times
151
BROOKS B. ELLWOOD, VALENTIN VILLAVERDE, STEPHEN L. BENOIST, JOAN BERNABEU...
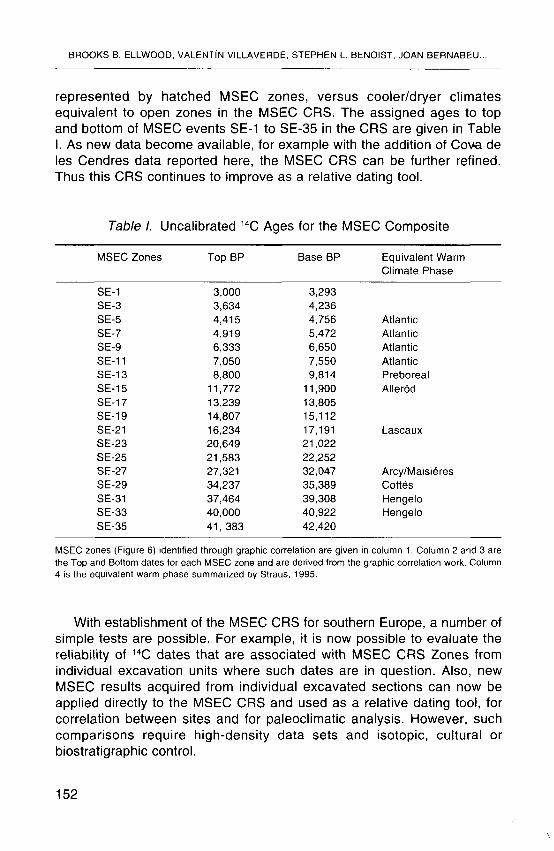
represented by hatched MSEC zones, versus cooler/dryer climates equivalent to open zones in the MSEC CRS. The assigned ages to top and bottom of MSEC events SE-1 to SE-35 in the CRS are given in Table I. As new data become available, for example with the addition of Cowa de les Cendres data reported here, the MSEC CRS can be further refined. Thus this CRS continues to improve as a relative dating tool.
Table I. Uncalibrated "̂C Ages for the MSEC Composite
MSEC Zones
SE-1 SE-3 SE-5 SE-7 SE-9 SE-11 SE-13 SE-15 SE-17 SE-19 SE-21 SE-23 SE-25 SE-27 SE-29 SE-31 SE-33 SE-35
TopBP
3,000 3,634 4,415 4,919 6,333 7,050 8,800
11,772 13,239 14,807 16,234 20,649 21,583 27,321 34,237 37,464 40,000 41, 383
Base BP
3,293 4,236 4,756 5,472 6,650 7,550 9,814
11,900 13,805 15,112 17,191 21,022 22,252 32,047 35,389 39,308 40,922 42,420
Equivalent Warm Climate Phase
Atlantic Atlantic Atlantic Atlantic Preboreal Allerod
Lascaux
Arcy/Maisieres Cottes Hengelo Hengelo
MSEC zones (Figure 6) identified through graphic correlation are given in column 1. Column 2 and 3 are the Top and Bottom dates for each MSEC zone and are derived from the graphic correlation work. Column 4 is ttie equivalent warm phase summarized by Straus, 1995.
With establishment of the MSEC CRS for southern Europe, a number of simple tests are possible. For example, it is now possible to evaluate the reliability of '̂'C dates that are associated with MSEC CRS Zones from individual excavation units where such dates are in question. Also, new MSEC results acquired from individual excavated sections can now be applied directly to the MSEC CRS and used as a relative dating tool, for correlation between sites and for paleoclimatic analysis. However, such comparisons require high-density data sets and isotopic, cultural or biostratigraphic control.
152
A Test of the MSEC Mettiod for Paleoclimate and Intersite Correlations from Late..
4.0
3.5
3.0
-3 ID
Q 2.5
2.0
1.5
Cova de les Cendres: Lower Levels
21,000EP
20,OOOEP
19,0(iOBP
18,000BP
17,000BP ,
^ • 14C ^= m
| - cr^nelb3inaeFAblllL]r hle'vilban • • • • • - hlAins
5 6 7
Composite Cave Standard composite standard
urils
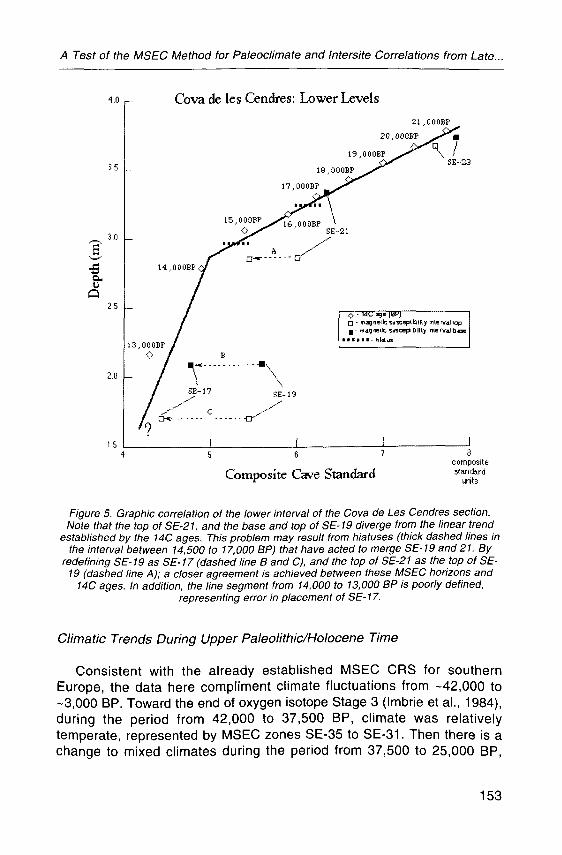
Figure 5. Graphic correiation of the lower interval of the Cova de Les Cendres section. Note that the top of SE-21, and the base and top of SE-19 diverge from the linear trend
established by the 14C ages. This problem may result from hiatuses (thick dashed lines in the inten/al between 14,500 to 17,000 BP) that have acted to merge SE-19 and 21. By
redefining SE-19 as SE-17 (dashed line B and C), and the top of SE-21 as the top of SE-19 (dashed line A); a closer agreement is achieved between these l\/ISEC horizons and
14C ages. In addition, the line segment from 14,000 to 13,000 BP is poorly defined, representing error in placement of SE-17.
Climatic Trends During Upper Paleolithic/Holocene Time
Consistent with the already established MSEC CRS for southern Europe, the data here compliment climate fluctuations from -42,000 to -3,000 BP. Toward the end of oxygen isotope Stage 3 (Imbrie et al., 1984), during the period from 42,000 to 37,500 BP, climate was relatively temperate, represented by MSEC zones SE-35 to SE-31. Then there is a change to mixed climates during the period from 37,500 to 25,000 BP,
153
BROOKS B. ELLWOOD, VALENTIN VILLAVERDE, STEPHEN L. BENOIST, JOAN BERNABEU..
0
i
i
g
10 /^ O 12 O o H M
Of a
n
a
a
90
S2
M
30
90
«
41
MSEC F M 1 temperate/warmer/wetter
cooler/dryer
Southern Europe MSEC Cave Correlations
Poitugal
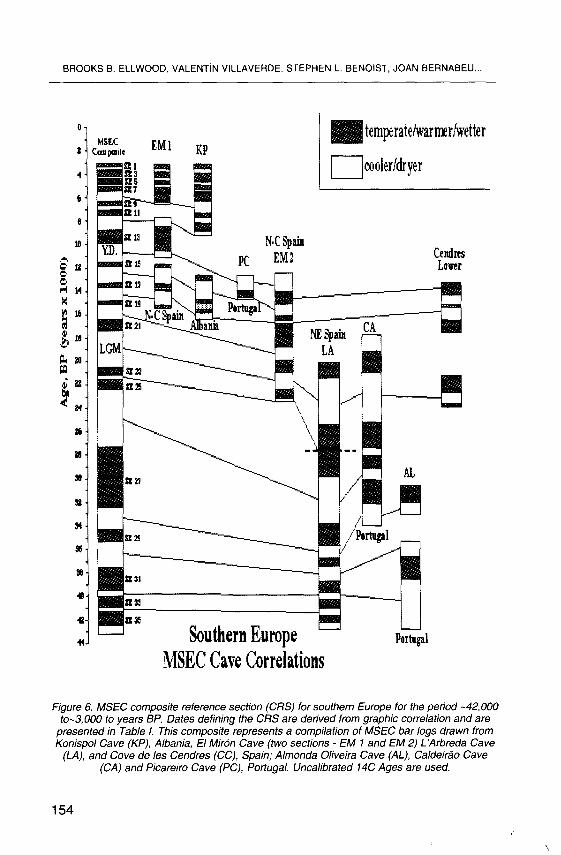
Figure 6. MSEC composite reference section (CRS) for soutfiern Europe for the period -42,000 to~3,000 to years BP. Dates defining tfie CRS are derived from graptiic correlation and are
presented in Table I. Tfiis composite represents a compilation of l\/ISEC bar logs drawn from Konispol Cave (KP), Albania, El fJliron Cave (two sections - ElVI 1 and ElVI 2) L'Arbreda Cave
(LA), and Cove de les Cendres (CC), Spain; Almonda Oliveira Cave (AL), Caldelrao Cave (CA) and Picareiro Cave (PC), Portugal. Uncalibrated 14C Ages are used.
154
A Test of the MSEC Mettiod for Paleoclimate and Intersite Correlations from Late...
including MSEC zones SE-29 and SE-27. At -25,000 BP, and lasting until about 7,500 BP climate became colder, shifting toward the Last Glacial Maximum (LGM). This period of colder climate includes very short temperate MSEC Events SE-25 to SE-13, and included Younger Dryas. The cold period, equivalent to oxygen isotope Stage 2, ended with the start of a trend toward warming during the Hoiocene that begins with MSEC temperate zone SE-11. During the period between -23,000 to -8,000 BP, there were several temperate periods, each of short duration (SE-25 to SE-13; Figure 6). The MSEC record for the Hoiocene generally represents warming, consistent with other available climatic information from southern Europe.
Examination of Table I (Column 4) shows that there is good correspondence between the timing of known warm or temperate periods for Europe and the MSEC CRS. While not perfect, most of the climate zones (summarized by Straus, 1995) are represented, as are the two major cold periods identified during the last 40,000 years. Because the data set is so robust and can be applied to any cave site where sediment is present, it is our belief that the MSEC data set will ultimately yield an extremely fine-scale record of climate for Europe.
Cova de Les Cendres fits well into the MSEC framework and shows good correlation with warm MSEC intervals SE-23 and the base of SE-21 in the lower levels within the cave (Fig. 6). SE-19 and SE-17 are present as well, but these require the presence of a period of non-deposition or erosion that has eliminated cool interval SE-20 between SE-21 and SE-19, as well as some of each of those events. There is archaeological evidence for at least four and possibly five hiatuses within the section (Fig. 3). The hiatus beginning in SE-21 and ending during SE-19, appears to have lasted for -1,000 years.
Cova de les Cendres: Upper Levels
For the upper levels at Cova de Les Cendres, there are six '̂'C dates that span a relatively short interval from 5,640 to 6,150 BP, a relatively short time span. This time appears to have been a period of relatively fast sediment accumulation, which provides the possibility of higher MSEC resolution. This is possible because individual samples represent relatively short periods of times, estimated at -10 years from Figure 2, given a time span of -500 years during which time -1 m of sediment was deposited and an individual MS sample size representing 2 cm of sediment.
155
BROOKS B. ELLWOOD, VALENTIN VILLAVERDE, STEPHEN L. BENOIST, JOAN BERNABEU...
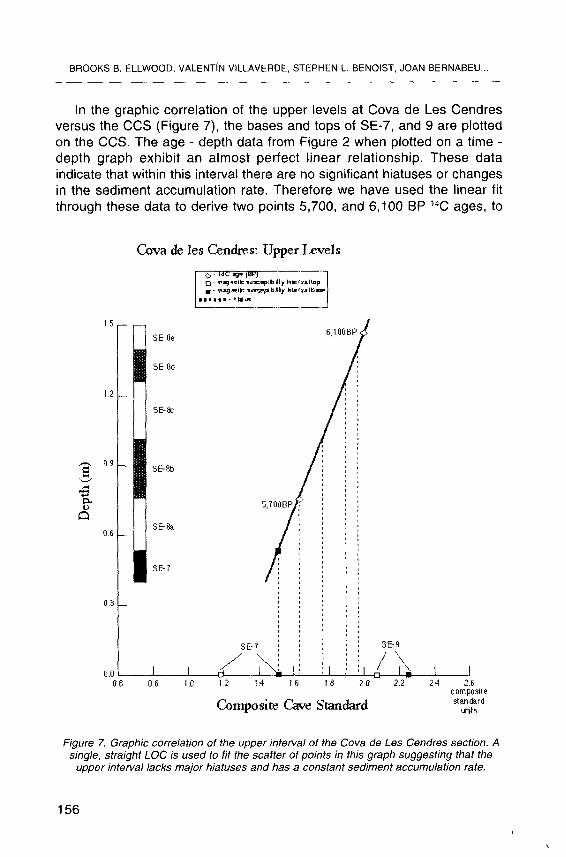
In the graphic correlation of the upper levels at Cova de Les Cendres versus the CCS (Figure 7), the bases and tops of SE-7, and 9 are plotted on the CCS. The age - depth data from Figure 2 when plotted on a time -depth graph exhibit an almost perfect linear relationship. These data indicate that within this interval there are no significant hiatuses or changes in the sediment accumulation rate. Therefore we have used the linear fit through these data to derive two points 5,700, and 6,100 BP "̂C ages, to
Q>va de les Cendres: Upper Levels
a
1.0 1.2 1,4 1.6 1.8 2.0
Qjmposite Cave Standard
2.4 2,6 composite standard
units
Figure 7. Graphic correlation of the upper interval of the Cova de Les Cendres section. A single, straight LOC is used to fit the scatter of points in this graph suggesting that the
upper interval lacks major hiatuses and has a constant sediment accumulation rate.
156
A Test of the MSEC Method for Paleoclimate and Intersite Correlations from Late...
define the LOC in Figure 7 and these ages plot as points on the graph. It should be noted that only the base of SE-7 falls on the line of correlation, indicating that only part of SE-7 is represented in the upper Cova de les Cendres section (Figure 7). SE-9 falls below the line of correlation.
Table II. Calibrated '̂'C Ages for Upper 20,000 Years of the MSEC Composite
MSEC Zones
SE-1 SE-3 SE-5 SE-7 SE-9 SE-11 SE-13 SE-15 SE-17 SE-19 SE-21
Top BP
3,179 3,947 5,019 5,625 7,254 7,899 9,823
13,816 15,912 17,718 19,360
Base BP
3,539 4,830 5,533 6,205 7,534 8,370
11,200 13,962 16,565 18,068 20,461
Dates were calibrated using the Radiocarbon calibration program 1999 of Stuiver and Reimer.
These data indicate that the sampled upper section is mainly represented by SE-8, a relatively cool climatic period. The relatively warm intervals present in the data set represented in Figures 2 and 7 appear to be finer scale climate periods that are represented here, either because sedimentation rates are high or they are local climate effects that we do not see elsewhere. However, when we examine the data from the cool SE-8 MSEC interval from Konispol Cave, Albania (Ellwood et al., 2001) we see two short but well-defined warm peaks that appear to correspond with peaks within SE-8 from Cova de les Cendres. Because Konispol sedimentation rates are also relatively high (but not as high as in Upper Levels in Cova de les Cendres) this suggests that these warm peaks are regional events. We have labeled them in Figure 7 as SE-8b and SE-8d, and they appear to represent very short periods of relatively warmer climate, perhaps having a duration of -100 years each.
CONCLUSIONS
MSEC data from individual cave sedimentary sequences can be compared to the regional MSEC composite reference section already
157
BROOKS B. ELLWOOD, VALENTIN VILLAVERDE, STEPHEN L. BENOIST, JOAN BERNABEU...
developed (Ellwood et al., 2001) to yield an independent data set for correlation and relative dating purposes. In addition, it appears from the data presented here, that if sedimentation rates are sufficiently high, we may be able to identify ultra-fine climate variations in MSEC data sets. Our initial results from Cova de les Cendres, when compared to data from Konispol Cave, Albania (Ellwood et al., 1997), indicate that these ultra-fine scale climate variations may be region, and not just local, events.
ACKNOWLEDGEMENTS
Support for the MSEC research was provided by NSF grant BCS9903172 to Ellwood and Harrold and support for «Tecnologi'a, Economi'a y Medio Ambiente en la Region Central del Mediterraneo Espanol entre el Tardigiaciar y el Holoceno medio» research was provided by a grant from Programa Sectorial de Promocion Genral del Conocimiento PB95-1087 to Viilaverde and Bernabeu.
REFERENCES
BERNABEU, J. (1989): La tradicion cultural de las ceramicas impresas en la zona oriental de la Peninsula iberica, Trabajos Varios del SIP, n.° 86.
BERNABEU, J., VILLAVERDE, V . , BADAL, E. and MARTINEZ, R. (1999): En torno a la neolitizacion
del Mediterraneo peninsular: valoracion de los procesos postdeposicionales de la Cova de les Cendres. Geoarqueologia i Quaternari litoral. Memorial M.P. Fumanal, 69-81.
ELLWOOD, B.B., HARROLD, F.B., BENOIST, S.L., STRAUS, L.G., GONZALEZ-MORALES, M., PETRUSO, K.,
BicHo, N.F., ZiLHAO, Z., and SOLER, N., (2001): Paleoclimate and Intersite Correlations from Late Pleistocene/Holocene Cave Sites: Results from Southern Europe, Geoarchaeology, in press.
ELLWOOD, B.B., HARROLD, F.B., & MARKS, A . E . (1994): Site identification and correlation using geoarchaeological methods at the Cabepo do Porto Marinho (CPM) locality, Rio Maior, Portugal, Journal of Archaeological Science, 2 1 , 779-784.
ELLWOOD, B. B., HROUDA, F., & WAGNER, J. J. (1988): Symposia on magnetic fabrics: Physics of the Earth and Planetary Interiors, 5 1 , p. 249-392.
ELLWOOD, B.B., PETER, D.E., BALSAM, W . , & SCHIEBER, J. (1995): Magnetic and Geochemical
Variations as Indicators of Paleoclimate and Archaeological Site Evolution: Examples from 41TR68, Fort Worth, Texas, Journal of Archaeological Science, 22, 409-415.
ELLWOOD, B.B., PETRUSO, K.M., & HARROLD, F .B . (1996): The Utility of Magnetic Susceptibility for Detecting Paleoclimatic Trends and as a Stratigraphic Correlation Tool: An Example from Konispol Cave Sediments, SW Albania, Journal of Field Archaeology, 23, 263-271.
ELLWOOD, B.B., PETRUSO, K.M., HARROLD, F.B., & SCHULDENREIN, J. (1997): High-Resolution
Paleocl imatic Trends for the Holocene Identif ied Using Magnetic Susceptibi l i ty Data from Archaeological Excavations in Caves, Journal of Archaeological Sciences, 24, 569-573.
ELLWOOD, B.B., ZILHAO, J., HARROLD, F.B., BALSAM, W . , BURKART, B., LONG, G.J., DEBENATH, A., &
BOUZOUGGAR, A. (1998): Identification of the Last Glacial Maximum in the Upper Paleolithic of Portugal using magnetic susceptibility measurements of Caldeirao Cave sediments, Geoarchaeology, 13, 55-71.
158
A Test of the MSEC Method for Paleoclimate and Intersite Correlations from Late..
FASSBINDER, J.W.E., STANJEK, H., & VALI , H . (1990): Occurrence of magnetic bacteria in soils, Nature, 343, 161-163.
FERRAND, W . R . (1993); Discontinuity in tlie startigraphic record: snapshots from Franclnthi Cave. In, Goldberg, P., Nas, D.T., and Petraglia, M.D., Eds,, Formation Processes in Arcfiaeological Context, l\Aonographs in World Arctiaeology, No. 17, Prehistory Press, Madison Wisconsin, 85-96.
FRANKEL, R.B., BLAKEMORE, R.P., & WOLFE, R . S . (1979): Magnetite in Freshwater Magnetotactic Bacteria. Science 203, 1355-1356.
MAHER, B .A . & TAYLOR, R . M . (1989); Formation of ultrafine-grained magnetite in soils. Nature, 336, 368-370.
MITCHELL, J . M . Jr. (1976): An overview of climatic variability and its causal mechanisms. Quaternary Research, 6, 481-493.
MULLENS, C . E . (1977): Magnetic susceptibility of the soil and its significance in soil science - a review, Journal of Soil Science, 28, 223-246.
NAGATA, T . (1961): Rock Magnetism, Maruzen Company, Ltd., Tokyo, 350 pp. O'BRIEN, S.R., MAYEWSKI, P.A., MEEKER, L.D., MEESE, D.A., TWICKLER, M.S., & WHITLOW, S.I.
(1995): Complexity of Holocene climate as reconstructed from a Greenland ice core. Science, 270, 1962-1964.
SHAW, A . B . (1964); Time in Stratigraphy, McGraw Hill, New York, 365 pp. SINGER, M.J., & FINE, P. (1989); Pedogenic factors affecting magnetic susceptibility of northern
California soils. Soil Science Society of America Journal, 53, 1119-1127. STANJEK, H., FASSBINDER, J.W.E., VALI , H., WAGELE, H . & GRAF, W . (1994); Evidence of biogenic
greigite (ferrimagnetic Fe3S4) in soil, European Journal of Soil Science, 45, 97-103. STRAUS, L . G . (1995); The Upper Paleolithic of Europe; An Overview, Evolutionary Anthropology,
4,4-16. TiTE, M.S., & LININGTON, R . E . (1975): Effect of Climate on the Magnetic Susceptibility of Soils,
Nature, 256, 565 - 566. TORRES DE ARAUJO, F.F., PIRES, M.A., FRANKEL, R.B., & BICUDO, C . E . M . (1986); Magnetite and
Magnetotaxjs in Algae. Biophysical Journal 50, 375-378. ViLLAVERDE, V., MABTINEZ, R., BADAL, E., GARCIA, R. And MENARGUES, J. (1999): El Paleolitico
superior de la Cova de les Cendres (Teulada-Moraira, Alicante). Datos proporcionados por el sondeo efectuado en los cuadros A/B-17. Archivo de Prehistoria Levantina, XXIII, 9-65.
WOODWARD, J . C . & BAILEY, G.N. (2000): 27. Sediment sources and terminal Pleistocene geomorphological processes recorded in rockshelter sequences in North-west Greece, In., Tracers in Geomorphology, Foster, I.D.L., Ed., John Wiley & Sons, Ltd., London, 521-550.
WOODWARD, J . C , LEWIN, J., & MACKLIN, M . G . (1992): Alluvial sediment sources in a glaciated catchment; the Voidomatis Basin, northwest Greece, Earth Surface Processes and Landforms, 17,205-216.
%
159

Copyright © 2022 FDOKUMEN


![Intersite Assemblage Variation from the US 89 Project Area. [US Highway 89 near Sunset Crater, AZ]](https://static.fdokumen.com/doc/165x107/6317d4eeb6c3e3926d0e0fa5/intersite-assemblage-variation-from-the-us-89-project-area-us-highway-89-near.jpg)