Eleventh Five Year Plan - Centre for Social Justice
537
Eleventh Five Year Plan 2007-12 VOLUME III VOLUME III AGRICULTURE, RURAL DEVELOPMENT, INDUSTRY, SERVICES, AND PHYSICAL INFRASTRUCTURE Eleventh Five Year Plan 2007-12 Planning Commission Government of India
-
Upload
khangminh22 -
Category
Documents
-
view
0 -
download
0
Transcript of Eleventh Five Year Plan - Centre for Social Justice

Eleventh Five Year Plan 2007-121www.oup.com
Volu
me III
Published by:
ElEvEnth FivE YEar Plan 2007-12
This Five Year Plan document focuses on inclusive growth. The document is divided into three volumes. Volume I: Inclusive Growth—details the vision,
policies, and strategies of the key sectors and gives the macroeconomic framework and financing of the Plan; Volume II: Social Sector—provides plans
for Education, Sports, Art and Culture, Health and Family Welfare, Nutrition and Social Safety Net, Drinking Water and Sanitation, and Women and Child Rights; and Volume III: Agriculture, Rural Development, Industry, Services, and Physical
Infrastructure—includes chapters on the respective sectors.
Rs 000
9 780195 696509
ISBN 0-19-569650-6
V o l u m e I I I
agrIculture, rural deVelopment, Industry, serVIces, and physIcal Infrastructure
Eleventh Five Year Plan2007-12
Planning Commission Government of Indiawww.planningcommission.gov.in
Planning Commission Government of India

Eleventh Five Year Plan(2007–2012)
Agriculture, Rural Development, Industry,Services and Physical Infrastructure
Volume III
Planning CommissionGovernment of India

1YMCA Library Building, Jai Singh Road, New Delhi 110 001
Oxford University Press is a department of the University of Oxford. It furthers theUniversity’s objective of excellence in research, scholarship, and education
by publishing worldwide in
Oxford New York
Auckland Cape Town Dar es Salaam Hong Kong Karachi Kuala LumpurMadrid Melbourne Mexico City Nairobi New Delhi Shanghai Taipei Toronto
With offices in
Argentina Austria Brazil Chile Czech Republic France Greece GuatemalaHungary Italy Japan Poland Portugal Singapore South Korea Switzerland
Thailand Turkey Ukraine Vietnam
Oxford is a registered trademark of Oxford University Pressin the UK and in certain other countries
Published in IndiaBy Oxford University Press, New Delhi
© Planning Commission (Government of India) 2008
The moral rights of the author have been asserted
First published 2008
All rights reserved. No part of this publication may be reproduced or transmitted, in any form or by any means,electronic or mechanical, including photocopying, recording or by any information storage and retrieval system,
without permission in writing from Planning Commission, Government of India
ISBN-13: 978-0-19-569650-9ISBN-10: 0-19-569650-6
Published by Oxford University PressYMCA Library Building, Jai Singh Road, New Delhi 110 001
On behalf of Planning Commission, Government of India, Yojna Bhawan,Sansad Marg, New Delhi 110 001

1Contents
List of Tables vList of Figures ixList of Boxes xList of Annexures xiiList of Acronyms xiv
I. Agriculture
1. AGRICULTURE 3
2. WATER MANAGEMENT AND IRRIGATION 43
3. FOREST 65
II. Rural Development
4. RAPID POVERTY REDUCTION 79
5. ENSURING RURAL AND URBAN LIVELIHOODS 104
6. BHARAT NIRMAN AND FLAGSHIP PROGRAMMES 129
III. Industry7. INDUSTRY 139
7.1 Industry including Small and Medium Enterprises (SMEs) 1397.2 Minerals 206
IV. Services8. SERVICES 239
8.1 Construction 2398.2 Tourism 245

8.3 IT and IT-Enabled Services 2518.4 Financial Services 259
V. Physical Infrastructure09. TRANSPORT 279
9.1 Integrated Transport System 2799.2 Railways 2799.3 Roads 2899.4 Shipping 3089.5 Ports 3149.6 Civil Aviation 320
10. ENERGY 342
11. URBAN INFRASTRUCTURE, HOUSING, BASIC SERVICES AND POVERTY ALLEVIATION 394
12. COMMUNICATIONS AND INFORMATION TECHNOLOGY 423
12.1 Telecommunications 42312.2 Information Technology 43112.3 India Post 43812.4 Information and Broadcasting 444
Appendix
PROJECTED GBS FOR THE ELEVENTH PLAN 455
iv Contents

1Tables
1.1 Average GDP Growth Rates—Overall and in Agriculture 41.2 Growth Rates of National State Domestic Product (NSDP) from Agriculture 41.3 Growth Rate in Output of Various Sub-sectors of Agriculture 51.4 Trend Growth Rate in Area, Input Use, Credit and Capital Stock in
Agriculture—1980–81 to 2005–06 61.5 Investment in Agriculture 81.6 Region-specific Factors Causing Low Productivity 91.7 Outlay and Expenditure of Ministry of Agriculture during the Tenth Five Year Plan 101.8 Production and Distribution of Seeds 161.9 Changing Share of Private and Public Sector in Seeds Production 17
1.10 Credit Flow to Agriculture Sector by Co-operatives 211.11 Progress of Reforms in Agricultural Markets (APMC Act) as on March 2008 23
2.1 Estimates of Water Resources in India 442.2 Ultimate Irrigation Potential, Potential Created and Potential Utilized 452.3 Water Requirement for Various Sectors 462.4 Physical Progress under CAD and Water Management (CADWM)
Programme in the Tenth Plan 472.5 Physical and Financial Performance of MMI Sector during the Tenth Plan 472.6 Spillover Major, Medium and ERM Projects into the Eleventh Plan 482.7 Unapproved Major, Medium and ERM Projects 492.8 Performance of AIBP Projects 502.9 Physical and Financial Performance of MI Sector during the Tenth Plan 50
2.10 Financial Performance in Flood Management during the Tenth Plan 522.11 Flood Damage and Relief in the Tenth Plan 522.12 Progress of Inter-linking of Rivers 572.13 State-wise Number of WUAs Formed and Irrigated Area Covered 592.14 The Overall Outlay for the Eleventh Five Year Plan 622.15 Physical Target 622.16 Overall Employment Potential 62
4.1 Percentage of People Below Poverty Line in India (1973–2004) 794.2 Number of Persons Below Poverty Line in India (1973–2004) 80

4.3 Percentage of Households by Asset-holding Categories, by Social Group 814.4 Land Owned per Household by Social Group, 2003 824.5 Incidence of Indebtedness by Social Group 824.6 Health and Nutrition Indicators by Social Groups in 2005–06 (NFHS-3) 834.7 Gross Enrolment, Dropout at Primary Stage (I–V) by Social Groups, 2004–05 835.1 Performance of Handloom Sector during the Tenth Plan Period 1085.2 Performance of Handicraft Sector during the Tenth Plan Period 1115.3 Performance of Powerloom Sector during the Tenth Plan Period 1135.4 Performance of Sericulture Sector during the Tenth Plan 1155.5 Tenth Plan Achievements and Eleventh Plan Targets for Wool Sector 1185.6 Performance of the KVI Sector during the Tenth Five Year Plan 1205.7 Performance of Coir Industry during the Tenth Plan Period 1215.8 Performance of FPI Sector during the Tenth Plan Period 1235.9 Year-wise Physical Targets for the Eleventh Plan for FPI (MSME Manufacturing Units) 125
A5.1 Indian Clusters—An Overview 1276.1 Index of Social and Economic Infrastructure 1296.2 Targets under Bharat Nirman 1306.3 Irrigation Targets under Bharat Nirman 1306.4 Physical Progress of Bharat Nirman during 2005–07 131
7.1.1 Growth Rates 1397.1.2 Sectoral Share in GDP 1407.1.3 Trends in the Performance of Industrial Sub-Sectors —Annual Growth Rate 1417.1.4 Gross Capital Formation and Capital Formation in Manufacturing 1417.1.5 Employment in Organized Manufacturing 1437.1.6 Contribution of Non-departmental Enterprises to GDP at Factor Cost (Current Price) 1537.1.7 Macro View of Central Public Sector Enterprises 1547.1.8 Performance Indicators of State-level Public Enterprises 1557.1.9 Projection of Growth in Vehicle Production and Exports in the Eleventh Five Year Plan 166
7.1.10 Capacity, Production, and Export of Cement 1707.1.11 Projected Shipbuilding Order Book Turnover 1867.1.12 Plan Outlays for the Last Three Five Year Plans for VSE Sector 1957.1.13 Chinese Town and Village Enterprises (TVEs) Exports 1967.1.14 Definition of MSMEs 1977.1.15 Year-wise Physical Targets for the Eleventh Plan 203
7.2.1 Production and Imports of Lead–Zinc Concentrate 2127.2 2 Minerals—Unrealized Potential 2138.2.1 Contribution of Travel and Tourism (T&T) in GDP and Employment in 2007 2458.2.2 Tourists Arrivals in India 2468.2.3 Tourism Receipts 2468.3.1 Growth of IT-ITES Professionals in India—Indian IT Sector:
Knowledge Professionals Employed 2538.3.2 Manpower Requirements for IT-ITES in India 2548.3.3 Indian IT-ITES Exports Forecast 2007–2012 2598.4.1 Growth Rate (Real) of Financial Services (Banking and Insurance) 2598.4.2 Savings and Loan Accounts 2608.4.3 Credit Access of Farmer Households 2618.4.4 Flow of Credit to Agriculture 262
vi Tables

8.4.5 Distribution of Outstanding Credit of SCBs according to the Size of the Credit Limit 2628.4.6 Sector-wise Distribution of Outstanding Credit of SCBs 2638.4.7 Artisan and Village Industries and Other Small-Scale Industries 2638.4.8 Average Population per Branch Office 2699.2.1 Physical Targets and Achievements 2809.2.2 Productivity Performance 2819.2.3 Throw Forward of Projects 2859.2.4 Projection of Freight Traffic in the Eleventh Five Year Plan vis-à-vis
Achievements in the Ninth and Tenth Plans 2879.2.5 Projection of Passenger Traffic in the Eleventh Five Year Plan vis-à-vis
Achievements in the Ninth and Tenth Plans 2879.2.6 Eleventh Five Year Plan—Requirement for Rolling Stock 2889.3.1 Achievements on National Highways 2909.3.2 Corridor-wise Details of Progress on the Golden Quadrilateral as on 31 August 2007 2919.3.3 Status of NHDP and Other NHAI Projects as on 31 August 2007 2929.3.4 Connectivity Status under PMGSY (as on 31 March 2007)—Targets versus Achievements 2949.3.5 Shortfall in Funds for Road Maintenance in the Tenth Plan 2959.3.6 Phasing of Expressway by the Study Group of MoSRTH 2979.3.7 Estimated Targets for the Eleventh Five Year Plan 3039.4.1 Financial Performance of the Shipping Sector in the Tenth Plan 3089.4.2 Increase in Tonnage 3099.5.1 Tenth Plan Cargo Traffic Targets and Achievements 3149.5.2 Tenth Plan—Capacity Added to Major Ports 3159.5.3 Tenth Plan—Productivity Parameters of Major Ports 3159.5.4 Capacity Creation and Projected Traffic in Major Ports in the Eleventh Plan 3179.6.1 Financial Performance of Air India 3249.6.2 Growth in Capacity and Traffic during the Tenth Plan 3249.6.3 Financial Performance of Indian Airlines 3259.6.4 Growth in Capacity and Traffic during the Tenth Plan 3259.6.5 Financial Performance of Airports Authority of India 3269.6.6 Financial Performance of Pawan Hans Helicopters Ltd 3269.6.7 Financial Performance of Air India Charters Ltd 32710.1 Projected Primary Energy Requirement for India, 2030 34310.2 Trends in Demand and Supply of Primary Energy 34510.3 Source-wise Energy Demand 34610.4 Percentage Demand met from Domestic Sources 34610.5 Projected Commercial Energy Requirement for 2011–12 at the Rate of 9% Growth 34710.6 Growth Rates of Domestic Supply 34710.7 Installed Capacity Addition during the Tenth Plan 35110.8 All-India Cumulative Generating Capacity 35110.9 Cumulative Achievements of Transmission Lines at the End of the Tenth Plan 352
10.10 Summary of Investment Component of APDRP (as on 31 August 2007) 35210.11 Viability of State Utilities not Improving 35310.12 Outlay/Expenditure—Centre, State and UTs 35410.13 Status of Capacity Addition during the Eleventh Plan 35410.14 Sector-wise, Mode-wise Capacity Addition during the Eleventh Plan 35510.15 Generating Capacity Anticipated at the End of the Eleventh Plan 355
Tables vii

10.16 Fuel Requirement during 2011–12 35710.17 Physical Programmes—Petroleum and Natural Gas 36510.18 Outlays/Expenditure—Petroleum and Natural Gas 36510.19 Crude Oil Production 36810.20 Natural Gas Production 36810.21 LNG Supply Projections during the Eleventh Plan 36910.22 Projected Crude Oil and Natural Gas Production from Overseas 36910.23 Public Sector Outlays for the Eleventh Plan 37010.24 Accretion of Coal Reserves over the Years 37210.25 Company-wise/Scheme-wise Expenditure during the Tenth Plan 37510.26 Household Energy Consumption in India (July 1999–June 2000) 38410.27 Estimated Medium-term (2032) Potential and Cumulative Achievements
as on 31 March 2007 38610.28 Progress in Grid Interactive Renewable Power 38710.29 Capital Costs and the Typical Cost of Generated Electricity from the Renewable Options 38710.30 Power Generation through Grid Interactive Renewable Power 38710.31 Financial Outlays Proposed for the Eleventh Plan 38810.32 Physical Targets Proposed for the Eleventh Plan 38810.33 Proposed R&D Initiatives in the Eleventh Plan 390
11.1 City/Town-wise Average Access to Drinking Water 40211.2 Funds Requirement—Urban Basic Services 40411.3 Proposed Flow of Funds 40411.4 Comparison of Poverty Estimates Based on Uniform Recall Period 40511.5 Comparison of Poverty Estimates Based on Mixed Recall Period 40511.6 Number of Persons below Poverty Line in Urban and Rural Areas 40511.7 Social Housing Schemes 40711.8 Urban Local Bodies/Parastatals which have been Granted Permission for
Issue of Tax-Free Bonds 41811.9 Outlay and Expenditure 420
11.10 Funds Requirement 42211.11 Sources of Funding 42211.12 Slum Population—Census 2001 42211.13 Population, Housing and Basic Amenities 422
12.1.1 Telecom Network Status in India as on March 2007 42312.1.2 Private Sector Participation (as on 31 March 2006) 42412.1.3 Status of Telecom Indicators in Some Countries as on December 2005 42412.1.4 Expansion of Telecom Network—Public and Private Operators and Fixed and Mobile
(PSUs and Private Operators) during the Tenth Plan Period (2002–07) 42512.1.5 Performance of Telecom Equipment Manufacturing Sector during the Tenth Plan 42612.4.1 Annual Growth of Indian Entertainment and Media Industry 445
viii Tables
1Figures
2.1 Expenditure on Irrigation 462.2 Categorization of Blocks/Mandals/Talukas as on March 2004 51
7.1.1 Share in World Exports of Manufactured Goods 1427.1.2 Starting a Business—Time, and Procedures 1447.1.3 Closing a Business—Time, and Recovery Rate 1457.1.4 Contribution of States to Output and Employment in Manufacturing 1607.1.5 Auto Components—Projection of Turnover and Exports 1677.1.6 Cement—Export, Project Demand and Capacity needed by 2011–12 1707.1.7 Share (Value of Output) of Different Segments of Chemical Industry in India 1737.1.8 Domestic Sales and Exports of Pharmaceuticals 1747.1.9 Pharmaceuticals—Exports, Retail Sale and Institutional Sale by 2011–12 175
7.1.10 Demand of Fertilizer by 2011–12 1787.1.11 Indian Leather Exports—Changing Structure 1807.1.12 Projected Growth of India’s Exports of Leather and Leather Products 1807.1.13 Relative Scale of Operation of Plastic Processing Industry 1837.1.14 Ownership-wise Distribution 1907.1.15 Project Cost Sanctioned under TUFS 1937.1.16 Growth of the SME Sector in India 1987.1.17 Availability of Credit for SSI and Tiny Units 201
7.2.1 Approvals of Reconnaissance Permit 2077.2.2 Production and Export of Aluminium 2087.2.3 Capacity, Production and Export of Copper 2087.2.4 Capacity and Production of Zinc 2097.2.5 Capacity and Production of Lead 21010.1 Estimated Sector-wise Demand for Coal in 2011–12 376
12.4.1 Indian Entertainment and Media Industry—Status and Projections 445

1Boxes
1.1 Strengths and Weaknesses of Watershed Development Projects in India after 1994 273.1 Avoided Deforestation Incentive Mechanism for States 735.1 Untapped Domestic and International Markets for Traditional Crafts 1055.2 Hope Looms 1085.3 Eleventh Plan Schemes—Handicrafts 1125.4 Eleventh Plan Schemes 1195.5 From Poverty to Prosperity 125
7.1.1 Autonomous Institutions in Industry Sector 1577.1.2 Industrial Area Development Schemes 1587.1.3 Dwindling of a Vibrant Sector 2007.1.4 Small Success 2048.1.1 Holistic Human Resource Development (HRD)—Construction Industry
Development Council (CIDC) 2419.2.1 Expansion of Chinese and Indian Railways (1992–2002)—A Comparison 2829.2.2 Dedicated Freight Corridors (DFCs) 2839.2.3 Throw Forward—A Way Forward 2859.2.4 Fare–Freight Ratio of World Railways 2859.2.5 Public–Private Partnership (PPP) 2869.3.1 Initiatives taken to Expedite Completion of Quality Road Projects 2939.3.2 Modernization of Maintenance Management 2969.3.3 Initiatives taken to Facilitate Private Sector Investment 2969.3.4 Road Sector Objectives for the Eleventh Plan 3009.3.5 Innovations by some State Governments 3019.3.6 Some Options of Resource Mobilization for Rural Roads 3019.5.1 Tariff Setting Mechanism 31910.1 Integrated Energy Policy 34310.2 Energy Equivalence 34510.3 Private Sector Participation 35711.1 Vision 39411.2 Strategy of Urban Development 39511.3 Status of Urban Services 402
11.4 Objectives for Urban Poverty Alleviation 40611.5 Slums 40611.6 Integrated Slum Development 40611.7 Spread of Slums 40611.8 Housing Construction and Ownership 40711.9 New Focus in SJSRY 408
11.10 Housing Stock 41011.11 Housing Shortage and Requirement 41111.12 Investment Requirement 41211.13 Financing of Housing Loans 41211.14 Best Practices in Public Transport 421
12.2.1 Major Government Initiatives 43212.2.2 Indicative List of Successful Initiatives in the States 43312.3.1 Basic Profile of the Postal Sector 439
Boxes xi

1Annexures
1.1 Plan Outlays for the Centre, States and UTs 411.2 Degraded Lands Developed under Various Watershed Development
Programmes—since Inception upto the Tenth Five Year Plan 421.3 Projection for Central Sector GBS–Ministry-wise for the Eleventh Plan 422.1 Plan-wise Cumulative Potential Created and Utilized 644.1 Headcount Ratio and Number of Poor Persons Below Poverty Line in India (Combined) 1004.2 Headcount Ratio and Number of Poor Persons Below Poverty Line in India (Rural) 1014.3 Headcount Ratio and Number of Poor Persons Below Poverty Line in India (Urban) 1024.4 Percentage of Population Below Poverty Line by Social Groups—2004–05 1035.1 Cluster Development in India—Towards a Reinvigorated Cluster Approach 127
7.1.1 Industrial Investment Proposals 2177.1.2 Investment Projects Benefiting from Loans from Banks/FIs in 2004–05, 2005–06
and 2006–07 2177.1.3 Composition of Exports and Growth Rates 2187.1.4 Performance of CPSEs during the Tenth Five Year Plan 2197.1.5 State-wise and Year-wise Investment Intentions (IEMs + LOIs + DILs) 2207.1.6 State-wise Investment Projects Benefiting from Loans from Banks/FIs
during 2004–05, 2005–06 and 2006–07 2217.1.7 Production and Export of Vehicles 2227.1.8 Production and Export Performance in Capital Goods Sector 2227.1.9 Production of Chemicals 223
7.1.10 Production, Consumption and Import of Fertilizers 2237.1.11 Production, Import and Export of Paper and Paperboard 2247.1.12 Production, Import and Export of Newsprint 2247.1.13 Performance of Commodity Polymers and Synthetic Fibres 2247.1.14 Production, Import and Export of Finished Steel 2257.1.15 Estimated Requirement of Raw Material and Other Inputs in Steel Production by 2011–12 2257.1.16 Production, Consumption and Export of Sugar during 2002–03 to 2006–07 2257.1.17 Production of Cloth—Year on Year Growth 2267.1.18 Exports of Textiles and Clothing during the Tenth Five Year Plan 2267.1.19 The Tenth Plan Outlay and Anticipated Expenditure and the Eleventh Plan Outlay 227

7.1.20 Performance of SSIs, Year 2001–01 to 2006–07 2287.1.21 Export Destination (Country) of SSI Products 2287.1.22 Participation of Women in SSI Sector, State-wise 2297.1.23 Schemes for MSME 230
7.2.1 Organization/Company-wise Actual Expenditure in theTenth Five Year Plan—Ministry of Mines 232
7.2.2 Life Indices of Important Minerals 2327.2.3 Estimated Apparent Consumption, Domestic Production,
Resource Situation and Life Index of Selected Minerals 2337.2.4 Material Balance of Principal Non-ferrous Metals 2347.2.5 Iron Ore Availability—Haematite (as on 1 April 2005) 2347.2.6 Iron Ore Availability—Magnetite (as on 1 April 2005) 2347.2.7 Physical Targets Proposed by GSI for some Important Activities for the
Eleventh Plan (2007–12) 2357.2.8 Physical Targets Proposed by IBM and MECL for some Important
Activities for the Eleventh Plan (2007–12) 2357.2.9 Expansion Projects of NALCO—Capacity Additions 236
7.2.10 Scheme-wise Break-up of Eleventh Plan Outlays at Current Price—Ministry of Mines 2368.2.1 Financial and Physical Performance of Tourism during the Tenth Five Year Plan 2739.2.1 Resource Mobilization for the Tenth Five Year Plan 3299.2.2 Gross Budgetary Support 3299.3.1 Financial and Physical Performance 3309.3.2 Central Road Sector Outlay and Expenditure—At Current and Constant
Price for the Tenth Plan 3329.3.3 Plan-wise Addition to NH Length 3339.3.4 Bharat Nirman—Targets for New Connectivity 3349.3.5 Tenth Five Year Plan (2002–07)—Financial and Physical Performance of Road Transport 3369.3.6 State-wise Sanctions and Releases of Central Share in Respect of
Model Driving Training School—Status as on 31 March 2007 3379.3.7 Physical Performance of State Road Transport Corporations/Undertakings 3389.5.1 Year-wise Physical Targets and Achievements during the Tenth Plan—
Major Ports (Commodity-wise) 3399.5.2 Year-wise Physical Targets and Achievements during the Tenth Plan—
Major Ports (Port-wise) 3399.5.3 Tenth Plan—Outlays and Expenditure in Ports Sector 3409.6.1 Financial Progress of the Civil Aviation Sector during the Tenth Plan 34110.1 Coal Demand/Supply—Sector-wise Break-up 39110.2 Company-wise Coal Production Programme 39210.3 Calorific Values, Units and Conversion Factors 393
12.2.1 Performance of IT Hardware and Software during the Tenth Five Year Plan 45012.2.2 Performance of Export Segment of IT Hardware and Software during the
Tenth Five Year Plan 45012.4.1 Progress of the Plan Expenditure of Communication and Information Sector 451
Annexures xiii
1Acronyms
3G Third GenerationA&N Islands Andaman and Nicobar IslandsAAI Airports Authority of IndiaAAUI Automobile Association of
Upper IndiaABB Asea Brown Boveri LtdACA Additional Central AssistanceACI Aero Club of IndiaACZs Agro-Climatic ZonesADB Asian Development BankAGR Adjusted Gross RevenueAI Air IndiaAIBP Accelerated Irrigation Benefit
ProgrammeAICL Air India Charters LimitedAICRP All-India Co-ordinated Research
ProjectAIDS Acquired Immuno Deficiency
SyndromeAIR All-India RadioALHW Andaman Lakshadweep Harbour
WorksALIMCO Artificial Limbs Manufacturing
CorporationAMR Addition, Modification and
ReplacementANDA Abbreviated New Drug ApplicationAP Annual PlanAP Andhra PardeshAPDRP Accelerated Power Development
and Reforms Programme
APEDA Agricultural and Processed FoodProducts Export DevelopmentAuthority
APES Apparel Parks for ExportsScheme
API Active Pharmaceutical IngredientAPM Administered Price MechanismAPMC Agricultural Product Marketing
CommitteeARAI Automotive Research Association
of IndiaASI Annual Survey of IndustriesAT&C Aggregate Technical and
CommercialATF Aviation Turbine FuelATI Automotive Training InstitutesATM Air Traffic ManagementATMAs Agriculture Technology
Management AgenciesAUWSP Accelerated Urban Water Supply
ProgrammeAVT Artisan, Village, and TinyAWBI Animal Welfare Board of IndiaBALCO Bharat Aluminium Co. LtdBARC Bhabha Atomic Research CentreBC Business CorrespondentsBCAS Bureau of Civil Aviation SecurityBCCL Bharat Coking Coal Limitedbcm billion cubic metreBCPL Brahmaputra Cracker and Polymer
Ltd

Acronyms xv
BCPL Bengal Chemicals andPharmaceuticals Limited
BDDS Bomb Detection and DisposalSquad
BE Budget EstimateBEE Bureau of Energy EfficiencyBG Broad GaugeBHEL Bharat Heavy Electricals LtdBIFR Bureau of Industrial and Financial
ReconstructionBih BiharBIFR Bureau of Industrial and Financial
ReconstructionBIS Bureau of Indian StandardsBkWh billion kilowatt hoursBLA BLA IndustriesBMI Body Mass IndexBMTC Bangalore Metropolitan Transport
CorporationBMTPC Building Materials and Technology
Promotion CouncilBMS Basic Minimum ServicesBOO Build–Own–OperateBOT Build, Operate, and TransferBPCL Bharat Petroleum Corporation LtdBPL Below Poverty LineBPO Business Process OutsourcingBRDB Border Roads Development BoardBRGF Backward Regions Grant FundBRK Brick KilnBRO Border Roads OrganizationBRPL Bongaigaon Refineries and
Petrochemicals LtdBRPSE Board for Reconstruction of Public
Sector EnterprisesBS Budgetary SupportBSNL Bharat Sanchar Nigam LtdBSUP Basic Services to the Urban PoorBt Billion tonneBTKM Billion Tonne Kilometrebtu British Thermal UnitBU Billion UnitC-DOT Centre for Development of
TelematicsCAA Constitution Amendment ActCACP Commission for Agricultural Costs
and Prices
CAD Command Area DevelopmentCAD Computer Aided DesignCADWM Command Area Development and
Water ManagementCAGR Compound Annual Growth RateCAMPA Compensatory Afforestation Fund
Management and PlanningAuthority
CARA Central Adoption Resource AgencyCART Credit Appraisal and Rating ToolCAS Conditional Access SystemCBM Coal Bed MethaneCBOs Community Based OrganizationsCBSP Capacity Building for Service
ProviderCBVS Chanderi Bunkar Vikas SamitiCBWE Central Board for Workers’
EducationCCA Culturable Command AreaCCBs Central Co-operative BanksCCDA Coal Conservation and
Development ActCCEA Cabinet Committee on Economic
AffairsCCL Central Coalfields LimitedCCO Coal Controller OrganizationCDI Coal Dust InjectionCDMA Code Division Multiple AccessCDP City Development PlanCDSCO Central Drugs Standard Control
OrganizationCEA Central Electricity AuthorityCERC Central Electricity Regulatory
CommissionCENVAT Central Value-Added TaxCERT-In Indian Computer Emergency
Response TeamCFC Common Facility CentreCFS Container Freight StationCFt Cubic FeetCGWB Central Ground Water BoardCha ChhattisgarhCHMS Complaints Handling Management
SystemCIC Community Information CentreCIDC Construction Industry
Development Council
xvi Acronyms
CII Confederation of Indian IndustriesCIL Coal India LimitedCIPET Central Institute of Plastics
Engineering and TechnologyCIRT Central Institute of Road
TransportCITES Convention on International Trade
in Endangered Species of WildFauna and Flora
CLA Central Loan AssistanceCLCS Credit-Linked Capital SubsidyCLCSS Credit Linked Capital Subsidy
SchemeCLIFF Community-linked Finance FacilityCMTI Central Manufacturing Technology
InstituteCNS Communication, Navigations and
SurveillanceCoI Committee on InfrastructureCOIN Co-operative Bank Information
NetworkCOSCAP Co-operative Development of
Operational Safety and ContinuingAirworthiness Programme
CPCL Chennai Petroleum CorporationLtd
CPCSEA Committee for the Purpose ofControl and Supervision ofExperiments on Animals
CPDS Chemical Promotion andDevelopment Scheme
CPL Commercial Pilot LicenceCPP Calling Party PaysCPP Captive Power PlantCPPRI Central Pulp and Paper Research
InstituteCPSE Central Public Sector EnterpriseCPSU Central Public Sector UndertakingCRC Chawki Rearing CentreCRF Central Road FundCRRI Central Road Research InstituteCSB Central Silk BoardCSC Common Service CentreCSD Cutter Suction DredgerCSIR Council of Scientific and Industrial
ResearchCSL Cochin Shipyard Ltd
CSO Central Statistical OrganizationCSS Centrally Sponsored SchemesCST Central Sales TaxCTL Coal To LiquidCTSA Central Tibetan School
AdministrationCUM Cubic MetreCUSP Cryogenic Upper Stage ProjectCVs Commercial VehiclesCWC Central Water CommissionCWDB Central Wool Development BoardCZA Central Zoo AuthorityDAC Department of Agriculture and
Co-operationDAE Department of Atomic EnergyDAHDF Department of Animal Husbandry,
Dairying, and FisheriesDAP Di-Ammonium PhosphateDARE Department of Agricultural
Research and EducationDBT Department of BiotechnologyDC Development CommissionerDCI Dredging Corporation of IndiaDD DoordarshanDDHPY Deen Dayal Hathkargha Protsahan
YojanaDDP Desert Development PlanDel DelhiDFC Dedicated Freight CorridorDFID Department for International
DevelopmentDFP Directorate of Field PublicityDFPD Department of Food and Public
DistributionDGCA Directorate General of Civil
AviationDGH Directorate General of
HydrocarbonDGLL Directorate General of Lighthouses
and LightshipsDGMS Directorate General of Mines
SafetyDGPS Differential Global Positioning
SystemsDG (S) Directorate General of ShippingDHI Department of Heavy IndustryDIL Direct Industrial License

Acronyms xvii
DIPP Department of Industrial Policy andPromotion
DIT Department of InformationTechnology
DMF Drug Master FileDMIC Delhi–Mumbai Industry CorridorDPAP Drought Prone Area ProgrammeDPC District Programme Co-coordinatorDPE Department of Public EnterprisesDPR Detailed Project ReportDoDWS Department of Drinking Water
SupplyDOE Directorate of ExtensionDoNER Development of North East RegionDoP Department of PostsDoRTH Department of Road Transport and
HighwaysDoT Department of TelecommunicationsDRDA District Rural Development AgencyDRM Digital Radio MondialeDSIR Department of Scientific and
Industrial ResearchDSL Digital Subscriber LinesDSM Demand Side ManagementDTH Direct To HomeDTO District Transport OfficeDVC Damodar Valley CorporationDWCUA Development of Women and
Children in Urban AreasDWT Dead Weight TonnageE&I Roads of Economic and Interstate
ImportanceE&P Exploration and ProductionEAPs Externally Aided ProjectsEBR Extra Budgetary ResourcesEC Expert CommitteeECBC Energy Conservation Building CodesECE Economic Commission for EuropeECL Eastern Coalfields LimitedEDI Electronic Data InterchangeEDP Entrepreneurship Development
ProgrammeEFC Expenditure Finance CommitteeEFR Environment Flow ReleasesEGS Education Guarantee SchemeEIA Environmental Impact AssessmentEIC Export Inspection Council
EMSC Environmental Measures andSubsidence Control
EOR Enhanced Oil RecoveryERC Expenditure Reform CommitteeERM Extension, Renovation, and
ModernizationERP Enterprise Resource PlanningESA External Support AgenciesEU European UnionEV Electric vehicleEWS Economically Weaker SectionsFAB Fabrication UnitsFAO Food and Agricultural OrganizationFAR Floor Area RatioFASAL Forecasting Agriculture Output
using Space, Agro-Meteorology, andLand-based Observation
FBRs Fast Breeder ReactorsFCI Food Craft InstituteFCRI Fluid Control Research InstituteFDA Forest Development AgencyFDDI Footwear Design and Development
InstituteFDI Foreign Direct InvestmentFICCI Federation of Indian Chambers of
Commerce and IndustryFM Frequency ModulationFO Furnace OilFOB Free On BoardFOIS Freight Operation Information
SystemFPI Food Processing IndustryFPR Flood Prone RiverFR Feasibility ReportFRM Fertilizer Raw MaterialFSI Floor Space IndexFSI Forest Survey of IndiaFTA Free Trade AgreementFTII Film and Television Institute of IndiaFTL Fluorescent Tube LightFWW Four Wheeler WagonG&P Ginning and PressingGAIL Gas Authority of India LtdGbps Gigabits per secondGBS Gross Budgetary SupportGCF Gross Capital FormationGCV Gross Calorific Value

xviii Acronyms
GDCF Gross Domestic CapitalFormation
GDP Gross Domestic ProductGER Gross Enrolment RatioGHz GigahertzGI Geographical IndicationGIS Geographic Information SystemsGLP Good Laboratory PracticesGMP Good Manufacturing PracticeGoI Government of IndiaGoM Group of MinistersGP Gram PanchayatGPS Global Positioning SystemGQ Golden QuadrilateralGRE Graduate Record ExaminationGSI Geological Survey of IndiaGSM Global System for Mobile
CommunicationsGSPC Gujarat State Petroleum
Corporation LimitedGSRDC Gujarat State Road Development
CorporationGST Goods and Service TaxGT Gross TonnagesGuj GujaratGVA Gross Value AddedGWe Gigawatt ElectricalGW-Yr Gigawatt Yearha HectareHACCP Hazard Analysis and Critical
Control PointHar HaryanaHCI Hotel Corporation of IndiaHCL Hindustan Copper LtdHCR Headcount RatioHDTV High Definition TelevisionHEMM Heavy Earth Moving MachineryHEP Hydro Electric ProjectHFC Housing Finance CompanyHH HouseholdHMCPs Hardware Manufacturing Cluster
ParksHP Himachal PradeshHOCL Hindustan Organics Chemicals
LimitedHPC High Powered Inter-Ministerial
Committee
HPCL Hindustan Petroleum CorporationLtd
HPL Hindustan Prefab LimitedHR Human ResourceHRD Human Resource DevelopmentHSL Hindustan Shipyard LtdHUDCO Housing Urban Development
CorporationHZL Hindustan Zinc LtdI&B Information and BroadcastingI&M Industry and MineralsIAY Indira Awaas YojanaIBM Indian Bureau of MinesIBP Indo Burma Petroleum Company
LtdIC Integrated CircuitsICAR Indian Council of Agricultural
ResearchICDS Integrated Child Development
ServicesICE Information, Communication and
EntertainmentICFRE Indian Council of Forestry Research
and EducationICML Integrated Coal Mining LtdICPS Integrated Child Protection
SchemeICRIER Indian Council for Research on
International Economic RelationsICT Information and Communication
TechnologyID Industrial DisputeIDA International Development
AssociationIDLS Integrated Development of
Leather SectorIDSMT Integrated Development of Small
and Medium TownsIDTR Institute of Driving Training and
ResearchIEBR Internal and Extra Budgetary
ResourceIEC Information, Education, and
CommunicationIEM Industrial Entrepreneur
MemorandaIEPR Integrated Energy Policy Report

Acronyms xix
IFFCO Indian Farmers FertilizerCo-operative Ltd
IGCAR Indira Gandhi Centre for AtomicResearch
IGCC Integrated Gasification CombinedCycle
IGRUA Indira Gandhi Rashtriya UranAkademi
IHM Institutes of Hotel ManagementIHSDP Integrated Housing and Slum
Development ProgrammeIID Integrated Infrastructure
DevelopmentIIFM Indian Institute of Forest
ManagementIIM Indian Institute of ManagementIIMC Indian Institute of Mass
CommunicationIIP Index for Industrial ProductionIISCO Indian Iron and Steel CompanyIIT Indian Institute of TechnologyIITM Indian Institute of Tropical
MetereologyIITTMs Indian Institute of Tourism and
Travel ManagementIIUS Industrial Infrastructure
Upgradation SchemeIL&FS Infrastructure Leasing and Financial
Services LtdILCS Integrated Low Cost Sanitation
SchemeILD International long distanceILDP Indian Leather Development
ProgrammeIMD Indian Meteorological DepartmentIMF Irrigation Maintenance FundIMO Instant money-orderIMR Infant Mortality RateIMU Indian Maritime UniversityINCOIS Indian National Centre for Ocean
Information ServicesIndal Indian Aluminium Company LimitedINSA Indian National Shipowners’
AssociationIOC Indian Oil CorporationIODP Integrated Ocean Drilling
Programme and Geotechnoic
IOR Improved Oil RecoveryIP Internet ProtocolIPE Institute of Public EnterpriseIPEA International Preliminary
Examining AuthorityIPFT Institute of Pesticides Formulation
TechnologyIPIRTI Indian Plywood Industries Research
and Training InstituteIPM Integrated Pest ManagementIPO Indian Intellectual Property OfficeIPRs Intellectual Property RightsIPTV Internet Protocol TelevisionIR Internal ResourcesIRDA Insurance Regulatory and
Development AuthorityIREDA Indian Renewable Energy
Development AgencyIREP Integrated Rural Energy ProgrammeIRMRA Indian Rubber Manufacturers
Research AssociationIRQP Improvement of Riding Quality
ProgrammeISA International Searching AuthorityISO International Organization for
StandardizationISP Internet Service ProviderIT Information TechnologyITC Industrial Training CentresITES IT-enabled ServicesITI Industrial Training InstituteITS Intelligent Transportation SystemIWAI Inland Waterways Authority of IndiaIWDP Integrated Wasteland Development
ProjectIWT Inland Water TransportJ&K Jammu and KashmirJBIC Japan Bank for International
CooperationJFM Joint Forest ManagementJha JharkhandJKML Jammu and Kashmir Mineral LtdJNNURM Jawaharlal Nehru National Urban
Renewal MissionJNPT Jawaharlal Nehru Port TrustJSMDCL Jharkhand State Mineral
Development Corporation

xx Acronyms
JSPL Jindal Steel and Power LtdJV Joint VentureJVC Joint Venture CompanyK–G Krishna–GodavariKar KarnatakaKBK Koraput, Bolangir, and KalahandiKcal KilocalorieKCCs Kisan Credit CardsKer KeralaKg KilogramKgoe Kilogram of oil equivalentKm KilometreKPO Knowledge Process OutsourcingKRIBHCO Krishak Bharati Co-operative
LimitedKRL Kochi Refineries LtdKV Kilo VoltKVI Khadi and Village IndustriesKVIC Khadi and Village Industries
CommissionKVK Krishi Vigyan KendraKW KilowattKWh Kilowatt hourKWp Kilowatt peakLEAP Lifelong Education and Awareness
ProgrammeLED Light-emitting diodeLIC Life Insurance CorporationLIG Low-Income GroupsLMT Lakh Metric TonnesLNG Liquefied Natural GasLOI Letter of IntentLSIs Large-Scale Industriesm metrem2 square metrem3 cubic metresMah MaharashtraMAMID Mine Accident Analysis and
Modernization of informationDatabase
MAP Medicinal and Aromatic PlantMAT Management Aptitude TestMBC Mail Business CentreMCA Model Concession AgreementMCA Ministry of Corporate AffairsMCDR Mineral Conservation and
Development Rules
MCuM Million Cubic MetresMDM Mid-day MealMDF Mineral Development FundMDR Major District RoadMECL Mineral Exploration Corporation
LtdMEMU Mainline Electric Multiple UnitMFI Micro Finance InstitutionMFPI Ministry of Food Processing
IndustriesMGIRI Mahatma Gandhi Institute for Rural
IndustrializationMH Million HectareMHRD Ministry of Human Resources
DevelopmentMI Minor irrigationMICE Meetings Incentives Conventions
and ExhibitionsMIS Management Information SystemsMITI Model Industrial Training InstituteML Mining LeaseMLAs Members of Legislative AssemblyMMA Macro Management SchemeMMBtu Million British Thermal UnitMMI Major and Medium IrrigationMMP Mission Mode ProjectMMDR Act Mines and Minerals (Development
and Regulation) ActMMSCMD Million Standard Cubic Metres
per DayMNC Multi-National CompanyMNRE Ministry of New and Renewable
EnergyMoA Union Ministry of AgricultureMoC Ministry of CoalMoCA Ministry of Civil AviationMoEF Ministry of Environment and ForestMoHUPA Ministry of Housing and Urban
Poverty AlleviationMoI&B Ministry of Information and
BroadcastingMoP Ministry of PowerMOP Muriate of PotashMORD Ministry of Rural DevelopmentMoSRTH Ministry of Shipping, Road
Transport, and HighwaysMoT Ministry of Tourism
Acronyms xxi
MoU Memorandum of UnderstandingMoWR Ministry of Water ResourcesMP Madhya PradeshMPC Metropolitan Planning CommitteeMPLAD Member of Parliament Local Area
Development ProgrammeMPP Marketing Promotion ProgrammeMPP Multipurpose ProjectMRIN Marketing Research Surveys and
Information NetworkMRO Maintenance, Repair, and
OverhaulMRPL Mangalore Refineries and
Petrochemicals LtdMRP maximum retail priceMRTD Marine Research and Technology
DevelopmentMRTS Mass Rapid Transit SystemMSE Micro and Small EnterpriseMSME Micro, Small, and Medium EnterpriseMSMED Act Micro, Small, and Medium
Enterprises Development ActMSP Minimum Support Pricesmt metric tonnesMTA Mid-Term AppraisalMTNL Mahanagar Telephone Nigam LtdMtoe Million Tonne of Oil EquivalentMU Million UnitMUTP Mumbai Urban Transport ProjectMUV Multi-Utility VehicleMVA Million Volt AmperesMW MegawattMWe Megawatt ElectricalNABARD National Bank for Agriculture and
Rural DevelopmentNAEB National Afforestation and
Eco-development BoardNAEEB National Afforestation,
Ecorestoration, and Eco-development Board
NAEP National Afforestation andEco-Development Project
NAFUS National Fund for the UnorganizedSector
NAIS National Agricultural InsuranceScheme
NAL National Aerospace Laboratories
NALCO National Aluminium Company Ltd.NAP National Afforestation ProgrammeNARDCO National Real Estate Development
CouncilNARS National Agricultural Research
SystemNASSCOM National Association of Software
and ServiceCompaniesNATRIP National Automotive Testing and
R&D Infrastructure ProjectNBC Net Bank CreditNBCC National Building Construction
CorporationNBFC Non-banking Financial CompanyNBO National Building OrganizationNBS Net Budgetary SupportNCA Normal Central AssistanceNCAER National Council for Applied
Economic ResearchNCAOR National Centre for Antarctic and
Ocean ResearchNCCBM National Council for Cement and
Building MaterialsNCDC National Climatic Data CentreNCERT National Council of Educational
Research and TrainingNCEUS National Commission for Enterprises
in the Unorganized SectorNCIWRD National Commission on Integrated
Water Resources DevelopmentNCL Northern Coalfields LtdNCLT National Company Law TribunalNCMP National Common Minimum
ProgrammeNCMRWF National Centre for Medium Range
Weather ForecastNCPCR National Commission for
Protection of Child RightsNCR National Capital RegionNCRPB National Capital Region Planning
BoardNDC National Development CouncilNDE Non-Departmental EnterpriseNDDB National Dairy Development BoardNDMA National Disaster Management
AuthorityNE North East/Eastern

xxii Acronyms
NEC North Eastern CoalfieldsNEDFI North Eastern Development
Finance Corporation LtdNEF National Electricity FundNEF National Equity FundNEF (R&D) National Energy FundNeGP National e-Governance PlanNEIP North East Industrial PolicyNEKRTC North East Karnataka Road
Transport CorporationNELP New Exploration Licensing PolicyNER North Eastern RegionNFBS National Family Benefit SchemeNFDB National Fisheries Development
BoardNFHS National Family Health SurveyNGN Next Generation NetworksNGOs Non-Governmental OrganizationsNH National HighwayNHAI National Highways Authority of IndiaNHB National Housing BankNHDP National Highway Development
ProgrammeNHFDC National Handicapped Finance and
Development CorporationNHM National Horticulture MissionNH (O) National Highways (Original)NHPC National Hydroelectric Power
Corporation LtdNIAM National Institute of Agricultural
MarketingNIC National Informatics CentreNIC National Industrial ClassificationNICFS National Institute of Criminology
and Forensic SciencesNICNET National Informatics Centre
NetworkNID National Institute of DesignNIFM National Institute of Finance
ManagementNIFT National Institute of Fashion
TechnologyNIOT National Institute of Ocean
TechnologyNIPER National Institute of
Pharmaceutical Education andResearch
NITs National Institutes of TechnologyNITA National Institute of Tribal AffairsNLC Neyveli Lignite CorporationNLCPR Non-Lapsable Central Pool of
ResourcesNLD National Long DistanceNLDCP National Livestock Disease Control
ProgrammeNLI National Labour InstituteNLW Non Linked WasheryNMBS National Maternity Benefit SchemeNMCC National Manufacturing
Competitiveness CouncilNMDFC National Minorities Development
and Finance CorporationNMT Non-motorized TransportNNM National Nutrition MissionNOAPS National Old Age Pension SchemeNOCs National Oil CompaniesNOVOD National Oilseeds and Vegetable
Oils Development BoardNPC National Productivity CouncilNPCIL Nuclear Power Corporation of India
LimitedNPK Nitrogen–Phosphorus–PotassiumNPPA National Pharmaceutical Pricing
AuthorityNPS New Pricing SchemeNRAA National Rainfed Area AuthorityNRC National Referral CentreNRC National Research CentreNRCP National River Conservation PlanNREG National Rural Employment
GuaranteeNREGA National Rural Employment
Guarantee ActNREGP National Rural Employment
Guarantee ProgrammeNREGS National Rural Employment
Guarantee SchemeNRHM National Rural Health MissionNRI Non-Resident IndianNRM Natural Resource ManagementNRSA National Remote Sensing AgencyNS–EW North–South and East–WestNSAP National Social Assistance
Programme

Acronyms xxiii
NSC National Seed CorporationNSDP National Slum Development
ProgrammeNSDP National State Domestic ProductNSIC National Small Industries
CorporationNSS National Sample SurveyNSSO National Sample Survey
OrganizationNSVS National Service Volunteer SchemeNTFP Non-Timber Forest ProduceNTH National Test HouseNTKM Net Tonne KilometreNTP New Telecom PolicyNTPC National Thermal Power
CorporationNUIF National Urban Infrastructure FundNUIS National Urban Information SystemNW National WaterwayNWDA National Water Development
AgencyNWDPRA National Watershed Development
Project for Rainfed AreaNWKRTC North West Karnataka Road
Transport CorporationNWP National Water PolicyNYKS Nehru Yuva Kendra SangathanO&M Operation and MaintenanceO&OEG Oil and Oil Equivalent of GasOBCs Other Backward ClassesOECD Organization for Economic
Co-Operation and DevelopmentOEM Original Equipment ManufacturerOFC Optical Fibre CableOIL Oil India LtdOMIFCO Oman India Fertilizer CompanyOMS Output per Man-ShiftOMT Operation, Maintenance, and
TollingONGC Oil and Natural Gas CorporationOOH Out-of-HomeOOIS Ocean Observation and
Information SystemOSVs Offshore Supply VesselsOTC Open Technology CentreOVL ONGC Videsh LtdPAP Project-Affected Person/People
PBITEP Profit before interest, tax, and EPPCC Pulverized Coal CombustionPCO Public Call OfficePCPDS Pharma and Chemical Promotion
and Development SchemePCPIRs Petroleum, Chemicals, and
Petrochemical Investment RegionsPCS Port Community SystemPCUs Passenger Car UnitsPDS public distribution systemPEPSURTC Punjab and East Punjab States
Union Road Transport CorporationPESA Panchayat (Extension to Scheduled
Areas) ActPFDF Pooled Finance Development FundPFMs Postal Finance MartsPGE Platinum Group of ElementsPHE Public Health EngineeringPHED Public Health Engineering
DepartmentPHHL Pawan Hans Helicopters LtdPHM Post-harvest ManagementPHWR Pressurized Heavy Water ReactorPIA Programme Implementation
AgencyPIB Public Investment BoardPIM Participatory Irrigation
ManagementPIU Programme Implementation UnitPL Prospecting LicensePLF Plant Load FactorPLR Prime Lending RatePMEGP Prime Minister’s Employment
Generation ProgrammePMGSY Pradhan Mantri Gram Sadak YojanaPMN Polymettalic NodulesPMRY Prime Minister’s Rozgar YojanaPMS Pavement Management SystemsPOL Petroleum, Oil, and LubricantsPPP Public–Private PartnershipPRIs Panchayati Raj InstitutionsPRODIP Product Development, Design
Intervention, and PackagingPSCs Powerloom Service CentresPSCI Postal Staff College IndiaPSE Public Sector EnterprisePSP Pump Storage Project

xxiv Acronyms
PSU Public Sector UndertakingPun PunjabPURA Provision of Urban Amenities in
Rural AreasPVC Polyvinyl ChloridePWC Pricewaterhouse CoopersPWD Persons With DisabilitiesPWD Public Works DepartmentQCI Quality Council of IndiaQts QuintalsR&D Research and DevelopmentR&M Renovation and ModernizationRaj RajasthanRAS Reclamation of Alkali SoilRBI Reserve Bank of IndiaRCF Rashtriya Chemicals and Fertilizers
LtdRCPs Rural Community PhonesRCSRC Regional Cyber Security Research
CentreRDG Route Dispersal GuidelinesRE Revised EstimateREACH Registration, Evaluation, and
Authorization of ChemicalsREC Rural Electrification Corporation
LtdREGP Rural Employment Generation
ProgrammeRF Radio FrequencyRFI Radio Frequency IdentificationRGGVY Rajiv Gandhi Grameen Vidyutikarn
YojanaRGSY Rashtriya Gram Swaraj YojanaRIDF Rural Infrastructure Development
FundRINL Rashtriya Ispat Nigam LtdRISC Rural Industries Service CentesRKM Route KilometresRKVY Rashtriya Krishi Vikas YojanaRMC Ready-Mix ConcreteRMK Rashtriya Mahila KoshRMS Risk Management SystemRNI Registrar of Newspaper for IndiaROB Road Over BridgeRP Reconnaissance PermitRPO Regional Project OfficeRPS Retention Price Scheme
RR Rural RoadsRRBs Regional Rural BanksRSVY Rashtriya Sam Vikas YojanaRSY Rashtriya Sadbhavana YojanaRTA Regional Trading ArrangementRTKM Revenue Tonne KilometresRTOs Regional Transport AuthoritiesRUB Road Under BridgeRVP River Valley ProjectRW Road WingS&T Science and TechnologySAIL Steel Authority of India Ltd.SARDP-NE Special Accelerated Road
Development Programme for theNorth Eastern Region
SARS Severe Acute RespiratorySyndrome
SAT Scholastic Aptitude TestSAUs State Agricultural UniversitiesSBIRI Small Business Innovation Research
InitiativeSBLP SHGs–bank linkage programmeSC Scheduled CasteSCA Special Central AssistanceSCB Scheduled Commercial BanksSCCL Singareni Collieries Company LtdSCDC Scheduled Caste Development
CorporationSCI Shipping Corporation of IndiaSCP Special Component PalnSDA State Designated AgencySDC Strategic Distribution CentreSDD Song and Drama DivisionSDF Sustainable Development
FrameworkSDF Sugar Development FundSEB State Electricity BoardSECL South Eastern Coalfields LtdSEI–CMM Software Engineering Institute–
Capacity Maturity ModelSERCs State Electricity Regulatory
CommissionsSES Selected Educational StatisticsSEWA Self Employed Women’s
AssociationSEZ Special Economic ZoneSFCI State Farm Corporation of India
Acronyms xxv
SFURTI Scheme of Fund for Regeneration ofTraditional Industries
SGRY Sampoorna Grameen RozgarYojana
SGSY Swaranjayanti Gram SwarozgarYojana
SH State HighwaySHG Self-help GroupSHPI SHG Promoting InstitutionSHTP Special Handicrafts Training ProjectSIAs State Implementing AgenciesSIDBI Small Industries Development Bank
of IndiaSISI Small Industries Service InstitutesSITP Scheme for Integrated Textile ParksSJSRY Swarna Jayanti Shahri Rozgar
YojanaSLDB State Land Development BankSLNA State-level Nodal AgencySLPEs State-level Public EnterprisesSME Small and Medium EnterpriseSMP Statutory Minimum PriceSOCFOD Strengthening of Core Functions
of DGMSSPA School of Planning and
ArchitectureSPS Sanitary and PhytosanitarySPUs State Power UtilitiesSPV Special Purpose VehicleSq M Square MetreSq Km Square KilometreSRs State RoadsSREP Strategic Research Extension PlansSRFTI Satyajit Ray Film and Television
InstituteSRR Seed Replacement RateSRSF Special Railway Safety FundSRTUs State Road Transport UndertakingsSRU Ship Repair UnitSS Secondary SchoolSSA Sarva Shiksha AbhiyanSSCP Sethusamudram Channel ProjectSSIs Small-Scale IndustriesST Scheduled TribeSTD Sexually Transmitted DiseaseSTPI Software Technology Parks of IndiaSWAN State-Wide Area Network
T&CS Thrift and Credit SocietiesT&D Transmission and DistributionT&T Travel and TourismTAT Technical Assistance in Telecom SectorTB TuberculosisTCD Metric Tonnes crushed per dayTCF Trillion Cubic FeetTCIDS Textile Centres Infrastructure
Development SchemeTDSAT Telecom Disputes Settlement and
Appellate TribunalTEC Telecom Engineering CentreTETC Telecom Testing and Security
Certification CentreTFC Twelfth Finance CommissionTISCO Tata Iron and Steel CompanyTMC Technology Mission on CottonTMT Thousand Metric TonneTN Tamil NaduTPD Tonnes Per DayTPY Tonne per YearTRAI Telecom Regulatory Authority of
IndiaTSC Total Sanitation CampaignTSD Trailer Suction DredgerTSP Tribal Sub-PlanTUFS Technology Upgradation Fund
SchemeTVEs Town and Village EnterprisesTWh Trillion Watt hourUAE United Arab EmiratesUCG Underground Coal GasificationUGC University Grants CommissionUHV Useful Heat ValueUIDSSMT Urban Infrastructure Development
Scheme for Small and Medium TownsUIP Ultimate Irrigation PotentialUK United KingdomULBs Urban Local BodiesUMA&N Undersea Cabling between
Mainland and Andaman & Nicobar(A&N) Islands
UMBVS Urmul Marusthali Bunkar VikasSamiti
UMPP Ultra-mega Power ProjectUNCCD United Nations Convention to
Combat Desertification

xxvi Acronyms
UNCTAD United Nations Conference onTrade and Development
UNDP United Nations DevelopmentProgramme
UNFC United Nations FrameworkClassification
UNIDO United Nations IndustrialDevelopment Organization
UP Uttar PradeshUPA United Progressive AllianceURIF Urban Reform Incentive FundUS/USA United States of AmericaUSAID United States Agency for
International DevelopmentUSFDA United Sates Food and Drug
AdministrationUSO Universal Service ObligationUSOF Universal Service Obligation
FundUSP Unique Selling PointUT Union TerritoryUtt UttarakhandVAMBAY Valmiki Ambedkar Awas YojanaVAT Value-Added TaxVGF Viability Gap FundingVLCC Very Large Crude Carrier
VLF Village Level FederationVoIP Voice over Internet ProtocolVPN Virtual Private NetworkVPT Village Public TelephoneVRS Voluntary Retirement SchemeVSAT Very Small Aperture TerminalVSE Village and Small EnterprisesVSNL Videsh Sanchar Nigam LimitedWB West BengalWCCU World Class Central UniversityWCD Women and Child DevelopmentWCL Western Coalfields LtdWDF Watershed Development FundWDPSCA Watershed Development Project for
Shifting Cultivation AreaWHO World Health OrganizationWiFi Wireless FidelityWII Wildlife Institute of IndiaWiMAX Worldwide Interoperability for
Microwave AccessWLL Wireless in Local LoopWMO Wireless Monitoring OrganizationWPC Wireless Planning & Co-ordinationWTO World Trade OrganizationWUA Water Users AssociationZBB Zero Based Budgeting

IAgriculture


1Agriculture
INTRODUCTION1.1 Although its share in Gross Domestic Product(GDP) has declined from over half at Independenceto less than one-fifth currently, agriculture remainsthe predominant sector in terms of employment andlivelihood with more than half of India’s workforceengaged in it as the principal occupation. Agriculturestill contributes significantly to export earnings andis an important source of raw materials as well as ofdemand for many industries.
1.2 India’s agriculture sector has an impressivelong-term record of taking the country out of seriousfood shortages despite rapid population increase.This was achieved through a favourable interplayof infrastructure, technology, extension, and policysupport backed by strong political will. The mainsource of long-run growth was technological augmen-tation of yields per unit of cropped area. This resultedin tripling of foodgrain yields, and foodgrain pro-duction increased from 51 million tonnes in 1950–51to 217 million tonnes in 2006–07. Production of oil-seeds, sugarcane, and cotton have also increasedmore than four-fold over the period, reaching 24million tonnes and 355 million tonnes and 23 millionbales, respectively, in 2006–07.
1.3 But, although GDP from agriculture has morethan quadrupled, from Rs 108374 crore in 1950–51 toRs 485937 crore in 2006–07 (both at 1999–2000 price),the increase per worker has been rather modest. GDP
per agricultural worker is currently around Rs 2000per month, which is only about 75% higher in realterms than in 1950 compared to a four-fold increasein overall real per capita GDP. While slower growth ofGDP in agriculture than non-agriculture is expected,the main failure has been the inability to reduce thedependence of the workforce on agriculture signifi-cantly by creating enough non-farm opportunities toabsorb the labour surplus in rural areas and equip-ping those in agriculture to access such opportunities.Half of those engaged in agriculture are still illiterateand just 5% have completed Higher Secondaryeducation. Incomes and education are of course leastamong agricultural labourers. Even families operat-ing farms now suffer from much smaller holdings(70% below 1 hectare in 2003 compared to 56% in1982), and farming members in such families are twiceas likely to be illiterate as non-farming members.Ensuring food security and farmer welfare thus requiresupport systems to extend technology and scale ben-efits in a sustainable manner to a huge existing work-force in agriculture that lacks non-farm skills and isalso ageing and getting feminized.
RECENT TRENDS AND CONCERNS1.4 The Mid-Term Appraisal (MTA) for the TenthFive Year Plan had drawn attention to the loss ofdynamism in agriculture and allied sectors after themid-1990s. In fact, during the last decade or so Indianagriculture has faced a number of severe challenges,superimposed on the long-term demographics. Recent

4 Eleventh Five Year Plan
trends that have raised concern regarding food secu-rity, farmers’ income, and poverty are:
• Slowdown in growth.• Widening economic disparities between irrigated
and rain-fed areas.• Increased vulnerability to world commodity price
volatility following trade liberalization. This had anadverse effect on agricultural economies of regionsgrowing crops such as cotton and oilseeds.
• Uneven and slow development of technology.• Inefficient use of available technology and inputs.• Lack of adequate incentives and appropriate insti-
tutions.• Degradation of natural resource base.• Rapid and widespread decline in groundwater table,
with particularly adverse impact on small and mar-ginal farmers.
• Increased non-agricultural demand for land andwater as a result of the higher overall GDP growthand urbanization.
• Aggravation in social distress as a cumulativeimpact of the above, reflected in an upsurge infarmers’ suicides.
1.5 Growth of agricultural GDP decelerated from over3.5% per year during 1981–82 and 1996–97 to onlyaround 2% during 1997–98 and 2004–05 (see Table1.1). This deceleration, although most marked in rain-fed areas, occurred in almost all States and coveredalmost all major sub-sectors, including those such ashorticulture, livestock, and fisheries where growth wasexpected to be high (see Table 1.3). Consequently,growth of agricultural GDP has been well below thetarget of 4% set in both Ninth and Tenth Plans. In fact,Tenth Plan growth averaged even less than that during
TABLE 1.1Average GDP Growth Rates—Overall and in Agriculture
(% per Year at 1999–2000 Price)
Period Total Economy Agriculture and Allied Sectors Crops and Livestock
1. Pre-green revolution 1951–52 to 1967–68 3.69 2.54 2.652. Green revolution period 1968–69 to 1980–81 3.52 2.44 2.723. Wider technology dissemination period 1981–82 to 1990–91 5.40 3.52 3.654. Early reforms period 1991–92 to 1996–97 5.69 3.66 3.685. Ninth Plan 1997–98 to 2001–02 5.52 2.50 2.496. Tenth Plan period 2002–03 to 2006–07 7.77 2.47 2.51
of which 2002–03 to 2004–05 6.60 0.89 0.892005–06 to 2006–07 9.51 4.84 4.96
Source: National Accounts Statistics 2008 (New Series), Central Statistical Organization, Ministry of Statistics and ProgrammeImplementation, New Delhi.
TABLE 1.2Growth Rates of National State Domestic Product (NSDP) from Agriculture
(States Ranked by % of Rainfed Area)
State Growth Rate in Rainfed State Growth Rate in RainfedNSDP Agriculture (%) NSDP Agriculture (%)
1984–85 to 1995–96 to 1984–85 to 1995–96 to1995–96 2004–05 1995–96 2004–05
1 2 3 4 5 6 7 8
Punjab 4.00 2.16 3 Gujarat 5.09 0.48 64Haryana 4.60 1.98 17 Rajasthan 5.52 0.30 70Uttar Pradesh 2.82 1.87 32 Orissa –1.18 0.11 73Tamil Nadu 4.95 –1.36 49 Madhya Pradesh 3.63 –0.23 74West Bengal 4.63 2.67 49 Karnataka 3.92 0.03 75Bihar –1.71 3.51 52 Maharashtra 6.66 0.10 83Andhra Pradesh 3.18 2.69 59 Kerala 3.60 –3.54 85All-India 3.62 1.85 60 Assam 1.65 0.95 86
Source: National Accounts Statistics, (State Series) Central Statistical Organization, Ministry of Statistics and Programme Implementa-tion, New Delhi.

Agriculture 5
Ninth Plan because, as was noted in the MTA, growthplummeted to below 1% during its first three years,that is from 2002–03 to 2004–05. There has been someupturn since then and growth has averaged more than4% in the subsequent two years, with early indicationsthat this is likely to be maintained in 2007–08 also. Thisrevival gives hope that at least some of the causesof recent poor agricultural performance are beingreversed and that the Eleventh Plan target, set at 4%,may actually be attainable.
1.6 The improved performance in the second half ofTenth Plan is a welcome development, but there is noreason for complacency. Not only is the period tooshort to reach firm judgment on trends, the prolongeddeceleration over several years has meant that despitethe improvements, per capita output of cereals, pulses,oilseeds, and also of some major vegetables and fruits(e.g., potatoes and bananas) in 2006–07 remainedbelow 1996–97 levels. Moreover, despite significantimports, food prices flared up in 2006. This was un-like during 2000–05 when, although production waseven lower, prices remained subdued because of lowdomestic demand and depressed world prices. Partof the recent production upturn is clearly price-led,following a marked hardening of world commodityprices and possibly also responding to the fact thatdomestic food demand has responded positively tohigher overall GDP growth and the introduction ofRural Employment Guarantee. However, althoughimportant in the short-run, such price response alonecannot be the basis of sustained agricultural growth
at 4%. The recent trend towards diversion of food cropsfor biofuels in surplus countries means that foodsecurity needs a stronger production response basedon tackling supply side problems in the foodgrainssector.
1.7 The supply side performance of agriculture is af-fected by a large number of factors, several of whichinteract among each other. These factors are the natu-ral resource base (including rainfall), technology, in-frastructure (including irrigation), and the economicenvironment comprising price signals and institutions(Table 1.4). Analysis by the Steering Group for the Elev-enth Plan has identified technological change (usingyield potential of varieties of major crops released bythe National Agricultural Research System [NARS] asa proxy), public investment (including investment onirrigation), and diversification (represented by areaunder fruits and vegetables) as the most importantproximate determinants of growth. The SteeringGroup analysis shows (Table 1.4) that progress on firsttwo of these factors slowed down from early 1990s.However, the negative effect in growth was offset byprivate investment, which was the fourth most impor-tant factor in the analysis, because the terms of trade,which affect profitability and thus private investment,improved during 1990–97. As a result, growth contin-ued to be relatively high in this period. However, termsof trade turned against agriculture from 1999–2000to 2004–05 and reduced profitability of farming quitesharply. This occurred partly because of low domesticfood demand and partly because removal of quota
TABLE 1.3Growth Rate in Output of Various Sub-sectors of Agriculture
(Gross Value of Output at 1999–2000 Price)
Period Cereals Pulses and Fruits and Other All Livestock FisheryOilseeds Vegetables Crops Crops
1951–52 to 1967–68 4.19 2.98 2.67 2.42 3.00 1.02 4.681968–69 to 1980–81 3.43 0.97 4.82 2.98 3.00 3.26 3.081981–82 to 1990–91 3.52 5.41 2.84 1.71 2.97 4.78 5.74 1991–92 to 1996–97 2.36 2.92 6.07 2.18 3.09 4.00 7.05Ninth Plan 1997–98 to 2001–02 1.49 –1.43 4.11 3.82 2.25 3.53 2.63Tenth Plan 2002–03 to 2006–07 1.28 4.29 2.97 3.58 2.46 3.69 3.23of which 2002–03 to 2004–05 –1.27 5.95 0.30 1.57 0.42 3.32 1.772005–06 to 2006–07 3.52 1.61 6.97 6.59 5.53 4.23 5.49
Source: New Series of National Accounts Statistics, Central Statistical Organization, Ministry of Statistics and Programme Implementa-tion, New Delhi.

6 Eleventh Five Year Plan
restrictions under World Trade Organization (WTO)made Indian farm prices to become more aligned withcorresponding international prices at a time whenthese were in decline. Private investment in agricul-ture stagnated as a result, the area cultivated fell, anddiversification slowed down—all leading to decelera-tion. Moreover, public investment remained lowand technology generation became negligible. Cut-backs following the Fifth Pay Commission in 1997 mayhave contributed to the problem as these cutbacksseverely weakened the reach of critical support insti-tutions—notably co-operatives, seed farms, and theextension system.
1.8 An important reason for recent farm distress wasthat after improving steadily from 1980 to 1997, termsof trade turned against agriculture from 1999 and,almost for the first time in post-independent India,farm prices actually fell at the same time that farm pro-duction decelerated. This not only depressed incomes,but also increased farm debt considerably. More gen-erally, farmers are now subject to greater risk becausevariability of world prices is much higher than whatIndian farmers have been used to in the past. Thereis need to evolve a clear policy on how to deal withthis situation and some suggestions are made later inthis chapter.
1.9 In the meantime, commodity futures markets thatcan potentially reduce price variability have grownmassively in crop coverage and trading volume. AtRs 36.76 lakh crore in 2006–07, futures volumes nowfar exceed the volume of actual physical trade in agri-cultural commodities. But direct participation of farm-ers is negligible and price volatility does not appear tohave reduced. A reason why futures markets are notbeing able to perform efficiently could be that thesemarkets are very new and still in a learning phase.Quality specifications, delivery norms, margin, and lotsize of most commodities traded at the bourses makeit difficult for the average farmers to directly partici-pate in exchange trading as hedgers. There is also aneed to look at legal and regulatory regime and modifythese to enable direct farmers’ participation. For ex-ample, the passage of the Warehousing (Developmentand Regulation) Act 2006 makes possible the intro-duction of a regulated system of warehouse receiptswhich, along with investment in rural marketing in-frastructure, can improve the effective reach of futurestrading. Besides the poor direct participation of farm-ers, which is not unusual, available evidence is also thatindirect benefit through reduced spot price volatilityhas been insignificant so far and the cash–future link-age is not very strong. However, futures markets doappear to have better integrated different spot market
TABLE 1.4Trend Growth Rate in Area, Input Use, Credit and Capital Stock in
Agriculture—1980–81 to 2005–06(% per Year)
Period 1980–81 to 1990–91 1990–91 to 1996–97 1996–97 to 2005–06
Technology# 3.3 2.81 0.00Public sector net fixed capital stock 3.86 1.92 1.42*Gross irrigated area 2.28 2.62 0.51*Electricity consumed in agriculture 14.07 9.44 –0.53@Area under fruits and vegetables 5.60 5.60 2.71@Private sector net fixed capital stock 0.56 2.17 1.17*Terms of trade 0.190 0.95 –1.69*Total net fixed capital stock 2.00 2.06 1.28*NPK use 8.17 2.45 2.30Credit supply 3.72 7.51 14.37*Total cropped area 0.43 0.43 –0.10Net sown area –0.08 0.04 –0.22Cropping intensity 0.51 0.39 0.12
Note: # Yield potential of new varieties released of paddy, rapeseed/mustard, groundnut, wheat, maize, and cotton; * Upto 2003–04;@ Upto 2004–05.

Agriculture 7
prices with each other and with world prices. This canbenefit farmers by reducing local monopsony power,but it can also be problematic if the policy objectiveis to insulate domestic prices from full variability ofworld prices. Unless trade policy is broadly predict-able in advance, futures can too quickly transmit in-ternational price shocks leading to controversy andknee-jerk reactions.
1.10 Another important development of market in-stitutions is the rise of modern food retailing whichoffers the prospect of lower marketing costs and re-duced spoilage leading to lower prices for consumersand higher realization for farmers. Modern retailinghas become controversial partly because those involvedin existing trading mechanisms feel their vested inter-ests threatened. However, although there is room formutually beneficial modernization in this area and thiswill undoubtedly evolve, a legitimate area of concernis that if front-end investment outpaces the backwardlinkage with farmers, the immediate outcome may sim-ply be higher imports and lower farm prices. Clearly,efforts must be made to ensure more efficient spot andfutures markets and more rapid development of thebackward farm linkages of retailing.
1.11 An unfortunate trend over the past two decadeshas been that expenditure control efforts followingfiscal shocks such as the Pay Commissions awards haveled to cutbacks in agricultural investment and exten-sion, but not in subsidies. Budgetary subsidies to agri-culture have increased from around 3% of agricultureGDP in 1976–80 to about 7% in 2001–03. During thesame period, public investment in agriculture declinedfrom over 4% of agriculture GDP to 2%. Most of thesubsidies are on fertilizer, power, and irrigation waterand these have actually contributed to the degrada-tion of natural resources. Further, a considerableamount of Plan expenditure on agriculture is not oninvestment but on subsidies not accounted for in theabove list. Simplistic fiscal rules such as protecting Planexpenditures more than non-Plan expenditures addto the problem. For example, although the Plan sharein States’ total expenditure on agricultural and alliedsectors has improved considerably from a low justafter Fifth Pay Commission, much of this representsincrease in Plan subsidies at the cost of essential
staff, particularly in the extension system and theco-operative sector. With hindsight, it appears that thepolicy of restraining new hiring may have been exces-sive, as is evident from the age composition and highvacancies among extension staff and reduced reach ofco-operatives. Even a relatively small percentagereduction in subsidies can finance relatively largeincrease in public investment in crucial areas such assoil amelioration, watershed development, groundwa-ter recharge, surface irrigation, and other infrastruc-ture and can also allow substantial expansion in thereach of critical farm support systems.
1.12 Nonetheless, an important policy gain of recentyears is the turnaround in public investment in lateryears of the Tenth Plan, reversing years of decline.Overall capital formation in the sector is now 12% ofagricultural GDP, which is the highest in 25 years.This must have contributed to the recent upturn ingrowth. But figures in Table 1.5 also imply that Incre-mental Capital Output Ratio has risen from about 2.5to around 4. Unless efficiency of investment is restored,investment would need to increase much further, toabout 16% of agricultural GDP, to achieve the 4% ag-ricultural growth target.
1.13 In light of the above, the Eleventh Plan certainlyneeds to increase public investment further, from 3%of agricultural GDP to about 4%. But it also needsto do much more to ensure that future growth ismore efficient, sustainable, and inclusive. This can beachieved by focusing on the following:
• With availability of land and water fixed, growth inagriculture can be achieved only by increasingproductivity per unit of these scarce natural re-sources through effective use of improved technol-ogy. The research system has so far focused mainlyon breeding varieties that increase the yield poten-tial of individual crops by enabling more intensiveuse of inputs. Although such research did increasepotential yields substantially in the past, it put lessemphasis on efficient and sustainable use of soilnutrients and water, or on identifying location-specific farming systems with proper mix of cropsand livestock, especially for rain-fed areas. Besides,the potential yields of new varieties being released

8 Eleventh Five Year Plan
seem to have plateaued suggesting that the currentsystem is no longer leading to adequate outcomes.This ‘technology fatigue’ has to be countered bychanging research priorities suitably.
• At the same time, frontline trials of various researchdepartments provide clear evidence of large gapsbetween what can be attained at the farmer’s fieldwith adoption of available technology as comparedto what is obtained with existing practices. Exploit-ing this potential must be the main source of yieldgrowth in the Eleventh Plan because overcomingtechnology fatigue will take time. Moreover, sinceyield gaps vary considerably from crop-to-crop andfrom region-to-region, the strategy must enablespecific plans for each agro-climatic region. As Table1.6 shows, constraints vary considerably even by veryaggregate zones. This will also require much stron-ger links between research, extension, and farmers.
• The pressing need to accelerate agriculture growthshould not be at the cost of sustainability ofour natural resource base, which is starkly limited.Deforestation has affected both soils and waterand this is compounded by soil degradation andoverexploitation of groundwater. Besides watersheddevelopment in watersheds where agriculture isimportant, a concerted effort is needed to afforestupper catchments at higher elevations of river ba-sins. In addition to erosion, salinity, and alkalinity,soils are losing soil carbon and micronutrientsdue to irrational and unbalanced fertilizer use
(Table 1.6). This must be addressed urgently sincethis directly affects input use efficiency. The serious-ness of the problem can be seen from the fact thatnearly two-thirds of our farmlands are in some wayeither degraded or sick and only about one-third arein good health. Rapid expansion of groundwater usefor irrigation was a key factor in the relatively rapidgrowth of agriculture between the mid-1960s andlate 1980s. But further expansion should be strictlymonitored, especially in regions where aquiferlevels have dropped causing concern about futuresustainability. Action on the environmental frontcannot wait in face of a possibly looming adverseclimate change due to global warming.
1.14 For growth to be at all inclusive, the agriculturalstrategy must focus on the 85% of farmers who aresmall and marginal, increasingly female, and who findit difficult to access inputs, credit, and extension or tomarket their output. While some of these farmers mayultimately exit from farming, the overwhelmingmajority will continue to remain in the sector and theobjective of inclusiveness requires that their needsare attended to. For example, credit has grown at un-precedented rates (30% per annum) to other sectorsbut not to small and marginal land holders and womenwho lack collateral security. Besides issues such as rightsto land (especially for women), it is now well recog-nized that the poor are best empowered if they func-tion as a group rather than as individuals. Hence there
TABLE 1.5Investment in Agriculture
(Rs in Crore at 1999–2000 Price)
Year GDP from Gross Capital Formation GCF in Agriculture as %Agriculture (GCF) in Agriculture of GDP from Agriculture
Public Sector Private Sector Total Public Sector Private Sector Total
1980–81 to 1984–85 239678 12007 13132 25139 5.0 5.5 10.51985–86 to 1989–90 274034 9601 14370 23971 3.5 5.2 8.71990–91 to 1994–95 325957 7915 19348 27263 2.4 5.9 8.41995–96 to 1999–2000 383330 7724 22631 30354 2.0 5.9 7.92000–01 407176 7155 31872 39027 1.8 7.8 9.62001–02 433475 8746 39468 48215 2.0 9.1 11.12002–03 398206 7962 38861 46823 2.0 9.8 11.82003–04 441360 9376 35457 44833 2.1 8.0 10.22004–05 441183 12273 36835 49108 2.8 8.3 11.12005–06 468013 15006 39899 54905 3.2 8.5 11.72006–07 485939 17749 43013 60762 3.7 8.9 12.5
Source: National Accounts Statistics 2008 (New Series), Central Statistical Organization, Ministry of Statistics and ProgrammeImplementation, New Delhi.

Agriculture 9
is a need to encourage a ‘group approach’ for the poorand for women to reap economies of scale and beeffective farmers. A group approach could also improvethe bargaining power of small cultivators in contractfarming. The few examples where small and marginalfarmers have benefited from contract farming arethose where they have entered into contracts collec-tively rather than individually. In Punjab, MahindraShubhlabh Services Ltd followed this approach formaize farming with a number of safeguards for riskprotection, etc., built in. Again in South India, theUnited Planter’s Association of South India signedcontracts with women’s self-help groups (SHGs) fortea cultivation. One way forward to encourage mar-ginal farmers and women to form groups for purposesof farming would be to shift at least some of the cur-rent subsidies to be available only to groups of suchfarmers rather than to individuals.
TENTH PLAN OUTLAYS AND EXPENDITURE1.15 Against the projected Tenth Plan outlay ofRs 58933 crore on agriculture and allied sectors, theutilization is about the same as outlay in current pricebut likely to be only around 84% at the 2001–02 price.The utilization in the case of irrigation and floodcontrol sector is also of the same order, that is 85%. Inboth the cases, much larger shortfalls in the first two
years of the Plan were made up in subsequent years.Plan outlays in agriculture and allied sectors and inirrigation and flood control for the Centre, States, andunion territories (UTs) are presented in Annexure 1.1.
1.16 The progress of outlay and expenditure duringthe Plan period for the three departments of the UnionMinistry of Agriculture (MoA), namely, the Depart-ment of Agriculture and Co-operation (DAC), theDepartment of Animal Husbandry, Dairying, andFisheries (DAHDF), and the Department of Agricul-tural Research and Education (DARE) is given inTable 1.7.
1.17 As may be seen, a substantial increase in outlaywas provided to the Ministry of Agriculture since 2004–05 taking the Central Government’s share of total planexpenditure on agriculture and allied sectors (Centreand States) from 33% in 2002–03 to 44% in 2006–07.The Ministry has introduced several new programmesduring Tenth Plan aimed at diversification of agricul-ture, strengthening technology validation, demonstra-tion and dissemination, water saving, and developmentof infrastructure. These include:
• The National Horticulture Mission (NHM) ap-proved by the Cabinet Committee on Economic
TABLE 1.6Region-specific Factors Causing Low Productivity
Agro-climatic Region States/Parts of States Region-specific Constraints
Western Himalayan region-I J&K, HP, Uttaranchal Severe soil erosion, degradation due to heavy rainfall/floods anddeforestation, low SRRs, poor road, poor input delivery, inadequatecommunication infrastructure and marketing
Eastern Himalayan region-II Assam, NE States, Sikkim Aluminium toxicity and soil acidity, soil erosion and floods, shiftingcultivation, low SRRs, non-availability of electricity, poor road, poorinput delivery system and communication infrastructure
Lower and middle gangetic West Bengal, Bihar, Flood/water logging, improper drainage, salinity/alkalinity, arsenicplains regions-III and IV Eastern UP contamination, low SRRs, non-availability of electricity, high popula-
tion growth, poor road and communication infrastructure
Upper and trans-gangetic Western UP, Punjab, Groundwater depletion, decreasing total factor productivity, micronu-plains region-V and VI Haryana trient deficiency, non-availability of electricity, and high population
density
Eastern plateau and hills Orissa, Jharkhand, Moisture stress, drought, and soil acidity, iron toxicity, low SRRs, non-region-VII Chhattisgarh availability of electricity, high population growth, poor road, poor
input delivery and communication infrastructure
Source: Cited in Report of the Working Group of Sub-Committee of National Development Council on Agriculture and Related Issueson Region/Crop Specific Productivity Analysis and Agro-Climatic Zones, Planning Commission, Government of India (February 2007).

10 Eleventh Five Year Plan
Affairs (CCEA) on 19 May 2005 became operationalduring 2005–06.
• The government approved a Centrally sponsored‘Micro Irrigation’ programme to help spreadthe network of water-saving implements suchas sprinkler and drip irrigation throughout thecountry.
• A National Gender Resource Centre in Agricul-ture was set up in the directorate of extension as afocal point for convergence and co-ordination ofgender-related issues within the DAC.
• Jute Technology Mission was approved in June2006.
• The National Agricultural Innovation Project waslaunched by the Indian Council for AgriculturalResearch in July 2006. A National Fund for Basicand Strategic Research in Agricultural Scienceshas also been set up in 2005–06. Both these willsupport agricultural research in project mode.
• The National Fisheries Development Board (NFDB)was formally set up at Hyderabad in September 2006with the main objectives of bringing major activi-ties relating to fisheries and aquaculture for focusedattention and professional management.
• A new Centrally sponsored scheme (CSS) ‘NationalMission on Bamboo Technology and Trade Devel-opment’ was approved in October 2006.
• The government decided to set up a Krishi VigyanKendra (KVK) in each rural district (578) in thecountry. So far over 537 KVKs have been established.
These Kendras disseminate farm technologies tofarmers and provide training to enhance the pro-ductivity and hence the income earning capacity ofthe farmers.
• Technology dissemination efforts are beingstrengthened further by establishing AgricultureTechnology Management Agencies (ATMAs), whichare autonomous bodies for extension planning andreform, in 252 districts. These will be extended toall rural districts.
• The National Rainfed Area Authority (NRAA) wasconstituted as an expert body to bring technical fo-cus to problems of rainfed agriculture and to ad-vise on design and convergence of various watersheddevelopment schemes.
• The Constitution (106th) Amendment Bill 2006 inrespect of co-operatives was introduced in LokSabha on 22 May 2006.
• The government approved a rehabilitation packageamounting to Rs 16978.69 crore for the farmers indistress in 31 selected districts in the four States,namely, Andhra Pradesh, Karnataka, Kerala, andMaharashtra. The package comprises relief fromthe Prime Minister’s Relief Fund, strengtheninginstitutional credit support, irrigation develop-ment, promotion of micro irrigation, watersheddevelopment, extension services, enhancing seedreplacement rate (SRR) and income augmentationthrough horticulture, livestock, and fishery in thesedistricts.
TABLE 1.7Outlay and Expenditure of Ministry of Agriculture during the Tenth Five Year Plan
(Rs Crore)
Current Price 2001–02 Price
S. No. DAC DAHDF DARE TOTAL DAC DAHDF DARE TOTAL
1. Tenth Plan outlay (2002–07)* 13200.00 2500.00 5368.00 21068.00 13200.00 2500.00 5368.00 21068.002. 2002–03 (Expenditure)# 1655.94 238.90 650.75 2536.95 1593.9 221.6 626.4 2441.93. 2003–04 (Expenditure)# 2050.34 271.76 748.98 3068.67 1901.4 249.8 694.6 2845.84. 2004–05 (Expenditure)# 2656.26 566.22 816.01 4035.72 2360.2 500.6 725.1 3585.95. 2005–06 (Expenditure)# 3817.46 589.37 1046.75 5453.37 3247.5 501.2 890.4 4639.26. 2006–07 (RE)# 4860.00 679.32 1430.00 7040 3909.1 603.2 1150.2 5662.57. Total expenditure 15040.00 2345.57 4692.49 22134.71 13012.1 2076.5 4086.7 19175.48. Total expenditure as % of 114% 94% 87% 105% 99% 83% 76% 91%
Tenth Plan outlay9. 2007–08 BE 5520.00 910.00 1600 8030 – – – –
Note: RE = Revised Estimate, BE = Budget Estimate.Sources: * Tenth Five Year Plan (2002–07), Planning Commission, Government of India; # Union Expenditure Budgets, Vol. I, Ministryof Finance, Government of India, from 2002–03 to 2007–08.

Agriculture 11
AREAS OF CONCERN IN IMPORTANTEXISTING PLAN SCHEMES1.18 Among major ongoing schemes of DAC, the larg-est is the Macro Management Scheme (MMA) whichwas initiated in 2000–01 by integrating 27 CSS so as toprovide flexibility to the States to develop and pursuea mix of activities on the basis of their regional priori-ties. The approved pattern of assistance is in the ratioof 90:10 for the Centre and the States, respectively,except in the case of North Eastern States that get 100%Central assistance. With the launching of NHM in theyear 2005–06, 10 schemes pertaining to horticulturedevelopment were taken out of the purview of thisscheme. An evaluation of the scheme (in August 2004)by three institutions, namely, the Indian Institute ofManagement, Kolkata, the National Bank for Agricul-ture and Rural Development (NABARD) ConsultancyServices Limited, and the Agricultural Finance Corp.Ltd brings out that the objective of flexibility wasachieved but the work plans prepared by the Statesdid not necessarily originate from the grass root level.These were generally prepared in a top-down process,and often did not reflect State priorities, thrust areas,and the initiatives for agricultural development. Fur-ther, there appeared to be lack of co-ordination amongdifferent departments. The funds were mainly retainedby the nodal department, that is the Agriculture De-partment, resulting in neglect in some of the States ofthe schemes that were in the areas of Natural ResourcesManagement and Co-operative Departments.
1.19 The Technology Mission on Oilseeds, Maize, Oilpalm, and Pulses is being implemented for two decadesfor oilseeds. Pulses, oil palm, and maize were broughtunder the ambit of the mission in 1990–91, 1992,1995–96. Although there has been a fairly substantialincrease in production of oilseeds since its inceptionin 1986, domestic production of oilseed is short of thedemand of edible oils in the country. The pulses pro-duction in the country has continued to be stagnantfor decades suggesting that the pulses mission has notbeen effective.
1.20 Crop insurance was introduced in the countrytwo decades ago. The present version, the NationalAgricultural Insurance Scheme (NAIS) has beenavailable since 1999–2000. The Scheme’s coverage is
limited to a few States and a few crops only. If NAIS isto be retained, it is important to impart a measure ofpermanency to the Scheme by shifting it to non-Plan,with banks that are its principal beneficiaries contrib-uting to the subsidy. If so, new additional actuarialschemes with subsidy on premia, involving larger num-ber of service providers and wider menu of insuranceproducts, can be considered for Plan financing. Somefurther details of agricultural insurance have beendiscussed later in the chapter.
1.21 The National Project on Cattle and BuffaloBreeding is the flagship scheme of DAHDF. Initiatedin October 2000 for a period of 10 years, this envis-ages genetic upgradation of indigenous cattle and buf-faloes, development and conservation of importantindigenous breeds, and to evolve sustainable breedingpolicy. The project is being implemented by StateImplementing Agencies (SIAs) in 26 States and 1 UT.This scheme suffers from many shortcomings, particu-larly quality of progeny bulls and inadequate atten-tion to tagging and registry. Further, feed and fodderare a perennial problem for exotic breeds and effortsmade during the Tenth Plan to improve feed and fod-der resources for livestock were not very successful.The performance of the Central Fodder DevelopmentOrganization was evaluated by The Centre for Man-agement Development, Thiruvanthapuram and foundto be unsatisfactory. Moreover, with the completionof ‘Operation Flood’ Project by National Dairy Devel-opment Board (NDDB), the pace of investment indairy sector has slowed down. The allocation for dairydevelopment by the Central and State Governmentshas also diminished over the last two plans. Assistancefrom Government of India under CSS, Intensive DairyDevelopment Programme, has gone to non-viableareas without conducting proper feasibility studiesand has been implemented without proper technicalsupervision. Delicensing and the subsequent decisionto do away with the concept of milk sheds wereexpected to boost private sector investment in dairy-ing, but this has not happened. Furthermore, thereappears to have been no concentrated efforts to investin technology for development of value-added andinnovative milk products. Consequently, in the firstfour years of the Tenth Five Year Plan, the growth rateof milk has been less than 3% per annum.
12 Eleventh Five Year Plan
CHALLENGES FOR THE ELEVENTH PLAN
AGRICULTURAL RESEARCH1.22 The major challenges facing us in formulatingpolicy for the Eleventh Plan are discussed below.
1.23 The DARE has an extensive network comprising48 Central Institutes, 5 National Bureaux, 12 ProjectDirectorates, 32 National Research Centres (NRC),and 62 All-India Co-ordinated Research Projects(AICRP). It also supports research and education in41 State Agriculture Universities, 5 Deemed Universi-ties, and 1 Central Agriculture University. DuringTenth Plan period 2 Indian Council of AgriculturalResearch (ICAR) institutes, 1 National Bureau,3 Project Directorates, and 10 State Agricultural Uni-versities (SAUs) have been established. Over the years,its co-ordinated trials have helped the nation improvevarieties of sugarcane, rice, wheat, maize, sorghum,groundnut, mustard, etc., considering the ecologicalvariations with respect to each crop. However, twoglaring features are now obvious. First, the productiv-ity achieved on farms has fallen short of those inthe field trials. Clearly, the KVKs that have the man-date of technology validation and transfer have notdelivered their full potential. Second, as observedearlier, there is some evidence of technologicalfatigue in terms of yields obtainable with the newestvarieties being delivered by the NARS. Since access tointernational research is now much more circum-scribed by intellectual property rights (IPRs), thiswill have to be addressed largely by toning up NARScapacity.
1.24 The following are critical research gaps:
• Integrating methods of traditional and modernbiology giving attention to both yield and qualityaspects.
• An orientation of public sector research in ‘hybriddevelopment with commercial viability’ has to bereintroduced on a mission mode at least in cropslike pigeon pea, soybean, and mustard.
• Indigenous plant types that inherently possess genesresponsible for higher nutritive value (more pro-tein, micronutrients, etc.) need to be identified andused for enriching nutrients in rainfed crops.
• The implications of climate change on agricultureand vice versa need to be studied and a dedicatedresearch programme should be initiated to combatglobal warming.
• A major research thrust is warranted in areas ofbalanced and site-specific nutrient supply and effi-cient water management strategies.
• Integrated Pest Management (IPM) needs greateremphasis. The existing package of practices is notfully integrated between various plant protectionsciences. This results in duplication, overlapping aswell as unrealistic recommendations in the nameof IPM. There is a need for interdisciplinary researchin plant protection to elucidate basic issues of her-bivory as well as to develop suitable mitigations.
• In horticulture, the research agenda needs toemphasize survey of indigenous biodiversity forresistance to various biotic and abiotic stressesfor improvement in production, productivity, andquality of produce.
• In livestock, there is an urgent need to reorientresearch and assess the genetic potential of indig-enous breeds. Intensive research work needs to beundertaken for genetic identification of traits ofexcellence in Indian breeds, such as Jaffarabadibuffalo, Black Bengal goat, Garole sheep, etc., andidentify the functional genomics associated withtheir traits of excellence.
• With endemic shortage of animal feeds, researchshould explore technologies to augment feed re-sources, including genetic modification of micro-organism to utilize high lignin forage grasses.
• With large quantities of animal products nowbeing produced, research on process technologies,value addition, packaging, storage, transportation,and marketing should receive high priority. Inthe absence of a proper slaughter regime, there isconsiderable wastage and an effective package ofpractices for management of slaughterage needsto be evolved. Prevention of animal losses due todisease should be the major area of focus with em-phasis on development of diagnostic kits and vac-cine. The health of the human population isintimately connected to the health of the animalwith several fatal and debilitating diseases beingcommon to both man and animal. Serious atten-tion to animal health care, disease diagnosis, and
Agriculture 13
prophylactics will go a long way in ensuring humanhealth also.
• Overall, there is a need to identify integrated farm-ing systems in different agro-ecological regions,internalizing synergies of different components toenhance resource utilization, income, and livelihoodgeneration and minimize environmental loading.
1.25 It is necessary to take a comprehensive view ofthe functioning of the agricultural research system andmake systemic changes in the course of the EleventhPlan. Thus far, research has tended to focus mostly onincreasing the yield potential by more intensive useof water and bio-chemical inputs. Far too little atten-tion has been given to the long-term environmentalimpact or on methods and practices for the efficientuse of these inputs for sustainable agriculture. Thesefeatures are widely known but efforts to correct themhave not been adequate; at any rate they have notmade much of a difference.
1.26 Agricultural research is underfunded but lack ofresources is not the only problem. Available resourcesalso have not been optimally utilized because of lackof a clearly stated strategy that assigns definite respon-sibilities, prioritizes the research agenda rationally, andrecognizes that the research mode is not always bestsuited for product development and delivery:
• Dominance of commodity-based research and de-velopment (R&D), that is lack of a holistic approachinvolving a matrix of farm enterprises.
• Strict compartmentalization of R&D agencies, i.e.,lack of effective bilateral flow of information amongresearch, extension, and implementation depart-ments.
• Lack of large-scale on-farm validation of techniquesand feedback thereon, leading to practically noscope for their refinement.
1.27 As far as possible, ICAR institutes should mainlyundertake basic, strategic, and anticipatory researchin line with national priorities, while SAUs do appliedand adaptive research addressing location-specificproblems, with complementarities also found betweenthe public and private sectors in product development.A distinction also needs to be made between basic
research which has knowledge advancement and sci-entific curiosity as its major focus and strategic researchwhich is aimed at well-defined researchable problemswhich are of high development priority and worthyof multi-discipline and multi-institution effect on amission mode.
1.28 A major paradigm shift is needed to transformthe present commodity-based research to a systemsapproach. Since farm-level problems are specific toagro-climatic zones (ACZs), what is needed is a con-vergence between R&D agencies within individualACZs so as to bring region-specificity in technologiesand their time-bound assessment. This requires aseven-step mechanism:
• Problem identification and prioritization;• Convergence of existing technologies to match the
need;• Generation of need-based viable technologies
using the holistic farming system approach;• On-farm assessment and evaluation;• Feedback on the technologies;• Refinement of technologies, if necessary;• Ensuring timely availability of inputs.
1.29 This kind of approach will help in establishing aresearch-development-technology transfer continuuminvolving all stakeholders.
1.30 SAUs are the key to regionally relevant researchand for generating quality human resources. Unfor-tunately, SAUs are so poorly funded by their own StateGovernments that some are in chronic overdraft, onlya quarter are accredited, and almost all rely mainlyon ICAR funding for research. This situation, whereStates still provide salary and establishment costs butSAUs look to ICAR for other funds, not only affectstheir education function adversely but it also distancesSAUs from State Agricultural Departments and reducesrelevance of their research for local problems. Thus,although Central support for revamping SAUs isjustified, this is likely to be effective only where Statesrecognize the value of agricultural education andresearch. An important criterion for identifyingSAUs for support from the Centre should be theinvestment that the State itself is making. Moreover,

14 Eleventh Five Year Plan
the biggest problem with NARS remains that it isstrictly governed by the same rules and regulationsrelating to expenditure and filling up of positions asoperative in government departments of States and theCentre. This robs the system of flexibility and discre-tion which are essential for healthy functioning ofscientific institutions.
EXTENSION1.31 Frontline demonstrations of various depart-ments provide clinching evidence of large gaps betweenwhat can be attained at farmers’ fields with the adop-tion of improved technology and what is obtained withthe existing practices followed by the farmers. This isa clear pointer to the large potential for raising outputthrough the effective dissemination of technology, es-pecially in the eastern Gangetic plains. But this is nothappening because of the absence or weak research–extension–farmer linkages. While technologies moreadaptable to wider regional variations are required,effective extension remains vital for realization of dem-onstration trials yields at farmers’ field on a large scale.
1.32 The challenge before extension agencies is howto deliver knowledge to all farmers, and especially howto involve and motivate the resource-poor farmers witha holding size below 1 hectare to take command oftheir situation and reduce the innovation adoptionperiod. Given the meagre marketable surplus at indi-vidual farmer level for small farmers, there is need toorganize the farmers around the commodity for get-ting them the benefits both mutually within the com-munity and in interaction with external agenciessupporting the development process. Developingfarmer’s organizations and federating them at block/district/State level and linking their economic activi-ties with the market assumes special significance as ithelps to attain the power of scale economies and col-lective bargaining to the advantage of farmers.
1.33 Public extension system has a key role in educat-ing farmers and helping them to take right decisions.In this context, it is to be noted that extension shouldbe treated as a service delivery mechanism and not beviewed as a revenue-generating programme. Hence,the principles governing business models of revenue-generating programmes should not be made applicable
for extension services. Adequate fund allocation toreach large number of small and marginal farmers byextension agency is essential. Infrastructure below dis-trict level is needed to support capacity building offarmers. In view of the above, it is essential to upscalethe ATMA to all 588 development districts by incor-porating the modifications and taking considerationof all the pre-requisites to meet the emerging andimminent changes in the context of ‘Wake up Call’given by the National Commission on Farmers and‘Regaining Agricultural Dynamism’. These provisionsare expected to enhance the acceptability of the schemeby States and effective operationalization of the schemein original spirits.
1.34 There are many extension service providers in thefield, providing different kinds of useful services suchas information and service support to farmers. They areState Government and Central Government agencies,agri-business companies, agripreneurs, input dealers,manufacturing firms, non-governmental organizations(NGOs), farmers’ organizations, and progressive farm-ers. There is duplication of efforts with multiplicity ofagents attending extension work without convergence.There should be co-ordinated attempt to synergize andconverge these efforts at the district level and below toimprove the performance of various stakeholders. It isessential to route all the State and Central Governmentextension funds through single agency like ATMA foreffective utilization of crucial resources.
1.35 At zonal level, institutions like Zonal ResearchStations and line departments need to prepare a zonalagricultural development strategy through consulta-tive approach. At district/block/village level, the keyinstitutions such as KVK, ATMA, and farmers’ orga-nizations need to have a close link with each other fortechnology assessment, refinement, and for creating aplatform between farmers’ organization and marketopportunities. The research and extension agenda ofthe district needs to be set by multi-disciplinary teaminvolving scientists, extension workers, farmers,and other stakeholders who would ensure research–farmer–extension–market linkage.
1.36 Public–private partnership (PPP) in extensionhas to be promoted for convergence and sharing of

Agriculture 15
resources. Horizontal expansion of private sector in-creases through partnership with the public extensionsystem, while vertical expansion of public extensionincreases through partnership with the private sector.The potential private extension service providers couldbe identified and made partners in PPP mode foreffective management of services and for nurturing aplurality of institutions. Under extension reform, mini-mum 10% of the fund allocation is made to undertakeextension activities through private extension agencies.This needs to be continued and, where appropriate,even expanded by framing suitable guidelines.
PRICE POLICY1.37 Pricing policy concerns arising from the volatil-ity of international prices need to be addressed. Inperiods of falling international prices, as for examplein the case of edible oils after the East Asian crisis, farm-ers experience income losses although consumersbenefit. In a period of rising international prices, asfor example in the case of wheat at present, farmersstand to benefit but consumers lose. It is logical forgovernment to want to balance producer and con-sumer interests and this can be done through carefulcalibration of import duties and minimum supportprices (MSP) . Our policy has not been entirely con-sistent in this respect. For example, import duties onedible oils were lowered in the mid-1990s when inter-national edible oil prices were high, but they were notadjusted when edible oil prices declined sharply after1997. Domestic producers of oil seeds experienced asubstantial price shock. The reaction to the recent in-crease in wheat prices has been different in the sensethat farmers did not experience the full benefit ofhigher prices because efforts were made to protect con-sumer interests by wheat imports for the public distri-bution system (PDS) that were undertaken at what areimplicitly subsidized rates.
1.38 A symmetric approach would be to moderateprice fluctuation both for upswings and downswings.This requires a clear understanding of how to calibrateimport tariffs and the MSP depending upon how in-ternational prices move. For downward movementsin international prices beyond a certain level, importtariffs should be adjusted automatically to stabilizeCost, Insurance, and Freight prices. No change needs
to be made in the MSP once announced, but persis-tence of high or low prices internationally should betaken into account by the Commission for Agricul-tural Costs and Prices (CACP) to adjust the MSP forthe next year. As a general rule, we should not imposebans on exports but rely only on export taxes to easedomestic price pressure by moderating export if thisis felt to be needed. In case international prices risesharply, there is a case for lowering tariffs. In suchsituations, for food products supplied through thePDS, there is a case for offering a bonus on the MSPbefore the marketing season begins to ensure adequatesupplies for the PDS. This could be supplemented byimports on the government account for meeting PDSrequirements and/or rebuilding depleted stocks. Thisamounts to a targeted subsidy for PDS consumers. Ifhigh international prices continue, the CACP shouldtake this into account in fixing the MSP for nextyear. An important feature of the system must be thatincreases in import tariffs in periods of low interna-tional prices must be accompanied by a simultaneousupward revision of duty drawback rates to ensure thatexporters are not hurt. This is essential in cases suchas cotton where the absence of such adjustment wouldhurt the competitiveness of our textile or garmentexport. A coherent policy along these lines wouldprovide an internally consistent and predictable wayfor dealing with international price volatility in amanner which balances producer, consumer, andexporter interests.
SOIL HEALTH MANAGEMENT ANDFERTILIZER SUBSIDY1.39 Soil degradation through use of agro-chemicalsis a serious issue that needs to be addressed on a prior-ity basis during Eleventh Plan. Imbalanced use ofchemical fertilizer has led to declining fertilizerresponse in the fertile irrigated regions. Excess use ofsome nutrients, driven in part by imbalanced subsi-dies, has led to depletion of other nutrients from thesoil leading to deterioration of the soil health. Thenature and extent of problem differ in different of partsof the country.
1.40 Lack of knowledge on the part of the farmersabout the importance of soil health and informationabout the status of the soil on his particular farm is an

16 Eleventh Five Year Plan
important constraint. Soil health cards, giving regu-larly updated information on major and micro nutri-ent, should be issued to all the farmers. This wouldrequire strengthening of soil testing labs in all parts ofthe country and expanding their testing capacity tocover micro-nutrients as well. Initial capital investmentwill have to be made by the government and subse-quent maintenance may be funded out of the fee tobe charged for the services rendered by these labs.The PPP mode can be explored wherever possible toexpand reach and ensure accountability.
1.41 The present system of fertilizer subsidy is irra-tional and has become counter-productive. Fertilizeris sold at almost the same controlled price throughoutthe country. However, because nitrogenous fertilizersare subsidized more than potassic and phosphatic fer-tilizers, the subsidy tends to benefit more the crops andregions which require higher use of nitrogenousfertilizer as compared to the crops and regions whichrequire higher application of potassic and phosphaticfertilizers. The imbalance in the use of nitrogen–phos-phorus–potassium (NPK) brought about by distor-tions in prices ratio in favour of nitrogenous fertilizeris creating serious problem of soil degradation andadversely affecting productivity. Balanced use of fer-tilizer can be achieved either by redistributing thepresent amount of fertilizer subsidy over NPK in amanner which is nutrient neutral or by increasing sub-sidy on P and K in such a way that farmers are in-duced to use NPK in the right proportion. The pricecontrol system also discourages producers from add-ing micro-nutrients to standard fertilizer eligible forsubsidy because the controlled price parameter forthat fertilizer cannot be adjusted to cover the cost ofmicro-nutrient added. Immediate steps should betaken to allow the major producers to charge costs for
adding micro-nutrients. Many of the micro-nutrientsare also reserved for small-scale production. Thissegment should be dereserved in the interest of theagricultural community.
SEEDS1.42 Seed management is a very crucial element forgrowth in productivity and the present situation ishighly unsatisfactory. There is practically no changein the SRR in the States of Orissa, Bihar, Uttar Pradesh,Jharkhand, Assam, Madhya Pradesh, and Chhattisgarh.At present the SRRs in respect of various crops indifferent States are still relatively low and need to beraised. The desirable SRRs, without which it is notpossible to achieve higher productivity, are 25% forself-pollinated crops, 35% for cross-pollinated crops,and 100% for hybrids.
1.43 Production of breeder seeds, foundation seeds,distribution of certified seeds for the year 2004–05to 2006–07 as compared to those in the trienniumending 1996–97 and 2001–02 are given in Table 1.8.Although the production of breeder seeds has in-creased significantly, the production of foundationseeds has not. There is a large increase in the distribu-tion of certified seeds but the quality of these seeds isoften questioned by farmers.
1.44 There are missing links in the seed productionsystem. There is very little focus on hybrid seed pro-duction in public sector. However the private sectorhas expanded to fill the gap. The private sector seedindustry in India is growing appreciably and has madesignificant contributions to BT cotton, hybrids ofmaize, rice, sunflower, etc. As shown in Table 1.9,the share of private sector in seed production is in-creasing whereas that of public sector is decreasing.
TABLE 1.8Production and Distribution of Seeds
Programme Use/Production in Triennium Ending
Unit 1996–97 2000–01 2004–05 2005–06 2006–07
Production of breeder seeds Thousand Qts 43.72 44.27 66.46 64.88 73.83Production of foundation seeds Lakh Qts 6.45 5.77 6.90 7.40 8.00Distribution of certified/quality seeds Lakh Qts 79.01 86.41 120.26 126.74 191.98
Source: Report of the Working Group on Crop Husbandry, Agricultural Inputs, Demand and Supply Projections and Agricultural Statis-tics for the Eleventh Five Year Plan (2007–12), Planning Commission, Government of India (December 2006).

Agriculture 17
During the Tenth Plan the private seed supply had over-taken the seed sourcing from public sources. However,not surprisingly, the private sector remains absent inthe production of seeds of self-pollinating varieties.
HORTICULTURE1.45 While the first few Five Year Plans assigned pri-ority to achieving self-sufficiency in foodgrain produc-tion, over the years, horticulture has emerged as anindispensable part of agriculture, offering a wide rangeof choices to the farmers for crop diversification. Italso provides ample opportunities for sustaining largenumber of agro-industries which generate substantialemployment opportunities. The horticulture sectorcontributes around 28% of the GDP in agriculturefrom about 13.08% of the area. It also provides 37%of the total exports of agricultural commodities.The sector encompasses a wide range of crops namelyfruit crops, vegetables crops, potato and tuber crops,ornamental crops, medicinal and aromatic crops,spices, and plantation crops. New introductions suchas mushroom, bamboo, and bee keeping (for improv-ing the crop productivity) has further expanded thescope of horticulture.
1.46 India accounts for an area of 4.96 million hect-ares (MH) under fruit crops with a production of 49.29million metric tonnes (mt). During the period 1991–92 to 2001–02 growth in area, production, and pro-ductivity of fruits was observed at the rate of 3.4%,4.2%, and 0.7%. Area growth accelerated between2001–02 and 2004–05 to 7.37% but with negligible ac-celeration in production growth. Among variousStates, Maharashtra ranks first and contributes 27%in area and 21.5% in production. Andhra Pradesh
ranks second in area and production contributing 13%and 16% of fruits. The maximum productivity wasobserved in Madhya Pradesh (22.6 mt/hectare),followed by Tamil Nadu (19.9 mt/hectare), Gujarat(15.9 mt/ hectare), Karnataka (15.9 mt/hectare), andWest Bengal (12.8 mt/hectare). The growth in produc-tivity was maximum (5%) in Kerala from 1991–92 to2001–02 while it was 10.2% in Uttar Pradesh from2001–02 to 2004–05.
1.47 Total vegetable production in India before inde-pendence was 15 million mt and since Independencefor decades the growth rate was stabilized around 0.5%.The impetus on vegetable research and policy inter-vention to promote vegetable crops witnessed a sud-den spurt in growth rate of 2.5%, a hike of five timesduring the last decade. The potential technologicalinterventions with improved gene pool and precisemanagement can take growth rate to nearly 6% perannum. The area under vegetables increased from5.59 MH in 1991–92 to 6.76 MH during 2004–05.The production in this period increased from 58.53million mt to 101.43 million mt. During the period,productivity of vegetables increased from 10.5 mt/hectare to 15.0 mt/hectare. While West Bengal contin-ues to be the leading State in area and production, theproductivity is higher in Tamil Nadu followed by UttarPradesh and Bihar.
1.48 India is the second largest producer of flowersafter China. The traditional flower sector registeredan impressive growth during the Eighth, Ninth, andTenth Plan periods and grew from 71000 hectares atthe end of the Eighth Plan period to 106000 hectaresby the end of the Ninth Plan. During the Tenth Planan additional 10000 hectares has been brought underthe traditional flowers sector by the end of 2004–05 toregister an overall area of 115921 hectares. The pro-ductivity per hectare is the highest in Bihar (17.05 mt)followed by Haryana (11.55 mt). On the other hand,the productivity of flowers is the least in Rajasthan(0.59 mt). The overall productivity of the country dur-ing 2004–05 was recorded at 5.64 mt. Nearly 77% ofarea under floricultural crops is concentrated in sevenStates comprising Tamil Nadu, Karnataka, AndhraPradesh, West Bengal, Maharashtra, Haryana, UttarPradesh, and Delhi. The production of cut flowers
TABLE 1.9Changing Share of Private and
Public Sector in Seeds Production
Year Share in Seed Production
Private (%) Public (%)
2004 49.11 50.892005 58.00 42.002006 57.75 42.25
Source: Report of the Working Group on Crop Husbandry, Agri-cultural Inputs, Demand and Supply Projections and AgriculturalStatistics for the Eleventh Five Year Plan (2007–12), PlanningCommission, Government of India (December 2006).

18 Eleventh Five Year Plan
increased over Plan periods to attain a production of1952 million flowers during the Tenth Plan periodfrom 615 million cut flowers during the end of EighthPlan period.
1.49 The medicinal plants-based industry is growingat the rate of 7%–15% annually. According to a con-servative estimate, the value of medicinal plants-related trade in India is to the tune of about Rs 5000crore per annum while the world trade is about62 billion US dollars and is expected to grow to thetune of 5 trillion US dollars by the year 2050. TheIndian Systems of Medicine have identified 1500medicinal plants, of which 500 species are mostly usedin the preparation of drugs. At present differentMedicinal and Aromatic Plant (MAP) species areunder cultivation in the country out of which about32 are listed in the priority list of the National Medici-nal Plant Board, Ministry of Health and FamilyWelfare for commercial cultivation and processingin the country. However, unorganized collectionfrom forest area has been banned in many states;the trade in this important sector is far from beingorganized and is also under private hands leading todistress sale by the growers and causing loss makingventures for new growers. Hence, in this sector itis important that only need-based cultivation ofany medicinal and aromatic crops is taken up withassured buy back arrangements. Furthermore, insome Council of Scientific and Industrial Research(CSIR) institutes the plants are available but thecosts are higher and not affordable for the growers.There is dearth of planting material in many keyspecies and limited improved varieties are available.Hence, different institutions under public domainare required to multiply plants for supply to thegrowers. The centres to be entrusted with this taskare NRC on MAP, Anand, Central Institute forMedicinal and Aromatic Plants, Lucknow, AICRPCentres of the network projects; Madhya Pradesh,West Bengal, Orissa, Jharkhand, Chhattisgarh, etc.
1.50 In the area of horticulture, a major beginning hasbeen made with the NHM. Already the government isimplementing Technology Mission for IntegratedDevelopment of Horticulture in North Eastern States,Sikkim, Jammu and Kashmir, Himachal Pradesh,
and Uttaranchal. The most important constraints toestablish the required linkages are in the area of agri-cultural marketing and processing. Since high-valueagriculture is based on perishable commodities, largeinvestments are required in modern methods ofgrading, post-harvest management (PHM), and devel-opment of cold chains. Such investment in turnrequires that new players, including large corporateplayers, be able to enter existing markets and set upnew marketing channels. The NHM thereforeincentivizes the ongoing marketing reforms basedon amending existing Agricultural Product MarketingCommittee (APMC) Acts to allow this. This processhas started in earnest, with many business housesinvesting in the area and with most States havingalready made APMC amendments. However, this mustbe taken to its logical conclusion. Many States havemade APMC amendments but are yet to frame thenecessary rules. This uncertainty needs to be removedas soon as possible.
1.51 Most States have also endorsed, and many haveencouraged, contract farming. This can be a usefulinstrument for linking farmers to corporate buyerswho can provide information and also inputs andextension tailored to the specific crops. It needs to bebacked by ensuring effective mechanisms for contractregistration and dispute resolution, along with ad-equate information and support so that small farmersare able to enter into collective contracts.
1.52 Planting material is the single most importantfactor around which the entire gamut of horticulturalactivities revolves. It is of special significance especiallyin perennial horticultural crops which have a long ju-venile/gestation phase and any mistake committed bythe grower in the initial stage will result in enormousloss in the later stages. Hence, genuineness, quality, andhealth of plant material are the major requirements ofmultiplication, sale, and adoption of any plant mate-rial. At present, farmers have to depend on privatesources of which the majority of the units are not regu-lated or monitored in most of the States. Hence, farm-ers do not have access to genuine and disease-free eliteto certified planting material in different crops andas a result suffer with respect to production, produc-tivity, and quality of the produce. Most of the old

Agriculture 19
existing nurseries lack modern infrastructure such asgreenhouses, mist propagation units, cold storage, mistirrigation systems, efficient nursery tools, implements,and machineries and even facilities for soil steriliza-tion, etc. Ignorance of the farmers, acute shortage ofmother plants of improved varieties, and absence ofquality testing and monitoring mechanisms make thesituation complex.
1.53 The situation is comparatively better in the caseof vegetables with the private sector taking a majorshare of the production and supply of seeds of hybrids/improved varieties, and enforcement of the provisionof Seed Act by the government agencies. However,the gap between the demand and supply of genuinequality material is too large to be met out of the presentefforts. Therefore, in the Eleventh Plan it is envisagedthat a massive programme on planting material beinitiated so that a sound basis for further growth anddevelopment of this sector can be taken up. The gov-ernment would also consider setting up a CentralCertification Agency and a Planting Material Author-ity to take care of good quality planting material.
1.54 There are at present 10 Central institutes with 27regional stations, 12 NRC, 9 multi-disciplinary insti-tutes, 15 AICRPs with 223 centres, 1 full-fledged SAUon horticulture and forestry, 25 SAUs with horticul-ture discipline, 5 network projects, 330 ad hoc researchprojects, and 29 revolving fund schemes which aredealing with research on different horticultural crops.Besides the above, a large number of CSIR laborato-ries and centres aided by Department of Biotechnol-ogy (DBT), Bhabha Atomic Research Centre (BARC),and Indian Space Research Organization are also un-dertaking basic and strategic research on horticulturalcrops. In addition, the Ministry of Commerce hasestablished one research institute each for coffee,rubber, and spices and two research institutes for teawhich work on different aspects of these commoditycrops. In spite of several research leads, there are stillgaps that require focused attention. Development ofimproved varieties/hybrids of fruits, vegetables, plan-tation crops, medicinal and aromatic crops, flowers andornamental crops, spices, cashew, oil palm with highproduction potential, biotic and abiotic stress resis-tance is the need of the hour. There is also need to
evolve appropriate horticultural-based croppingsystems for different agro-climatic areas. Although theprivate sector has emerged as a major supplier ofnew varieties, there is a need to evolve appropriatehorticulture-based cropping systems for different agro-climatic areas.
1.55 Protected cultivation/greenhouse/low poly tun-nels production techniques are now available for grow-ing cut-flowers and vegetables. Crops, such as tomato,cucurbits, cabbage, cauliflower, cucumber, lettuce,onion, spinach, brinjal, pepper, turnip, radish, can besuccessfully grown achieving high quality under pro-tected cultivation. It has enabled farmers to producevegetables in places such as Leh and also off-seasonproduction of vegetables in north India. Technologyfor protected cultivation of flowers such as rose,chrysanthemum, gerbera, and carnation in polyhouse,shade net, etc., has been perfected. Low-cost green-house technology has also been developed for highquality flower production in hilly States of Jammu andKashmir, Himachal Pradesh, Uttaranchal, and NorthEastern States. These structures are now used commer-cially for export of quality flower production in plainsof Maharashtra and Karnataka.
PLANT PROTECTION1.56 IPM, inter alia, aims at employment of alternatemethods of pest control like cultural, mechanical, andbiological control in a compatible manner. Chemicalcontrol which has several ill-effects should be resortedto only when other control methods fail to providedesired results. IPM is economical and ecologically safe,an important consideration since food safety issuesare an area of growing concern all over the world. Toensure ecologically safer food products, it is necessaryto control pesticide residue contents by fixing maxi-mum residue limits so as to bring them down to inter-nationally accepted minimum tolerance levels. Atpresent implementation of IPM itself is disintegratedas IPM component in different Plan schemes. Thesefragmented elements need to be co-ordinated.
1.57 The Plant Quarantine (Regulations of Importinto India) Order 2003, made operational from 1January 2004, contains adequate provisions to preventthe introduction of exotic pests, diseases, and weeds

20 Eleventh Five Year Plan
into India. Other allied responsibilities are the issu-ance of a Phytosanitary Certificate as per the Interna-tional Plant Protection Convention 1951, of the Foodand Agricultural Organization (FAO), and to under-take the Post Entry Quarantine inspections in cases ofimports of agricultural products. These functionsshould be enlarged with a view to facilitating interna-tional trade in agricultural products.
AGRICULTURAL CREDIT1.58 Credit is an essential requirement for revitaliz-ing agriculture and there have been some importantpositive developments in this area. The total credit toagriculture increased from Rs 62045 crore during2001–02, the terminal year of the Ninth Five Year Plan,to Rs 200000 crore during 2006–07, the final year ofthe Tenth Five Year Plan. This was a more than three-fold increase over five years. The share of commercialbanks in total agricultural credit increased from 54%in 2001–02 to around 69% in 2005–06. The share ofinvestment credit increased from 35% in 2001–02 toaround 41% in 2004–05, despite the negative growthachieved by the long-term co-operative credit struc-ture. As against a target of Rs 736570 crore, the totalinstitutional credit flow to agriculture during theTenth Five Year Plan is expected to be above Rs 650000crore, that is, a likely compound annual growth rate(CAGR) of 26%. This is much better than the CAGRof 18% achieved during the Ninth Five Year Plan.
1.59 The growth of credit was especially impressiveduring the last two years of the Tenth Plan on accountof the ‘Farm Credit Package’ announced by theGovernment of India (GoI). A Special ‘Farm CreditPackage’ as enunciated by the GoI on 18 June 2005 fordoubling the credit flow to agriculture, contained vari-ous innovative propositions for credit growth. As perprovisional figures available for 2005–06, the ground-level credit flow to agriculture during 2005–06 wasRs 180446 crore; 128% of the target of Rs 141000 crore,and registering an annual growth of 44%. While com-mercial banks registered a growth of 54% duringthe year, co-operative banks recorded 25% growth,followed by regional rural banks (RRBs) at 22%.
1.60 However, although the total agricultural credithas increased during the Tenth Plan period, there are
serious quantitative as well as qualitative concerns.The outreach of the formal institutional credit struc-ture is very limited. The findings of the NationalSample Survey Organization (NSSO) 59th Round(2003) revealed that only 27% of the total number ofcultivator households received credit from formalsources while 22% received credit from informalsources. The remaining households, comprisingmainly small and marginal farmers, had no credit out-standing. It is unlikely that the situation has changedmuch since 2003.
1.61 Comprehensive measures aimed at financialinclusion in terms of innovative products and servicesto increase access to institutional credit are urgentlyrequired. Issues such as credit flow to tenant farmers,oral lessees and women cultivators, complex documen-tation processes, high transaction costs, inadequateand ineffective risk mitigation arrangements, poorextension services, weak marketing links, and sectoraland regional issues in credit are also required tobe addressed expeditiously. The agrarian crisis alsoled to default by many farmers, and a consequentfreeze on their ability to access institutional credit. Theoverhang of such non-performing debt also needs tobe reduced.
1.62 The share of direct accounts with a credit limitof less than Rs 25000 in total direct accounts declinedfrom 97% in 1990 to 67% in 2005, while their share indirect credit has declined precipitously. The coverageof operational holdings needs to be increased signifi-cantly, with sub-targets for the less developed Statesand small and marginal farmers. Considering that forsmall and marginal farmers the only alternate sourcesof finance are expensive loans from moneylenders, theshare of direct accounts with a credit limit of Rs 25000in total direct finance may be targeted at a substan-tially higher level.
1.63 At present direct finance to agriculture underpriority sector lending includes credit for the purchaseof trucks, mini-trucks, jeeps, pick-up vans, bullockcarts, and other transport equipment to assist thetransport of agricultural inputs and farm produce.Direct finance also includes credit for the construc-tion and running of cold storage facilities, warehouses,

Agriculture 21
and godowns. As alternate formal sources of financeare available for these activities, their inclusion underdirect finance for agriculture needs to be reconsidered.
1.64 Special credit packages with varying and flexiblerepayment periods may be thought of for the agricul-ture sector to take care of mismatches of income andexpenditure flows of farmers and the seasonal natureof agricultural income. Doorstep banking imple-mented through designated agent of commercial bankshas now been facilitated by recent decision of theReserve Bank of India (RBI) and provides an opportu-nity for farmers to interact with banks with timingssuitable to the farming community. The banks arecurrently allowed to extend financial outreach byutilizing the services of civil society organizations,Farmers’ clubs, NGOs, post offices, etc., as ‘BusinessFacilitators’ or as ‘Business Correspondents’. NABARDcould look into the reasons which are coming in the wayof the banks using intermediaries as facilitators/corre-spondents and approach RBI for necessary changes/amendments in the instructions on the subject.
CO-OPERATIVES1.65 The credit disbursal by commercial banks cov-ers only 11.7% of operational holdings in the country.As may be seen from Table 1.10, credit growth by theco-operatives to the agriculture sector has graduallypicked up during the course of the Tenth Five YearPlan. The number of loan accounts have, however,declined from 224.6 lakh in 2004–05 to 192.8 lakhin 2005–06. The most potent means for wideningand deepening access to institutional credit to the
innumerable small and marginal farmers are the co-operative credit societies that are autonomous anddemocratic. The revitalization of the co-operativecredit structure in order to transform them intovibrant and viable democratic financial institutions istherefore vital. It is, therefore, extremely important,that the restructuring of co-operative credit now inprogress, on the lines of the recommendations of theA. Vaidyanathan Committee are implemented speed-ily and rigorously. Memorandum of Understanding(MoU) has been signed by 13 State Governments andthe process of auditing of accounts is under way. It isnecessary to move quickly to take the next steps indepoliticizing the system.
RISK MANAGEMENT1.66 The frequency and severity of risks in agricul-ture particularly in last few decades have increased onaccount of climate variability. The principal evidenceof climatic change has been rising temperatures,erratic rainfall pattern, and increase in the severity ofdroughts, floods, and cyclones which have caused hugelosses in agricultural production and the livestockpopulation. India has developed response mechanismsfor primary (crop failures) and to some extent second-ary (livestock deaths) consequences of climate vari-ability. However, a tertiary mechanism which goesbeyond resource transfer to resource assessment andmanagement, through climate forecasting, climateinformation generation and dissemination, early warn-ing system, mapping of agricultural losses throughremote sensing technology, and a pre- and post-climate change response need to be put in place on adecentral-ized basis. Such a response mechanism mustinclude putting in place a catastrophe protectioninsurance mechanism as also provision of bankruptcylegislation for the farmers.
1.67 Crop insurance was introduced in the countrytwo decades ago. The present version, the NAIS is avail-able since 1999–2000. Despite States’ support for cov-erage of the NAIS being tardy, NAIS is a useful device,especially for farmers growing relatively risky crops.The main problem is that NAIS is not really actuarialinsurance. Premiums for most important crops arefixed at all-India level irrespective of risk and the gov-ernment pays for entire excess of claims over premium
TABLE 1.10Credit Flow to Agriculture Sector by Co-operatives
Year Credit Growth Number of Loan(Rs in Crore) (%) Accounts (Lakh)
2001–02 23604 – –2002–03 23716 – –2003–04 26959 14 –2004–05 31424 17 224.62005–06 39404 25 192.82006–07 42480 8 188.7
Source: Various Issues of Economic Survey, Department ofEconomic Affairs, Ministry of Finance, and information providedby Department of Agriculture and Co-operation, Krishi Bhawan,New Delhi.
22 Eleventh Five Year Plan
received. Moreover, being compulsory for all borrow-ers from banks in States where it is in force, and withrelatively few non-loanee farmers involved, it mainlyinsures banks against default following poor harvest.Further, its popularity with farmers is limited since itis based on crop-cutting experiments, which delaysclaims payments until well after harvest and the riskcovered is only of yield shortfalls at the block level.There is a scope for improving the coverage of NAISin terms of regions and crops, substitution of long-term yield rate as a benchmark, and ensuring promptpayment of the indemnities. Decision to devolve thearea of damage assessment from blocks to smallerunits may be done with care, as the costs of such de-centralization and the moral hazards will be very highcompared to the likely benefits. Other indicators, suchas rainfall, could be used for assessing the damage dueto natural factors. Some States are devising their owncrop insurance policies including weather insurance,which can be supported in suitable ways. However,for the next few years they should not be treated as asubstitute to NAIS.
1.68 An important lacuna, which many researchershave pointed out, is the rather indifferent attitudeof the banks towards crop insurance. All commercialbanks, RRBs, and the co-operative banks shouldmake crop insurance mandatory for all agriculturalloanees, especially because such insurance can indi-rectly contribute to the viability of rural banking.An equally important aspect is the need for muchlarger involvement of the States in the functioningof the scheme. The government needs to take upagricultural reinsurance more extensively with appro-priate insurance products. Recently some of thesuccessful insurance products like Weather basedInsurance have been developed by Agriculture Insur-ance Company of India Ltd (AIC), ICICI-LombardGeneral Insurance Company, and by IFFCO-TokyoGeneral Insurance Company. Under the scheme,coverage for deviation in rainfall index is extendedand compensations for economic losses due to theless or more than normal rainfall are paid. There is alot of interest in private sector for insurance business.Necessary incentives should be devised for insurancecompanies to design suitable products for the agricul-ture sector.
MARKETING1.69 The agriculture sector needs well-functioningmarkets to drive growth, employment, and economicprosperity in rural areas. Currently agricultural mar-kets are regulated under respective State AgriculturalProduce Marketing (Regulation) Acts, generally knownas APMC Act. Besides, there are other regulations,viz. Essential Commodities Act and various ControlOrders issued thereunder. All these have createdrestrictive and monopolistic marketing structures,which have resulted in inefficient operation andhigh degree of marketing costs. They have also hadan adverse impact upon agricultural production andsystem, inefficient flow of commodities, and lack ofcompetitiveness.
1.70 The markets lack even basic infrastructure atmany places. When the APMCs were first initiatedthere was significant gain in market infrastructure de-velopment. However, this infrastructure is now out ofdate, especially given the needs of a diversified agri-culture. At present only one-fourth of the markets havecommon drying yards, trader modules, viz., shop,godown, and platform in front of shop exist in only63% of the markets. Cold storage units are needed inthe markets where perishable commodities are broughtfor sale. However they exist only in 9% of the marketsat present and grading facilities exist in less than one-third of the markets. The basic facilities, viz., internalroads, boundary walls, electric lights, loading and un-loading facilities, and weighing equipment are avail-able in more than 80% of the markets. Farmers’ resthouses exist in more than half of the regulated mar-kets. Covered or open auction platforms exist in onlytwo-thirds of regulated markets. It is evident from theabove that there is considerable gap in the facilitiesavailable in the market yards. Also the farmers have todeal with non-transparent methods of price discov-ery and there is often lack of auction of graded items.Some modern markets with electronic auctioning havebeen introduced, but they are the exception. A majormodernization of this aspect of the infrastructure isurgently needed.
1.71 On the basis of the recommendation of theInter-Ministerial Task Force, Ministry of Agriculturedrafted a model law on marketing which would allow

Agriculture 23
new markets to be established by private entities or co-operatives. Several State Governments have alreadyamended their APMC Acts allowing varying degreesof flexibility. The present status of the amendmentin the APMC Acts by the States is given at Table 1.11.However several States are yet to notify the relevantrules that would make the amendment fully opera-tional. These steps should be speedily completed toprovide a boost to promotion of direct marketing,contract farming, and setting up of markets in privateand co-operative sectors. Some of the important is-sues relating to agricultural marketing which wouldbe addressed during the Eleventh Plan include mar-keting system improvement and conducive policyenvironment; strengthening of marketing infrastruc-ture and investment needs; improving market infor-mation system with the use of Information andCommunication Technology (ICT); human resourcedevelopment for agricultural marketing; and promo-tion of exports/external trade. We should move to aregime of professionally managed wholesale markets.
1.72 In the context of market regulation and devel-opment, all States and UT governments should:
• Hold regular elections of agricultural produce mar-ket committees and bring professionalism in thefunctioning of existing regulated markets.
• Plough back the market fee for development ofmarketing facilities and investments for creationand/or upgradation of infrastructure in marketyards/sub-yards.
• Extend greater flexibility to stakeholders, sellers, aswell as buyers to interact in the markets.
• Promote grading, standardization, packaging, andcertification in the market area.
• Ensure transparency in auction system, penaliza-tion on arbitrary deductions from the farmers’realization, prompt payments to farmers, dissemi-nation of market intelligence, and speedier andhassle free transactions in the market.
• Improve weighing systems by installing bulkweighment system and handling in a time-boundmanner.
1.73 There are issues concerning legal framework andfiscal matters which will have to be attended to duringthe Eleventh Plan. Some of these include a need forbringing uniformity in the State-level tax structure inagricultural commodities for improving the marketefficiencies; rationalizing taxes and fees on raw agri-cultural commodities, and removing de facto restric-tions on movement of goods across State borders byharmonizing State-level taxes and providing for theirhassle free collection at convenient points. Further,the country should be conceptualized as a unified
TABLE 1.11Progress of Reforms in Agricultural Markets (APMC Act) as on March 2008
Stage of Reforms Name of States/Union Territories (UTs)
Source: Information provided by Department of Agriculture and Co-operation, Krishi Bhawan, New Delhi.
1. States/UTs where reforms to APMC Act has been done fordirect marketing, contract farming, and markets in private/co-operative sectors
2. States/UTs where reforms to APMC Act have been donepartially
3. States/UTs where there is no APMC Act and hence notrequiring reforms
4. States/UTs where APMC Act already provides for the reforms
5. States/UTs where administrative action is initiated for thereforms
Andhra Pradesh, Arunachal Pradesh, Assam, Chhattisgarh,Goa, Gujarat, Himachal Pradesh, Karnataka, Madhya Pradesh,Maharashtra, Nagaland, Orissa, Rajasthan, Sikkim and Tripura
(i) Direct Marketing:National Capital Territory of Delhi
(ii) Contract Farming:Haryana, Punjab, and Chandigarh
(iii) Markets in Private/Co-operative Sectors:Punjab and Chandigarh
Kerala, Manipur, Andaman and Nicobar Islands, Dadra andNagar Haveli, Daman and Diu, and Lakshadweep. Bihar hasrecently repealed the APMC Act w.e.f. 1.9.2006
Tamil Nadu
Mizoram, Meghalaya, J&K, Uttarakhand, West Bengal,Pondicherry, Jharkhand, and Uttar Pradesh

24 Eleventh Five Year Plan
integrated national market. Essential Commodities(Amendment) Act should be modified to provide forimposition of trade and marketing restrictions onlyduring the exceptional situations of demand–supplydislocation, market aberration, and price volatility.
1.74 The rules and regulations under the Food Safetyand Standards Act 2006, which has been passed by theParliament, should be expeditiously formulated andnotified. The Warehousing (Development and Regu-lation) Bill 2005 has been passed by the Parliament.This will facilitate early introduction of negotiablewarehousing receipt system. There is need to set upan accreditation agency for certified warehousesand warehouse receipts; encourage private sector, co-operatives, and Panchayats to set up rural godownsand specify standards and permit warehousing receiptsystem.
POST-HARVEST MANAGEMENT (PHM)1.75 At present, the post-harvest losses are about20%–30% in different horticultural crops. This hap-pens because of inadequate infrastructure develop-ment for PHM including pre-cooling. Packingmaterials like corrugated fibreboard boxes, perforatedpunnettes, cling films, sachets, wraps, etc., have beenstandardized for fresh horticultural produce. Tetrapacks of different products are now household items.
AGRO-PROCESSING1.76 Demand for horticultural products will be sus-tained by developments in agro-processing. In factthere is a rising demand for new products such as driedpowder fruit based milk mix, juice punches, bananachips and fingers, mango nectar, and fruit kernelderived cocoa substitute, essential oils from citrus, fruitwines, dehydrated products from grape, pomegran-ate, mango, apricot and coconut, grape wines, value-added coconut products like snowball tender coconut,milk powder, and pouched tender coconut water(Cocojal). Improved blending and packaging of tea andcoffee have opened new markets. Consumer-friendlyproducts such as frozen green peas, ready-to-usesalad mixes, vegetable sprouts, ready-to-cook freshcut vegetables are major retail items. The privatecorporate sector has a major role to play in develop-ing this aspect in the agriculture–consumer linkage.
Technology development has been in vogue but itsadoption is far below the requirements.
MECHANIZATION1.77 To keep pace with improved production andproductivity, different machines have been developedfor effective cultivation, intercultural operations,harvesting, grading, packaging, and value-addition.Machines such as mango harvesters, kinnow clippers,potato diggers, coconut peelers, etc., are being adoptedby the growers. Machines have also been developed/installed for different specialized uses such as coolsterilization (irradiation) for sprouting in potato andonion, dehydration of different produce, vapour heattreatment in major mango growing belts, packagingof coconut water, banana fig, and chip-making ma-chine, etc.
ANIMAL HUSBANDRY, DAIRYING, AND FISHERIES1.78 Livestock plays an important role in Indianeconomy and is an important sub-sector of Indianagriculture. The contribution of livestock to the GDPis about 4.5% and the sector employs about 5.5% of theworkforce. Livestock provides stability to family incomeespecially in the arid and semi-arid regions of the coun-try and is an insurance against the vagaries of naturedue to drought, famine, and other natural calamities.Major part of the livestock population is concentratedin the marginal and small size of holdings. Growthduring the Tenth Plan has been at the rate of 3.6%.
1.79 The goals for the Eleventh Five Year Plan for thelivestock sector would be (i) to achieve an overallgrowth between 6% and 7% per annum for the sectoras a whole with milk group achieving a growth of 5.0%per annum and meat and poultry group achieving agrowth of 10% per annum; (ii) the benefit of growthshould be equitable, benefiting mainly the small andmarginal farmers and landless labourers and shouldbenefit poorly endowed areas like draught prone, arid,and semi-arid areas; (iii) to provide adequate animalhealth services for effective disease control; (iv) the sec-tor should generate additional employment opportu-nity to people in the rural areas especially to the femalepopulation; (v) livestock should provide major sourceof income in the selected areas having potential formixed crop-livestock farming system; and (vi) the

Agriculture 25
growth in the sector should result in the improvementof environment, specially in the rural areas. Marketopportunities have opened up for the livestock sectorfollowing the economic liberalization. But the sector’sability to capitalize on new market opportunity is con-strained by the availability and quality of supportservices which, at present, are mainly provided by thegovernment. Moreover, these services are not availableat the doorsteps of the producers. There is a need torestructure service delivery mechanism to becomeconducive to the requirement of the rural livestockproducers. Lack of credit for livestock production hasbeen a major problem. Public sector lending is verylow. The strategy should be to correct these distortionsand ensure timely availability of inputs and servicesincluding credit to livestock farmers.
1.80 Presently, fisheries and aquaculture contribute1.04% to the national GDP of the country and 5.34%to agriculture and allied activities. The fisheries sectorhas been providing employment to over 9 lakh full timeand 11 lakh part time fishermen whose occupationis highly prone to natural calamities. The projectedexports from the fisheries sector by end of the Elev-enth Plan is 1.06 million tonnes in quantity andRs 15000 crore in value. The future of fisheries exportwould be influenced by the consistent compliancewith food safety measures (Hazard analysis andCritical Control Point [HACCP] and Sanitary andPhytosanitary [SPS] standards).
1.81 Seed, being the critical input for successful cul-ture practices, needs focused attention with regard tostrengthening of the existing infrastructure for pro-duction and rearing, transport, and quality aspects. Theprojected requirement of seed of carps, in pond cul-ture, wetland, and reservoir fisheries that are mostlycarp-based, is to the tune of 34400 million annually.Sustainable fisheries can only be achieved throughimprovement of the quality, technical skills, and man-agement of human resource managing fisheries in thecountry, in consonance with the rapidly changingneeds. Raising a cadre of officers at various levels toplan and execute fishery development programmes iscritically important. Fishes in waters, whether seas orinland waters, are impacted by a number of processes,both natural and anthropogenic. While fisheries is a
State subject like agriculture, it is necessary to developa broad framework for harmonizing the variousacts under which fisheries is administered. This wouldenable addressing international issues.
RAINFED AGRICULTURE1.82 Rainfed areas in the country, which account for60% of the cultivated area and are home to majorityof our rural poor and marginal farmers, have sufferedneglect in the past in not having received differenti-ated technological, institutional, infrastructural, andinvestment support. These areas are characterized byhigh incidence of poverty, low education and healthstatus, high distress in the farming sector, distressmigration, low employment opportunities, and vul-nerability to a variety of high risks. Apart from theseconditions, the population in these areas also suffersfrom various exploitative social structures and prac-tices, poor attention by government departments, poorquality of service delivery, and so on. Repeated waterscarcities leading to large-scale droughts have severelyaffected livelihoods of these rural poor. The challenge,therefore, is to improve rural livelihoods through par-ticipatory watershed development projects, reinforcedby an integrated farming system approach that wouldincrease productivity in a sustainable manner andcontribute to livelihood security.
1.83 After a high growth in rainfed agriculture dur-ing 1985–96, the deceleration in its growth since 1996was more than that of the irrigated sector partly dueto liberated trade policies in vegetable oils and inef-fective domestic support prices of rainfed crops. There-fore, stabilization of domestic support price is calledupon for internalizing improved technology. Effortswill have to be made to fill up productivity gaps of theexisting technologies and their scaling up throughproper extension mechanisms, supply of inputs, insti-tutions, and proper governance. The coarse cereals inthese areas are being diversified into a better option ofpulses crops which need to be promoted by providingimproved seeds of pulses, availability of specific nu-trients of sulphur and phosphorous, and better mar-ket linkages. Improving productivity of rainfed ricein eastern India would also help in ensuring foodsecurity in the country. Similarly, sweet sorghum forethanol production could be more competitive in the

26 Eleventh Five Year Plan
relatively dry regions of southern and western States.Crop residues could be used as fodder or feed stock toadd more value to the cultivation of sweet sorghum.Risk moderation through in situ rain water conserva-tion, rejuvenation of traditional water bodies, andimproving efficiency of harvested water may be givenhigh priority to reduce vulnerability to climatic vari-ability. Livestock, agro-forestry, and dryland horticul-ture and value addition through processing, storageetc., of these commodities are significant copingmechanisms of managing risk and uncertainties.Diversification and expansion of predominantlyrainfed crop of soybean by market linkage is an excel-lent example to be pursued in other commodities.There are some niche attribute crops like seedspices, guar, and medicinal crops which are veryrelevant at micro level in which contract farmingneeds to be promoted to avoid periodic crash inprices. Credit requirement of rainfed regions are alsomore specific. The repayment strategies should beplanned to cover the risks; for example, total livelihoodportfolio with extended repayment period would bemore appropriate. Convergence with employmentguarantee schemes, Backward Regions Grant Fund,Artificial Groundwater Recharge, as well as renovationof existing water bodies may be promoted tohave complementarities of different programes.Upgradation of skills of the landless, assetless, artisans,and small and marginal farmers should be promotedkeeping in view the new marketing demands. Intensi-fication of biofuels in farming system in these areascan add significantly to livelihood security. Compre-hensive District Agricultural Plans have been initiatedon pilot basis to capture such variations and developappropriate strategies.
1.84 Systematic reviews and appraisals conducted onwatershed development projects by various organiza-tions and departments have established the merits ofthe watershed-based approach. These are:
• Soil loss and surface runoff reduced by 52% to 58%respectively in completed watersheds.
• Area under irrigation increased from 34% to 100%in different watersheds.
• The area under sowing increased. The croppingintensity increased.
• Productivity/yields of crops increased and the netreturns also increased (up to 63%).
• The Benefit Cost Ratio of watershed ranged from1.10 to 15.72, depending on the above factors.
• The availability of drinking water and ground-water situation improved in all project villages.
• Other benefits such as fodder availability, employ-ment opportunities (and also equal wages in lim-ited number of cases), and income generationopportunities improved significantly in all villageswhere watershed projects were implemented.
• Human and cattle migration reduced significantly.
1.85 These findings suggest that there is a strong casefor a massive expansion of the rainfed areas program-me in the country.
1.86 The integrated watershed development projectsimplemented since 1994 have unique strengths inproject management, project content, and processeswhich need to be reinforced (see Box 1.1).
1.87 The analysis of benefits/strengths and weaknessesof the watershed development projects implementedso far establish the following essential principles forguiding policy and its execution in the future. Theseare:
• Equity: Watershed Development Projects shouldbe considered as instruments for increased landproductivity and inclusiveness.
• Decentralization: Establishing suitable institutionalarrangements within the overall framework of thePanchayati Raj Institutions (PRIs), professional anddedicated human resources, and operational flex-ibility in norms to suit varying local conditions willenhance decentralized decision making.
• Facilitating Agencies: Social mobilization, commu-nity organization, building capacities of commu-nities in planning and implementation, ensuringequity arrangements, etc., need intensive facilitationby professional teams. They need to be providedfinancial support to perform the above specificfunctions.
• Centrality of Community Participation: The com-munity organizations should be closely associatedand accountable to the Gram Sabha in project
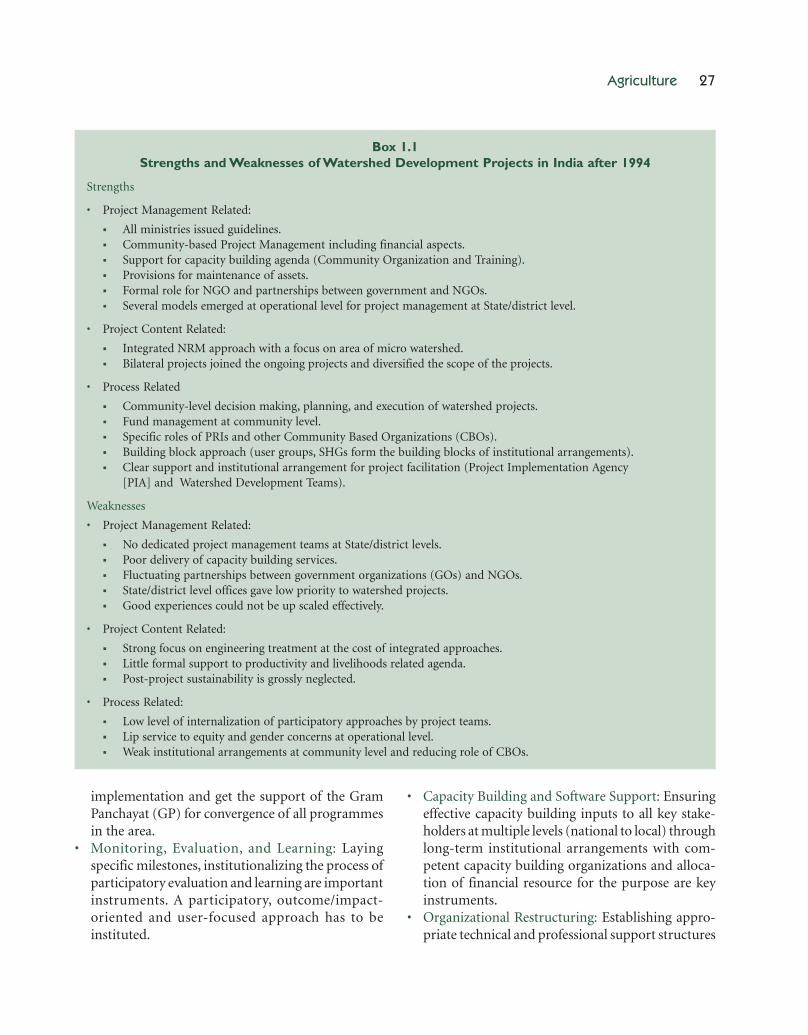
Agriculture 27
implementation and get the support of the GramPanchayat (GP) for convergence of all programmesin the area.
• Monitoring, Evaluation, and Learning: Layingspecific milestones, institutionalizing the process ofparticipatory evaluation and learning are importantinstruments. A participatory, outcome/impact-oriented and user-focused approach has to beinstituted.
• Capacity Building and Software Support: Ensuringeffective capacity building inputs to all key stake-holders at multiple levels (national to local) throughlong-term institutional arrangements with com-petent capacity building organizations and alloca-tion of financial resource for the purpose are keyinstruments.
• Organizational Restructuring: Establishing appro-priate technical and professional support structures
Box 1.1Strengths and Weaknesses of Watershed Development Projects in India after 1994
Strengths
• Project Management Related:
� All ministries issued guidelines.� Community-based Project Management including financial aspects.� Support for capacity building agenda (Community Organization and Training).� Provisions for maintenance of assets.� Formal role for NGO and partnerships between government and NGOs.� Several models emerged at operational level for project management at State/district level.
• Project Content Related:
� Integrated NRM approach with a focus on area of micro watershed.� Bilateral projects joined the ongoing projects and diversified the scope of the projects.
• Process Related
� Community-level decision making, planning, and execution of watershed projects.� Fund management at community level.� Specific roles of PRIs and other Community Based Organizations (CBOs).� Building block approach (user groups, SHGs form the building blocks of institutional arrangements).� Clear support and institutional arrangement for project facilitation (Project Implementation Agency
[PIA] and Watershed Development Teams).
Weaknesses
• Project Management Related:
� No dedicated project management teams at State/district levels.� Poor delivery of capacity building services.� Fluctuating partnerships between government organizations (GOs) and NGOs.� State/district level offices gave low priority to watershed projects.� Good experiences could not be up scaled effectively.
• Project Content Related:
� Strong focus on engineering treatment at the cost of integrated approaches.� Little formal support to productivity and livelihoods related agenda.� Post-project sustainability is grossly neglected.
• Process Related:
� Low level of internalization of participatory approaches by project teams.� Lip service to equity and gender concerns at operational level.� Weak institutional arrangements at community level and reducing role of CBOs.

28 Eleventh Five Year Plan
at national, State, district, and project levels anddeveloping effective functional partnerships amongproject authorities, implementing agencies andsupport organizations is essential for ensuringeffective project management.
1.88 Estimates of the extent of degraded land varyfrom 55 MH to 175 MH depending upon the defini-tion of wasteland and also the source of information.As per the 25 year perspective plan of the PlanningCommission (1997), 88.5 MH was to be developedunder watershed programme by the end of ThirteenthFive Year Plan. Out of the above, 22.2 MH has alreadybeen developed during Ninth and Tenth Plan througha watershed approach. The latest attempt to harmo-nize the above data (ICAR–National Remote SensingAgency [NRSA]–NRAA Expert Group 2007) hasbrought out that the degraded land which has thepotential for development under watershed develop-ment projects amounts to a total of 64 MH consistingof 50 MH of water eroded, 5 MH of wind eroded, and9 MH in notified forest. It is proposed to develop36.6 MH during the Eleventh Plan through integratedwatershed approach. The rest of the area, that is 29.7MH, would be considered for development in thesubsequent Five Year Plans.
1.89 The major thrust in the Eleventh Plan must belaid on developing the untreated area in Desert Devel-opment Plan (DDP) and Drought Prone Areas Pro-gramme (DPAP) blocks and watershed developmentprojects of the Ministry of Agriculture. In addition,special attention is to be devoted to developing vil-lages where groundwater is over exploited. For thispurpose, priority would be laid to work in 425 blocksin 100 districts, where groundwater depletion is veryhigh and the number of dug wells is also high. Thepriority for Integrated Watershed Developmentprojects during the Eleventh Plan would be arid, semi-arid, and dry sub-humid areas.
1.90 In order to develop an integrated approach forrainfed areas a farming system approach would beemphasized. Common guidelines for watershed man-agement programmes in different ministries are be-ing prepared to be put before the newly created NRAA.The Authority will also work towards developing a
watershed plus approach for improving agriculturalproductivity. This would involve an emphasis on inte-grating crop husbandry, livestock, horticultural, andother sub-systems appropriate to the agro-climaticconditions. A new programme on Rainfed Farmingwould be launched for the purpose of augmenting theexisting programmes of Ministry of Rural Develop-ment (MoRD) and Ministry of Agriculture.
1.91 The investment requirement for treatment of36.6 MH in Eleventh Plan is estimated at approximatelyRs 36600 crore. Although only about Rs 23000 crore islikely to be available from concerned Central minis-tries (Rs 17000 crore from MoRD and Rs 6000 crorefrom Ministry of Agriculture), it is envisaged thatsubstantial additional resources can became availablethrough convergence with National Rural Employ-ment Guarantee (NREGA) and Backward RegionsGrant Fund (BRGF) programmes. The possibility ofsome additional funding by the State Governmentswould also be explored.
THE SOCIAL CONTEXT: NEED TO MODERNIZEAGRARIAN RELATIONS FOR EQUITY AND EFFICIENCY1.92 Land is the prime resource of the vast majorityof the poor in India deriving livelihood from agricul-ture. The Land Administration is plagued by manyinfirmities. Unclear titles, informal tenancy arrange-ments, and other related problems have not onlyaffected productivity of agriculture, they have alsoforced migration of people, both landless and mar-ginal farmers, in search of employment to urbanareas as well as of the landed gentry, giving rise toabsentee landlordism, who do not lease out land forfear of losing the land titles. Therefore, an efficient andcorruption free land administration, coupled with adynamically adaptive land policy, has a vital role inincreasing agriculture growth and poverty reduction.The key elements of an effective land policy are thefollowing:
• Modernization of management of land records.• Reforms relating to land ceiling.• Security of homestead rights.• Reforms relating to tenancy laws.• Protection of the rights in land of tribals.• Access to agricultural services.

Agriculture 29
MODERNIZATION OF MANAGEMENT OFLAND RECORDS AND TITLES1.93 Correct and updated land records are crucial forthe security of land rights and to encourage invest-ment. These result in fewer disputes and conflicts, al-low land to be used as collateral, lower transaction costsand corruption, ensure efficient land markets, and helpin implementation of land reforms and planning forvarious development programmes.
1.94 Efforts thus far have remained focused on thesystem of computerization of textual land records.However, by itself it has limited benefits, unless theland records are accurate and updated in real time. Thesteps to be taken to put in place effective and modernland administration system are:
• The process of registration and mutation should beintegrated into one function of registration of deeds.Before registering the deed, the concerned officershould check the legality of the transaction andcompetence of parties to take part in the transac-tion. Computerization should also be taken up ofrecords of the previous 50 years, or such lengthof time as may be prescribed in this regard in therelevant State laws, so that the title being registeredis clear and uncontested.
• The computerization of spatial records should betaken up in all the States and all the cadastral mapsshould be digitized.
1.95 Setting up a system on the above lines in all Statesand UTs would facilitate citizen services based on landdata, such as providing records of rights with maps-to-scale; other land-based certificates such as castecertificates, income certificates (particularly in ruralareas), domicile certificates, etc.; information foreligibility for development programmes; land pass-books with the relevant land information for accessto agricultural credit; and access to the data to theco-operative banks and other credit institutions.
1.96 In addition to the above steps, it would also bedesirable to integrate three layers of data: (i) forestsummary maps, (ii) cadastral maps, and (iii) revenuerecords, and harmonize them on a Geographic Infor-mation System (GIS) pattern, so as to provide a
comprehensive tool for planning developmental,regulatory, and disaster management activities andfor any other purpose where location-specific infor-mation is needed.
1.97 The modernization of the land administrationsystem through computerization of textual and spa-tial records and integration of the registration officeshould open the doors to exploring, by setting upa few pilot projects, the possibility of shifting to the‘Torrens’ system which is ‘title’ based rather than thepresent ‘deed’ based system. This will ensure that thedeed document is a proof of title and reflects reality;search costs for ascertaining title will thus reduceto negligible and title guarantee by the State wouldbe feasible.
1.98 Two CSS currently under implementation are thecomputerization of land records and strengthening ofRevenue Administration. These would be subsumedin the proposed National Land Records ManagementProgramme, which would be launched shortly as apilot project in one district in each State. After the vali-dation of the proof of concept within the next twoyears, the scheme would be extended to the entirecountry. It is expected that digitization of land recordsafter undertaking comprehensive land survey wouldbe completed by the end Twelfth Plan period. It is ex-pected that after availability of this basic record, thecountry could move towards the Torrens system in theThirteenth Five Year Plan.
REFORMS RELATED TO LAND CEILINGS1.99 One of the basic objectives of land reforms wasto bring about a more equitable distribution of land.The main instrument for realizing this objective wasthe imposition of ceiling on land. In line with the pre-scription of the five year plans, laws on impositionof ceiling on agricultural holdings were enacted byseveral States during the 1950s and 1960s. These wereimplemented with varying degrees of effectiveness indifferent States. The quantum of land declared surplusis far short of land which was estimated to be surpluson the basis of various national surveys. Thus, it is clearthat reform measures have not been able to achievethe desired impact. The total area declared surplusso far has been 73.5 lakh acres only, of which 53.9 lakh
30 Eleventh Five Year Plan
acres have been distributed. The distribution of theremaining area of land declared surplus is held upmainly due to litigation.
1.100 There are also widespread complaints that landsallotted to the rural poor under the ceiling laws arenot in their possession. In some cases, it has also beenalleged that pattas were issued to the beneficiaries butpossession was not delivered in respect of the landsshown in the pattas or corresponding changes in therecords of rights were not made. It has also been theexperience that rural poor allottees of ceiling surplusland are dragged into litigation by the erstwhile land-owners and against which the allottees are unable todefend themselves. Besides, a number of benami andclandestine transactions have resulted in illegal pos-session of significant amounts of lands above ceilinglimits. For all these reasons the results of implementa-tion of the ceiling laws are far from satisfactory. Thefollowing measures can be taken up:
• Since large areas of good quality ceiling surplus landare unlikely to be available for distribution to thelandless poor, efforts must be made to take steps torelease and distribute the land locked in litigationthrough speedy disposal of court cases.
• In such cases where the land has been distributedbut the beneficiary is not in a position to enjoythe land due to being dispossessed or not having awell-defined title to the land, these cases should besurveyed and reopened and such land be restored.
• A special squad of revenue functionaries and GramSabha members should be set up for identificationof benami and fictitious transactions in a time-bound manner.
• There should be a survey of the government landencroached by ineligible persons and such landshould be identified and distributed to the landless.An inventory of the government lands should bemade and wherever surplus land is available, itshould be distributed to the landless persons.
• Asset in the form of land can lead to poverty reduc-tion. However, to the extent that distributinggovernment lands is not an option, acquisitionof land through purchase by the State and distribu-tion to the poor as individuals or in a group may beconsidered.
PROTECTION OF RIGHTS IN LAND OF TRIBAL PEOPLE1.101 Land is the major tangible productive asset thatmembers of scheduled tribes (STs) possess. Tribals alsohave very strong emotional attachment to their land.Some of the social practices and religious rituals oftribals are also connected with land, which occupies apivotal place in their psyche. An important fact is thatcommunity ownership of tribal land continues to bethe dominant mode in tribal societies and takes pre-cedence over individual ownership.
1.102 The increase in extremist activities in manytribal districts can be linked to issues related to landincluding alienation of tribal land. These are:
• Sale and transfer of land by tribals to other tribalsand non-tribals.
• Indebtedness and consequent sale of land.• Forcible eviction of tribals from land or unautho-
rized occupation of tribal land by non-tribals or bypublic authorities.
• Conversion of land from communal ownership toindividual ownership.
• Treating tribals traditionally occupying forest landsas encroachers.
• Government land allotted to tribals under variousschemes but substantive possession not given.
• Large-scale displacement on account of develop-ment projects, such as multi-purpose irrigationand power projects, mining, industry, highways, andurbanization.
• Environment-disturbing developments taking placeclose to tribal habitats, forcing the tribals to moveout, though there is no formal transfer and acquisi-tion of land.
1.103 The following measures are necessary for pre-venting alienation of tribal land and restoration ofalienated tribal land:
• Highest priority should be accorded to the prepa-ration and updating of land records in tribal areas,and with active participation of tribal communities.
• The legal provisions prohibiting the alienation oftribal land in Schedule V areas and its restorationshould be extended to the non-Scheduled areasalso. A cut-off date should be prescribed while
Agriculture 31
extending these provisions to the non-Scheduledareas.
• A complete ban on all forms of transfers of triballands should be enforced.
• The district authorities should be empowered totake suo moto action for the detection and restora-tion of land belonging to the STs. It should beensured that once order of restoration is passed bythe competent authority, land is speedily restoredto the tribal.
• At present Panchayat (Extension to the ScheduledAreas) Act 1996 (PESA) is applicable only to theScheduled areas, but a large part of the tribal popu-lation lives outside the Scheduled areas. Therefore,provisions of PESA should be applicable mutatismutandis to villages/areas where majority of thepopulation consists of STs.
• Major alienation of tribal land in the scheduledareas has taken place through the means of com-pulsory acquisition using the government processof land acquisition. As provided under PESA,no acquisition should take place without the priorconcurrence of the Gram Sabha.
1.104 The present arrangements of resettlement andrehabilitation are detrimental and prejudicial to theinterests of the tribals. The process of erosion of cor-pus of tribal land continues at an accelerated paceunder the new economic dispensation while the policyoptions are being debated. The proposed revisions tothe Land Acquisition Act and to the current policy andpractices relating to resettlement and rehabilitationwould provide the much desired policies and pack-ages for more humane and relevant approach indealing with displacements. There is a strong needfor enactment by Parliament of an enabling legisla-tion (like PESA) regarding alienation of land belong-ing to STs. Incorporating the provisions of theenabling legislation should be mandatory in alllaws/regulations made by the respective StateGovernments.
1.105 Implementation of the Scheduled Tribes andother Traditional Dwellers (Recognition of ForestRights) Act 2006, passed by the Parliament, and rulesframed under it, will provide the much needed protec-tion and respite from exploitation for large numbers
of those whose rights could not be recorded or recog-nized for generations.
SECURITY OF HOMESTEAD RIGHTS1.106 An estimated 13 to 18 million families in ruralIndia today are reported to be landless, of which about8 million lack homes of their own. They either live ina house constructed on the land of others or providedby landowners in return for some forced labour. Someof these persons do not have land to construct a house,while others may have small patches of land but noresources to build a hutment.
1.107 The right to a roof over one’s head needs to beseen as a basic human right, along with the right tofreedom from hunger and right to education. TheSupreme Court, in UP Avas Evam Vikash Parishad vsFriends Co-operative Housing Society (List All IndiaReporter [AIR], 1997, Supreme Court [SC] 152),held that right to shelter is a fundamental right. TheEleventh Five Year Plan provides the opportunity torealize this vision.
1.108 Several State Governments have already takensteps to provide each family with a minimum size ofland (10–15 cents), so that they have enough space tolive and, also a little space extra for supplementary live-lihood activities, such as growing fodder and keepinglivestock, planting fruit trees or vegetables, or under-taking other land-based economic activities (farm ornon-farm) to improve their food, nutrition, and live-lihood security. Kerala has a scheme of providing 10cents of land to each landless family and this has had anotable impact on poverty reduction in the State.Similarly, in 2005, the governments of Karnataka andWest Bengal initiated schemes to give homestead-cum-garden plots to landless families. These experimentsshould be generalized across all States.
1.109 The following steps are needed to ensure thisobjective:
• All landless families with no homestead land as wellas those without regularized homestead should beallotted 10–15 cents of land each. Female-headedfamilies should have priority.
• Some of the required resources could be arranged

32 Eleventh Five Year Plan
through reallocation of the resources from existingschemes, such as the Indira Awas Yojana, NREGA,etc. This must be completed during the EleventhFive Year Plan.
• When regularizing the homesteads of familiesoccupying irregular and insecure homesteads, thehomesteads so regularized should be in the nameof the wife.
• The beneficiaries should be given homestead landin a contiguous block, within 1 km or less of theirexisting village habitation, with proper roads andinfrastructural connectivity. In such a consolidatedblock, essential facilities should also be provided,such as primary school, primary health centre,drinking water, etc.
• The beneficiaries of homestead-cum-garden plotshould be assisted by Panchayats and line depart-ments of government to develop plans and receivefinancial assistance for undertaking suitable eco-nomic activities, such as livestock rearing, fodderdevelopment, and planting of high-value trees ifwater is available.
TENANCY REFORMS1.110 Tenancy legislations were introduced after in-dependence to confer ownership on the tenantand some measure of security of tenure, coupled withrent regulation to prevent exploitation of tenants andincrease agricultural productivity in such farms. Thereis a need for giving a fresh look at the tenancy legisla-tions to reflect changes that have occurred in a man-ner which balances the interest of the landowner andthe tenant and improves access to land, its utilizationand releases the forces of production leading toimproved agricultural productivity.
1.111 Legislative provisions have been made in manyStates, providing for conferment of ownership rightson tenants or for allowing cultivating tenants to ac-quire ownership rights on payment of a reasonablecompensation to the landowners. Some States haveacquired ownership of land from the landownersand have transferred them to the tenants who haveto pay a certain amount or premium to the State.The national policy, however, permits landownerswho are members of the Defence Services, widows, un-married women, minors, and persons suffering from
physical and mental disability to lease out lands totenants without loss of ownership. Provisions forsecurity of tenure have been made even in States whichdo not provide for conferment of ownership rights ontenants, sub-tenants, and sharecroppers.
1.112 Although agricultural tenancies are banned inmost States, the incidence of some type of tenancy,particularly in various forms of crop sharing, is stillsubstantial in some regions. As tenancy is contractedorally, and in most cases in violation of law, the tiller’sposition is precarious and she/he has no incentive tocultivate land efficiently. In several regions, the exist-ing provisions lead landowners to keep the land fal-low for fear of losing their rights. It also restricts poorpeoples’ access to land through leasing in. Experiencehas shown that measures to ban tenancy are not usu-ally effective and large amount of oral/concealedtenancy continues to exist among all categories ofrural households. Thus decrease in lease market par-ticipation with economic growth indicates that ten-ancy restrictions are constraining the supply of landin the rental market. Tenancy legislation has also ledto the demise of longer term contractual arrangementsand led to even seasonal tenancy in some areas. Thisdiscourages the use of farm yard manure and invest-ments which have a long-lasting effect.
1.113 In a majority of States landless and marginalfarmers are net leasers in of land. On the other hand,in some of the States, large and medium farmers leasein land from smaller farmers, giving rise to ‘reversetenancy’. This indicates that the transactions for leas-ing in and leasing out pervade all along the farm sizecontinuum and it appears that it is economic factorsrather than power relationships which are definingthese leasing arrangements.
1.114 Security of tenure is necessary for producers tohave the incentive for investment for productivity andsecurity of tenure should not be confused with own-ership rights. Land tenure security should signify thatlegitimately held rights-to-use in land will not be dis-turbed without legitimate cause and without dueprocess, and any such contested rights will be resolvedby an appropriate dispute settlement mechanism. Forprotecting the interests of tenants and landowners
Agriculture 33
and also to increase agricultural productivity, thefollowing reforms in tenancy legislation should beundertaken:
• Tenancy should be legalized in a ‘limited’ manner. Itshould provide security to the tenant for the con-tractual period, which could be long enough toencourage long-term investment by the tenant. Itshould also protect the rights to the land of the land-owner so that he has an incentive to lease his landinstead of keeping it fallow or underutilizing it.Long-term tenure arrangements should thus maxi-mize agricultural production and increase the re-turns to both the farmer, the landlord, and the tenant.
• Instead of prescribed rentals, which are violated ininformal tenancies, an upper and lower bound ofrents may be prescribed at the State level. If thesebands are wide enough, this will do away with theneed for illegal arrangements, ensure that the rentsare determined by market forces within the pre-scribed band, and thus increase efficiency and co-operation of both the willing parties.
• Legalizing of tenancy within the above frameworkwill result in increasing the supply of land andwill encourage all categories of rural households toparticipate in the lease market based upon resourceendowment, education, employment prospects,prevailing wage levels, and the institutional backupavailable.
• As agrarian conditions vary across the States, a one-size fit-all prescription cannot be advocated. In caseswhere the landlords are dominant and there isstrong likelihood that interests of tenants may notbe safeguarded, special clauses could be necessary.
• Small land-owners who would otherwise have tooperate small uneconomic holdings should have theopportunity to legally lease out land to other farm-ers with the assurance of being able to resume pos-session at the end of the stated period of tenancy.
• The marginal and small landowners should beassisted with adequate institutional support andrural development schemes, so that they are notcompelled to lease out land to big farmers or corpo-rate houses, thereby creating conditions for invol-untary reverse tenancy. In the case of sharecroppers,they should have access to credit, once they enterinto long-term contracts.
ACCESS TO AGRICULTURAL SERVICES1.115 Small and marginal farmers often lack accessto major agricultural services, such as credit, exten-sion, insurance, and markets. This is especially true ofwomen farmers since there is pervasive male bias inprovision of such services. With almost all sharecrop-pers and most marginal farmers unable to accesscredit from the formal system, a key issue relating toagricultural credit is the utter lack of financial inclu-siveness. Recent suicides by farmers in many parts ofIndia are linked with increase in indebtedness to non-institutional sources.
1.116 Small and marginal farmers, particularlywomen, have lower literacy levels compared to thebigger farmers. This limits their access to informationsources like media, TV, etc. The government extensionmachinery also tends to focus on progressive orbigger farmers. Small and marginal farmers are alsodeprived of MSP because of low surpluses, and attimes pledge of produce to moneylenders at less thanmarket price.
1.117 Agricultural technology for enhancing efficiencyshould normally be scale neutral if markets exist forwater and for rental use of lumpy machinery. In fact,small-sized farms actually have an advantage in usingsurplus family labour and saving monitoring costs, andthis is the main argument for land reforms. But lackof access often results in significant yield gaps betweenbigger and smaller farmers. One solution is strongpublic intervention in favour of small producers, en-abling them to access and benefit from the relevantmarkets and extension services. But while instructionsfrom above can help, this is not a substitute for em-powerment of the beneficiaries themselves.
1.118 The most potent vehicle that can empower thepoor is group action. Among success stories, the DeccanDevelopment Society has provided subsidized creditto landless scheduled caste (SC) women’s groups forland purchase using an AP government scheme. Manygroups have purchased land through this schemeand are farming it collectively. This has enhanced agri-cultural output, food security, and employment forpoor women and their families. Many have brought un-cultivated land into productive use. Another example

34 Eleventh Five Year Plan
is a Government of India–United Nations Develop-ment Programme (GoI-UNDP) programme whichcovered 1357 villages and 50000 women in AndhraPradesh, UP, and Orissa promoting group access to landand collective cultivation by women. This involvedcollective cultivation on land acquired in many ways:leasing in, releasing mortgaged land, etc. Undertakenin partnership with State Governments, women’sgroups, and NGOs, support for this programme hasended. It needs revising and extending.
THE WAY AHEAD1.119 The strategy to accelerate agricultural growthto 4% per annum in the Eleventh Plan requires actionin the following broad areas.
• Bringing technology to the farmers.• Improving efficiency of investments, increasing
systems support, and rationalizing subsidies.• Diversifying, while also protecting food security
concerns.• Fostering inclusiveness through a group approach
by which the poor will get better access to land,credit, and skills.
TECHNOLOGY1.120 It is necessary to prepare a long-term visionenvisaging synergy between SAU/ICAR institutionswith other relevant research funded by CSIR, DBT, theMinistry of Earth Sciences, etc., especially to copewith longer climate change from global warming. It isalso necessary to impart a strategic focus to adaptiveresearch making it location-specific and aimed at iden-tifying regionally relevant best practice.
1.121 Immediate action points are the following:
• Priority in agriculture research should be given tostrategic research.
• Research priorities have to shift towards evolvingcropping systems suited to various agro-climaticconditions and towards enhancing the yieldpotential in rainfed areas through development ofdrought- and pest-resistant varieties.
• The ICAR needs to restructure accordingly and toincrease its accountability.
• SAUs also need to be made more accountable,
and strengthened to develop, refine, and promotelocation-specific technologies. Their teachingcapacity also requires to be strengthened.
1.122 Public expenditure (both Plan and non-Plan,Centre and States) on agriculture research will needto increase from around 0.7% of agriculture GDP atpresent to 1% by end of Eleventh Plan. Increased allo-cation by the Centre would take this to 0.9%. Addi-tional investment by States would lead to publicexpenditure on agricultural research to 1% of agricul-tural GDP. To avoid business as usual, the additionalresources should be conditional on:
• Improving the governance of the National Strate-gic Research Fund within the Ministry of Agricul-ture. An expert body independent of the NARS canassess potential and constraints, including climatechange, and set the priorities for the much enhancedstrategic research required.
• High-level expert committees at the Centre and inStates should also be formed to oversee extendedbut incentivized SAUs to revitalize their teachingand location-specific research to enable strongerlinks with farmers. This, in turn, should have ademand-led component whereby States and dis-tricts could finance [from schemes such as RashtriyaKrishi Vikas Yojana (RKVY)] specific problem-oriented research arising from the district plans.
IRRIGATION1.123 The scope for new large surface irrigationprojects is getting smaller and the focus should betherefore on completing ongoing irrigation projectsand on modernizing existing ones. In particular,much greater emphasis is required on investments inphysical rehabilitation and on modernization of sys-tems essential for improving the efficiency of water use.With these considerations in view, it is suggested:
• The allocation to Accelerated Irrigation BenefitProgramme (AIBP) during Eleventh Plan shouldbe increased but with much more effective moni-toring using remote sensing data to incentivize theCentral funds flow to the States.
• States should shift to ‘fixed-time fixed-cost’contracts.

Agriculture 35
• One model modernization project should be ineach State.
• More emphasis must be placed on ParticipatoryIrrigation Management (PIM), including collectionand retention of water rates by water user associa-tions, to reduce the gap between potential createdand the actual utilized.
• Comprehensive water balance accounts must beprepared of current use, both at the system level andat the level of water user associations, to highlightthe extent of avoidable waste and identify possibili-ties of reducing this through better regulation ofwater deliveries and conjunctive use.
• The subsidy structure on micro-irrigation equip-ment must be restructured to enable promotionof community sprinkler systems by water userassociations.
• National Rural Employment Guarantee (NREG)/BRGF funds must be used to supplement CommandArea Development.
1.124 As far as groundwater is concerned, the priorityshould be to exploit the abundant availability in Assam,Bihar, Chhattisgarh, Orissa and parts of Jharkhand,Uttar Pradesh, and West Bengal. The ongoing program-me of rural electrification in this region under BharatNirman will help. The scope of Rajiv Gandhi GrameenVidyutikaran Yojana (RGGVY) must be expanded toinclude energization of pump-sets by convergingresources from BRGF and the newly formed RKVY.
1.125 However, it is vital to ensure both that adequatecredit is available for pump-sets and that electricityrates are not reduced to the unsustainable levelsreached elsewhere.
1.126 In other parts of the country where withdrawalcurrently exceeds recharge, the following are essential:
• There must be regular and accurate assessment ofactual groundwater use in both rural and urbanareas to correlate this with recharge and extraction.
• Separation of feeders for domestic and agriculturalpower and its timely but controlled supply for irri-gation can help regulate water use.
• Ways must be explored to empower and entrust vil-lage communities with the right and responsibility
to collect electricity charges and in dark blocks toregulate access through, for example, obligation ongroundwater users to undertake rainwater harvest-ing and groundwater recharge.
NATURAL RESOURCES MANAGEMENT ANDWATERSHED DEVELOPMENT1.127 Much of the country’s agricultural area willremain rainfed even if we utilize irrigation potentialfully. It is this area that has witnessed the largest decel-eration although the untapped potential from existingyield gaps is high. Government has now constituted theNRAA to bring focus to the problems and potentials ofthese huge but hitherto neglected areas. The NRAA isexpected to harmonize across the different CentralGovernment efforts and offer expert advice to States onhow to integrate these in their own agricultural plans.
1.128 The pace of watershed development must beaccelerated to cover about 37 MH in the Eleventh Plan.To sustain people’s participation, it is necessary to havelonger treatment and inclusion of a farming systemscomponent. With the higher unit costs envisaged, andincluding soil conservation measures, this would re-quire a minimum investment of Rs 36000 crore onNatural Resource Management (NRM) during theEleventh Plan. This magnitude of investment is fea-sible if the combined investment on irrigation andNRM increases at 12% per annum from their 2006–07 base, but only if the States progressively shift someof the resources currently expended on irrigation toNRM. States could utilize resources available from theRKVY for this purpose. At the same time, existingCentral Sector NRM programmes under Macro Man-agement and Sustainability of dry land farming willbe linked to a new and larger programme for rainfedfarming systems with a much wider focus so as to bringthe watershed-plus element into programmes of theMinistry of Agriculture and of Rural Development.The National Rainfed Authority will provide guide-lines and technical inputs.
STRENGTHENING INPUT AND SUPPORT SERVICESAND RATIONALIZING SUBSIDIES1.129 The present unbalanced and irrational sys-tem of fertilizer subsidy is an important cause ofdeteriorating soil quality. There is an urgent need to

36 Eleventh Five Year Plan
rationalize subsidy across nutrients and also examinemethods by which the delivery of some part of the pres-ently huge subsidies can be transferred from fertilizerproducers to farmers or a group of farmers directly.
1.130 Soil health awareness must be promotedthrough a credible system of soil testing and of adviceon nutrient needs based on soil tests.
1.131 Agricultural extension is critical for narrowingthe more general knowledge gaps that exists in ouragriculture. States must begin by filling up field-levelvacancies in extension and provide much better train-ing, including at SAUs. At the same time, the Centre’splan to support the KVKs and ATMAs should besynergized and made part of a comprehensive andparticipatory district planning process. Alternatedelivery channels spanning Rural Knowledge Centres,ICT-based extension, farmer-to-farmer extension,NGOs, and the private sector should also be promotedsimultaneously. ATMAs capacity in relatively neglectedareas, such as animal husbandry must be increased andthe scope of Strategic Research Extension Plans (SREP)enlarged. The SREP and ATMAs will form a core partof agricultural district planning to be incentivized bythe RKVY.
1.132 There is also a need to ensure adequate andtimely supply of the quality inputs of which thesupply of seed needs the most urgent attention. Theseed production and distribution system must be re-vamped by strengthening public sector seed agenciesand by involving private trade in seed multiplicationand distribution system. States must simultaneouslystrengthen their systems to check quality of inputs sincethere is evidence that sale of spurious seed, fertilizer,and farm chemicals is on the rise.
1.133 An associated issue is that of credit outreach.In order to revamp the co-operative credit structure,all the States must act urgently to implement theVaidyanathan Committee recommendations. Earlyreports are promising, but monitorable deadlines mustbe set to meet the required commitments.
1.134 Promoting financial inclusion should receivehigher priority than the demand for lower interest
rates. We need to move towards universal banking,including group lending and a rural credit informa-tion system aimed at smart Kisan Credit Cards (KCCs)for all. Although arbitrary debt waivers should beavoided, the present situation on farm debt requiresthat banks and State Governments act together to setup some appropriate formal mechanism to expediteone-time settlements.
1.135 The existing NAIS is a Plan Scheme with verylimited coverage and there is strong demand to expandthis massively and to reduce the basis of assessmentfrom block to the village. This involves high cost if it isdone in an actuarial basis and also raises issues of moralhazard. However, new insurance providers and prod-ucts are emerging and could offer more choice thancurrently. Expansion of insurance should be a Stateinitiative, which the Centre should support throughan Additional Central Assistance (ACA)/CSS, whileretaining the existing NAIS on the non-Plan side.
1.136 Another aspect of risk mitigation is to reduceprice uncertainty. MSP exist, and farmers in everyregion need to be supported in at least one food andone non-food crop in each marketing season. The flex-ibility provided by our WTO bound tariffs should beused symmetrically to protect farmers from excessiveinternational price volatility.
FOOD SECURITY1.137 Food security considerations remain an imme-diate priority. In view of this, and the large existingpotential from yield gaps in eastern and centralIndia, the Central Government has launched theNational Food Security Mission as a Central sectorscheme in mission-mode aimed at increasingfoodgrains production by at least 20 million tonnesby the end of Eleventh Plan. This programme concen-trates particularly on increasing seed replacementand the replacement of older varieties by newerones. Adequate emphasis will also be given to betterground water utilization and linkage with RGGVY. Afeature of this scheme is that it provides much morethan earlier programmes on capacity building, moni-toring, and planning and that the execution of theprogramme would be within the district planningframework.
Agriculture 37
DIVERSIFICATION1.138 Available demand projections suggest that thedemand for foodgrains, including for uses other thanfor direct human consumption, will grow at 2–2.5%per annum during Eleventh Plan, traditional cash cropssuch as oilseeds, fibres, and sugarcane at 3–4% perannum and livestock and horticulture at 4–6% perannum. Diversification towards horticulture and live-stock therefore will have to be a very major element inthe strategy for achieving 4% agricultural growth. Suchdiversification not only offers opportunity for raisingfarm incomes significantly, employment elasticity forthese activities is quite high and these are also likely toput less pressure on natural resources.
1.139 The NHM is already the largest single schemeof the Union Ministry of Agriculture (MoA), withmore allocation than for all other crops put together.However, this still largely excludes vegetable produc-tion and there is still a shortage of quality plantingmaterial. Moreover, horticulture statistics continue tobe very weak so that there is inadequate benchmark toassess either the selections made regarding crop clus-ters or the Mission’s overall impact. Although Stateshave welcomed the NHM, their own efforts are stillinadequate, for example, on possibilities of converg-ing with other schemes such as integrating withwatershed development, using the NREG to developorchards or using the Mid-day Meals (MDM) schemeto provide a stable local source of demand. There isdanger that full opportunities of horticulture may bemissed if horticulture has less than full co-operationfrom other relevant departments. For this reasonthe district plans incentives by RKVY will put broademphasis on such convergence.
1.140 Agricultural marketing is a critical element ofthe diversification strategy. Since high-value agricul-ture is based on perishable commodities, large invest-ments are required in modern methods of grading,PHM, and development of cold chains. Such invest-ment in turn requires that new players, including largecorporate players, be able to enter existing markets andset up new marketing channels. The NHM thereforeincentivizes the on-going marketing reforms based onamending existing APMC Acts to allow this. This pro-cess has started in earnest, with many business houses
investing in the area and with most States having al-ready made APMC amendments. However, this mustbe taken to its logical conclusion. Many States that havemade APMC amendments are yet to frame the neces-sary rules. This uncertainty needs to be removed assoon as possible.
1.141 Contract farming is another mechanismwhereby the private corporate sector can establish link-ages between farmers and markets. This needs to bebacked by ensuring effective mechanisms for contractregistration and dispute resolution, along with ad-equate information and support so that small farmersare able to enter into collective contracts.
1.142 Food processing also needs to be strengthenedto create demand for agricultural produce, cut downor eliminate post-production losses and provide valueadded products. Investment in food processing, espe-cially in rural areas would lead to a higher realizationto farmers as this would generate additional demandfarm products as well as create employment opportu-nities in the non-farm sector crating a virtuous cyclein the process.
1.143 Livestock and fishery development need amajor step-up in infrastructure and policy support.There is need to massively expand the breeding infra-structure for cattle and buffalo, utilizing scope forimprovement through selective breeding using betterquality indigenous stock. India needs a comprehensivedisease control programme, including for small rumi-nants and poultry, and a definite policy to cope withthe growing problem of surplus male cattle. Newinitiatives contemplated during Eleventh Plan includesalvaging and rearing of male buffalo calves, entrepre-neurial development for commercial rearing of smallruminants and pigs, a separate poultry capital venturefund to promote establishment of poultry estates, re-tail poultry outlets, and other poultry activities. Dur-ing Eleventh Plan new initiatives are envisaged toprovide infrastructure for deriving economic gainsfrom the fallen animals and also for training of theprimary producers to create awareness regarding ac-ceptable level of food safety at various levels of animalhusbandry. In fishery, there is need to establish morehatcheries and ensure stockable sizes of seed for ponds,

38 Eleventh Five Year Plan
tanks, and reservoir sites. All this would require muchmore commitment from States than is indicated by theircurrent annual plan (AP) allocation of only aroundRs 2100 crore for all these activities, including dairy.The Centre, too, will require stepping up its efforts,especially in areas of feed/fodder supply, disease con-trol, and in ensuring progeny testing and traceability.
1.144 The recently set up NFDB has huge potentialand requires being up-scaled rapidly. It is also neces-sary to reduce the present duplication of effortsbetween the Department of Animal Husbandry andthe NDDB and resolve the associated disagreementson a long-term strategy for dairy development. TheNDDB has proposed a National Dairy Plan. This needsto be considered seriously by the States and their viewsincorporated in the Eleventh Plan.
EQUITY ISSUES
SMALL FARMERS’ NEEDS1.145 Given that 80% of farmers are small and mar-ginal, and, increasingly female, special steps will beneeded to improve their effective access to inputs,credit, extension services, and output markets. It is nowwell recognized that the poor are best empowered ifthey function as a group rather than as individuals andthat this is also the best way to secure economies ofscale. Hence for the poor and for women to gain andbe effective farmers we should encourage a ‘groupapproach’. This could range from low levels of collec-tive functioning such as joint investments in lumpyinputs such as tube wells or co-operatives for inputpurchase and marketing, to high levels of collectivefunctioning such as land pooling or even joint pur-chase of leasing of land and joint farming. A group-oriented approach could benefit small farmers onmany different fronts:
• Investment in irrigation and irrigation deliverysystems.
• Information and input delivery.• Product marketing.• Promoting land access.• Land pooling of owned land, or joint purchase or
joint leasing in and group farming.• Contract farming.
1.146 An important task in this context will be to ex-amine the nature of subsidies in current schemes. Thereis a strong case to redesign these subsidies, givinggreater benefits to PRIS/farmers groups than individu-als, so as to incentivize group formation particularlyamongst small, marginal, and female farmers.
1.147 Managing vulnerabilities and demographicchange: All precaution must be taken to ensure thatthe poor do not get further excluded as a result of con-tingencies, whether natural or a part of the economicgrowth strategy. In particular, there should be no fearthat they will lose their lands involuntarily to largerentities:
• Survey/settlement should be completed and landtitles and their mutations issued and recorded prop-erly. If this is done, modern IT/GIS technologiescould be used to build an online registry of farmersand their land status. This would not only bringconfidence but also enable better credit linkage andeventually allow subsidies to be passed on to farm-ers directly.
• There is no justification, at this stage, for encourag-ing corporate farming by relaxing the existing ceil-ing on land ownership. In fact, if the registry aboveis done properly, some ceiling-surplus land will beavailable for distribution. In any case, since manyricher farmers are exiting agriculture voluntarily,small farmers should be assisted to buy land throughthe provision of institutional credit on long-termbasis at a low rate of interest.
• At the same time, the land-lease market should beliberalized. The two major elements of such reformare: security of tenure for the tenants during theperiod of contract and the right of the land-ownerto resume land after the period of contract is over.The right should be especially firmly available tosmall farmers.
• Special programmes need to be designed and imple-mented to enable small farmers to improve theircapacity to go for high value commercial activitiesin crop production, dairy, poultry, fisheries, etc.
1.148 Gender equity: With the share of female work-force in agriculture increasing, and increased incidenceof female-headed households, there is an urgent need

Agriculture 39
to ensure women’s rights to land and infrastructuresupport:
• Women’s names should be recorded as cultivatorsin revenue records on family farms where womenoperate the land having ownership in the name ofmale members.
• The gender bias in functioning of institutions forinformation, extension, credit, inputs, and market-ing should be corrected by gender-sensitizing theexisting infrastructure providers.
• Women’s co-operatives and other forms of groupeffort should be promoted for the dissemination ofagricultural technology and other inputs, as well asfor marketing of produce.
• Wherever possible a group approach for investmentand production among small scale womenfarmers, be it on purchased or leased land, shouldbe promoted. Women farmers are typically unableto access inputs, information, and market produceon an individual basis. A group approach wouldempower them.
1.149 Regional balance: A problem, not peculiar toagriculture, is that poorer States that have poor in-frastructure not only miss out on private investmentbut also cannot avail many Central governmentprogrammes. The Bharat Nirman initiative is attempt-ing to rectify some of this so far as rural areas areconcerned but two sources of bias in agricultureagainst poorer States need to be corrected:
• The Rural Infrastructure Development Fund (RIDF)recycles to States for infrastructure creation banks’shortfall in agricultural lending from priority lend-ing norms. This should ideally go to those States andbenefit those who have least access to credit. In fact,most RIDF funds go to States where rural credit–deposit ratios are relatively high. This should be cor-rected, along with RIDF allocations changed frombeing year-to-year to a longer allocation so that thiscan be built properly into State and district plans.
• Regions with poor market infrastructure areusually excluded from MSP operations by Centralagencies. Since this leads to a double disadvantagefor farmers in such regions, some arrangementneeds to be made, for example a revolving price sta-
bilization fund, so that short-term credit from thiscan be easily availed by PRIs to do their own MSPpurchase which can then be delivered to the Cen-tral agencies involved.
• The new Eleventh Plan schemes will put specialemphasis on regional balance. For example theRKVY gives special weightage to rainfed areas andthe selection of districts under National FoodSecurity Mission especially targets districts withcurrently low yields but high potential.
RESTRUCTURING AGRICULTURE PLANNING1.150 An important innovation during the EleventhPlan is the new RKVY with an outlay of Rs 25000 crore,which is designed to give more flexibility to States,and incentivize them to spend more on agriculture onthe basis of properly designed district and State plans.The RKVY provides a framework to achieve thisobjective since it requires that every district shoulddraw up a district plan that fully utilizes an initial re-source envelope available from all existing schemes,State or Central, including resources at district levelfrom Central schemes such as those of Rural Devel-opment, Ministry of Panchayati Raj, Ministry ofWater Resources (MoWR), and other ministries. TheDistrict Agricultural Plan should include livestock andfishing and be integrated with minor irrigation (MI)projects, rural development works, and with otherschemes for water harvesting and conservation. TheState agricultural plan should be based on these initialdistrict plans, subject to reasonable resources from itsown plan and adding those available from the Centre,aimed at achieving the State’s agricultural growthobjective, keeping in view the sustainable managementof natural resources and technological possibilitiesin each agro-climatic region. This plan should thendetermine each district’s final resource envelope, theirproduction plan, and the associated input plan.Annual targets at the start of the fiscal year should befixed and funds for relevant schemes ensured, withimplementation reviewed every quarter both atdistrict and State level.
1.151 Most agricultural activities figure in ScheduleXI of the Constitution and form part of the domainof PRIs. The 74th Constitutional Amendment Actstipulates District Planning Committees at the district
40 Eleventh Five Year Plan
level to integrate sectoral plans of a district whichthen get further integrated into the State plans. ThePlanning Commission has already issued detailedguidelines of Plan process which needs to be followedby the States while preparing District Agriculture Planas well.
1.152 Unfortunately, State Agricultural Plans today arefar from this ideal. In many cases these are only littlemore than an aggregation of the States’ share of CSSwhose guidelines are Centrally determined and whoserelease is often a problem. Moreover, since Centralfunds flow through different channels and to differentlevels, district plans are no more than a collection ofproposals to different Central departments and sinceeach Central department clears proposals on its ownpriorities, the resulting State and district plans losethe application of minds which can come up withbetter region-specific solutions. Things are, of course,somewhat better where the State plan component oftotal Plan expenditure on agriculture is high, but thisis getting rare.
1.153 There is, therefore, a need to ensure that ad-equate resources are available for agriculture from bothCentre and State and that this be known adequately inadvance for meaningful planning at district and Statelevels. The RKVY is an attempt to address these issues.It is conditional on States adopting appropriate dis-trict planning and also on States maintaining a base-line share for agriculture in total Plan expenditure. Theguidelines already issued strongly incentivize higherState expenditure on the sector and also stressesalmost all the priorities outlined earlier in the chapter.
1.154 In this format, not only RKVY but also the workplans of existing schemes of macro-management andextension (including district-level SREPs) will be in-tegrated into the district plans. On the basis of these,the State plan can be the basis for early discussionbetween the State, the Ministry of Agriculture, and thePlanning Commission so that resource envelopes canaccordingly be communicated to the districts. It wouldallow much more integration especially with NRM,on which the NRAA could advise and also provide
incentives for States to maintain the share of agricul-ture in their own plans. The Planning Commission,along with Ministry of Agriculture and Panchayati Raj,has already started intensive consultation with Statesto put into effect adequate and comprehensive districtagricultural planning. If this works, the Centre couldconsider, in consultation with States, decentralizingthe administration of its CSS through empoweredRegional Production Commissioners acting alongsideICAR regional co-ordinators so that the Central rolein both R&D becomes more consistent, with the agro-economic requirements. However, the workability ofthis needs to be further discussed in detail with theState Government.
FINANCING OF THE ELEVENTH PLAN1.155 The Eleventh Plan strategy of inclusive growthrests upon substantial increase in public sector outlay.The Eleventh Plan allocation at 2006–07 price is pro-jected at Rs 54801 crore as against a Tenth Plan outlayof Rs 20513 crore at 2001–02 price. The total projectedGross Budgetary Support (GBS) for the Eleventh Planfor Department of Agriculture and Cooperation isRs 36549 crore (2006–07 price) and Rs 41337 crore(current price), for DAHDF is Rs 7121 crore (2006–07price) and Rs 8054 crore (current price) and forDepartment of Agriculture Research and Education isRs 11131 crore (2006–07 price) and Rs 12588 crore(current price). (Details at Annexure 1.3.)
As has been highlighted in the chapter, in additionto this, the government has already initiated measuresto incentivize State Governments to increase invest-ment in agriculture sector by provision of Rs 25000crore ACA to States over the plan period through theRKVY. In addition to these budgetary supports pro-vided to Ministry of Agriculture, Rs 17205 crore wouldbe made available to MoRD for Natural ResourceManagement and support to the States for setting upan efficient Land Administration System. Investmentsin NREGA, BRGF, and Rural Infrastructure underBharat Nirman would also strengthen the growthimpulse in the agriculture sector. These measures areexpected to create conditions for drawing in privateinvestment as well which has been seen to be comple-mentary to public investment in agricultural sector.

Agriculture 41
ANNEXURE 1.1Plan Outlays for the Centre, States and UTs
(Rs Crore)
Total Plan Agriculture Irrigation Total Total Plan Agriculture Irrigation TotalOutlay and Allied and Flood (3) + (4) Outlay and Allied and Flood (7) + (8)
Sectors Control Sectors Control
At Current Price At 2001–02 Price
(1) (2) (3) (4) (5) (6) (7) (8) (9)
Eighth Plan (1992–97) 434100.0 22467.2 32525.3 54992.5 853898.25 44194.2 639793.0 108173.2outlay (5.2%) (7.5%) (12.7%) (5.2%) (7.5%) (12.7%)
Ninth Plan (1997–2002) 859200.0 42462.0 55420.0 97882.0 1094541.7 54092.7 70599.9 124692.7outlay (4.9%) (6.5%) (11.4%) (4.9%) (6.5%) (11.4%)
Tenth Plan (2002–07) 1525639.0 58933.0 103315.0 162248.0 1525639.0 58933.0 103315.0 162248.0outlay (3.9%) (6.8%) (10.6%) (3.9%) (6.8%) (10.6%)
Annual Plan 2002–03 210202.9 7655.1 11964.8 19620.3 202333.92 7368.5 11516.9 18885.8(Actual) (3.6%) (5.7%) (9.3%) (3.6%) (5.7%) (9.3%)
Annual Plan 2003–04 224827.0 8776.0 12900.3 21676.3 208497.1 8138.6 11963.3 20101.9(Actual) (3.9%) (5.7%) (9.6%) (3.9%) (5.7%) (9.6%)
Annual Plan 2004–05 263665.2 10962.6 19024.5 29987.1 234279.1 9740.8 16904.2 26644.9(Actual)) (4.2%) (7.2%) (11.4%) (4.2%) (7.2%) (11.4%)
Annual Plan 2005–06 351629.5 13439.8 25007.0 38446.8 299132.7 11433.3 21273.6 32706.8(RE) (3.8%) (7.1%) (11.2%) (3.8%) (7.1%) (11.2%)
Annual Plan 2006–07 441285.2 16162.8 33189.4 49352.2 354941.2 13000.3 26695.4 39695.7(3.7%) (7.5%) (11.2%) (3.7%) (7.5%) (11.2%)
Total Tenth Plan 1491616.2 56996.3 102086.00 159082.7 1299183.98 49681.5 88353.3 138035.2expenditure (3.82%) (6.84%) (10.67%) (3.82%) (6.84%) (10.67%)
Tenth Plan expenditure 97.8% 96.7% 98.8% 98.1% 85.1% 84.3% 85.5% 85.1%as % of outlay
Note: Figures in brackets indicate % of total Plan outlay.
Source: Economic Survey 2006–07.

42 Eleventh Five Year Plan
ANNEXURE 1.2Degraded Lands Developed under Various Watershed Development Programmes—
since Inception upto the Tenth Five Year Plan(Area in Lakh Hectares and Expenditure in Rs Crore)
S. No. Ministry/Scheme and Progress since Progress in Total sinceYear of Start Inception up Tenth Plan* Inception up
to Ninth Plan (2002–07) to Tenth Plan*
Area Expr. Area Expr. Area Expr.
(A) Ministry of Agriculture (Department of Agriculture and Co-operation)
NWDPRA (1990–91) 69.79 1877.74 23.30 1147.82 93.09 3025.56RVP and FPR (1962 and 1981) 54.88 1516.26 9.98 727.98 64.86 2244.24WDPSCA (1974–75) 2.58 166.27 1.35 129.31 3.93 295.58RAS (1985–86) 5.81 76.39 1.30 45.35 7.11 121.74WDF (1999–2000) 0.00 0.00 0.59 26.02 0.59 26.02EAPs 13.35 2039.81 4.80 1927.54 18.15 3967.35
Subtotal 146.41 5676.47 41.32 4004.02 187.73 9680.49
(B) Ministry of Rural Development (Department of Land Resources)
DPAP(1973–74) 68.95 3284.74 68.32 1557.76 137.27 4842.50DDP(1977–78) 33.56 797.38 45.17 1152.50 78.73 1949.88IWDP(1988–89) 37.34 616.51 62.22 1821.64 99.56 2438.15EAPs 1.40 18.39 3.60 274.28 5.00 292.67
Subtotal 141.25 4717.02 179.31 4806.18 320.56 9523.20
(C) Ministry of Environment and Forests
NAEP(1989–90) 0.70 47.53 0.00 0.00 0.70 47.53
Total (A+B+C) 288.36 10441.02 220.63 8810.20 508.99 19251.22
Note: * Includes tentative achievement of 2006–07.Source: Report of the Working Group on Natural Resources Management for the Eleventh Five Year Plan (2007–12), Planning Commis-sion, Government of India (February 2007).
ANNEXURE 1.3Projection for Central Sector GBS—Ministry-wise for the Eleventh Plan
(Rs Crore)
S. No. Ministry/Department Tenth Plan BE Eleventh Eleventh Plan(2001–02) Plan Base
Price Year2006–07 BE
Constant Current(2006–07) Price
1. Department of Agriculture and Co-operation 13883 4800 36549 413372. Department of Agricultural Research and Education 4422 1350 11131 125883. Department of Animal Husbandry, Dairying, and Fisheries 2208 777 7121 8054
Note: In addition, Rs 25000 crore will be provided as Central Assistance to States through RKVY, to be administered by DAC.
2Water Management and Irrigation
INTRODUCTION2.1 Sustainable development and efficient manage-ment of water is an increasingly complex challenge inIndia. Increasing population, growing urbanization,and rapid industrialization combined with the needfor raising agricultural production generates compet-ing claims for water. There is a growing perception ofa sense of an impending water crisis in the country.Some manifestations of this crisis are:
• There is hardly any city which receives a 24-hoursupply of drinking water.
• Many rural habitations which had been coveredunder the drinking water programme are now be-ing reported as having slipped back with target datesfor completion continuously pushed back. Thereare pockets where arsenic, nitrate, and fluoride indrinking water are posing a serious health hazard.
• In many parts, the groundwater table declines dueto over-exploitation imposing an increasing finan-cial burden on farmers who need to deepen theirwells and replace their pump sets and on StateGovernments whose subsidy burden for electricitysupplies rises.
• Many major and medium irrigation (MMI) projectsseem to remain under execution forever as they slipfrom one plan to the other with enormous cost andtime overruns.
• Owing to lack of maintenance, the capacity of theolder systems seems to be going down.
• The gross irrigated area does not seem to be risingin a manner that it should be, given the investment
in irrigation. The difference between potentialcreated and area actually irrigated remains large.Unless we bridge the gap, significant increase inagricultural production will be difficult to realize.
• Floods are a recurring problem in many partsof the country. Degradation of catchment areasand loss of flood plains to urban developmentand agriculture have accentuated the intensity offloods.
• Water quality in our rivers and lakes is far from sat-isfactory. Water in most parts of rivers is not fit forbathing, let alone drinking. Untreated or partiallytreated sewage from towns and cities is beingdumped into the rivers.
• Untreated or inadequately treated industrial efflu-ents pollute water bodies and also contaminategroundwater.
• At the same time water conflicts are increasing.Apart from the traditional conflicts about waterrights between upper and lower riparians in a river,conflicts about quality of water, people’s right forrainwater harvesting in a watershed against down-stream users, industrial use of groundwater andits impact on water tables and between urban andrural users have emerged.
2.2 India with 2.4% of the world’s total area has 16%of the world’s population; but has only 4% of the totalavailable fresh water. This clearly indicates the needfor water resource development, conservation, andoptimum use. Fortunately, at a macro level India is notshort of water. The problems that seem to loom large

44 Eleventh Five Year Plan
over the sector are manageable and the challenges fac-ing it are not insurmountable.
AVAILABILITY OF WATER
WATER RESOURCES2.3 The water resource potential of the country hasbeen assessed from time to time by different agencies.The different estimates are shown in Table 2.1. It maybe seen that since 1954, the estimates have stabilizedand are within the proximity of the currently acceptedestimate of 1869 billion cubic metre (bcm) whichincludes replenishable groundwater which gets chargedon annual basis.
TABLE 2.1Estimates of Water Resources in India
Agency Estimate Deviationin from
bcm 1869 bcm
First Irrigation Commission (1902–03) 1443 –23%Dr A.N. Khosla (1949) 1673 –10%Central Water and Power Commission
(1954–66) 1881 +0.6%National Commission on Agriculture 1850 –1%Central Water Commission (1988) 1880 +0.6%Central Water Commission (1993) 1869 –
UTILIZABLE WATER RESOURCES POTENTIAL2.4 Within the limitations of physiographic condi-tions, socio-political environment, legal and constitu-tional constraints, and the technology available at hand,the utilizable water resources of the country have beenassessed at 1123 bcm, of which 690 bcm is from sur-face water and 433 bcm from groundwater sources(CWC, 1993). Harnessing of 690 bcm of utilizablesurface water is possible only if matching storages arebuilt. Trans-basin transfer of water, if taken up to thefull extent as proposed under the National PerspectivePlan, would further increase the utilizable quantity byapproximately 220 bcm. The irrigation potential of thecountry has been estimated to be 139.9 MH withoutinter-basin sharing of water and 175 MH with inter-basin sharing.
2.5 While the total water resource availability in thecountry remains constant, the per capita availabilityof water has been steadily declining since 1951 due to
population growth. The twin indicators of water scar-city are per capita availability and storage. A per capitaavailability of less than 1700 cubic metres (m3) istermed as a water-stressed condition while if per capitaavailability falls below 1000 m3, it is termed as a water-scarcity condition. While on an average we may benearing the water-stressed condition, on an individualriver basin-wise situation, nine out of our 20 riverbasins with 200 million populations are alreadyfacing a water-scarcity condition. Even after construct-ing 4525 large and small dams, the per capita storagein the country is 213 m3 as against 6103 m3 in Russia,4733 m3 in Australia, 1964 m3 in the United States (US),and 1111 m3 of China. It may touch 400 m3 in Indiaonly after the completion of all the ongoing andproposed dams.
ULTIMATE IRRIGATION POTENTIAL (UIP)2.6 The demand for irrigation water in India is verylarge. However, the limits to storage and transfer ofwater restrict the potential for irrigation. UIP reassessedby the Committee constituted by the MoWR in May1997, the potential created, and the potential utilizedup to end of the Tenth Plan are given in Table 2.2.
2.7 The assessment of UIP needs to be periodicallyreviewed to account for revision in scope, technologi-cal advancement, inter-basin transfer of water, inducedrecharging of groundwater, etc. The creation of irriga-tion potential depends upon the efficiency of thesystem for delivering the water and its optimal use atthe application level. With the modern techniques ofintegrating micro irrigation with canal irrigation as hasbeen done in the case of Narmada Canal Project,Rajasthan, the UIP can further be increased. Similarlyin the case of groundwater, innovative methods ofrecharging the groundwater and also storing water inflood plains along the river banks may enhance the UIPfrom groundwater to more than 64 MH.
WATER FOR NATURE2.8 The question of a trade-off between competingclaims on water becomes most important in the con-text of ecological requirement. The National WaterPolicy (NWP) places ecology in the fourth place inthe order of priorities for water use. Yet, there is a gen-eral agreement amongst all that any water diversion
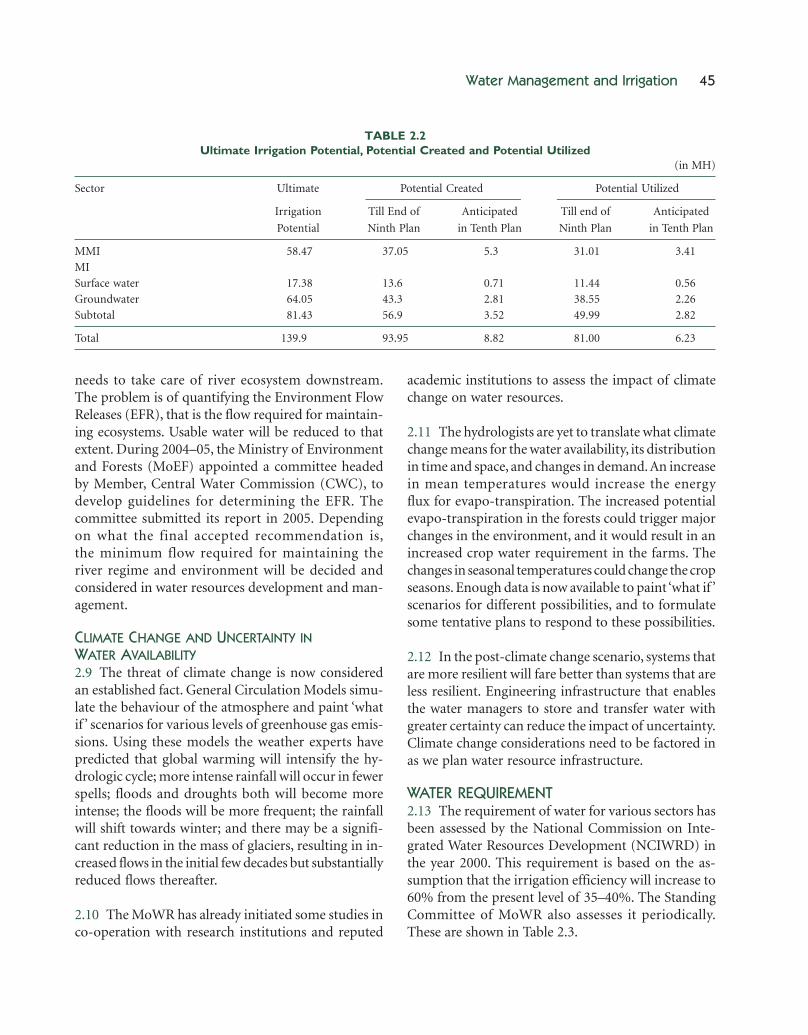
Water Management and Irrigation 45
needs to take care of river ecosystem downstream.The problem is of quantifying the Environment FlowReleases (EFR), that is the flow required for maintain-ing ecosystems. Usable water will be reduced to thatextent. During 2004–05, the Ministry of Environmentand Forests (MoEF) appointed a committee headedby Member, Central Water Commission (CWC), todevelop guidelines for determining the EFR. Thecommittee submitted its report in 2005. Dependingon what the final accepted recommendation is,the minimum flow required for maintaining theriver regime and environment will be decided andconsidered in water resources development and man-agement.
CLIMATE CHANGE AND UNCERTAINTY INWATER AVAILABILITY2.9 The threat of climate change is now consideredan established fact. General Circulation Models simu-late the behaviour of the atmosphere and paint ‘whatif ’ scenarios for various levels of greenhouse gas emis-sions. Using these models the weather experts havepredicted that global warming will intensify the hy-drologic cycle; more intense rainfall will occur in fewerspells; floods and droughts both will become moreintense; the floods will be more frequent; the rainfallwill shift towards winter; and there may be a signifi-cant reduction in the mass of glaciers, resulting in in-creased flows in the initial few decades but substantiallyreduced flows thereafter.
2.10 The MoWR has already initiated some studies inco-operation with research institutions and reputed
academic institutions to assess the impact of climatechange on water resources.
2.11 The hydrologists are yet to translate what climatechange means for the water availability, its distributionin time and space, and changes in demand. An increasein mean temperatures would increase the energyflux for evapo-transpiration. The increased potentialevapo-transpiration in the forests could trigger majorchanges in the environment, and it would result in anincreased crop water requirement in the farms. Thechanges in seasonal temperatures could change the cropseasons. Enough data is now available to paint ‘what if ’scenarios for different possibilities, and to formulatesome tentative plans to respond to these possibilities.
2.12 In the post-climate change scenario, systems thatare more resilient will fare better than systems that areless resilient. Engineering infrastructure that enablesthe water managers to store and transfer water withgreater certainty can reduce the impact of uncertainty.Climate change considerations need to be factored inas we plan water resource infrastructure.
WATER REQUIREMENT2.13 The requirement of water for various sectors hasbeen assessed by the National Commission on Inte-grated Water Resources Development (NCIWRD) inthe year 2000. This requirement is based on the as-sumption that the irrigation efficiency will increase to60% from the present level of 35–40%. The StandingCommittee of MoWR also assesses it periodically.These are shown in Table 2.3.
TABLE 2.2Ultimate Irrigation Potential, Potential Created and Potential Utilized
(in MH)
Sector Ultimate Potential Created Potential Utilized
Irrigation Till End of Anticipated Till end of Anticipated
Potential Ninth Plan in Tenth Plan Ninth Plan in Tenth Plan
MMI 58.47 37.05 5.3 31.01 3.41
MI
Surface water 17.38 13.6 0.71 11.44 0.56
Groundwater 64.05 43.3 2.81 38.55 2.26
Subtotal 81.43 56.9 3.52 49.99 2.82
Total 139.9 93.95 8.82 81.00 6.23

46 Eleventh Five Year Plan
WATER RESOURCES DEVELOPMENTAND USE: IRRIGATION
HISTORICAL DEVELOPMENT2.14 The planned development of irrigation sectorstarted in a big way since the First Five Year Plan(1951–56). New projects were taken up in the SecondFive Year Plan, the Third Five Year Plan, and theAnnual Plans 1966–69. During the Fourth Five YearPlan emphasis was shifted to the completion of ongo-ing schemes. The widening gap between potentialcreation and utilization was felt in the Fifth Plan (1974–78) and accordingly Command Area Development(CAD) programme was launched. The Annual Plans1978–80 and the Sixth Plan witnessed new starts andthen the focus was shifted towards completion ofirrigation projects. By the end of the Eighth Plan(1996–97), central assistance was provided under AIBPto help the State Governments in early completion ofthe projects.
2.15 Although plan expenditure on irrigation hasincreased from Rs 441.8 crore in the First Plan toRs 95743.42 crore (outlay) in the Tenth Plan, the sharein total plan expenditure has decreased from 23%in the First Plan to 6.3% in the Tenth Plan. The trendsin change of per cent of total plan expenditure on irri-gation sector are shown in Figure 2.1.
2.16 The anticipated irrigation potential created upto March 2007 is 102.77 MH, which is 73.46% ofthe UIP of 140 MH. MMI projects have an UIP of58.47 MH against which irrigation potential created is42.35 MH. MI potential created is 60.42 MH againstthe UIP of 81.43 MH. The irrigation potential creationand its corresponding utilization during the planperiods is given in Annexure 2.1.
2.17 The gross irrigated area in the country is only87.23 MH. With an average irrigation intensity of140%, the actual net irrigated area is likely to bearound 62.31 MH, which is only 43% of the net sownarea of the country (142 MH). Even after achievingthe UIP of 139.89 MH. and considering the averageirrigation intensity of 140%, the ultimate irrigatedarea in the country would be only 70% of the netsown area.
2.18 The increasing difference between irrigationpotential created and utilized is ascribed to a numberof reasons. Irrigation systems are designed for exten-sive irrigation for a 75% confidence level. Thus wateravailability in some basins would be less the designedamount. Excess withdrawal by farmers near the head
TABLE 2.3Water Requirement for Various Sectors
Sector Water Demand in km3 (or bcm)
Standing Sub- NCIWRDCommittee of MoWR
2010 2025 2050 2010 2025 2050
Irrigation 688 910 1072 557 611 807Drinking water 56 73 102 43 62 111Industry 12 23 63 37 67 81Energy 5 15 130 19 33 70Others 52 72 80 54 70 111
Total 813 1093 1447 710 843 1180
FIGURE 2.1: Expenditure on Irrigation
0
5
10
15
20
25
1950 1960 1970 1980 1990 2000
Year
%o
fT
ota
lP
lan
Exp
end
itu
re

Water Management and Irrigation 47
of canals deprives farmers at the tail end of water.Inadequate development of field channels, required tobe developed by farmers, contribute to the gap. Themissing links or breaks in the canal network mayalso reduce utilization. A part of this gap can be re-duced by command area development programmes.Under the CAD Programme, 311 projects [with totalculturable command area (CCA) of 28.58 MH] havebeen included so far. Till the end of March 2006, theconstruction of field channels has been completed inan area of 17.43 MH. The programme is presentlybeing implemented in 136 projects with total CCA of17.06 MH.
2.19 Details of the physical progress achieved inrespect of core components under the Command AreaDevelopment and Water Management (CADWM)Programme during the Tenth Plan till the end of March2006 and progress likely to be achieved till end of TenthPlan are given in Table 2.4.
2.20 The total anticipated State share expenditure forthe Tenth Plan under the CADWM Programme worksout to Rs 1591.57 crore.
MAJOR AND MEDIUM PROJECTS
Physical and Financial Performance2.21 The potential creation target fixed for the TenthPlan by the Planning Commission was 9.93 MH. It wasrevised to 6.5 MH during the MTA of the Plan. Theperformance during the first three years of the TenthPlan and anticipated performance for remaining twoyears is given in Table 2.5.
Completion of Projects2.22 A total number of 490 projects spilled into theTenth Plan from previous plans, and another 231projects were to be taken up during the Tenth Plan.Besides, based on the current financial and physicalstatus of the projects, it was also anticipated that 103major, 210 medium, and 62 extension, renovation, andmodernization (ERM) projects could be completedwith adequate provision of funds. Since irrigation is aState subject, the projects are largely executed by StateGovernments. The Working Group for Water Resourcesfor the Eleventh Five Year Plan has now assessed that179 new projects have been taken up in the Tenth Plan,while 178 projects including 48 major, 91 medium, and
TABLE 2.4Physical Progress under CAD and Water Management (CADWM) Programme in the Tenth Plan
(in MH)
S. No. Item Progress till the Anticipated Progress Total AnticipatedEnd of March 2006 during 2006–07 Progress for Tenth Plan
1 Field channels 1.671 0.373 2.0442 Field drains 0.476 0.108 0.5843 Wara Bandi 0.929 0.124 1.0534 Land levelling* 0.050 – 0.050
Note: * This component was discontinued w.e.f. 1 April 2004.
TABLE 2.5Physical and Financial Performance of MMI Sector during the Tenth Plan
Year Physical (in MH) Financial (in Rs Crore)
Potential Created Potential Utilized Revised Outlay Expenditure
2002–03 0.812 0.532 13131.51 9655.682003–04 0.922 0.639 12334.79 11046.402004–05# 1.064 0.685 15483.05 15483.052005–06# 1.069 0.625 30263.83 30263.832006–07* 1.428 0.928
Total 5.295 3.409 71213.18 66448.96
Note: # anticipated; * targeted.

48 Eleventh Five Year Plan
39 ERM projects would be completed during the TenthPlan. The reasons for non-completion of the projectsfrom the projected level include inadequate funds dueto thin spread of funds over many projects, revisionin the estimated costs, change in scope of the works, un-foreseen bottlenecks involving other agencies,opposition by the project-affected persons (PAPs), etc.
Spillover Projects into Eleventh Five Year Plan2.23 In the course of analysing the status of ongoingprojects likely to spill over, it is observed that a num-ber of previously unreported projects have now beenreported; some of the ongoing projects deferred whilesome of the projects have been interchanged amongthe classified heads of major, medium, and ERMprojects. After accounting for the number of newprojects taken up in the Tenth Plan, projects likelyto be completed in the Tenth Plan, and other factorsinducing changes in the number of projects, the num-ber of spillover projects into the Eleventh Five YearPlan works out to be 477 including 166 major, 222medium, and 89 ERM projects. The status is givenin Table 2.6.
2.24 Projects of all three types have been under ex-ecution for many years, some from as far back asthe Second Five Year Plan. Around 63% of the above477 projects are unapproved by the Centre and areineligible for central assistance.
Major and Medium Projects in Drought-proneAreas and Tribal Areas2.25 Projects in drought-prone areas and tribal areasare approved with a lower cut-off ratio of benefitsto costs to reflect the higher weight given to benefitsaccruing to these areas. About one-third of the totalgeographical area of the country is recognized asdrought-prone area. A total of 99 districts in 14 Statesare identified as drought prone. These districts havecultivable area of about 77 MH which is 42% of thecountry’s total cultivable area of 184 MH. Amongthe States, Gujarat and Rajasthan are the most drought-prone States followed by Karnataka and Maharashtra.At the beginning of Eleventh Five Year Plan, of the 477projects under implementation, 148 major and 195medium projects envisaged benefits to drought-pronedistricts. Among these, 76 major and 102 mediumprojects benefit tribal areas as well.
Unapproved Projects2.26 The schemes under the Plan sector require for-mal investment clearance from the Planning Commis-sion before execution. Accordingly, major schemes arescrutinized for techno-economic feasibility, inter-stateand international aspects, ecology and environmentalaspects, and rehabilitation aspects by the concernedCentral ministries. Recommendations of variousexpert agencies are then considered by the AdvisoryCommittee of the MoWR. Thereafter the proposal isconsidered by the Planning Commission for investmentclearance. In case of MMI projects the State PlanningBoards are empowered to clear the proposals if inter-state issues are not involved. In spite of well-definedpolicy and guidelines in place, a large number ofmajor and medium projects have been under execu-tion without investment clearance from PlanningCommission. The unapproved projects in the TenthPlan comprising 90 major, 136 medium, and 74 ERMprojects are likely to spill over into the Eleventh FiveYear Plan. Expenditure likely to be incurred on theseprojects up to the Tenth Plan will be about Rs 41128crore with the break-up as shown in Table 2.7.
ACCELERATED IRRIGATION BENEFIT PROGRAMME(AIBP)2.27 The additional irrigation potential created in thecountry from the beginning of the Sixth Plan (i.e. 1980)
TABLE 2.6Spillover Major, Medium and ERM
Projects into the Eleventh Plan
Plan of Start Major Medium ERM Totalof Project
I 0 0 0 0II 2 0 0 2III 5 1 0 61966–69 2 0 0 2IV 8 5 4 17V 33 19 1 531978–80 2 9 3 14VI 25 19 6 50VII 10 13 11 341990–92 2 2 0 4VIII 19 48 11 78IX 20 40 17 77X 38 66 36 140
Total 166 222 89 477
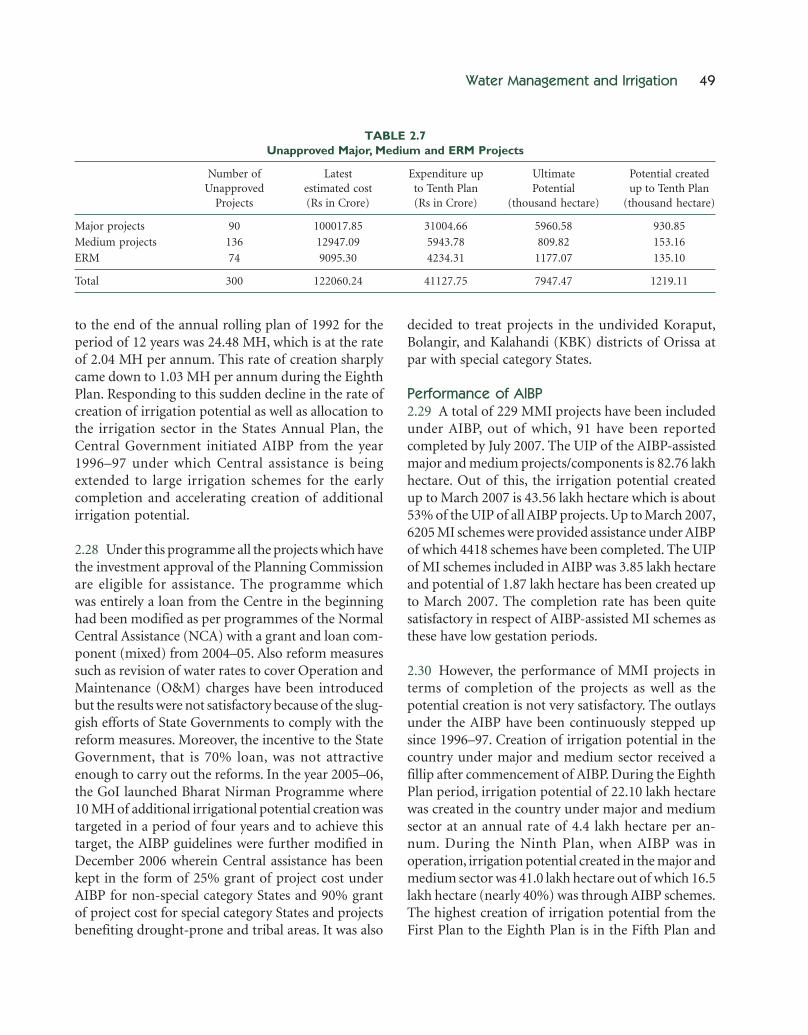
Water Management and Irrigation 49
to the end of the annual rolling plan of 1992 for theperiod of 12 years was 24.48 MH, which is at the rateof 2.04 MH per annum. This rate of creation sharplycame down to 1.03 MH per annum during the EighthPlan. Responding to this sudden decline in the rate ofcreation of irrigation potential as well as allocation tothe irrigation sector in the States Annual Plan, theCentral Government initiated AIBP from the year1996–97 under which Central assistance is beingextended to large irrigation schemes for the earlycompletion and accelerating creation of additionalirrigation potential.
2.28 Under this programme all the projects which havethe investment approval of the Planning Commissionare eligible for assistance. The programme whichwas entirely a loan from the Centre in the beginninghad been modified as per programmes of the NormalCentral Assistance (NCA) with a grant and loan com-ponent (mixed) from 2004–05. Also reform measuressuch as revision of water rates to cover Operation andMaintenance (O&M) charges have been introducedbut the results were not satisfactory because of the slug-gish efforts of State Governments to comply with thereform measures. Moreover, the incentive to the StateGovernment, that is 70% loan, was not attractiveenough to carry out the reforms. In the year 2005–06,the GoI launched Bharat Nirman Programme where10 MH of additional irrigational potential creation wastargeted in a period of four years and to achieve thistarget, the AIBP guidelines were further modified inDecember 2006 wherein Central assistance has beenkept in the form of 25% grant of project cost underAIBP for non-special category States and 90% grantof project cost for special category States and projectsbenefiting drought-prone and tribal areas. It was also
decided to treat projects in the undivided Koraput,Bolangir, and Kalahandi (KBK) districts of Orissa atpar with special category States.
Performance of AIBP2.29 A total of 229 MMI projects have been includedunder AIBP, out of which, 91 have been reportedcompleted by July 2007. The UIP of the AIBP-assistedmajor and medium projects/components is 82.76 lakhhectare. Out of this, the irrigation potential createdup to March 2007 is 43.56 lakh hectare which is about53% of the UIP of all AIBP projects. Up to March 2007,6205 MI schemes were provided assistance under AIBPof which 4418 schemes have been completed. The UIPof MI schemes included in AIBP was 3.85 lakh hectareand potential of 1.87 lakh hectare has been created upto March 2007. The completion rate has been quitesatisfactory in respect of AIBP-assisted MI schemes asthese have low gestation periods.
2.30 However, the performance of MMI projects interms of completion of the projects as well as thepotential creation is not very satisfactory. The outlaysunder the AIBP have been continuously stepped upsince 1996–97. Creation of irrigation potential in thecountry under major and medium sector received afillip after commencement of AIBP. During the EighthPlan period, irrigation potential of 22.10 lakh hectarewas created in the country under major and mediumsector at an annual rate of 4.4 lakh hectare per an-num. During the Ninth Plan, when AIBP was inoperation, irrigation potential created in the major andmedium sector was 41.0 lakh hectare out of which 16.5lakh hectare (nearly 40%) was through AIBP schemes.The highest creation of irrigation potential from theFirst Plan to the Eighth Plan is in the Fifth Plan and
TABLE 2.7Unapproved Major, Medium and ERM Projects
Number of Latest Expenditure up Ultimate Potential createdUnapproved estimated cost to Tenth Plan Potential up to Tenth Plan
Projects (Rs in Crore) (Rs in Crore) (thousand hectare) (thousand hectare)
Major projects 90 100017.85 31004.66 5960.58 930.85
Medium projects 136 12947.09 5943.78 809.82 153.16
ERM 74 9095.30 4234.31 1177.07 135.10
Total 300 122060.24 41127.75 7947.47 1219.11

50 Eleventh Five Year Plan
this is 40.28 lakh hectare. With the introduction ofAIBP the same pace of additional irrigational poten-tial could be restored in the Ninth Plan and subse-quently in the Tenth Plan. The year-wise funds releasedand potential created are shown in Table 2.8.
MINOR IRRIGATION (MI)2.31 Over the period 1951–2007, irrigated area frommajor projects has increased to 3.47 times, from tanks1.9 times, and from groundwater 6.3 times. Ground-water use has expanded as it provides control overirrigation to the farmer and its growth stimulatedby spread of electrification and subsidized power.Even in the command area of major irrigation projects,farmers often use groundwater as a matter of routineto supplement canal water to maximize agriculturalproduction.
2.32 The outlay provided for the Tenth Plan by thePlanning Commission was Rs 13873 crore for a targetof 6.8 MH. The outlay has been subsequently revisedto Rs 14764 crore and during MTA the target wasrevised to 4.0 MH. However, it is now anticipated thatthe achievement may be around 3.5 MH, out of which2.81 MH is anticipated through groundwater devel-opment. The performance during the first three yearsof the Tenth Plan and anticipatory performance forremaining two years is given in Table 2.9.
2.33 The broad reasons for low performance arementioned below:
• Poor economic status of small and marginalfarmers.
• Non-availability of assured power supply.• Highly subsidized water rates in canal command,
whereas, no provision of subsidy for developmentof groundwater.
• In hard rock areas, probability of obtaining ground-water resource is low.
• Over-extraction in critical areas which has causeddepletion of water tables resulting in failure of wells.
TABLE 2.8Performance of AIBP Projects
(Rs Crore/Thousand Hectare)
Year Central Loan Potential Potential Total Potential TotalAssistance (CLA)/ Created Created Created under Potential
Grant Released (Normal) (Fast Track#) AIBP Created
1996–97 500.00 72.08 72.08 559.971997–98 952.19 200.02 200.02 645.181998–99 1119.18 257.41 257.41 592.151999–2000 1450.48 220.21 220.21 666.042000–01 1856.20 531.43 531.43 983.532001–02 2601.98 443.37 0.00 443.37 1214.592002–03 3061.70 272.43 182.93 455.36 812.002003–04 3128.50 357.20 89.83 447.03 1004.002004–05 2867.34 408.67 82.58 491.25 1000.00*
2005–06 1900.31 735.85 144.09 879.94 1500.00*
2006–07 2301.97
Total 21739.85 3498.67 499.43 3998.10
Note: # Projects which are to be completed in two agricultural season (one year) with higher Central assistance; * Tentative.
TABLE 2.9Physical and Financial Performance of
MI Sector during the Tenth Plan
Year Physical Financial(in MH) (in Rs Crore)
Potential Potential Revised Expendi-Created Utilized Outlay ture
2002–03 0.687 0.548 1950.45 16392003–04 0.628 0.502 2634.63 19572004–05 0.740 0.592 2780.35 2780.352005–06# 0.545 0.440 7398.75 7398.752006–07* 0.918 0.734
Total 3.518 2.816 14764.18 13775.1
Note: # anticipated; * targeted.

Water Management and Irrigation 51
2.34 The rapid development of groundwater has ledto over-exploitation of groundwater in the country.In 15% of the blocks the annual extraction of ground-water exceeds annual recharge and in 4% of the blocksit is more than 90% of recharge. As the groundwaterrecedes wells have to be deepened and more energyhas to be used to pump water. Figure 2.2 shows thestatus of groundwater use in the country. The mapshows two challenges: first, how to restrain ground-water use to sustainable level in over-exploited regionsand second, how to develop the large untapped groundwater potential in eastern India.
2.35 Rural electrification through the RGGVY isbeing completed in Eastern Uttar Pradesh, Bihar, andWest Bengal. In the Eleventh Plan the objective shouldbe to bring large part of the cultivable area in theseStates under irrigation through electrified agriculturalpump sets. This would be the key to the breakthroughin the agricultural production and food security. Asthis is a viable action plan would need to be drawn upby the States involving provision of (i) adequate powerfor irrigation, (ii) soft credit for farmers to install
tubewells, and (iii) subsidized rates for grant of elec-tricity connections. With the implementation of thetariff policy of differential pricing for peak and off-peak supply of electricity, it should be possible tohave modest rates for supply of off-peak electricity toagriculture.
MINOR IRRIGATION SURFACE WATER SCHEMES2.36 Surface water schemes based on tanks and pondshave developed slowly. Due to the success of the Gov-ernment in providing canal irrigation and heavilysubsidized electricity for use of ground water therehas been neglect of local storage through village ponds,tanks, etc. Many of these have begun to disappear.This is partly due to village communities losing a senseof their own responsibility for managing water opti-mally. Restoration of water bodies has been taken upin 24 districts of 14 States, namely, Andhra Pradesh,Chhattisgarh, Gujarat, Himachal Pradesh, Jammu andKashmir, Jharkhand, Karnataka, Kerala, MadhyaPradesh, Maharashtra, Orissa, Rajasthan, Tamil Nadu,and West Bengal. In the Eleventh Five Year Plan 20000water bodies are likely to be renovated and restored.
FIGURE 2.2: Categorization of Blocks/Mandals/Talukas as on March 2004

52 Eleventh Five Year Plan
FLOOD MANAGEMENT
Physical Achievements2.37 At the beginning of the Tenth Plan (2002), thearea benefited or the area provided with a reasonabledegree of protection was about 16.44 MH. The Plan-ning Commission approved an outlay of Rs 4619 crorefor State sector to protect 1.93 MH. The area likely tobe protected as reported by the States in their respec-tive annual plan documents is 1.78 MH. Thus, totalarea reasonably protected against flood by end of theTenth Plan is likely to be 18.22 MH. The physicalachievements per unit investment follow a reducingtrend because of cost escalation and increased alloca-tion for stabilization of existing works.
2.38 The year-wise outlays of the State and Centralsectors for the Tenth Plan and the actual/anticipatedexpenditures are given in Table 2.10.
Flood Damages and Relief2.39 During the first three years of the Tenth Plan,the flood damages as reported by the States and therelief fund released are given in Table 2.11.
2.40 The aforementioned relief funds also includeassistance for cyclones and other such natural calami-ties. It would be seen from the above table that duringthe first three years of the Tenth Plan, the expenditureon relief was significantly high and the correspondingPlan outlays were inadequate. It is necessary that amore rational approach and optimum programme ofworks is adopted for flood management.
2.41 The preceding paragraphs describe the situationanalyses of the irrigation sector in the country. Ashas been indicated at the beginning of the chapter,water scarcity and uncertainty in availability ofwater are important constraints that would need tobe addressed in the Eleventh Five Year Plan. Thestrategy to be followed in the Eleventh Five YearPlan for this sector is described in the followingsection.
ELEVENTH FIVE YEAR PLAN STRATEGY FORMAJOR, MEDIUM, AND MINOR IRRIGATION2.42 The GoI launched Bharat Nirman Programmein 2005–06. The irrigation component of the pro-gramme envisages creation of an additional 6.2 MH
TABLE 2.10Financial Performance in Flood Management during the Tenth Plan
(Rs Crore)
Year Approved/Revised Outlay Expenditure (Actual/Anticipated)
States Centre Total States Centre Total
2002–03 624 151 775 698 86 7852003–04 496 156 652 523 96 6192004–05 669 184 853 644 100 7442005–06 933 232 1165 830 181 10112006–07 1034 680 2520 1116 194 1310
Total 4562 1403 5965 3811 657 4468
TABLE 2.11Flood Damage and Relief in the Tenth Plan
(Rs Crore)
Year Flood RecommendedDamage CalamityReported Relief Fund
2002–03 2575 16002003–04 4434 15872004–05 3337 1286
of irrigation potential. This target will be achievedthrough major, medium, and minor projects forsurface water and ERM schemes. Owing to compara-tively low allocation by the States for irrigation projects,intervention of the Centre for creation of irrigationpotential will be required. AIBP is the only programmeunder MoWR to assist State Governments to achievethe targets set under the surface water component ofirrigation programme of Bharat Nirman.

Water Management and Irrigation 53
2.43 The Prime Minister has announced a rehabilita-tion package for agrarian distress districts of AndhraPradesh, Karnataka, Kerala, and Maharashtra whichincludes early creation of irrigation facilities in thesedistricts. The package includes 65 MMI projects to becompleted through assistance to be provided underAIBP out of which 28 projects are already includedunder AIBP assistance. It has also been decided to pro-vide assistance under AIBP to the projects providingirrigation facilities to drought-prone tribal areas as wellas to States which are having irrigation developmentof their potential below national average.
Linkage of AIBP with CommandArea Development2.44 It has been observed that utilization of the cre-ated irrigation potential through AIBP is not up to theexpected level. One of the reasons for non-utilizationor low utilization of created irrigation potential is non-completion of CAD work in the area where irrigationfacilities have been created. The CAD Programmeshould be integrated with the project implementationand upon completion of the project the water shouldreach to the farm gate instead of creating the irriga-tion potential which is not immediately utilized. It isalso pertinent to mention that the cost of land devel-opment works should also be integrated with theproject cost which may be funded under AIBP. Theinclusion of CAD component with the cost of theproject may affect the benefit–cost ratio of the project.
National Projects2.45 For quite sometime many State Governmentshave been raising the issue of declaring some irrigationprojects as ‘National Projects’. The criteria for the selec-tion of these projects, their mode of implementationand pattern of funding, etc. are yet to be finalized.However, it is obvious that the projects which are oninternational borders and the projects benefiting twoor more States should figure as National Projects.
Monitoring of the Projects with Remote Sensing2.46 During the end of the Tenth Plan, the PlanningCommission insisted on monitoring of the projectfunded under AIBP through remote sensing. Accord-ingly a pilot scheme for monitoring Teesta and UpperKrishna projects through remote sensing has been taken
up. The results of remote sensing have been matchedwith the ground realities and were found to the extentof 90% close to actuals. Accordingly the MoWR hasassigned the job of monitoring of 53 projects coveringthe area of 5 MH for remote sensing monitoring.
STRATEGY2.47 The following steps could be taken for major,medium, and minor irrigation sector for the EleventhFive Year Plan.
Major and Medium Irrigation Projects• Funds would be earmarked by the Planning Com-
mission in the State plans so that the ongoingschemes under AIBP can be completed in time andcost over-run is avoided.
• Since the fund requirement for medium or minorirrigation projects are less, adequate funds maybe made available for completion of these projects,without jeopardizing the programme for majorprojects. ERM projects should be given due prior-ity where the eroded potential can be restored withmoderate expenditure.
• Foremost priority should be given for completionof the ongoing projects.
• Ongoing projects which have already achieved90% or more of the ultimate potential should beconsidered as completed. It is also neceesary to criti-cally review all such projects which are having onlymarginal benefit left or are near impossible to com-plete because of various problems, and declare themcompleted or curtailed or deleted. The balance costof the remaining projects should be updated realis-tically for consideration during the Eleventh Plan.
• Inter se priority should be decided consideringvarious aspects such as externally aided projects,inter-state projects, projects benefiting drought-prone or tribal areas, etc. as per the guidelines pre-pared by National Commission for Integrated WaterResources Development Plan.
• High priority should be accorded to the Pre-Seventh and Seventh Plan Projects for fundingunder AIBP to complete these projects during theEleventh Plan.
• Schemes should be given out on fixed cost time cer-tain contract basis with incentive and penalty clause.
• Remote sensing satellite monitoring should be the
54 Eleventh Five Year Plan
basis for the performance of the implementationand accordingly the next release of funds should bemade.
• The CAD works and project execution should be inone package to ensure the availability of water uponcompletion of the project.
• The ERM projects are being funded under AIBPassistance and their funding should be linked withimprovement in efficiency of the irrigation systemand for this purpose minimum threshold targetefficiency should be considered.
• To improve efficiency, irrigation projects should bebenchmarked for performance evaluation by anindependent expert group so that optimum use ofwater is realized. The AIBP assistance in the formof grant should be made according to the perfor-mance parameters.
• A separate budget head up to 15% of Plan fund maybe provided as Irrigation Maintenance Fund (IMF)and full amount of irrigation revenue as collectedshould be credited to the IMF.
• In addition to the liabilities of completed projectsand provision for ongoing and new projects, theState plan proposals should incorporate provisionsfor special repairs of existing irrigation systems, damsafety measures, improved water management, andwater development aspect encompassing surveyand investigation, R&D, training, and NationalHydrology Project.
• System maintenance and revenue realization shouldbe handed over to beneficiaries groups or WaterUsers Associations (WUAs).
• The existing regional and State-level institutionssuch as Water and Land Management Institutesshould be strengthened and brought into main-stream activities for irrigation management im-provement.
• Dam safety measures should be taken up system-atically for Disaster Prevention and Management.5% of plan fund may be allocated for undertakingdam safety activities to ensure that dams in distressget special and timely attention.
• The performance evaluation of completed projectsneeds to be continued for benchmarking andimprovement in irrigation efficiency.
• New projects should be undertaken only afterconfirming that adequate funds for ongoing
programmes are available, in the State plan aswell as the availability of Central assistance by thePlanning Commission.
• Introduce the concept of National Projects.• Review the requirements and process of environ-
mental clearance.
Minor Irrigation Sector• Renovation and restoration of old tanks as well as
old diversion channels in hilly regions may be givenhigh priority.
• Micro irrigation system in water deficit areas shouldbe promoted.
• Groundwater development in areas havinguntapped and unutilized potential, particularly inthe Eastern Region should be promoted through atime-bound programme.
• A comprehensive strategy as recommended by theexpert group for regulation of groundwater devel-opment and use on sustainable basis should beimplemented.
GROUNDWATER EXPLOITATION AND GOVERNANCEFOR PREVENTING OVER-EXPLOITATION OFGROUNDWATER2.48 The two concerns about groundwater areover-exploitation in parts of the country and under-utilization in large parts of the country. The region-wise potential is as follows.
• Alluvial areas of the east and north east regions(NER) (particularly Assam, Bihar, West Bengal,and Uttar Pradesh) with low stage of groundwaterdevelopment have an additional potential of around2.7 MH from the unconfined aquifers.
• Hard rock areas of peninsular India have anadditional potential of around 0.8 MH by judiciousand scientific development of groundwater inAndhra Pradesh, Chhattisgarh, Jharkhand, Kerala,Maharashtra, Orissa, Tamil Nadu, and parts ofMadhya Pradesh.
• Hilly areas of the north and the NER have a mar-ginal additional potential of around 0.04 MH inArunachal Pradesh, Himachal Pradesh, Jammu andKashmir, Manipur, Tripura, and Uttaranchal.
• Deeper confined aquifers in the alluvial plainsof Uttar Pradesh, Haryana, and Punjab have an

Water Management and Irrigation 55
additional potential of 1.0 MH by tapping deeperconfined aquifers. However, there is need to under-take detailed studies to establish the ‘Safe Yield’ fromsuch aquifers to avoid any adverse environmentalimpacts.
2.49 Sustainable groundwater development and man-agement need to be taken up by incorporating studieson artificial recharge to groundwater and rainwaterharvesting, management of salinity ingress in coastalregions, sustainable management in areas with highlevels of groundwater development, conjunctive useof surface water and groundwater, and regulationof groundwater development. There are numberof groundwater extraction structures in the countrywhich are very old, have outlived their working life,and are not functional. These structures, in reality, donot contribute to irrigation potential. Such structuresneed replacement for restoration of old/alreadycreated potential. As suggested by NABARD, replace-ment may be planned at 0.5 MH during the EleventhFive Year Plan in only safe and semi-critical blocks/units.
2.50 MI and groundwater development provide plentyof scope for employment of unskilled labour forces. Itis, therefore, very important to link National RuralEmployment Guarantee Programme (NREGP) withMI and groundwater development.
2.51 The UIP through ground- water resources hasbeen assessed to be about 64 MH in the country, outof which 46.03 MH has been created upto the end ofthe Tenth Plan. Since groundwater is an open accessresource and everyone is entitled to pump water be-low his own land, it is over-exploited in a number ofblocks in the country and the water table is going down.This increases the cost of irrigation and farmers arerequired to periodically deepen their wells.
2.52 In order to address the issues of sustainable useof groundwater and the question of ownership of thegroundwater, the Planning Commission has set upan expert group on ‘GroundWater Management andOwnership’ chaired by Member (Water and Energy)Kirit S. Parikh. The group recommended that theownership of the groundwater below the land will
continue to remain with the owner of the land as perthe Easement Act 1882 as long as the exploitation ofgroundwater is not causing depletion in the groundwater levels so the similar rights of the adjoining land-owners and public at large are not encroached upon.Centre’s intervention would be required when thegroundwater level falls below the replenishable level.In such events, the affected area will be declared asan area under threat and any exploitation willbe regulated. The Central Ground Water Authority,under the provisions of Environment Act 1986, isempowered to make such declarations and it wouldbe the responsibility of the State Government toensure that the exploitation in the area is regulated.
2.53 The group has noted that the experiences atnational and international levels have shown that acommand and control mechanism has not yieldedgood results in protecting the groundwater resourcesfrom over-exploitation. The regulation/reduction/restriction on the groundwater usage can be madeeffective by the State Government only with theco-operation of user groups and community partici-pation involving PRIs. The user groups will be respon-sible for regulating the ground water usage amongvarious sectors, that is irrigation, drinking, and indus-trial. Such regulations by the user group can be madeeffective only if the State/Central Ground Water Board(CGWB) monitors and provides information on safelyextractable water on the basis of water table levelsrecorded scientifically.
AUGMENTING UTILIZABLE WATER2.54 Usable water availability can be increased by tap-ping water that otherwise would have run-off to thesea. Water storage above ground through dams anddiversion through weirs are the conventional means.However, water can also be stored underground byenhancing percolation through artificial recharge. Rainwater harvesting in many small ponds through con-struction of bunds can also add to water availability.Inter-basin transfer of water through inter-linking ofrivers can substantially expand availability.
ARTIFICIAL RECHARGE AND RAIN WATER HARVESTING2.55 The groundwater levels are declining in manyparts of the country. Artificial recharge of groundwater

56 Eleventh Five Year Plan
with rainwater is an important strategy to arrest thistrend. The CGWB has already prepared a master planto recharge 36 bcm of rainwater into groundwater at acost of Rs 24500 crore. Except for pilot projects in theEighth and Ninth Plans, no serious effort has beenmade to implement this on a mission mode. In urbanareas, many cities have by-laws making rainwaterharvesting compulsory for new buildings. However inrural areas there is no such programme.
2.56 Local storage is cost effective. There is significantpotential for increasing the overall utilizable waterthrough rainwater harvesting, construction of checkdams, watershed management, and restoration of tra-ditional water bodies as well as creation of new ones.In areas where groundwater is under severe stress,artificial recharging would need to be undertaken withproper technical support. Resources under the NREGP,BRGF, etc. are available for this purpose. The multilat-eral agencies such as World Bank and Asian Develop-ment Bank (ADB) have also been requested to providefinancing for this purpose. Alternatively, a cess on thebottled water (since many negative externalities areassociated with it like generation of plastic waste, theirimproper disposal, etc.) can be levied and funds fromsuch levy could be used for revival of traditional waterbodies or for recharging ground water with commu-nity participation. The challenge is to motivate thelocal communities to undertake this work on prioritybasis and to build their capacity for this purpose. Tech-nical support systems for developing an optimalwater management master plan for a micro watershed/hydrological unit need to be created. Groundwatermapping, GIS mapping, satellite imagery, etc. need tobe utilized for assisting the village community in pre-paring water resource development and managementof master plans. With broadband connectivity expectedto reach all over rural India in the Eleventh Plan this isfeasible. It does however pose a difficult challenge increating the institutional systems and delivery mecha-nisms for providing technical back-up support to thevillage community for preparing water managementmaster plans.
2.57 The flood plains in the vicinity of rivers can begood repositories of groundwater. A planned manage-ment of groundwater in the flood plain aquifers offers
an excellent scope of its development to meet theadditional requirements of water. The development ofgroundwater in the Yamuna flood plain area in Delhiis an example of scientific management of water re-sources. During rainy season, the flood water spreadsover the plains but due to very shallow water table therecharge is small and the rejected recharge result inriver out flows. CGWB constructed 95 tubewells inPalla Sector in the depth range of 38–50 m for DelhiJal Board. The total pumpage during the pre-monsoonperiod of 2002 was 40 million gallons per day whichcreated a regional drawdown of about 5 m in theflood plain area. It was observed that immediatelyafter rainy season, the depleted aquifer fully recouped.Thus over-development of shallow aquifers in floodplains creates the necessary subsurface space foraugmentation of groundwater from the river flowsduring the monsoon. Induced recharge is an effectivemanagement tool to meet the gap of demand and sup-ply in areas adjacent to rivers with active flood plains.
INTER-BASIN TRANSFERS THROUGHINTER-LINKING OF RIVERS2.58 The inter-linking of rivers and the transfer ofsurplus water, especially in the monsoon period fromthe surplus basins to the deficient basins has beenchampioned by many experts over time. The task forceon the inter-linking of rivers has drawn up a set ofproject proposals. The total amount of water that canbe usefully transferred is estimated to be about 220bcm. However, there are apprehensions that the as-sessed surplus is somewhat illusory for many basinsand future generations would actually need all thewater. Sceptics have reservations about the economicviability of such large projects. Environmental con-cerns would need to be addressed through the envi-ronmental appraisal process of each project. For thesereasons the pace of progress in the Tenth Plan periodhas been quite modest and is summarized in Table 2.12.
2.59 The availability of water in the country has vastvariation both in time and space. The bulk of the rain-fall is concentrated in the monsoon months June toSeptember. While 51.12 MH is affected by droughts,mainly in peninsular India, 40 MH is affected byfloods mainly in Bihar and Assam. The per capita avail-ability of water is 1820 m3 which is above the water

Water Management and Irrigation 57
stress condition threshold value of 1700 m3. Howeverthe per capita availability varies from 18417 m3 in theBrahmaputra river to 380 m3 in some east-flowingrivers in Tamil Nadu showing that many basins in thecountry are already critically starved of water. Out ofthe annual precipitation and snowfall of 4000 bcm,747 bcm runs waste to the sea, mainly from theGanga and Brahmaputra rivers systems, which have60% of the water potential. Only 19% of the waterpotential is available in Mahanadi, Godavari, Krishnaand Cauvery.
2.60 In the above backdrop, inter-linking of riversassumes importance as a part of the 747 bcm runningwaste to sea (about 160–220 bcm) is proposed to betransferred through a series of 30 inter-linking pro-posals from surplus basins to deficit basins. Long-distance, trans-basin transfer of water is not a newconcept. Many examples of existing projects can begiven in this regard—Western Yamuna canal, Periyarproject, Kurnool Cuddapah canal, Indira Gandhicanal, and Sardar Sarovar canal. International examplescan be given of California water transfer project fromnorth to central and southern parts of the US, China,the erstwhile USSR, Sri Lanka, and Mexico. Pioneer-ing work was earlier done on a National Water Gridby K.L. Rao and Capt. Dastur. These were refined bythe MoWR and 30 links identified—16 as peninsular
component and 14 as Himalayan component. Pre-feasibility studies of 16 links (14 in peninsular com-ponent) have also been completed.
2.61 Before detailed project reports (DPR) are takenup, consensus among States is required so that imple-mentation can smoothly begin after the DPRs areappraised. Five links have already been identified forDPR preparation and dialogue with concerned Statesinitiated by MoWR. Co-operation of States is thus asine qua non for success of the inter-link projects. TheNational Common Minimum Programme (NCMP)also stresses for a consultative approach to the project.One could even think of monetary compensationto the donor States in the form of a royalty as isbeing done for other natural resources such as coaland oil.
2.62 Since water will be transferred at a great cost, theeconomics of the proposal will need a careful evalua-tion taking into consideration not only primarybenefits but also secondary and tertiary benefits. Theenvironmental impacts of such a large-scale transferwill also need a very careful study and integration intothe economic evaluation. Stress needs to be laid onpromotion of drip and sprinkler irrigation and horti-culture crops from the point of view of water savingand optimum returns. The funding will have to come
TABLE 2.12Progress of Inter-linking of Rivers
S. No. Item of Work Progress Made So Far
1 Preparation of feasibility reports (FRs) by National NWDA has already prepared 16 FRs (14 under PeninsularWater Development Agency (NWDA) Component, 2 under Himalayan Component). Draft FR of 4
links under Himalayan Component in advance stage ofcompletion and remaining are in progress.
2 Inter-linking of rivers is to be pursued continuously The MoWR is laying special emphasiswith a focus on peninsular component on undertaking the works of the peninsular components on
priority and accordingly NWDA is working on this component.
3 Priority links (i) After signing of MOU by concerned states of UP and MPKen–Betwa for preparation of DPR for Ken–Betwa link on 25 August
2005, work started by NWDA.Parbati–Kalisindh–Chambal (ii) Concerned States of MP and Rajasthan are discussing
bilaterally to sort out differences for MOU of Parbati–Kalisindh–Chambal link.
4 Identification of another priority link NWDA has identified three more links in PeninsularComponent namely Damanganga–Pinjal and Par–Tapi–Narmada and Polavaram–Vijayawada link as priority links.
58 Eleventh Five Year Plan
from a mix of budgetary support, market borrowings,and external assistance. For the implementation ofsuch a mega project, an authority may have to be setup akin to the National Highways Authority of India(NHAI) with full autonomy for raising loan, approv-als, etc. The maintenance of the created assets willhave to be properly done with required revenuesgenerated from the project.
2.63 Inter-linking of rivers is a challenging project andis essential for meeting the looming water crisis in fu-ture. The syndrome of drought and floods is hamper-ing the required growth in agriculture and inter-linkingof rivers offers an effective solution to the problem.In the Eleventh Plan the inter-basin transfer of waterneeds to be pursued more vigorously. Where a con-sensus emerges regarding the prima facie feasibility ofspecific projects their DPR preparation, environmen-tal appraisal and decision on investment as well asexecution modalities need to be completed in a time-bound manner. The execution of some projects shouldcommence in the Eleventh Plan period.
IMPROVING WATER USE EFFICIENCY2.64 For a gross irrigated area of about 87 MH, thewater use is 541 bcm which gives a delta of 0.68 m perha of gross irrigated area. The average annual rainfall is1170 mm (1.17 m). Taking 70% of the rainfall as effec-tive for crop consumptive use, the gross water use isabout 1.45 m (4.8 feet) per ha of the gross irrigated area.This is very high as compared to water use in irrigationsystems in say the US where water allocation is about 3feet. This overuse in the country reflects a low irrigationefficiency of about 25% to 35% in most irrigation sys-tems, with efficiency of 40% to 45% in a few exceptionalcases. A basin-wise study conducted by A. Vaidyanathanand K. Sivasubramaniam of the Madras Institute ofDevelopment Studies (MIDS) using potential evapo-transpiration data and gross water withdrawals reportsthe overall irrigation efficiency in the country as 38%.The study reveals that the Krishna, Godavari, Cauvery,and Mahanadi systems have a very low efficiency ofaround 27% while the Indus and Ganga systems aredoing better with efficiencies in the range of 43%–47%.This is understandable as the peninsular rivers havelarge areas under irrigation in delta areas, wherethe water management practices are poor, while the
rotational water supply (wara bandi) is practised in theIndus and Ganga systems. However, this is only amacro-level study. Project-level data available on irri-gation efficiency unfortunately is minimal. It needsto be appreciated that 55% of the area irrigated is bygroundwater sources where the efficiencies are quitehigh (70%–80%) in view of absence of long conveyancesystems. Consequently the efficiencies in surface irriga-tion systems must be much lower than the averagefigure of 38%.
REASONS FOR LOW IRRIGATION EFFICIENCY2.65 The reasons that contribute to low irrigationefficiency can be identified as follows:
• Completion of dam/head works ahead of canals.• Dilapidated irrigation systems.• Unlined canal systems with excessive seepage.• Lack of field channels.• Lack of canal communication network.• Lack of field drainage.• Improper field levelling.• Absence of volumetric supply.• Inadequate extension services.• Low rate for water.
2.66 The equitable and optimal use of water fromcanal irrigation has been a matter of continuingconcern. The traditional approach of pursuing theseobjectives through the field-level functionaries ofirrigation department had its limitations. The partici-pation of actual beneficiaries through PIM and themaintenance of village-level distribution channelsthrough WUAs have been found useful. There isbroad consensus that this has been a step in the rightdirection. This needs to be pursued more vigorouslywith genuine empowerment of WUAs. The objectiveshould be to cover the entire command of all majorand medium projects with WUAs by the end of theEleventh Plan. The experience across States has beenuneven. It is reported that 55501 users associations hasbeen created and their State-wise position is indicatedin Table 2.13.
ON-FARM WATER MANAGEMENT2.67 On-farm water management covers a gamut ofareas such as field channels, field drains, land levelling,

Water Management and Irrigation 59
and irrigation scheduling with the objective of reduc-ing field application losses. The works below the outletare traditionally taken as CAD works and are not in-cluded as a part of the scope of the irrigation projectwhich stops at the outlet. Out of an investment ofRs148000 crore in major, medium, and minor irriga-tion till the Ninth Plan, the investment in CAD workshas been only Rs 6800 crore or 4.6%. This low outlay isan important contributory factor to poor on-farmwater management, viz. low application efficiency andshortage in supplies to tail-enders. Since stepping upof CAD allocations by the States will be difficult, onemeasure that could be taken is to include all CAD worksas a part of the project itself so that infrastructurerequired for irrigation water to reach every field isimplemented alongwith the dam. This, together withconjunctive use, will no doubt hike project cost butsince compartmentalized approach has not succeeded,an integrated approach will have to be seriously
considered. There is an option to dovetail these workswith the rural development programmes such asNREGP, BRGF, district plan, etc.
MICRO IRRIGATION2.68 Micro irrigation, comprising drip and sprinkler,has emerged as a tool for effective management of re-sources which save water, fertilizer as well as electricityand distribute water evenly unlike other irrigation sys-tems. Drip irrigation is ideally suited for horticulturecrops such as pomegranate, grapes, mango, banana,guava, coconut, amla, and cash crops such as sugar-cane. Drip irrigation saves 25%–60% water and upto60% increase in yield can be obtained. Sprinklers areuseful in undulating land with cereals crops and save25%–33% of water. Out of the 69 MH net irrigatedarea in the country, only 0.5 MH under drip and 0.7MH under sprinkler has been achieved. Maharashtrahas 46% of the area under drip in the country.Karnataka, Tamil Nadu, and Andhra Pradesh followwith percentage area of 21%, 14%, and 12%, respec-tively. Drip irrigation methods range from simplebucket kit systems for small farms to automatedsystems linking release of water to soil moistureconditions measured continuously by tensiometers.
2.69 It is suggested that while sanctioning new irriga-tion projects, it would be made obligatory for projectauthorities to implement micro irrigation in at least10% of the command area. The various suggestions ofthe Task Force on Micro Irrigation also need to be takennote of as micro irrigation has the potential to trans-form Indian agriculture.
RURAL AND URBAN DRINKING WATERAND SANITATION2.70 These issues and programmes are discussed inVolume II, Chapter 5, ‘Drinking Water, Sanitation, andClean Living Conditions’.
MEETING INDUSTRIAL WATER DEMAND2.71 Industrial demand for water is growing. Alsodisposal of waste water from industries withoutappropriate treatment pollutes water bodies, under-ground aquifers, and soils. In addition long-term landuse planning for urbanization and industrializationis now a necessity and provision of water on a sustain-
TABLE 2.13State-wise Number of WUAs Formed and
Irrigated Area Covered
S. Name of State Number Area CoveredNo. of WUAs (Thousand
Formed Hectare)
1 Andhra Pradesh 10790 4800.002 Arunachal Pradesh 2 1.473 Assam 37 24.094 Bihar 37 105.805 Chhattisgarh 945 NA6 Goa 42 5.007 Gujarat 576 96.688 Haryana 2800 200.009 Himachal Pradesh 875 35.0010 Jammu and Kashmir 1 1.0011 Karnataka 2279 1052.4112 Kerala 3930 148.4813 Madhya Pradesh 1470 1501.4514 Maharashtra 1299 444.0015 Manipur 62 49.2716 Meghalaya 99 NA17 Nagaland 25 NA18 Orissa 11020 907.0019 Punjab 957 116.9520 Rajasthan 506 219.6521 Tamil Nadu 7725 474.2822 Uttar Pradesh 24 10.5523 West Bengal 10000 37.00
Total 55501 10230.08(say, 10.23 MH)

60 Eleventh Five Year Plan
able long-term basis should be a key factor in suchplanning exercises. In the absence of such planningdemand for water emerges in areas where the provi-sion of water requires enormous investments incarriage systems over long distances or even treatmentof sea water. With proper long-term planning in termsof location of special economic zones (SEZs), indus-trial parks, and townships it should be possible tooptimize costs of industrial development. For meet-ing the water needs of industry the approach discussednext appears appropriate.
2.72 New industries should ideally be located only inplanned industrial areas, industrial parks, townshipson industrial/zones identified in township MasterPlans. They should be provided water by the localauthorities who should charge prescribed rates on avolumetric basis. These rates should fully cover:
• the cost of supply.• a premium to reflect the scarcity value of water in
areas where there is water shortage.• the cost of treatment to enable the discharge to go
back into the water system through drainage intoirrigation canals, rivers, lakes, etc.
2.73 Where groundwater is the source of supply andis under stress, the cost of supply should include thecost of recharge wherever such recharge is required andthe recharge component should be credited to a dedi-cated Recharge Fund (RF) so that its utilization is suit-ably monitored. For new and existing industries whichwould use groundwater on their own there should bea system of IT-based volumetric metering of actualextraction by water-intensive industries in those areaswhere ground water levels have become critical. Forthese areas, there should be prescribed rates for groundwater use by industry in a particular hydrological unit.The option of recycling the water and using it forsecondary needs, that is other than drinking, shouldbe a strategy for the Eleventh Plan.
FLOOD MANAGEMENT2.74 Every year some part or other of the countrygets flooded. A multi-pronged approach consistingof measures of prevention, protection, management,forecasting, and early warning are needed.
PREVENTION AND PROTECTION2.75 Floods can be prevented or significantly moder-ated by watershed management of the catchment areaof rivers. Agriculture, which is the nodal ministryfor the watershed management works, should workout a detailed programme in consultation with theMoWR. For international rivers originating in Nepaland Bhutan, a joint mechanism for watershed man-agement needs to be evolved. Another way is to pre-serve and augment flood cushions like natural swampsand lakes which can be developed into detentionbasins. Also, capacity of existing depressions can beimproved for absorbing flood waters. Special drivesfor development of Tal and Diara areas are needed.Construction of dams and reservoir schemes withadequate flood cushion provide long-term solutionof flood problems. Efforts should also be made forutilizing the existing reservoirs in the country forflood moderation to the extent possible. Even in res-ervoirs constructed for power or other purposes, therule curves may be framed in such way that effectiveflood moderation is achieved. Rule curves guide theoperation of a reservoir and ensure that a desiredlevel of storage cushion is maintained to absorbfloods of specified probability. Raising and strength-ening of the existing embankments, if required afterdetailed studies of hydrological, morphological, topo-graphical, and developmental aspects, provide someprotection.
2.76 Watershed management in the hilly catchmentsof the rivers originating in Nepal, Bhutan, and hillyareas of India should be selectively chosen and fullyfunded. Implementation should be done through ajoint mechanism.
2.77 The ideal solution for flood control is the cre-ation of adequate storages in flood prone riversystems. The Damodar Valley Corporation (DVC) isthe best example of a series of storage projects whichhave made floods in the Damodar river basin a matterof history. The Ganga–Brahmaputra–Barak basins areour most flood-prone basins. There is clearly a needto build storage reservoirs in the northern tributariesof the Ganga and in the Brahmputra and its tributar-ies in the NER. These storage projects need to beinvestigated designed and executed expeditiously.

Water Management and Irrigation 61
For the northern tributaries of the Ganga, co-operation with Nepal would be required. Negotiationswould need to be pursued with vision and construc-tive pragmatism.
2.78 The strategy of flood control through embank-ments has been pursued by the States over the years. Aholistic view of an entire tributary or a large stretch ofa tributary needs to be taken. Wherever feasible a onetime decisive investment for a flood protection projectshould be made. The recommendations of expertgroups and contemporary international experiencein other rivers in Asia with monsoon climate need tobe looked into.
MANAGING FLOODS2.79 Construction at appropriate location of spillingsections/sluices in the flood embankment for thecontrolled flooding of the protected areas for restoringfertility, recharge of soil moisture and groundwater canbe useful. Drainage sluices should be integral part ofembankments to prevent water-logging in the protectedareas. Flood management schemes should be integratedwith other infrastructural development programmesin the sectors of roads, railways, inland waterways, andcanal/command area development works. Drainageimprovement in critical areas in the country should begiven priority. Also dredging at selective locations, thatis outfalls, etc. in the rivers and the tributaries, helpsreduce flood levels in low-lying areas and also helps inquick drainage. Erosion of land by rivers should beminimized through suitable cost effective measures.The Centre should continue to assist the States in theGanga and Brahmaputra Valleys through Plan Fundsto counter land erosion by river action. In order to giveadequate emphasis on the O&M of the flood protec-tion measures already created, a percentage of outlayof the flood sector should be earmarked for this pur-pose. R&D activities for improved flood managementneed to be encouraged.
2.80 To the extent groundwater is intensively utilizedfor irrigation for multiple cropping in north Biharand Bengal and local water bodies are restored, thecapacity for recharge of groundwater in the monsoonperiod would increase and flooding would get miti-gated partially. In other parts of India flash floods
would get minimized if local drainage and restoration/creation of local water bodies was done with water-shed planning under NREGP, BRGF, etc.
FORECASTING AND EARLY WARNING2.81 Development of digital elevation model of flood-prone areas for taking up schemes for inundationforecast, preparation of flood risk maps, planning offlood management schemes, etc. should be taken up.Steps should be taken to ensure implementation ofAction Plan prepared by National Disaster Manage-ment Authority (NDMA) for flood management.
SUSTAINABILITY2.82 Two major challenges are being faced in ensur-ing sustainability of water, that is quality and quan-tity, to meet the needs. Groundwater use has to berestricted to average recharge and quality of waterhas to be improved and should be protected frombiological and chemical contamination. Sustainableuse of groundwater has been already discussed.
PRESERVING WATER QUALITY2.83 The threats to water quality are from untreatedindustrial effluents and municipal wastes from habi-tations, pollution from open defecation, and run-offfrom farms containing fertilizers and pesticides.Upscaling total sanitation campaign (TSC) pro-gramme for rural sanitation (see Volume II, Chapter5), strict enforcement of industrial effluent standards,and treatment of all municipal wastes are needed. Atthe same time farming practices have to be adjustedto use as little chemical fertilizers and pesticidesand apply them in ways that minimize residues inrun-off water, which is a waste for the farmer, arecalled for.
CONVERGENCE2.84 The subject of water is presently being dealt atthe Centre by a number of Ministries/Departments.The linkages of water with other sectors are many.Water availability and quality impact on social, hu-man development and economic activities. Effectivecoordination among different ministries and conver-gence of programmes is essential. Suitable institutionalarrangements would be made in the Eleventh Plan inthis regard.
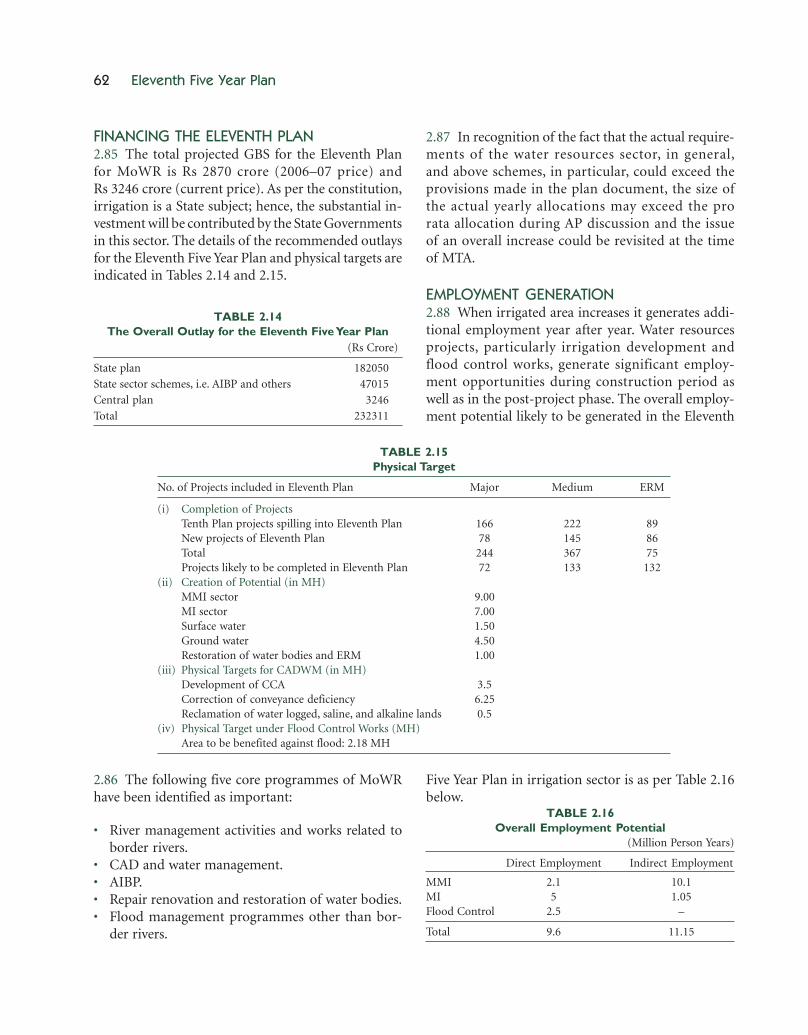
62 Eleventh Five Year Plan
FINANCING THE ELEVENTH PLAN2.85 The total projected GBS for the Eleventh Planfor MoWR is Rs 2870 crore (2006–07 price) andRs 3246 crore (current price). As per the constitution,irrigation is a State subject; hence, the substantial in-vestment will be contributed by the State Governmentsin this sector. The details of the recommended outlaysfor the Eleventh Five Year Plan and physical targets areindicated in Tables 2.14 and 2.15.
2.87 In recognition of the fact that the actual require-ments of the water resources sector, in general,and above schemes, in particular, could exceed theprovisions made in the plan document, the size ofthe actual yearly allocations may exceed the prorata allocation during AP discussion and the issueof an overall increase could be revisited at the timeof MTA.
EMPLOYMENT GENERATION2.88 When irrigated area increases it generates addi-tional employment year after year. Water resourcesprojects, particularly irrigation development andflood control works, generate significant employ-ment opportunities during construction period aswell as in the post-project phase. The overall employ-ment potential likely to be generated in the Eleventh
TABLE 2.15Physical Target
No. of Projects included in Eleventh Plan Major Medium ERM
(i) Completion of ProjectsTenth Plan projects spilling into Eleventh Plan 166 222 89New projects of Eleventh Plan 78 145 86Total 244 367 75Projects likely to be completed in Eleventh Plan 72 133 132
(ii) Creation of Potential (in MH)MMI sector 9.00MI sector 7.00Surface water 1.50Ground water 4.50Restoration of water bodies and ERM 1.00
(iii) Physical Targets for CADWM (in MH)Development of CCA 3.5Correction of conveyance deficiency 6.25Reclamation of water logged, saline, and alkaline lands 0.5
(iv) Physical Target under Flood Control Works (MH)Area to be benefited against flood: 2.18 MH
2.86 The following five core programmes of MoWRhave been identified as important:
• River management activities and works related toborder rivers.
• CAD and water management.• AIBP.• Repair renovation and restoration of water bodies.• Flood management programmes other than bor-
der rivers.
Five Year Plan in irrigation sector is as per Table 2.16below.
TABLE 2.16Overall Employment Potential
(Million Person Years)
Direct Employment Indirect Employment
MMI 2.1 10.1MI 5 1.05Flood Control 2.5 –
Total 9.6 11.15
TABLE 2.14The Overall Outlay for the Eleventh Five Year Plan
(Rs Crore)
State plan 182050
State sector schemes, i.e. AIBP and others 47015
Central plan 3246
Total 232311

Water Management and Irrigation 63
THE WAY FORWARD2.89 The measures suggested for the Eleventh Planaddress the whole range of issues concerning watermanagement and irrigation. The long gestation periodin building irrigation infrastructure and thin spread ofresources are the main reasons for delay in completionof a number of ongoing projects. During the EleventhPlan a total of 477 projects including 166 major,222 minimum, and 89 ERM projects are likely to spill-over. The spill-over cost of these projects during theEleventh Plan is estimated to be about Rs 133746 crore.There is a need for reducing the gestation periodand making available the benefits of irrigation to theusers by way of integrating CAD programme with theprojects. The projects should be implemented on aconstruction schedule not more than four to five years.The land acquisition and R&R works should be takensimultaneously with the project formulation. Irrigationefficiency in the systems needs to be upgraded fromthe present level of 35% to about 60% in case ofsurface water system and from about 65% to 75% ingroundwater system. The efforts of the other depart-ments such as Rural Development and Agriculture, etc.should be converged and an integrated approach for
water resources development and conservation shouldbe adopted. The various schemes of MoRD for rainwater harvesting, watershed development, and NREGAct should be implemented in consultation withMoWR and Department of Drinking Water Supply(DoDWS). There is a need for (PPP) in developmentof water resource projects as this issue has already beenaddressed by NWP, 2002. The modern scientific devel-opment of water resources conservation, transfer, andapplication to the field is needed to be applied in theirrigation command. In flood management, the recur-rence interval of the floods should be the guiding fac-tor for taking up flood control measures. The floodcontrol measures should not be taken in isolation butit should be based on master plan approach in an inte-grated manner. The sustainability of ground water isone of the core areas which require attention for meet-ing irrigation and drinking water requirements. Use ofground water should be limited and linked with thequantum of water being recharged. The issue of moni-toring ground water levels through scientific methodssuch as Piezo meters, etc. should be left to the group ofbeneficiaries with proper technical support from theCentral Government and the State Governments.

64 Eleventh Five Year Plan
ANNEXURE 2.1Plan-wise Cumulative Potential Created and Utilized
(In MH)
Plan Potential Created Potential Utilized
Major and SW Minor Total Total Major & SW Minor Total TotalMedium GW Medium GW
Upto 1951 (Pre-Plan) 9.7 6.4 6.5 12.9 22.6 9.7 6.4 6.5 12.9 22.6First Plan 1951–56 12.2 6.43 7.63 14.06 26.26 10.98 6.43 7.63 14.06 25.04Second Plan 1956–61 14.33 6.45 8.3 14.75 29.08 13.05 6.45 8.3 14.75 27.8Third Plan 1961–66 16.57 6.48 10.52 17 33.57 15.17 6.48 10.52 17 32.17Annual Plan 1966–69 18.1 6.5 12.5 19 37.1 16.75 6.5 12.5 19 35.75Fourth Plan 1969–74 20.7 7 16.5 23.5 44.2 18.39 7 16.5 23.5 41.89Fifth Plan 1974–78 24.72 7.5 19.8 27.3 52.02 21.16 7.5 19.8 27.3 48.46Annual Plan 1978–80 26.61 8 22 30 56.61 22.64 8 22 30 52.64Sixth Plan 1980–85 27.7 9.7 27.82 37.52 65.22 23.57 9.01 26.24 35.25 58.82Seventh Plan 1985–90 29.92 10.9 35.62 46.52 76.44 25.47 9.97 33.15 43.12 68.59Annual Plan 1990–92 30.74 11.46 38.89 50.35 81.09 26.31 10.29 36.25 46.54 72.85Eighth Plan 1992–97 32.95 12.51 40.8 53.31 86.26 28.44 11.07 37.7 48.77 77.21Ninth Plan 1997–2002 37.05 13.6 43.3 56.9 93.95 31.01 11.44 38.55 49.99 81Tenth Plan 2002–2007 42.35 14.31 46.11 60.42 102.8 34.42 12 40.81 52.81 87.23
3Forest
INTRODUCTION3.1 National Forest Policy 1988 acknowledged theimportance and primacy of local communities andprovided for a sustainable management approach withmaintenance of environmental stability as the primeobjective. Commitment to conservation of nature ishighlighted by the targets of maintaining one-third ofland under the forest/tree cover. The social concernsare targeted through increasing productivity tomeet local and national needs and creating a people’smovement for afforestation. Industries have beenadvised to network with farmers for industrial rawmaterial.
3.2 Forest cover is critical for a living environment asit influences the quality and quantity of air and water.The role of forests as carbon sinks endows them addedrecognition as an important environmental factor.Therefore, forest cover and afforestation have beendealt with in Volume I, Chapter 9, ‘Environment andClimate Change’.
3.3 In India, per capita forest area is only 0.064 haagainst the world average of 0.64 ha. (FAO). The pro-ductivity of our forests is only 1.34 m3/ha/year againstthe world average of 2.1 m3/ha/year. While 78% of theforest area is subjected to heavy grazing and otherunregulated uses, adversely affecting productivityand regeneration, nearly 10 MH of forest area is sub-jected to shifting cultivation. Land use changes suchas diversion of community areas for non-biomass
purposes have directed nearly all biomass needs to-wards forests.
3.4 Plan investment in forestry and wildlife sector sofar, including State and Central plan, has been about1% of the total plan outlay. The National ForestryCommission (2006) has recommended an investmentof 2.5% of the plan outlay in the forestry and wildlifesector.
3.5 As the State forest administration is responsiblefor management of forests, the focus of Central inter-ventions should be on reinforcing the capacityof States to undertake the national policy mandatestowards conservation and sustainable use. The strat-egy for the Eleventh Plan will, therefore, be to createan environment for achieving sustainable forestry andwildlife management with specific focus on the socio-economic targets. Accordingly, the following scenariowill be the core of the forestry sector developmentstrategy:
• The objective of enhancing the green cover will beintegrated with livelihood opportunities. Suitablepolicy and legal measures for this purpose willback-up the programmatic interventions. The TenthPlan strived to universalize Joint Forest Manage-ment (JFM). The resolve of the Eleventh Plan is tostrengthen the regime by incorporating the conceptsof harvesting, value addition, and facilitated mar-keting of forest produce.
66 Eleventh Five Year Plan
• The ultimate aim of the State forest managementwill be to achieve optimally productive forestscapable of providing timber and non-timber prod-ucts, apart from the ecological services without un-natural change in the composition of the forests.
• The forests in the vicinity of habitations will bemanaged for livelihood needs of the neighbouringpopulations. For this, adequate support and empow-erment will be ensured.
• The harvest of forest products will be governed bythe availability. However, strategy for widening theproduction base beyond forests will be pursued toensure sustainable use of the land resources of thecountry.
• Protected areas will be integrated with the sensitivi-ties of local populations and protected area man-agement planning will be based on the optimizationof local community resources and the use of non-invasive benefits from the PAs directed towards theneighbouring population, on village eco-develop-ment principles.
• Support systems for attaining these results will beevolved in terms of R&D, capacity building, andstrong information system for long as well as shortterm objective monitoring.
LINKING FORESTS TO LIVELIHOOD ANDSTRENGTHENING PARTICIPATORY PROCESSES
NATIONAL AFFORESTATION PROGRAMME3.6 The CSS National Afforestation Programme(NAP) of National Afforestation and Eco-developmentBoard (NAEB) assists rehabilitation of degraded for-ests through JFM Committees. Forest DevelopmentAgencies (FDAs) have been created at the district levelto function as a link between the Ministry of Environ-ment and Forest (MoEF) and JFM Committees for thescrutiny of projects, release of funds, and implemen-tation of the sanctioned programmes.
3.7 NAP, as a CSS, has been the epicenter of the JFMmovement. Out of about 22 MH forest area looked af-ter by 1.07 lakh JFM Committees, NAP covers about 9lakh ha through 23750 committees, which representsonly 24% of the total committees and 4.20% of the totalarea under JFM. NAP as a stand-alone scheme may nothave any impact unless it is able to influence the Statesto orient their programmes towards strengthening JFM.
3.8 There have also been certain shortcomings in theway JFM has been functioning. The modalities ofJFM do not recognize the existing informal traditionalinstitutions engaged in conservation. At the nationallevel, centralized control on activities for NAP com-ponents has resulted in a slow pace of awareness anddevelopment of interface between the forest managersand community institutions.
3.9 In a national-level study conducted by the IndianInstitute of Bio-Social Research and Development in2004–05, JFM was evaluated in about 500 JFM Com-mittee areas in 13 States across the country. The crite-ria were clarity and purpose of roles, institutionalmechanisms, capacity of JFM Committees, and re-source management. Impact on forest profile, socio-economic aspects such as household income, villagedevelopment, women empowerment, and social unitywere studied. The average score for institutionalizationis 51% with high scores for West Bengal (68%),Rajasthan (62%), and Maharashtra (56%). However,no State has reached the state of incorporating androutinization of JFM. The effectiveness of the institu-tions has been rated as 50.28% with strong correlationwith resource management. To achieve success the needfor more motivation than mechanisms has been felt.Highest effectiveness was observed in Uttaranchal, WestBengal, Orissa, and the least in Karnataka, AndhraPradesh, and Chhattisgarh.
3.10 Close analysis has revealed that conflicts andfailures have been more where the benefits from man-aged resources are scarce or not clearly visible. Thissituation demands investment for improving produc-tivity of the resources and rationalizing the modalitiesof sharing. Products from the forests could forma share of communities while ecological benefits in-cluding aperpetual green cover could be the nationalshare. Products can then be accounted as the valuepaid by the State to the communities for the environ-mental services rendered by them for conservingforests.
3.11 National Afforestation/Eco-restoration Pro-gramme, as the flagship programme of the CentralGovernment, will be designed for augmenting ecologi-cal resources and resultant benefits will accrue to theparticipating community. The main objective will be

Forest 67
to empower all participatory institutions to ensure for-est conservation.
• For improving the outreach of the Programme,States will also need to implement their forestimprovement programmes through the ForestDevelopment Agency (FDA) mechanism.
• It will be ensured that the micro plans evolve fromthe JFM Committees and the decisions on speciesfor afforestation are based on a naturally compat-ible combination of species with local ownership.
• The JFM framework will duly recognize the exist-ing Van Panchayat and other community forestryinstitutions and honour their democratic decisionsrelated to management of forests. The gram sabhasunder the PESA in Schedule V areas and the tradi-tional institutions in the North East can act ascommunity forestry institutions. The green coverof the community forests and the environmentalservices will be treated as the share of the Stateand the harvested products as the share of thecommunity.
• The programme may also include a component forencouraging forest-based small enterprises withappropriate mechanisms for accessing forest pro-duce. Self-employment programmes will be sup-ported with training and capacity building ofeducated unemployed youth.
• The social component in the Programme canalso include specific projects on decentralizedenergy solutions such as biomass gasification-basedelectricity, solar systems, etc., for improvement ofcommunity services, linking these to plantingprojects.
• The programme for afforestation/eco-restorationshould leverage part of allocation under NREGPfor augmenting the ecological resource base.
National Afforestation, Eco-restoration, andEco-development Board3.12 The NAEB may be renamed as the NationalAfforestation, Eco-restoration, and Eco-developmentBoard (NAEEB) to broaden its vision to include non-tree ecosystems. The NAEEB programme will have thefollowing components:
• Grants-in-Aid for Greening India Scheme willinclude assistance for setting up well-equipped
nurseries for quality planting material, supported bywell-networked genetic improvement plans andwell-monitored seed/clone testing and certificationprogramme, apart from afforestation efforts byNGOs.
• Monitoring and evaluation of the state of desertifi-cation and afforestation/eco-restoration pro-grammes and co-ordination of programmes forcombating desertification based on the definedcriteria and indicators, as mandated within UnitedNations Convention to Combat Desertification(UNCCD).
• Support to regional centres of the NAEB to assistin dissemination of technologies and NAEEBprogrammes through mass awareness and studies.
• Eco task forces for afforestation/eco-restoration ofthe areas where afforestation/eco-restoration is notpossible with participation of people due to harshconditions.
Augmenting Common Biomass Resources3.13 More than four lakh villages in the countrydo not have a forest in the vicinity. For augmentingthe biomass resource base, community controlledand other accessible lands need to be made optimallyproductive.
3.14 Panchayat Raj Institutions should identify suchavailable lands and empower the community groupsfor their regeneration and management on locallyrelevant terms. States will provide technology andwages through the social forestry wing, with thesupport of the Central Government through a newCSS. Thus the funds and technical support under thisprogramme will be available where Panchayats arewilling to put the underproductive lands under pro-ductive regimes.
3.15 The NREGP can be linked for building thesecommon resources. However, this would presupposeproactive action by fund users and sustained supplyof manpower till the establishment of the planta-tions.
PROMOTION OF AGRO-FORESTRY3.16 Agro-forestry offers ancillary opportunities ofsustained income per unit investment in agriculturallands as subsidiary to the main crops. While in
68 Eleventh Five Year Plan
commercial agriculture, bund planting has been popu-lar, net returns are better than conventional practicesin many situations in rainfed areas. Subsistence or com-mercial agro-forestry has thus scope to grow from theexisting indicative contribution of about 3% to about10% of the forest/tree cover.
3.17 India today imports large quantities of timberas well as pulp. For ensuring impetus in greening infarm sector, organizing markets and facilitating fairtrade will be the priority. Concessions for cheap andduty-free import of pulp need to be reviewed. Marketoptions and incentives including overseas marketsshould be available to the farmers. R&D for enhanc-ing productivity and testing indigenous alternatives toconventional agro-forestry species such as Eucalyptusand Acacias, suitable for the farm sector, should betaken up.
MITIGATION OF DEGRADATION OF FORESTS3.18 The management of government forests ishandled by the State Governments whereas capacitybuilding and research have been with the CentralGovernment.
3.19 Apart from a network of regional centres ofMoEF for monitoring the compliance of centralregulations, a CSS Integrated Forest Protection waslaunched in the Tenth Plan. The programme could bemade fully operational only in 2005–06 and is yet toshow an impact. Assistance provided under thisprogramme needs to be thoughtfully used for build-ing modern sustainable forest management capacityof the states. This will include management informa-tion, inventory and assessment, and adoption ofmodern methods for planning and monitoring.Accordingly the following two programmes of MoEF,viz., Integrated Forest Protection, and StrengtheningForestry Divisions, are proposed to be reoriented inthe Eleventh Plan.
INTENSIFICATION OF FORESTMANAGEMENT SCHEME3.20 The Integrated Forest Protection Scheme will beredesigned to provide assistance to the states for build-ing capacity and basic infrastructure for modernforest management. Improving Management Planning
and Survey (land records) set-up will be the first pri-ority for Central assistance. The following componentswill be provided for modernization of the State forestmanagement:
• Modernization of the management planning(Working Plan) units with equipment, infrastruc-ture, and manpower. This may include forest inven-tories, training and satellite imagery processing,and GIS facilities. This will also include professionalservices such as ecologists and sociologists forrelevant inputs.
• Forest Land Information System for land records,with modern and empowered survey, and landrecord maintaining mechanisms for documentingthe legally recognized individual rights, concessions,ownerships including those under the ScheduledTribes and other Forest Dwellers (Recognition ofForest Rights) Act.
• Forest boundary demarcation by providing assis-tance for the state-of-the-art infrastructure, train-ing/outsourcing survey work, fixing permanentboundary pillars, updating the forest block indicesand compartment histories.
• Installation of forest fire surveillance and warningsystems, along with fire management planning inparticipatory mode. This fire management systemwill also be integrated with a national network forforest fire surveillance and monitoring.
• Assistance for general infrastructure for accommo-dation in remote areas, communication, improve-ment of road network, etc., will also be a part of thisprogramme.
STRENGTHENING FOREST MANAGEMENT3.21 The programme will cover consultations andstudies on relevant matters for efficient managementof the sector including monitoring of compliancethrough the network of regional offices of the Minis-try. Following specifically earmarked componentsshould be part of this programme:
� A National Forestry Information system may beset up, along with networking with the States, fortracking the changes in forest development, harvest-ing, trade, and utilization scenarios. This will in-clude information on non-timber forest produce

Forest 69
(NTFP) resources including medicinal and aro-matic plants.
� The National Working Plan Code may be revisitedfor incorporating aspects dealing with ecologicaland biodiversity concerns of the forest areas. Thiswill also include NTFP, medicinal, and aromaticplant resources.
� A mechanism for internationally recognized inde-pendent sustainable forest management certifica-tion regime for forest resources and products maybe set-up.
MANAGEMENT OF GREGARIOUS FLOWERINGIN THE NORTH EAST3.22 Muli bamboo, Melocanna baccifera, grows over anarea of approximately 18000 square kilometre (sq km)in the States of Mizoram, Tripura, Manipur, and partsof Assam, Nagaland, and Meghalaya. The largest popu-lation of the species exists in Mizoram covering about6700 sq km. Gregarious flowering has commenced af-ter a flowering cycle of about 48 years and the wholeflowered bamboo population will dry off after seedsetting. This may result in ecological, economic, andsocial problems in the area due to destruction of largetracts, rendering them vulnerable to forests fires, deple-tion of important bamboo resources for the artisans andindustry, and increase in rodent population causingfurther destruction and health hazards. For working outa strategy for management of gregarious flowering inthe North East, consultations began in April 2002 whichresulted in the launching of a CSS for which a sum ofRs 85 crore was approved by the Central Governmentas part of an action plan of Rs 366 crore. The programmeactually took off in 2005–06 and will continue till2008–09. The action plan has the following priorities:
• Resource survey and mapping be taken up for as-sessment of the growing stock affected.
• Harvesting of the standing crop of bamboo to theextent possible before flowering, including arrange-ments to facilitate transport by road, railway, water-ways, etc. Effective ways of disposal of the harvestedbamboo by linkages with paper mills like HindustanPaper Corporation Ltd, promoting bamboo-basedcottage industries and establishing mini mechani-cal chipping and pulping units in small-scale indus-trial sector.
• Regeneration of flowered areas including introduc-tion of economically important bamboo species forsubsequent use.
CAPACITY BUILDING AND RESEARCH
CAPACITY BUILDING3.23 The ongoing paradigm change in the forestry sec-tor necessitates fundamental orientation and attitudi-nal changes of the personnel in line with multifariousroles of forests, corresponding variety of externalities,and for coping with traditional forestry managementpractices. This includes social sensitivities along withthe scientific basis of the processes of nature.
3.24 An integrated capacity building programme willbe designed for forestry personnel including trainingof trainers for State frontline staff training institutionsand will also enable stakeholders to understand theperspective of conservation in human well being byproviding them state-of-the-art information andknowledge base.
INDIAN INSTITUTE OF FOREST MANAGEMENT (IIFM)
3.25 IIFM has emerged as a premier forestry institu-tion and has contributed to the development of crite-ria and indicators for sustainable forest managementand participatory forest management processes. Basedon an evaluation, IIFM intends to enlarge its educa-tional and management development programmesas well as policy-relevant research focused on forestryand its linkages with rural institutions and naturalresource-based rural livelihoods. The Institute willtake up policy and development research includingthe valuation of ecosystem services, evaluation ofthe economy of participation in natural resource,especially forest management, and modelling ofimpact of climate change on livelihood and forestresources.
WILDLIFE INSTITUTE OF INDIA (WII)3.26 Apart from the training, research, and advisoryrole of WII, the new approaches would include devel-oping workable framework for mainstreaming con-servation in development projects and policies,empirical studies on processes for ecological impacts
70 Eleventh Five Year Plan
of developmental projects and human activities,strengthening common property resource manage-ment, and developing expertise in managing wildlifein isolated and fragmented landscapes. The use ofmodern tools and technology and development ofanalytical capabilities will be undertaken.
INDIAN COUNCIL OF FORESTRY RESEARCHAND EDUCATION (ICFRE)3.27 The Council was created in 1986 to evolve ascientific environment in forestry, in view of thenew scope of genetic, ecological, climatic, and eco-nomic roles, compared to pre-1988 mandates, oflargely silviculture-based management systems, andancillary aspects on regeneration, harvest, and utiliza-tion. Accordingly, the management of research andeducation needs to be supported by enabling decision-making through consultation and in a professionalcapacity.
• The Council should have specific separate mandatesregarding the administration of its institutes andco-ordination of research. For this purpose, a taskgroup may be set up, involving top-level researchmanagers, forest managers, and policy makers, topropose a working mechanism including resourcemobilization for its research and education com-ponents. This group may also deliberate on inte-grating wildlife, biodiversity, and habitat/landscape/ecological research concerns within the Council.
• For the plan period, 50% of the total grants-in-aidto ICFRE will be earmarked exclusively for researchand education. The Council will encourage itsinstitutes to collaborate with other institutions ofrepute in relevant fields including State ForestResearch Institutes.
• Research programmes will be oriented towardsmeeting the priority areas of productivity, geneticimprovements, ecosystem research, and updatinggrowth and yield parameters required for analysisin management planning. Management of naturalforests for improvement of their profile will bethe main focus. The research and educationprogramme in the field of utilization of woodand wood products should also include IndianPlywood Industries Research and Training Institute(IPIRTI).
• Nation-wide long-term genetic improvementprogrammes for indigenous species, screening ofIndian species for fast growing, short rotationalternatives for traditional species for industry andprotocols for survey, inventory, and managementplanning for NTFP, medicinal, and aromatic plantsin forests will be launched.
• Specific thrust will be given for developing technolo-gies and processes for agro-forestry and socialforestry. Quality seed and planting materialprogrammes in public or private sector will be sup-ported by credible testing and certification regimes.
• A forest biodiversity network will be established forintegrating the available information on one plat-form and for studies in the left out areas. It will becompatible with the management planning systemsof forest administration and the other existing/evolving information resources.
• Inter-sectoral impacts, trade, and market aspectsof forest economics, ecosystem research, policyresearch, and concerns of climate change includingcarbon trade methodologies, will be taken up.
INDIAN PLYWOOD INDUSTRIES RESEARCH ANDTECHNOLOGY INSTITUTE (IPIRTI)3.28 Besides the specific mandate of developing tech-nologies for efficient utilization of wood in structuralmaterial, development and promotion of technologiesfor alternative and efficient use of residual waste likebamboo, husk, wood waste, small wood, etc., will bethe thrust areas. Better utilization of the agro-forestryspecies including treatments for longevity of the prod-ucts will be the focus of research for utilization. Apartfrom its own grants in aid, IPIRTI will be integratedwith ICFRE for wood utilization research and tech-nology. Technology transfer being the mandate ofIPIRTI, professional courses on wood technologyshould be planned.
FOREST SURVEY OF INDIA (FSI)3.29 Present scope of the FSI is limited to the assess-ment of tree canopy cover. The information is notsufficient for objective assessment and planning forthe sector.
3.30 Scope of interpretation of satellite data for treecover will include separate canopy status in forest lands,

Forest 71
patterns of degradation, and state of commercialplantations. With redefined green cover, appropriateindicators compatible with the technologies usedby FSI need to be developed. Monitoring of ecologicalstatus of landscapes/habitats in terms of the dynamicsof vegetation and early warning systems, productivity,consumption, and supply from forest and non-forestresources will be taken up. On the basis of thesepriorities, rationalization of the present network ofregional units and manpower will be taken up. Thescope, definition, and components of FSI inventorieswill be decided at an expert group level, in order torender them compatible with various national andinternational formats, definitions, and organizationsfor collaboration.
SOCIO-ECONOMIC AND POLICYIMPERATIVES
TRIBALS, NTFP, AND PESA3.31 State governments will need to provide supportfor implementation of the Scheduled Tribes andother Forest Dwellers (Recognition of Forest Rights)Act for preparing the forest land records for therecognized rights, mapping of common forests forcommunity management, and developing manage-ment plans.
3.32 To maximize economic benefits to the commu-nities with sustainable forest use, the available mecha-nisms for dealing with NTFP will be reviewed. As thelarge volume NTFPs require dealing and trading athigher scale, professional services can be organizedthrough the marketing federations of NTFP gather-ers/processors. Nationalized system of collectionthrough corporations and contracts will be dealt within the light of the settled policy and legal position.Improving livelihood through gainful employmentopportunities will be encouraged by organizingvalue addition of NTFP at community level underthe NAP. For capacity building and technologyassistance, linkages with voluntary organizationsand programmes such as National Bamboo Mission,National Mission on Bamboo Applications, Villageand Small Scale Industries, and institutes of ruraldevelopment and technologies will be established.
GENDER PERSPECTIVE3.33 Women are the principal stakeholders in naturalresource use and management. It is crucial to ensureequal representation of women in the decision mak-ing and implementation processes in participatoryplanning and development programmes. JFM prin-ciples indicate 50% participation of women in JFMinstitutions. However, the models vary among States.The participation of women should be ensuredin all community activities and the decisions shouldbe based on their considered opinions. This shouldhold good for not only JFM but also processes such asafforestation through Panchayats, protected area man-agement, planning, and use of common propertyresources including NTFP under the Tribal Rights Actor PESA. Thus gender perspective should be a visiblecomponent of any community-based programme.
MOBILIZATION OF RESOURCES FOR AFFORESTATION3.34 Apart from enrichment activity for forests,afforestation/eco-restoration helps in sustaining thelivelihood of the rural poor. Developing multipurposeresources in underproductive forest or non-forestareas must be a component of any employmentgeneration programme. A shelf of afforestation/eco-restoration programmes will be generated forvillage communities for implementation under theNREGP. Necessary institutional initiatives will includenotification of afforestation as one of the activities, anddovetailing afforestation programmes with the NREGprogramme.
COMPENSATORY AFFORESTATION FUNDMANAGEMENT AND PLANNING AUTHORITY(CAMPA)3.35 While considering the proposals for diversion offorest lands for non-forestry purposes under Forest(Conservation) Act, 1980, MoEF generally levies costof compensatory afforestation in equivalent non-forest lands offered by the user agencies or in degradedforest land. Net present value of the land allowed to bediverted is also realized from the user agency. The fundsthus accrued were to be made available by the respec-tive States for identified compensatory afforestationand other forest development activities. The ApexCourt had, however, observed that the funds were not

72 Eleventh Five Year Plan
appropriated to the implementing authorities. It,therefore, directed the Central Government in 2002to constitute an authority for management of thefunds received from the user agencies and theirexclusive and prompt utilization for the intendedpurpose. MoEF notified the constitution of CAMPAon 23 April 2004 for management and use of this fundfor forest development. However, the mechanism isyet to take effect. It is understood that presently anamount of about Rs 5000 crore is available withCAMPA for utilization in forest conservation activi-ties. The amount should be made available in thecurrent plan period on the basis of specific project pro-posals from the States.
FOREST PLANTATIONS3.36 For sustaining forest cover, existing commercialplantations should be intensively managed for opti-mum productivity and provided with scientificallydesigned inputs including quality planting material,cultural/silvicultural treatments, etc. Harvesting andreplanting should be the interlinked operations. In thecontext of the required thrust on agro-forestry, itshould be ensured that plantation projects in forestlands avoid agro-forestry species.
3.37 On the other hand, afforestation works shouldbe taken up with a specific context and habitat profilein mind and only in participatory mode with localcommunities. The species selection should be a partof the micro plans. The Central Government is respon-sible for the approval and monitoring of WorkingPlans. Therefore, MoEF should ensure that no newcommercial plantations are created in the name ofafforestation/eco-restoration.
PRIVATE FORESTRY INITIATIVES3.38 The Central Government has been deliberatingon modalities of PPP. The concept of multi-stakeholderpartnership in forestry is primarily based on grantingtenure on degraded lands (including forest lands)to investors with benefit-sharing arrangements.Considering the multiple stakes of local communitiesover the forest lands, and the accepted position offirst charge of communities on natural resources,such partnership with industry for forest lands is notdesirable. However, with the explicit consent of the
communities in public-hearing mode, possibilitiesof such ventures in non-forest wastelands can beexplored.
3.39 Encouraging industry as a dedicated destinationfor agro-forestry products will be desirable and focusshould be on establishing appropriate linkages withthe farmers for cultivation of tree crops as suggestedin the National Forest Policy 1988. The examples ofITC-Bhadrachalam and other similar initiatives withinthe private sector are worth emulating in this context.
AREAS UNDER SHIFTING CULTIVATION3.40 The North Eastern hill areas need to be viewedas cultivated and uncultivated domains—both withextensive tree cover owned by people, individually orcollectively. The length of the jhum cycle is the maindeterminant of degradation of jhum lands. The re-duced amount of land available for jhum shortens thefallow period and results in increased economic pres-sure on low-income families. Most of the shiftingcultivation is practiced on lands with customary com-munity rights. In such areas, any afforestation activitybeyond fallow management is expected to face resis-tance. Replacement of these practices by settled agri-culture or horticulture has resulted in alienation ofthe lands from common categories, putting furtherpressure on the remaining commons.
3.41 For the areas with jhum cycles above 10 years,the tree farming model of Nagaland EnvironmentalProtection and Economic Development Project maybe studied. It provides for planting of fast-growingindigenous trees along with main crop to ensure thatthe trees attain harvestable girths by the subsequentslash and burn stage, and find demand in the timbermarket. While tree planting can be supported underNAP, appropriate market linkages for ensuringeconomic benefits to the farmers from the treeproducts will be quite useful. For this, opening upmarkets beyond NER with appropriate safeguards isimportant.
ECO-TOURISM3.42 Eco-tourism, including homestead tourism,offers excellent possibilities of taking the benefits ofnature conservation to local communities in many

Forest 73
ways. The protected areas and the adjoining terrestrialand wetland ecosystems have the potential tocontribute to the rural economy and communitydevelopment. A long-term policy is needed on eco-tourism, complementary with the conservation objec-tives and participation of the local stakeholders fromthe serving communities.
3.43 The eco-tourism plans should include modali-ties of managing the ecological and socio-economicintegrity of the area, designs to strengthen the capaci-ties of locally formed institutions, such as land man-agement committee, waste management committee,alternative fuel technology institutions, tour operatorscommittee, etc. The programmes should be takenup with the tourism sector and build on communityownership to promote equitable distribution of thenet benefits.
PRESERVATION OF WILDLIFE ANDFOREST BIODIVERSITY3.44 The 1952 National Forest Policy provided forsetting up of sanctuaries and national parks forpreservation of wildlife. Enactment of the Wildlife(Protection) Act, 1972, launch of Project Tiger in 1973,Project Elephant in 1992, and the Biological DiversityAct 2002 are other milestones. Indian Ivory is bannedand India is a member of the Convention on Interna-tional Trade in Endangered Species of Wild Fauna andFlora. On the R&D front, WII, Central Zoo Authority(CZA), the new Tiger Conservation Authority, and
National Wildlife Crime Control Bureau show the in-creasing Central resolve to support the responsibilityof States for conservation.
3.45 The public forests dedicated to the protection ofwildlife habitats include 96 national parks and 509wildlife sanctuaries. The total area of 15.7 MH, whichis about 4.78% of the geographical area of the countrycovering about 20% of the total forests, is maintainedunder this protected area network. Scientific assess-ments of biodiversity of fauna, flora, and micro-organisms and well-organized retrievable databases forthese are yet to be achieved.
3.46 During the Eleventh Plan, initiatives will be takenfor mitigation of wildlife–human conflicts, involvingand compensating local communities, management ofhabitats outside PAs, rehabilitation of displaced com-munities, and strengthening and protection of indig-enous knowledge while improving research andmonitoring systems.
INTEGRATED DEVELOPMENT OF WILDLIFE HABITATS3.47 The CSS ‘Development of National Parks andWildlife Sanctuaries’ provides assistance to the Statesfor conservation activities in the wildlife areas. Dur-ing the Tenth Plan, out of the outlay of Rs 350 crore,Rs 240 crore was allocated and 342 PAs have been cov-ered. MoEF has prioritized the PAs on conservationvalue basis. However, all PAs do not have scientificallydrafted management plans. At present, about 204 PAs
Box 3.1Avoided Deforestation Incentive Mechanism for States
• There is no incentive to the States to protect forests. In the era of climate change, India has to depend on avoided defores-tation as a mitigation step. In this context, there should be a mechanism that supports and encourages avoided deforesta-tion. This money must be shared between the States and the forest dwelling communities.
• Satellite imagery can be used for determining the extent of avoided deforestation. The aim would be to pay for existingdense forest cover, at rates which reflect the opportunity costs of the forests. This will create local stakes and economicinterest in dense forest protection.
• It is important to develop a compensation structure for the State Government and the local community. The CentralGovernment should create a system for cess on all tax payers—a forest services tax (replace the road cess) to fund thismechanism.
• If such a strategy is developed internally in India, it can provide the framework to source carbon funds for avoideddeforestation that can enhance economic benefits of protection and livelihood security.

74 Eleventh Five Year Plan
are reported to have approved management plans. Theprincipal objective of Central assistance being devel-oping efficient management, the assistance needs tohave linkages with the management plans.
3.48 The scheme may be renamed as ‘IntegratedDevelopment of Wildlife Habitats’ with wider scopefor conservation. The support for management, pro-tection, and development of PAs can be augmentedby the following initiatives by MoEF:
• Evaluation of the non-recurring investment in thePAs should form the basis of further non-recurringassistance. The Central assistance can also be linkedto the deployment of sanctioned frontline staffstrength in the first place. The concept of project-based assistance with a provision of mid-coursethird-party appraisal may be considered.
• States should constitute specialized units for under-taking surveys, inventories, and the socio-economicanalysis required for management planning andbaseline landmarks for the PAs including the com-munity and conservation reserves.
• Assistance for development of PAs should be basedon the management plan and assessment of out-comes of the past interventions. Participatory man-agement with village eco-development will bean earmarked component of the programme.Ministry will issue an eco-development resolutionto the States with guiding principles, as was donein case of JFM in 1990.
• Assistance should also be provided for managementof the identified special vulnerable habitats of highconservation value outside PAs on similar terms.This may include assisted regeneration for the veg-etation components of such habitats.
• Species recovery and conservation programmesshould also be supported for endangered species/ecosystems such as the Snow Leopard, the GreatIndian Bustard, the Dolphin, and their habitats.Wide consultation will be undertaken for threatassessment and project formulation, consideringthe larger landscapes and socio-economic issuesinvolved.
• Management of human–wildlife conflict may in-clude compensation for damage from wildlife, mea-sures to mitigate and avoid ingress of wildlife
movement into habitations, tracking, capture, andtranslocation of wildlife from high conflict areas inexcess of carrying capacity, to other suitable habi-tats on case to case basis.
STRENGTHENING WILDLIFE MANAGEMENT3.49 The Directorate of Wildlife Preservation with anetwork in major ports of import/export has been re-inforced with National Wildlife Crime Control Bureau.The following components may be added to theprogramme.
• Studies and consultations needed for importantareas of concern such as conservation values,biodiversity impact assessments, cost–benefit analy-sis of relocation proposals of habitations from wild-life areas, etc.
• Pilot projects for species focused initiatives and re-location of viable populations of wildlife species tonew habitats, monitoring of the impact of rescue/conservation/outreach efforts, etc.
• A programme for rehabilitation of traditional hunt-ing communities with the participation of NGOs,activists, forest department, and the revenue depart-ment.
CENTRAL ZOO AUTHORITY (CZA)3.50 The CZA provides financial assistance to recog-nized public sector zoos having adequate land, poten-tial, and willingness to develop as modern zoos. Alaboratory for conservation of endangered speciesat the Centre for Cellular and Molecular BiologyHyderabad and five veterinary centres for zoo animalhealth care have been supported. The assistance to zoosincludes modern housing and upkeep of animalsincluding relocation of the existing zoos. Duringthe Eleventh Plan, this may also include the followingcomponents.
• Support for rehabilitation and upkeep of animalsof seven rescue centres created by CZA for rehabili-tation of captive animals from the circuses.
• Development of a National Referral Centre at theIndian Veterinary Research Institute, Izatnagar(Bareilly) for specialized services and diagnosticfacilities for health care of wild animals in Indianzoos.
Forest 75
PROJECT TIGER3.51 The Tenth Plan period saw the depletion of tigerpopulation from the Sariska Tiger reserve, resulting inthe introspection through the Tiger Task Force. Themethods of monitoring the status of wildlife havebeen found primitive. The recommendations of theTiger Task Force are relevant for not only protectedarea management but also general forest management.The follow-up of the recommendations has resultedin the constitution of the Tiger Conservation Author-ity and Wildlife Crime Control Bureau at the Centre.Critical activities such as identification of areas fea-sible for relocation and inclusive protection strategiesremain to be worked on. Out of about 1500 villages intiger reserves, only 80 have been relocated so far in-cluding nine during the Tenth Plan period.
3.52 India eco-development project was taken up inseven tiger reserves during the Ninth Plan and theTenth Plan at a cost of Rs 142 crore. The investmentsmade for evolving a protected area management strat-egy with village eco-development as an importantcomponent are yet to be evaluated for sustainability.The evaluation of the project remains to be analysedfor utility and cost efficiency in the context of exten-sion to other protected areas.
3.53 The National Tiger Conservation Authorityprovides an institutional mechanism for ProjectTiger. The prerequisites for efficient management,namely, filling up vacancies of frontline staff, capacitybuilding for working in conservation areas, manage-ment planning on the acceptable principles of partici-patory processes, and scientifically sound systems fordocumentation and monitoring of the key constitu-ents of the habitats should be ensured:
• Relocation of villages from the existing tiger reservesis a priority. The resources for this purpose will beearmarked in the annual plans on the basis of theproject reports and feasibility.
• Specific arrangement for documentation of land-marks and progress on the basis of the socio-economic, population, habitat, and ecologicalindicators should be laid down for effective moni-toring of the impact of management inputs in thetiger reserves.
• Village eco-development should be the core activ-ity in the project. The assistance for the tiger re-serves can be linked to the eco-developmentactivities based on micro plans developed with fullparticipation of local communities.
• Notification of any new tiger reserves should beconsidered based on the scientific data analysis aswell as assessment of impact on local communities.
PROJECT ELEPHANT3.54 The aim of Project Elephant is long-term conser-vation of viable elephant populations in the larger land-scapes through strengthening or creation of corridors.Not enough attention has been paid to reduce human–wildlife conflicts. Much of the activities have beenshort-term responses to conflict situations. Withincreasing population, wild elephants are observed tobe increasing their range by dispersing into new areas.
3.55 The project should focus on strategies forstrengthening and developing elephant movementcorridors. Possibility of relocation from the areaswith the potential of restoration of habitats shouldbe explored. For the captive elephant population,a complete database for monitoring the status ofhealth and productivity should be aimed at. ForState Governments maintaining domestic elephants,component for improving the kraals and training ofmahouts may also be provided.
ANIMAL WELFARE3.56 The Animal Welfare Board of India (AWBI) hasbeen working on ensuring a humane dealing of ani-mals in experimentation, during stress, of stray animals,and general protection from cruelty. The AnimalWelfare movement has been largely based on NGOparticipation. The following components of animalwelfare are dealt with by the Ministry under the plan:
• Provision of shelter houses.• Provision of ambulance services for animals in
distress.• Animal birth control and immunization of stray
dogs.• Scheme for relief to animals during natural calami-
ties and unforeseen circumstances.• Assistance to AWBI.

76 Eleventh Five Year Plan
• Assistance to Committee for the Purpose of Con-trol and Supervision of Experiments on Animals.
• National Institute of Animal Welfare.
3.57 Proposed programmes for rabies control,gaushalas, and capacity building should be structuredwithin the existing components. An information basealong with fact sheets on the voluntary groups work-ing in the field of animal welfare should be prepared.For National Institute of Animal Welfare, curricula
need to be designed based on the larger scope ofcareer opportunities and subject related courses. Agood programme of monitoring the status of stray dogpopulation in the country can be taken up throughcollaborative, free, public domain knowledge resourcesbased on student projects.
3.58 The total projected GBS for the Eleventh planfor the MoEF is Rs 8842 crore (at 2006–07 price) andRs 10000 crore (at current price).

IIRural Development

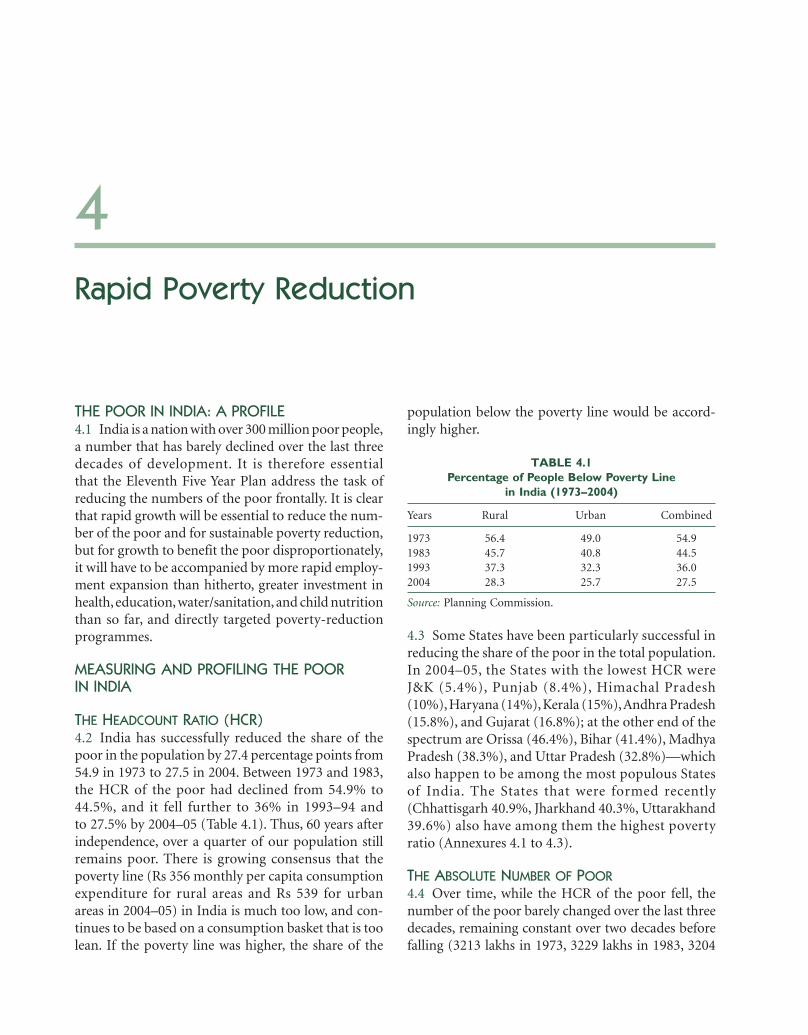
4Rapid Poverty Reduction
THE POOR IN INDIA: A PROFILE4.1 India is a nation with over 300 million poor people,a number that has barely declined over the last threedecades of development. It is therefore essentialthat the Eleventh Five Year Plan address the task ofreducing the numbers of the poor frontally. It is clearthat rapid growth will be essential to reduce the num-ber of the poor and for sustainable poverty reduction,but for growth to benefit the poor disproportionately,it will have to be accompanied by more rapid employ-ment expansion than hitherto, greater investment inhealth, education, water/sanitation, and child nutritionthan so far, and directly targeted poverty-reductionprogrammes.
MEASURING AND PROFILING THE POORIN INDIA
THE HEADCOUNT RATIO (HCR)4.2 India has successfully reduced the share of thepoor in the population by 27.4 percentage points from54.9 in 1973 to 27.5 in 2004. Between 1973 and 1983,the HCR of the poor had declined from 54.9% to44.5%, and it fell further to 36% in 1993–94 andto 27.5% by 2004–05 (Table 4.1). Thus, 60 years afterindependence, over a quarter of our population stillremains poor. There is growing consensus that thepoverty line (Rs 356 monthly per capita consumptionexpenditure for rural areas and Rs 539 for urbanareas in 2004–05) in India is much too low, and con-tinues to be based on a consumption basket that is toolean. If the poverty line was higher, the share of the
population below the poverty line would be accord-ingly higher.
TABLE 4.1Percentage of People Below Poverty Line
in India (1973–2004)
Years Rural Urban Combined
1973 56.4 49.0 54.91983 45.7 40.8 44.51993 37.3 32.3 36.02004 28.3 25.7 27.5
Source: Planning Commission.
4.3 Some States have been particularly successful inreducing the share of the poor in the total population.In 2004–05, the States with the lowest HCR wereJ&K (5.4%), Punjab (8.4%), Himachal Pradesh(10%), Haryana (14%), Kerala (15%), Andhra Pradesh(15.8%), and Gujarat (16.8%); at the other end of thespectrum are Orissa (46.4%), Bihar (41.4%), MadhyaPradesh (38.3%), and Uttar Pradesh (32.8%)—whichalso happen to be among the most populous Statesof India. The States that were formed recently(Chhattisgarh 40.9%, Jharkhand 40.3%, Uttarakhand39.6%) also have among them the highest povertyratio (Annexures 4.1 to 4.3).
THE ABSOLUTE NUMBER OF POOR4.4 Over time, while the HCR of the poor fell, thenumber of the poor barely changed over the last threedecades, remaining constant over two decades beforefalling (3213 lakhs in 1973, 3229 lakhs in 1983, 3204

80 Eleventh Five Year Plan
lakhs in 1993–94) to 3017 lakhs in 2004–05 (Table 4.2).Therefore, number of poor in the country has declinedover the last decade (1993–94 to 2004–05) by 1.86.
TABLE 4.2Number of Persons Below Poverty Line
in India (1973–2004)(in Lakh)
Years Rural Urban Combined
1973 2612.90 600.46 3213.361983 2519.57 709.40 3228.971993 2440.31 763.37 3203.682004 2209.24 807.96 3017.20
Source: Planning Commission.
4.5 In some States, the absolute numbers of the poorin the population has actually increased over the lastthree decades: in Uttar Pradesh (including Uttaranchal)from 535.7 lakhs in 1973 to 626 lakhs in 2004–05;in Rajasthan from 128.5 lakhs to 134.9 lakhs; inMaharashtra from 287.4 lakhs to 317.4 lakhs, andin Nagaland from 2.9 lakhs to 4.0 lakhs. The totalnumber of poor has also increased in Madhya Pradesh(including Chhattisgarh) taken together from 276 lakhsto 341 lakhs and in Bihar (including Jharkhand) from370 lakhs to 485.5 lakhs over the same period. Thereare many States where the number of poor overall hasremained roughly constant over the last two decades:Haryana, Himachal Pradesh, Orissa, and Mizoram.However, there are also States that have succeededin reducing the absolute number of the poor in ruralareas over the three decades from 1973 to 2004–05:Andhra Pradesh from 178.2 lakhs to 64.7 lakhs;Karnataka from 128.4 lakhs to 75 lakhs; Kerala from111.4 lakhs to 32.4 lakhs; Tamil Nadu from 172.6 lakhsto 76.5 lakhs; and West Bengal from 257.9 lakhs to 173.2lakhs (Annexures 4.1 to 4.3), and Assam and Gujarat toa much smaller extent. These are the relative successstories in reducing the numbers of the poor in India.
4.6 Overall, the number of poor in rural areas inthe country as a whole has declined from 2613 lakhsin 1973 to 2209 lakhs in 2004–05, i.e., by just 404lakh people over a 31 year period. That means therate of decline in the numbers of the poor has been13 lakhs per year. But in urban areas the numbers ofthe poor has gone on increasing from 600.5 lakhsin 1973 to 808.0 lakhs in 2004–05 (Annexures 4.1 to4.3); this is hardly surprising since the share of the
urban population in India’s total population hasalso gone on increasing, driven partly by rural urbanmigration.
4.7 The fact that the numbers of the poor have de-clined in rural areas, and increased in urban areas overthe last three decades suggests that to escape ruralpoverty, the poor migrate to urban areas. In fact, thetotal number of migrant workers in India in 1999–2000was 10.27 crore—a staggering number. The numberof seasonal or cyclical migrants in India may be 2 croreor so. But migration, both rural–rural (from relativelypoor to relatively richer States and districts) andrural–urban, has the effect of disenfranchising thepoor, leaving them without a safety net. Nevertheless,rural–urban migration will, and should continue; thepolicy imperative is that migrants are provided thebasic social services that all citizens are entitled toaccording to the Constitution of India.
4.7(a) While the earlier two subsections examined theheadcount ratio and the absolute numbers of the poor,it is also useful to examine which States contribute mostof India’s Poor. Four States account for nearly 58% ofIndia’s poor population in 2004–05: Uttar Pradesh(19.6%), Bihar (12.23%), Madhya Pradesh (8.3%) andMaharashtra (10.5%). In 1983, these States (includingundivided Bihar and Madhya Pradesh) accounted for49% of India’s total poor population (Annexure 4.1).
COMPOSITION OF THE POOR4.8 The composition of the poor has been changingand rural poverty is getting concentrated in agricul-tural labour and artisanal households and urbanpoverty in casual labour households. Agriculturallabour households accounted for 41% of rural poorin 1993–94 as well as in 2004–05. The share of self-employed in agriculture among the rural poor hadfallen from 32% to 21.6%. Casual labour householdsaccounted for 62.6% in 1993–94 in urban areas and56.5% in 2004–05.
4.9 The occupational composition of rural poor var-ied across the States. In general, in developed Statespoverty was highly concentrated among agriculturallabour households, and in contrast in backward Statespoverty extended to other occupational groups includ-ing self employed in agriculture.

Rapid Poverty Reduction 81
4.10 Among social groups, SCs, STs, and backwardcastes accounted for 80% of the rural poor in 2004–05, considerably more than their share in the ruralpopulation (Working Group on Poverty, PlanningCommission, 2006). In 2004–05, while the HCR of thepoor in the total rural population was 28.3%, amongthe SCs it was 36.8%. In urban areas, the HCR overallwas 25.7%, but among SCs it was even higher than inrural areas at nearly 40%.
4.11 The proportion of STs population among therural population living in poverty is high. It is about15% in 2004–05—double that of their share in thetotal population of India. For rural population, theincidence of poverty among STs had fallen from51.94% in 1993–94 to 47.3 % in 2004–05 whereas ithad fallen from 37.3% to 27.5% in the total popula-tion. In 2004–05, the incidence of poverty among theSTs had barely fallen compared to a decade earlier andit was a good 20 percentage points higher for the STsthan for the rest of the population.
4.12 The share of poor in the total urban populationin 2004–05 was 25.7% but 33.3% of the STs in urbanareas were poor. The HCR of the STs (47.3%) ishigher than that of SCs (36.8%) in rural areas, but thesituation is the other way around in urban areas, i.e.,of all STs living in rural areas a higher proportion ispoorer than all SCs living in rural areas. On the otherhand, of all SCs living in urban areas, more SCs arepoor than all STs. In rural areas SCs don’t have accessto land and therefore are forced to migrate to urbanareas more often. On the other hand, STs (unlike SCs)in rural areas have much better access to land, espe-cially in the forested areas, but the quality of that land,and its productivity is low, and yields low incomes.
In terms of assets, unlike SCs, the STs have less of aproblem in respect to land. Thus, in the total ruralpopulation, 63.2% of households held land, and thatshare was 61.3% for STs.
4.13 In terms of both income poverty and otherindicators of human development (such as educationand health) the STs are at the bottom. The increasingconcentration of the tribals among those who sufferfrom multiple deprivations is a matter of concern.
MULTIPLE DEPRIVATIONS OF THE POOR4.14 Deprivation of SCs and STs shows itself also inthe form of inequalities of wealth. SCs own fewerassets than the rest of the population. Most SCs livein rural areas, where land is the main asset. In theoverall population, 60% of the rural households werecultivator households. But SC households are moredisadvantaged among rural households; only 47% werecultivators and a quarter of the SC households wereagricultural labour households (Table 4.3). About 6%to 7% of the SC households were artisan households.If we examine the value of assets held by social groupsin rural areas, we find that in the total populationabout 12% of the households in the ‘Other category’(i.e., non-SC, non-ST, and non-OBC) have assets worthless than Rs 30000; but 22% of rural SCs have assetsworth less than Rs 30000. Conversely, only 9% of SChouseholds have assets worth Rs 3 lakh and above,while 37% of households in the ‘Other category’ (whoare not either SC or ST or OBC) hold such assets. Thisdifference in asset holdings becomes sharper in urbanareas, with as much as 29% of SC households with as-sets less than Rs 30000. Only 16.7% of SC householdshold assets worth Rs 3 lakh, while 43.5% of ‘otherhouseholds’ hold such assets in urban areas.
TABLE 4.3Percentage of Households by Asset-holding Categories, by Social Group
Social Group Household Asset-holding (Rs in ’000s)
Rural Urban
less than 30 300 and above less than 30 300 and above
ST 23.5 9.1 32.5 20.1SC 22.1 9.0 29.1 16.7OBC 13.3 24.4 23.7 28.5Others 11.9 37.1 20.0 43.5All 15.9 24.8 23.0 33.7
Source: All-India debt and investment survey, Ministry of Statistics and Programme Implementation,GoI, NSS 59th Round, 2003.

82 Eleventh Five Year Plan
4.15 Land is the most important asset for ruralpeople. Although SCs were 21.6% of the rural house-holds, they held only 9% of the land (Table 4.4).On average SC households barely owned 0.3 ha ofland in rural areas. Land distribution was even furtherskewed against the SCs in urban areas. Other Back-ward Classes (OBCs) on average held 0.758 ha (orapprox. 1.5 acres) per household, although the shareof total rural land held by them was comparable totheir share in the population.
4.16 With fewer assets, it was also not possible for SCsand STs to borrow (Table 4.5), and thus emerge out ofpoverty. This is true for both sets of communities inboth rural and urban areas.
4.17 SCs and STs have much worse health, education,and nutrition indicators than the rest of the popula-tion, followed by OBCs, and others (Table 4.6). Whileinfant mortality rates (IMR) were 49 for Others, forSCs it was 66, for STs 62 and for OBCs 57. Their nutri-tional status is also worse; the mean body mass index(BMI) for SCs, STs, and OBCs is 5–10% below that forOthers, and very close to the cut-off for malnutrition(>18.5). (BMI is a measure of a person’s nutritionalstatus [weight for height, measured in kg per squaremetre, sq m, of height.])
4.18 SCs and STs have Gross Enrolment Rates at pri-mary level which are comparable with the generalpopulation (Table 4.7), as they have risen sharply for
TABLE 4.4Land Owned per Household by Social Group, 2003
Characteristic Rural
SC ST OBC Others All
Percentage of area of land owned 9.04 11.2 43.5 36.3 100Average area (ha) owned per household 0.3 0.77 0.76 1.003 0.73Percentage of households 21.6 10.6 41.6 26.26 100
Urban
SC ST OBC Others All
Percentage of area of land owned 4.76 3.25 36.8 55.21 100Average area (ha) owned per household 0.04 0.15 0.14 0.151 0.13Percentage of households 15 2.91 34.5 47.57 100
Source: Household Ownership Holdings in India, Ministry of Statistics and Programme Implementation, GoI, NSS 59th Round, 2003.
TABLE 4.5Incidence of Indebtedness by Social Group
Indicators Rural
ST SC OBC Others All
Average debt per household (Rs ) 3205 4641 8288 10437 7539Debt asset ratio (%) 2.3 3.7 3.1 2.4 2.8Incidence of indebtedness (%) 17.9 27.1 28.9 25.7 26.5
Urban
ST SC OBC Others All
Average debt per household (Rs ) 9233 7744 11200 13577 11771Debt asset ratio (%) 3.8 4.2 3.4 2.4 2.8Incidence of indebtedness (%) 12.2 19.2 21.2 15.3 17.8
Source: All-India debt and investment survey, Ministry of Statistics and Programme Implementation, GoI, NSS 59th Round, 2003.

Rapid Poverty Reduction 83
all sections of the population in the recent decade.However, their dropout rates, before they completefive years of schooling (a minimum if they are to
retain literacy acquired during those five years), arehigher than for the general population. ST childrenare dropping out far more. Thus, we have a serioussituation, in that in 2004–05 not only were 29% of theentire nation’s children dropping out before complet-ing primary schooling, but the SCs and STs weredoing even worse.
POVERTY AMONG WOMEN4.19 The incidence of income poverty among femalestended to be marginally higher in both rural andurban areas. The percentage of female persons livingin poor households was 28% in rural and 26% inurban areas in 1993–94, and 29 and 23 respectivelyin 2004–05. In contrast, the percentage of male per-sons living in poverty was 27 in rural and 26 in urbanareas in 1993–94, and 27 and 23 in 2004–05 . The lowerpercentage of female persons among the poor despitehigher female poverty ratio was due to an adverse sexratio—which itself is a reflection of the discrimina-tion that women and girls face over their life-cycle. Itshould be noted that the above measure of genderpoverty ignores intra-household inequalities in con-sumption. There are other dimensions of poverty suchas food insecurity, malnutrition, and illness associatedmore with female members.
4.20 That women are much worse off in terms of mostsocial indicators is quite well known. SC and ST girlsare the worst off in terms of most educational out-come indicators. For instance, in the critical age-groupof 15–49 years, when women are in their reproductiveand most productive years, it is remarkable that 73%of SC women , 79% of ST women , and 61% of OBCwomen are illiterate. 61% of Muslim women were alsoilliterate; this percentage is relatively low, only becausethe rate of urbanization among Muslims is higher thanfor other social groups.
4.21 The nutritional status of SC and ST womenremains a source of worry as well. A good 42% ofSC women and 46% of ST women had a BMI lessthan 18.5, which is seen as the cut-off for malnutri-tion. The fact that as much as 30% of the ‘Other’women were also malnourished clearly indicates thatthere is a serious problem of under-nutrition amongmost segments of the population, not just SCs and STs.
TABLE 4.6Health and Nutrition Indicators bySocial Groups in 2005–06 (NFHS-3)
Indicators Rural
SC ST OBC Others
Infant Mortality 71.0 63.9 61.1 55.7Under-five Mortality 94.7 99.8 78.7 68.2
Urban
SC ST OBC Others
Infant Mortality 50.7 43.8 42.2 36.1Under-five Mortality 65.4 53.8 54.5 42.1
Total (Combined)
SC ST OBC Others
Fertility 2.92 3.12 2.75 2.35Infant Mortality 66.4 62.1 56.6 48.9Under-five Mortality 88.1 95.7 72.8 59.2
Nutritional Status Mean BMI for Men 19.7 19.3 20.2 20.9Mean BMI for Women 19.9 19.1 20.4 21.3
Source: National Family Health Survey (NFHS-3), 2005–06,International Institute for Population Sciences, Mumbai.
TABLE 4.7Gross Enrolment, Dropout at Primary Stage (I–V)
by Social Groups, 2004–05
Indicators SC
Boy’s Girl’s Total
Gross Enrolment Ratio (GER) 123.33 106.62 115.30Dropout Rate 32.73 36.14 34.21
ST
Boy’s Girl’s Total
Gross Enrolment Ratio (GER) 128.06 115.49 121.91Dropout Rate 42.55 42.04 42.32
General
Boy’s Girl’s Total
Gross Enrolment Ratio (GER) 110.70 104.70 107.80Dropout Rate 31.81 25.42 29.00
Source: Selected Educational Statistics, Ministry of HumanResource Development (MHRD), GoI, 2007.

84 Eleventh Five Year Plan
POVERTY AMONG CHILDREN4.22 Child poverty is widespread in India both inrural and urban areas. The percentage of childrenbelow 15 years living in below poverty line (BPL)households constituted 39 in rural and 41 in urbanareas in 1993–94 and 44 in rural and 32 in urban areasin 2004–05. Among the poor population, the percent-age of children increased from 44 in rural and 39 inurban areas in 1993–94, to 46 and 42 respectivelyin 1999–2000. This rising tendency in the proportionof children among the poor contrasts with the pro-portion of children in the population which was aconstant 44% in rural areas in 1993–94 as well as in2004–05 and a marginal decline from 39% to 32%in urban areas during the same period. The high andrising level of child poverty is not only linked to a highincidence of child malnutrition, but also underminestheir future capabilities and adversely affects equalityof opportunity.
MEASURING AND IDENTIFYING THE POOR: A NOTEON REVISION OF POVERTY LINES4.23 There are two policy-relevant sets of issues aboutpoverty in the country at present. First, there has beencontroversy around the measurement of poverty, aspresented in the official statistics of the Planning Com-mission. Second, there are issues around the identifica-tion of the poor who are potential beneficiaries ofgovernment programmes, as carried out by the UnionMoRD. The two are not unconnected, since for someprogrammes State Governments have to accept theHCR of poor as measured by the Planning Commission.
4.24 There are many unresolved issues regardingmeasurement of poverty in India and upon thequestion of poverty line itself, which necessitate arevisit of this entire question. Accordingly, an ExpertGroup has been constituted by the Planning Commis-sion whose recommendations, hopefully, will provideacceptable measures of both poverty and the popula-tion below the poverty line.
4.25 The identification of the poor since 1992 has beendone in quinquennial surveys carried by the MoRD.The first one (1992) used income to identify the poor,the second one (1997) used consumption. The thirdone (2002) adopted a 13-criteria questionnaire giving
each criteria equal weightage. This survey has beenquestioned in the Supreme Court in Public InterestLitigation. Before commissioning a new BPL surveyfor identification of poor, which is due, there is needto constitute an Expert Group with representativesfrom States, academics, and civil society and evolvean acceptable criteria and methodology for the forth-coming BPL survey. Suitable adjustments of the dis-trict specific and State specific poverty populationyielded from this survey should be negotiated withthe State Governments so that this number is not outof sync excessively with the poverty as measured byPlanning Commission based on National SampleSurvey (NSS) data.
DIRECTLY TARGETED POVERTY REDUCTIONPROGRAMMES AND THE STRATEGY FORINCLUSIVE GROWTH4.26 Given the chronic and multi-dimensional natureof poverty in India, it is imperative that the program-mes to address poverty rely on a multi-pronged ap-proach. The preceding analysis has identified that thereis a geography of poverty, with poverty being concen-trated in the rural areas of certain States. It also pointedout that there is a sociology of poverty, with certainsocial groups increasingly concentrated among thosewho are identified as poor. It also noted that there areidentifiable occupational features of the poor: they areconcentrated in agricultural labour and artisanalhouseholds in rural areas, and among casual labourersin urban areas. Casual labourers in urban areas areessentially distress migrants from rural areas in Stateswhere agricultural land-man ratio is very adverse, andwhere agricultural incomes have not been growing—reinforcing the need for both land reforms as well asmeasures to increase productivity. Accordingly, in thenext section, the strategy and programmes directlyrelevant to the emerging features of poverty groups inIndia are discussed.
4.27 First, regions which have large number of chronicpoor people include tribal in forests concentratedin arid, semi-arid, and sub-humid areas in centraland eastern parts of the country. However, in manysemi-arid regions, where agriculture is mainly rainfedrather than irrigated, located in the more industrialStates of western and southern India, there has been
Rapid Poverty Reduction 85
more dynamism. Migration from semi-arid areas mayresult in improvement of economic conditions forpeople in the rainfed areas due to better investmentopportunities and market functioning compared tothe forest-based regions. In forest regions, poor people’saccess to the resources which are located there in thoseregions have been limited, and their own low humancapital endowment (e.g., low literacy and poor healthservices) have resulted in their incorporation intolabour markets at disadvantageous terms. It is forthis reason that the strategies that are needed foreach of these agro-climatic regions have to rely uponan area-development approach. This is particularlytrue of rain dependent water stressed areas, wherewatershed development has been neglected. Thuswatershed development in rainfed agriculture has totake center-stage in the poverty reduction strategyfor the Eleventh Plan. Watershed development isdiscussed in the chapter on Agriculture (Chapter 1,Volume III). Similar initiatives that hold promise toimpart dynamism to Backward districts/regions are(i) the Backward Regions Grant Fund, (ii) Border AreaDevelopment Programme, and (iii) Hill Area Develop-ment Programme. These initiatives are discussed inthe chapter on Spatial Development (Chapter 6,Volume I).
4.28 Second, the poor are geographically concentratedin India. They also happen to be in States where a sig-nificant proportion of agriculture is irrigated, and notrainfed (and where the land-man ratio is the lowest inthe country). In other words, without effective (i) landreforms and (ii) agricultural services, none of theseregions are likely to be able to reduce poverty. There isalso a need for programmes to modernize land rela-tions in an era of rapid industrialization. We discussagricultural services in the chapter on Agriculture, aswe do land reforms including issues related to alien-ation of tribal lands.
4.29 Third, dependence on casual labour has grown,and a large proportion of the chronic poor are depen-dent on wage labour. There has been a steady increasein the share of the Indian population working as hiredlabour. All of the increase in recent decades has beendue to the expansion of the share of casual hired labour.Most of these are SCs and STs. While male rural casual
labourers have increasingly worked in the non-farmsector over time, women have increasingly been con-centrated in agricultural casual labour and have lostjobs overall, especially in the 1990s. Growth in casuallabour was strong among the landless and especiallyrapid after the 1987 drought. In the 1990s there wasan explosion of self-employed people choosing to dosubsidiary work as casual labourers. The incidence ofpoverty among rural casual workers is greatest amongnon-workers who do occasional casual work and es-pecially among women. Most ST and 40% of SCcasual workers are poor, the landless casual workersbeing the poorest. On an average, women are poorerthan men casual labourers. Clearly, this calls for aneffective wage employment programme in rural areas,especially focusing on women, of the NREG kind.
4.30 Fourth, the poor have to be enabled to increasetheir incomes by diversifying away from agriculture,and relying on non-farm sources for at least a subsid-iary income. Casual labourers and artisans, especiallywomen, can be brought together through socialmobilization to form SHGs, and with credit support,to diversify their sources of income. In certain partsof India (e.g., Kerala, Andhra Pradesh, Gujarat) thesuccess of such efforts have already borne fruit, and itis essential to make sure that this programme goes toscale in the country in regions which need it most—inthe eastern and northern parts—where it has hardlytaken root.
4.31 Finally, the poor need a safety net, if they are toescape the cycle of inter-generational transfer of pov-erty. At least 18 million rural people do not have a homeover their heads, and the rural housing programmeneeds to focus on giving a homestead to at least thosewho are houseless. Homesteads will not only give thema home, but also provide a small plot of land wherethey can diversify their income by rearing goats andpoultry and growing vegetables on the family plot.Similarly, the elderly destitute, widows, and disabledamong the rural poor, need social assistance.
4.32 The poor also suffer from low human capital.Household size is closely related to both malnutritionof adults and children, and to the inter-generationaltransfer of poverty. The directly-targeted poverty

86 Eleventh Five Year Plan
reduction efforts of the government will fail in the Elev-enth Plan if the quality of public health services andthe integrated child development services do not im-prove, and also if the universalization of elementaryeducation with quality does not happen. However, aninclusive growth strategy that focuses only on humancapital formation or directly targeted poverty reduc-tion is likely to fail. The structure of growth and alsothe pattern of production have to be employment-gen-erating, especially outside agriculture. In other words,the simultaneous focus on a three-legged strategy—economic growth, income-poverty reduction throughtargeted programmes, and human capital formation—will put India on a sustainable growth path, since thereis a recognized synergy between these outcomes.
GUARANTEED WAGE EMPLOYMENT—NATIONALRURAL EMPLOYMENT GUARANTEE ACT (NREGA)4.33 Workfare programmes have been importantprogramme interventions in India and elsewhere indeveloping countries since long. These programmestypically provide unskilled workers with short-termemployment on public works. They provide incometransfers to poor households during periods when theysuffer on account of absence of opportunities of em-ployment. In areas with high unemployment rates andunder employment, transfer benefits from workfareprogrammes can prevent poverty from worsening,especially during lean periods. Durable assets that theseprogrammes create have the potential to generatesecond-round employment benefits as requisite infra-structure is developed.
4.34 We have a long history and experience in imple-menting wage employment programmes. However,beginning with Jawahar Rojagar Yojana in 1989, theoutreach of these programmes increased significantlyas in the period 1989 to 2006, ultimately culminatingin NREGA. These wage employment programmesimplemented by State Governments with Central as-sistance were self-targeting, and the objective was toprovide enhanced livelihood security, especially ofthose dependent on casual manual labour.
4.35 Based on the experience of these programmesthe NREGA was enacted to reinforce the commitmenttowards livelihood security in rural areas. The Act was
notified on 7 September 2005. The significance ofNREGA lies in the fact that it creates a right basedframework for wage employment programmes andmakes the government legally bound to provide em-ployment to those who seek it. In this way the legisla-tion goes beyond providing a social safety net, andtowards guaranteeing the right to employment. Theexperience with NREGA so far suggests that it is oneof the main planks of rapid poverty reduction in theEleventh Five Year Plan.
4.36 Starting with 200 districts across the country inPhase-I during 2006–07, NREGA was extended toadditional 130 districts in Phase-II during 2007–08.From 1 April 2008 onwards the Act will cover the wholeof rural India. As a district is notified under the Act,Sampoorna Grameen Rozgar Yojana (SGRY) is auto-matically merged in the NREGA and would thereforecease to exist with effect from 1 April 2008.
4.37 The objective of the NREGA is to enhance thelivelihood security of the people in rural areas by guar-anteeing 100 days of wage employment in a financialyear to a rural household whose members volunteerto do unskilled manual work. The Act further aims atcreating durable assets and strengthening the liveli-hood resource base of the rural poor. The choice ofworks suggested in the Act address causes of chronicpoverty like drought, deforestation, soil erosion, etc.,so that the process of employment generation is on asustainable basis.
4.38 Employment is dependent upon the worker ex-ercising the choice to apply for registration, obtain ajob card, and then to seek employment through a writ-ten application for the time and duration chosen byher. The legal guarantee has to be fulfilled within thetime limit prescribed and this mandate is underpinnedby the provision of unemployment allowance. TheAct is thus designed to offer an incentive structureto the States for providing employment as 90% of thecost for employment provided is borne by the Centre,and there is a concomitant disincentive for not pro-viding employment, if demanded, as the States thenbear the double indemnity of unemployment andthe cost of unemployment allowance. Earlier wageemployment programmes were allocation based.

Rapid Poverty Reduction 87
However, NREGA is not supply driven but demanddriven. Resource transfer under NREGA is based onthe demand for employment and this provides anothercritical incentive to States to leverage the Act to meetthe employment needs of the poor. The deliverysystem has been made accountable, as it envisages anAnnual Report on the outcomes of NREGA to be pre-sented by the Central Government to the Parliamentand to the State Legislature by the State Government.
FUNDING4.39 The Central Government bears the costs on thefollowing items:
• The entire cost of wages of unskilled manualworkers.
• 75% of the cost of material, wages of skilled andsemi skilled workers.
• Administrative expenses as may be determinedby the Central Government, which will include,inter alia, the salary and the allowances of theProgramme Officer and his supporting staff andwork site facilities.
• Expenses of the National Employment GuaranteeCouncil.
4.40 The State Government bears the costs on thefollowing items:
• 25% of the cost of material, wages of skilled andsemi skilled workers (as a ratio of 60:40 is to bemaintained for wages of the unskilled manual work-ers and the material, skilled/semi-skilled workers’wages, the State Government has to bear only 25%of the 40% component, which means a contribu-tion of 10% of the expenditure).
• Unemployment allowance payable in case the StateGovernment cannot provide wage employment ontime.
• Administrative expenses of the State EmploymentGuarantee Council.
KEY ISSUES4.41 The key issues that require focus in the EleventhPlan so that NREGA can be optimally realized forsupplementing wage employment opportunities arebriefly highlighted here.
(i) Articulation of Demand for Employment4.42 Since NREGA is a right-based programme, ar-ticulation of demand by the rural poor is the basicpremise of its operation, especially if wage seekers arenot literate and not organized. Generating awarenessamong local rural communities through Information,Education, and Communication becomes critical forenabling the rural poor to articulate demand. Stateshave forged a variety of methods for communicationand social mobilization that include preparation ofcommunication material on NREGA processes insimple local language, one day orientations ofsarpanches/ward members, convening gram sabhas,using district teams for village level interactions, localvernacular newspapers, TV and radio spots, pamphletsand brochures, local cultural forums, informationcounters on local market days, village informationwall, fixing a Rozgar Day in a week, and establishing ahelpline. Full knowledge of the rights that NREGAconfers to the rural poor is the most important pre-requisite to enable them to seek employment as pertheir choice of time and duration.
(ii) Preparing a Labour Budget, Annual Shelfof Projects, and Perspective Plan4.43 The Act guarantees providing employmentwithin 15 days of demand and the instrument for pro-viding employment is unskilled manual work selectedfrom the list of permissible works. This legal guaran-tee has implications for the way in which works haveto be planned. A Labour Budget as stipulated underthe Act is required to be prepared to facilitate advanceplanning, whereby districts estimate their labour de-mand for the ensuing financial year by December-end.The National Guidelines indicate the way in which theannual shelf of projects may be prepared to meet theestimated labour demand. Districts have attempted toprepare shelves of projects to keep a list of works readyto meet employment demand. Greater precision inplanning works has been suggested through assigninga unique location code to each work and mentioningthe plot numbers of the sites where works are to beexecuted. Estimated benefits in terms of person daysneed to be assessed, so that the employment expectedto be generated through the works planned may beclearly matched with the estimated employment de-mand. Physical improvement envisaged (land/water

88 Eleventh Five Year Plan
conservation etc.) has to be quantified so that thefocus remains on creating durable and productiveassets that support further self sustaining employment.Displaying the list of approved works at the GP Officeand the details of works taken up on the work sitehas been stipulated so that the workers know the workopportunities locally available.
4.44 National Guidelines lay down the broad prin-ciples of preparing a Five Year District Perspective Panthat must have the following components viz., villagemapping of natural resources and social infrastruc-ture, identification of gaps and works that can be takenup as per NREGA permissible list, assessment of worksthat respond to what local people want, what will builda livelihood base to enable them to move out ofNREGA to sustainable employment, and assessmentof labour demand.
4.45 The planning capacity of the PRIs and districtlevel functionaries needs to be strengthened to infusethe Plans with a long term vision of sustainable liveli-hoods.
(iii) Record of Work Done and Paymentof Wages4.46 The legal guarantee of the Act mandates thatwages due to workers be paid within 15 days of workcompletion. This requires that a fair record be main-tained for the work done. To ensure that authenticmuster rolls are used, numbered muster rolls are tobe issued for each sanctioned work by ProgrammeOfficer and maintained on the work site by the ex-ecuting agency. Muster rolls must mention Job Cardnumbers of workers, days worked, quantum of workdone, amount paid and must have space for recordinginspections. Muster rolls should be read out on thework site during measurement and wage paymentto prevent bogus records. Entries of the muster rollshould be correspondingly recorded in the job cardsof the workers. Updating of muster roll data at theBlock level computers in a 15-day cycle needs to beensured. Regular measurement and supervision ofworks should be done by qualified technical person-nel on time. There is a need for stricter complianceof all the provisions of the Act so that payment to thelabourers can be made in time.
(iv) Vigilance and Transparency4.47 NREGA places a strong emphasis on vigilanceand transparency. A web enabled management infor-mation systems (MIS) www.nrega.nic.in has beendeveloped that seeks to place all information inpublic domain. It is a household level database andhas internal checks for ensuring consistency and con-formity to normative processes. All critical parametersget monitored in the public domain.
4.48 The field verification of NREGA processes isthrough external and internal agencies and the feed-back is shared with the States for follow up. Indepen-dent concurrent studies have also been taken up.Monitoring at the State level needs to be strengthenedand States are expected to ensure 100% verification atblock, 10% at district, and 2% at the State level espe-cially of works muster rolls, and records. Guidelinesfor muster roll verification have been evolved and needto be rigorously followed. The setting up and traininglocal vigilance and monitoring committees is also re-quired for bringing in lateral transparency.
(v) Public Accountability4.49 The Act contains specific provisions for publicaccountability. This has to be accomplished throughthe provisions made in the Act and guidelines regard-ing Right to Information, proactive disclosure ofinformation, and a transparent social audit process.
4.50 The Right to Information should be followed inboth letter and spirit in all matters relating to NREGAas stipulated in Section 4 and Schedule I, Para 17 ofthe Act.
4.51 The Section 17 of NREGA provides for socialaudit of all works in a GP by the Gram Sabha and theGP has to provide records for social audit. This neces-sitates a need for creating capacity for social auditamong officials, GP members, and the Gram Sabha.A significant feature here is the active role played bycivil society organizations in facilitating social auditprocesses in partnership with State Government aswell as independently.
(vi) Grievance Redressal4.52 Enforcement of the right to employment requires
Rapid Poverty Reduction 89
setting up an effective grievance redressal system. TheAct vests the responsibility for grievance redressalwith the Programme Officer. To ensure prompt griev-ance redressal certain basic arrangements must beensured, such as setting up a grievance redressalcell at the Programme Officer/District ProgrammeCo-ordinator (DPC) offices, preferably with a tollfree helpline. The Programme Officer and DPC mustreview the disposal of complaints on a monthly basisand the persons concerned must be informed.
(vii) Strengthening Administrative Systems4.53 Technical Resource Support Groups are requiredto bring in multidisciplinary professional expertise inMoRD, to provide resource support in critical areas,inter alia, assisting the Ministry in formulating andcodifying standard operating procedures for settingmeasurable outcomes, for laying down standards ofprogramme delivery, for designing appropriate man-agement information systems (MIS) for monitoringprogramme outcomes. They would also carry outtraining needs assessment for capacity building atthe State, district, and sub-district level and formulatethe framework for training and capacity building atvarious levels.
4.54 Another issue critical to strengthening adminis-trative systems pertains to training of different stake-holders. The requirements of training are considerableat all levels and include functionaries, PRIs and thelocal vigilance committees. The challenge is to designtraining programmes calibrated in content andprocess according to different target groups and tomanage large scale training needs without compro-mise on quality.
(viii) Financial Management4.55 A non-lapsable Central Employment GuaranteeFund has been set up to ensure that availability of fundsmatch working season demands. Districts have dedi-cated accounts for NREGA funds and submit theirproposals based on clearly delineated guidelines so thatfunds may be devolved efficiently at each level, andadequate funds may be available to respond to demand.
4.56 The funds are released on the basis of demandfor employment received in a district and are based on
an appraisal of both financial and physical indicatorsof outcomes. To meet the norms for fund release,districts need to strengthen their capacity for both pre-paring a Labour Budget to project an annual require-ment of funds based on an estimation of labourdemand, and undertake rigorous monitoring of fundsspent and the physical outcomes to track current trendsof employment generation, so that adequate funds canbe demanded and deployed efficiently.
ROAD AHEAD
(i) Empowering Workers4.57 NREGA is a right-based statute and its effective-ness lies eventually in the extent to which wage seekerscan exercise their choice and assert their rights to claimentitlements under the Act. The issues involved inempowering workers are in the range of enhancementof knowledge levels, development of literacy skills,organizing workers, and enhancing social securitylevels of workers. Opening savings accounts of work-ers’ in banks and post offices that has been initiatedneeds to be supported on a larger scale so that thriftand small savings can be encouraged among workers.The inclusion of NREGA workers under the cover ofvarious life and health insurance schemes will also raisetheir security thresholds.
(ii) Linkages with Other DevelopmentProgrammes4.58 Empowerment of workers and creation of du-rable assets depend to a great extent on the linkagesbetween NREGA and other development programmes.Linkages with human development programmes suchas National Rural Health Mission (NRHM), NationalMission for Literacy and Elementary Education, andother livelihood and infrastructure initiatives areneeded to ensure basic human entitlements to theworkers and to strengthen the natural resource baseof livelihoods. The full potential of the kind of workspermissible under NREGA can be tapped if planningfor these works is coordinated with other developmentprojects, for example watershed management, agricul-tural pro-grammes, horticultural projects, etc. Initia-tives for NRM also need to be dovetailed with incomegeneration projects to enable workers to move fromwage employment to self-sustaining employment.

90 Eleventh Five Year Plan
(iii) Exploring the Possibility of Other Works4.59 The list of permissible works under NREGArecognizes the possibility of a need arising for worksother than those specifically indicated in ScheduleI which may be notified by the Central Ministry inconsultation with the States. The Ministry mayconsider formulating guidelines for the States thatmay enable them to identify other works in confor-mity with the general principles of the Act and therationale for them.
4.60 The allocation for the Eleventh Plan (at currentprice) is tentatively provided at Rs 100000 crore. How-ever, since NREGA is a demand driven programmeand the government is legally bound to provideemployment mandated under the act, this figure isonly indicative.
SELF-EMPLOYMENT—SWARNJAYANTI GRAMSWAROZGAR YOJANA (SGSY)
Rationale4.61 Persistent efforts made by the government tofine-tune the self employment programmes duringvarious Plan periods, especially oriented towardsimproving the implementation quality, yielded somenew concepts that emerged at various times andgot consolidated. The need to integrate the clusterapproach, capacity building, skill upgradation, infra-structure including marketing development and tech-nology penetration were felt more acutely with everypassing year. Emphasis also was necessary to be laidon micro enterprise development with effective for-ward and backward linkages, so as to ensure bestreturns on the investment. Therefore, the SGSY waslaunched with effect from 1 April 1999 to bring theassisted poor families above the poverty line by ensur-ing appreciable sustained level of income over aperiod of time. This objective was to be achievedby organizing the rural poor into SHGs through theprocess of social mobilization, their training andcapacity building and provision of income generatingassets. The SHG approach helps the poor to build theirself-confidence through community action. Groupprocesses and collective decision were to enable themin the identification and prioritization of their needsand resources. This process would ultimately lead to
the strengthening and socio-economic empowermentof the rural poor as well as improve their collectivebargaining power.
4.62 The SGSY is, by design, meant to create wide-spread income generating activities, through the em-powering mechanism of SHGs, where group dynamicsare expected to compensate for the basic weaknessesof the individual rural poor and present them as creditworthy and financially accountable units. The systemof grading the SHGs through a rigorous process isexpected to separate the more vibrant of the SHGs andeventually give them a capital subsidy assistance so thatthey undertake self-employment oriented livelihoodopportunities.
4.63 The SGSY scheme has been successful in deliver-ing the outcomes in terms of poverty alleviationwherever capacity building and beneficiary mobiliza-tion have been carried out. Thrift, multiple lending,participatory process of identification, and pursuitof economic activities have succeeded in States likeAndhra Pradesh, Tamil Nadu, and Kerala substantiallybecause the basic processes had been grounded.
4.64 The higher performance parameter of multiplelending and increased quantum of lending have beenachieved in States like Andhra Pradesh due to theSHGs having been federated at different levels fromthe village to the district. With the emergence of a wellfederated organizational base, the SHG network hasbeen observed to acquire dynamism and versatility inactivities in States like Kerala and Andhra Pradesh.There have been diverse models of Self Help in vari-ous parts of the country, most important amongthem being the Kudumbashree in Kerala with activelinkages with the PRIs, and the AP model that relieson the fulcrum of federations of SHGs that have growninto organizations of the poor. The NABARD alsosponsors SHGs.
Key Issues4.65 The SGSY is being implemented since 1999. Closeto 2.6 million SHGs have been formed under the SGSYsince its inception. Of these SHGs 16 lakh have alreadycrossed the Grade-I stage. About 8 lakh SHGs havepassed the Grade-II stage and of them, slightly less than

Rapid Poverty Reduction 91
five lakh SHGs have taken up economic activities.About 60% of the Grade-II SHGs have taken upeconomic activities, the balance number waiting forfinancial assistance. Of the nearly Rs 25000 crore creditflow targeted under the programme, less than 50% hasbeen achieved. SHGs have several in-built strengths,most of which are intangible, such as group cohesion,enhanced ability for articulation of common demands,better and efficient use of available local resources, etc.While it would be necessary to work on the strengthsof the SHGs, it is equally necessary to learn the lessonsfrom the experience of implementing the SGSY overthe past eight years. There are several issues—someconceptual ones pertaining to larger aspects of theprogramme, such as the role and utility of the subsidycomponent, and some programme specific secondgeneration issues such as forming federations, provi-sion of interest subsidy, social mobilization issues,etc. Some such issues are highlighted below:
• Diverse views are being expressed in various quar-ters about the relevance or otherwise of subsidy-driven programmes. A rational response would haveto be found for such positions. Subsidy is a form ofsupport to the poor and stopping it entirely wouldbe unwarranted. However, the idea of directing thesubsidy flows properly and to examine if there wasany case for putting conditionalities to the systemof subsidy flow so that the targeted populations arebetter served, merits examination.
• The number of SHGs formed under the SGSY is verylarge, but there is a feeling about whether such largenumbers mean anything from the point of viewof poverty alleviation. Agencies such as NABARD,Small Industries Development Bank of India(SIDBI), and Rashtriya Mahila Kosh (RMK), andMinistries such as Women and Child Developmenthave their own models of SHG formation and theirsustenance. Some State Governments such as AndhraPradesh and Kerala have their own models. There istherefore, a need for placing the SGSY programmeon this large canvas and fitting it in the broadercontext of the SHG movement of the country.
• There is tremendous shortage of manpower in thearea of technical support for rural development.Andhra Pradesh continually engages about 6.00lakh SHGs through a separate structure, Society
for the Elimination of Rural Poverty that has inde-pendent units that deal with Risk Mitigation, FoodSecurity, Micro Finance, Institution Building,Marketing, and Livelihood Promotion. At the dis-trict level too they have equivalent units that go uptothe Mandal level. The dedicated institutionalmachinery seems to have made a difference. Thereis a case for similar efforts from other States as well.
• Going by the experience of the States like AndhraPradesh, Kerala, and Tamil Nadu, federating theSHGs appears essential for improving the bargain-ing power of the SHGs and better sustainability ofthe SHG movement. Encouraging the inter-state,inter-district networking of the SHGs/SHG Federa-tions for marketing of the SHG products would bethe next step. Current institutional arrangementsfor social mobilization and livelihood generationare somewhat limited in scope. Therefore, a mis-sion mode approach to enhance facilitation, insti-tutional building, and hand holding support to SHGmovement is required over a long period of time tosecure sustainability of SHGs and their apex orga-nizations. The social mobilization aspect of theSGSY programme has hitherto not been given dueattention. Social mobilization is both a means andan end in itself. Expansion of political rights of themobilized poor will have tremendous intrinsicvalue, not always measurable. A few of the SHGsthat acquire the characteristics of good entrepre-neurs may be encouraged to become entrepreneurs.SGSY is actually lagging behind in keeping pace withthe SHG movement sweeping the country.
• Credit is a very important issue. It would be neces-sary to enhance the credit flow to the SHGs in amore creative manner than what has been possibleso far. The credit achievement, in terms of the totalvolume as well as the rate of flow, in Andhra Pradeshmodel seems to be much higher than the nationalachievement. An issue that requires to be looked intois also the possibility of introducing interest sub-sidy as an alternative to the capital subsidy. Thereare no two opinions about the utility of financialintermediation for making the lending under theprogramme cost effective for the banks. Federationsof SHGs having their own corpus can work as in-termediaries. An investment on making the SHGscredit-worthy cannot be wished away. In terms of

92 Eleventh Five Year Plan
priority, saving followed by risk mitigation and thencredit would be the natural sequence for financialintervention. Federations acting as financial inter-mediaries is a high skill activity and it is essentialthat investments are made on enhancing the skillbase of the Federations. There is a need to promoteinstitutional partnerships between the SHGs/Fed-erations with the bankers. Enhancing the credit flowto the poor may call for grounding several strate-gies and partnerships and not just one. The coun-try is also on the threshold of a major initiative formicro finance. Again, there are diverse views onthe role, utility, and relevance of micro finance inpoverty alleviation. The issue of harmonizing theSGSY and the micro finance models also requiresto be looked at.
• New areas are emerging in view of the changes inthe economy due to liberalization, privatization, andglobalization. It may not be possible for the SGSY, apure self-employment programme to capture all theaspects of poverty. Purely from a family’s economicsecurity point of view, BPL families might want tohave at least one wage earner among them, so as toprovide the requisite certainty to their family in-comes. In such a situation there may be a case forintroducing a placement-oriented skill enhance-ment model for youth as a sub-set of the SGSY.This programme will be a hybrid of the wage-employment and self-employment programmes.
• Special projects of the SGSY, that were expected toground innovative and alternative ways of reducingpoverty do not seem to have actually made muchdifference. The higher quantum of subsidy availablethrough special projects appeared to have drivenlarge number of projects. Often activities proposedare eligible to be funded by different schemes of theline departments of the concerned sectors. Even thenfunds are sought in the project proposals throughspecial projects. States and other agencies follow upproposals vigorously till the sanction of the projectand thereafter virtually no monitoring of projectsseemed to have been undertaken. Of the 231 specialprojects that have already been sanctioned, onlyabout 29 have been completed. Due to the indiffer-ent performance it does not appear that there is acase for continuing with the special project compo-nent under the SGSY. There have been very wide
inequities in the sanction of special projects amongthe States so far.
THE WAY FORWARD—STRATEGY FOR THEELEVENTH PLAN4.66 Eleventh Plan strategy for SGSY would have tonecessarily take the best out of what has evolved in theSelf Help movement across the country over the lastfew years and integrate it with the programme. Like-wise a few aspects of the SGSY programme that havefailed to give the desired results require a fresh lookand if necessary, dropped.
4.67 One of the most important aspects that requiresexamination is the institutional mechanism that hadbeen erected to undertake the poverty alleviationprogrammes. The District Rural Development Agency(DRDAs) in their current form and content do notappear to have the requisite wherewithal to handle acomplex issue such as poverty. The current adminis-trative setup at the national level is unequal to a largetask such as poverty elimination across the geographi-cal and social complexity and it requires a differentorder of involvement of the MoRD. It is therefore,necessary to set up a National Agency outside the min-istry to manage the National Rural Poverty Elimina-tion Programme to achieve the objectives of theprogramme meaningfully and comprehensively.The need for setting up a national level agency with aflexible administrative structure, for better planning,organizing, and coordinating the poverty eliminationeffort cannot be overstated. The national level organi-zation will be the intellectual backbone and providerequisite technical expertise and capacities, while theones at the level of the State Governments will be thefunctional bodies. These organizations would haveto be manned by people with an active commitmentto poverty alleviation as well as an undertaking fromthe States to assure minimum tenures to the officialsprior to making any funding arrangements, if neces-sary, through a MoU. The administrative set-up couldessentially be a society attached to the MoRD. Thenational organization will co-ordinate with the pov-erty elimination agencies established by the StateGovernments for implementing the SGSY in its revisedform. It will also be the agency to document and bethe clearing house for the best practices with respect

Rapid Poverty Reduction 93
to the poverty elimination programmes and strategiesof the country. It should devolve funds to the StateGovernments based on rational formulae, evolvingand working out the MoUs with the State Governmentsfor the implementation of the poverty eliminationprogrammes. The national and State level organiza-tions so created will systematically address the keysubjects of poverty alleviation like livelihood genera-tion, capacity building, skill upgradation, credit, andinternational assistance .
4.68 Considering the experiences and lessons learntfrom various development projects, the revised SGSYprogramme should aim at promoting and strength-ening member-owned, member-controlled, and mem-ber-managed institutions of the poor that enable themto secure sustainable livelihoods and better quality oflife. These institutions should provide a wide range ofservices to their members as per their demand. Therevised SGSY should promote and nurture a large cadreof activists and leaders from the poor for providingsupport services to the institutions of the poor on asustainable basis. The approach for organizing the poorstems from the conviction that there is an immensedesire and latent capability among the poor to comeout of poverty. They have a tremendous potential tohelp themselves and the potential of each member canbe harnessed by organizing them. Social mobilizationenables the poor to build their own organizations inwhich they participate fully and directly and take de-cisions on all issues concerning poverty elimination.
4.69 The current mechanism of fund flow to the SHGsthrough a graded system requires a comprehensivereview. The current scheme allows a Revolving Fundentitlement of upto Rs 10000 for the Grade-I SHGs,that will also entitle them to draw cash credit from afinancial institution. The rate of attrition betweenthe Grade-I and II indicates that a large number ofSHGs fizzle out mid-way after availing the RevolvingFund. Further, the SHGs that have cleared the Grade-II stage seem to wait for long periods before getting anopportunity to avail the subsidy assistance. Close to 3lakh such SHGs are waiting in the wings for suchassistance. The overall credit achievement under theprogramme is abysmally low. The overall credit tar-gets are achieved only by about 50%. More importantly
in a capital subsidy mechanism there is little scope toleverage higher credit flow because of the subsidyentitlements. The volume of credit extended to SHGsin one State, Andhra Pradesh, alone is higher than thenational credit achievement under the SGSY. This callsfor serious scrutiny.
4.70 The SHGs can be further strengthened and sta-bilized by federating them at, say village or cluster ofvillages or block level depending upon the number ofSHGs and their spatial distribution. The federationsshall be formal organizations registered under the mostappropriate Acts (Societies Registration Act, StateCooperative Act, Trust, Mutually Aided CooperativeSocieties Act, or Mutual Benefit Trust) that exist in theState. The second tier of Institution Building phase isthe federation of SHGs either at village or at cluster ofvillages’ level. The Village Level Federations (VLFs) arevital for demonstrating solidarity, initiating collectiveaction on various poverty related issues and reducingdependency on the external agency for information,technical support and resolving conflicts. The VLFsprovide a forum to voice the problems of the poor inthe village, exchange of experiences including flow ofinformation from various government departments,and raises resources required to take up the appropri-ate development interventions in poverty reduction.It generates income by collecting share capital, mem-bership fee, savings, interest margins and penalties, andbecome financially sustainable in a period of 3–4 years.Based on the proposals of the VLFs, the district levelagency sanctions fund for on-lending to SHGs. Oncethe VLFs attain a certain level of maturity, the BlockLevel Federation is promoted. The Block Level Fed-eration provides solidarity to all the VLFs and SHGs.It plays a vital role in bringing all the BPL families intothe SHG fold, building the capacities of the SHGsand VLFs, framing required policies and ensuring thequality of institutions, etc.
4.71 However, in order to strengthen the existingprogramme an effort should be made to graduate theallocations in such a manner that all further increasesin the allocations to the SGSY should be based on de-mand-driven model, with attendant commitmentsof the State with respect to erecting institutions ofthe poor, dedicated implementation machinery and
94 Eleventh Five Year Plan
adhering to the framework provided by the nationallevel agency. The current allocations to the SGSYcan taper off over the balance Plan period so that atthe end of the Plan period the new model will be firmlyin place.
4.72 To capture the opportunities that are emergingin the economy due to the processes of globalizationand liberalization, it will be necessary to launch a newsub-set of the SGSY—that can be known as the place-ment-linked skill enhancement programme. TheMinistry’s experience of the Reddy’s Labs initiative ofthe SGSY and more recently with the InfrastructureLeasing and Financial Services (IL&FS), are worthymodels for institutionalization and systemic action.The sectors that can be looked at are Textiles, Leather,Gems and Jewellery, Retail Chains, etc., where there isa shortage of supply of trained labour. Skill forma-tion, by use of in-house programmes, evolving spe-cific curriculum, independent accreditation, andplacement are the essential components of this pro-cess. It is suggested that a definite component of theskills programme be included in the revised SGSYprogramme.
RURAL HOUSING FOR THE HOUSELESS4.73 Housing is a basic human need. A roof over herhead endows a shelterless person with an essential as-set and improves her physical and mental well-being.
4.74 The importance of housing has been acknowl-edged and housing as a human right was recognizedway back by the Universal Declaration of HumanRights adopted by the General Assembly of the UnitedNations on 10 December 1948. Article 25 of thisdeclaration states: ‘Everyone has the right to standardof living adequate for the health and well being ofhimself, and his family, including food, clothing,housing. . . .’
4.75 Article 11 of the International Covenant onEconomic, Social and Cultural Rights, 1966 also re-quired the States Parties to the Covenant to recognizethe right of everyone to an adequate standard ofliving for herself and her family, including adequatefood, clothing, and housing and to the continuousimprovement of living conditions. It further asked the
States Parties to take appropriate steps to ensure therealization of this right.
4.76 India also embarked on the path of making‘housing for all’ a reality. The conference of ChiefMinisters, 1996 recommended the Basic MinimumServices (BMS) Programme. One of the seven BMSrequiring priority attention was ‘Provision of PublicHousing Assistance to all shelterless poor families’.Consequently, the BMS programme became part ofNinth Five Year Plan and concerted efforts in afocused manner were initiated to make these basicservices accessible to every one. Later, the NationalHousing and Habitat Policy, 1998 stated that theultimate goal of the policy was to ensure ‘Shelter to all’and better quality of life for all citizens.
INDIRA AWAAS YOJANA (IAY)4.77 Though the earliest housing programme takenup by the GoI was for rehabilitation of refugeesimmediately after the partition of the country, thegovernment started implementing its major housingscheme of IAY as an independent scheme only from1 January 1996.
4.78 In the present form, IAY is one of the verypopular schemes of the MoRD and has caught theimagination of the rural people. The popularity canbe attributed to the fact that the scheme enablesbeneficiaries to participate and involve themselvesin construction of their home. The role of the StateGovernment is confined to mere facilitating use oflocal, low cost, environment-friendly, and disaster-resistant technology and also in encouraging construc-tion of sanitary latrine and smokeless chulha. There isno prescribed design or technology and no contrac-tors are involved. Funds are released in installmentsdirectly to the beneficiaries and there is no creditportion as part of the assistance which enable timelyrelease of funds. The beneficiaries construct the housesas per their own choice of design, technology, andrequirement. Not surprisingly, evaluation studiesreveal high levels of occupancy and satisfaction.
4.79 In spite of criticism from certain quarters aboutIAY being a full subsidy scheme, experience reveals thathouses get completed more or less on time which may

Rapid Poverty Reduction 95
not have been the case if credit was part of the assis-tance. Moreover the unit assistance of Rs 25000 perdwelling in the plain areas and Rs 27500 in the tribaland hilly areas is not adequate and beneficiaries haveto contribute at least by way of their own labour forcompletion of the house. This participation makes thescheme even more meaningful.
4.80 The funds for the IAY scheme are shared betweenthe Central and the State Government in the ratioof 75:25. The Central budget is allocated to the Statesbased on a 75% weightage to housing shortage and25% weightage to poverty ratio. Similarly the districtallocation is based on a 75% weightage to housingshortage and 25% to the share of SC/ST population.To introduce transparency, the selection of beneficia-ries which was being done through the gram sabhas isnow expected to be from the permanent IAY waitlists.These lists are prepared based on the ranking givento families as part of the BPL Census 2002. Further,60% of the IAY funds are earmarked for SC/STs, 3%for persons with disability, and 15% for minorities. Itis expected that all houses will be sanctioned in thename of women or jointly with the husband. Theseprovisions have enabled effective targeting of theweaker sections and the scheme has succeeded inempowering the poorest.
ADEQUACY OF HOUSES AND TACKLINGSHELTERLESSNESS4.81 Based on building materials used for construc-tion of structure, houses have been classified as perCensus 2001 as pucca houses (the walls and roof ofwhich are made of permanent materials), semi-puccahouses (either the wall or the roof is made of perma-nent material and the other is made of temporarymaterial), temporary house (both walls and roof aremade of materials which have to be replaced fre-quently), serviceable temporary houses (wall is madeof mud, unburnt bricks, or wood), and non-service-able temporary houses (wall is made of grass, thatch,bamboo, plastic etc).
4.82 Trends indicate that share of pucca houses hasincreased. However, kutcha houses account for 26.5million, and the next important cause of shortage iscongestion (10.18 million houses).
4.83 For the Eleventh Plan, however, focus could beon targeting the poorest of the poor as far as IAY isconcerned while targeting the remaining shortage withother interventions. Hence for the purpose of IAY theshortage emerging due to factors of (i) houseless,and (ii) unserviceable kutcha house could be tackled.With these factors, the estimate of housing shortagefor 2001 stands at 148.6 lakh houses and for 2007 at159.5 lakh houses. Hence a target of constructing about150 lakh houses under IAY needs to be fixed for theEleventh Plan.
KEY ISSUES AND STRATEGIC INTERVENTIONS
IAY
(i)Selection of Beneficiaries4.84 Though selection had to be done by the gramsabhas, studies have revealed that 25% to 50% of thebeneficiaries are not being selected through the gramsabhas. Further, the selection as well as allocationamong Panchayats has been influenced by the PRIs/MLAs. The vocal and active segments of beneficiariesinfluence the selection process because of the limitedallotment under IAY. In the process, the poorest amongBPL households are left out, and non-BPL familiesalso get selected for the IAY houses. Besides, collec-tion of illegal gratification of selection by PRIs is acommon complaint often heard at the field level,as brought to light by the several studies. Moreover,only beneficiaries who have house-sites are selectedand thus, the very poor who do not have a plot ofland get out from the purview of the scheme. This is aserious problem, since these are the people who arethe most vulnerable. Some 8 million of the 14 millionhouseless are actually those who have no land, orlive on homes located on land belonging to others(e.g., landlords, public land, etc.). The focus of theIAY programme must be on the houseless (e.g., suchcommunities as the Saharyas, Musahars, the so calledde-notified tribes, those living on canal bunds or roads,and other such who are seen to be at the bottom of thesocial ladder.
4.85 A more accurate targeting may result by thepreparation of permanent IAY waitlists. These waitlistshave to be based on scores given to families as part of

96 Eleventh Five Year Plan
BPL Census 2002. This can bring about more trans-parency and tackle the problem of illegal gratification.Regarding provision of plots and homesteads for thelandless both State Government and Panchayats haveto be encouraged to play a major role. State govern-ment need to be incentivized and Panchayats have tobe appropriately empowered.
(ii) Adequacy of Unit Cost4.86 Inadequacy of cash assistance for constructionhas resulted in poor quality of house, non-fulfillmentof requirements of the disaster-prone areas, and debttrap on account of the beneficiaries having to borrowfunds to complete the construction of a pucca house.Several examples have been reported of poor qualityof construction, sagging foundation, use of temporarymaterials for roofing or leaving the construction in-complete because of inadequate finance. Even aftercontributing their labour and borrowing from localsources, a significant number of families are not ableto complete the house in all respects, and most housesremain without plastering or flooring.
4.87 There is an urgent need to increase the unit costfrom the present level of Rs 25000 for plain areas andRs 27500 for hilly areas.
(iii) Structural Facilities and Provision ofInfrastructure4.88 Studies have revealed that only about 50% of IAYhouses have sanitary latrines and even a lesser percent-age have installed smokeless chullas. This is a seriousproblem. Over a million women and children not onlysuffer from upper respiratory tract infections due toinhaling of indoor smoke but many die as a result.In addition, India is one of the countries in the worldwith much of its population not having access to sani-tary means of excreta disposal (despite the existence ofTSC, another CSS, which is part of the Bharat Nirmanset of pro-grammes). Houses built as part of theCentral Government’s own programmes, like IAY,need to succeed in building of smokeless chulhas andof sanitary latrines.
4.89 The quality of life may not improve despitethe construction of new houses unless there is provi-sion for infrastructure. There is a need to provide a
minimum level of infrastructure such as internal road,drainage, water supply stand post, along with the pro-vision of houses by way of convergence of schemes.
(iv) Ownership Issues4.90 It is found that the title of the house site tends tobe in the name of the male member of the household.Hence the benefit to accrue to women by allotment ofthe scheme is restricted only for the purpose of thescheme sanction. Some effort to ensure clear cut own-ership in the name of women needs to be made.
OTHER STRATEGIC INTERVENTIONS4.91 Other than the IAY, the States have rural houseconstruction programmes usually targeting the poor.While IAY can focus on eliminating the backlog ofhouselessness and temporary and unserviceable housesin rural India, the States should take responsibility foraddressing any emerging needs. It is necessary to havethe right kind of interventions so that the programmeobjective of tackling shelterlessness is achieved withinthe target time. Hence, the following strategic inter-ventions are suggested:
• Encourage primary lending institutions to enhancetheir credit flow to the rural population and activelyinvolve the existing institutional mechanisms ofSHGs and micro finance institutions to extend loansto the rural population.
• Encourage new, flexible financial products throughcommercial banks geared to payback cycles ofrural families to bring about a higher degree of in-clusivity in institutional lending for rural housing.
• Encourage small and medium developers to takeup housing in rural areas through a mix of fiscalincentives and business volumes after necessaryenvironment and social impact assessments andclearances from the PRIs.
• Create institutional mechanisms to address thehigher risk perception in rural areas.
• Consider housing at par with rural infrastructureas far as funding and concessions are concerned, inorder to encourage investments in the sector.
4.92 Based on the aforementioned multidimensionalapproach and strategic interventions, specific initia-tives can be taken up, as listed below.

Rapid Poverty Reduction 97
• The IAY funds are being released directly to DRDAsfor further disbursement. But it has been observedthat there is no uniformity in disbursing the amountto the beneficiaries. To streamline the process aswell as also speedy disbursement to the beneficia-ries which may also speed up physical progress,implementing agencies of IAY at district levelmay be advised to disburse the amount directlyto beneficiaries by depositing in bank accounts asfar as possible.
• To ensure transparency and fair selection ofbeneficiaries, all State Governments have eitherfinalized or are in the process of finalizing perma-nent IAY waitlist in such a manner that the poorestof the poor get the top slot. Further, implementingagencies should introduce the system of socialaudit to ensure proper utilization of funds and tomake the system leakage proof. In addition to thisthe database of the IAY beneficiaries may also beprepared by the States and put on the website forinformation of IAY beneficiaries.
• It is gratifying to note that many State Governmentsare already implementing State-run schemes tosupplement the efforts of the Central Governmentto provide houses to the poor. Still the gap betweenthe demand and supply is huge. Hence to cover upthe shortage of houses for the rural poor, theStates which do not have State-run schemes may beincentivized to have their own State-run schemes.
• Even though 164.00 lakh houses have beenconstructed under IAY till date to provide shelterto the poor, still the poorest of the poor may fail totake benefit under the scheme because of their be-ing landless people in the rural areas. To ensure so-cial and economic equity, it is necessary to reachout to these people. State should acquire land anddistribute homestead plots. Funds for this may beprovided by the government.
NATIONAL RURAL HOUSING CONSORTIUM4.93 A consortium could be created comprising nodalorganizations such as National Housing Bank (NHB),NABARD, nationalized and premier commercialbanks and apex microfinance institutions to provideequity and debt for rural housing for small andmarginal farmers, small village artisans, self employed,etc. MoRD could play the role of a Key Facilitator.
INCENTIVIZING LENDING INSTITUTIONS4.94 Presently, Housing Finance Companies (HFCs)registered with NHB are allowed to create a SpecialReserve to the extent of 40% income earned throughlong term mortgage financing (mortgage loans formore than 5 years) under Section 36(1) (vii) of theIT Act. This fiscal incentive is, however, not availableto banks, who are presently the leaders in the housingfinance market. At present, the rural housing loanportfolios of banks and HFCs, comprise only 10–12%of their total housing loans. There is need to incentivizethese institutions to increase their lending in ruralareas. It is, therefore, proposed that the limit underthis provision should be increased from the presentlevel of 40% to 60% for HFCs, banks, and NHB.The additional 20% provisions will exclusively befor lending in rural areas. It is proposed that banksmay also be allowed to create the Special Reserves onthe lines of HFCs for long term mortgage financingin rural areas. This will encourage banks and HFCsto aggressively lend for housing in rural areas. SHGsand micro finance institutions (MFIs)could also beencouraged to be actively involved in extending hous-ing loans.
ROLE OF HUDCO4.95 Housing Urban Development Corporation(HUDCO) started its rural housing activity from1977–78 by extending assistance for construction/upgradation of rural houses. As part of its commit-ment to rural housing, HUDCO makes availablefinancial assistance to State Governments and theiragencies like Housing Boards, District Taluka, andPanchayat Development Boards nominated by theState Government for undertaking housing schemeswith its assistance.
4.96 HUDCO’s normal rural housing programme byand large caters to Economically Weaker Sections(EWS) (with a monthly household income less thanRs 2500). In rural areas, the three types of schemesfinanced by HUDCO include:
(i) EWS rural housing schemes for landless persons,(ii) EWS rural housing schemes for land owning per-
sons and,(iii) The village abadi scheme including house repair.

98 Eleventh Five Year Plan
4.97 Under the first two schemes, the cost ceiling perdwelling unit is Rs 60000. The maximum extent offinance is 90% of the project cost or Rs 40000, which-ever is less. Under the first scheme HUDCO supple-ments effort of State Governments to provide freehouse sites by extending loans at low interest rates.The third scheme envisages improvement of existinghouses as well as environmental improvement of sur-rounding areas by providing for sanitation, drainage,water supply, link roads, etc. Most of the HUDCO’ssanctions pertain to the second scheme.
4.98 Over the last 28 years, HUDCO has sanctioned2472 schemes with a loan amount of Rs 5807 crore forconstruction of 86.11 lakh dwelling units in variousStates in the country (as on 31 March 2006). There isan urgent need to strengthen the role of HUDCO andprovision of its services to enhance constructionactivity in rural areas, especially to cater to EWS.
4.99 The allocation for the Eleventh Five Year Plan(at current price) is tentatively provided at Rs 26882crore.
SOCIAL PROTECTION—NATIONAL SOCIALASSISTANCE PROGRAMME (NSAP) ANDASSOCIATED PROGRAMMES4.100 The Constitution of India (Article 41) states:‘The State shall, within the limits of its economiccapacity and development, make effective provisionfor securing the right to work, to education and topublic assistance in cases of unemployment, old age,sickness and disablement, and in other cases of unde-served want’. Social protection refers to public assis-tance in all cases of underserved want. It provideshuman security to the poor and the destitute.
4.101 For the first time in India, the NSAP waslaunched on 15 August 1995. The basic aim of thisprogramme was to provide social assistance benefit tothe rural poor in case of old age, death of primarybreadwinner, and for poor women during maternity.It aims at providing them with a modicum of dignityand support, thereby ensuring a minimum quality ofcare and attention from the community. It provides anopportunity for linking the social assistance packageto schemes for poverty alleviation and provision of
basic needs. It was a CSS with 100% Central assistanceprovided to States/UTs. This programme is imple-mented through a synergistic partnership with StateGovernments and under the direct supervision ofDRDAs in close collaboration with the various PRIs.This programme included three schemes viz., NationalOld Age Pension Scheme (NOAPS), National FamilyBenefit Scheme (NFBS), and National MaternityBenefit Scheme (NMBS).
• Under NOAPS, old age pension of Rs 75 per monthwas provided to persons of 65 years and above whoare destitute. This amount has since been enhancedto Rs 200 per month from the year 2006–07. Theresponse for this scheme has been overwhelmingfrom the poor as well as the State Governments.Many States are matching these pension amountsequally and many more are extending the coverageof this scheme to all those identified from amongBPL families.
• The NFBS provides a lump sum family benefit ofRs 10000 to the bereaved household in case of thedeath (natural or accidental) of the primary bread-winner (male or female) whose earnings contrib-ute substantially to the total household income.This scheme is applicable to all the eligible personsin the age group 18 to 64. The bereaved householdshould belong to BPL families to qualify for thisbenefit.
• Under the NMBS there is a provision for paymentof Rs 500 per pregnancy to women belonging topoor households for pre-natal and post-natalmaternity care upto the first two live births. Thisbenefit is provided to eligible women of 19 yearsand above. The objective of the scheme is to extendfinancial assistance to pregnant women from BPLhouseholds, for the first two live births. To ensurebetter linkage with nutrition and national popula-tion control program-mes, NMBS was transferredto Department of Family Welfare and is renamedas Janani Suraksha Yojana in 2001–02. It is now partof the NRHM.
4.102 On the recommendations of the Group ofMinisters (GoM) a new scheme called Annapurna waslaunched on 1 April 2000 as a CSS. It aims to provid-ing food security to meet the requirement of those

Rapid Poverty Reduction 99
senior citizens who though eligible, have remaineduncovered under the NOAPS. Under the Annapurnascheme the beneficiaries should be 65 years or aboveand must be destitute. The beneficiaries are entitled to10 kg of food grains per month free of cost. The ceil-ing on the total number of Annapurna beneficiarieswill be at least 20% of the persons eligible to receivepension under NOAPS.
4.103 These schemes continued to be administered bythe MoRD upto 2001–02 as CSS, and during 2002–03these schemes were transferred to Central Assistancefor State Plans on the recommendation of the NationalDevelopment Council (NDC) with the requisite flex-ibility in the choice of implementation.
KEY ISSUES4.104 Various studies conducted in respect of theNOAPS indicate that the criteria of destitution are dif-ficult to apply. Many States have adopted the povertyline itself to define destitution. This is, in fact, reason-able since a BPL family can hardly support itself andwould not be in a position to support the aged. There-fore, the NOAPS has now been extended to all oldpersons above 65 years of age in BPL families witheffect from 2007–08. Consequently the AnnapurnaScheme which provides 10 kg of foodgrains to seniorcitizens uncovered under NOAPS would be discon-tinued soon after these beneficiaries are coveredunder NOAPS.
4.105 The National Policy for Older Persons, 1999 rec-ognizes that a person becomes a senior citizen at theage of 60 and would be eligible for the facilities andconcessions available to senior citizens. Indeed, theaged over 60 years, from among the poor families, canhardly participate in the workforce and support givento them will be more useful when above 60 years, thanif given only after 65 years. Therefore, the scheme ofNOAPS needs to be made applicable to persons of theage of 60 years or more.
4.106 The rate of pension under NOAPS has recentlybeen enhanced to Rs 200 per month. The State Gov-ernments have been urged to top it up with anotherRs 200 so that every pensioner would get a minimumof Rs 400 per month. Currently, ten States/UTs are
already providing an additionality of Rs 200 per monthor even more. Other States need to be encouragedto supplement the Central Government’s Old AgePension, so that a minimum of Rs 400 per month isprovided to the deserving aged.
4.107 NSAP requires to be extended to two more cat-egories of deserving poor in dire need of this assis-tance viz., persons with severe/multiple disabilities andwidowed women. Similarly, national schemes formaintenance of orphans, street children, and othersections of the poor in distress are needed.
4.108 The scope of the NFBS needs to be extended tocover instances of death of any adult member of thefamily without limiting to the death of breadwinner.
4.109 At present, there are two life insurance schemesoperated by Life Insurance Corporation (LIC) thatare making headway among the people below andmarginally above the poverty line viz., ‘JanashreeBima Yojana’ for the rural poor and the ‘Aam AadmiInsurance Scheme’ for the landless agricultural labour.These two schemes under which the premium iscontributed by the Centre and the State Governmentsin equal proportions provide significant supplemen-tation to the Family Benefit Scheme with enhancedbenefits on death, accidental death, and disability forthe persons insured in the BPL families.
4.110 The poor require comprehensive access tostrengthened public health system and facilities. Inaddition, they need suitable instruments in the formof health insurance in cases involving serious illnessrequiring hospitalization, which are not provided ininstitutions of public health.
4.111 In the execution of NSAP, greater professionalsupport is needed for ensuring quality, delivery andfor suitable monitoring and evaluation purposes, bothat the Centre and State levels. Advisory Committeescomprising of professionals and voluntary organiza-tions should be set up at Central, State, and districtlevels for continuous review of policy and performanceof NSAP. Technical support groups should also beestablished at all level to ensure smooth implementa-tion and closer monitoring of NSAP.

100 Eleventh Five Year Plan
ANNEXURE 4.1Headcount Ratio and Number of Poor Persons Below Poverty Line in India (Combined)
States/UTs Headcount Ratio Number of Poor Persons (in Lakh)
1973–74 1983 1993–94 2004–05 1973–74 1983 1993–94 2004–05
Andhra Pradesh 48.9 28.9 22.2 15.8 225.7 164.6 154.0 126.1Assam 51.2 40.5 40.9 19.7 81.8 77.7 96.4 55.8
Bihar 61.9 62.2 55.0 41.4 370.6 462.1 493.4 369.2
Delhi 49.6 26.2 14.7 14.7 22.8 18.4 15.5 22.9
Goa 44.3 18.9 14.9 13.8 4.2 2.2 1.9 2.0
Gujarat 48.2 32.8 24.2 16.8 138.4 117.9 105.2 90.7
Haryana 35.4 21.4 25.1 14.0 38.3 29.6 43.9 32.1
Himachal Pradesh 26.4 16.4 28.4 10.0 9.7 7.4 15.9 6.4
Karnataka 54.5 38.2 33.2 25.0 170.7 149.8 156.5 138.9
Kerala 59.8 40.4 25.4 15.0 135.5 106.8 76.4 49.6
Madhya Pradesh 61.8 49.8 42.5 38.3 276.3 278.0 298.5 249.7
Maharashtra 53.2 43.4 36.9 30.7 287.4 290.9 305.2 317.4
Orissa 66.2 65.3 48.6 46.4 154.5 181.3 160.6 178.5
Punjab 28.2 16.2 11.8 8.4 40.5 28.6 25.1 21.6
Rajasthan 46.1 34.5 27.4 22.1 128.5 126.8 128.5 134.9
Tamil Nadu 54.9 51.7 35.0 22.5 239.5 260.1 202.1 145.6
Uttar Pradesh 57.1 47.1 40.9 32.8 535.7 556.7 604.5 590.0
West Bengal 63.4 54.9 35.7 24.7 299.3 318.7 254.6 208.4
Chhattisgarh – – – 40.9 – – – 91.0
Jharkhand – – – 40.3 – – – 116.4
Uttarakhand – – – 39.6 – – – 36.0
Chandigarh 28.0 23.8 11.4 7.1 0.8 1.2 0.8 0.7
Dandra & Nagar Haveli 46.6 15.7 50.8 33.2 0.4 0.2 0.8 0.8
J&K 40.8 24.2 25.2 5.4 20.5 15.6 20.9 5.9
All India 54.9 44.5 36.0 27.5 3213.4 3229.0 3203.7 3017.2
Note: 1. Poverty Ratio of Assam is used for Sikkim, Arunachal Pradesh, Meghalaya, Mizoram, Manipur, Nagaland, and Tripura.2. Poverty Ratio of Tamil Nadu is used for Pondicherry and Andaman and Nicobar Islands (A&N Islands).3. Poverty Ratio of Kerala is used for Lakshadweep.4. Urban Poverty Ratio of Punjab is used for both rural and urban poverty of Chandigarh.5. Poverty Line of Maharashtra and expenditure distribution of Goa is used to estimate poverty ratio of Goa.6. Poverty Line of Maharashtra and expenditure distribution of Dadra & Nagar Haveli is used to estimate poverty ratio of Dadra
& Nagar Haveli.
Source: Planning Commission.

Rapid Poverty Reduction 101
ANNEXURE 4.2Headcount Ratio and Number of Poor Persons Below Poverty Line in India (Rural)
States/UTs Headcount Ratio Number of Poor Persons (in Lakh)
1973–74 1983 1993–94 2004–05 1973–74 1983 1993–94 2004–05
Andhra Pradesh 48.4 26.5 15.9 11.2 178.2 114.3 79.5 64.7
Assam 52.7 42.6 45.0 22.3 76.4 73.4 94.3 54.5
Bihar 63.0 64.4 58.2 42.1 336.5 417.7 450.9 336.7
Delhi 24.4 7.7 1.9 6.9 1.1 0.4 0.2 0.6
Goa 46.9 14.8 5.3 5.4 3.2 1.2 0.4 0.4
Gujarat 46.4 29.8 22.2 19.1 94.6 72.9 62.2 63.5
Haryana 34.2 20.6 28.0 13.6 30.1 22.0 36.6 21.5
Himachal Pradesh 27.4 17.0 30.3 10.7 9.4 7.1 15.4 6.1
Karnataka 55.1 36.3 29.9 20.8 128.4 100.5 96.0 75.1
Kerala 59.2 39.0 25.8 13.2 111.4 81.6 56.0 32.4
Madhya Pradesh 62.7 48.9 40.6 36.9 231.2 215.5 216.2 175.7
Maharashtra 57.7 45.2 37.9 29.6 210.8 193.8 193.3 171.1
Orissa 67.3 67.5 49.7 46.8 142.2 164.7 140.9 151.8
Punjab 28.2 13.2 12.0 9.2 30.5 16.8 17.8 15.1
Rajasthan 44.8 33.5 26.5 18.7 101.4 96.8 94.7 87.4
Tamil Nadu 57.4 54.0 32.5 22.9 172.6 181.6 121.7 76.5
Uttar Pradesh 56.5 46.5 42.3 33.4 450.0 448.0 496.2 473.0
West Bengal 73.2 63.1 40.8 28.6 258.0 268.6 209.9 173.2
Chhattisgarh – – – 40.8 – – – 71.5
Jharkhand – – – 46.3 – – – 103.2
Uttarakhand – – – 40.8 – – – 27.1
Chandigarh 28.0 23.8 11.4 7.1 0.1 0.1 0.1 0.1
Dadra & Nagar Haveli 46.9 14.8 52.0 39.8 0.4 0.2 0.7 0.7
J&K 45.5 26.0 30.3 4.6 18.4 13.1 19.1 3.7
All India 56.4 45.7 37.3 28.3 2612.9 2519.6 2440.3 2209.2
Note: 1. Poverty Ratio of Assam is used for Sikkim, Arunachal Pradesh, Meghalaya, Mizoram, Manipur, Nagaland, and Tripura.2. Poverty Ratio of Tamil Nadu is used for Pondicherry and A&N Islands.3. Poverty Ratio of Kerala is used for Lakshadweep.4. Urban Poverty Ratio of Punjab is used for both rural and urban poverty of Chandigarh.5. Poverty Line of Maharashtra and expenditure distribution of Goa is used to estimate poverty ratio of Goa.6. Poverty Line of Maharashtra and expenditure distribution of Dadra & Nagar Haveli is used to estimate poverty ratio of Dadra
& Nagar Haveli.
Source: Planning Commission.

102 Eleventh Five Year Plan
ANNEXURE 4.3Headcount Ratio and Number of Poor Persons Below Poverty Line in India (Urban)
States/UTs Headcount Ratio Number of Poor Persons (in Lakh)
1973–74 1983 1993–94 2004–05 1973–74 1983 1993–94 2004–05
Andhra Pradesh 50.6 36.3 38.3 28.0 47.5 50.2 74.5 61.4
Assam 36.9 21.7 7.7 3.3 5.5 4.3 2.0 1.3
Bihar 53.0 47.3 34.5 34.6 34.1 44.4 42.5 32.4
Delhi 52.2 27.9 16.0 15.2 21.8 18.0 15.3 22.3
Goa 37.7 27.0 27.0 21.3 1.0 1.1 1.5 1.6
Gujarat 52.6 39.1 27.9 13.0 43.8 45.0 43.0 27.2
Haryana 40.2 24.2 16.4 15.1 8.2 7.6 7.3 10.6
Himachal Pradesh 13.2 9.4 9.2 3.4 0.4 0.3 0.5 0.2
Karnataka 52.5 42.8 40.1 32.6 42.3 49.3 60.5 63.8
Kerala 62.7 45.7 24.6 20.2 24.2 25.2 20.5 17.2
Madhya Pradesh 57.7 53.1 48.4 42.1 45.1 62.5 82.3 74.0
Maharashtra 43.9 40.3 35.2 32.2 76.6 97.1 111.9 146.3
Orissa 55.6 49.2 41.6 44.3 12.2 16.7 19.7 26.7
Punjab 28.0 23.8 11.4 7.1 10.0 11.9 7.4 6.5
Rajasthan 52.1 37.9 30.5 32.9 27.1 30.1 33.8 47.5
Tamil Nadu 49.4 47.0 39.8 22.2 66.9 78.5 80.4 69.1
Uttar Pradesh 60.1 49.8 35.4 30.6 85.7 108.7 108.3 117.0
West Bengal 34.7 32.3 22.4 14.8 41.3 50.1 44.7 35.1
Chhattisgarh – – – 41.2 – – – 19.5
Jharkhand – – – 20.2 – – – 13.2
Uttarakhand – – – 36.5 – – – 8.9
Chandigarh 28.0 23.8 11.4 7.1 0.8 1.1 0.7 0.7
Dadra & Nagar Haveli 37.7 27.0 39.9 19.1 0.0 0.0 0.1 0.2
J&K 21.3 17.8 9.2 7.9 2.1 2.5 1.9 2.2
All India 49.0 40.8 32.4 25.7 600.5 709.4 763.4 808.0
Note: 1. Poverty Ratio of Assam is used for Sikkim, Arunachal Pradesh, Meghalaya, Mizoram, Manipur, Nagaland, and Tripura.2. Poverty Ratio of Tamil Nadu is used for Pondicherry and A&N Islands.3. Poverty Ratio of Kerala is used for Lakshadweep.4. Urban Poverty Ratio of Punjab is used for both rural and urban poverty of Chandigarh.5. Poverty Line of Maharashtra and expenditure distribution of Goa is used to estimate poverty ratio of Goa.6. Poverty Line of Maharashtra and expenditure distribution of Dadra & Nagar Haveli is used to estimate poverty ratio of Dadra
& Nagar Haveli.
Source: Planning Commission.

Rapid Poverty Reduction 103
ANNEXURE 4.4Percentage of Population Below Poverty Line by Social Groups—2004–05
States Rural Urban
SC ST OBC SC ST OBC
Andhra Pradesh 15.4 30.5 9.5 39.9 50.0 28.9
Assam 27.7 14.1 18.8 8.6 4.8 8.6
Bihar 64.0 53.3 37.8 67.2 57.2 41.4
Chhattisgarh 32.7 54.7 33.9 52.0 41.0 52.7
Delhi 0.0 0.0 0.0 35.8 9.4 18.3
Gujarat 21.8 34.7 19.1 16.0 21.4 22.9
Haryana 26.8 0.0 13.9 33.4 4.6 22.5
Himachal Pradesh 19.6 14.9 9.1 5.6 2.4 10.1
J&K 5.2 8.8 10.0 13.7 0.0 4.8
Jharkhand 57.9 54.2 40.2 47.2 45.1 19.1
Karnataka 31.8 23.5 20.9 50.6 58.3 39.1
Kerala 21.6 44.3 13.7 32.5 19.2 24.3
Madhya Pradesh 42.8 58.6 29.6 67.3 44.7 55.5
Maharashtra 44.8 56.6 23.9 43.2 40.4 35.6
Orissa 50.2 75.6 36.9 72.6 61.8 50.2
Punjab 14.6 30.7 10.6 16.1 2.1 8.4
Rajasthan 28.7 32.6 13.1 52.1 24.1 35.6
Tamil Nadu 31.2 32.1 19.8 40.2 32.5 20.9
Uttar Pradesh 44.8 32.4 32.9 44.9 37.4 36.6
Uttarakhand 54.2 43.2 44.8 65.7 64.4 46.5
West Bengal 29.5 42.4 18.3 28.5 25.7 10.4
All-India 36.8 47.3 26.7 39.9 33.3 31.4
Note: 1. Poverty Ratio of Assam is used for Sikkim, Arunachal Pradesh, Meghalaya, Mizoram, Manipur, Nagaland, and Tripura.2. Poverty Ratio of Tamil Nadu is used for Pondicherry and A&N Islands.3. Poverty Ratio of Kerala is used for Lakshadweep.4. Poverty Ratio of Goa is used for Dadra & Nagar Haveli and Daman & Diu.5. Urban Poverty Ratio of Punjab is used for both rural and urban poverty of Chandigarh.6. Poverty Line of Maharashtra and expenditure distribution of Goa is used to estimate poverty ratio of Goa.7. Poverty Line of Maharashtra and expenditure distribution of Dadra & Nagar Haveli is used to estimate poverty ratio of Dadra
& Nagar Haveli.8. The poverty ratio among the ST population in some States may be treated with caution due to the smallness of the sample
household based on which the class distribution of persons have been obtained in the NSS. These States are: in the rural areasHaryana and Punjab, where the number of sample households among the STs is 10 or less. Similarly, in the urban areas, theStates are: Bihar, Haryana, Himachal Pradesh, J&K, Kerala, and Punjab, where the number of sample households among the STsis 10 or less, and Delhi, Tamil Nadu and Uttarakhand, where the number of sample households is 20 or less.
Source: Planning Commission.

5Ensuring Rural and Urban Livelihoods
INTRODUCTION5.1 The dispersed, unorganized and often household-based micro and small enterprises are capital-saving,labour-intensive, and environment-friendly tools ofinclusion. In India, they are the largest source ofemployment after agriculture and are found in bothrural as well as urban areas.
5.2 In nearly three decades, the structure of rural em-ployment has not changed much.1 According to thelatest NSS figures (61st Round), agriculture continuesto employ 70% of our rural workforce, industry(14.4%), and services (14.8%) make up for the rest.However, in view of the decline in agriculture’s con-tribution to GDP and the near constant proportionof workers dependent on it, there is need for rapidgeneration of off-farm employment. The chapter onAgriculture deals with diversification within agricul-ture (to sericulture, horticulture, pisciculture) toexpand the scope of off-farm rural livelihoods. Thereal potential for employment generation, however,rests with the micro and small enterprises (MSEs)sector which comprises weavers, artisans, people
engaged in food processing, hawkers, vendors, andcarpenters.
5.3 In developing countries across Asia, small andmedium enterprises (SMEs)2 (i) make up 80%–90%of all enterprises, (ii) provide over 60% of the privatesector jobs, (iii) generate over 30%–40% of total em-ployment, and (iv) contribute about 50% of sales orvalue added. In India, they constitute3 95% of all en-terprises. Labour productivity4 of small-scale indus-tries (SSIs) in India during 1990–98 at the compoundgrowth rate was 8.5% whereas labour productivity oflarge-scale industries (LSIs) was 7.54%. However, re-cently in a study of 53 countries done by Fortune SmallBusiness Survey, June 2007 on ‘Most and Least FriendlyCountries to Small Businesses’, India ranked 46th, wellbehind the other neighbouring Asian countries suchas Singapore (5th), Hong Kong (6th), Thailand (15th),Malaysia (28th), etc.
5.4 Inadequate working capital, lack of informationto access markets and foreign business opportunities,lack of trained personnel, and obsolete technology are
1 Male and female employment in industry in rural areas has risen from 8% and 6.7%, respectively, in 1977–78 to 15.5% and 10%,respectively, in 2004–05. Most of the employment in manufacturing is in textiles (4 million), wood products (3.7 million), non-metallicproducts (3.4 million), food products (3.1 million), tobacco (3.1 million), and wearing apparel 2.8 million) (NSS 2004–05, Report 515).In services, employment in rural areas has risen from 10.5% of male employment and 5.1% of female employment in 1977–78 to 18%and 6.6% respectively in 2004–05.2 Asian Association of Management Organization Report—SMEs in Asian Region: Harnessing the Growth Potential.3 UNCTAD-2003, OECD-2000, and Country reports.4 Asian Association of Management Organization Report—SMEs in Asian Region.

Ensuring Rural and Urban Livelihoods 105
the major barriers to the growth of MSEs across theworld in general and in India in particular.
5.5 Shortage of working capital is widely recognizedas the biggest hurdle in the growth of unorganized andorganized MSEs. Securing bank credits, difficulties indocumentation for bank loans, and lack of collateralsecurity are bigger problems in India than in majorityof the other developing countries in Asia. It is estimatedthat less than 8% of the total bank credit finds its wayto the MSE sector.
5.6 Unorganized sector enterprises generally sufferfrom weak marketing. They need better market infra-structure, professionally organized exhibition of prod-ucts at the international level, efficient system of supplychain management, brand promotion, and standard-ization. Efforts are needed to establish better linkageswith the industry.
5.7 In post-WTO agenda, domestic markets have beenopened up for imports, creating severe competition forthe local industries. At the same time, this has createdopportunities for the small industries to export prod-ucts to the developed countries. To gain from this op-portunity, however, effort must be made in pushingfor greater market access in the developed countries.
5.8 Technology is one of the most critical elements inthe growth of the MSE sector. India is ranked at thetop5 in terms of availability of Science and Engineer-ing personnel; however, MSEs in India are losing theircompetitive edge in the global markets due to lack of
modern technology. Owing to obsolete technology, thecost of manufacturing is much higher in India com-pared to the other developing countries in Asia.
5.9 Addressing these problems to ensure a vibrant MSEsector is essential for sustained and inclusive growth.
VILLAGE AND COTTAGE INDUSTRIES, HANDLOOMS,HANDICRAFTS, AND FOOD PROCESSING ANDAGRO INDUSTRIES: ENGINES OF SUSTAINEDAND INCLUSIVE GROWTH5.10 The MSE sector provides livelihood, checksrural–urban migration, generates export earnings, andtouches upon the lives of the remotest and mostmarginalized people. The needs, problems, and poten-tial of this sector differ not just with the nature of ac-tivity (weaving, building components for big industries,etc.), but also with size, geographical location, andstructure (organized/unorganized). The importanceof this sector and the vision for it in the EleventhPlan has been outlined in the chapter on Industries.The untapped domestic and international markets fortraditional crafts has been indicated in Box 5.1.
5.11 This sector has been fragmented across variousministries and departments which have often beenpitted against each other: powerloom versus handloom,anti-dumping duty on foreign silk yarn to protectinterest of silk rearers versus removal of duty for hand-looms and powerlooms, interest of petty traders ver-sus greater control for home-based producers—thesehave been recurring debates. There is a need to movefrom competitive to complementary relationships by
Box 5.1Untapped Domestic and International Markets for Traditional Crafts
In the small town of Chamba in Himachal Pradesh, over 500 artisans make sturdy and beautifully designed leather footwear.They sit inside homes or in tiny shops making one pair of chappals in approximately two hours. They earn Rs 30 per pair;each pair retails for anything between Rs 100 and Rs 500. At one time, Chamba made footwear for the entire Punjab. Chambachappals have long been known for their durability and exclusive designs, many of which are now being developed and soldby big footwear manufacturers at exorbitant prices. These chappals have tremendous export potential and can take thedomestic market by storm. Yet, in the absence of proper advertising and market linkages, the Chamba artisans are finding itincreasingly difficult to make ends meet. Similarly, the bamboo products developed in North East India—in Meghalaya,Tripura, Manipur, Mizoram, even Assam, and Siliguri and Jalpaiguri (both in West Bengal)—have tremendous export poten-tial. The range of products vary from picnic baskets to furniture, dinner sets, and even furnishing material.
5 Global Competitive Index—2005; World Economic Forum.

106 Eleventh Five Year Plan
making each sector a resource for the other. Encourag-ing this symbiotic relationship between different seg-ments of the MSE sector will be the key Eleventh Planstrategy.
5.12 The Eleventh Plan will also move away from look-ing at certain sub-sectors of MSE as purely rural orurban sectors. Handlooms and handicrafts are oftenfound in towns and cities (Benaras, Murshidabad,Berhampur, Jodhpur, Delhi, Jaipur, etc); powerloomunits tend to be concentrated in urban areas but arealso found in villages; food processing units and smallindustries involved in manufacturing of components,dyes, etc., are found in both urban and rural settings.Yet often, the traditional sectors are looked upon asrural livelihoods and the modern enterprises as urbanlivelihoods. Thus, urban planning that involves demo-lition of slums and street (flea) markets, widening ofstreets, or construction of apartments and flyovers failsto take into account the impact on the small and tinysectors, robbing vendors, petty traders, weavers, arti-sans, rickshaw pullers, and small entrepreneurs of theirsource of livelihood. Similarly, rural planning oftenfails to meet the needs of the non-traditional smallindustries. In the Eleventh Plan concerted efforts willbe made to ensure that the perceived locational dis-tinctions do not hinder the progress of this sector.
5.13 The Eleventh Plan will use a two-pronged ap-proach, focusing on both the lives and livelihoods ofthe people engaged in the MSE sector. Thus far, wehave mostly concentrated on production. In the Elev-enth Plan, both production and producer will receiveattention as each is dependent on the other. Higherproductivity and earnings cannot be achieved if theweaver, artisan, entrepreneur, or worker is starving,diseased, uneducated, and untrained. Similarly, thequality of life of the producer cannot improve untilhis/her productivity increases.
MSMEs AS INSTRUMENTS OF INCLUSION
NORTH EAST, J&K, AND OTHER DIFFICULT TERRAINS5.14 Be it the desert sands of Rajasthan, the hills ofHimachal Pradesh, North East, and Kashmir, or the
islands of Lakshadweep and Andaman and Nicobar,the MSE sector is often the only source of livelihoodin these ecologically fragile regions. According to astudy sponsored by the North Eastern DevelopmentFinance Corporation Ltd (NEDFI, 2002), the NorthEast accounts for 19.18% of the total number of handi-crafts units in India and 21.71% of the artisans. Theregion also has a huge potential for the developmentof food processing and knowledge-based smallindustries. The situation in J&K, Himachal Pradesh,Rajasthan, and Kutch is similar. These areas are, how-ever, also places6 where infrastructure facilities areminimal, banking facilities are limited, and connec-tivity is poor, making access to markets difficult. Theflow of credit to the NER is hampered due to adversetopography, problem of land collateralization (tradi-tionally, in many parts of NER, land is owned by thecommunity), lack of awareness about schemes, andpoor recovery of loans.
WOMEN5.15 While a gender-disaggregated, comprehensivedatabase on the sector is not available, there is ampleevidence to prove that a majority of women are en-gaged in the MSEs. In sectors such as handloom, over60% of the workforce comprises women. Chemical andplastics, food processing, and village industries alsoemploy a large number of women. The proportion ofwomen entrepreneurs is, however, quite low. As perthe Third All-India Census (2001–02), only 995141(9.46%) MSEs are actually managed by women. Asagainst this, in the US, women own 38% of the smallenterprises,7 which employ more than 50% of theprivate sector workforce. In countries such as Brazil,Ireland, Spain, and the US, women are creating newenterprises at a faster rate than men (OECD, 2001).The absence of property rights and the concomitantdifficulty in accessing credit may be responsible forthe low proportion of women entrepreneurs in India.Most women either do job work, assist their familymembers, or are employed as workers in small-scaleunits. They face widespread discrimination and exploi-tation. Zari workers, agarbatti and bidi rollers, embroi-dery workers make as little as Rs 10 for an eight-hourday. During the Eleventh Plan period, it is essential to
6 Scheme for North East Handlooms and Handicrafts.7 Milken Institute, 2000.

Ensuring Rural and Urban Livelihoods 107
provide a social security cover that is sensitive towomen’s special needs. Equal wages, adequate protec-tion, provision of drinking water, toilets, crèche, andfeeding facilities will be ensured in all small unitsand for every cluster. Women entrepreneurs willbe provided easy access to credit and appropriateadvisory and mentoring services.
MARGINALIZED GROUPS—SC/ST/MINORITIES5.16 The MSE sector, especially traditional enterprises,provides livelihood to many marginalized groups.While the sector in general lacks access to marketingand credit, the problem is even more pronounced forpeople belonging to SC/ST and minorities. The Elev-enth Plan, therefore, will introduce social security,training, and health insurance schemes for these vul-nerable groups. Efforts will also be made to collect dis-aggregated data, set targets for credit availability, andensure access to schemes for the people belonging tothese communities.
DIFFERENT SEGMENTS, DIFFERENTIAL NEEDS
HANDLOOMS5.17 As a metaphor for Indian culture and heritage,handlooms enable 65 lakh persons to earn a livingby skilfully blending myths, faiths, symbols, andimagery. Today, the handloom industry directly andindirectly provides livelihood to 124 lakh people,8 ofwhich 60% are women, 12% SC, and 20% ST (Minis-try of Textiles, 2001). While the exact numbers are notavailable, a chunk of the handloom weavers belong tominorities.
5.18 Indian handloom products range from coarsecloth to very fine fabrics from a variety of fibressuch as cotton, silk, tasar, jute, wool, and syntheticblends. Each region has handcrafted textiles that areunique in design and style. What is woven is, however,inseparable from where and how it is woven, that isfrom the structure of production. There are indepen-dent weavers, weavers organized into co-operatives,and there are those working under master weavers.
Often a combination of production types exists atone time in one area, even within a single household.Yet there is no data reflecting this diverse nature.We do not have updated figures on the number oflooms or people. The last Census was carried out in1995–96.
Current Situation5.19 With the largest number of handlooms in theworld, India produces approximately 6541 millionsq m of handloom cloth annually. While the total pro-duction of cloth has increased by about 30% between1996–97 and 2004–05, the production of handloomsector has declined by about 23%. Between 2000 and2005, the average annual growth rate of handloomproduction has been 6.99%. This has hit the livelihoodsof the handloom weavers. West Bengal, Tamil Nadu,Uttar Pradesh, Andhra Pradesh, Assam, and Manipurare the major handloom States accounting for 75%of handloom weaving in the country. As per theSecond Handloom Census, Assam (10.97 lakh), WestBengal (2.22 lakh), and Manipur (2.15 lakh) togetheraccounted for 64% of the handloom units. Almostall handloom production in India is for domesticmarkets. According to the Directorate General ofHandlooms, though handlooms account for 10% ofour textile exports, only 1.3% of working looms pro-duce fabric9 for export markets. Europe is the largestdestination, accounting for nearly half of the totalexports in 1999–2000.
5.20 In the terminal year of the Tenth Plan, handloomcloth production was 6541 million sq m with exportsat Rs 4605 crore. The Tenth Plan performance isindicated in Table 5.1.
5.21 With the phasing out of quota and the openingup of markets, ‘Handloom’ cloth and designs are be-ing produced cheaply by mills and powerlooms bothin India and in China. As the market is shrinking, weav-ers are becoming manual labourers or in extreme casescommitting suicide. This has led many to label thisindustry as a sunset sector. This, however, is far from
8 India’s Handloom Sector—K. Rajendran Nair (Former Development Commissioner for Handlooms).9 Handloom Mark Scheme—A Report on Diagnostic Survey and Business Plan for Handloom Sector in Bihar, submitted to Departmentof Industries, Government of Bihar by IL&FS.

108 Eleventh Five Year Plan
the truth. Health- and environment-friendly hand-woven fabrics have a huge international demand andhave the potential to generate domestic demand as well.
In the post-Multi-Fibre Agreement era, weavers cancapture new markets. Box 5.2 highlights the potentialfor this sector.
TABLE 5.1Performance of Handloom Sector during the Tenth Plan Period
Item 2002–03 2003–04 2004–05 2005–06 2006–07
Cloth production (million sq m) 5980 5493 5722 6108 6541Employment(lakh persons) 65 65 65 65 65Export (Rs crore) na na na na 4605
Source: Office of Development Commissioner (Handlooms), Ministry of Textiles.
Box 5.2Hope Looms
Though handloom is regarded by many as a sunset industry, there are enough success stories across the country—SelfEmployed Women’s Association (SEWA) in Lucknow, Kutch Mahila Samiti in Gujarat, and Dastkar in Andhra which exposethis myth and show the way forward for this sector. Maheshwar, a small town of Madhya Pradesh has been weaving for thelast 250 years, ever since Rani Ahilyabai Holkar brought the profession to this town and etched a beautiful design palette instones along the banks of the Narmada. Three decades ago the market for Maheshwari sarees started shrinking and therewere less than 25 looms left in the town. Once again the Holkars intervened—this time in the form of REHWA society.Rehwa is another name for the Narmada. Through this society they carried out design interventions, moved from the ‘nauwari’to ‘chhewari’ sarees, and organized exhibitions. They provided weavers with work, looms, health facilities, crèches and schoolsfor their children, and even homes. Today, there are about 2500 looms creating poetry with silk and cotton yarn in Maheshwarand they have the potential to install more. The wages have gone up from Rs 9 per saree to Rs 150 per saree. Phalodi, indistrict Jaisalmer of Rajasthan, traditionally produced Pattu—two pieces of cloth woven in local wool, stitched togetherlaterally, and enhanced by an extra weft ornamentation known as Kashida. Pattu weavers were disorganized and were depen-dent for sale on the intermediaries and fairs/exhibitions. In 1991, with the help of Urmul Trust, they organized themselvesinto a registered NGO, the Urmul Marusthali Bunkar Vikas Samiti (UMBVS). Today more than half of the weavers in Phalodiare its members. At the time of registration, a compulsory three-month training is imparted. For every group of 8–15 weav-ers, a commission-based Vyavasthapak (manager) delivers raw materials and designs; monitors quality during weaving; weighs,checks, and delivers products; and makes payments. UMBVS provides raw materials and markets products through fairs andexhibitions, websites, and its own showroom. It has managed to get financial support from banks and new designs fromNIFT, NID, etc. Pochampally, a small town in Nalgonda district of Andhra Pradesh, is known for its unique Ikat design.About 50% of the population here depends on handlooms. In December 2003, Pochampally became the first traditionalIndian craft to get a Geographical Indication (GI) registered. Less than two years later, the proprietors of the GI found that aretailer in Hyderabad was selling sarees produced by a Mumbai-based manufacturer under the false GI of ‘Pochampally’.They immediately filed a case. Both the retailer and the manufacturer accepted the case of infringement and agreed to an outof court settlement. They also gave an undertaking not to sell any products in the name of Pochampally. 13 SHGs of weaversfrom Chanderi, Madhya Pradesh, have come together to form Chanderi Bunkar Vikas Samiti (CBVS). Quality control isemphasized and a mechanism has been devised to reject products that do not conform to specifications. The groups affiliatedto the Samiti are heavily represented by women. The unique selling point (USP) of CBVS is its market linkage to Fab India.The weavers have regular work and they can sell their products to the Samiti and get timely payments. The Samiti has triedto become self-reliant by developing a common facility centre (CFC) for dyeing and a raw-material depot. This raw-materialdepot takes advantage of the Mill Gate Price Scheme and sells yarn with a 3% mark-up on the procurement price to Samitimembers and with a 5% mark-up to non-members. For almost 80 years now, Nalli has monopolized the silk industry inIndia. From one loom in Kancheepuram and one shop in Chennai’s T-Nagar set up in 1928, the Nallis today have 50 loomsunder their direct control and another 10000 looms working for them in Kancheepuram, Salem, and Kumbakonam. Theyhave 14 shops including one each in Singapore, San Jose (California), and Toronto (Canada). Nalli manages over 5000dedicated suppliers and has an annual turnover of Rs 325 crore. It has a range of products from Rs 80 to Rs 50000.

Ensuring Rural and Urban Livelihoods 109
Challenges For the Eleventh Plan5.22 Many challenges for the handloom sector havealready been discussed in the chapter on Industry(see paragraphs 7.1.356 to 370, Chapter 7.1, VolumeIII). This section looks at some specific issues whichwill be tackled during the Eleventh Plan to ensure thevibrancy of this sector.
AVAILABILITY OF WORKING CAPITAL5.23 Though NABARD provides refinance facilitiesto the State co-operative banks and RRBs for financ-ing requirements of primary and apex weavers’ co-operative societies, the service charges levied by theseinstitutions result in the doubling of interest ratesfor the artisans and societies. Further, most Statehandloom co-operative societies lift stock and reim-burse weavers only on sale of products. This blocksthe working capital for the weavers.
AVAILABILITY OF QUALITY RAW MATERIALS:10
5.24 Despite the setting up of co-operative spinningmills and the hank yarn obligation, yarn shortagesand steep prices are continuing problems. As early asin 1995, the gap between the supply and the demandfor hank yarn used by the handloom sector was 150million kg. The use of hank yarn by mills and power-looms also diverts yarn meant for handlooms. Theschemes ensuring availability of hank yarn at reason-able prices, usually only benefit the big weavers or theco-operative sector which covers 20.3% weavers.
TRAINING AND TECHNOLOGY5.25 The Janata Cloth Scheme de-skilled weavers andwe now have two categories of weavers—skilled andsemi-skilled. The products manufactured by the latterare easily produced by mills and powerlooms at muchcheaper rates. Their market is shrinking and there islittle hope for its revival. Reskilling of semi-skilledweavers in handlooms or in any other field andskill upgradation for the skilled weavers are necessary.Currently, weaving has become a profession for theuneducated. People need to take up this profession outof choice, not necessity. Encouraging educated indi-viduals to provide design inputs, marketing, etc., tothis sector is a challenge.
MARKETING AND PUBLICITY5.26 Primary producers have no direct access to ei-ther markets or market information. As a result, thereis a mismatch between production and market de-mand. Markets today are created and captured throughaggressive publicity campaigns using icons. The chal-lenge in the Eleventh Plan is to create a demand forhandloom products by flaunting their unique sellingpoint (USP). Unfortunately, marketing efforts thus farhave been limited to organizing buyer–seller meets andholding a few exhibitions where space is often providedto master weavers and gaddidars, not poor weavers.The challenge is to encourage market research andproduct diversification. The latter does not imply arejection of the traditional designs. It means develop-ment of new products using the traditional designsadapted to modern tastes.
INFRASTRUCTURE DEVELOPMENT5.27 Few clusters have organized dyeing centreswith modern facilities such as water softening plantsor dyeing chambers. Dyeing is unorganized andmarked with low end applications. All this has a sig-nificant bearing on the quality of final products andthe resultant poor earnings of weavers. It also harmsthe environment. Electricity, space to keep the looms,yarn banks, dyeing units, roads connecting weaversto markets, water supply, processing and packagingfacilities are needed.
ENCOURAGING ORGANIZATION OF WEAVERS5.28 Organizing weavers into SHGs or cluster com-mittees to increase their bargaining power, enable themto access credit, design and common facilities centres,and undertake collective marketing is an importantchallenge.
SOCIAL SECURITY5.29 Provision of a social security net that includeseducation, skill training, access to health facilities, andinsurance is essential. Occupational health centresare needed to treat tuberculosis (TB) and silicosis.Moreover, in places like Varanasi, weavers have in-curred huge electricity arrears; paying them off freesthe weavers from the cycle of debt.
10 The Hindu, 2005.

110 Eleventh Five Year Plan
BETTER GOVERNANCE5.30 Major institutions for providing inputs are cen-tralized and hence are unable to reach the dispersedand largely home-based industry. Schemes run by thevarious Central and State bodies currently operate assilos with little convergence.
OTHER MEASURES5.31 There are various other challenges during theEleventh Plan: branding of handloom products, map-ping of handloom clusters, development of designbanks, and handloom research centres. The priorityareas for research in the industry are energy conserva-tion measures, improvement in the quality to boostexports, and providing cheaper and more durable fab-rics for internal consumption.
The Way Forward5.32 Government interventions for revival of hand-looms during the Eleventh Plan will focus on two kindsof interventions: policy and programmatic. Policy in-terventions will include taking decisions on issues suchas removal of anti-dumping duty on Chinese silk, speci-fying the policy on export of cotton yarn, availabilityof yarn, marketing as a value-added niche product, andpreferential procurement by the government institu-tions. These will be backed by suitable programmaticinterventions. For this, many of the existing Tenth Planschemes such as workshed scheme, health insurancescheme, and Deen Dayal Hathkargha Protsahan Yojana(DDHPY) have been suitably restructured. To stream-line the operations, various handloom schemes havebeen clubbed together under four major schemes—Integrated Handloom Cluster Development Scheme,Weavers Welfare Scheme, Marketing and Export Pro-motion, and Diversified Handloom DevelopmentScheme. In the Eleventh Plan, schemes for the well beingof weavers will include (i) Health Insurance Scheme,(ii) Mahatma Gandhi Bunkar Bima Yojana, (iii) ThriftFund Scheme, (iv) Pension Scheme, and (v) DistressRelief Fund. The insurance schemes not only offer so-cial security but also have a component for educationof weavers’ children. Under the new pension scheme,weavers aged 60 years or above will be provided Rs 200every month. The Distress Relief Fund will provideimmediate relief to weavers in distress situations andthose affected by natural calamities, riots, floods, etc.
5.33 The Integrated Handloom Development Schemeis based on a cluster approach where basic inputsand worksheds are provided, training is imparted,and formation of SHGs is encouraged. In fact, acluster-based approach would be a major thrust ofEleventh Plan in the case of all the sectors coveredand discussed in this chapter. Annexure 5.1 providesa detailed note. Under this scheme, the committeesof weavers, supported by an external cluster develop-ment agency, will be empowered to decide whichinterventions need to be carried out. Branding ofcluster products, GI registration, and constructionof CFC will be carried out. This will not only givegreater power to weavers, but will also help in market-ing products, quality control, and processing of big-ger orders. Under DDHPY, financial assistance fordesign development, product diversification, public-ity, CFCs, market survey, and market incentives willbe encouraged. The workshed cum housing schemewill be extended to weavers outside the co-operativefold as well.
5.34 The Marketing Promotion Programme (MPP)will be restructured to focus on brand equity, provid-ing market consultants, doubling market events—expos, melas, etc.—and building promotional websites.Urban Haats and market complexes will be set up atimportant places of tourism and business. Space onrent will be taken up at upcoming malls, marketingcomplexes, large retailing stores, etc. Private businesshouses will be requested to earmark outlets forhandlooms. Fabric tourism, on the lines of vineyardtourism in France and glass tourism in Italy (Muranoglass factories), will be promoted. Special exposwill be organized to encourage big retail chainsand hotels to use handloom furnishings. Exclusivefashion shows with the participation of NationalInstitute of Fashion Technology (NIFT) and SHGs/co-operatives will be organized to reach the youthin schools and in college festivals. A huge publicitycampaign backed by icons will be initiated. At thesame time, measures will be taken for protection oftraditional designs and patterns under the GI Act.Handloom Mark will be used to popularize hand-woven products and guarantee to the buyer thatthe product being purchased is genuinely hand-woven. To attract entrepreneurs and investors into the

Ensuring Rural and Urban Livelihoods 111
Handloom Export Sector, Handloom Export Schemewill be subsumed under MPP. It is expected that ex-ports will grow at 15% per annum and reach Rs 10000crore by the end of the Eleventh Plan.
5.35 Under the Diversified Design DevelopmentScheme, 20 design studios will be set up in handloomclusters for creating designs based on the clientneeds. The design studios may be a joint collaborationbetween the GoI and the industry/Handloom ExportPromotion Council (75:25 ratio). A heritage libraryhousing all the traditional designs will also be created.Inputs such as hank yarn will be provided at millgate price.
5.36 A committee with Managing Director, NABARDas Convenor has suggested (i) cleansing of balancesheets of apex societies and primary societies, (ii) waiverof overdue loans and interest of primary weaversco-operative societies and apex societies, (iii) interestsubvention—working capital, and (iv) contribution toHandloom Development and Equity Fund and CreditGuarantee Fund Scheme for handloom weavers. On thebasis of this report and the Vaidyanathan Committeereport, a Rs 1200 crore package for handlooms hasbeen formulated.
5.37 For schemes to be effective, strengthening ofthe delivery mechanism with the help of an NGO/voluntary sector is essential. All the schemes will bewidely publicized in local and regional languages.A convergence between various schemes for health,nutrition, education, etc., will be ensured. A necessarystep in this direction would be a mapping of weaversand artisans. The preservation of the rich handloomheritage can be achieved only through the socio-economic upliftment of the individuals who createthe heritage.
HANDICRAFTS5.38 Like handlooms, this sector also touches uponthe lives of the most marginalized and has the poten-tial to transform the economy of difficult areassuch as the North East, border States, J&K, deserthabitations, etc. It produces a range of items from util-ity goods to clothing and variety of lifestyle items.
Current Situation5.39 The performance of handicrafts sub-sector dur-ing the Tenth Plan period is given in Table 5.2.
5.40 The current global handicraft market is valuedat more than US$ 400 billion. China accounts for 30%of this and India’s share is less than 2%. Over the last10 years, the average annual rate of growth of ourhandicraft exports market has been 15%. During thenext five years, it is projected to increase by 42% andgenerate an impressive US$ 9100 million. The US isthe preferred destination for Indian handicrafts,accounting for 29.59% of our total exports. Europeaccounted for 33.86% in 2004–05.11
5.41 Despite this, while some crafts such as woodwork,metal work, and carpets are flourishing, others arefloundering. Even for the handicrafts that are doingwell, increase in exports and demand has not led to aconcomitant rise in the income. In places such asRajsamund (silver minakari), Bhopal (zari work),Bhadohi (carpets), and Indore (sequins and embroi-dery), wages have not changed in the last two decades.In zari, gems, and jewellery units, often women andchildren are employed due to their deft fingers. Theconditions of work are oppressive and workers earnwages as little as Rs 10–15 per day. The profit is takenover by the middlemen and the export houses. As inthe case of handlooms, there is no database or map-ping of crafts across the country.
TABLE 5.2Performance of Handicraft Sector during the Tenth Plan Period
Item 2002–03 2003–04 2004–05 2005–06 2006–07 CAGR (%)
Production (Rs crore) 19565 24019 28936 29804 38660 14.5Employment (lakh persons) 60.16 61.96 63.81 65.72 67.69 2.3Export (Rs crore) 10934 12768 15616 17277 20963 14.0
Source: Office of Development Commissioner (Handicrafts), Ministry of Textiles.
11 Confederation of Indian Industries (CII).

112 Eleventh Five Year Plan
Challenges5.42 The distinction between handlooms and handi-crafts is often artificial and difficult to understand. Forinstance carpets, though hand-woven, are counted ashandicrafts. This distinction limits the workers’ accessto schemes and in many cases results in a duplicationof efforts. Resolving this will be a principal challengefor the Eleventh Plan. Apart from usual challengesmentioned in paragraphs 5.22 to 5.31, the specificchallenges faced by the handicrafts sector are:
TECHNOLOGY UPGRADATION• Use of old and obsolete technology increases drudg-
ery, impacts on the health of the worker, reducesproductivity, and in many cases even affects quality.
IMPACT ON ENVIRONMENT AND HEALTH• Activities such as printing, metal works, use of dyes,
and woodwork seriously impact the environmentand the health of the workers. As most units arehome-based or small-scale units, they do not haveadequate safety arrangements or sewage treatmentfacilities. Thus, they get caught in non-tariff barri-ers. The challenge is to ensure occupational healthfor artisans and to develop simple, cheap technol-ogy for treatment of waste and pollution control.
SAFEGUARDING THE INTERESTS OF ARTISANS• An ongoing debate in the handicrafts sector (par-
ticularly in areas such as carpet weaving) is aboutgreater flexibility in labour laws to permit export
houses to expand. The challenge in the EleventhPlan is to balance productivity gains with the inter-ests of the actual producers, the artisans. A recur-ring suggestion has been to allow firms someflexibility if the State Governments are willing toprovide social security.
QUALITY CONTROL AND STANDARDIZATION• Lack of standardization procedures and inadequate
facilities for testing and certification of raw materi-als and products impacts the export potential.
The Way Forward5.43 During the Eleventh Plan, it is proposed to morethan double the production of handicrafts (fromRs 43600 crore in 2007–08 to Rs 90412 crore in 2011–12), double the exports (from Rs 23400 crore in 2007–08 to Rs 48522 crore in 2011–12), and create almost 11lakh additional jobs. Special targets which include ex-port turnover of Rs 500 crore and credit flow of Rs 150crore have been set for the NER. For this, infrastruc-ture is vital. In order to augment the governmentresources, schemes will be adopted in the PPP mode.The government will partner with good NGOs toensure an effective implementation of the schemes andpolicies and to compile an accurate database of theartisans. In the Eleventh Plan, the existing Tenth Planschemes have been modified and clubbed into sevenschemes to improve the delivery of services and ensureeffective and focused implementation. Eleventh PlanSchemes for handicrafts are indicated in Box 5.3.
Box 5.3Eleventh Plan Schemes—Handicrafts
• Baba Saheb Ambedkar Hastshilp Yojana: Revised to a demand driven, needs-based scheme for integrated development ofhandicraft clusters. Setting up of CFCs and e-Kiosks, publicity, toolkits distribution will be included. Target: 375 newclusters in 322 districts covering four lakh artisans.
• Design and Technology Upgradation: Thrust on skill upgradation, new designs, technologies, innovative products,revival of languishing crafts, setting up of Design Bank. Target: 1000 Design Workshops and 400 Integrated Design Projectsto benefit 38600 artisans.
• Marketing Support, Services, and Export Promotion: This scheme will continue. Target: 1.2 lakh artisans.• R&D Scheme: The scheme includes conducting research studies, all-India census for handicrafts, setting up of six labs,
technology development, transfer/adoption of technology.• Handicraft Artisans Comprehensive Welfare Scheme: The scheme includes Bima Yojana and Rajiv Gandhi Shilpi Swasthya
Bima Yojana. Target: Two lakh artisans per year for each scheme.• Human Resource Development: Special Handicraft Training Programme (SHTP) implemented during Tenth Plan has
been modified. Target: Capacity building of two lakh artisans and stakeholders.• Infrastructure Projects for development of specific need-based infrastructure, building, haats, expo marts, etc.
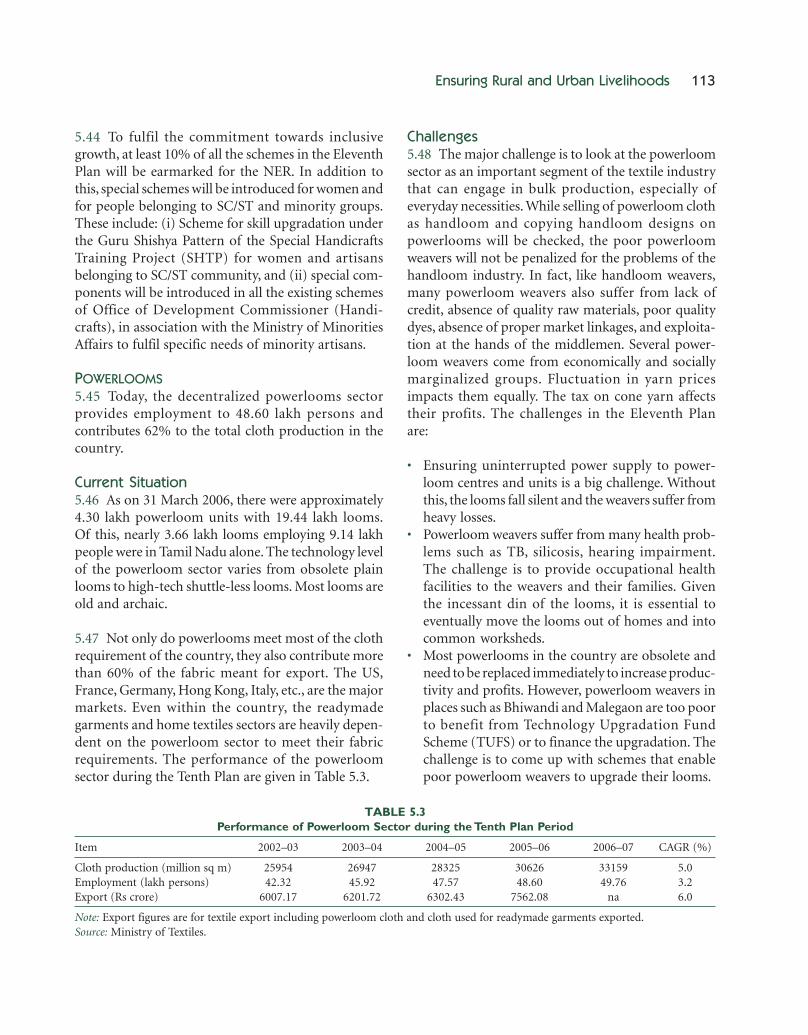
Ensuring Rural and Urban Livelihoods 113
5.44 To fulfil the commitment towards inclusivegrowth, at least 10% of all the schemes in the EleventhPlan will be earmarked for the NER. In addition tothis, special schemes will be introduced for women andfor people belonging to SC/ST and minority groups.These include: (i) Scheme for skill upgradation underthe Guru Shishya Pattern of the Special HandicraftsTraining Project (SHTP) for women and artisansbelonging to SC/ST community, and (ii) special com-ponents will be introduced in all the existing schemesof Office of Development Commissioner (Handi-crafts), in association with the Ministry of MinoritiesAffairs to fulfil specific needs of minority artisans.
POWERLOOMS5.45 Today, the decentralized powerlooms sectorprovides employment to 48.60 lakh persons andcontributes 62% to the total cloth production in thecountry.
Current Situation5.46 As on 31 March 2006, there were approximately4.30 lakh powerloom units with 19.44 lakh looms.Of this, nearly 3.66 lakh looms employing 9.14 lakhpeople were in Tamil Nadu alone. The technology levelof the powerloom sector varies from obsolete plainlooms to high-tech shuttle-less looms. Most looms areold and archaic.
5.47 Not only do powerlooms meet most of the clothrequirement of the country, they also contribute morethan 60% of the fabric meant for export. The US,France, Germany, Hong Kong, Italy, etc., are the majormarkets. Even within the country, the readymadegarments and home textiles sectors are heavily depen-dent on the powerloom sector to meet their fabricrequirements. The performance of the powerloomsector during the Tenth Plan are given in Table 5.3.
Challenges5.48 The major challenge is to look at the powerloomsector as an important segment of the textile industrythat can engage in bulk production, especially ofeveryday necessities. While selling of powerloom clothas handloom and copying handloom designs onpowerlooms will be checked, the poor powerloomweavers will not be penalized for the problems of thehandloom industry. In fact, like handloom weavers,many powerloom weavers also suffer from lack ofcredit, absence of quality raw materials, poor qualitydyes, absence of proper market linkages, and exploita-tion at the hands of the middlemen. Several power-loom weavers come from economically and sociallymarginalized groups. Fluctuation in yarn pricesimpacts them equally. The tax on cone yarn affectstheir profits. The challenges in the Eleventh Planare:
• Ensuring uninterrupted power supply to power-loom centres and units is a big challenge. Withoutthis, the looms fall silent and the weavers suffer fromheavy losses.
• Powerloom weavers suffer from many health prob-lems such as TB, silicosis, hearing impairment.The challenge is to provide occupational healthfacilities to the weavers and their families. Giventhe incessant din of the looms, it is essential toeventually move the looms out of homes and intocommon worksheds.
• Most powerlooms in the country are obsolete andneed to be replaced immediately to increase produc-tivity and profits. However, powerloom weavers inplaces such as Bhiwandi and Malegaon are too poorto benefit from Technology Upgradation FundScheme (TUFS) or to finance the upgradation. Thechallenge is to come up with schemes that enablepoor powerloom weavers to upgrade their looms.
TABLE 5.3Performance of Powerloom Sector during the Tenth Plan Period
Item 2002–03 2003–04 2004–05 2005–06 2006–07 CAGR (%)
Cloth production (million sq m) 25954 26947 28325 30626 33159 5.0Employment (lakh persons) 42.32 45.92 47.57 48.60 49.76 3.2Export (Rs crore) 6007.17 6201.72 6302.43 7562.08 na 6.0
Note: Export figures are for textile export including powerloom cloth and cloth used for readymade garments exported.Source: Ministry of Textiles.

114 Eleventh Five Year Plan
The Way Forward5.49 It is proposed to increase production of power-loom cloth from 38138 million sq m in 2007–08 to58437 million sq m and to raise exports to US$ 56.05billion by the terminal year of the Eleventh Plan.
5.50 Like in the case of handlooms and handicrafts,two kinds of measures are essential for the powerloomsector. Policy interventions need to deal with issues suchas yarn availability and pricing and to resolve the per-ceived ‘conflict’ between handlooms and powerlooms.Programmatic interventions will focus on research andtechnology upgradation, promotion of value-addedtextiles, strengthening of existing infrastructure facili-ties, creation of design banks and Computer AidedDesign (CAD) centres, and easy access to credit andmodernized workshed scheme. Here again, the clusterapproach will be adopted and common facilities suchas yarn depots, dyeing houses, quality testing labs,etc., will be provided. Weavers will be organized intoSHGs and will be encouraged to move their looms intocommon worksheds. Clusters will be supported insetting up mini-power generation plants to ensureuninterrupted power supply. During the Eleventh Plan,cluster development activities will be undertaken in 50powerloom clusters. Product innovation and diversi-fication will be encouraged and weavers will be includedin cluster development committees.
5.51 The TUFS will be modified and continued in theEleventh Plan. Currently, powerloom units in placessuch as Sholapur, Surat, and Ichalkaranji are ableto draw benefits from TUFS; however, small andweak units in backward clusters such as Malegaon,Burhanpur, and Mau are unable to do so due to theirinability to provide collateral guarantees. For them,the National Climatic Data Centre co-operative fund-ing route may be more useful. During the EleventhPlan period, TUFS will be modified to enable the weakand small powerloom units to take the advantage ofthis scheme.
5.52 Besides this, a survey of the powerloom sectorwill be carried out to find out the profile of thepeople engaged in the sector, as well as the numberand the type of looms. New CAD centres will beset up and existing powerloom service centres (PSCs)
will be upgraded. Health insurance schemes that havebeen announced for BPL workers would be made avail-able to the powerloom workers and their families.
5.53 Presently, there is only one State in the NERwhere powerlooms exist. In Guwahati (Assam), thereare about 2700 conventional looms providing employ-ment to approximately 7000 workers. Most of thelooms are engaged in job work, producing acrylicshawls. The feasibility of setting up a new CAD centrein the Guwahati PSC will be examined.
SILK AND SERICULTURE5.54 India is the only country producing all the fourknown commercial silks, namely, mulberry, tasar, eri,and muga. It is the second largest producer of raw silkin the world. At present, over 60 lakh families—mostlyin the States of Karnataka, Andhra Pradesh, Tamil Nadu,West Bengal, Jammu and Kashmir, and Assam—areinvolved in this labour-intensive agro-based industryin activities such as food plant cultivation, silkwormrearing, silk reeling, twisting, de-gumming, weaving,dyeing, printing and finishing, and garment manufact-uring. Sericulture is at various stages of developmentin Uttarakhand, Uttar Pradesh, Madhya Pradesh,Chhattisgarh, Orissa, Bihar, and the North East.
5.55 Sericulture in India is a sustainable farm-basedeconomic enterprise that generates a steady stream ofincome (on average, a net income of up to Rs 45000annually in about four to five splits, from one acreof irrigated mulberry). A large number of people insericulture, especially in production of tasar, belongto tribal groups. It is estimated that every hectare ofmulberry provides employment to about 16 persons.Besides the weaving industry, sericulture is beneficialto farmers as well. Today, of the 60 lakh people depen-dent on this industry, 47 lakh are agriculturists.
Current Situation5.56 China, producing 102560 metric tonnes(81.65%) of raw silk is the largest exporter, whereasIndia, contributing about 13% of the world’s raw silkproduction, is the largest consumer. According to theMysore-based Central Sericulture Research and Train-ing Institute, against an annual requirement of about25000 metric tonnes of silk, India produces only about

Ensuring Rural and Urban Livelihoods 115
15000 metric tonnes. The rest of the demand is metthrough imports. In 2006–07, around 9258 tonnes ofsilk, worth over Rs 600 crore, was imported fromChina. As a result, cocoon prices crashed and nearly49000 ha of mulberry crop was uprooted in Karnatakacausing a loss of 3000 tonnes to the country’s overallsilk production.12 Thus, while productivity of silk hasgone up from 16 kg to 85 kg raw silk per ha per yearfrom the Ninth to the Tenth Plan, raw silk productionhas remained almost static. Against the total produc-tion target of 26450 metric tonnes of raw silk per year,achievement was just 15445 metric tonnes by 2005–06 and 16805 metric tonnes by the end of the TenthPlan period (Table 5.4). This was due to shortfallin mulberry bivoltine raw silk production despite theaddition of 17 new components targeting bivoltineproduction in the Catalytic Development Scheme. Thephysical achievements during the Tenth Plan are givenin Table 5.4.
5.57 Indian silk exports are primarily in the form offinished goods and not silk yarn. Thus Indian exportsare largely dependent on the import of quality silk fromChina. US, United Kingdom (UK), Italy, Germany, andHong Kong together account for over 55% of India’stotal export earnings from silk. Estimates say thatIndia requires 120000 metric tonnes of silk to meetthe demand in world market. With better infrastruc-ture facilities, the sericulture industry can improve itsproductivity to 15% as against the current 9%.
Challenges5.58 The Indian sericulture industry, which provideslivelihoods to not just farmers and reelers but alsodyers and silk weavers, is currently grappling withmany problems similar to those faced by other sec-tors. However, it faces some specific challenges such as
IMPROVING QUALITY OF SILK• Indian silk yarn is of poor quality, especially in com-
parison to that of China. This not only affects ourcompetitiveness in the world market, it also resultsin a preference for imported yarn in the domesticsector. Though Indian breeds have the potential toproduce the same quality of bivoltine silk as China,there has been lack of sufficient thrust on the adop-tion of improved technologies, strict disease con-trol measures, lack of quality leaf due to insufficientinputs to mulberry garden, use of young age silk-worms, appropriate mountages, lack of grading sys-tem for cocoons, and quality-based pricing system.
ARRESTING FALL IN PRODUCTION• The challenge is to initiate area-specific research to
improve fertility of the soils, which will ultimatelyenhance soil productivity, mulberry and non-mulberry host plant leaf and silkworm cocoonproduction, and arrest decline in area under silkfood plants.
MULTIVOLTINE VERSUS BIVOLTINE• Bivoltine yarn is sturdier and is used by the
powerloom industry. Yet only 5% of the silk pro-duced in India is bivoltine because its productionrequires much more attention and resources. Italso yields just two crops in a year, as against theyield of four to six crops by multi-voltine. Since thedifference in the selling price of bivoltine andmultivoltine silk is not much, farmers do not haveany incentive to switch to bivoltine silk yarn pro-duction. Insufficient adoption and proliferation oftechnology packages developed through R&D ef-forts; no effort to increase the area under mulberry;fragmented and ad hoc approach; non-involvementof private partners in a big way in seed production;
12 Indian Silk Industry—Gaurav Doshi.
TABLE 5.4Performance of Sericulture Sector during the Tenth Plan
Item 2002–03 2003–04 2004–05 2005–06 2006–07
Raw silk production (metric tonnes) 14617 13970 14620 15445 16805Employment (lakh persons) 56.00 56.50 58.00 59.50 60.03Export (Rs crore) 2294.05 2779.19 2879.56 3194.20 3200.00
Source: Central Silk Board (CSB), Ministry of Textiles.

116 Eleventh Five Year Plan
farming and reeling; non-penetration of theschemes; improper forward and backward linkages;and dumping of cheap Chinese raw silk and fabricare the other factors. The challenge in the EleventhPlan period is to encourage farmers to move fromproduction of multivoltine silk to bivoltine silkthrough proper incentives. Yet, care should be takento ensure that adequate amount of multivoltine isavailable for the handloom sector to continue pro-duction.
ANTI-DUMPING DUTY ON SILK• There has been a decline in the cultivated area and
the raw silk production during 2002–04 due todrought and dumping of Chinese silk at cheapprices. The sericulturists want imports of raw silkto be restricted and the anti-dumping duty on yarnto remain in place. Exporters and weavers, on theother hand, want the anti- dumping duty to be with-drawn so that they get an assured supply of yarn andare able to export more silk products at competitiverates. The challenge is to balance the aspirations offarmers and weavers.
NON-MULBERRY SILK PRODUCTION• Non-mulberry silk production in the country con-
tinues to be unsteady and fluctuates from year toyear. With its uniqueness, non-mulberry silk pro-duction in India has a great potential for value-added exports.
NEED FOR QUALITY-BASED PRICING• Reeling sector is an input-dependent activity and its
operations are influenced heavily by three factors—cocoon quality, cocoon price, and cocoon supply.However, due to the absence of quality-based pricefixation, there has been very little quality control.
The Way Forward5.59 The CSB has set a target of 26000 tonnes of rawsilk production by the year 2011–12 and it has alsoproposed to:
• Enlarge area under mulberry silkworm food plantsto 2.5 lakh ha by adding 0.50 lakh ha. This will pro-duce an additional 6400 metric tonnes of mulberryraw silk.
• Raise national mulberry silk productivity from 85kg per ha to 100 kg per ha per year.
• To increase production of non-mulberry silks from125 gm per person per day to 150 gm per personper day.
• Increase employment to 77.04 lakh and exports toRs 4500 crores.
5.60 To achieve these targets, association of privatesector and especially the major agro-based industriesin both pre-cocoon and post-cocoon segments, willbe encouraged. Medium and small corporate sectorswill be supported for the production of cocoons bycontract farming through a participatory (not subsidyoriented) approach. R&D in the areas of reeling, twist-ing, spinning, and blending for all varieties of silk willbe carried out and exotic fabrics, which may be usedfor furnishing, carpets, and other dress material, willbe created.
5.61 The reeling sector has seen poor growth duringthe Tenth Plan. There are around 182000 handloomsand 30000 powerlooms with an average age of 15–20years. About 20% improvement in productivity inaddition to yarn quality can be achieved by upgradingthe old machines. Additional production of raw silkto the tune of 7000 metric tonne will feed 80000handlooms and 20000 powerlooms/shuttle looms.Therefore there is a need to upgrade the handlooms,powerlooms, and wet processing sectors to supportnon-mulberry reeling/spinning activity to improve theproductivity and reduce drudgery.
5.62 Recently, an amendment to the CSB Act by theParliament was made providing a regulatory mecha-nism for production and sale of silkworm seed. Itensures: (i) production and sale of seed of authorizedraces only, (ii) control on unauthorized productionand trade, (iii) control and prevention of entry ofuntried and untested hybrids from other countrieslikely to be carrying diseases and other unknownrisks.
5.63 During the Eleventh Plan period, CSB will imple-ment all schemes of pre- and post-cocoon sectorsin the form of clusters. Village Panchayats, reputedvoluntary service organizations, rural development
Ensuring Rural and Urban Livelihoods 117
agencies, and financing institutions will be involvedin planning from the project formulation stage on-wards to facilitate integration of producer groupsinto the production chain and develop a marketableproduct within the geographical niche. Large-scalebivoltine seed production; supply of chawki wormsto all bivoltine farmers; setting up of infrastructuresuch as rearing house, grainages, and chawki rearingcentres (CRCs), and improved rearing appliances willbe adopted under the existing Catalytic DevelopmentProgramme schemes. Extensive training and demon-strations with the active participation of SHGs andexpert farmers will be undertaken; linkages betweenthe grainages and CRCs, the farmers, and the reelerswill be established. Important policy interventions pro-viding incentives to farmers who undertake bivoltineproduction will be carried out, but without hurtingthe handloom sector. The import policy for raw silkwill be reviewed periodically, balancing interests of thesericulturists as well as export manufacturers andweavers.
5.64 To meet international standards in quality, largeinvestments in seed production, farming, reeling, andprocessing are needed. The Eleventh Plan proposes tolink large number of small farmers to few large entre-preneurs capable of making huge investments as in thecase of castor cultivation, sugarcane cultivation, etc.The Plan also proposes to launch a new scheme forestablishment of large bivoltine grainages and to openit to State departments.
5.65 During the Eleventh Plan, efforts will be madeto enable networking of various cocoon and silk mar-kets to facilitate availability of real time informationon the availability of raw materials and market trendson the Internet. Existing National Informatics Centre(NIC) infrastructure will be utilized and an NIC Cellwill be started in CSB on the pattern of other govern-ment institutions. Pest and disease forecasting andforewarning system for mulberry and silkwormswill be introduced to provide sericulture farmersand the State departments enough time to organizeeffective management of pests and diseases andminimize the crop losses. This programme will belinked to NRSA, Hyderabad and Indian Meteorologi-cal Departments in various States.
5.66 The existing Tenth Plan schemes that are doingwell such as the Silk Mark will be continued in theEleventh Plan.
5.67 The Eleventh Plan interventions will promoteinclusive growth for regions and social groups. At least30% of beneficiaries in all schemes will be women. Awomen’s credit fund will be set up, women-friendlytechnologies will be developed, and appropriate train-ing will be provided. For other marginalized groupssuch as SC/ST and minorities, concessions like reduc-ing beneficiary share by 10% of the envisaged contri-bution will be provided. Special programmes willbe taken up in areas dominated by the marginalizedgroups.
UNORGANIZED WOOL SECTOR5.68 The wool sector plays an important role in link-ing the rural economy and shepherds with the small,medium, and large-scale manufacturing units. Thissector also has a diverse product portfolio: from tex-tile intermediates to finished textiles, garments,knitwear, blankets, carpets, and a nominal presence intechnical textiles. India is the seventh largest producerof raw wool accounting for 1.8% of the world pro-duction. In 2003, it had 615 lakh sheep, that is about4.2% of the world’s total sheep population.
5.69 The wool industry is broadly divided betweenthe organized and decentralized sectors. The organizedindustry comprises: (i) composite mills, (ii) combingunits, (iii) worsted and non-worsted spinning units,(iv) knitwear and woven garment units, and (v)machine-made carpet manufacturing units. Thedecentralized industry is engaged in (i) hosiery andknitting, (ii) powerlooms, (iii) hand-knotted carpets,druggets, and namadahs, and (iv) independent dye-ing and processing houses.
Current Situation5.70 The wool industry currently employs 27.2 lakhpeople—12 lakh in the organized sector, 12 lakh insheep rearing and farming, and 3.2 lakh weavers inthe carpet sector. The productivity of this sector islow. The world average for wool productivity hasbeen about 3.5 kg per sheep per year, while in Indiathe average is 0.8 kg per sheep per year. The quality of

118 Eleventh Five Year Plan
domestic wool is also coarse and brittle. It is basicallycarpet grade wool and has an important role in thenational economy: it is rural-based (sheep breeding),defence-oriented (blankets and made-ups), and con-tributes significantly to exports (carpets). About 80%of good quality Indian wool goes into the manufac-turing of carpets. Of the remaining, 15% is very coarsegrade and 5% is apparel grade but of shorter averagefibre length. Rajasthan (44%), J&K (13%), Karnataka(12%) along with Gujarat, Uttar Pradesh, AndhraPradesh, and Haryana (23%) are the major wool-producing States in the country.
5.71 As the production of fine apparel grade wool isnot adequate in the country, a large quantity of woolis imported from Australia, New Zealand, China,Middle East, and other countries. In 2004–05, the to-tal wool consumption at industry level in the countrywas 135 million kg. Of this, just 55 million kg was do-mestic wool; rest was imported. Of the total imported80 million kg of wool, 47 million kg is apparel gradeand the rest carpet grade. There has been a consistentincrease in the quantity of imported raw wool inthe Tenth Plan. But export of woollen items has alsoshown an increase from Rs 3597.31 crore in 2002–03to Rs 4969.02 crore in 2005–06. This is mainly onaccount of the carpet industry which exports 95% ofits output. There are 718 woollen units in the orga-nized sector and many more in the small-scale sector.The wool-combing capacity of the sector is around30 million kg and synthetic fibre combing is 3.57 mil-lion kg. Approximately 7228 powerlooms operate inthis industry.
5.72 During the Tenth Plan, the Central Wool Devel-opment Board (CWDB), Jodhpur, implementedIntegrated Wool Improvement Programme for theunorganized wool sector. The various components ofthe scheme were improvement of wool fibre and breed;
product development; provision of quality-testing centres, provision of CFCs for scouring,drying, carding, design development, product diversi-fication, training, improvement, and development ofspeciality fibre such as Angora and Pashmina. TheCWDB programmes have covered 25.5 lakh sheepand benefited 55091 families upto the end of the TenthPlan period.
5.73 The CWDB installed wool-testing centres atBikaner and Beawar in Rajasthan to test the fibresupplied by growers, merchants, and industries.The Board has also implemented two R&D projects,and set up one CFC and two common facility-cum-training centres.
5.74 The growth of the production of woollen itemsdisplayed mixed trends during the Tenth Plan. Hand-made carpets recorded the highest growth, but therewas nominal annual increase in the production ofwoollen yarn and worsted yarn production. Despitethis, the woollen industry could not achieve the over-all targets of wool production due to the fluctuationsin the prices of Australian raw wool, lack of promo-tion, unfavourable climate, change in fashion trendsin favour of cotton, lifestyle changes, weak participa-tion by the State Governments, and inadequate infra-structure.
The Way Forward5.75 The Tenth Plan achievements and targets forthe terminal year of the Eleventh Plan are given inTable 5.5. Eleventh Plan Schemes for unorganizedwool sector are indicated in Box 5.4.
5.76 During the Eleventh Plan period, the productiv-ity per sheep will be increased from present 0.8 kgper sheep per year to 1.5 kg per sheep per year. Duringthis Plan period, the effort will be to produce good
TABLE 5.5Tenth Plan Achievements and Eleventh Plan Targets for Wool Sector
Item Tenth Plan Assumed Growth Rate Terminal Year ofAchievements during Eleventh Plan (%) Eleventh Plan
Wool production (million kg) 55.00 10 88.50Employment (lakh persons) 27.00 17 60.00Export (Rs crore) 5600 13 10000
Source: Central Wool Development Board, Ministry of Textiles.

Ensuring Rural and Urban Livelihoods 119
quality carpet wool. The Tenth Plan schemes will becontinued after suitable modifications. Two newschemes will also be started—insurance for shepherdsas well as insurance for sheep. A revolving fund forprocurement of raw wool from shepherds to help themin getting remunerative prices will be set up as a pilotproject. The State Governments of Rajasthan andUttarakhand have already demonstrated good resultswith similar initiatives. The wool sector needs conver-gence between various departments such as animalhusbandry and rural development. In the EleventhPlan, a comprehensive policy for pasturelands andcommons will be developed.
5.77 One of the major problems with the wool indus-try has been the virtual absence of a system of grad-ing. This will be taken up on a priority basis in theEleventh Plan.
5.78 Marketing of wool is critical; it is also a weaklink in the sector. There should be project-based assis-tance with clear identifiable objectives. Processingand finishing of wool products requires huge capitalinvestment for which common infrastructure facili-ties will be developed with assistance from thegovernment. To improve the breed, there has to beimport of high breed germ plasms. Legislative mea-sures would need to be taken up for issues of grazing,routes through forests for migratory sheep. CFCsfor finishing carpets and shawls are being set up inthe PPP mode. Involvement of industry associationsis being obtained with the government support andassistance.
KHADI AND VILLAGE INDUSTRIES (KVI)5.79 The KVI sector comprises khadi manufacturingand production from village/rural industries spreadall over the country. The KVI programmes have nowreached over 2.61 lakh villages providing employmentopportunities to the rural poor in remote and hillyareas, border, and tribal areas. SCs/STs artisans accountfor 32% and women for 46% of the total artisans.
Current Situation5.80 A large part of the employment in the khadi seg-ment is part-time (4.05 lakh part-time and 4.65 lakhfull-time). Spinning activity is carried out almost en-tirely by women, mostly belonging to the disadvan-taged sections of the society. KVI institutions provide‘charkhas’ to the spinners, usually at their homes andoccasionally in common worksheds. These institutionsare run by the office bearers of the societies. The wagepayments are irregular and generally made only afterthe permanent employees of the society receive theirsalaries. The sale of khadi products is only throughthe ‘departmental outlets’ of either the institutions orthose of the Khadi and Village Industries Commission(KVIC) or State KVI boards. The focus is on charityand appealing to the ‘goodness of people’s hearts’, noton the value of the product itself.
5.81 Currently, more than 60 lakh artisans/entrepre-neurs in villages are engaged in production/servicessuch as of minerals, leather, bee-keeping, honey,polyvastra, shoe repairing and manufacturing, papadmaking, food processing, and repairing agriculturalimplements.
Box 5.4Eleventh Plan Schemes
• Integrated Wool Improvement and Development Programme: To increase production, ensure breed improvement, healthcare, marketing of wool, survey and study, training, processing, and strengthening of indigenous varieties of wool, estab-lishing multi-purpose extension centre, etc. Target: 26 lakh new sheep, 26000 rams, and 15 farms, 400 families underAngora and 2400 families under Pashmina Wool Development.
• Quality Processing of Wool and Woollen Products: To help in provision of processing facilities with latest technology forimproving the quality of yarn and its end products. Target: 14 CRCs and 4 finishing centres.
New Initiatives
• Social Security Scheme for Insurance of Sheep Breeders in case of natural as well as accidental death. Target: 93500shepherds.
• Sheep Insurance to cover accidents including fire, flood, famine, storm, etc., and diseases. Target: 24 lakh sheep.
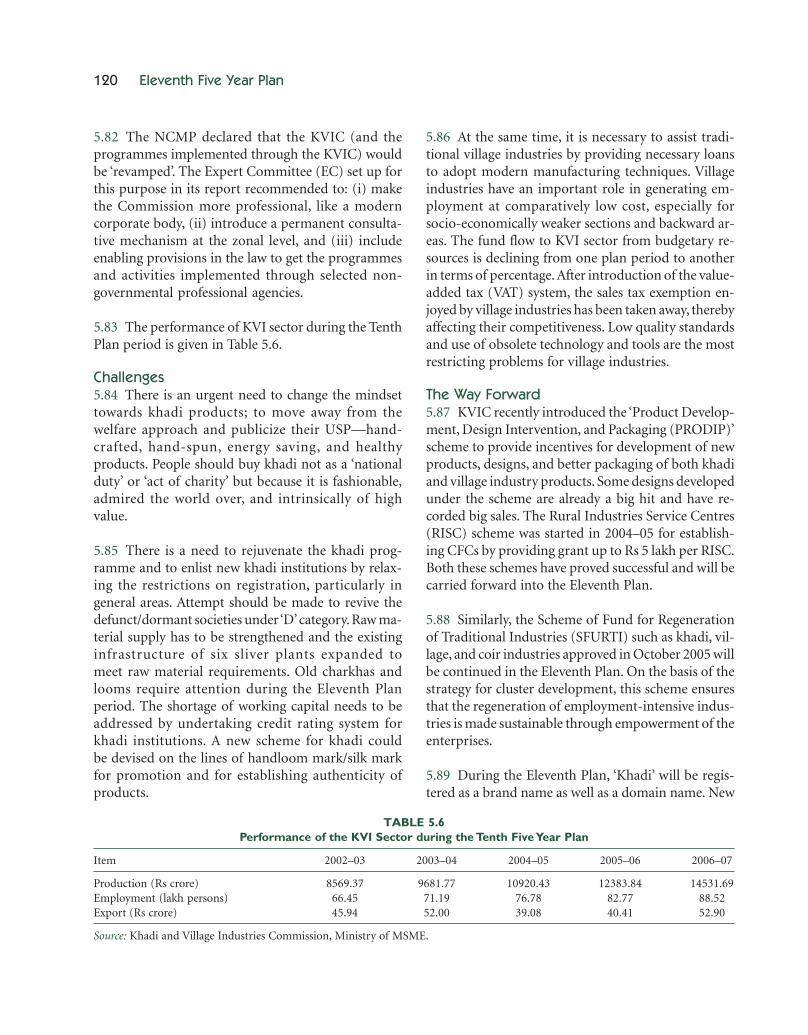
120 Eleventh Five Year Plan
5.82 The NCMP declared that the KVIC (and theprogrammes implemented through the KVIC) wouldbe ‘revamped’. The Expert Committee (EC) set up forthis purpose in its report recommended to: (i) makethe Commission more professional, like a moderncorporate body, (ii) introduce a permanent consulta-tive mechanism at the zonal level, and (iii) includeenabling provisions in the law to get the programmesand activities implemented through selected non-governmental professional agencies.
5.83 The performance of KVI sector during the TenthPlan period is given in Table 5.6.
Challenges5.84 There is an urgent need to change the mindsettowards khadi products; to move away from thewelfare approach and publicize their USP—hand-crafted, hand-spun, energy saving, and healthyproducts. People should buy khadi not as a ‘nationalduty’ or ‘act of charity’ but because it is fashionable,admired the world over, and intrinsically of highvalue.
5.85 There is a need to rejuvenate the khadi prog-ramme and to enlist new khadi institutions by relax-ing the restrictions on registration, particularly ingeneral areas. Attempt should be made to revive thedefunct/dormant societies under ‘D’ category. Raw ma-terial supply has to be strengthened and the existinginfrastructure of six sliver plants expanded tomeet raw material requirements. Old charkhas andlooms require attention during the Eleventh Planperiod. The shortage of working capital needs to beaddressed by undertaking credit rating system forkhadi institutions. A new scheme for khadi couldbe devised on the lines of handloom mark/silk markfor promotion and for establishing authenticity ofproducts.
5.86 At the same time, it is necessary to assist tradi-tional village industries by providing necessary loansto adopt modern manufacturing techniques. Villageindustries have an important role in generating em-ployment at comparatively low cost, especially forsocio-economically weaker sections and backward ar-eas. The fund flow to KVI sector from budgetary re-sources is declining from one plan period to anotherin terms of percentage. After introduction of the value-added tax (VAT) system, the sales tax exemption en-joyed by village industries has been taken away, therebyaffecting their competitiveness. Low quality standardsand use of obsolete technology and tools are the mostrestricting problems for village industries.
The Way Forward5.87 KVIC recently introduced the ‘Product Develop-ment, Design Intervention, and Packaging (PRODIP)’scheme to provide incentives for development of newproducts, designs, and better packaging of both khadiand village industry products. Some designs developedunder the scheme are already a big hit and have re-corded big sales. The Rural Industries Service Centres(RISC) scheme was started in 2004–05 for establish-ing CFCs by providing grant up to Rs 5 lakh per RISC.Both these schemes have proved successful and will becarried forward into the Eleventh Plan.
5.88 Similarly, the Scheme of Fund for Regenerationof Traditional Industries (SFURTI) such as khadi, vil-lage, and coir industries approved in October 2005 willbe continued in the Eleventh Plan. On the basis of thestrategy for cluster development, this scheme ensuresthat the regeneration of employment-intensive indus-tries is made sustainable through empowerment of theenterprises.
5.89 During the Eleventh Plan, ‘Khadi’ will be regis-tered as a brand name as well as a domain name. New
TABLE 5.6Performance of the KVI Sector during the Tenth Five Year Plan
Item 2002–03 2003–04 2004–05 2005–06 2006–07
Production (Rs crore) 8569.37 9681.77 10920.43 12383.84 14531.69Employment (lakh persons) 66.45 71.19 76.78 82.77 88.52Export (Rs crore) 45.94 52.00 39.08 40.41 52.90
Source: Khadi and Village Industries Commission, Ministry of MSME.

Ensuring Rural and Urban Livelihoods 121
products and new designs will be developed withthe help of National Institute of Design (NID) andNIFT. Packaging of khadi products will be improved.A mechanism to ensure the quality of khadi productswill be evolved. Advertising campaigns in India andabroad will be carried out to make people aware ofkhadi and to project it as a fashion statement for theyouth. Shops will be opened at all international air-ports in India and the possibility of marketing KVIproducts through e-commerce will be explored.
COIR INDUSTRY5.90 The 150-year old coir industry is mostly concen-trated in Kerala, Tamil Nadu, Andhra Pradesh, andKarnataka due to availability of coir husk, a by-prod-uct of coconut plantation. It has an annual turnoverof Rs 1300 crore with a steady growth rate of 10%.India accounts for 90% of the world’s coir productionand our coir products are exported to approximately90 countries across the world. The industry provideslivelihood and/or additional income to more than31.25 lakh people, mostly the disadvantaged sectionsof the population—SC, ST, and minorities. Womenconstitute 80% of its workforce.
Current Situation5.91 The coir industry is highly decentralized, seasonal,and labour intensive. In 2006–07, coir exports amoun-ted to Rs 605.17 crore, well above the Plan target.SFURTI has been taken up in 25 clusters selected inconsultation with the principal coir-growing States suchas Kerala, Andhra Pradesh, Tamil Nadu, Karnataka, etc.
5.92 The performance of the coir industry during theTenth Plan period is given in Table 5.7.
Challenges5.93 Though coir is found in many coastal areas, forhistorical reasons, coir products are primarily made in
Kerala. There is an urgent need to promote and encour-age healthy competition among the coconut-growingStates to catalyse State/region—specific innovations fortapping the immense growth and employment poten-tial of this versatile fibre. The challenge in the EleventhPlan is to develop new market driven products, to ex-plore new markets—both in India and abroad—and,most importantly, to ensure a rational growth of coirindustry on the basis of mutual co-operation.
5.94 There has been no comprehensive study toassess the actual global demand for coir productsand the demand–supply gap, if any. Though coir in-dustry is capable of producing a range of products,the use of coir products has remained confined tofloor-covering material. Apart from this, the sector alsofaces some specific challenges such as
TARIFF AND NON-TARIFF BARRIERS• In the international market, the duty applicable on
import of coir and coir products ranges between4% and 35%.
DISEASE• Production of coir fibre has been affected by disease,
which reduces the size of the coconut husk, result-ing in low yield and inferior quality fibre.
SCATTERED PRESENCE• Barring a few natural clusters, the industry is dis-
persed. Even in these clusters, the industry is notwell integrated to take advantage of the develop-ment and promotional efforts towards moderniza-tion.
TECHNOLOGICAL OBSOLESCENCE• The method of production has not undergone any
significant change. The cost of production has beenprogressively rising, rendering it non-competitive.
TABLE 5.7Performance of Coir Industry during the Tenth Plan Period
Item 2002–03 2003–04 2004–05 2005–06 2006–07
Coir fibre production (metric tonnes) 353700 364000 385000 410000 430025Employment (lakh persons) 5.79 5.86 6.06 6.22 6.40Export (Rs crore) 352.71 407.50 473.40 508.44 605.17
Source: Coir Board, Ministry of MSME.

122 Eleventh Five Year Plan
MARKETING NEW PRODUCTS• There is a need to undertake product development
in traditional and non-traditional applications.New products that have phenomenal applications,such as rubberized coir, needle felt, geo-textiles, andcoir pith, could be promoted to increase the demandfor coir.
The Way Forward5.95 During the Eleventh Plan period, most of theTenth Plan schemes will be continued to reduce drudg-ery and increase production and wage levels. A majorcluster development project with an approved outlayof Rs 56.8 crore has been taken up, in associationwith the Department of Industrial Policy and Promo-tion (DIPP), for the development of coir industries inand around Alappuzha, Kerala, with a Central grantof Rs 42.6 crore.
5.96 It is proposed to increase the level of growth ofthe industry to 15% and achieve a turnover of Rs 2100crore by the terminal year of the Plan. Approximately176250 new jobs will be created in the coir sector dur-ing the Eleventh Plan. Of this, 1.41 lakh jobs will befor women.
5.97 In the Eleventh Plan there is a need to focusupon R&D for diversification and popularizingnew coir products in the market. Rejuvenation, mod-ernization, and technology upgradation schemeswill be introduced in the Eleventh Plan period. Betterconversion rate of husk-to-coir products as a resultof this scheme will require 50000 additional coirworkers. Five mega clusters, one each in Kerala,Tamil Nadu, Andhra Pradesh, Karnataka, andOrissa, with thrust on technology upgradation willbe promoted.
FOOD PROCESSING INDUSTRIES5.98 Traditionally, food processing has been an im-portant part of the rural and semi-urban economy,with pickles, jams, chutneys, and papads being madeby women at the household level. As an industry,however, the food processing sector is yet to realize itspotential. India currently produces about 50 milliontonnes of fruits, about 9% of the world’s fruit produc-tion, and 90 million tonnes of vegetables, accounting
for 11% of the world’s vegetable production. Yet, onlyabout 2% of these fruits and vegetables are processedas against 23% in China, 78% in Philippines, 83% inMalaysia, and 80% in South Africa. Within the coun-try, share of fruits and vegetables processing is less thanother products such as milk (35%) and marine prod-ucts (26%). Lack of processing and storage capacitiesfor fruits and vegetables results in about 35% waste inthe annual production, the value being approximatelyRs 54000 crore. A progressive and vibrant food pro-cessing industry (FPI) fetches more remunerative pricefor farmers and reduces waste.
Current Situation5.99 There are three segments in the Indian food-processing industry—household, small, and large.Together they contribute 14% to the manufacturingGDP and employ about 130 lakh people directly and350 lakh people indirectly. Of this 45.34 lakh peopleare employed in the MSME segment as indicated inTable 5.8. Then there are vendors, hawkers, peopleemployed by large food processing industries, etc. Foran investment of Rs 1 crore in organized and unorga-nized food processing sector, 140 and 1050 jobs arecreated, respectively. The multiplier effect of invest-ment in food processing is 2.5 times in comparison toother industrial sectors.
5.100 In sectors such as marine products, cashewprocessing, and pickle manufacturing, the involvementof women is as high as 90%. Evaluation of schemesimplemented by Ministry of Food Processing Indus-tries (MFPI) in NER during the Tenth Plan show that30% of permanent employment generated due to as-sistance provided under the programmes/schemes ofMFPI was availed by women.
5.101 During the Tenth Plan, the schemes run by theMFPI were primarily for the small and large sectors ofthe industry. Little was done for the household sector,especially street food vendors who are present in largenumbers in various cities (1 lakh in Ahmedabad, 2 lakhin Mumbai, and 1.5 lakh in Kolkata). While physicaltargets were met in some schemes, others such as foodparks faced problems of gross underutilization. Mostof the 54 food parks sanctioned since the Eighth FiveYear Plan are yet to become operational. Currently only

Ensuring Rural and Urban Livelihoods 123
28 units are running in eight parks. Similarly, though18 projects were sanctioned under cold chain facilitiesand five under value-added centres, only four coldstorages and two value added centres are currentlyoperational.
5.102 The performance of FPI sector during the TenthPlan period is given in Table 5.8.
5.103 To provide an impetus to food processingindustries (FPIs), a number of policy measures wereinitiated during the Tenth Plan. Excise duty on fruitand vegetable processing was waived, Income taxholiday was provided, and customs duty reduced onfreezer van from 20% to 10%.
5.104 Availability of raw materials for FPIs is a majorstrength of India. The growing middle-income andupper middle-income groups, increasing health con-sciousness, growing number of working women, timeconstraint, convenience, and need for hygienic foodhave also increased the demand for processed foods.Malls and departmental stores in metros, medium andsmall towns are providing better forward linkages.
Challenges5.105 All three segments of the food processing sec-tor face specific challenges. This section deals with thechallenges faced by the dispersed small and householdsector.
• Infrastructure Development: Since deteriorationof agricultural produce starts within five hours ofharvesting, much higher investments are requiredin pre-cooling and controlled atmosphere compo-nents at the farm level. Cold chain facilities alsohelp in the decentralized distribution of processedfood in small and medium-sized towns. Non-availability of adequate power of appropriate volt-age is, however, a major hurdle.
• Investment and Credit Availability: Estimates indi-cate that more than 40% of the credit needs of smalland marginal farmers are met by the traditionalarhtias at very high interest rates. Similarly, morethan 75% processors rely on informal credit.Development of a secondary market on the basis offinancial instruments and negotiable warehousereceipt system is necessary for providing liquidity.The use of warehouse receipts as a financial instru-ment has not picked up. The Eleventh Plan will seea more secure system of accrediting warehousesso that they can provide certification about qualityand quantity of the goods plus credits and standardsof the goods stored. The Amendment to the Ware-housing Act, pending in the Parliament will beexpedited.
• Year Round Availability of Raw Materials: Non-availability of agriculture and horticulture surplusesin the required quantity and quality at the appro-priate time is a major concern. To ensure theavailability of varieties suitable for processing, a
TABLE 5.8Performance of FPI Sector during the Tenth Plan Period
Item 2002–03 2003–04 2004–05 2005–06 2006–07 CAGR (%)
Production at current price#— 66472.05 76264.13 86128.19 94127.99 104758.54 9.5(Rs crore)MSME sector CSO dataFPI component of GDP* 45146.00 51846.00 55772.00 59281.00 na
(Prov.)Employment (lakh persons)** 38.30 39.97 41.74 43.51 45.34 3.4Export***(Rs crore) 4727.57 5467.06 6154.77 8634.49 8493.40 12.4
(Prov.)
Note: # Data compiled on the basis of the Third Census results of MSME sector and growth rate estimated using Index of IndustrialProduction (MSME sector).*Provided by Central Statistical Organization (CSO). These figures would be revised by the MFPI after compiling the data for FPI sector,which includes MSMEs and large industries.**Estimated on the basis of the Third Census results of MSME sector.***Agricultural and Processed Food Products Export Development Authority (APEDA) data.Source: MFPI.

124 Eleventh Five Year Plan
co-ordinated network of research and extensionservices is required.
• A significant challenge is the limited period of avail-ability of products. Mango is available for three tofour months; lychees for fifteen days in a year. Thus,units have to procure maximum crop during har-vest time and process it throughout the year. Manyunits argue for flexibility in hiring, but workers’interests need to be ensured.
• Creating Markets: The high cost of transportingagricultural commodities and processed food affectsefficiency. The challenge is to establish an integrated,comprehensive but simple system for the movementof commercial transport vehicles to increase effi-ciency, reduce delays, and make produce availableon a timely basis. With rural connectivity, the coun-try should become a single market.
• The complex tax structure and multiplicity of state-level taxes need to be rationalized. VAT should be-come uniform in all States/UTs. Abolition of allindirect taxes on agricultural/horticulture productscould resolve the problem of border taxes.
• Farmers’ associations, SHGs, and co-operatives aswell as private companies need to be promoted sothat they can bargain with the processors and re-tailers for better price. Realization of the economiesof scale in procurement, technology, and market arealso better ensured by producer’s groups.
• The food supply chain is complex with perishablegoods and numerous small stakeholders. Eachstakeholder works in a silo. Demand forecastingis totally absent and the farmers try to push whatthey produce into the market. There is need fordata integration, financial flow management,supply–demand matching, collaborative forecast-ing, information-sharing, and goods movementsynchronization through efficient transport sched-uling.
• Packaging has become the competitive tool to reachthe consumer. Cost of packaging ranges from 10%to 64% of the production costs, and efforts areneeded to reduce this.
• The expenditure on R&D is less than 1%. This needsto be enhanced for finding effective technologies forhousehold and small units.
• Standardization is a powerful tool for improvingthe supply chain efficiency. There are two standards.The first is about content, manufacturing process,
and packaging. The second one deals with logisticsand IT systems such as standardization of cartons,pallets, and IT software so that seamless transfer ofgoods and information is possible. Both these stan-dards need to be enforced so that the demand is notaffected by the issue of quality control.
• The increase in world food trade and the adventof the SPS Agreement under the WTO have led toincreasing recognition and adoption of food safetymeasures. Our ability to compete in world marketsdepends on our compliance with the increasinglystringent food safety standards, especially in viewof the breakout of diseases such as Avian Influenzaand Bird Flu.
5.106 The household sector of food processing facesanother problem. Street vendors are increasingly be-ing removed for urban planning and development.This not only robs many of their livelihoods, butalso reduces the access of low-income groups to streetfood.
The Way Forward5.107 Integration of the food processing infrastruc-ture from farm to market, providing choice to con-sumers, assurance about safety and quality of food,setting up a transparent and industry-friendly foodauthority, and putting in place a transparent systemof standards will be the thrust areas during the Elev-enth Plan. For this purpose, certain targets have beenset, for example: (i) increase the level of processing ofperishables such as fruits and vegetables from 6% to20%, (ii) enhance the value addition in food process-ing from the present 20% to 35%, and (iii) increaseshare in global food trade from 1.5% to 3% by 2015.The year-wise physical targets for the Eleventh Plan isgiven in Table 5.9.
5.108 A paradigm shift is required for the implemen-tation of the various schemes. Management andimplementation arrangements in the PPP mode andstrong project implementation capabilities will bedeveloped. The scheme for technology upgradationand modernization would be decentralized and oper-ated through nodal banks in place of State nodal agen-cies to provide back-ended credit-linked subsidy. A newintegrated approach would be adopted based on thestrategy of (i) better project selection, development,

Ensuring Rural and Urban Livelihoods 125
and implementation, (ii) decentralized cluster-baseddevelopment, particularly for creation of infrastruc-ture and fostering linkages with the retail outlets,(iii) industry-led capacity building and upgradationof standards, (iv) an integrated food law and scientificfood standards, and (v) strategic intervention withredesigned schemes and strong implementationarrangements.
5.109 The Eleventh Plan will see the development ofcarefully planned, cluster-based, privately drivenfood parks; publicly owned and privately managedabattoirs; integrated cold chain facilities and strategicdistribution centres (SDCs); cluster-based preserva-tion infrastructure (cold storages, reefer vans, etc.)and irradiation centres; public and private testing andcertification labs; and a liberalized wine policy lever-aging the agri/horticultural surpluses. Emphasis willbe laid on upgrading the quality and hygiene of thestreet food. National Meat Board, Wine Board, andNational Institute of Food Technology and Manage-ment will be set up and the Paddy Processing Research
Centre, Thanjavur will be modernized. New marketswill be tapped by creating the ‘Halal Food Hub’, the‘Organic Food Hub’, the ‘Vegetarian Food Hub’, the ‘SeaFood Hub’ among others.
ELEVENTH PLAN SCHEMES5.110 The scheme for infrastructure developmentaims to establish 30 mega food parks (new scheme),50 abattoirs for modernization, and 30 cold chaininfrastructure and value-added centres. The megafood parks would be set up with the objective of:(i) state-of-the-art infrastructure for food processing,(ii) ensuring value addition, (iii) inducting latest tech-nology, (iv) fostering of inter-agency linkages for pool-ing of resources, and (v) quality assurance throughbetter process control and capacity building. Integratedcold chain and SDCs would be set up in a networkof towns in associations with private infrastructurecompanies. Local bodies would be encouraged to par-ticipate in setting up of modern abattoirs with a focuson capacity building and training for hygienic and sci-entific slaughtering.
TABLE 5.9Year-wise Physical Targets for the Eleventh Plan for FPI
(MSME Manufacturing Units)
Item 2007–08 2008–09 2009–10 2010–11 2011–12 CAGR (%)
Production at current prices (Rs crore) 120472.33 138543.18 159324.65 183223.35 210706.85 12
Employment (lakh persons) 47.61 49.99 52.49 55.11 57.87 4
Export (Rs crore) 11630.00 13185.00 14955.00 16970.00 19270.00 10.7
Source: MFPI.
Box 5.5From Poverty to Prosperity
Shri Mahila Griha Udyog, the makers of the popular Lijjat Papad, started with a modest loan of Rs 80 and an annual turnoverof Rs 6196. This triumphant journey began on 15 March 1959, when seven women inhabitants of South Bombay, withoutany seed money, gathered on the terrace of a building to prepare papad. Today, Lijjat Papad involves a workforce of morethan 40000 women, has an annual turnover of Rs 300 crore, and an annual export of Rs 10 crore. Though Lijjat has achievedhuge success, its annual expense on advertisements and promotions is Rs 60 lakh, a mere 0.2% of the total turnover. Theco-operative believes in promotion by word of mouth and thus concentrate on cost effectiveness and quality rather thanpromotion through advertisements. Lijjat has now diversified into other products such as grounded spices, khakhra, blackpepper powder, detergent powder, and cake, vadi, bakery products, etc. Kanjikuzhy GP in Allepuzha district of Kerala wasone of the poorest and least-developed Panchayats of the State. Under the leadership of a dynamic woman pradhan, thevillage started vegetable gardens. They began making coir products and processing different varieties of food that they culti-vated—amla, lime, garlic, ginger, bittergourd, and mango. Today the Panchayat has a turnover of over Rs 2 crore per monthby selling its coir products, pickles, jams, squashes, etc. under its own brand. There are over 2000 women SHGs in five villageswith a population of 1.6 lakh. Women earn Rs 60 per day as wage and get a share in profits.

126 Eleventh Five Year Plan
5.111 The scheme for technology upgradation,establishment, and modernization of FPI will bedecentralized and operated through nodal banks/financial institutions directly in place of State nodalagencies. The target under this scheme is 300–350food processing units. With effect from 1 April 2007,the Ministry has decentralized the disbursement ofgrants to the applicants directly from the banks whichhave appraised their projects and provide term loan/working capital. This has resulted in increasing theoutreach of the scheme. The new demand coupledwith the outstanding applications implies that therewill be greater allocation for this scheme during theEleventh Plan.
5.112 The scheme for quality assurance, codex stan-dards, and R&D and promotional activities providesfinancial assistance for total quality management,International Organization for Standardization (ISO)standards, bar coding, quality control labs, strength-ening of codex cell, and R&D. The scheme also en-courages promotional activities. The existing schemeis proposed to be modified for making it more attrac-tive. Private parties will be encouraged to set up qual-ity control/food testing laboratories. FPI units will beprovided inputs for adopting modern practices suchas HACCP, good manufacturing practice (GMP), goodhandling practice, ISO 9000, etc.
5.113 Four thousand programmes will be taken upunder the scheme for HRD to provide assistance forskill development, strengthening of technical coursesin food processing in universities, EntrepreneurshipDevelopment Programmes (EDPs), training centres,etc. Follow-up support would be provided to the train-ees of EDPs as well as linkages for availing loans frombanks/financial institutions would be provided.
5.114 A new scheme for upgradation of quality ofstreet food will be introduced to provide assistance forupgrading and establishing safe food town/food streetin 25 cities. This would play a major role in makingavailable hygienically prepared food to aam admi(common man). Industry associations, NGOs, PRIs,municipal bodies, etc., would be involved to ensuresafety and good quality of street food with the focus
on value addition to augment the income levels of thefood vendors.
5.115 The total projected GBS for the Eleventh Planfor the MFPI is Rs 3564 crore (2006–07 price) andRs 4031 crore (current price). A matching privatesector investment and a leveraging ratio of 2.5 wouldresult in an investment of about Rs 20000 crore in theprocessing units. This will lead to creation of 28 lakhadditional jobs in the organized sector during the Planperiod. Further, assuming a reasonable investmentturnover ratio of 2, a total investment of Rs 20000 crorewould lead to an aggregate turnover of Rs 40000 croreover the Plan period. The income levels of the farmersare also expected to go up by 20% due to better real-ization, value addition, and integration of the supplychain. During the Plan period, supportive steps willbe taken in a number of other sectors which have adirect or indirect impact on the agricultural/horticul-tural surpluses available for processing. These will in-clude quality of the inputs, research, and institutionalsupport to enable the farmer to generate surpluses,facilitating transportation of produce across Stateborders, formation of a national market, etc.
5.116 During the Eleventh Plan period, specialprogrammes for capacity building of SCs, STs, minori-ties, and women will be formulated. Potential entre-preneurs belonging to these groups will be identified,and tailor-made EDPs, skill development programmes,study tours, etc., will be organized. Gender sensitiza-tion programmes for stakeholders including extensionfunctionaries and other implementing agencies willbe carried out. Training programmes for womenwill be redesigned to include technology, management,and micro credit and to promote rise of womenentrepreneurs. R&D institutions will be encouragedto develop women-friendly technologies for post-harvest handling and processing, especially fordrudgery reduction and providing ease of operation.Most importantly, provision of utilities, basic ameni-ties, and crèches for women staff workers will bemade mandatory in the infrastructure projects. Anincreased scale of assistance will be given for all theinfrastructure projects to attract investment in theNorth East.

Ensuring Rural and Urban Livelihoods 127
Clusters are defined as a sectoral and geographicalconcentration of enterprises, institutions, service pro-viders, and related regulatory bodies, engaged in theproduction of homogeneous or inter-related productsand faced with common opportunities and threats.
TYPOLOGY OF CLUSTERS IN INDIA FROMA POLICY PERSPECTIVEIn India, as per the current estimates, there are over6600 clusters. Agencies have come up with a range ofdefinitions of clusters by specifying a minimum num-ber of units in a given measured location. However,from a policy perspective, it makes sense to typify clus-ter by their broad challenges relevant for policy inter-vention. Accordingly, clusters in India can be classifiedinto three broad categories, namely, (i) high-techclusters (very few at present) targeting innovation forexistence, (ii) traditional manufacturing clusters(around 400 plus) targeting competitiveness andconsequent employment, and (iii) low-tech micro en-terprise ‘poverty-intensive’ clusters (around 6000) thathave both employment as well as poverty implications.Industry/region-wise overview of Indian clusters isindicated in Table A5.1.
A POLICY FRAMEWORK
Activation should be Preferred overCluster CreationCluster-level support is required for both ‘soft’[e.g., marketing, training, network creation, Business
Development Service provision, benchmarking, pro-ductivity improvement areas] as well as ‘hard’ (clus-ter-specific infrastructure) interventions. Besides,support is also required for programme managementfor implementing agencies, resource organization, andcluster development executives.
Capacity Building for Creation of Cluster-related Institutional InfrastructureDevelop a cadre of human resources to initiate clusterdevelopment. Develop at least 8–10 national and25–30 regional institutions to support the implemen-tation of cluster-based development initiatives.
Policy institutions should set up cluster cells andeither deploy adequately trained personnel or hireexpert institutions for continuous monitoring andevaluation.
ACTIONS BY CENTRAL GOVERNMENT• The National Commission for Enterprises in the
Unorganized Sector (NCEUS) has recommendedcreation of a National Fund for the UnorganizedSector (NAFUS). NAFUS should be a statutorybody funded by the Central Government, publicsector banks, financial sector institutions, andother government agencies. The functions of theFund would not be merely to enable better accessof credit to farm and non-farm enterprises alonebut to enable the unorganized sector to benefit inareas of marketing, technology, skill and entrepre-neurship, guidance and counselling, and capacity
TABLE A5.1Indian Clusters—An Overview
Region Traditional Micro Enterprise
Manufacturing Handicraft Handloom Others
No. (%) No. (%) No. (%) No. (%)
North 123 31.7 716 25.75 140 23.56 698 24.11East 36 9.28 645 23.19 43 7.24 464 16.02West 140 36.09 764 27.47 134 22.57 787 27.17South 89 22.95 502 18.05 214 36.02 858 29.62North East 0 0 153 5.51 63 10.61 89 3.08Total 388 100 2780 100 594 100 2896 100
Source: Compiled from DC (Handicrafts), DC (Handlooms), UNIDO, and the Third Census of SSI units, 2001–02.
ANNEXURE 5.1
CLUSTER DEVELOPMENT IN INDIA—TOWARDS A REINVIGORATED CLUSTER APPROACH

128 Eleventh Five Year Plan
building. The target group of the Fund shouldbe the micro enterprises, with focus on those belowan investment of Rs 0.5 million. These constitute94% of the small enterprises in the country butreceive about 2% of the net bank credit (NBC),despite providing employment to 70 million peopleand contributing 30% of industrial production. TheFund could ensure convergence among the variousinstitutions and programmes, through refinancingand confidence schemes for the banks.
• The NCEUS has also piloted Growth Poles for theunorganized sector, based on a concept of develop-ing a cluster of clusters in project mode with PPP.The Commission recommends that 25 GrowthPoles (one in each State) be supported during theEleventh Plan with incentives similar to those offeredto SEZs.
ACTIONS BY STATE GOVERNMENTS• State governments and institutions with specific
areas of focus may draw up their own criteria todefine clusters. In view of the huge employment po-tential of the services clusters, there is need for iden-tifying such clusters and subsequent interventionsin urban, semi-urban, and rural hubs.
• Although the international experience (especiallyin Italy and China) has been that local governmentsare the key players in promoting clusters, in Indialocal governments currently lack this capacity. Thereis need to shift to a pattern of funding and supportdriven by State Governments.
• Targeting poverty reduction through clusterdevelopment calls for addressing the needs ofan estimated 6000 clusters. While the handloomand handicrafts clusters are well-defined, microclusters need to be further documented withrespect to their products, marketability, and disper-sion. Within those clusters, highest importanceneeds to be given to the presence of certainsocial groups such as higher presence of SCs,STs, and minority communities and those havinghigher involvement of women as entrepreneurs/workers.
ACTIONS BY PRIVATE ACTORS ANDINDUSTRY ASSOCIATIONSThe international experience is that for co-operativeaction to take place within clusters, the enterpriseswithin clusters should have an association. Thereare about 3000 associations in existence; however,nearly all these associations are for industrialclusters and not for artisanal clusters. In other words,the 400–500 odd industrial clusters are serviced bysome 3000 associations, while the artisanal clustershave no more than 100 associations between them.Without such associations, the articulation of thedemands and needs of such artisanal clusters islikely to remain inadequate, and the governmentprogrammes or cluster development agency effortsmay be supply driven, as opposed to being demanddriven and responding to the real felt needs of playersinvolved.
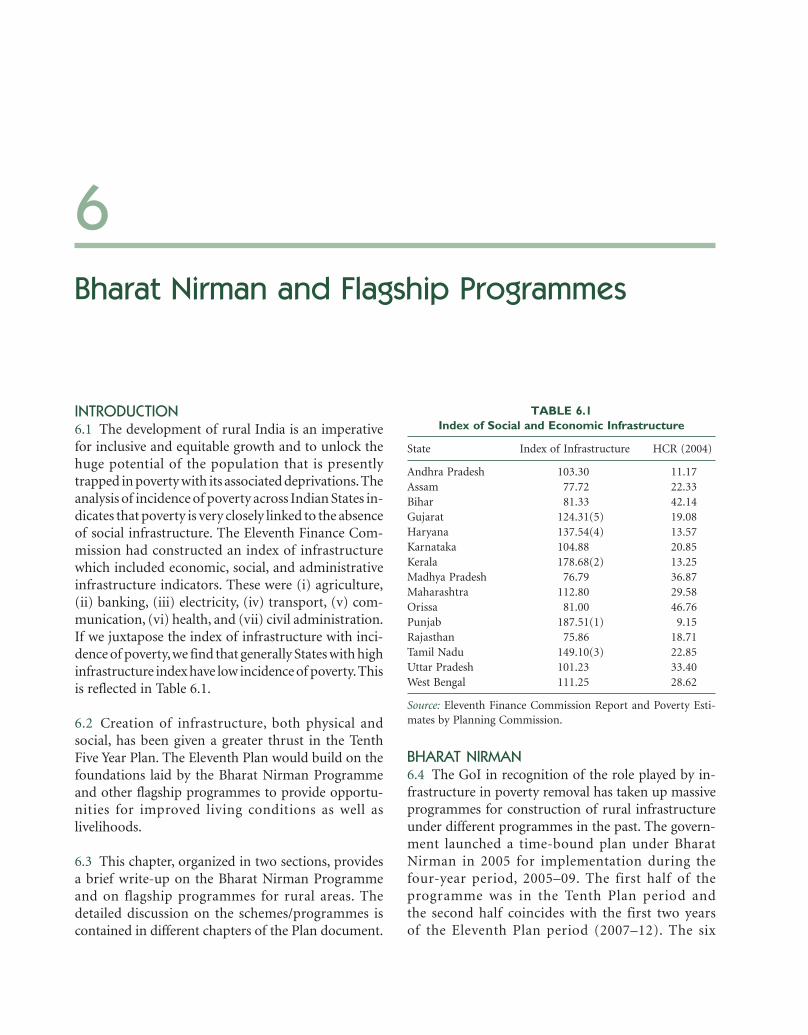
6Bharat Nirman and Flagship Programmes
INTRODUCTION6.1 The development of rural India is an imperativefor inclusive and equitable growth and to unlock thehuge potential of the population that is presentlytrapped in poverty with its associated deprivations. Theanalysis of incidence of poverty across Indian States in-dicates that poverty is very closely linked to the absenceof social infrastructure. The Eleventh Finance Com-mission had constructed an index of infrastructurewhich included economic, social, and administrativeinfrastructure indicators. These were (i) agriculture,(ii) banking, (iii) electricity, (iv) transport, (v) com-munication, (vi) health, and (vii) civil administration.If we juxtapose the index of infrastructure with inci-dence of poverty, we find that generally States with highinfrastructure index have low incidence of poverty. Thisis reflected in Table 6.1.
6.2 Creation of infrastructure, both physical andsocial, has been given a greater thrust in the TenthFive Year Plan. The Eleventh Plan would build on thefoundations laid by the Bharat Nirman Programmeand other flagship programmes to provide opportu-nities for improved living conditions as well aslivelihoods.
6.3 This chapter, organized in two sections, providesa brief write-up on the Bharat Nirman Programmeand on flagship programmes for rural areas. Thedetailed discussion on the schemes/programmes iscontained in different chapters of the Plan document.
BHARAT NIRMAN6.4 The GoI in recognition of the role played by in-frastructure in poverty removal has taken up massiveprogrammes for construction of rural infrastructureunder different programmes in the past. The govern-ment launched a time-bound plan under BharatNirman in 2005 for implementation during thefour-year period, 2005–09. The first half of theprogramme was in the Tenth Plan period andthe second half coincides with the first two yearsof the Eleventh Plan period (2007–12). The six
TABLE 6.1Index of Social and Economic Infrastructure
State Index of Infrastructure HCR (2004)
Andhra Pradesh 103.30 11.17Assam 77.72 22.33Bihar 81.33 42.14Gujarat 124.31(5) 19.08Haryana 137.54(4) 13.57Karnataka 104.88 20.85Kerala 178.68(2) 13.25Madhya Pradesh 76.79 36.87Maharashtra 112.80 29.58Orissa 81.00 46.76Punjab 187.51(1) 9.15Rajasthan 75.86 18.71Tamil Nadu 149.10(3) 22.85Uttar Pradesh 101.23 33.40West Bengal 111.25 28.62
Source: Eleventh Finance Commission Report and Poverty Esti-mates by Planning Commission.

130 Eleventh Five Year Plan
components included under the programme areirrigation, drinking water, electrification, roads,housing, and rural telephony.
6.5 Certain physical targets have been set undereach of the components. These are indicated inTable 6.2.
6.6 The investment proposed to be made is of the or-der of Rs 174000 crore during the four-year period.The objective of the Bharat Nirman Programme is toimpart a sense of urgency to create rural infrastruc-ture by setting time-bound goals under variousschemes which form a part of the Bharat NirmanProgramme. The Programme imposes a responsibil-ity on the State to create these facilities in a transpar-ent and accountable manner.
IRRIGATION6.7 Under the Bharat Nirman Programme, creation ofaverage rate of irrigation potential creation is to be in-creased from 1.4 MH per annum (i.e., the average rateof creation from 1951–2002) to 2.5 MH per annum.With this objective, it is targeted to create 10 MH ofirrigation potential through a combination of majorand medium projects, minor irrigation, and restora-tion of water bodies. The year-wise physical details aregiven in Table 6.3.
6.8 The creation of additional irrigation potentialof 4.30 MH was targeted in the first two years of theBharat Nirman Programme against which the achieve-ment reported up to March 2007 is 2.587 MH which isabout half of the target. Clearly the acceleration ofpotential creation has not been as targeted.
TABLE 6.2Targets under Bharat Nirman
Component Targets to be Achieved by Year 2009
Irrigation To create 10 million ha of additional irrigation capacity.Roads To provide all-weather roads to every habitation over a 1000 population and above
(500 in hilly and tribal areas); remaining 66802 habitations to be covered.Electricity To provide electricity to remaining 125000 villages and to 23 million households.Housing To construct 60 lakh houses.Drinking water To provide drinking water to 55067 uncovered habitations by 2009. All habitations with
failed sources and water quality problems will be addressed.Telephone connectivity To connect remaining 66822 villages with telephone by 2007.
Source: Booklet on Bharat Nirman.
TABLE 6.3Irrigation Targets under Bharat Nirman
(Unit in Million Ha)
Components 2005–06 2006–07 2007–08 2008–09 Total
I Major and Medium Irrigation
Completion of ongoing projects 0.90 1.10 1.10 1.10 4.20 Extension, renovation, modernization of
MMI projects 0.25 0.25 0.25 0.25 1.00Major and medium irrigation total 1.15 1.35 1.35 1.35 5.20
II MI
Surface water 0.25 0.25 0.25 0.25 1.00Ground water 0.45 0.75 0.80 0.80 2.80Repair, renovation, and restoration of waterbodies/ERM of MI schemes 0.05 0.05 0.45 0.45 1.00
MI total 0.75 1.05 1.50 1.50 4.80
Grand total 1.90 2.40 2.85 2.85 10.00
Source: MoWR.

Bharat Nirman and Flagship Programmes 131
6.9 The Eleventh Five Year Plan would target tocreate 16 MH potential. During the first two years ofthe Eleventh Plan, it was proposed to create 5.7 MHirrigation potential through the Bharat NirmanProgramme. This would call for higher outlays forirrigation from the States and liberal assistance underAIBP (which is now only a grant and available forsurface MI schemes also) for completion of ongoingprojects. External assistance for restoration of lostpotential by restoring tank irrigation would be utilized.Groundwater potential would be utilized in theStates where there is still scope for development. Closemonitoring of the projects with remote sensing andcompleting the projects on a fixed cost turn keymode are required to achieve the targets of the BharatNirman Programme. (Details on the irrigation sectorare given in Chapter 2, Volume III.)
ROADS6.10 Rural connectivity is the key component ofrural development and poverty alleviation in India.Rural roads (RRs) provide accessibility for the ruralhabitations to market and other facility centres. Inorder to give a boost to rural connectivity, a rural roadsprogramme, Pradhan Mantri Gram Sadak Yojana(PMGSY) was launched as a 100% CSS in December2000.
6.11 The Bharat Nirman Programme envisages amassive scaling up in terms of habitation connectivitycoverage, construction targets, and financial invest-ment. To achieve the targets of the Programme, 146185km of RRs are proposed to be constructed to benefit66802 unconnected eligible habitations in the coun-try. It is also proposed to upgrade nearly 1.94 lakh kmof the existing RRs which are identified through routesof the core network. The physical progress under the
Bharat Nirman Program-me during its first two years,that is 2005–07 is given in Table 6.4.
6.12 The targets for new connectivity and up-gradation for the remaining two years, that is 2007–09are as under:
• New Connectivity:– Number of habitations to be covered under the
Bharat Nirman Programme upto 2009: 43638 km.– Length of the road: 95510 km.
• Upgradation:– Length of upgradation: 128067 km.
6.13 The main objective of the Eleventh Five Year Planis achieving the targets of the Bharat NirmanProgramme by 2009. However, the physical targets setunder the Bharat Nirman Programme till the endof 2008–09 are found to be beyond the capacity ofthe States. Therefore, the leftover targets of theProgramme for 2007–09 will be completed only by theend of the financial year 2009–10. In order to augmentfunding for meeting the targets of rural connectivityunder the Bharat Nirman Programme, it is proposedto borrow Rs 16500 crore from NABARD by leverag-ing the cess accruals. This would, however, entailsetting aside substantial amounts that would accruefrom cess from 2009–10 onwards for repayment ofthe NABARD loan. The outlay for Central sectorRRs for the Eleventh Plan is Rs 43251.07 crore at cur-rent price, excluding the borrowing from NABARD.(For a detailed write-up see Chapter 9, Volume III.)
DRINKING WATER6.14 The Bharat Nirman Programme envisages cov-ering the 55067 habitations not covered, covering theslipped back habitations from not covered to partially
TABLE 6.4Physical Progress of Bharat Nirman during 2005–07
Status 2005–06 2006–07 2005–07 Percentage
Target Achieved Target Achieved Target Achieved Achieved
New connectivity Length (in km) 15492.4 18053.7 35182.15 21422.85 50674.55 39476.55 77.90No. of habitations 7034 5552 16130 8279 23164 13831 59.71
Upgradation Length (in km) 11394.4 3925.6 54669.26 46129.90 66063.66 50055.50 75.77
Source: MoRD.

132 Eleventh Five Year Plan
covered status, and providing safe drinking water towater-quality-affected habitations. During the firsttwo and half years there was an impressive achieve-ment (63%) in covering the slipped back habitationsas they are relatively easier (involves restoring thedefunct bore pumps, carrying out repairs to watersupply pipelines, augmentation wherever required,etc.) to execute. The coverage of not covered habita-tions has also progressed well with 48% of the targetedhabitations being covered. However, there is a hugeshortfall in covering the water-quality-affected habi-tations in which only 5% coverage is achieved.
6.15 Sustainability of water supply has become thefocal point to avoid slipped back habitations. Conver-gence of various rural development programmes ofthe government (such as NREGP, BRGF, watersheddevelopment, restoration of water bodies, etc.) needto be vigorously pursued, supported by village-levelplanning. The issue of water quality has assumedserious proportions. While providing water supplyfrom surface water sources and the conjunctive use ofground water, surface water, and rooftop rainwaterharvesting would be ideal, in situ methods such asdilution of chemical contaminants through augmentedgroundwater recharge (aided through convergence ofprogrammes), adopting cost-effective scientific waterquality treatments on an individual village basis wouldgo a long way to improve coverage of water in thewater-quality-affected areas. (For a detailed discussionsee Chapter 5, Volume II.)
RURAL ELECTRIFICATION6.16 The rural electrification targets are set to beachieved under RGGVY. The twin objectives of elec-trification of 125000 villages and electrifying the2.3 crore BPL households are proposed to be achievedunder the Bharat Nirman Programme. During the firsttwo years, the progress under both the objectives hasregistered an achievement of 34% and 6%, respectively.There are major shortfalls in this sector. Clearly thereis a need for acceleration to achieve the target duringthe Eleventh Plan. Non-availability of electrificationmaterials due to sudden demand is also a contributingfactor for under achievement. Rural electrification as-sumes additional significance since enormous ground-water potential in eastern and north eastern parts
of the country could be tapped for MI development.Electrification should trigger economic activity forrural development. Fully operationalizing the franchi-see system for revenue collection and viable tariff arekey to sustaining the power supply in rural areas. (Fora detailed write-up see Chapter 10, Volume III.)
HOUSING6.17 The Bharat Nirman Programme has recognizedand accorded due priority to the need to end shelter-lessness. The programme has set a target to construct60 lakh houses from 2005 to 2009. In the first two yearsof the Bharat Nirman Programme, 28.69 lakh houseshave been constructed. The housing component underthe Programme is being implemented in parallel withIAY scheme. This scheme was launched as an indepen-dent and major housing scheme from 1 January 1996to provide assistance for construction upgradation ofdwelling units to the BPL rural households.
6.18 For the Eleventh Plan, the focus should be ontargeting the poorest of the poor while targeting theremaining housing shortage with other interventions.Housing shortage for 2001 stands at 148.6 lakh housesand for 2007 at 159.5 lakh houses. Hence a target ofconstructing about 150 lakh houses under IAY needsto be fixed for the Eleventh Plan. This translates intoan annual target of 30 lakh houses as against 15 lakhhouses being constructed under IAY presently. The perunit cost is also proposed to be revised from the presentlevel of Rs 25000 in the plain areas and Rs 27500 in thehilly and difficult areas. For more accurate targetingof beneficiaries, permanent IAY waitlists should beprepared on the basis of the scores given to families, aspart of BPL Census 2002. For this, the State Govern-ments need to be incentivized and Panchayats have tobe appropriately empowered. Houses built as part ofIAY should be with smokeless chulhas and sanitarylatrines. The title of the house site/ownership shouldbe in the name of female member of the household.While IAY can focus on eliminating the backlog ofhouselessness and temporary and unserviceable housesin rural India, the States should take responsibilityfor addressing any emerging needs. With the help ofcertain feasible interventions, the prime objective oftackling shelterlessness can be achieved within thestipulated time. (For details see Chapter 4, Volume III.)
Bharat Nirman and Flagship Programmes 133
RURAL TELEPHONY6.19 Under the Bharat Nirman Programme, 66822revenue villages not having telephone connectivity areto be provided with Village Public Telephone (VPT)facility. Out of these, 14183 remotely located villagesare to be provided VPTs through digital satellite phoneterminals, while the remaining 52639 villages are to beprovided any other technology. An estimated sum ofRs 451 crore is likely to be disbursed as subsidy sup-port towards these VPTs. The entire funding is to be metout of the Universal Service Obligation Fund (USOF).A total number of 48704 VPTs have been providedtelephone connectivity and 18118 VPTs are likely to beprovided by June 2008. It is important to improve thetele-density in rural areas and move to the next step ofmaking every village a knowledge centre with telecom-munication. For this high-speed Internet connectionproviding the necessary knowledge content relevant tothe villages for the benefit of all sections of the societyis required. (For details see Chapter 12, Volume III).
FLAGSHIP PROGRAMMES6.20 The thrust of the Eleventh Five Year Plan issocial inclusion coupled with provision of improvedlivelihood opportunities. This approach calls forrenewed emphasis on education, health, and other basicpublic facilities. Inadequate access to these essentialservices directly limits the welfare of large sections ofour population, and also denies them the opportunityto share fully in the growth process. Indeed, inadequateattention to human resource development limits thegrowth process itself. In the Tenth Plan, many schemeswere either launched or revamped and strengthenedto provide education, health care, nutrition, sanitation,and social security. Many of these programmes areimplemented on an all-India basis, while some areimplemented only in rural areas. Even the programmesthat are implemented across the country tend to favourrural and backward areas in terms of resource alloca-tion. These programmes, called flagship programmes,form the second strand for development of ruralareas, the first being the Bharat Nirman Programme.The following flagship programmes are discussed inthe ensuing paragraphs:
• NREGP.• NRHM.
• Integrated Child Development Services (ICDS).• Sarva Shiksha Abhiyan (SSA).• MDM.• TSC.• NSAP.• BRGF.
NATIONAL RURAL EMPLOYMENTGUARANTEE PROGRAMME (NREGP)6.21 The NREGA has been enacted to reinforce thecommitment towards livelihood security in ruralareas. The Act was notified on 7 September 2005. Thesignificance of NREGP lies in the fact that it createsa right-based framework for wage employmentprogrammes and makes the government legally boundto provide employment to those who seek it. TheNREGP marks a paradigm shift from the previous wageemployment programmes by providing a statutoryguarantee of wage employment and not being justa scheme. The objective of the NREGP is to enhancethe livelihood security of the people in the rural areasby guaranteeing 100 days of wage employment in afinancial year to a rural household whose membersvolunteer to do unskilled manual work. The Actfurther aims at creating durable assets and strength-ening the livelihood resource base of the rural poor.The choice of works suggested in the Act address causesof chronic poverty such as drought, deforestation,soil erosion, etc., so that the process of employmentgeneration is on a sustainable basis. The experiencewith NREGP so far suggests that it is one of the mainplanks of rapid poverty reduction in the Eleventh FiveYear Plan.
6.22 Starting with 200 districts across the countryin Phase-I during 2005–06, NREGA was extended toadditional 130 districts in Phase-II during 2007–08.From 1 April 2008 onwards, the Act will cover thewhole of rural area in the country. (For a detaileddiscussion see Chapter 4, Volume III.)
NATIONAL RURAL HEALTH MISSION (NRHM)6.23 The main aim of NRHM is to provide accessible,affordable, accountable, effective, and reliable primaryhealth care, especially to poor and vulnerable sectionsof the population. It also aims at bridging the gapin rural health care through creation of a cadre of

134 Eleventh Five Year Plan
accredited social health activists and improves hospi-tal care, decentralization of programme to district levelto improve intra- and inter-sectoral convergence,and effective utilization of resources. The programmesets standards for rural health care and providesfinancial resources to meet these standards. Theprogramme is under implementation in 18 Stateswhich have poor health infrastructure.
6.24 As per Rural Health Bulletin (2006), it is notedthat the number of sub-centres without regular watersupply, electric supply, and all-weather motorableapproach roads is very large in Bihar, Chhattisgarh,Maharashtra, Orissa, Uttar Pradesh, West Bengal,and other States. Similar position is noted regardingfacilities at primary health centres also. Out of the sixtasks to be completed under the Bharat NirmanProgramme in a time-bound manner, five (namelyelectricity, all-weather roads, safe drinking water,telephone, and rural housing) have direct impact onthe NRHM. (For details see Chapter 2, Volume II.)
INTEGRATED CHILD DEVELOPMENT SERVICES(ICDS)6.25 The ICDS scheme is a child-focused interventionto address the inter-related needs of young childrenand pregnant and lactating mothers. The ultimateobjective of the scheme is to reduce incidence ofmortality, morbidity, malnutrition, and school drop-outs and enhance the capability of the mother andfamily to look after the health, nutritional, and devel-opment needs of the child. It is now a nation-wideprogramme, which aims at promoting health andnutritional requirements of children up to six yearsand expectant and nursing mothers. As on 31 March2007, there are 6284 sanctioned projects and 10.53 lakhanganwadi centres in the country. Out of these, 5672projects are operational through 7.8 lakh anganwadicentres servicing 7.05 crore beneficiaries comprising5.81 crore children below six years and 1.23 crorepregnant and lactating mothers. The ICDS wouldbe one of the major programmes for achieving thefollowing goals:
• Raising the sex ratio of the girl child in the age groupof 0–6 years from 927 in 2001 to 935 by 2011–12and to 950 by 2016.
• Reducing IMR to 28 and maternal mortality ratioto 1 per 1000 live births.
• Reducing malnutrition among children of agegroup of 0–3 years to half its present level and ane-mia among women and girls by 50% by the end ofthe Eleventh Plan.(For a detailed discussion see Chapter 6, VolumeII.)
SARVA SHIKSHA ABHIYAN (SSA)6.26 SSA is the principal programme for universal-ization of elementary education. SSA aims to provideuseful and relevant elementary education for all chil-dren in the age group of 6–14 years by 2010. The othersignificant objective is to bridge social, regional, andgender gaps with the active participation of the com-munity in the management of schools, besides focus-ing on elementary education of satisfactory qualitywith emphasis on education for life. SSA addresses theneeds of about 20 crore children in more than 12.37lakh habitations covering 10.42 lakh existing primaryand upper primary schools (SES, 2004–05; MHRD,2007). SSA successfully ensured universal access toprimary education. About 94% of Indian villages/habitations have access to schools within a distance of1 km. In the remaining villages/habitations, alterna-tive schooling arrangements have been made throughEducation Guarantee Scheme (EGS) and Alternativeand Innovative Education (AIE) centres.
6.27 As a result of SSA interventions, between 2001–02 and 2004–05, total enrolment in primary classeshas increased from 11.39 crore to 13.08 crore (14.84%)and in upper primary classes from 4.48 crore to5.12 crore (14.29%). A remarkable feature has beenthe spurt in girls’ enrolment in the correspondingperiod, from 5.03 crore to 6.11 crore in primary classes(21.47%) and from 1.87 crore to 2.27 crore (21.39%)in upper primary classes. (For details see Chapter 1,Volume II.)
MID-DAY MEAL (MDM)6.28 The MDM Scheme launched in 1995 aims to givea boost to universalization of primary education byincreasing enrolment, retention, and attendance andsimultaneously impacting upon nutritional status ofstudents in primary classes. The Scheme was revised

Bharat Nirman and Flagship Programmes 135
in June 2006, provides for 450 calories, 12 gm of pro-tein, and adequate quantities of micronutrients suchas iron, folic acid, and vitamin A to the children. Thecooking cost has been enhanced to Rs 2.00 per childper school day. All the States and UTs are providingcooked meal to the children in primary classes. Thecoverage of school children under the programmehas risen to 12 crore in 9.5 lakh primary schools/EGScentres during 2006–07. With a proposed investmentof Rs 48000 crore in the Eleventh Plan period, MDMis to be expanded in the Eleventh Plan to upper pri-mary classes (VI–VIII) in 3479 educationally backwardblocks in 2007–08 and universalized at elementary levelby 2008–09. MDM will thus reach out to an additional3 crore children at upper primary stage reaching outto a total of about 15 crore children at primary andupper primary level in 2007–08 and about 18.0 crorechildren by 2008–09.
• The nutrition value of the MDM for upper primarychildren has been fixed as 700 calories, derivedfrom at least 150 gm of cereals and 20 gm of pro-tein, with Central assistance for cooking cost goingup to Rs 2.00 per child per school day (Re 0.50 fromthe States).
• Kitchen sheds to be built in 3.13 lakh primary and3.0 lakh upper primary schools at a rate of Rs 60000per unit, and kitchen devices to be provided at arate of Rs 5000 per school.
• The programme is to be managed and implementedby the local community and PRIs and would not becontractor-driven.
• School health programme to be revived and bestpractices replicated.(For details see Chapter 1, Volume II.)
NATIONAL SOCIAL ASSISTANCE PROGRAMME(NSAP)6.29 The NSAP is a flagship programme of thegovernment which aims to provide human securityto the poor and the destitute. The programme waslaunched on 15 August 1995 as a wholly Centrallyfunded program to give financial assistance to fami-lies with little or no regular means of subsistence,living below the poverty line. NSAP presently consistsof three components, namely, NOAPS, NFBS, andAnnapurna Scheme. These schemes continued to be
administered by the MoRD upto 2001–02 as CSS, un-til these schemes were transferred to Central assistancefor State plans in 2002–03. The details of each compo-nent have been explained in Chapter 4, Volume III onRural Poverty Reduction. Government of India hasrecently modified the criteria for grant of pensionunder NOAPS to all persons of 65 years or above andbelonging to a household below the poverty line.With this modification, the pension under NOAPSwhich was restricted to only destitutes will now beuniversalized and approximately 1.57 crore beneficia-ries will be covered against the present coverage ofaround 87 lakh.
6.30 During the Eleventh Plan it is proposed to ex-tend the NOAPS to all old people above the age of60 years (from the present 65 years) from amongthe BPL families with a minimum pension of Rs 400per month funded by the Centre and the States.The Annapurna Scheme, targeted at senior citizenswho remained uncovered under NOAPS, can be dis-continued soon after these beneficiaries are coveredunder the NOAPS. The Scheme will include personswith severe/multiple disabilities from BPL familiesand widows. The NFBS would continue during theEleventh Five Year Plan with the support enhancedfrom Rs 10000 to Rs 25000. This amount will besufficient for meeting the funeral charges and otherincidental expenditure. To ensure smooth implemen-tation and closer monitoring of the Scheme, advisorycommittees comprising professionals and voluntaryorganizations along with technical support groupsshould be set up at Central, State, and district levels.(For details see Chapter 4, Volume III.)
TOTAL SANITATION CAMPAIGN (TSC)6.31 Provision of sanitation facilities in rural areas hasbeen highly inadequate. Many programmes were ini-tiated in the past to expand coverage but with littlesuccess. In 1999, the DoDWS launched ‘Total Sanita-tion Campaign’ (TSC) which is a demand-responsive,community-oriented, low-subsidy programme in aproject mode. The performance of project mode TSCwas very satisfactory and, therefore, from 2002–03, theentire Central Rural Sanitation Programme has beenconverted into TSC. The objective of TSC was attain-ing 100% sanitation coverage in terms of household,

136 Eleventh Five Year Plan
schools, and anganwadi toilets and also providinghygiene education to the people.
6.32 The target of the Millennium Development Goalis to cover 50% rural sanitation by 2015. Under TSC,the target is to achieve 100% coverage by the end ofthe Eleventh Plan (2012). This programme also in-cludes funds for Nirmal Gram Puraskar which hashelped in accelerating the pace of implementation ofTSC since its inception in 2005. The approach ofthe Nirmal Gram Puraskar also helps in sustainabilityand maintenance of the sanitation programme. Theoutlay proposed for the Eleventh Plan is Rs 7816 crore(Rs 6910 crore at 2006–07 price). The allocationfor AP 2007–08 is Rs 1060 crore. The physical targetfor the Eleventh Plan is to cover 69 million households,25769 sanitary complexes, 133114 aganwadis, all theremaining schools (new schools will be covered underSSA) and Rural Sanitation Marts/Production Centres(figures will be finalized after the receipt of revisedproposals from the districts). (For details see Chapter5, Volume II.)
BACKWARD REGIONS GRANT FUND (BRGF)6.33 The BRGF has replaced the Rashtriya Sam VikasYojana (RSVY) in order to provide a more participa-tive approach through the involvement of PRIs.The spatial coverage was also expanded and it nowcovers 250 districts (RSVY covered 147 districts). The
scheme aims to help converge and add value to otherprogrammes such as the Bharat Nirman Programme,the NREGP, and other flagship programmes that areexplicitly designed to meet rural infrastructural needsbut that need supplementation to address critical gaps.It aims at catalysing development in backward areas by:(i) filling infrastructure gaps; (ii) promoting goodgovernance and agrarian reforms; (iii) converging,through supplementary infrastructure and capacitybuilding, the substantial existing development inflowsinto these districts.
6.34 The scheme has two components, namely,(i) the districts’ component covering 250 districtswhich will be anchored on a well conceived, participa-tory district plan with schemes selected throughpeoples’ participation for which PRIs from the villageupto the district level will be the authorities for plan-ning and implementation; and (ii) special plans forBihar and the KBK districts of Orissa. The specialplan for Bihar had been formulated, in consultationwith the State Government of Bihar, to bring aboutimprovement in sectors such as power, road connec-tivity, irrigation, forestry, and watershed development.The special plan for the KBK districts focuses ontackling the main problems of drought proofing,livelihood support, connectivity, health, education,etc., as per local priorities. (For details see Chapter 7,Volume II.)

IIIIndustry


7Industry
7.1 INDUSTRY INCLUDING SMALL ANDMEDIUM ENTERPRISES (SMEs)
INTRODUCTION7.1.1 The Tenth Plan target of 10% industrial growthhas not been met, but there was an acceleration in theindustrial growth rate during the Plan period andthe target was exceeded in the terminal year. TheCAGR rose from 4.5% in the Ninth Five Year Planto 8% in the Tenth Five Year Plan. Manufacturingshowed particular dynamism, the CAGR rising from3.8% in the Ninth Five Year Plan to 8.7% in the TenthFive Year Plan. The annual growth rate of manufac-turing rose consistently during the period, registering12.3% in 2006–07. For the first time in many years,industrial growth at 11% equalled the growth ratein services, with manufacturing outstripping both(Table 7.1.1).
7.1.2 The rising demand in both domestic and exter-nal markets was a major contributory factor but theimpressive performance of manufacturing was due inno small measure to the cumulative effect of indus-trial and fiscal policy changes carried out since theeconomic reforms of 1991–92. The competitive envi-ronment created by the reduction of external barriersto trade finally started to bear fruit. Against a CAGRof 6.3% in the Ninth Five Year Plan, exports of manu-factures registered a CAGR of more than 19% duringthe Tenth Five Year Plan.
7.1.3 Going by the marked improvement in the GCFin manufacturing and the quantum jump in thevalues shown in the Industrial Entrepreneurs’ Memo-randa (IEM) filed with the DIPP, a continuation ofthe high growth rates of manufacturing is highly likelyduring the Eleventh Five Year Plan (Annexure 7.1.1).
TABLE 7.1.1Growth Rates
CAGR in 2002–03 2003–04 2004–05 2005–06 2006–07 CAGR inNinth Plan (QE) (RE) Tenth Plan
GDP 5.5 3.8 8.5 7.5 9.0 9.4 7.6
Agriculture, forestry, and fishing 2.0 –7.2 10.0 0.0 6.0 2.7 2.1
Industry (manufacturing) 4.5 6.8 6.0 8.4 8.0 11.0 8.0
(3.8) (6.8) (6.6) (8.7) (9.1) (12.3) (8.7)
Services# 8.1 7.4 8.9 10.0 10.3 11.0 9.5
Note: # Construction is included in Services; QE = Quarterly Estimates. Figures in parentheses relate to manufacturing.Source: Central Statistical Organization.

140 Eleventh Five Year Plan
REVIEW OF THE TENTH PLAN7.1.4 During the Tenth Five Year Plan the sectoralshare of industry in the GDP started rising afterseveral years of decline. The share of manufacturingalso maintained a rising trend after falling in thefirst year of the Tenth Plan (Table 7.1.2).
TABLE 7.1.2Sectoral Share in GDP
(in %)
Agriculture, Industry ServicesForestry, and (Manu-
Fishing facturing)
2001–02 24.0 25.0 (14.8) 51.02002–03 21.5 25.8 (15.2) 52.72003–04 21.7 25.6 (15.0) 52.72004–05 20.2 26.1 (15.1) 53.72005–06 (QE) 19.7 26.2 (15.1) 54.12006–07 (RE) 18.5 26.6 (15.5) 54.9
Note: The data given here are not comparable with the data usedin the Ninth Five Year Plan and MTA Documents as the base yearhas been changed by CSO from 1993–94 to 1999–2000.Source: Press Note, 31 May 2007, National Accounts Statistics 2007,CSO.
Output of the Manufacturing Sector7.1.5 The Annual Survey of Industries (ASI) is thebasic source of data for the registered units and noreliable data are available for the unregistered ones. Inthis situation, the Central Statistics Organization(CSO) has been using the somewhat limited Indexof Industrial Production (IIP) to project growth ofboth the registered and the unregistered units at a two-digit level for manufacturing. The data from the IIPshows that manufacturing posted a CAGR of 8.82%during the Tenth Five Year Plan in terms of the output(Table 7.1.3).
7.1.6 Cotton textiles, textile products, paper andpaper products, basic metals and alloys, machineryand equipment, transport equipment, and othermanufacturing industries scored substantial increasesin the rate of growth, while beverages and tobacco aswell as chemicals and chemical products maintainedimpressive rates of growth. After recording negativegrowth in the first two years of the Plan period, cottontextiles made remarkable progress in the last three
years following the fiscal policy reforms in the 2004–05 Budget, which created a level playing field betweenthe small-scale and other industries. The performanceof the textile industries other than cotton was evenmore striking. The performance of the capital goodsindustry was another positive feature in view of theimplication it has about the increasing investment inmanufacturing. The production of metals surgedahead, with both steel and non-ferrous metals show-ing a good response to the worldwide buoyancy.Although paper and paper products showed goodoverall growth, the performance was uneven. Chemi-cal products were lifted by the accelerating growthin the export of pharmaceutical products. Anothermajor industry that seems to be on a high growth pathis automobiles and auto products, in which both domestic and export demand have been picking up. Thethree areas that showed negative growth are jutetextiles, wood and wood products, and leather andleather products. In leather the negative growth in2002–03, 2003–04, and 2005–06 is not consistent withthe export data which show substantial increases inthose years. The anomaly in data is due to fact thatthere is less than full coverage of the enterprises en-gaged in manufacturing in this sector in the collectionof production data by the DIPP.
Capital Formation7.1.7 After having reached a high of 13.53% in 1995–96, the rate of GCF in manufacturing as a percentageof GDP at market price showed a declining trend, bot-toming out in the terminal year of the Ninth Plan. TheTenth Five Year Plan period saw a striking reversal oftrend from the outset and in 2005–06 it had increasedto 13.6%. Registered manufacturing showed a higherlevel of GCF rising from 3.8% in 2001–02 to 10.4% in2005–06 (Table 7.1.4).
Industrial Investment Intentions7.1.8 The optimistic outlook about future investmentin manufacturing also emerges from the industrialinvestment intentions, as reflected in IEM, Letters ofIntent (LOI), and Direct Industrial Licenses (DIL).There was a significant increase particularly between2005 and 2006 in the value of proposed investment(Annexure 7.1.1).

Industry 141
TABLE 7.1.4Gross Capital Formation and Capital Formation in Manufacturing
Year Capital Formation as % of GDP Capital Formation in Registered(at Market Price) and Unregistered Manufacturing
as % of Respective GVA@
GDCF# at Manufacturing Registered Unregistered Registered UnregisteredCurrent Price GCF& Manufacturing Manufacturing
1999–2000 25.9 8.9 7.0 2.0 78.5 42.0
2000–01 24.3 6.9 4.6 2.4 48.0 49.5
2001–02 22.9 5.0 3.8 1.2 40.5 27.9
2002–03 25.2 7.1 4.9 2.3 51.0 50.2
2003–04 28.0 8.4 5.4 3.0 56.6 67.1
2004–05 31.5 11.6 8.1 3.4 81.4 76.2
2005–06 (P) 33.8 13.6 10.4 3.2 102.5 72.2
Note: @ Gross Value Added (GVA), #Gross Domestic Capital Formation (GDCF), & Gross Capital Formation (GCF).Source: Central Statistical Organization.
TABLE 7.1.3Trends in the Performance of Industrial Sub-Sectors— Annual Growth Rate
(in %)
Ind- Industry Weight CAGR 2001–02 2002–03 2003–04 2004–05 2005–06 2006–07 CAGRustry Name in IIP 1997–2002 2002–07Code
20–21 Food products 9.08 2.49 –1.68 11.0 –0.5 –0.4 2.0 8.7 4.05
22 Beverages and tobacco 2.38 11.17 12.18 27.9 8.5 10.8 15.7 11.3 14.67
23 Cotton textiles 5.52 0.29 –2.20 –2.7 –3.1 7.6 8.5 14.8 4.79
24 Wool, silk, and man-madefibre textiles (except cotton) 2.26 8.53 4.40 3.0 6.8 3.5 0.0 8.1 4.25
25 Jute textiles 0.59 0.37 –5.86 8.3 –4.2 3.7 0.5 –15.8 –1.85
26 Textile products 2.54 2.60 2.40 14.4 –3.2 19.2 16.3 11.5 11.38
27 Wood and wood products 2.70 –6.79 –11.03 –17.6 6.8 –8.4 –5.7 29.1 –0.39
28 Paper and paper products 2.65 4.29 2.99 6.8 15.6 10.5 –0.9 8.4 7.95
29 Leather and fur products 1.14 8.07 5.93 –3.2 –3.9 6.7 –4.8 0.4 –1.05
30 Chemical and chemicalproducts 14.00 8.56 4.76 3.7 8.7 14.5 8.3 9.4 8.86
31 Rubber, plastic, petroleum 5.73 7.55 11.08 5.5 4.5 2.4 4.3 12.7 5.81
32 Non-metallic mineralproducts 4.39 8.89 1.37 5.1 3.7 1.5 11.0 12.9 6.75
33 Basic metals and alloys 7.45 2.16 4.01 9.2 9.2 5.4 15.8 22.9 12.32
34 Metal products and parts 2.81 5.34 –9.59 6.4 3.7 5.7 –1.1 11.4 5.14
35–36 Machinery and equipment 9.57 6.51 1.02 1.6 15.8 19.8 12.0 14.2 12.48
37 Transport equipment 3.98 6.40 6.83 14.6 17.0 4.1 12.7 15.0 12.58
38 Other manufacturingindustries 2.56 0.35 8.86 0.1 7.7 18.5 25.2 7.7 11.49Manufacturing 79.36 5.27 2.86 6.0 7.4 9.2 9.1 12.5 8.82
Source: Central Statistical Organization.

142 Eleventh Five Year Plan
7.1.9 The data on capital investments compiled by theRBI on the basis of the envisaged capital expenditureof companies that have been sanctioned assistanceby the banks and the financial institutions during2004–05, 2005–06, and 2006–07 reinforce the pictureof increasing investment in the pipeline in the indus-try and some other sectors (Annexure 7.1.2).
7.1.10 In the last three years of the Tenth Five YearPlan, the investment in projects in the pipeline roserapidly, not only in power, petroleum products, metaland metal products, textiles and cement but also insugar, chemical and petrochemical products, electri-cal and non-electrical machinery, transport equip-ment, and construction.
Exports of Manufactured Products7.1.11 A major feature of the performance of indus-try was the remarkable increase in the export share ofmanufacturing sustained during the entire Plan period.Against a CAGR of 6.3% achieved during the NinthPlan, exports of manufactured products had a CAGRof 19.9% during the Tenth Five Year Plan (Annexure7.1.3).
7.1.12 The export of engineering goods recordedthe highest CAGR of 33.1% mainly on the basis of the
increase in auto and auto components; the export ofbasic chemicals was not very far behind, with CAGRof 23.1% due to the growth recorded in pharmaceuti-cals. Among traditional products, textiles andreadymade garments responded well to the disman-tling of quotas that had restricted imports to themajor developed economies until 1 January 2005, andgems and jewellery bettered the performance duringthe Tenth Plan. The share of manufactures in worldexports also inched up.
Share in World Trade7.1.13 Despite the recent impressive growth in exports,textiles and clothing, iron and steel, and chemical prod-ucts are the only products in which India’s share was1% or more of the world exports in 2005. Takingmanufactures as a whole, India’s share in the worldtrade of manufactures is close to 1%. Apart from China,which has become the manufacturing powerhouse ofthe world, six developing countries and customsterritories have a larger share in world exports ofmanufactured products (Figure 7.1.1).
7.1.14 The comparatively low share of India in theworld export of manufacturers is reflected in its lowshare of manufacturing value added in GDP comparedto countries in South East and East Asia [15.9% of
Source: International Trade Statistics, WTO.
FIGURE 7.1.1: Share in World Exports of Manufactured Goods

Industry 143
India against China (34.5%) in year 2000, Thailand(34.5%), and Malaysia (31.4%)].
Creation of Jobs in Manufacturing7.1.15 The performance of the organized manufac-turing sector continued to be a source of concern.There was a massive decline in employment in thepublic sector following the rationalization of staffingin some units and closure of the sick units. In the earlypost-reform years, the increase in private sector em-ployment made good the decline in the public sector;however, the early years of the Tenth Five Year Plansaw a decline in the private sector employment as well,causing an absolute decline by as much as 5.40 lakhemployees (Table 7.1.5).
7.1.16 The grim scenario reflected by the above datahas, however, been considerably brightened by the re-lease of findings of the Fifth Economic Census andthe 61st Round of the NSS. Both the surveys foundthat accelerating output growth has been accompa-nied by the faster rate of job growth. The FifthEconomic Census has found that the employment ineconomic activities other than crop production andplantations increased by 2.49% annually between1998 and 2005 (against the annual increase of 5%in workforce). Data from the latest NSS round for2004–05 suggests that the non-agricultural employ-ment expanded strongly at the annual rate of 4.7%during 1999–2005. Obviously this growth has comeentirely from the unorganized sector in manufactur-ing and services, which accounts for about 71.6% of
all non-agricultural workers in the unorganizedsector. The slow growth of regular jobs and the inten-sification of duality in labour markets (formal versusinformal) has become a serious issue.
INVESTMENT CLIMATE7.1.17 A number of favourable factors have helped toimprove the investment climate for the industry andto create considerable optimism on the manufactur-ing front. India maintained an upward climb in theglobal competitiveness indices drawn up by reputedbodies and business confidence was high at the end ofthe Tenth Five Year Plan.
Elimination of Entry Barriers7.1.18 Entry barriers adversely affect the investmentclimate of the State. One of the determinants of theinvestment climate for an industry is the ease withwhich the firms are able to enter into the business ac-tivities. Doing Business 2007: How to Reform—a co-publication of the World Bank and the InternationalFinance Corporation (2007) shows that the averagetime spent in completing entry requirement in Indiais 35 days and the number of procedures is 11 com-pared to 35 days and 13 numbers of procedures inChina. Figure 7.1.2 illustrates this point.
7.1.19 Industrial licensing had already been substan-tially dismantled and during the Tenth Five Year Planperiod further measures were taken to pare it down.Drugs and pharmaceuticals including biotechnologywere delicensed in 2005. At the end of the Tenth Five
TABLE 7.1.5Employment in Organized Manufacturing
(in Lakh)
Manufacturing Manufacturing Total Employment Employment Total(Private Sector) (Public Sector) Employment in (in Public (in Private Employment
Manufacturing Sector Sector OrganizedIndustry) Industry) Sector
1991 44.81 18.52 63.33 190.57 76.77 267.341996 50.49 17.38 67.87 194.29 85.12 279.412000 50.85 15.31 66.16 193.14 86.46 279.602001 50.13 14.30 64.33 191.38 86.52 277.892002 48.68 13.50 62.18 187.73 84.32 272.062003 47.44 12.60 60.04 185.80 84.21 270.002004 44.89 11.89 56.78 181.97 82.46 264.43
Source: Economic Survey, 2006–07.

144 Eleventh Five Year Plan
Year Plan period only the following manufacturingactivities needed industrial license:
• distillation and brewing of alcoholic drinks;• cigars and cigarettes of tobacco and manufactured
tobacco substitutes;• electronic aerospace and defence equipment;• industrial explosives;• specified hazardous chemicals.
7.1.20 Entrepreneurs are free to select the locationfor setting up industry. Approval is required from
the government for locating an industrial unit within25 km of the periphery of cities having a populationof more than one million according to the 1991census, provided that is not within an industrialarea designated before 24 July 1991. However, theselocational restrictions are not applicable for electron-ics, computer software, printing industries, and othernon-polluting industries that may be designatedfrom time to time.
7.1.21 Apart from the licensing restrictions, thereare some restrictions arising from certain industries
Source: Unleashing India’s Innovation: Toward Sustainable and Inclusive Growth, Mark A. Dutz,World Bank Publication, 2007.
FIGURE 7.1.2: Starting a Business—Time, and Procedures

Industry 145
reserved for the public sector and for the small-scalesector. Reservation for the public sector is now verylimited, covering only manufacturing involving cer-tain substances relevant for atomic energy (as well asproduction of atomic energy and provision of railwaytransport). The list of items reserved for SSIs has beenreduced to 114. Larger units are allowed to manufac-ture items reserved for the small-scale sector only ifthey undertake an export obligation of 50% of theirindustrial production.
7.1.22 The Foreign Direct Investment (FDI) policy wasalso successively liberalized during the Tenth Five YearPlan. Following a comprehensive review in 2006 it wasfurther liberalized, particularly by allowing FDI un-der the automatic route for manufacture of industrialexplosives and hazardous chemicals and making iteasier for new investments by foreign investors whohad entered into joint ventures with Indian partnersearlier. At the end of the Plan period, FDI upto 100%was permitted in all manufacturing activities exceptwhere the foreign investor had an existing joint ven-ture/technical collaboration/trademark agreement inthe same field of activity.
7.1.23 There are caps on the foreign equity in certainservice sectors, viz., 20% on FM radio broadcasting;26% on insurance, defence production, print andelectronic media covering news and current affairs;49% on air transport services, asset reconstructioncompanies, cable network, direct to home (DTH),hardware for uplinking, HUB, etc.; 51% on single
brand retailing of products; and 74% on atomic min-erals, private sector banking, telecom services, and theestablishment and operation of satellites. FDI is evenprohibited in a few other services, viz., retail trading(except single brand product retailing), gambling andbetting, lottery, and atomic energy. However, there isno foreign equity cap on any manufacturing activityother than in public sector undertakings (PSUs) forpetroleum refining.
Elimination of Exit Barriers7.1.24 Investment climate in the country is also af-fected by the exit barriers. Perhaps the most impor-tant exit barrier relates to Chapter V-B of the IndustrialDisputes Act 1947 under which units with more than100 employees cannot exit an unprofitable enterprisewithout the consent of the concerned State Govern-ment. This consent is often difficult and time consum-ing to obtain.
7.1.25 The other important exit barrier to the indus-tries in India is the legal provision relating to insol-vency, rehabilitation, liquidation, and winding upproceedings, which need to be simplified and be madetime bound. The co-publication of the World Bankand the International Finance Corporation (2007)reports that resolving the insolvency cases takes upto10 years in India against 2.4 years in China, 1.5 yearsin South Korea, and 3 years in the US. Similarly, therecovery rate of closing business is 13% in India com-pared to 82% in South Korea. Figure 7.1.3 illustratesthis point.
Source: Unleashing India’s Innovation: Toward Sustainable and Inclusive Growth, Mark A. Dutz, World Bank Publication, 2007.
FIGURE 7.1.3: Closing a Business—Time, and Recovery Rate

146 Eleventh Five Year Plan
7.1.26 A comprehensive draft of the new CompaniesBill 2007 has been proposed by the Ministry of Cor-porate Affairs (MCA) to simplify the rules and proce-dures and to set up a quasi judicial fora such as theNational Company Law Tribunal and the NationalCompany Law Appellate Tribunal to deal with casesrelating to insolvency, rehabilitation, liquidation,and winding up proceedings, taking over the relatedfunctions of Company Law Board, Bureau of Indus-trial and Financial Reconstruction (BIFR), and thejudiciary in this respect. The actual setting up of suchbodies can be done on the basis of the decision in arelated matter pending before the Constitution Benchof the Supreme Court.
7.1.27 A major initiative taken during the Tenth FiveYear Plan period, which would help to alleviate entrybarriers, was the introduction of MCA 21 e-GovernanceProject’ to computerize and speed up the process ofregistration of companies. The decision to introducelegislation for limited liability partnerships was anotherstep forward.
Liberalization of Trade7.1.28 Quantitative restrictions on trade had alreadybeen progressively eliminated before the Tenth FiveYear Plan period and import tariffs on non-agricul-tural products drastically reduced after the introduc-tion of economic reforms in 1991–92. The process wascarried forward strongly and peak tariffs on non-agricultural products were brought down from 30%in 2002–03 to 10% in the Union Budget for 2007–08,although there are some exceptions. The liberalizationof trade was one of the factors contributing to theimpressive increase in manufacturing value added andincrease in the GCF in manufacturing.
Rising Domestic Demand7.1.29 India’s growing competitiveness in skill-inten-sive segments such as auto components, fine chemi-cals, and pharmaceuticals is an important recentdevelopment. The sustained increase in merchandiseexports at a rate above 20% over the last few years hasestablished India’s export competitiveness over a widerange of manufactured products. However, the futuregrowth of India’s manufacturing (as of services) willbe stimulated increasingly by the domestic consumer
demand. The research carried out by the NationalCouncil for Applied Economic Research (NCAER)(The Great Indian Middle Class: Results from theNCAER Market Survey of Households, NCAER inassociation with Business Standards, 2004) andMcKinsey (The ‘Bird of Gold’: the Rise of India’sConsumer Market, Mckinsey & Company, 2007) hasbrought out that the number of households with anincome above Rs 2 lakh will rise from 14.4 millionhouseholds in 2005 to 63.9 million in 2015 and 137.5million in 2025. The aggregate disposable income inthe hands of this class will rise by about four-fold by2015 and more than 10-fold by 2025. Another factorinfluencing consumer demand will be the changingdemographic profile of the country resulting in a dropin the dependency ratio from 60% in 2005 to 52% in2015 and 48% in 2025. By 2025, India is expected tobecome the fifth largest market in the world, overtak-ing Germany’s consumer market. ‘Rising incomeswill lift 291 million out of poverty and create a 583million-strong middle class’ (Mckinsey).
THE ELEVENTH PLAN PERSPECTIVE ON INDUSTRY7.1.30 In order to achieve an average growth rate of9% per annum in GDP during the Eleventh Plan, ithas been projected that, individually, industry andmanufacturing will have to grow at an average annualrate of 9.8%. However, if a number of issues are ad-dressed as discussed below and particularly the plansfor improvement of infrastructure (power and trans-port) fructify in full measure, and the recommendedpolicies on mining (para 7.2.60) and construction(para 8.1.6) are implemented, a substantially higherindustrial growth rate can be achieved. The NationalManufacturing Competitiveness Council (NMCC)has, infact, suggested a growth rate of at least 12%–14% per annum for manufacturing. Various issuesrequiring urgent attention are discussed as under:
ISSUES IN INDUSTRIAL GROWTH
World-class Infrastructure7.1.31 Investment in physical infrastructure was in-tensified during the Tenth Five Year Plan, and in otherchapters we describe the investment plans and poli-cies being adopted for the Eleventh Five Year Plan.However, despite substantial progress, the quality of

Industry 147
infrastructure remained many notches below worldclass at the end of the Tenth Five Year Plan. Problemsrelated to the availability and quality of electric poweras well as roads, railways, ports, and airports have beenhighlighted in Chapter 1 of Volume I along with theoutline of the new strategies adopted in the EleventhPlan to tackle these problems.
Taxation7.1.32 Tax policy is a very important determinant ofthe investment climate. The rates of direct taxes deter-mine the structure of incentives to work, save, and in-vest, while the level and structure of indirect taxesinfluences the aggregate demand and thus the scale ofoperations on the one hand and relative prices of dif-ferent goods and services on the other. Concerted ef-forts to simplify the tax system, moderate the rates oftax, and avoid cascading of taxes, which intensifiedsince the 1991–92 reforms and were continued duringthe Tenth Five Year Plan, have improved the invest-ment climate. But more needs to done.
DIRECT TAXES7.1.33 The rate of Corporate Tax has been broughtdown to a level of 30%, which with surcharge and cessamounts to a maximum marginal rate of 33.99%.However, analysis has brought out two features of thedirect taxation in the country arising from the regimeof exemptions. First, the average effective rate of Cor-porate Tax paid in 2005–06 was 17% or about half ofthe statutory rate. Second, the range of incidence var-ied from 11.7% to 32.5%.
7.1.34 Different effective rates of direct taxes can causemisallocation of resources. Capital investment shouldbe driven by efficiency considerations rather thanby tax advantage. Withdrawal of industry-specificconcessions will make it possible to consider the in-troduction of a flat rate without any exemptions.The desirability of a flat rate stems from the fact thatit promises to introduce transparency and equity intaxation of different economic activities, reduces theincentive to evade or avoid tax, and minimizesthe use of discretion of tax authorities (regardingeligibility for concessions). The Kelkar Task Forceon direct taxes had recommended a similar regime ofCorporate Tax at 25%.
INDIRECT TAXES7.1.35 In indirect taxes great progress was made dur-ing the Tenth Five Year Plan in reducing the cascadingeffect of indirect taxes by the adoption of State VAT byalmost all the States and UTs. However, the rates ofindirect taxes in India remain among the highest inthe world. Most industrial products are subject toCentral value-added tax (CENVAT) on the manufac-tured value, at an average of 16% and a State VAT ata modal rate of 12.5% of retail value (though there area number of goods that are exempt from State VATand some are subject to lower rates of tax). At presentthe incidence of CENVAT and State VAT together isabout 23%. In addition, States and local levels ofgovernment levy such taxes as octroi or entry tax,etc. The overall rate of indirect taxes compareunfavourably with those prevailing in Association ofSouth-East Asian Nations countries, which are closerto 10%–12%.
7.1.36 High taxes raise the final price of products, re-ducing demand for specific products and dampeningaggregate demand. Lower taxes lead to an increase inthe aggregate demand, providing long-lasting incen-tive to investment, simultaneously increasing employ-ment and incomes. If the buoyancy in tax collectionseen in the recent years continues, it will provide anopportunity for making a beginning toward thegradual reduction of the combined incidence ofCENVAT and State VAT.
INVERTED DUTY STRUCTURE7.1.37 The customs duty in India on non-agriculturalproducts has come down drastically since 1991–92, andduring the past five years the peak duties (except for ahandful of products) have fallen from 30% to 10% advalorem (as on 1 March 2007). The vast majority ofmanufacturing industries have withstood increasedcompetition from imports arising from the loweringof customs duties. However, what is affecting themadversely is the inverted duty structure arising fromelimination or reduction of duty on value-added prod-ucts, while higher duties apply on the raw material andintermediate products. In some cases, inverted dutiesare embedded in the Most-Favoured-Nation duties, asin the cases of Information Technology (IT) productsand books. Although under the obligations of the
148 Eleventh Five Year Plan
Information Technology Agreement, basic customsduty has been eliminated from almost all IT productsincluding intermediate products, some basic raw ma-terials that go into the production of these productsstill attract varying levels of customs duty. Similarly,paper is subject to excise duty (and when imported itis subject also to import duty), but import of printedbooks does not attract any basic customs duty or ad-ditional customs duty imposed in lieu of excise. Theincidence of inverted duty structure has been consid-erably increased by the Regional Trading Arrangements(RTAs) that India has entered into, and exacerbatedby selective preferences implemented at the outsetthrough Early Harvest Lists. While measures have beentaken to alleviate the problem of inverted duty struc-ture arising from RTAs through specific interventions,more needs to be done.
7.1.38 It is also important to safeguard the domesticindustry from possible disruption as a result of imple-mentation of several free trade agreements (FTAs), thenegotiations for which are in an advanced State withsome of world’s leading trading countries. Efficiencyin manufacturing, in particular, is a function of thequality of physical infrastructure and of skill develop-ment, and our infrastructure, both social and physical,is at present not of world class. It is necessary to raisethe level of education and skills and to improve powerand transport infrastructure in the country even as weenter into FTAs, as otherwise there would be flight ofcapital from the country to the trading partners withsuperior infrastructure and level of skills. Furthermore,a level playing field must be created on the fiscal side.In order to ensure that our industries do not suffer adisadvantage in an FTA, the introduction of Goods andService Tax (GST) must be firmly on course. There mustbe an understanding also on the exchange rate policyas well before we can have a soundly functioning FTA,because a market driven exchange rate policy in onepartner country cannot co-exist with a substantiallycontrolled exchange rate policy in another. These fun-damental aspects need to be attended to first before themajor FTAs, which we are negotiating, enter into force.
GOODS AND SERVICES TAX7.1.39 Non-discretionary application of uniformtaxes to all economic activities is among the most
important desiderata of a tax system. The introduc-tion of an integrated GST would go a long way in meet-ing this objective. The Report of the (Kelkar) Task Forceon Implementation of the Fiscal Responsibility andBudget Management Act 2003 recommended theintroduction of the GST. The government has agreedto introduce the GST and has set 2010 as the targetyear for its introduction. To prepare for this, it hasalso begun a phased reduction of Central Sales Tax(CST) to zero by 2010. This is because CST, which isan origin-based tax, is inconsistent with VAT, whichare destination based—the two should not co-exist.As revenue from CST was transferred to the states, theyare to be compensated by being given the right to levyservice tax on certain commodities. A Group of StateFinance Ministers has been constituted to work onthe modalities for the introduction of GST on linessimilar to the group that had been set up for the intro-duction of State VAT.
7.1.40 Once the integrated GST across the countryis introduced, it will simplify tax administrationand eliminate cascading of taxes. It will lead to a re-duction in the distortions in the structure of produc-tion, consumption, and exports and further to amore efficient allocation of the resources. The demandfor manufactured goods can be expected to growsignificantly.
Structural Change in Manufacturing Sector7.1.41 Review of data from the ASI, which covers allfactories registered under Factories Act 1948, revealsthat by 2004–05 a substantial change in the sharesof different sectors of manufacturing had occurredsince 1990–91. After accounting for the change inclassification from National Industrial Classification(NIC) 87 prevalent in 1990–91 to NIC 2004 basedon which the index of industrial production iscomputed in 2004–05, the main changes seen areincreases in the shares of chemical and chemicalproducts from 8.42% to 16.4% and basic metalsand alloys industry from 12.9% to 19%, and reduc-tions in the shares of machinery, machine tool, andelectrical machinery (NIC 35–36) from 16.14% to 10%and of textile and textile products including apparelfrom 14.37% to 7.3%. Transport equipment and partsregistered a small increase from 8.3% to 9.5% while

Industry 149
food, beverages, and tobacco showed a decline from11.9% to 8.8%.
7.1.42 The capital intensity of the manufacturing sec-tor in terms of fixed capital per employee has increasedat a CAGR of about 6.5% since 1990–91 at constantprices. Increase in outsourcing in manufacturingsegment might have inflated the increase in capitalintensity. The fixed capital to net value-added ratiodecreased from 2.53 in 1980–81 to 1.85 in 1990–91before rising marginally to 1.97 in 2004–05. The seg-ments where capital intensity has increased are paper,basic metals, and non-metallic minerals and even largeemployment-generating sectors such as textile andfood processing.
7.1.43 A recent study on India’s pattern of develop-ment by Kalpana Kochhar et al.1 has noted that ‘Theparadox of Indian manufacturing in the early 1980s isthat a labor-rich, capital-poor economy using too littleof the former, and using the latter very inefficiently’. Ithas further observed that little has changed sincethe economic reforms on account of the fact thatthe labour markets have not been touched and theeducation expenditure continues to be skewed towardtertiary education. If the structure of Indian industryis to be adapted to the factor endowments of the coun-try, it is evident that the impediments in the way oflabour-intensive industries must be removed and,while not relenting on the expenditure on higher edu-cation, emphasis must be also put on skill develop-ment for making the workforce employable in suchindustries.
Skill Development7.1.44 A skill deficit in virtually all areas of manufac-turing has emerged as one of the major impedimentsto growth in manufacturing. All areas of manufactur-ing are affected but the more dynamic areas suchas pharmaceuticals, automobiles and auto parts, tex-tiles and clothing, leather and leather manufacturesare affected more severely. And the shortages are at alllevels, from executives and designers at the top to thebase level skilled workers such as tailors and machine
operators. The shortage has led to a serious problemof poaching of skilled personnel being experienced byestablished industrial units.
7.1.45 Skills and knowledge are the driving force ofthe economic growth and social development ofthe country. Development of skills and knowledgeis basic to enhancing employment opportunitiesand a comprehensive strategy to address this problemin the Eleventh Plan is outlined in Chapter 4 ofVolume I.
Labour Flexibility7.1.46 We need to recognize three influences thatcould work on firm behaviour in organized manufac-turing in the future. First, in order to meet the pres-sures of increased competition resulting from globalintegration, firms have a need to build flexibilityinto their organizational structure, so that they canadjust to volatility in the international demand for theirproducts. Enterprises are increasingly focusing on theircore competence and outsourcing all other activitiesto specialist organizations, which can deliver better andat lower cost.
7.1.47 Second, the lack of flexibility in some of thelabour laws, such as Chapter V-B of the IndustrialDisputes Act 1947, and Contact Labour (Regulationand Abolition Act), which focus on job protection,inhibits employment. In the MTA it was recognizedthat these laws make it difficult for employers to flex-ibly respond to the changes in demand when neces-sary and have the net effect of discouraging the growthof strong labour absorbing sectors. It must be acknowl-edged here that the aforementioned provisions ofthe Industrial Dispute (ID) Act 1947 has not provedto be a major obstacle in downsizing by several manu-facturing enterprises during the past few years withthe aid of generous packages for voluntary retirement.Furthermore, in the context of severe shortages ofskilled personnel being experienced by existing manu-facturing enterprises, the need to reduce staff is not acurrent problem for many labour-intensive enterprises.Similarly, despite the provisions of the Contract Labour
1 India’s Pattern of Development: What Happened, What Follows, Kalpana Kochhar, Utsav Kumar, Raghuram Rajan, ArvindSubramanian, and Ioannis Tokatlidis, Working Paper 12023, National Bureau of Economic Research, Cambridge, February 2006.

150 Eleventh Five Year Plan
(Regulation and Abolition) Act, the scope of prohibi-tions issued under Section 10 of the Act has not beenvery wide, being limited to specific processes, opera-tion, or other work in particular establishments. How-ever, Chapter V-B of the ID Act 1947 does create apsychological block in entrepreneurs against establish-ing new enterprises with a large workforce andimpede attainment of economies of scale. As a result,firms prefer to set up enterprises with a smaller per-manent workforce, and these enterprises are unableto cope with large size orders from retail market chainsin garments and footwear for instance. Similarly theContract (Regulation and Abolition) Act constrainsseasonal employment because of the fear that workdone by employees recruited to meet the temporaryor seasonal demand would be declared to be work ofperennial nature.
7.1.48 Third, while several fiscal incentives for corpo-rate investment encourage capital, only one relatesto labour use, and that too is of little practical value.This induces enterprises to give preference to capital-intensive over labour-intensive technology.
7.1.49 We have seen earlier that, according to theEconomic Survey, employment in the organized manu-facturing sector was on the decline up to 2004. The61st Round (2004–05) NSS data has revealed that inmanufacturing, employment growth was 3.9% perannum, raising the sectoral share of manufacturing inemployment from 12.13% in 1999–2000 to 12.90%in 2004–05. The latest NSSO data implies that theincrease in the manufacturing employment hascome from the unorganized sector. The quality ofemployment in the unorganized sector is poor andthe NSSO 61st Round shows that large numbers ofsuch workers do not have written job contracts as wellas are not eligible for paid leave and social securitybenefits. The need is to bring about an increase inquality employment, which only either the organizedsector or the MSME’s hiring workers on wage con-tract can provide. For this reason, it is necessary toconsider during the Eleventh Five Year Plan practicalways of resolving the difficulties created by theselaws. In addition, fiscal benefits related to employ-ment objectives will have to be carefully designed andimplemented.
Scarcity of Raw Materials7.1.50 Scarcity of raw materials, feedstock, and fuelsis another impediment limiting the growth of someindustries. Coal, natural gas, and forestry resources arethe main materials in short supply.
COAL7.1.51 A number of industries, including steel and ce-ment (which are essential inputs for buildinginfrastructure) and electricity generation, use coal asthe basic fuel in their production process. Adequateavailability of the required grades of coal needs tobe ensured for them if their supply is not to prove anobstacle to growth.
7.1.52 Since the nationalization of coal mines, the in-vestment in coal mining for commercial sale has beendetermined by the availability of financial resourceswith Coal India Ltd. Only owners of captive coal minescould undertake production according to their de-mand perceptions. All other users have had to relyon the coal-linkage committee to allocate whatevercoal was available in an equitable manner. The coal-linkage committee classified coal consumers as coreand non-core. Initially the core sector included powerutilities, independent power producers, cement,defence, railways, fertilizer, sponge iron, and steelplants. Subsequently, in 2004, aluminum, paper,Central public sector enterprises (CPSEs), and coal forexport were also included in the core sector.
7.1.53 India has large reserves of coal, and there isa need to utilize coal in an optimal manner. As thepublic sector coal mining companies have, for variousreasons, not increased their output to the desired level,there is a need to supplement their efforts by privateparticipation in coal mining for merchant sale. Theavailability of adequate quantity of coal is as impor-tant as, and a pre-condition for, the availability ofelectric power, which is a basic requirement of growth.
7.1.54 Improvement in availability can come onlywhen it is possible to increase production so that theneed for coal linkages and allocation by governmentcommittees can be minimized. Until that becomespossible, merchant sales should be allowed not only tonew players but also to captive mine owners.

Industry 151
FERTILIZER FEEDSTOCK/NATURAL GAS7.1.55 The increased emphasis on the agriculture sec-tor and agricultural productivity requires that all theinputs for agricultural production are made availablein adequate measure and at affordable prices. One ofthe most important inputs for the agricultural pro-duction is fertilizer. The government recognizes thisand has been providing fertilizer subsidy.
7.1.56 Urea is the most widely used fertilizer and theideal feedstock for it is natural gas. Many urea unitsare producing urea using uneconomic feedstock suchas naphtha and diesel oil. A decision has now beentaken, in principle, to convert all these units into gas-based units. Assured supply of natural gas for the pro-duction of urea, the sources of supply, and the price atwhich such supplies would be made are unresolvedissues. The most efficient use of gas is in the produc-tion of fertilizer (urea) that utilizes this as a feedstockusing both its heat value and the chemical components.Therefore, the sectors where gas is utilized as feedstockshould have priority in terms of allocation.
7.1.57 A lot of offshore gas has been discovered in theKrishna–Godavari (K–G) basin in fields allocated un-der the New Exploration Licensing Policy (NELP).There is a production sharing agreement in the NELP,according to which the government is entitled to anagreed share of the profit. One option that is oftensuggested is for the Central Government to providegas from its share in the production sharing agreementto the urea-producing units. However, even when takenin kind it will be available in significant amount onlyafter five to seven years of the start of production ofgas. In any case, whether the government gives gas at asubsidized price or gives a subsidy for it makes nodifference.
7.1.58 The pricing of gas is a contentious issue, as thereis no properly functioning market for gas in India.Power plants and fertilizer units are entitled to a pass-through of the cost of gas and thus have no incentiveto push for lower prices. Consequently, price bidsby them cannot be accepted for price discovery offair market value. As the government provides fertil-izer subsidy, supplying gas at the cost of productioncould be considered until a fair market price has been
determined. As in the case of gas produced by Oil andNatural Gas Corporation (ONGC) and by Oil IndiaLtd (OIL) the Tariff Commission could be asked todetermine the cost of production/fair price for K–Gbasin gas as well.
RAW MATERIAL FOR PAPER7.1.59 The growth of the paper industry has not beenable to match the growth in the demand for paper asthe industry has been acutely short of domesticallyavailable wood. The limitation on cutting trees andother forest produce has led it to depend on importedwood and wood-based materials. As there is a lowimport duty on paper, domestic production of paperis progressively becoming uncompetitive. For theindustry to grow, it needs to have an assured source ofsupply of wood from domestic sources.
7.1.60 One way to achieve this and also improve theforest cover is to lease degraded forestland to the pa-per mills for development of captive plantations. Theycould thus grow trees to meet their raw material needsand in their self-interest they would need to do this ona sustainable basis.
7.1.61 The degraded forestland in the hands of theForest Department has remained degraded owing tothe other demands on the Department’s resources andtime. The land could benefit by grant of long-termlease to paper mills, which will devote the resourcesnecessary to grow trees, as a matter of their own com-mercial viability. The lease agreement could have acondition that the lease is given on usufruct terms,that is, at the end of the lease period the lessee willreturn the land in a condition that is no worse thanwhen the lease was awarded. Experience in somedeveloped countries has shown that the generation oftrees in captive plantations is more than the require-ment of the paper mills and can provide additionalforest cover.
7.1.62 In view of the accepted position that the firstcharge on natural resources should be of the local com-munities and the policy of JFM, an arrangement suchhas been advocated above has not been possible. Thisleaves the government with the possibility of allowingjoint ventures with paper mills only on non-forest

152 Eleventh Five Year Plan
wasteland. Consent of the local communities in publichearing would be required here too, but this couldbe obtained if the paper mills agree to spend a partof their turnover in social infrastructure for theirbenefit. The other alternative is for the State Govern-ments to facilitate linkages between paper mills andfarmers for growing tree crops as suggested in Chapter3, Volume III.
Fostering Innovation7.1.63 For the growth of the Indian economy, the keydriver has to be innovation. Innovation2 is broadlydefined to include ‘new to the world’ knowledge cre-ation and commercialization as well as ‘new to themarket’ knowledge diffusion and absorption. Althoughboth types of innovation activities are essential, Indiastands to gain more from catching up to the globalfrontier of knowledge through increased absorptionthan from trying to push out the frontier throughcreation. An enormous amount of global knowledgeis not fully utilized in India. Given the overridingneed to better address the needs of the poor in India,innovation could be ‘inclusive’ by addressing knowl-edge creation and absorption efforts most relevantto the poor. For fostering innovation, sharpeningcompetition by reducing entry and exit barriers isessential so that innovation becomes a necessity.Similarly, innovation-friendly socio-cultural normscould be strengthened by dissemination of successstories and provide high profile awards and prizes.For diffusing and absorbing knowledge, technology-support programmes could be taken at cluster levelfor the MSMEs and world-class demand responsivemetrology, standards, testing, and quality infrastruc-ture closely linked to innovation created for fosteringinclusive innovation. Financial support for grassrootinnovators could be increased and Intellectual Prop-erty Rights for traditional knowledge strengthened.
7.1.64 Innovation whether in goods and services orprocesses can be instrumental in increasing profitabil-ity by increasing competitiveness and market share.The national investment on R&D activities during2002–03 as per the Ministry of Science and Technol-ogy was Rs 18000.16 crore, of which only about
one-fourth could be attributed to the private sector(20.3%) and public sector (4.5%) enterprises. Theratio of R&D expenditure to the gross national prod-uct was only 0.80% in 2002–03 compared to 5.11% inIsrael, 4.27% in Sweden, 3.11% in Japan, and 1.23%in China. Obviously, there is scope for considerableimprovement on the R&D front in India for fosteringinnovation.
7.1.65 The National Knowledge Commission, setup by the Planning Commission, has highlightedthe following aspects in its national survey oninnovation:
• Innovation intensity (i.e., the percentage of revenuefrom products/service less than three years old) hasincreased for large firms and SMEs, with the SMEsregistering a greater increase in innovation thanlarge firms.
• About 7.3% of the large firms have achieved break-through in innovation while 76.4% have introducedincremental innovation.
• Internal processes for innovation such as maintain-ing a specific innovation department, allocatingfunds, rewarding innovative employees, maintain-ing physical locations for innovations, and consti-tuting cross functional teams are all importantfactors which encourage firms to become moreinnovative.
• Firms with more patent filings and use of IPR con-sultants are more innovative.
• Firms partnering with government agencies, col-laborating with universities and R&D labs also tendto be innovative.
7.1.66 However, the most important barrier toinnovation is skill shortage and a lack of effectivecollaboration with the R&D institutions. NDC hasrecommended that there is a need for systematicreforms of the higher education system, includingskill-based marketable vocational education in Indiawhich would facilitate the development of the requiredintellectual capital as well as enable more effective col-laboration between industry, educational institutions,and the government. Apart from this, it is necessary to
2 Unleashing India’s Innovation: Toward Sustainable and Inclusive Growth, Mark A. Dutz, World Bank Publication, 2007.

Industry 153
encourage innovation through fiscal incentives on acontinuing basis.
7.1.67 The NMCC was set up in September 2004 bythe government to provide a continuing forum forpolicy dialogue to energize and sustain the growth ofmanufacturing industries in India. The NMCC pre-sented its report ‘The National Strategy for Manufac-turing’ to the government in March 2006 which hasidentified challenges being faced by Indian manufac-turing and has recommended measures in consulta-tion with different departments and industries. AHigh-Level Committee on Manufacturing under theChairmanship of the Prime Minister has been consti-tuted to ensure implementation of the recommenda-tions. The analysis and policy recommendations in thesections that follow reflect, inter alia, the strategy drawnup by the NMCC as well as suggestions made in the 11Working Groups set up by the Planning Commissionfor the Eleventh Five Year Plan.
PUBLIC SECTOR ENTERPRISES (PSES)7.1.68 PSEs have made a notable contribution to theeconomic growth of the country, particularly bycreating a diversified industrial base. After the intro-duction of economic reforms in 1991–92, a policyof disinvestments and privatization was adoptedand upto 2001–02 equity had been sold in 123 enter-prises and receipt of Rs 26012 crore realized. Duringthe first two years of the Tenth Five Year Plan, theprocess intensified and a sum of Rs 18895 crore wasrealized from disinvestments. In 2004–05, there wasa policy shift and the United Progressive Alliance(UPA) government, while expressing a commitmenttoward a strong and effective public sector, decidedthat ‘generally profit making companies will not beprivatized’. Residual disinvestments made in the lastthree years of the Plan brought in receipts of Rs 4335crore.
Performance of Central Public SectorUndertakings7.1.69 Despite the privatization accomplished uptothe middle of the Tenth Five Year Plan, when the policychanged, the role of PSEs and their contribution tothe GDP has not diminished. In fact, the GDP fromnon-departmental enterprises (NDEs) registered an
increase during the first two years of the Tenth FiveYear Plan as shown in the Table 7.1.6.
TABLE 7.1.6Contribution of Non-departmental Enterprises to
GDP at Factor Cost (Current Price)
Year GDP from NDEs GDP at Factor Share(Rs Crore) Cost (Rs Crore) (%)
1996–97 141710 1260710 11.242001–02 244345 2100187 11.632002–03 282518 2265304 12.472003–04 312364 2549418 12.252004–05 338352 2855933 11.85
Source: National Accounts Statistics 2007 for 2001–02 onwards;for 1996–97 based on ‘Back Series’ information provided by CSO.
7.1.70 In 2004–05, the share of CPSEs in the GDPwas 6.82% out of 11.85% for NDEs. The numberof operational CPSEs has decreased from 231 in2001–02, the last year of the Ninth Five Year Plan, to225 in 2005–06. What is significant is that the numberof profit-making CPSEs has gone up from 120 to 157and the number of loss-making CPSEs has decreasedfrom 109 to 58. The profits of profit-making CPSEshave increased from Rs 36432 crore to Rs 76240crore and the losses of loss-making ones has comedown from Rs 10454 crore to Rs 5752 crore during thesame period. Table 7.1.7 gives the macro picture ofCPSEs.
7.1.71 The net profits made by the CPSEs has led tothe accumulation of large reserves which totalled asmuch as Rs 353641.62 crore for 157 profit-makingenterprises at the end of the financial year 2006–07.Between 2002–03 and 2005–06, the cash and bank bal-ances of all CPSEs rose from Rs 53453 crore toRs 150680 crore. Thus, CPSEs have accumulated largeamounts of investible funds, which are not being putto productive use.
7.1.72 The top 10 profit-making CPSEs made anet profit of Rs 47371 crore in 2005–06. The ONGC(Rs 14431 crore), Bharat Sanchar Nigam Ltd. (BSNL)(Rs 8940 crore), National Thermal Power Corpora-tion (NTPC) (Rs 5820 crore) were the top three profit-making CPSEs. The top 10 loss-making CPSEsaccounted for a net loss of Rs 4552 crore, the top threeloss-making units being the Fertilizer Corporation

154 Eleventh Five Year Plan
of India, Food Craft Institute (FCI) (Rs 1294 crore),Hindustan Fertilizer Corporation Limited, HFC(Rs 965 crore), and Hindustan Photo Films Co. Ltd,(Rs 561 crore). While the top 10 profit-making enter-prises are diversified, the top 10 loss-making enter-prises are largely concentrated in manufacturing.
7.1.73 Mid-year review (April–September 2006against April–September 2005) showed that the turn-over of 202 CPSEs (out of 225) for which data wasavailable increased by 24.07% and the net profit in-creased by 18.18%. The performance of CPSEs in dif-ferent industry sectors during the Tenth Five Year Planis presented in Annexure 7.1.4.
Policies toward CPSEs and theirImplementation7.1.74 In accordance with the mandate in the NCMPthe two main elements of the GoI policy have beendevolution of full managerial and commercial au-tonomy to successful, profit-making companies andmodernization and restructuring of sick PSUs (as wellas sell-off or closure of chronically sick CPSEs).
7.1.75 Pursuant to the recommendations of an ad hocgroup of experts under the chairmanship of ArjunSengupta, the government introduced a series of mea-sures for enhancement of financial delegation toNavratnas, Miniratnas, and profit-making CPSEs.
These include measures for creation of and disinvest-ment in subsidiaries, transfer of assets to such subsid-iaries, and floating of fresh equity.
7.1.76 Under the provisions of Sick Industrial Com-panies (Special Provisions) Act 1985, 62 CPSEs hadalready been referred to the BIFR earlier and duringthe Tenth Five Year Plan 12 more were referred to themfor considering revival/restructuring/closure. A totalof 28 of these had been recommended for winding up.Because of the delays inherent in the process of BIFR,the government has already sought to replace it bythe National Company Law Tribunal (NCLT) but thecreation of NCLT has been under dispute in theHonourable Supreme Court. Hearing in the specialleave petition is already over and the final judgmenthas been reserved.
7.1.77 The government constituted a Board for Re-construction of Public Sector Enterprises (BRPSE) inDecember 2004, as a part time advisory body to ad-dress the task of strengthening, modernization, revival,and restructuring of CPSEs. Until February 2007, theBRPSE had considered cases of 46 CPSEs receivedfrom 14 administrative ministries/departments andmade recommendations in respect of 40 CPSEs. Onthe basis of the recommendations of BRPSE, the gov-ernment has also approved the winding up of oneCPSE, namely, Bharat Opthalmic Glass Limited. It has
TABLE 7.1.7Macro View of Central Public Sector Enterprises
(Rs Crore)
2001–02 2002–03 2003–04 2004–05 2005–06 April– April–September September
2005 2006
Number of operating CPSEs 231 226 230 227 225Profit before interest, tax, 63190 72539 95039 108420 106533 64962 73169and EP (PBITEP)Capital employed 289934 417160 452336 504407 581250Turnover 478731 572833 630704 744307 832584 377370 468221Net profit 25978 32344 52985 64963 70288 27235 35465Net profit as % of turnover 5.4 5.6 8.4 8.7 8.4 7.2 7.6Profit of profit-making CPSEs 36432 43316 61606 74433 76240Loss of loss-incurring CPSEs 10454 10972 8522 9356 5952Profit-making CPSEs (nos.) 120 119 139 138 157Loss-incurring CPSEs (nos.) 109 105 89 79 58
Source: Public Enterprise Survey 2005–06 and Mid-Year Review of CPSEs for 2006–07, Department of Public Enterprises (DPE).

Industry 155
approved revival schemes in respect of 25 CPSEs,envisaging assistance of Rs 1951.30 crore in cash byway of equity/loan/grant and Rs 5709 crore by way ofwaiver of interest/loan/guarantee fees. Out of the 20CPSEs for which the budgetary support has been sanc-tioned for revival, 13 had posted profits after tax in2005–06 while the remaining have continued to incurlosses. The data for 2006–07 that have been made avail-able in respect of some CPSEs show that while somelike the Cement Corporation of India, Heavy Engineer-ing Corporation, Mineral Exploration CorporationLtd (MECL), Bharat Compressors Ltd have shownbetter financial performance than projected in the re-vival proposal, others such as Hindustan AntibioticsLtd and Andrew Yule & Company Ltd have been be-low the projected levels. Thus rehabilitation proposalshave been effective in about 50% of the cases. How-ever, it must be observed here that the improvementin market situation and hand-holding by the govern-ment in terms of price preference, placing of orderson nomination basis have also contributed to thesuccess of the revival efforts of the government.
Performance of State-level PublicEnterprises (SLPEs)7.1.78 No regular survey is carried out for SLPEs. Ason 31 March 2005, 1129 SLPEs were in operation(Table 7.1.8). The majority of SLPEs—about 50% innumber—are in manufacturing followed by utilities,promotional, and welfare enterprises. The total invest-ment in SLPEs increased every year in the post-economic reform period reaching a peak of Rs 285564crore in 2002–03 before going into a declining trendending up with Rs 259124 crore in 2004–05. Theaccumulated losses of SLPEs have been on the increasereaching a figure of Rs 60517 crore in 2004–05, with
consequential adverse fiscal impact on the States. Table7.1.8 gives the picture of the financial performanceof SLPEs at the end of Seventh, Eighth, and Ninth FiveYear Plan periods and in the first three years of theTenth Five Year Plan. The overall financial health ofSLPEs was very weak at the end of 2004–05.
7.1.79 A total of 579 manufacturing sector SLPEs con-stituted about 51% of the total number of 1129 SLPEs.Manufacturing SLPEs constituted a major share of theSLPEs portfolio in States such as Assam, Gujarat,Kerala, Maharashtra, Rajasthan, Tamil Nadu, UttarPradesh, and West Bengal. It is also noteworthy that aconsiderable number of these enterprises are takenover sick units. The investment in manufacturing en-terprises increased from Rs 17099 crore in 1997–98 toRs 23912 crore in 2004–05. The CAGR of investmentwas 4.2%. These enterprises incurred losses during allthe years excluding 2003–04 and 2004–05. As a resultof that their net worth in 2004–05 was Rs 12951 crore.
RESTRUCTURING OF SLPEs7.1.80 Some States have been active in restructuringsick PSEs. According to the information collected byInstitute of Public Enterprises (IPE) Hyderabad upto2004–05, 30 units including co-operatives had beenprivatized in Andhra, 3 in Gujarat, and 1 each inHaryana, Orissa, Punjab, and Rajasthan. West Bengalis another State which has shown substantial progressin the last two or three years. Out of 82 PSEs, 18 wereprofit making, and 63 loss making at the end of 2004–05. The Government of West Bengal has taken uprestructuring of 34 units in the first phase, of which 4have been successfully restructured under governmentownership, 3 have been converted into joint ventures,and 21 units have been closed. The 34 units had about
TABLE 7.1.8Performance Indicators of State-level Public Enterprises
(Rs Crore)
1991–92 1996–97 2001–02 2002–03 2003–04 2004–05
Number of operating SLPEs 1129Turnover 42986 86681 87375 86284 113208 127150Total investment 90983 144471 280116 285564 247676 259184Capital employed 83277 150291 179831 179627 232889 244770Accumulated losses 8754 13122 22764 27353 64486 60517Net worth 13248 35352 38429 44631
Source: Study by IPE, Hyderabad.

156 Eleventh Five Year Plan
11000 employees. With a view to reducing manpowerthese employees were offered compensation if theyopted for early retirement. Insurance and retrainingfacilities were also given.
Future Strategies7.1.81 In a globalized economy, cost-cutting strategicacquisitions and mergers are vital for facing interna-tional competition. CPSEs must have full autonomyand functional powers to take investment decisions totake advantage of the opportunities offered by the com-petitive international market. The informal levers ofcontrol from the ministries have no place in the com-petitive corporate world. Constitution of an indepen-dent Advisory Board to look after the government’sinterests in the CPSEs and leaving them to managethe corporation with the help of strong independentdirectors would be explored.
7.1.82 Substantial progress has been made in therevival of sick CPSEs, but close monitoring would beneeded to ensure that the restructuring plans are suc-cessfully implemented. In considering the revival ofthe remaining sick CPSEs, greater caution is necessaryas it has been seen that a few of the rehabilitated unitsare not performing in accordance with expectations.
7.1.83 The investment behaviour of the large profit-making CPSEs needs review. Many CPSEs appear toprefer investing in financial assets or reducing theirdebt burden in preference to investment which wouldcontribute to capital formation. As on 31 March 2006,CPSEs have made financial investment to the tuneof Rs 136558 crore. A substantial portion of thisinvestment is by Navratna CPSEs. One reason for thisphenomenon is the risk-averse nature of top manage-ment in CPSEs and the absence of institutional mecha-nisms which facilitate quick decision-making. Thegovernment has set up a special mechanism of anEmpowered Committee of Secretaries in Ministries ofPetroleum and Natural Gas, Ministry of Finance, andDPE for considering projects in the oil sector involv-ing financial decisions above a certain threshold.The recommendations of this Empowered Commit-tee are submitted to the CCEA directly for approval.Present mechanisms are inadequate to ensure opti-mum investment decisions. The supervisory body (that
is, independent Advisory Board) suggested above couldalso be given the task of guiding and facilitating theinvestment decisions in all profit-making CPSEs.
7.1.84 The system of MoUs between CPSEs and thegovernment has proved to be ineffective and dysfunc-tional. While the CPSEs are expected to perform inaccordance with the norms, the government’s com-mitments are marginal and not effectively monitored.There is a need to review and overhaul the system toensure effective operational autonomy and function-ing of the CPSEs. Financial delegations, particularlyof the profit-making CPSEs, will have to be enhanced.
AUTONOMOUS INSTITUTIONS IN INDUSTRY SECTOR7.1.85 Over the past Plans a number of autonomousinstitutions were set up to support the industry to meetvarious needs, such as technology transfer, skill devel-opment, and introduction of advanced technology.These institutions were designed to function in closecoordination with industry and the governing bodiesincluded all stakeholders. Some industry associationsset up such institutes on their own initiative with ini-tial government support. Some institutes such as theCentral Pulp and Paper Research Institute (CPPRI)and Institute of Pesticides Formulation Technology(IPFT) were set up with assistance from internationalorganizations such as United Nations IndustrialDevelopment Organization (UNIDO). Institutes suchas the National Test House (NTH) have the backing ofstatutes for some of the activities although they workon a commercial basis also.
7.1.86 No systematic study has been carried out so faron a comprehensive basis on the functioning of theseautonomous institutions. The Expenditure ReformCommittee (ERC) in 2001 had recommended thatbudgetary support should be progressively reducedhaving regard to the scope for maximizing internalresources generation and restraining of expendituregrowth. ERC also proposed greater autonomy toautonomous institutions whose performance hadbeen outstanding and had received internationalacclaim and recommended that an MoU be enteredinto by autonomous institutions with the parentministry/department, spelling out clearly not only theinput but also more importantly the output targets.

Industry 157
7.1.87 There are about 24 institutions under the con-trol of different ministries/departments concerningIndustry Sector (see Box 7.1.1).
7.1.88 In the Tenth Plan, Budgetary support of aboutRs 850 crore was provided to autonomous institutesfor new infrastructure/modernization. Apart from in-stitutes shown in the Box 7.1.1, there are a numberof autonomous institutes providing services to small-scale industries, FPI, and handloom and handicraft in-dustries. The emphasis in the Tenth Five Year Plan hasbeen to enable the institutions to achieve higher levelsof self-sufficiency and to provide only project-basedsupport. An important new initiative during the TenthFive Year Plan was to set up the National AutomotiveTesting and R&D Infrastructure Project (NATRIP) tomeet the homologation and testing need of automo-tive industry. The seven centres of NATRIP in differ-ent locations in the country, mainly in the areas ofconcentration of manufacturing activity in automo-biles and auto components, will be completed duringthe Eleventh Five Year Plan. Once completed, theindividual centres will be managed by the industrywith no recurring assistance from the government.
During the Tenth Five Year Plan period new centres ofNIFT, Central Institute of Plastics Engineering andTechnology (CIPET), and NID were also set up.
7.1.89 The emphasis in the Eleventh Plan wouldcontinue to promote self-sufficiency in these institu-tions so that they can operate on a self-sustainingbasis without the requirement of budgetary support.The government support will be limited to one timegrants for the creation of new facilities, with recurringexpenses being met from the revenues generated bythem.
AREA DEVELOPMENT FOR INDUSTRY7.1.90 Since the beginning of planned development,a policy has been followed for the development of in-dustrial areas and industrial estates within such areasto facilitate the establishment of small and mediumindustrial units. Initiative has also been taken for im-proving the infrastructure of existing clusters outsideof such areas. At the end of the Tenth Five Year Planthere were a multiplicity of schemes of cluster andarea development established for the creation orupgradation of infrastructure as shown in Box 7.1.2.
Box 7.1.1Autonomous Institutions in Industry Sector
• Quality Council of India (QCI).• Central Manufacturing Technology Institute (CMTI), Bangalore.• National Council for Cement and Building Materials.• Indian Rubber Manufacturers Research Association (IRMRA).• NID.• National Productivity Council.• Central Institute of Plastics Engineering and Technology (CIPET).• National Institute of Pharmaceutical Education and Research (NIPER) and IPFT.• Six Textiles Research Associations (TRAs).• NIFT.• Bureau of Indian Standards (BIS).• NTH.• Automotive Research Association of India (ARAI), Pune.• NATRIP.• Fluid Control Research Institute (FCRI).• National Ship Design and Research Centre, Visakhapatnam.• Biju Patnaik National Steel Institute.• National Institute of Secondary Steel Technology.
158 Eleventh Five Year Plan
7.1.91 Among the listed schemes the oldest is theGrowth Centre Scheme of the DIPP, which was de-signed for promoting the development of manufac-turing industries in industrially backward areas.Although as many as 52 growth centres were estab-lished, there was a weak response from the entrepre-neurs to set up units within the centres, as a result ofwhich large areas within the centres were lying vacant.The scheme was discontinued after the MTA of theTenth Five Year Plan. The Industrial Parks Scheme, alsoof DIPP, envisaged the establishment of industrialparks for development of industrial infrastructure orbuilt up space with common facilities in any areaallotted or earmarked for the purposes of industrialdevelopment. Driven by the benefits available underSection 80 IA of the Income Tax Act 1961, as many as270 industrial parks were set up. The objective ofthe Industrial Infrastructure Upgradation Scheme(IIUS) was to provide quality infrastructure facilitiesin existing functional clusters/industrial locations.Eligible activities included physical infrastructuresuch as water supply, effluent treatment, solid wastemanagement, etc. A total of 26 industrial areas spreadover 14 districts have been sanctioned assistance un-der the scheme. A feature of the IIUS is that it is basedon PPP and the initiative has to come from the benefi-ciary units.
7.1.92 To improve the infrastructure facilities specifi-cally for units in textiles and clothing, the CentralGovernment initiated two CSS of the Ministry of
Textiles in 2002, namely, (i) Textile Centres Infrastruc-ture Development Scheme (TCIDS) with the objec-tive of modernizing infrastructure facilities at majortextiles centres in the country and (ii) Apparel Parksfor Exports Scheme (APES) to promote setting up ofmodern apparel units at major growth centres. Al-though 19 TCIDS and 12 APES projects were takenup, the progress was slow and eventually none couldbe completed during the Tenth Five Year Plan. Conse-quently, the Scheme for Integrated Textile Parks (SITP)was introduced in 2005–06. As in the case of the IIUS,the SITP is based on PPP and is demand driven, andfollowing a good response from the industry 30 SITPprojects were taken up during the Tenth Five Year Plan.
7.1.93 The scheme for food parks was an element ofthe scheme for infrastructure development begun in2002–03 by the MFPI. The scheme also envisaged theestablishment of packaging centre, integrated coldchain facilities, value-added centre, and irradiationfacilities. During the Tenth Five Year Plan, 18 foodparks were approved, but progress was limited as only8 were actually established with just 28 industrial unitsfunctioning within the parks. In 2004–05, the MoRDlaunched the scheme for Provision of Urban Ameni-ties in Rural Areas (PURA) to encourage developmentof identified growth centres for the working popula-tion in the rural areas and prevent their migrationto the urban areas. To start with, the development ofclusters on a pilot basis has been envisaged at sevenlocations in the country.
Box 7.1.2Industrial Area Development Schemes
• Growth Centre Scheme—announced in June 1988 and became operational from 1991—DIPP.• Industrial Park Scheme 1999–2000, DIPP.• IIUS 2003–04, DIPP.• Apparel Parks for Exports 2001–02, Ministry of Textiles.• Textile Centres Infrastructure Development Scheme (TCIDS) 2002–03, Ministry of Textiles.• Scheme for Infrastructure Development 2002–03, MFPI.• SEZs 2005–06, Department of Commerce.• PURA—2004–05, Ministry of Rural Development.• Scheme for Integrated Textile Parks (SITP) 2005–06, Ministry of Textiles.• Petroleum, Chemicals, and Petrochemical Investment Regions (PCPIRs) 2006–07, Department of Chemicals and
Petrochemicals.

Industry 159
7.1.94 A new scheme for SEZs has been launched bythe Department of Commerce on the basis of the SEZAct 2005. The objective of the scheme is to establishindustrial townships divided into processing and non-processing areas. Apart from the existing export pro-cessing zones earlier set up by the Department ofCommerce, which have been converted into SEZs, theestablishment of new SEZs has been left to the initia-tive of private developers. The SEZs benefit from vari-ous tax incentives such as exemption from excise orcustoms duty, income tax exemption under Section80-1AB of the Income Tax Act, exemption from mini-mum alternate tax, dividend distribution tax, CST,and Service Tax. Units in SEZs have access to theDomestic Tariff Area on payment of full customsduties on the finished product. The scheme has evokeda good response and up to the end of August 2007,366 SEZs had been approved formally and 141 hadbeen notified.
7.1.95 In 2006 another area development schemeknown as the Petroleum, Chemicals, and Petrochemi-cal Investment Regions (PCPIRs) was announcedthrough a policy resolution of the Ministry of Chemi-cals and Petrochemicals. The PCPIR is a ‘specificallydelineated investment region/s with an area of around250 sq km—including SEZ/s, Free Trade and Ware-housing Zones, EOU units, and other existing indus-trial clusters—wherein is provided an internationallycompetitive and hassle-free environment with world-class infrastructure facilities to encourage global scaleinvestments in petroleum, chemical, and petrochemi-cal sectors to accelerate economic growth’. The policyprovides for a duly notified SEZ to be set up withinthe PCPIR. Although a number of locations areunder consideration, up to the end of August 2007, noState Government had initiated action for notifyinga PCPIR.
7.1.96 Experience of establishing area developmentprogrammes up to the end of the Plan period seemsto suggest that they can succeed only if they are de-mand driven and are so designed as to ensure that theinitiative comes from entrepreneurs who are willingto commit not only to make a substantial initial capi-tal investment on their part but also to run theprogramme on a self-sustaining basis.
7.1.97 The newly conceptualized Delhi–MumbaiIndustry Corridor (DMIC) project is in partnershipwith Japan. An approximately 150 km wide band oneither side of the proposed 1483 km long dedicatedrail freight route is to be developed into a plannedindustrial belt. Several large hubs/nodes have beenidentified for development as large industrial regionsin consultation with the government of the six Statesthrough which the corridor would pass. In the firstphase (2008–09 to 2012–13), it will have six invest-ment regions (about 200 sq km each) and six indus-trial areas (about 100 sq km each). The implementationwould adopt a PPP approach.
REGIONAL DEVELOPMENT OF INDUSTRY7.1.98 The disparities in the performance on manu-facturing output and employment of the States arereflected in Figure 7.1.4, which depicts the position asit stood in 2003–04.
7.1.99 The State-wise data on investment intentionsnotified to the DIPP during the Tenth Five Year Planbring out some new trends (Annexure 7.1.5). WhileGujarat, Karnataka, and Maharashtra continue to bein the forefront, Chhattisgarh, Jharkhand, Orissa, andWest Bengal are getting increasing attention. The dataon capital investments compiled by the RBI on the basisof the envisaged capital expenditure of companies thathave been sanctioned assistance by banks and finan-cial institutions show a different picture (Annexure7.1.6). In 2006–07, Gujarat has emerged as the leadinginvestment destination in the country, while AndhraPradesh, Karnataka, Maharashtra, and Tamil Nadu arealso attracting very substantial investments. Orissa toohas come up, registering a substantial increase inprojects in the pipeline during 2006–07. Jharkhand,Himachal Pradesh, and Uttarakhand have shown largeincreases in investment projects during the last twoyears of the Tenth Five Year Plan.
7.1.100 The most important determinant of theinvestment climate in the States is the state of physicalinfrastructure, particularly power and transportconnectivity with the rest of the country. Althoughskilled personnel can move from other parts of thecountry, local availability of such personnel is anadvantage. A fundamental requirement, however, is

160 Eleventh Five Year Plan
social stability and the existence of the rule of law,giving confidence to the entrepreneurs that theirlife and property will be safeguarded. Efforts of thegovernment have to address these prerequisites forfostering a more balanced industrial development ofthe country.
Central Government Initiatives for BalancedIndustrial Development7.1.101 On 24 December 1997, the Central Govern-ment notified the North East Industrial Policy (NEIP)providing a package of fiscal and other incentivesaimed at facilitating the process of industrial develop-ment in the NER. During the Tenth Five Year Planperiod, industrial incentives were extended to someother States. On 23 December 2002, similar incentiveswere extended to Sikkim, when it became a memberof the North Eastern Council. A special package forJ&K was announced on 14 June 2002. On 7 January2003, the Central Government granted incentives forindustrial investment to the States of Himachal Pradeshand Uttarakhand, which would remain for industries
that are set up till 31 March 2010. The NEIP, whichwas originally valid until 31 March 2007, has beenextended for another period of 10 years.
7.1.102 All the States covered by the incentive pro-grammes benefit from full excise duty exemption onfinished products as well as income tax exemption onprofits as also from capital subsidy on investment inplant and machinery. The North Eastern States getadditionally enhanced capital subsidy, interest subsidyon working capital loan, reimbursement of 100% pre-mium under Comprehensive Insurance Schemes aswell as transport subsidy of 50%–90% of the cost oftransportation of raw materials and finished productsto/from designated railheads. J&K also benefits frommost of the additional incentives appli/cable to theNorth Eastern States. An evaluation report by a pro-fessional consultant in 2004 had brought that in theNER a total of 681 units had been set up from 1999to September 2004, with an investment of Rs 1067.28crore and employment generation of 20709. Assamaccounted for about 49% of the investment and
Source: ‘Towards a Competitive Manufacturing Sector’, ICRIER paper by Rajiv Kumar, Chief Executive and Director, ICRIER andAbhijit Sen Gupta, Fellow, ICRIER.
FIGURE 7.1.4: Contribution of States to Output and Employment in Manufacturing
Guj
17%
TN
11%
Bih + Jha
3%MP + Cha
5%
Raj
3%
UP + Utt
8%
Mah
18%
Kar
7%
Har
5%
WB
4%
Pun
4%
Ker
3%
AP
7%
Del
1%
Other
4%
TN
16%
Guj
9%
Mah
13%
UP + Utt
8%
Raj
3%
AP
12%WB
7%
Kar
6%
Har
4%
Pun
4%
Ker
5%
Other
6%
Del
1%
MP + Cha
3%
Bih + Jha
3%
2003–04 2003–04
Decomposition of Output Decomposition of Employment
Industry 161
Meghalaya for about 41%. The experience of otherStates is much better. According to the reports submit-ted by the State Governments concerned, the invest-ment already made up to March 2007 was Rs 5902 crorein Uttarakhand, Rs 2884 crore in Himachal Pradesh,and Rs 3403 crore in J&K, the latter predominantlyin the Jammu region. Data compilation from IEMsand RBI of the investment envisaged in projectsreceiving financial assistance from banks and finan-cial institutions also suggest that the incentives havestimulated industrial activity in Himachal Pradesh andUttarakhand significantly.
7.1.103 There have been complaints from not only theadjoining States but also from the States in the southof flight of capital induced by excise duty exemptionsin Himachal Pradesh and Uttarakhand. Some otherStates with hilly regions such as West Bengal have raisedquestions of equity. During the Eleventh Five YearPlan, the industrial incentives would have to be closelymonitored. Because of the distortions introduced byexcise duty exemptions in particular, considerationwould have to be given to replacing the incentives, fullyor partly, by an accelerated programme for infrastruc-ture improvement.
INTELLECTUAL PROPERTY RIGHTS (IPRS)7.1.104 Recognizing the importance of the IPRs as ameans for fostering innovation and contributing toenhanced economic growth and competitiveness,India has adopted a four-pronged strategy to strengthenits IPR regime: (i) to meet international obligations,(ii) to safeguard national interests, (iii) to modernizethe IPR administration, and (iv) to create awarenessregarding IPRs.
Legislation7.1.105 In keeping with the above strategy, India hasupdated its Intellectual Property related legislation,that is, patents, trade marks, geographical indications,industrial designs, copyrights, biodiversity, semi-conductor integrated circuits layout design, etc., so asmeet its international obligations. At the same time,necessary safeguards to protect public interest havealso been suitably incorporated in the Patents Act toensure availability of patented products, includingpharmaceuticals, at reasonably affordable price. The
law also contains provisions which ensure that grantof patents for frivolous innovations resulting in‘evergreening’ of patents would not be possible.‘Evergreening’ of patents could have adverse conse-quences on both the availability as well as the pricesof essential medicines impacting the health and livesof millions of people. The law thus encourages sub-stantive R&D.
7.1.106 The legislative modernization exercise hasalso been utilized to streamline and rationalize theprocedural aspects so as to make the system more effi-cient and user-friendly. Definitive timeframes havebeen prescribed for various activities by the PatentOffices. At the same time, the time lines available forthe applicants and the public have been extended. Inaddition, the maximum time period for grant of patenthas been reduced from 104 months to 52 months. Apatent can be obtained in a shorter period dependingupon the initiatives taken by the applicant.
Modernization of Infrastructure7.1.107 As a part of improving and strengthening theinfrastructure, the government has implemented mod-ernization of IP Offices at a cost of Rs 153 crore in theNinth and the Tenth Five Year Plans. This included:new, integrated IP offices in the four metros; strength-ening of library and novelty search facilities by acquir-ing books, journals, and CD-ROMs of patents, designs,trademarks, and geographical indications granted orregistered; and making operations in the IP offices ITenabled.
Impact7.1.108 The legislative and administrative initiativestaken during the last few years have had a very posi-tive impact on the creation and securing of IP in Indiaduring the Tenth Five Year Plan period. Patent filingwhich was a mere 11466 in 2002–03 has gone up bytwo and a half times to 28882 in 2006–07. The patentsgranted also registered a five-fold growth from 1379to 7559 during the same period. The number of trade-marks registered increased phenomenally from 11190in 2002–03 to 109361 in 2006–07.
7.1.109 The Geographical Indications of Goods (Reg-istration and Protection) Act 1999 was an entirely new

162 Eleventh Five Year Plan
legislation for India. This was brought into force on15 September 2003 and with the initiatives taken bythe government, it has been possible to generate 97applications out of which 37 products have alreadybeen registered including Darjeeling tea, Chanderisaree, Pochampally ikat, etc.
7.1.110 A major initiative taken recently has been theannouncement of a National Design Policy. This isexpected to give a boost to the design sector in Indiawhere the country with its diversity and long culturaltraditions has an edge over others.
7.1.111 The increase in the activities in the IP officeshas also resulted in substantial growth in revenue gen-eration. The income of the Patent and TrademarkOffices, which was a mere Rs 17.06 crore in 2002–03has gone up to Rs 163.67 crore in 2006–07. This hasbeen possible because of the trust and confidence thatthe IP creators and owners developed in the servicesprovided by these offices, particularly in clearing hugebacklogs.
Second Phase of Modernization7.1.112 Further modernization of IP offices has alsobeen planned in the Eleventh Five Year Plan. Thiswould address the needs of human resource develop-ment, training, and awareness and also infrastructurebesides regular updating of the IT facilities.
7.1.113 The second phase of modernization wouldcontribute toward making the Indian Intellectual Prop-erty Office (IPO) a front ranking IPO. The Indian IPOwould be made an International Searching Authority(ISA) and an International Preliminary ExaminingAuthority (IPEA) under the Patent Cooperation Treatyof World Intellectual Property Organization, placingit in an exclusive group of 12 countries currentlyrecognized as ISA/IPEA. Accession to the MadridProtocol, a facilitation system for international regis-tration of trademarks, will also be considered. ANational Institute for Intellectual Property Manage-ment will be established at Nagpur. The Institute willcater to the requirements of training and awarenessand also act as a centre for policy, research, and IP thinktank.
PLAN OUTLAYS AND EXPENDITURE IN THE TENTH PLAN7.1.114 The Industry and Mineral Sector spans 11departments and ministries. The actual expenditureon the schemes in the industry sector was aboutRs 25000 crore during the Tenth Five Year Planperiod, which is 65% of the original outlay and 75%of the outlay as revised after the MTA. A summaryof the Plan outlay and expenditure on major schemesin the industry sector during the Tenth Plan is givenin Annexure 7.1.19. A review of the major schemesimplemented during the Tenth Five Year Plan is givenin the following paragraphs.
7.1.115 With a view to enhancing competitiveness byproviding quality infrastructure in existing clusters,IIUS was launched in 2003 with an outlay of Rs 675crore for assisting 20–25 clusters. The IIUS was envis-aged as a user-driven scheme, based on PPP, imple-mented through a Special Purpose Vehicle (SPV)formed by the users, and administered by the ApexCommittee in the DIPP. During the Tenth Five Year Plan,the Apex Committee sanctioned 26 projects with totalcost of Rs 1766.18 crore and a GoI grant component ofRs 952.10 crore. A sum of Rs 437.38 crore was releasedup to the end of 2006–07. Evaluation has not beenpossible, as none of the schemes have been completedalthough several are in an advanced state of comple-tion. However, since the design of the scheme ensuresthat the schemes are taken up only after the usershave taken initiative and made investments, andseveral schemes are in an advanced state of completion,it will be useful to continue with the scheme in theEleventh Five Year Plan. The scheme would need toundergo a mid-term review on the basis of the progressmade.
7.1.116 A programme focused on tannery modern-ization in a small way was initiated in 1999 and duringthe Tenth Five Year Plan it was subsumed in an enlargedIndian Leather Development Programme (ILDP) withan approved outlay of Rs 400 crore, comprising twoseparate components, viz., Integrated Development ofLeather Sector (IDLS) and Infrastructure Strengthen-ing of Leather Sector with outlays of Rs 290 crore andRs 110 crore, respectively. Owing to late sanction onthe account of procedural delays in the GoI the scheme

Industry 163
could not take off during the Tenth Five Year Plan andwill spill over into the Eleventh Five Year Plan.
7.1.117 The major schemes implemented by the Min-istry of Textiles are the TUFS, Technology Mission onCotton (TMC), APES, and TCIDS.
7.1.118 The TUFS was initially introduced in 1999with the objective to provide adequate impetus to allthe sub-sectors of textiles and jute industry by way of5% interest reimbursement so as to reduce the cost ofcapital for modernization. Small-scale textile and juteindustrial units were given an option either to availCredit-linked Capital Subsidy (CLCS) or interest re-imbursement. An additional option of credit linked20% capital subsidy for small-scale powerloom andweaving preparatory machinery, with the option toobtain credit from an enlarged credit network, was alsointroduced. Besides, an additional capital subsidy of10% for benchmarked processing machinery over andabove the extant 5% interest reimbursement wasstarted in April 2005. In the Tenth Plan, as against theloan disbursed by the banks and financial institutes ofRs 18506 crore, subsidy amount of Rs 2043.66 crorewas granted under the scheme. In the Eleventh Planperiod, there is a spillover liability of Rs 984 crorerelating to the subsidy for the projects sanctionedduring the Tenth Plan period. Preliminary findings ofthe evaluation of the scheme by a professional con-sultant reveal an improvement in profitability and pro-ductivity. However, substantial dependence on importof second-hand machinery and low share ofpowerloom and processing sector have emerged asareas of concern. In view of the continuing need tostimulate investment and the positive response of theindustry to the scheme, the TUFS would need to becontinued during the Eleventh Five Year Plan.
7.1.119 The SITP was launched in August 2005. Theprimary objective of the scheme is to provide the in-dustry with world-class infrastructure facilities for set-ting up of textile units in clusters. As in the case ofIIUS, the scheme is being implemented through SPVswith industry associations/groups of entrepreneurs asthe main promoters of the integrated textile parks.GoI’s support under the scheme by way of grant or
equity is limited to 40% of the project cost, subject toa ceiling of Rs 40.00 crore. The SITP envisaged cre-ation of 30 new textile parks of international standardsin potential growth centres before 2007–08. An amountof Rs 625.00 crore was allocated for the developmentof these parks against which Rs 88.27 crore of GoIgrant was released till the end of the Tenth Five YearPlan. In all the 30 schemes, the SPV has been formedand land has been acquired. Since 9 schemes were sanc-tioned late in 2005–06 and the remaining 21 in theperiod after July 2006, none of the projects has beencompleted. A major factor has been that the industryis awaiting the issuance of the guidelines for the re-vised TUFS before moving for bank loans for the unitswithin the parks. During the Eleventh Five Year Planthe first priority will have to be completion of the 30projects already taken in hand but provision willhave to be made for additional projects within theavailable plan allocation.
7.1.120 In addition to the SITP there were two pre-existing schemes, the APES and the TCIDS, whichwere commenced in 2002. A total of 18 projects weresanctioned under TCIDS and 12 under APES, with aGoI assistance of Rs 271.06 crore and Rs 191.70 crore,respectively. An amount of Rs 172.50 crore is estimatedto have been spent by the end of the Tenth Five YearPlan under APES and TCIDS. There was a designdefect in these schemes in as much as the schemeswere implemented on the initiative of the State Gov-ernments without the assurance of interest amongthe entrepreneurs. As a result, these schemes have beenlanguishing. An assessment would need to be madeon the sustainability of these schemes, and duringthe Eleventh Five Year Plan only those would needto be assisted in which there is an interest among theentrepreneurs.
7.1.121 The Technology Mission on Cotton (TMC)was launched in February 2000, with the objectiveof bringing tangible improvement in the productivityand quality of cotton. An evaluation of the schemeby a professional consultant has indicated markedimprovement by way of reduced contaminationlevels in cotton processed by the modernized Ginningand Pressing (G&P) factories matching to international

164 Eleventh Five Year Plan
levels. It is expected that 80% of the cotton producedin the country would be able to meet the higherstandards of international markets on completion ofmodernization of 1000 G&P factories. This schemetoo will need to be continued during the EleventhFive Year Plan.
7.1.122 The Consumer Protection Act has been inoperation for about 20 years. The objective of theCentral Consumer Protection Council establishedunder the Act is to promote and protect consumerrights that include the right to be informed and theright to consumer education. The consumer movementis still in infancy in the country. One of the reasonsfor the slow progress is lack of consumer awarenessespecially in the rural areas. The National Action Plantaken up by the Department of Consumer Affairsenvisages a two-pronged approach, that is creatingconsumer awareness and strengthening grievancereadressal machinery for consumer protection. A newservice, National Consumer Helpline, was launchedduring 2004–05. From the expenditure level of Rs 9.12crore in the first three years of the Tenth Five YearPlan, the allocation was stepped up significantly toRs 67.49 crore and Rs 69.40 crore during 2005–06and 2006–07, respectively. The multimedia campaigncovered topics such as maximum retail price (MRP),gold hallmarking, ISI mark on products, expiry dates,and consumer rights. About Rs 70.00 crore was utilizedon consumer awareness ‘Jago Grahak Jago’ campaignduring each of the years 2005–06 and 2006–07. Anevaluation of the scheme carried out by the IndianInstitute of Mass Communication (IIMC) in August2006 has shown that the percentage of recall of thecampaign among the consumers was 65% in the samplestates.
7.1.123 The industry programmes run by the Depart-ment of Atomic Energy (DAE) provide inputs suchas structural materials, fuels, heavy water, and electro-nics and instrumentation to the nuclear power plants.The Department is also engaged in activities pertain-ing to fuel reprocessing, waste management, andthermal and fast reactor technology. The industryprogrammes were allocated Rs 818.93 crore but theexpenditure was higher at Rs 1280.88 crore. Someof the developments during the Tenth Plan were the
following: augmentation of existing zirconium spongeplant and capacity expansion of zirconium oxideplant, modification of heavy water plant, tubebundle for condensers, heavy water clean up facility,boron exchange distillation facility, advanced vetri-fication system, large capacity spent fuel storagefacilities, fabrication of fuel and structural materials,and Instrumentation packages for nuclear powerplants.
7.1.124 The ship-building sector of the Departmentof Shipping was allocated Rs 1047.86 crore againstwhich the actual expenditure has been Rs 282.45 crore.The shortfall in expenditure was on account of the factthat the expansion plans of Cochin Shipyard Ltd andthe revival plan of Hindustan Shipyard Ltd (HSL) didnot materialize.
7.1.125 The outlay of the Ministry of Steel was revisedfrom Rs 11044 crore to Rs 8477 crore at MTA stage,mainly financed by Internal and Extra BudgetaryResources (IEBR), except for Rs 65 crore. The actualexpenditure on steel sector schemes was Rs 4119 croreout of total expenditure of Rs 4825 crore in the Indus-try and Minerals (I&M) sector. Implementation of themodernization and expansion programmes of SteelAuthority of India Ltd (SAIL) was sluggish in thefirst three years of the plan. The expansion plan ofRashtriya Ispat Nigam Ltd (RINL) from 3.5 millionper year hot metal capacity to 6.3 million per year hotmetal capacity, which was approved in 2005, alsoremained behind schedule.
7.1.126 The outlay of the Department of HeavyIndustry was increased in the later half of the TenthFive Year Plan with the new emphasis in the govern-ment policy on restructuring of sick PSEs. The overallexpenditure was Rs 2606 crore. The expenditure on‘support to existing public sector undertakings’ and‘restructuring of CPSEs’ was increased considerably.The progress of expenditure in respect of the NATRIPscheme was satisfactory. Revival and restructuring ofthe Nagaland Pulp and Paper Company Ltd at Tuli,Nagaland and expansion of the Hindustan NewsprintLtd, Kerala were taken up during the Tenth Plan inaddition to restructuring of 14 sick CPSEs based onthe recommendation of BRPSE.
Industry 165
7.1.127 The DBT took up a new scheme for settingup of biotechnology incubators, pilot-level facilities,and biotech parks. Subsequently, a new scheme underthe PPP mode to promote Small Business InnovationResearch Initiative (SBIRI) towards development ofnew technologies/products through industry academiainteraction was also started. Under the Biotech ParkScheme two projects were taken up for implementa-tion: setting up of the Biotechnology Park at Lucknowand establishment of Biotechnology Incubators Cen-tre at Shapoorji Pallonji Biotech Park at Hyderabad.Financial support for another four incubation centreswas also provided. The actual implementation of SIBRIscheme commenced in 2005–06 and some researchprojects have been supported. The schemes were ini-tially allocated Rs 30 crore in the Tenth Five Year Planbut the expenditure was higher at Rs 102 crore.
ELEVENTH PLAN OUTLAYS AND MAJOR SCHEMES7.1.128 Eleventh Plan outlays of various ministries/departments concerning the industry sector are indi-cated in Annexure 7.1.19. The scheme-wise break-upis indicated in the Appendix, Volume III. Major ongo-ing and new schemes are as follows.
Ongoing Schemes• TUFS• SITP• TMC• Second phase of NATRIP• Modernization and strengthening of Intellectual
Property offices• IIUS• Setting up of Biotechnology Incubators, Biotech
parks and SBIRI• Industry segment of DAE• Strengthening, reviving, and restructuring of PSEs• North East Industrial and Investment Promotion Po-
licy, and package for special category states
New Schemes• ILDP (modified and increased coverage)• Scheme for enhancement of competitiveness in
capital goods sector• Setting up of National Institute of Pharmaceutical
Education and Research (NIPER) like institutes forpharmaceutical sector
• Schedule M compliance by SMEs in Drugs andPharmaceuticals
• Capital Subsidy for conversion of existing FurnaceOil (FO)/Low Sulphur Heavy Stock based fertilizerplants to NG/liquefied natural gas (LNG)
• DMIC• R&D in ship-building sector
SECTORAL PROFILES
The Automotive Industry7.1.129 If there is one manufacturing industry inIndia that has moved from strength to strength afterthe economic reforms of 1991–92, it is the automotivesector. It has grown at the spectacular rate of 17%over the last few years, with an investment of Rs 50000crore in 2005–06 (and another Rs 30000 crore in thepipeline), attaining a turnover of Rs 165000 crore. In2005–06, the passenger car segment crossed the onemillion mark.
7.1.130 At present the direct employment in theindustry is 2 lakh in vehicle manufacturing and 2.8lakh in component companies. With the additionalinvestment and increase in production, it is expectedthat the direct employment in the sector will doublein the next five years. In 2005–06, the componentmanufacturers added investment worth US$ 1 billion(Rs 4500 crore) in new capacity. In 2006–07, the auto-mobile manufacturers have announced investmentof Rs 60380 crore and the component manufacturershave announced investment of Rs 2523 crore so far.
Production and Exports of Vehicles7.1.131 The production of various categories ofautomobiles in the Tenth Five Year Plan period grewat a CAGR of 16% crossing the 10 million mark in2006–07, as shown in the Annexure 7.1.7.
7.1.132 The industry proved its international competi-tiveness in all categories of vehicles by achieving aCAGR of 35% in exports during the Tenth Five YearPlan period (Annexure 7.1.7). The segments that haveshown particular buoyancy are passenger vehicles,two wheelers, and three wheelers, which have risenfour-fold, six-fold, and ten-fold, respectively, duringthe Tenth Five Year Plan period as compared to the
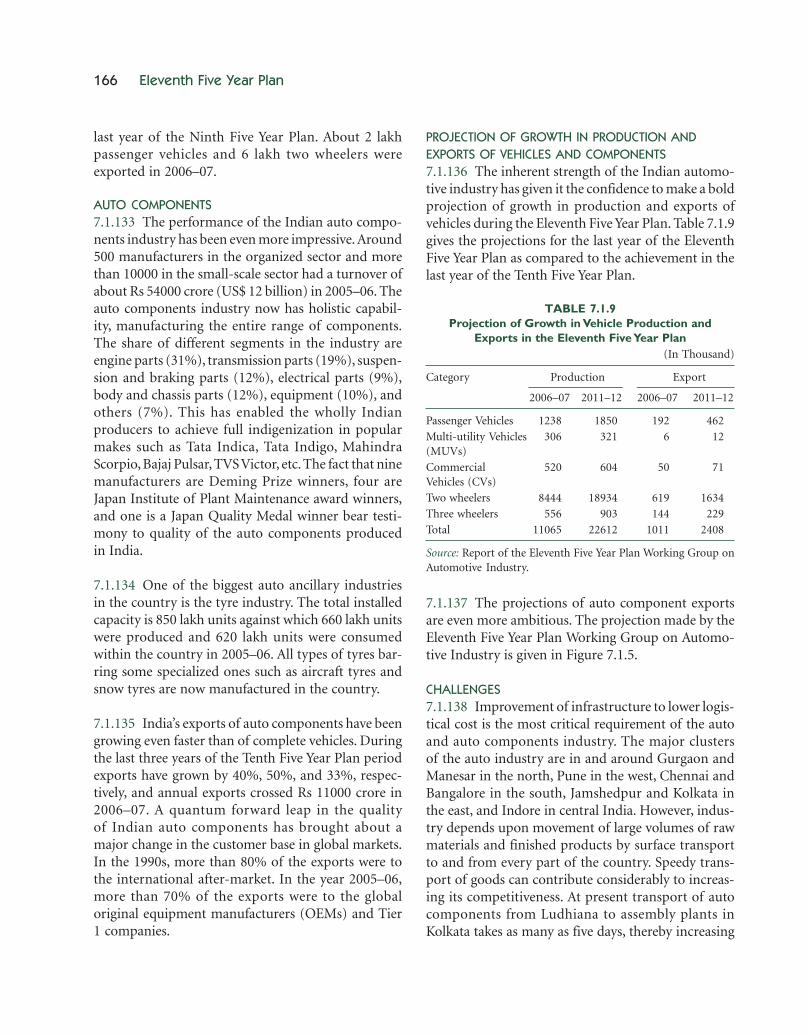
166 Eleventh Five Year Plan
last year of the Ninth Five Year Plan. About 2 lakhpassenger vehicles and 6 lakh two wheelers wereexported in 2006–07.
AUTO COMPONENTS7.1.133 The performance of the Indian auto compo-nents industry has been even more impressive. Around500 manufacturers in the organized sector and morethan 10000 in the small-scale sector had a turnover ofabout Rs 54000 crore (US$ 12 billion) in 2005–06. Theauto components industry now has holistic capabil-ity, manufacturing the entire range of components.The share of different segments in the industry areengine parts (31%), transmission parts (19%), suspen-sion and braking parts (12%), electrical parts (9%),body and chassis parts (12%), equipment (10%), andothers (7%). This has enabled the wholly Indianproducers to achieve full indigenization in popularmakes such as Tata Indica, Tata Indigo, MahindraScorpio, Bajaj Pulsar, TVS Victor, etc. The fact that ninemanufacturers are Deming Prize winners, four areJapan Institute of Plant Maintenance award winners,and one is a Japan Quality Medal winner bear testi-mony to quality of the auto components producedin India.
7.1.134 One of the biggest auto ancillary industriesin the country is the tyre industry. The total installedcapacity is 850 lakh units against which 660 lakh unitswere produced and 620 lakh units were consumedwithin the country in 2005–06. All types of tyres bar-ring some specialized ones such as aircraft tyres andsnow tyres are now manufactured in the country.
7.1.135 India’s exports of auto components have beengrowing even faster than of complete vehicles. Duringthe last three years of the Tenth Five Year Plan periodexports have grown by 40%, 50%, and 33%, respec-tively, and annual exports crossed Rs 11000 crore in2006–07. A quantum forward leap in the qualityof Indian auto components has brought about amajor change in the customer base in global markets.In the 1990s, more than 80% of the exports were tothe international after-market. In the year 2005–06,more than 70% of the exports were to the globaloriginal equipment manufacturers (OEMs) and Tier1 companies.
PROJECTION OF GROWTH IN PRODUCTION ANDEXPORTS OF VEHICLES AND COMPONENTS7.1.136 The inherent strength of the Indian automo-tive industry has given it the confidence to make a boldprojection of growth in production and exports ofvehicles during the Eleventh Five Year Plan. Table 7.1.9gives the projections for the last year of the EleventhFive Year Plan as compared to the achievement in thelast year of the Tenth Five Year Plan.
TABLE 7.1.9Projection of Growth in Vehicle Production and
Exports in the Eleventh Five Year Plan(In Thousand)
Category Production Export
2006–07 2011–12 2006–07 2011–12
Passenger Vehicles 1238 1850 192 462
Multi-utility Vehicles 306 321 6 12(MUVs)
Commercial 520 604 50 71Vehicles (CVs)
Two wheelers 8444 18934 619 1634
Three wheelers 556 903 144 229
Total 11065 22612 1011 2408
Source: Report of the Eleventh Five Year Plan Working Group onAutomotive Industry.
7.1.137 The projections of auto component exportsare even more ambitious. The projection made by theEleventh Five Year Plan Working Group on Automo-tive Industry is given in Figure 7.1.5.
CHALLENGES7.1.138 Improvement of infrastructure to lower logis-tical cost is the most critical requirement of the autoand auto components industry. The major clustersof the auto industry are in and around Gurgaon andManesar in the north, Pune in the west, Chennai andBangalore in the south, Jamshedpur and Kolkata inthe east, and Indore in central India. However, indus-try depends upon movement of large volumes of rawmaterials and finished products by surface transportto and from every part of the country. Speedy trans-port of goods can contribute considerably to increas-ing its competitiveness. At present transport of autocomponents from Ludhiana to assembly plants inKolkata takes as many as five days, thereby increasing

Industry 167
the working capital requirement and making the adop-tion of just-in-time manufacturing impossible.
7.1.139 Since the industry will become increasinglyexport-oriented, the port infrastructure is also crucialfor its development. Chennai and Mumbai ports, whichhandle the bulk of the exports of vehicles, lack spacefor parking and repair of vehicles damaged in transit.The longer turnaround time and poor port connec-tivity are also impediments that need to be addressed.
7.1.140 Adequate and supply of quality power isanother infrastructure requirement. It is estimatedthat the industry will need an incremental supply of12000 MW of power during the Eleventh Five Year Planperiod.
7.1.141 Harmonization of emission norms as perEconomic Commission for Europe (ECE) guidelines,measures to increase road safety, computerizationand interconnection of Regional Transport Authori-ties (RTOs) to enable recall of vehicle in case of defects,mandatory inspection and certification of vehicles inuse are other suggestions that have been made for thebenefit of the vehicle users as well as the industry.
7.1.142 The industry needs to strive continuously forinnovation and upgradation for increasing its produc-tivity, and for this the industry has to carry out R&D
activities. The government encourages research bygiving weighted reduction in corporate tax for expen-diture incurred on R&D, but the provision is renewedfor short periods, discouraging long-term commit-ment to R&D. In addition to the fiscal benefits, thegovernment’s assistance is needed for setting up world-class automotive testing and R&D infrastructure.
STRATEGIES7.1.143 The substantial programme for improvementof transport infrastructure and power being under-taken during the Eleventh Five Year Plan and describedelsewhere in this document will go a long way towardalleviating the problems faced by the automotive in-dustry. Of special relevance to the automotive indus-try will be the Dedicated Freight Corridor (DFC) ofthe railways, the expressways, and the port modern-ization programme. With the expected increase in ex-ports of completed vehicles, it is necessary to considerdedicating existing or new berths for export of vehicles,at Mumbai, Chennai, and Kolkata, with provision forample parking space.
7.1.144 An ambitious NATRIP has already been com-menced in the Tenth Five Year Plan, for full-fledgedtesting and homologation centres in Manesar andChennai, upgradation of existing testing and homolo-gation centre at Pune and Ahmednagar, world-classtesting tracks at Nagpur, facilities for testing of tractors
Source: Working Group on Automotive Industry for Eleventh Five Year Plan.
FIGURE 7.1.5: Auto Components—Projection of Turnover and Exports

168 Eleventh Five Year Plan
and off-road vehicles at Rae Bareilly, and hill area driv-ing training centre at Silchar. Substantial workremains to be done to complete the initiative.
7.1.145 Concessions in corporate taxes for R&Dexpenditure must be made a permanent feature of ourcorporate tax laws.
7.1.146 A National Road Safety Board needs to beestablished at an early date as recommended by theSunder Committee set up by the Ministry of Roads,Transport, and Highways. Mandatory inspection andcertification of in-use vehicles is also a pre-requisitefor improving road safety. Computerization of RTOsand their interconnection is also a desirable course ofaction from the point of view of effective regulationof transport services and also for facilitating recall if amanufacturing defect is detected.
7.1.147 It is necessary for the industry to achieveinternational safety and pollution standards by 2015by aligning the domestic standards with the ECEregulations.
7.1.148 In order to meet the growing scarcity oftrained human resources there is need to consider thesetting up of a National Level Automotive Institute forrunning training courses in the automobile sector andformulating courses and modules for training in theautomobile sector to be imparted by various Indus-trial Training Institutes (ITIs) and Automotive Train-ing Institutes (ATIs). It is also necessary to createcentres of automotive manufacturing excellence infour IITs and open an auto design centre at NIDAhmedabad. The OEMs and Tier 1 component manu-facturers could be encouraged to adopt ITIs and ATIs.
7.1.149 Encouragement through suitable fiscal con-cessions should be provided for manufacture andassembly of fuel-efficient and hybrid vehicles and foruse of alternative fuels for promoting energy conser-vation and environmental protection.
7.1.150 The main ongoing Plan scheme is setting-upof NATRIP. In the Eleventh Plan an outlay of Rs 1407crore has been made to complete the second phase ofthe project.
Capital Goods and Engineering Industry7.1.151 The Indian engineering industry has emergedas a dynamic sector in the country’s industrial economyand has made the country self-reliant in key areas. Thecapital goods value addition contributes about 9%–12% to the total manufacturing. The annual produc-tion of the capital goods industry stood at Rs 50000crore as of 2003–04. The capital investments made inthis sector have registered a healthy CAGR of close to10% during the period from 1995 to 2005, the invest-ment picking up from 2001–02.
7.1.152 The five major sectors in the capital goodsindustry, viz., electrical machinery, process plantequipment, mining and construction machinery,machine tools, and textile machinery contribute nearly57% of the total sector. The production, export, andimport in these five sectors are presented in Annexure7.1.8. Production of the five segments grew at ratesranging between 12% and 32%. Exports of machinetools, mining and construction machinery, andprocess plant equipment grew impressively andexport of textile machinery grew modestly. Exportsof electrical machinery fell during the Tenth FiveYear Plan.
MACHINE TOOLS SECTOR7.1.153 The industry constitutes 450 manufacturingunits of which nearly 33% are in the organized sector.Top 10 companies in the sector contribute to almost73% of the total production in the sector. Since 2002,the industry has shown a healthy growth and as in 2006,production in the sector has been growing at 12% andexport at 17%. The industry’s turnover in 2006–07 wasRs 2900 crore and it is estimated that the industry’sturnover would be Rs 6000 crore by 2011–12.
7.1.154 During the Tenth Plan, the support measuresby the government were in the form of machine toolcluster under IIUS Scheme, UNIDO-sponsoredBangalore Machine Tool Cluster and support forinfrastructure and technology development to CMTI,Bangalore.
TEXTILE MACHINERY7.1.155 The textile engineering industry currently hasan annual installed capacity to the tune of Rs 3800 crore

Industry 169
per annum and the capacity utilization has goneup from 55% to 67% during 2005–06 over its preced-ing year. The size of the industry is likely to grow up toRs 10000 crore by 2010. The industry is unable to copewith the demand of domestic textile and clothing unitsand at present it is estimated that 80% of the require-ment is being imported. The liberal policy of importof second-hand textile machinery promoted in thesector has affected the prospect of fresh investment inthe sector.
INDIAN HEAVY ELECTRICAL INDUSTRY7.1.156 The Indian heavy electrical industry hasregistered a growth of almost 20% during 2004–05over its preceding year. The fortune of the industry isclosely linked to the development of power sector inthe country. A capacity addition of 78000 MW isplanned in the Eleventh Five Year Plan. There is asubstantial order backlog in the industry that is to becompleted over a span of two years. Capacity additionin the country, particularly for the manufacture ofboilers, has become imperative. The sector is experi-encing difficulties in technology transfer since foreigncompanies can now directly participate in the infra-structure projects. The level of R&D and technologyinnovation within the country is low by internationalstandards.
MINING AND CONSTRUCTION EQUIPMENT SECTOR7.1.157 The mining and construction equipmentindustry is dominated by a few large manufacturersin each product segment. Bharat Earth MoversLimited supplies to nearly half of the total market. Themining and construction equipment sector registereda healthy growth in its output and exports over thelast two years. The domestic demand has increasedfrom a level of Rs 6300 crore in 2004–05 to Rs 8400crore in 2006–07.
PROCESS PLANT EQUIPMENT INDUSTRY7.1.158 The process plant machinery and componenetindustry in India is a very heterogeneous industrywith a turnover of Rs 10000 crore per annum as of2004–05. The growth projection for 2005–06 manu-facturing total equipment in the process industry wasRs 6000 crore, a jump of 15% on an average. Owing tothe fragmented nature of the industry and the small
size of the players, most of them have not implementedany of the latest soft technologies.
CHALLENGES7.1.159 The Indian Capital Goods Industry shareswith other industries the major hindrances to growthin the country, which are low scale of operation, tech-nological dependence, high input costs (raw materi-als, power, fuel, and high rates of interest on term loanand working capital), lack of world-class infrastruc-ture, and stringent labour laws.
7.1.160 Some of the problems specific to the sectorare purchase preference to CPSEs and unimpededimports of second-hand machinery.
STRATEGIES7.1.161 To encourage investment, assistance wouldneed to be provided for setting up of sector-specificparks in machine tools, textiles machinery, and heavyelectricals. Apart from general infrastructure, the parkscould also have CFCs such as testing laboratoriesand R&D centres. But the process would have to bedemand driven and the initiative would have to comefrom the industry.
7.1.162 On the same pattern as sector-specific parks,CFCs for existing clusters could be set up with facili-ties for testing, R&D, heat treatment, etc., on the modelof the IIUS scheme of the DIPP.
7.1.163 To bring some level playing between privatesector and CPSEs, the purchase preference policy forCPSEs would need to be discontinued.
7.1.164 The policy for import of second-hand capitalgoods in textiles and other areas should be reviewedand government assistance by way of interest subsidyon bank finance should not be provided for importsof such capital goods.
7.1.165 For attracting investors from abroad whohave the necessary technology in textile machinery,it is necessary to mount a campaign. It is also neces-sary to induce foreign companies manufacturingelectrical generation equipment to set up manufactur-ing facilities in the country by introducing an offset
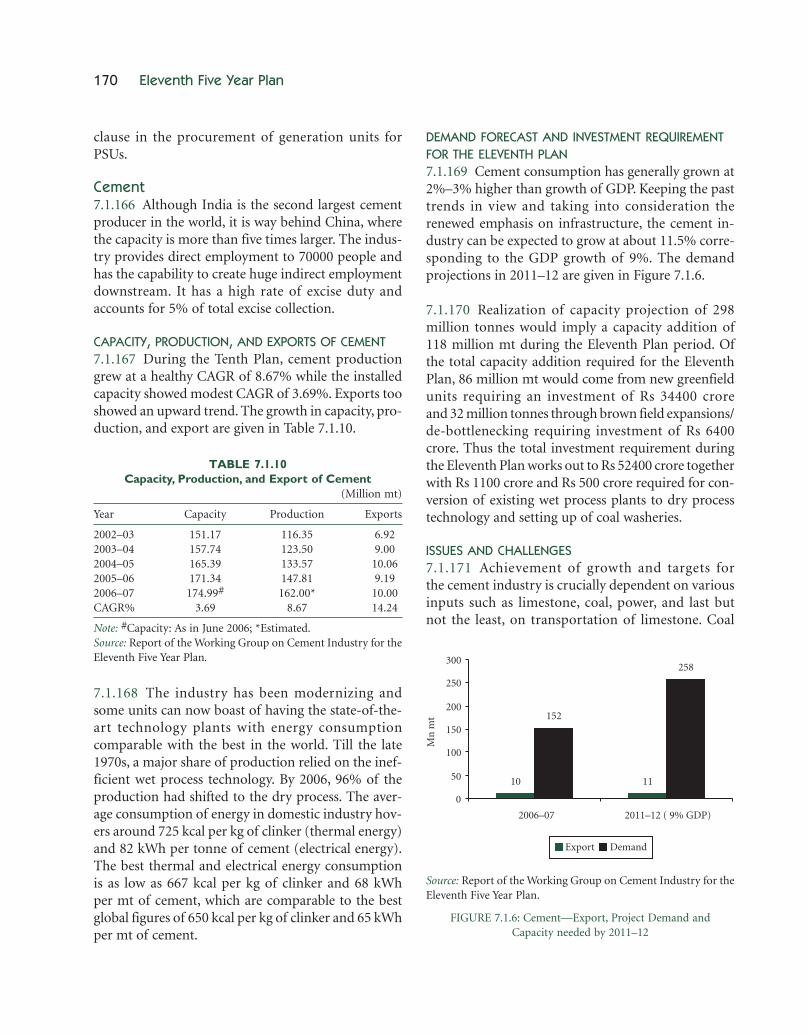
170 Eleventh Five Year Plan
clause in the procurement of generation units forPSUs.
Cement7.1.166 Although India is the second largest cementproducer in the world, it is way behind China, wherethe capacity is more than five times larger. The indus-try provides direct employment to 70000 people andhas the capability to create huge indirect employmentdownstream. It has a high rate of excise duty andaccounts for 5% of total excise collection.
CAPACITY, PRODUCTION, AND EXPORTS OF CEMENT7.1.167 During the Tenth Plan, cement productiongrew at a healthy CAGR of 8.67% while the installedcapacity showed modest CAGR of 3.69%. Exports tooshowed an upward trend. The growth in capacity, pro-duction, and export are given in Table 7.1.10.
TABLE 7.1.10Capacity, Production, and Export of Cement
(Million mt)
Year Capacity Production Exports
2002–03 151.17 116.35 6.922003–04 157.74 123.50 9.002004–05 165.39 133.57 10.062005–06 171.34 147.81 9.192006–07 174.99# 162.00* 10.00CAGR% 3.69 8.67 14.24
Note: #Capacity: As in June 2006; *Estimated.Source: Report of the Working Group on Cement Industry for theEleventh Five Year Plan.
7.1.168 The industry has been modernizing andsome units can now boast of having the state-of-the-art technology plants with energy consumptioncomparable with the best in the world. Till the late1970s, a major share of production relied on the inef-ficient wet process technology. By 2006, 96% of theproduction had shifted to the dry process. The aver-age consumption of energy in domestic industry hov-ers around 725 kcal per kg of clinker (thermal energy)and 82 kWh per tonne of cement (electrical energy).The best thermal and electrical energy consumptionis as low as 667 kcal per kg of clinker and 68 kWhper mt of cement, which are comparable to the bestglobal figures of 650 kcal per kg of clinker and 65 kWhper mt of cement.
DEMAND FORECAST AND INVESTMENT REQUIREMENTFOR THE ELEVENTH PLAN7.1.169 Cement consumption has generally grown at2%–3% higher than growth of GDP. Keeping the pasttrends in view and taking into consideration therenewed emphasis on infrastructure, the cement in-dustry can be expected to grow at about 11.5% corre-sponding to the GDP growth of 9%. The demandprojections in 2011–12 are given in Figure 7.1.6.
7.1.170 Realization of capacity projection of 298million tonnes would imply a capacity addition of118 million mt during the Eleventh Plan period. Ofthe total capacity addition required for the EleventhPlan, 86 million mt would come from new greenfieldunits requiring an investment of Rs 34400 croreand 32 million tonnes through brown field expansions/de-bottlenecking requiring investment of Rs 6400crore. Thus the total investment requirement duringthe Eleventh Plan works out to Rs 52400 crore togetherwith Rs 1100 crore and Rs 500 crore required for con-version of existing wet process plants to dry processtechnology and setting up of coal washeries.
ISSUES AND CHALLENGES7.1.171 Achievement of growth and targets forthe cement industry is crucially dependent on variousinputs such as limestone, coal, power, and last butnot the least, on transportation of limestone. Coal
Source: Report of the Working Group on Cement Industry for theEleventh Five Year Plan.
FIGURE 7.1.6: Cement—Export, Project Demand andCapacity needed by 2011–12

Industry 171
continues to be the main fuel for the cement industryand will remain so in the near future. At present,60% of coal requirement of the cement industry is metthrough linkages and fuel supply agreements, while theremaining requirement is met from open-market pur-chases, import, and use of petroleum coke. With thecapacity addition projected for the Eleventh Plan, theannual requirement of coal would substantially go upfrom the current level of 28.68 million tonnes to 57.97million tonnes by the end of the Eleventh Plan. Side-by-side depletion of higher quality of coal reserves andincreasing open cast mine would call for increasingbeneficiation of coal in the regional washeries.
7.1.172 The production of cement is a continuousprocess requiring uninterrupted power supply. Sincethe availability and quality of grid power supplycontinue to be a problem, the use of captive powerhas been increasing. Most of the cement units haveinstalled captive power generation capacities to theextent of 60% to 100% of their requirement. The cap-tive power generation capacity of cement industry isestimated to be 1825 MW at present, of which 61% isbased on diesel and the rest 39% on coal. With growinguncertainties of grid power availability, it is estimatedthat 2000 MW captive power would be required dur-ing Eleventh Plan.
7.1.173 Cement is a low-value and high-volume com-modity mainly concentrated near limestone depositsavailable in a few States. The main input coal is alsoavailable in a few States. In view of this, long leads ofmovement both for inputs and for outputs are requiredand the railways remain the only economical modefor such transportation. Against the envisaged level of60% movement of cement production by rail on macrolevel, the current share of dispatches through rail ac-counts for 39%–45% after continuous decline duringthe past decade. With the intended capacity additionin the Eleventh Plan, requirement of rail facilitiesfor movement of cement and clinker as well as otherinputs such as coal, granulated slag, and fly ash wouldincrease substantially.
7.1.174 The availability of cement grade limestone isessential for making technological and financialdecisions of the entrepreneurs for capacity addition
projected for the Eleventh Plan. The gross reserves ofcement grade limestone stood at 97430 million tonnesas on 31 March 2006 as under.
7.1.175 Out of 97430 million tonnes of gross reservesas on 31 March 2006, proven reserves are only 22931million tonnes. Since 50% of the proven reserves arelocated in inaccessible or ecologically sensitive areas,these would suffice only for the lifecycle of cementplant that would be existing at the end of the EleventhPlan period.
7.1.176 Modernization of the construction industryis heavily dependent on the availability of cement inbulk and ready-mix concrete (RMC) usage. However,bulk transportation of cement in our country accountsfor only 5% as against the global average of 70%. Like-wise use of RMC in construction activity is only 10%in India. RMC usage and bulk transportation of ce-ment complement each other with inherent advantagesof lower pilferage, higher consistency, and environ-ment-friendly application. A major limiting factor inbulk handling of cement is the small number of bulkcement terminals in the country. There are only tworail bulk cement terminals and three port-based bulkcement terminals in the country.
7.1.177 Ordinary Portland Cement is currently usedin the government/public sector for most of the con-struction activities. However, the performance require-ment of most constructions could be met by the useof Portland Pozzolana Cement/slag cement, and infact these types should be preferred as they conservenon-renewable resources.
STRATEGIES7.1.178 Additions to capacity to the tune of 118 mil-lion mt projected for the Eleventh Plan would becritically dependent on the measures adopted to miti-gate logistics-related issues. Substantial augmentationof railway capacity being envisaged in the EleventhFive Year Plan will help in meeting the requirements ofthe cement industry. However, to facilitate long-termplanning and to ensure that adequate handling andstorage facilities and wagon capacity are created, therailways should set up a consultative process with theindustry.

172 Eleventh Five Year Plan
7.1.179 Bulk cement transportation in specializedtankers, viz., railway wagons, trucks, or ships providebusiness opportunities to railways, truck, and cargooperators. Setting up bulk cement terminals wouldhelp in attracting huge investments. Wherever possiblethe railways could provide land on long-term lease forthe purpose.
7.1.180 Concerted efforts would be required to iden-tify new commercially exploitable limestone deposits.Joint exploration should be intensified by variousState departments of mines and geology in associa-tion with the Indian Bureau of Mines (IBM), MECL,etc., for exploring and identification of new limestonedeposit.
7.1.181 With a view to promoting the use of PPC andslag cement, construction codes of the Central andState Governments need to be appropriately modifiedto allow their use. Furthermore, in addition to stan-dards for slag and fly ash based cement, Bureau ofIndustrial Standards should work for setting standardsof cement using more than one waste material.
7.1.182 Installation of greenfield mini-cement plantsshould not be encouraged except in deficient far-flungareas, that is North Eastern States, J&K, etc. The ceil-ing on the capacity of a mini-cement plant should beremoved and they should be set free to use the mosteconomically viable technology.
Chemical Industry7.1.183 The chemical industry is an important con-stituent of the Indian economy with an estimated turn-over at around US$ 35 billion, constituting 1.5% ofthe global chemical industry estimated at US$ 2400billion. The total investment in the sector is nearlyUS$ 60 billion and the employment is about onemillion. It accounts for 13%–14% of total exportsand 8%–9% of total imports of the country. Gujaratdominates with 51% of the total share of major chemi-cals produced in the country. Various sub-sectorssuch as chloralkali, inorganic chemicals, organicchemicals, dyestuffs and dye intermediates, and agro-chemicals grew at varying rates during the Tenth FiveYear Plan, with inorganic chemicals recording thehighest CAGR at 10% and agro-chemicals the lowest
CAGR at 0.7%. The chemicals industry as a wholegrew at an average of 4.7% during the Tenth Five YearPlan. The industry expectation is that the sector maygrow in the range of 5%–8% during the Eleventh Plan(Annexure 7.1.9).
7.1.184 Increased competition resulting from global-ization is driving the chemical industry towards con-solidation, cost reduction, location of manufacturingbases close to raw materials, cheaper energy sources,lower tax regimes, increased use of information tech-nology (IT), and intensification of R&D activities.At the same time the industry is responding to theincreased environment consciousness worldwide.Consolidation has become imperative as the industryseeks economies of scale in manufacturing, logistics,and R&D. Cost reduction is being aggressively at-tempted through improved operating norms andfinancial restructuring. Enhanced worldwide concernfor the protection of the environment has been forc-ing the industry to modernize and innovate.
7.1.185 Over the last decade, the Indian chemicalindustry has evolved from being a basic chemical pro-ducer to becoming an innovative industry. With in-creasing investments in R&D, the industry is registeringsignificant growth in the knowledge sector compris-ing specialty chemicals, fine chemicals, and pharma-ceuticals. Broadly, the share of basic, knowledge, andspecialty chemicals is 57%, 18%, and 25%, respectively.Share of different segments of Chemical Industry inIndia is shown in Figure 7.1.7.
CHALLENGES7.1.186 The major hindrances for a double-digitgrowth of the Indian chemical industry are sub-optimal size of plants, higher input costs (raw materi-als, power, fuel, etc.), lack of world-class infrastructure(roads, ports, and power supply), lack of competitive-ness, and stringent labour laws. Without addressingthese issues it would be very difficult for the industryto compete globally with rapidly declining duty differ-entials and appreciation in the value of rupee. Some ofthe sector-specific challenges are:
• While peak duties on non-agricultural productshave been reduced from year to year, commensurate

Industry 173
reduction has not taken place on fuels, rawmaterials, building blocks, and feedstock, such asdenatured ethyl alcohol, flourspar, carbonblack feedstock, and molasses, that go into theproduction of various downstream value-addedchemicals.
• Tank terminals for such chemicals as methanol,ammonia, benzene have not been provided at criti-cal railway junctions.
• Although various laws have been enacted by thegovernment relating to air and water pollution,environment protection in general, hazardous wastemanagement, and product liability insurance, andthe government is a signatory to international trea-ties, conventions, protocols, and codes of conduct,there is lack of awareness in the industry about theselaws and international agreements.
• In 2007, the European Union had passed legisla-tion on registration, evaluation, and authorizationof chemicals (REACH). For compliance withthe provisions of this legislation it would be neces-sary for exporters to submit test data from accred-ited laboratories following good laboratorypractices (GLP). Until Indian laboratories are so ac-credited the exporters would have to get thetest data generated in foreign laboratories, whichwill be costly.
• The levels of R&D expenditure by the chemicalindustry in India are very low by internationalstandards.
STRATEGIES7.1.187 Duty structure on building blocks for thechemical industries needs to be reviewed with a viewto considering how far these can be brought on parwith those prevailing in the other emerging economies.
7.1.188 Railways should consult with the chemicalsindustry with a view to determining the locations inwhich it would be in their mutual interest to establishinfrastructure at ports to handle bulk chemicals andPetroleum, Oil, and Lubricants (POL) products.
7.1.189 Creation of R&D hubs with state-of-the-arttesting needs to be initiated in the PPP mode in theline of NATRIP.
7.1.190 The government should consider upgradingthe national laboratories such as the Indian Instituteof Chemical Technology, Hyderabad and the CentralDrug Research Institute, Lucknow to GLP standardsso that they can obtain accreditation from the Euro-pean Union (EU) bodies to enable them to generatetest data for compliance with REACH.
7.1.191 The government should regularly hold work-shops and seminars to disseminate knowledge relat-ing to environmental laws and related internationaltreaties and negotiations.
Drugs and Pharmaceuticals
OVERVIEW7.1.192 The Indian pharmaceutical industry registeredstrong growth during the Ninth and Tenth Five YearPlan periods and has emerged as an area of strengthespecially in generics. The adoption of world-classpatent laws for pharmaceutical products w.e.f.1 January 2005, pursuant to obligations under theWTO Agreement, has not dampened the robust growthbut has improved the overall IPR environment. Theturnover of the industry was Rs 72000 crore during2006–07, having risen by more than 12 times since1990. India has become one of the leading global
Source: Report of the Task Force on Chemicals, 2002, Departmentof Chemicals and Petrochemicals.
FIGURE 7.1.7: Share (Value of Output) of DifferentSegments of Chemical Industry in India

174 Eleventh Five Year Plan
players, holding fourth position in terms of volumeand thirteenth position in terms of value of produc-tion. Exports have also grown significantly to overRs 24942 crore in 2006–07, accounting for as much as34% of the turnover (Figure 7.1.8).
PRODUCTION AND EXPORTS OF PHARMACEUTICALS7.1.193 According to the report submitted in 2003 bythe committee headed by R.A. Mashelkar, the numberof drug manufacturing licenses issued was as follows:bulk drugs (1333), formulations (4534), large volumeparenterals (134), and vaccines (56) making the totalof 6057 manufacturing units. About 300 of these phar-maceutical units are large units.
7.1.194 India is one of the signatories of the WorldHealth Organization (WHO) certification scheme onthe quality of pharmaceutical products moving ininternational commerce. WHO GMP certificate isgranted after inspection by the Central Drugs Stan-dard Control Organization and the State LicensingAuthorities. The GMP, which involve both the premisesand the plants, are laid down in Schedule M of theDrugs and Cosmetics Rules 1945. The present Sched-ule ‘M’ provisions, which have become mandatorysince 1 July 2005, conform to international standardsand have a higher level of GMP that can lead to betterquality of products destined for both domestic and
international markets. Another important develop-ment is that the manufacturers and exporters aregoing beyond the WHO GMP and accepting regula-tory approvals from national agencies of importantforeign markets such as United States Food andDrug Administration (USFDA), UK Medicines andHealthcare Products Regulatory Agency, AustraliaTherapeutic Goods Administration, and South AfricaMedicines Control Council. With about 100 USFDAapprovals, India has the largest USFDA approvedplants outside the US. As the US is the largest marketfor pharmaceuticals, accounting for half of the world’sgenerics market, the focus of many Indian companieshas remained on the US generics market, with Indiaaccounting for almost half of Drug Master File (DMF)filings and one-fourth of Abbreviated New DrugApplication (ANDA) in the US in 2006. DMF is a docu-ment filed with the USFDA by a manufacturer ofbulk drug (Active Pharmaceutical Ingredient, API)offering API in the US market. ANDA is a documentfiled by a manufacturer of generic formulations(finished dosage form). Regulatory approval of DMFtakes two years and that of ANDA 30 months.
7.1.195 Production, domestic sales, and exports roserapidly during the Tenth Five Year Plan period.During the Tenth Five Year Plan domestic sales grewgenerally at the rate of 11%–15% and exports at the
Note: Estimated retail market in 2005–06 is based on ORG-IMS, for 2006–07 retail market includes institutional sales.
Sources: Export: actual—DGCI&S; estimate—Indian Pharmaceuticals Alliance; Domestic sales actual/estimated—ORG-IMS.
FIGURE 7.1.8: Domestic Sales and Exports of Pharmaceuticals (Rs Crore)
1767
4
2036
8
2127
3
3150
0
4700
0
1282
6
1521
3
1785
7
2211
6
2494
2
0
5000
10000
15000
20000
25000
30000
35000
40000
45000
50000
2002 03 2003 04 2004 05 2005 06 2006 07
Rs
Cro
re
Domestic Sales Exports

Industry 175
rate of 20%–26%. Industry estimates are that domes-tic sales will grow at the rate of 16% and exports at therate of 30%–35% during the Eleventh Five Year Plan,so that by the terminal year exports will constitute closeto 60% of the domestic production. The optimismabout increase in the export growth rates is based onthe fact that the sharp increase in DMF and ANDAfilings by Indian manufacturers in the US during theyears 2004–06 will begin showing its effect only fromthe year 2007–08, because of the time taken for regu-latory approvals. Projections for 2011–12 are givenshown in Figure 7.1.9.
7.1.196 India’s rich human capital is its greatest assetfor this knowledge-led industry. With US$ 60 billionworth of medicines coming off patents in the next fewyears, India is poised to emerge as one of the biggestplayer in the area of generics. The biopharmaceuticalsmarket is also evolving very fast and India could emergeas the largest vaccine producer in the world. Otherfavourable factors are the growing dependence on ge-nerics across the world, wide acceptance of Indian ge-neric products as safe and effective, aggressive thrustof Indian companies for building and acquiringsales, and marketing network abroad, entry of thirdand second tier Indian companies in the internationalmarket. The industry projection is that by the endof the Plan period the domestic sales will increase toRs 78000 crore (about US$ 19.5 billion) and exportsto Rs 112000 crore (US$ 28 billion).
RESEARCH AND DEVELOPMENT (R&D)7.1.197 Internationally, pharmaceutical companiesspend 15%–20% of their sales revenue on R&D,particularly for the discovery and development ofnew chemical entities. In the absence of the law forproduct patents before 2005, Indian pharmaceuticalcompanies had traditionally confined their researchactivities to processes rather than to products. Thelaw for grant of product patents on pharmaceuticalproducts has now been enacted. But few Indiancompany has the resources to pursue the cutting edgeresearch and take a new compound through all stagesup to marketing. However, Indian companies areadopting one of the following options to lower costsand mitigate risks:
• Collaboration with large R&D based MNCs eitherfor co-development or through the co-licensingroute.
• Work on existing molecules with proven market bydeveloping chiral molecules or race-mates currentlymarketed, or through new formulations of existingdrugs with beneficial characteristics of increasedefficacy and safety.
• Identify through clinical trials new indications formarketed drugs.
• Develop traditional medicines acceptable to globalmarkets.
7.1.198 Apart from the Indian companies investingin R&D, MNCs are setting up research facilities inIndia or entering into tie-ups with Indian companies.Astra-Zeneca of the UK, Altan Pharma of Germany,Eisai of Japan, and Ethy Pharma of France have setup R&D centres and wholly owned sub-sidiaries andEli Lily has entered into collaboration with Jubilant.More importantly, nine Indian companies (three inHyderabad, two each in Mumbai and Chennai, andone each in Bangalore and Vadodra) have entered busi-ness to exploit the outsourcing opportunities in drugdiscovery services and their clients include MNCs.International drug discovery companies are also in theprocess of setting up their presence in India.
7.1.199 Cost advantage has also resulted in the coun-try becoming a hub for clinical trials and MNCssuch as Pfizer, Johnson & Johnson, GSK, Merck, Eli
Source: Report of the Working Group on Drugs and Pharmaceu-ticals for the Eleventh Five Year Plan (2007–12).
FIGURE 7.1.9: Pharmaceuticals—Exports, Retail Sale andInstitutional Sale by 2011–12
47000
78143
112275
24942
2006–07 (Actual) 2011–12 ( Projected)
Exports Retail and Institutional sales
Total Rs 71942 crore
Total Rs 190418 crore

176 Eleventh Five Year Plan
Liliy, Novartis, and Novo Nordisk are using India as abase for running their Phase II and Phase III clinicaltrials. Quintiles, Icon Clinical, and Pharmaolam aresome of the foreign clinical research organizationsworking in India.
7.1.200 The enactment by the Parliament of world-class IPR laws has created the environment conduciveto the outsourcing of drug discovery and clinicalresearch to India. Apart from this, the adoption of GLPand Good Clinical Practices by Indian companies hasalso induced the outsourcing of these services. By someestimates, the global R&D expenditure on pharmaceu-ticals may touch US$ 100 billion by 2011–12 and ifoutsourcing is done from Indian companies. India’sshare at the end of the current Plan could be in therange of US$ 1–3 billion. Estimate from industry putsthe Indian Clinical Trial market at present at US$ 100million, which may increase to US$ 300 million in twoor three years.
PRODUCT PATENTS AND DRUG PRICES7.1.201 At the time of India’s decision to acceptthe WTO Agreement, there was a fear that the intro-duction of product patents in pharmaceuticals in thecountry would lead to the price of drugs becomingunaffordable for the poor people. This has not hap-pened and is not likely to happen on account of sev-eral factors. First, all the drugs included in the list ofessential drugs published by the Ministry of Healthare already in the public domain. Second, most of thepatented medicines introduced from time to time usu-ally bring about some improvement over the previousgeneration and their price cannot be far out of line withthat of the existing drugs. At any point of time thereare more than half a dozen patent expired therapeuticequivalents available. Thus the price competitionamong drugs in the same therapeutic group will auto-matically keep the prices of new entities under con-trol. The limited purchasing power of the Indian publicwill also act as a check on any dramatic rise in price.And ultimately recourse can be always had to the pro-visions on compulsory licensing and government usefor non-voluntary licensing of patented drugs.
7.1.202 India has had price control on drugs for a longtime but the span of control has been progressively
reduced. If the promise shown by this dynamic indus-try is to be realized and the figures of production andexport projected above are to be achieved, it would beimportant to maintain this trend even though the pricecontrol is consistent with WTO obligations. Concernsfor making medicines available at affordable pricesmust be met through alternatives other than by meansof control on the basis of cost plus pricing. The routeto lower prices is greater competition and that willhappen if new manufacturers find it attractive toenter the sector. Price control will diminish profits andturn entrepreneurs away from the sector and lower thecompetition. Furthermore, diminishing profits willlimit the capacity of firms to invest in R&D, which isthe soul of a vibrant pharmaceutical sector.
CHALLENGES7.1.203 According to a survey of the small-scale phar-maceutical companies in 2001–02, as many as 327 unitshad been closed or had their licenses suspended ormay have shifted to some other States and another370 units were not in a position to comply with theGMP norms. Since the GMP norms have been mademandatory with effect from 1 July 2005, these unitshave been closed.
7.1.204 If the Indian pharmaceutical sector is to liveup to the promise in both manufacturing and R&Dservices, the supply of science and pharmacy gradu-ates with quality education has to be substantiallyraised. In order to double the exports, the pharma-ceutical industry requires 1000 highly trained man-power every year for the next 10 years.
7.1.205 Since R&D in pharmaceuticals is a highly riskyventure, there is need to incentivize it through tax con-cessions on a permanent basis.
INTERVENTIONS7.1.206 In order to enable the small-scale sector toacquire GMP compliant facilities, it is necessary toprovide financial assistance to them through interestsubsidies.
7.1.207 The NIPER at Mohali has made a significantcontribution in providing human resources of theright calibre needed by the industry, academia, and

Industry 177
regulatory bodies. To meet the future demand of theindustry, it is necessary to replicate NIPER throughfive more institutes in different parts of the country.
7.1.208 The provision for weighted reduction of R&Dexpenses for corporate tax purposes should be madepermanent after the current validity expires.
7.1.209 The main Eleventh Plan Scheme is setting-upof five new NIPER like institutes in the PPP mode. Anallocation of Rs 514 crore has been made for these newinstitutes. The existing NIPER has been provided anallocation of Rs 164 crore for modernization and ex-pansion. An allocation of Rs 340 crore has been madefor a new scheme to support Schedule M complianceby SMEs in drugs and pharmaceutical sector by pro-viding interest subsidy to these units in Eleventh Plan.A new scheme with an allocation of Rs 75 crore hasbeen envisaged to assist the Pharma CPSEs to meetWHO pre-qualification.
Fertilizer Industry7.1.210 India is the fourth largest producer of fertilizersin the world after China, the US, and Russia. It meetsthe bulk of its substantial needs for nitrogenous andphosphatic fertilizers from domestic production butpotassic fertilizers’ needs are met through imports. Forthe production of phosphatic fertilizers, the countryrelies on imports of raw materials.
7.1.211 During the Tenth Plan the increase in con-sumption outstripped the slow growth in production,with the result that in the later years of the Plan period,imports registered strong increases (Annexure 7.1.10).
7.1.212 During the terminal year of the Ninth Five YearPlan (2001–02), the installed capacity of thedomestic fertilizer industry was 120.58 lakh metrictonnes (LMT) of nitrogen and 53.87 LMT of P
2O
5
(phosphate) per annum. In the absence of freshinvestment, the capacity of the fertilizer industryremained by and large stagnant during the Tenth Planperiod. The actual domestic production of urea in2005–06 was 200.98 LMT from 28 functional unitsand 13.25 LMT from the Joint Venture (JV) OmanIndia Fertilizer Company (OMIFCO) against the pro-jected demand of 242.14 LMT per annum urea by the
terminal year (2006–07). During the Tenth Five YearPlan various capacity additions such as BrahmaputraValley Fertilizer Corporation Limited revamp project,OMIFCO materialized. Thal III expansion of RashtriyaChemicals and Fertilizers Ltd (RCF) (11.55 LMT) andKrishak Bharati Co-operative Limited (KRIBHCO)-Hazira expansion Projects (10.56 LMT) could not betaken up due to lack of availability of natural gas/LNG.
7.1.213 There has been a significant growth in fertil-izer consumption over the years. The per hectareconsumption of NPK (nutrients) increased from lessthan 1 kg in 1951–52 to 106.7 kg in 2005–06. How-ever, the consumption is still much lower than thelevels achieved even in China and Pakistan. With agrowth rate of 4.1 per annum on the estimated baselevel consumption of 220 LMT in 2006–07, the totalnutrient consumption for 2011–12 is envisaged at269 LMT. The demand forecasts for ‘N’, ‘P’, and ‘K’ areestimated at 163.10 LMT, 72.90 LMT, and 33 LMT,respectively, in the terminal year of the Eleventh FiveYear Plan. This corresponds to a demand of 287.55LMT for urea, 95.10 LMT for di-ammonium phos-phate (DAP), 37.40 LMT for muriate of potash (MOP),93.30 LMT for complex fertilizers, and 36.45 LMT forSSP (Figure 7.1.10).
7.1.214 The Working Group on Fertilizer for theEleventh Plan has estimated that over and above thepresent installed capacity of 213.52 LMT of urea, a totalof 128 LMT of additional urea capacity can come upthrough revamp of existing gas-based units; newBrownfield expansion of plants such as Indo Gulf,RCF, KRIBHCO, and Indian Farmers Fertilizer Co-operative Ltd (IFFCO); JV abroad on the basis of cheapgas/LNG and revival of seven FCI and HFC plants byjoint venture or any other suitable model. Investmentof Rs 36000 crore may be required to increase thecapacity of urea by about 12 million mt by expandingdomestic units and reviving sick ones.
CHALLENGES7.1.215 The production of urea in the country isstill saddled with the legacy of the era of importsubstitution policies, when pursuit of self-sufficiencyled to the establishment of units based on inefficientfeedstock/fuel such as naphtha and fuel oils. Since the

178 Eleventh Five Year Plan
costs of production of these units were much higherthan those of units based on natural gas, the GoIintroduced the Retention Price Scheme (RPS). Eachurea unit had a unique retention price depending uponthe technology, feedstock used, capacity utilization,energy consumption, distance from the source offeedstock, etc., and the government paid to them thedifference between the retention price and the MRPfixed by the government for sale of urea to farmers. Asthe RPS was cost plus in nature and encouraged goldplating, it was replaced by the New Pricing Scheme(NPS) on the recommendations of the ExpenditureReforms Commission in 2000, to be implemented inthree stages: Stage I (1 April 2003 to 31 March 2004),Stage II (1 April 2004 to 31 March 2006), andStage III. Under the NPS, the existing units have beendivided into six groups on the basis of vintage and feed-stock for determining the group-based concession.Stage III has commenced on 1 October 2006, with somepolicy changes to encourage additions to capacity.An important decision taken is that the non-natural-gas-based units would have three years to convert intoNG/LNG units. But to make such conversion possible,issues have to be resolved relating to connectivity,supply, and price of gas.
7.1.216 While there is an increasing gap betweensupply and demand, a number of sick PSE units are
lying closed. Most of these units have excellent infra-structure in the shape of residential colonies, coal andelectricity tie-ups, railway sidings, etc., and revival ofthese units is a major issue that needs to be tackled.
7.1.217 Fertilizer use in India is inadequate,imbalanced, and skewed in favour of nitrogen, whichhas resulted in the emergence of nutrient deficienciesin Indian soils. As against the recommended N:P:Kratio of 4:2:1, the average for the country was 5.3:2.2:1in 2005–06. However, the average conceals variationwithin the States and the actual ratio in Punjab in thesame year was 20:6:1 and in Haryana 30:9:1. Balanceduse of fertilizers will have implications for the demandfor production and import of fertilizers.
7.1.218 India does not have sufficient quantities ofknown reserves of rock phosphates, and where avail-able these are of low quality. As a result, India has toimport large quantities of rock phosphates or phos-phoric acid.
7.1.219 Large quantities of urea, DAP, rock phos-phates, and MOP are being imported and the portsare not sufficiently equipped to deal with such largevolumes of imports. Absence of railway wagonsdesigned for the bulk movement of fertilizers isanother impediment that the industry faces.
Source: Report of the Working Group on Fertilizers for the Eleventh Plan.
FIGURE 7.1.10: Demand of Fertilizer by 2011–12.
75
28.5
73.6
28.75
287.55
95.1
37.4
93.3
45.6
243.05
Urea DAP MOP NPK SSP
(Lak
hT
on
ne)
2006–07 2011–12

Industry 179
STRATEGIES7.1.220 The most important element of futurestrategies relating to the urea industry is to establish asingle producer price, and with this end in view, theGoI has already decided on a sunset for non-gas-basedunits. For implementation of the decision, the issuesof connectivity, supply, and price has to be resolved.Pipeline connectivity already exists in respect of 22units and it is likely to become available to others inthe next few years. The units at Goa, Mangalore, andTuticorin are expected to be serviced by the RelianceGas Transportation Infrastructure Limited Chennai–Tuticorin pipeline and Chennai–Mangalore pipeline.Although in the past natural gas has been in short sup-ply even for gas-based units, it is expected that the newdiscoveries will make it possible to supply gas not onlyto them but also to the newly converted units. As forprice, a single producer price policy will necessitatethat the government ensures gas supplies to all ureaproducers at the same price.
7.1.221 Although currently the import parity pricesfor urea are ruling high, the fact remains that naturalgas is available in oil-rich countries at a much lowerprice than in India; an appropriate long-term policyshould be announced so that more joint ventures areset up such as the one in Oman.
7.1.222 Effort should be made to revive those unitsthat are revivable, including setting up of joint ven-tures with private sector participation.
7.1.223 Efficient use of fertilizers can be promoted byextension for adoption of better agronomic practices.However, the single most effective way for achievingefficient use of fertilizers will be to make subsidies foragriculture nutrient-based.
7.1.224 In order to ensure sufficient supplies of rawmaterials for phosphatic fertilizers, it is necessary tointensify exploration activities in India. Additionally,Indian companies must be encouraged to invest inmining and production of intermediates in resource-rich countries.
7.1.225 Port facilities need to be enhanced to enableefficient handling of imported fertilizers and fertilizer
material. The railways should also introduce speciallydesigned wagons for handling of fertilizers.
7.1.226 An outlay of Rs 20628 crore including abudgetary support of Rs 1492 crore has been made inthe Eleventh Plan, mainly to support conversion ofold fuel oil-based fertilizer units to gas-based ones andrestructuring of the CPSEs.
Leather and Leather Goods7.1.227 The importance of the Indian leather indus-try is derived from the fact that it is labour-intensiveand contributes substantially to exports. Artisans,micro enterprises, and SSIs account for 60% to 65%of the total production. The manufacturing activityprovides full-time employment to 1 million personsand activities connected with the recovery of hidesfrom carcasses provides part-time employment toanother 0.8 million. The turnover of the industrywas Rs 25000 crore in 2004–05, out of which Rs 10800crore (43%) was exported. Exports have risen inrecent years from US$ 1.9 billion in 2000–01 to US$2.9 billion in 2006–07. The composition of exports ofleather and leather goods has been moving increas-ingly toward leather footwear, but the share (32%in 2006–07) still falls far short of the 65% share offootwear in the world export of leather and leatherproducts (Figure 7.1.11).
7.1.228 The Inter-Ministerial Group constituted toevolve a comprehensive strategy for the developmentof the leather sector has assessed that India hasthe potential to expand exports from the level ofUS$ 2.7 billion in 2005–06 to US$ 7 billion in2011–12. The break-up of the projections is given inthe Figure 7.1.12.
7.1.229 Footwear is the component accounting for thelargest growth. In quantitative terms, the exports offootwear translate into 300 million pairs in the last yearof the Eleventh Five Year Plan period against 92 mil-lion pairs in 2005–06. This would require the creationof capacity of 750000 pairs a day against the capacityof 250000 pairs a day in 2005–06. If non-leather foot-wear is added, the required capacity for exports alonewill be 1 million pairs. Similarly the production ofleather garments would need to grow from 24 million

180 Eleventh Five Year Plan
pieces in 2005–06 to 72 million pieces in 2011–12, andof leather goods from 6 million pieces to 18 millionpieces in the same period.
7.1.230 However, before the above potential can berealized a number of challenges would need to beaddressed.
CHALLENGES• The indigenous raw material base of the industry
is deficient. As of now about 90% (1.8 billion sqft) of leather is produced in the country fromindigenous hides and skins. To achieve exportsof US$ 7 billion, 4 billion sq ft will be neededin 2012.
Source: Council for Leather Exports, India.
FIGURE 7.1.11: Indian Leather Exports—Changing Structure
Source: Inter-Ministerial Committee on Enhancement of the Competitiveness of Leather Industry, 2008.
FIGURE 7.1.12: Projected Growth of India’s Exports of Leather and Leather Products (in US$ Million)
Exports2000–01: US$ 1.9 billion2006–07: US$ 2.9 billion

Industry 181
• The tanneries in the country have low capacities andoutdated technologies with a majority of tanneriesstill using manual systems. During the Tenth FiveYear Plan, the scheme for IDLS under ILDP waslaunched for technology upgradation and modern-ization, but the funds could be utilized only to asmall extent because of delay in the finalization ofthe scheme.
• Another problem faced by the existing tanning units(in Tamil Nadu) has been the imposition of rigor-ous environmental requirement (Zero Liquid Dis-charge) by the State Pollution Control Board underthe directions of the Honourable High Court. Whilethe large units have been able to make additionalinvestment needed to comply with the requirement,the small-scale units do not have the financialstrength to do so without the government assistance.
• There is acute shortage of skilled and semi-skilledworkforce and it is estimated that if the full poten-tial is to be realized 0.5 million workers would needto be trained.
• A large majority of the manufacturers produce smallquantities and are unable to meet the large volumeorders from the US, which accounts for a largeshare of world imports. Also much of the footwearproduction in India is of dress shoes for men, whilethere is increasing requirement for comfort shoes.Ladies shoes are also not being manufactured forexports. What is needed is to scale up the produc-tion and diversify the product mix.
• The competitiveness of Indian exporters of leatherproducts suffers on account of bad roads, delays inInland Container Depots, and the fact that a largepart of Indian cargo from the eastern seaboard,where the production is concentrated, is trans-shipped at Colombo and Singapore. This is duemainly to the fact that the channels in the ports onthe eastern coast lack the depth necessary to allowlarge ships to come to these ports.
STRATEGIES7.1.231 In order to address the above challenges thefollowing significant interventions are proposed.
7.1.232 For augmenting the raw material base, rear-ing of male buffalo calves would be encouraged asalso scheme for modernization of slaughter launched
under PPP. For the better utilization of the skins offallen animals, a scheme will be launched in theDepartment of Animal Husbandry for establishing50 carcass centres, 20 bone-crushing plants, and 5000hide-flaying units.
7.1.233 In order to stimulate fresh investment in newtanning units as well as in leather products, it is pro-posed that at least 10 leather parks/complexes wouldbe established on the pattern of the SITP scheme ofthe Ministry of Textiles.
7.1.234 The Tenth Five Year Plan schemes, LeatherTanning Complex at Nellore (which did not take offduring the Plan period but in which the State Govern-ment has recently taken positive steps) and the Foot-wear Complex in Tamil Nadu (which has beensubstantially completed) need to be carried forwardinto the Eleventh Five Year Plan. It is also proposed tocontinue the Tenth Five Year Plan scheme for the IDLSbut the expenditure would be limited to the extent thatthe allocations remained unutilized in the Tenth FiveYear Plan.
7.1.235 The small and medium tanning units in TamilNadu and elsewhere would be assisted for making in-vestment to enable them to comply with rigorous en-vironment norms imposed by the Pollution ControlBoards. The GoI will provide 60% assistance, the re-maining amount coming from the State Governmentand the units themselves.
7.1.236 A large Human Resource Development Mis-sion will be launched for onsite training of workersand artisans in the unorganized sector and also forentrepreneurship development. The Mission will alsocover the development of skilled manpower by theexisting institutions, which offer courses at the degreelevel. The Footwear Design and Development Insti-tute (FDDI), Noida, will be provided with additionalmachinery, equipment, workshops, and laboratoryfacilities for running courses on design and technol-ogy with increased intake and a new branch of theFDDI will be set up at Fursatganj. Consideration willbe given to setting up more branches of FDDI in otherparts of the country with concentrations of leathermanufacturing units.

182 Eleventh Five Year Plan
7.1.237 In the Eleventh Plan an allocation of Rs 1300crore has been made for the ILDP.
Paper Industry
OVERVIEW7.1.238 Paper industry is one of the 35 high-priorityindustries in India and is presently growing at a rateof 6.3% per annum. The turnover is nearly Rs 17000crore per annum and its contribution to the nationalexchequer is around Rs 2500 crore. The industry em-ploys 0.3 million people directly and is estimated toemploy 1 million people indirectly. The per capitalconsumption of paper in India is 7.2 kg, which is farlower than in other emerging economies, for example45 kg in China, 15–20 kg in other East Asian coun-tries, and much higher level that exists in the US andEurope. The consumption of paper is likely to increasemanifold with the growth in the economy and the risein literacy.
7.1.239 At the end of the Tenth Five Year Plan therewere about 666 industrial units with the total installedcapacity of 8.50 million mt for paper and paperboard.However, 98 units with a capacity of 1.1 millionmt are closed due to environmental problems.The industry produces 5.80 million mt of paper andpaperboard. It has made significant progress afterindependence with government support and fiscalincentives. The country is almost self-sufficient inmost varieties of paper and paperboard, and importsare taking place only of certain specialty items suchas coated paper, cheque paper, etc. However, theindustry has failed to keep pace with the technologicaladvances and is beset with major difficulties suchas high production cost, pollution problems, and fin-ished paper quality not conforming to internationalstandards.
7.1.240 The Indian paper industry is highly frag-mented and 458 mills are of capacities less than 60tonnes per day (tpd), 48 are of capacities rangingfrom 60 tpd to 100 tpd, and 62 are of capacitiesabove 100 tpd. A variety of fibrous raw materials,viz., bamboo, hardwoods, agricultural residues, andwaste paper are being used for paper-making in thecountry.
7.1.241 From the raw material perspective, the indus-try can broadly be divided into three segments, namely,wood based, agro based, and recycled fibre based.The contribution of these towards production is 30%,32%, and 38%, respectively. The industry lacks abun-dant raw material here in the country and increasingquantities of waste paper and wood pulp are being im-ported. The imports of waste paper increased fromabout 1.4 million mt in 2004–05 to about 1.8 millionmt in 2005–06. During the same period, the import ofwood pulp increased from 378432 mt to 472391 mt.The production, import, and export of paper andpaperboard are given in Annexure 7.1.11. The produc-tion has shown a slow increase during the Tenth FiveYear Plan.
NEWSPRINT INDUSTRY7.1.242 The paper mills producing newsprintconforming to BIS and supplying to newspaper pub-lishers are considered for inclusion in Schedule ofNewsprint Control Order 2004, enabling them to availexemption of the excise duty. There are at present 77mills including 2 Central public sector units and 2State public sector units which are manufacturingnewsprint paper with a total installed capacity of15.9 lakh mt. The domestic production was 9.1lakh mt in the year 2005–06 and 10.3 lakh mt in2006–07.
7.1.243 The production, import, and export of news-print during the last four years are as given in Annex-ure 7.1.12.
ISSUES AND CHALLENGES7.1.244 The paper industry uses wood, agri-residue,and waste paper as raw materials with all the three seg-ments contributing equally to the production. The useof non-wood raw material and waste paper has in-creased over the years and accounted for about 70%of total production at the end of the Tenth Five YearPlan period. With the liberalization of trade, the do-mestic industry has been exposed to increasing com-petition, and both product quality and price have comeunder pressure. While production has been increasinggradually, growth of the industry is hamstrung by thenon-availability of particularly forest-based raw ma-terial. From the angle of this important industry, it has

Industry 183
become imperative that there is a paradigm shift inthe management of forest from a ‘conservation-centred’ to a ‘production-centred’ approach.
7.1.245 No major greenfield integrated pulp and pa-per mill has come up in a decade. Raw material short-age is undoubtedly a major factor contributing to thestagnation of production capacity. Low per capita con-sumption of paper in the country and rising literacylevels present opportunities for growth of this indus-try. Steps are required to improve competitiveness ofthe industry which should specifically focus on theproblems of technological obsolescence and economicuse of water and energy as well effluent treatment tomitigate environmental problems.
STRATEGIES7.1.246 The foremost problem that needs to be ad-dressed is increasing the raw material base of theindustry. Vast opportunities exist on degraded forestland but the rights of local communities and theprinciple of JFM constitute an insurmountableobstacle in leasing out such land to paper mills. If theselands remain bereft of forests for prolonged periods,the issue would need to be revisited. In the meantime,wastelands should be considered for developingforests under appropriate PPP arrangements, withthe participation of local communities. The State Gov-ernments also need to consider ways of stimulatingagro-forestry.
7.1.247 A programme should be put in place forincentivizing the SMEs to adopt energy-reducing andless water-intensive technologies and to take adequatesteps for effluent treatment.
Petrochemical Industry7.1.248 Internationally the petrochemical industryhas been one of the drivers of industrial development,constituting 40% of the global chemical market.During 1950–90 countries West of Suez were domi-nating in the manufacture of petrochemicals butafter that the global epicentre shifted to East ofSuez, largely due to the availability of crude oil andnatural gas in the Middle East and the growth ofconsumption centres in Asia, which has a large popu-lation base.
7.1.249 With 15 raw material producers and morethan 50000 downstream processing units, the Indianpetrochemical industry has a share of about 2.5% ofthe global petrochemicals production capacity. TheIndian petrochemical industry consists of buildingblocks, commodity polymers, performance plastics,synthetic fibre, synthetic rubber, surfactants, anddownstream plastic processing industry. Domesticdemand growth for petrochemicals has slowed downduring the Tenth Five Year Plan as compared to theprevious Plan period. The production of commoditypolymers and synthetic fibre which grew modestlyduring the Tenth Plan is presented in Annexure 7.1.13.
7.1.250 The downstream plastic processing sector ishighly labour-intensive, currently providing employ-ment to 3.3 million people but having the potential togenerate 3.7 million new jobs by 2011–12. Domesticindustry is extremely fragmented and operating withsub-optimal scale of operation, which is inhibiting itsinternational competitiveness. This is mainly due tothe government’s past policy of reservation of variousplastic products for exclusive manufacture in small-scale units and excise duty exemptions for them. Thescale of operation in downstream plastic processingindustry is sub-optimal in the country as can be seenfrom Figure 7.1.13.
7.1.251 Imports of plastic products from China andThailand into India have increased rapidly in the re-cent years due to non-availability of quality plasticproducts in the country. Recognizing the economic
Source: Industry Association, Report of the Working Group onPetrochemicals Sector, Eleventh Five Year Plan.
FIGURE 7.1.13: Relative Scale of Operation ofPlastic Processing Industry (unit size in tons per unit)
1333
1111
682
673
588
179
0 200 400 600 800 1000 1200 1400
USA
Germany
China
Brazil
Canada
India

184 Eleventh Five Year Plan
benefits and employment potential of the downstreamsector, China had first developed the plastic process-ing sector and is the largest global exporter of plasticgoods worth of US$ 18 billion compared to India’s US$1 billion. After establishing globally competitive down-stream processing industry, China started focusing onupstream cracker investments to increase their rawmaterial and intermediate security.
7.1.252 India’s competitiveness in the plastic process-ing industry is likely to improve in the future becausein January 2007 and March 2007 the government hasde-reserved 70 out of 84 items. Further the Micro,Small, and Medium Enterprises Act 2006 has raisedthe limit on investment in plant and machinery forSSIs from Rs 1 crore to Rs 5 crore.
7.1.253 According to the assessment of the WorkingGroup on the Petrochemical Sector for the EleventhPlan, the demand for polymers in the country hasthe potential to reach 12.5 million mt by the endof the Eleventh Five Year Plan growing at a CAGRof 18% necessitating commissioning of 5 additionalcrackers of 1 million mt average size with investmentsof US$ 8 billion and US$ 6 billion investments inthe downstream plastic processing sector by 2011–12.The existing naphtha and gas cracker plants atPata and Haldia are under expansion and new upcom-ing investments are in the Crackers at Panipat andJamnagar and Assam with an investment of Rs 32000crore.
CHALLENGES7.1.254 The polymer industry has not grown becauseof stagnation in the processing industry on account ofstructural factors, viz., fragmentation of the industryon account of reservation of manufacturing forSSIs. Now that this problem has been resolved, mod-ernization and achievement of scale economies needto be incentivized. The high level of 16% excise dutieson polymers and articles of plastic dampens thedemand. If the excise duty is lowered the demand willbe stimulated.
7.1.255 At a time when growth in the processing in-dustry is likely, it would be important to ensure thatthe industry adopts the highest quality standards.
Although India is late in making its presence felt inthe international markets in plastic products, highquality products can enable the industry to make upfor the lost time.
7.1.256 To facilitate modernization, special effort willbe needed for improvement of infrastructure in thevicinity of existing and proposed industrial units.
7.1.257 If expansion of the industry takes place atthe scale that is envisaged, additional manpowerrequirement will be of 6 lakh including 1.4 lakh skilledworkers. The training arrangements will have to bestepped up.
7.1.258 The use of plastic conserves natural reservessuch as wood, metals, etc., for better productiveuse.Plastics can boost agricultural growth throughplasticulture, better access to potable water, layingdurable roads based on polymer-modified bitumen,and can save precious materials currently used in con-struction industry. The challenge is to persuade theusers to use plastics in preference to more scarce alter-natives derived from natural resources.
STRATEGIES7.1.259 Consideration should be given to the reduc-tion of excise duties on polymers and plastic productsin order to stimulate demand.
7.1.260 The use of BIS specifications should be mademandatory for both domestically produced and im-ported articles of plastic for identified areas.
7.1.261 Since with enhanced demand both petro-chemical producers and processing industry will bebenefited, a joint effort of promoting polymer appli-cation in non-traditional areas should be initiatedthrough their associations.
7.1.262 At present, CIPET is entrusted with provid-ing the middle-level manpower requirement of theprocess industry. CIPET is creating technical man-power for the process industry in its 15 branches atdifferent parts of the country and till date it has cre-ated 27000 professionals since its inception 40 yearsago. In view of the projected demand of 1.4 lakh skilled

Industry 185
plastic professionals during the Eleventh Plan, theintake capacity of each centre may be enhanced.
7.1.263 PCPIRs should be established with dedicatedplastic parks to stimulate new investment activity inthe sector. Cluster development programmes such asin the IIUS of DIPP also need to be undertaken for theexisting clusters.
7.1.264 The Eleventh Plan allocation for CIPET isRs 136.50 crore including an Organization of thePetroleum Exporting Countries (OPEC) loan of Rs 55crore. The Assam Gas Cracker Project has beenapproved by the government in 2006. The project isbeing implemented by a joint venture company, withGas Authority of India Ltd (GAIL) having 70%equity participation. The joint venture companynamely M/s Brahmaputra Cracker and Polymer Ltd(BCPL) was incorporated during January 2007 forimplementation of this project.
Shipbuilding and Ship-repair Industry
SHIPBUILDING
Overview7.1.265 The Indian shipbuilding is mainly centredaround 27 shipyards comprising 8 public sector (6yards under Central Government and 2 under StateGovernments) and 19 private sector shipyards. Theshipyards between them have 20 dry docks and 40slipways with an estimated capacity of 281200 DeadWeight Tonnage (DWT). A major share of this capac-ity is held by the 8 public sector yards and only CochinShipyard Limited (110000 DWT) and HSL (80000DWT) have the required infrastructure and gravingdock to build large vessels.
7.1.266 After a pronounced boom in the mid-1970s,the global shipbuilding industry experienced a pro-longed depression for more than 20 years, which lasteduntil the end of the Tenth Five Year Plan. Since thenanother boom has set in and the outlook of the ship-building industry has been transformed. At the begin-ning of the Eleventh Five Year Plan, the order bookposition of Indian shipyards was very healthy. Privateshipyards are severely limited by capacity and the size
of ship they can build. However, five of them are inthe process of expanding or setting up new capacities,including for building Very Large Crude Carrier(VLCC) size ships, with an investment in the regionof Rs 4000 crore.
Production and Export7.1.267 The growth of shipbuilding in India has goneup from 4.5% in the Ninth Five Year Plan period to15% per year in the Tenth Five Year Plan period, andIndia’s share in the world market from an insignifi-cant 0.1% in the beginning of Tenth Plan to 1.3% in2006. On the export front, one public sector shipyard,that is Cochin Shipyard Ltd (CSL), and three privatesector shipyards, viz., ABG, Bharati, and Chowgule,performed remarkably well during the Tenth FiveYear Plan period and were able to get export orders.The Indian ship-repair industry is having an averageturnover of around US$ 76 million. The ship-repairmarket potential is much more than what is presentlybeing undertaken.
7.1.268 A meagre six ships were exported in the NinthFive Year Plan but orders for export of more than50 ships have been taken by Indian yards in the TenthFive Year Plan. Against 0.3 million DWT exportedduring the Ninth Five Year Plan, the order book forexport is more than 1.0 million DWT and the projec-tions for the Eleventh Five Year Plan are about 4.00million DWT. The bulk of the export is in the small-ship segment where India has emerged as a majorsupplier, and for the construction of offshore and oilindustry ships such as Offshore Supply Vessels (OSVs)and anchor handling tugs. From an inward-lookingindustry dependent on government orders, the Indianshipbuilding industry has emerged as a competitiveexport-led industry.
Market Potential7.1.269 As per Indian National Shipowners Associa-tion (INSA), the total tonnage required to be addedin the Eleventh Plan will be around 5.33 million GTinvolving about 455 vessels, and the investmentrequired will be Rs 55000 crore.
7.1.270 The annual average global order book grewby 78.86 million DWT in the period 2001–05 and in

186 Eleventh Five Year Plan
excess of 100 million DWT in the last two years. Of theRs 14000 crore worth vessels on order in the Indianyards, nearly 68% are for foreign buyers. Clearly theoutlook for the Indian shipbuilding industry is verybright and a faster growth of shipbuilding capacity isimperative for seizing the opportunity presented by thecurrent boom. Projected shipbuilding order book turn-over in Eleventh Five Year Plan is given in Table 7.1.11.
TABLE 7.1.11Projected Shipbuilding Order Book Turnover
2006–07 2007–12
Order book (Mn DWT) 1.3 5.00Global order book (Mn DWT) 231.2 231.2India’s share of global order book 0.4% 2.2%Delivery (Mn DWT) 0.65 2.50Turnover (US$ Billion) 0.65 2.50Shipbuilding industry % of GDP 0.04% 0.16%Total employment 12000 78000
Source: DIPP.
Investment7.1.271 The Indian Shipbuilders Association hasestimated that the industry can grow at a rate of morethan 30% and this momentum can be maintained forthe next 10 years to reach a level of 5 million DWTorder book for the Eleventh Five Year Plan as against1.3 million for the Tenth Five Year Plan.
Challenges7.1.272 Shipyards get orders only if they are credible(i.e., deliver quality ships on time) and it can be cred-ible only after successfully executing consistentlyunder international competition. During the TenthFive Year Plan the industry has demonstrated its in-ternational competitiveness and the ability to respondto a buoyant market. The main challenges are remov-ing the policy impediments, ensuring a stable environ-ment, and encouraging R&D, design, and productivityimprovement.
7.1.273 The Working Group has highlighted that costcompetitiveness of Indian yards was affected on ac-count of service tax, custom duty on ships manufac-tured in Indian yards, high excise duty on raw materialsand capital goods required for manufacturing ships,etc. While foreign shipping companies are building
their medium and small merchant ships in India,Indian shipping companies are purchasing their shipsfrom abroad, both big and small but more big thansmall. The present fiscal and statutory rules on ship-building in the country are heavily loaded in favour ofexport and discourage construction of ships by Indianyards for the Indian flag.
7.1.274 The shipbuilding subsidy has been the mainpromotional instrument for the shipbuilding indus-try. The shipbuilding subsidy scheme has been oper-ating since 1971 for Central public sector shipyards.The scheme was discontinued in 1975, was laterre-introduced in 1977, and was modified in August2000. The shipbuilding subsidy up to 2002 has beenused as a measure for revival of public sector ship-building. Re-modified subsidy scheme introduced in2002 discontinued Interest Differential Subsidy upto5% and extended the benefits to 30% subsidy onthe price of the ship to private sector yards also. Thesubsidy has clearly been a major contributing factorin enabling the industry to get a foothold in the inter-national market. It is also a fact that the major ship-building nations of the world have been grantingshipbuilding subsidies in the past.
7.1.275 In order to be able to join the league of majorshipbuilding nations, the industry needs to under-take design development and R&D. With the chang-ing technological environment, increasing applicationof information technology, and changes in safetynorms, it is imperative for shipyards to keep pace withsuch developments to meet emerging classificationstandards.
Strategies7.1.276 It is necessary to examine in depth the impactof the fiscal regime on the Indian shipbuildingindustry to see if any corrective measures need to betaken. In particular, the reasons have to be ascertainedfor the preference of the Indian shipping industry topurchase from foreign sources and remedial measurestaken.
7.1.277 It has become apparent that the existing ship-building subsidy scheme cannot be continued indefi-nitely when boom conditions are prevailing in the

Industry 187
international market. However, a gradual phase downrather than sudden termination may seem to becalled for.
7.1.278 The R&D institutional set up serving the ship-building sector needs to be reviewed and strengthened.The R&D scheme in the shipbuilding sector will haveto cover projects for industry-wide improvement inknowledge base, standardization, and skill develop-ment. The government should extend budgetarysupport for R&D in shipbuilding.
7.1.279 An allocation of Rs 170 crore has been madein the Eleventh Plan for R&D in the shipbuildingsector.
SHIP-REPAIR INDUSTRY
Overview7.1.280 Unlike the shipbuilding industry, which ex-periences cyclical downturns and upturns, the ship-repair industry is evergreen. Ship-repair yards generallyhave a continuous and consistent flow of business andrevenue generation is more predictable. Anotherattractive feature of the ship-repair industry from theIndian perspective is its job-creating potential on theone hand and the availability of skilled personnel onthe other.
7.1.281 Unlike in some other countries where shiprepairs are done mainly in dedicated units, in Indiathere is only one dedicated unit and all the other yardscarry out ship repairs and shipbuilding side by side.Ship repairs are also carried out in dry docks and float-ing docks. The Indian ship-repair industry is regulatedthrough ship-repair units (SRUs), which are registeredand licensed by the Director General of Shipping toenable them to avail customs duty and other conces-sions. There are 35 SRUs of which only 7 SRUs havebeen registered on a permanent basis.
PERFORMANCE AND MARKET POTENTIAL7.1.282 During the Tenth Five Year Plan the industryachieved an annual turnover of about Rs 436 crore.The Tenth Five Year Plan had envisaged that Indiawould emerge as a dominant ship-repair centre chal-lenging Dubai, Singapore, and Bahrain. This did not
happen because, inter alia, the industry turned its at-tention to shipbuilding in response to the prevailingboom conditions. The Working Group has assessed theannual market potential for ship repairs in India to bebetween Rs 2440 crore and Rs 2790 crore. Of thisalmost 50% will be accounted for by foreign ships onoverseas trade visiting Indian ports, and the remain-ing by domestic ships engaged in overseas trade,coastal/service vessels, offshore rig repairs, navy andcoast guard vessels, and other merchant vessels in theregion.
Challenges7.1.283 While the Indian shipbuilding industry isbenefiting from an unprecedented boom, the ship-repair industry is in the doldrums. One of the reasonsis poor productivity. The Yiu Lian Dockyard Ltd, thebiggest shipyard in China, has steel renewal capacityof 250 mt per day as against 5 mt per day at best inIndia, and sand/grit blasting capacity of over 15000 sqm per day against around 1000 sq m per day in India.It takes 6 to 7 days in India to blast the outer hull of a30000–40000 DWT ship and 50 days to replace 250mt of steel in India against just one day in China foreach of these operations. Since the time taken for shiprepair of the essence for competitiveness, the longertime taken by the Indian ship-repair industry makes itless competitive.
7.1.284 The existing docking facilities in India havenot grown to meet the requirements of the moderntonnage with only the two CPSEs, Cochin ShipyardsLtd and Hindustan Shipyards Ltd, able to provide drydock and repair facilities for large size vessels. There isno dry dock facility for VLCC class of vessels, whichare bound to increase in number on the west coast withthe commencement of new refineries in Gujarat. EvenSuezmax size vessels do not have dry docking facilitiesin the country. Further, the 13 dry docks and 1 float-ing dock in existence in the major port trusts areunderutilized for the repair business.
7.1.285 While exemption is available to SRUs fromboth customs duty and excise duty, no such exemptionis available in respect of service tax. The service tax of12.24% has made the industry uncompetitive vis-à-visship repairers in Bahrain, Dubai, and Singapore.

188 Eleventh Five Year Plan
Customs clearance procedures also are time consum-ing and impose costs on the industry.
Strategies7.1.286 The CPSEs are the engines of growth in shiprepairs. While the private sector units will no doubtrespond to market demands by creating the capacityfor repair of large size ships and to improve produc-tivity, it is also necessary to make additional invest-ments toward this end in the CPSEs, particularlythe CSL and HSL. Further the reasons for under-utilization of dry dock and floating dock facilitiesin major ports need to be examined and correctivemeasures taken.
7.1.287 The possibility of exemption of the ship-repair industry from service tax and improvement ofcustoms procedures for speedy clearance of importconsignments of spare parts needed for ship repairsneed to be examined.
Steel Industry
OVERVIEW: PRODUCTION, IMPORT, AND EXPORT7.1.288 The Tenth Five Year Plan has seen robustgrowth of the steel industry with significant increasesin both production and consumption. Crude steel pro-duction grew at the rate of 9.8% annually from 34.83million tonnes in 2002–03 to 50.88 million tonnes in2006–07 (provisional). This growth was driven by bothcapacity expansion (from 40.41 million tonnes in2002–03 to 56.84 million tonnes in 2006–07) and im-proved capacity utilization (from 86% in 2002–03 to89% in 2006–07). The year-wise production, availabil-ity, consumption, export, and import of finished steelin the Tenth Plan are presented in Annexure 7.1.14.
7.1.289 The average increase in production during theTenth Five Year Plan was 3.7 million tonnes per an-num compared to just 1.1 million tonnes per annumin the Ninth Five Year Plan (1997–2002), and the an-nual growth rate of steel consumption doubled to 9.8%in the Tenth Five Year Plan compared to only 3.8% inthe Ninth Five Year Plan. Capacity creation during thelast decade after deregulation has taken place entirelyin the private sector. As a result, there has been a no-ticeable shift towards the private sector both at the
crude and finished steel stages. Private sector during2006–07 accounted for 67% of the total crude steeloutput compared to 41% in 1992–93 and 74% ofthe total finished steel output compared to 54% in1992–93.
7.1.290 The National Steel Policy 2005 has projectedconsumption to grow at 7% based on GDP growth of7%–7.5% and production capacity of 110 milliontonnes by 2019–20. The estimates have been revisedupward by the Working Group. In the ‘Most Likely’scenario of 9% GDP growth, demand for steel is pro-jected to be 70 million tonnes by 2011–12. Therefore,it is envisaged that in the next five years, the demandwill grow at a considerably higher annual average rateof 10.2% as compared to around 7% growth achievedbetween 1991–92 and 2005–06.
7.1.291 Several existing steel mills have planned ex-pansion of capacity and there are new investments in-cluding foreign investment in the pipeline. The publicsector units, namely, SAIL and RINL, are planning toincrease production of crude steel from a level of 16million tonnes per annum in 2006–07 to 30 milliontonnes per annum by 2011–12. The Eleventh Five YearPlan Working Group on the steel industry has esti-mated that the capacity that will actually come up bythe terminal year will be 80 million tonnes per annumof crude steel.
7.1.292 The world steel industry has been buoyedup by the frenetic pace of growth in the consumptionand production of steel in China. The world crudesteel production grew from 0.850 billion tonnes in2001 to approximately 1.24 billion tonnes in 2006recording a growth of 7.9% per annum comparedto a mere 2% annual growth recorded between 1995and 2001. China’s steel production rose by more than210 million tonnes since 2001 to reach a level of 423million tonnes in 2006. Today more than 34% of theglobal steel production is attributed to the Chineseeconomy. The World Steel Dynamics in its latest fore-cast for next 15 years (June 2006) projects global steeldemand at least at a rate of 3.1% per year till 2015. Theimpetus for expansion of steel capacity in India hascome from the expected expansion of the domesticdemand.
Industry 189
7.1.293 The Indian steel industry has withstood in-ternational competition despite the reduction of basiccustoms duty on steel from 25%–30% in 2002–03 to5% in 2006–07. By the end of the Tenth Five Year Planthe industry was fully geared to operate in an openeconomy where exports and imports respond to in-creases or decreases in the domestic demand drivenprimarily by market signals. While exports of finishedcarbon steel were sustained at a level of 4–5 million mtper annum during the Tenth Five Year Plan importsincreased sharply from about 1.5 million mt in 2002–03 to 4.10 million mt in 2006–07 (provisional), it wasnot because of fall in competitiveness but rather to fillup supply–demand gap in the domestic market.
CHALLENGES7.1.294 If steel production is to increase to the pro-jected levels by the end of the Eleventh Five Year Plan,there would be a large requirement of raw materialsand other inputs. The indicative requirements thathave been worked out by the Eleventh Five Year PlanWorking Group are presented in Annexure 7.1.15.
7.1.295 The challenge arises from the fact that ironore resources in the country are depleting, aided bythe rapid growth of exports, and high grade cokingcoal needed by the industry which is in short supply,globally leading to hardening of prices from US$ 48per mt FOB Australian ports in 2003 to US$ 115 permt in 2006. Although non-coking coal reserves inthe country are adequate, the production of the rawmaterial is constrained by low investment by CoalIndia Ltd. An added problem of the Indian steel in-dustry is that adequate sintering and pelletizationcapacities do not exist in the country as a result ofwhich steel mills rely on lump ores and fines have tobe necessarily exported.
7.1.296 A related problem is that of movement ofraw materials such as iron ore, non-coking coal, andlimestone from the mines to the plants. Large volumesof coking coal would have to be moved from the portsto the plants, which are mostly situated inland. Thequality of transport infrastructure in the countryimposes huge costs on the steel industry and withincreased quantities needed to be moved the problemwill increase.
STRATEGIES7.1.297 It would be necessary to monitor the exportsof iron ore from the country with a view to ensuringthat supplies to the Indian steel plants are not affected.Export duty has already been imposed and it isexpected that the exports would come down. At thesame time, for assured metallurgical coke supplies,the possibility should be explored of an arrangementwith China to swap iron ore for metallurgical coke. Toincentivize the development of sintering and pelleti-zation capacities consideration should be given forfiscal concessions to the industry.
7.1.298 Increased movement of input and outputfrom the steel industry will be considerably facilitatedby the investment envisaged in the Eleventh Five YearPlan in road, rail, and ports. The financing plan of portsalready takes into consideration the likely increase inimports of coking coal. Since the internal movementof bulk raw materials will be largely by rail, and pro-jected increases of movement are very large, the rail-ways should set up joint consultative machinerywith the industry to ensure that the requirementsof the industry are fully factored into the plans of therailways.
7.1.299 In steel sector, in the Eleventh Plan, the out-lay of Rs 37318.18 crore includes the budgetary Rs 216crore only. Out of total allocation of Rs 37318.18 crore,SAIL and RINL account for Rs 27409 crore andRs 9569.18 crore, respectively. The budgetary supportis for the restructuring of CPSEs in steel sector and forsome of the ongoing and new R&D schemes.
Sugar Industry7.1.300 India is the largest producer–consumer ofsugar in the world. The sugar industry is the secondlargest agro-based industry, next to textiles in the coun-try. About five lakh workers are directly employed inthe sugar industry besides many more in industries,which utilize by-products of sugar industry as rawmaterial. The country has 582 sugar factories with anaggregate capacity of 197.97 lakh tonnes. The owner-ship-wise break up is given in Figure 7.1.14.
7.1.301 As a result of a conducive policy environmentresulting from progressive decontrol and favourable

190 Eleventh Five Year Plan
monsoon, sugar production in the country experi-enced strong growth in the last four years of theNinth Plan to reach an all time high level of 201.32lakh tonnes in 2002–03. After a decline due to failureof monsoon in some States during 2003–04 and2004–05 seasons, domestic production again pickedup, achieving the estimated level of 283 lakh tonnesin 2006–07.
7.1.302 Out of 582 sugar-producing units in the coun-try, 410 are in the small segment, with 228 having acapacity of 2500 Metric Tonnes Crushed per day (TCD)and 282 having a capacity of 2500 to 5000 TCD. Mid-size segment has 64 units with capacities higher than5000 TCD but below 10000 TCD, while only 8 unitsare large, having capacities of 10000 TCD and above.The position regarding production, internal consump-tion, and export of sugar during 2002–03 to 2005–06are given in the Annexure 7.1.16.
POLICY INTERVENTIONS7.1.303 While the sugar industry has benefited fromthe withdrawal of industrial licensing under theIndustries Development and Regulation Act 1951 andthe abolition of stockholding and turnover limits onwholesalers/dealers, it is still subject to a number ofpolicy interventions as described below:
• The industry is subject to statutory minimum price(SMP) for sugarcane fixed by the Central Govern-ment from year to year on the basis of the recom-mendations of the CACP taking into account cost
of production of sugarcane, return to growers fromalternative crops, fair consumer price of sugar,etc. SMP is fixed after consulting the State Govern-ments and associations of sugar industry and canegrowers.
• While the policy of blanket control on sugar underEssential Commodities Act 1955 has been discon-tinued, a policy of partial control and dual pricingis still in operation. Under this policy, a certain per-centage of sugar production in factories is levied bythe government on a pre-fixed price for distribu-tion under PDS and the remaining production goesfor free sale. The proportion of levy sugar has how-ever been reduced from 40% to 10%. The Sugar-cane Control Order stipulates that a new mill cannotbe established within a distance of less than 1 kmfrom an existing mill.
• While the erstwhile Sugar Export Promotion Act1958 was repealed and export of sugar decanalized,the level of exports is regulated through several mea-sures such as system of advance licensing, periodicban, etc.
SUGAR DEVELOPMENT FUND (SDF)7.1.304 Under the Sugar Cess Act 1982, a cess ofRs 14.00 per quintal is collected on all sugar producedin the country and an amount equivalent to the sameis credited in the SDF created under the SDF Act 1982.The Fund has benefited the domestic industry by pro-viding loans at concessional rates to sugar factories formodernization and expansion of capacities, rehabili-tation, development of sugarcane, setting up facilitiesfor internal transportation for export obligation,setting up of bagasse-based co-generation units, pro-duction of ethanol from molasses, and maintenanceof buffer stock as well as providing grant for indus-trial research. Commensurate with the technologyupgradation and price escalation, normative projectcosts of various components, especially, bagasse-basedco-generation, etc., are being revised from time to time.In an amendment dated 15 September 2006 the nor-mative project cost for bagasse-based co-generationunit has been revised upwards and the SDF loancomponent raised to 40% of the project cost from30% earlier. The amendment also relaxed the earlierrequirement of bank guarantee for SDF loans to setup ethanol units by sugar factories.
Source: Annual Plan 2007–08, Department of Food and PublicDistribution (DFPD).
FIGURE 7.1.14: Ownership-wise Distribution

Industry 191
BUFFER STOCKS7.1.305 In order to alleviate the difficulties of the millsin times of surplus production, the Central Govern-ment undertakes buffer stock operations from timeto time. In August 2007 the government decided tocreate a buffer stock of 30 lakh mt for a period ofone year.
CHALLENGES7.1.306 While international prices have been fluctu-ating, the SMP fixed by the Central Government hasbeen raised gradually from Rs 62.05 per quintal in2001–002 to Rs 81.18 per quintal in 2007–08. Addi-tionally some of the State Governments have been ad-vising sugar factories to pay cane price at a higher levelthan the SMP. The sugar industry thus faces a predica-ment in which it is asked to pay more for the raw ma-terials even as it gets less for its produce in the market.
7.1.307 Indian sugar exports experience wide fluctua-tions from year to year. While exports are restrictedin the years when international prices are high, theyneed to be subsidized in years in which such pricesare low. Export subsidies have become inconsistentwith India’s obligations under the WTO Agreementfrom 2004 after the expiry of the validity of theWTO provision which gave special dispensation tothe developing countries in respect of subsidies onmarket promotion expenses including internationalfreight as well as on concessions on internal freight onexport shipments.
7.1.308 Indian sugar industry is amongst the mostdiversified industry in the world, with an installedcapacity to produce 1000 MW co-generated poweragainst a potential of 7500 MW. An addition of 1000MW is under implementation. Despite emphasis laidby the GoI to harness the growth potential further, theprogress as co-generation of power is sapped by prob-lems with regard to tariff fixation, third-party sale, andtimely payments by State Electricity Boards (SEBs).
7.1.309 The economics of sugar production are cru-cially dependent on the production of by-product etha-nol. Recently, the 5% ethanol-doping programme hasbeen extended to the country as a whole, with theannual doping requirement estimated at 550 million
litres of ethanol. With further increase in the ethanoldoping to 10% from June 2007, the annual demandwould rise up to about 1100 million litres. Already acapacity of about 1550 million litres has been estab-lished in major sugarcane-producing States, which issufficient to meet this scale of ethanol-doping require-ment. However, the oil companies are going slow. Fur-ther, in as many as seven States, the EDP has not beenimplemented due to taxation problem by the StateGovernments. It may be noted that in Brazil, dopinghas been mandated by the government at 24%.
STRATEGIES7.1.310 Since fluctuation in international prices is afeature of international commodity markets, it needsto be examined how the fall in sales realization in cer-tain years can be taken into account in fixing the SMPfor sugarcane or in considering additional paymentssometimes mandated by the State Governments.
7.1.311 The evolution of the WTO rules has madeexport subsidies by India in sugar (or any agriculturalproducts) arguably inconsistent with the WTO obli-gations. The developing countries are likely to get atime-limited window for such subsidies once the DohaRound concludes. In the meantime, it needs to beexamined how the government can assist the industryin a WTO-consistent manner to deal with surplusproduction.
7.1.312 The difficulties of sugar mills in the sale ofadditional power from co-generation need to beresolved.
7.1.313 A long-term policy needs to be devised on themixing requirements for petroleum fuel with ethanol.
Textiles and Jute7.1.314 The strength of the Indian textiles and cloth-ing industry is based on the long tradition of manu-facturing, strong raw material base, indigenous designcapabilities, presence in the entire value chain, largeand growing domestic demand, and the availability oftrained manpower at internationally competitive rates.The Indian textile and clothing industry consumes adiverse range of fibres and yarns but is predominantlycotton based. At current price, the total market size of

192 Eleventh Five Year Plan
the Indian textiles industry is approximately US$ 47billion. The industry contributes 14% to the total in-dustrial production and directly employs 35 millionpeople. It accounted for 17% of India’s export earn-ings, 3.37% share in international merchandise, and18% of industrial employment in 2006.
7.1.315 During the Tenth Five Year Plan period, thegrowth rate of the industry accelerated under the twinstimuli of domestic policy reforms and the end of thequota regime with effect from 1 January 2005 in ma-jor industrialized countries following agreement in theWTO. The excise duty structure was streamlined andrationalized, customs duty on machinery reduced, andthe reservation for SSI units for garments eliminated.Removal of the policy tilt towards the SSI units had asignificantly positive effect on the industry. The TUFSand the cotton technology mission also boosted theindustry. The production of cloth increased stronglyin the last three years of the Plan period after stagnat-ing in the first two years. During the first two yearsof the Tenth Five Year Plan, the total production ofcloth hovered around 42 million sq m but rose to49.5 million sq m in 2005–06, and is estimated tohave reached a figure of 53.7 million sq m in 2006–07(Annexure 7.1.17).
7.1.316 Following the end of textile quotas, exportsregistered a strong increase in the year 2005–06 butthere was a deceleration in the subsequent year.Export of textiles and clothing during the Tenth FiveYear Plan is presented in Annexure 7.1.18.
7.1.317 The available export data (April 2006–Febru-ary 2007) seem to suggest that the growth of exportsdecelerated sharply (to about 7.75%) as compared to25.9% during April 2005–February 2006. Even in2005–06, when exports had risen overall, man-madetextiles had shown a decline, indicating lack of com-petitiveness in a quota-free regime. Clearly, despitethe progress in the latter half of the Tenth Five YearPlan, the well-known constraints, which are indicatedlater, are still affecting competitiveness in man-madetextiles. Overall, however, at the end of the Tenth FiveYear Plan period there was considerable vibrancy inthe textile industry and confidence that it was poisedfor significant growth during the Eleventh Five Year
Plan. The vision projected by the industry envisagesthat cloth production would grow at 12% and the to-tal turnover at 16% during the Eleventh Five Year Plan.The turnover will rise from US$ 47 billion to US$ 115billion and the exports from US$ 17 billion to US$ 55billion. The industry expectation is that the incremen-tal investment of Rs 30000 crore would be replicatedduring each of the five years of the Eleventh Five YearPlan. The industry also projects an increase in employ-ment by 6.5 million, of which almost 2 million will bein the skilled and managerial categories.
TEXTILES MACHINERY INDUSTRY7.1.318 The fortunes of the textiles engineering in-dustry are linked with textiles industry. The perfor-mance of textiles engineering industry has shownsignificant improvement during the last —two to threeyears in line with the textiles industry. The produc-tion of textiles machinery has been steadily increasingover the last five years and a significant increase of 28%has been recorded during the year 2005–06. The ca-pacity utilization of the industry has also been gradu-ally increasing. It has increased from 28% in 2001–02to 57% in 2005–06. In terms of value, the productionof textiles machinery has increased from Rs 1072.46crore in 2001–02 to Rs 2151.10 crore during 2005–06.
JUTE INDUSTRY7.1.319 The jute industry occupies an important placein the national economy. It is one of the major indus-tries in the eastern region, particularly in West Bengal.It supports nearly four million farm families, besidesproviding direct employment to about 2.6 lakh indus-trial workers and livelihood to another 1.4 lakh peoplein the tertiary and allied sectors. The target for rawjute production in the Tenth Plan is likely to beachieved in 2006–07. Against the production target of110 lakh bales for the terminal year 2006–07 of theTenth Five Year Plan, the achievement in 2005–06 was85 lakh bales and the expectation is that the targetwould have been achieved in 2006–07. The average ofjute and mesta produced during 2002–03 to 2005–06was 91.25 lakh bales. Jute goods production, however,will fall short of the Plan target by 18%: against thetarget of 19.50 lakh mt for terminal year 2006–07, theachievement during 2005–06 was 15.82 lakh mt andthe average production of jute goods from 2002–03 to

Industry 193
2005–06 was 15.96 lakh mt. In contrast, export targetshad been met and exceeded. Against the export targetfor jute goods of US$ 154.36 million for theterminal year 2006–07, the achievement in 2005–06was US$ 276 million. The average exports of jute goodsfrom 2002–03 to 2005–06 was US$ 240 million.
REVIEW OF MAJOR TENTH PLAN SCHEMES7.1.320 We review below the three major Planschemes that were in operation during the TenthFive Year Plan.
Technology Upgradation Fund Scheme (TUFS)7.1.321 Investments in the textiles sector, which wasbeing incentivized by the TUFS, picked up steam from2004–05 after the major steps taken by the CentralGovernment for rationalizing the excise duty struc-ture in that year. Another reason for the spurt was theimplementation of the WTO Agreement for the elimi-nation of quotas. Figure 7.1.15 shows the growth ofinvestment stimulated by the TUFS.
Technology Mission on Cotton (TMC)7.1.322 TMC, which commenced during the NinthPlan, had four mini-missions, the first two for increas-ing agricultural productivity, implemented by theMinistry of Agriculture, and the other two for thedevelopment of marketing yards and modernizationof G&P units, implemented by the Ministry of Tex-tiles. The missions implemented by the Ministry ofAgriculture have contributed to an increase in theproductivity from 308 kg per ha in 2002 to 467 kg perha in 2005 (world average: 680 kg per ha; US: 830 kgper ha; Brazil: 1180 kg per ha; China: 1140 kg per ha).
Under mini-mission III 250 marketing yards weresanctioned for development against which 225 areexpected to have been sanctioned until the end ofthe Tenth Five Year Plan. Under mini-mission IV,modernization of about 900 Ginning and Pressingunits is expected to have been sanctioned against atarget of 1000. Some of the ginners have availed of theTUFS for modernization, making the total number1500. With the completion of these programmes theindustry will have the capability to process about325000 bales of cotton, which is expected to be cleanand contamination free.
Scheme for Integrated Textile Parks (SITP)7.1.323 The SITP was launched in 2005 to neutralizethe weakness of fragmentation in the various sub-sectors of textiles value chain and the non-availabilityof quality infrastructure. The aim was to consolidateindividual units in a cluster, and also to provide theindustry with world-class infrastructure facilities on aPPP model to set up their textile units. A total of 26parks have already been approved and these are ex-pected to be developed by March 2008. These parkswould incorporate facilities for spinning, sizing,texturizing, weaving, processing, apparels, and embel-lishments. The estimated project cost (for commoninfrastructure and common facilities) is Rs 2428.33crore of which the GoI assistance under the schemewould be Rs 866 crore. (The estimated investment inthese parks would be Rs 13445 crore and the estimatedannual production would be Rs 19200 crore.) A totalof 2219 entrepreneurs will put up their units in theseparks. The estimated employment generation wouldbe around five lakh (direct/indirect).
CHALLENGES7.1.324 The Indian textiles industry suffers from allthe handicaps of the manufacturing sector mentionedearlier, viz., deficiencies in the transport infrastructure,shortcomings in the quantity and quality of supply ofelectricity, lack of adequate flexibility in the labourlaws, high transaction cost, and direct and indirecttaxes that are short of world standards. Althoughmuch has been done during the Tenth Five Year Planin particular, the task remains formidable. We considersome of these problems in the context of the textilesindustry.
Source: Report of the Working Group on Textiles and Jute Industryfor Eleventh Plan.
FIGURE 7.1.15: Project Cost Sanctioned under TUFS
1320 14383289
7349
15032
30000
0
5000
10000
15000
20000
25000
30000
35000
2001–02 2002–03 2003–04 2004–05 2005–06 2006–07
(Rs
Cro
re)

194 Eleventh Five Year Plan
7.1.325 The main reason for India to be well behindChina in textiles and clothing is the absence of econo-mies of scale in the manufacturing enterprises in thecountry. While many units in China have tens of thou-sands of workers, the industrial units in India arediscouraged by the requirements of Chapter V-B ofthe Industrial Disputes Act 1956 from employing morethan 100 workers. The result is that the industry is frag-mented and is unable to respond to the large volumesof orders that are placed by the retail chains in the in-dustrial economies. The Contract Labour (Regulationand Abolition) Act 1970 is another hurdle in theseenterprises being able to respond to enquiries for sup-ply of large volumes of goods unless they are assuredof long-term demand, which is seldom the case. Thisis the main reason behind the fact that the share oftextiles in the FDI flows into the country so far hasbeen about 1% against 10% in China.
7.1.326 Technologically, our textiles industry is stillbackward and the modernization process that beganduring the Ninth Five Year Plan and accelerated mid-way through the Tenth Five Year Plan has not madeenough progress. To give one example, only 2% shuttle-less looms are in place as against the world average of16%. Another segment that has not made progress isprocessing. A big handicap is that the order books ofthe textile machinery industry are full and the indus-try is not able to get delivery in quick time. As a resultthe enterprises are purchasing second-hand equip-ment, which costs a fraction of the new equipment.Large-scale purchase of the used machinery, with alimited life, cannot be really called modernization.
7.1.327 The technical textile is an upcoming area inthe textile sector which is primarily textile materialsand products with specific physical and functionalproperties, mostly used as component/part of anotherproduct to improve the performance of the product.These include spun-bonded geo-textiles, needle-punched geo-textiles, woven geo-textiles, geo-grids,woven narrow fabrics, and non-woven for disposableshealthcare textiles, sanitary napkins, incontinencediapers, and diapers. The domestic market in 2005 wasworth US$ 6.7 billion as against the size of US$ 107billion. The global market is expected to grow to US$127 billion by 2010. The challenge for the Indian
textile sector is to increase its share of the global mar-ket during the Eleventh Five Year Plan.
7.1.328 A related problem is that modernization isbased on the government support through the TUFS,which was made operational in the Ninth Five YearPlan. The financial assistance being given by theCentral Government under the programme is not in-consistent with WTO obligations, but the problem isthat it renders our exports vulnerable to countervailingduties being imposed by importing countries if theseexports are assessed by them to be causing materialinjury to their domestic industry. Since the subsidy ison capital goods, the vulnerability will remain for theentire period of the useful life of the machinery. If theSEZ benefit of income tax concession on profits fromexport income and/or the benefits of the SITP areadded, the importing countries could impose highcountervailing duties. Furthermore, the requirementof funds for continuing the TUFS is likely to be veryhigh if the scheme is rolled over into the Eleventh FiveYear Plan.
7.1.329 As mentioned earlier, it is expected that dur-ing the Eleventh Five Year Plan period there would bea large requirement of additional workforce in the in-dustry. The Working Group for Textiles and Clothingfor the Eleventh Five Year Plan has identified category-wise requirement (in lakh) of workforce as manage-rial, technical, and administration (6.5); skilled, ITIsand Certificate courses (13); semi-skilled machine op-erators (32.5); and unskilled (13). In the absence oforganized effort the requirement is not likely to be met.
STRATEGIES7.1.330 It has been difficult to achieve consensus onproposals for changes in labour laws, particularlyChapter V-B of the Industrial Disputes Act 1956 andthe Contract Labour (Regulation and Abolition) Act1970, but given the potential for unlocking substan-tial additional employment in the textile and clothingindustry if these changes are carried out, considerationof such changes and consultations for the same wouldhave to continue so that early action is taken duringthe Plan period. In the absence of any change, theambitious programmes of the industry are likely toremain unrealized.

Industry 195
7.1.331 In order to continue the stimulus for invest-ment for modernization, upgradation, and additionalcapacity creation, the TUFS, SITP and TMC wouldhave to be continued during the Eleventh Five YearPlan. However, it would be necessary to limit the TUFS,either in time or scope, in order to ensure that the fi-nancial commitment of the Central Government doesnot cross the allocation available for the programme.Furthermore, in order to ensure that the industrymodernizes, the assistance should be restricted onlyto the purchase of new machinery.
7.1.332 It has become apparent that substantial addi-tional effort would be needed for skill upgradation andtraining of managerial, skilled, and semi-skilled man-power. In order to ensure that the effort is demanddriven, the individual initiatives must come from theindustry, which should be willing to take completeresponsibility for running the additional programmes.The government’s contribution could come as a one-time assistance for developing the needed infrastruc-ture, by way of buildings and equipment needed for thecreation of new facilities or expansion of existing ones.
7.1.333 The total outlay for the industry segment ofthe textile sector is Rs 11000 crore. In the Eleventh Planthe TUFS would continue for two years. Other maincontinuing schemes are SITP and TMC. Jute Technol-ogy Mission has already been revised by bringing allcomponents together in Mission Mode in 2006. Forskill upgradation, a ‘Human Resource DevelopmentScheme’ is proposed in the Eleventh Plan.
MICRO AND SMALL ENTERPRISES (MSEs)
Introduction7.1.334 Worldwide, MSMEs3 have been recognized asengines of economic growth. In India, MSEs (till re-cently, known as village and small enterprises) accountfor almost 40% of the total industrial production, 95%of the industrial units (along with medium industries),and 34% of the exports. They manufacture over 6000products ranging from handloom sarees, carpets, andsoaps to pickles, papads, and machine parts for largeindustries.
7.1.335 It is estimated that an investment of Rs 10 lakhin fixed assets in the small sector produces goods orservices worth Rs 46.2 lakh with an approximate valueaddition of 10 percentage points. In 2003–04, the con-tribution of SSI sector alone to the GDP was 6.71%.In the last decade, the growth rate of MSEs has beenconsistently higher than the overall growth rate of theindustrial sector, crossing the 12% mark in the termi-nal year of the Tenth Plan.
7.1.336 The MSEs are, however, more than just GDPearners; they are instruments of inclusive growth whichtouch upon the lives of the most vulnerable, the mostmarginalized—women, Muslims, SCs, and STs—andthe most skilled. Being the largest source of employ-ment after agriculture, the MSE sector in India enables650 lakh men, women, and children living in urbanslums, upcoming towns, remote villages and isolatedhamlets to use indigenous knowledge, cultural wis-dom, dextrous hands, and entrepreneurial skills forthe sustenance of their lives and livelihoods. Yet, insuccessive Five Year Plans this sector has not receivedits due. A subset of the MSE sector is what can betermed as ‘cultural and creative industries’. India’scultural diversity and heritage is capable of givingthe country a strong presence in the global marketfor products from such industries. The PlanningCommission had constituted a Task Force with aview to integrate production by cultural and creativeindustries with our development strategy. The recom-mendations of the Task Force will be examinedfor implementation in the Eleventh Plan.Table 7.1.12indicates the allocation for Village and Small Enter-prises (VSE) in the past three Plan periods.
TABLE 7.1.12Plan Outlays for the Last ThreeFive Year Plans for VSE Sector
(Rs Crore)
Sector Eighth Ninth TenthPlan Period Plan Period Plan Period
MSME 1629.55 4303.85 5534.00Textiles 1157.00 1270.00 1600.00FPI 146.00 235.04 650.00
Source: Ninth and Tenth Plan, Planning Commission.
3 In this chapter, MSME means micro, small, and medium enterprises; SME means small and medium enterprises; while MSEmeans micro and small enterprises.

196 Eleventh Five Year Plan
7.1.337 TThe MSME sector has been artificially frag-mented across various ministries, such as MSME, tex-tiles, and FPI to name a few. As a result, sectors such ashandloom, powerloom, handicrafts, khadi, and coirhave suffered greater neglect than other manufactur-ing and service based MSEs.
7.1.338 In an attempt to correct these discrepanciesand neglect, the Micro, Small and Medium EnterprisesDevelopment Act was enacted on 16 June 2006. ThisAct provides the first-ever legal framework recogniz-ing the concept of ‘enterprise’ (comprising both manu-facturing and service entities), defining mediumenterprises and integrating the three tiers of these en-terprises, namely, micro, small and medium. Carryingforward the vision behind this Act, the Eleventh Planrecognizes the MSE sector as an important compo-nent of the industry that needs infrastructure, credit,and policy support. During this Plan period, the en-deavour would be to recognize the heterogeneity ofthe MSE sector and at the same time remove artificialdistinctions within the sector to ensure that the unor-ganized, home-based industries such as handloomsand food processing are able to avail the benefits andschemes launched for the industry in general and theMSE in particular.
Role of SMEs in Global Economy:International Scenario7.1.339 The overall contribution of small firms—for-mal and informal—to the GDP and employment re-main about the same across low, middle, andhigh-income group countries. As income increases, theshare of the informal sector decreases and that of theformal SME sector increases.4
7.1.340 In Brazil, MSEs represent 20% of the totalGDP. Of the country’s 4.7 million registered businesses,
96.8% are MSEs and–along with the other 9.5 millioninformal enterprises—they employ 59% of the eco-nomically active population.5 Similarly, informal andmicro enterprises account for 39% of labour forceand contribute to 24% of the GDP in South Africa;SMEs employ 27% of the labour force and contribute32% to the GDP; while large enterprises employ 34%people and account for 44% of GDP. (Stats SA 2000and Abedian 2001).6 SMEs comprise over 90% of allindustrial units in Bangladesh contributing between80% and 85% of the industrial employment and23% of the total civilian employment (SEDF, 2003).7
They contribute three-quarters of the householdincome in both the urban and the rural areas. InJapan, SMEs employ more than 70% of the wageearners, contributing over 55% of value added in themanufacturing sector.8 In Thailand in 2003, there were2006528 enterprises of which 99.5% were SMEs. TheseSMEs generated products worth 38.1% of GDP andin 2003 they employed 60.7% of Thailand’s workingpopulation.9
7.1.341 The real importance of the SMEs, however, canbe seen in China where over 68% of the exports comefrom the SMEs (Table 7.1.13). China has created moreSMEs in the last 20 years than the total number of SMEsin Europe and the US combined. Their numbers have
4 http://www.worldbank.org/research/projects/sme/abd.pdfSmall and Medium Enterprises across the Globe: A new Database, Meghana Ayyagari, Thorsten Beck, and Asli Demirgüç-Kunt,
August 2003.5 http://www.dai.com/pdf/developments/developments_ fall_2005.pdf6 http://www.ciionline.org/services/112/Images/defsme.pdf7 SEDF: South Asia Enterprise Development Facility http://www.bei-bd.org/beireport/sme/The%%20Small%% 20and%%%
20Medium% 20Enterprises %%20(SME) %%20in %%20Bangladesh.pdf8 http://www.mofa.go.jp/region/asia-paci/thailand/joint0312.pdf9 http://www.jetro.go.jp/thailand/e/data/smesupport.htm
TABLE 7.1.13Chinese Town and Village Enterprises (TVEs) Exports
(in Billion US$)
Total Exports SME Exports SME Exportsas % of Total
2002 438.23 272.48 62.32003 593.32 390.44 65.82004 761.99 518.16 68.0
Source: SME Briefing, Vol. 91, by SME Division of NationalDevelopment and Reform Commission on 28 November 2006.
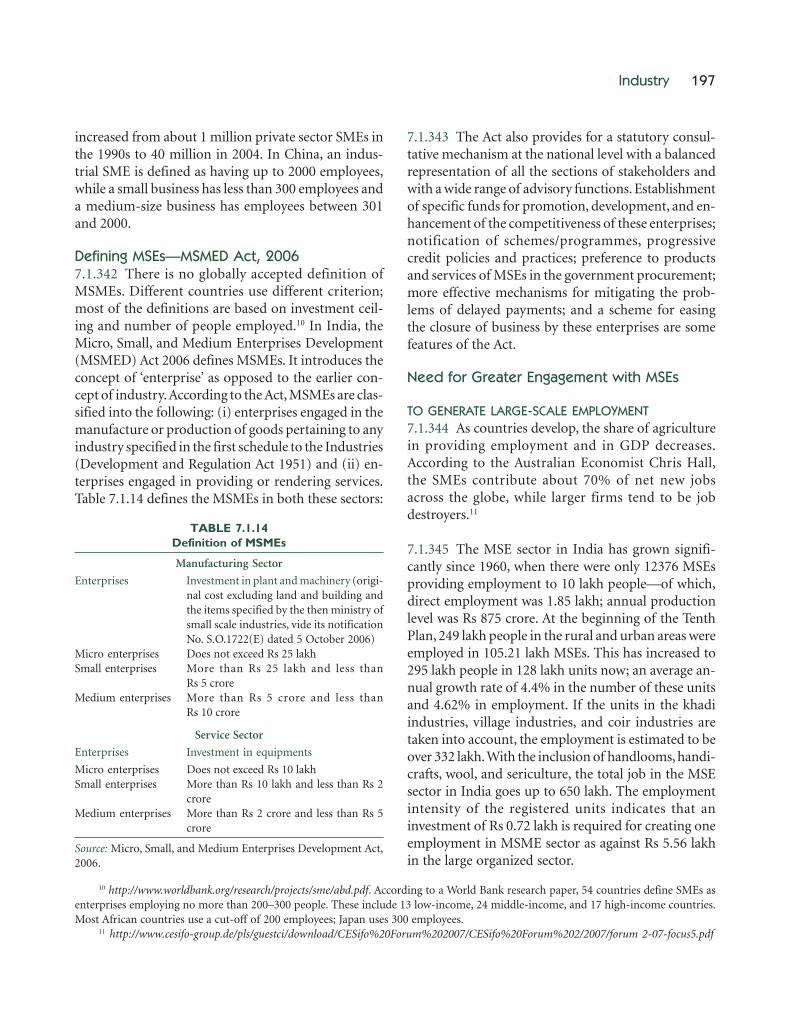
Industry 197
increased from about 1 million private sector SMEs inthe 1990s to 40 million in 2004. In China, an indus-trial SME is defined as having up to 2000 employees,while a small business has less than 300 employees anda medium-size business has employees between 301and 2000.
Defining MSEs—MSMED Act, 20067.1.342 There is no globally accepted definition ofMSMEs. Different countries use different criterion;most of the definitions are based on investment ceil-ing and number of people employed.10 In India, theMicro, Small, and Medium Enterprises Development(MSMED) Act 2006 defines MSMEs. It introduces theconcept of ‘enterprise’ as opposed to the earlier con-cept of industry. According to the Act, MSMEs are clas-sified into the following: (i) enterprises engaged in themanufacture or production of goods pertaining to anyindustry specified in the first schedule to the Industries(Development and Regulation Act 1951) and (ii) en-terprises engaged in providing or rendering services.Table 7.1.14 defines the MSMEs in both these sectors:
TABLE 7.1.14Definition of MSMEs
Manufacturing Sector
Enterprises Investment in plant and machinery (origi-nal cost excluding land and building andthe items specified by the then ministry ofsmall scale industries, vide its notificationNo. S.O.1722(E) dated 5 October 2006)
Micro enterprises Does not exceed Rs 25 lakhSmall enterprises More than Rs 25 lakh and less than
Rs 5 croreMedium enterprises More than Rs 5 crore and less than
Rs 10 crore
Service Sector
Enterprises Investment in equipments
Micro enterprises Does not exceed Rs 10 lakhSmall enterprises More than Rs 10 lakh and less than Rs 2
croreMedium enterprises More than Rs 2 crore and less than Rs 5
crore
Source: Micro, Small, and Medium Enterprises Development Act,2006.
7.1.343 The Act also provides for a statutory consul-tative mechanism at the national level with a balancedrepresentation of all the sections of stakeholders andwith a wide range of advisory functions. Establishmentof specific funds for promotion, development, and en-hancement of the competitiveness of these enterprises;notification of schemes/programmes, progressivecredit policies and practices; preference to productsand services of MSEs in the government procurement;more effective mechanisms for mitigating the prob-lems of delayed payments; and a scheme for easingthe closure of business by these enterprises are somefeatures of the Act.
Need for Greater Engagement with MSEs
TO GENERATE LARGE-SCALE EMPLOYMENT7.1.344 As countries develop, the share of agriculturein providing employment and in GDP decreases.According to the Australian Economist Chris Hall,the SMEs contribute about 70% of net new jobsacross the globe, while larger firms tend to be jobdestroyers.11
7.1.345 The MSE sector in India has grown signifi-cantly since 1960, when there were only 12376 MSEsproviding employment to 10 lakh people—of which,direct employment was 1.85 lakh; annual productionlevel was Rs 875 crore. At the beginning of the TenthPlan, 249 lakh people in the rural and urban areas wereemployed in 105.21 lakh MSEs. This has increased to295 lakh people in 128 lakh units now; an average an-nual growth rate of 4.4% in the number of these unitsand 4.62% in employment. If the units in the khadiindustries, village industries, and coir industries aretaken into account, the employment is estimated to beover 332 lakh. With the inclusion of handlooms, handi-crafts, wool, and sericulture, the total job in the MSEsector in India goes up to 650 lakh. The employmentintensity of the registered units indicates that aninvestment of Rs 0.72 lakh is required for creating oneemployment in MSME sector as against Rs 5.56 lakhin the large organized sector.
10 http://www.worldbank.org/research/projects/sme/abd.pdf. According to a World Bank research paper, 54 countries define SMEs asenterprises employing no more than 200–300 people. These include 13 low-income, 24 middle-income, and 17 high-income countries.Most African countries use a cut-off of 200 employees; Japan uses 300 employees.
11 http://www.cesifo-group.de/pls/guestci/download/CESifo%20Forum%202007/CESifo%20Forum%202/2007/forum 2-07-focus5.pdf

198 Eleventh Five Year Plan
7.1.346 Not only do MSEs generate the highest em-ployment per capita investment, they also go a longway in checking rural–urban migration by providingvillagers and people living in isolated areas with asustainable source of employment. Among the MSEsin India, the dispersed food products sector generatesmaximum employment (13.7% of total employ-ment in the MSE sector), followed by non-metallicmineral products (10.9%) and metal products(10.2%). In chemicals and chemical products, machin-ery parts except electrical parts, wood products,basic metal industries, paper products and printing,hosiery and garments, repair services, and rubberand plastic products, the contribution ranges from 9%to 5%. In all other industries the contribution is lessthan 5%.
7.1.347 Per unit employment is highest (20) in unitsengaged in beverages, tobacco, and tobacco products.Next come cotton textile products (17), non-metallicmineral products (14.1), basic metal industries (13.6),and electrical machinery and parts (11.2). Per unitemployment is highest (10) in the metropolitan areasand lowest (5) in the rural areas. Non-metallic productscontribute 22.7% to the employment generated in therural areas, followed by food products (21.1%), woodproducts, and chemicals and chemical products. As for
the urban areas, food products and metal productsalmost equally share 22.8% employment. Machineryparts except electrical, non-metallic mineral products,and chemicals and chemical products between themaccount for another 26.2% employment. Metal prod-ucts, machinery and parts except electrical, and paperproducts and printing (total share being 33.6%) are theleading industries in metropolitan areas.
7.1.348 The presence of MSEs across States is not uni-form. Tamil Nadu (14.5%) makes the maximum con-tribution to employment followed by Maharashtra(9.7%), Uttar Pradesh (9.5%), and West Bengal (8.5%).Per unit employment is high—17, 16, and 14, respec-tively—in Nagaland, Sikkim, and Dadar & NagarHaveli; Madhya Pradesh has the lowest figure of 2. Inall other cases it is around 6.
TO SUSTAIN ECONOMIC GROWTH ANDINCREASE EXPORTS7.1.349 Estimates say that in order to achieve thetarget of 10% growth in the Eleventh Plan, the MSEsector needs to grow at 12%.
7.1.350 Figure 7.1.16 indicates the growth of the SMEsector in terms of number of units, employment, andproduction.
Source: CII Website.
FIGURE 7.1.16: Growth of the SME Sector in India

Industry 199
7.1.351 Non-traditional products account for morethan 95% of the SSI exports. The performance ofgarments, leather, and gems and jewellery units hasbeen remarkable in the last decade. The SSI sectordominates in export of sports goods, readymadegarments, woollen garments and knitwear, plasticproducts, processed food, and leather products.Annexure 7.1.20 indicates performance of SSIs from2000–01 to 2006–07. The US, Europe, and West Asiaare the major export destinations as indicated asAnnexure 7.1.21.
7.1.352 There is tremendous potential to expand thequantum of exports from traditional MSEs becausethey are handcrafted and hence eco-friendly andexclusive. Further, while MSEs are unable to takeadvantage of economies of scale, they are ideal formeeting small order quantities—a bonus in industriessuch as readymade garments, home furnishings, etc.
7.1.353 MSEs often act as ancillary industries for LSIsproviding them with raw materials, vital components,and backward linkages. For instance, large cycle manu-facturers of Ludhiana rely heavily on the small MSEsof Maler Kotla which produce cycle parts. MSEs alsopromote eco-friendly growth, especially in difficultterrains and the ecologically sensitive areas. In largetracts of barren desert land in Barmer and Kutch, inthe scattered dhanis of Udaipur, in the hilly hamlets ofJ&K, Ladakh, Himachal, and the North East, in thetribal hinterlands of central India, they are the onlysource of livelihood.
FOR MAKING GROWTH INCLUSIVE7.1.354 The MSE sector is a microcosm of all vulner-abilities—it touches upon the lives of women, children,minorities, SCs, and STs in the villages, in the urbanslums, and in the deprived pockets of flourishing townsand cities. For many families, it is the only source oflivelihood. For others, it supplements the family in-come. Thus, instead of taking a welfare approach, thissector seeks to empower people to break the cycle ofpoverty and deprivation. It focuses on people’s skillsand agency.
7.1.355 Different segments of the MSE sector aredominated by different social groups. Women are
mostly found in the unregistered sector—food pro-cessing enterprises, manufacturing enterprises, andweaving—and often work part time in the familyenterprises. Women and small children roll bidis, makeagarbattis, do zari and sequin work for meagre wages.Annexure 7.1.22 gives state-wise figures for womenemployed in MSMEs.
7.1.356 Large number of Muslims are found in theunorganized weaving sector and in powerlooms. STsproduce wonderful handcrafted articles and are in-volved in sericulture. In the North East, most womenweave. In States like Tripura, 50% of rural men and35% rural women are engaged in MSEs. In Nagalandand Mizoram over 68% of urban men are with MSEs.
Challenges
AN OVERVIEW7.1.357 The MSE sector in India is heterogeneous,dispersed, and mostly unorganized. It includes diversetypes of production units ranging from traditionalcrafts to high-tech industries. Yet, it is often consid-ered to be limited to large units among the SSIs whichdeal with high-tech industries or serve as ancillaries tolarge industries. Segments such as powerlooms,handlooms, handicrafts, food processing, coir, sericul-ture, khadi, village industries, and wool, which aremostly unorganized, are fragmented across variousministries and often seen only as rural livelihoods. Thisis, however, far from the truth. Towns and cities suchas Benaras, Berhampur, etc., are big handloom cen-tres; Lucknow, Bhopal, Delhi, and Jaipur are famousfor their handicraft products while powerlooms arenormally only found in urban areas. The artificialfragmentation of the sector often pits the traditionalMSEs against each other and against non-traditionalventures. It also limits their access to capital, infrastruc-ture, and support policies.
7.1.358 Due to the unorganized nature of the sector,entrepreneurs and artisans/workers face difficulties inaccessing government schemes. Consequently, theworkers engaged in the MSE sector—and these areoften the most vulnerable and poor—have verylittle bargaining power and are exploited by the middle-men, unit owners, and big business houses. Unable

200 Eleventh Five Year Plan
to take up aggressive marketing, like big industries, theycannot find markets despite good quality and compe-tent prices (Box 7.1.3)
7.1.359 The dispersed, unorganized nature of the in-dustry also raises issues of quality, bulk production,and inability of meeting big orders. Often individualunits lack packaging facilities.12 As a result, markets,especially for traditional MSEs, are shrinking andworkers are experiencing a dip in wages. Moreover, asmost non-traditional MSEs serve as ‘captive units’ forbig industries, often workers, especially women do notget paid until the product is picked up. The situationis same for the traditional sector where payments aremade by traders and even government corporationsonly after the stock is sold. Thus money is held up,further impoverishing the workers.
7.1.360 The MSEs engaged in manufacturing of prod-ucts such as paints, dyes and chemicals, explosives,minerals, leather and leather goods, etc., pollutethe environment. These units have to obtain non-pollution certification from the concerned pollutioncontrol agencies of the State.
INADEQUATE ACCESS TO CREDIT AND WORKING CAPITAL7.1.361 Though most sub-sectors of the MSE underdifferent ministries have a scheme for credit availabil-ity, everywhere across the country—from the iron
mongers of Jodhpur to powerloom units of Malegaon,from young entrepreneurs trying to set up food pro-cessing units in Kargil to handloom weavers ofKaithun, Berhampur, and Pochampally—artisans,weavers, and entrepreneurs rue the non-availability ofthe working capital. The percentage share of the MSEs(erstwhile SSI) in non-food Bank Credit declined from15.1% in 1990–91 to 8.0% in March 2007. The fall inthe percentage share of credit to MSEs under prioritysector can, in part, be attributed to the expandingscope of the priority sector lending to accommodatefast-growing areas such as housing, exports, etc. Asper the Third All-India SSI Census (2001–02), only14.2% of the registered and 3.09% of the unregisteredMSEs availed of bank finance. Though the NayakCommittee (set up by RBI in 1991–92) had recom-mended working capital to the SSEs at 20% of theirannual turnover, SSI and KVI units together receivedonly 13.3% of their production value from scheduledcommercial banks (SCBs) in 2005–06.
7.1.362 Lending to micro enterprises, which is stipu-lated at 60% of the total credit to MSE sector, has fallenfrom 51.2% in 2002–03 to 45.1% at the end of 2005–06. Moreover, difficulty in arranging collaterals orthird-party guarantees continues to be a problem.Though the RBI had issued instructions to advancecollateral free loans up to Rs 5 lakh, at the end of 2005–06, only 24% of the total outstanding loans under Rs 5
12 Specific challenges faced by different segments of the MSE sector will be discussed separately in the chapter on MSEs and RuralLivelihoods (Chapter 5, Volume III).
Box 7.1.3Dwindling of a Vibrant Sector
People working in MSEs, especially in the traditional sector, are being increasingly impoverished. In Tantol village (Rajsamanddistrict, Rajasthan), the silver minakari workers have not received a hike in wages for the last 60 years. As the markets areflooded by cheap machine-made and Chinese goods, weavers of Barabanki, Uttar Pradesh, have experienced a fall in wages.So while the trendy stoles, shawls, and duppattas they make are sold at upmarket stores for Rs 300 onwards, they get onlyRs 5–10 a piece.The powerloom weavers of Bhiwandi and Malegaon and the handloom weavers of Benaras have no civicamenities. In Malegaon, powerloom weavers say that every day they suffer a loss of Rs 1 crore due to power cuts. Most of thelooms in both Malegaon and Bhiwandi are old. Hence productivity is very low. The Bhairongarh print from district Ujjain,Madhya Pradesh is one of the many crafts which have become extinct. Handloom Himroo Shawl from Aurangabad is on theverge of exitinction. The Langas and Manganiyars of Rajasthan who have long entertained people with their music are nowfinding it difficult to survive. Leh and Kargil cannot sustain big industries but have a huge tourist market where their handlooms,handicrafts, processed apricots plus Leh berry juice can be sold. Yet in the absence of packaging facilities and credit, smallentrepreneurs are unable to set up food processing units.
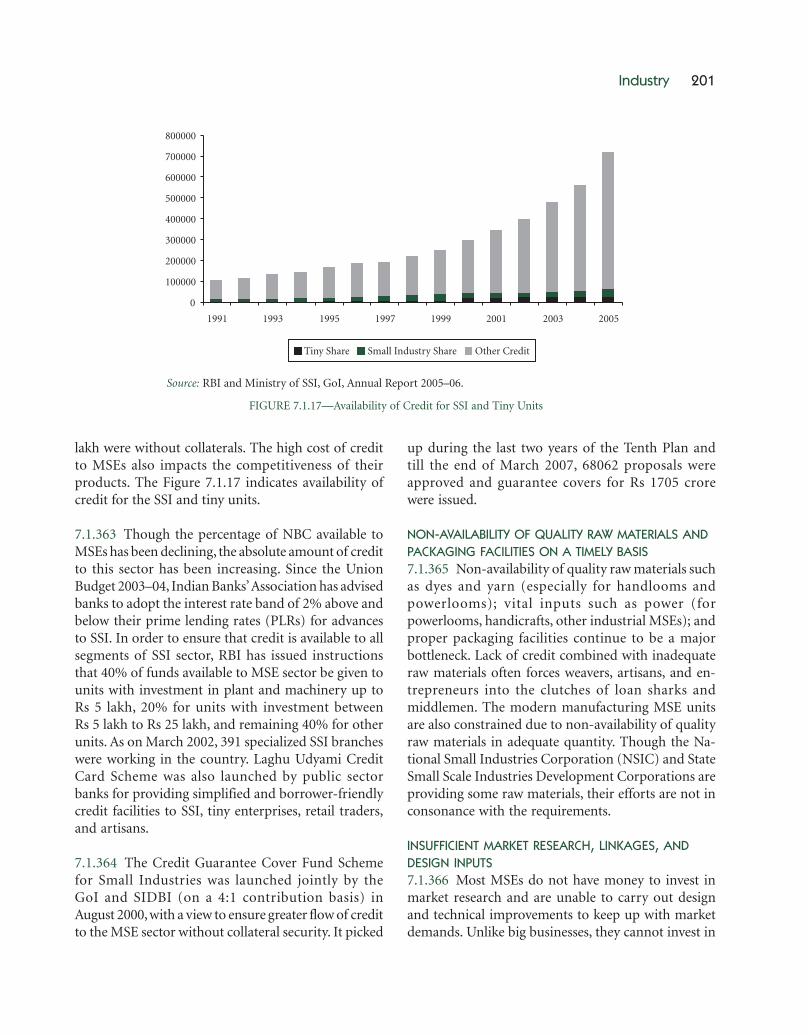
Industry 201
lakh were without collaterals. The high cost of creditto MSEs also impacts the competitiveness of theirproducts. The Figure 7.1.17 indicates availability ofcredit for the SSI and tiny units.
7.1.363 Though the percentage of NBC available toMSEs has been declining, the absolute amount of creditto this sector has been increasing. Since the UnionBudget 2003–04, Indian Banks’ Association has advisedbanks to adopt the interest rate band of 2% above andbelow their prime lending rates (PLRs) for advancesto SSI. In order to ensure that credit is available to allsegments of SSI sector, RBI has issued instructionsthat 40% of funds available to MSE sector be given tounits with investment in plant and machinery up toRs 5 lakh, 20% for units with investment betweenRs 5 lakh to Rs 25 lakh, and remaining 40% for otherunits. As on March 2002, 391 specialized SSI brancheswere working in the country. Laghu Udyami CreditCard Scheme was also launched by public sectorbanks for providing simplified and borrower-friendlycredit facilities to SSI, tiny enterprises, retail traders,and artisans.
7.1.364 The Credit Guarantee Cover Fund Schemefor Small Industries was launched jointly by theGoI and SIDBI (on a 4:1 contribution basis) inAugust 2000, with a view to ensure greater flow of creditto the MSE sector without collateral security. It picked
up during the last two years of the Tenth Plan andtill the end of March 2007, 68062 proposals wereapproved and guarantee covers for Rs 1705 crorewere issued.
NON-AVAILABILITY OF QUALITY RAW MATERIALS ANDPACKAGING FACILITIES ON A TIMELY BASIS7.1.365 Non-availability of quality raw materials suchas dyes and yarn (especially for handlooms andpowerlooms); vital inputs such as power (forpowerlooms, handicrafts, other industrial MSEs); andproper packaging facilities continue to be a majorbottleneck. Lack of credit combined with inadequateraw materials often forces weavers, artisans, and en-trepreneurs into the clutches of loan sharks andmiddlemen. The modern manufacturing MSE unitsare also constrained due to non-availability of qualityraw materials in adequate quantity. Though the Na-tional Small Industries Corporation (NSIC) and StateSmall Scale Industries Development Corporations areproviding some raw materials, their efforts are not inconsonance with the requirements.
INSUFFICIENT MARKET RESEARCH, LINKAGES, ANDDESIGN INPUTS7.1.366 Most MSEs do not have money to invest inmarket research and are unable to carry out designand technical improvements to keep up with marketdemands. Unlike big businesses, they cannot invest in
Source: RBI and Ministry of SSI, GoI, Annual Report 2005–06.
FIGURE 7.1.17—Availability of Credit for SSI and Tiny Units

202 Eleventh Five Year Plan
advertising and packaging. This limits their ability totap markets and attract consumers. Most people areunaware of Chamba Chugh, natural fibre purses andcushion covers, passion fruit pickles, Bhuvastra (gar-ment of the Earth—made in coir), Chamba Chappals,Camel Hair Carpets (which do not burn) of Jodhpur,and the intricately carved tables of Ladakh. MSEs, es-pecially those pertaining to traditional livelihoods, aretherefore, increasingly being forced to rely on middle-men, petty traders, and big businesses to market theirproducts. This has reduced many to the status of dailyworkers, earning less than the minimum wages.
REHABILITATION OF SICK SSI UNITS7.1.367 The major causes of sickness in the SSI sector,as per the Third Census of SSI (2001–02), were lack ofdemand, shortage of working capital, non-availabilityof raw material, power shortage, marketing problems,etc. Combining the three yardsticks used to measuresickness, viz., (i) delay in repayment of loan over oneyear, (ii) decline in net worth by 50%, and (iii) declinein output in last three years, 13.98% of the units in theregistered SSI sector and 6.89% in the unregisteredsector were either sick or incipiently sick. In the totalSSI sector, this percentage was 7.82%.13 The five Statesof Kerala, Tamil Nadu, Andhra Pradesh, Karnataka,and Maharashtra together accounted for 54.28% of thesick/incipiently sick SSI units in the country.
GLOBALIZATION7.1.368 Many segments of MSE, especially the tradi-tional sectors, find it difficult to compete againstaggressive marketing by the big domestic and multi-national players. Street vendors, petty traders,handloom and powerloom weavers, home-based foodprocessing units, khadi institutions, attar (perfumers),zari workers, and rural artisans, many of whom haveeven lost livelihoods and places of work due to devel-opmental works, are the worst affected. There is a needto evolve a constructive response to this situation.As these sectors employ the most marginalized, ourindigenous/traditional industries should be given op-portunities to tap both the domestic and internationalmarkets. Most important, however, is that the licenseraj and redtapism, which is being minimized in
other sectors, needs to wither away from the microsector as well.
7.1.369 As in other countries, globalization can alsoact as a tool for development of the MSE sector. MSEsengaged in the manufacturing of engineering andautomobile products have shown excellent growth inthe past decade due to their expertise in supplyingOEM assemblies and sub-assemblies, components, etc.What is needed is a rational policy which offers ad-equate support and protection to this sector, enablingit to reach Indian markets. MSEs have many inherentadvantages such as exclusivity, ability to produce smallorder quantities, etc. In a globalized world, they cantap new markets, especially in the West where there isa big demand for handcrafted products. Informationtechnology can be used as a tool to provide online in-formation on indigenous products and producers,while the GI Act and patents can be used to preventcheap imitations of our designs and products by othercountries.
TECHNOLOGY UPGRADATION AND ACHIEVING‘ECONOMIES OF SCALE’7.1.370 The investment ceiling on plant and machin-ery used for defining the small-scale units create prob-lems. Efforts such as raising investment ceiling to Rs 5crore for micro and small-scale units will help theseunits to graduate to medium-scale enterprises. TheTenth Plan schemes such as TUFS and SITP, which havehelped some units to modernize, will be continued inthe Eleventh Plan as well. There is an urgent need todevise measures to tackle the problem of loss of fiscalbenefits when the micro and small-scale units gradu-ate into larger units. The general excise duty exemp-tion, which was traditionally available to the SSIs,is now restricted to Rs 1.5 crore of the transactions, afigure which is largely insignificant for many of thelarger SSEs. As has been demonstrated by units suchas Hero Cycles, Nirma detergents, Videocon, and Onidaelectronics, and vertical expansion and upward move-ment of MSEs to the medium and large sector enablesthem to achieve economies of scale. But today MSEsare encouraged to go for horizontal expansion anddeliberate fragmentation, mainly to stay within the
13 http://www.smallindustryindia.com/ssiindia/performance.htm

Industry 203
limits of excise exemptions. During the Eleventh Planit would be necessary to consider policy initiatives toincentivize MSEs to achieve economies of scale byexpanding production. One possibility could be toallow them to retain the benefit of excise duty exemp-tion up to the prescribed limit even after they gradu-ate into medium-scale enterprises. Measures wouldalso need to be taken to deal with the problems arisingfrom Chapter V-B of the Industrial Dispute Act tofacilitate the MSEs to overcome fragmentation andinefficiency. While doing all this, however, it is impera-tive to ensure that the small, household based unitsare not neglected.
7.1.371 Owing to liberalization and opening up ofthe economy, the MSEs are facing stiff competitionfrom imports and need technological upgradation toproduce better quality products at cheap rates. Theyshould be able to access production supply unitsaround the world through the Internet. Informationdissemination about availability of recent technolo-gies, literature on modern machinery, contact detailsof suppliers, etc., is essential. A Technology Bank couldbe set up for this purpose. There is a need to intensifyimplementation of the Credit Linked Capital SubsidyScheme (CLCSS) along with ready availability of modelmodernization projects for manufacturing industries.
Potential of MSE Sector in Eleventh Plan:Monitorable Targets7.1.372 Monitorable targets for the MSE sector (ex-cluding khadi, village industries, handicrafts,handloom, and food processing) for the Eleventh Planare given in the following Table 7.1.15.
ELEVENTH PLAN STRATEGIES FOR PROMOTION OF MSEs7.1.373 The Eleventh Plan approach to the MSE sec-tor marks a shift from the welfare approach to that
of empowerment. The Plan looks at this sector as anengine for sustained and inclusive economic growthand employment. The strategy is two-pronged—it focuses on livelihood and social security. Thisis not just a rights issue but also makes economiccommon sense—artisans and entrepreneurs can bemost productive only when they are physically andmentally fit.
7.1.374 The Eleventh Plan considers the MSE sectoras an important segment of industry which is unorga-nized and hence needs support and access to allschemes of industry with special enabling provisions.As it is, Tribal Sub-Plan (TSP) and Special Compo-nent Plan (SCP) are constitutional requirements.Support for women’s empowerment and minoritydevelopment has been stressed upon in the PrimeMinister’s 15-point programme and in other flagshipschemes of the government. We know that it is mostlythe tribes, SCs, minorities, and women who are en-gaged in traditional livelihoods and in the small andmicro sector. In the handloom sector alone, 60.6%weavers are women, 10.76% belong to SCs, 25.5% toSTs, and 42.65% to OBCs.14
7.1.375 Thus providing enabling provisions for arti-sans, weavers, and small entrepreneurs within indus-trial policies and schemes will automatically fulfil theconstitutional requirement and the commitmentsmade by various Plans. While planning infrastructuredevelopment for industries, the needs of the microand small sector would be kept in mind. There is needto move from adversarial to complementary relation-ships between various segments of industry and MSE.For instance, handlooms can target hi-end exclusiveproducts—stoles, shawls, sarees, and furnishings—while powerloom mills do bulk production forgamchas, dhotis, towels, bed and table linen, etc. Big
14 Joint handloom and powerloom census conducted in 1995–96.
TABLE 7.1.15Year-wise Physical Targets for the Eleventh Plan
Item 2007–08 2008–09 2009–10 2010–11 2011–12 CAGR
Production at current price (Rs crore) 682613 816705 977144 1169112 1398803 15.4%Employment (lakh persons) 322.28 338.39 355.31 373.08 391.73 4%
Source: Ministry of MSME.
204 Eleventh Five Year Plan
brands can continue to develop products such assuitings, shirtings, t-shirts, etc.
7.1.376 The MSE sector, including handlooms andhandicrafts, presents an opportunity for exports.Exclusivity, which stems from the dispersed nature ofthis sector, is its biggest strength (Box 7.1.4). And yet,the dispersed nature of the sector makes it difficult tomeet bulk orders, raises quality control issues, robs theworkers of bargaining power, limits access to credit andmarkets, results in absence of social security, and pre-vents enterprises from benefiting from economies ofscale. The effort during the Plan period will thereforebe to organize this sector, to create clusters and SHGsof weavers/artisans to improve their bargaining powerand to enable them to pool resources. These groups,comprising weavers, artisans, and entrepreneurs, willbe given full control over cluster decisions and will beprovided support in the form of credit, inputs, exper-tise, and marketing links.
7.1.377 The Working Group on MSMEs for theEleventh Plan had projected the need for Rs 296400crore as the working capital and term loans for MSEsduring the Eleventh Plan. At present, there is no sub-sector target for the MSE sector within the overallstipulated 40% ceiling for the priority sector lending.
Since sub-targets have already been fixed at 18% foragriculture and at 10% for the weaker sectors, the MSEsector has to compete with real estate, housing,education, retail, etc. for the remaining 12%. Consid-ering the vital role of the MSE sector in generation oflarge-scale employment opportunities, considerationshould be given to whether a separate sub-target forthe MSE sector can be effectively introduced in allSCBs. If this is not possible then other means must befound to incentivize lending to this sector.
7.1.378 For micro and small entrepreneurs whocannot bring in sufficient equity/promoter’s contri-bution, a flexible debt–equity ratio may need to beadopted while sanctioning export credit. Banks willbe encouraged to ensure that all loans upto Rs 5 lakhto MSEs (excluding credit from MFIs) are given freeof collateral at the interest rate of 8%. Coverage underthe Credit Guarantee Trust Fund will be increased. Asinternational experience indicates cluster based financ-ing is the most effective way of providing credit toMSEs, 100 MSE clusters based on the PPP model willbe adopted on a pilot basis.
7.1.379 During the Eleventh Plan period, an aggres-sive marketing campaign using the media and iconswill be launched. Handlooms, handicrafts, food
Box 7.1.4Small Success
Individual success stories in various nooks and corners of the country have demonstrated the potential of MSEs. Kolkata-based Mallika’s Kantha has rejuvenated the traditional Kantha weave. Today, hundreds of women sit at their village homes inWest Bengal, making stoles, shawls, sarees, dupattas, table covers, cushion covers, etc., which sell for anything between Rs5000 to Rs 50000. From the Pope to the Prime Minister, everyone appreciates the art of Kantha.Fab India has shown thetremendous appeal of Indian handlooms and handprints, especially for the young, college-going crowd. Even brands likePantaloons are starting handloom ranges for both men and women. In Andhra, designer shirts and kurtas of khadi madeunder the PRODIP scheme are a big success. Hotels like the Jahanuma Palace in Bhopal use handlooms and other handcraftedproducts for interior decoration. This experience is cherished by tourists. Tourists pick up a large number of products, chappals,bags, masks, papier mâché etc., from small shops allotted to artisans inside the Mehrangarh Fort in Jodhpur. The artisans ontheir part get a steady source of income.Chizami is a small village in the Phek district of Nagaland. Here, an NGO, North EastNetwork, has provided the local youth with a source of livelihood. They make passion fruit, guava, and ginger jams, pickles,and squashes. India has many natural fibres such as banana, khus, sisal, korai grass, talipot, palm leaf, coconut, pineapple,screwpine, golden grass, jute, sabai, etc. Not-for-profit organizations such as Industree Crafts are encouraging rural artisansto convert these fibres into value-added finished products such as bags, table mats, cushion covers, hats, floor coverings,curtains, office and home accessories, etc. These products are now being marketed in top stores across the country. Likewise,natural soaps, shampoos, and cosmetics produced by various small units under the brand name of Khadi are already catchingon in the domestic market and have tremendous scope for exports.

Industry 205
processing, and other cultural industries will be linkedto tourism; circuits for heritage and fabric tourism willbe developed. In the West, the cultural industries havebecome the most rapidly growing sector in the world,contributing over 7% of the world’s GDP. Giving an‘industry’ status to craftspersons is important becauseit entitles them to tax benefits and export promotionschemes, makes them eligible for banking and creditsupport, and helps them lobby for protection of intel-lectual property.15
7.1.380 Mapping of the MSE sector will be carried outand registration of products under the GI Act will beencouraged and supported. Strict enforcement of lawsrelating to reservation will be carried out. Neglectedareas such as occupational health, insurance, and soon will be taken up as an integral part of the MSEpolicy. Special emphasis will be laid on skill develop-ment and upgradation across all sectors.
7.1.381 An effective preference policy for procurementof goods and services produced by MSEs both at Cen-tral and State levels will be developed. A policy forwomen in the micro and small sector, particularly inthe unorganized segments, will also be formulated toensure that women get their rights and that their spe-cial needs are catered to.
ELEVENTH PLAN SCHEMES OF MINISTRY OF MSME7.1.382 Most of the existing schemes for the MSMEsector have been evaluated by independent organiza-tions and suitably modified and reorganized. These willbe continued during the Eleventh Plan period alongwith addition of some new schemes. The schemeswhich will be carried forward in the Eleventh Plan aregiven in Annexure 7.1.23.
NEW INITIATIVES7.1.383 The Small Industries Development Organi-zation (now called Micro, Small, and Medium Enter-prises Development Organization) has a network ofmore than 3000 technically qualified personnel work-ing through its Small Industries Service Institutes (andBranch SISIs), testing centres, and autonomous orga-nizations such as the Tool Room, Product and Process
Development Centres, etc. In the Eleventh Plan, theMinistry of MSME will establish a TechnologyMission to promote new and emerging technologies,assess present levels of technology and their upgrda-tion, set up technology information centres/data banksand an IT portal for information dissemination tocarry out detailed technology audits.
7.1.384 In 2006, the government launched the NationalManufacturing Competitiveness Programme. TheNMCC and the Ministry of MSME chalked out afive-year programme with a projected expenditure ofRs 850 crore. The programmes include: setting upof design clinics, application of lean manufacturingtechnologies for increasing competitiveness of firms bysystematically identifying and eliminating wastethroughout the business cycle. These programmes willbe demand driven and will be implemented in the PPPmode in selected industrial clusters.
7.1.385 Infrastructural constraints, notably the poweroutages, affect the MSEs much more than the largerenterprises. Although some States do offer differentialpower tariffs in favour of the MSEs, the real deficiencyis the quality and quantity of power supply. Duringthe Eleventh Plan, group/associations of the MSEs willbe incentivized to establish captive power plants asenjoined in the Electricity Act 2003 or to set up com-mon large-scale generation facilities with dedicatedfeeder lines. Roads, transport, water, and other infra-structure problems, or their total absence, push upoperating costs of MSEs as against goods produced inmore favourable conditions in other countries and itis, therefore, imperative for the government to developadequate infrastructure.
7.1.386 Labour Laws and Factory Laws have createdproblems for MSE units in terms of number of inspec-tions. The committee set up under Member (Indus-try) Planning Commission recommended a systemof third-party inspection to give enterprises anoption to get their regulatory compliance certifiedby accredited agencies. Once such certification hasbeen obtained the unit would be exempted fromroutine inspection. Special inspections would be
15 InfoChange News and Features, September 2006.

206 Eleventh Five Year Plan
authorized only on receipt of credible complaints.Early implementation of this recommendationduring the Eleventh Plan will provide relief to theMSMEs.
7.1.387 A proper database is critical for formulationof appropriate schemes for the MSE sector. The re-cently announced ‘Package for Promotion of Microand Small Enterprises (SMEs)’ contains a proposal forproviding financial support to the MSE Associationsfor their capacity building and for strengthening thedatabase and contacts with the grassroots. This initia-tive would be carried forward during the Eleventh FiveYear Plan.
7.1.388 An outlay of Rs 11500 crore has been allocatedto Ministry of MSME, out of which Rs 4000 croreis for DC (MSME) and Rs 7500 crore is for agro andrural industries.
7.2 MINERALS
INTRODUCTION7.2.1 Accelerated growth rate of the Indian economyneeds rapid development of the mining sector, onwhich most of the basic industries depend. The effortsfor locating minerals over the last 55 years have en-hanced reserves for various minerals such as mica,barites, chromite (metallurgical), coal (thermal), lig-nite, bauxite (metallurgical), manganese ore, and ironore, and have placed the country among top 10 pro-ducers of these minerals. However, in respect of fertil-izer minerals, diamond, gold, nickel, copper, lead, zinc,platinum group of metals, and rare metals, there hashardly been any discovery despite an extremelyfavourable geological environment.
7.2.2 With the surge in the demand for metals inresponse to strong economic growth, it has becomenecessary to mount a well-planned, comprehensive,and time-bound programme for regional and detailedexploration for locating and delineating the country’shidden mineral deposits, which are likely to be con-siderable.
7.2.3 The mining sector was opened to FDI in 1993and 100% FDI has been allowed since 2000. However,
the actual flows have been minimal in the absence ofpolicies conducive to FDI for prospecting. Attractingthe FDI into exploration and prospecting will requirea revision of the current non-investor-friendly min-ing regime and adoption of a multi-disciplinaryapproach, embracing the legal framework, technology,sustainability, infrastructure, and procedural stream-lining.
REVIEW OF THE TENTH PLAN7.2.4 The Offshore Areas Mineral (Development andRegulation) Act 2002 providing for the developmentand regulation of mineral resources in the territorialwaters, continental shelf, and the exclusive economiczone was notified on 31 January 2003. The legislationwould enable the streamlining of mineral explorationand development in the offshore areas and ensure sys-tematic and scientific exploitation of mineral reserves(except petroleum, natural gas, and hydrocarbonresources) for attracting private investment in theoffshore mineral sector.
7.2.5 In 2000, the ceiling of 74% on FDI in explora-tion and mining of diamonds and precious stoneswas removed though it continued to require ForeignInvestment Promotion Board approval. In 2006,this restriction too was removed and all FDI in themining sector, including FDI above 74% in miningof diamonds and precious stones, is now on the auto-matic route.
7.2.6 For a comprehensive review of the NationalMineral Policy and for suggesting possible amend-ments to the MMDR Act 1957, the Planning Commis-sion constituted a high-level committee under theChairmanship of Member (Industry), Planning Com-mission. The high-level committee submitted its re-port to the government on 19 July 2006. The committeerecommended a number of changes in the NationalMineral Policy and in the relevant laws and rules tostimulate mineral exploration activities and promotethe development of a vibrant mining and mineralsector in the country. For augmenting state revenuesfrom the mineral sector, the committee recommendedthat the method of fixation of royalty should movedecisively toward ad valorem rates, away from thetonnage system currently prevailing for a number of
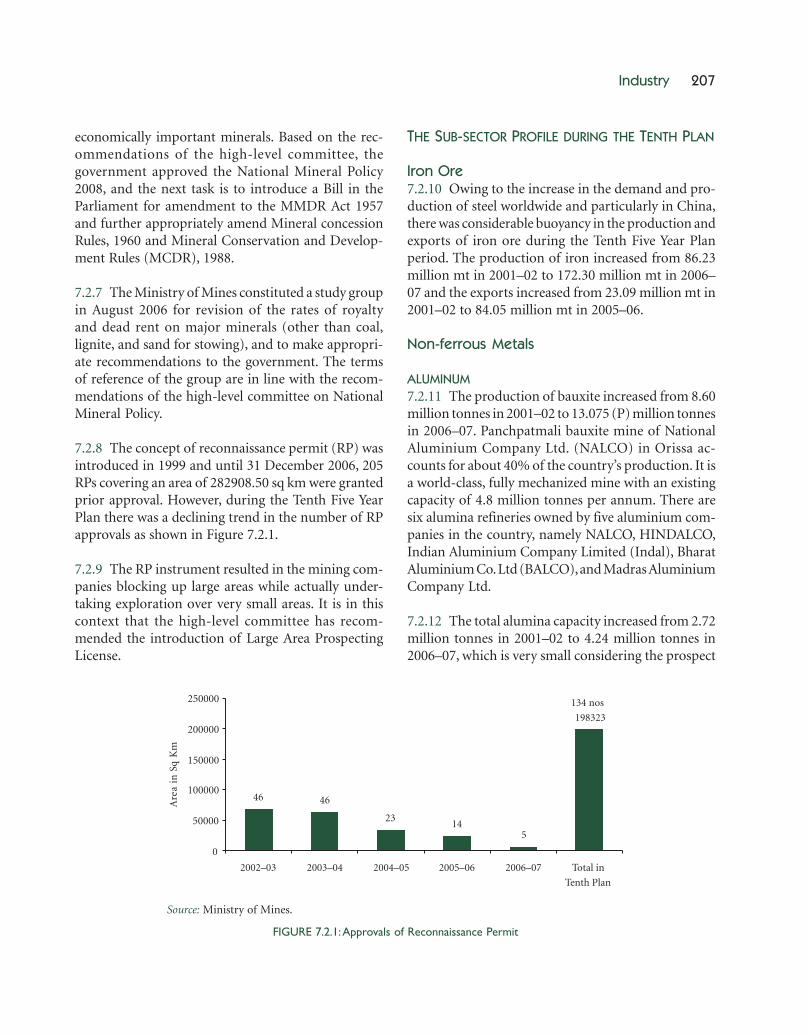
Industry 207
economically important minerals. Based on the rec-ommendations of the high-level committee, thegovernment approved the National Mineral Policy2008, and the next task is to introduce a Bill in theParliament for amendment to the MMDR Act 1957and further appropriately amend Mineral concessionRules, 1960 and Mineral Conservation and Develop-ment Rules (MCDR), 1988.
7.2.7 The Ministry of Mines constituted a study groupin August 2006 for revision of the rates of royaltyand dead rent on major minerals (other than coal,lignite, and sand for stowing), and to make appropri-ate recommendations to the government. The termsof reference of the group are in line with the recom-mendations of the high-level committee on NationalMineral Policy.
7.2.8 The concept of reconnaissance permit (RP) wasintroduced in 1999 and until 31 December 2006, 205RPs covering an area of 282908.50 sq km were grantedprior approval. However, during the Tenth Five YearPlan there was a declining trend in the number of RPapprovals as shown in Figure 7.2.1.
7.2.9 The RP instrument resulted in the mining com-panies blocking up large areas while actually under-taking exploration over very small areas. It is in thiscontext that the high-level committee has recom-mended the introduction of Large Area ProspectingLicense.
THE SUB-SECTOR PROFILE DURING THE TENTH PLAN
Iron Ore7.2.10 Owing to the increase in the demand and pro-duction of steel worldwide and particularly in China,there was considerable buoyancy in the production andexports of iron ore during the Tenth Five Year Planperiod. The production of iron increased from 86.23million mt in 2001–02 to 172.30 million mt in 2006–07 and the exports increased from 23.09 million mt in2001–02 to 84.05 million mt in 2005–06.
Non-ferrous Metals
ALUMINUM7.2.11 The production of bauxite increased from 8.60million tonnes in 2001–02 to 13.075 (P) million tonnesin 2006–07. Panchpatmali bauxite mine of NationalAluminium Company Ltd. (NALCO) in Orissa ac-counts for about 40% of the country’s production. It isa world-class, fully mechanized mine with an existingcapacity of 4.8 million tonnes per annum. There aresix alumina refineries owned by five aluminium com-panies in the country, namely NALCO, HINDALCO,Indian Aluminium Company Limited (Indal), BharatAluminium Co. Ltd (BALCO), and Madras AluminiumCompany Ltd.
7.2.12 The total alumina capacity increased from 2.72million tonnes in 2001–02 to 4.24 million tonnes in2006–07, which is very small considering the prospect
Source: Ministry of Mines.
FIGURE 7.2.1: Approvals of Reconnaissance Permit

208 Eleventh Five Year Plan
for producing and exporting this product in whichIndia is internationally very competitive.
7.2.13 Despite the limitation imposed by the highenergy cost, there was a substantial increase in the ca-pacity, production, and export of aluminum in thecountry during the Tenth Five Year Plan as shown inFigure 7.2.2.
7.2.14 Production of aluminum is estimated to haveincreased by 65% during the Plan period, the bulk ofthe increase being absorbed domestically. NALCO, aCPSE, has about 35% share of production.
COPPER7.2.15 India has a substantial capacity for the produc-tion of primary copper metal but is significantly
Note: @ In 2005–06, additional production of aluminum is due to capacity expansion in BALCO.Source: Annual Reports, Ministry of Mines and Department of Commerce.
FIGURE 7.2.2: Production and Export of Aluminium
Source: Annual Reports, Ministry of Mines and Department of Commerce.
FIGURE 7.2.3: Capacity, Production and Export of Copper

Industry 209
dependent on the import of copper metal-in-concen-trates. The production and import of copper concen-trate in 2005–06 was 22984 mt and 1072905 mt,respectively. Figure 7.2.3 gives the figures of capacity,production, and export of primary copper during theTenth Five Year Plan period.
7.2.16 Although India is dependent on imports ofcopper concentrate, its smelting capacity in the metalgrew almost three-fold and the production by about60% during the Tenth Five Year Plan period. The shareof the public sector (HCL) in the production fell fromabout 13% in 2001–02 to about 6% in 2005–06.
ZINC AND LEAD7.2.17 The capacity expansion and growth of produc-tion of zinc and lead were also impressive, almost dou-bling for both metals as shown in Figure 7.2.4.
7.2.18 After privatization, Hindustan Zinc Ltd (HZL)expanded its zinc mining and used the mineral fromits captive Rampura Agucha mines to expand smelt-ing. The capacity and production of lead during theTenth Five Year Plan are shown in Figure 7.2.5.
PLAN OUTLAY AND EXPENDITURE DURINGTHE TENTH PLAN7.2.19 An outlay of Rs 8344.50 crore was approved forthe Tenth Five Year Plan (2002–07) for the Ministry
of Mines with gross budgetary support of Rs 1271.00crore, net budgetary support of Rs 1021.00 crore, and(IEBR) of Rs 7073.50 crore. There was a provisionof Rs 250 crore [Geological Survey of India (GSI)Rs 200.00 crore and IBM Rs 50.00 crore] for externalaid through the Budget in the Tenth Plan. However,during the MTA of the plan, the outlay was reduced toRs 4485.28 crore against which the expenditure was ofthe order of Rs 2856.29 crore. The shortfalls weremainly on account of delay in the approval of secondphase expansion of NALCO and slow progress in themodernization and replacement scheme of the GSI.(The details are given in Annexure 7.2.1).
ELEVENTH PLAN OBJECTIVES7.2.20 The following are the main objectives of theEleventh Five Year Plan in the mining sector:
• Intensification of exploration for low-volume high-value minerals such as gold, diamond, base metals,and platinum group of minerals and efforts towardsaugmentation of the existing resources in respectof ferrous and non-ferrous minerals and industrialminerals.
• Improvement of the National Mineral Inventory,particularly for those minerals in which reserves arelow such as base metals, nickel, tin, graphite, noblemetals, precious stones, and rock phosphate.
• Restructuring and modernization of the GSI in the
Source: Working Group Report on Mineral Exploration and Development (Other than coal andlignite), Eleventh Five Year Plan, Volume III.
FIGURE 7.2.4: Capacity and Production of Zinc
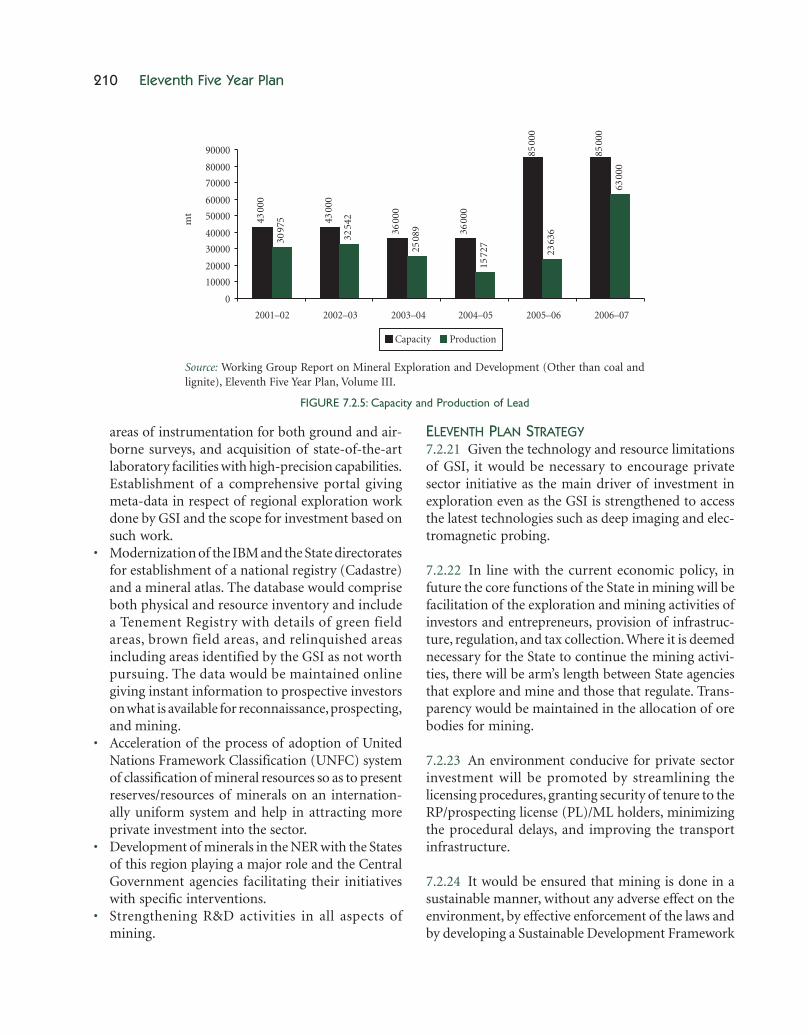
210 Eleventh Five Year Plan
areas of instrumentation for both ground and air-borne surveys, and acquisition of state-of-the-artlaboratory facilities with high-precision capabilities.Establishment of a comprehensive portal givingmeta-data in respect of regional exploration workdone by GSI and the scope for investment based onsuch work.
• Modernization of the IBM and the State directoratesfor establishment of a national registry (Cadastre)and a mineral atlas. The database would compriseboth physical and resource inventory and includea Tenement Registry with details of green fieldareas, brown field areas, and relinquished areasincluding areas identified by the GSI as not worthpursuing. The data would be maintained onlinegiving instant information to prospective investorson what is available for reconnaissance, prospecting,and mining.
• Acceleration of the process of adoption of UnitedNations Framework Classification (UNFC) systemof classification of mineral resources so as to presentreserves/resources of minerals on an internation-ally uniform system and help in attracting moreprivate investment into the sector.
• Development of minerals in the NER with the Statesof this region playing a major role and the CentralGovernment agencies facilitating their initiativeswith specific interventions.
• Strengthening R&D activities in all aspects ofmining.
ELEVENTH PLAN STRATEGY7.2.21 Given the technology and resource limitationsof GSI, it would be necessary to encourage privatesector initiative as the main driver of investment inexploration even as the GSI is strengthened to accessthe latest technologies such as deep imaging and elec-tromagnetic probing.
7.2.22 In line with the current economic policy, infuture the core functions of the State in mining will befacilitation of the exploration and mining activities ofinvestors and entrepreneurs, provision of infrastruc-ture, regulation, and tax collection. Where it is deemednecessary for the State to continue the mining activi-ties, there will be arm’s length between State agenciesthat explore and mine and those that regulate. Trans-parency would be maintained in the allocation of orebodies for mining.
7.2.23 An environment conducive for private sectorinvestment will be promoted by streamlining thelicensing procedures, granting security of tenure to theRP/prospecting license (PL)/ML holders, minimizingthe procedural delays, and improving the transportinfrastructure.
7.2.24 It would be ensured that mining is done in asustainable manner, without any adverse effect on theenvironment, by effective enforcement of the laws andby developing a Sustainable Development Framework
Source: Working Group Report on Mineral Exploration and Development (Other than coal andlignite), Eleventh Five Year Plan, Volume III.
FIGURE 7.2.5: Capacity and Production of Lead

Industry 211
(SDF), especially tailored to the context of India’s min-ing environment, to be adhered to voluntarily by themining firms.
7.2.25 New relief and rehabilitation norms (to beadhered to on a voluntary basis) will be developedbuilding on the existing packages announced by theStates for compensation to the PAPs as well as for thebenefit that must accrue to the communities living inthe villages around the mining area.
STRUCTURE OF OUTPUT7.2.26 In all, about 90 minerals are produced in thecountry, which include 4 fuel minerals, 10 metallicminerals, 50 non-metallic minerals, 3 atomic miner-als, and 23 minor minerals. The total value of mineralproduction (excluding atomic minerals) during theyear 2006–07 is estimated at Rs 87866.35 crore. Dur-ing the year 2006–07, the provisional value of fuel min-erals was put at Rs 63938.76 crore (73% of total value),metallic minerals at Rs 12858.71 crore (15% of the totalvalue), and non-metallic minerals including minorminerals at Rs 11068.88 crore (12% of the total value).
Life Indices of Principal Minerals7.2.27 The life indices as at the end of the Tenth Planof important minerals such as bauxite, copper ore,chromite, lead–zinc ore, iron ore (haematite and mag-netite) are given in Annexure 7.2.2. The life indicesbeyond 1 April 2007 estimated at the current level ofproduction for important minerals are: bauxite (166years); copper (200 years); chromite (33 years); lead–zinc ore (69 years); and iron ore (97 years).
7.2.28 The estimated apparent consumption, domes-tic production, resource situation, and life indices ofsome selected minerals in the terminal years of theTenth and Eleventh Plans are given in Annexure 7.2.3.The life indices in years at the end of the Eleventh FiveYear Plan of some of the important minerals are esti-mated as follows: bauxite—refractory grade (96 years);chromite (16 years); graphite (58 years); gypsum (125years); and rock phosphate (68 years).
Material Balance of Principal Non-ferrous Metals7.2.29 The projections of production, import, export,and domestic demand up to 2011–12 of principal
non-ferrous metals—such as aluminum, copper, zinc,and lead—based on the Eleventh Five Year Plan Work-ing Group Report on Mineral Exploration and Devel-opment are given in Annexure 7.2.4. Strong growth indomestic demand is expected in all non-ferrous met-als, but the country will remain a net exporter of alu-minum and copper (based largely on imported mineralconcentrate). It will become self-sufficient in zinc butwill be a net importer in lead.
Sectoral Profile
IRON ORE RESOURCES7.2.30 The iron ore resources identified so far andestimated on the UNFC basis as on 1 April 2005 areabout 14630 million tonnes of haematite ore andabout 10619 million tonnes of magnetite ores. Unlikehaematite, almost the entire magnetite resource is stillto be converted to reserves. Even the small proportion,which has been converted so far by the NationalMineral Development Corporation Limited, is in theWestern Ghats biodiversity area and is presently notavailable for extraction because of the ban imposedby the Supreme Court for reasons of environmentalprotection. Of the haematite resources, high-qualityreserves above 65% Fe content constitute only about1.3 billion tonnes. The details are given in Annexures7.2.5 and 7.2.6.
MANGANESE ORE7.2.31 The all-India total resources of manganese oreas on 1 April 2005 are 380 million tonnes. Out of these,37.29% are in the reserve category and balance 62.71%in the remaining resource category. Of the totalresources, the blast furnace grade constituted 130.2million tonnes, medium grade 31.63 million tonnes,and ferro–manganese grade 25.3 million tonnes.
CHROMITE7.2.32 The all-India total resources of chromite are232.12 million tonnes as on 1 April 2005 (provisional).Out of these 28.48% are in the reserve category and71.52% are in the remaining resource category. Gradewise, 18% are metallurgical, 1.79% are refractory,23.69% are charge chrome, 18.28% are beneficiated,and the balance 38.24% are low-grade ferrochrome,other unclassified and undefined grades. The bulk of
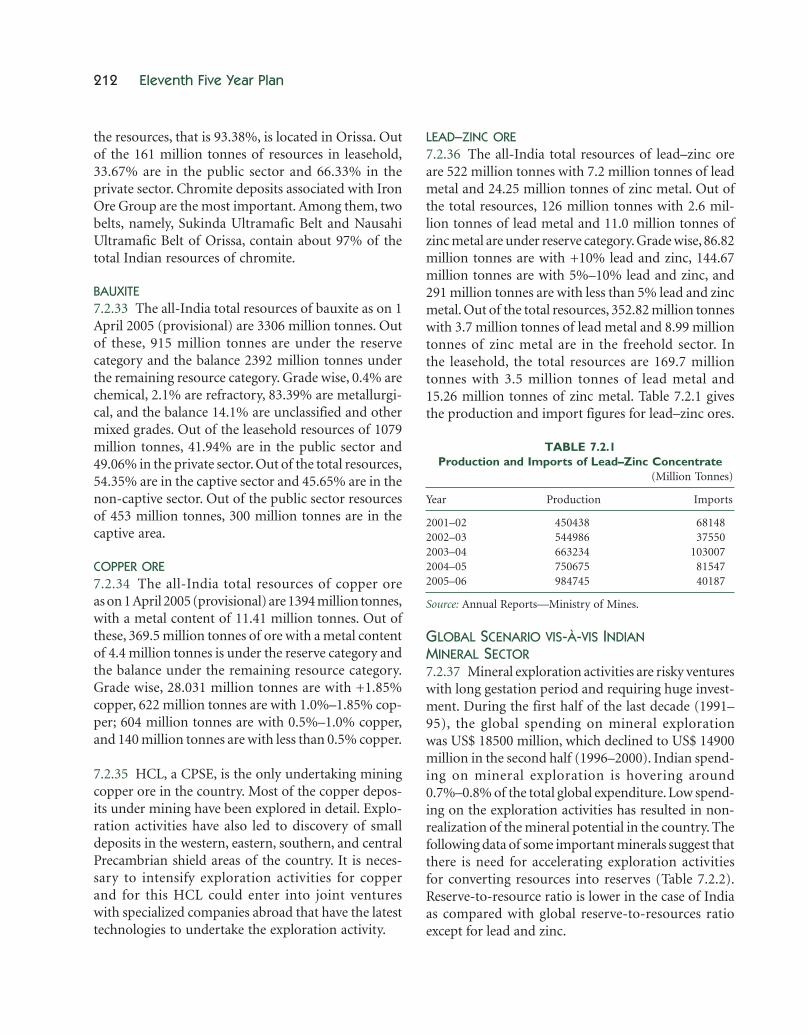
212 Eleventh Five Year Plan
the resources, that is 93.38%, is located in Orissa. Outof the 161 million tonnes of resources in leasehold,33.67% are in the public sector and 66.33% in theprivate sector. Chromite deposits associated with IronOre Group are the most important. Among them, twobelts, namely, Sukinda Ultramafic Belt and NausahiUltramafic Belt of Orissa, contain about 97% of thetotal Indian resources of chromite.
BAUXITE7.2.33 The all-India total resources of bauxite as on 1April 2005 (provisional) are 3306 million tonnes. Outof these, 915 million tonnes are under the reservecategory and the balance 2392 million tonnes underthe remaining resource category. Grade wise, 0.4% arechemical, 2.1% are refractory, 83.39% are metallurgi-cal, and the balance 14.1% are unclassified and othermixed grades. Out of the leasehold resources of 1079million tonnes, 41.94% are in the public sector and49.06% in the private sector. Out of the total resources,54.35% are in the captive sector and 45.65% are in thenon-captive sector. Out of the public sector resourcesof 453 million tonnes, 300 million tonnes are in thecaptive area.
COPPER ORE7.2.34 The all-India total resources of copper oreas on 1 April 2005 (provisional) are 1394 million tonnes,with a metal content of 11.41 million tonnes. Out ofthese, 369.5 million tonnes of ore with a metal contentof 4.4 million tonnes is under the reserve category andthe balance under the remaining resource category.Grade wise, 28.031 million tonnes are with +1.85%copper, 622 million tonnes are with 1.0%–1.85% cop-per; 604 million tonnes are with 0.5%–1.0% copper,and 140 million tonnes are with less than 0.5% copper.
7.2.35 HCL, a CPSE, is the only undertaking miningcopper ore in the country. Most of the copper depos-its under mining have been explored in detail. Explo-ration activities have also led to discovery of smalldeposits in the western, eastern, southern, and centralPrecambrian shield areas of the country. It is neces-sary to intensify exploration activities for copperand for this HCL could enter into joint ventureswith specialized companies abroad that have the latesttechnologies to undertake the exploration activity.
LEAD–ZINC ORE7.2.36 The all-India total resources of lead–zinc oreare 522 million tonnes with 7.2 million tonnes of leadmetal and 24.25 million tonnes of zinc metal. Out ofthe total resources, 126 million tonnes with 2.6 mil-lion tonnes of lead metal and 11.0 million tonnes ofzinc metal are under reserve category. Grade wise, 86.82million tonnes are with +10% lead and zinc, 144.67million tonnes are with 5%–10% lead and zinc, and291 million tonnes are with less than 5% lead and zincmetal. Out of the total resources, 352.82 million tonneswith 3.7 million tonnes of lead metal and 8.99 milliontonnes of zinc metal are in the freehold sector. Inthe leasehold, the total resources are 169.7 milliontonnes with 3.5 million tonnes of lead metal and15.26 million tonnes of zinc metal. Table 7.2.1 givesthe production and import figures for lead–zinc ores.
TABLE 7.2.1Production and Imports of Lead–Zinc Concentrate
(Million Tonnes)
Year Production Imports
2001–02 450438 681482002–03 544986 375502003–04 663234 1030072004–05 750675 815472005–06 984745 40187
Source: Annual Reports—Ministry of Mines.
GLOBAL SCENARIO VIS-À-VIS INDIANMINERAL SECTOR7.2.37 Mineral exploration activities are risky ventureswith long gestation period and requiring huge invest-ment. During the first half of the last decade (1991–95), the global spending on mineral explorationwas US$ 18500 million, which declined to US$ 14900million in the second half (1996–2000). Indian spend-ing on mineral exploration is hovering around0.7%–0.8% of the total global expenditure. Low spend-ing on the exploration activities has resulted in non-realization of the mineral potential in the country. Thefollowing data of some important minerals suggest thatthere is need for accelerating exploration activitiesfor converting resources into reserves (Table 7.2.2).Reserve-to-resource ratio is lower in the case of Indiaas compared with global reserve-to-resources ratioexcept for lead and zinc.
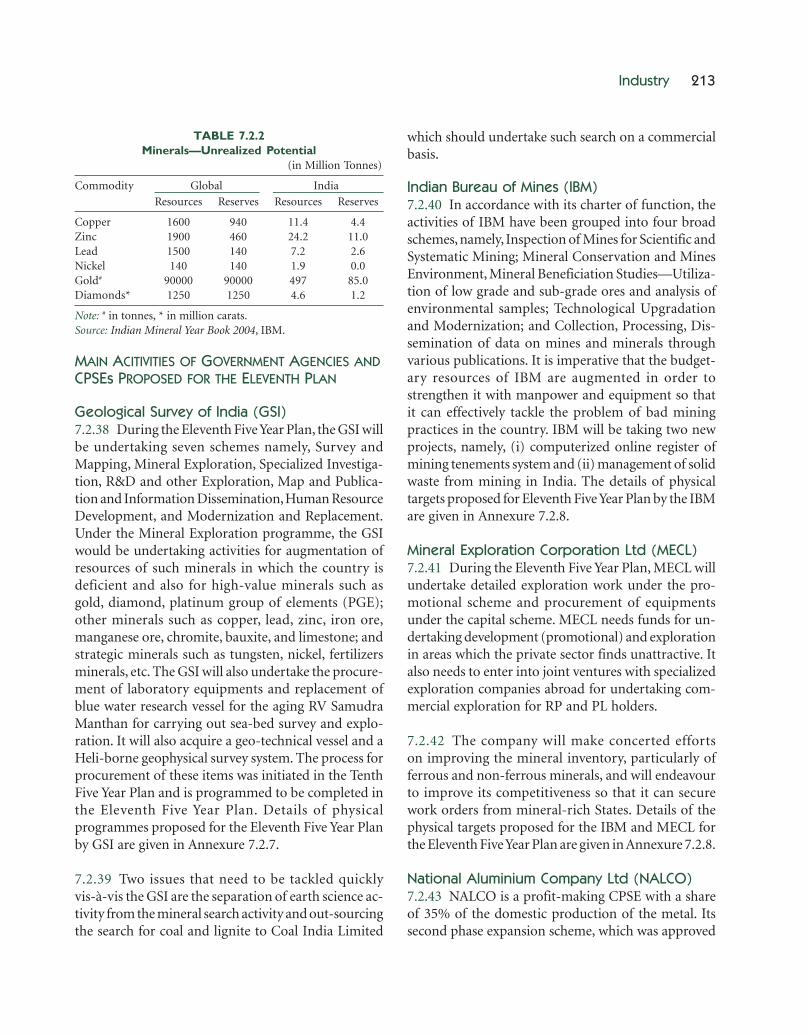
Industry 213
TABLE 7.2.2Minerals—Unrealized Potential
(in Million Tonnes)
Commodity Global India
Resources Reserves Resources Reserves
Copper 1600 940 11.4 4.4Zinc 1900 460 24.2 11.0Lead 1500 140 7.2 2.6Nickel 140 140 1.9 0.0Gold# 90000 90000 497 85.0Diamonds* 1250 1250 4.6 1.2
Note: # in tonnes, * in million carats.Source: Indian Mineral Year Book 2004, IBM.
MAIN ACITIVITIES OF GOVERNMENT AGENCIES ANDCPSEs PROPOSED FOR THE ELEVENTH PLAN
Geological Survey of India (GSI)7.2.38 During the Eleventh Five Year Plan, the GSI willbe undertaking seven schemes namely, Survey andMapping, Mineral Exploration, Specialized Investiga-tion, R&D and other Exploration, Map and Publica-tion and Information Dissemination, Human ResourceDevelopment, and Modernization and Replacement.Under the Mineral Exploration programme, the GSIwould be undertaking activities for augmentation ofresources of such minerals in which the country isdeficient and also for high-value minerals such asgold, diamond, platinum group of elements (PGE);other minerals such as copper, lead, zinc, iron ore,manganese ore, chromite, bauxite, and limestone; andstrategic minerals such as tungsten, nickel, fertilizersminerals, etc. The GSI will also undertake the procure-ment of laboratory equipments and replacement ofblue water research vessel for the aging RV SamudraManthan for carrying out sea-bed survey and explo-ration. It will also acquire a geo-technical vessel and aHeli-borne geophysical survey system. The process forprocurement of these items was initiated in the TenthFive Year Plan and is programmed to be completed inthe Eleventh Five Year Plan. Details of physicalprogrammes proposed for the Eleventh Five Year Planby GSI are given in Annexure 7.2.7.
7.2.39 Two issues that need to be tackled quicklyvis-à-vis the GSI are the separation of earth science ac-tivity from the mineral search activity and out-sourcingthe search for coal and lignite to Coal India Limited
which should undertake such search on a commercialbasis.
Indian Bureau of Mines (IBM)7.2.40 In accordance with its charter of function, theactivities of IBM have been grouped into four broadschemes, namely, Inspection of Mines for Scientific andSystematic Mining; Mineral Conservation and MinesEnvironment, Mineral Beneficiation Studies—Utiliza-tion of low grade and sub-grade ores and analysis ofenvironmental samples; Technological Upgradationand Modernization; and Collection, Processing, Dis-semination of data on mines and minerals throughvarious publications. It is imperative that the budget-ary resources of IBM are augmented in order tostrengthen it with manpower and equipment so thatit can effectively tackle the problem of bad miningpractices in the country. IBM will be taking two newprojects, namely, (i) computerized online register ofmining tenements system and (ii) management of solidwaste from mining in India. The details of physicaltargets proposed for Eleventh Five Year Plan by the IBMare given in Annexure 7.2.8.
Mineral Exploration Corporation Ltd (MECL)7.2.41 During the Eleventh Five Year Plan, MECL willundertake detailed exploration work under the pro-motional scheme and procurement of equipmentsunder the capital scheme. MECL needs funds for un-dertaking development (promotional) and explorationin areas which the private sector finds unattractive. Italso needs to enter into joint ventures with specializedexploration companies abroad for undertaking com-mercial exploration for RP and PL holders.
7.2.42 The company will make concerted effortson improving the mineral inventory, particularly offerrous and non-ferrous minerals, and will endeavourto improve its competitiveness so that it can securework orders from mineral-rich States. Details of thephysical targets proposed for the IBM and MECL forthe Eleventh Five Year Plan are given in Annexure 7.2.8.
National Aluminium Company Ltd (NALCO)7.2.43 NALCO is a profit-making CPSE with a shareof 35% of the domestic production of the metal. Itssecond phase expansion scheme, which was approved

214 Eleventh Five Year Plan
by the GoI in October 2004 at an estimated cost ofRs 4091.51 crore, is likely to be completed by Decem-ber 2008. The capacity of various project segmentsbeing expanded is given in Annexure 7.2.9. NALCOwill also initiate action for setting up green fieldprojects and diversifying its activities.
Hindustan Copper Ltd (HCL)7.2.44 HCL, which was earlier a sick CPSE, has beenmaking profits over the past three years. During theEleventh Five Year Plan, HCL will be undertaking re-placement and renewal of equipments to be fundedthrough their internal resources for maintaining theexisting level of production and for planning enhancedproduction in the future.
RESEARCH AND DEVELOPMENT (R&D)7.2.45 Research work is being undertaken by theNational Institute of Rock Mechanics, JawaharlalNehru Aluminium Research, Development, and De-sign Centre, the National Institute of Miners’ Health,and other educational institutions. The funds forresearch are being provided to these institutions bythe Ministry of Mines on approval of research projectsby the Standing Advisory Group in the Ministry.
7.2.46 The major thrust areas identified for R&D inthe mineral sector include: exploration, mining tech-nology, mineral processing and value addition, metalextraction, alloys and product development, andenvironment management for ensuring sustainabledevelopment of the sector.
7.2.47 There is need for a focused approach in the fieldof R&D in the mineral sector. Some of the specificprojects identified for the Eleventh Plan are as follows:
• Study of greenstone belts and their associated min-erals, especially gold (Au) and PGE mineralization.
• The by-products and wastes that are available arevaluable products for the future. With metal pricesfor titanium (Ti), vanadium (V), and gallium (Ga)scaling new highs, an integrated approach to winmany materials from the same source has becomeimperative. Red mud requires a serious second lookas it is possible to recover the above-mentionedmetals. Similarly, a re-look at various slags and
anode slimes for high-value trace metals for PGEmetals is needed and specific R&D programmesshould be taken up for secondaries and wastes.
• Multi-material extraction technology for extractionof metals such as tungsten, molybdenum, vanadium,chromium, nickel, etc., on the one hand, and value-added trace elements such as gallium, indium, tellu-rium, etc., on the other hand, needs to be developed.
7.2.48 For strengthening R&D activities in mining,consideration needs to be given to the proposal to setup a centralized R&D institution for undertakingresearch on all aspects of mining.
HUMAN RESOURCE DEVELOPMENT7.2.49 GSI, IBM, State Directorates of Mines andGeology, State Mining Corporations, Central PublicSector Undertakings (CPSUs), private and joint ven-ture exploration and mining companies, researchinstitutions, and academic institutions are the keyplayers which recruit competent and trained man-power in the mineral sector. Organizations such as GSIand IBM are facing problems of shortage of trainedmanpower. The best talents are being attracted byareas such as IT and business management and thereis little demand among students for taking up miningengineering and geology as courses of study. Non-induction of officers at the entry level in the GSI andIBM has compounded the problem. In order to rem-edy the situation, it is necessary to make an assessmentof the future requirement of geologists and miningengineers in the GSI and IBM and announce a long-term programme of recruitment.
SUSTAINABILITY OF MINERAL DEVELOPMENT7.2.50 Mineral development faces opposition in thecountry on two accounts. First, there is scepticismabout mining operations being done in a mannerthat does not have an adverse impact on the environ-ment. Second, there is a feeling among PAPs that theyhave not received enough compensation. More impor-tantly, there are unfulfilled expectations from miningcompanies for providing development services inreturn for the social license to operate the mines.
7.2.51 There are two statutes, viz., the Forest (Con-servation) Act 1980 and the Environment (Protection)

Industry 215
Act 1986, which lay down the law that must befollowed in the development of mines. A criticism thathas been made is that the two statutes have a preoccu-pation with two concerns, namely, compensation fordiversion of forest land to non-forest use in variousforms (including compensatory afforestation) andthe need for environment impact studies prior to thegrant of environmental clearances. The best practiceinternationally goes much beyond these concerns.Worldwide, mining interventions are becoming in-creasingly sophisticated and the objective is ‘to ensurethat the critical natural capital is maintained, thatecosystems are enhanced where possible, and thatmineral wealth contributes to net environmentalcontinuity.’ (National Mineral Policy: Report of theHigh Level Committee, 2006).
7.2.52 As for relief and rehabilitation, various min-eral-rich States already have in position policies andexecutive orders that lay down the entitlements of thePAPs. But the practice in the country falls short of thatprevailing internationally in mining sector interven-tions. The international best practices include 2%–3%of the turnover of mining companies being expendedon social infrastructure in the region, a direct finan-cial stake in the mining venture to indigenous com-munities (e.g., tribals) in the form of equity, and allthis is in addition to fair compensation to PAPs by wayof cash, housing, and jobs. Mining companies inIndia now under statutory obligations, routinely un-dertake welfare measures for the development ofentire local communities. However, as observed bythe high-level committee, ‘these are unorganizedad hoc initiatives that are voluntary in nature and forwhich there is no accountability to outside agencies’.It is necessary to have a formalized framework sothat standards are laid down and adherence to thestandards is ensured.
7.2.53 In order to enhance the contribution of min-ing to the enrichment of the environment and improvethe well being of the indigenous communities beyondwhat the current law and policy provides, the high-level committee on the Mineral Policy has recom-mended that a framework should be prepared andadapted to the Indian mining context on the basis ofthe SDF developed by the International Council of
Mining and Metals and the International Union forthe Conservation of Nature and Natural Resources.Once such a framework has been prepared, all miningleaseholders would be required to adhere to it as a con-dition of their lease. The government would establisha mechanism for monitoring such adherence in a par-ticipative mode along with the NGOs and PAPs.
IMPEDIMENTS TO INVESTMENT IN MINING7.2.54 The main reason for the lack of private sectorinvestment in exploration and mining activity is thatthere is no assurance that the RP holder will get theprospecting license and the PL holder will get theML. Further, even after an entrepreneur gets the ML,several discretionary provisions in the statutes pose athreat to the ML holder’s security of tenure.
7.2.55 At present, the system of exclusive RPs containsno incentive for the RP holder to expedite reconnais-sance work. Furthermore, the lack of clarity on theright to transfer PLs limits the applications for RP onlyto large companies, which have the ability to take upreconnaissance, prospecting, as well as mining activ-ity. Without a guaranteed and explicit right to transferthe PLs, standalone exploration companies, which havethe ability to do reconnaissance and prospecting onthe basis of state-of-the-art techniques, but do notundertake mining as this is a separate activity, are dis-couraged from making an application for RP. This isthe single most vital issue for attracting investment inexploration and it lies at the core of the recommenda-tion for ‘unbundling’ made by the high-level commit-tee on the National Mineral Policy.
7.2.56 Even though the regulations contain time lim-its for the State Government in disposing of applica-tions, they may defer indefinitely a decision on anapplication for RP/PL/ML in the hope that applicationswould come in future from value-adders.
7.2.57 Procedural delays in the disposal of applica-tions occur for a number of reasons. One of them isthat a great deal of time is taken for the verification ofmineral titles. The availability of a spatially represented,easily accessible registry of all pending and grantedexploration titles is a key part of a modern regulatorysystem.
216 Eleventh Five Year Plan
7.2.58 Several State Government undertakings areinvolved in mining activity and since the State isalso a regulator the State’s involvement in mining, incompetition with private mining companies it canbecome a disincentive for the private sector invest-ment.
MINERAL DEVELOPMENT IN THE STATES7.2.59 In line with the current economic and newmineral policy, the core functions of the State inmining will be facilitation of exploration and miningactivities of investors and entrepreneurs, provisionof infrastructure, and regulation and tax collection.The mineral-producing States need to updatetheir mineral policy in line with the National MineralPolicy.
INFRASTRUCTURE IN MINING AREAS7.2.60 While deficiencies in arterial roadways, railways,and port infrastructure need to be addressed by theCentral Government, equally crucial for the develop-ment of mining is the infrastructure that links minesto the arterial routes. While the Central Governmentis providing funds for arterial routes, there is a needfor funds for linking infrastructure as well. This isparticularly important in our country where non-captive mining is mainly an SME sector activity.
STRATEGIES TO MEET THE CHALLENGES7.2.61 At the end of the Tenth Five Year Plan, the po-tential of the mineral sector in the country remainslargely unrealized in the absence of exploration activi-ties on the scale needed. The public sector bodies arehamstrung by the lack of financial resources and theprivate sector does not find the legal framework andthe procedures to be conducive for the enterprise.There are other challenges as well, particularly thoserelating to the transport infrastructure, the protectionof the environment, rehabilitation of the people dis-placed by the mining activity, and increasing the rev-enue for the State Governments from mining activity.We give below the more important strategies for tack-ling them, based largely on the recommendations ofthe high-level committee on National Mineral Policyreferred to earlier.
• It is necessary to effect changes in law so that thetransition from RP to PL and further to ML is madeseamless. Discretionary powers of the government,which affect the security of tenure of the holders ofRP/PL/ML, should be eliminated or at least sub-stantially curtailed.
• For maximizing the investment in exploration, RPsshould be made non-exclusive and prospectingcompanies should be given explicitly a guaranteedright to transfer the PL with the accompanying rightto be granted the ML.
• The present registry system should be modernizedby creating a digitized online mineral atlas, whichwould show the mineral titles clearly. This will makeit feasible for applicants to ascertain the availabilityof areas before applications and to apply online,which should be allowed.
• Co-ordination-cum-empowered committees needto be established in the Centre as well as in the Statesto monitor the clearances and to serve as a pressurepoint to ensure speedy clearance by different de-partments and agencies.
• In line with the current economic policy, the corefunctions of the State in mining should be facilita-tion of exploration and mining activities of privatesector investors and entrepreneurs, provision ofinfrastructure, and regulation and tax collection.
• To facilitate the provision of infrastructure linkingthe mines to the arterial routes, each State Govern-ment with major mining activity should set up amineral development fund (MDF) by earmarking15% of the annual royalty collections for the fund.The GoI should also make matching contributionto the MDF of each State every year for the dura-tion of the Eleventh Plan.
PLAN OUTLAY IN THE ELEVENTH PLAN7.2.62 The scheme-wise break up of the Eleventh Planoutlay is given in Annexure 7.2.10. The total projectedoutlay for the Eleventh Five Year Plan for Ministry ofMines is Rs 7430 crore at 2006–07 price (Rs 8404 croreat current price) which includes Rs 1043 crore of GBSat 2006–07 price (Rs 1180 crore at current price) andRs 6387 crore of IEBR at 2006–07price (Rs 7224 atcurrent price).

Industry 217
ANNEXURE 7.1.1Industrial Investment Proposals
Industrial Entrepreneur Letter of Intents (LOIs) Direct IndustrialMemoranda (IEM) Licenses (DILs)
Year No. of Proposed No. of Proposed No. of ProposedProposals Investment Proposals Investment Proposals Investment
(Rs Crore) (Rs Crore) (Rs Crore)
2001 2981 91234 117 13182002 3172 91291 89 6492003 3875 118612 116 1395 142004 5118 267069 39 381 61 48842005 6203 353956 24 333 111 26572006 6260 588271 20 137 90 46932007 (up to March 2007) 1030 204517 1 37 6 886
Source: SIA Statistics, April 2007, DIPP.
ANNEXURE 7.1.2Investment Projects Benefiting from Loans from Banks/FIs in 2004–05, 2005–06 and 2006–07
2004–05 2005–06 2006–07
Number Project % Number Projects % Number Project %of Cost Share of Cost Share of Cost Share
Projects Amount Projects Amount Projects Amount(Rs Crore) (Rs Crore) (Rs Crore)
1 Industry 2 3 4 5 6 7
11. Infrastructure 75 31294 33.3 109 44541 33.9 125 101744 35.9(i) Power 60 12419 13.2 66 35358 26.9 64 51451 18.2(ii) Telecom 4 15832 16.9 5 2639 2.0 9 17950 6.3(iii) Ports and airports 11 3043 3.2 3 2295 1.8 7 10745 3.8(iv) Roads, storage, and 22 2386 1.8 8 13083 4.6
water management(v) SEZ, industrial, 13 1864 1.4 37 8515 3.0
biotech, and IT parks12. Sugar 14 763 0.8 20 2857 2.2 33 8867 3.113. Textiles 126 7458 8.0 158 14128 10.8 258 25933 9.214. Paper and paper products 17 2330 2.5 23 2397 1.8 24 2915 1.015. Coke and petroleum products 2 1107 0.8 11 44083 15.516. Chemicals and petrochemicals 38 2822 3.0 26 3021 2.3 35 4136 1.517. Cement 14 3642 3.9 13 1945 1.5 27 10567 3.718. Metal and metal products 141 27331 29.1 126 21799 16.6 130 39876 14.119. Electrical and non- 23 671 0.7 22 384 0.3 20 4486 1.6
electrical machinery10. Transport equipments 25 1289 1.4 13 988 0.8 29 5174 1.811. Construction 8 275 0.3 33 4700 3.6 34 9277 3.312. Hotels and restaurants 20 2254 2.4 37 4454 3.4 74 11122 3.913. Transport services 45 4201 4.5 21 16947 12.9 17 1561 0.514. Entertainment 9 1807 1.4 20 761 0.315. IT 16 974 1.0 7 2683 2.0 8 228 0.116 Food products/processing 47 1754 1.917. Others* 81 3401 3.6 193 7540 5.7 209 12710 4.5
Total 720 93859 100.00 812 131299 100.0 1054 283440 100.0
Note: *Comprise industries, each with a share of less than 1% in total cost of projects in 2005–06 and 2006–07.Source: RBI, Bulletin, August 2006 and August 2007.

AN
NE
XU
RE
7.1
.3C
ompo
siti
on o
f E
xpor
ts a
nd G
row
th R
ates
Exp
orts
% S
hare
Com
pou
nd
CA
GR
2006
–07
of E
xpor
tsA
nn
ual
Gro
wth
in T
enth
P (
US$
Rat
e (C
AG
R)
Pla
nM
illio
n)
in N
inth
Pla
nG
row
th R
ate
over
Pre
viou
s Ye
ar
Com
mod
ity
Nin
th P
lan
2006
–07
2002
–03
2003
–04
2004
–05
2005
–06
2006
–07
I.P
rim
ary
Pro
duct
s19
547.
818
.315
.5–2
.321
.513
.736
.920
.919
.422
.2
A.
Agr
icu
ltur
e an
d al
lied
prod
ucts
1251
4.6
15.6
9.9
–3.0
13.7
12.3
12.5
20.3
22.5
16.2
B.
Ore
s an
d m
iner
als
7033
.12.
75.
61.
558
.118
.711
4.4
21.9
14.1
41.0
II.
Man
ufa
ctur
ed G
oods
8281
7.8
77.4
65.6
6.3
20.6
20.5
25.2
18.3
14.1
19.9
A.
Leat
her
and
man
ufa
ctur
es29
33.1
4.5
2.3
3.5
–3.2
17.0
12.0
8.4
8.7
9.0
B.
Che
mic
als
and
rela
ted
prod
ucts
1672
7.1
12.9
13.2
9.1
23.2
26.7
31.7
16.6
13.3
22.5
1. B
asic
che
mic
als,
pha
rmac
euti
cals
,10
445.
88.
28.
28.
226
.025
.522
.125
.214
.423
.1an
d co
smet
ics
2. O
ther
s62
81.3
4.7
5.0
10.7
18.8
28.7
47.3
5.1
11.3
21.7
C.
En
gin
eeri
ng
good
s29
079.
114
.923
.07.
029
.837
.339
.824
.233
.933
.1
D.
Text
ile a
nd
text
ile p
rodu
cts
1700
9.7
25.5
13.5
3.4
13.8
10.1
6.0
18.3
3.7
10.8
1. C
otto
n y
arn
, fab
rics
, mad
eups
, etc
.41
36.6
8.1
3.3
–0.3
9.1
1.3
1.6
12.0
4.9
6.1
2. R
eady
mad
e ga
rmen
ts86
94.7
12.2
6.9
5.9
13.6
9.5
5.3
28.1
0.9
11.7
3. M
an-m
ade
yarn
, fab
rics
,21
64.6
2.3
1.7
8.7
28.8
28.4
11.4
–2.2
10.6
15.2
3. m
adeu
ps, e
tc.
4. O
ther
(si
lk, j
ute,
coi
r, w
oole
n20
13.8
2.9
1.6
0.1
13.4
16.6
12.6
17.2
7.0
13.7
4. p
rodu
cts,
an
d ca
rpet
s)
E.
Gem
s an
d je
wel
lery
1558
5.7
17.3
12.3
9.0
23.6
17.1
30.2
13.0
0.4
16.4
F.H
andi
craf
ts (
excl
udi
ng
han
d-37
1.7
1.6
0.3
2.9
43.0
–36.
4–2
4.5
8.7
–19.
5–7
.5m
ade
carp
ets)
G.
Oth
er m
anu
fact
ured
goo
ds11
11.4
0.8
0.9
7.7
22.5
29.0
34.1
37.7
13.0
23.4
III.
Petr
oleu
m P
rodu
cts
1855
1.9
2.3
14.7
34.5
21.6
38.5
95.9
64.7
59.4
54.3
IV.O
ther
s54
13.7
2.0
4.3
28.2
1.5
57.7
20.3
32.9
115.
635
.8
Tota
l E
xpor
ts12
6331
.110
0.0
100.
05.
520
.321
.130
.823
.022
.523
.6
Not
e: P
= P
rovi
sion
al.
Sour
ce: H
andb
ook
of S
tati
stic
s on
In
dian
Eco
nom
y, R
BI,
200
7.

Industry 219
ANNEXURE 7.1.4Performance of CPSEs during the Tenth Five Year Plan
(Rs Crore)
Turnover Net Profit/Loss (–)
Industry 2001–02 2002–03 2003–04 2004–05 2005–06 2001–02 2002–03 2003–04 2004–05 2005–06
Steel 20135 24885 31008 40820 41742 –1781 229 4091 8893 5307
Minerals and 5461 5846 7160 10153 12384 568 755 1467 2876 4039
non-ferrous metals
Coal and lignite 22001 26920 29048 33698 34489 2158 3035 5238 4826 8216
Power 23977 25271 25321 30010 34306 5613 5219 8605 8730 9082
Petroleum 253012 305335 330074 406247 499555 12639 22322 23819 25959 26181
Fertilizers 7429 8280 8017 8999 9364 –1796 –2329 –2128 –2104 –1990
Chemicals and 810 981 1005 1298 976 –388 –253 –376 –557 –74
pharmaceuticals
Heavy engineering 7892 7973 9041 10823 15042 144 –6 43 313 977
Medium and light 7808 7946 7864 8443 9559 –191 –687 –977 –450 –25
engineering
Transportation 6112 6505 6962 8198 9619 776 388 293 679 1045
equipment
Consumer goods 1241 1241 1311 1325 1606 –306 –721 –575 –848 225
Agro-based 129 142 158 150 173 –14 –14 –11 –26 –21
industries
Textiles 753 940 825 875 856 –1032 –1961 425 –1479 1211
Total industry 356759 422264 457793 561039 669672 16390 25978 39914 46815 54172
Enterprises 107174 138930 160064 166302 162912 10003 6199 12576 17269 16117
rendering services
Total CPSEs 463934 561194 617857 727341 832584 26393 32176 52490 64083 70288
Note: The data is in respect of 225 CPSEs in operation in 2005–06 for 2001–02 to 2004–05. In 2005–06, 10 CPSEs did not report the datato DPE and therefore data for 2005–06 pertains to 215 CPSEs.Source: DPE, 2007, Public Enterprises Survey 2005-06, Volume–I.

220 Eleventh Five Year Plan
ANNEXURE 7.1.5State-wise and Year-wise Investment Intentions (IEMs + LOIs + DILs)
(in Rs Crore)
S. No. Name of the State 2003–04 2004–05 2005–06 2006–07 2007–08(April–May)
11. Andhra Pradesh 16527 16596 19001 48660 2577
12. Assam 163 430 809 2044 169
13. Bihar 27 314 3913 4850 308
14. Chhattisgarh 16155 47602 39914 118737 17559
15. Dadra and Nagar Haveli 4137 834 2374 2794 431
16. Gujarat 32341 29695 82901 72283 7946
17. Haryana 8372 2737 5578 16095 769
18. Himachal Pradesh 1126 3384 1774 1906 254
19. Jammu and Kashmir 774 2719 2058 2306 400
10. Jharkhand 1861 10539 54089 35257 17969
11. Karnataka 14074 10969 15353 72250 7059
12. Madhya Pradesh 1616 8538 18782 12537 1963
13. Maharashtra 8878 13256 24694 62191 6907
14. Orissa 17718 45565 38255 96869 5997
15. Punjab 1844 4190 7127 10128 544
16. Rajasthan 1096 2162 5077 10040 1768
17. Tamil Nadu 2898 54481 11841 20377 5373
18. Uttar Pradesh 2179 21633 31710 33745 1823
19. Uttarakhand 1334 2441 5706 14887 968
20. West Bengal 7637 14078 12047 51836 9410
21. Others 17628 1931 3378 6574 1857
Total 158385 294094 386381 696366 92051
Note: Investment in terms of IEMs filed, Letters of Intent (LOIs) issued, and DILs.Source: SIA Statistics, June 2007.

Industry 221
ANNEXURE 7.1.6State-wise Investment Projects Benefiting from Loans from Banks/FIs during 2004–05, 2005–06 and 2006–07
2004–05 2005–06 2006–07
State Number of Project Cost Number of Project Cost Number of Project CostProjects Projects Projects
Amount % Amount % Amount %(Rs Crore) Share (Rs Crore) Share (Rs Crore) Share
1 2 3 4 5 6 7 8 9 10
Andhra Pradesh 38 3330 3.6 76 11254 8.6 105 25173 8.9
Chhattisgarh 40 8620 9.2 19 5162 3.9 13 2365 0.8
Delhi 12 1471 1.6 24 2127 1.6 19 6359 2.2
Gujarat 81 10983 11.7 95 24531 18.7 86 73170 25.8
Haryana 21 1440 1.5 29 1805 1.4 42 3897 1.4
Himachal Pradesh 17 1358 1.4 19 9325 7.1 30 2644 0.9
Jharkhand – – – 8 367 0.3 13 7174 2.5
Karnataka 50 6641 7.1 51 4537 3.5 91 19930 7.0
Madhya Pradesh 19 766 0.1 12 2514 1.9 23 4878 1.7
Maharashtra 102 9808 10.4 121 24828 18.9 142 24330 8.6
Orissa 30 9256 9.9 20 4525 3.5 23 14806 5.2
Punjab 32 2609 2.8 27 2041 1.5 48 5902 2.1
Rajasthan 26 1587 1.7 27 2466 1.9 38 9806 3.5
Sikkim – – – – – – 3 9418 3.3
Tamil Nadu 110 9929 10.6 124 12160 9.3 157 24299 8.6
Uttar Pradesh 23 1348 1.4 50 10415 7.9 60 9836 3.5
Uttarakhand 10 599 0.6 24 2959 2.2 31 5633 2.0
West Bengal 40 2324 2.5 27 2548 1.9 37 3404 1.2
Multi-State 33 18893 20.1 29 5730 4.4 46 25428 9.0
Others* 36 2898 3.1 30 2005 1.5 47 4988 1.8
Total 720 93859 100.0 812 131299 100.0 1054 283440 100.0
Note: *Comprise States/UTs, each with share of less than 1% in aggregate cost of projects in 2005–06 and 2006–07.Source: RBI Bulletin August 2006 and August 2007.
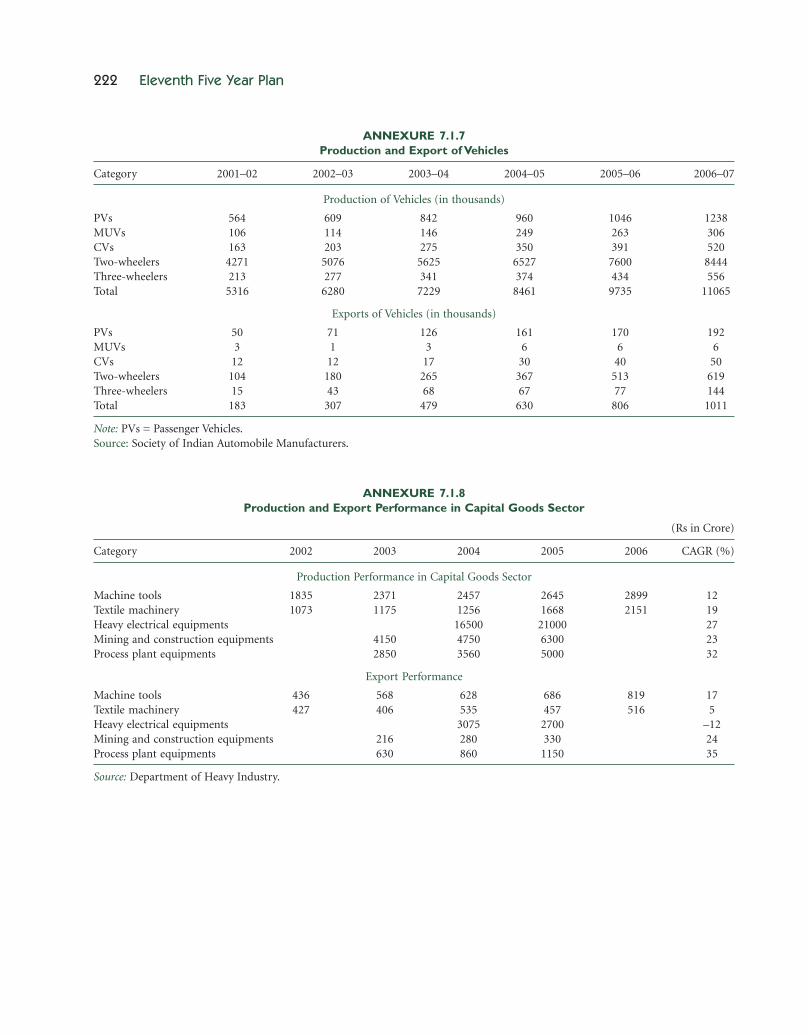
222 Eleventh Five Year Plan
ANNEXURE 7.1.7Production and Export of Vehicles
Category 2001–02 2002–03 2003–04 2004–05 2005–06 2006–07
Production of Vehicles (in thousands)
PVs 564 609 842 960 1046 1238MUVs 106 114 146 249 263 306CVs 163 203 275 350 391 520Two-wheelers 4271 5076 5625 6527 7600 8444Three-wheelers 213 277 341 374 434 556Total 5316 6280 7229 8461 9735 11065
Exports of Vehicles (in thousands)
PVs 50 71 126 161 170 192MUVs 3 1 3 6 6 6CVs 12 12 17 30 40 50Two-wheelers 104 180 265 367 513 619Three-wheelers 15 43 68 67 77 144Total 183 307 479 630 806 1011
Note: PVs = Passenger Vehicles.Source: Society of Indian Automobile Manufacturers.
ANNEXURE 7.1.8Production and Export Performance in Capital Goods Sector
(Rs in Crore)
Category 2002 2003 2004 2005 2006 CAGR (%)
Production Performance in Capital Goods Sector
Machine tools 1835 2371 2457 2645 2899 12Textile machinery 1073 1175 1256 1668 2151 19Heavy electrical equipments 16500 21000 27Mining and construction equipments 4150 4750 6300 23Process plant equipments 2850 3560 5000 32
Export Performance
Machine tools 436 568 628 686 819 17Textile machinery 427 406 535 457 516 5Heavy electrical equipments 3075 2700 –12Mining and construction equipments 216 280 330 24Process plant equipments 630 860 1150 35
Source: Department of Heavy Industry.
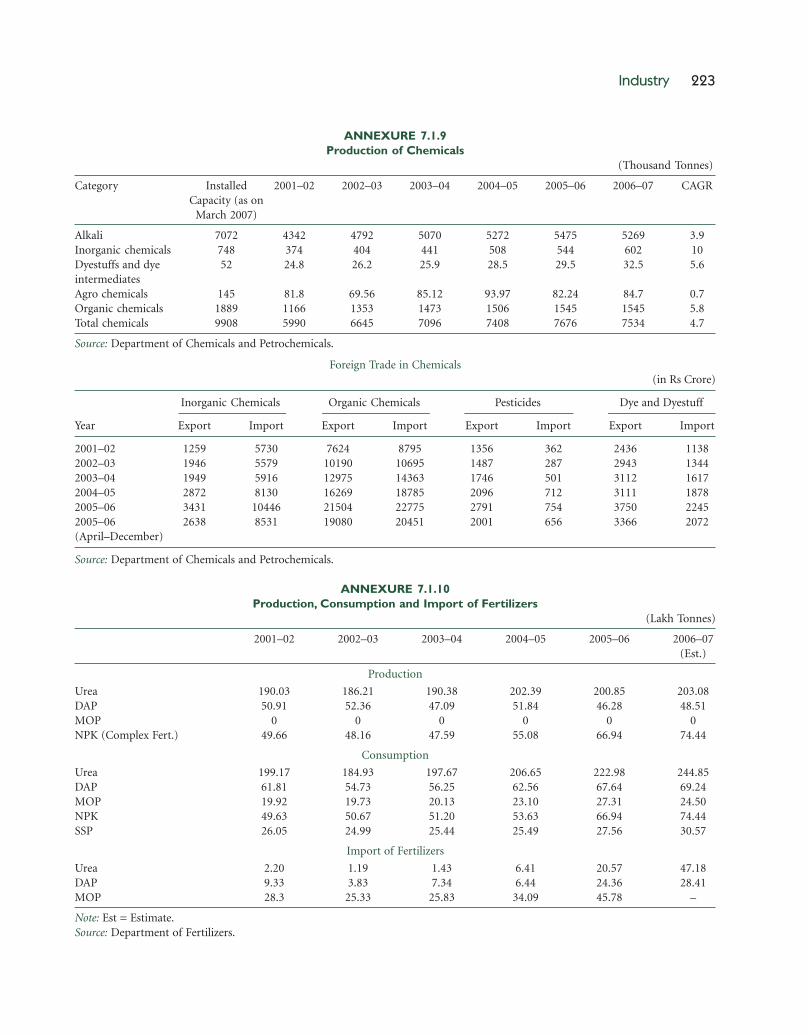
Industry 223
ANNEXURE 7.1.9Production of Chemicals
(Thousand Tonnes)
Category Installed 2001–02 2002–03 2003–04 2004–05 2005–06 2006–07 CAGRCapacity (as on
March 2007)
Alkali 7072 4342 4792 5070 5272 5475 5269 3.9Inorganic chemicals 748 374 404 441 508 544 602 10Dyestuffs and dye 52 24.8 26.2 25.9 28.5 29.5 32.5 5.6intermediatesAgro chemicals 145 81.8 69.56 85.12 93.97 82.24 84.7 0.7Organic chemicals 1889 1166 1353 1473 1506 1545 1545 5.8Total chemicals 9908 5990 6645 7096 7408 7676 7534 4.7
Source: Department of Chemicals and Petrochemicals.
Foreign Trade in Chemicals(in Rs Crore)
Inorganic Chemicals Organic Chemicals Pesticides Dye and Dyestuff
Year Export Import Export Import Export Import Export Import
2001–02 1259 5730 7624 8795 1356 362 2436 11382002–03 1946 5579 10190 10695 1487 287 2943 13442003–04 1949 5916 12975 14363 1746 501 3112 16172004–05 2872 8130 16269 18785 2096 712 3111 18782005–06 3431 10446 21504 22775 2791 754 3750 22452005–06 2638 8531 19080 20451 2001 656 3366 2072(April–December)
Source: Department of Chemicals and Petrochemicals.
ANNEXURE 7.1.10Production, Consumption and Import of Fertilizers
(Lakh Tonnes)
2001–02 2002–03 2003–04 2004–05 2005–06 2006–07(Est.)
Production
Urea 190.03 186.21 190.38 202.39 200.85 203.08DAP 50.91 52.36 47.09 51.84 46.28 48.51MOP 0 0 0 0 0 0NPK (Complex Fert.) 49.66 48.16 47.59 55.08 66.94 74.44
Consumption
Urea 199.17 184.93 197.67 206.65 222.98 244.85DAP 61.81 54.73 56.25 62.56 67.64 69.24MOP 19.92 19.73 20.13 23.10 27.31 24.50NPK 49.63 50.67 51.20 53.63 66.94 74.44SSP 26.05 24.99 25.44 25.49 27.56 30.57
Import of Fertilizers
Urea 2.20 1.19 1.43 6.41 20.57 47.18DAP 9.33 3.83 7.34 6.44 24.36 28.41MOP 28.3 25.33 25.83 34.09 45.78 –
Note: Est = Estimate.Source: Department of Fertilizers.

224 Eleventh Five Year Plan
ANNEXURE 7.1.13Performance of Commodity Polymers and Synthetic Fibres
(Kilo Tonnes)
2001–02 2002–03 2003–04 2004–05 2005–06 2006–07
Performance of Commodity Polymers
Capacity 4252 4316 4431 4614 4710 5187Production 3974 4175 4499 4776 4768 5183Consumption 3826 3795 4107 4177 4795 naImports 420 381 450 416 722 naExports 568 761 843 1015 695 naNet trade 148 380 393 599 (–) 27
Performance of Synthetic Fibre
Capacity 2071 2113 2204 2341 2413 3246Production 1669 1755 1868 1875 1906 2244Consumption 1718 1800 1882 1890 1893 naImports 147 189 155 193 162 naExports 98 144 141 178 175 naNet trade (–) 49 (–) 45 (–) 14 (–) 14 13
Source: Department of Chemicals and Petrochemicals.
ANNEXURE 7.1.11Production, Import and Export of Paper and Paperboard
(Lakh Tonnes)
Year Production Imports Exports
2003–04 55.57 3.15 2.322004–05 57.93 1.95 2.702005–06 58.70 2.85 2.292006–07 61.28 3.10 2.6
(April 2006–February 2007) (April–Dec 2006)
Source: Annual Reports, DIPP.
ANNEXURE 7.1.12Production, Import and Export of Newsprint
(Lakh Tonnes)
Year Production Imports Exports
2003–04 6.8 7.5 0.032004–05 7.6 6.7 0.052005–06 9.1 6.8 0.102006–07 10.3 7.9 0.04
Source: Annual Reports, DIPP.
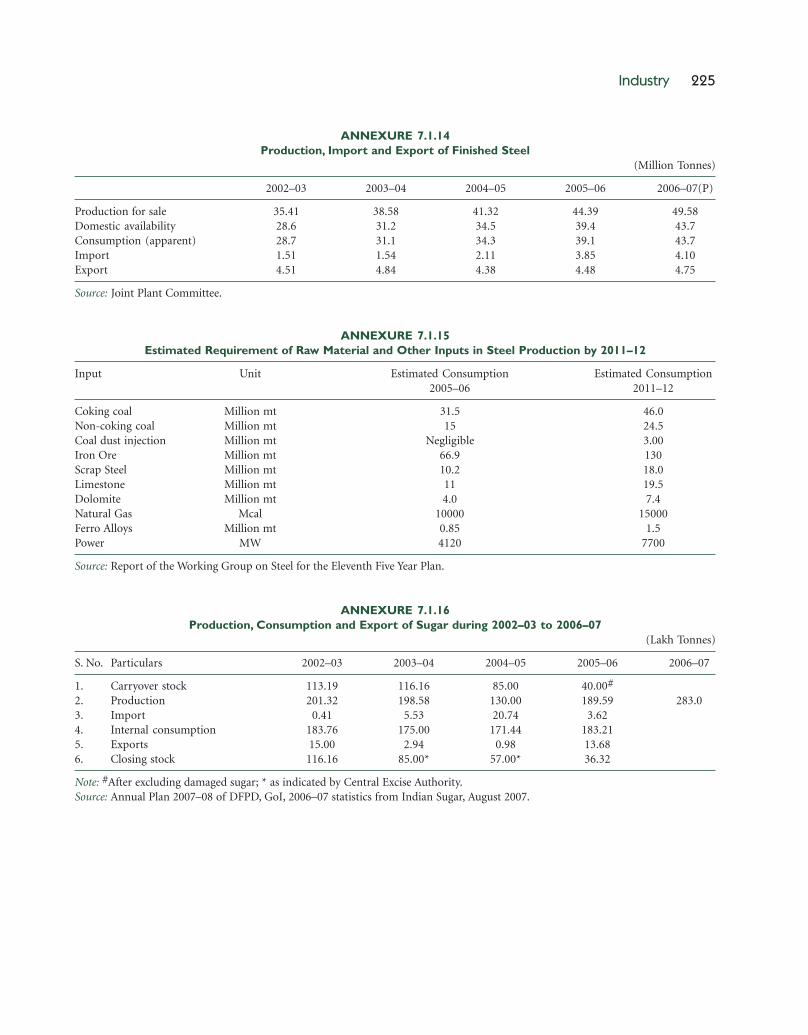
Industry 225
ANNEXURE 7.1.15Estimated Requirement of Raw Material and Other Inputs in Steel Production by 2011–12
Input Unit Estimated Consumption Estimated Consumption2005–06 2011–12
Coking coal Million mt 31.5 46.0Non-coking coal Million mt 15 24.5Coal dust injection Million mt Negligible 3.00Iron Ore Million mt 66.9 130Scrap Steel Million mt 10.2 18.0Limestone Million mt 11 19.5Dolomite Million mt 4.0 7.4Natural Gas Mcal 10000 15000Ferro Alloys Million mt 0.85 1.5Power MW 4120 7700
Source: Report of the Working Group on Steel for the Eleventh Five Year Plan.
ANNEXURE 7.1.16Production, Consumption and Export of Sugar during 2002–03 to 2006–07
(Lakh Tonnes)
S. No. Particulars 2002–03 2003–04 2004–05 2005–06 2006–07
1. Carryover stock 113.19 116.16 85.00 40.00#
2. Production 201.32 198.58 130.00 189.59 283.03. Import 0.41 5.53 20.74 3.624. Internal consumption 183.76 175.00 171.44 183.215. Exports 15.00 2.94 0.98 13.686. Closing stock 116.16 85.00* 57.00* 36.32
Note: #After excluding damaged sugar; * as indicated by Central Excise Authority.Source: Annual Plan 2007–08 of DFPD, GoI, 2006–07 statistics from Indian Sugar, August 2007.
ANNEXURE 7.1.14Production, Import and Export of Finished Steel
(Million Tonnes)
2002–03 2003–04 2004–05 2005–06 2006–07(P)
Production for sale 35.41 38.58 41.32 44.39 49.58Domestic availability 28.6 31.2 34.5 39.4 43.7Consumption (apparent) 28.7 31.1 34.3 39.1 43.7Import 1.51 1.54 2.11 3.85 4.10Export 4.51 4.84 4.38 4.48 4.75
Source: Joint Plant Committee.

226 Eleventh Five Year Plan
ANNEXURE 7.1.18Exports of Textiles and Clothing during the Tenth Five Year Plan
(US$ Million)
2001–02 2002–03 2003–04 2004–05 2005–06 April 2005– April 2006– Y-o-YFebruary February Growth
2006# 2007# (%)
Cotton textiles 3092 3370 3609 3543 4493 4038.0 4781.90 18.40
Man-made textiles 1092 1421 1826 2050 2000 1813.70 2104.70 16.00
Silk textiles 287 315 381 405 430 631.50 634.30 0.50
Woolen textiles 52 51 58 70 84 418.10 412.50 –1.30
Clothing 5024 5705 6248 6559 8403 7051.40 7273.40 3.10
Total 9547 10862 12122 12627 15410 13952.70 15206.80 9.0
Jute, coir, and handicrafts 1254 1583 1409 1394 1668 1574.80 1524.70 –3.18
Grand Total 10801 12445 13531 14021 17078 15527.50 16731.50 7.75
Percentage growth 15.22 8.73 3.62 21.80 7.75
Note: # DGCI&S, Kolkata.Source: Report of the Working Group on Textiles and Jute Industry for the Eleventh Plan.
ANNEXURE 7.1.17Production of Cloth—Year on Year Growth
2001–02 2002–03 2003–04 2004–05 2005–06 2006–07#
Cotton 0.26 –2.37 –6.53 14.50 15.13 9.67
Blended –1.01 –6.54 3.27 –0.59 3.48 8.34
100% non-cotton 12.70 5.22 9.16 2.19 4.16 7.07
Khadi, etc. 15.41 2.80 0.00 4.68 0.00 0.00
Total cloth 4.48 –0.15 0.98 7.07 9.00 8.37
Note: # Provisional, Confederation of Indian Textile Industry.Source: Report of the Working Group on Textiles and Jute Industry for the Eleventh Five Year Plan.

AN
NE
XU
RE
7.1
.19
The
Ten
th P
lan
Out
lay
and
Ant
icip
ated
Exp
endi
ture
and
the
Ele
vent
h P
lan
Out
lay
(Rs
Cro
re)
Ten
th P
lan
Ele
ven
th P
lan
(at
Cur
ren
t P
rice
)
Ou
tlay
sA
nti
cipa
ted
Exp
endi
ture
M
inis
try/
Dep
artm
ent
BS
IEB
RO
utl
ayB
SIE
BR
Exp
endi
ture
BS
IEB
RO
utl
ay
11.
Stee
l65
1097
911
044
106
4708
4814
217.
0045
390.
0845
607.
08Ir
on a
nd
Stee
l60
6039
6099
103
3994
4097
216.
0037
102.
1837
318.
18M
iner
als
549
4049
453
714
717
1.00
8287
.90
2288
.90
12.
Fert
ilize
r10
5048
5059
0065
7.36
1893
.74
2551
.10
1492
.06
1913
5.87
2062
7.93
13.
Che
mic
als
and
Petr
oche
mic
als
300
2744
3044
574.
910
574.
9119
60.0
029
6.36
2256
.36
14.
Indu
stri
al P
olic
y an
d P
rom
otio
n20
000
2000
1779
017
7941
83.0
00.
0041
83.0
0
15.
Hea
vy I
ndu
stry
700
1363
2063
1351
1255
2606
4093
.00
7208
.67
1130
1.67
16.
Pub
lic E
nte
rpri
ses
500
5094
094
54.0
00.
0054
.00
17.
Text
iles
3500
8035
8045
04.4
80
4504
.48
1400
0.00
0.00
1400
0.00
Indu
stry
seg
men
t19
0080
1980
2686
.63
026
86.6
311
000.
000.
0011
000.
00V
SE s
egm
ent
1600
016
0018
17.8
50
1817
.85
3000
.00
0.00
3000
.00
18.
Con
sum
er A
ffai
rs55
055
280.
240
280.
2410
83.0
00.
0010
83.0
0
19.
Com
pany
Aff
airs
(C
orpo
rate
Aff
airs
)50
050
00
021
1.00
0.00
211.
00
Indu
stry
Seg
men
t O
utl
ay i
n o
ther
Min
istr
ies/
Dep
artm
ents
10.
Petr
oleu
m (
Petr
oche
mic
als
076
14.8
176
14.8
10
6824
6824
0.00
1555
7.00
1555
7.00
and
En
gin
eeri
ng)
11.
Ship
Bu
ildin
g24
2.86
805
1047
.86
156
127
282
170.
0055
0.00
720.
00
12.
Ato
mic
En
ergy
(I&
M)
2270
1079
.533
49.5
1645
.53
392.
4420
37.9
784
2525
54.1
210
979.
12In
du
stry
1811
90.0
1901
.012
41.2
339
.65
1280
.88
6975
160.
0071
35.0
0M
iner
als
459
989.
514
48.5
404.
3035
2.79
757.
0914
5023
94.1
238
44.1
2
13.
Bio
tech
nol
ogy
300
3010
20
102
750.
000.
0075
0.00
14.
DSI
R25
025
250
2515
0.00
0.00
150.
00
15.
Ear
th S
cien
ces
(Oce
an D
evel
opm
ent)
100
010
093
093
319.
000.
0031
9.00
Sour
ce:
Pla
nn
ing
Com
mis
sion
.

228 Eleventh Five Year Plan
ANNEXURE 7.1.20Performance of SSIs, Year 2000–01 to 2006–07
Year Total Fixed Production Employment Exports
SSI Units Investment Current Constant (In Lakh (Rs Crore)(Lakhs) (Rs Crore) Price Price Persons)
(Rs Crore) (1993–94in Rs Crore)
2000–01 101.1 151527 261297 184401.4 240.94 69797(4.07) (8.25) (11.78) (8.23) (5.17) (28.78)
2001–02 105.21 160673 282270 195613 252.29 71244(4.07) (6.04) (8.03) (8.00) (4.71) (2.07)
At 2001–02 Price
2002–03 109.49 169579 314850 306771 263.68 86013(4.07) (5.54) (11.54) (8.68) (4.51) (20.73)
2003–04 113.95 178269 364547 336344 275.30 97644(4.07) (5.12) (15.78) (9.64) (4.41) (13.52)
2004–05 118.59 188793 429796 372938 287.55 124417(4.07) (5.90) (17.90) (10.88) (4.45) (27.42)
2005–06 123.42 198050 497842 418884 295.85 150242(4.07) (4.90) (15.83) (12.32) (4.28) 20.76
2006–07 (Prov.) 128.44 207307 585112 471663 312.52 –(4.07) (4.67) (17.53) (12.60) (4.23) –
Note: Figures in brackets indicate increase in the percentage over the last year.Source: Ministry of SSI, GoI, Annual Report 2005–06.
ANNEXURE 7.1.21Export Destination (Country) of SSI Products
S. No. Product Group Main Destination (Countries)
11. Readymade garments USA, Europe, Canada, West Asia, and North Africa.
12. Plastic items UAE, China, Italy, Saudi Arabia, and Oman.
13. Marine products Japan, USA, European Union, China, and South East Asia.
14. Sports goods UK, USA, Australia, Germany, and South Africa.
15. Spices East Asia, European Union, North African Zone, and American Zone.
16. Cashew items USA, Netherlands, UK, Japan, and UAE.
17. Shellac items Indonesia, Germany, UAE, USA, and Italy.
18. Synthetic items (Madeups) UAE, UK, Turkey, USA, and Italy.
19. Leather and leather items Germany, UK, Italy, USA, and France.
10. Engineering and electronic items USA, Europe, Japan, Hong Kong, UAE, Germany, Belgium, and France.
11. Basic chemical and cosmetic products USA, Japan, Saudi Arabia, China, Singapore, and Netherlands.
12. Chemical and allied products Japan, Belgium, Italy, France, Bangladesh, USA, and UK.
13. Wool and woollen (Madeups) knitted garments, etc. Europe, Japan, and Bangladesh.
14. Processed food items USA, Europe, and Japan.
15. Electronic items and computer software USA, Hong Kong, UAE, UK, Germany, and Japan.
16. Tobacco and tobacco items East Europe.
Source: http://www.laghu-udyog.com/ssiindia exportdest.htm

Industry 229
ANNEXURE 7.1.22Participation of Women in SSI Sector, State-wise
Name of State/UT No. of Female Employees No. of No. of
Regd. Unregd. Total Enterprises WomenSSI Sector SSI Sector Managed Enterprises
by Women
Jammu & Kashmir 3313 8153 11466 5640 5742
Himachal Pradesh 4016 4134 8150 3515 3722
Punjab 11757 36013 47770 30190 29068
Chandigarh 659 1975 2634 2059 2243
Uttarakhand 2940 13240 16180 8706 8804
Haryana 15651 14889 30540 10087 9620
Delhi 6306 35798 42104 13368 14383
Rajasthan 15003 46065 61068 29785 36371
Uttar Pradesh 23506 180918 204424 54491 72667
Bihar 8353 68908 77261 38170 49443
Sikkim 212 9 221 30 98
Arunachal Pradesh 342 104 446 131 150
Nagaland 637 2574 3211 207 179
Manipur 3853 19485 23338 9168 10745
Mizoram 2188 4636 6824 3076 3700
Tripura 4294 3325 7619 631 863
Meghalaya 3139 5664 8803 3658 3580
Assam 9077 16988 26065 11189 11757
West Bengal 26549 304969 331518 71847 69625
Jharkhand 5105 8907 14012 7271 7865
Orissa 11723 213123 224846 33274 38233
Chhattisgarh 10177 52476 62653 11766 10034
Madhya Pradesh 29612 111703 141315 62351 68823
Gujarat 41189 79990 121179 55361 53703
Daman & Diu and Dadra & 6106 126 6232 167 213
Nagar Haveli
Maharashtra 78731 162700 241431 80662 100670
Andhra Pradesh 60693 270026 330719 77347 77166
Karnataka 117934 223142 341076 101264 103169
Goa 5309 1833 7142 677 810
Lakshadweep 26 405 431 61 67
Kerala 189640 224491 414131 137561 139225
Tamil Nadu 270936 223050 493986 130289 129808
Pondicherry 5613 2670 8283 1089 1065
Andaman & Nicobar Islands 124 294 418 53 110
974713 2342783 3317496 995141 1063721
Note: Regd. = Registered; Unregd. = Unregistered.Source: 3rd SSI Census 2001–02– Ministry of MSME.

230 Eleventh Five Year Plan
ANNEXURE 7.1.23Schemes for MSME
Central excise duty exemption to makeMSE products price competitive
Priority-sector lending to facilitatelending to MSEs
CLCSS for Technology Upgradation
Credit Guarantee Scheme, to bankslending to MSEs
Prime Minister’s Rozgar Yojana foremployment generation
ISO 9000/ISO 14001 Certification FeeReimbursement Scheme for improvingquality and business processes
Participation in international fairs forexport promotion
Credit Appraisal and Rating Tool (CART)
Reservation of products for exclusivemfg. by MSEs
Purchase and price preference ingovernment procurement to helpimprove marketing
Fiscal Incentives/Subsidies
All MSEs (manufacturing),including khadi and villageindustry units
Credit (Grants and Loans)
All MSEs
All (manufacturing) MSEs,including khadi and villageindustry units
All (manufacturing) MSEs,including khadi and villageindustry units
Educated (VIII standard pass)unemployed youth withfamily income up to Rs 40000per annum
Individual MSEs, including thoseengaged in business/service
Individual MSEs
Other Schemes
All MSEs
MSEs registered with NSIC
Exemption up to Rs 100 lakh from excise duty, iftotal annual clearances or sales do not exceed Rs 400lakh.
10% of all NBC by foreign banks to go to the MSEsector; no specific sub-target for domestic banks,which have to provide 40% of NBC to the prioritysector as a whole..
Subsidy of 15% (12% prior to 29 September 2005)of capital acquired for upgrading technology or tech-niques for sub-sectors/products approved under thescheme upto a limit of Rs 100 lakh (Rs 40 lakh priorto 29 September 2005).
Guarantee of 75% for loans up to Rs 25 lakhextended by member lending institutions of theCredit Guarantee Fund Trust, guarantee fee beingborne by the borrower.
Loans of up to Rs 2 lakh for self-employmentprojects each case (Rs 1 lakh for business/serviceactivities). Subsidy is released as a grant by the gov-ernment, through the RBI, to the participating banksfor crediting to the account of beneficiary, andadjusted against the repayment of last installmentof loan by the beneficiary. The subsidy is 15% ofthe project cost or Rs 7500 per entrepreneur, which-ever is less. The bank charges interest (not exceed-ing PLR) on the loan amount minus subsidy.
Reimbursement of expenses incurred in acquiringQuality Management System ISO 9000 certification/environment management ISO 14001 certification,at 75% of the cost or Rs 75000, whichever is less.
Subsidy for renting space and partialreimbursement of air fare.
Scheme for reimbursement of performance andcredit rating of MSMEs through reputed CreditRating agencies. To rationalize the pricing of credit,SIDBI has developed an advanced but simplified,technology-based rating model for MSEs calledCART.
114 items at present.
358 items are currently reserved for exclusivepurchase by the Central Government and its PSUsfrom the MSEs. 15% price preference for CentralGovernment purchases, i.e. a micro/small enterprisequoting up to 15% above the quote of a non-MSEbidder would be eligible to get the order, other
Scheme/Goal Eligibility Description
Annexure 7.1.23 (contd.)

Industry 231
Small Industry Cluster DevelopmentProgramme (renamed as Micro andSmall Enterprises Cluster DevelopmentProgramme) to enhance the productivity,and competitiveness, as well as capacitybuilding of micro and small enterprises
Integrated Infrastructure Development(IID) Scheme, to facilitate provision ofbuilt-up infrastructure with necessaryfacilities for manufacturing and relatedservice enterprises, with reservation of50% for rural areas
Mini Tool Rooms to improve availabilityof quality equipment, machines,and tooling facilities, necessary formanufacturing, on payment of usercharges
Testing centres to improve availability ofquality test equipment, machines andother facilities, necessary for testing of rawmaterial, intermediates, and finishedproducts on payment of user charges
Sub-contracting exchanges to assistassociations of MSEs track bulk orders/tenders for bulk supplies by largeindustries to enable member MSEs tobid for parts of these orders
SSI Market Development Assistance forexport promotion
Assistance to EntrepreneurshipDevelopment Institutes
Micro Finance Programme
conditions of quality, terms of supply being met.Tender document is also provided free of charge andexemption from earnest money/security deposits.
Implemented in PPP mode, GoI assistance variesfrom 30% to 80% of the project cost depending onthe average investment in plant and machinery,location of the cluster, level of commercial self-sufficiency, etc.
Central Government grants assistance of up toRs 200 lakh or 40% of the project cost, whichever isless, for setting up new industrial estates for MSEs(up to 80% or Rs 40 million for the NER, includingSikkim, Himachal Pradesh, Jammu & Kashmir, andUttarakhand). Also available for improvements inexisting estates.
Assistance up to 90% of the cost of plant and ma-chinery or Rs 900 lakh, whichever is less, for settingup new mini tool rooms (75% of the cost of plantand machinery or Rs 750 lakh for upgrading exist-ing tool rooms).
Assistance up to 50% of the cost of testing equip-ment and machinery or Rs 50 lakh, whichever is less,for setting up testing centres.
One time grant upto Rs 4 lakh for procurement ofhardware such as plain paper copier, telex, faxmachine, computer, furniture. Grant paid on reim-bursement basis and provides a matching grant ona tapering basis at 50%, 30%, and 10% for runningexpenses, not exceeding Rs 125000, Rs 75000, andRs 25000, respectively, during the first three years,subject to a ceiling of Rs 157000 per exchange.
Partial subsidization of costs of air fare, space rental,publicity, etc., to MSEs at varying rates, with prefer-ential terms to the micro enterprises, partial finan-cial assistance to contest anti-dumping cases, under-taking market studies, etc. Provision for reimburse-ment of 75% of one-time registration fee or Rs 15000,whichever is less for adoption of bar coding.
Financial assistance in the form of non-recurringgrant for strengthening infrastructure like building,training aids/equipment, and other support serviceson matching (50:50 basis) of the cost or Rs 100 lakhwhichever is less.
Portfolio Risk Fund provided to SIDBI for securitydeposit requirements of the loan amount fromthe MFIs.
Micro and small (MSE) clusters
State governments, industryassociations, and NGOs fordevelopment/disposal of plots/sheds on commercial basis
State Governments/StateGovernment agencies
Industry associations
Industry associations
MSEs and their associations
State/UT governments andother agencies involved inentrepreneurship development
Micro finance institutions (MFIs)
Source: SIDO online information, viewed at http://www.smallindustry.india.com [4 July 2006]; RBI online information, viewed athttp://www.rbi.org.in/scripts/FAQView.aspx?Id=8; and Ministry of Finance (2006), Economic Survey 2005–06.
Annexure 7.1.23 (contd.)
Scheme/Goal Eligibility Description

232 Eleventh Five Year Plan
ANNEXURE 7.2.1Organization/Company-wise Actual Expenditure in the Tenth Five Year Plan—Ministry of Mines
(Rs Crore)
Organization Approved Tenth Plan Revised Tenth Plan (Mid-term) Actual Tenth Plan
National Aluminium Co. Ltd 7056.00 2864.25 1840.27Hindustan Copper Ltd 50.00 326.16 266.34Mineral Exploration Corp. Ltd 50.00 73.75 66.45Geological Survey of India 1000.00 998.56 537.54Indian Bureau of Mines 103.00 136.08 84.88S&T Programmes 57.50 52.48 32.95Construction# 28.00 34.00 27.86Total 8344.50@ 4485.28 2856.29GBS 1271.00 2881.75 986.27IEBR 7073.50 1603.53 1870.02
Note: @ excluding outlay for HZL since disinvested; # construction in GSI and IBM.
Source: Tenth Five Year Document, Planning Commission, and Ministry of Mines.
ANNEXURE 7.2.2Life Indices of Important Minerals
(in Million Tonnes)
S. No. Mineral Total Resources Total Balance Estimated Domestic Life Index Beyondas on 1 April 2000 Resources as on Production during 1 April 2007
1 April 2007 2006–07 at 2006–07Production Level
1. Bauxite 3306.763 3269.525 13.142 166(2221.549) (2184.311)
2. Copper ore 1394.425 1385.094 3.293 200(659.789) (650.458)
3. Chromite 232.120 220.532 4.090 33(146.483) (134.895)
4. Lead–zinc ore 522.579 510.072 4.414 69(316.879) (304.372)
5. Iron ore (haematite 25250 24795 160.33 97and magnetite) (15946) (15432)
Note: Figures in parentheses (of proved and probable reserves) have been considered for life index.
Source: Working Group Report on Mineral Exploration and Development (Other than coal and lignite) for Eleventh Five Year Plan,Volume II.

Industry 233
ANNEXURE 7.2.3Estimated Apparent Consumption, Domestic Production, Resource Situation and
Life Index of Selected Minerals(Thousand Tonnes)
Minerals Estimated Apparent Estimated Total Estimated LifeConsumption in Production for Balance of IndexTerminal Year of Terminal Year of Resources as on beyond
1 April 2012 2012
Tenth Eleventh Tenth EleventhFive Year Five Year Five Year Five Year
Plan Plan Plan Plan2006–07 2011–12 2006–07 2011–12
A Refractory minerals1. Bauxite 12934 19900 14214 21875 3176799 96
(2091585)
2. Chromite 2978 4583 4302 6619 192569 16(106932)
3. Graphite 113 174 113 174 157788 58(10087)
4. Ball clay 2045 3147 1610 2477 52493 5(13335)
5. Wollastonite 170 262 194 298 18429 48(14255)
B Flux and construction minerals1. Gypsum 3437 5289 3994 6145 1194934 125
(767507)
2. Asbestos 227 349 6 9 21724 Very(11228) large
C Fertilizer and chemical minerals1. Rock phosphate 4475 6695 1340 2061 383547 68
(139631)
2. Sulphur (by-product) 1320 2031 128 197 – –3. Fluorspar 126 194 12.86 20 12591 538
(10765)
Note: Figures in parenthesis (proved and probable reserves) considered for life indices.
Source: Working Group Report on Mineral Exploration and Development (other than coal and lignite) for Eleventh Five Year Plan,Volume II.

234 Eleventh Five Year Plan
ANNEXURE 7.2.4Material Balance of Principal Non-ferrous Metals
(Thousand mt)
Aluminium Copper Zinc Lead
2001 2006– 2011– 2001– 2006– 2011– 2001– 2006– 2011– 2001– 2006– 2011––02 07 12 02 07 12 02 07 12 02 07 12
Production (Primary) 660 950 1250 390 740 808 201 423 638 31 63 95Secondary 40 50 60 – – – 25 30 40 40 60 75Total Production 700 1000 1310 390 740 808 226 453 678 71 123 170Import 150 120 270 45 – – 71 2 – 61 152 273Export 150 200 300 61 300 219 – – 11 – – –Domestic Demand 700 920 1280 374 440 589 297 455 667 132 275 443
Note: Demand for copper for 2011–12 has been projected at 6% compound growth rate per annum and production at 90% capacityutilization of existing installed capacity of 897500 tonnes.
Source: Working Group Report on Mineral Exploration and Development (other than coal and lignite), Eleventh Five Year Plan, Volume III.
ANNEXURE 7.2.5Iron Ore Availability—Haematite (as on 1 April 2005)
(Qty in Million Tonnes)
Grade Reserves Remaining Resources Total
High grade (Fe +65%) 1304.3 629.03 1933.33Medium grade (Fe 62%–65%) 3544.03 3062.02 6606.05Low grade (Fe below 62%) 1989.75 1686.94 3676.69Unclassified 159.23 743.67 902.90Black iron ore 2.52 12.72 15.24Others 1.62 5.05 6.67Unclassified 1.98 0 1.98Not known 0.73 1486.79 1487.52Grand Total 7004.17 7626.22 14630.39
Source: IBM.
ANNEXURE 7.2.6Iron Ore Availability—Magnetite (as on 1 April 2005)
(Qty in Million Tonnes)
Grade Reserves Remaining Resources Total
Metallurgical 0.67 2185.05 2185.74Coal washery 3.33 5.00 8.33Foundry 0.46 0.30 0.76Others 0.97 24.16 25.13Unclassified 52.64 8060.34 8112.98Not known 0.43 286.12 286.55Grand total 58.50 10560.98 10619.48
Source: IBM.

Industry 235
ANNEXURE 7.2.7Physical Targets Proposed by GSI for some Important Activities for the Eleventh Plan (2007–12)
Schemes Physical Target
1. Survey and MappingSpecialized thematic mapping 35000 sq kmGeochemical mapping 180000 sq kmGeophysical mapping 240000 sq kmAir-borne geophysical survey 76000 sq kmMarine surveys 12 cruises with RV Samudra Manthan, 13 cruises with new blue water research vessel, 70
cruises by coastal launches, that is RV Samudra Kaustubh and RV Samudra Saudhikama.
2. Mineral Exploration 226 items out of which 154 items on non-coal minerals and 72 items on coal and lignite (coal66 items and lignite 6 items). Large scale: mapping 13530 sq km, Drilling: 429000 m
3. Specialized Investigations Land slide hazard zonation on 1:50000/25000 scale of about 10000 line km through land slideprone hilly terrains; on 1:10000/5000 scale in thickly populated localities. In 20 sites, develop-ment of early warning system in 3 problematic land slides. Other specialized investigationsinclude earthquake geology and seismology, environmental geology, geotechnical studies,glaciological and geothermal studies.
4. R&D and Antarctica Studies 202 items covering geochronology and isotope geology, petrology, photo-geology, and remotesensing, etc.
5. Publication and dissemination Transformation of 3892 maps of 1:50000 scale geological maps into uniform .COOF formatof information under GIS platform out of total 4306 maps digitized so far and digitization of 118 mineral
belt maps; 130 district resource maps to be placed in public domain after completing them;completion of 1:0.5 M scale maps of 14 States; departmental publication: 100.
6. Human Resource Development 177 in house training courses.
7. Modernization and Replacement Procurement of laboratory equipment, replacement of RV Samudra Manthan, Geotechnicalvessel, and Heli-borne Geophysical Survey System.
Note: M scale = Million scale.Source: Ministry of Mines.
ANNEXURE 7.2.8Physical Targets Proposed by IBM and MECL for some Important Activities for the Eleventh Plan (2007–12)
Schemes Target
Indian Bureau of Mines
Inspection of mines for enforcement of 2500 mines per annum.provision of MCDR 1988.
Mineral beneficiation studies Ore dressing investigations: 70 and chemical analysis of 50000 radicals annually;mineralogical studies: 2300.
Technological upgradation and modernization Management of solid waste from mining in India.
Collection, processing, dissemination of Adoption of UNFC system, 100 multi-mineral maps with corresponding forestdata on mines and minerals overlays on yearly basis. Computerized online register of mining tenements system.
Mineral Exploration Corporation Limited
Remote Sensing studies 23 itemsEnvironmental studies 75 itemsGeophysical surveys 1535 sq kmGeophysical logging 557462 sq mGeological mapping 4655 sq kmDrilling 1066325 mExploratory mining 17500 mSampling and analysis 358250 nos
Source: Ministry of Mines.

236 Eleventh Five Year Plan
ANNEXURE 7.2.9Expansion Projects of NALCO—Capacity Additions
Product Unit Existing Capacity Expanded Capacity Increase Capacity
Mine Bauxite Lakh TPY 48.00 63.00 15.00Alumina Plant Alumina Hydrate Lakh TPY 15.75 21.00 5.25Smelter Aluminium Lakh TPY 3.45 4.60 1.15CPP Power MW 960 1200 240
(120 × 8)MW (120 × 10) MW (120 × 2) MW
Note: TPY = Tonne per Year; CPP = Captive Power Plant.Source: Ministry of Mines.
ANNEXURE 7.2.10Scheme-wise Break-up of the Eleventh Plan Outlays at Current Price—Ministry of Mines
(Rs Crore)
S. No. Organization/Company Outlay IR EBR GBS NBS
1. NALCO 6927.08 6927.08 0.00 – –2. HCL 223.00 223.00 – – –3. MECL
Promotional 50.00 – – 50.00 50.00Capital 44.00 44.00 – – –
4. GSI (including construction) 1020.00 – – 1020.00 1020.005. IBM (including construction) 90.00 – – 90.00 90.006. S&T 49.92 26.97 2.95 20.00 20.00
Total 8404.00 7221.05 2.95 1180.00 1180.00
Note: NBS = Net Budgetary Support.Source: Planning Commission.
IVServices


8Services
8.1 CONSTRUCTION
BACKGROUND8.1.1 The development of physical infrastructurein the country and, consequently, the constructionsector has been in focus during the last decade.The increasing significance of construction activitiesin the growth of the economy was also evidentduring the course of implementation of the TenthPlan with areas such as transportation, irrigation,housing, urban development, and civil aviationhaving received greater importance. It is well estab-lished that the influence of the construction industryspans across several sub-sectors of the economyas well as the infrastructure development, such asindustrial and mining infrastructure, highways, roads,ports, railways, airports, power systems, irrigationand agriculture systems, telecommunication systems,hospitals, schools, townships, offices, houses and otherbuildings; urban infrastructure, including water sup-ply, sewerage, and drainage, and rural infrastructure.Thus, it becomes the basic input for socio-economicdevelopment.
CRITICALITY TO ECONOMY8.1.2 The contribution of construction to the GDP atfactor cost in 2006–07 was Rs 196555 crore, register-ing an increase of 10.7% from the previous year. Theshare of construction in GDP has increased from 6.1%in 2002–03 to 6.9% in 2006–07. The increase in theshare of construction sector in GDP has primarily been
on the account of increased government spending onphysical infrastructure in the last few years, withprogrammes such as National Highway DevelopmentProgramme (NHDP) and PMGSY/Bharat NirmanProgramme receiving a major fillip of late. The con-struction industry is experiencing a great upsurge inthe quantum of the work load, and has grown at therate of over 10% annually during the last five years.Although various steps have been taken to strengthenthe construction industry, it is crucial to take neces-sary measures in order to prepare the industry to meetthe challenges of growth.
8.1.3 The importance of construction activity in in-frastructure, housing, and other asset-building activi-ties can be seen from the fact that the component ofconstruction comprises nearly 60%–80% of the projectcost of certain infrastructure projects such as roads,housing, etc. In projects such as power plants, indus-trial plants, etc., though the share is lower but it stillremains critical. In terms of magnitude, constructionactivity is second only to agriculture. The constructionindustry also has major linkages with the buildingmaterial manufacturing industry including cement andsteel, bricks and tiles, sand and aggregates, fixtures andfittings, paints and chemicals, construction equipment,petrol and other petro-products, timber, mineral prod-ucts, aluminum, glass, and plastics. Constructionmaterials account for nearly two-third of the averageconstruction costs. On the basis of an analysis of theforward and backward linkages of construction, the

240 Eleventh Five Year Plan
multiplier effect for construction on the economy isestimated to be significant.
EMPLOYMENT IN THE CONSTRUCTION INDUSTRY8.1.4 With around 27770 enterprises involved directlyin the activity of construction in 2005, the industry isone of the largest employers in the country and ischaracterized by a mix of both organized and unorga-nized entities. The employment figures have showna steady rise from 14.6 million in 1995 to more thandouble in 2005, that is 31.46 million personnel com-prising engineers, technicians, foremen, clerical staff,and skilled and unskilled workers. Larger investmentsin infrastructure have resulted in an increased demandfor construction and, consequently, for constructionengineers and technicians. However, due to the limitedavailability of engineers and technicians in general andthe greater demand in sectors such as IT, there is a sub-stantial drop in the percentage of qualified engineersemployed at the work sites from 4.71% in 1995 to 2.65%in 2005, and similarly at sub-engineering levels from2.46% in 1995 to 1.85% in 2005. The strength of skilledworkforce has also been consistently and substantiallygoing down from 15.34% in 1995 to 10.57% in 2005,whereas relative proportions of unskilled workers havegone up from 73.08% in 1995 to 82.45% in 2005. Theworkers community accounted for 93% of the totalemployment in the construction sector in 2005, with apredominance of migrant labour workforce. It isimportant to create a reliable information system forlabour migration both at the destination as well as atthe point of origin of migration to reduce vulnerabil-ity. As macro level data is often inadequate to capturethe flow and pattern of migration, state-centric surveysare required to fill in this gap. With several ambitiousprojects on anvil during the Eleventh Plan, the demandfor construction manpower is going to grow at aconsistent pace of at least 8%–9%, thereby resulting inan annual accretion of around 25 lakh persons to theexisting stock.
DEVELOPMENTS DURING THE TENTH PLAN8.1.5 During 2002–07, many milestones were achievedby the Indian construction industry in the areas ofinstitutional finance, human resource development,dispute resolution, procurement procedures, safety andquality in the construction industry, and disaster
mitigation initiatives. The construction industry wasaccorded Industrial Concern Status under the Indus-trial Development Bank of India (Amendment) Act,thereby providing the much-needed impetus in termsof availability of finance to the construction industry.Many national initiatives in human resource manage-ment were implemented for the non-formal construc-tion sector, addressing workers as well as engineers andmanagement professionals in the industry. Other ma-jor initiatives included, inter alia, the establishment ofarbitral institutions for dispute resolution, developmentof institutions for safety and quality aspects, settingup of disaster mitigation and Retrofitting Clinicsalong with the training of professionals in disastermitigation, improvement in procurement practices inpublic sector, development of regulatory manuals forprocurement procedures, as well as dissemination ofinformation regarding good practices and developmentof action framework for quality and safety audits,certification, and training of manpower.
STRATEGIES FOR THE ELEVENTH PLAN8.1.6 The major challenge that the construction indus-try faces during the Eleventh Plan is to raise its deliv-ery capabilities commensurate with the Plan targetsfor sectors such as transportation, housing, and urbandevelopment. The planned development of infrastruc-ture would face constraints, unless the constructionindustry improves the delivery potentials by address-ing crucial issues and impediments by bringing insystemic changes. The major issues in the constructionindustry have been detailed in the following sections.
PRODUCTIVITY IN THE CONSTRUCTION INDUSTRY8.1.7 Since capacity building for the constructionindustry to achieve expected delivery capabilities isthe key focus area, introduction of efficient techno-logies and modern management techniques to raisethe productivity of the industry are vital. R&D in theconstruction industry should be seen as a continuingactivity, because the scientific and technologicaladvancements are needed to strengthen and raisethe technological base of the construction industry.Recognizing this, support to the national institutionsengaged in scientific research and incentives forprivate sector players to undertake in-house R&Dneed to be provided.

Services 241
8.1.8 The low technological level of Indian construc-tion leads to low value addition, productivity, quality,and high time and cost overruns. A national strategyand policy framework, focusing particularly on pro-ductivity enhancement and cost reduction, is requiredto be developed to match the envisaged work load anddelivery targets. Introduction of new technologies,construction systems, and energy-efficient materials(preferably based on waste recycling) needs to beadequately emphasized in the national strategy. ForRR sector, there is a need for developing and intro-ducing use of ‘marginal materials’ to enhance the costeffectiveness of works. Adequate funds should beearmarked in the field of R&D for identification ofappropriate and alternate materials to reduce the costof construction.
8.1.9 Management of information in contemporaryconstruction projects is one of the biggest challengesthat project teams face in the upgradation of produc-tivity levels. Information technology can be leveragedto address issues related to tendering, bidding, bidevaluation, grading of construction entities, projectexecution logistics, project management, as well asfinancial accounting and reporting for the construc-tion industry. An appropriate MIS should be devel-oped and implemented at the national, district,and local levels. Further, an institution needs to benominated as the repository of National Databasefor construction industry.
Human Resource and EntrepreneurialDevelopment Framework8.1.10 The major impediments faced by the construc-tion industry in raising the levels of productivity arethe acute shortage of skilled manpower, both at workerand supervisory levels, as well as the lack of experiencedconstruction engineers. The construction industry,particularly the highway and road construction sectors,is facing acute shortages of contracting agencies. Thepresent situation is marked by lack of a harmonizedskill upgradation and certification programme forconstruction workers and lack of incentives and regu-latory framework to prescribe a certain percentage oftrained and certified manpower by the contractors.There is also a need to encourage adequate intake ofcivil engineers in engineering institutions to mitigatethe existing shortage.
8.1.11 One of the initiatives undertaken by Construc-tion Industry Development Council (CIDC) is thetraining, testing, and certification programme of theconstruction workers. This initiative has resulted insuccessfully upgrading the skills of construction work-ers in 47 designated trades through training, testing,and certification of the construction workers (seeBox 8.1.1).
8.1.12 A National Plan for training and certificationof construction personnel at all levels needs to bedeveloped and implemented. The Plan should include
Box 8.1.1Holistic Human Resource Development (HRD)—Construction Industry Development Council (CIDC)
• CIDC, in association with several universities and industry constituents, has offered an HRD Programme for theworkers from construction industry for last three years. The programme, based on an open learning and distant mode ofeducation, offers 38 trades through 19 centres situated in various parts of the country. A number of PSUs, SPVs, and StateGovernments have also been actively participating.
• CIDC conducts programmes in 29 ITIs across four States—Madhya Pradesh, Rajasthan, Haryana, and Bihar. As of date,more than 100000 workers have been tested and certified under this programme and have found gainful employmentwith construction companies.
• Initiative has been taken by NHAI and the State Government of Madhya Pradesh for the inclusion of a prequalificationcondition in NHAI’s tender document that a minimum of 5% of trained and certified workers should be employed, tobecome eligible for any of the bid from NHAI. Such practices need to be replicated by other States.
• CIDC is also actively designing, developing, and disseminating Management Development Programmes for supervisors,managers, and senior officers in Construction Management, Project Management, Emerging Technologies, and otherrelated issues. CIDC’s Diploma Programme in Civil, Mechanical, and Electrical Engineering for Army personnel is fieldtested and finds increased favour with the armed forces.
242 Eleventh Five Year Plan
initiating a system of ‘Graded Certification’ depend-ing upon the levels of proficiency achieved. In orderto meet the shortage of trained manpower, short-termcourses in certain important trades may be introduced.The role of advisory and consultancy services instrengthening the stature of construction industry isvital. However, presently these services are only a smallpart of the overall construction services and need tobe suitably upgraded.
NEED TO REDUCE CONSTRUCTION COST8.1.13 It is estimated that the total cost of procuring,monitoring, and supervising and other indirect costsof construction projects consists of about 22% of thecost of the asset that is created. The reduction of theseand other transaction-related costs would be decisivein improving the profitability of the Indian construc-tion industry. Apart from the measures to improveproductivity, as discussed in the earlier sections,efforts are also required to streamline procedures andmechanisms within the industry as well as enhance thelevels of quality for the sector as a whole.
CONTRACT PROCEDURES8.1.14 The present contract conditions, procedures ofprocurement of projects, and services being used byvarious project authorities in the country, both in thepublic and private sector, need to be reviewed andharmonized. According to some estimates, the cost ofprocuring comprises 16% of the total construction costfor certain projects. Development of standard contractprocedure, documents, and the evaluation criteriawould lead to significant reduction in the transactioncost and time. In order to enable fair competition aswell as maintain the quality of the output, the systemof pre-qualification should be adopted for large PPPprojects, whereby only those companies that meet thestringent qualification criteria would be shortlistedand invited to make a bid. For smaller projects, espe-cially those involving repair and maintenance, pre-qualification should be done periodically and biddingshould be made on the basis of limited circulation. Theguidelines issued by the Ministry of Statistics andProgramme Implementation in the form of a set ofUniform Contract Conditions may be taken as a basisfor further consultation with experts and stakehold-ers with a view to formulating standard contract
and bidding documents. A shift from the currentpractices towards electronic tendering process, onlinepublishing of tender notices, online contract biddingdocuments, and reverse bidding would eliminateunfair competition and make the bidding processtransparent.
DISPUTE RESOLUTION8.1.15 In the absence of institutionalized proceduresand practices, arbitration continues to be costly andtime consuming. As per a survey conducted in 2001by the CIDC, the amount of capital blocked in theconstruction sector disputes was over Rs 54000 crore.To minimize disputes leading to time and cost over-runs, proper project planning process should beencouraged and DPRs may be completed before tech-nical sanction. After the Arbitration and ConciliationAct 1996 came into force, there has been an improve-ment in the number of disputes resolved. However,certain shortcomings remain to be addressed in thead hoc arbitration process in terms of defined selec-tion procedures and working ethics of arbitrators,absence of specific rules for agreement, and provisionof a neutral body to administer and supervise arbitra-tion. In view of these deficiencies, there is a need tointroduce new measures to resolve disputes in a fair,speedy, transparent, and cost-effective manner.
8.1.16 A procedure involving the amicable resolutionby conciliation should be followed, failing whichreference to arbitration by a Board of Arbitrators inaccordance with the Rules of Arbitration of the Inter-national Center for Alternate Dispute Resolution, NewDelhi should be made. Moreover, institutional arbi-tration rules, a panel of accredited arbitrators basedon selection criteria to maintain the quality, standards,and code of ethics/conduct, norms for negotiable termsof appointment, management of arbitrator’s fees,monitoring and supervision of progress of case, etc.,should be developed and institutionalized in line withIndian Arbitration and Conciliation Act 1996, afterconsultation with experts and stakeholders.
QUALITY AND STANDARDS8.1.17 To make the Indian construction industry morecompetitive, aspects related to enhanced quality inconstruction products should be accorded attention

Services 243
at all levels. The inadequate quality in constructionworks emanates from lack of incentives for inductingnew technology, lack of pre-qualification requirementsfor trained and certified workmen, lack of apprecia-tion for lifecycle costing approach, and lack of adequateR&D. In order to enhance the technological capabili-ties of the industry, all stakeholders would be requiredto actively support training and certification levels forskilled workers, supervisors, and managers, and pro-mote construction techniques (such as ready-mixedconcrete, pre-fab techniques) that use informationtechnology.
8.1.18 The Performance Appraisal Certificate Schemeis being implemented for the development and pro-motion of materials, products, and systems underthe joint initiatives of Building Materials and Tech-nology Promotion Council (BMPTC), CIDC, BIS,and other agencies. Further, in view of the widespreadinfrastructural development programmes, coveringboth urban and rural areas, particularly for roads,highways, and rural connectivity schemes, district-leveltesting laboratories should be established for testingand quality evaluation of materials.
8.1.19 The importance and benefit of adhering toperformance standards, both in inviting tenders andin implementation, are being increasingly realized byconstruction entities and procurement agencies. BISis formulating a performance standard for special jobsrequiring high-quality levels. Another development,aimed at enhancing quality in construction works, isthat a large number of construction companies areworking to obtain ISO 9000 series certification.
CONSTRUCTION FINANCE8.1.20 The Indian construction industry is faced withhigh operation, maintenance, and financial costs. Thisaspect is further exacerbated by inadequate access toinstitutional finance, especially for small contractorswho execute over 90% of the total construction works.Moreover, subsequent to the conferring of IndustrialConcern Status on the construction industry, existingfinancial institutions, and banks should adopt con-struction industry-specific lending norms and eligi-bility criteria for the borrowers from the constructionsector as well as introduce special incentives or schemes
for financing import of hi-tech construction equip-ment for infrastructure projects.
OTHER IMPORTANT ISSUES
Safety and Related Issues ofConstruction Workers8.1.21 Workers employed in construction activityare highly vulnerable segments of the labour forceparticularly because of its unorganized nature. Theworkers in construction industry are vulnerable to theinherent risk to their life and limbs. Constructionactivities are also characterized by poor training,temporary relationships between the employer and theemployee, uncertain working hours, lack of basicamenities, inadequacy of welfare facilities, and casualapproach of employers towards the problems ofemployees. In the absence of adequate statutoryprovisions, the requisite information regarding thenature and number of accidents is also not generallyavailable.
8.1.22 In the recent past, several initiatives have beentaken for the improvement of working conditions ofthe construction workers through the mandatoryprovision for instituting the Provident Fund Schemeamong casual workers and the introduction of theWorkers Welfare Cess. The Building and other Con-struction Workers (Regulation of Employment andConditions of Service) Act 1996 was also enactedrecognizing the need for a comprehensive Centrallegislation for regulating the safety, health, welfare, andother conditions of service for construction workers.However, only a few States have implemented theprovisions of the Act, such as setting up welfare boards,and efforts need to be renewed to speed up the imple-mentation of the Act.
8.1.23 Along with the provision of appropriate train-ing facilities for safety aspects related to construction,vigilant Safety Management Teams adequately trainedin compliance procedures, hazard and risk assess-ment, and documentation of inspections of stipulatedmeasures for safety of workers are required to be putin place. As a substantial segment of the constructionindustry workforce, women workers need to beaccorded special focus in terms of vocational training

244 Eleventh Five Year Plan
and skill upgradation as well as the provision of stipu-lated social benefits.
Asset Management and Maintenance8.1.24 Although the construction of physical infra-structure has been receiving emphasis in the succes-sive Five Year Plans, the maintenance of the assets thatare created has not been accorded similar importancedue to the absence of necessary framework, planning,and professionals for asset maintenance. The presentsystem of asset management needs to be reviewed andstrengthened at the local, State, and Central Govern-ment levels. A policy framework for ensuring manda-tory provision for maintenance of assets needs to beevolved.
Environmental Issues8.1.25 Sustainable development concepts applied tothe design, construction, and operation of construc-tion projects can enhance both the economic well-being and the environmental health of communities.Environmental Impact Assessment (EIA) is recognizedas an important tool for integrating these objectives,wherein EIA should be a necessary pre-conditionbefore construction projects beyond stipulated sizeare approved. Further, initiatives for ensuring adher-ence to international standards and regulations, suchas the Environment Protection Act 2006 and theEnergy Conservation Act of 2001 are also required.Various interdisciplinary organizations such as CIDCand Building Materials and Technology PromotionCouncil (BMTPC) have been set up to address theissues of environment-friendly technologies andenergy efficiency in building materials, along withCentral and State Pollution Control Boards to approve,monitor, and regulate projects from all sectors includ-ing construction, keeping in view their impact onenvironment.
Construction Law8.1.26 As per the prevailing scenario, any organiza-tion engaged in construction activity requires regis-tration under five different legislations, apart fromobtaining licenses under three enactments and beingsubject to inspection under 12 laws. Further, there are27 statutes pertaining only to labour. The multiplicityof laws and authorities, anomalies in the existing
legal systems, and the complexities thereof suggest theneed for a Unified Construction Law along with theformulation of a single window arrangement. TheUnified Construction Law should have chapterspertaining to national construction policy and plan;constitution and functions of Central and Stateconstruction authorities; dispute resolution and arbi-tration; grants, funds, accounts, audit, and report;registration and other provisions.
Taxation8.1.27 The construction sector experiences a very highincidence of direct and indirect taxes for constructionand construction-related activities as compared toother sectors. The taxation and regulatory systemspertaining to construction should be reviewed with aview to rationalize the same and eliminate multi-source taxation. Greater clarity needs to be broughtout on the treatment of the sector as ‘Industry’ or‘Service’ for taxation purposes.
Combating Natural Disasters8.1.28 There is an increasing realization that the prob-lem of natural disasters is grave because their frequencyhas recorded more than a five-fold increase in the lasttwo decades. Institutional arrangements are requiredto identify, prevent, and mitigate the effects of naturaldisasters. New programmes need to be taken as perthe guidelines and programmes announced by theNDMA. The development of human resources andtraining of professionals in disaster mitigation, disas-ter-resistant construction technologies, and settingup of Retrofitting Clinics and Disaster IdentificationCentres in all major districts falling in disaster-proneregions is also recommended.
8.1.29 Substantial national resources are being spenton building assets and the pace of investment is goingto enhance considerably during the Eleventh Plan, withseveral new projects related to transportation includ-ing RRs, housing, industrial infrastructure, energy, andagriculture slated for time-bound implementation.Necessary modifications, amplifications, and introduc-tion of good practices need to be adopted to achievethe desired growth in the construction sector and toalign it with global trends in terms of growth, quality,and competitiveness.
Services 245
PATH AHEAD• Enhance capacity building in the construction
sector by improving productivity through introduc-tion of efficient technologies and modern manage-ment techniques.
• Reduce transactional costs by reviewing contractprocedures and dispute resolution mechanisms.
• Enhance quality standards and provision ofadequate institutional finance to the constructionsector.
• Develop a National Plan for human resourcedevelopment through training and certification ofconstruction personnel.
• Accord greater importance to safety in construc-tion activities by establishing trained and certifiedSafety Management Teams.
• Earmark funds in the field of R&D for identifica-tion of appropriate and alternate materials to re-duce the cost of construction.
8.2 TOURISM
OVERVIEW8.2.1 Tourism is a multi-sectoral activity characterizedby multiple services provided by a range of suppliers.It is the largest service industry in the country. Its im-portance lies in being an instrument for economicdevelopment and employment generation, particularlyin remote and backward areas. It is contributing to-wards overall socio-economic improvement and accel-erated growth in the economy. The economic benefitsflow into the economy through growth of tourism inthe shape of increased national and State revenues,business income, employment, wages, and salaryincome. Tourism is overwhelmingly an industry ofprivate sector providers and the public sector has asignificant role to play in infrastructure areas eitherdirectly or through Public Private Partnership mode.
8.2.2 Tourism is one economic sector in India that hasthe potential to grow at a high rate and can ensureconsequential development of the infrastructure of thedestinations. It has the potential to stimulate othereconomic sectors through its backward and forwardlinkages and cross-sectoral synergies with sectorslike agriculture, horticulture, handicrafts, transport,construction, etc. The particular significance of tour-ism industry in India is its contribution to nationalintegration and preservation of natural as well as cul-tural environments and enrichment of the social andcultural lives of people like preservation of monumentsand heritage properties.This sector is also helping thetraditional art forms, crafts, and culture.
GLOBAL STATUS AND TRENDS8.2.3 Over the past few years, the Travel and Tourism(T&T) industry has had to contend with a series ofunprecedented challenges. International events,such as terrorism and SARS, and economic turbulencehave led to significant changes in T&T demand. Atthe same time, international events such as an increasein information and booking facilities made availableover the Internet; an ongoing desire by consumersto travel more frequently; stronger branding andglobalization by companies; and the expansion oflow-cost carriers have acted as a catalyst, acceleratingfundamental changes in market behaviour andtravel patterns that have been slowly emerging overthe past decade. While business plans have becomeincreasingly short term, more and more governmentsare starting to realize that they cannot leave thegrowth of T&T to chance. This emerging globalconsciousness represents a great opportunity forthis industry.
8.2.4 As per the estimates of World Travel and Tour-ism Council (Table 8.2.1), the worldwide travel and
TABLE 8.2.1Contribution of Travel and Tourism (T&T) in GDP and Employment in 2007
India (%) World average % World average %2007 during 2007 Estimated in 2017
Contribution of T&T Economy to GDP 5.4 10.4 10.7Contribution of T&T Industry to GDP 2.0 3.6 3.4Contribution of T&T Economy employment 5.5 8.3 8.3Contribution of T&T Industry Employment 2.3 2.7 2.8
Source: WTTC (World Travel and Tourism Council).

246 Eleventh Five Year Plan
tourism is expected to grow by 4.3% per annumbetween 2008–17. The industry is expected to postUS$ 7060.3 billion of economic activity (total demand)in 2007, which will increase to US$ 13231.6 billionby 2017. The industry is expected to contribute 3.6%to GDP in 2007 (US$ 1851.1 billion), which is expectedto rise to US$ 3121.7 billion in absolute terms butpercentage wise it will decrease to 3.4% by 2017. Theearnings from T&T have made it one of the largestindustries in the world and the fastest growing sectorof global trade accounting for 10.4% of global GDP,12.2% of global exports, 8.3% of global employment,and 9.5% of global capital investment.
INDIA’S TOURIST PROFILE8.2.5 Tourist growth in India has undergone a remark-able change during the Tenth Plan. Table 8.2.2 showsthat foreign tourist arrival has increased by about87% from a level of 2.38 million in 2002 to 4.45million in 2006. Share of India in world touristarrivals has increased from 0.34% to 0.52% duringthis period.
TABLE 8.2.2Tourists Arrivals in India
(in Million)
Year World Foreign Domestic Share ofTourist Tourist Tourist India in WorldArrivals Arrivals Visits Arrivals
(In India) (%)
2002 706.4 2.38 269.6 0.34
2003 693.2 2.73 309.0 0.39
2004 761.0 3.46 366.2 0.46
2005 802.0 3.92 390.5 0.49
2006 842.0 4.45 461.2 0.52
Source: Ministry of Tourism (MoT).
8.2.6 Similarly, it is evident from the Table 8.2.3 thatthe foreign exchange earnings have grown by about147% during the same period (US$ 2923 millionto US$ 6569 million), 0.9% of the internationaltourist receipts. The average per tourist earnings inIndia was about US$ 1476 against the world averageof US$ 872 during 2006.
8.2.7 Domestic tourist visits has also grown rapidlyduring the Tenth Five Year Plan from 269.6 million
in 2002 to 461.2 million in 2006. According to theTourism Satellite Account for India prepared by theMoT, the contribution of tourism sector, includingboth direct and indirect to GDP and employment was5.83% and 8.27% respectively during 2002–03.
8.2.8 It is universally acknowledged that the tourismresources in the country have the potential to gener-ate significantly higher levels of demand from thedomestic and international markets, which if exploitedintelligently in a sustainable manner, can prove to bethe proverbial engine of growth for the economy.
REVIEW OF THE TENTH FIVE YEAR PLAN8.2.9 Against an outlay of Rs 2900 crore in the TenthFive Year Plan (Central sector) an expenditure ofRs 2635.67 crore (91%) has been incurred. Thescheme-wise financial performance during the TenthFive Year Plan is given at Annexure 8.2.1. In the TenthFive Year Plan period an emphasis was laid on posi-tioning and maintaining tourism development as anational priority activity by enhancing and maintain-ing the competitiveness of India as a tourist destina-tion and improving existing tourism products andexpanding these to meet new market requirementsby creating world class infrastructure, developingsustained and effective market plans and programmesand giving special thrust to rural and small segmenttourism. Through broad fields of development, theMoT focused on infrastructure development in fivekey destinations like Ajanta-Ellora, Bodhgaya, Rajgiri-Nalanda, Kurukshetra, and Mahabalipuram. Informa-tion and technology was also given a major thrust to
TABLE 8.2.3Tourism Receipts
(in Billion US$)
Year World Earnings Share of IndiaEarnings by India in World
Earnings
2002 487.0 2.9 0.60
2003 533.1 3.5 0.66
2004 633.0 4.8 0.75
2005 678.0 5.7 0.85
2006 735.0 6.6 0.89
Source: MoT.

Services 247
promote Indian tourism products in the country andabroad. Human resource development and capacitybuilding for service providers were given more impor-tance. As a result more than 40000 persons were giventraining through 24 Institutes of Hotel Management(IHM) and 12 Food Craft Institutions. In additionto these, large revenue generating products like con-vention centers at Suraj Kund, Haryana, luxury trainsin Karnataka, Night Safari Park at Jorepokhari inDarjeeling, West Bengal were developed throughPPP mode.
OBJECTIVE AND STRATEGY FOR THEELEVENTH FIVE YEAR PLAN8.2.10 Though the Working Group on Tourism forEleventh Five Year Plan has recommended a target of10 million international tourist arrivals by 2011,the Vision Document presently being drafted by MoTenvisages achievement of this target by 2010. As perthis strategy, target for the year 2011 will be 10.25million. This target is proposed to be achieved throughdiversification of principal source markets, improv-ing the infrastructural facilities such as airports, roads,civic amenities at the tourist destinations, increasingthe air seat capacity and connectivity, vigorous pub-licity, etc. For domestic tourism, the target to beachieved in 2010 and 2011 will be 725 million and 812million respectively assuming an annual growth rateof about 12% over the level of 461 million domestictourist visits in 2006.
8.2.11 In order to achieve international visitor levelsof 10 million by the end of the Eleventh Five YearPlan, the emphasis would be on diversification ofprincipal source markets to include countries such asSouth Africa, Israel, Spain, China, Japan, South Korea,Australia, Brazil, Argentina, etc., which offer highgrowth potential and from where present level ofinbound tourist is low. There is also a need to concen-trate on countries like South Africa, Mauritius,Kenya, Malaysia, Fiji, etc., with a large Indian diasporafor higher tourist arrivals from those countries.Similarly, greater resonance needs to be created inNRIs and persons of Indian origin to visit the countryof their origin and discover their roots. The ‘Baby-Boomers’ group in North America and Europe wouldbe encouraged to visit India by creating in them
the desire to discover one of the oldest civilizations ofthe world to enjoy the plurality of cultural enjoyment,offered by this country.
8.2.12 In order to meet the requirement of growth intraffic, there would be further creation of quality ac-commodation. It is estimated that 200000 approvedquality accommodation rooms would be required in2011 against the current level of about 100000 rooms.Domestic travel must complement international travel.This would help in optimizing the utilization ofinfrastructural facilities and also make the futureinvestment viable. The possibility of constructinghotels on surplus land with Airport Authority ofIndia near international airports needs to be consid-ered. The surplus railway land at specified railwaystations may also be utilized for constructing budgethotels. New forms of tourism like rural tourism, cul-tural tourism, adventure tourism, cruise tourism,MICE tourism, and medical tourism need to be takenup with renewed zeal and efforts.
8.2.13 To achieve the above goals, suitable measureswould be taken for:
• Positioning and maintaining tourism developmentas a national priority activity.
• Enhancing and maintaining the competitiveness ofIndia as a tourist destination.
• Improving India’s existing tourism products furtherand expanding these to meet new market require-ments.
• Creation of world-class infrastructure.• Developing strategies for sustained and effective
marketing plans and programmes.• Developing human resources and capacity build-
ing of service providers.
Positioning and Maintaining Tourismas a National Priority8.2.14 Effective linkages and close coordinationamong various departments and ministries of gov-ernment will be established to plan and implement aprofessionally managed and integrated communica-tions strategy to increase awareness about tourism andits social and economic impact on the society. Stategovernments would be encouraged to set up land

248 Eleventh Five Year Plan
banks and streamline procedure and practices tofacilitate investment in the tourism sector.
Enhancing and Maintaining theCompetitiveness of India as aTourist Destination8.2.15 Effective steps for easier and faster availabilityof visas, increasing air connectivity and seat capacityfrom overseas markets, improving facilities andquality of services at international and major domes-tic airports, rationalization of taxes, and removingrestrictions like Restricted Area Permit/ProtectedArea Permit/Inner Line Permit would facilitate touristflow to the country.
8.2.16 Connectivity has been one of the impedimentsfor the growth of tourism in India. Steps taken duringthe Tenth Five Year Plan to liberalize civil aviation sec-tor to a large extent eased the position with regard tothe availability of seats. While international airlinesinducted more capacity, there is a growth in the num-ber of carriers providing domestic air services. Theincrease in capacity has not only resulted in meetingthe demand of the air travel but also in lowering theairfares. The infrastructure facilities at the airportswould be developed to meet the rising air traffic re-quirements. For the promotion of tourism in the coun-try, trained personnel and workforce need to beprovided at airports for increasing the quality of ser-vice at the airports. The possibility of extending facili-ties of visa on arrival would be considered for touristoriginating from selected countries.
8.2.17 Quality of rail services would be improved toencourage tourists to travel by train. Budget hotels maybe provided by railways in all metro cities within therealm of PPP. Well maintained clean waiting rooms,basic amenities like drinking water, toilets, tea/coffeefacilities, parking facilities for tourist vehicles may beavailable at railway stations.
8.2.18 All major tourist destinations/heritage sitesshould be well connected with the highways. Touristcoaches have to queue up at the border for payingtoll tax and transport tax at every barrier, which isa harassment for the tourists. The respective StateGovernments may introduce a single toll collection
point for free movement of tourist transport. Touristtransport vehicles may also be given separate identifi-cation under Motor Vehicles Act to allow free move-ment between States. Oil companies on the highwaysmay be encouraged to provide basic amenities at petrolpumps.
Improving India’s Existing Tourism ProductsFurther and Expanding these to MeetNew Market Requirements8.2.19 India has a rich resource of both tangible cul-tural heritage in its monuments and sites and also anintangible cultural heritage in the form of its architec-ture, music, dance/drama, local rituals and traditions,and other folk arts. Cultural and heritage tourism willbe expanded to tap rich resources of cultural heritagein its monuments and sites. An integrated circuit link-ing heritage monuments, with culturally rich villagesand towns around them are to be formed to enableand strengthen the development of cultural tourismin India. The National Highways Authority mayconsider facilitating provision of suitable tourismfacilities on their routes such as budget tourist accom-modation and improvements in wayside amenities onroadsides and highways. Beach and coastal tourismon the beaches of Goa, Kerala, and North Karnatakamay be considered for development due to easieraccessibility of these places by air. Kerala and theAndaman and Nicobar Islands have already been de-veloped as international cruise destinations. Riverinetourism may be developed along traditional routes,which may have an exotic appeal and also help sustainvillages and settlement along the routes. In this way,village tourism would also be promoted. Indiancuisine has caught the fancy of people across the globe.This can be capitalized by developing culinary tourroutes into different regions for enthusiasts to tasteand learn the authentic way. This will create a highlyskilled workforce of culinary professionals not onlyfor India but also to promote Indian cuisine interna-tionally. Wild Life Sanctuaries and National Parkswould also be made an integral part of the Indian tour-ism product. For sustainable tourism, the facilitiesat the parks may be enhanced and proper site andvisitor management plans need to be prepared soas not to disturb the ecological balance and the localhabitat.

Services 249
8.2.20 India offers the best mountain-based adven-ture tourism in the world in the Himalayas. Already alot of work has been initiated in this segment but theyhave to be made comparable to or better than what isbeing offered in the Alpine countries. India’s medicalexpertise has been gaining popularity in the West wherethe costs are prohibitive. The development of specialinterest tourism segment will accrue greater socio-economic benefits.
8.2.21 Indian textiles, handlooms, and handicrafts, itsfurniture and jewellery are already popular abroad.Now with Indian designers also receiving global rec-ognition, shopping has become an integral part of atourist’s itinerary. Hence the development of dedicatedshopping centers and the flow of special interest shop-ping tourists may be encouraged as it will help revivetraditional crafts and craftsmen, textiles and weavers,and give these families a means of livelihood.
8.2.22 Domestic tourism in India is mainly pilgrim-age related. Travel facilities as well as facilities at pil-grimage centers need to be strengthened and mademore tourist-friendly. Pilgrimage centers may be iden-tified and integrated with new domestic tourist cir-cuits wherein transport, accommodation, catering, anddarshan are all synergized to make pilgrimage tour-ism into a popular and comfortable mode.
Creation of World-class Infrastructure8.2.23 Quality infrastructure may be created for de-veloping tourist products and for providing betterservices to both domestic and international tourists.Creation of tourism infrastructure has favorable im-pact on overall economic growth and employment andon the preservation of art, culture, and heritage. Tour-ism projects like Destination Development are capitalintensive, commercially unviable, and require finan-cial support from the government. At the same time, itis necessary that such infrastructure is created with pro-fessional expertise of architects and landscaping expertsand is then privately managed through a transparentprocess. Large revenue projects such as setting up ofhotels, convention centers, golf courses, tourist trains,etc., normally have substantial gestation periods. Thesefacilities may be created by private initiative with thegovernment acting as a facilitator and catalyst.
8.2.24 Tourist sites and destinations need to be care-fully selected on the basis of their potential to provideall infrastructure facilities required by the touristswithin such destinations and circuits. Master planningof destinations and circuits will be done by outstand-ing architects/consulting agencies with sensitivitytowards conservation, preservation, and aestheticaspects to enable their development in an integratedholistic manner.
8.2.25 During the Eleventh Five Year Plan, the strat-egy for infrastructure development should be to selectonly 10 major Destinations and 6 Circuits on anannual basis. Destination Management needs atten-tion and coordination at the 27 World Heritage Sitesin the country, which are impacted by increasing num-ber of visitors and are also subject to a number ofregulatory authorities. For the development of ruraltourism, a panel of professionals may be identifiedfor selecting the rural sites, interacting with the com-munity, and preparing projects based on tourismpotential of the site.
8.2.26 One of the major bottlenecks in creation ofhotel infrastructure is non-availability of land for thepurpose. The steps that may be taken are: (i) MasterPlan of major cities should mark commercial sitesfor construction of hotels, convention and exhibitioncenters; (ii) the hotel sites should be allotted on long-term lease basis or could be allotted under the PPPmode through joint venture, revenue sharing, etc.;(iii) our endeavor should be that the hotels are allowedhigher Floor Area Ratio/Floor Space Index (FAR/FSI)so that more rooms and commercial spaces arecreated out of the same space and it also helps ingenerating sustainable revenues; (iv) the land shouldalso be allotted for building of guest houses in allmajor cities and tourist destinations, if possible;(v) home stay programme under the Government ofIndia Scheme of ‘Incredible India Bed & Breakfast’needs to be promoted by all State Governments byallowing such establishments to be treated as non-commercial.
8.2.27 Rural villages, which have immense culturalheritage potential, need to be developed to showcaseIndia’s vast heritage. Infrastructure and other tourist

250 Eleventh Five Year Plan
facilities should be developed and local communityinvolved in the management so as to percolate tour-ism and its socio-economic benefits to rural areas. Thefocus would be on both tangible heritage and intan-gible heritage. The tangible heritage representsthe ‘hard’ culture of a community, whereas intangibleheritage represents the ‘soft’ culture—the people, tra-ditions, folklore, music, dance, traditional games,mythology, rituals, customs, handicrafts, arts, festivals,events, storytellers, local markets, and also livinghuman treasures.
Developing Strategies for Sustained andEffective Marketing Plans and Programmes8.2.28 This objective can be achieved by evolving andmaintaining a system of market research activities inIndia’s major source markets to continuously receive,analyse, and respond to information on pricing, secu-rity issues, health, safety, quality of tourism servicesand products, etc., and making use of various techno-logical tools, including the Internet, for advertisingfor greater and wider impact. Besides, it is necessaryto encourage e-commerce portals to extend effectivemarketing support to SMEs and also offer competitivepackages.
Developing Human Resources and CapacityBuilding of Service Providers8.2.29 Tourism sector in the country is witnessing aboom that may bring an exponential demand for theworkforce at managerial, supervisory, skilled andsemi-skill levels. This increase in growth will have adirect impact on the demand and supply mismatchthat the country is already passing through and tryingto correct for providing of satisfactory service to visit-ing tourists. To bridge the widening gap at skill-level,the existing Food Craft Institutes (FCIs) are requiredto be strengthened and new ones opened. To enlargethe scope, hospitality education needs to be impartedthrough the network of ITIs, Polytechnics and at the+2 stage as a vocational stream of the school system.IHMs, which are processing the bulk of manpower atmanagerial and skill level, need to be strengthened andcapacities augmented, with international linkages forquality and quantity output of human resources. NewIHMs in the States/regions that have not been coveredas yet should be established for proper distribution of
government resources. Through integrated efforts withStates, IHMs under PPP should be encouraged. Forthe young untrained staff who continue to join theindustry, the government should through short-termtraining programmes build capacities in order to pro-vide quality service. A scheme is required to be mootedto examine and certify the large number of industry/conventional trained skilled manpower available inthe country. The existing scheme of ‘Train the Trainer’should be strengthened and implemented country-wide for boosting availability of adequate trainersfor training.
8.2.30 Capacity building of the service providersthrough shorter training courses should be taken upas an integral effort to strengthen/enlarge the man-power required by the hospitality industry. MoreFCIs need to be opened to meet the demand for skilledpersonnel in food crafts. The training programmesmust cover the skill development in general for freshcandidates, specialized skill development includinglanguage courses, for fresh as well as existing serviceproviders, basic skill upgradation in general for exist-ing service providers, training of trainers programme,and creating awareness of tourism benefits/knowledgein rural areas.
PROMOTION AND PUBLICITY8.2.31 The MoT is carrying out its promotion andpublicity in both overseas and domestic market vigor-ously. The strategy to be adopted for the Eleventh Planon publicity and marketing is to promote Indian tour-ism in the European markets like Italy, Spain, France,and Germany in the regional languages and in theKorean and Japanese markets in a focused manner.India should be promoted as a summer retreat in themonths of July, August, and September when manyEuropean and North American schools and collegeshave their holiday breaks. The campaign should con-vey India as a ‘Year Round’ Destination. 2009 shouldbe declared as ‘Visit India Year’ as this will be very closeto the Commonwealth Games in 2010, and wouldenable a boost to inbound tourism. While producingpublicity material like brochures, etc., the key areasshould be identified and a balance needs to be estab-lished between the print collaterals and the digital for-mats. While producing tourist literature, the availability

Services 251
of infrastructure and connectivity of the areas beingmarketed through the collaterals also needs to be takeninto account.
TAXATION, INCENTIVES, AND CONCESSIONS8.2.32 Provision of tax holiday to the T&T industrymay be considered to encourage investments fromnon-tourism sectors into the tourism sector. TheMinistry of Finance (Budget 2007–08) has accordedTax holiday for 5 years for 2-star, 3-star, and 4-star,category of hotels in and around the adjoiningdistricts of Delhi for the Commonwealth Games. Thisneeds to be extended if possible, throughout the coun-try and for all categories of hotels. Special incentivesmay be considered for the hilly areas, rural areas andplaces of pilgrimage, the NER including Sikkm, J&K,Uttaranchal, and Himachal Pradesh. Each State Gov-ernment has its own criteria for Luxury Tax varyingfrom 5% to 20%. Rationalization of Luxury Tax andother tourism related taxes and levies may be consid-ered by all the States. The tax structure should not bebased on announced tariff; rather it should be on thebasis of actual payment made by the clients. There isacute shortage of hotel accommodation and in par-ticular budget accommodation all over the country.The MoT has estimated that there is a shortage of150000 hotel rooms all over the country. Out of this,110000 rooms are in the budget category. The subsidy/incentives should be on the room created basis andshould be also applicable in metro towns and the pro-cedure of disbursement of subsidy should be simple.In order to create standard budget accommodation,incentives may be given to guest houses and accom-modation under the Home Stay programme of thegovernment also.
OUTLAY FOR THE ELEVENTH PLAN8.2.33 The total projected GBS for the Eleventh Planfor the MoT is Rs 4558 crore (2006–07 price) andRs 5156 crore (current price). The scheme-wisedetails are given in Appendix (Volume III).
8.3 IT AND IT-ENABLED SERVICES
OVERVIEW8.3.1 Information Technology has marked a turningpoint in the history of global trade and services. With
ever increasing availability of international bandwidthand powerful workflow management software, it isnow possible to disaggregate any business process, ex-ecute the sub-processes in multiple locations aroundthe world, and reassemble it, in near-real time, atanother location. This is driving fundamental changesin the global IT services landscape. The vendorsand customers are redefining the levels of valuecreation in the industry. IT also makes significantcontribution in increasing productivity in varioussectors of the economy. Indeed, the phenomenalgrowth of the Indian IT Software and Services andIT-enabled Services-Business Process Outsourcing(ITES-BPO) sector has had a perceptible multipliereffect on the Indian economy as a whole. In additionto the direct positive impact on the national incomeand employment generation, it has triggered a risein direct-tax collections and propelled an increasein consumer spending, thanks to the significantlyhigher disposable incomes. Today, India has foundits niche in the IT world and is regarded as thepremier destination for the global sourcing of IT andIT-enabled Services (ITES). ITES like Medical Tran-scription, Call Centers, Data Processing, Back-OfficeOperations, GIS, Revenue Accounting, etc., are con-sidered as niche areas of the country and the IT indus-try is now getting involved in providing end to endbusiness solutions, system integration, remote man-agement, etc.
REVIEW OF THE TENTH PLAN8.3.2 The IT and ITES fall into two segments: (i) Ex-ports and (ii) Domestic, as described below.
IT-ITES (Exports Segment)8.3.3 India’s success in the export of IT Software andRelated Services over the past decade remains unpar-alleled. Total export revenues earned by this sector havegrown from US$ 7.7 billion in 2001–02 to US$ 31.3billion in 2006–07, thus showing a near 32% com-pound growth rate. India now accounts for 65% ofthe global market in offshore IT and 46% of the ITESmarket. A majority of the Fortune 500 and Global2000 corporations are sourcing IT and ITES fromIndia. While the US and the UK remain the dominantmarkets, contributing to 67% and 15% of total exportsrespectively, Indian firms are also keenly exploring

252 Eleventh Five Year Plan
new geographies for business development, and tostrengthen their global delivery footprint.
8.3.4 Since the inception of IT industry in India,companies have been focusing on quality initiativesto align themselves with international standards. Overthe years, the industry has built robust processes andprocedures to offer world class IT software and tech-nology related services. Today, India-based centers(both Indian firms as well as MNC-owned captives)constitute the largest number of quality certificationsachieved by any single country. As of December 2006,over 440 Indian companies had acquired quality cer-tifications with 90 companies certified at SoftwareEngineering Institute–Capacity Maturity Model (SEI–CMM) Level 5—higher than any other country in theworld.
8.3.5 The growth of the sector has led to tremendouspayoffs in terms of wealth creation and generation ofhigh quality employment. Market capitalization val-ues of leading Indian IT companies now exceed thoseof global competitors, and the exports segment of theIndian IT-ITES sector directly employed over 920000people in 2005–06.
8.3.6 With only 10% of the US$ 300 billionmarket potential accessed so far, there is significantheadroom for growth. Further, with the globaloffshoring market continuing to grow rapidly, asthe proven benefits of offshoring (also termedglobal sourcing or global delivery) induce morecompanies to adopt these practices and developthe capabilities to offer more sophisticated productsand services—the size of the overall pie is alsoexpanding.
8.3.7 Key service lines and vertical markets includingnewly emerging sectors for the ITES industry are listedbelow:
SERVICE LINES• R&D and engineering services• Consulting services• System integration• Application development and maintenance• Traditional IT outsourcing
• Horizontal services (finance accounting and admin-istration, customer interaction services, humanresource administration, research, etc.)
VERTICALS (INCLUDING NEWLY EMERGING SECTORS)• Agriculture• Banking• Insurance• Manufacturing• Health Care and pharmaceuticals• Travel and hospitality• Animation, media, and entertainment• Biotechnology and life sciences• Nanotechnology• Judiciary• Power and energy• Very Large Scale Integration (VLSI) and CAD• Automobile and transportation• Smart governance
8.3.8 This represents a ‘make or break’ opportunity,capable of catapulting India into a high growth orbitand on a fast track to becoming a developed nation.Given that we are closely chased by other aspiringcountries to grab a share of this pie, there has to be aconcerted effort by the government and industry tomaintain the lead position thus created and expand itfurther. The benefits of global leadership in theseknowledge industries go far beyond the economicdimensions. As major global companies offshore moremission-critical work to India, their dependence onIndia increases, thus providing significant strategicadvantage.
Domestic IT/ITES-BPO Segment8.3.9 The Banking and Financial Services, Commu-nications and Media, Manufacturing (ConsumerDurables/Automobile), Aviation, Hospitality, andRetail are some of the key verticals that primarilybenefit from the ITES-BPO services in the domesticmarket in India. While cost savings have been the pri-mary driver of offshore outsourcing, vendors do nothave comparable differences in labour costs to lever-age while serving the domestic market. As a result, theprimary motivation for the domestic market, in itsearly years of evolution are not cost savings but accessto specialist skills and freeing client resources to focus

Services 253
on the core business. Scalability and process efficiencyare expected to result in some degree of cost savingsin the domestic market as well. Notwithstanding itsrelatively smaller contribution to the industry rev-enues, this segment is witnessing a noticeable increasein interest and activity on the part of customer orga-nizations as well as service providers. However, the totalsize of the domestic market is expected to cross US$8.335 billion in financial year 2006–07, a growth of28% over financial year 2005–06. Although thissegment has been led by MNCs in the past few years,Indian firms are gradually gaining ground. Overtime, this segment would provide significant spacefor larger SMEs, as the mid-sized firms increase theirlevels of IT adoption. Table 8.3.1 depicts the growthof IT-ITES professionals in India during the TenthFive Year Plan period.
VISION AND STRATEGY FOR THE ELEVENTH PLAN
Vision8.3.10 Our vision is to make India the most preferreddestination for providing IT and IT-enabled servicesand creating the required eco-system to demonstratethe full potential of Indian skills and enterprise in thisvital sector. The objective during the Eleventh Planwould be to make an effective and maximal utiliza-tion of ICT to improve the quality of life of the com-mon man and promote inclusive growth, increaseproductivity and competitiveness and generate wealthand strength so that India emerges as a knowledgesuperpower in the comity of developed nations.
Strategy8.3.11 India’s performance in IT-enabled and otherhigh end services is clearly a source of strength that we
must build upon. Our strategy is to identify gaps,if any, in existing skill sets in different ITES-BPO/Knowledge Process Outsourcing (KPO) verticals andsuggest programmes for bridging them throughformal and non-formal sectors so that India becomesa leading software developer in the world. Besides, thethrust areas need to be identified where the countryhas potential to become internationally competitivefor achieving significant exports in the field of elec-tronics hardware manufacturing.
POLICY ISSUES, PROGRAMME REFORMS, ANDNEW INITIATIVES IN THE ELEVENTH PLAN8.3.12 Some of the policy issues which need to beaddressed in a focused manner in the IT and ITESsector in the country are elaborated hereunder.
Improving the Supply of Suitable Talent8.3.13 Table 8.3.2 shows the manpower requirementsfor IT-ITES in India, which is self-explanatory.Our biggest challenge is, of course, in relation tohuman resources. While we produce a large numberof graduates and technologists, the demand of the ITindustry is growing and is becoming more discerning.There are problems of quantity and quality in thisregard. These problems have to be tackled in differenttime frames: the short-term, medium-term, andlong-term.
8.3.14 In the short term, we need programmes to topup the skill level of graduating students through‘finishing schools’ and ‘finishing programmes’ whichwill help resolve the quality problem. As the quality oftalent pool is not industry ready, implementation offinishing school concept ensures that the right talentis available for immediate deployment. To enhance the
TABLE 8.3.1Growth of IT-ITES Professionals in India—Indian IT Sector: Knowledge Professionals Employed*
(Nos)
1999–2000 2000–01 2001–02 2002–03 2003–04E 2004–05E 2005–06E
IT, Engineering and R&D, SoftwareProducts Exports 110000 162000 170000 205000 296000 390000 513000
ITES Exports 42000 70000 106000 180000 216000 316000 409000Domestic Sector 132000 198114 246250 285000 318000 352000 365000
Total 284000 430114 522250 670000 830000 1058000 1287000
Note: *Does not include employee numbers in the hardware sector; E = Estimated.Source: National Association of Software and Service Companies (NASSCOM).

254 Eleventh Five Year Plan
pool of experienced, mid-level managers, that is will-ing and suitable to work in the IT-ITES sectors, a‘bridge course’ could be introduced to equip profes-sionals who may not have read for a course in IT. Inthe medium term, this kind of training needs to beback-ended into the formal system itself by improv-ing the quality of our technical and general educationprogrammes at the graduate level. This will makegraduates far more employable. In the long term, weneed to address the quantity problem. The educationsystem needs to be expanded rapidly at all levels. Thiswould also require a huge expansion in our Mastersand Doctoral programmes. Easing the supply con-straint requires more investment as well as a radicalreform of our education system. There is also a needfor starting academic programmes for developingmanpower in some of the niche areas like IT in healthcare, transportation, manufacturing, nanotechnology,animation and entertainment, etc. Faculty develop-ment is another major issue which needs focus. Forthis purpose, a national programme on faculty devel-opment in niche areas would be required. During theEleventh Plan period, the above important issues needto be tackled and the government needs to provide thenecessary resources and policy framework for achiev-ing the desired objectives. In this national endeavour,industry and government need to work together inclose unison. Some of the other measures that need to
be introduced in order to maintain and improve thequality of manpower are:
• Introduction of standardized national level testssimilar to Scholastic Aptitude Test (SAT), GraduateRecord Examination (GRE), Management AptitudeTest (MAT) etc., for benchmarking of students seek-ing admissions in undergraduate and postgraduateinstitutes in India.
• Rating and accreditation of all educational institu-tions by an independent agency.
• Introduction of a common nation-wide benchmarkfor assessing graduating students and inclusion ofindustry needs in this assessment process.
• Making the teaching/academic profession moreattractive and respectable.
• Encouraging students and working professionals topursue further education for skill enhancement.
• Periodic review and updation of curriculum to makeit more industry oriented and encouraging facultyto constantly upgrade skills.
Building Adequate Basic, Business, andSocial Infrastructure8.3.15 The growth of IT and ITES industry requiresbuilding and strengthening of basic, business, andsocial infrastructure. The incremental infrastructurerequired to support the projected growth is unlikely
TABLE 8.3.2Manpower Requirements for IT-ITES in India
(Million)
2002 2003 2006 2009 2012
IT export services
Consulting, Integration, Installation 0.01 0.02 0.03 0.09 0.27IT Development 0.07 0.08 0.08 0.08 0.11Outsourced IT Support 0.09 0.11 0.17 0.28 0.53Training and Education 0.00 0.00 0.00 0.02 0.06Total 0.17 0.21 0.29 0.48 0.97
IT-enabled services
Customer Care 0.03 0.05 0.15 0.42 1.03Finance 0.02 0.03 0.05 0.09 0.21Human Resource 0.00 0.00 0.02 0.15 0.69Payment Services 0.00 0.1 0.05 0.14 0.45Administration 0.2 0.3 0.5 0.15 0.15Content Development 0.03 0.04 0.07 0.09 0.20
Total 0.11 0.16 0.38 1.0 2.72
Source: ITD, NASSCOM-Mckinsey Manpower Profile of India, KPMG, 2003.

Services 255
to be absorbed into the existing city centres (Tier I/II),which are already witnessing signs of strain. WithTier III/IV cities lacking important elements ofbusiness and social infrastructure, decentralizedgrowth of the IT and ITES sector will require a coor-dinated, large scale (distributed) urban planningexercise. Some of the important initiatives requiredto be taken include:
• Strengthening of the intra-city road networkand public transport infrastructure to decongestexisting hubs.
• Decentralization of the industry beyond existinghubs by developing new townships.
• Introduction of faster public transport (high speedtrains similar to Train à Grande Vitesse of Franceand Bullet of Japan) between important cities.
Ensuring a Favourable Business Policy andRegulatory Environment with Special Focus onEncouraging Small and Medium Enterprieses(SMEs) and New Ventures8.3.16 A favourable business policy and a regulatoryenvironment are critical for the success of any sector.The example set by the Software Technology Parks ofIndia (STPI) scheme stands testament to this fact. Inorder to strengthen India’s proposition for sustainedleadership in the IT and ITES space, it is essential toactively support the SME sector. In addition, the issueof intellectual property protection, data and informa-tion security is a key risk to the sector. Hence, it is es-sential for India to proactively formulate a robustpolicy framework to address this challenge. This callsfor: (i) Continuation of the benefits provided by theSTPI scheme, (ii) strengthening the IP protection,data privacy, and information security environment inthe country, (iii) providing support for SME segmentgrowth to ensure that SMEs can continue to leveragethe benefits offered under the STP/SEZ schemewithout constraints on where they may be located, and(iv) ensuring adequate access to venture capital andangel funding for start-ups.
Global Trade Development and Promotion ofGlobal Free Trade in Services8.3.17 Expansion of the global IT-BPO marketopportunity is directly influenced by the policy and
regulatory frameworks governing cross-border tradein services. Growth of cross-border trade in services isconstrained not only by tariff barriers—but more soby non-tariff barriers (e.g., national treatment in cross-border supply and movement of people). India mustcontinue to work proactively with its trading partners(through the WTO and other trade promotion agen-cies) to streamline trade in professional services. Indiamust push for the free movement of professionalsengaged in delivering services on the basis of formalcontracts, through a global General Agreement onTrade in Services or professional services visa. At thesame time, it must engage in bilateral or multilateralnegotiations on these issues with countries of specificinterest to us. Negotiations are also needed to concludeagreements relating to exemption or refund of socialsecurity taxes paid by Indian professionals workingabroad.
Fostering a Sustainable Ecosystemfor Innovation and Research andDevelopment (R&D)8.3.18 In order to structurally strengthen India’sproposition and ensure its long-term leadership, it isessential to nurture a sustainable ecosystem for inno-vation and R&D in the country. This will require amultifaceted approach comprising (i) developingcore capabilities at the academic level in identifiedfocus areas, (ii) encouraging industry–academia par-ticipation in R&D, and (iii) facilitating the incubation/commercialization of innovations. IPR awarenessshould be increased in institutes and industries. Witha view to encourage and reward innovation, there isa need to ensure availability and access to adequatefunding for technology entrepreneurs and commer-cialization of innovation. Research and training shouldgo hand in hand. This is the practice worldwide. TheCSIR laboratories should pair with universities andtargeted R&D should be undertaken.
The Transformation of the Industry fromBPO to KPO and Related HumanResource (HR) Issues8.3.19 The society is shifting from an era of indus-trial society into ‘knowledge society’. Knowledgecreation and its applications are primary featuresof this change in today’s networked society. In any

256 Eleventh Five Year Plan
industrial society, the growth rate in the services sec-tor is higher than that of the manufacturing sector.Services themselves are also becoming an increasinglyintegral part of all production businesses and thereare relatively more people working in this sector now.This trend is ultimately leading to an increased em-phasis on intangible products, which is also calledservice concepts. Providing services is a much morechallenging task than just delivering goods, and,therefore, there will be an increasing focus on makingoptimal use of resources for maximizing their com-petitiveness.
8.3.20 The IT and ITES-BPO sector should continu-ously identify the emerging verticals, which have thepotential to grow and generate revenues keeping thedynamic nature of this sector in view. Generating theright kind of manpower with skill-sets requirementfor each of the potential vertical is so diverse that itbecomes a challenge for the HR function of a com-pany to continuously evolve vertical specific trainingmethodologies and design suitable training modules.Further, the HR companies will have to continuouslyscan the horizon for the emergence of newer technolo-gies and knowledge areas. The situation will becomemore complex as the transition from BPO to KPO takesplace. Intuitively, one can say that the transition islikely to be very crucial for sustenance of the industry’sgrowth and subsequent establishment in the marketplace.
8.3.21 It will be essential for each company to buildinternal capabilities to manage knowledge effectivelyand also the collective competence building for theIT sector. Managing knowledge is a process whichinvolves multi-period decision framework, startingfrom investment in R&D to diffusion of knowledge tocreation of innovation and ultimately realizing thevalue through commercialization of innovation andinventions.
Software Technology Parks (STPI) Scheme8.3.22 A favourable business policy and a regulatoryenvironment are critical for the success of any sectorand the STPI scheme stands testament to this fact. STPswere set up in various parts of the country as per theResolution issued by the government in 1993. Over the
last few years, it has played a seminal role in placingIndia on the global map as an IT superpower. In fact,significant credit for the record growth in exports, for-eign exchange earnings, employment generation, andthe development of the Indian IT-ITES sector isattributed to this scheme. Under the STP scheme, unitsengaged in the export of IT-ITES are entitled to taxbenefits under section 10A and 10B of Income Tax Act1961. However, these benefits under the scheme arescheduled to lapse post assessment year 2009–10.
IT in School Education8.3.23 Technology could be effectively used for digitaldelivery of high quality lectures and course materialto other institutions and embellish the same with classroom teaching for enhancing the learning. ICT toolscan make it easier to monitor not only the attendanceand performance of the students but also that of theteachers as well. The MIS also needs to be developedto monitor national projects such as SSA, MDM,ICDS, etc.
Gender Empowerment through ICT8.3.24 The Indian IT-ITES industry with revenues ofUS$ 39.6 billion has emerged as the largest private sec-tor employer in the country with direct employmentof 1.6 million professionals, and indirect employmentfor over 6 million people in different sectors. This fastexpanding IT and ITES sector in India has opened newdoors of opportunity for women. The participationof women in the IT-BPO workforce is seen as a criticalenabling factor for continued growth of the industry.While the percentage of women in the IT-BPOworkforce at an entry level is commensurate with theirproportion amongst graduating students, anecdotalevidence suggests that this is not so at the middle andsenior management positions. However, companies arerecognizing that having women on board at all levelsin the organization makes good business sense. IT-BPOcompanies are, therefore, considering ways to involveand develop women for higher roles and functions.Their increased professional participation will resultin changing the socio-economic status of womenwithin the employing organization and will also con-tribute towards the breakdown of gender disparity. Ina study conducted by NASSCOM in 2006, 76% of soft-ware professionals in IT companies are men, whereas

Services 257
24% are women. However, NASSCOM says this ratiois likely to be 65:35 (men:women) by the year 2007.Interestingly, this ratio is reversed in the ITES-BPOsector where the ratio of men to women is 31:69. Inline with the basic principles of governance to whichthe government is committed under the NCMP, whichincludes empowerment of women, the governmenthas introduced gender budgeting. In accordance withthis, gender empowerment through ICT should be aregular feature during the Eleventh Plan and effortsshould be made to support schemes of gender empow-erment through ICT for reducing digital divide.
Faculty Development in IT8.3.25 The prevailing system of education in India isconstrained by several factors. The government needsto strengthen the education system structurally with anumber of strategies. There is a dire need for continu-ously updating the course content, curriculum, andpedagogic methods to make them more relevant to theneeds of the industry. Additionally there is a need totake up specific programmes for the development offaculty and provide adequate incentives for makingteaching an attractive career option. Some of the policyissues in this regard which need immediate attentionare the following:
• Make teaching/academics as attractive a careeroption as working in the industry. The academicinstitutes need to provide suitable faculty remune-ration as there is a large gap between the salarystructures in the industry and in academics. Theindustry needs to come forward and supplementgovernment efforts through establishment of Chairsfor professors, incentives, sponsored research, andthe like.
• Need to increase the number of faculty positions inthe Indian universities and technical institutions aswell as creation of adjunct faculty from the indus-try to address the twin issue of quantity and qualityand R&D activities.
• Need to tie up with institutions abroad for profes-sors to come here on sabbatical.
• Need to train the ICT faculty of both the formaland the non-formal sector of education to keeppace with the demands of the industry as well asthe technological changes.
• Develop a mechanism to encourage migration ofstudents between formal and non-formal streamsto address the issue of quantity. Also introduce acredit system whereby the students can accumulateand carry forward their credits and complete theireducation at their own pace. This would particu-larly help the in-service personnel.
• Evolve National Mission for faculty developmentin general and faculty development in niche ITESareas such as IT in tourism, health, medical, andlegal services and finance in particular.
IT in Health Sector8.3.26 The importance of Health in the process ofeconomic and social development and improving thequality of life of our citizens has been well recognized.The government has identified Health as one of theseven Thrust Areas and has given focused attention toit. Since independence, a vast public health infrastruc-ture has been created comprising Public HealthCentres and Community Health Centres (CHCs) andDistrict/State and Super Specialty hospitals. In ruralareas especially, there are pockets of under-servedpopulations where the vicious circle of poverty, mal-nutrition, and poor health reinforce each other. Thereis an urgent need to reach out to the un-reached espe-cially in the remote areas. This can effectively be donewith the infusion of technology into the Health sector.
8.3.27 Integrated disease surveillance projects,creation of district and State Health Data Centres forthe surveillance units, networking and operating ofdistrict health centres through video based distancecommunications, early warning system for diseaseincidence and collection of call centre based informa-tion, web-based health MIS, and telemedicine are someof the important areas that need to be operationalized.Electronic health—or e-health is one of the nextfrontiers of ICT innovations. Some of the well knownhospitals in the country have developed MIS for healthwhich is also known as Medical Information System,which would go a long way in creation and adoptionof nationwide electronic medical records for allpatients treated at various hospitals in the country. Theissues like data privacy, security, and interoperabilityof systems are to be dealt with properly from ane-health perspective.

258 Eleventh Five Year Plan
IT in Agriculture Sector8.3.28 Agriculture continues to be one of the main-stays of Indian economy. Increased agricultural pro-duction and incomes would put more money in thehands of the people living in the rural areas. Keepingin view the important role that IT can play in boost-ing productivity and incomes of farmers and reduc-ing the cost of operations, agriculture has beenidentified as one of the Mission Mode Projects (MMPs)under the National e-Governance Plan (NeGP), anationwide initiative for promoting e-governance inthe country.
8.3.29 By means of IT, the agriculture sector wouldachieve higher efficiencies to redefine the way in deal-ing with the production and post harvest losses. TheAgricultural Resources Information System is envis-aged to create a comprehensive database on variousparameters related to land use, water use, and a systemfor strengthening advisory services to farmers in adopt-ing the latest agricultural production practices. Theportal AGMARKNET which provides daily marketinformation on commodity prices in respect of about300 commodities and 2000 varieties from over 2700markets is a Sunshine Portal for farmers to bargainbetter prices for their produce. Similarly, the ‘Gyandoot’portal of the State of Madhya Pradesh provides infor-mation regarding rates of grains and vegetables, dis-penses land records and issues income, domicile, andcaste certificates. Further attempts need to be made inproviding the latest information on real time basisto the farmers and other rural population in the re-motest parts of the country. Market is now the driverfor agricultural growth and efficiency of the marketdepends on effective dissemination of information. IThas the potential to help the agriculture sector to over-come some of the traditional barriers to developmentby improving access to information, expanding themarket base, enhancing employment opportunities,and making government services work better. DecisionSupport System on agricultural production and mar-keting, water allocation in an irrigation system, andcattle farming system in livestock are required to bedeveloped aggressively.
8.3.30 In the private sector also several initiatives havebeen taken to optimize the supply chain. ‘e-Choupal’
has been conceived as a more efficient supply chainaimed at delivering value to its customers around theworld on a sustainable basis. The e-Choupal modelhas been specifically designed to tackle the challengesposed by the unique problems of Indian agriculture,characterized by fragmented farms, weak infrastruc-ture, and the involvement of numerous intermediar-ies, among others.
IT in Rural Sector8.3.31 Rural Content Providers: The creation oflocal/rural content is of utmost importance in orderto make the PCs and Internet an attractive proposi-tion to a much larger number of people. Involving theprivate sector in this regard would also be essential.Therefore, it is felt that a new entrepreneurial categoryof Rural Content Providers would give a further boostto and drive the demand, both for PCs and Internetaccess as well as for rural connectivity. It will also helpin better utilization of the cable/wireless networkalready laid, or being planned in the rural areas by thebandwidth providers. The Rural Content Providerswould provide content and other facilities, includingentertainment, which will be of interest to the ruralpopulation.
8.3.32 Content creation would be a specializedarea requiring thorough understanding of the localrequirements and language which can only be donethrough local entrepreneurs. The business model ofsuch a Rural Content Provider would vary fromregion to region and would be driven by themarket. The Department of IT and the Departmentof Telecommunications (DoT) need to evolve asuitable strategy to encourage such Rural ContentProviders. The IT revolution would remain incom-plete unless the benefit of this revolution reachesrural masses.
TARGETS OF IT-ITES SECTOR FORTHE ELEVENTH FIVE YEAR PLAN8.3.33 Given the backdrop of large untappeddemand potential and strong fundamentals, Indiais uniquely positioned to secure global leadership.Table 8.3.3 shows the exports forecast for the EleventhPlan period as estimated by NASSCOM-McKinseyReport 2005.

Services 259
TABLE 8.3.3Indian IT-ITES Exports Forecast 2007–12
Year IT-ITES Exports(US$ billion)
2007–08 37.62008–09 47.52009–10 60.02010–11 72.12011–12 86.6
Source: NASSCOM-McKinsey Report 2005.
8.3.34 Additionally, Indian IT-ITES export growthcan be further accelerated through deep and enduringinnovation by industry participants. Such extensiveinnovation could generate an additional US$ 15–20billion in export revenue over the next five to tenyears.
8.3.35 Further, establishing India’s leadership in theglobal IT-ITES sector will mean more than achievinga targeted growth in exports. Attaining these ambitiousoutcomes will require breakthrough collaborationamongst industry players, Central and State Govern-ments, and NASSCOM—to ensure that appropriateactions required to maximize the global sourcingmarket potential and sustain India’s superiority asthe preferred sourcing destination are executed in atimely manner.
8.3.36 Achieving these growth targets will entail asignificant demand for incremental human andfinancial capital in the country. US$ 86 billion inIT-ITES exports by 2012 translates to incrementaldirect employment of about 2.5 million peopleand capital investment of approximately US$ 20billion.
THE PATH AHEAD8.3.37 The outlook for Indian IT/ITES-BPO remainsbright and the sector is poised to achieve its target ofUS$ 86.6 billion in export revenues by financial year2011–12. In order to achieve these targets, both theGoI as well as the industry need to work in unison.While the basic policy framework and fiscal incentivesas enumerated above need to be put in place by thegovernment, the industry associations and industriesneed to actively support the initiatives.
8.4 FINANCIAL SERVICES
INTRODUCTION8.4.1 The financial services sector in the country hasbeen displaying a varying growth rate in the recent past.The annual growth rates since 2000–01 are given inTable 8.4.1.
TABLE 8.4.1Growth Rate (Real) of Financial Services
(Banking and Insurance)
S Year Rate of Percentage ShareNo. Growth in the GDP
1. 2000–01 –2.0 5.52. 2001–02 9.1 5.73. 2002–03 11.3 6.14. 2003–04 2.2 5.85. 2004–05 8.8 5.96. 2005–06 14.0 6.17. 2006–07 13.0 6.38. 2000–01 to 2006–07 8.1 5.9
(Average)
Source: CSO.
8.4.2 The financial sector as a whole is estimated toemploy between 3.5 million to 4.0 million people,including direct employees and agency forces. Tosupport the GDP growth aspiration of 9%–10%,the financial sector would need to grow by 25%–30%annually over the next five years. The penetrationof the financial sector in India remains low relative tomany markets, with bank credit/GDP at under 50.0%,overall insurance premium/GDP at under 5.0%, andgeneral insurance premium/GDP at under 1.0%. Theunderlying GDP growth and higher penetrationpotential offer strong growth opportunities for thefinancial sector. The financial sector also has substan-tial potential for employment creation.
8.4.3 This sector performs the vital functions ofenabling productivity and income growth in theeconomy as a whole, and has an equally importantpart to play in making this growth more inclusive.The sector has to be enabled to attain an increasinglevel of sophistication so as to meet the requirementsof globalizing trade and industry and the increasingengagement of the Indian economy with the rest ofthe world, both on the current as well as on the

260 Eleventh Five Year Plan
capital accounts. The government has recently receivedthe report of the EC on making Mumbai an Inter-national Financial Centre. This report has made veryfar reaching recommendations on the fiscal andmonetary policies, financial sector regulation andsupervision, as well as on the development ofvarious financial markets. While these recommenda-tions would be relevant to the needs of medium- andlarge-scale industry and commerce, it would benecessary to look at certain further policy measuresin order to ensure that small and marginal farmers,micro enterprises in the unorganized sector, theweaker and disadvantaged sections of society, andthe relatively backward regions and States areenabled to participate more fully in the growthprocess.
8.4.4 This chapter outlines some of the major issuesthat the financial services sector needs to address inthis task of facilitating inclusive growth and suggestsome necessary steps in the way forward.
FINANCIAL INCLUSION8.4.5 Financial inclusion can be described as thedelivery of banking and other financial services ataffordable costs to the vast sections of the disadvan-taged and low-income groups. To bring the ‘financiallyexcluded’ population within the formal financialsystem, many policy initiatives have been taken,such as making available a basic banking ‘no frills’account either with ‘nil’ or very low minimum balances,issuing of General Credit Cards to eligible beneficia-ries without insistence on security, purpose, or enduse of credit; introduction of KCCs, allowing banksto utilize the services of NGOs, SHGs, MFIs, andother civil society organizations as intermediaries inproviding financial services; credit linking of SHGs,support to MFIs; introduction of Financial Sector(Regulation and Development) Bill 2007 to developand regulate the MFIs; and constitution of FinancialInclusion Fund and Financial Inclusion TechnologyFund of Rs 500 crore each to strengthen the institu-tional and technological infrastructure for greaterfinancial inclusion. We have to introduce suitablepolicy interventions and technological innovations tomaximize the financial inclusion during the EleventhPlan period.
EXTENT AND CAUSES OF FINANCIAL EXCLUSION8.4.6 Lack of access to financial services such as credit,savings, and insurance at an affordable cost not onlyresults in exclusion but also acts as a constraint togrowth impetus in the rural and unorganized sectors.Despite years of policies aimed at the financial inclu-sion, a large number of households do not have accessto formal financial services even today.
8.4.7 The financial exclusion covers exclusion fromany or all of the financial services necessary for par-ticipating in a modern market economy. Nevertheless,exclusion from credit provision has been looked at asbeing more significant than that from other services.There is a rural–urban divide and a regional skew tothe financial exclusion. Table 8.4.2 presents the pre-vailing situation:
TABLE 8.4.2Savings and Loan Accounts
S. Regions No. of Savings No. of LoanNo. Accounts to Accounts to
Adult Population Adult Population(2005) (%) (2005) (%)
1. North 80 12
2. North East 37 7
3. East 34 8
4. Central 52 9
5. West 60 13
6. South 66 25
7. All-India 59 14
7a Rural 39 9.5
7b Urban 60 14
Source: Speech of Usha Thorat, Dy Governor, RBI (19 June 2007).
8.4.8 The NSSO Situation Assessment Survey on ‘In-debtedness of Farmer Households’ (2003) reveals that51.4% of farmer households do not access credit ei-ther from formal or non-formal sources. The region-wise position of the level of indebtedness is indicatedin Table 8.4.3.
8.4.9 There are several reasons for financial exclusion:lack of awareness, low income/assets, social exclusion,and illiteracy are the demand side factors. On thesupply side, distance from branches, branch timings,cumbersome documentation and procedures, unsuit-

Services 261
able products, language, and staff attitudes are thereasons for exclusion.
8.4.10 While steps need to be taken to improve theaccess to and the supply of credit and other financialservices, there can be no overemphasis of the impor-tance of building up the capacity of the weaker sec-tions to use the financial services. To some extent, afinancial service such as insurance would be necessaryto use another financial service such as credit; finan-cial literacy would help in using savings, credit, andinsurance services, etc., but there remain several othervery important factors outside of the financial sectorthat are complementary to financial services and needto considered as an integrated package.
8.4.11 On the supply side, the post-1991 period has alsoseen significant changes in the credit provision for theweaker sections. Despite emphasis on increasing thecredit penetration and outreach of institutional sourcesof credit, the number of rural bank branches has de-clined from 35134 in March 1991 to 30572 in March2006. Even the number of small borrowers’ accounts(less than Rs 25000) has declined from 625.48 lakhto 387.33 lakh. The result has been that the share ofmoney lenders in the total dues of rural householdshas increased from 17.5% in 1991 to 29.6% in 2002.(All-India Debt and Investment Survey as on 30 June2002, NSS 59th Round Released in December 2005.)
8.4.12 A continuing policy measure is the stipulationof priority sector lending. However, this has got
diluted in the last 10 years by a shift in the focus tobetter creditworthy activities such as housing, trans-port, professional activities, etc.
8.4.13 The priority sector now comprises agriculture(both direct and indirect), SSIs, small road and watertransport operators, small business, retail trade, pro-fessional and self-employed persons, State-sponsoredorganizations for SC/ST, education, housing loans,micro credit, loans to software, and food, and agro-processing sectors.
8.4.14 The share of agriculture in total bank creditdeclined sharply from 15.9% at end-March 1990to 9.6% by end-March 2001. During this period,however, the share of agriculture in GDP also declinedsignificantly. As a result, the credit intensity of theagriculture sector (credit to agriculture sector as per-centage of sectoral GDP) remained broadly at the samelevel. Credit to agriculture picked up significantly from2004–05 onwards. The government announced on 18June 2004 a package for doubling the flow of credit toagriculture and allied activities in a period of threeyears commencing from 2004–05 over the amountdisbursed during the year 2003–04. Table 8.4.4 indi-cates the target and achievement of the agriculturalcredit flow during 2004–05, 2005–06, and 2006–07.
8.4.15 The credit intensity of the sector increasedsharply from 11.1% in 2001–02 to 27% in 2005–06.The number of borrowal accounts in the agriculturesector also increased from 19.84 million in 2000–01
TABLE 8.4.3Credit Access of Farmer Households
Region Farmer Households (HHs) Farmer Households (HHs)
Borrowing from both not Accessing Credit from either
Formal and Non-formal Sources Formal or Non-formal Sources
No. (Lakh) Percentage of total HHs No. (Lakh) Percentage of total HHs
Northern 56.26 51.40 53.20 48.60North Eastern 7.04 19.90 28.36 80.10Eastern 84.22 40.00 126.39 60.00Central 113.04 41.66 158.29 58.34Western 55.74 53.77 47.92 46.23Southern 117.45 72.70 44.11 27.30Group of UTs 0.49 33.10 0.99 66.90All-India 434.24 48.6 459.26 51.4
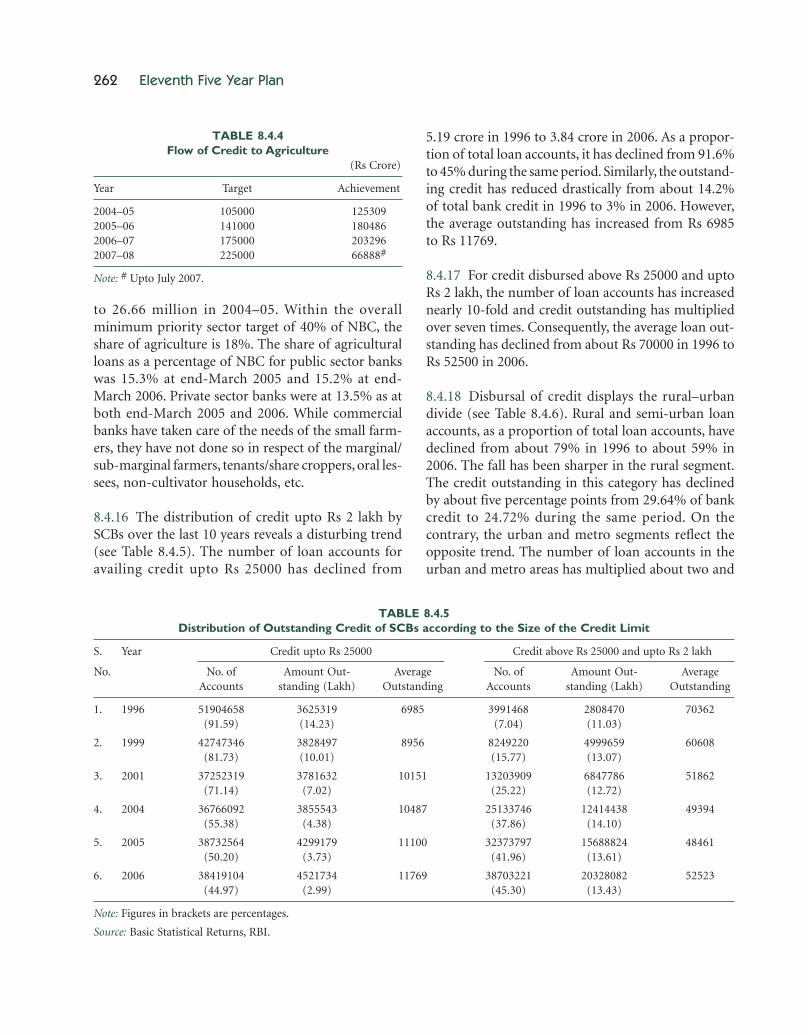
262 Eleventh Five Year Plan
to 26.66 million in 2004–05. Within the overallminimum priority sector target of 40% of NBC, theshare of agriculture is 18%. The share of agriculturalloans as a percentage of NBC for public sector bankswas 15.3% at end-March 2005 and 15.2% at end-March 2006. Private sector banks were at 13.5% as atboth end-March 2005 and 2006. While commercialbanks have taken care of the needs of the small farm-ers, they have not done so in respect of the marginal/sub-marginal farmers, tenants/share croppers, oral les-sees, non-cultivator households, etc.
8.4.16 The distribution of credit upto Rs 2 lakh bySCBs over the last 10 years reveals a disturbing trend(see Table 8.4.5). The number of loan accounts foravailing credit upto Rs 25000 has declined from
5.19 crore in 1996 to 3.84 crore in 2006. As a propor-tion of total loan accounts, it has declined from 91.6%to 45% during the same period. Similarly, the outstand-ing credit has reduced drastically from about 14.2%of total bank credit in 1996 to 3% in 2006. However,the average outstanding has increased from Rs 6985to Rs 11769.
8.4.17 For credit disbursed above Rs 25000 and uptoRs 2 lakh, the number of loan accounts has increasednearly 10-fold and credit outstanding has multipliedover seven times. Consequently, the average loan out-standing has declined from about Rs 70000 in 1996 toRs 52500 in 2006.
8.4.18 Disbursal of credit displays the rural–urbandivide (see Table 8.4.6). Rural and semi-urban loanaccounts, as a proportion of total loan accounts, havedeclined from about 79% in 1996 to about 59% in2006. The fall has been sharper in the rural segment.The credit outstanding in this category has declinedby about five percentage points from 29.64% of bankcredit to 24.72% during the same period. On thecontrary, the urban and metro segments reflect theopposite trend. The number of loan accounts in theurban and metro areas has multiplied about two and
TABLE 8.4.5Distribution of Outstanding Credit of SCBs according to the Size of the Credit Limit
S. Year Credit upto Rs 25000 Credit above Rs 25000 and upto Rs 2 lakh
No. No. of Amount Out- Average No. of Amount Out- AverageAccounts standing (Lakh) Outstanding Accounts standing (Lakh) Outstanding
1. 1996 51904658 3625319 6985 3991468 2808470 70362(91.59) (14.23) (7.04) (11.03)
2. 1999 42747346 3828497 8956 8249220 4999659 60608(81.73) (10.01) (15.77) (13.07)
3. 2001 37252319 3781632 10151 13203909 6847786 51862(71.14) (7.02) (25.22) (12.72)
4. 2004 36766092 3855543 10487 25133746 12414438 49394(55.38) (4.38) (37.86) (14.10)
5. 2005 38732564 4299179 11100 32373797 15688824 48461(50.20) (3.73) (41.96) (13.61)
6. 2006 38419104 4521734 11769 38703221 20328082 52523 (44.97) (2.99) (45.30) (13.43)
Note: Figures in brackets are percentages.
Source: Basic Statistical Returns, RBI.
TABLE 8.4.4Flow of Credit to Agriculture
(Rs Crore)
Year Target Achievement
2004–05 105000 1253092005–06 141000 1804862006–07 175000 2032962007–08 225000 66888#
Note: # Upto July 2007.
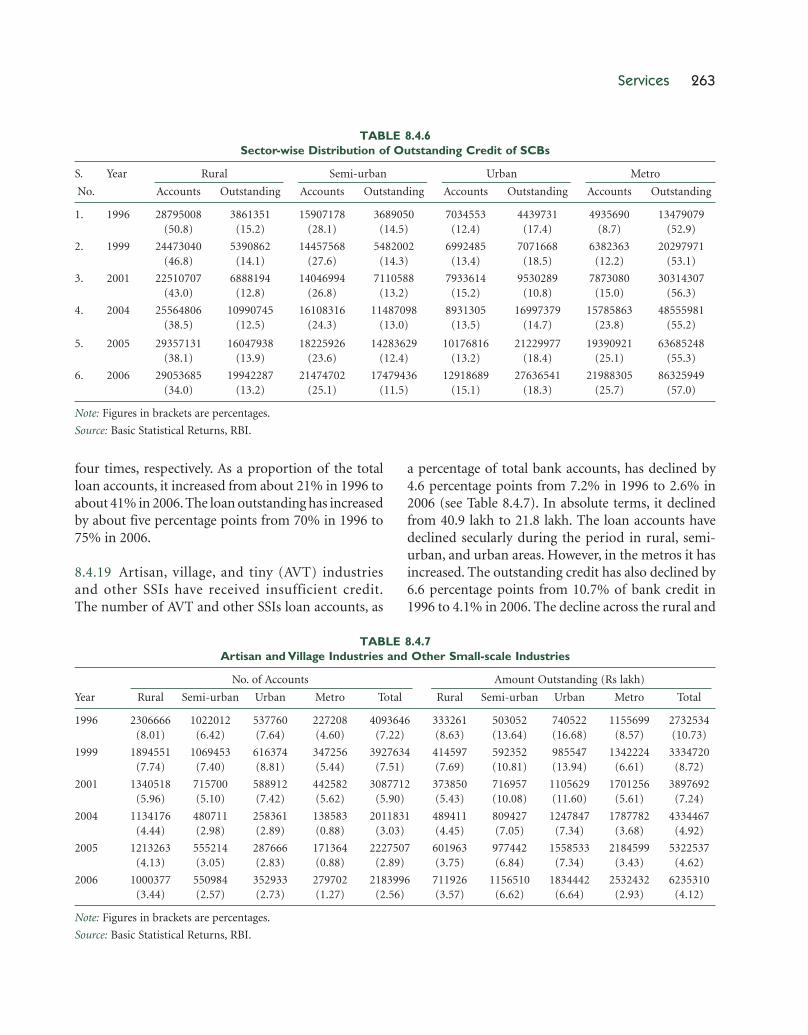
Services 263
four times, respectively. As a proportion of the totalloan accounts, it increased from about 21% in 1996 toabout 41% in 2006. The loan outstanding has increasedby about five percentage points from 70% in 1996 to75% in 2006.
8.4.19 Artisan, village, and tiny (AVT) industriesand other SSIs have received insufficient credit.The number of AVT and other SSIs loan accounts, as
a percentage of total bank accounts, has declined by4.6 percentage points from 7.2% in 1996 to 2.6% in2006 (see Table 8.4.7). In absolute terms, it declinedfrom 40.9 lakh to 21.8 lakh. The loan accounts havedeclined secularly during the period in rural, semi-urban, and urban areas. However, in the metros it hasincreased. The outstanding credit has also declined by6.6 percentage points from 10.7% of bank credit in1996 to 4.1% in 2006. The decline across the rural and
TABLE 8.4.6Sector-wise Distribution of Outstanding Credit of SCBs
S. Year Rural Semi-urban Urban Metro
No. Accounts Outstanding Accounts Outstanding Accounts Outstanding Accounts Outstanding
1. 1996 28795008 3861351 15907178 3689050 7034553 4439731 4935690 13479079 (50.8) (15.2) (28.1) (14.5) (12.4) (17.4) (8.7) (52.9)
2. 1999 24473040 5390862 14457568 5482002 6992485 7071668 6382363 20297971 (46.8) (14.1) (27.6) (14.3) (13.4) (18.5) (12.2) (53.1)
3. 2001 22510707 6888194 14046994 7110588 7933614 9530289 7873080 30314307 (43.0) (12.8) (26.8) (13.2) (15.2) (10.8) (15.0) (56.3)
4. 2004 25564806 10990745 16108316 11487098 8931305 16997379 15785863 48555981 (38.5) (12.5) (24.3) (13.0) (13.5) (14.7) (23.8) (55.2)
5. 2005 29357131 16047938 18225926 14283629 10176816 21229977 19390921 63685248 (38.1) (13.9) (23.6) (12.4) (13.2) (18.4) (25.1) (55.3)
6. 2006 29053685 19942287 21474702 17479436 12918689 27636541 21988305 86325949 (34.0) (13.2) (25.1) (11.5) (15.1) (18.3) (25.7) (57.0)
Note: Figures in brackets are percentages.
Source: Basic Statistical Returns, RBI.
TABLE 8.4.7Artisan and Village Industries and Other Small-scale Industries
No. of Accounts Amount Outstanding (Rs lakh)
Year Rural Semi-urban Urban Metro Total Rural Semi-urban Urban Metro Total
1996 2306666 1022012 537760 227208 4093646 333261 503052 740522 1155699 2732534(8.01) (6.42) (7.64) (4.60) (7.22) (8.63) (13.64) (16.68) (8.57) (10.73)
1999 1894551 1069453 616374 347256 3927634 414597 592352 985547 1342224 3334720(7.74) (7.40) (8.81) (5.44) (7.51) (7.69) (10.81) (13.94) (6.61) (8.72)
2001 1340518 715700 588912 442582 3087712 373850 716957 1105629 1701256 3897692(5.96) (5.10) (7.42) (5.62) (5.90) (5.43) (10.08) (11.60) (5.61) (7.24)
2004 1134176 480711 258361 138583 2011831 489411 809427 1247847 1787782 4334467(4.44) (2.98) (2.89) (0.88) (3.03) (4.45) (7.05) (7.34) (3.68) (4.92)
2005 1213263 555214 287666 171364 2227507 601963 977442 1558533 2184599 5322537(4.13) (3.05) (2.83) (0.88) (2.89) (3.75) (6.84) (7.34) (3.43) (4.62)
2006 1000377 550984 352933 279702 2183996 711926 1156510 1834442 2532432 6235310(3.44) (2.57) (2.73) (1.27) (2.56) (3.57) (6.62) (6.64) (2.93) (4.12)
Note: Figures in brackets are percentages.
Source: Basic Statistical Returns, RBI.
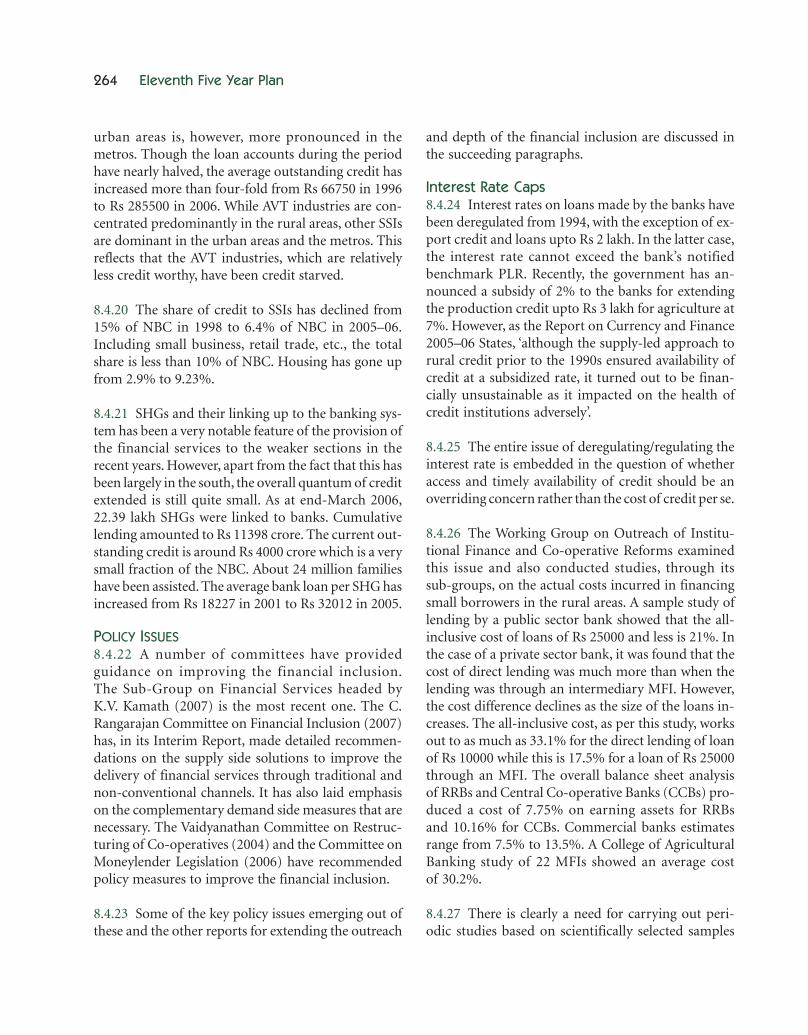
264 Eleventh Five Year Plan
urban areas is, however, more pronounced in themetros. Though the loan accounts during the periodhave nearly halved, the average outstanding credit hasincreased more than four-fold from Rs 66750 in 1996to Rs 285500 in 2006. While AVT industries are con-centrated predominantly in the rural areas, other SSIsare dominant in the urban areas and the metros. Thisreflects that the AVT industries, which are relativelyless credit worthy, have been credit starved.
8.4.20 The share of credit to SSIs has declined from15% of NBC in 1998 to 6.4% of NBC in 2005–06.Including small business, retail trade, etc., the totalshare is less than 10% of NBC. Housing has gone upfrom 2.9% to 9.23%.
8.4.21 SHGs and their linking up to the banking sys-tem has been a very notable feature of the provision ofthe financial services to the weaker sections in therecent years. However, apart from the fact that this hasbeen largely in the south, the overall quantum of creditextended is still quite small. As at end-March 2006,22.39 lakh SHGs were linked to banks. Cumulativelending amounted to Rs 11398 crore. The current out-standing credit is around Rs 4000 crore which is a verysmall fraction of the NBC. About 24 million familieshave been assisted. The average bank loan per SHG hasincreased from Rs 18227 in 2001 to Rs 32012 in 2005.
POLICY ISSUES8.4.22 A number of committees have providedguidance on improving the financial inclusion.The Sub-Group on Financial Services headed byK.V. Kamath (2007) is the most recent one. The C.Rangarajan Committee on Financial Inclusion (2007)has, in its Interim Report, made detailed recommen-dations on the supply side solutions to improve thedelivery of financial services through traditional andnon-conventional channels. It has also laid emphasison the complementary demand side measures that arenecessary. The Vaidyanathan Committee on Restruc-turing of Co-operatives (2004) and the Committee onMoneylender Legislation (2006) have recommendedpolicy measures to improve the financial inclusion.
8.4.23 Some of the key policy issues emerging out ofthese and the other reports for extending the outreach
and depth of the financial inclusion are discussed inthe succeeding paragraphs.
Interest Rate Caps8.4.24 Interest rates on loans made by the banks havebeen deregulated from 1994, with the exception of ex-port credit and loans upto Rs 2 lakh. In the latter case,the interest rate cannot exceed the bank’s notifiedbenchmark PLR. Recently, the government has an-nounced a subsidy of 2% to the banks for extendingthe production credit upto Rs 3 lakh for agriculture at7%. However, as the Report on Currency and Finance2005–06 States, ‘although the supply-led approach torural credit prior to the 1990s ensured availability ofcredit at a subsidized rate, it turned out to be finan-cially unsustainable as it impacted on the health ofcredit institutions adversely’.
8.4.25 The entire issue of deregulating/regulating theinterest rate is embedded in the question of whetheraccess and timely availability of credit should be anoverriding concern rather than the cost of credit per se.
8.4.26 The Working Group on Outreach of Institu-tional Finance and Co-operative Reforms examinedthis issue and also conducted studies, through itssub-groups, on the actual costs incurred in financingsmall borrowers in the rural areas. A sample study oflending by a public sector bank showed that the all-inclusive cost of loans of Rs 25000 and less is 21%. Inthe case of a private sector bank, it was found that thecost of direct lending was much more than when thelending was through an intermediary MFI. However,the cost difference declines as the size of the loans in-creases. The all-inclusive cost, as per this study, worksout to as much as 33.1% for the direct lending of loanof Rs 10000 while this is 17.5% for a loan of Rs 25000through an MFI. The overall balance sheet analysisof RRBs and Central Co-operative Banks (CCBs) pro-duced a cost of 7.75% on earning assets for RRBsand 10.16% for CCBs. Commercial banks estimatesrange from 7.5% to 13.5%. A College of AgriculturalBanking study of 22 MFIs showed an average costof 30.2%.
8.4.27 There is clearly a need for carrying out peri-odic studies based on scientifically selected samples
Services 265
and factoring in all costs to arrive at the actual cost oflending to small borrowers in the rural areas.
8.4.28 In addition to the interest rates charged, theborrowers have to incur other costs, such as submit-ting certificates/documents (land documents, searchreports by lawyers, ‘no dues’ certificate from otherbank branches, valuation certificates, etc.), and oftenbribes. Taking all these into account, the total cost ofborrowing through the formal institutional channelsmay not be less than the rates charged by the formalcredit channels.
8.4.29 If documentation and other procedures aresimplified, thereby reducing the transaction costs ofthe farmers significantly, the farmers may not mindpaying market driven rates of interests, covering thecosts of funds, and the transaction costs and risk costsof the banks. Allowing the interest rates to be marketdriven and taking into account the risk perceptions ofthe banks would lead to the banks considering agri-cultural lending as a viable business proposition.
8.4.30 The Report on Currency and Finance itselfquotes the Prime Minister to raise significant ques-tions relating to credit to the weaker sections. It raisesthe fundamental issue of whether farmers need reli-able access to credit at reasonable rates or a lower rateof interest, whether we need to create new institutionalstructures, etc.
8.4.31 There appears to exist an element of inconsis-tency in the stipulations relating to the interest rates.While the interest rate on direct lending by the banksupto a limit of Rs 2 lakh cannot be at a rate higherthan the bank’s PLR, there is no such restriction ifthe lending is to an ultimate borrower through the in-termediation of an MFI. The RBI in 2000 deregulatedthe interest rates on loans made by the commercialbanks to the MFIs, and interest rates on loans made bythe MFIs to the borrowers. Micro credit extended bythe commercial banks either directly or through anintermediary was to be considered as part of the bank’spriority sector lending. Again in 2006, the RBI empha-sized that the interest rates applicable to loans givenby banks to MFIs or by MFIs to SHGs/memberbeneficiary would be left to their discretion. This leads
to an anomalous situation where loans to the samebeneficiaries if dispensed through alternate channelsof financing are priced differently. In order to removethis anomaly, no interest rate ceilings should be im-posed on the banks by the government.
8.4.32 The available data show that around 82% ofthe lending by the banks is taking place at sub-PLRrates. While better creditworthy corporates are gettingcredit at sub-PLR rates, the agriculture and SSI sec-tors and others are charged PLR or even higher rates.This would again point out to the need to carry outproper costing studies for credit provision to differentclasses of customers. It must be recognized that if theeffort for financial inclusion of the underprivileged isto be sustained, the cost of providing such servicesshould invariably be met. However, the model should,at the same time, penalize inefficiencies in providingcredit. Therefore, the costs should be appropriatelybenchmarked in accordance with the best practices.A free interest rate regime and competition shouldbe recognized as the primary means of ensuringreasonable rates; this should be supplemented by thepublication of the results of such studies.
8.4.33 It is necessary to recognize that there are limi-tations beyond which the institutional credit systemwill not be able to provide services inspite of the adop-tion of technology, especially when it pertains to thedisadvantaged groups. Experience through case stud-ies shows that the expansion of micro finance hashelped in smoothening of the interest rates chargedby the informal sector.
8.4.34 While the approach of the RBI has been veryopen and driven by the larger interest for the develop-ment of the micro finance sector, there have beeninstances of the State Governments regulating theinterest rate. The State Governments have taken theplea that MFIs charge usurious rates of interestand this increases the indebtedness of the usually poorborrowers.
8.4.35 Consultative Group to Assist the Poor guidingprinciples on regulation and supervision of microfinance state that interest rate caps, where they are inforce, almost always hurt the poor by limiting the

266 Eleventh Five Year Plan
services, far more than they help the poor by loweringthe rates. The Report of the Internal Group to Exam-ine Issues relating to Rural Credit and Micro Finance(Khan Committee) of the RBI has also deliberated onthis issue. The Report mentions that the empirical datain respect of several micro finance projects beingcarried out in different parts of the world prove thattimely availability and right quantity of credit, and notthe interest rate, are crucial to the success of the microfinance programmes. Since the method of costingapplied by the MFIs is fundamentally different fromthat followed by the banks, the methodology for ap-plying interest rates for them would be different fromthe methodology for the banks. Since providingservices at the doorstep of the customer has a cost,no undue intervention is required to set the interestrates charged to the ultimate borrower through thefinancial intermediation route. This is best left to thecommercial judgment of the borrowing MFIs andthe lending institutions.
8.4.36 It has been argued that both the CentralGovernment and State Government can play a centralrole in reducing the interest rates without introducingrate caps. This can be done by creating a database andmonitoring system for interest rates being charged bythe MFIs. Under the system, it would be mandatoryfor the MFIs to report the effective interest rate offer-ings periodically. However, transparency in the fixa-tion of interest rates is the major bottleneck. At present,there is no uniform agreed methodology followed bythe MFIs for disclosing effective interest rate chargedincluding loan processing fees, bad debt provisions,and other ancillary charges. This makes it difficultto compare interest rates across all MFIs. One of theoptions could be self-regulation, that is associationsof the MFIs themselves voluntarily adopt and enforcea code of conduct including disclosure norms. As self-regulatory organizations have serious limitations toenforcing their rules, the other option is formal regula-tion of the sector. This would include formulation andenforcement of uniform financial reporting guidelinesincluding norms for treatment of non-performingassets; unambiguous interest rate disclosure guidelinesincluding norms for disclosing loan processing fees,bad debt provisions, and other hidden charges; clearconduct codes for behaviour of the MFI staff with
penalty for breach of conduct rules; and audit provi-sion for the MFIs above a certain level of portfolio.
8.4.37 Ratings of MFIs by external agencies such asSIDBI could also be thought of to promote transpar-ency in the operations of the MFIs.
8.4.38 With the use of IT solutions and transparencyin pricing coupled with growing competition amongstMFIs, it is expected that the interest rate charged bythe MFIs would come down. Credit dispensationthrough alternate channels, namely, MFIs, SHGs,Non-banking Financial Companies (NBFCs), HFCs,and post offices would be effective in increasingaccess, reducing transaction costs, as also in improv-ing recovery.
Modes of Extending Outreach
UP-SCALING SHGs–BANK LINKAGE PROGRAMME (SBLP)8.4.39 Essentially, two forms of providing micro creditare being followed, namely SBLP and MFIs. Withinthe SHG–bank linkage model, SHGs are formed byNGOs and SHG Promoting Institutions (SHPIs) andcredit is extended by the banks to the SHGs directly.This is the predominant form of disbursement of creditwithin the SBLP model.
8.4.40 The geographical distribution of both theSHGs–bank linkage and the MFIs is highly skewed.The southern States account for the bulk of SHGs.However, in the recent years, SBLP has been makinginroads into the regions with a large percentage ofrural poor. About 90% of the SHGs that are linked tothe banks are of women.
8.4.41 SBLP has registered an impressive growthduring the last five to seven years. At present, 90% ofthe micro credit is being disbursed through the SHGs–bank linkage model. The SHGs linked to banks haveincreased from 2.64 lakh in 2000–01 to 22.39 lakh in2005–06. Despite such an impressive growth, a vast gapbetween the demand and supply of micro creditexists. As per the estimate by the Task Force headed byV.S. Vyas (2007), the minimum requirement of themicro credit is Rs 70000 crore as against the supply ofRs 11378 crore. This programme is also concentrated
Services 267
in the southern States. However, in 2005, NABARDhad identified 13 priority States accounting for the bulkof India’s poor for special efforts and location-specificstrategies.
8.4.42 Under the SBLP, the average loan per memberis less than Rs 4000. This is grossly insufficient forfinancing income-generating activities. The interestrate charged from members has been reported to be15%–24% per annum. The cost of forming and nur-turing the group up to the stage of credit linkage isborne by NABARD. The norms of the MoRD providefor Rs 10000 per group as the cost of formation ofthe groups.
8.4.43 The binding constraint in the SBLP is the abil-ity to form groups and to build up their capacities.This, in turn, is strongly dependent on the availabilityof committed NGOs and SHPIs. The Rangarajan Com-mittee has identified the SBLP as one of the two maininstruments for achieving financial inclusion andhas suggested that the Department of Women andChild Development should be actively involved inthis process. Upon the recommendation of this Com-mittee, a Financial Inclusion Fund has been set up byNABARD for promotional activities. NABARD isalready engaged in a variety of capacity-buildingefforts in this area. NABARD’s programme needsto be more closely integrated with those of the StateGovernments, especially in the 13 priority States. Itis to be noted that the NCEUS has also made a similarrecommendation for a fund to be used for promo-tional activities.
8.4.44 At the same time, it has been suggested by somethat this model may be allowed to grow organicallyin response to needs and capabilities and there shouldbe emphasis on quality rather than quantity. SHGsshould not be allowed to go the co-operatives way.Co-operatives were burdened with non-credit businessthat is used as a mechanism to deliver governmentprogrammes such as PDS, sale of fertilizer, etc. Theysubsequently became politicized. SHGs being such alarge-scale movement are also susceptible topoliticization. It needs to be ensured that SHGs retaintheir character as a peoples’ movement and do notbecome a tool in power politics.
8.4.45 Interestingly, the Vaidyanathan CommitteeStates that co-operatives, of the mutual thrift and credittype, are the only form of organization by which eco-nomically disadvantaged individuals and groups,through voluntary collective action, overcome theirdisadvantageous position in an unequal market andpromote their well being. It further adds that thecredit would be put to good use in the organizationsin which the members know each other first hand, areclosely linked through kinship and social relations, andhave a strong mutual stake in the proper use of thecommon credit pool. One would not be mistaken ifthis description were understood as being one of SHGs.In fact, there is nothing new in the SHG concept thathas not been embedded in that of the co-operativesearlier. That the co-operatives have reached theirpresent state should serve as a serious warning to theSHG movement as well.
THE MFI SECTOR8.4.46 In the MFI model, the MFIs both form thegroups and provide credit to SHGs and individuals.MFIs raise funds from the banks and financial institu-tions for on-lending to SHGs and individuals.
8.4.47 MFIs are an amorphous collection of legal en-tities, both for-profit and not-for-profit institutions.Amongst not-for-profit institutions are includedNGOs incorporated as trusts/societies, co-operativesset up under the Co-operative Acts, and Section 25companies under the Companies Act. For-profit MFIsinclude NBFCs incorporated under the Companies Actand regulated by the RBI.
8.4.48 In the MFI model, the rate of interest chargedis higher (at about 20%–24%) than the SBLP modelas the MFIs have to charge a rate of interest that recov-ers cost of funds as well as the cost of formation ofgroups. Sa-Dhan’s voluntary code of conduct laysdown that the MFIs will charge reasonable rate ofinterest, that is 21%– 24% per annum. This is compa-rable to the rate of interest charged by SHGs from theirmembers. Even the cost of formation and nurturingthe groups is borne by the MFIs themselves. Thecost of funds to MFIs is higher than the rate at whichthe banks lend to SHGs under the SBLP. Transactioncosts are also higher owing to weekly collections

268 Eleventh Five Year Plan
and delivery of services at the doorstep. On the flipside, transparency in fixation of the rate of interestand disclosure norms, consumer protection, andcoercive practices of MFIs have emerged as the majorconcerns.
8.4.49 MFIs require funds for credit expansion andon-lending to the SHGs and individual members. Asof now, studies reveal that the Indian MFIs are veryhighly leveraged compared to those of the rest of theworld. With a low equity base, the ability of MFIs toraise debt resources from the banks and other finan-cial institutions is limited. Several measures to enlargeequity capital of MFIs include relaxing the constrainton equity investment by venture capital into MFIs,lowering the minimum capital requirement for for-eign equity participation, and enhancing the corpusof equity support from NABARD.
REVITALIZATION OF CO-OPERATIVES8.4.50 Co-operatives have the largest nominal out-reach amongst the rural financial institutions includ-ing the commercial banks. Presently, they are at acrossroads owing to resource constraints, poor gover-nance, bad management, and inefficiency. On the ba-sis of the recommendations of the VaidyanathanCommittee, the GoI has formulated a revival packagefor restructuring and strengthening of the rural co-operative credit institutions. A total of 17 States haveaccepted ‘in-principle’ the revised revival package asformulated by the GoI. Of the 17 States, 12 States haveexecuted an MoU with the GoI and NABARD. Theconditionalities free the societies from the necessity ofbeing a part of the three-tier structure. Individualsocieties would also be free to establish business con-tact with the commercial banks and borrow from anyRBI regulated institution. Freedom from compulsoryfederation would help in reducing unnecessary tiersin financing which add to costs. The co-operatives arealso to be free to decide interest rates on deposits andadvances subject to RBI regulations. These reforms aresalutary and will enable the co-operatives to functionon sound commercial lines. The insistence on signingthe MoU with its conditionalities and acceptance ofguidelines prescribed by RBI for ensuring ‘fit andproper’ criteria for Directors in the Boards and ChiefExecutive Officers of rural co-operatives are apparently
some of the reasons for the slow pace of implementa-tion of the revival package.
8.4.51 It is imperative that the revival package is im-plemented in toto, without diluting the contingentlegal, financial, regulatory, and institutional reforms.This would have the effect of cleansing the balancesheets and strengthening the capital base of ruralco-operatives so that they begin on a clean slate andare at par with other rural financial institutions.However, there are several valid concerns that need tobe addressed so that the financial and institutionalsustainability of the rural co-operatives is not impaired.
8.4.52 The Vaidyanathan Committee states that, co-operative societies in India, unlike the world over, havenot been mutual, but only agencies for credit dispen-sation. Upper tiers were created to provide refinancefor the lower tiers. This resulted in a structure drivenby borrowers at all levels. The Committee, therefore,recommended that there should be an aggressiveeffort to convert pure credit to thrift-cum-credit soci-eties. In this form, it is expected that there would benatural incentives for good governance. This visionhas been largely preserved in the reform package thathas now been worked out. However, the process oforganic growth that this entails is likely to constrainthe ability of the co-operatives to quickly scale uptheir operations.
8.4.53 The Vaidyanathan Committee has recom-mended liquidation of the non-viable and defunctPrimary Agricultural Co-operatives (PACs). The exactmodality of liquidation, however, has not been speltout. As the number of PACs to be liquidated is quitelarge, transitional arrangements need to be put in placeto maintain the ground-level credit flow. Mergers withhealthy PACs or take-over by neighbouring PACs mayadversely affect the financial performance and burdenthe functioning of the taking-over PACs. A bettersolution lies in development of new PACs under theModel Act suggested by the Vaidyanathan Committee.However, this would be a time-taking but a sustainableoption in the long run.
8.4.54 Co-operatives offer high rates of interest on de-posits. Co-operatives also suffer from high transaction

Services 269
costs owing to over-staffing and salaries unrelatedto the magnitude of business. High-risk costs ariseon account of low recovery levels, lack of adequaterisk mitigation systems and procedures, absence ofappropriate credit appraisal and monitoring, and over-exposure to agricultural lending. Actual repaymentsare influenced by ad hoc government decisions tosuspend, delay, or even waive recovery. The revivalpackage, significantly, does not disempower the StateGovernments from giving directives to the creditco-operatives. These powers have been used often inthe past to subject the co-operatives to commerciallyunsound decisions. The costs of funds are also high asPACs depend on borrowings from the upper tierco-operatives. Lack of information about credit wor-thiness of the clients further compounds the problem.The lending rates need to cover cost of funds, transac-tion costs, and risk costs. While the VaidyanathanCommittee has identified these factors that increasethe cost of co-operative credit operations, it has notadequately suggested mechanisms to reduce the asso-ciated transactions and risk costs.
8.4.55 The apprehension, therefore, is that the imple-mentation of the revival package is unlikely to pro-vide any substantial remedy to the problem of financialexclusion. This would be even truer of the productionand investment financing needs of agriculture. Thereappears to be no alternative to a vigorous increase inthe outreach and the scale of rural operations of thecommercial banks.
SCHEDULED COMMERCIAL BANKS (SCBs)/REGIONAL RURAL BANKS (RRBs)8.4.56 While the rural branch network of commer-cial banks had steadily grown in the years followingnationalization in 1969, there has been a rollback since1991. The average rural population served by a bankbranch has therefore gone up, as shown by the follow-ing numbers (see Table 8.4.8).
TABLE 8.4.8Average Population per Branch Office
1991 2005
Population per branch 13711 15680Population per rural branch 13462 16650Population per urban branch 14484 13619
8.4.57 However, there is an opinion that the existingrural branch infrastructure can be more intensivelyused so as to service a much larger customer base. Amajor recommendation of the Rangarajan Commit-tee is that the banks be given targets to add at least 250farmer accounts per year per branch. This, the Com-mittee feels, will enable covering all the unbankedfarmer households in the next five years. Prescribinga target-based approach for the commercial banksto extend their outreach in rural areas may not be aviable option until and unless banks are allowed tocharge a rate of interest that covers their cost of funds,transaction costs, and risk costs.
8.4.58 While several policy measures have been initi-ated to augment the credit flow to small and marginalborrowers, the results speak differently. During 1996and 2006, the loan outstanding for accounts upto Rs 2lakh credit has declined from 25.3% to 16.4% of bankcredit. These loans are disbursed at or below PLR. Sub-PLR lending has increased from 39% in September2004 to 82% in March 2007. These loans are essentiallydisbursed to better creditworthy corporates. However,agriculture and SSI sectors, in particular AVT and otherSSIs whose loan outstanding is more than Rs 2 lakh,are charged interest rates above PLR. This has severalimplications. First, lending at below PLR lacks trans-parency and affects both lenders and borrowers. Sec-ond, to compensate for the sub-PLR lending, othersegments are charged higher rates of interest thus lead-ing to cross-subsidization of the economically well-offborrowers by the economically poor borrowers.
8.4.59 The employment intensive and greater regionalspread of AVT and other SSIs make them an engineof inclusive growth. However, they are consideredmore risky by the banks and collaterals are insistedupon. This has been partly addressed by setting up ofa Credit Guarantee Fund Trust for SSIs. This fund guar-antees upto 75% of the credit risk subject to loan capof Rs 50 lakh per borrower. The other option to obvi-ate the need for collateral could be introducing inde-pendent rating of the borrowers and generating theircredit history.
8.4.60 Today’s small entrepreneur is tomorrow’sbig businessman, if provided appropriate financial

270 Eleventh Five Year Plan
support. The banks have to be proactive and gear uptheir risk assessment and management capacities. Theyhave to finance the first-time entrepreneurs, notwith-standing the risk, if financial inclusion is to become areality. The inevitability of some degree of failed ven-tures should not lead to unreasonable attachment ofaccountability which otherwise leads to risk aversionamongst lenders. Prudential norms need to be laiddown by the regulator to provide this comfort.
8.4.61 Along with the above, it may be necessaryto modify the priority sector lending guidelines bycreating sub-limits for lending to the weaker sections.As suggested by the NCEUS, a sub-target of 10%should be reserved for marginal and small farmerswithin the 18% reserved for agriculture. The flow ofcredit against this sub-target should be separatelymonitored. Similarly, a separate target of 10% for smalland micro enterprises, of which again 4% is reservedfor micro enterprises with a capital investment ofless than Rs 5 lakh, should be imposed and enforced.Along with the freeing of interest rate that has beenrecommended above, this would help in credit reach-ing the needy sections.
8.4.62 There have been some suggestions made that thepriority sector targets should be enforced in a differentfashion than hitherto. A suggestion that merits consid-eration is that the targets be made tradeable amongstbanks. This would have the merit of acting as means ofachieving the targets at the lowest possible cost.
8.4.63 A major step taken recently is to permit thebanks to extend their outreach through engaging busi-ness facilitators and business correspondents (BC).The banks are required to formulate their own schemesin line with the guidelines of the RBI to operationalizethese mechanisms. Though these guidelines werebrought out more than one and a half years ago, theNCEUS notes that the banks are not inclined to adoptthis model because of cost considerations. They, there-fore, suggest that some incentives may be providedto the banks, in the form of tax or other benefits, toadopt this model. The Rangarajan Committee saysthat the banking system has not yet been able to fullyappreciate the business gains that could accrue fromadopting the model. It adds that discussions with a
cross-section of bankers reveals that the muted re-sponse is, in part, due to disinclination on the part ofthe banks to absorb the costs involved on grounds ofits impact on the viability of operations.
8.4.64 Prohibition on banks to charge more than thePLR on loans less than Rs 2 lakh has made the BCmodel unworkable for provision of micro credit. Evenif the banks were willing to absorb the difference be-tween their PLR and their cost of funds, margins wouldnot be adequate to compensate the BCs to cover thecosts of originating, monitoring, and collecting loans.Second, under the model, the bank is responsible foromissions and commissions of the BC. Third, the lackof IT connectivity (owing to cost considerations)would make it difficult to report and incorporate theBC’s transactions in the books of the bank by the endof the next working day. Due to these reasons, the BCmodel has received a rather lukewarm responsefrom the banks. However, this seems to be the bestavailable option for increasing financial inclusion.Apart from removing interest rate controls, a system-atic programme for capacity building for the BCs, es-tablishing robust procedures for monitoring theirperformance and rating them, and the building up ofIT connectivity, perhaps even by sharing it amongstbanks so as to reduce costs, are all essential for thismodel to succeed.
8.4.65 The industry feels that the financial sector par-ticipants would find it difficult to expand intounderserved areas in the absence of appropriate pay-ment processing infrastructure. More than 80% ofIndia’s financial transactions are processed in physicalcash. Cash as means of payment has a large cost interms of handling, transaction processing, holding,and risk of loss. Looking ahead, card-based solutionsare likely to emerge as the key mechanism for deliver-ing financial services to the unbanked. There is there-fore a need to create a national payments system withparticipation by all banks, reduce transaction costs,and substantially increase the deployment for Pointof Sales terminals and their utilization for both high-and small-value payments.
8.4.66 India has achieved good mobile penetrationboth geographically and in terms of socio-economic
Services 271
classes. The total number of mobile phone connec-tions has already greatly exceeded the number of bankaccounts. South Africa has reportedly pioneeredthe large-scale use of mobiles for payment. Japan,South Korea, and other countries also are said to beusing this method. Enabling mobile paymentswould facilitate cheaper payment processing, wide geo-graphic coverage, online payments straight throughprocessing, and financial inclusion. The mobile phonecan be used as a device to transfer funds and makepayments from a bank account using appropriateauthentication protocols.
TRADITIONAL MONEYLENDERS8.4.67 The All-India Debt and Investment Survey(NSS 59th Round) has revealed that the share of insti-tutional agencies in the total cash dues of urban house-holds had increased from 72% in 1991 to 75.1% in2002 and that of moneylenders had also increasedduring the period from 10.2% to 14.1%. In the caseof rural households on the other hand, the share ofinstitutional agencies had in fact declined from64% in 1991 to 57.1% in 2002. And more significantly,the share of moneylenders had increased in thesame period from 17.5% to 29.6% in the case of ruralhouseholds.
8.4.68 Despite measures to extend institutional creditespecially in the rural areas, the dependence on mon-eylenders has only increased. Thus there is a case tolook at the possibility of using moneylenders for pro-viding credit within a regulated framework. Usuriousrates of interest and coercive practices are a reality thatneeds to be appropriately addressed.
8.4.69 International experience also suggests thatmoneylenders perform similar activities all over theworld both in developed and developing countries.Internationally, the nature of moneylending laws isregulatory. The emphasis of such laws is on protectingthe interests of the borrowers by capping the rate ofinterest and curbing coercive recovery practices.
8.4.70 The technical group of the RBI to review thelegislations on moneylending in its report has alsorecommended that registration of the moneylendersshould be made compulsory and a penalty should
be imposed on those conducting business withoutregistration. It has also recommended that the StateGovernments should stipulate the maximum rate ofinterest that could be charged by the moneylenders.The group has also recommended a model legislationfor adoption by the State Government to regulate themoneylenders. The legislation provides incentivesfor registration and mainstreaming the activity ofmoneylending. It also provides for penalties for viola-tion of its provisions as well as disincentives to thosewho circumvent the law in the form of more stringentaction against unregistered lenders.
8.4.71 A major issue that needs to be resolved here isthe regulatory capacity of State Governments, who arethe competent authorities for this purpose. A possiblesolution could be to outsource the regulatory functionto the banking system. The incentive of obtaining creditfrom banks to enlarge their businesses could be usedto overcome the fear of costs associated with registra-tion. The government could consider mainstreamingmoneylending by instituting an effective regulatoryframework as has been done worldwide.
Building up the Demand Side8.4.72 Perhaps the greatest benefits of public policyinitiatives towards the financial inclusion are in thearea of creating systemic infrastructure for provisionof credit and other financial services. Specific measuresinclude creating credit registries, national identifica-tion numbers, payment systems, electronic commod-ity and auction markets, and weather measurementsystems—all of which are public goods which wouldhelp stimulate economic activity. Other measures thatwould help generate demand for financial services in-clude public investment in rural infrastructureprogrammes, vocational training programmes, andmeasures to improve market linkages that help microentrepreneurs find reliable channels for marketingtheir products and services.
New Initiatives8.4.73 There are certain NGOs, societies, trusts, andco-operative societies operating in the micro financialsector that are engaged in providing credit and otherfinancial services to the economically active low-in-come people especially women, poor households, and

272 Eleventh Five Year Plan
their micro enterprises. However, the financial activi-ties undertaken by such organizations lack a formalstatutory framework. It was, therefore, considered ex-pedient to provide a formal statutory frameworkfor the promotion, development, and orderly growthof the micro credit sector. Accordingly, the MicroFinancial Sector (Development and Regulation) Bill2007 was introduced in the Lok Sabha on 20 March2007. Some of the important features of the Bill aregiven below:
• Entrust the function of development and regula-tion of the micro financial sector to the NABARD.
• Define various entities engaged in the activity ofmicro finance such as co-operative societies, mu-tual benefit societies, or mutually aided societies reg-istered under any State enactments or multi-Stateco-operative societies registered under the Multi-State Co-operative Societies Act, 2002; societies reg-istered under the Societies Registration Act 1860;or any other State enactments governing such soci-eties and a trust created under the Indian Trust Act,
1882 or public trust registered under any Stateenactments, that will be governed by the regulatoryframework that is proposed to be set up.
• Define various categories of beneficiaries ofmicro financial services as eligible clients includingSHGs or joint liability groups of such eligibleclients.
• Provide for extending micro financial servicesto eligible clients by way of financial assistancesubject to ceilings to be prescribed and such otherfinancial services as may be specified by NABARD.
• Provide for constitution of Micro Finance Devel-opment Council to advise the NABARD on formu-lation on policies, schemes, and other measuresrequired in the interest of orderly growth and de-velopment of the micro finance sector.
• Provide for constitution of Micro Finance Devel-opment and Equity Fund to be utilized for thedevelopment of the micro finance sector.
8.4.74 The Bill is currently under examination withthe Standing Committee on Finance.

(Ann
exur
e 8.
2.1
cont
d.)
AN
NE
XU
RE
8.2
.1F
inan
cial
and
Phy
sica
l Per
form
ance
of T
ouri
sm d
urin
g th
e Te
nth
Fiv
e Ye
ar P
lan
(Rs
in c
rore
)
S.Sc
hem
es/
Fin
anci
al P
erfo
rman
ceP
hysi
cal
Perf
orm
ance
No.
Pro
gram
mes
Ten
th P
lan
Ten
th P
lan
Ou
tlay
BE
RE
Act
ual
Exp
.Ta
rget
sA
chie
vem
ents
IC
entr
al S
ecto
r Sc
hem
es
1E
xter
nal
ly A
ided
Pro
ject
s50
.00
40.5
040
.50
31.2
4
2A
ssis
tan
ce t
o IH
Ms/
FCIs
etc
.11
0.00
127.
5012
7.50
135.
43
3C
apac
ity
Bu
ildin
g fo
r se
rvic
e24
.00
31.5
031
.50
12.2
5pr
ovid
ers
4O
vers
eas
prom
otio
n a
nd
500.
0048
5.00
485.
0050
9.34
Pub
licit
y in
clu
din
g M
arke
tD
evel
opm
ent
Ass
ista
nce
(MD
A )
To e
nsu
re e
ffec
tive
pla
n p
rep
arat
ion
an
dsu
per
visi
on o
n e
xecu
tion
of
Aja
nta
-Ello
raC
onse
rvat
ion
an
d T
ou
rism
Dev
elo
pm
ent
Pro
ject
Ph
ase-
II a
nd
Dev
elo
pm
ent
of
Bu
dd
his
t C
ircu
it p
roje
cts
in U
P w
ith
th
eas
sist
ance
of
Jap
an B
ank
for
Inte
rnat
ion
alC
oope
rati
on (
JBIC
).
To p
rovi
de fi
nan
cial
ass
ista
nce
for i
mpr
ovin
gan
d u
pgr
adin
g o
f ex
isti
ng
infr
astr
uct
ure
of I
HM
s/FC
Is/I
ndi
an I
nst
itu
te o
f To
uri
sman
d Tr
avel
Man
agem
ent
(IIT
TM
s).
To
co
nd
uct
tr
ain
ing
pro
gram
mes
fo
rpa
rtic
ipan
ts t
here
by q
ual
itat
ivel
y im
prov
ing
tou
rism
man
pow
er i
n t
he c
oun
try.
To p
rom
ote
tour
ism
acr
oss t
he g
lobe
thro
ugh
glob
al c
amp
aign
s, f
airs
an
d f
esti
vals
, ro
adsh
ows
etc.
Infr
astr
uctu
re u
pgr
adat
ion
of B
udd
hist
cir
cuit
sha
s be
en ta
ken
in a
big
way
thro
ugh
iden
tifi
ca-
tion
of 2
2 im
por
tan
t Bu
ddhi
st s
ites
thro
ugh
out
the
cou
ntr
y. M
oT h
as e
nte
red
into
an
agr
eem
ent
for
un
der
taki
ng
infr
astr
uct
ure
dev
elo
pm
ent
at B
ud
dh
ist
site
s o
f S
arn
ath
, K
ush
inag
ar,
Kap
ilvas
tu, S
hra
vast
i, an
d Sa
nki
sa i
n U
P, w
ith
JBIC
for
a lo
an a
ssis
tan
ce o
f Rs
395.
63 c
rore
for
tota
l pro
ject
of
Rs
680
cro
re.
Ass
ista
nce
was
ext
ende
d to
22
IHM
s an
d 7
FCIs
follo
win
g N
atio
nal
Cou
nci
l’s c
urr
icu
lum
.
Con
du
cted
tra
inin
g to
th
e p
erso
ns
wh
o a
reen
gage
d in
the
un
orga
niz
ed s
ecto
rs a
nd
com
ein
con
tact
wit
h a
maj
or s
egm
ent o
f the
tour
ists
.M
ore
than
400
00 p
erso
ns
wer
e gi
ven
tra
inin
gu
nde
r th
is C
BSP
sch
eme.
Glo
bal
ca
mp
aign
s an
d
mar
ket
spec
ific
cam
pai
gns
as a
par
t of
th
e ‘I
ncr
edib
le I
nd
ia’
cam
paig
n in
the
ove
rsea
s m
arke
ts w
ere
carr
ied
out.
Par
tici
pat
ed i
n i
nte
rnat
ion
al t
rad
e fa
irs
and
exh
ibit
ion
s an
d o
rgan
ized
ro
ad s
ho
ws/
Ind
ia P
rese
nta
tio
ns
in i
mp
ort
ant
ove
rsea
sm
arke
ts to
sho
wca
se th
e va
ried
In
dian
tou
rism
prod
uct
s.

5D
omes
tic
prom
otio
n a
nd
230.
0017
2.00
172.
0017
3.40
publ
icit
y in
clu
din
gh
ospi
talit
y
6In
cen
tive
to
acco
mm
odat
ion
45.0
047
.00
47.0
047
.50
infr
astr
uct
ure
7C
onst
ruct
ion
of
build
ing
for
0.00
16.0
016
.50
13.8
0II
SM a
t G
ulm
arg,
Kas
hmir
.
8M
arke
t re
sear
ch i
ncl
udi
ng
20.0
015
.50
15.5
032
.22
20 y
ears
per
spec
tive
pla
n.
9A
ssis
tan
ce f
or L
arge
Rev
enu
e98
.00
122.
0092
.00
34.9
6G
ener
atin
g P
roje
cts
10C
ompu
teri
zati
on a
nd
IT10
0.00
72.0
072
.00
52.3
3
11To
uri
sm I
nfr
astr
uctu
re0.
0030
.00
30.0
00.
00D
evel
opm
ent
Fun
d
12R
eviv
al o
f To
uris
m in
J&
K0.
009.
0016
.00
16.0
0
To p
opu
lari
ze th
e cu
ltur
e an
d n
atur
al b
eau
tyo
f d
iffe
ren
t re
gio
ns,
pil
grim
sit
es,
and
new
to
uri
sm p
rod
uct
s li
ke E
co-t
ou
rism
,A
dven
ture
an
d R
ural
Tou
rism
, etc
.
To c
reat
e b
ud
get
acco
mm
od
atio
n i
n t
he
cou
ntr
y by
pro
vidi
ng
subs
idie
s/in
cen
tive
s.
To u
pgr
ade
the
Inst
itut
e w
ith
con
stru
ctio
nof
bu
ild
ing
and
pro
vid
ing
mac
hin
ery
and
othe
r eq
uip
men
ts.
To c
ond
uct
Mas
ter
Pla
ns/
DP
Rs
(Det
aile
dP
roje
ct R
epor
t),
Surv
ey/S
tud
y re
por
ts a
nd
tou
rism
sta
tist
ics
publ
icat
ion
s su
ppor
ted
ondi
ffer
ent a
spec
ts o
f tou
rism
to p
rovi
de in
puts
to p
olic
ymak
ers.
To
p
rom
ote
la
rge
reve
nu
e ge
ner
atin
gto
uri
sm p
roje
cts
in P
PPs
an
d in
par
tner
ship
sw
ith
oth
er g
over
nm
ent/
sem
i-go
vern
men
tag
enci
es.
Eff
ecti
ve u
se o
f IT
for
exc
lusi
ve p
rom
otio
nan
d
pu
bli
city
, an
d
stre
amli
nin
g d
ata
colle
ctio
n a
nd
upd
atin
g th
rou
gh a
ppro
pria
teha
rdw
are
and
soft
war
e.
To c
reat
e em
ploy
men
t, se
lf e
mpl
oym
ent,
and
revi
val o
f ec
onom
ic a
ctiv
itie
s.
The
me-
base
d do
mes
tic
med
ia c
ampa
ign
s, m
ass
soci
al a
war
enes
s p
rogr
amm
es,
pro
du
ctio
n o
fpu
blic
ity
mat
eria
l an
d co
llate
rals
, wer
e ca
rrie
do
ut
and
cen
tral
fin
anci
al a
ssis
tan
ce w
asex
ten
ded
to S
tate
s/U
Ts f
or f
airs
& f
esti
vals
.
Pro
vid
ed s
ub
sid
y o
n t
he
loan
tak
en b
y th
een
trep
ren
eurs
fo
r co
nst
ruct
ion
of
bu
dge
tca
tego
ry h
otel
s.
Th
e co
nst
ruct
ion
o
f b
uil
din
g is
n
ear
com
plet
ion
.
24 M
aste
r Pla
ns/
DP
Rs,
14
Surv
ey/S
tudy
repo
rts,
and
2 t
ou
rism
sta
tist
ics
pu
bli
cati
on
s w
ere
pu
blis
hed
in
dif
fere
nt
asp
ects
of
tou
rism
to
prov
ide
inpu
ts t
o p
olic
ymak
ers.
21 L
arge
Rev
enu
e G
ener
atin
g P
roje
cts
wer
esa
nct
ion
ed.
Em
phas
is h
as b
een
giv
en o
n m
axim
um
use
of
IT t
o pr
omot
e ‘I
ncr
edib
le I
ndi
a’ m
ore
aggr
es-
sive
ly th
roug
h O
nlin
e C
ampa
ign
on
Wor
ld W
ide
Web
to d
rive
traf
fic
to th
e of
fici
al w
ebsi
te o
f the
MoT
.
The
Sch
eme
was
dro
pped
Min
istr
y ha
d ex
ten
ded
a pa
ckag
e fo
r fi
nan
cial
assi
stan
ce a
nd
subs
idy
to t
he s
ervi
ce p
rovi
ders
(Ann
exur
e 8.
2.1
cont
d.)
S.Sc
hem
es/
Fin
anci
al P
erfo
rman
ceP
hysi
cal
Perf
orm
ance
No.
Pro
gram
mes
Ten
th P
lan
Ten
th P
lan
Ou
tlay
BE
RE
Act
ual
Exp
.Ta
rget
sA
chie
vem
ents
(Ann
exur
e 8.
2.1
cont
d.)
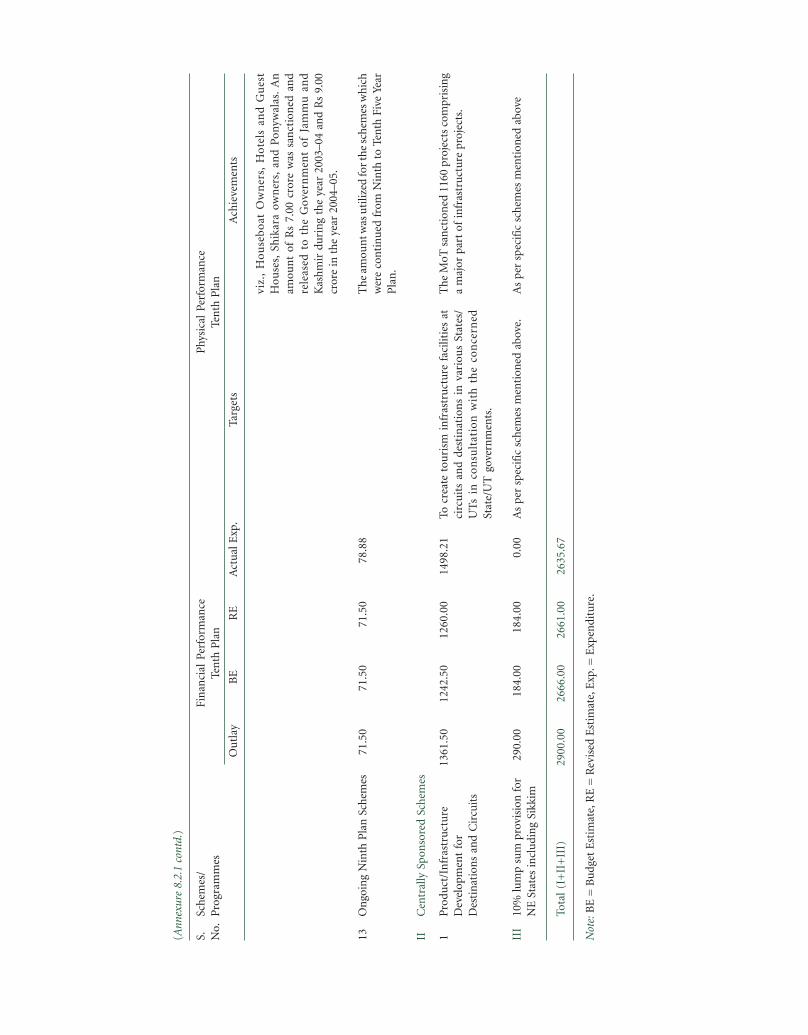
13O
ngo
ing
Nin
th P
lan
Sch
emes
71.5
071
.50
71.5
078
.88
IIC
entr
ally
Sp
onso
red
Sche
mes
1P
rodu
ct/I
nfr
astr
uct
ure
1361
.50
1242
.50
1260
.00
1498
.21
Dev
elop
men
t fo
rD
esti
nat
ion
s an
d C
ircu
its
III
10%
lum
p su
m p
rovi
sion
for
290.
0018
4.00
184.
000.
00N
E S
tate
s in
clu
din
g Si
kkim
Tota
l (I
+II
+II
I)29
00.0
026
66.0
026
61.0
026
35.6
7
Not
e: B
E =
Bu
dget
Est
imat
e, R
E =
Rev
ised
Est
imat
e, E
xp. =
Exp
endi
ture
.
viz.
, H
ou
seb
oat
Ow
ner
s, H
ote
ls a
nd
Gu
est
Hou
ses,
Sh
ikar
a ow
ner
s, a
nd
Pon
ywal
as.
An
amou
nt
of R
s 7.
00 c
rore
was
san
ctio
ned
an
dre
leas
ed t
o t
he
Go
vern
men
t o
f Ja
mm
u a
nd
Kas
hmir
dur
ing
the
year
200
3–04
an
d R
s 9.
00cr
ore
in t
he y
ear
2004
–05.
The
am
oun
t was
uti
lized
for
the
sche
mes
whi
chw
ere
con
tin
ued
fro
m N
inth
to
Ten
th F
ive
Year
Pla
n.
The
MoT
san
ctio
ned
116
0 pr
ojec
ts c
ompr
isin
ga
maj
or p
art
of in
fras
truc
ture
pro
ject
s.
As
per
sp
ecif
ic s
chem
es m
enti
oned
abo
ve
(Ann
exur
e 8.
2.1
cont
d.)
S.Sc
hem
es/
Fin
anci
al P
erfo
rman
ceP
hysi
cal
Perf
orm
ance
No.
Pro
gram
mes
Ten
th P
lan
Ten
th P
lan
Ou
tlay
BE
RE
Act
ual
Exp
.Ta
rget
sA
chie
vem
ents
To c
reat
e to
uri
sm i
nfr
astr
uctu
re f
acili
ties
at
circ
uit
s an
d de
stin
atio
ns
in v
ario
us
Stat
es/
UT
s in
co
nsu
ltat
ion
wit
h t
he
con
cern
edSt
ate/
UT
gov
ern
men
ts.
As
per
sp
ecif
ic s
chem
es m
enti
oned
abo
ve.


VPhysical Infrastructure


9Transport
9.1 INTEGRATED TRANSPORT SYSTEM9.1.1 The transport system in India comprises a num-ber of distinct modes and services, notably railways,roads, road transport, ports, inland water transport,coastal shipping, airports, and airlines. Railways androads are the dominant means of transport carryingmore than 95% of total traffic generated in the coun-try. Although other modes such as coastal shippingand inland water transport would play a greater role,the railways and roads would continue to dominatethe transport landscape in the foreseeable future.
9.1.2 It is necessary to foster the development of thevarious transport modes in an integrated manner thatwill lead to the realization of an efficient, sustainable,safe, and regionally balanced transportation system,where each mode of transport operates in its field ofeconomy and usefulness, with competitive and non-discriminatory prices that are adequate to supportprogressive development of transport infrastructureand services. This would also enable the comparativeadvantages and economic efficiencies to be properlyreflected in the user costs.
9.1.3 The liberalization of our economy has broughthome the urgency of recognizing that an efficient trans-portation system is necessary for increasing productiv-ity and enabling the country to compete effectively inthe world market. Adequacy and reliability of transportinfrastructure and services are important factorsthat contribute towards the ability of the country to
compete in the field of international trade and attractforeign direct investment. The government has amajor role to play in this sphere. Even in a marketeconomy, the framework that national governmentsprovide for the transport sector largely determines thelevel of cost and transport operations. It is, therefore,necessary to create a policy environment that encour-ages competitive pricing and co-ordination betweenalternative modes in order to provide an integratedtransport system that assures the mobility of goodsand people at maximum efficiency and minimum cost.
9.1.4 With the vision of formulating an integratedpolicy and long-term investment planning, the Plan-ning Commission has undertaken a project of con-ducting a Total Transport System Study with the helpof M/s Rail India Technical and Economic Services.This study will generate traffic flows covering the fourmajor mechanized modes of transport—railways,highways, airways, and shipping—and also forecastmode-wise traffic demand for specified horizon yearsupto 2025–26. The study will also help to analyseinter-modal transport resource costs and determineoptimal inter-modal mix.
9.2 RAILWAYS9.2.1 Indian Railways is often referred to as the life-line of the Indian economy because of its predominancein transportation of bulk freight and long-distancepassenger traffic. The network criss-crosses the nation,binding it together by ferrying freight and passengers

280 Eleventh Five Year Plan
across the length and breadth of the country. As theIndian economy moves into a higher growth trajectory,Indian Railways has also stepped up developmentalefforts and is preparing itself for an even bigger role inthe future.
REVIEW OF THE TENTH PLAN9.2.2 The Tenth Plan has seen a remarkable turnaroundin the financial performance of the Indian Railways,making it possible for it to place increased reliance oninternal resources and market borrowings for develop-ment. The actual mobilization of internal resourceswent up from a meagre Rs 3113 crore or 27% of thetotal resource mobilization in its first year to a sizeablecontribution of more than Rs 12000 crore or nearly50% of the total resource mobilization in its final year.The table in Annexure 9.2.1 also shows the markedstep up in internal resource generation in the last twoyears of the Tenth Plan, with commensurate decreasein the contribution of GBS during this period. Nota-bly, the bulk of the contribution to the GBS hasbeen on account of the Special Railway Safety Fund(SRSF), as brought out in the table in Annexure 9.2.2.Additional GBS provided through SRSF has helpedthe Railways in wiping out arrears in renewal of criticalassets that enabled improvement in availability aswell as utilization of assets, which has eventually con-tributed to the turnaround in the performance ofthe Railways.
Physical Targets and Achievements9.2.3 The Tenth Plan targets and achievements aresummarized in Table 9.2.1. Indian Railways have farexceeded the Tenth Plan projections both in passengerand freight traffic. Originating freight has shown an
average annual growth of 8.1% over the Tenth Planperiod as against 3.8% in the Ninth Plan period. Simi-larly, in BTKM, the corresponding growth in freightwas 7.4% and 3.7%. The average annual passengergrowth in the Tenth Plan was no less impressive, at4.2% in terms of the number of originating passen-gers and 7.4% in terms of the passenger kilometre ascompared to respective figures of 4.2% and 6.7% inthe Ninth Plan.
A Remarkable Performance9.2.4 The impressive achievement in freight loadingand movement—exceeding the target by 16.7%/20%—was the result of a market-focused strategy aimed atcapturing large volumes of traffic along with efficientutilization of assets and resources with associatedreductions in unit costs despite rising input costs. Themajor initiatives that contributed to enhancing thecompetitive advantage included the decision to use thecarrying capacity of the wagons optimally by increas-ing the loadability of the wagons on selected routesup to 15%, realignment of tariffs to the competitiveconditions in the market, and incentivization of load-ing in the lean season and in the empty flow direction.Incremental loading has come across-the-board fromall commodity groups, barring the expected declinein petroleum products. Major increases were seen incoal, iron ore for export and steel plants, cement, andother commodities (which include containers). TheRailways’ share in respect of commodities such ascement and steel has increased despite stiff competi-tion from roadways. This praise-worthy performanceneeds to be sustained, consolidated, and carriedforward with outcome-based enhancements in theEleventh Plan.
TABLE 9.2.1Physical Targets and Achievements
Ninth Plan Tenth Plan
(2001–02) Target for 2002–03 2003–04 2004–05 2005–06 2006–07Terminal Year
(2006–07)
Originating freight (mt) 492.5 624 518.7 557.4 602.1 666.5 728.4Freight net tonne km(billion) 333.2 396 353.2 381.2 407.4 439.6 475Originating Passengers(million) 5169.3 5885 5048.2 5202.9 5475.5 5832.4 6352.1Passenger km (billion) 494.2 625 515.4 542.1 576.6 616.6 691.8

Transport 281
Productivity9.2.5 The spurt in traffic has been supported by a con-comitant increase in the productivity of the assets. Thisquantum jump in the productivity of assets, includ-ing wagon and track utilization, has come about as aresult of various initiatives. The increase in axle loadon mineral routes, improved maintenance practices,and reduced detentions at terminals have all contrib-uted significantly to higher wagon productivity. Withthe growth in volumes and the improved productiv-ity, the unit cost of operations has been brought down.Improved productivity of assets over the Plan periodis summarized below in Table 9.2.2.
9.2.6 There is a sustained improvement in wagonutilization from 2468 net tonne kilometre (NTKM)per wagon per day in the first year of the Tenth Planto 2963 NTKM in its final year. The wagon turnroundhas come down to six days from seven days in thebeginning of the Tenth Plan and eight and a half daysin 1996–97. Track utilization improved markedly from7.74 million NTKM per route km to 9.05 millionNTKM per route km.
9.2.7 Significant improvements in managerial prac-tices have underpinned the improvements in theproductivity of human resources during the TenthPlan, which increased from 0.26 million NTKM peremployee to 0.33 million NTKM per employee by the
fourth year of the Tenth Plan while passenger km peremployee increased from 0.37 million to 0.47 millionduring the same period.
POLICY ISSUES AND STRATEGIES FOR THEELEVENTH PLAN9.2.8 Indian Railways is at the threshold of a majorchange at the beginning of the Eleventh Plan. The keychallenge before it is not attracting additional traffic,but rather meeting the accelerating demand for high-quality services imposed by a vibrant economy forwhich it has to take immediate and appropriate stepsto augment capacity and deploy it optimally throughnew investment and tariff policies. The Railwaysalso has to execute projects speedily and procureassets at a rapid pace by incorporating best practicesin project implementation, production, and procure-ment of new assets.
9.2.9 The mid-term appraisal of the Tenth Plan docu-ment had noted that the Chinese Railways is carrying4.5 times more freight than the Indian Railways, mainlydue to the larger investments made in the ChineseRailways in expanding and strengthening the infra-structure which also contributed towards improve-ments in the productivity of the Chinese Railways.Indian Railways carries more passengers than ChineseRailways, but the longer term development of theRailways in India depends crucially upon its ability to
TABLE 9.2.2Productivity Performance
Productivity Indicator Ninth Plan Tenth Plan
(2001–02) 2002–03 2003–04 2004–05 2005–06
Wagon UtilizationNTKM/wagon/day (Broad Gauge [BG]) 2223 2468 2574 2617 2872Wagon km/wagon/day (BG) 191.6 204.6 187.8 204.5 211Wagon turnround (in days) (BG) 7.2 7.0 6.7 6.4 6.1
Track UtilizationNTKM/route km (million) 7.38 7.74 8.14 8.57 9.05Passenger km/route km (million) 10.1 10.5 10.8 11.5 12.2
NTKM/Engine Day Online (Goods-BG)Diesel 167163 164713 199958 218045 279066Electric 311061 326798 352669 415244 465375
Human Resources ProductivityNTKM/employee (million) 0.24 0.26 0.28 0.31 0.33PKM/employee (million) 0.35 0.37 0.40 0.43 0.47
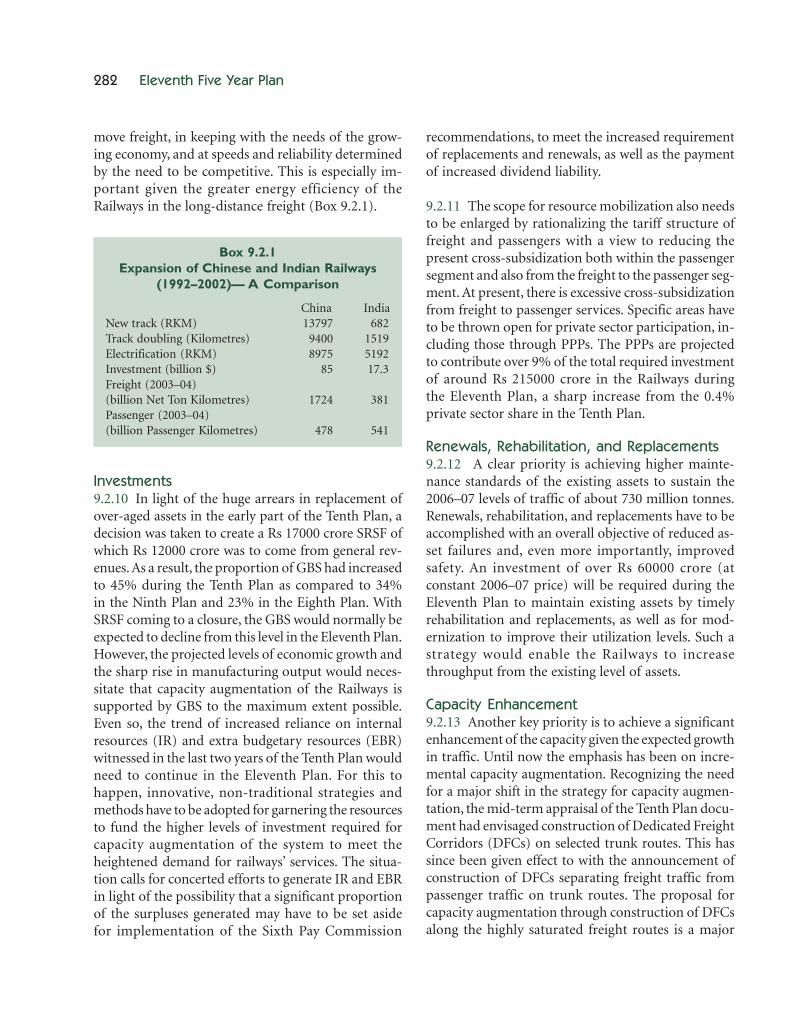
282 Eleventh Five Year Plan
move freight, in keeping with the needs of the grow-ing economy, and at speeds and reliability determinedby the need to be competitive. This is especially im-portant given the greater energy efficiency of theRailways in the long-distance freight (Box 9.2.1).
Investments9.2.10 In light of the huge arrears in replacement ofover-aged assets in the early part of the Tenth Plan, adecision was taken to create a Rs 17000 crore SRSF ofwhich Rs 12000 crore was to come from general rev-enues. As a result, the proportion of GBS had increasedto 45% during the Tenth Plan as compared to 34%in the Ninth Plan and 23% in the Eighth Plan. WithSRSF coming to a closure, the GBS would normally beexpected to decline from this level in the Eleventh Plan.However, the projected levels of economic growth andthe sharp rise in manufacturing output would neces-sitate that capacity augmentation of the Railways issupported by GBS to the maximum extent possible.Even so, the trend of increased reliance on internalresources (IR) and extra budgetary resources (EBR)witnessed in the last two years of the Tenth Plan wouldneed to continue in the Eleventh Plan. For this tohappen, innovative, non-traditional strategies andmethods have to be adopted for garnering the resourcesto fund the higher levels of investment required forcapacity augmentation of the system to meet theheightened demand for railways’ services. The situa-tion calls for concerted efforts to generate IR and EBRin light of the possibility that a significant proportionof the surpluses generated may have to be set asidefor implementation of the Sixth Pay Commission
recommendations, to meet the increased requirementof replacements and renewals, as well as the paymentof increased dividend liability.
9.2.11 The scope for resource mobilization also needsto be enlarged by rationalizing the tariff structure offreight and passengers with a view to reducing thepresent cross-subsidization both within the passengersegment and also from the freight to the passenger seg-ment. At present, there is excessive cross-subsidizationfrom freight to passenger services. Specific areas haveto be thrown open for private sector participation, in-cluding those through PPPs. The PPPs are projectedto contribute over 9% of the total required investmentof around Rs 215000 crore in the Railways duringthe Eleventh Plan, a sharp increase from the 0.4%private sector share in the Tenth Plan.
Renewals, Rehabilitation, and Replacements9.2.12 A clear priority is achieving higher mainte-nance standards of the existing assets to sustain the2006–07 levels of traffic of about 730 million tonnes.Renewals, rehabilitation, and replacements have to beaccomplished with an overall objective of reduced as-set failures and, even more importantly, improvedsafety. An investment of over Rs 60000 crore (atconstant 2006–07 price) will be required during theEleventh Plan to maintain existing assets by timelyrehabilitation and replacements, as well as for mod-ernization to improve their utilization levels. Such astrategy would enable the Railways to increasethroughput from the existing level of assets.
Capacity Enhancement9.2.13 Another key priority is to achieve a significantenhancement of the capacity given the expected growthin traffic. Until now the emphasis has been on incre-mental capacity augmentation. Recognizing the needfor a major shift in the strategy for capacity augmen-tation, the mid-term appraisal of the Tenth Plan docu-ment had envisaged construction of Dedicated FreightCorridors (DFCs) on selected trunk routes. This hassince been given effect to with the announcement ofconstruction of DFCs separating freight traffic frompassenger traffic on trunk routes. The proposal forcapacity augmentation through construction of DFCsalong the highly saturated freight routes is a major
Box 9.2.1Expansion of Chinese and Indian Railways
(1992–2002)— A Comparison
China IndiaNew track (RKM) 13797 682Track doubling (Kilometres) 9400 1519Electrification (RKM) 8975 5192Investment (billion $) 85 17.3Freight (2003–04)(billion Net Ton Kilometres) 1724 381Passenger (2003–04)(billion Passenger Kilometres) 478 541
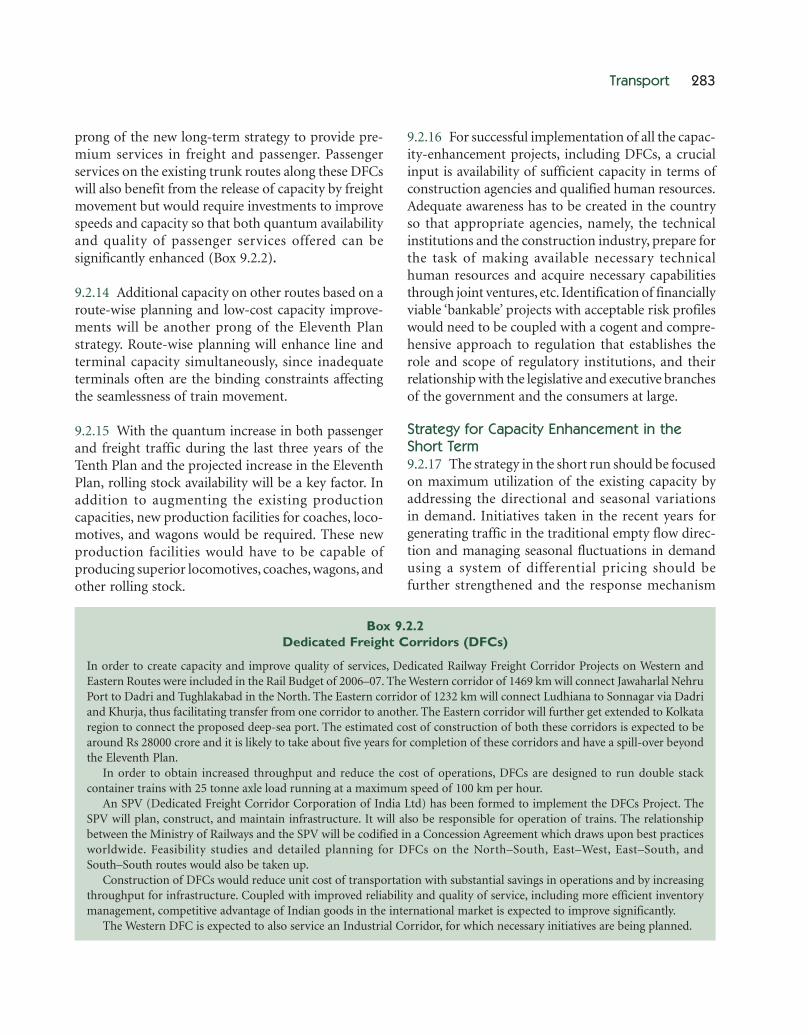
Transport 283
prong of the new long-term strategy to provide pre-mium services in freight and passenger. Passengerservices on the existing trunk routes along these DFCswill also benefit from the release of capacity by freightmovement but would require investments to improvespeeds and capacity so that both quantum availabilityand quality of passenger services offered can besignificantly enhanced (Box 9.2.2).
9.2.14 Additional capacity on other routes based on aroute-wise planning and low-cost capacity improve-ments will be another prong of the Eleventh Planstrategy. Route-wise planning will enhance line andterminal capacity simultaneously, since inadequateterminals often are the binding constraints affectingthe seamlessness of train movement.
9.2.15 With the quantum increase in both passengerand freight traffic during the last three years of theTenth Plan and the projected increase in the EleventhPlan, rolling stock availability will be a key factor. Inaddition to augmenting the existing productioncapacities, new production facilities for coaches, loco-motives, and wagons would be required. These newproduction facilities would have to be capable ofproducing superior locomotives, coaches, wagons, andother rolling stock.
9.2.16 For successful implementation of all the capac-ity-enhancement projects, including DFCs, a crucialinput is availability of sufficient capacity in terms ofconstruction agencies and qualified human resources.Adequate awareness has to be created in the countryso that appropriate agencies, namely, the technicalinstitutions and the construction industry, prepare forthe task of making available necessary technicalhuman resources and acquire necessary capabilitiesthrough joint ventures, etc. Identification of financiallyviable ‘bankable’ projects with acceptable risk profileswould need to be coupled with a cogent and compre-hensive approach to regulation that establishes therole and scope of regulatory institutions, and theirrelationship with the legislative and executive branchesof the government and the consumers at large.
Strategy for Capacity Enhancement in theShort Term9.2.17 The strategy in the short run should be focusedon maximum utilization of the existing capacity byaddressing the directional and seasonal variationsin demand. Initiatives taken in the recent years forgenerating traffic in the traditional empty flow direc-tion and managing seasonal fluctuations in demandusing a system of differential pricing should befurther strengthened and the response mechanism
Box 9.2.2Dedicated Freight Corridors (DFCs)
In order to create capacity and improve quality of services, Dedicated Railway Freight Corridor Projects on Western andEastern Routes were included in the Rail Budget of 2006–07. The Western corridor of 1469 km will connect Jawaharlal NehruPort to Dadri and Tughlakabad in the North. The Eastern corridor of 1232 km will connect Ludhiana to Sonnagar via Dadriand Khurja, thus facilitating transfer from one corridor to another. The Eastern corridor will further get extended to Kolkataregion to connect the proposed deep-sea port. The estimated cost of construction of both these corridors is expected to bearound Rs 28000 crore and it is likely to take about five years for completion of these corridors and have a spill-over beyondthe Eleventh Plan.
In order to obtain increased throughput and reduce the cost of operations, DFCs are designed to run double stackcontainer trains with 25 tonne axle load running at a maximum speed of 100 km per hour.
An SPV (Dedicated Freight Corridor Corporation of India Ltd) has been formed to implement the DFCs Project. TheSPV will plan, construct, and maintain infrastructure. It will also be responsible for operation of trains. The relationshipbetween the Ministry of Railways and the SPV will be codified in a Concession Agreement which draws upon best practicesworldwide. Feasibility studies and detailed planning for DFCs on the North–South, East–West, East–South, andSouth–South routes would also be taken up.
Construction of DFCs would reduce unit cost of transportation with substantial savings in operations and by increasingthroughput for infrastructure. Coupled with improved reliability and quality of service, including more efficient inventorymanagement, competitive advantage of Indian goods in the international market is expected to improve significantly.
The Western DFC is expected to also service an Industrial Corridor, for which necessary initiatives are being planned.

284 Eleventh Five Year Plan
institutionalized, so that policy and operations’responses are dynamic and flexible.
9.2.18 The second important strategy would be in-vestments in identified mineral routes and feederroutes to DFCs. It is envisaged that the entire 6973km of iron ore route will be upgraded for running25 tonne axle load trains during the Eleventh Planperiod. This has already started in the terminal year ofthe Tenth Plan. Track and bridge structures will bestrengthened concomitantly. It is also envisaged that4220 km of existing feeder routes joining the DFC willbe upgraded to 25 tonne axle load. With investmentsdirected into identified mineral routes, it should bepossible to switch over to 25 tonne axle load concur-rently with availability of requisite rolling stock.
9.2.19 Finally, the investments in signalling improve-ments such as automatic signalling, introduction ofintermediate block sections, block-proving axlecounters, track circuiting, etc. coupled with inductionof high power locomotives should also create addi-tional capacity in the short run at low cost. Further,the improved wagons with the higher pay-load to tareratio of around 4, as against the extant 2.6, should beinducted expeditiously to obtain the much neededadditional capacity. Switching over to mechanizedmaintenance of track by investing in track machineswould also free some of the capacity locked up inmanual maintenance of the track. Reduction in assetfailures would also be a part of the strategy to improveline capacity in the interim period.
Technology Upgradation9.2.20 To keep pace with the technological develop-ments in various aspects of the Railways sector, it isnecessary to continuously upgrade the technology. Inaddition to pursuing the measures indicated above,measures such as introducing longer trains and opti-mization of coach capacities have to be fully explored.
9.2.21 Speed differential between the freight andpassenger trains has to be narrowed down by induct-ing high-speed freight stock and upgrading freightterminals and their approaches to obtain additionalcapacity in the medium term as well as to increase thereliability of service in freight business.
9.2.22 Information technology applications hold thekey to the Railways’ sustained improvement in servicesand efficiency. Internet ticketing was introduced inAugust 2002 with the objective of providing ticketsat the doorstep of the customer. Initially it was startedin Delhi, which is now extended to over 200 cities.Further, in September 2005, e-ticketing was started asa pilot project in two trains, which is now extended toall trains. Booking of Tatkal tickets was also startedthrough Internet in December 2005.The concept of‘ticket at doorstep’ will have to be further developedfor reserved, unreserved, and sub-urban tickets. Anintegrated Railway information system on real-timebasis would be developed and implemented to pro-vide information of train movement, ticketing, facili-ties on display systems on stations and trains, as wellas through diversified media.
9.2.23 Freight Operation Information System (FOIS)which was sanctioned initially in 1984 was taken up inright earnest after detailed scrutiny in 1998–2003 andthe first module of the two modules identified, that is,Rake Management System, is fully implemented andcommissioned. Implementation of the FOIS hasreached the next stage with the implementation of thesecond module, that is, Terminal Management System,in 489 locations and benefits will now begin to accrueto customers. FOIS will have to be extended to all load-ing points and be interfaced with customers’ informa-tion systems, weigh bridges, etc. This is expected to beover during this Plan period.
9.2.24 Coach toilets are the main source of poor sani-tation in railway premises. In order to prevent dischargefrom the toilets while the train is in railway stationpremises, speed actuated controlled discharge toiletsand biodegradable toilets will be introduced in passen-ger coaches. In collaboration with IIT, Kanpur, effortsare already on to develop indigenous technology toproduce fully environment-friendly toilets to suitIndian conditions, so that the discharge from coachtoilets does not create unhygienic conditions all alongthe railway track.
Throw Forward9.2.25 The Railways has a large number of ongoingprojects, which require very large funds for completion

Transport 285
(Box 9.2.3). The requirement of fund for completingthese projects under various categories is as shown inTable 9.2.3. At current prices, the total throw forwardwould be around Rs 65000 crore. In comparison withthe position at the beginning of Tenth Plan, the maxi-mum increase has been in the areas of new lines anddoubling.
The objective is to enable assessment of profitabilityof different operations and routes, provide specific costinformation to be used for marketing purposes, andfacilitate indexing of tariffs to input costs.
9.2.27 The fare–freight ratio, that is the ratio of pas-senger fare per km and freight rate per tonne km, inIndia is among the lowest in the world, indicatingthe extent of cross-subsidization from freight topassenger (Box 9.2.4). In addition, premium passen-ger services are priced very high vis-à-vis second class.This is not a viable strategy since the Railways arecompeting with air traffic for premier segment andthe airline sector is strongly competitive. Reducingcross-subsidization within passenger fares and betweenthe fares of passenger and freight is now an urgent ne-cessity. In any case, Railways have to move towardsaligning the fares with the costs in all modes and classesof traffic.
9.2.28 With the availability of more reliable andscientific data on costs, there will be a rational basisfor arriving at costs for individual services withinthe passenger services as also for freight services.Therefore, the next logical step is to have a TariffRegulating Authority to determine rail fares on arational basis, after factoring in relevant issues ofunavoidable losses on account of uneconomic linesand sub-urban services.
TABLE 9.2.3Throw Forward of Projects
Type of Projects Estimated Throw Forward
Km Rs Crore
New lines 8132 31519Gauge conversion 7148 10417Doubling 3213 7314Electrification 1952 1080Traffic facility works 0325 2044
(nos)Metropolitan transport projects – 3820Total 56194
Box 9.2.3Throw Forward—A Way Forward
Arising from operational necessity, works on doubling,electrification, and gauge conversion are to be completedin a time-bound manner. Due to scarcity of the availableresources it is not possible to fix time frames for thecompletion of other throw forward works. However,works on new lines, accounting for almost 60% of throwforward’s value, have been accorded priority gradings as apart of the mid-term review of the Tenth Plan in order tofocus the available resources on such works which giveimmediate benefits and also meet national priorities. Allpending works were, thus, categorized in order of theirimportance into four categories, and higher outlays arebeing provided to ‘last mile’ projects, ‘operationally re-quired’ projects, projects of strategic importance, andprojects taken up on cost-sharing basis. This has alreadystarted showing results with physical achievements match-ing the financial outlays, especially in respect of gaugeconversion works.
Box 9.2.4Fare–Freight Ratio of World Railways
Source: World Bank Study.
1.6
1.4
1.2
1
0.8
0.6
0.4
0.2
0
Ban
glad
esh
Indo
nes
ia
Kor
ea
Mal
aysi
a
Tha
ilan
d
Vie
tnam
Ph
illip
ines
Chi
na
Indi
a
Paki
stan
Sri L
anka
Au
stra
lia
Har
are
Gre
eceTariff Regulating Mechanism
9.2.26 The Indian Railways has embarked upon areview of its accounting policies and practices to in-troduce a fully computerized accounting and MISso as to generate costing data on commercial lines.
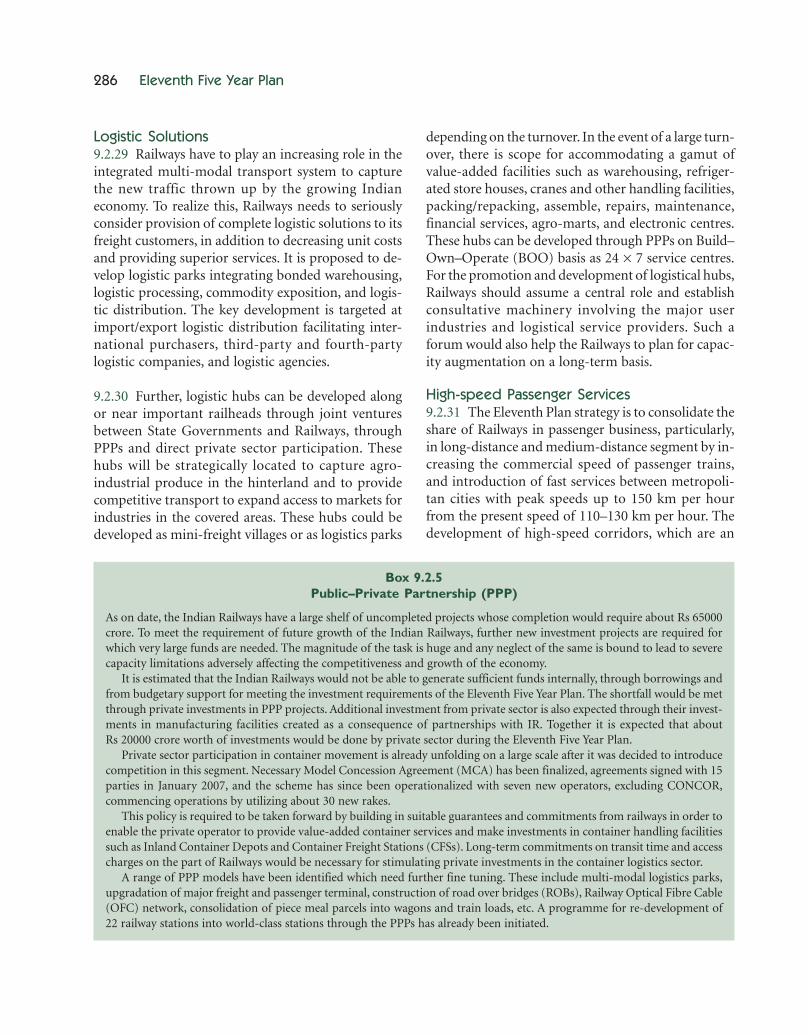
286 Eleventh Five Year Plan
Logistic Solutions9.2.29 Railways have to play an increasing role in theintegrated multi-modal transport system to capturethe new traffic thrown up by the growing Indianeconomy. To realize this, Railways needs to seriouslyconsider provision of complete logistic solutions to itsfreight customers, in addition to decreasing unit costsand providing superior services. It is proposed to de-velop logistic parks integrating bonded warehousing,logistic processing, commodity exposition, and logis-tic distribution. The key development is targeted atimport/export logistic distribution facilitating inter-national purchasers, third-party and fourth-partylogistic companies, and logistic agencies.
9.2.30 Further, logistic hubs can be developed alongor near important railheads through joint venturesbetween State Governments and Railways, throughPPPs and direct private sector participation. Thesehubs will be strategically located to capture agro-industrial produce in the hinterland and to providecompetitive transport to expand access to markets forindustries in the covered areas. These hubs could bedeveloped as mini-freight villages or as logistics parks
depending on the turnover. In the event of a large turn-over, there is scope for accommodating a gamut ofvalue-added facilities such as warehousing, refriger-ated store houses, cranes and other handling facilities,packing/repacking, assemble, repairs, maintenance,financial services, agro-marts, and electronic centres.These hubs can be developed through PPPs on Build–Own–Operate (BOO) basis as 24 × 7 service centres.For the promotion and development of logistical hubs,Railways should assume a central role and establishconsultative machinery involving the major userindustries and logistical service providers. Such aforum would also help the Railways to plan for capac-ity augmentation on a long-term basis.
High-speed Passenger Services9.2.31 The Eleventh Plan strategy is to consolidate theshare of Railways in passenger business, particularly,in long-distance and medium-distance segment by in-creasing the commercial speed of passenger trains,and introduction of fast services between metropoli-tan cities with peak speeds up to 150 km per hourfrom the present speed of 110–130 km per hour. Thedevelopment of high-speed corridors, which are an
Box 9.2.5Public–Private Partnership (PPP)
As on date, the Indian Railways have a large shelf of uncompleted projects whose completion would require about Rs 65000crore. To meet the requirement of future growth of the Indian Railways, further new investment projects are required forwhich very large funds are needed. The magnitude of the task is huge and any neglect of the same is bound to lead to severecapacity limitations adversely affecting the competitiveness and growth of the economy.
It is estimated that the Indian Railways would not be able to generate sufficient funds internally, through borrowings andfrom budgetary support for meeting the investment requirements of the Eleventh Five Year Plan. The shortfall would be metthrough private investments in PPP projects. Additional investment from private sector is also expected through their invest-ments in manufacturing facilities created as a consequence of partnerships with IR. Together it is expected that aboutRs 20000 crore worth of investments would be done by private sector during the Eleventh Five Year Plan.
Private sector participation in container movement is already unfolding on a large scale after it was decided to introducecompetition in this segment. Necessary Model Concession Agreement (MCA) has been finalized, agreements signed with 15parties in January 2007, and the scheme has since been operationalized with seven new operators, excluding CONCOR,commencing operations by utilizing about 30 new rakes.
This policy is required to be taken forward by building in suitable guarantees and commitments from railways in order toenable the private operator to provide value-added container services and make investments in container handling facilitiessuch as Inland Container Depots and Container Freight Stations (CFSs). Long-term commitments on transit time and accesscharges on the part of Railways would be necessary for stimulating private investments in the container logistics sector.
A range of PPP models have been identified which need further fine tuning. These include multi-modal logistics parks,upgradation of major freight and passenger terminal, construction of road over bridges (ROBs), Railway Optical Fibre Cable(OFC) network, consolidation of piece meal parcels into wagons and train loads, etc. A programme for re-development of22 railway stations into world-class stations through the PPPs has already been initiated.

Transport 287
environment-friendly solution for high-speed passen-ger transport, will be explored on selected routes. Thiswill be done through PPP route. Speeding up deliveryof passenger services by utilizing Mainline ElectricMultiple Unit (MEMU) and Diesel Electric MultipleUnit rakes would also be pursued with greater vigour.Trains would be augmented to 24 coaches on allimportant sectors.
Terminal Facilities9.2.32 Terminal capacity is an important determinantof the carrying capacity affecting the flow of passen-ger and freight trains. Full benefits of the line capacityworks cannot be derived until terminal constraints areremoved. In order to make Indian Railways a world-class railway system, substantial improvements to theterminal facilities are required.
World-class Stations9.2.33 Most of the railway stations and passengerterminals on the Indian Railway network were builtseveral years back and are suffering from severeinfrastructural inadequacies in handling the passen-gers. As the stations occupy the prime land in the heartof cities, they offer promising possibilities for theirre-development by leveraging a part of the real estatedevelopment potential. A total of 22 stations have beenidentified which are located in metropolitan cities andmajor tourist centres for development through PPProute. The preparatory work for New Delhi and Patnastations through appointment of consultants hasalready been taken in hand.
Safety and Security9.2.34 Improved safety is best achieved by upgradingtechnological aids together with improving reliabilityof assets, while minimizing human dependence.Elimination of collision through use of anti-collisiondevices, adoption of fire-proof coaches to reducefire accidents, crash worthy coaches to reduce fatali-ties in case of accidents, and reducing level crossingaccidents are all part of this Plan. Enhanced trainingto impart better skills in O&M of assets will also bethe focus during the Plan. In order to improve thesecurity of the passengers in general, and women andchildren in particular, efforts will be made to empowerthe Railway Protection Force by providing them
modern equipment and weaponry as also throughbetter training facilities and upgrading the informa-tion system.
PHYSICAL TARGETS FOR THE ELEVENTH PLAN
Freight Traffic9.2.35 The freight traffic projections for the terminalyear of the Eleventh Plan have been pegged at 1100million tonnes of originating freight and 702 billiontonne km (BTKM) of transportation output. The pro-jections for freight traffic are given in Table 9.2.4.
TABLE 9.2.4Projection of Freight Traffic in the Eleventh Five Year
Plan vis-à-vis Achievements in the Ninth and Tenth Plans
2001–02 2006–07 2011–12
Originating freight 492.5 728.4 1100(million tonnes) (47.9)# (51.0)#
Freight tonne km 332.2 475 702(43.0)# (47.8)#
Note: # % increase over the previous Plan.
Passenger Traffic9.2.36 Passenger traffic is expected to grow at a rateof about 5.5%. The projections for passenger trafficare given in Table 9.2.5. The Eleventh Plan will focuson reducing the cost of operations, developing attrac-tive service packages, and adopting competitive pric-ing to safeguard the market share of upper-class railtravel against airlines.
TABLE 9.2.5Projection of Passenger Traffic in the
Eleventh Five Year Plan vis-à-visAchievements in the Ninth and Tenth Plans
2001–02 2006–07 2011–12
Originating passengers 5169.3 6352.1 8400(million) (22.9)# (32.2)#
Passenger km (billion) 494.2 691.8 942(40.0)# (36.2)#
Note: # % increase over the previous Plan.
9.2.37 To cater to the projected annual growth of non-sub-urban traffic at 8%–9%, it would be necessary toexpand supply by increase in train services and augmen-tation of seating capacity of trains. Augmentation oftrain composition to 24 coaches, started in the TenthPlan, would be continued and extended to other sectors.

288 Eleventh Five Year Plan
Bridges9.2.38 There are 127768 bridges of Indian Railways.Of these, 44% are more than 100 years old. Railwayswill undertake repair, rehabilitation, and rebuildingof bridges on the basis of their physical condition asascertained during annual inspections.
Signalling and Telecommunication9.2.39 More than 10000 Route Kilometres (RKM) stillhas obsolete overhead alignment-based communica-tion system on certain routes. It is planned to speedilyreplace it with an Optical Fibre Cable (OFC) and quadcable-based communication system.
Electrification9.2.40 During the Eleventh Plan about 3500 km oftrack will be electrified which is nearly double the TenthPlan achievement of about 1800 km.
Energy Management9.2.41 For the first time in the history of Indian Rail-ways, direct power supply from the NTPC has beenobtained for the Ghaziabad–Kanpur section yieldingsubstantial savings of about Rs 50 crore per annumwith relatively small investment of Rs 68 crore.Further, Railways is also exploring the possibilityof buying power from NTPC or from other powerutilities, through tariff-based competitive bidding,under Open Access System. Setting up of a 1000 MWcaptive generation power plant at Nabinagar inBihar, a joint venture with NTPC, is also approvedwhich is expected to be commissioned during thisPlan period. To further the cause of clean and greenenergy, a 10 MW wind energy plant is being set upat Chennai to provide captive power to a Railwayproduction unit.
Rolling Assets9.2.42 Technological upgradation and modernizationof rolling stock is a key element of the plan for rollingassets. Universal switch-over to 22.9 tonne axle loadwagons from the present axle load of 21.3 tonne willlead to improved loadability of the wagons. Efforts willbe directed to bring lighter and corrosion-resistantmaterial to improve the payload to the tare ratio of wag-ons. Railways are also planning to introduce specialtypes of wagons for movement of automobiles, bulk
cement, fly ash, and hazardous chemicals. During theEleventh Plan the proportion of high horsepowerlocomotives will be increased. The requirements areshown in Table 9.2.6.
TABLE 9.2.6Eleventh Five Year Plan—Requirement for Rolling Stock
Tenth Plan Eleventh
Target Actual Plan
Target
Wagons (nos in FWUs) 65000 90554 155000Electric locos (nos) 343 524 1800Diesel locos (nos) 444 622 1800BG conventional Coaches (VUs) 9160 10789 17500EMUs/DEMUs/MEMUs (VUs) 2715 1413 5000
Note: EMUs = Electric Multiple Units; FWUs = Four WheelerUnits; VUs = Vehicle Units.
Metropolitan Transport Projects9.2.43 The sub-urban services would require separa-tion from main line systems in places like Mumbai. Theemphasis in sub-urban services would be to increasepeak time services and augment trains to 12 car rakes.
9.2.44 The Mumbai sub-urban services are severelystrained and will be augmented with the capacity ad-ditions as part of the Mumbai Urban Transport Project(MUTP) works. The introduction of air-conditionedsub-urban coaches/trains will also be considered, ifpossible, through PPPs.
9.2.45 Mumbai Rail Vikas Corporation Ltd typemodel which is implemented for rail component ofPhase II of the MUTP, wherein the State Governmentof Maharashtra has agreed for financing on the basisof Peak Cash Deficit Funding (a kind of viability gapfunding [VGF] wherein the gap in debt service liabil-ity and the surcharge collection levied for servicing thedebt is met by the concerned State Government)should be tried out for other sub-urban systems inChennai, Kolkata, and Delhi. The first step would beto form a separate SPV for each of these sub-urbansystems with the necessary mandate for moderniza-tion and upgradation of the existing system.
Physically Challenged and Senior Citizens9.2.46 All mail and express trains would be providedwith specially designed coaches which have separate

Transport 289
compartments and suitably designed toilets for thephysically challenged and senior citizens. In addition,trains having air-conditioned accommodation wouldalso be provided with air-conditioned compartmentsfor physically challenged persons.
North East Region (NER)9.2.47 Providing rail connectivity to all States in theNER is a national priority. It has been decided tocreate a dedicated fund for the National Projects ofNorth East with 25% contribution from the GBS ofRailways and the remaining 75% to be provided asadditionality from the general revenues. With thesescaled-up funds, Railways has been directed to ensurecompletion of all the sanctioned works within theEleventh Plan period.
RESOURCE MOBILIZATION9.2.48 For the economy to grow at 9% per annum overthe Eleventh Plan period, it is targeted to increase theGCF in the infrastructure from 5% of GDP at the startof the Tenth Plan to around 9% at the end of theEleventh Plan. For this to be achieved, private sectorparticipation in a big way is imperative. The areasidentified for private sector participation includenew manufacturing units, multi-modal logistics parks,construction of high-speed passenger corridors, induc-tion of privately owned rolling stock of containeroperators, commercial development of land and airspaces, port connectivity works of the private ports,ore lines for steel plants, upgradation of major freightand passenger terminals, construction of road overbridges (ROBs), and railway OFC network.
9.2.49 To garner additional internal resources forbridging the gap between the projected requirementand the availability of resources, Railways may con-sider levying a ‘developmental surcharge’ on passen-ger as well as freight traffic to fund the DFCs as alsoupgradation of existing network to run high-speedpassenger trains.
9.2.50 The total projected outlay for the EleventhPlan for the Ministry of Railways is Rs 194263 croreat 2006–07 price (Rs 219717.36 crore at current price)which includes Rs 44263 crore of GBS at 2006–07 price(Rs 50063.36 crore at current price) including Rs 3750
crore at 2006–07 price (Rs 4241.36 crore at currentprice) of cess accruals. The scheme-wise break up ofthe GBS at current prices is given in the Appendix(Volume III). In addition, the sector is expected togenerate private sector investment of Rs 20000 croreduring this period. Further, the additional GBS neededfor the National Projects of J&K and North East dur-ing the Eleventh Plan period would be of the order ofRs 12000 crore and this would be made availableduring the course of the year, as in the past. This shouldmeet the requirement of Railways. However, if there isa need to further enlarge the Plan size, this would beaccomplished by mobilizing necessary additional IEBRand private investments during the course of imple-mentation of the Plan.
9.3 ROADS9.3.1 A good road network is a critical infrastructurerequirement for rapid growth. It provides connectiv-ity to remote areas; provides accessibility to markets,schools, and hospitals; and opens up backward regionsto trade and investment. Roads also play an importantrole in inter-modal transport development, establish-ing links with airports, railway stations, and ports.
9.3.2 India has one of the largest road networks in theworld, of 33.14 lakh km, consisting of (i) national high-ways (NHs), (ii) State highways (SHs), (iii) major dis-trict roads (MDRs), and (iv) RRs that include otherdistrict roads and village roads. NHs with a length of66590 km comprise only 2.0% of the road network butcarry 40% of the road-based traffic. SHs with a lengthof about 137000 km and MDRs with a length of 300000km together constitute the secondary system of roadtransportation which contributes significantly to thedevelopment of the rural economy and industrialgrowth of the country. The secondary system alsocarries about 40% of the total road traffic, although itconstitutes about 13% of the total road length. RRs,once adequately developed and maintained, hold thepotential to provide rural connectivity vital for gener-ating higher agricultural incomes and productiveemployment opportunities besides promoting accessto economic and social services.
9.3.3 Despite its importance to the national economy,the road network is grossly inadequate in various

290 Eleventh Five Year Plan
respects. It is unable to handle high traffic density andhigh speeds at many places and has poor riding qual-ity. Besides speedy implementation of the GoldenQuadrilateral (GQ) and the North–South and East–West (NS–EW) corridors, addressing the deteriorationof large stretches of NHs and other improvements inthe road network are, therefore, to be accorded highpriority in the planning process.
REVIEW OF THE TENTH PLAN9.3.4 Against an outlay of Rs 59490 crore in theTenth Plan for the road sector, the expenditure wasRs 42577.43 crore (Rs 48593.95 crore at current price).The overall financial and physical performance is givenin Annexure 9.3.1. The scheme-wise and year-wiseoutlay and expenditure are given in Annexure 9.3.2.
NATIONAL HIGHWAYS (NHS)9.3.5 In absolute terms, there has been considerablegrowth in the NHs network since Independence. Table9.3.1 details the various achievements over select peri-ods and Annexure 9.3.3 provides Plan-wise details ofincrease in the NHs network.
9.3.6 The progress of four-laning, two-laning,strengthening of roads, and construction of bridgesduring the Tenth Plan period has been satisfactory,keeping in view the availability of funds. There has,however, been some shortfall in construction of by-passes, primarily due to the time-consuming processof land acquisition and shifting of utilities in thecase of bypasses. A large number of deficiencies, how-ever, remain in the network, in terms of inadequate
capacity, insufficient pavement thickness, weak, nar-row and distressed bridges/culverts, ROBs, etc. Annex-ure 9.3.1 provides an overview of the physical targetsand achievements of normal NH works, Border RoadsDevelopment Board (BRDB) works, and works by theNHAI during the Tenth Plan period.
9.3.7 Despite the progress reported above, the NHs arenot what they should be. Only 12.5% of their totallength is wider than two lanes (as on 31 March 2007),leading to heavy congestion. Shortfall in constructionof bypasses, inadequate capacity, insufficient pavementthickness, and weak, narrow, and distressed bridges/culverts as well as ROBs are some of the other defi-ciencies. Upgradation of large segments of SHs to NHsunder the NHDP during the Ninth and Tenth Plans,although impressive, has not kept pace with thedemand for road transportation, besides spreadingavailable resources too thinly across competingprojects. The result is poor maintenance and ridingquality of NHs network, particularly of the non-NHDPsection. Also many of the NHs declared during thelast two Plan periods were substandard, resulting infurther aggravation of the problem.
NATIONAL HIGHWAY DEVELOPMENT PROGRAMME(NHDP)9.3.8 The Committee on Infrastructure (CoI) has ap-proved a massive phased programme for the improve-ment and development of NHs during the period2005–12. This programme envisages an investment ofRs 236247 crore. Although, the NHDP envisages awardof concessions/contracts by 2012, the completion of
TABLE 9.3.1Achievements on National Highways
Period Total Length# Widening to Widening to Strengthening of Major Bridges(km) Two Lanes (km) Four Lanes (km) Pavement (km) (nos)
1947–69 24000 14000* Nil Nil 1691969–90 33612 16000 267 9000 3021990–2002 58112 3457 1276 7000 87Tenth Plan (2002–07) 66590 4177 6769** 8377 611***Total – 37634 8312 24377 1169
Note: # Length at the end of the period.* Includes 6000 km which were already two-lane at the time of designation as NHs.** Includes 216.62 km which have been six- or eight-laned upto the Tenth Plan.*** This does not include the bridges constructed/rehabilitated by NHAI under the stretches of NHDP.

Transport 291
part of Phase III and Phases IV, V, VI, and VII isexpected to be accomplished only by the middle ofthe Twelfth Plan.
9.3.9 NHDP Phase I consists of the GQ, port connec-tivity, and 962 km of NHs covered under NS–EWcorridor of NHDP Phase II. All works on GQ have beenawarded, but there have been some slippages inits completion. Against the total length of 5846 km ofGQ, 5602 km, that is 95.82%, have been four-laned,thereby leaving a balance of 244 km for completion.Progress of various segments of the GQ is given inTable 9.3.2.
9.3.10 The port connectivity project envisages im-provement of 380 km of NHs connecting 10 majorports. Till date, the works on Kandla, Mormugoa,Phase I; JNPT, Phase I; and Vizag ports have beencompleted. By end-August 2007, four-laning of about159 km roads of port connectivity and 322 km of otherNH had been completed. Improvement of about 215km roads of port connectivity and 620 km of otherNH is under implementation and the balance lengthof 6 km of port connectivity and 20 km of other NHsis yet to be awarded.
9.3.11 Under NHDP II, by end-August 2007, 1418 kmof the NS–EW corridors had been four-laned out of atotal length of 7300 km (7200 km at present), that is19.42% of the total. Work is in progress over a length
of 4903 km, while work for the balance 821 km is stillto be awarded. The target for substantially completingthe NS–EW corridor project is December 2009.
9.3.12 The major reasons for shortfalls in fulfilling thetargets fixed during the Tenth Plan period include,inter alia, delay in land acquisition, obtaining environ-ment and forest clearances, getting clearance of Rail-ways for ROB designs, shifting of utilities, local lawand order problems, and poor performance by somecontractors.
9.3.13 In respect of NHDP III, which initially envis-aged four-/six-laning of about 10000 km (subsequentlyenhanced to 12109 km) on build, operate, and trans-fer (BOT) basis, the first phase covering 4815 km isexpected to be completed in December 2009. Four-laning in a total length of 126 km road length hasbeen completed in NHDP III, the work is in variousstages of progress over an aggregate length of 1866 km,and work aggregating to 2823 km is yet to be awarded.The second phase of NHDP III, which has also beenapproved, involves preparation of DPR for the balancelength of about 7294 km and is targeted for comple-tion by December 2013.
9.3.14 Approval of NHDP IV for widening of 20000km to two lanes with paved shoulders as well as forNHDP VII comprising construction of ring roads ofmajor towns, bypasses, flyovers, etc. is pending.
TABLE 9.3.2Corridor-wise Details of Progress on the Golden Quadrilateral as on 31 August 2007
Corridor Four-laned Under Implementation Total Length (km)
Length (km) Length (km) No. of Contracts
Delhi–Kolkata 1364 89 13 1453(NH-2) (92.15)*
Kolkata–Chennai 1568 116 6 1684(NH-5, 6, and 60) (93.11)
Mumbai–Chennai 1251 39 6 1290(NH-4, 7, and 46) (96.97)
Delhi–Mumbai 1419 – – 1419(NH-8, 76, and 79) (100)
Total 5602 244 25 5846(95.82)
Note: Figures in parenthesis denote percentages.

292 Eleventh Five Year Plan
9.3.15 Under NHDP V, out of 6500 km to be six-laned,two projects covering 148 km have already beenawarded, leaving a length of 6352 km still to be awardedas on 31 August 2007.
9.3.16 NHDP VI which has also been approved re-lates to construction of 1000 km of expressways withfull access control on new alignment. The Vadodara–Mumbai corridor (400 km) on NH-8, the highest den-sity corridor, has been prioritized and is likely to beawarded by 2008–09. The balance 600 km will beselected out of the other high density corridor routesidentified on the basis of traffic volume. The status ofphysical parameters of NHDP and other roads, includ-ing port connectivity projects, is given in Table 9.3.3.
9.3.17 The approved Special Accelerated Road Devel-opment Programme for the North Eastern (SARDP-NE) Region, which envisaged improvement of about7616 km of road length (3251 km NH and 4365 kmof State roads (SRs)/roads of strategic importance),has been subsequently enhanced to 8737 km of roadlength (3846 km of NHs and 4891 km of SRs/roadsof strategic importance). This is to be undertakenin two phases. Implementation of Phase A of SARDP-NE aggregating to 2304 km as also initiating actionfor preparation of DPRs under Phase B for 6433 kmhas been approved. A High Powered Inter-MinisterialCommittee (HPC) has been set up for co-ordinatingthe programme, ensuring avoidance of overlapping ofvarious proposals, and sanctioning of individualsub-projects under SARDP-NE. The HPC has so farapproved proposals in an aggregate length of 571 kmat an estimated cost of Rs 1424 crore covering mainlyAssam, Manipur, and Sikkim. The DPRs for the other
stretches are under preparation. A provision of Rs 9562crore (Rs 10814.83 crore at current price) has beenmade during the Eleventh Plan for this importantinitiative of road connectivity in the North East.
9.3.18 Regular monitoring of financial and physicalprogress of works is carried out at various levels witha view to removing bottlenecks. Several initiatives havebeen undertaken to expedite the implementation ofcontracts and make improvements in its internalprocesses, some of which are detailed in Box 9.3.1.
STATE HIGHWAYS (SHS) AND MAJOR DISTRICTROADS (MDRS)9.3.19 The present condition and stage of develop-ment of the secondary network varies widely acrossStates. Though reasonable in terms of size, the qualityof SHs and MDRs is particularly worrisome. This ismainly because the funds for the development of thissecondary system are very inadequate. The NHs andRRs are provided with reasonable funds for theirdevelopment at the Central level, while the RRs alsoreceive some share at the State level. In the process, thesecondary system of roads is neglected.
9.3.20 The result is that there are several deficienciesin the existing SHs and MDRs as a result of (i) inad-equate width of carriageway in relation to trafficdemand; (ii) weak pavement and bridges; (iii) con-gested stretches of SHs and MDRs passing throughcities/towns; (iv) poor safety features and road geo-metrics, and inadequate formation width in hilly andmountainous region; (v) missing links and bridges, and(vi) several railway level crossings requiring urgentreplacement with ROB/road under bridge (RUB).
TABLE 9.3.3Status of NHDP and Other NHAI Projects as on 31 August 2007
Project Length Already Under Implementation Yet to be
(km) Four-laned (km) Length (km) No. of Contracts Awarded
Golden Quadrilateral 5846 5602 244 25 –North–South/East–West 7300 1418 4903 148 821Port Connectivity 380 159 215 8 6Others 962 322 620 16 20NHDP IIIA 4000 126 1866 31 2008NHDP V 6500 – 148 2 6352
Total 24988 7627 7996 230 9207

Transport 293
9.3.21 The existing road network is under severe straindue to traffic growth, overloading of vehicles, andpaucity of funds for road maintenance. A broadassessment shows that over 50% of SHs and MDRsnetwork have poor riding quality. According to oneassessment, losses due to poor condition of these roadswould be around Rs 6000 crore per annum.
9.3.22 Although, efforts have been made by severalStates to encourage and attract private sector financ-ing in augmenting capacity of roads and provisionof bridges, ROBs, and bypasses, the resources haveremained a major constraint in the execution of theprogrammes for SRs during the Tenth Plan. Other con-straints include, inter alia:
Thin Spreading of Resources• More projects are sanctioned than can be under-
taken within the available resources, leading tospreading of available funds thinly and resulting intime and cost overruns.
Delay in Pre-construction Activities• Work has at times been awarded without acquiring
full land for the project. This has affected obtainingthe environmental clearance and shifting/removalof utilities.
Weak Management by Contractors• Although, several measures have been taken by the
contracting industry to acquire state-of-art equip-ment and procure good technical and managerialstaff, considerable scope exists for improvement inachieving project management excellence, properscheduling of human resources, and equipmentresources.
Poor Implementation Capacities• The State Public Works Departments (PWDs) are
required to be reoriented for the current needs ofmodern technology and commercial managementprinciples. There is a need to improve the capacityfor planning, designing, and execution of works to
Box 9.3.1Initiatives taken to Expedite Completion of Quality Road Projects
• Standard format for acquisition of land approved by Ministry of Law, based on which Department of Road Transport andHighways (DoRTH) are to take action on specific proposals for land acquisition.
• For resolving problems in pre-construction activities, regular follow-up meetings are being held with senior officials andspecifically designated nodal officers of State Governments.
• In pursuance of decision of CoI, an Empowered Committee of Secretaries has been constituted under the CabinetSecretary to address Inter-Ministerial and Centre–State issues regarding land acquisition, utility shifting, environmentalclearance, etc.
• MOU signed with M/s IRCON for speedy construction of ROBs.• Works Manual incorporating the Guidelines for procurement of works and consultancy services, compiled by NHAI in
July 2006, will guide procurements and management of contracts, including under PPP Projects.• Action has been taken against defaulting civil contractors: 14 contracts terminated and 17 contractors declared non-
performers.• For ensuring preparation of quality DPRs for civil works, provisions made for peer review, 10% performance guarantee,
and penalty for delays and variation of quantities of more than 15%.• DPR Consultants are now required to co-ordinate at field level with Project Implementation Units (PIUs), NHAI, local
officers, and local residents at every stage of preparation of DPR. Proof Consultants are to review the DPR to ensure fullcompatibility with project requirements, timelines, and detailed guidelines.
• DPR contracts to provide for mandatory continuation of certain key personnel of DPR consultants for a period of at leastthree to four months after award of civil contracts for technical co-ordination.
• JV partners to compulsorily submit performance security separately from each partner’s bank account to the extent oftheir participation in JV.
• Steps taken to improve cash flow problems of contractors by granting interest bearing discretionary advance at therequest of contractor, release of retention money against bank guarantee of equal amount, deferment of recovery ofadvances (on interest basis), and relaxation in minimum Interim Payment Certificate amount.

294 Eleventh Five Year Plan
meet the transport demand of users in many States.Considerable scope also exists for enhancing thetraining arrangements of engineering personnel.Side-by-side contracting industry and consultancysector also need to grow on healthy lines.
RURAL ROADS (RRS)9.3.23 To boost the rural connectivity, a rural roadsprogramme, the PMGSY was launched as a 100% CSS.It aims to provide all-weather roads by 2003 to habi-tations with a population of 1000 and above, andby 2007 to those with a population of 500 and above.In respect of hilly/desert/tribal areas, it aims to linkhabitations with a population of 250 and above.
9.3.24 However, despite all efforts about 35% of allhabitations still remain to be connected by all-weatherroads. Table 9.3.4 details the progress made in physicalparameters of PMGSY by end-March 2007. As may beseen, only 21% of the habitations have been actuallyconnected so far, although 24% were targeted during theTenth Plan period. To address this slippage, the PMGSYhas been re-phased to achieve time-bound targets ofrural connectivity by folding it into the Bharat NirmanProgramme (initiated in 2005–06). It aims to connectall 1000-plus habitations in rural areas (500-plus forhilly and tribal areas) by 2009. The Bharat NirmanProgramme also envisages a massive scaling up of theprogramme in terms of habitation, connectivity cover-age, construction targets, and financial investment.
TABLE 9.3.4Connectivity Status under PMGSY
(as on 31 March 2007)—Targets versus Achievements
Population No. of Eligible Target up to No. ofCategory Habitations Tenth Plan Habitations
Connected
1000 and above 60030 25371 20478500 and above 79208 14854 13193250 and above 39530 2511 3816
Total 178768 42736 37487
Issues in the Construction and Maintenanceof Roads
ROAD MAINTENANCE9.3.25 The road network built at a huge cost needs tobe maintained properly to prevent disintegration and
deterioration, ensure its continuous utilization in anoptimum manner, and ensure road safety to users.However, maintenance of roads, being a non-planactivity, has tended to be neglected in the face of avail-able financial resources. A study by the World Bankestimated that US$ 45 billion invested in main roadsin 85 countries had been eroded over the previous20 years. In India too, some of the excellent roads,constructed with International Development Associa-tion loan four decades back, have been reduced to avery poor condition. As the Twelfth Finance Commis-sion has observed, ‘. . . it is far more important to en-sure that assets already created are maintained andyield services as originally envisaged than to go onundertaking commitments for creating more assets. . .’.What is important is that repair activities, if required,on the road are to be taken up at an appropriate time,as the rate of progression of deterioration of roadsincreases rapidly once the deterioration starts. Thevehicle operating cost on highways, which is a majorcomponent of the total transport cost, is entirely de-pendent on the condition of the roads. A rupee spenton maintenance saves two to three rupees in vehicleoperating cost, besides providing a very cost-effectiveoption to improving traffic flow. Although attentionhas been given to maintenance work in the Tenth Planperiod, there is compelling need to give it overridingpriority with increased emphasis on higher standardsso as to reduce the frequency of reconstruction.
9.3.26 The maintenance requirement of the highdensity corridor of NHs under construction and post-implementation is provided by NHAI. However, thenon-NHDP NH sections, which are maintained byState PWDs, are poorly managed, primarily because thefunds made available to them for maintenance are wellshort of the requirement as per norms. For NHs, theDoRTH gets only 40% of the total funds required formaintenance of NHs, as per the specified norms. Theyear-wise details of shortfall are given in Table 9.3.5.
9.3.27 Maintenance of SHs and MDRs has also beensuffering from paucity of resources made available forthe purpose. Keeping this in view, the Twelfth FinanceCommission allocated Rs 15000 crore for maintenanceof roads and bridges in the entire country duringthe period 2006–10. This amount is distributed to the

Transport 295
States on the basis of their road length, with appropri-ate weights being assigned to different type of roads.For rural roads under PMGSY, there is provision formaintenance for five years following the completionof a project although the long-term issue of mainte-nance has not been addressed so far.
9.3.28 Besides inadequacy of resources, managementof roads is unsystematic and inspections irregular.Maintenance work is done departmentally withdisproportionate allocation spent towards the gangestablishment. Modern mechanized equipments forroad maintenance are not used to the desired degree.There is weak accountability and poor monitoring ofthe maintenance activities.
9.3.29 The first task is to ensure that the allocation forrepair and maintenance is adequate. The Central RoadFund Act 2000, which gave statutory status to the Cen-tral Road Fund (CRF), clearly specifies that the fundbe meant, inter alia, for development and maintenanceof NHs. Despite the clarity in the statutory provision,the entire share meant for the NHs has been appropri-ated for the NHDP programmes for development andfurther upgradation of roads. Since maintenance of ex-isting assets is more important than the creation of newones, all alternatives for making resources available formaintenance must be considered, including possibleearmarking of a fixed proportion, say one-third, of theNH share of road cess for maintenance. Likewise, StateGovernments may have to consider supplementingthe allocation for road maintenance from the TwelfthFinance Commission with the State share of roadcess. Beginning with the Eleventh Plan, but increasinglyin future Plans, resources will have to be found for
maintaining the substantial road assets being createdin the PMGSY, bearing in mind that the road cessshare for rural roads has already been pre-empted fororiginal construction for many years.
9.3.30 Additionally, in NH projects under BOT mode,maintenance is taken care of during the period ofconcession. For other tollable roads, the ModelConcession Agreement (MCA) for Operation, Main-tenance, and Tolling (OMT), published by PlanningCommission, should be adopted. For non-tollableroads on NHs, SHs, and MDRs, long-term mainte-nance contracts should be introduced. Other steps tobe taken include adoption of Pavement ManagementSystems (PMS), outsourcing of work, increased mecha-nization, corridor management, and enforcement ofthe Control of National Highways (Land and Traffic)Act 2002 (Box 9.3.2).
Modalities for Execution of a Road Project9.3.31 The problems of development of road networksare diverse and future requirements are of a formidablemagnitude. Therefore, the strategy for developmentof roads would have to vary keeping in view thenature of problem and the development. It has beendecided to award all contracts for high-density corri-dors under NHDP III onwards only on BOT basis, withtraditional construction contracts awarded only inspecified exceptional cases. However, NHs character-ized by low density of traffic and passing through farflung, remote, or strategically important areas wouldbe developed primarily through budgetary resources.
9.3.32 During the Tenth Plan, the total quantumof private sector investment on NHDP has beenRs 6367.25 crore, as against a target of Rs 7580.27 crore.The shortfall in its achievement, especially during2006–07 (Rs 1578 crore against a target of Rs 2243crore) is attributable mainly to the teething problemsencountered while establishing an appropriate policyand regulatory framework for the PPPs, including theirinstitutional mechanism. However, given the complex-ity of the PPP contracts and the exposure of thegovernment in such contracts, some standardizedstructures that provide predictability and mitigate riskto private capital have been put in place. Thus, MCAfor BOT projects has been developed to facilitate
TABLE 9.3.5Shortfall in Funds for Road Maintenance
in the Tenth Plan (in Rs Crore)
Year Requirement Amount Shortfall Shortfallas per Norms Provided (%)
2002–03 2200.00 800.00 1400.00 63.642003–04 2200.00 731.74 1468.26 66.742004–05 2480.00 745.56 1734.44 69.942005–06 2480.00 868.10 1611.90 65.002006–07 2480.00 814.38 1665.62 67.16

296 Eleventh Five Year Plan
speedy award of contracts and the roll out of projectsare being accelerated. Besides, MCA for OMT has beenpublished by the Planning Commission. The MCA forAnnuity Projects is presently under finalization. Theinitiatives taken in order to facilitate private sectorinvestment are given in Box 9.3.3.
9.3.33 Although, private sector investment wouldshow an increase during the Eleventh Plan, there would
undoubtedly be a limit to road stretches that can beawarded on BOT (Toll) basis. In this mode of delivery,the private sector takes a market risk as the conces-sionaire not only builds the road and maintains itduring the concession period, but also charges toll torecover the cost of construction and maintenance. Inview of the uncertainty of future traffic flows and inthe cases where toll earning may not fully cover thecapital cost, the concessionaire is allowed a VGF of upto
Box 9.3.2Modernization of Maintenance Management
• PMS incorporating a rational method of assessment of distress and decision support system for maintenance activitiesneeds to be introduced for productive use of limited resources. Inventorization programme, including the Road Informa-tion System, may be used for PMS.
• Use of machines for repair of distress in pavements and mobile inspection units for proper inspection/distress in bridgesto improve maintenance culture should be encouraged.
• Maintenance works hitherto being done departmentally should be outsourced to the private sector to enhance efficiency.Concepts involving OMT contracts need to be extended to NHs with State PWDs.
• Corridor management, including engineering and non-engineering experts, is needed for the proper management andmaintenance of NHs section. This would include:
– Maintenance of roads and bridges to the desired standard.– Tackling safety hazards and traffic bottlenecks.– Traffic management.– Collection of users’ fee.– Incidence management.– Land management.
• Steps need to be taken for enforcing the necessary provision of the Control of National Highways (Land and Traffic)Act 2002, which came into force from January 2005 for safe and speedy movement of traffic on NHs. The HighwaysAdministration has already been established for its enforcement.
Box 9.3.3Initiatives taken to Facilitate Private Sector Investment
• In order to maximize the volume of investments in the road sector, given the limited availability of public resources or theneed to use them for development of roads in backward/remote areas, it has been decided that all the sub-projects inNHDP Phase III to Phase VII would be taken up on the basis of PPP on BOT mode.
• The government has announced several incentives such as tax exemptions and duty-free import of road-building equip-ment and machinery to encourage private sector participation.
• The MCA for NHs, which was approved by CoI in 2005, has now been adopted for implementation of PPP projects byMinistry of Shipping, Road Transport, and Highways (MoSRTH)/NHAI; the MCA for SHs has been published by thePlanning Commission.
• A review of tolling policy in respect of NHs has been concluded and the report, once finalized, would serve to impartgreater certainty in revenue projections for concessionaires.
• Manuals of Standards and Specifications for four-laning and six-laning of NHs through PPPs are under finalization byDoRTH. Adoption of these manuals would reduce project preparation time as project specific manuals would no longerbe needed.
• The substantial completion of NHDP Phase I, that is GQ, has called for a shift in emphasis to corridor management so asto deliver maximum throughput in terms of speed and traffic volume, while minimizing operational cost and enhancingroad safety. In this regard, an MCA for O&M of Highways has been published by the Planning Commission.

Transport 297
40% of the project cost based on competitive bid forthe lowest subsidy. Some projects can also be taken upon BOT (Annuity) mode of delivery basis, whereintolling is not an integral part of the project and theproject is, therefore, essentially a road construction andmaintenance arrangement that involves deferred pay-ment by the government. It may not be difficult to findconcessionaires willing to take up the project on BOT(Annuity) basis. This mode of delivery, which is notclassical PPP, is costlier, and should be the leastpreferred option.
EXPRESSWAYS9.3.34 Traffic conditions on the stretches other thanthose that would be taken up under NHDP VI, whetherof two-lane, four-lane, or six-lane, are substantiallyshort of world standards. The mix of motorized andnon-motorized traffic on these roads is a huge hurdle.These roads pass through habitations and pedestrians’traffic impedes vehicular traffic flow. Bypasses havebeen built for some cities but ribbon developmentand roadside eating establishments abound. In theabsence of adequate roadside amenities, roads are alsoused for parking by trucks encroaching upon the ROW.Intersections have been provided on these highwaysto enable vehicles to take a U-turn at different places.Vehicles standing in the middle of the road, waitingfor the oncoming traffic to stop before turning aroundconstrain the traffic flow. Worse, since there is norestriction on access, it is a common practice all overthe country for vehicles to move in the wrong direc-tion in order to avoid driving to the next intersectionand coming back.
9.3.35 Another impediment is the stoppage of vehiclesat the check posts at State borders even when the ve-hicle is merely transiting the State. Vehicles movingon inter-state routes remain stationary about 40% ofthe time in the process of being thus inspected. TheWorld Bank has estimated that truck delays at check-points costs the Indian economy anywhere betweenRs 900 crore to Rs 2300 crore.1
9.3.36 The cumulative result of all deficiencies is thateven when the road surface is good and has adequate
width, vehicles move at a slow speed. Trucks (with oneor two drivers and one helper) travelling from Delhito Mumbai (1419 km) take three days and those fromDelhi to Bangalore (2019 km) four to five days.According to the same World Bank study, ‘US equiva-lent transit times, with one driver operating legallywould be two and three days (actually second and thirdmorning), respectively. If the US carrier used two-driver teams, a day would be cut from each movement.’On the average, Indian trucks are used for 60000 kmto 100000 km a year, which is less than a quarter ofthose in developed countries.
9.3.37 A study group of the Ministry of Shipping,Road Transport, and Highways (MoSRTH) set upduring the Ninth Plan proposed a total expresswaysnetwork of about 15600 km by the year 2020 withbroad phasing as shown in Table 9.3.6.
TABLE 9.3.6Phasing of Expressway by the
Study Group of MoSRTH
Year Cumulative Length (km)
2005 49002010 105002015 141002020 15600
More recently, the Tenth Plan Working Group on theroad sector had observed ‘It is strongly felt that seg-ments of highways where traffic levels in the next fiveto seven years are assessed to be justifying a six-lanefacility (considering both local and long distanceinter-city traffic) say traffic exceeding 60,000 PCUs[Passenger Car Units] per day, it would be more pru-dent to think in terms of an Expressway than optingfor widening of existing highway. The need of trafficin the interim period should be met by provision ofpaved shoulders along existing roads. MaharashtraState provides a good example of the initiative takenby them in going ahead with the construction ofMumbai-Pune expressway.’ In 2005, the CoI approveda plan for the construction of NHs during the period2005–12, which included the construction of 1000 kmof expressways under NHDP Phase VI.
1 India Road Transport Service Efficiency Study, World Bank, 2005.
298 Eleventh Five Year Plan
9.3.38 In order to provide world-class road infrastruc-ture during the Eleventh and Twelfth Plans, the NHDPPhase VI would need to be substantially scaled up.Access-controlled expressways best serve to overcomethe deficiencies of NHs. Even checking on inter-statetraffic can be minimized by requiring that the checksbe carried out only at the time of entry into or exitfrom the expressway network. It is, therefore, neces-sary to formulate a comprehensive Master Plan for theconstruction of access-controlled expressways on newalignments and then proceed with land acquisition.Active participation and necessary financial support,especially for acquisition of land by the State Govern-ments, would be essential for developing such express-ways. A blueprint for the development of 15600 kmof expressways, which may include the GQ andNS–EW corridors is required, using modern scientificmethods to determine alignments and avoid habita-tions as far as possible. The establishment of an Ex-pressways Authority of India to implement the schemeshould be considered by the Ministry.
Need for Studying the Capacity of ExistingRoads and Revision of Capacity Norms9.3.39 The design service volume norms that havebeen developed quite some time back have been usedfor the purpose of planning. A study on updating ofroad user cost data (July 2001) carried out by CentralRoad Research Institute (CRRT) indicates that thesenorms, particularly those relating to four-lane, maybe under-estimated. As a matter of fact, no systematicstudy has ever been undertaken to determine thecapacity of multi-laned roads. The reduction in thedifference of speed of various vehicles, change in themix of traffic as well its pattern, etc., may also havefavourable impact on the capacity of various catego-ries of roads. Thus, there is a need to initiate a studyon the capacity of highways depending upon thecarriageway/roadway widths, etc.
Supply Side Constraints9.3.40 Apart from the resource constraints, the lim-ited absorptive capacity of certain States, inadequateinstitutional and implementing capacities, availability/capacity of local contracting and consulting services,and availability of raw materials and human resourcesare some of the important supply side constraints,
especially when a number of competing road projectsare under implementation under various initiativessuch as the Bharat Nirman Programme, RSVY, etc.The State Government may depute a dedicated teamof officials to strengthen and expedite the land acqui-sition process for projects under NHDP.
9.3.41 The measures to strengthen institutions re-sponsible for developing and maintaining roads, suchas NHAI, State PWDs, and Border Roads Organiza-tion (BRO), are underway. These include restructur-ing the NHAI and training technical officers in BROin project preparation, new specifications, and con-struction and maintenance technologies. State PWDsneed to reorient themselves to meet the challenges fromheightened emphasis on private sector participationand large-scale projects funded by multi-lateral agen-cies. Although, the account codes and works manualsin the State PWDs are well developed, these need to bereviewed and synchronized with upgraded systemsadopted at the Central level.
9.3.42 Although, Programme Implementation Units(PIUs) have been established at the district level un-der PMGSY for planning and executing rural roadprojects, a single specialized nodal agency, for State-level co-ordination, with responsibility for overallpolicy, planning, and management of RRs is desirable.As ownership of RRs will rest with the PRIs eventu-ally, capacity is required to be built at the grass-rootlevel by qualified manpower and training.
9.3.43 For RRs, which are essentially low cost roads,use of local materials which are cheap and involveminimum haulage should be maximized. The use ofnon-conventional road construction material suchas industrial wastes and by-products should also bepromoted.
Integrated Development of Road Network9.3.44 The State Governments should consider for-mulation of an integrated transport plan for develop-ment of their road network. The Centre is providingfunds for the balanced development of the SRsfrom the CRF. In this context, it may be mentionedthat the SARDP-NE is a major initiative, not onlyfor improving connectivity in hilly/remote areas
Transport 299
but also for ensuring integrated development ofroad works.
Goals and Objectives for the Eleventh Plan9.3.45 The main thrust is to create world-class roadinfrastructure, with the objective of improving mo-bility and accessibility while reducing the cost of trans-portation. The expanded NHDP when implementedwill bring about a major improvement in the ridingquality and capacity of around 46000 km of arterialroads out of a total of 66590 km of NHs, which carryaround 40% of the road traffic. Some adjustment maybe necessary in the NHDP programmes keeping inview the availability of resources. Out of the 20000 kmoriginally envisaged under NHDP Phase IV, it may bepossible to take up 6800 km through the BOT routeduring the Eleventh Plan. The remaining length ofroads of 13200 km would be taken up in stretches,which have deteriorated so much that they have be-come virtually impassable, for Improvement of RidingQuality Programme (IRQP) and strengthening atthe estimated cost ranging from Rs 50 lakh per km toRs 1.75 crore per km. Furthermore, it is necessary tosignificantly up-scale the expressways project, initiallyby preparing a blueprint for 15600 km of access-controlled expressways, determining the alignments,and completing the acquisition of land for 6000 kmwithin the Eleventh Plan period. Strict monitoringwould be required in order to ensure that construc-tion of 1000 km of expressways is expedited duringthe Eleventh Plan.
9.3.46 Ensuring a balanced development of the totalroad network across the country would continue tobe an important objective of the Eleventh Plan, includ-ing thorough widening of roads, improvement inriding quality and strengthening, road safety measures,and providing world-class wayside amenities to caterto the growing demand for road services. In particu-lar, 100% rural connectivity with all-weather roads tohabitations with a population of 1000-plus (500-plusin hilly/tribal areas) is a priority objective under theBharat Nirman Programme. Inter-modal issues suchas road connectivity with airports, railways, ports, etc.are also crucial issues. The broad goals and objectivesfor road sector development in the Eleventh Plan aregiven in Box 9.3.4.
Mobilizing Resources
FUNDING FOR NHs9.3.47 In the past, funds for development of NHshave essentially been provided through the CentralGovernment budget. Fees/tolls levied by the CentralGovernment on bridges on NHs and selected stretchesare utilized for upgradation and improvement ofroads. Of the Rs 2 per litre cess on petrol and high-speed diesel oil collected by the Central Governmentand accredited to the Central Road Fund, the cessamount of Rs 1.50 per litre is distributed for develop-ment and maintenance of NHs, SRs, RRs, and forthe construction and development of ROB/RUB andother safety features, as provided in the CRF Act 2000,in accordance with the prescribed formula. The re-maining cess of Rs 0.50 per litre is allocated solelyfor development and maintenance of NHs. The multi-lateral financing agencies such as the World Bank andthe ADB have been providing loan assistance for high-way projects and efforts need to be made to continuetapping this source.
9.3.48 Implementation of NHDP would leave a sub-stantial part of non-NHDP NH network, which wouldalso require development in the Eleventh Plan period.These sections are characterized by low density oftraffic. Some of these stretches fall in backward andinaccessible areas, while others are of strategic impor-tance. In fact, the substantial addition made to NHnetwork during the last two Plan periods has led to anincreased gap between availability of resources and re-quirements and thus contributed to poor maintenanceand riding quality of the non-NHDP network.The development of these stretches of NHs would befinanced primarily through budgetary resources.However, it would be essential to prioritize them inorder to ensure that resources are not spread thinlyamong competing projects, which are responsible fortime and cost overruns.
FUNDING FOR SHs9.3.49 Although State Governments provide funds forSHs, besides allocations from the CRF (of, for instance,Rs 1566 crore during 2007–08), BOT projects are alsobeing encouraged to meet the large financing require-ments of SHs in the Eleventh Plan. For this purpose

300 Eleventh Five Year Plan
an MCA for the PPPs in SHs has been published bythe Planning Commission and State Governments havebeen recommended to use it. Further, opportunitiesfor providing VGF of up to 20% of project cost for
financing State sector schemes have been made avail-able by the Central Government. Specific initiativeshave been taken by some State Governments, in par-ticular, State Governments of Gujarat, Rajasthan, and
Box 9.3.4Road Sector Objectives for the Eleventh Plan
• Develop roads as an integral part of transport system, supplementing other modes, with high priority being accorded tobalanced development of road network (primary, secondary and tertiary systems).
• Expedite implementation of enhanced NHDP:– Completion of balance work of GQ and North–South and East–West corridors.– NHDP Phases III through VII, with reduction in scope of NHDP IV from 20000 km to 6800 km.– Restructure NHAI, the main implementing agency of NHDP.
• Phased removal of deficiencies in existing NHs concomitant with development of traffic over the next 10–15 years:– Emphasis on augmentation of capacity of high-density corridors.– Greater attention to construction of missing links and missing bridges, rehabilitation and reconstruction of weak/
dilapidated bridges for traffic safety.• Formulate comprehensive Master Plan for development of 15600 km of access-controlled expressways:
– Determine alignments.– Acquire land for about 6000 km.– Expedite and complete construction of 1000 km.– Consider establishing an ‘Expressways Authority of India’ to implement the Master Plan.
• Prioritize SARDP-NE:– Improve connectivity of all State capitals in North East with two- or four-lane NHs with paved shoulders.– Connect all district headquarters with two-lane NHs/SHs.
• Prioritize development of high-density corridors in SHs/MDRs.• Promote private sector participation for development of the national and State roads networks:
– Adopt BOT (Toll) for construction.– Adopt MCA for OMT for tollable roads.– Earmark sufficient funds for maintenance for non-tollable roads;– Adopt improved maintenance practices NHs/SHs/MDRs.
• Achieve Bharat Nirman time target of providing rural connectivity through all-weather roads to all habitations with apopulation of 1000-plus persons (500-plus in hilly/tribal areas) by 2009 and thereby improve the quality of life in ruralareas and ensure balanced regional development.
• Focus on proper upkeep and maintenance of the existing road network and on attaining higher maintenance standardsfor optimum utilization of existing network capacity and preserving road assets already created. Adopt modern manage-ment techniques for scientific assessment of maintenance strategies/priorities.
• Improve capacities of implementing agencies: NHAI, State PWDs, and BRO.• Prioritize road safety: prevent overloading of trucks, encroachments, unplanned ribbon development, etc. Focus on
issues like energy conservation and environment protection.• Provide world-class wayside amenities along highways.• Reduce transportation costs: better riding surface, use of containers, multi-axle vehicles in the haulage of goods, etc.• Ensure road connectivity where rail link is not possible.• Integrate road development with railways and other modes of transport.
– Identify feeder roads to important railway routes and undertake needed improvement including periodicmaintenance.
– Link minor important ports with minimum two-lane NHs/SHs/SRs.– Link all inland container depots/CFSs with minimum two-lane NHs/SHs.
• Develop a road data bank, computerize project monitoring system, promote use of information technology in theroads sector.

Transport 301
Punjab in order to strengthen and upgrade SRs (Box9.3.5). The possibility of tolling ROBs, constructed atlevel crossings where heavy traffic crosses the railwayline, could be explored and success stories replicatedacross States. External funding could also be exploredas a possible source of finance for the development ofselected highways. Some States have established RoadConstruction Corporations which augment resourcesthrough market borrowings.
FUNDING FOR RURAL ROADS (RRS)9.3.50 In order to augment funding for meeting thetime targets of rural connectivity under the BharatNirman Programme, it is proposed to borrow Rs 16500crore from the NABARD by leveraging cess accruals.
However, with loan repayments commencing in 2009–10, the amount of cess available (net of repayments) tofinance the rural roads programme would be limitedin the last two years of the Eleventh Plan. Options tocontinue leveraging cess, to increase budgetary supportand various other strategies for mobilizing funds couldbe explored (Box 9.3.6).
PHYSICAL TARGETS FOR THE ELEVENTH PLAN
National Highways9.3.51 High priority is accorded to expeditiouscompletion of the balance works under NHDP PhasesI and II and first phase of NHDP Phase III. The GQ isscheduled for substantial completion by December
Box 9.3.5Innovations by some State Governments
• Crucial role being played by Madhya Pradesh Road Development Corporation and Gujarat State Road DevelopmentCorporation (GSRDC) in upgrading SRs using Central Government’s VGF which extends subsidy of up to 20% of totalproject cost and an additional up to 20% financed by State Government. Contribution to GSRDC is also kept to defrayexpenditure on pre-construction activities.
• PPP (Annuity) model adopted by Gujarat since strengthening/widening of SRs does generate a commercially viablereturn despite 40% upfront subsidy.
• Adoption of a plan scheme for land acquisition for identified corridors by Punjab to reduce traffic congestion on majorhighways, with funds proposed to be released on the condition that these shall be recovered by PWD by imposing a cesson sale/purchase and any development activity carried out by the private parties on lands adjoining PWD roads.
• Creation of a Rajasthan State Road Development Fund, through a cess on sale of petrol and high speed diesel, towardsextending interest free loan and share capital to the Road Infrastructure Development Company of Rajasthan for projectsto upgrade SHs.
Box 9.3.6Some Options of Resource Mobilization for Rural Roads
Independent Road Fund: There is practically no scope for private sector financing of rural roads since they carry very lowvolumes of traffic. Creation of an independent road fund in various States, as has been done by a few States such as UttarPradesh and Karnataka for maintenance, needs to be explored.Market Committee Funds: Extension of the scheme of levying marketing fee and rural development cess on agricultureproduce to all States with the support of the farmers’ community could be explored.Vehicle Fees: In addition to taxes on fuels, additional funds should be generated through special purchase tax on twowheelers, cars, and agricultural tractors. Part or whole of such funds so collected may be allocated for rural roads andprovision of road transport services in rural areas.Domestic Borrowings: Recently, NABARD in India has come up in a significant way to provide loan assistance for construc-tion of rural roads in several States under RIDF programme. As the financial institution like NABARD may not have therequisite technical expertise, it may be worthwhile to consider providing NABARD loans with technical and managementinputs of NRRDA. This would enhance the financial and technical discipline, as well as help in adoption of uniformstandards for these roads, on the lines of the PMGSY. This can be channelized by transferring the total loan amount to a poolto be availed of by the States under guidelines similar to that of PMGSY.

302 Eleventh Five Year Plan
2007. North–South, East–West corridors are expectedto be substantially completed by December 2009. Theother priorities include:
• Complete the first phase of NHDP Phase III byDecember 2009. Although, the second phase ofNHDP Phases III, V (six-laning of 6500 km), andVI (expressways of 1000 km) are scheduled forcompletion in the Twelfth Plan, their implementa-tion must be strictly monitored in the EleventhPlan.
• Initiate work for two-laning 6800 km of identifiedstretches under NHDP Phase IV through the BOT(Toll) mode and construct ring roads of majortowns and bypasses and flyovers under NHDPPhase VII.
• Consider establishing an Expressways Authority ofIndia to formulate and implement a Master Planfor 15600 km of access-controlled expresswaysfor high-density corridors and initiate action fordetermining the alignment and acquiring the landfor 6000 km; simultaneously expedite constructionof 1000 km of expressways under NHDP Phase VIto provide unhindered, high-speed, and safe move-ment of traffic.
• Complete SARDP-NE (Phase A) and initiate actionto implement Phase B to catalyse development ofthe NER.
• To keep the balance non-NHDP section in reason-ably good shape, earmark a proportion of the cessavailable for NH exclusively for maintenance.
9.3.52 The targets for stretches other than NHDP haveto be prioritized according to their importance to thenational economy so that the available resources arenot spread thinly among competing projects. Themajor targets for non-NHDP components include:
• Accelerated efforts to bring NHs network (presently,20644 km is single lane/intermediate lane) to aminimum of two-lane standard within the next 10years and four-laning small segments of non-NHDPstretches.
• Removing existing deficiencies, such as inadequatecapacity, insufficient pavement thickness, etc., in theroad network by strengthening the NH network/improving riding quality.
State Roads (SRs)9.3.53 Greater focus should be given to augment thecapacity and quality of SRs rather than any large-scaleexpansion. There is a need to identify and develop a corenetwork of major arterial routes covering SHs/MDRs,which are either already experiencing high volumes oftraffic or have such potential in the light of industrialand other growth strategies by the public and/or theprivate sector.
9.3.54 The core network would include expressways,four-laned roads, strengthened pavements, and pave-ments with good riding quality, bypasses, bridges, etc.for a length of about 71500 km, with a financial outlayof about Rs 80000 crore covering the States. This net-work could be based on the ‘corridor concept’, suchthat a commercial vehicle can cover about 500 km onthis network in one day (800 km or more on express-ways) with adequate road safety.
9.3.55 Although, it is difficult to precisely estimatephysical and financial requirements for upgrading SHsand MDRs without a detailed study of traffic forecastsand their existing conditions by concerned States, it isbroadly estimated to amount to Rs 100000 crore forthe construction of 300 km of expressways, four-laning5000 km, and widening to two lanes 40000 km of thecore network. For the non-core network in the NER,2500 km length is to be upgraded for two-laning, andfor the other States 10000 km length is to be upgradedto two lanes.
Rural Roads (RRs)9.3.56 The physical targets set under the BharatNirman Programme till the end of 2008–09 are gener-ally found to be beyond the capacity of the States toachieve them. Therefore, the leftover targets of theBharat Nirman Programme (that is, about 33%) willbe completed only in 2009–10. To achieve the targetsof the Bharat Nirman Programme, 146185 km ofrural roads are proposed to be constructed to benefit66802 unconnected eligible habitations in the coun-try. It is also proposed to upgrade nearly 1.94 lakhkm of the existing rural roads which are identifiedin the core network. State-wise and year-wise targetsfor new connectivity, number of new habitations tobe connected, and length to be upgraded under the
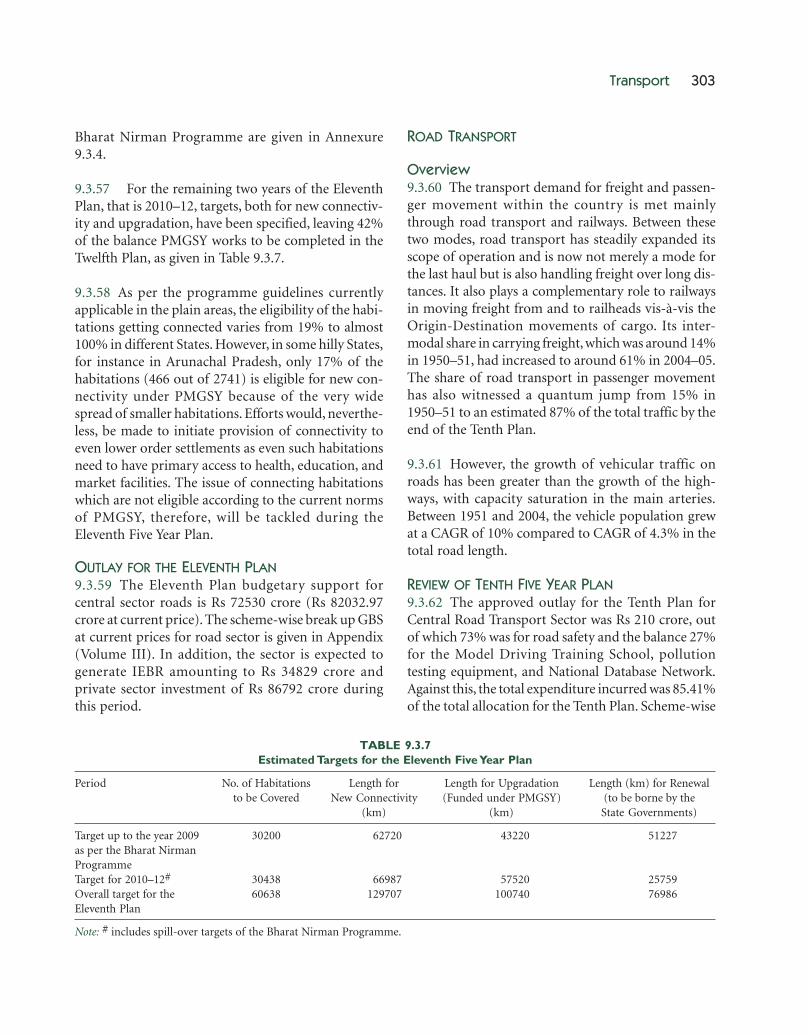
Transport 303
Bharat Nirman Programme are given in Annexure9.3.4.
9.3.57 For the remaining two years of the EleventhPlan, that is 2010–12, targets, both for new connectiv-ity and upgradation, have been specified, leaving 42%of the balance PMGSY works to be completed in theTwelfth Plan, as given in Table 9.3.7.
9.3.58 As per the programme guidelines currentlyapplicable in the plain areas, the eligibility of the habi-tations getting connected varies from 19% to almost100% in different States. However, in some hilly States,for instance in Arunachal Pradesh, only 17% of thehabitations (466 out of 2741) is eligible for new con-nectivity under PMGSY because of the very widespread of smaller habitations. Efforts would, neverthe-less, be made to initiate provision of connectivity toeven lower order settlements as even such habitationsneed to have primary access to health, education, andmarket facilities. The issue of connecting habitationswhich are not eligible according to the current normsof PMGSY, therefore, will be tackled during theEleventh Five Year Plan.
OUTLAY FOR THE ELEVENTH PLAN9.3.59 The Eleventh Plan budgetary support forcentral sector roads is Rs 72530 crore (Rs 82032.97crore at current price). The scheme-wise break up GBSat current prices for road sector is given in Appendix(Volume III). In addition, the sector is expected togenerate IEBR amounting to Rs 34829 crore andprivate sector investment of Rs 86792 crore duringthis period.
ROAD TRANSPORT
Overview9.3.60 The transport demand for freight and passen-ger movement within the country is met mainlythrough road transport and railways. Between thesetwo modes, road transport has steadily expanded itsscope of operation and is now not merely a mode forthe last haul but is also handling freight over long dis-tances. It also plays a complementary role to railwaysin moving freight from and to railheads vis-à-vis theOrigin-Destination movements of cargo. Its inter-modal share in carrying freight, which was around 14%in 1950–51, had increased to around 61% in 2004–05.The share of road transport in passenger movementhas also witnessed a quantum jump from 15% in1950–51 to an estimated 87% of the total traffic by theend of the Tenth Plan.
9.3.61 However, the growth of vehicular traffic onroads has been greater than the growth of the high-ways, with capacity saturation in the main arteries.Between 1951 and 2004, the vehicle population grewat a CAGR of 10% compared to CAGR of 4.3% in thetotal road length.
REVIEW OF TENTH FIVE YEAR PLAN9.3.62 The approved outlay for the Tenth Plan forCentral Road Transport Sector was Rs 210 crore, outof which 73% was for road safety and the balance 27%for the Model Driving Training School, pollutiontesting equipment, and National Database Network.Against this, the total expenditure incurred was 85.41%of the total allocation for the Tenth Plan. Scheme-wise
TABLE 9.3.7Estimated Targets for the Eleventh Five Year Plan
Period No. of Habitations Length for Length for Upgradation Length (km) for Renewalto be Covered New Connectivity (Funded under PMGSY) (to be borne by the
(km) (km) State Governments)
Target up to the year 2009 30200 62720 43220 51227as per the Bharat NirmanProgrammeTarget for 2010–12# 30438 66987 57520 25759Overall target for the 60638 129707 100740 76986Eleventh Plan
Note: # includes spill-over targets of the Bharat Nirman Programme.

304 Eleventh Five Year Plan
financial and physical performance for the Tenth Planis given in Annexure 9.3.5.
MODEL DRIVING TRAINING SCHOOL ASCENTRALLY SPONSORED SCHEME9.3.63 The scheme, started in the Tenth Plan with theobjective of imparting training to drivers in order toreduce the rate of accidents, envisages the CentralGovernment assistance in the form of a one-timecapital grant for building and other infrastructure ofup to 70% of the project cost. The remaining cost,including maintenance and operational cost, is borneby the State Government. During the Tenth Plan, 11such schools were sanctioned. Although the schemehas been dropped in the Eleventh Five Year Plan, itwill need to be replaced by a more broad-based actionplan. The State-wise and year-wise allocation andreleases are given in Annexure 9.3.6.
PASSENGER SERVICES9.3.64 Passenger road transport services in India aremet by personalized and public transportation. Publictransport is provided by the State Road TransportUndertakings (SRTUs) and by private operators. Atthe end of 2003–04, the country had about 73 millionregistered automobiles. The composition reveals adominance of two-wheelers, with a share of more than71%, followed by cars with 13%, and other vehicles(a heterogeneous category which includes three-wheelers, trailers, tractors, etc.) with 9.4%. The shareof buses and trucks in the vehicle population is 1%and 5%, respectively. The share of the personalizedmodes of transport, viz. two-wheelers, cars, and jeepsincreased from 60% in 1951 to 84% in 2004, at theexpense of public transport, notably buses, whose sharedeclined from 11.1% in 1951 to 1.1% by the end of2003–04. Within the buses category, the share of SRTUsin total buses has declined from 37% in 1985–86 to15.8% in 2002–03 and the share of private buses hasrisen from 63% in 1985–86 to a lion’s share of 84.2%in 2002–03.
STATE ROAD TRANSPORT UNDERTAKINGS (SRTUS)9.3.65 Of the 53 SRTUs operating in the country, 15 areoperated by local bodies and 38 have been establishedby State Governments under the Road Transport Cor-poration Act 1950. These 38 SRTUs are estimated to
have a total of 1.13 lakh buses, with a total investmentof Rs 18669.19 crore, and they provided direct employ-ment to about 7.09 lakh workers during 2006–07.
Physical Performance of SRTUs9.3.66 The overall productivity of SRTUs improvedin the Tenth Plan. Fleet utilization improved from78.72% in 2002–03 to 82.50% in 2006–07, whilevehicle productivity increased from 210 km per busper day to 229 km per bus per day, staff productivityfrom Rs 39.23 per worker per day to Rs 39.39 perworker per day, and fuel efficiency from 4.11 km perlitre to 4.31 km per litre during the same period.
9.3.67 However, there is wide variation in the perfor-mance of physical parameters of various SRTUs.Efficiently run undertakings include those in Haryana,Tamil Nadu, Andhra Pradesh, Rajasthan, Maharashtra,and Karnataka, while the undertakings in Bihar, Jammuand Kashmir, North Eastern States, Punjab Roadways,and Delhi Transport Corporation have considerablescope for improvement. An action plan on Manage-ment Monitoring needs to be worked out by theseundertakings for speedy improvement in performanceof their physical parameters. The State-wise physicalperformance of SRTUs is given in Annexure 9.3.7.
Financial Performance of SRTUs9.3.68 The financial performance of the SRTUs hasbeen deteriorating year after year, with their net lossof Rs 1503.02 crore in 2002–03 having increased toRs 2137.66 crore in 2006–07. Uneconomic passengerfares, high burden of taxes, operations on uneconomicbut obligatory routes, concessions in fares provided tocertain category of commuters, and high bus staffratio, and of late, increase in interest burden due tolarger institutional borrowings have all contributed tothe losses.
9.3.69 Various initiatives taken by SRTUs to improvetheir physical and financial parameters include routerationalization, introduction of special services suchas deluxe buses and night time services, better main-tenance practices at depot level, introduction of elec-tronic ticketing, and outsourcing of staff and services.However certain other measures such as providingSRTUs with full reimbursement of cost concessions,

Transport 305
allowing SRTUs to make required commercial fareadjustments, rationalization of motor vehicle andrelated taxes also need to be taken. It is also necessaryto rationalize the procedures for award of transportroutes to private operators. For commercial routes theprivate operator should be selected through the pro-cess of competitive tendering. As for non-commercialroutes, instead of burdening the SRTUs with them,these too should be subjected to the competitivebidding process on the basis of alternatives such asuniversal service obligation (USO) or VGF models.
FREIGHT SERVICES9.3.70 Freight movement on the road is predomi-nantly carried out by the private sector truck opera-tors. The volume of freight in BTKM carried by roadgrew annually at an average rate of 6.5% as comparedto 3.6% for railway freight during the last 10 years.The road freight industry is mostly unorganized andhighly fragmented with more than 85% of the truckoperators owning less than five trucks. The popula-tion of goods vehicles has burgeoned from 82000 in1951 to 8.63 lakh in 1986 (over 10-fold increase), andfurther to 37.49 lakh in 2004 (increase of 46 times fromthe 1951 level). This increase signifies the acceleratingincrease in the demand for road freight services facedby the industry and the subsequent challenges of im-proving service standards, rationalizing costs, enhanc-ing productivity, and reorganizing the road freightservices industry.
POLICY ISSUES9.3.71 The expected future growth of road transpor-tation for both passengers as well as freight movementis tremendous, due to substantial investments inimprovement of reach, capacity, and quality of the NHnetwork. However the sector is beset with lowtechnology, low energy efficiency, high pollution, poorquality roads, and hindered movement of goods andpassenger traffic. A number of policy aspects are to beaddressed for gearing up the Indian road transportsector to meet the challenges of further growth.
Need to Strengthen the Public Transport System9.3.72 Public transport causes lesser environmentaldamage in terms of air and noise pollution, optimiza-tion of road space, increased per unit throughput, and
reduction in traffic congestion, as compared to person-alized vehicles. However, the composition of vehiclepopulation in India is skewed towards personalizedtransport. The role of both public and private sector iscrucial. Considering the advantage of public transportthere is a need to strengthen the public transportationservices through a policy regime, which fosters theirfinancial viability and grants them more functionalautonomy. They may be allowed to fix commercial faresbased on a formula approved by the respective StateGovernments. The PSUs may also be reimbursed fullcost of concessions provided to various categories ofpassengers.
Private Sector Participation9.3.73 Almost all State Governments have facilitatedentry of private sector in providing passenger trans-port services to ease pressure on the public sector. Ason 31 March 2004, the share of private buses was 85%.Private bus operators have, however, exhibited deplor-able quality of service, with disregard to traffic rules,unsafe driving practices, unscheduled operation, andusage of irrational cost cutting measures and tax eva-sion. The private sector has also adversely affected theperformance of public sector by resorting to unfaircompetition.
9.3.74 A prerequisite is, therefore, to strictly enforcerules, for which specially designated regulatory bodiesneed to be set up, with powers to lay down minimumbasic service standards, impose heavy fines, suspend oreven cancel licenses, and launch and pursue prosecu-tions for accidents vigorously.
Pollution Control and Energy Conservation9.3.75 Rapid growth of motorized vehicles in thecountry over last one decade has raised the demandfor petroleum fuel, resulting in increased vehicle pol-lution. The Central Government has taken measuresto bring down the existing sulphur content level of0.5% in diesel to 0.10% in phases by introducing thefollowing emission norms during the Tenth Plan:
• Bharat Stage II emission norms extended to entirecountry in respect of all categories of motor vehiclesw.e.f. 1 April 2005 in respect of vehicles manufac-tured after 1 April 2005.

306 Eleventh Five Year Plan
• Bharat Stage III emission norms have been intro-duced w.e.f. 1 April 2005 in respect of four-wheeledvehicles manufactured on and from 1 April 2005 inthe National Capital Region (NCR) and cities ofMumbai, Kolkata, Chennai, Bangalore, Hyderabad,including Secundarabad, Ahmedabad, Pune, Surat,Kanpur, and Agra except for four-wheeled trans-port vehicles plying on interstate permits, nationalpermits, or all-India tourist permits within the ju-risdiction of these cities. The emission norms fortractors have also been upgraded. While Bharat(Trem) Stage II norms have come into force from 1June 2003, the Bharat (Trem) Stage III norms havecome into force from 1 October 2005.
9.3.76 The emission norms are being revised apacewith international emission norms. Enforcement, how-ever, is sadly lacking, and there may be improvementsby accrediting private sector institutions to comple-ment the responsible governmental agencies. Underthe Motor Vehicles Act, the authorized testing stationsissue certificate of fitness for transport vehicles. TheState Governments are empowered to authorize anyagency through a notification.
Barrier Free Movement of Freight and Passengers9.3.77 Barriers to inter-state movement, throughmultiple checking by the police, sales tax department,transport department, and excise and custom, entailedhuge economic costs in the range of Rs 3200 crore toRs 4300 crore in 2004 which are estimated to progres-sively increase to Rs 60168 crore by 2017.
9.3.78 By way of remedy, apart from introducingonline information network for registration and taxadministration at national, regional, and local level,and different colour-codes for the number plate oftrucks that move inter-state, the concept of ‘GreenChannel’ may also be promoted, initially for high-valuefreight and perishable commodities, by certifyingthe consignment at the origin and transmitting therequired documents to the authorities for an unhin-dered journey to their destination.
Motor Vehicle Taxation9.3.79 The existing tax structure for CVs shows widevariations across States due to different classification
principles for the taxation of vehicles, variations in theapplication of lifetime and annual tax rates to vehiclecategories, use of specific and ad valorem rates, andthe multiplicity of rates. There is a need to study theeconomic implications of rationalization of the taxstructure across the country in terms of its impact onthe reduction of transaction costs. Vehicle taxation isroad damage related, but levied on the basis of grossvehicle weight rather than on potential axle loads, re-sulting in under-taxation of two-axle trucks comparedto multi-axle vehicles, and should be changed for goodsvehicles from gross vehicle weight to axel loads.
Overloading9.3.80 To check overloading, Weigh in Motion (WIM)bridges need to be installed at selected points on NHs,inter-state check posts, industrial areas, etc., with fa-cilities for unloading and temporary warehousing ofexcess loads. The Honourable Supreme Court has heldthat the excess load needs to be variably off-loaded evenif the offence is compounded. The Government ofIndia has recently proposed to expand the area of over-loading offence of the Motor Vehicles Act 1988 by in-troducing the Motor Vehicle Bill 2007. The proposedextension makes the common carrier and consignoralso liable for overloading along with vehicle owner(who is already covered under the present Act) andwould therefore discourage the extensive operation ofillegal overloading on goods.
Road Safety9.3.81 The number of accidents has quadrupled from1.1 lakh in 1970 to 4.3 lakh in 2004, with 92618 per-sons killed in accidents (one fatality per 4.6 accidents)and 464521 persons injured in 2004. The social costimpact of road accidents is 3% of the GDP.
9.3.82 Road safety is a multi-dimensional issue, incor-porating development and management of roadinfrastructure, provision of safer vehicles, legislationand law enforcement, mobility planning, provision ofhealth and hospital services, child safety, and urbanland use planning. The success of road safety strate-gies also depends upon a broad base of support andcommon action from all stakeholders. Its existing in-stitutional set up is multi-tier, with MoSRTH, NationalRoad Safety Council, and the Transport Development
Transport 307
Council at the Centre, State Transport Departmentand State Road Safety Councils at the State level, andfinally, organizations and agencies involved includingthe police, Indian Road Congress, CRRI, CentralInstitute of Road Transport (CIRT), NGOs, andacademic institutes.
9.3.83 In order to assess the magnitude of road trafficinjuries and fatalities in India and to suggest measuresfor rescue and relief of accident victims, an EC ofIndia was constituted. The Committee has recom-mended setting up of a National Road Safety andTraffic Management Board to lay down standards andguidelines as well as to oversee and coordinate allactivities pertaining to road safety at Centre as wellas State level for promoting and improving trafficmanagement in India. The Report is under activeconsideration.
9.3.84 With a view to reducing accidents, injuries, anddeaths during the Eleventh Five Year Plan, some moremeasures need to be taken. Road safety audit on allNHs should be made mandatory at different stages ofthe projects, coupled with a stringent highway patrol-ling system. Trauma care centres need to be established,accident-prone spots need to be identified, and theirroad geometry improved. There is a need to upgradeall urban and rural roadside furniture standards tointernational best practices, coupled with review ofroad design, road maintenance, and traffic manage-ment. Strict enforcement of the Motor Vehicle Act toensure adherence of traffic rules is vital.
Human Resource Development9.3.85 The human resources requirement is estimatedto grow from 12.83 million in 2007 to 17.64 million in2012, out of which 66% will be drivers, four-fifth ofwhich in turn would be absorbed in goods vehiclecategory. To substantially improve driving skills andenlarge the pool of drivers, institutions such as theITIs and CIRT need to create competent driver train-ing instructors with training of trainers by accreditedinstitutions. Adequate infrastructure facility includingdriving tracks needs to be provided near the cities foruse by driving schools. Many initiatives have been takenup both by the government and the private sector topromote road safety education and driving training
facility in India, which include the Institute of Driv-ing Training and Research (IDTR) which is a jointventure between the Department of Transport, Gov-ernment of Delhi, and Maruti Udyog Limited; Auto-mobile Association of Upper India (AAUI) DrivingSchool (which also provides electronic simulator basedtraining facilities); Institute of Road Traffic Educationand Driver Training Institute by Ashok Leyland inBurari, near Delhi, in partnership with the Govern-ment of Delhi. Such initiatives inviting automobilemanufacturers and insurance companies for provid-ing training to drivers of automobiles need to beencouraged. The minimum educational qualificationfor obtaining a driving license needs to be increasedfrom the passing certificate of Class VIII to Class XIIin the future.
Research and Development (R&D) toImprove Vehicle Efficiency9.3.86 R&D efforts should be focused on bus bodydesign, with emphasis on energy conservation and ecofriendliness; propulsion technology for use of hybridcells, bio fuels, etc.; and developing appropriate trans-mission systems for urban driving conditions.
Database9.3.87 Motor Vehicles Act provides for maintenance ofState registers of motor vehicles. An IT-based central-ized vehicle registration system; depository of motorvehicle registration by assigning unique number simi-lar to permanent account number; data on tax payingand non-tax paying vehicles; public surveys to measurefreight/passenger movement by road, with time motionsurveys of trucks to assess transaction costs are requiredto be established.
Non-motorized Transport (NMT)9.3.88 The status of NMT needs to be studied andappropriate infrastructure created coupled with enact-ment of safety code for NMT to reduce the risks borneby cycles, walk trips, and the like. This will also help tofree road space for motorized transport.
OUTLAY FOR THE ELEVENTH PLAN9.3.89 The Central Sector outlay for road transportsector for the Eleventh Five Year Plan at current priceis Rs 1131.00 crore, which would be budgetary support.

308 Eleventh Five Year Plan
The scheme-wise details are given in the Appendix(Volume III).
9.3.90 The total projected outlay for the Eleventh Planoutlay for DoRTH is Rs 108359 crore at 2006–07 price(Rs 122557 crore at current price) which includesRs 73530 of GBS at 2006–07 price (Rs 83164 crore atcurrent price) and Rs 34829 crore of IEBR at 2006–07price (Rs 39393 crore at current price).
9.4 SHIPPING
SIGNIFICANCE OF SHIPPING9.4.1 The recent accelerated growth in Indian economyand trade underscores the increasing criticality of theshipping sector for India, as the bulk of the country’sExport-Import trade takes place through the maritimeroute. One of the objectives of the Foreign Trade Policy2004–09 is ‘to double our percentage share of globalmerchandise trade within the next five years’ taking itto 1.5%. With 8.42 million gross tonnages (GT), Indiastands at the 20th rank among maritime nations,in terms of fleet size, with a share of 1.19% of theworld fleet.
9.4.2 Indian tonnage was practically stagnant till2004–05, but reforms introduced in that year stimu-lated a burst of growth in 2005–06. The ShippingCorporation of India (SCI), a PSU under the Depart-ment of Shipping, has a major share in India’s ship-ping tonnage. A feature of recent experience in India’sshipping sector is the sharp decline in the share ofIndian ships in the carriage of India’s overseas trade
from 31.5% in 1999–2000 to 13.7% in 2004–05.Indian shipping fleet is characterized by the predomi-nance of oil tankers and bulk carriers. While oil tank-ers account for 60.6% of the total tonnage, bulk carriersaccount for 29.6%, with the other vessel types such asliner vessels, OSVs accounting for a mere 9.8%.
REVIEW OF THE TENTH PLAN9.4.3 During the Tenth Plan, shipping tonnage wit-nessed a rise from 560 vessels carrying 6.82 millionGT to 787 vessels amounting to 8.60 million GT.A total of 227 vessels of 1.78 million GT were addedto the fleet as against a target of 156 vessels of 3.26million GT.
9.4.4 The main reason for the fleet growth in2005–06 was the change in fiscal regime applicable tothe sector. Tonnage Tax was introduced in 2004–05 andwas further extended to dredgers in 2005, as an alter-native to regular corporate tax, thereby reducing taxto a nominal rate and making profits from shippingexempt from tax if they were used for creating an in-vestment fund for acquisition of new tonnage. Expan-sion of cargo volumes due to rapid growth of theeconomy and the increased availability of low costcapital due to liberalized policy governing externalcommercial borrowings also boosted acquisitions.
9.4.5 An outlay of Rs 7753.85 crore was provided inthe Tenth Plan for the shipping sector. Against this,the expenditure was Rs 2991.62 crore, accounting for38.6 % of the total outlay. The scheme-wise details aregiven in Table 9.4.1.
TABLE 9.4.1Financial Performance of the Shipping Sector in the Tenth Plan
(In Rs Crore)
S No. Scheme/Programme Financial Performance—Tenth Plan
Approved Tenth Approved Annual Actual Expd.Plan Outlays Plan Outlays
1. SCI 5800.00 6378.95 2380.942. DG (S) 288.84 58.03 59.913. DG (LL) 185.00 132.00 67.414. IWT 903.00 615.57 475.875. Information Technology – 7.49 7.496. Unallocated 577.01 – –
Total 7753.85 7192.04 2991.62
Note: Expd.= Expenditure

Transport 309
STRATEGIES FOR ELEVENTH PLAN9.4.6 As recognized in the Report of the EC to ReviewIndian Shipping headed by Dr Rakesh Mohan (2002),‘Shipping is not a stand-alone industry and has gotcollateral linkages with several other industrial activi-ties of considerable economic consequence’, the Re-port goes on to give the assessment, ‘Having regard tothe combined impact of the mother industry i.e. Ship-ping and its satellites, the net aggregate contributionto the national economy could well be of the order of2.5–3% of the national GDP.’ In light of this and inorder to maximize gains from the growth of merchan-dise trade, it is imperative that the shipping tonnagegrows steadily along with trade. Retained earningsfrom the shipping sector are as important as exportearnings from important service sectors such as IT andITES.
9.4.7 A national shipping fleet commensurate withour overseas cargo needs would help in reducing thefreight costs of Indian cargo. Transchart and ‘right offirst refusal’ policy also help to discourage undue freightincreases. A thriving shipping sector encourages thegrowth of associated industry and services providersrequired for servicing this industry, accounting to over75% of the shipping sector’s national contribution.Most importantly, national tonnage is decisive in main-taining the supply line of essential cargo during inter-national emergencies, as was also demonstrated duringthe Iraq war, when every drop of crude imports fromthe Middle East came on Indian Ships.
Increase in Tonnage9.4.8 During the Eleventh Plan, it would be possibleto achieve a tonnage target of 10 million GT. An envi-ronment conducive to the growth of Indian shippingcan be fostered by fiscal rationalization, strengthen-ing of regulatory mechanism, and increased focus onmaritime training. If supportive policy measures asdetailed below are taken, acquisition of vessels up to12 million GT and 15 million GT may be achieved.These scenarios are given in Table 9.4.2, along withtheir required investments.
Fiscal Regime Rationalization9.4.9 Ship owners can shift registrations easily andconsequently they move to regimes where the tax
regime is least onerous. The favourable effect inIndia of the introduction of the Tonnage Tax as seeninitially, quickly evaporated because of the lowertaxation in other regimes, estimated by the industryto be of the order of 5%–6%. There is an urgentneed to study the cumulative incidence of taxeson ships registered in India vis-à-vis the incidence inother jurisdictions so that necessary measures canbe taken to reduce or eliminate the disparity in taxtreatment. Another aspect, which translates itselfinto a tax-related disadvantage for the ships withIndian flags, is that national manning is compulsoryfor them. The company has to make withholdingtax payments for Indian seafarers since they are notexempt from income tax. As this obligation does notdevolve on ships registered in other jurisdictionsand employing Indian seafarers, the result is that theIndian ships have to pay a higher salary. It is criticalfor the growth of shipping in India that a level playingfield is created as compared to other regimes inrespect of taxes.
Cargo Support9.4.10 The continuation of the policy with respect togovernment owned and controlled cargo to be im-ported on FOB basis and shipping arrangements to bechannelized through the Department of Shipping’sChartering Wing, Transchart would be advisable. Thispolicy, which is similar to that followed in some devel-oping countries, has proved to be advantageous notonly by providing cargo support to Indian ships, butalso by enabling the buyers/receivers to retain controlover shipping arrangements and shipment schedulesaccording to their import requirements. The assuranceof cargo support encourages new entrants andmitigates the risks of tonnage and fleet expansion forexisting companies.
TABLE 9.4.2Increase in Tonnage
Tonnage Additional Ships Investment
Target Numbers Tonnage (in Rs Crore)
Scenario 1 10 m GT 279 4.6 m GT 35000
Scenario 2 12 m GT 404 6.2 m GT 55000
Scenario 3 15 m GT 609 9.2 m GT 80000
310 Eleventh Five Year Plan
Maritime Human Resource Developmentand Training9.4.11 India has positioned herself as a major humanresources-supplying nation to the maritime industry.As a result of the initiatives taken by the governmentin encouraging private participation in maritime train-ing, the number of maritime training institutes underthe assurance of quality training by the DirectorateGeneral of Shipping DG(S) rose to 128 in 2005. India’sshare of global maritime human resources rose to26950 officers and 75650 ratings, comprising an esti-mated 6% of the world’s seafarers. The Eleventh Plantarget for the marine training programme is to retainour 6% share of the global workforce and additionallysupplying 20% of the current estimated shortages.
9.4.12 By virtue of income tax applicable to Indianseafarers, Indian ship owners are at an inherent disad-vantage as foreign flag vessels become the first choicefor Indian seafarers and the best talent is denied tothe local shipping industry. Moreover, it is mandatoryfor Indian ships to employ Indian seafarers compound-ing the problem further. It would be necessary toreview this restriction so that the Indian shippingindustry may not face human resources shortage.
9.4.13 Policy initiatives are required to retain and buildtalent. In the area of maritime training, although theintake capacities at all training institutes for officershave risen from 2185 in 2000 to 5263 in 2006 and forratings to 4726 in 2006 to reach the necessary targets,there is a shortage of sea-time berths to absorb thenumber of pre-sea officers and ratings trainees. Thus,there is a need to shift the focus in strategy from in-creasing cadet intake at pre-sea levels to more sea-timetraining slots. Initiatives for this could include theco-option of the member lines of the INSA intoallocating 10% of each ship’s manning scales exclu-sively for sea training berths at the cost of these futureemployers.
9.4.14 With the objective of providing world-classtraining opportunities for the shipping sector, the gov-ernment would be establishing an Indian MaritimeUniversity (IMU) at Chennai, with campuses atKolkata, Mumbai, and Vishakhapatnam, throughan Act of Parliament. IMU would play the role of a
centralized nodal agency for co-ordinating, monitor-ing, and controlling maritime training in India,through nation-wide rating, consolidation, and reor-ganization of training systems under IMU. This wouldfacilitate and promote maritime studies and researchin emerging areas such as marine science and technol-ogy and marine environment. The aim of IMU wouldbe to become a centre of excellence in the content andquality of maritime training and also seek affiliationto the World Maritime University.
9.4.15 There is also a need for capacity building inthe DG(S), with greater technological tools, training,human resources availability, and greater autonomy forauthorizing surveyor movement to ships on foreignshores and deciding on the delegation of powers toMercantile Marine Department.
Other Issues9.4.16 In view of the increasing traffic in territorialwaters, and with a growing fleet, marine disaster andemergency response system should be established. Forthe protection of the environment, it is also necessaryto develop a ‘Ballast Water Management System’ inaccordance with the requirements of InternationalConvention for the Control and Management ofShips as adopted by the IMO in 2004, along withthe development of waste disposal facilities in ports.Further, in the interest of safe operations of OSVs, aregulatory mechanism should be developed for thissector.
COASTAL SHIPPING9.4.17 Coastal shipping serves as an integral part ofthe supply chain in the domestic and overseas trade ofmerchandise. It is a viable, eco-friendly alternative tothe already stretched rail and road infrastructure withlow socio-economic cost. Apart from their substantialcontribution to the nation’s trade and economy, ship-ping services also play a crucial role as the major sourceof income for the population in many of the coastalStates and act as the lifeline especially for places suchas Andaman & Nicobar Islands and LakshadweepIslands. During 2004–05, the coastal traffic at majorports was 109.80 mt, accounting for 28.6% of the totalmajor ports traffic and growing at 5.81% CAGR. India’scoastal traffic is estimated to increase from 116 mt in

Transport 311
2002–03 to 220 mt by the end of the Eleventh Planperiod (2012). A total of 497 vessels of 8.17 lakh GTcomprised the Indian coastal vessels tonnage as on 31March 2006. During the last decade, coastal shippinghas exhibited significant growth in smaller size vesselssuch as liners, passenger-cum-cargo launches, tugs,ro-ros, dredgers, pilot/survey launches, etc. At present,coastal shipping also includes activities like offshoresupply and multi-purpose support for the oil and gasexploration and production, port and harbour services,and dredging.
9.4.18 With a view to encouraging the growth ofIndian coastal shipping, during the Plan period thegovernment had accorded various concessions andinitiatives to this sector such as certain relaxations incustoms procedures, benefit of tonnage tax, lowervessel and cargo related charges at ports, and provi-sion of dedicated terminals for coastal shipping. Inaddition to its economic advantages coastal shippingalso eases traffic congestions which occur frequentlyin road transport. Despite the inherent advantages,coastal shipping is hampered by inadequate port andlandside infrastructure, the burden of customs duties,cumbersome procedures, and poor port productivity.Considering the positive externalities of coastal ship-ping, there is a need to consider fiscal incentives forregistered multi-modal transport operators, shippers,trade/industries that prefer transporting sizeabledomestic cargoes through coastal shipping.
9.4.19 For improving infrastructure facilities forcoastal shipping, it is important to provide adequaterail and road connectivity to each port along with thedevelopment of required infrastructure for encourag-ing emerging areas with promising potential in coastalshipping sector. Berthing capacities at Indian ports maybe developed to address the needs of coastal shippingand berth space at all terminals may be reserved forcoastal shipping vessels, if so required.
9.4.20 Other policy initiatives relate to manningrequirements, training initiatives, and surveying.Although the manning scale of coastal vessels has beenreviewed in the last few years with an objective to sim-plifying the same, yet it requires further rationaliza-tion. Adequate facilities may be instituted for training
the floating staff to ensure that the operating standardsare upheld and adequately trained hands are available.It is suggested that a Special Training Programme maybe designed specifically for coastal shipping to pro-duce and retain more cadet officers for employmentonly on Near Coastal Voyages. Since there is a short-age of surveyors, with a view to avoiding delays tovessels, the work of surveying may be assigned toclassified surveyors.
MULTI-MODAL TRANSPORTATION9.4.21 The growth of multi-modalism globally, fuelledby increasing trade, containerization, and reducinglogistics costs, has impacted the Indian shipping sce-nario. The physical infrastructure required to propelthe multi-modal movement in India is being addressedin terms of investments in port capacities and infra-structures, port to hinterland connectivity, and port–rail–road interfaces. However, there is also a need tosimultaneously address policy issues such as regula-tion of services, co-ordination in planning, and sim-plification of processes and procedures in customs. Themulti-modal transportation in India is governed bythe Multimodal Transportation of Goods Act 1993which needs to be strengthened in order to addressissues such as liability regime, setting of service stan-dards, registration of service providers, etc. in order toprovide transparency in operations.
SHIPPING CORPORATION OF INDIA (SCI)9.4.22 An outlay of Rs 5800 crore was provided in theTenth Plan for SCI. This included a sum of Rs 1290crore as internal resources and Rs 4510 crore asexternal borrowings. Against this outlay, the expendi-ture was Rs 2381 crore or 41.1% of the total outlay.Due to the speculation regarding its disinvestment,the SCI could only acquire 9 vessels of 0.79 millionGT against the target of acquisition of 39 vessels of2.10 million GT.
9.4.23 The profitability of SCI increased during thePlan. The net profit increased from Rs 241.6 crore toRs 1042.2 crore and the fixed assets increased fromRs 3463.6 crore to Rs 5729.8 crore. As a result, net worthof the SCI rose from Rs 2095.6 crore to Rs 4355.4 croreduring the same period, reflecting a rise in the level ofreserves and surplus from Rs 1852.1 crore to Rs 4077.8
312 Eleventh Five Year Plan
crore. The dividend payment also increased from Rs 98.8crore in 2001–02 to Rs 239.9 crore in 2005–06.
9.4.24 The SCI plans to acquire 62 vessels of variouscategories during the Eleventh Plan period.
DIRECTORATE GENERAL OF SHIPPING, DG(S)9.4.25 The DG(S), a statutory authority under theMerchant Shipping Act 1958, is responsible for imple-menting the Act. During the Tenth Plan, the approvedoutlay for DG(S) was Rs 288.84 crore for the imple-mentation of e-governance, execution of civil works,etc., including an IEBR component of Rs 200 crorefor acquisition of simulators under grant-in-aid fromthe Government of Japan for the maritime traininginstitutes under Indian Institute of Maritime Studies.However, this did not materialize and against theremaining amount of Rs 88.84 crore under GBS, thetotal anticipated expenditure is Rs 63.94 crore.
9.4.26 In the Eleventh Plan period, DG(S) proposesto carry out activities for strengthening the Mercan-tile Marine Department, procuring modern surveyinstruments for Minor Ports Survey Organization(MPSO), and establishing the IMU.
LIGHTHOUSES AND LIGHTSHIPS9.4.27 The Directorate General of Lighthouses andLightships, DG(LL) provides marine aids to navigationalong the Indian coast. At present, there are 169 light-houses, 1 lightship, 22 differential global positioningsystems (DGPS), 48 racons, and 22 deep sea lightedbuoys available as aids to marine navigation. DGLL alsoearns revenue, deriving its income from light dues fromships entering and leaving Indian ports.
9.4.28 During the Tenth Plan, the anticipated revenueearning by DGLL is Rs 507 crore. Against the Planoutlay of Rs 185 crore, the expenditure in this sector isexpected to about 45.9% of the outlay at Rs 85 crore.The major achievements are placement of workorder for establishment of Vessel Traffic Service forGulf of Kachch, installation of racons, and introduc-tion of DGPS. To a certain extent, the progress ofprojects got affected due to tsunami damages alongthe East Coast and Andaman and Nicobar Islands,entailing priority restoration work.
9.4.29 In the Eleventh Plan, the Directorate would betaking up new projects such as visual aids, radio aids,development of information technology, replacementof assets and flotilla, along with new initiatives such asrendering assistance for improvement of local lights,beautification of lighthouses for attracting tourists,establishment of the National Automatic Identifica-tion System network, and the Vessel Traffic Service inthe Gulf of Khambat.
INLAND WATER TRANSPORT (IWT)9.4.30 India has about 14500 km of navigable water-ways which comprises rivers, canals, backwaters,creeks etc. About 45 million tons of cargo (2.5 BTKM)is being moved annually by IWT. Inland WaterwaysAuthority of India (IWAI) was constituted in 1986 forthe development and regulation of inland waterwaysfor shipping and navigation. However, most waterwayssuffer from navigational inadequacies such asshallow waters, narrow width, siltation, and bankerosion. Consequently, its operations are currentlyrestricted to about 5200 km of major rivers and 485km of canals suitable for mechanized craft operations.Today, there are three waterways that have been de-clared as National Waterways (NWs), namely Gangafrom Haldia to Allahabad (1620 km); Brahmaputrafrom Dhubri to Dadiya (891 km); and West CoastCanal from Kottapuram to Kollam, includingChampakara and Udyogmandal canals (205 km), withthe declaration of three more waterways being con-sidered. At present, organized cargo transportation isspread over the Ganga river in NW-I, the Brahmaputrariver in NW-II, West Coast Canal in NW-III, and Goaand Mumbai waterways. The States covered are UttarPradesh, Bihar, Jharkhand, and West Bengal underNW-I; Assam under NW-II; and Kerala under NW-III. A number of private operators provide theirservices in all the three NWs whereas the publicsector Central Inland Water Transport Corporationoperates on NWs I and II.
9.4.31 The cargo movement by IWT increased from197.65 lakh tonnes (1 BTKM) in the Ninth Plan to504.13 lakh tonnes (2.82 BTKM) by 2005–06. Anoutlay of Rs 903 crore was approved for IWT in theTenth Plan, against which an expenditure of Rs 275crore or 30% of the outlay has been made. The

Transport 313
approved Plan outlay for IWAI was Rs 626.73 croreagainst which an expenditure of Rs 386.74 crore or62% of the outlay was made. The expenditure wasmainly incurred on the maintenance of fairway includ-ing procurement of vessels for channel development(dredgers, survey launches, etc.), setting up of termi-nals, provision of navigational aids, procurement ofcargo vessels for demonstration purpose, techno-economic feasibility studies on other waterways,assistance to States under CSS, and Inland Vessel Build-ing Subsidy Scheme to entrepreneurs for procurementof IWT vessels.
9.4.32 With a view to providing an impetuous to thedevelopment of IWT mode, the Government of Indiahad approved the Inland Water Transport Policy whichincludes several fiscal concessions and policy guide-lines for the development of IWT, including encour-aging private sector participation in the developmentof infrastructure and ownership and operation ofinland vessels. IWAI is also authorized for establishingjoint ventures and undertaking equity participationin BOT projects.
9.4.33 The CIWTC was earlier also engaged in activi-ties of ship-building and ship repair, apart fromoperating a fleet of vessels. Following continuous lossessince its inception and the decision to restructureCIWTC, Rajabagan Dockyard has been transferred toGarden Reach Ship Builders and Engineers on 1 July2006 on outright sales basis. In respect of decision onwriting off interest and conversion of outstandingprincipal amount into equity, a suitable provision hasbeen made in the Supplementary Budget 2006–07by the Minister of Finance. Regarding disinvestmentof CIWTC and Voluntary Retirement Scheme (VRS),the government is in the process of assessing viabilityof disinvestment with different sets of employeenumber.
POLICIES AND PROGRAMMES IN THEELEVENTH PLAN9.4.34 The focus in the Eleventh Plan would be to putrequisite infrastructure on the existing waterways tomake them fully functional, along with the develop-ment of new waterways. By the end of the EleventhPlan, three waterways, namely, canal system from
Kakinada to Pondicherry integrated with Godavari andKrishna rivers (1095 km), East Coast Canal integratedwith Brahmani river and Delta of Mahanadi river(623 km), and Barak river in Assam (152 km) are tobe added to the existing three NWs, taking the cover-age up to 4500 km.
9.4.35 For IWT to play a more meaningful role inmulti-modal transportation, the planning and devel-opment process for IWT requires a structured andscientific approach. The investments required foraugmenting the existing IWT infrastructure need toconsider overall, end-to-end traffic movement and therequisite phasing of the project for holistic growth. Theentire process of project formulation and approvalsneed to be systemized. IWAI may prepare a compre-hensive proposal for each waterway for approval ofExpenditure Finance Committee/Public InvestmentBoard (EFC/PIB) and funds may be released accord-ing to the phasing as approved for these projects. TheIWAI needs to identify some viable stretches and theirdevelopment may be accorded high priority. Ministryof Shipping needs to formulate the developmentprogramme on the above lines.
9.4.36 During the Eleventh Plan, emphasis would belaid on co-operation with Bangladesh for achievinghigher exports and better connectivity to NER, byadding more protocol routes, more ports of call, andimproved cargo handling facilities on protocolroutes. Uniformity in the legal regime and conducive,hassle-free inter-state IWT operations must also befostered. Amendments in the Indian Vessels (I.V.) Act1917 may be considered along with formulation ofmodel IV rules framed by IWAI, for State Governmentsto follow.
OUTLAY FOR THE ELEVENTH PLAN9.4.37 The Eleventh Plan outlay for the shippingsector is Rs 1000 crore at 2006–07 price (Rs 1131 croreat current price). The scheme-wise break-up of GBSat current prices is given in the Appendix (Volume III).The sector is also expected to generate IEBR amount-ing to Rs 12285 crore at 2006–07 price. In addition,the budgetary support for ship-building and repairs isRs 150 crore (Rs 170 crore at current price). The IEBRfor this sector is Rs 550 crore at 2006–07 price.

314 Eleventh Five Year Plan
9.5 PORTS9.5.1 Ports constitute the inter-modal interface be-tween maritime and road and rail transport. India hasa coast line of around 7517 km with 12 major portsand 187 notified non-major (minor/intermediate)ports along the coast line and sea islands. Almost 95%by volume and 70% by value of India’s global mer-chandise trade is carried through the sea route. In2006–07, the 12 major ports handled about 73% ofthe maritime cargo of the country. The balance 27%was handled by the non-major ports. Overseas cargoaccounts for about 77% of the total cargo handled atIndian ports. Of the 12 major ports, 11 are adminis-tered by the respective Port Trusts and Ennore Port,the 12th major port, which started functioning inFebruary 2001, is corporatized.
REVIEW OF THE TENTH PLAN
Traffic and Capacities9.5.2 The projected traffic for the Tenth Plan periodwas 415 million tonnes for the major ports and 150million tonnes for the minor ports, making an overalltarget of 565 million tonnes. The achievements havebeen more than the targets in the case of major portsand are likely to exceed the targets in the case of non-major ports also. Major ports have handled 463.84million tonnes and non-major ports are expected tohave handled around 171.92 million tonnes during2006–07. The actual traffic handled as on 31 March2006 is 423.42 million tonnes at major ports and 151.14million tonnes at non-major ports. The commodity-wise traffic handled in the terminal year of the Tenth
Plan is given in Table 9.5.1 and year-wise details aregiven in Annexure 9.5.1. Year-wise and port-wise(major ports) physical achievements are given inAnnexure 9.5.2.
9.5.3 The increase of about 70 million tonnes over thetarget is primarily due to the increase in quantum ofiron ore exports to countries such as China, Japan, andSouth Korea. The traffic in fertilizer (including FRM),break bulk cargo, and containers also exceeded theprojections. On the other hand, there was a shortfallin POL, since the port facilities of Nagarjuna OilRefineries Ltd and LNG handling facilities at Ennoreand Cochin expected to be commissioned during thePlan period did not materialize. There is also a short-fall in coal traffic against the projections as the newpower plants expected to come up at New Mangaloreand Mumbai have not materialized.
9.5.4 The actual capacity of major ports at the startof the Tenth Plan was 343.95 million tonnes which wastargeted to go upto 470.60 million tonnes by the endof the Tenth Plan. However, the actual capacity ofmajor ports at the end of the Tenth Plan is likely tohave gone upto 504.75 million tonnes by 31 March2007, showing an increase of 160.80 million tonnesduring the Plan period. Such capacity addition wasachieved as a result of implementation of spill-overschemes of the Ninth Plan as well as new schemes dur-ing the Tenth Plan and improvement in productivity.Thus, the capacity of 504.75 million tonnes of majorports at the end of the Tenth Plan was a little over theactual traffic of 463.84 million tonnes. There has to be
TABLE 9.5.1Tenth Plan Cargo Traffic Targets and Achievements
(Million Metric Tonnes)
Commodity Tenth Plan Target Actual in 2006–07
Major Ports Non-major Ports (Prov.) Total
POL 235.30 154.35 81.87 236.22Iron ore 65.50 80.56 29.21 109.77Coal 88.30 60.22 14.05 74.27Fertilizers, incl. FRM 18.45 14.11 7.05 21.16Containers 66.10 73.47 5.0 78.47Other cargo 91.35 81.13 34.74 115.87Total 565.00 463.84 171.92 635.76
Note: Prov.= Provisional.

Transport 315
greater cushion for making allowance for bunching oftraffic. The details of the capacity addition of 160.80million tonnes are given in Table 9.5.2.
TABLE 9.5.2Tenth Plan—Capacity Added to Major Ports
(Million Metric Tonnes)
Commodity Capacity Addition Capacityas on during the as on
31 March 2002 Tenth Plan 31 March 2007
POL 135.35 39.35 174.70
Iron ore 43.60 13.90 57.50
Coal 44.20 2.05 46.25
Containers 37.00 51.08 88.08
Other cargo 83.80 54.48 138.22
Total 343.95 160.86 504.75
Productivity9.5.5 The average turnaround time for all major portshas improved from 4.24 days during the last year ofthe Ninth Plan to 2.58 days during the last year of theTenth Plan. Among the ports, Chennai, Tuticorin,Mumbai, Jawaharlal Nehru Port Trust (JNPT), andKandla have shown appreciable improvement. Thepre-berthing detention, which showed substantialimprovement and reduced to 4.9 hours in 2003–04as compared to 11.5 hours during the last year ofthe Ninth Plan, slipped down slightly in the lasttwo years of the Tenth Plan (but was still betterthan the Ninth Plan performance). Among the ports,improvement has been noticed in Paradeep,Chennai, Tuticorin, Ennore, and New Mangalore. Theoutput per ship berth day has also shown consistentimprovement during the Plan period as detailed inTable 9.5.3.
9.5.6 The major factors contributing to deteriorationin average pre-berthing retention time in the lasttwo years were priority berthing and ousting priorityto vessels carrying foodgrains and fertilizers notablyin the ports of Kandla, Haldia Dock System in KolkataPort, and Vishakhapatanam Port; bunching of vessels;and lack of mechanized cargo handling equipmentfor certain dry bulk commodities. Though the cargohandled was within the total capacity of the ports, therewas shortfall in the capacity of certain commoditiesin some specific ports. Inadequate port capacity leadsto congestion, thereby leading to ship detention, etc.Most of the ports are not equipped with latest naviga-tional aides and facilities such as Vessel Traffic Man-agement System, sophisticated marine crafts, etc.,channel restrictions in width leading to unidirectionalmovements, number of dedicated berths available be-ing limited leading to bunching of vessels and callingof larger vessels combined with inadequate cargo han-dling equipments are the other factors contributing toincrease in detentions.
Private Sector Participation9.5.7 The government has put in place a schemefor private participation in major ports mainly incontainer terminals, specialized cargo berths, ware-housing/storage facilities, etc. on BOT basis with aconcession period not exceeding 30 years. The schemealso includes formation of joint venture by the portswith the private operators selected on the basis ofcompetitive bidding. The scheme did not take off asexpected during the Tenth Plan. Necessary policyinitiatives in respect of management control, etc., arerequired to be evolved for facilitating the formationof joint ventures. In case of non-major ports, the VGF
TABLE 9.5.3Tenth Plan—Productivity Parameters of Major Ports
Year Average Turnaround Average Pre-berthing Average Output perTime (Days) Detention (Hours) Ship Berth Day (Tonnes)
2001–02 (Ninth Plan) 4.24 11.53 7158
2002–03 3.69 6.90 8455
2003–04 3.45 4.90 9079
2004–05 3.41 6.03 9298
2005–06 3.41 8.73 9586
2006–07 2.58 9.94 12612
316 Eleventh Five Year Plan
scheme of the GoI will have to be made compatiblewith the requirements and the operational imperativesof the sector so as to enable the non-major ports toaccess these funds. During the Tenth Plan period,private sector schemes costing Rs 11257 crore wereidentified, eight schemes costing Rs 2435 crore havebeen completed with incremental capacity addition of44.40 million mt, another six schemes costing Rs 3818crore have already been awarded to private operatorswhich are expected to create an additional capacity of45.50 million mt.
Sethusamudram Channel Project (SSCP)9.5.8 SSCP, sanctioned in June 2005 with the objec-tive of creating a navigable channel from Gulf ofMunnar to Bay of Bengal/Palk Bay, would save up to424 nautical miles of navigation and up to 30 hourssailing time for ships plying between the east andwest coasts. For the project with an estimated costof Rs 2427.40 crore, an SPV, the SethusamudramCorporation Ltd was formed with equity participa-tion of Rs 495 crore by the government.
Tsunami Rehabilitation Programme9.5.9 The Tsunami Rehabilitation Programme initi-ated after the severe earthquake and tsunami wavesseverely damaged the 56 ports, harbours, jetties, wharfs,and allied structures, especially in the southern islandsof Hut Bay, Car Nicobar, Nan Cowry group of islands,and Great Nicobar, at an estimated cost of Rs 897.31crore, is to be completed by March 2009.
Tenth Plan Outlay and Expenditure9.5.10 An outlay of Rs 5418.29 crore had beenapproved for the port sector, comprising Rs 972 croreas GBS and Rs 4446.29 crore through IEBR. However,year-wise allocations were aggregated to Rs 5954.84crore (details are given in Annexure 9.5.3) of whichRs 2892.65 crore or 48.58% was utilized. The acuteshortfall in expenditure, particularly in respect ofmajor ports, is due to failure of project formulationleading to delays in implementation and savings onaccount of schemes dropped/deferred.
EMERGING SCENARIO IMPACTING THE PORT SECTOR9.5.11 In the backdrop of doubling of India’s share inthe world trade in the next five years, efficiency and
speed in the movement of cargo through ports arevital. Shipping and cargo technologies are changingrapidly; ships are bigger and faster with large-sizedcontainer vessels drawing 14.5 m draft and moving atspeeds of 25 knots; and containerization of traffic isgrowing steadily and significantly.
9.5.12 To meet such challenges, initiatives takeninclude Electronic Data Interchange (EDI)-basedsingle window clearance in many ports and develop-ment of an International Container TransshipmentTerminal at Cochin. Non-major and private ports haveseen spectacular growth. Notably, non-major portsincreased their share of cargo traffic from 23.58% in2000–01 to 27% in 2006–07 while their traffic volumegrew by 11.74% (CAGR) in the last five years against8.54% for major ports. However, the growth of trafficin non-major ports was skewed across coastal States,with Gujarat handling more than 60%.
9.5.13 Nevertheless, much more needs to be done bythe Indian ports to improve their operational efficiencythrough enabling policies, regulatory and institutionalmechanisms adopted to raise port efficiency, produc-tivity, human resource planning, and equipment,initially to achieve the benchmarks of efficient portsin the region and to eventually become world class.
ISSUES AND STRATEGIES FOR THE ELEVENTH PLAN
Capacity Augmentation9.5.14 To meet the overall projected traffic of 1008.95million tonnes by 2011–12, of which the share ofmajor ports would be 708.09 million tonnes, adequateport capacity is required to be created, the details ofwhich are given in Table 9.5.4.
Dredging9.5.15 In this crucial component of port capacity, only11% of the target for capital dredging could be achievedduring the Tenth Plan period. The requirement ofcapital dredging in the Eleventh Plan has increasedmore than two-fold, to 298.28 million cubic metres(MCuM) for major ports and SSCP and 367.18 MCuMfor non-major ports, besides maintenance dredgingof 380.06 MCuM and 33.89 MCuM, respectively. Dur-ing the Eleventh Plan, dredging capacity of ports would

Transport 317
be 29.73 MCuM per annum and that of the DredgingCorporation of India (DCI) 168 MCuM per annum.
9.5.16 To enable this capacity creation, a more liberaldredging policy has been brought into force whichallows ports to charter foreign flag dredgers after grant-ing the Indian companies the ‘first right of refusal’.It is necessary to consider the policy option of procur-ing the required dredgers from private dredgingcompanies on a long-term basis, with appropriateguarantees and risk-sharing with the terminal opera-tor incorporated in the concession agreement. JointVentures should be preferred for projects with a sub-stantial dredging component.
9.5.17 Cargo traffic in general and container trafficin particular is concentrated in western ports leadingto congestion and delays. Western ports are typicallyused even for much of the East Sea lane traffic, whichis about 40% of total container traffic. The develop-ment of dredging facilities to handle container vesselsrequiring deeper drafts at the eastern ports should beprioritized in the Eleventh Plan.
DREDGING CORPORATION OF INDIA (DCI)9.5.18 The capacity of the DCI, established in 1976,to provide integrated dredging services to major andminor ports at the beginning of the Tenth Plan was
73.60 MCuM of Trailer Suction Dredgers (TSDs) and6.25 MCuM of Cutter Suction Dredgers (CSDs). Dueto delays in finalization of procurement orders for thedredgers, there was no capacity addition during theTenth Plan. The expenditure for the Tenth Plan isRs 206.12 crore as against the outlay of Rs 365 crore.
9.5.19 During the Eleventh Plan, DCI proposes toacquire 10 TSDs of 5000–9000 CuM hopper capacityand 5 CSDs of 2000–3000 CuM hopper capacity inaddition to other auxiliary equipment.
DEVELOPMENT OF NEW DEEP DRAFT PORTS9.5.20 In order to meet the expected growth in trafficat ports of 10% and more, necessary feasibility andlocational studies for developing some more ports,especially on the East Coast, are being undertaken.
PRODUCTIVITY9.5.21 Improvement of labour productivity throughenhanced training and redeployment of surplus humanresources is a major area to be addressed during theEleventh Plan. Equally important, ports would needto pay greater attention to selection, deployment, andoperation as well as maintenance of the cargo handlingequipment, with on-time replacement of obsoleteequipment with state-of-art multi-tasking flexibleequipment guided by specified procedures for disposal
TABLE 9.5.4Capacity Creation and Projected Traffic in Major Ports in the Eleventh Plan
(Million Metric Tonnes)
Port Projected Traffic Existing Capacity Capacity Addition Total Capacityin 2011–12 2006–07 by 2011–12 in 2011–12
Kolkata 13.43 13.40 18.85 32.25Haldia 44.50 43.50 21.20 64.70Paradeep 76.40 56.00 55.00 111.00Vishakhapatnam 82.20 58.50 52.40 110.90Ennore 47.00 13.00 51.20 64.20Chennai 57.50 50.00 23.50 73.50Tuticorin 31.72 20.55 43.43 63.98Cochin 38.17 20.15 35.40 55.55New Mangalore 48.81 41.30 22.50 63.80Mormugao 44.55 30.00 37.46 67.46Mumbai 71.05 44.65 48.16 92.81JNPT 66.04 52.40 43.90 96.30Kandla 86.72 61.30 58.80 120.10Total 708.09 504.75 511.80 1016.55

318 Eleventh Five Year Plan
of surplus/obsolete equipment. Competition fromprivate operators is already showing some improve-ments in productivity of public berths.
DWELL TIME9.5.22 The dwell time of cargo in Indian ports is highon account of many constraints. The workflow inIndian ports is manual with low level of IT penetra-tion. For container handling, adequate electronicenvironment with Enterprise Resource Planning(ERP), which enables the resources of ports to be usedin an even and efficient manner, is yet to be establishedin a full-fledged manner. The EDI, which ensures flowof data electronically between port, customs, shippinglines, and users, resulting in greater accuracy, speed,and efficiency of the total maritime logistic chain, isyet to be commissioned on a common platform. Thisinformation bottleneck is estimated to contribute toabout 40% of the documentation. At present, EDI isminimal and consists of the proprietary message ex-change format formulated by customs. To maximizethe benefits of EDI and move towards a paperlessregime, necessary steps have been already initiated toimplement centralized web-based Port CommunitySystem (PCS), which would ultimately achieve seam-less integration of the port community. Besides theabove, there are other constraints such as inadequateinfrastructure, absence of seamless connectivity withother modes, etc. A Committee of Secretaries has goneinto these issues and made suitable recommendationsindicating time frames ranging from December 2007to June 2010. After implementation of these recom-mendations, the expected reduction in terminal dwelltime for dry bulk, break bulk, and containers, respec-tively, would go down from the existing 3.23, 5.62, and1.88 days to 1.60, 1.50, and 1.00 days in the case ofimports and from 3.57, 6.60, and 3.78 days to 1.70,3.30, and 1.50 days in the case of exports.
RISK MANAGEMENT SYSTEM (RMS) OF CUSTOMS9.5.23 Two main customs components of detentionof cargo at ports are assessment and examination atports. Implementation of RMS is expected to bringabout significant reduction in detention to cargo atports. The basic approach of the RMS is to ‘trust theaccredited trade partners’ and involves self-appraisaland use of minimal and appropriate intervention to
address perceived risks. The scheme of the RMSincorporates an Accredited Clients Programme whichenvisages assured facilitation to clients who meet speci-fied criteria in terms of amount of duty paid, volumeof imports, and a clean compliance record. Theirimports will be subject to a small percentage ofsystem-generated random checks in order to monitortheir continuing compliance and to retain an elementof surprise. In respect of non-accredited clients’ im-ports, the RMS will determine the treatment to begiven to individual transactions on the basis of anassessment of risks associated with such transactions.The purpose is to ensure that the department’sresources are focused on high risk areas so that thethreats to revenue and restriction/prohibitions onimports are effectively tackled. A large number of lowrisk bills of entry are cleared on the basis of self-appraisal mode, without any assessment and exami-nation by officers.
PRIVATE SECTOR PARTICIPATION9.5.24 The bulk of capacity augmentation would beundertaken through the PPPs and captive users. Newberths at major ports would be constructed throughPPP mode, except where operational exigencies neces-sitate taking up development of new berths throughthe ports’ own resources. In addition to the areasalready identified, possibilities for inviting privateinvestment in maintenance dredging operations andpilotage would also be explored during the EleventhPlan period. For providing stable policy and regula-tory framework, the existing model bid documentsincluding the concessions agreement are beingrefined on the basis of the experiences gathered fromthe existing PPP projects. A new MCA is being devel-oped taking into account all the experience fromexisting private terminals and the concerns of all stake-holders.
NON-MAJOR PORTS9.5.25 Traffic at non-major ports and private ports isgrowing at 11.74% (CAGR) and its share is expectedto grow from 26.30% in 2005–06 to 30% in 2011–12.During the Eleventh Plan, non-major ports are ex-pected to more than double their capacity, from 228.31million tonnes upwards to 575 million tonnes. Thetotal value of the developmental schemes to be taken

Transport 319
up during the Eleventh Plan amounts to aroundRs 36000 crore, with contribution predominantly fromprivate entities.
9.5.26 A holistic and integrated development perspec-tive of major and non-major ports is necessary asthey would complement and compete with each other.Suitable policies need to be devised so that non-majorports also act as centres of growth with appropriatecoordination among the maritime States and theCentral agencies.
TARIFF REGULATION9.5.27 Increasing induction of private players in portoperations is resulting in the gradual emergence of acompetitive environment. The multiplicity of portoperators has brought into focus the pressing need foran institutional mechanism that provides a level play-ing field for all port operators. Areas such as naviga-tional safety, security, and conservancy in ports; safetyand occupational health; disaster management; andpollution control measures would also need to beregulated by a national authority. The jurisdiction ofTariff Authority for Major Ports is restricted to the levyof tariffs for services rendered by major ports orby private operators authorized by them. A suitableregulator and a regulatory framework to addressissues specific to the ports should be put in place.
INSTITUTIONAL REFORMS9.5.28 To make port management more responsive tothe dynamic and growing needs of port users, it would
be necessary to impart (i) financial and operationalautonomy to them, (ii) separate regulatory and man-agement functions with a view to commercialize thelatter, (iii) improve access to long-term capital andproject finance, and (iv) unbundle various services andprivatize identified areas.
CORPORATIZATION9.5.29 Corporatization of Ports Trusts would providebetter accessibility to funds, create a board-managedcorporate entity, and facilitate disinvestment. On theother hand, corporatization with revaluation of assetscould merely push up tariffs without the port usersseeing any change in the quality of service, if such amove is not supported by other reforms. The provi-sions of the Major Port Trusts Act can be purposefullyinvoked to serve the desired purpose in tandem withjudicious privatization of the port services with thePorts Trusts playing a landlord’s role. Where a particu-lar service does not generate a sufficient stream ofrevenue and is thus non-viable for total privatization,the JV route for attracting private investment andmanagement expertise should be encouraged.
9.5.30 For improving productivity, quality of service,and enhancing their competitiveness, the existingstructure in the major ports would be reoriented forrendering port services, consistent with the practicesfollowed in the Landlord Port Model.
IT IN PORTS9.5.31 So far, from amongst the two basic IT systems,namely, Application Software to manage the opera-tion of ports and EDI to facilitate appraisal andpayment of duty without any human interface, theport–user interface has been achieved in some of theports, while EDI has been introduced and port–customs interface achieved in all major ports, exceptParadeep. Now, all activities across the maritimetransport chain have to be integrated through onecommon standard PCS. It is expected that PCS inmajor ports would be implemented in the first yearof the Eleventh Plan. The ports should draw up theirIT Policy with the objective to develop and deploystate-of-art information and communication tech-nologies to maximize the port’s efficiency and effec-tiveness.
Box 9.5.1Tariff Setting Mechanism
The present ‘cost plus’ tariff setting mechanism combinedwith the revenue sharing model for the PPP projects hascertain inconsistencies. The Task Force, set up under thechairmanship of Anwarul Hoda, Member, PlanningCommission, to examine the tariff setting mechanismand bidding parameters for PPP projects has noted thattariffs to be charged by port operators would be deter-mined by market forces once adequate capacity is devel-oped and sufficient competition introduced. However, inthe interim the berths should be bid out after determin-ing the tariff caps up front on the basis of norms to bedeveloped for the purpose. As at present the revenue sharewould continue to be the sole bidding parameter.
320 Eleventh Five Year Plan
9.5.32 In sum, the thrust of IT in port sector in theEleventh Plan would be: (i) to implement centralizedweb-based EDI-PCS at major ports and to furtherextend this to supply chain management system andto bring other ports into its ambit, (ii) to gear up portsto have Radio Frequency Identification (RFI) devicereader to capture the data from RFI device tags onshipments, and (iii) to implement centralized ERPcovering all major ports.
HINTERLAND CONNECTIVITY9.5.33 Apart from other deficiencies, port efficiencyis impeded owing to the port’s inability to handleadditional traffic because of slow evacuation of cargofrom ports or slow turnaround of ships. This under-mines the competitiveness of Indian ports vis-à-visother ports in the region, and vitiates the environmentfor investment in manufacturing in the country. There-fore, it is important that connectivity of major portswith the hinterland is augmented not only to ensuresmooth flow of traffic at the present level but also tomeet the requirements of projected increase in traffic.
9.5.34 The recommendations of the Committee ofSecretaries constituted to address hinterland connec-tivity include construction of a four-lane road as wellas double railway line connectivity for each major port,consideration of projects less than minimum pre-scribed IRR on case to case basis, and consideration ofbudgetary assistance and also the assistance under VGFscheme for such projects. The Committee furtherrecommended that 10 road projects of value Rs 2036crore and 8 rail projects of value Rs 2014 crore, whichhad already been sanctioned, should be completed ina time-bound manner. All approved recommendationsare to be implemented within a period of three years,that is, by 2009.
ANDAMAN LAKSHADWEEP HARBOUR WORKS(ALHW)9.5.35 ALHW was set up in 1965 for planning, execu-tion, and maintenance of port and harbour facilitiesin the Andaman and Nicobar Islands and LakshadweepIslands. During the Tenth Plan, construction of break-waters at Mus in Car Nicobar and extension of wharfat Hut Bay in Little Andamans were completed.Embanking facilities at Agathi, Amini, and Minicoy and
Kawaratti in Lakshadweep, and development works ofJunglighat Harbour in Port Blair and deep water wharfin Campbel Bay have been taken up. Against the TenthPlan outlay of Rs 200 crore, expenditure incurred till31 March 2007 was Rs 144.20 crore.
OUTLAY FOR THE ELEVENTH PLAN9.5.36 The Eleventh Plan budgetary support forCentral sector ports is Rs 3315 crore at 2006–07 price(Rs 3749 crore at current price). The scheme-wisebreak up of GBS at current prices is given in the Ap-pendix (Volume III). In addition, the sector is expectedto generate IEBR of Rs 26574.11 crore at 2006–07 priceand private sector investment of Rs 36868.00 croreduring this period. Further, a public investment ofRs 3627.00 crore is expected in the State sector.
9.5.37 The total projected outlay for the Eleventh Planfor the Department of Shipping (including Ports) isRs 43874 crore at 2006–07 price (Rs 49623 crore atcurrent price) which includes Rs 4465 crore of GBSat 2006–07 price (Rs 5050 crore at current price) andRs 39409 crore of IEBR at 2006–07 price (Rs 44573crore at current price).
9.6 CIVIL AVIATION
OVERVIEW9.6.1 Air transport is the preferred mode of transportespecially for long-distance travel, business travel,accessing difficult terrains, and for transporting high-value and perishable commodities mainly on accountof the speed of travel and saving of time. With theopening up of domestic skies to private carriers in thesecond half of the Tenth Plan, air services have becomeaffordable and are now effectively competing withother modes of transport. Propelled by growth of theeconomy and liberalization, the sector experienced anunprecedented growth during the Tenth Plan, accel-erating particularly in its last three years.
REVIEW OF THE TENTH PLAN9.6.2 During the Tenth Plan an outlay of Rs 12928.00crore was provided to the Ministry of Civil Aviation(MoCA), out of which Rs 7792.09 crore or 60% ofthe outlay was spent by them. However, against a sumof Rs 672.73 crore provided as GBS, the expenditure

Transport 321
incurred was to the tune of Rs 546.10 crore or 81%.Details of outlay and anticipated expenditure are givenin Annexure 9.6.1.
9.6.3 Important developments in the airline andairport sector included: (i) modernization and restruc-turing of Delhi and Mumbai airports launchedthrough JV companies; (ii) development of greenfieldair-ports at Bangalore and Hyderabad on a Build–Own–Operate–Transfer basis with PPP; (iii) approvalof modernization of 35 non-metro airports and13 other airports to world-class standards in phases;(iv) liberalization of FDI limit upto 100% throughautomatic route for setting up greenfield airports;(v) acquisition of modern and technologicallyadvanced aircraft for Air India (AI) Ltd, Air IndiaCharters Ltd (AICL), and Indian Airlines Ltd; (vi) lib-eralization of bilateral air services agreement in linewith the contemporary developments in internationalcivil aviation sector; (vii) adoption of a limited OpenSky Policy in international travel to meet the trafficdemand during peak season; and (viii) adoption oftrade facilitation measures in custom procedures tofacilitate speedy clearance of air cargo.
ELEVENTH PLAN
Objectives9.6.4 The main objectives of the Civil Aviation Sectorfor the Eleventh Plan would be to provide (i) world-class infrastructure facilities; (ii) safe, reliable, andaffordable air services so as to encourage growth inpassenger and cargo traffic; and (iii) air connectivityto remote and inaccessible areas with special referenceto north eastern part of the country.
Strategies9.6.5 The realization of above objectives would callfor capacity building that will include modernizationand expansion of major international and domesticairports, construction of new greenfield airportsincluding that of the NER, enhancement of cargo han-dling facilities at all airports, and upgradation/mod-ernization of Air Traffic Management (ATM) System.
9.6.6 Similarly, in the airline sector, acquisition ofmodern fuel-efficient aircraft fitted with the latest
equipment would be encouraged. The capacitybuilding process in both airlines and airports wouldbe mainly through increased private sector participa-tion. While a decision has been taken to modernizethe non-metro airports through the Airports Author-ity of India (AAI), the city side development at theseairports would be done through PPP. Two major metroairports (Delhi and Mumbai) and two greenfieldairports (Bangalore and Hyderabad), which would becompleted during the Eleventh Plan, are already beingdeveloped through PPP. A similar strategy is envisagedfor the Navi Mumbai airport for which in-principleclearance has been given. While the existing airportsat Kolkata and Chennai would be developed by AAI,the greenfield airports at these locations will need tobe taken up through PPP.
9.6.7 Acute shortage of technical and operating man-power would be addressed by upgrading the existingtraining institutes and opening new world-class flyingtraining institutes.
Traffic Projections9.6.8 Both domestic and international traffic wit-nessed a boom during the last three years of the TenthPlan, that is 2004–05, 2005–06, and 2006–07, withgrowth in passenger traffic of 21.5%, 23.7%, and31.38%, respectively, resulting in overall growth(CAGR) of 19.23% (13.58% in international passen-ger and 21.78% in domestic traffic) during the TenthPlan. The main factors contributing to this growthinclude the growth of the economy, falling fares, andincreasing capacities of domestic private airlines. It isestimated that international and domestic passengersare forecast to grow at the rate of 15.9% and 19.9%,respectively, resulting in overall increase of 18.8%during the Eleventh Plan. All the Indian airports takentogether, passenger traffic is forecasted at 2054.00 lakh(540.37 lakh international and 1513.63 lakh domesticpassengers) and cargo traffic at 2683.47 thousandmetric tonnes (TMTs) (1822.69 TMTs internationaland 860.78 TMTs domestic cargo) by 2011–12.
9.6.9 Additional capacities of about 296.95 lakhinternational and 1035.74 lakh domestic passengerswould require to be created at 45 major airports by2011–12, as the total international passengers and

322 Eleventh Five Year Plan
domestic passengers projected would be 539.39 lakhand 1489.70 lakh, respectively.
9.6.10 Similarly, during the Tenth Plan, cargo trafficgrew (CAGR) by 12.70% (12.75% international and12.61% domestic cargo). During the Eleventh Plan,international and domestic cargo traffic is expectedto grow at the rate of 12.1% and 10.1%, respectively,resulting in overall increase of 11.4%.
9.6.11 To take care of above growth in respect of cargoterminal, additional capacity would require to becreated to the tune of 800.00 TMTs of internationalcargo traffic and about 300.00 TMTs of domestic cargotraffic by 2011–12.
POLICY FRAMEWORK
Air Transport9.6.12 The main advantage of civil aviation lies in itsspeed particularly over long distances and difficultterrain. A major disadvantage is the high cost of trans-portation on account of high Aviation Turbine Fuel(ATF) cost, which is further aggravated by taxes.Viewed in inter-modal context, it is desirable to ratio-nalize ATF pricing and to review the tax structure.
Multi-modal Connectivity9.6.13 The major airports in India are mostly atconsiderable distance from the city centre. Apart fromcausing inconvenience to the passengers, this alsoadversely affects the comparative advantage in termsof saving in time otherwise enjoyed by air transportvis-à-vis other modes of transport. These airports needto be connected to cities by metros and expressways toget full advantage of air transportation by reducingthe total travel time.
Foreign Equity Participation9.6.14 The Domestic Air Transport Policy approvedby the government provides for foreign equity partici-pation up to 49% and investment by non-residentIndians (NRIs) up to 100% in the domestic air trans-port services. Foreign airlines are, however, not permit-ted to participate in equity directly or indirectly. Witha view to attracting new technology and managementexpertise, this policy needs to be reviewed.
Air Cargo9.6.15 Today, about 40% of the world’s cargobusiness, in terms of value, moves by air. Althoughcargo traffic is growing steadily in recent years it hasnot kept pace with the passenger traffic growth be-cause of shortcomings such as lack of facilities for tran-shipment of imports and exports; absence of integratedcargo infrastructure; deficiencies in gateway andhinterland connectivity through rail and road; com-plexities in custom procedures in air cargo; and needfor technological upgradation and performance-based service standards. To address these shortcom-ings, during the Eleventh Plan, steps will be taken in-cluding (i) streamlining/simplification of proceduresby various regulatory agencies; (ii) provision ofinfrastructural facilities relating to cargo handling;(iii) promoting and developing India as a Regional AirCargo Hub; and (iv) setting up of ‘Cargo Villages’ atkey international airports.
Maintenance, Repair, and Overhaul (MRO)9.6.16 Owing to the availability of skilled manpower,India has the potential to emerge as an MRO hub inAsia Pacific region. Currently, the two merged NationalAirlines, viz., Indian Airlines and AI, have in-houseaircraft maintenance facilities, but at times they toohave to outsource maintenance to foreign companies.At present, there is virtually no credible third-partyMRO facility in India to support the requirements ofthe rapidly expanding aircraft fleets of private opera-tors. The current growth phase provides India an idealopportunity to develop into an MRO hub. Investmentby the private sector including foreign direct investmentwould be encouraged to this end.
Regional Airlines9.6.17 In order to tap the vast potential of growth oftraffic and to encourage balanced growth of civil avia-tion, regional airlines need to be promoted. The pro-motion of regional airlines would, however, be throughmore liberal policy and provision of better infrastruc-ture facilities. The rules and procedures governing theentry may also be simplified.
Route Dispersal Guidelines (RDG)9.6.18 According to the RDG laid down in 1994, allscheduled operators are required to deploy a certain

Transport 323
percentage of their capacity on trunk routes (Category-I routes) to the North Eastern and other inaccessibleareas (Category-II) and within Category-II regions. Inview of the vital changes that have taken place in civilaviation sector since the policy was laid down, it isdesirable to review the RDG to bring them in line withthese developments. One way to make the RDG work-able will be to make the obligation tradable. Anotheralternative could be to provide direct subsidies to op-erators willing to operate in inaccessible and isolatedareas and require the operators on trunk routes to con-tribute towards the subsidy.
Air Connectivity in NER and OtherRemote/Inaccessible Areas9.6.19 In view of the hilly terrain with uneasy accessthrough the land link, improvement of air connectiv-ity and development of airport infrastructure in NERand other remote areas such as the hill States of Jammuand Kashmir, Himachal Pradesh, Uttarakhand, andisland territories of Andaman and Nicobar andLakshadweep need to be accorded top priority.
9.6.20 During the Eleventh Plan, three greenfieldairports, one each at Pakyong in Sikkim, Itanagar inArunachal Pradesh, and Chiethu in Nagaland, wouldbe constructed. In addition, some existing airports inNER would also be taken up for expansion/modifica-tion so as to make them operational for scheduledflights. Airports in other crucial areas such as Jammu,Dehradun, Agatti, and Port Blair would be takenup under the scheme for modernization and up-gradation of 35 non-metro airports.
Air Transport Security9.6.21 Security issues, particularly arising out of theterrorist-related activities, have assumed even greaterimportance in the international environment in recentdecades. The legal and institutional framework for civilaviation security needs to be strengthened by evolvingappropriate technology, training, and equipments.
Role of the Private Sector9.6.22 The private sector is now playing a crucial rolein the development of both airline and airport sector.Its market share in the domestic traffic during 2006reached 78.5%, which includes the 29% traffic of low
cost airlines. Jet Airways has emerged as the marketleader with a share of 31.2%, followed by IndianAirlines (21.5%), Air Deccan (18.3%), Air Sahara(8.8%), Kingfisher (8.7%), Spice Jet (6.9%), Go Air(2.8%), Indigo (1.3%), and Paramount (0.7%). Theprivate sector share is likely to increase during theEleventh Plan with an estimated further acquisitionof additional fleet by them of about 258 aircraftthrough a mix of lease/purchase involving an invest-ment of as much as Rs 71863.00 crore.
9.6.23 The total private investment envisaged for thissector, including Rs 1500.00 crore for city side devel-opment 35 non-metro airports, would be to the tuneof Rs 93493.00 crore during the Eleventh Plan.
NEW INITIATIVES9.6.24 In order to sustain the spectacular growth reg-istered by the civil aviation sector in the last few yearsthrough the Eleventh Plan, the following initiativeshave been taken:
• Model Concession Agreement (MCA) is beingevolved to help attract private investments and alsofacilitate smooth execution of air transport projects.
• Airports Economic Regulatory Authority (AERA)is being established in order to create a level play-ing field and healthy competition amongst allmajor airports (handling more than 1.5 millionpassenger per annum); encourage investment inairport facilities; regulate tariffs of aeronauticalservices; protect reasonable interest of users; andoperate efficient, economic, and viable airports.
• Merger of AI and Indian Airlines to optimize fleetacquisition, to leverage the asset base, to strengthenthe network, and to achieve economy of scale, withestimated cost and synergy benefits (net) of Rs600.00 crore at the end of the third year of merger.
• Human Resource Development (HRD) to mitigatethe acute shortage of qualified personnel, especiallypilots and flying instructors. The following steps arebeing taken in this regard:– Training facilities at Indira Gandhi Rashtriya
Uran Akademi (IGRUA) would be upgraded/augmented.
– A new Flying Training Institute would be set upat Gondia, Maharashtra.
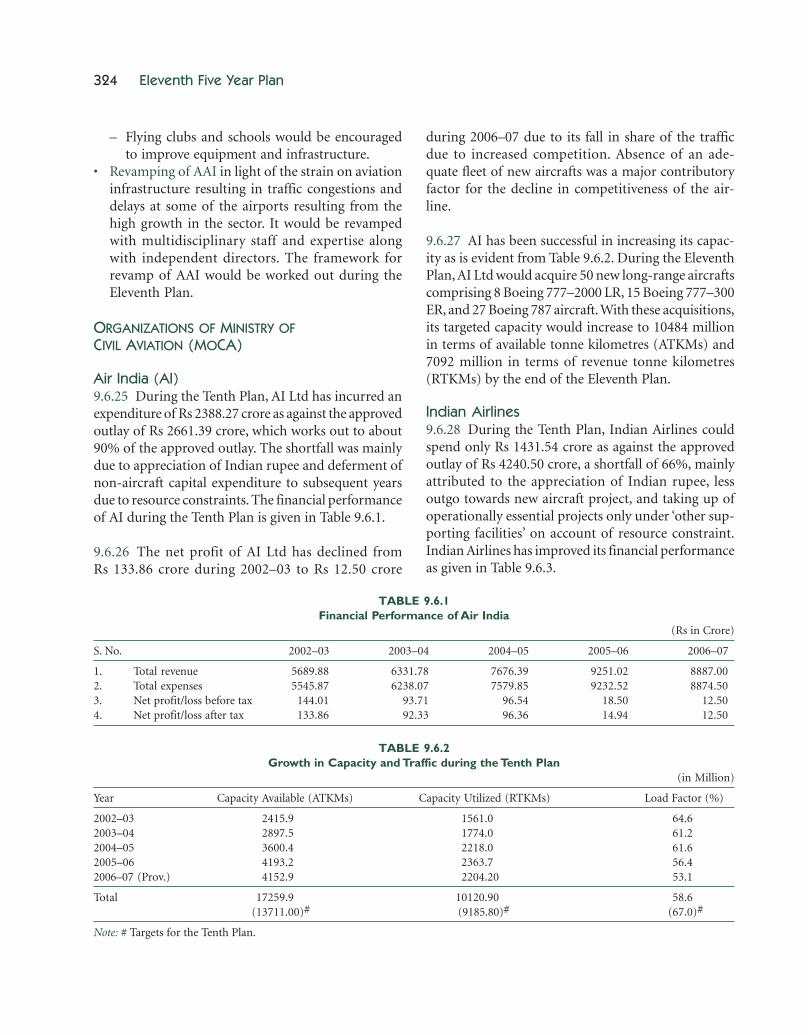
324 Eleventh Five Year Plan
– Flying clubs and schools would be encouragedto improve equipment and infrastructure.
• Revamping of AAI in light of the strain on aviationinfrastructure resulting in traffic congestions anddelays at some of the airports resulting from thehigh growth in the sector. It would be revampedwith multidisciplinary staff and expertise alongwith independent directors. The framework forrevamp of AAI would be worked out during theEleventh Plan.
ORGANIZATIONS OF MINISTRY OFCIVIL AVIATION (MOCA)
Air India (AI)9.6.25 During the Tenth Plan, AI Ltd has incurred anexpenditure of Rs 2388.27 crore as against the approvedoutlay of Rs 2661.39 crore, which works out to about90% of the approved outlay. The shortfall was mainlydue to appreciation of Indian rupee and deferment ofnon-aircraft capital expenditure to subsequent yearsdue to resource constraints. The financial performanceof AI during the Tenth Plan is given in Table 9.6.1.
9.6.26 The net profit of AI Ltd has declined fromRs 133.86 crore during 2002–03 to Rs 12.50 crore
during 2006–07 due to its fall in share of the trafficdue to increased competition. Absence of an ade-quate fleet of new aircrafts was a major contributoryfactor for the decline in competitiveness of the air-line.
9.6.27 AI has been successful in increasing its capac-ity as is evident from Table 9.6.2. During the EleventhPlan, AI Ltd would acquire 50 new long-range aircraftscomprising 8 Boeing 777–2000 LR, 15 Boeing 777–300ER, and 27 Boeing 787 aircraft. With these acquisitions,its targeted capacity would increase to 10484 millionin terms of available tonne kilometres (ATKMs) and7092 million in terms of revenue tonne kilometres(RTKMs) by the end of the Eleventh Plan.
Indian Airlines9.6.28 During the Tenth Plan, Indian Airlines couldspend only Rs 1431.54 crore as against the approvedoutlay of Rs 4240.50 crore, a shortfall of 66%, mainlyattributed to the appreciation of Indian rupee, lessoutgo towards new aircraft project, and taking up ofoperationally essential projects only under ‘other sup-porting facilities’ on account of resource constraint.Indian Airlines has improved its financial performanceas given in Table 9.6.3.
TABLE 9.6.1Financial Performance of Air India
(Rs in Crore)
S. No. 2002–03 2003–04 2004–05 2005–06 2006–07
1. Total revenue 5689.88 6331.78 7676.39 9251.02 8887.002. Total expenses 5545.87 6238.07 7579.85 9232.52 8874.503. Net profit/loss before tax 144.01 93.71 96.54 18.50 12.504. Net profit/loss after tax 133.86 92.33 96.36 14.94 12.50
TABLE 9.6.2Growth in Capacity and Traffic during the Tenth Plan
(in Million)
Year Capacity Available (ATKMs) Capacity Utilized (RTKMs) Load Factor (%)
2002–03 2415.9 1561.0 64.62003–04 2897.5 1774.0 61.22004–05 3600.4 2218.0 61.62005–06 4193.2 2363.7 56.42006–07 (Prov.) 4152.9 2204.20 53.1
Total 17259.9 10120.90 58.6(13711.00)# (9185.80)# (67.0)#
Note: # Targets for the Tenth Plan.

Transport 325
9.6.29 Indian Airlines started earning net profit ofRs 44.17 crore in 2003–04, mainly due to increase indomestic fares and various cost-cutting measuresinitiated by the company. However, increase in ATFprice and fall in passenger yields as a result of intensecompetition in domestic aviation market made thefinancial performance erratic.
9.6.30 During the Tenth Plan, the physical perfor-mance of Indian Airlines, in terms of capacityproduced and utilized, indicates that it has not beenable to achieve the targets, mainly due to delay inacquisition of aircrafts and intense competition fromother domestic airlines, as given in Table 9.6.4. Inorder to increase its capacity and expand network dur-ing the Eleventh Plan, Indian Airlines would acquire43 new Airbus aircrafts, the order for which was placedduring the Tenth Plan. In addition to these aircrafts,Indian Airlines proposes to lease 12 wide-body aircraftsand 8 Turbo Prop aircrafts (50-seater), among others,thereby enlarging the total fleet size to 117 by the endof the Eleventh Plan. At the same time, it proposes tophase out 11 Boeing 737–200, 3 Airbus A 300, and 2Dornier. As a result, the capacity of Indian Airlines isexpected to grow from 1686 million ATKMs to 4238
million ATKMs by the end of the Eleventh Plan.Similarly, the capacity in terms of RTKMs is expectedto grow from 1233 million RTKMs during 2006–07 to3093 million RTKMs during the same period.
Airports Authority of India (AAI)9.6.31 Against the approved budget of Rs 5404.21crore including budgetary support of Rs 250 crore, AAIspent Rs 3534.62 crore including budgetary supportof Rs 150.67 crore during the Tenth Plan. The short-fall in expenditure of 35% was mainly due to defer-ment of projects at Delhi and Mumbai airports due totheir restructuring through PPP, delay in finalizationof certain projects for non-metro airports, and delayin procurement of communication/surveillance anddistance measuring equipment.
9.6.32 The net profit of AAI has increased fromRs 282.05 crore during 2002–03 to Rs 793.71 croreduring 2006–07, thus earning an appreciable totalprofit of Rs 2433.71 crore during the Tenth Plan, asindicated in Table 9.6.5.
9.6.33 During the Eleventh Plan, AAI would be under-taking development of 35 non-metro airports and 13
TABLE 9.6.3Financial Performance of Indian Airlines
(Rs Crore)
S. No. 2002–03 2003–04 2004–05 2005–06 2006–07 (BE)
1. Total revenue 4173.51 4725.67 5362.57 5788.82 7944.002. Total expenses 4370.07 4677.50 5290.96 5725.82 7847.503. Net profit/(loss) before tax (–)196.56 48.17 71.61 63.00 96.504. Profit/(loss) after tax (–)196.56 44.17 65.61 49.50 43.00
Note: BE= Budget Estimate.
TABLE 9.6.4Growth in Capacity and Traffic during the Tenth Plan
(In Million)
Year Capacity Available (ATKMs) Capacity Utilized (RTKMs) Load Factor (%)
2002–03 1308.018 845.097 64.62003–04 1334.069 877.475 65.82004–05 1472.062 1017.284 69.12005–06 1592.642 1140.947 71.62006–07 (Prov.) 1686.29 1232.67 73.1
Total 7393.081 5113.473 69.2(8384.00)# (5793.00)# (69.1)#
Note: # Targets for the Tenth Plan.

326 Eleventh Five Year Plan
other airports; development of Chennai and Kolkataairports; construction of new greenfield airports, in-cluding three in NER; expansion of five airports in NERand other crucial areas; up-gradation of technologyfrom ground-based Communication, Navigation, andSurveillance-Air Traffic Management (CNS-ATM) tosatellite-based CNS-ATM facilities; installation ofnew facilities including security equipment at variousairports; installation of safety and facilitation equip-ment; development of airspace capacity enhancement;and development of IT.
Pawan Hans Helicopters Ltd (PHHL)9.6.34 PHHL has incurred an expenditure of Rs 281.95crore as against an approved outlay of Rs 458.90 crore,which is 61% of approved outlay for the Tenth Plan.The shortfall was due to delay in acquisition of newhelicopters.
9.6.35 In spite of ever increasing ATF price, PHHLcould increase its profit to Rs 49.00 crore in 2006–07from Rs 15.39 crore during 2002–03, as per the detailsgiven in Table 9.6.6.
9.6.36 During the Eleventh Plan, PHHL would add 20more helicopters to expand its present fleet includingfive medium class helicopters with longer range andhigher pay-load capabilities for deep water exploration.
The provision of helicopter support services would alsobe extended, beyond servicing ONGC, National Hydro-electric Power Corporation Ltd (NHPC), Ministry ofHome Affairs, and State Governments, especially ofNorth Eastern States and other remote and inaccessibleStates/UTs, to new areas such as tourism, medicalevacuation, law enforcement, news gathering, intra-citytransportation, and corporate travel. Besides, possibilitywould also be explored to expand its repair and over-haul business by offering repair services to otheroperators as well as by creating a new state-of-art main-tenance centre at Mumbai.
Hotel Corporation of India (HCI)9.6.37 An outlay of Rs 15.00 crore was approved forHCI during the Tenth Plan, against which the expen-diture incurred was Rs 26.27 crore, or 75% more thanthe allocation, mainly on the maintenance and opera-tion of hotels due to delay in their disinvestment.
9.6.38 HCI is expected to earn a profit of Rs 2.19 croreduring 2006–07 after incurring losses for the first fouryears of the Tenth Plan.
9.6.39 The hotels of HCI were recommended for dis-investment and, accordingly, the disinvestment in twohotels, viz., Centaur Hotels at Mumbai airport and JuhuBeach in Mumbai, was completed during 2002–03. The
TABLE 9.6.5Financial Performance of Airports Authority of India
(Rs Crore)
S. No. 2002–03 2003–04 2004–05 2005–06 2006–07
1. Total revenue 2384.49 2630.59 2999.65 3490.46 3431.862. Total expenses 1887.44 2086.63 2314.83 2281.85 1948.153. Net profit/loss before tax 497.05 543.96 684.82 1208.61 1483.714. Provision for tax 215.00 229.00 359.45 490.99 690.005. Profit after tax 282.05 314.96 325.37 717.62 793.71
TABLE 9.6.6Financial Performance of Pawan Hans Helicopters Ltd
(Rs Crore)
S. No. 2002–03 2003–04 2004–05 2005–06 2006–07(RE)
1. Total revenue 205.02 224.00 241.85 199.08 211.502. Total expenses 145.54 158.78 173.90 163.98 177.863. Net profit/loss before tax 24.37 77.84 83.86 64.60 40.304. Profit after tax 15.39 52.69 49.58 47.39 49.00
Note: RE= Revised Estimate.
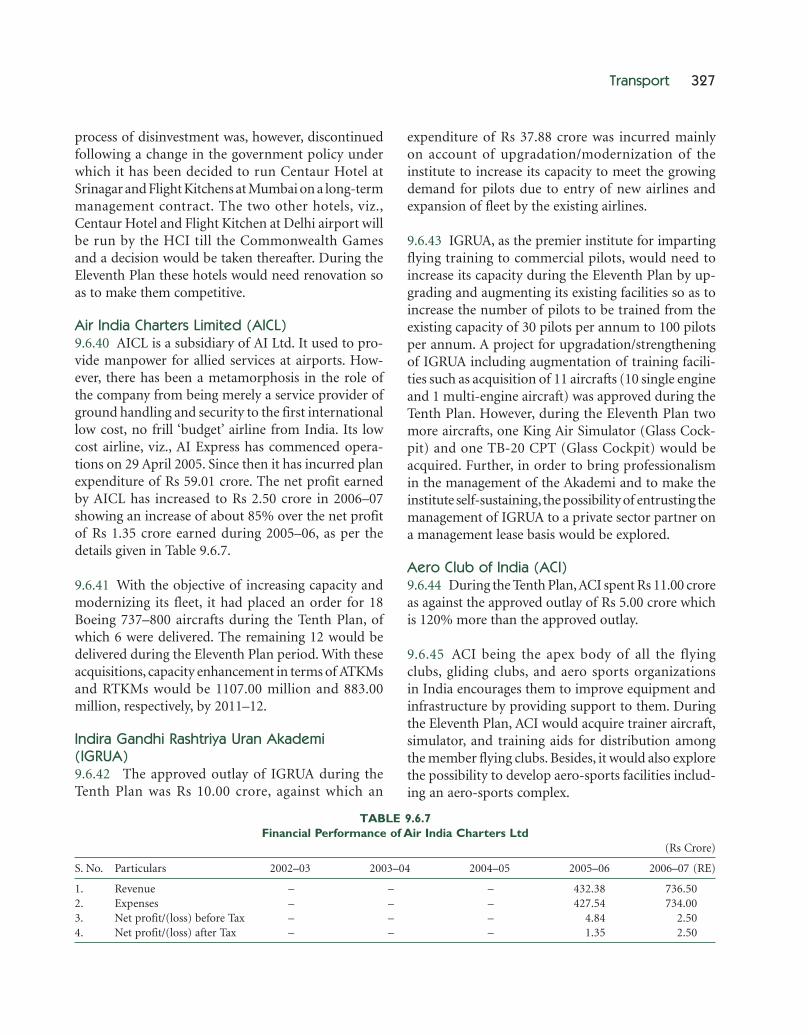
Transport 327
process of disinvestment was, however, discontinuedfollowing a change in the government policy underwhich it has been decided to run Centaur Hotel atSrinagar and Flight Kitchens at Mumbai on a long-termmanagement contract. The two other hotels, viz.,Centaur Hotel and Flight Kitchen at Delhi airport willbe run by the HCI till the Commonwealth Gamesand a decision would be taken thereafter. During theEleventh Plan these hotels would need renovation soas to make them competitive.
Air India Charters Limited (AICL)9.6.40 AICL is a subsidiary of AI Ltd. It used to pro-vide manpower for allied services at airports. How-ever, there has been a metamorphosis in the role ofthe company from being merely a service provider ofground handling and security to the first internationallow cost, no frill ‘budget’ airline from India. Its lowcost airline, viz., AI Express has commenced opera-tions on 29 April 2005. Since then it has incurred planexpenditure of Rs 59.01 crore. The net profit earnedby AICL has increased to Rs 2.50 crore in 2006–07showing an increase of about 85% over the net profitof Rs 1.35 crore earned during 2005–06, as per thedetails given in Table 9.6.7.
9.6.41 With the objective of increasing capacity andmodernizing its fleet, it had placed an order for 18Boeing 737–800 aircrafts during the Tenth Plan, ofwhich 6 were delivered. The remaining 12 would bedelivered during the Eleventh Plan period. With theseacquisitions, capacity enhancement in terms of ATKMsand RTKMs would be 1107.00 million and 883.00million, respectively, by 2011–12.
Indira Gandhi Rashtriya Uran Akademi(IGRUA)9.6.42 The approved outlay of IGRUA during theTenth Plan was Rs 10.00 crore, against which an
expenditure of Rs 37.88 crore was incurred mainlyon account of upgradation/modernization of theinstitute to increase its capacity to meet the growingdemand for pilots due to entry of new airlines andexpansion of fleet by the existing airlines.
9.6.43 IGRUA, as the premier institute for impartingflying training to commercial pilots, would need toincrease its capacity during the Eleventh Plan by up-grading and augmenting its existing facilities so as toincrease the number of pilots to be trained from theexisting capacity of 30 pilots per annum to 100 pilotsper annum. A project for upgradation/strengtheningof IGRUA including augmentation of training facili-ties such as acquisition of 11 aircrafts (10 single engineand 1 multi-engine aircraft) was approved during theTenth Plan. However, during the Eleventh Plan twomore aircrafts, one King Air Simulator (Glass Cock-pit) and one TB-20 CPT (Glass Cockpit) would beacquired. Further, in order to bring professionalismin the management of the Akademi and to make theinstitute self-sustaining, the possibility of entrusting themanagement of IGRUA to a private sector partner ona management lease basis would be explored.
Aero Club of India (ACI)9.6.44 During the Tenth Plan, ACI spent Rs 11.00 croreas against the approved outlay of Rs 5.00 crore whichis 120% more than the approved outlay.
9.6.45 ACI being the apex body of all the flyingclubs, gliding clubs, and aero sports organizationsin India encourages them to improve equipment andinfrastructure by providing support to them. Duringthe Eleventh Plan, ACI would acquire trainer aircraft,simulator, and training aids for distribution amongthe member flying clubs. Besides, it would also explorethe possibility to develop aero-sports facilities includ-ing an aero-sports complex.
TABLE 9.6.7Financial Performance of Air India Charters Ltd
(Rs Crore)
S. No. Particulars 2002–03 2003–04 2004–05 2005–06 2006–07 (RE)
1. Revenue – – – 432.38 736.502. Expenses – – – 427.54 734.003. Net profit/(loss) before Tax – – – 4.84 2.504. Net profit/(loss) after Tax – – – 1.35 2.50

328 Eleventh Five Year Plan
Directorate General of Civil Aviation (DGCA)9.6.46 During the Tenth Plan, an outlay of Rs 19.00crore was provided to DGCA, against which it couldspend only Rs 12.03 crore. The shortfall was due tothe acquisition of lesser number of trainer aircraftsfrom National Aerospace Laboratories (NAL).
9.6.47 With the objective of ensuring safety in airtransport, the existing training programmes of DGCAsuch as Safety Oversight Programme of ICAO, Co-operative Development of Operational Safety andContinuing Airworthiness Programme (COSCAP) andEuropean Union Training Programme will be contin-ued during the Eleventh Plan. The other programmeswhich DGCA would be taking up will be procurementof trainer aircrafts (light helicopters/simulators forrestructuring of flying/gliding clubs/institutions),purchase of machinery and equipment for aircraftaccident investigation laboratories, and modernizationof examination system and civil works at DGCA head-quarters and their field offices.
9.6.48 Keeping in view the acute shortage of techni-cal and operating manpower, it is proposed to estab-lish a new world-class state-of-the-art National FlyingTraining Institute at Gondia, Maharashtra. The mainobjective of the institute is to provide flying trainingto trainees for acquiring Private Pilot Licence, Com-mercial Pilot Licence, Airline Transport Pilot Licence,Micro Pilot Licence, etc. The institute would alsobe utilized for R&D in the field of flying training,aviation-related innovative and practical courses.
Bureau of Civil Aviation Security (BCAS)9.6.49 During the Tenth Plan, BCAS could spendonly Rs 9.52 crore as against the approved outlay of
Rs 114.00 crore, which works out to about 8%. Thehuge shortfall in utilization of funds was mainlydue to non-finalization of schemes, such as restruc-turing of BCAS, construction of additional RegionalDeputy Commissioner of Security Office, settingup of additional Bomb Detection and DisposalSquad (BDDS)/dog squads, and also due to delay incommencing work on setting up the Civil AviationSecurity Academy.
9.6.50 Security in airlines operations has assumedgreater importance especially after the incident of9/11 and threats arising out of other terrorist-relatedactivities. It would be necessary to undertake measuresto strengthen and restructure BCAS, its trainingmethods and training infrastructure, etc. Othermeasures would include electronic perimetersurveillance and protection, automated smartcard access control at airports, setting up ofadditional BDDS and dog squads at the identifiedhyper-sensitive airports, and setting up of CivilAviation Security Training Academy during theEleventh Plan period.
OUTLAY FOR THE ELEVENTH PLAN9.6.51 The total projected outlay for the EleventhPlan for MoCA is Rs 43560 crore at 2006–07 price(Rs 49267 crore at current price) which includes Rs 1680crore of GBS at 2006–07 price (Rs 1900 crore atcurrent price). The scheme-wise break up of GBS atcurrent prices is given in the Appendix (Volume III).In addition, the sector is expected to generate privatesector investment of Rs 93493 crore during this period.The IEBR may go up by Rs 2226.68 crore at 2006–07price on account of higher generation and utilizationby AAI to fund their projects.

Transport 329
ANNEXURE 9.2.2Gross Budgetary Support
(In Rs Crore at Current Price)
Year Capital Special Railway Diesel Cess TotalSafety Fund
Amount Share Amount Share Amount Share Amount Share(Rs Crore) (%) (Rs Crore) (%) (Rs Crore) (%) (Rs Crore) (%)
2002–03 4264 37.6 1350 11.9 164 1.5 5778 51
2003–04 5315 39.8 1600 12.0 166 1.2 7081 53
2004–05 5493 35.5 2975 19.2 201 1.3 8669 56
2005–06 5312 28.3 2499 13.3 262 1.4 8073 43
2006–07 6189 24.8 1365 5.5 360 1.4 7914 33
Total (Provisional) 26573 31.6 9789 11.5 1154 1.4 37516 45
ANNEXURE 9.2.1Resource Mobilization for the Tenth Five Year Plan
(In Rs Crore at Current Price)
Year Internal Resources Market Borrowings Gross Budgetary Support Total
Amount Share Amount Share Amount Share Amount
(Rs crore) (%) (Rs crore) (%) (Rs crore) (%) (Rs crore)
2002–03 3113 27 2517 22 5778 51 11408
2003–04 3475 26 2837 21 7081 53 13393
2004–05 3712 24 3041 20 8669 56 15422
2005–06 7033 37 3731 20 8074 43 18838
2006–07 (RE) 12233 49 4794 19 7914 32 24941
Total (Provisional) 29567 35 16920 20 37516 45 84003
Tenth Plan Outlay 33000 27600 45.5 60600
(54.5%)

330 Eleventh Five Year Plan
ANNEXURE 9.3.1Financial and Physical Performance
(In Rs Crore)
S. No. Schemes/Programmes Financial Performance Tenth Plan
Outlay BE RE Actual Exp.
01 2 3 4 5 6
01. Externally aided projects 13990.00 13050.70 10007.90 9495.18
(i) Externally aided (RW) 2560.00 403.10 99.16 7.53
(ii) Counterpart funds (RW) 640.00 126.00 28.54 4.66
EAP Ministry 3200.00 529.10 128.00 15.53
(iii) Externally aided (NHAI) 8712.00 10015.72 7893.62 5182.70
(iv) Counterpart funds (NHAI) 49.50 0.00 0.00 0.00
(v) Loan to NHAI 2028.00 2504.88 1986.28 1346.78
EAP—NHAI 10789.50 12520.90 9879.98 9479.48
(vi) Strengthening of PIC 0.50 1.00 0.85 0.47
02. Other schemes—NH (O) 8664.00 7443.60 7789.67 7560.85
03. Works under BRDB 950.00 1564.00 1508.00 1525.43
04. Travel expenses (domestic) 20.00 5.27 3.47 3.05
05. Other charges 2.90 1.18 0.53
06. Development of Information Technology 20.00 24.00 14.50 9.44
07. Strategic roads under RW 50.00 1.50 1.50 0.00
08. Strategic roads under BRDB 192.17 202.42 178.30
09. R&D Plg. studies 20.00 24.75 22.75 11.50
10. Training 10.50 17.50 15.50 13.60
11. Machinery and equipment 15.00 37.72 37.72 34.67
12. Charged expenditure 50.00 25.00 25.00 17.79
13. NHAI (investment) 10500.00 15518.19 15518.19 15518.19
14. E&I for States from CRF 500.00 716.11 626.11 374.55
15. E&I for UTs from CRF 31.09 31.09 8.55
16. NHDP-III, two-laning expressways and six-laning 1510.00 810.00 810.00
17. SARDP-NE 1000.00 1000.01 550.0118. Strategic Roads in Arunachal Pradesh under
Ministry of Defence 100.00 100.00 0.00
19. Provision for NER 0.00 0.00 0.00
Total (BS) 34790.00 41264.70 37715.00 36112.05
20. IEBR 24700.00 25500.00 17782.00 12481.90
Grand Total 59490.00 66764.70 55497.00 48593.95
Note: The outlays include provisions for NER also whereas in BE and RE figures the provisions for NER have been segregated andshown separately under item no. 19; Exp. = Expenditure; RW = Road Wing; Plg. = Planning; E&I = Roads of Economic and InterstateImportance; NH (O) = National Highways (Original); BS = Budgetary Support.
(Annexure 9.3.1 contd.)
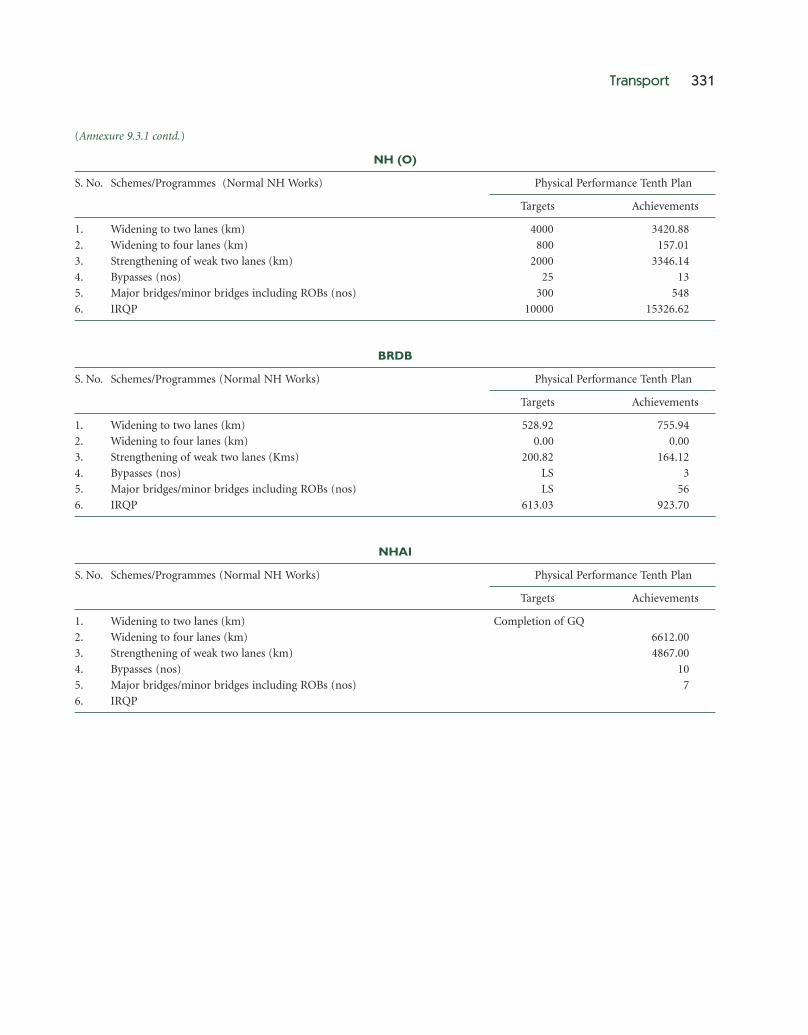
Transport 331
NH (O)
S. No. Schemes/Programmes (Normal NH Works) Physical Performance Tenth Plan
Targets Achievements
1. Widening to two lanes (km) 4000 3420.88
2. Widening to four lanes (km) 800 157.01
3. Strengthening of weak two lanes (km) 2000 3346.14
4. Bypasses (nos) 25 13
5. Major bridges/minor bridges including ROBs (nos) 300 548
6. IRQP 10000 15326.62
BRDB
S. No. Schemes/Programmes (Normal NH Works) Physical Performance Tenth Plan
Targets Achievements
1. Widening to two lanes (km) 528.92 755.94
2. Widening to four lanes (km) 0.00 0.00
3. Strengthening of weak two lanes (Kms) 200.82 164.12
4. Bypasses (nos) LS 3
5. Major bridges/minor bridges including ROBs (nos) LS 56
6. IRQP 613.03 923.70
NHAI
S. No. Schemes/Programmes (Normal NH Works) Physical Performance Tenth Plan
Targets Achievements
1. Widening to two lanes (km) Completion of GQ
2. Widening to four lanes (km) 6612.00
3. Strengthening of weak two lanes (km) 4867.00
4. Bypasses (nos) 10
5. Major bridges/minor bridges including ROBs (nos) 7
6. IRQP
(Annexure 9.3.1 contd.)

AN
NE
XU
RE
9.3
.2C
entr
al R
oad
Sec
tor
Out
lay
and
Exp
endi
ture
—A
t C
urre
nt a
nd C
onst
ant
Pri
ce f
or t
he T
enth
Pla
n(I
n R
s C
rore
)
S.Sc
hem
esTe
nth
Pla
nA
PA
PA
PA
PA
PTo
tal
Tota
l Exp
.
No.
(200
2–07
)(2
002–
03)
(200
3–04
) (
2004
–05)
(20
05–0
6) (
2006
–07)
Ou
tlay
for
at
Cur
ren
t
Ou
tlay
Ou
tlay
Exp
.O
utl
ayE
xp.
Ou
tlay
Exp
.O
utl
ayE
xp.
Ou
tlay
RE
Ten
th P
lan
Pri
ces
012
34
56
78
910
1112
1314
15
01.
Ext
ern
ally
aid
ed p
roje
cts
1399
0.00
2158
.00
1512
.64
2390
.90
1448
.90
3323
.70
1602
.30
3200
.30
2953
.34
1978
.00
1978
.00
1305
0.70
9495
.18
(i)
Ext
ern
ally
aid
ed (
RW
)25
60.0
012
3.80
4.88
39.3
00.
0080
.00
2.65
160.
000.
000.
000.
0040
3.10
7.53
(ii)
Cou
nte
rpar
t fu
nds
(R
W)
640.
0031
.00
4.66
21.5
00.
0033
.50
0.00
40.0
00.
000.
000.
0012
6.00
4.66
EA
P M
inis
try
3200
.00
154.
809.
5460
.80
0.00
113.
502.
6520
0.00
3.34
0.00
0.00
529.
1015
.53
(iii)
Ext
ern
ally
aid
ed (
NH
AI)
8712
.00
1602
.00
1202
.00
1863
.52
1159
.12
2568
.00
1239
.08
2400
.00
0.00
1582
.20
1582
.50
1001
5.72
5182
.70
(iv)
Cou
nte
rpar
t fu
nds
(N
HA
I)49
.50
0.00
0.00
0.00
0.00
0.00
0.00
0.00
0.00
0.00
0.00
0.00
(v)
Loan
to
NH
AI
2028
.00
401.
0030
1.00
466.
3828
9.78
642.
0036
0.50
600.
0039
5.50
395.
5025
04.8
813
46.7
8E
AP
—N
HA
I10
789.
5020
03.0
015
03.0
023
29.9
014
48.9
032
10.0
015
99.5
830
00.0
029
50.0
019
78.0
019
78.0
012
520.
9094
79.4
8(v
i)St
ren
gthe
nin
g of
PIC
0.50
0.10
0.10
0.10
0.00
0.20
0.07
0.30
0.00
0.30
0.30
1.00
0.47
02.
Oth
er S
chem
es—
NH
(O
)86
64.0
014
40.0
014
25.1
715
44.0
014
74.5
714
82.0
015
03.8
814
27.3
015
70.3
415
50.3
015
86.8
974
43.6
075
60.8
503
.W
orks
un
der
BR
DB
950.
0014
5.00
210.
0421
0.00
256.
0021
0.00
210.
0041
5.00
321.
3958
4.00
528.
0015
64.0
015
25.4
304
.Tr
avel
exp
ense
s (d
omes
tic)
20.0
01.
000.
401.
020.
330.
500.
371.
000.
701.
751.
255.
273.
0505
.O
ther
cha
rges
1.00
0.03
0.50
0.00
450.
400.
001.
000.
000.
502.
900.
5306
.D
ev. o
f In
form
atio
n T
echn
olog
y20
.00
4.00
2.48
5.00
1.81
3.00
0.29
6.00
1.86
6.00
3.00
24.0
09.
4407
.St
rate
gic
road
s u
nde
r R
W50
.00
1.00
0.00
0.50
0.00
0.00
0.00
0.00
0.00
0.00
1.50
0.00
08.
Stra
tegi
c ro
ads
un
der
BR
DB
8.50
10.2
519
.00
24.5
019
.50
19.5
071
.00
49.8
874
.17
74.1
719
2.17
178.
3009
.R
&D
Plg
. stu
dies
20.0
03.
001.
753.
000.
197.
900.
614.
852.
956.
006.
0024
.75
11.5
010
.Tr
ain
ing
10.5
01.
500.
4312
.00
10.6
11.
001.
501.
061.
501.
5017
.50
13.6
011
.M
achi
ner
y an
d eq
uip
men
t15
.00
2.00
1.50
7.00
6.29
3.00
3.00
15.7
213
.88
10.0
010
.00
37.7
234
.67
12.
Cha
rged
exp
endi
ture
50.0
05.
005.
005.
003.
715.
000.
035.
004.
055.
005.
0025
.00
17.7
913
.N
HA
I (i
nves
tmen
t)10
500.
0020
00.0
020
00.0
019
93.0
019
93.0
018
48.0
018
48.0
032
69.7
432
69.7
464
07.4
564
07.4
515
518.
1915
518.
1914
.E
&I
for
Stat
es f
rom
CR
F50
0.00
95.0
025
.00
95.0
064
.52
92.0
016
.88
162.
0586
.09
272.
0618
2.06
716.
1137
4.55
15.
E&
I fo
r U
Ts f
rom
CR
F0.
005.
000.
005.
000.
004.
000.
008.
540.
008.
558.
5531
.09
8.55
16.
NH
DP-
III,
tw
o-la
nin
gex
pres
sway
s an
d si
x-la
nin
g14
00.0
070
0.00
110.
0011
0.00
1510
.00
810.
0017
.SA
RD
P-N
E45
0.00
0.00
550.
0055
0.01
1000
.00
550.
0118
.St
rate
gic
Roa
ds i
n A
run
acha
lP
rade
sh u
nde
r M
in. o
f D
efen
ce10
0.00
0.00
0.00
0.00
100.
000.
00To
tal (
BS)
3479
0.00
5870
.00
5194
.79
6290
.92
5284
.44
7000
.00
5204
.86
1053
9.00
8975
.28
1156
4.78
1145
2.68
4126
4.70
3611
2.05
19.
IEB
R24
700.
0062
00.0
055
92.9
040
00.0
00.
0033
00.0
00.
0085
00.0
033
89.0
035
00.0
035
00.0
025
500.
0012
481.
90
Gra
nd
Tota
l59
490.
0012
070.
0010
787.
6910
290.
9252
84.4
410
300.
0052
04.8
619
039.
0012
364.
2815
064.
7814
952.
6866
764.
7048
593.
95

Transport 333
ANNEXURE 9.3.3Plan-wise Addition to NH Length
Period Length Added in km Total Length in km
As on 1 April 1947 21440
Pre First Plan (1947–51) 815 22255
First Plan (1951–56) – 22255
Second Plan (1956–61) 1514 23769
Third Plan (1961–66) 179 23948
Interregnum Period (1966–69) 52 24000
Fourth Plan (1969–74) 4819 28819
Fifth Plan (1974–78) 158 28977
Interregnum Period (1978–80) 46 29023
Sixth Plan (1980–85) 2687 31710
Seventh Plan (1985–90) 1902 33612
Interregnum Period (1990–92) 77 33689
Eighth Plan (1992–97) 609 34298
Ninth Plan (1997–2002) 23814 58112
Tenth Plan (2002–07) 9008# 66590
Tenth Plan (2002–07)
2002–03 – 58112
2003–04 7457 65569
2004–05 – 65569
2005–06 556# 66125
2006–07 995 66590
Note: # Excluding 530 km of NHs denotified in 2006.

334 Eleventh Five Year Plan
ANNEXURE 9.3.4Bharat Nirman—Targets for New Connectivity
(Length in km, Habitations in Numbers)
S. No Name of the State 2005–06 2006–07 2007–08 2008–09 Total
Length Habs Length Habs Length Habs Length Habs Length Habs
01. Andhra Pradesh 0 0 0 0 0 0 0 0 0 0
02. Arunachal Pradesh 162.5 22 637.5 85 646.875 86 671.875 105 2118.75 298
03. Assam 605.852 421 2864.063 1988 3889.845 2701 5793.46 4022 13153.22 9132
04. Bihar 1665.831 896 3928.75 2062 6121.425 3214 7230.306 3784 18946.312 9956
05. Chhattisgarh 1501.365 478 4367.606 1310 6450.644 2007 8255.181 2514 20574.796 6309
06. Goa 0 0 0 0 0 0 0 0 0 0
07. Gujarat 402.955 230 429.723 246 438.675 251 438.675 251 1710.028 978
08. Haryana 0 0 0 0 0 0 0 0 0 0
09. Himachal Pradesh 464.583 127 795.833 209 638.542 166 479.167 123 2378.125 625
10. Jammu and Kashmir 169.972 57 1059.49 352 1781.869 593 1405.099 466 4416.43 1468
11. Jharkhand 1051.779 526 2594.39 1295 1812.298 901 2319.31 1155 7777.777 3877
12. Karnataka 0 0 0 0 0 0 0 0 0 0
13. Kerala 0 0 0 0 0 0 0 0 0 0
14. Madhya Pradesh 2602.139 768 6162.451 1760 8326.848 2399 10470.17 2905 27561.608 7832
15. Maharashtra 0 0 0 0 0 0 0 0 0 0
16. Manipur 100 11 460.714 48 464.286 48 719.048 74 1744.048 181
17. Meghalaya 123.609 35 135.971 39 140.091 40 144.211 41 543.882 155
18. Mizoram 82.746 12 274.819 39 277.884 39 306.498 43 941.947 133
19. Nagaland 93.318 9 104.529 10 109.507 10 114.485 11 421.839 40
20. Orissa 1055.95 493 1985.609 874 2524.021 1087 4427.774 1993 9993.354 4447
21. Punjab 0 0 0 0 0 0 0 0 0 0
22. Rajasthan 2153.615 743 3629.519 1252 3554.217 1225 2123.494 732 11460.845 3952
23. Sikkim 75.031 22 104.042 30 108.043 31 132.053 37 419.169 120
24. Tamil Nadu 0 0 0 0 0 0 0 0 0 0
25. Tripura 94.774 66 261.74 183 354.701 248 447.661 313 1158.876 810
26. Uttar Pradesh 1966.416 1236 2390.632 1504 2059.213 1295 1378.701 867 7794.962 4902
27. Uttarakhand 380.609 95 422.008 106 1025.641 257 1020.299 255 2848.557 713
28. West Bengal 739.378 787 2572.767 2738 3265.307 3473 3643.359 3876 10220.811 10874
Total 15492.42 7034 35182.16 16130 43989.93 20071 51520.83 23567 146185.34 66802
(Annexure 9.3.4 contd.)

Transport 335
(Length in km)
S. No Name of the State 2005–06 2006–07 2007–08 2008–09 TotalLength Length Length Length Length
1 2 3 4 5 6 7
01. Andhra Pradesh 1821.494 2258.652 2258.652 2258.652 8597.45
02. Arunachal Pradesh 0 0 0 0 0
03. Assam 0 2005.71 2269.808 2219.843 6495.361
04. Bihar 0 2393.617 3510.638 3390.958 9295.213
05. Chhattisgarh 0 1986.063 3240.418 3222.996 8449.477
06. Goa 190.114 190.114 190.114 190.114 760.456
07. Gujarat 0 1557.971 1557.971 1413.043 4528.985
08. Haryana 229.358 1146.789 1146.789 1238.532 3761.468
09. Himachal Pradesh 0 1515.923 1694.268 1503.185 4713.376
10. Jammu and Kashmir 0 1007.584 920.91 1007.584 2936.078
11. Jharkhand 0 2108.433 2123.494 1987.952 6219.879
12. Karnataka 2573.529 2573.529 2573.529 2573.529 10294.116
13. Kerala 524.109 628.931 524.109 524.109 2201.258
14. Madhya Pradesh 0 5189.543 6614.379 6823.53 18627.452
15. Maharashtra 4334.365 4334.365 4334.365 4334.365 17337.46
16. Manipur 0 0 0 0 0
17. Meghalaya 0 587.583 587.583 665.189 1840.355
18. Mizoram 0 257.998 257.998 216.718 732.714
19. Nagaland 0 246.914 246.914 370.371 864.199
20. Orissa 0 4438.574 4663.144 5059.445 14161.163
21. Punjab 423.729 1483.051 1483.051 1680.791 5070.622
22. Rajasthan 0 4764.543 4653.74 3656.51 13074.793
23. Sikkim 0 196.85 137.795 98.425 433.07
24. Tamil Nadu 1297.71 2824.427 2824.427 4167.939 11114.503
25. Tripura 0 373.737 383.838 414.141 1171.716
26. Uttar Pradesh 0 7158.962 6956.031 14408.12 28523.113
27. Uttarakhand 0 889.454 1283.354 1270.648 3443.456
28. West Bengal 0 2549.942 2878.965 4054.053 9482.96
Total 11394.408 54669.259 59316.284 68750.742 194130.693
(Annexure 9.3.4 contd.)
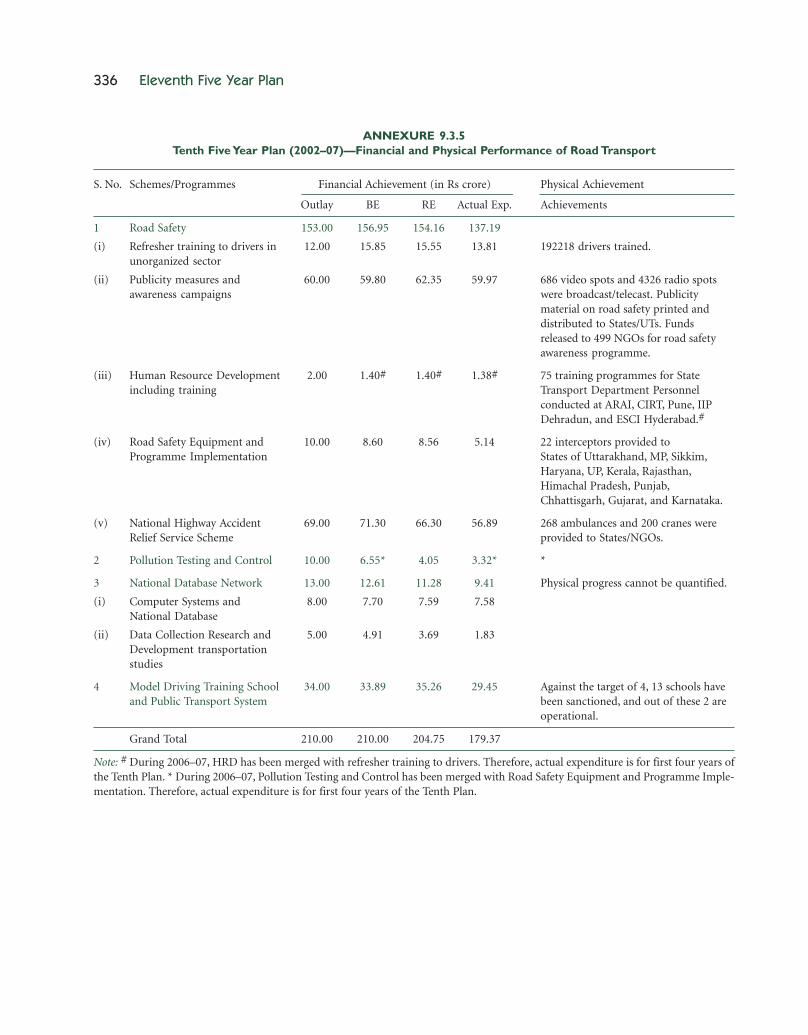
336 Eleventh Five Year Plan
ANNEXURE 9.3.5Tenth Five Year Plan (2002–07)—Financial and Physical Performance of Road Transport
S. No. Schemes/Programmes Financial Achievement (in Rs crore) Physical Achievement
Outlay BE RE Actual Exp. Achievements
1 Road Safety 153.00 156.95 154.16 137.19
(i) Refresher training to drivers in 12.00 15.85 15.55 13.81 192218 drivers trained.unorganized sector
(ii) Publicity measures and 60.00 59.80 62.35 59.97 686 video spots and 4326 radio spotsawareness campaigns were broadcast/telecast. Publicity
material on road safety printed anddistributed to States/UTs. Fundsreleased to 499 NGOs for road safetyawareness programme.
(iii) Human Resource Development 2.00 1.40# 1.40# 1.38# 75 training programmes for Stateincluding training Transport Department Personnel
conducted at ARAI, CIRT, Pune, IIPDehradun, and ESCI Hyderabad.#
(iv) Road Safety Equipment and 10.00 8.60 8.56 5.14 22 interceptors provided toProgramme Implementation States of Uttarakhand, MP, Sikkim,
Haryana, UP, Kerala, Rajasthan,Himachal Pradesh, Punjab,Chhattisgarh, Gujarat, and Karnataka.
(v) National Highway Accident 69.00 71.30 66.30 56.89 268 ambulances and 200 cranes wereRelief Service Scheme provided to States/NGOs.
2 Pollution Testing and Control 10.00 6.55* 4.05 3.32* *
3 National Database Network 13.00 12.61 11.28 9.41 Physical progress cannot be quantified.
(i) Computer Systems and 8.00 7.70 7.59 7.58National Database
(ii) Data Collection Research and 5.00 4.91 3.69 1.83Development transportationstudies
4 Model Driving Training School 34.00 33.89 35.26 29.45 Against the target of 4, 13 schools haveand Public Transport System been sanctioned, and out of these 2 are
operational.
Grand Total 210.00 210.00 204.75 179.37
Note: # During 2006–07, HRD has been merged with refresher training to drivers. Therefore, actual expenditure is for first four years ofthe Tenth Plan. * During 2006–07, Pollution Testing and Control has been merged with Road Safety Equipment and Programme Imple-mentation. Therefore, actual expenditure is for first four years of the Tenth Plan.

AN
NE
XU
RE
9.3
.6S
tate
-wis
e S
anct
ions
and
Rel
ease
s of
Cen
tral
Sha
re in
Res
pect
of
Mod
el D
rivi
ng T
rain
ing
Sch
ool—
Sta
tus
as o
n 31
Mar
ch 2
007
(in
Rs
Lakh
)
S. N
o.N
ame
of t
he S
tate
/NG
OC
entr
alA
mou
nt
San
ctio
ned
Tota
l Am
oun
tB
alan
ce
Ass
ista
nce
2002
–03
2003
–04
2004
–05
2005
–06
2006
–07
Rel
ease
d
012
34
56
108
910
01.
Ass
am (
Bet
kuch
i)39
4.00
45.0
015
0.00
–15
0.00
20.0
039
0.00
4.00
RT
-250
36/2
/200
1-R
SC(2
5.3.
03)
(11
.3.0
4) (
19.0
5.05
)(1
4.02
.07)
25.0
0(3
1.3.
04)
02.
M/s
KD
LOA
(V
ijaya
wad
a)40
0.00
50.0
012
5.00
150.
0060
.00
12.8
139
7.81
NIL
[O
ut
of 1
5.00
RT
-250
36/2
/200
1-R
SC(2
5.3.
03)
(18.
3.04
) (
14.1
0.04
)(2
0.6.
05)
(30.
3.07
)(I
nte
rest
Rs
2.19
Lak
hson
Rs
385
Lakh
s)]
03.
Kar
nat
aka
(Hag
arib
omm
anah
alli)
269.
0010
0.00
–10
0.00
50.0
015
.00
265.
004.
00R
T-2
5036
/2/2
001-
RSC
(25.
3.03
) (
28.6
.04)
(20.
6.05
)(3
0.3.
07)
04.
Wes
t B
enga
l (Je
ssor
e R
oad)
328.
0010
0.00
50.0
0–
––
275.
0053
.00
RT
-250
36/2
/200
1-R
SC(2
5.3.
03)
(11
.12.
03)
125.
00(3
1.3.
04)
05.
Him
acha
l P
rade
sh (
Jass
ur)
181.
00–
–75
.00
80.0
0–
155.
0026
.00
RT
-250
36/2
/200
4-R
SC(6
.8.0
4)(3
1.3.
06)
06.
Ker
ala
(Eda
ppal
)29
9.00
––
100.
00–
–10
0.00
199.
00R
T-2
5036
/2/2
004-
RSC
(6.8
.04)
07.
IDT
R (
Sara
i Kal
e K
han
)32
5.00
––
100.
0015
0.00
40.0
029
0.00
35.0
0R
T-2
5036
/2/2
004-
RSC
(6.8
.04)
(14.
11.0
5)(2
4.08
.06)
08.
Utt
rakh
and
(Deh
radu
n)
325.
00–
–12
5.00
––
125.
0020
0.00
RT
-250
36/2
/200
4-R
SC(1
7.2.
05)
09.
Utt
ar P
rade
sh (
Alle
n f
ores
t at
339.
00–
––
101.
70–
101.
7023
7.30
Kan
pur)
RT
-250
36/2
/200
4-R
SC(2
7.03
.06)
10.
Ori
ssa
(Cha
ndi
khol
e) (
join
t ve
ntu
re33
6.00
––
–10
0.80
200.
0030
0.80
35.2
0w
ith
TATA
Mot
ors
and
All
Ori
ssa
(27.
03.0
6)(3
0.3.
07)
Truc
k O
wn
ers
Fede
rati
on)
RT
-250
36/2
/200
4-R
SC11
.N
agal
and
at D
imap
ur
354.
00–
––
–10
6.20
306.
2047
.80
RT
-250
36/2
/200
5-R
S(2
3.10
.06)
200.
00(3
0.3.
07)
12.
Mad
hya
Pra
desh
(In
dore
)39
3.96
––
––
118.
1811
8.18
275.
78R
T-2
5036
/2/2
006-
RS
(13.
2.07
)13
.H
arya
na
at B
ahad
urg
arh
400.
00–
––
–12
0.00
120.
0028
0.00
RT
-250
36/5
/200
7-R
S(3
0.3.
07)
Gra
nd
Tota
l43
43.9
629
5.00
475.
0065
0.00
692.
5083
2.19
2944
.69
(Rs
1397
.08
+ I
nte
rest
(As
on 3
1 M
arch
200
7)R
s 2.
19)
Rs
1399
.27

338 Eleventh Five Year Plan
ANNEXURE 9.3.7Physical Performance of State Road Transport Corporations/Undertakings
SRTU % Fleet Vehicle Staff FuelUtilization Productivity— Productivity— Efficiency
Rev. Earning Rev. Earning km KMPLper bus per km per worker per day
2002–03 2006–07 2002–03 2006–07 2002–03 2006–07 2002–03 2006–07
Andhra Pradesh 99.24 99.50 320 339 48.00 55.00 5.24 5.27
Arunachal Pradesh 65.00 77.00 125 99 24.56 25.51 3.1 3.10
Assam 68.00 78.00 123 141 13.00 14.00 4 4.00
Bihar 12.00 67.00 29 176 7.52 30.83 4.1 4.03
DTC (Delhi) 79.85 85.65 171 179 17.99 27.48 3.78 3.96
Goa (Kadamba) 79.00 83.00 206 214 39.00 44.00 4.26 5.1
Gujarat 83.50 84.50 302 313 47.91 57.02 5.3 5.25
Haryana 97.00 96.00 311 338 57.50 62.79 4.54 4.93
Himachal Pradesh 97.00 98.00 223 235 45.79 46.95 3.57 3.64
Jammu and Kashmir 64.00 75.00 95 112 15.14 23.90 3.81 4.2
Karnataka
KSRTC 95.30 95.00 343 368 62.20 57.30 4.97 5.22
NWKRTC 96.10 95.00 336 333 57.54 55.13 4.97 5.6
BMTC 95.00 95.00 216 218 42.20 37.10 4.6 4.75
NEKRTC 92.30 96.00 285 315 56.70 58.00 4.97 5.55
Kerala 78.00 82.00 335 329 45.66 52.96 3.89 4
Madhya Pradesh 83.00 0.00 245 0 42.00 0.00 4.06 0
Maharashtra 93.96 95.00 293 309 45.32 48.79 4.76 4.9
Meghalaya 72.00 68.00 85 154 7.45 3.67 3.66 3.67
Mizoram 53.00 63.00 60 138 5.92 6.26 3 3
Nagaland 61.00 63.00 90 89 13.61 19.84 3.5 3.7
Orissa 91.00 90.00 275 230 45.50 57.24 4.2 4.45
Punjab Roadways 85.10 88.40 238 206 41.40 47.80 4.29 4.42
PEPSURTC 95.00 95.00 267 318 57.90 60.82 4.39 5.12
Rajasthan 93.00 96.00 319 364 63.37 75.25 4.94 5.12
Sikkim 80.00 68.00 67 65 17.53 10.56 3.25 2.8
Tamil Nadu 91.72 93.02 379 404 52.06 58.31 4.37 4.8
Tripura 61.00 55.00 76 79 9.27 12.52 3.57 3.63
Uttar Pradesh 90.00 97.00 262 322 42.79 62.61 4.79 5.2
Calcutta STC 66.88 59.00 150 128 20.77 22.26 3.7 3.9
North Bengal STC 61.00 57.00 147 141 21.19 22.61 3.94 3.95
South Bengal STC 77.00 85.00 206 222 34.54 38.41 3.85 4.3
Calcutta Tramways 63.00 67.00 136 157 20.20 22.70 3.3 3.5
Uttarakhand 0.00 94.00 0 300 0.00 43.00 0 4.79
All-India Average 78.72 82.50 210 229 39.23 39.39 4.11 4.31

Transport 339
ANNEXURE 9.5.1Year-wise Physical Targets and Achievements during the Tenth Plan—Major Ports (Commodity-wise)
(Million Metric Tonnes)
S. No. Name of Commodity Tenth Plan 2002–03 2003–04 2004–05 2005–06 2006–07Target Ach. Ach. Ach. Ach. Ach.
01. POL 154.30 109.63 122.16 126.44 142.09 154.35
02. Iron ore 52.50 50.56 58.81 76.20 79.17 80.56
03. Fertilizers and Fertilizer Raw Material (FRM) 13.45 8.55 7.54 9.68 12.19 14.11
04. Thermal and Coking Coal 71.30 48.19 48.80 52.56 58.76 60.21
05. Container 61.10 43.67 51.00 54.76 61.98 73.48
06. Other cargo 62.35 52.95 56.49 64.11 69.38 81.13
Total 415.00 313.55 344.80 383.75 423.57 463.84
Note: Ach. = Achievement.
ANNEXURE 9.5.2Year-wise Physical Targets and Achievements during the Tenth Plan-—Major Ports (Port-wise)
(Million Metric Tonnes)
S. No. Port/Organization Tenth Plan 2002–03 2003–04 2004–05 2005–06 2006–07Target Ach. Ach. Ach. Ach. Ach.
01. Kolkata 21.40 7.20 8.69 9.95 10.81 12.60
02. Haldia 33.40 28.60 32.56 36.26 42.33 42.45
03. Paradeep 28.90 23.90 25.31 30.10 33.11 38.52
04. Vizag 60.00 46.01 47.74 50.15 55.80 56.39
05. Chennai 40.00 33.69 36.71 43.81 47.25 53.41
06. Tuticorin 18.70 13.29 13.68 15.81 17.14 18.00
07. Cochin 17.20 13.02 13.57 14.09 13.89 15.31
08. New Mangalore 32.70 21.43 26.67 33.89 34.45 32.04
09. Mormugao 26.30 23.65 27.87 30.66 31.69 34.24
10. Mumbai 30.40 26.80 30.00 35.19 44.19 52.36
11. JL Nehru 34.50 26.84 31.19 32.81 37.83 44.82
12. Kandla 51.00 40.63 41.52 41.55 45.91 52.99
13. Ennore Port Ltd 20.50 8.49 9.28 9.48 9.17 10.71
Grand Total 415.00 313.55 344.79 383.75 423.57 463.84

AN
NE
XU
RE
9.5
.3Te
nth
Pla
n—O
utla
ys a
nd E
xpen
ditu
re i
n Po
rts
Sec
tor
(in
Rs
cror
e)
S. N
oN
ame
of t
heTe
nth
2002
–03
2003
–04
2004
–05
2005
–06
2006
–07
Ten
th
Port
/Org
aniz
atio
nP
lan
App
rove
dA
ctu
alA
ppro
ved
Act
ual
App
rove
dA
ctu
alA
ppro
ved
Act
ual
App
rove
dA
ctu
al P
lan
Ou
tlay
Ou
tlay
Exp
.O
utl
ayE
xp.
Ou
tlay
Exp
.O
utl
ayE
xp.
Ou
tlay
Exp
.A
ct. E
xp
01.
Kol
kata
#78
9.42
199.
926.
8521
0.30
10.4
846
.22
47.5
554
.04
59.6
650
.04
71.9
919
6.53
02.
Mu
mba
i88
0.20
109.
0510
0.76
54.2
157
.81
56.1
544
.49
74.5
319
.23
59.8
614
.55
236.
84
03.
JNP
T26
2.75
146.
3640
.26
143.
0212
.73
102.
1458
.85
96.8
465
.77
106.
1440
.74
218.
35
04.
Ch
enn
ai32
6.70
95.9
985
.50
36.6
929
.21
16.7
522
.68
46.7
125
.11
35.0
026
.07
188.
57
05.
Coc
hin
366.
51–
10.0
218
.88
10.8
685
.41
9.52
53.1
224
.76
73.8
472
.89
128.
05
06.
Viz
ag24
0.84
49.0
651
.30
51.0
055
.65
54.4
427
.68
27.0
017
.68
27.3
343
.79
196.
10
07.
Kan
dla
416.
7194
.78
55.8
966
.71
41.5
092
.98
52.8
993
.30
91.2
994
.66
80.1
932
1.76
08.
Mor
mu
gao
348.
0630
.86
26.5
387
.14
43.0
653
.85
11.0
533
.50
17.9
228
.06
20.7
711
9.33
09.
Para
dip
222.
7059
.00
41.4
253
.40
14.5
687
.16
28.9
911
6.00
44.0
283
.40
23.1
515
2.14
10.
New
Man
galo
re14
7.40
37.0
024
.41
25.0
05.
1420
.00
29.6
026
.00
18.0
918
.00
18.0
295
.26
11.
Tuti
cori
n23
0.0
76.1
036
.02
17.5
421
.84
25.8
15.
4843
.67
13.5
652
.31
29.1
210
6.04
12.
En
nor
e Po
rt L
td30
0.00
1.00
-15
0.00
0.99
95.0
02.
3276
.00
13.4
070
.00
9.57
26.2
8
Tota
l (A
)45
31.2
989
9.12
478.
9691
3.89
303.
8373
5.91
341.
174
0.71
410.
4969
8.64
450.
8519
85.2
5
13.
Seth
usa
mu
dram
––
––
–10
.00
–10
7.00
150.
0030
4.00
334.
6648
4.66
14.
Web
-bas
ed E
DI
PC
S–
––
––
––
6.00
0.34
7.83
1.66
2.00
15.
Oth
ers*
587.
0021
4.88
53.9
823
7.00
44.0
622
1.04
19.8
726
0.04
79.1
333
3.78
214.
7741
1.81
Tota
l (B
)58
7.00
214.
8853
.98
237.
0044
.06
231.
0419
.87
373.
0422
9.47
645.
6155
1.09
898.
47
Tota
l (A
+B
)51
18.2
911
14.0
053
2.94
1150
.89
347.
8996
6.95
360.
9711
13.7
563
9.96
1344
.25
1001
.94
2883
.70
16.
Surv
ey V
esse
ls30
0.00
45.0
08.
9550
.00
–10
0.00
–50
.00
0.00
20.0
00.
008.
95
Gra
nd
Tota
l54
18.2
911
59.0
054
1.89
1200
.89
347.
8910
66.9
536
0.97
1163
.75
639.
9613
64.2
510
01.9
428
92.6
5
Not
e: #
incl
udes
Hal
dia
and
RR
Sch
emes
. * in
clud
es D
CI,
ALH
W, R
&D
stu
dies
, Pos
t-ts
un
ami w
orks
, an
d M
inor
Por
t st
udi
es.

AN
NE
XU
RE
9.6
.1F
inan
cial
Pro
gres
s of
the
Civ
il A
viat
ion
Sec
tor
duri
ng t
he T
enth
Pla
n(i
n R
s cr
ore)
S. N
o.O
rgan
izat
ion
Ten
th P
lan
2002
–03
2003
–04
2004
–05
2005
–06
2006
–07
Ten
th P
lan
Ou
tlay
Ou
tlay
Exp
.O
utl
ayE
xp.
Ou
tlay
Exp
.O
utl
ayE
xp.
Ou
tlay
Exp
.To
tal E
xp.
012
34
56
78
910
1112
1314
01.
Air
In
dia
Ltd
2661
.39
858.
7074
3.07
600.
8147
9.57
471.
4035
8.07
468.
7444
3.33
486.
7036
4.23
2388
.27
(1.0
0)(1
.00)
(1.0
0)(1
.00)
(1.0
0)
02.
Indi
an A
irlin
es L
td42
40.5
051
0.00
418.
9328
0.00
248.
7822
6.00
221.
7091
1.73
192.
1370
6.00
350.
0014
31.5
4(1
.00)
(1.0
0)(1
.00)
(1.0
0)(3
25.0
0)*
(325
.00)
*(3
25.0
0)
03.
Air
port
s A
utho
rity
5404
.21
996.
0544
5.66
800.
0056
6.22
795.
0860
6.49
892.
3087
6.08
1506
.44
1040
.17
3534
.62
of I
ndi
a(2
50.0
0)(5
3.12
)(3
3.59
)(3
4.96
)(2
2.08
)(3
0.00
)(3
0.00
)(3
0.00
)(3
6.00
)(4
2.91
)(2
9.00
)(1
50.6
7)
04.
PH
HL
458.
9013
3.80
53.0
181
.45
19.6
010
9.50
60.9
290
.70
41.5
217
5.00
106.
9028
1.95
05.
Indi
ra G
andh
i R
asht
riya
10.0
02.
090.
983.
500.
503.
003.
003.
852.
3040
.30
31.1
037
.88
Ura
n A
cade
my
(10.
00)
(2.0
9)(0
.98)
(3.5
0)(0
.50)
(3.0
0)(3
.00)
(3.8
5)(2
.30)
(40.
30)
(31.
10)
(37.
88)
06.
Dir
ecto
rate
Gen
eral
of
19.0
03.
102.
544.
152.
864.
003.
065.
001.
8329
.00
1.74
12.0
3C
ivil
Avi
atio
n(1
9.00
)(3
.10)
(2.5
4)(4
.15)
(2.8
6)(4
.00)
(3.0
6)(5
.00)
(1.8
3)(2
9.00
)(1
.74)
(12.
03)
07.
Bur
eau
of
Civ
il A
viat
ion
114.
007.
693.
877.
004.
2410
.00
0.28
5.00
0.98
5.00
0.15
9.52
Secu
rity
(114
.00)
(7.6
9)(3
.87)
(7.0
0)(4
.24)
(10.
00)
(0.2
8)(5
.00)
(0.9
8)(5
.00)
(0.1
5)(9
.52)
08.
Hot
el C
orpo
rati
onof
In
dia
Ltd
15.0
08.
768.
761.
000.
511.
001.
001.
001.
0015
.00
15.0
026
.27
09.
Air
In
dia
Cha
rter
s Lt
d0.
000.
000.
000.
000.
000.
000.
000.
0016
.83
70.7
042
.18
59.0
1
10.
Aer
o C
lub
of I
ndi
a5.
001.
000.
001.
271.
001.
001.
001.
000.
0012
.79
9.00
11.0
0(5
.00)
(1.0
0)(0
.00)
(1.2
7)(1
.00)
(1.0
0)(1
.00)
(1.0
0)(0
.00)
(12.
79)
(9.0
0)(1
1.00
)
Tota
l12
928.
0025
21.1
916
76.8
217
79.1
813
23.2
816
20.9
812
55.5
223
79.3
215
76.0
030
46.9
319
60.4
777
92.0
9(4
00.0
0)(6
9.00
)(4
0.98
)(5
2.88
)(3
0.68
)(5
0.00
)(3
7.34
)(3
70.8
5)(3
66.1
1)(1
30.0
0)(7
0.99
)(5
46.1
0)
Not
e: F
igu
res
in b
rack
ets
indi
cate
Gro
ss B
udg
etar
y Su
ppor
t.
* D
urin
g 20
05–0
6, b
udg
etar
y su
ppor
t of
Rs
325
cror
e w
as r
elea
sed
to I
ndi
an A
irlin
es f
or p
urc
hase
of
new
air
craf
ts, o
ut
of w
hich
the
com
pany
uti
lized
Rs
47.6
1 cr
ore
duri
ng
2005
–06
and
bala
nce
am
oun
t of
Rs
277.
39 c
rore
was
uti
lized
in A
pril
2006
.

10Energy
ENERGY SECTOR
ISSUES AND CHALLENGES10.1 Availability and access to energy are consideredas catalysts for economic growth. The envisaged growthof the economy at 9% in the Eleventh Plan cannotbe achieved without a commensurate increase inthe availability of energy. Over half of the country’spopulation does not have access to electricity or anyother form of commercial energy. Meeting the energyaccess challenges and ensuring lifeline supply of cleanenergy to all is essential for empowering individuals,especially women and girls, who have the task ofcollecting and using non-commercial fuels such asfire wood, crop residues, and dung cakes that remainthe primary energy source for cooking in over two-thirds of the households. Provision of clean fuels or atleast wood plantation within one km of habitation anddissemination of technology for use of clean fuelsis vital for good health. This is essential if growth isto be inclusive.
10.2 India is both a major energy producer and a con-sumer. India currently ranks as the world’s seventhlargest energy producer, accounting for about 2.49%of the world’s total annual energy production. It is alsothe world’s fifth largest energy consumer, accountingfor about 3.45% of the world’s total annual energy con-sumption in 2004. Since independence, the countryhas seen significant expansion in the total energy usein the country with a shift from non-commercial to
commercial sources. The share of commercial energyin total primary energy consumption rose from 59.7%in 1980–81 to 72.6% in 2006–07. It must be noted,however, that India’s per capita energy consumption isone of the lowest in the world. India consumed 455kilogram of oil equivalent (kgoe) per person of primaryenergy in 2004, which is around 26% of world averageof 1750 kgoe in that year. As compared to this, per capitaenergy consumption in China and Brazil was 1147 kgoeand 1232 kgoe, respectively.
10.3 The main challenge before the energy sectorfor fuelling the proposed growth in the EleventhPlan is to enhance energy supply in cost-effectiveways. The persistent shortages of electricity both forpeak power and energy indicate the magnitude ofthe problem. Average peak shortages are estimatedto be 12% in 2006–07 which is an underestimate asscheduled load shedding is not included in it. The veryhigh load factor of 76.8% for the system indicates thatthe system is operating under strain or has limitedreserve. At the same time, for want of natural gas,some gas-based power plants are kept idle. Nuclearplants are also operated at lower load factors forwant of adequate uranium. Power shortages are anindication of insufficient generating capacity andinadequate transmission and distribution (T&D)networks. To a great extent this is the outcome ofpoor financial health of the State Electricity Utilitieshaving high levels of Aggregate Technical andCommercial (AT&C) losses.

Energy 343
10.4 The task of meeting the energy needs of devel-opment has become more complex in recent times dueto the imminent threat of global warming. This posesa challenge to the world as a whole including Indiaand points to the need for an acceptable internationalapproach to deal with the problem. India’s energy strat-egy has, therefore, to bear in mind the need for actionas part of a reasonable international agreement whichis consistent with India’s development objectives.
LONG-TERM REQUIREMENT10.5 Since energy sector involves large gestation lags,we also need to look at the long-term requirement. Therate of growth and, therefore, the energy intensity arethe key factors which impact the projections of futureenergy demand. The Expert Committee (EC) on Inte-grated Energy Policy, Planning Commission (Box 10.1)has projected primary energy demand for 2031–32 forIndia. Table 10.1 summarizes the range of projected
requirement and supply. The projected requirement ofcoal has been estimated assuming its calorie contentto be 4000 kcal per kg and 2865 kcal per kg for lignite.
AVAILABILITY OF ENERGY RESOURCE10.6 India is not endowed with large primary energyreserves in keeping with her vast geographical area,growing population, and increasing final energyneeds. The distribution of primary commercial energyresources in the country is quite skewed. Whereas coalis abundant and is mostly concentrated in the easternregion, which accounts for nearly 70% of the totalcoal reserves, the western region has over 70% of thehydrocarbons reserves in the country. Similarly, morethan 70% of the total hydro potential in the country islocated in the northern and the north eastern regions.The southern region, which has only 6% of the coalreserves and 10% of the total hydro potential, has mostof the lignite deposits occurring in the country.
Box 10.1Integrated Energy Policy
The Planning Commission had set up an expert group to recommend integrated energy policy. Its report submitted in 2006(http://planningcommission.nic.in/reports/genrep/rep_intengy.pdf) deals with various sources and forms of energy (electric-ity, coal, oil, gas, nuclear, hydel energy, renewables including wind energy, solar energy, biofuels, wood plantations), thecountry’s projected requirement and availability of resources, energy security, energy efficiency as well as R&D priorities.
The report lays strong emphasis on making the energy sector efficient and competitive. It argues for relative prices andtaxes that reflect the true social cost of different fuels and forms of energy as the best way to encourage right choice of fuelsand techniques; for competitive markets wherever possible; transparent and target subsidies when needed; policies that relyon incentives and disincentives; and policies that are implementable. The recommendations are being discussed with variousministries for implementation. Many of the policies recommended for the coal sector have already been implemented. Progresshas also been made in policies concerning energy efficiency and renewable energy. Progress in the power sector has yet toshow results. The oil and gas sector continues with an unsustainable pricing policy.
TABLE 10.1Projected Primary Energy Requirement for India, 2030
(All in Mtoe)
Fuel Range of Assumed Domestic Range of ImportRequirements Production Imports# (%)
Coal including lignite 632–1022 560 72–462 11–45Oil 350–486 35 315–451 90–93Natural gas including coal bed methane (CBM) 100–197 100 0–97 0–49Total commercial primary energy 1351–1702 – 387–1010 29–59
Note: # Range of imports is calculated across all scenarios by taking the minimum requirement and maximum domestic production asthe lower bound and maximum requirement and minimum domestic production as the upper bound.Source: Integrated Energy Policy Report (IEPR), 2006.
344 Eleventh Five Year Plan
COAL AND LIGNITE10.7 Coal continues to be the major energy resourceof the country. As on January 2007, the coal reserveswere 253.3 billion tonnes (bt), out of which 97.92 btare in the ‘proved’ category. The lignite reserves as onApril 2006 were estimated at 38.27 bt, out of which4.5 bt is in the proved category. If all the inferredreserves materialize, these reserves can sustain currentlevel of production for 140 years.
PETROLEUM AND NATURAL GAS10.8 The balance of recoverable oil reserves as on1 April 2006 is around 1653 mt (Directorate Generalof Hydrocarbon, DGH 2005–06 report), which cansustain the current level of production for the next35 years. The current level of production barelycaters to 26% of the petroleum products demand andthe balance oil requirements are met by importingthe crude. The current level of natural gas productionin the country is inadequate to meet the industrialdemand, particularly of the power and fertilizer in-dustries. LNG imports since 2004–05 have been ableto bridge the gap partially. The situation is likely toimprove once production starts from Krishna–Godavari (K–G) basin reserves in a couple of years.
10.9 Besides natural gas, the country has significantCBM and underground coal gasification (UCG)resources. Coal India Limited (CIL) and ONGC arealready implementing two CBM projects. Blockshave also been allocated through competitive biddingprocess to private companies for exploration andexploitation of CBM. Production of 3.78 bcm fromCBM and 2.99 bcm from UCG are included in theEleventh Plan targets.
NUCLEAR ENERGY10.10 At present, nuclear energy installed capacity is3900 MWe which is 3.1% of total installed powergeneration capacity and the Plant Load Factor (PLF)of Nuclear Power stations is 57%. India’s long-termnuclear power programme is based on utilizing the vastindigenous resources of thorium for electricity gen-eration. The three-stage nuclear power developmentprogramme in India is aimed at converting thoriumto fissile material. India is poorly endowed withuranium and available uranium resources can support
10000 MWe electricity generation programme basedon pressurized heavy water reactors (PHWRs) usingnatural uranium as fuel and heavy water as modera-tor and coolant. The energy potential of natural ura-nium can be increased to about 300000 MWe in thesecond stage through fast breeder reactors (FBRs)which utilize plutonium obtained from the recycledspent fuel of the first stage along with thorium asblanket to produce U233. With the deployment ofthorium in the third stage using U233 as fuel, theenergy potential for electricity generation is largeand substantial.
RENEWABLE SOURCES OF ENERGY10.11 Projections made in the IEPR reveal that toachieve its development goals, India would need to relyincreasingly on imported oil, gas, and coal in the me-dium term (2032). Against this backdrop, the role ofnew and renewable energy assumes added significance,irrespective of whether it replaces coal or oil. In thisregard, IEPR recognizes ‘the need to maximally developdomestic supply options as well as the need to diver-sify energy sources . . .’, although renewables are likelyto account for only around 5%–6% of the primarycommercial energy-mix by 2032. Given the growingconcerns for climate change and energy security, itis imperative that this energy in the longer termwill substantially increase its share in the fuel-mix.Continuing to support the growth of new and renew-able energy is in the country’s long-term interest, eventhough in the medium term this option might appearsomewhat costlier. Thus, a balanced approach fornew and renewable energy that factors in the needto develop domestic and renewable sources of energyhas to be adopted.
TRENDS IN PRIMARY ENERGY DEMANDAND SUPPLY10.12 The demand for energy, particularly for com-mercial energy, has been growing rapidly with thegrowth of the economy, changes in the demographicstructure, rising urbanization, socio-economic devel-opment, and the desire for attaining and sustainingself-reliance in some sectors of the economy. Table 10.2gives the trend of primary commercial energy demandand supply between 1960–61 and 2006–07 and pro-jected requirement for 2011–12.

Energy 345
10.13 While total primary energy requirement regis-tered an average annual growth rate of 3.67% between1990–91 and 2006–07, the primary commercial energyrequirement registered an average annual growth rateof 4.93% during the same period. The Tenth Plan hadenvisaged a declining primary commercial energy in-tensity of GDP reflected in growth of 6.64% in pri-mary commercial energy supply by the end of 2006–07over the 2001–02 level while GDP grew at 8% imply-ing an energy elasticity of 0.83. However, the primarycommercial energy consumption actually registered agrowth rate of 5.51% over the consumption level in
2001–02, whereas the economy registered an averagegrowth rate of 7.8% during the Tenth Plan periodyielding an elasticity of primary commercial energyconsumption with respect to the GDP of only about0.71%.
10.14 Non-commercial energy resources include thetraditional fuels such as wood, cow dung, crop resi-due, and biogas and constitute a significant percent-age of total primary energy consumption in thecountry. A larger share of these fuels is used by thehouseholds, particularly in rural areas, for meeting
Box 10.2Energy Equivalence
The energy labeled as ‘final energy’ such as electricity, petrol, gas, coal, firewood, etc. is obtained from the sources available innature, labeled as ‘primary energy’, and includes hydrocarbons (coal, oil, and natural gas), fissile or fertile elements primarilyuranium, the kinetic energy of natural elements (wind, water, etc.), and the electromagnetic rays of the sun and the naturalheat of the Earth (geothermal energy). As per convention, final energy consumption is generally expressed as weights of fuelsburnt, or from kWh consumed if it is electricity. Each fuel, while burning, produces certain amount of energy in the form ofheat that can be measured in standard units such as kilocalories or Joules. Fuels are compared using their calorie content withthat of oil in tonnes or million tonnes of oil equivalent (mtoe). One tonne of oil is worth 42 billion Joules or 10 billioncalories whereas one million tonne of Indian coal has 4.1 billion calories. Thus 1 mt of coal is 4.1/10 mtoe or 0.41 mtoe.Electrical energy measured in kWh is also converted into the thermal energy kcal or kJ using the definition and finallyexpressed as mtoe (1 billion kWh = 0.86 billion calorie). Taking the thermal efficiency of the power plant and other losses inthe system, the equivalence between electricity and fossil fuels would be 1billion kWh = 0.28 mtoe (in case of coal-firedboilers) and 0.261 mtoe (in case of nuclear electricity). 1 billion kWh generated from hydroelectricity or wind power, how-ever, are considered as equivalent to 0.086 mtoe since there is no intermediate stage of heat production while using theseprimary energies. It is possible to argue that the efficiency of thermal power plant should be used to convert hydroelectricityand wind power also. In this case, 1 billion kWh of hydroelectricity would be equivalent to 0.28 mtoe. This has an importantbearing when one considers how much renewable energy is renewable. Thus in 2006–07 renewable energy was 2.8% or 8.3%of India’s total primary commercial energy depending on the conversion factor used.
TABLE 10.2Trends in Demand and Supply of Primary Energy
(All in Mtoe#)
1960–61 1970–71 1980–81 1990–91 2000–01 2006–07 2011–12*
Domestic production of commercial energy 36.78 47.67 75.19 150.01 207.08 259.56 435Net imports 6.04 12.66 24.63 31.07 89.03 131.97 111Total commercial energy 42.82 60.33 99.82 181.08 296.11 391.53 546Non-commercial energy 74.38 86.72 108.48 122.07 136.64 147.56 169Total primary energy demand 117.20 147.05 208.30 303.15 432.75 539.09 715
Note: # Mtoe = million tonne of oil equivalent. For details see Annexure 10.3.* Projected requirement at the end of the Eleventh Plan is as per the Report of the EC on Integrated Energy Policy and projectionof domestic supply is as per the Working Group Reports. Import requirement is the difference between projected requirement anddomestic supply projections.(i) Domestic production of commercial energy includes coal, lignite, oil, natural gas, hydro power, nuclear power, and wind power.(ii) Net imports include coal, oil, and LNG imports.Source: IEPR.

346 Eleventh Five Year Plan
their cooking and heating needs. The consumption of147.56 mtoe of traditional fuels in 2006–07 includesconsumption of 238 mt of fuel wood, 98 mt of dung,and 38 mt of agricultural waste. Around 80% of thefuel wood is used for household consumption and thebalance is used by the cottage industry, hotels, etc.
10.15 The total energy needs are met by differentenergy sources. Table 10.3 gives the source-wisebreakup of the energy demand and Table 10.4 givesthe percentages of these met from domestic produc-tion, the rest coming from imports.
10.16 Though the share of oil and gas has been pro-gressively increasing over the years, coal continuesto be the dominant fuel in the total energy use inthe country. Imports constituted about 33.70% of thetotal primary commercial energy consumption in2006–07.
10.17 While production of coal in 2006–07 hasincreased about three times the level of production
in 1980–81, the share of coal and lignite in totalprimary commercial energy supply has been declin-ing progressively over the years. On the other hand,share of oil and natural gas in the total primary com-mercial energy supply has been rising progressively.While the share of oil and natural gas rose from 37.89%in 1980–81 to 42.93% in 2006–07, the share of coaland lignite declined from 56.83% in 1980–81 to 53.11%in 2006–07.
10.18 Our dependence on imports is growing.Table 10.4 shows that we imported 13.4% of our coalrequirement, 73.4% of oil and product needs, and 1.6%of gas requirement. Net imports of 131.97 mtoe in2006–07 covers import of 95.43 mt of crude oil andpetroleum products, 44.29 mt of coal, and 5 mt of LNG.
10.19 India needs to eliminate shortage of energy sup-ply and enhance the availability of commercial energyresources if it has to sustain the projected 9% economicgrowth in the Eleventh Plan period. Table 10.5 showsprojected commercial energy requirement of all the
TABLE 10.3Source-wise Energy Demand
(All in mtoe)
1960–61 1970–71 1980–81 1990–91 2000–01 2006–07 2011–12#
Coal 35.64 36.48 56.96 94.15 131.52 200.02 270Lignite 0.01 0.81 1.23 3.58 6.43 8.72 13Oil 8.29 19.14 32.26 57.75 106.97 132.75 186Natural gas – 0.60 1.41 11.49 25.07 34.60 48Hydro power 0.67 2.17 4.00 6.16 6.40 9.75 12Nuclear power – 0.63 0.78 1.60 4.41 4.86 17Wind power – – – – 0.13 0.83 <1Total 44.61 59.83 96.73 174.73 280.93 391.53 546
Note: # Projected requirement at the end of the Eleventh Plan as per the IEPC report.Source: Planning Commission.
TABLE 10.4Percentage Demand met from Domestic Sources
(All in %)
1960–61 1970–71 1980–81 1990–91 2000–01 2006–07 2011–12#
Coal 100 100 99.7 97.8 96.1 90.33 93.02Lignite 100 100 100 100 100 100 100Oil 5.4 35.6 32.6 42.8 30.3 26.6 27.59Natural gas/LNG – 100 100 100 100 82.08 69.30Hydro power 100 100 100 99.93 99.96 99.74 95.94
Note: # Projections from various Working Group Reports.Source: Planning Commission.

Energy 347
available resources in the terminal year of theEleventh Plan period in physical units. Coal demandof 731 mt covers 51 mt of imports. 74% of this isexpected to be consumed by the power sector includ-ing captive plants. Out of the oil demand of 145 mt,domestic production will be around 40 mt and thebalance would be imported. Domestic availability ofnatural gas in the terminal year of the Eleventh Planis expected to be about 47 bcm. An import of 23.75 mtof LNG would augment the supplies to meet the de-mand shortfall. There will be a gap of around 32 bcmbetween availability and demand if no addition by theprivate sector is achieved. The shortfall in availabilitywill adversely affect the power sector and fertilizerindustry, which consume around 70% of the currentgas demand.
10.20 Availability of hydro, wind, and nuclear energyis estimated assuming a capacity factor of 37% forhydro, 20% for wind, and 70% for nuclear for takinginto account the likely capacity additions during thePlan period.
10.21 Table 10.6 shows the realized growth rates ofdomestic supply of different fuels in the past as alsothose projected for the Eleventh Plan.
SUPPLY OPTIONS10.22 Coal production in the terminal year of theEleventh Plan period is projected to increase more thanone and half times the production level in 2006–07. Inspite of the significant increase in domestic coal pro-duction, around 51 mt coal is required to be importedto meet the gap between demand and supply. Domes-tic production is likely to reach 680 mt level in theterminal year of the Eleventh Plan registering anaverage annual growth rate of 9.37% as compared toa growth rate of 5.8% achieved during the Tenth Planperiod. Power sector alone will consume more than70% of the projected demand.
10.23 Domestic production of crude is likely toincrease to around 40 mt in the terminal year of theEleventh Plan representing a modest increase from thecurrent level of about 34 mt. By the end of theEleventh Plan, the domestic production will cater toonly around 28% of the projected petroleum prod-ucts demand of 145 mt.
10.24 Domestic production of natural gas in the ter-minal year of the Eleventh Plan is likely to be 63.23 bcm,which will be around 100% higher than the current levelof production. This increase in gas production will bemainly from K–G basin production of 40 million stan-dard cubic metres per day (MMSCMD). The level ofproduction may go further up if the Gujarat State Pe-troleum Corporation Limited is able to develop its re-sources in K–G basin in the Eleventh Plan period itself.
TABLE 10.5Projected Commercial Energy Requirement for
2011–12 at the Rate of 9% Growth
Primary Fuel Unit Quantity
Coal mt 731
Lignite mt 55.59
Oil mt 145
Natural gas bcm 106
Hydro power BkWh 165
Nuclear power BkWh 44.64
Wind power BkWh 7
Source: Working Group Reports of various sectors.
TABLE 10.6Growth Rates of Domestic Supply
(All in %)
1960–70 1970–80 1980–90 1990–2000 2002–07# 2007–12*
Coal 2.74 4.57 6.39 3.87 5.80 9.37Lignite – 4.18 10.42 5.24 4.64 11.72Oil 31.23 4.42 12.1 –0.18 0.56 3.31Natural gas – 5.50 22.32 5.06 0.09 18.53Hydro power 12.61 7.03 3.17 2.66 9.02 7.87Nuclear power – 7.95 4.86 11.10 (–) 9.18 19.13
Note: # The Tenth Plan period; * projected for the Eleventh Plan as per various Working Group Reports.Source: Planning Commission.
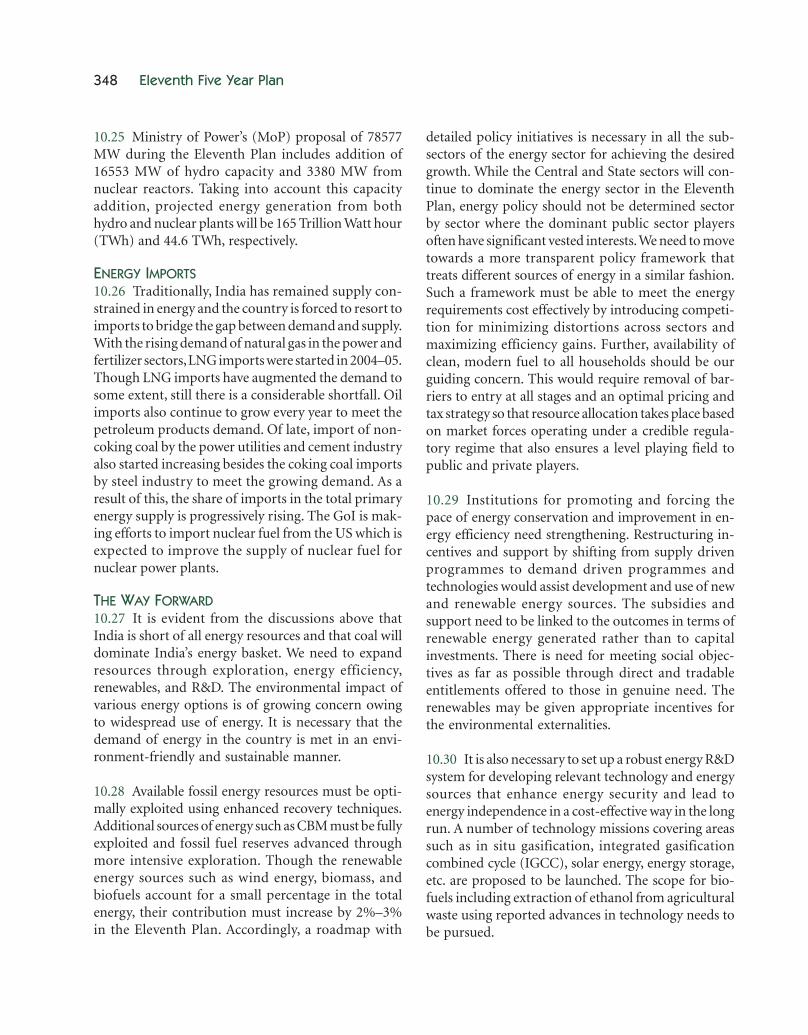
348 Eleventh Five Year Plan
10.25 Ministry of Power’s (MoP) proposal of 78577MW during the Eleventh Plan includes addition of16553 MW of hydro capacity and 3380 MW fromnuclear reactors. Taking into account this capacityaddition, projected energy generation from bothhydro and nuclear plants will be 165 Trillion Watt hour(TWh) and 44.6 TWh, respectively.
ENERGY IMPORTS10.26 Traditionally, India has remained supply con-strained in energy and the country is forced to resort toimports to bridge the gap between demand and supply.With the rising demand of natural gas in the power andfertilizer sectors, LNG imports were started in 2004–05.Though LNG imports have augmented the demand tosome extent, still there is a considerable shortfall. Oilimports also continue to grow every year to meet thepetroleum products demand. Of late, import of non-coking coal by the power utilities and cement industryalso started increasing besides the coking coal importsby steel industry to meet the growing demand. As aresult of this, the share of imports in the total primaryenergy supply is progressively rising. The GoI is mak-ing efforts to import nuclear fuel from the US which isexpected to improve the supply of nuclear fuel fornuclear power plants.
THE WAY FORWARD10.27 It is evident from the discussions above thatIndia is short of all energy resources and that coal willdominate India’s energy basket. We need to expandresources through exploration, energy efficiency,renewables, and R&D. The environmental impact ofvarious energy options is of growing concern owingto widespread use of energy. It is necessary that thedemand of energy in the country is met in an envi-ronment-friendly and sustainable manner.
10.28 Available fossil energy resources must be opti-mally exploited using enhanced recovery techniques.Additional sources of energy such as CBM must be fullyexploited and fossil fuel reserves advanced throughmore intensive exploration. Though the renewableenergy sources such as wind energy, biomass, andbiofuels account for a small percentage in the totalenergy, their contribution must increase by 2%–3%in the Eleventh Plan. Accordingly, a roadmap with
detailed policy initiatives is necessary in all the sub-sectors of the energy sector for achieving the desiredgrowth. While the Central and State sectors will con-tinue to dominate the energy sector in the EleventhPlan, energy policy should not be determined sectorby sector where the dominant public sector playersoften have significant vested interests. We need to movetowards a more transparent policy framework thattreats different sources of energy in a similar fashion.Such a framework must be able to meet the energyrequirements cost effectively by introducing competi-tion for minimizing distortions across sectors andmaximizing efficiency gains. Further, availability ofclean, modern fuel to all households should be ourguiding concern. This would require removal of bar-riers to entry at all stages and an optimal pricing andtax strategy so that resource allocation takes place basedon market forces operating under a credible regula-tory regime that also ensures a level playing field topublic and private players.
10.29 Institutions for promoting and forcing thepace of energy conservation and improvement in en-ergy efficiency need strengthening. Restructuring in-centives and support by shifting from supply drivenprogrammes to demand driven programmes andtechnologies would assist development and use of newand renewable energy sources. The subsidies andsupport need to be linked to the outcomes in terms ofrenewable energy generated rather than to capitalinvestments. There is need for meeting social objec-tives as far as possible through direct and tradableentitlements offered to those in genuine need. Therenewables may be given appropriate incentives forthe environmental externalities.
10.30 It is also necessary to set up a robust energy R&Dsystem for developing relevant technology and energysources that enhance energy security and lead toenergy independence in a cost-effective way in the longrun. A number of technology missions covering areassuch as in situ gasification, integrated gasificationcombined cycle (IGCC), solar energy, energy storage,etc. are proposed to be launched. The scope for bio-fuels including extraction of ethanol from agriculturalwaste using reported advances in technology needs tobe pursued.

Energy 349
10.31 Sector-wise programmes and financial require-ment for the Eleventh Plan are given in the followingsection.
POWER SECTOR
ISSUES AND CHALLENGES10.32 Rapid growth of the economy will place aheavy demand on electric power. Reforms in thissector, for making the power sector efficient and morecompetitive, have been under way for several yearsand while there has been some progress, shortageof power and lack of access continues to be a majorconstraint on the economic growth. The greatestweakness is on the distribution front which is entirelythe domain of the States. AT&C losses of most of theState Power Utilities (SPUs) remain as high as 40%and this has made them financially sick and unableto invest adequately in additional generating capacity.For the same reason, these utilities have had onlylimited success in attracting private investors to set uppower plants.
10.33 The Eleventh Plan must ensure substantialexpansion in order to move to a comfortable situationconsistent with a growth rate between 9% and 10%per annum. Policies must be evolved that wouldensure completion of on-going projects quickly andadd new capacity in an efficient, least cost manner,while emphasizing exploitation of India’s hydro po-tential and nuclear capabilities especially in the fieldof FBRs. Renewables such as wind power, which canbe set up in a short time, play a useful role. One of themain challenges is a major step-up in investment indistribution infrastructure and a restructuring ofthe Accelerated Power Development and ReformsProgramme (APDRP), using technological and mana-gerial tools such as smart metering and GIS mappingfor real time, monitoring and accountability at eachdistribution transformer with a goal set for the StateGovernments to bring down AT&C losses from thecurrent level of around 40% to at least 15% by the endof the Eleventh Plan. Given the high level of such lossesat present, it may be difficult for some States to attainthese targets. Another challenge is to provide electric-ity access to all households and actually connect allBPL households under the RGGVY.
10.34 Establishment of new generation capacityand reducing cost of power will require action onmany fronts:
• Availability of fuel such as coal or natural gas fornew power plants must be assured.
• Long-term finance should be made available tolower the capital charge.
• The presently provided guaranteed rate of posttax returns for CPSUs, the rate of return to theutilities, needs to be realigned by Central Electric-ity Regulatory Commission (CERC) keeping in viewthe assessments of overall risks and prevalent costof capital.
• Inter-state and intra-state transmission system ofadequate capacity needs to be built that is capableof transferring power efficiently from one regionto another.
• Distribution system must be made efficient whichalone can ensure financially viable expansion.
• Thermal stations should be rehabilitated throughRenovation and Modernization (R&M) to augmentgenerating capacity and improve PLF.
• Hydro stations should be rehabilitated to yieldadditional peaking capacity.
• Supply side and demand side efficiencies shouldbe improved to effectively lower primary energydemand by 5%–7% during the Eleventh Planperiod.
• Use of washed coal should be ensured for powergeneration.
• Captive capacity should be harnessed to meet thepower deficit.
REVIEW OF THE TENTH PLAN
Power Sector Reforms10.35 Power sector reforms have been underway forover a decade. Enactment of ‘Electricity Act 2003’during the Tenth Plan was an important step towardsreforms in the power sector. The objectives of theAct are ‘to consolidate the laws relating to generation,transmission, distribution, trading and use of electric-ity and taking measures conducive for the developmentof electrical industry, protecting interests of consum-ers and supply of electricity to all areas, rationaliza-tion of electricity tariffs, ensuring transparent policies

350 Eleventh Five Year Plan
regarding subsidies, promotion of efficient and envi-ronmentally benign policies, constitution of Regula-tory Commissions and establishment of AppellateTribunal for matters connected therewith or inciden-tal thereto’.
10.36 The following milestones were achieved in thepower sector during the Tenth Plan:
• As many as 14 States have restructured or cor-poratized their power sector and unbundled theirboards into separate entities for transmission,distribution, and generation.
• Distribution has been privatized in Orissa andDelhi.
• Setting up of State Electricity Regulatory Commis-sions (SERCs) has become mandatory. A total of25 States have either constituted or notified theconstitution of SERC and 21 SERCs have issuedtariff orders.
• A total of 26 States have notified rural areas underSection 14 of the Act, permits have been taken ofcomposite schemes of generation and distributionwithout any license.
• In compliance with Section 3 of the ElectricityAct 2003, the Central Government notified theNational Electricity Policy in 2005. Similarly,National Tariff Policy was also notified in 2006.Further, in compliance with Sections 4 and 5 ofthe Electricity Act 2003, the Central Governmentnotified the Rural Electrification Policy on 28August 2006.
• The Central Government constituted the AppellateTribunal for Electricity and the same becameoperational in July 2005. The Tribunal has startedhearing appeals against orders of the RegulatoryCommissions/Adjudicating Officers.
• Open access has been technically allowed andalso made functional for inter-state transmis-sion; however it has, in fact, been hindered bythe high cross-subsidy surcharge set by manySERCs.
• Finally, under APDRP, nine States have shown a cashloss reduction of Rs 5254.60 crore over their losslevels of 2001–02. However, the progress is smalland AT&C losses continue to remain high in mostStates.
OTHER NEW MAJOR INITIATIVES IN THETENTH PLAN
Guidelines Formulated for MerchantPlants/Coal Linkages10.37 Guidelines were formulated on MerchantPower Plants with an aim to restructure the electricityindustry on 3 November 2006. Under this policy,coal blocks/coal linkage will be provided to thesuccessful bidders in setting up thermal powerstations.
Guidelines for Procurement of Electricity10.38 In compliance with Section 63 of the Electric-ity Act 2003, the Central Government has notifiedguidelines for procurement of power by DistributionLicensees through competitive bidding. Further, theCentral Government has also issued the standard biddocuments for long-term procurement of power fromprojects having specified site and location.
Launch of Ultra-mega Power Projects (UMPPs)10.39 The Electricity Act 2003 requires competitivetariff-based bidding from independent power produc-ers. To initiate the process and to realize the benefitsof international competitive bidding and economiesof scale, a scheme was launched for development ofcoal-based UMPPs with a capacity of 4000 MW orabove through tariff-based competitive bidding. Theprojects will include development of power projectsas well as associated coal mines in respect of pitheadsites and imported coal sourcing in respect of coastalsites. These projects will be awarded to developers onBOO basis. The bidding process has been completedin respect of two projects, that is, Sasan in MadhyaPradesh and Mundra in Gujarat and the projects al-lotted to Reliance Energy and Tata Power, respectively.The process is underway in respect of Krishnapattanamin Andhra Pradesh.
Guidelines Issued for EncouragingCompetition in Development ofTransmission Projects10.40 The Central Government has also notifiedguidelines for encouraging competition in develop-ment of transmission projects through tariff-basedbidding.

Energy 351
Capacity Addition10.41 The all-India installed generating capacity ofutilities at the beginning of the Tenth Plan was104917.50 MW. This included 26261.22 MW ofhydro, 74428.82 MW of thermal, 2720.00 MW ofnuclear power, and 1507.50 MW of wind energy.
10.42 The capacity addition target for the Tenth Planwas 41109.84 MW. Against this, a capacity addition of21080.24 MW was actually achieved during the Planperiod. The sector-wise, mode-wise summaries of theTenth Plan capacity addition target and achievementare given in Table 10.7.
10.43 It may be noted that the above capacity includes1210.6 MW thermal-based capacity (Central: 500 MW,State: 538 MW, and private: 172.60 MW) which wasnot included in the original Plan target. Despite theseadditional projects, the Tenth Plan performance hasbeen disappointing.
10.44 The cumulative capacity at the end of the TenthPlan was 132329.21 MW, including 7760.60 MWrenewable sources of energy, the details of whichare given in Table 10.8.
Transmission and Distribution (T&D) Facilities10.45 The major portion of the HVDC, 765 kV and400 kV transmission network planned to be set upduring the Tenth Plan, was in the Central sector, whilethat of the 220 kV network was in the State sector.Most of the targeted addition achieved was inadequateas neither the targeted generation nor the projecteddemand was realized. A summary of the Tenth Plantransmission achievement up to 31 March 2007 is givenin Table 10.9.
Transmission and Distribution (T&D)Losses/AT&C Losses10.46 T&D losses in India continue to be among thehighest in the world and are the main concern in thedevelopment of power sector. The reported all-Indiaaverage T&D losses increased from 19.8% in 1992–93to 33.98% at the beginning of the Tenth Plan. There isa wide variation in the losses reported by differentStates. T&D losses for the country as a whole are esti-mated to be in the range of 35%–45%.
10.47 As T&D losses figures did not capture the gapbetween the billing and the collection, the concept ofAT&C loss was introduced in 2001–02 to capture the
TABLE 10.7Installed Capacity Addition during the Tenth Plan
Type Target Achievement
Central State Private Total Central State Private TotalSector Sector Sector Sector Sector Sector
Hydro 7842.00 5381.20 1170.00 14393.20 4495.00 2691.00 700.00 7886.00Thermal 12790.00 6675.64 5951.00 25416.64 6590.00 3553.64 1970.60 12114.24Nuclear 1300.00 0.00 0.00 1300.00 1080.00 0.00 0.00 1080.00Total 21932.00 12056.84 7121.00 41109.84 12165.00 6244.64 2670.60 21080.24
Source: Central Electricity Authority (CEA).
TABLE 10.8All-India Cumulative Generating Capacity
(MW)
Hydro Thermal Nuclear Total
Centre 7562.00 33658.99 3900.00 45120.99State/UTs 25785.62 43334.33 0.00 69119.95Private 1306.15 9021.52 0.00 10327.67Total 34653.77 86014.84 3900.00 124568.61#
Note: # excludes the capacity of 7760.60 MW from renewable energy sources (State: 975.65 MWand private: 6784.95 MW).Source: CEA.

352 Eleventh Five Year Plan
total performance of the utility. The AT&C losses arepresently in the range of 18% to 62% in various States.The average AT&C loss in the country is about 40%.There is wide variation of losses among the States andvariation among the distribution companies withinthe States. The major portion of losses is due to theftand pilferage, which is estimated at about Rs 20000crore annually as per the Economic Survey 2006–07.More than 75%–80% of the total technical loss andalmost the entire commercial loss occur at the distri-bution stage.
Programme for Central Assistance under APDRP10.48 To encourage distribution reforms, the
APDRP was launched in March 2003 consistingof an investment financing component and anincentive component for improved performance.Under the investment component, projects worthRs 17033.58 crore had been sanctioned. All ofthese projects were designed to reduce the AT&Closses through strengthening of the sub-transmissionand distribution system. While the total invest-ment needs for projects in special category Stateswere to be met by the GoI, the non-special categoryStates were required to fund 75% of the approvedproject outlay through counterpart funding arrangedby the State Governments. A broad summary of theinvestment component is given in Table 10.10.
TABLE 10.9Cumulative Achievements of Transmission Lines at the End of the Tenth Plan
Transmission System Unit At the End of Ninth Plan Addition during At the End of Tenth PlanType/Voltage Class (March 2002) Tenth Plan (March 2007)
Transmission Lines
(i) 765 kV ckm 971 733 1704(ii) HVDC + 500kV Bi-pole ckm 3138 2734 5872(iii) 400 kV ckm 49378 26344 75722(iv) 230/220kV ckm 96993 117636 114629(v) HVDC 200 kV Mono-pole ckm 162 0 162
Total of (i), (ii), (iii), (iv), and (v) ckm 150642 47447 198089
Sub-stations
(i) 765 kV MVA 0 2000 2000(ii) 400 kV MVA 60380 32562 92942(iii) 230/220 kV MVA 116363 40134 156497
Total of (i), (ii), and (iii) MVA 176743 74696 251439
HVDC
(i) Bi-pole link capacity MW 3000 2000 5000(ii) Back-to-back capacity MW 2000 1000 3000(iii) Mono-pole link capacity MW 200 0 200
Total of (i), (ii), and (iii) MW 5200 3000 8200
Source: CEA.
TABLE 10.10Summary of Investment Component of APDRP (as on 31 August 2007) (at Current Price)
(Rs Crore)
S. Category Project Revised APDRP Amount Actually Counterpart Total UtilizationNo. of States Outlay Component to be Released by GoI Funds Provided (Actual Investment)
Funded by GoI by States
1. Non-special 13668.28 5567.26 5094.32 4750.97 9232.012. Special 3365.30 3152.81 2292.49 62.95 1830.41
Grand Total 17033.58 8720.07 7386.83 4813.92 11062.42
Source: MoP.
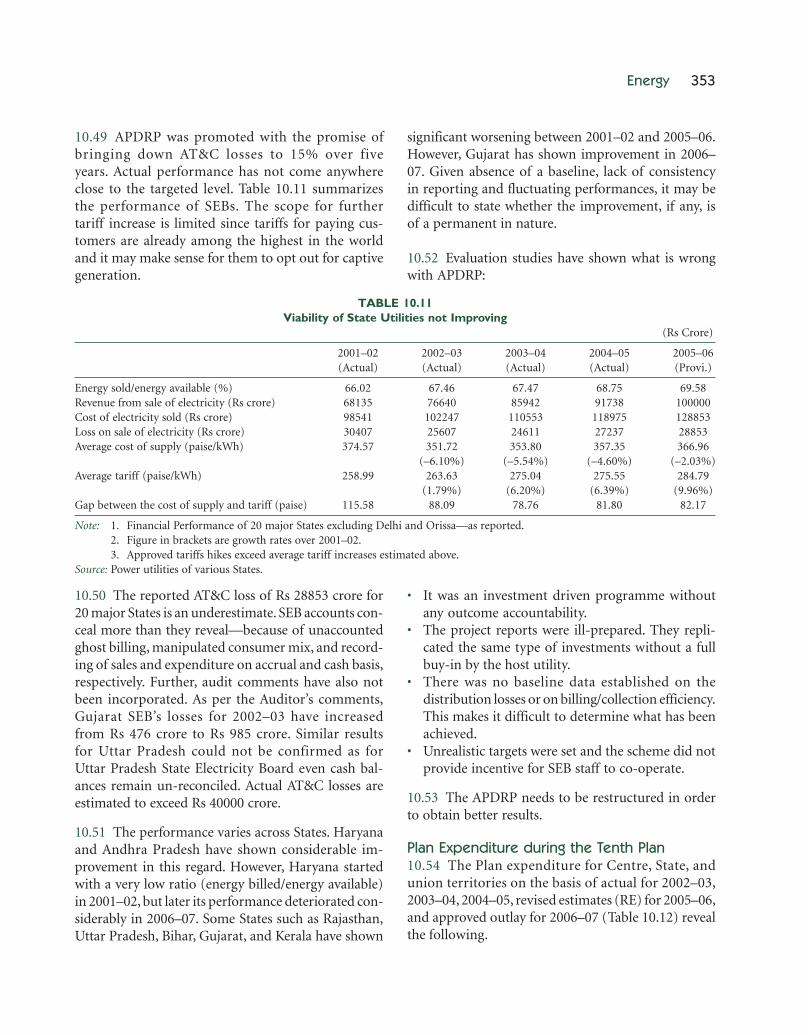
Energy 353
10.49 APDRP was promoted with the promise ofbringing down AT&C losses to 15% over fiveyears. Actual performance has not come anywhereclose to the targeted level. Table 10.11 summarizesthe performance of SEBs. The scope for furthertariff increase is limited since tariffs for paying cus-tomers are already among the highest in the worldand it may make sense for them to opt out for captivegeneration.
significant worsening between 2001–02 and 2005–06.However, Gujarat has shown improvement in 2006–07. Given absence of a baseline, lack of consistencyin reporting and fluctuating performances, it may bedifficult to state whether the improvement, if any, isof a permanent in nature.
10.52 Evaluation studies have shown what is wrongwith APDRP:
TABLE 10.11Viability of State Utilities not Improving
(Rs Crore)
2001–02 2002–03 2003–04 2004–05 2005–06(Actual) (Actual) (Actual) (Actual) (Provi.)
Energy sold/energy available (%) 66.02 67.46 67.47 68.75 69.58Revenue from sale of electricity (Rs crore) 68135 76640 85942 91738 100000Cost of electricity sold (Rs crore) 98541 102247 110553 118975 128853Loss on sale of electricity (Rs crore) 30407 25607 24611 27237 28853Average cost of supply (paise/kWh) 374.57 351.72 353.80 357.35 366.96
(–6.10%) (–5.54%) (–4.60%) (–2.03%)Average tariff (paise/kWh) 258.99 263.63 275.04 275.55 284.79
(1.79%) (6.20%) (6.39%) (9.96%)Gap between the cost of supply and tariff (paise) 115.58 88.09 78.76 81.80 82.17
Note: 1. Financial Performance of 20 major States excluding Delhi and Orissa—as reported.2. Figure in brackets are growth rates over 2001–02.3. Approved tariffs hikes exceed average tariff increases estimated above.
Source: Power utilities of various States.
10.50 The reported AT&C loss of Rs 28853 crore for20 major States is an underestimate. SEB accounts con-ceal more than they reveal—because of unaccountedghost billing, manipulated consumer mix, and record-ing of sales and expenditure on accrual and cash basis,respectively. Further, audit comments have also notbeen incorporated. As per the Auditor’s comments,Gujarat SEB’s losses for 2002–03 have increasedfrom Rs 476 crore to Rs 985 crore. Similar resultsfor Uttar Pradesh could not be confirmed as forUttar Pradesh State Electricity Board even cash bal-ances remain un-reconciled. Actual AT&C losses areestimated to exceed Rs 40000 crore.
10.51 The performance varies across States. Haryanaand Andhra Pradesh have shown considerable im-provement in this regard. However, Haryana startedwith a very low ratio (energy billed/energy available)in 2001–02, but later its performance deteriorated con-siderably in 2006–07. Some States such as Rajasthan,Uttar Pradesh, Bihar, Gujarat, and Kerala have shown
• It was an investment driven programme withoutany outcome accountability.
• The project reports were ill-prepared. They repli-cated the same type of investments without a fullbuy-in by the host utility.
• There was no baseline data established on thedistribution losses or on billing/collection efficiency.This makes it difficult to determine what has beenachieved.
• Unrealistic targets were set and the scheme did notprovide incentive for SEB staff to co-operate.
10.53 The APDRP needs to be restructured in orderto obtain better results.
Plan Expenditure during the Tenth Plan10.54 The Plan expenditure for Centre, State, andunion territories on the basis of actual for 2002–03,2003–04, 2004–05, revised estimates (RE) for 2005–06,and approved outlay for 2006–07 (Table 10.12) revealthe following.
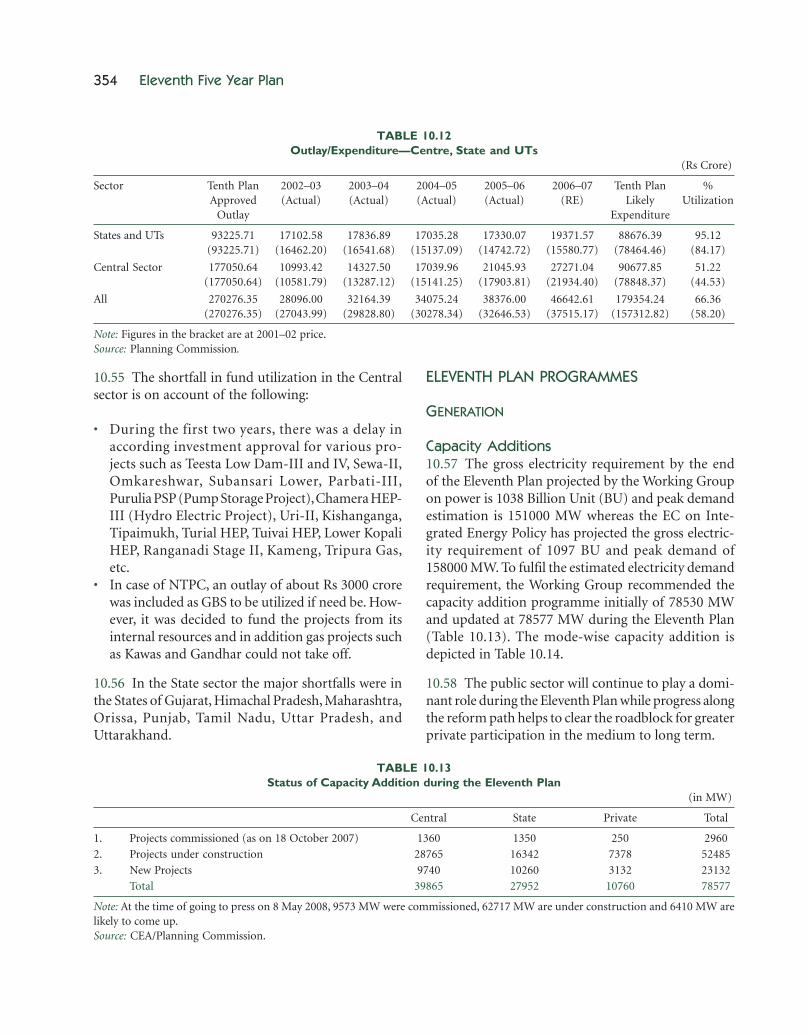
354 Eleventh Five Year Plan
10.55 The shortfall in fund utilization in the Centralsector is on account of the following:
• During the first two years, there was a delay inaccording investment approval for various pro-jects such as Teesta Low Dam-III and IV, Sewa-II,Omkareshwar, Subansari Lower, Parbati-III,Purulia PSP (Pump Storage Project), Chamera HEP-III (Hydro Electric Project), Uri-II, Kishanganga,Tipaimukh, Turial HEP, Tuivai HEP, Lower KopaliHEP, Ranganadi Stage II, Kameng, Tripura Gas,etc.
• In case of NTPC, an outlay of about Rs 3000 crorewas included as GBS to be utilized if need be. How-ever, it was decided to fund the projects from itsinternal resources and in addition gas projects suchas Kawas and Gandhar could not take off.
10.56 In the State sector the major shortfalls were inthe States of Gujarat, Himachal Pradesh, Maharashtra,Orissa, Punjab, Tamil Nadu, Uttar Pradesh, andUttarakhand.
ELEVENTH PLAN PROGRAMMES
GENERATION
Capacity Additions10.57 The gross electricity requirement by the endof the Eleventh Plan projected by the Working Groupon power is 1038 Billion Unit (BU) and peak demandestimation is 151000 MW whereas the EC on Inte-grated Energy Policy has projected the gross electric-ity requirement of 1097 BU and peak demand of158000 MW. To fulfil the estimated electricity demandrequirement, the Working Group recommended thecapacity addition programme initially of 78530 MWand updated at 78577 MW during the Eleventh Plan(Table 10.13). The mode-wise capacity addition isdepicted in Table 10.14.
10.58 The public sector will continue to play a domi-nant role during the Eleventh Plan while progress alongthe reform path helps to clear the roadblock for greaterprivate participation in the medium to long term.
TABLE 10.12Outlay/Expenditure—Centre, State and UTs
(Rs Crore)
Sector Tenth Plan 2002–03 2003–04 2004–05 2005–06 2006–07 Tenth Plan %Approved (Actual) (Actual) (Actual) (Actual) (RE) Likely Utilization
Outlay Expenditure
States and UTs 93225.71 17102.58 17836.89 17035.28 17330.07 19371.57 88676.39 95.12(93225.71) (16462.20) (16541.68) (15137.09) (14742.72) (15580.77) (78464.46) (84.17)
Central Sector 177050.64 10993.42 14327.50 17039.96 21045.93 27271.04 90677.85 51.22(177050.64) (10581.79) (13287.12) (15141.25) (17903.81) (21934.40) (78848.37) (44.53)
All 270276.35 28096.00 32164.39 34075.24 38376.00 46642.61 179354.24 66.36(270276.35) (27043.99) (29828.80) (30278.34) (32646.53) (37515.17) (157312.82) (58.20)
Note: Figures in the bracket are at 2001–02 price.Source: Planning Commission.
TABLE 10.13Status of Capacity Addition during the Eleventh Plan
(in MW)
Central State Private Total
1. Projects commissioned (as on 18 October 2007) 1360 1350 250 2960
2. Projects under construction 28765 16342 7378 52485
3. New Projects 9740 10260 3132 23132
Total 39865 27952 10760 78577
Note: At the time of going to press on 8 May 2008, 9573 MW were commissioned, 62717 MW are under construction and 6410 MW arelikely to come up.Source: CEA/Planning Commission.
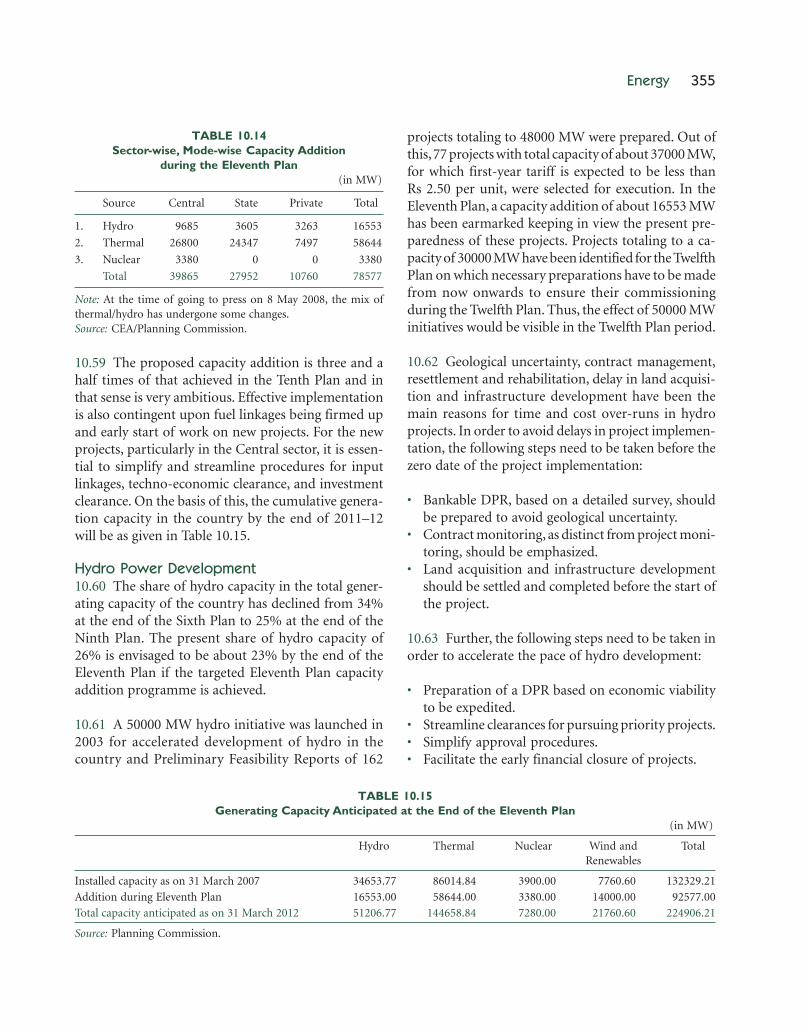
Energy 355
10.59 The proposed capacity addition is three and ahalf times of that achieved in the Tenth Plan and inthat sense is very ambitious. Effective implementationis also contingent upon fuel linkages being firmed upand early start of work on new projects. For the newprojects, particularly in the Central sector, it is essen-tial to simplify and streamline procedures for inputlinkages, techno-economic clearance, and investmentclearance. On the basis of this, the cumulative genera-tion capacity in the country by the end of 2011–12will be as given in Table 10.15.
Hydro Power Development10.60 The share of hydro capacity in the total gener-ating capacity of the country has declined from 34%at the end of the Sixth Plan to 25% at the end of theNinth Plan. The present share of hydro capacity of26% is envisaged to be about 23% by the end of theEleventh Plan if the targeted Eleventh Plan capacityaddition programme is achieved.
10.61 A 50000 MW hydro initiative was launched in2003 for accelerated development of hydro in thecountry and Preliminary Feasibility Reports of 162
projects totaling to 48000 MW were prepared. Out ofthis, 77 projects with total capacity of about 37000 MW,for which first-year tariff is expected to be less thanRs 2.50 per unit, were selected for execution. In theEleventh Plan, a capacity addition of about 16553 MWhas been earmarked keeping in view the present pre-paredness of these projects. Projects totaling to a ca-pacity of 30000 MW have been identified for the TwelfthPlan on which necessary preparations have to be madefrom now onwards to ensure their commissioningduring the Twelfth Plan. Thus, the effect of 50000 MWinitiatives would be visible in the Twelfth Plan period.
10.62 Geological uncertainty, contract management,resettlement and rehabilitation, delay in land acquisi-tion and infrastructure development have been themain reasons for time and cost over-runs in hydroprojects. In order to avoid delays in project implemen-tation, the following steps need to be taken before thezero date of the project implementation:
• Bankable DPR, based on a detailed survey, shouldbe prepared to avoid geological uncertainty.
• Contract monitoring, as distinct from project moni-toring, should be emphasized.
• Land acquisition and infrastructure developmentshould be settled and completed before the start ofthe project.
10.63 Further, the following steps need to be taken inorder to accelerate the pace of hydro development:
• Preparation of a DPR based on economic viabilityto be expedited.
• Streamline clearances for pursuing priority projects.• Simplify approval procedures.• Facilitate the early financial closure of projects.
TABLE 10.14Sector-wise, Mode-wise Capacity Addition
during the Eleventh Plan(in MW)
Source Central State Private Total
1. Hydro 9685 3605 3263 16553
2. Thermal 26800 24347 7497 58644
3. Nuclear 3380 0 0 3380
Total 39865 27952 10760 78577
Note: At the time of going to press on 8 May 2008, the mix ofthermal/hydro has undergone some changes.Source: CEA/Planning Commission.
TABLE 10.15Generating Capacity Anticipated at the End of the Eleventh Plan
(in MW)
Hydro Thermal Nuclear Wind and TotalRenewables
Installed capacity as on 31 March 2007 34653.77 86014.84 3900.00 7760.60 132329.21
Addition during Eleventh Plan 16553.00 58644.00 3380.00 14000.00 92577.00
Total capacity anticipated as on 31 March 2012 51206.77 144658.84 7280.00 21760.60 224906.21
Source: Planning Commission.

356 Eleventh Five Year Plan
• Priority to be given to projects for which concur-rence has already been issued by the CEA.
• High priority to be accorded to smaller capacity Runof the River-type hydro projects having gestationperiod less than five years.
• Basin-wise optimization studies for all the majorriver basins should be carried out.
• Competitive bidding other than tariff-basedcompetitive bidding could also be consideredfor hydro projects since there are formidableconstruction risks in hydro power constructiondue to geological uncertainties and other factors.
Nuclear Power10.64 Atomic energy is an important source of elec-tric power which has environmental advantages andis also likely to be economical in the longer run. Atpresent, nuclear energy installed capacity is 3900 MWe
which is 3.1% of total installed capacity. The PLF ofNuclear Power Corporation of India Limited (NPCIL)stations increased from 60% in 1995–96 to 82% in2000–01 but it has decreased to 57% in 2006–07. Con-straint in nuclear fuel availability is the main reasonfor lower PLF. NPCIL made major strides in cuttingcosts and construction periods for nuclear powerprojects in the Tenth Plan. The lower constructionperiod and improved contracting and contractmanagement have resulted in reduction in the capitalcost per MWe.
10.65 The Kudankulam project (2 × 1000 MWe)is being set up, based on light water reactor technol-ogy, and NPCIL has initiated pre-project activitiesfor its expansion with another two units of 1000MWe. Further, the design of 700 MWe indigenousPHWRs has been undertaken by NPCIL to enhancethe pace of first stage capacity addition programme.Pre-project activities of four such units have beeninitiated.
10.66 Having successfully completed the R&D phaseof the FBR technology, the DAE has engaged the IndiraGandhi Centre for Atomic Research (IGCAR) for thedesign, development, construction, and operation ofthe country’s first 500 MWe liquid-sodium-cooled FBR.The government has set up a new company, BharatiyaNabhikiya Vidyut Nigam Limited, in September 2003
to implement the first project based on the FBRtechnology. The first 500 MWe prototype FBR is likelyto be commissioned in the Eleventh Plan. The FBRtechnology is critical for developing the second stageof India’s nuclear power programmes. Without devel-oping the wide-scale use of FBR technology, Indiawould find it difficult to go beyond 10000 MWe nuclearcapacity based on known indigenous uranium re-sources. About 20000 MWe nuclear power programmeis critical to developing the thorium-based third stageof India’s nuclear power programme. Use of FBR tech-nology would enable indigenous uranium resourcesto support it. The BARC is also engaged in R&D ac-tivities to develop advanced heavy water reactors of300 MWe capacity that would provide an alternativeroute to the thorium-based third stage of India’snuclear power programme.
10.67 The Eleventh Plan power programme includes3380 MWe of nuclear power plants. The GoI is makingefforts to import nuclear fuel from abroad whichis expected to improve the supply of nuclear fuelfor nuclear power plants. It is also expected that theexecution of nuclear projects will also be opened upto enable participation by other PSUs and privatesector. The effect of this is likely to be visible in theTwelfth Plan period. NPCIL has indicated a capacityaddition of about 11000 MW during the TwelfthPlan.
Merchant Power Plants10.68 A merchant power plant does not have long-term Power Purchase Agreement for sale of its powerand is generally developed on the balance sheet ofdevelopers. The GoI has reserved coal block withreserves of 3.2 billion tonnes of coal for allotmentby Screening Committee of Ministry of Coal (MoC)for merchant and captive plants. About 10000 MWcapacity is expected to be developed through thisinitiative. This capacity has not been taken intoaccount while working out the capacity requirementover the Eleventh Plan period as it is not likely tomaterialize before the Twelfth Plan.
Captive Power Generation10.69 Large number of captive plants including co-generation power plants of varied type and sizes exist
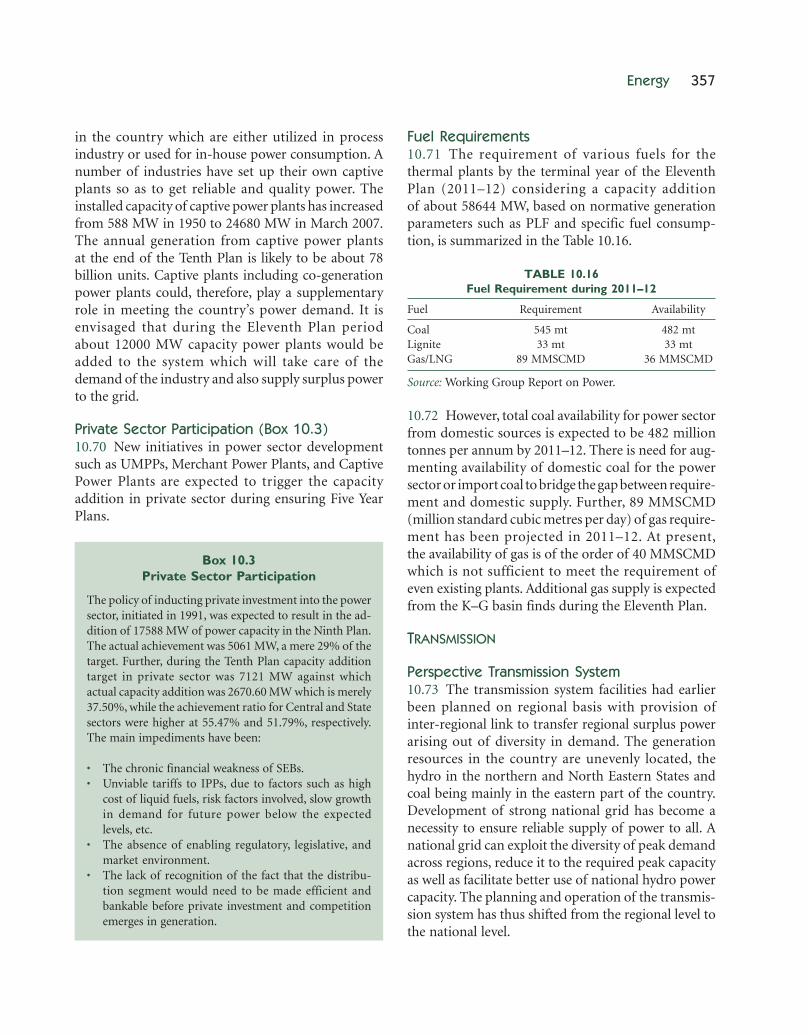
Energy 357
in the country which are either utilized in processindustry or used for in-house power consumption. Anumber of industries have set up their own captiveplants so as to get reliable and quality power. Theinstalled capacity of captive power plants has increasedfrom 588 MW in 1950 to 24680 MW in March 2007.The annual generation from captive power plantsat the end of the Tenth Plan is likely to be about 78billion units. Captive plants including co-generationpower plants could, therefore, play a supplementaryrole in meeting the country’s power demand. It isenvisaged that during the Eleventh Plan periodabout 12000 MW capacity power plants would beadded to the system which will take care of thedemand of the industry and also supply surplus powerto the grid.
Private Sector Participation (Box 10.3)10.70 New initiatives in power sector developmentsuch as UMPPs, Merchant Power Plants, and CaptivePower Plants are expected to trigger the capacityaddition in private sector during ensuring Five YearPlans.
Fuel Requirements10.71 The requirement of various fuels for thethermal plants by the terminal year of the EleventhPlan (2011–12) considering a capacity additionof about 58644 MW, based on normative generationparameters such as PLF and specific fuel consump-tion, is summarized in the Table 10.16.
TABLE 10.16Fuel Requirement during 2011–12
Fuel Requirement Availability
Coal 545 mt 482 mtLignite 33 mt 33 mtGas/LNG 89 MMSCMD 36 MMSCMD
Source: Working Group Report on Power.
10.72 However, total coal availability for power sectorfrom domestic sources is expected to be 482 milliontonnes per annum by 2011–12. There is need for aug-menting availability of domestic coal for the powersector or import coal to bridge the gap between require-ment and domestic supply. Further, 89 MMSCMD(million standard cubic metres per day) of gas require-ment has been projected in 2011–12. At present,the availability of gas is of the order of 40 MMSCMDwhich is not sufficient to meet the requirement ofeven existing plants. Additional gas supply is expectedfrom the K–G basin finds during the Eleventh Plan.
TRANSMISSION
Perspective Transmission System10.73 The transmission system facilities had earlierbeen planned on regional basis with provision ofinter-regional link to transfer regional surplus powerarising out of diversity in demand. The generationresources in the country are unevenly located, thehydro in the northern and North Eastern States andcoal being mainly in the eastern part of the country.Development of strong national grid has become anecessity to ensure reliable supply of power to all. Anational grid can exploit the diversity of peak demandacross regions, reduce it to the required peak capacityas well as facilitate better use of national hydro powercapacity. The planning and operation of the transmis-sion system has thus shifted from the regional level tothe national level.
Box 10.3Private Sector Participation
The policy of inducting private investment into the powersector, initiated in 1991, was expected to result in the ad-dition of 17588 MW of power capacity in the Ninth Plan.The actual achievement was 5061 MW, a mere 29% of thetarget. Further, during the Tenth Plan capacity additiontarget in private sector was 7121 MW against whichactual capacity addition was 2670.60 MW which is merely37.50%, while the achievement ratio for Central and Statesectors were higher at 55.47% and 51.79%, respectively.The main impediments have been:
• The chronic financial weakness of SEBs.• Unviable tariffs to IPPs, due to factors such as high
cost of liquid fuels, risk factors involved, slow growthin demand for future power below the expectedlevels, etc.
• The absence of enabling regulatory, legislative, andmarket environment.
• The lack of recognition of the fact that the distribu-tion segment would need to be made efficient andbankable before private investment and competitionemerges in generation.

358 Eleventh Five Year Plan
Transmission Capacity Requirement10.74 The focus of transmission system developmentprogramme for the Eleventh Plan is to provide ad-equate inter-regional and intra-regional transmissioncapacity so as to consolidate and strengthen thenational grid network towards a strong all-India grid.The inter-regional power exchange requirementhas been assessed from possible scenarios of regionalsurpluses and deficits for the peak and off-peak con-ditions of winter, summer, and monsoon months. Theprojections are based on programme of generation andanticipated demand aim at estimating the transmis-sion requirement at the inter-regional level. Gridexpansion plan based on this projection would be ableto cater to the needs of various feasible operating sce-narios and also provide required margins to supportmarket-oriented power exchanges.
Development of National Grid10.75 It is envisaged to add new inter-regional capaci-ties of 20700 MW at 220 kV and above during theEleventh Plan period. This would increase the totalinter-regional transmission capacity of nationalpower grid at 220 kV and above from 14100 MW (bythe end of the Tenth Plan) to 37750 MW by 2011–12.The plan for national power grid and the schemeshave been identified. NER, Sikkim, and Bhutan havevast untapped hydro potential which is planned fordevelopment during the Eleventh Plan and beyond.The requirement of transmission system for evacua-tion of the NER hydro power has been estimatedcorresponding to the capacity of hydro projectswhich may be feasible to develop in the next 20 years.This generation is estimated to be about 35000 MWin the NER, about 8000 MW in Sikkim, and about15000 MW in Bhutan. Taking local development ataccelerated pace resulting in demand within the NER,Sikkim, and Bhutan to be in the range of 10000–12000MW (presently it is about 1500 MW), the transmis-sion requirement through the chicken neck works outto be of the order of 45000 MW. The total require-ment including additional circuits for meeting the con-tingencies and reliability needs would work out toseven or eight HVDC bi-pole lines of 800 kV andfour or five double-circuit lines of 400 kV—a totalof 12 high-capacity transmission corridors passingthrough the chicken neck. For this, Right of Width
requirement would be about 1.5 km in width consid-ering the minimum distance between adjacent towersto be such that fall of any tower does not affect theadjoining line. The first 800 kV HVDC bi-pole linehas been planned from a pooling sub-station atBiswanath Chariyali in the NER upto Agra in thenorthern region. This is being programmed forcommissioning matching with Subansiri Lower HEPin 2011–12.
Transmission Capacity for Trading/Margins10.76 The method adopted for evolving the nationaltransmission system expansion plan provides sufficienttransmission capacities which would have inherentmargins for trading transactions. Transmission systemimplemented on the basis of the expansion planevolved in this manner would enable trading acrossthe regional boundaries towards optimal utilizationof generation resources in the country for ultimatebenefit of the consumer.
Distribution10.77 Distribution is the key segment of the electric-ity supply chain. The distribution sector caters to therural and urban areas. Rural distribution segment ischaracterized by wide dispersal of network over largeareas with long lines, low demand density, high cost ofsupply, low paying capacity of the people, large num-ber of subsidized customers, unmetered flat rate sup-ply to farmers, non-metering due to high cost andpractical difficulties, low load and low rate of loadgrowth. Urban distribution is characterized by highconsumer density and higher rate of growth of load.Both segments are distinct with different problems andissues. The biggest challenge of the power sector is thehigh T&D losses. A combination of technical and non-technical factors is contributing to high T&D losses.Lack of consumer awareness, political interference, andinefficient use of electricity is further aggravating theproblem. In urban areas too, the distribution systemsuffers from a large number of unauthorized connec-tions and power theft.
10.78 The sub-transmission and distribution systemwere the thrust areas during the Tenth Plan. Theperformance of APDRP scheme has not been up tothe mark in the Tenth Plan period and needs to be
Energy 359
restructured in the Eleventh Plan period as distribu-tion is the key element for improving the overallperformance of the power sector. For APDRP restruc-turing, following actions are suggested to be takenduring the Eleventh Plan:
• All distribution companies should target a reduc-tion of 3% per annum of their AT&C losses in nextfive years. High loss making feeders need to be fran-chised by distribution companies.
• Setting up of peaking power plants should beencouraged to overcome peaking shortages as theadditional power cost of supply from such a plantcould then be passed on to the consumer who optfor uninterruptible/reliable supply.
• Introducing bifurcation of feeders for agriculturalusers with unmetered power supply, automatedmetering of all distribution transformers, and GISmapping of all consumers.
• Preparation of baseline data in respect of energyflow for each distribution transformer within threemonths of completing the above.
• Incentive for staff linked to specific measures ofimprovement.
• Web-based transparency of performance of eachdistribution transformer level including names ofthe staff responsible.
• Independent external audit to track and monitoroutliers.
• Funds initially to be given as loan which may beconverted to grant based on achievement ofspecific milestones on outcomes of investments.
10.79 The Working Group of the Eleventh Plan hasassessed a total investment requirement of this sectoras more than Rs 2 lakh crore. A major investmentof this size is beyond the capacity of State utilities. Itis therefore planned to set up a National ElectricityFund (NEF) to cater to the requirement of these com-panies. State utilities could prepare their distributioninvestment plans along with supportive measures in-cluding appointment of franchises, high voltage dis-tribution supply, fast track courts to punish personsguilty of theft of electricity, use of covered cables inareas prone to theft of electricity, installation ofmetres, and a monitoring system with complete auditof electricity generated and received by the company.
The APDRP funds could be used to provide grant(25%) for utilities, the balance being the loan fromthe NEF and for North Eastern States this could be(90%) grant.
RAJIV GANDHI GRAMEEN VIDYUTIKARAN YOJANA(RGGVY)10.80 The GoI launched RGGVY in April 2005 toprovide electricity access to all rural households andextend free connections to all BPL households (esti-mated at 2.3 crore) by 2009. RGGVY subsidizes thecapital cost by 90% through GoI grants. The approvedcapital cost estimate for RGGVY is Rs 16000 crorewith a subsidy component of Rs 14750 crore. Thephysical targets included electrification of 125000un-electrified villages by creating rural electricitydistribution backbone and village electrificationinfrastructure and last mile service connectivity to10% households in the village at a rate of Rs 6.50lakh per village. The target to give free connectionsto 2.34 crore BPL households was also included inthe above estimates. Further, the estimates coveredintensification works in already electrified villagesat a rate of Rs one lakh per village for 4.62 lakhvillages.
10.81 While approval was accorded to Phase-I ofthe scheme of Rural Electricity Infrastructure andHousehold Electrification, which was later renamedas RGGVY by CCEA in December 2004, it wasdecided that implementation of Phase-I of the schemein the Tenth Plan will have a provision of Rs 5000crore as subsidy under the Plan Budget of the MoPfor the remaining two years of the Tenth Plan,namely, 2005–06 and 2006–07. It was also decided thatprior commitment of the States will be obtained,before grant of subsidy, for (i) deployment of franchi-sees for the management of rural distribution inprojects financed under the scheme and (ii) theprovision of the requisite revenue subsidies to theState utilities by the State Government as requiredunder the Electricity Act 2003. CCEA also decidedthat the scheme is to be subject to concurrent evalua-tion and a view on modifications required for imple-mentation during the Eleventh Plan may be takenafter a comprehensive review towards the end of theTenth Plan.
360 Eleventh Five Year Plan
10.82 The target set by the MoP was electrificationof 10000 villages in 2005–06 and the achievementreported was 9819 villages during the same period.In addition, intensification works were carried out in350 already electrified villages. Against the total sub-sidy amount of Rs 1100 crore provided for 2005–06,an amount of Rs 1031.067 crore was released to theStates. The total amount of funds released for RGGVYin 2005–06 was Rs 1616.24 crore which includes loansprovided by Rural Electrification Corporation Ltd(REC) to meet the capital cost over and above the sub-sidy amount released for the scheme. The MoP hadalso reported that a total of 34003 households (includ-ing 16815 BPL households) were provided electricityaccess. The implementation of RGGVY in 2005–06 wasmainly in the States of Bihar, Karnataka, Rajasthan,Uttar Pradesh, Uttarakhand, and West Bengal.However, the achievement of villages electrified inaccordance with the revised definition of village elec-trification (requiring a mandatory coverage of at least10% of the households to be electrified in a villagedeclared as electrified) is yet to be verified and reportedby the MoP.
10.83 The MoP set a target to electrify 40000 un-electrified villages under RGGVY in 2006–07.An amount of Rs 3000 crore was provided in thebudget of the MoP to meet the subsidy requirementsof RGGVY during the year. As on 31 March 2007,the MoP had reported a cumulative achievement ofelectrification of 50402 villages during 2005–06and 2006–07, which includes 11177 electrifiedvillages where intensive electrification had been car-ried out. In other words, the number of un-electrifiedvillages electrified during 2006–07 is limited to28706 only, that is 72.64% of the set target of 40000villages. The intensification works had been carriedout in 11177 villages. In respect of electricity accessprovided to households, the cumulative achievementwas 731527 households (including 672588 BPLhouseholds). During 2006–07, a total of 697524households (including 655773 BPL households)were provided with electricity access. The totalfunds released for RGGVY during the Tenth Plan wereRs 5475.15 crore which includes 10% of the loancomponent over and above the Central subsidy pro-vided at 90%.
RGGVY IN THE ELEVENTH PLAN10.84 An amount of Rs 3983 crore has been providedin the MoP budget for 2007–08 to meet capital subsidyunder RGGVY. The MoP has set a target to electrify40000 un-electrified villages during 2007–08. Mean-while RGGVY for the Eleventh Plan has been approvedby the Cabinet at the cost of Rs 28000 crore. A GoMhas been appointed to look into enhancing the effec-tiveness of the scheme implementation.
10.85 The Rural Electrification component under theBharat Nirman Programme envisages electrificationof all 125000 un-electrified villages and 2.3 crorehouseholds (out of total 7.8 crore un-electrified house-holds in the country) by 2009. Thus the Rural Electri-fication component under Bharat Nirman Programmeis the sub-set of RGGVY. The time frame for these twoprogrammes coincides.
R&D IN POWER SECTOR10.86 With the twin cries of depletion of energyresources and environmental pollution, it has becomemore crucial to develop efficient and clean powerplants and their delivery system. These plants shouldbe capable of effective utilization of resources suchas coal, NG, and other sources of energy. Thus, inorder to meet India-centric requirements, varioussectors related to the field of energy have been identi-fied for segregating different research avenues. Thedepletion of fuel resources has resulted into the needof exploring renewable power generation. Similarly,the application of distributed power generationmay be useful for electrification of remotely locatedun-electrified villages. Apart from this, application ofnew technologies in the field of generation, transmis-sion, and distribution also needs to be given utmostemphasis.
Policy IssuesThe following are the policy issues:
• Technology advancements and R&D have so farnot been properly addressed. Major organizationssuch as NTPC, NHPC, Power Grid Corporationof India Ltd (POWERGRID) on the generationside and Bharat Heavy Electricals Ltd (BHEL),Asea Brown Boveri Ltd (ABB), and Siemens on the

Energy 361
manufacturing side must enhance substantiallytheir budget allocations for R&D. The utilitiesshould aim at least about 1% of their profit to beutilized for R&D activities and the manufacturingorganizations should consider 3%–4% to be pro-vided for technology development.
• Ultra Super Critical boiler technology, IGCCtechnology, and oxy-fuel technology are wellresearched abroad but have to be developed forIndian coal. NTPC, the major Indian CentralSector utility should have its R&D centre strength-ened to expedite the work started during theTenth Plan on IGCC. This project may be giventop priority.
• There is a need to work with specialized S&T labo-ratories under CSIR and other space and nuclearestablishments to develop material technology foradvanced boilers, fuel cells, solar power, battery,and super conducting material application in powersector.
• The projects of national interest have to be takenupon collaborative research route. In future capitalfund support for R&D should be reduced and utili-ties and industries should collaborate to fund R&Dprojects.
• R&D import should be exempted from custom dutyto encourage indigenous R&D.
• A High Power Committee in R&D should monitorR&D projects and regulate funds. This will avoidduplication and ensure competitive R&D.
Human Resource Development and CapacityBuilding10.87 Human resource development and capacitybuilding in the present power scenario demands a verycomprehensive and pragmatic approach to attract,utilize, develop, and conserve valuable human re-sources. Training, re-training, and career prospects aresome of the important elements of human resourcedevelopment. The reforms in the power sector haveled to change in the role of senior engineers from apurely government-controlled technical managementto business management in a corporatized framework.
10.88 Technically trained manpower comprisingskilled engineers, supervisors, artisans, and managersis required in every sphere of the power supply
industry. Due to the introduction of more sophisticatedtechnology and automation, the Man/MW ratio isdeclining over the years. The overall Man/MW ratio inpower sector which was 9.42 at the end of the Ninth Planis expected to go down to 7.00 at the end of the TenthPlan and it is expected to be 5.82 at the end of theEleventh Plan. This indicates the increasing importanceof each individual, the man behind the machine.Therefore, the human resource development/trainingneeds of technical, non-technical, and supporting staffshould be given importance keeping in view theNational Training Policy for the power sector.
10.89 It is estimated that during the Eleventh Plan, theavailability of infrastructure for training is about 0.77lakh man-months per year against the requirement of3.40 lakh man-months per year. This shows that thereis a deficit of about 77%. In spite of such a situation oflack of availability of required infrastructure, quiteoften a number of training institutes remain under-utilized. Therefore, there is need to network varioustraining and academic institutions such as NationalPower Training Institute, Indian Institute of Manage-ment (IIMs), Administrative Staff College of Indiaand other reputed institutions for providing trainingto power sector personnel.
LEGISLATIVE AND POLICY ISSUES10.90 The Electricity Act 2003 has put in place aliberal and progressive framework for the developmentof electricity sector in the country. Its main objectivesare promoting competition, protecting interest ofconsumers, supply of electricity to all areas, rational-ization of electricity tariff, and ensuring transparentpolicies regarding subsidies.
10.91 The National Electricity Policy and the TariffPolicy have been notified under the provisions of theAct. The National Electricity Policy aims at providingaccess to electricity to all in the next five years by over-coming energy and peaking shortages and havingadequate spinning reserves by the year 2012 for fullymeeting the demand and supply of reliable and qual-ity power of specific standards in an efficient mannerand at reasonable rates. The Tariff Policy aims atensuring financial viability of the sector and promot-ing transparency, consistency, and predictability in

362 Eleventh Five Year Plan
regulatory approaches. It also aims at promotingcompetition and efficiency in operation and meetingquality of supply. Further, the Integrated Energy Policyaimed at promoting overall development of the sectorhas been announced. The Electricity Tariff Policy basedbidding is mandatory for all plants from January 2006excepting for public sector plants which are requiredto do so by 2011.
10.92 The legal provisions of the Electricity Act 2003,National Electricity Policy, Tariff Policy, and the Inte-grated Energy Policy provide an appropriate legisla-tive and policy framework for the development ofthe power sector. The provisions of these policiesmust be implemented within the stipulated time inorder to make power available at affordable cost toall by 2012. The major issues to be addressed in thisregard during the Eleventh Plan are as follows.
Issues Related to Capacity BuildingThe issues related to capacity building are the follow-ing:
• There is a need to streamline and standardize theprocedure to shorten the time cycle for obtainingenvironmental/forest clearance for power projects.
• The captive coal blocks development should be donein advance to match with commissioning scheduleof power projects.
• The number of agencies having authorization toundertake exploration of coal blocks also needs tobe increased.
• State governments should take suitable policy mea-sures to make captive generation more attractive.
• To encourage R&M of old power plants, CERCshould set up benchmarks for capital expenditureon R&M.
Issues Related to Promotion of Open Accessand TradingThe following are the issues related to promotion ofopen access and trading:
• There is a requirement of having an enabling policyframework for merchant power plants which couldbe in the size of up to 1000 MW so that adequatepower is available for open access.
• To provide transmission corridors for merchantpower plants, adequate redundancy should be builtat the stage of transmission planning.
• A rational transmission tariff framework is essen-tial for facilitating optimum network use, promot-ing power trade, and facilitating open access.
Issues Related to Control Cost of Bulk PowerThe issues related to control cost of bulk power arethe following:
• Coal blocks should be offered on the basis of com-petitive tariff-based bidding as part of the integratedcoal mine cum power project to reduce the fuel costas major part of the cost of bulk power is fuel cost.
• The price of domestic natural gas and its allocationshould be independently regulated on a cost plusbasis including reasonable return till the timedomestic supply exceeds demand by fertilizer andstranded power plants after which it should bemarket determined. An exception needs to be madefor hydro plants that involve significant geologicaluncertainties.
• Various taxes and initiatives on generation, trans-mission, and distribution projects should be iden-tical to remove distortions.
• Taxes on fuels should not distort economic fuelchoices.
Issues Related to Improvement inDistribution SegmentThe issues related to improvement in distribution seg-ment are as follows:
• An National Electricity Fund be set up and support-ive measures taken to bring major improvement inthe distribution system.
• There is a need to restructure the APDRP to makeit sustainable for better results.
• To reduce distribution losses and improve qualityof supply to the consumers. The larger investmentswould be required for upgradation of distributionnetworks and a special drive would be necessaryfor identifying high loss areas and controllingcommercial losses in such areas.
• AT&C loss reduction of 3% every year in next fiveyears should be targeted by all States.
Energy 363
• Setting up of peaking power stations should be en-couraged by time of day tariff for both producersand consumers to overcome peaking shortagesas the additional power cost of supply from such astation could then be passed on to the consumerswho opt for uninterrupted/reliable supply.
PLAN OUTLAYS10.93 A public sector tentative outlay for the EleventhPlan is Rs 554766 crore at constant price. This consistsof Rs 343387 crore for the Central sector and Rs 211379crore for the State sector. The proposed outlay forCentral sector includes Rs 313722 crore IEBR require-ment of PSUs (Rs 278781 crore for PSUs under theMoP, Rs 12218 crore for Power projects of NeyveliLignite Corporation (NLC), and Rs 22723 crore forpower projects of Atomic Energy). It also includesRs 29665 crore budgetary support (Rs 26924 crore forprogrammes of the MoP and Rs 2741 crore for powerrelated programmes of DAE). The State sector invest-ments include borrowing amount of Rs 25000 crorefor the APDRP scheme initially as loan to the SPUsby Central PSUs of the MoP. In addition, investmentwould have to be made to meet the gap, particularlyin the T&D systems for which a group of ministershas been set up.
PETROLEUM AND NATURAL GAS SECTOR
ISSUES AND CHALLENGES10.94 Currently, India’s per capita consumption ofpetroleum products is about one-fifth of world’s aver-age per capita consumption. The share of hydrocarbonsin the commercial energy is about 45% out of whichthe share of oil is 36% and that of natural gas is around9%. In India, the indigenous production of crude oilhas not been increasing in tandem with the consump-tion/demand of petroleum products. Considering theglobal trend of shift in energy mix from oil to gas, theshare of gas in consumption pattern is also likely toincrease gradually. India’s current import of crude oilis more than 70% of its total requirements and the shareis expected to increase in the near future. The impactof high oil prices in the international market and stag-nant domestic oil supply has led to accelerated effortson domestic exploration, venturing into overseasequity oil and gas and LNG imports as measures for
ensuring energy security. The hydrocarbon industry hasbeen passing through very turbulent and challengingphases for the last few years.
10.95 The challenges before the country are:
• Maximizing supply of crude oil and gas at the leastpossible cost as part of energy security by getting asmuch as possible from known reserves, encourag-ing exploration for new finds, and getting equityoil abroad.
• Developing suitable gas market through explora-tion for finding new gas fields, rapid developmentof existing fields, creating a pipeline network fordistribution and competitiveness.
• Creating conditions for competitive markets ofpetroleum products and regulating it to ensurethat fair competition protects interests of all stake-holders.
• Rationalizing subsidies for kerosene and domesticLPG whose burden has increased dramatically.Effective delivery and targeting of subsidies are criti-cal to reduce the burden.
• Ensuring large investment for creating marketingand associated infrastructure such as ports, storage,pipelines, etc.
10.96 Various policies and programmes have beenpursued in the past for the petroleum and natural gassector. A brief review of these is given below.
REVIEW OF THE TENTH PLAN10.97 A brief review of the thrust areas identifiedduring the Tenth Plan is given below.
Oil Security• Under six rounds of NELP, 162 blocks have been
awarded. A total of 37 discoveries have been madeso far and development plans for their exploitationare under progress. In addition, 26 blocks havebeen awarded for exploitation of CBM and 6 TCF(trillion cubic feet) of gas reserves have been estab-lished so far.
• A number of Improved Oil Recovery (IOR) andEnhanced Oil Recovery (EOR) schemes wereimplemented to enhance the indigenous produc-tion of crude oil.
364 Eleventh Five Year Plan
• Oil and gas PSUs were encouraged to pursue equityoil and gas opportunities overseas. OVL (ONGCVidesh Ltd), OIL, IOC (Indian Oil Corporation),and GAIL are actively involved in acquiring over-seas exploration and production assets. Against theacquisition target of 10.14 million tonnes of oil andoil equivalent of gas (O&OEG) during the TenthPlan period, OVL achievement was 22.24 milliontonnes of O&OEG from its overseas activities.
• About 5 million tonnes strategic crude oil storageis under construction at three locations.
• Biofuels Policy initiatives for blending of petrol withethanol and biodiesel with diesel were taken up.
Infrastructure Development• Refining capacity at the beginning of the Tenth Plan
was 118.37 million tonnes per annum whichincreased to 148.97 million tonnes per annum inthe terminal year of the Tenth Plan.
• Private sector was allowed to market transportationfuels, namely, motor spirit, high-speed diesel, andATF. However, the desired competition could notbe achieved due to unprecedented increase in crudeoil prices in the international market which ledto the government intervention for moderatingthe prices of petroleum products.
Efficiency Improvement• A number of energy efficiency projects were imple-
mented to reduce energy consumption in variousrefineries.
• Petroleum Conservation and Research Associationand other organizations have taken up a numberof programmes on conservation of petroleumproducts in transport, industry, agriculture, andhousehold sectors. However, the savings of petro-leum products due to conservation and efficiencyimprovement measures have yet to be quantified.
Environment and Quality Improvement• Road map was prepared for achieving product qual-
ity norms based on the Auto Fuel Policy Report.Diesel Hydro Desulphurization projects were imple-mented in the refineries.
• Introduction of Bharat Stage II petrol through-out the country was achieved by 1 April 2005.Introduction of Bharat Stage II diesel in a phased
manner was completed in various States. EURO IIIpetrol and diesel were introduced in 11 majorcities.
Reforms• Petroleum and Natural Gas Regulatory Board Bill
was passed and the Board has now been constituted.• Dismantling of administered price mechanism
(APM) regime was initiated w.e.f. 1 April 2002.However, the envisaged competition in the market-ing of petroleum products could not be achieved.The GoI currently exercises control by declaringprice caps. As a practical matter, full competition atrefinery gate and retail level within the declared pricecaps should be allowed. Such competition will leadto lower prices and, over a period, lead to limiting/eliminating the government support on automotivefuels. If such price caps entail any compensation toNational Oil Companies (NOCs) through pricingof crude oil or otherwise then such benefit shouldbe made available evenly to both public and privatesector players. The ultimate objective should be toremove government intervention in pricing of allpetroleum products and provide targeted subsidiesdirectly to the intended beneficiaries. Such subsidiesshould be funded through the National Budget. Fullcompetition at the refinery gate and retail levelwould lead to trade parity prices.
• The phasing out of subsidies on domestic LPG andPDS kerosene envisaged during the Tenth Plan wasnot achieved.
10.98 The physical and financial performances of thepetroleum and natural gas are given in Tables 10.17and 10.18.
Exploration and Development10.99 Under NELP, so far 162 exploration blocks havebeen awarded, covering an area of less than 40%of the Indian sedimentary basins. Out of the above162 blocks, 115 blocks were awarded during theTenth Plan.
10.100 Under the CBM policy, contracts with PSUs/private companies for 23 blocks in three rounds ofbidding were signed. In addition, three blocks—twoblocks to ONGC–CIL consortium and one block to

Energy 365
Great Eastern Energy Corporation Ltd—were awardedon nomination basis.
Financial Performance10.101 An outlay of Rs 96041.19 crore was approvedfor the Tenth Plan for oil and gas PSUs against whichthe actual expenditure was Rs 108002.65 crore at cur-rent price. At constant 2006–07 price the expenditurewas 98.25% of the approved outlay.
THRUST AREAS IN THE ELEVENTH PLAN10.102 The policy issues that need to be addressed inthe petroleum and natural gas sector relate to oil andgas security, pricing of petroleum products, pricing ofdomestically produced natural gas and its allocationto the power and fertilizer industry, ensuring compe-tition and open access in the pipeline transportationand distribution grid, and conservation of petroleumproducts and natural gas.
OIL AND GAS SECURITY
Enhanced Exploration and Development10.103 The Eleventh Plan envisages bringing moreand more acreage under exploration especially thosein the frontier areas/basins, adoption of state-of-the-art Exploration and Production (E&P) technology,faster development of discovered reserves, develop-ment of marginal fields, and continuation of IOR/EORschemes. These efforts would lead to a projected totalcrude oil production of 206.76 million tonnes againstthe actual production of 166.56 million tonnes dur-ing the Tenth Plan. Similarly, the projected gas pro-duction will be 255.76 bcm against the Tenth Planproduction of 159.06 bcm. In addition, CBM blockswould be awarded during the Eleventh Plan in MadhyaPradesh, Jharkhand, Gujarat, Tamil Nadu, andArunachal Pradesh. During the Eleventh Plan, theCBM production is projected to be around 3.78 bcm.
TABLE 10.17Physical Programmes—Petroleum and Natural Gas
Programme Ninth Tenth 2002–03 2003–04 2004–05 2005–06 2006–07 Achieve- % of
Plan Plan (Prov.) ment Target
Actual Target Actual Actual Actual Actual Actual 2002–07
Demand/consumption(million tonnes) 100.43# 120.4# 104.2 107.75 111.63 111.92 119.85 119.85# 99.5Reserve accretion (Mtoe) 795.13 785–914 329.47 348.32 337.15 222.95 387.53 1652.92 178–207Crude oil production(million tonnes) 162.99 169.38 33.04 33.37 33.98 32.19 33.98 166.56 98.3Natural gas production (bcm) 140.92 177.48 31.39 31.96 31.76 32.20 31.55 158.86 89.5
Net Import
Crude oil – – 81.99 90.43 95.86 99.41 111.50 – –Petroleum products – – –13.06 –6.72 –9.38 –9.38 –15.77 – –
Refining capacity (million tonnes)as on 1 April 118.37 138–155# 118.37 127.37 127.37 132.47 148.97 148.97# –
Note: # Figures for the terminal year of the Tenth Plan.Source: Ministry of Petroleum and Natural Gas.
TABLE 10.18Outlays/Expenditure—Petroleum and Natural Gas
(Rs Crore)
Tenth Plan 2002–03 2003–04 2004–05 2005–06 2006–07 Likely %Approved Outlay (Actual) (Actual) (Actual) (Actual) (Actual) Achievement Utilization
(Prov.) 2002–07
96041.19 15805.67 16625.99 20981.19 251414.57 29175.23 108002.65 112.45(119409.99) (18915.35) (19169.83) (23178.51) (26879.50) (29175.23) (117318.43) (98.25)
Note: Figures in the bracket are at 2006–07 price.Source: Planning Commission

366 Eleventh Five Year Plan
Acquisition of Equity Oil and Gas Abroad10.104 Considering the continuing gap between thedemand and indigenous production of crude oil andnatural gas and low crude oil reserves replenishment,NOCs and private companies are being encouragedto venture abroad. The various strategic options inthis regard are: focus on ventures with producingproperty in the short term; purchase of equityshare of companies as a part of reserves portfoliomanagement; focus on exploration acreages in shortto medium term, and promoting upstream sectorservices.
Strategic Crude Oil Storage10.105 The government has taken in principle deci-sion to construct 15 million tonnes of strategic stor-age in various phases. In the first phase, a project forcreating a strategic storage of 5.0 million tonnes forcrude oil is under implementation at three locations,viz., 1 million tonne at Visakhapatnam, 1.5 milliontonnes at Mangalore, and 2.5 million tonnes at Padur,a site near Mangalore. This storage will be over andabove the existing storage capacity for crude oil andpetroleum products at the various refineries andwould act as emergency response in case of short-termsupply disruption. The project is anticipated to becompleted during the Eleventh Plan.
DEVELOPMENT OF ALTERNATE FUELS
Coal Bed Methane10.106 A total of 26 CBM blocks have already beenoffered in the three rounds of bidding. These fields areunder development stage and production of CBM isexpected in the Eleventh Plan. The bidding roundswill be continued in the Eleventh Plan and it is plannedto offer CBM blocks in Assam, Arunachal Pradesh,Orissa, Jharkhand, Madhya Pradesh, Gujarat, andTamil Nadu.
Gas Hydrates10.107 National Gas Hydrates Programme was startedin 1997. Till now, a large number of seismic surveyshave been conducted. K–G basin, Mahanadi basin, andKonkan and Kerala basins have been identified as po-tential areas. The production of gas from the gas hy-drates is one of the biggest challenges facing the energy
sector and technology is still to be established in thisarea. Pilot test production is planned to be carried outin India by 2009–10.
Underground Coal Gasification (UCG)10.108 ONGC and GAIL have been exploring thepossibilities of exploiting the gas through UCG pro-cess. The techno-economic feasibility and commercialexploitation is proposed to be carried out during theEleventh Plan. ONGC has planned to produce 2.7MMSCMD of gas through UCG process and envis-ages producing 2.99 bcm of UCG gas during the Elev-enth Plan.
Coal to Liquid10.109 OIL has carried out pre-feasibility studies onCatalytic Two-Stage Liquefaction Technology andDirect Liquefaction Technologies in order to selectthe best suitable technology for the North East coalfor liquification. The feasibility study on the selectedtechnology will be carried out during the EleventhPlan. A joint task force between OIL and CILhas been constructed by MOP&NG to confirmavailability and assured supply of coal in Assam,Arunachal Pradesh, and Meghalaya for a commercialplant.
Biofuels10.110 After stabilization of 5% ethanol blendingpetrol sales, the content of ethanol in petrol wouldbe considered for increasing up to 10% by the middleof the Eleventh Plan, subject to ethanol availabilityand commercial viability of blending. Depending uponthe bio-diesel production and availability, the entirecountry may be progressively covered with sale of 5%bio-diesel blended diesel by the end of the EleventhPlan.
Oil Shale10.111 In India, shale formation is exposed to thesurface in the region of Belt of Schuppen falling inAssam, Arunachal Pradesh, and Nagaland. The oil shalereserves are estimated at about 100 billion barrels.However, the production of shale oil requires largeamount of energy and water. Environment and mon-etary cost have so far made production of oil from oilshale uneconomical.

Energy 367
REFORMS
Petroleum Product Pricing10.112 With the dismantling of APM for petroleumproducts w.e.f. 1 April 2002, it was envisaged that theprice of petroleum products would be moved fromAPM to market-determined pricing mechanism.An import parity pricing mechanism was followedby the oil industry which was subsequently modifiedto a trade parity pricing as an approximation to com-petitive market prices. Full price competition at therefinery gate and retail level needs to be adopted toenhance competition in the sector.
Phasing Out Subsidies on PDS Kerosene andDomestic LPG10.113 For kerosene, it is proposed to provide directsubsidies to the consumers, particularly those belowthe poverty line. A system of smart card for supply ofkerosene to BPL families would be introduced. Withthe smart card, kerosene may be bought from any shopat market price. In case of domestic cooking gas also,it is proposed to phase out subsidy gradually with theintroduction of smart cards for domestic LPG whichwould help in preventing diversion of domestic LPGto the commercial sector.
Unified State Taxes and Removal of TaxAnomalies10.114 There is a need to amalgamate the individualState markets into one nation-wide market with uni-fied State taxes. Therefore, there is need to removeState tax anomaly, provide level playing field todomestic production vis-à-vis direct import, andintroduce a uniform VAT which provides full set-offfor local levies such as octroi and entry-tax at theState level.
ENVIRONMENTAL AND QUALITY MANAGEMENT10.115 Efforts would be made to improve the HealthSafety and Environment (HSE) management so asto provide occupationally healthier work force,reduced accident rates, cleaner and greener productwith reduced emissions and effluents. The followingmeasures would be implemented in the explorationand production sector during the Eleventh Planperiod:
• Establishing environment management system forall oil and gas field installations and drilling rigsbased on international standards to ensure improve-ments towards reducing discharges and emissionsto internationally acceptable levels.
• Eco-rating of major installations and compulsoryenvironmental audits.
• Pro-active measures to prevent marine pollutionand to effectively combat oil spills.
• Benchmarking at par with international oil majorswith respect to environmental practices.
10.116 On the basis of the assessment of the impactof Bharat Stage-II norms in the entire country andEURO III equivalent norms in identified cities, EUROIV equivalent norms in identified cities and EURO IIIequivalent norms in the entire country would beintroduced w.e.f. 1 April 2010.
INFRASTRUCTURE DEVELOPMENT
Marketing Infrastructure10.117 In view of the proposed increase in refiningcapacity during the Eleventh Plan, a large investmentwould be required for creating marketing and associ-ated infrastructure such as ports, storage, pipelines, andterminals.
Manpower Planning10.118 The rapid development of the oil and gassector in the last few years has led to acute shortage ofskilled manpower. Therefore, high degree of collabo-ration between the industry and academia, expandingtraining programmes to address emerging skill short-ages, would be a major thrust area for planning sus-tained availability of knowledge workers in thepetroleum and natural gas sector.
Servicing of E&P Activities in India10.119 E&P service providers play a key role in en-abling success for E&P operators. The acceleratedgrowth of E&P activities has led to multifold growthin demand of technology and oilfield servicesworldwide. Therefore, availability of services in Indiais becoming constrained and expensive. Hence,there is a need to facilitate the growth of E&P serviceindustry.

368 Eleventh Five Year Plan
PHYSICAL PROGRAMMES
DEMAND/CONSUMPTION OF PETROLEUM PRODUCTS10.120 The demand of petroleum products in the ter-minal year of the Eleventh Plan (2011–12) is projectedat 131.77 million tonnes to 141.79 million tonnesagainst the anticipated consumption of 119.85 milliontonnes in 2006–07, indicating a CAGR of 1.91% to3.42% during the Eleventh Plan. The actual growthmay be lower if the prevailing high oil prices continueduring the Eleventh Plan resulting in policies encour-aging energy efficiencies.
DEMAND OF NATURAL GAS10.121 About 70% of the natural gas is currentlybeing consumed in the fertilizer and power sectors.As per the Working Group on Petroleum and NaturalGas, the demand for natural gas in the terminalyear of the Eleventh Plan is expected to increase upto 279.43 MMSCMD out of which 126.57 MMSCMDhas been assumed for power sector and 76.26MMSCMD for fertilizer sector. However, as per theMoP projections, the demand of natural gas forpower sector would be only 89 MMSCMD. The lowerprojected demand of natural gas by the MoP istaking into account the prevailing market price and
availability of APM gas. Taking into account thelower demand for natural gas by the MoP, the totaldemand of natural gas in the terminal year of the Planwould be 241.86 MMSCMD. However, materializationof this demand would depend upon the price ofnatural gas.
HYDROCARBON RESERVE ACCRETION10.122 The anticipated reserve accretion duringthe Tenth Plan was 1652.92 million tonnes, excludingPvt/Joint Venture Company (JVC) share, against thetarget of 785–914 million tonnes. The projectedindicative hydrocarbon in-place reserves during theEleventh Plan are of 2129.44 million tonnes.
CRUDE OIL AND NATURAL GAS PRODUCTION10.123 The targets for production of crude oil andnatural gas are given Tables 10.19 and 10.20, respec-tively.
10.124 It may be seen from above that against theprojected demand of 241.86 MMSCMD in the termi-nal year of the Eleventh Plan, the production willbe only 173.23 MMSCMD. The additional require-ment would have to be met through the import ofnatural gas.
TABLE 10.19Crude Oil Production
(Million Tonnes)
Organization 2007–08 2008–09 2009–10 2010–11 2011–12 Total
ONGC 27.16 28.00 29.00 28.53 27.37 140.06OIL 3.50 3.55 3.73 3.91 4.30 18.99Pvt/JVC 10.57 10.78 9.76 8.75 7.85 47.71Total 41.23 42.33 42.49 41.19 39.51 206.76
Source: Working Group Report on Petroleum and Natural Gas.
TABLE 10.20Natural Gas Production
(bcm)
Organization 2007–08 2008–09 2009–10 2010–11 2011–12 Total
ONGC 22.10 22.53 22.77 22.99 22.00 112.39OIL 3.13 3.21 3.25 3.28 3.56 16.43Pvt/JVC 8.55 22.55 29.41 28.77 37.61 126.45Total 33.78 48.29 55.43 55.03 63.23 255.76Total (MMSCMD) 92.20 132.30 151.86 150.79 173.23 700.38
Source: Working Group Report on Petroleum and Natural Gas.
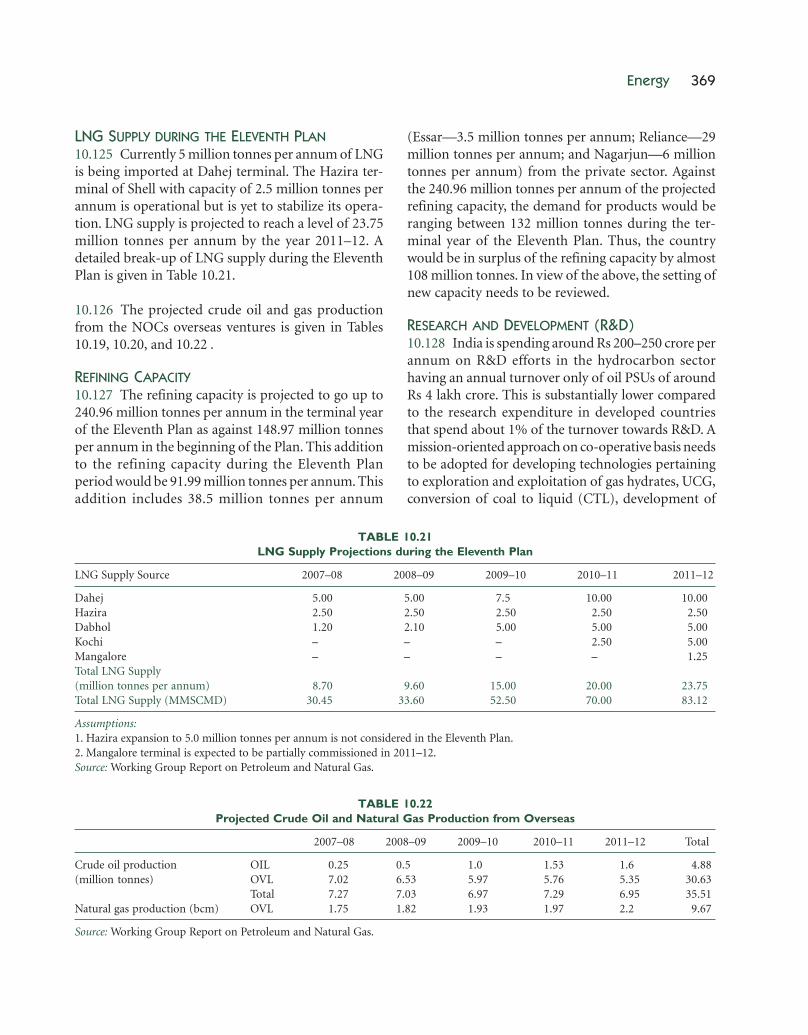
Energy 369
LNG SUPPLY DURING THE ELEVENTH PLAN10.125 Currently 5 million tonnes per annum of LNGis being imported at Dahej terminal. The Hazira ter-minal of Shell with capacity of 2.5 million tonnes perannum is operational but is yet to stabilize its opera-tion. LNG supply is projected to reach a level of 23.75million tonnes per annum by the year 2011–12. Adetailed break-up of LNG supply during the EleventhPlan is given in Table 10.21.
10.126 The projected crude oil and gas productionfrom the NOCs overseas ventures is given in Tables10.19, 10.20, and 10.22 .
REFINING CAPACITY10.127 The refining capacity is projected to go up to240.96 million tonnes per annum in the terminal yearof the Eleventh Plan as against 148.97 million tonnesper annum in the beginning of the Plan. This additionto the refining capacity during the Eleventh Planperiod would be 91.99 million tonnes per annum. Thisaddition includes 38.5 million tonnes per annum
(Essar—3.5 million tonnes per annum; Reliance—29million tonnes per annum; and Nagarjun—6 milliontonnes per annum) from the private sector. Againstthe 240.96 million tonnes per annum of the projectedrefining capacity, the demand for products would beranging between 132 million tonnes during the ter-minal year of the Eleventh Plan. Thus, the countrywould be in surplus of the refining capacity by almost108 million tonnes. In view of the above, the setting ofnew capacity needs to be reviewed.
RESEARCH AND DEVELOPMENT (R&D)10.128 India is spending around Rs 200–250 crore perannum on R&D efforts in the hydrocarbon sectorhaving an annual turnover only of oil PSUs of aroundRs 4 lakh crore. This is substantially lower comparedto the research expenditure in developed countriesthat spend about 1% of the turnover towards R&D. Amission-oriented approach on co-operative basis needsto be adopted for developing technologies pertainingto exploration and exploitation of gas hydrates, UCG,conversion of coal to liquid (CTL), development of
TABLE 10.21LNG Supply Projections during the Eleventh Plan
LNG Supply Source 2007–08 2008–09 2009–10 2010–11 2011–12
Dahej 5.00 5.00 7.5 10.00 10.00Hazira 2.50 2.50 2.50 2.50 2.50Dabhol 1.20 2.10 5.00 5.00 5.00Kochi – – – 2.50 5.00Mangalore – – – – 1.25Total LNG Supply(million tonnes per annum) 8.70 9.60 15.00 20.00 23.75Total LNG Supply (MMSCMD) 30.45 33.60 52.50 70.00 83.12
Assumptions:1. Hazira expansion to 5.0 million tonnes per annum is not considered in the Eleventh Plan.2. Mangalore terminal is expected to be partially commissioned in 2011–12.Source: Working Group Report on Petroleum and Natural Gas.
TABLE 10.22Projected Crude Oil and Natural Gas Production from Overseas
2007–08 2008–09 2009–10 2010–11 2011–12 Total
Crude oil production OIL 0.25 0.5 1.0 1.53 1.6 4.88(million tonnes) OVL 7.02 6.53 5.97 5.76 5.35 30.63
Total 7.27 7.03 6.97 7.29 6.95 35.51Natural gas production (bcm) OVL 1.75 1.82 1.93 1.97 2.2 9.67
Source: Working Group Report on Petroleum and Natural Gas.

370 Eleventh Five Year Plan
shale oil, biofuels and hydrogen, etc. Presently, mostof the funding comes from the government or thepublic sector. Under the present scenario the privatesector is playing a significant role in the growth ofthe petroleum industry. Therefore, funding of R&Dprogrammes from the private sector should also beencouraged.
PLAN OUTLAYS10.129 A public sector tentative outlay for the Elev-enth Plan is Rs 213514.59 crore at current price.This consists of Rs 150932.49 crore for exploration andproduction and Rs 62582.10 crore for refining andmarketing sector. The PSU-wise outlays are given inTable 10.23.
10.130 In addition, during the Eleventh Plan, thegovernment has decided to set up Rajiv Gandhi Insti-tute of Petroleum Technology, an institute to cater tothe education and training requirements of all segmentsof petroleum and natural gas industry. The total esti-mated cost of the institute is estimated to be Rs 695.58crore, out of which Rs 285 crore is proposed to be metthrough the budgetary support.
COAL SECTOR
ISSUES AND CHALLENGES10.131 Coal provides 25.1% of global primary energyneeds against 34.3% from oil, 20.9% from gas, 6.5%from nuclear, 2.2% from hydro, and 11% from renew-able. The contribution of coal in the world’s electric-ity generation is around 40%. Coal accounts for over50% of India’s commercial energy consumption andabout 78% of domestic coal production is dedicatedto power generation. The global hard coal consump-tion in 2005 was 4990 million tonnes. China is the larg-est producer of coal (2226 million tonnes) followedby the US (951 million tonnes) and India (398 milliontonnes). The major coal exporters are Australia (231million tonnes), Indonesia (108 million tonnes),Russia (76 million tonnes), South Africa (73 milliontonnes), and China (72 million tonnes). The major coalimporting countries are Japan (178 million tonnes),Republic of Korea (77 million tonnes), Chinese Taipei(61 million tonnes), UK (44 million tonnes), andGermany (38 million tonnes).
10.132 The growth in demand of coal in the EleventhPlan is pegged at more than 9% per annum for en-abling the power sector to attain the anticipatedgrowth. The coal producing companies may not be ableto jump from the present growth rate of less than 6%to more than 9% within a year, but there is need foraligning strategies so that the projected coal produc-tion from coal PSUs as well as captive coal mines ma-terializes by the end of the Eleventh Plan. Under theCoal Mines (Nationalization) Act 1973, coal can bemined by public sector companies as well as designatedcaptive users, which are steel, cement, and power atpresent, for their own use. An increase in the numberof producers can help reach the targeted production.At the same time we will need to import more coal,which needs to be facilitated. Further, it is necessaryto take required steps for addressing the need formatching the growth of infrastructure with the pro-posed growth in coal production. The desired expan-sion of the rail network and rolling stock for movingthe projected quantities of coal from mines to loadcentres would need large investments. Coal movementshould also be economical; therefore the railway freightrate for movement of coal needs to be rationalized.
TABLE 10.23Public Sector Outlays for the Eleventh Plan
(Rs Crore)
PSUs Eleventh Plan Outlay
A. Exploration and ProductionONGC-OVL 45332.87ONGC 75983.77OIL 13439.02GAIL 10326.83IOC 2982.00HPCL 2000.00BPCL 868.00Subtotal (A) 150932.49
B. Refining and MarketingHPCL 8714.00BPCL, incl. KRL 11344.80CPCL 3275.00BRPL 1444.53IOC 28567.75IBP 0.00NRL 593.00MRPL 8643.02Subtotal (B) 62582.10Total petroleum and natural gas sector 213514.59
Source: Ministry of Petroleum and Natural Gas.
Energy 371
A high freight rate increases coal price at a distanceand distorts choice of fuels, reduces competitiveness,and results in mislocation of industries.
10.133 A competitive coal market is required for eco-nomic efficiency. Since for power plants, the major usersof coal, coal cost is a pass through cost, price discoverymechanism is a challenge. We need to streamline theprocess of e-auction of non-coking coal and sell at least20% of the non-coking coal production through thisprocess for effective discovery of market price of coal.
10.134 An independent coal regulator is required tooversee the price discovery mechanism, regulate up-stream allotment, and exploit available coal blocks toyield coal, coal bed methane, mine mouth methane,CTL, and for in situ coal gasification so that India,with the third largest reserves of coal in the world,becomes a long-term player in the highly liquid inter-national market for coal. In order to deliver, coalcompanies must ensure that productivity of men andmachines is at par with international standards. Thecost of coal movement can also be reduced by wash-ing and beneficiating coal as Indian coal has a highash content. A change in the coal pricing system, whereprice of coal is fully variable based on its gross calo-rific value (GCV) rather than the current practiceof grading coal by using wide ranges of useful heatvalues (UHV), is also called for.
10.135 The extractable coal reserves in the country willrun out in about 45 years if domestic coal productioncontinues to grow at 5% per year. However only about45% of the potential coal bearing area has currentlybeen covered by regional exploration and detailed drill-ing. Rapid increase of coal production requires accel-erated exploration, augmentation of drilling capacityand capacity to assess coal reserves, and preparing geo-logical reports.
REVIEW OF THE TENTH PLAN
Coal Demand and Production10.136 Demand for coal in the terminal year of theTenth Plan was projected at 460.50 million tonnescomprising 37.21 million tonnes of coking coal and423.29 million tonnes of non-coking or thermal coal.
Demand from the power sector (utilities) touched297.37 million tonnes. The CAGR of the demand was5.66% against 5.74% envisaged at the time of formu-lation of the Plan and 3% actually achieved duringthe Ninth Plan.
10.137 To meet the surge in the demand of coal, Emer-gency Coal Production Plan of CIL was approved toraise the production by advancing the productionschedule in 12 existing mines/ongoing projects andby taking up four new projects with a likely capitalinvestment of Rs 2085.05 crore. Outsourcing of coaland overburden removal activities in these projectswas proposed. Though the earmarked projects did notyield additional production during the Tenth Plan, theyset the pace of implementation of new projects.
10.138 Production of coal in 2006–07 touched 430.54million tonnes against the target of 430.10 milliontonnes. While there were delays in taking up newprojects during the Tenth Plan, augmentation ofcoal production was made possible by increasing theproduction from existing mines and acceleration inactivities to reduce production build up period ofongoing projects. CAGR of production during theTenth Plan period was 5.6% against 4.46% envisagedat the time of formulation of the Plan and 2.5% actu-ally achieved in the Ninth Plan. Growth in CIL’s pro-duction during the Tenth Plan was 5.28%. The outputof captive mines increased at a higher rate.
Demand Supply Management10.139 It is pointed out that the demand and produc-tion numbers are not weighted for quality of coal anddifferences in coal quality can also impact the demandrealized. Finally, use of washed coal in power genera-tion or the use of Corex technology in the steel sectoris also not well accounted in establishing the demandnumbers. The physical gap of 45 million tonnes be-tween the demand and supply in the terminal year(2006–07) of the Tenth Five Year Plan was met throughimport of 45 million tonnes of coal (coking coal, 22million tonnes; thermal coal, 23 million tonnes) asenvisaged. Though the import of thermal coal by thepower sector helped its planned generation program-me, it resulted in reduced domestic off-take, resultingin additional stock build-up at pit heads.

372 Eleventh Five Year Plan
Lignite Consumption and Production10.140 Demand of lignite in the terminal year (2006–07) of the Tenth Plan was projected as 57.79 milliontonnes (Tamil Nadu, 35.86 million tonnes; Gujarat,16.27 million tonnes; Rajasthan, 5.65 million tonnes)but the materialization was about 30.63 million tonnes(Tamil Nadu, 20.51 million tonnes; Gujarat, 9.65 mil-lion tonnes; Rajasthan, 0.47 million tonnes) showinga CAGR of 4.93%. Linked to 16.36 BU of Gross PowerGeneration, the demand for NLC in 2006–07 wasprojected as 21.50 million tonnes. Consequent uponthe downward revision of Gross Power Generationtarget to 15.71 BU, the demand for lignite was loweredby 1.09 million tonnes and kept at 20.41 million tonnes.NLC produced 19.38 million tonnes of lignite andgenerated 14.85 BU of gross power.
Coal and Lignite Inventories (Reserves)10.141 As on 1 January 2007, the national coal inven-tory stood at 255 billion tonnes, out of which 97.92billion tonnes are in the proved category. The inven-tory of lignite resources stood at 38.27 billion tonnes,as on 1 April 2006, with 4.5 billion tonnes in the provedcategory. Table 10.24 gives accretion of coal reservesover the years.
Central Sector Plan Schemes
PROMOTIONAL EXPLORATION10.142 An outlay of Rs 275.80 crore was providedduring the Tenth Plan for plan scheme of ‘Regional/Promotional Drilling’ for drilling 6 lakh metres, com-prising 3.3 lakh metres for coal covering 43 blocks and2.7 lakh metres for lignite covering 13 blocks; and for
other exploratory services including creation of coal/lignite database and CBM studies. Project-basedapproach was adopted for this plan scheme and 121projects were sanctioned for implementation. Againstthe projection, 6.288 lakh metres (91%) of drillingwas achieved during the Tenth Plan establishing 19.78billion tonnes of coal resource and 17.53 billion tonnesof lignite resource.
DETAILED DRILLING IN NON-CIL BLOCKS10.143 The blocks outside the purview of CIL wereproposed to be explored in detail for reducing the timelag between offering the blocks to potential entrepre-neurs and start of mining operations by them throughthe scheme of ‘Detailed Drilling in Non-CIL Blocks’with budgetary support. The cost of exploration wasto be recovered from the recipients of these blocks. Thisscheme continued from the Ninth Plan and an outlayof Rs 70.66 crore (Rs 57.86 crore for drilling andRs 12.80 crore for other exploratory services) was pro-vided during the Tenth Plan for drilling 2.13 lakh metreto bring 3.65 billion tonnes of resources under theproved category. Revised cost estimate of this PlanScheme was approved in March 2006 where physicaltarget was revised to 2.83 lakh metre of drilling withan outlay of Rs 93.84 crore. Against the projections,drilling of 2.84 lakh metre was achieved during theTenth Plan, establishing 7.06 billion tonnes of coalresource as proved.
SCIENCE AND TECHNOLOGY (R&D)10.144 Despite the thrust laid on coal science and tech-nology (S&T) programme, the continuing schemesince 1975, the progress has not been satisfactory both
Table 10.24Accretion of Coal Reserves over the Years
(In Million Tonnes)
Coal Reserves as on Proved Accretion in Inferred Indicated Total ReserveCategory Proved Category Category Category Reserve Accretion
1 January 2002 87320 – 109377 37417 234114 –1 January 2003 90085 2765 112613 38050 240748 66341 January 2004 91631 1546 116174 37888 245693 49451 January 2005 92960 1329 117090 37797 247847 21541 January 2006 95866 2906 119769 37666 253301 54541 January 2007 97920 2054 118992 38260 255172 1871
Source: Coal Directory of India.
Energy 373
in terms of taking up of new projects and utilizing theoutlays provided to various ongoing projects. The cu-mulative expenditure during the Tenth Plan under thisscheme was Rs 50.94 crore.
ENVIRONMENTAL MEASURES AND SUBSIDENCECONTROL (EMSC)10.145 The Ninth Plan scheme, namely, ‘Rehabilita-tion, Control of Fire, and Subsidence in Jharia andRaniganj Coalfields’ was merged in this Tenth Planscheme. The purpose of the scheme is to improve theenvironmental conditions in old mined out areas, par-ticularly, Jharia and Raniganj coalfields, throughimplementation of a number of projects for mitigat-ing the damages that occurred due to unscientific min-ing carried out prior to nationalization of coal mines.Against an outlay of Rs 163.00 crore provided underthis scheme, the cumulative expenditure in the TenthPlan is Rs 52.57 crore. The progress of implementa-tion has not been satisfactory due to constraints ofland acquisition, agitation/frequent interruption bylocal people, non-finalization of site of rehabilitationby local authorities, some technical problems, etc.
INFORMATION TECHNOLOGY10.146 The government had mandated all the minis-tries to formulate a plan scheme with an outlay of about2% of the total Plan outlay in the field of informationtechnology in order to give a boost to e-governance.Accordingly, the MoC spent Rs 4.21 crore in theTenth Plan for improving infrastructure needed fore-governance.
COAL CONTROLLER ORGANIZATION (CCO)10.147 CCO under Collection of Statistics Act 1953and Rules 1959 undertakes the activity of collectionof coal and lignite related data and publishes ‘coalstatistics’ annually using an outlay of Rs 0.22 crore.The Tenth Plan expenditure under this scheme wasRs 0.93 crore.
CONSERVATION AND SAFETY IN COAL MINES ANDDEVELOPMENT OF TRANSPORT AND INFRASTRUCTUREIN COAL MINES10.148 On the directions of the Ministry of Finance,MoC in the year 2005–06 had proposed two planschemes with an outlay of Rs 117 crore and Rs 135.79
crore, respectively. Activities under these schemes arefunded as reimbursement of a portion of the stowingexcise duty, which is statutorily levied as per the CoalMines (Conservation and Development) Act 1974 anddeposited in the government treasury account. Priorto 2005–06, the expenditure incurred in these schemeswas shown under the non-Plan head. In spite ofthe fact that the Planning Commission insisted ontreating activities under these schemes as non-Planactivities, matter could not be resolved with theMinistry of Finance. A token provision of Rs 0.01 crorein each of these schemes was provided in last twoyears of the Tenth Plan period.
Productivity of Coal and Lignite PSUs
EQUIPMENT PRODUCTIVITY10.149 The Heavy Earth Moving Machinery (HEMM)productivity has improved significantly in theTenth Plan. In Coal India Ltd (CIL), the increase inproductivity of shovels was by 124%, dumpers by15%, drills by 25%, and dozers by 14% over theachievements of the Ninth Plan whereas the produc-tivity of draglines remained constant. In the caseof Singareni Collieries Company Ltd (SCCL), theimprovements in the productivity are to the tune of18% in draglines, 21% in shovels, 50% in dumpers,and 6% in the performance of dozers. System capacityutilization in most of the coal companies is consistentlyindicated as more than 100%. However, the per-centage utilization of machinery (except draglinemachine) in open-cast mines remained below thestandard norms of Central Mine Planning and DesignInstitute.
MANPOWER PRODUCTIVITY10.150 The overall productivity in terms of the out-put per man-shift (OMS) has increased from 2.45tonnes in the beginning of the Tenth Plan to 3.54tonnes in 2006–07 in CIL and from 1.88 tonnes to 2.32tonnes in SCCL. In NLC, the OMS has increased from8.84 tonnes in the beginning of the Plan to 10.16 tonnesin 2006–07. Many activities have been outsourced bydifferent coal companies during the Tenth Plan butits effect on manpower productivity has not beencaptured while assessing manpower productivity ofrespective coal companies.

374 Eleventh Five Year Plan
Coal Movement10.151 The Tenth Plan identified certain critical raillinks in potential coalfields and the railways havetaken up most of these for implementation. It was alsoenvisaged to strengthen the infrastructure such as portcapacity and backward rail linkages for higher coalimports. The movement of raw coal and coal prod-ucts by rail from CIL and SCCL increased from 199.74million tonnes (63.7% of the total coal off-take) in2001–02 to 217.20 million tonnes (53.4% of thetotal coal off-take) in 2006–07. The component ofmerry go round movement has increased from 74.62million tonnes (23.8% of the total coal off-take) inthe beginning of the Tenth Plan to 96.35 million tonnes(23.9% of the total off-take) in the terminal year.The movement of coal by road in the beginning of thePlan was 51.35 million tonnes (16.4% of the total coaloff-take) and has increased to 94.32 million tonnes(22.5% of the total coal off-take) in 2006–07. Coastalshipment (inland) of coal increased from 16.10million tonnes in 2001–02 to 17.47 million tonnesin 2006–07.
Initiatives on Clean Coal Technologies10.152 Higher thermal efficiency and better environ-mental performance are apparent benefits of Circula-tory Fluidized Bed Combustion, Integrated GasCombined Cycle (IGCC), and super-critical boiler.High ash Indian coal and high sulphur lignite have beenfound to be good for these technologies. Initiatives weretaken in the Tenth Plan for improving efficiency ofenergy conversion of Pulverized Coal Combustion(PCC) boilers by giving thrust on adoption of supercritical and ultra super critical technologies.
10.153 Coal India Ltd, SCCL, and NLC entered intoMoU with ONGC for developing UCG technology.ONGC, in turn, tied up with Skochinsky Institute ofTechnology, Moscow for technical assistance. NLC tookup an R&D project for gasification of lignite seamsin Rajasthan but the project remained non-starter astechnical consultant or adviser could not be foundeven after two rounds of global bid. Finally, NLCchose to enter into MoU with ONGC for consultancyin the project. A joint venture between GAIL and CILproposed for surface gasification of coal is underactive consideration.
10.154 Interaction between CIL and OIL has takenplace on the business initiatives of Coal Liquefactionproject by way of creating a ‘Joint Task Force’. Theproject for converting coal from North EasternCoalfields (NEC) to liquid would cost Rs 12600 croreincluding Rs 3500 crore for producing 3.5 milliontonnes of coal.
10.155 A demonstration Coal Bed Methane project isunder implementation with financial support from theGlobal Environment Facility and UNDP. Several CBMblocks have also been awarded to private companiesfor exploration and production during three roundsof bidding. Apart from this, exploration works on twoblocks were awarded to two PSUs on nominationbasis. Commercial production of CBM is expected inthe beginning of the Eleventh Plan.
Safety and Welfare10.156 Implementation of safe practices in alloperations by the coal companies lowered number ofserious and fatal accidents in mines. However, thenumber of casualty was inflated during the Planperiod due to five disasters involving more than 10deaths. The practice of monitoring mine safety throughWorker’s Participation in Safety in associationwith Internal Safety Organization of coal companies,risk assessment techniques, and safety audits wasstrengthened.
10.157 The wages of workmen in the CIL and SCCLwere revised in 2005. In addition to enhancement inthe quantum of fringe benefits and allowances, theminimum wage was increased to Rs 238.63 per day.There were substantial improvements in respect ofwelfare amenities such as housing satisfaction, watersupply, education facilities, health care, etc.
10.158 The coal companies are committed to bear thesocial responsibilities in medical services, education,water supply, housing, co-operatives and banking, ecol-ogy and environment, and community developmentfor their employees. In addition to this, communitydevelopment activities were also undertaken by dif-ferent coal companies of Coal India Ltd. During theTenth Plan, CIL spent an amount of about Rs 85 croreon various community development projects.

Energy 375
Revival of Loss Making Companies10.159 Three subsidiary companies of CIL, namelyEastern Coalfields Limited (ECL), Bharat Coking CoalLimited (BCCL), and Central Coalfields Limited(CCL), were loss making at the terminal year of theNinth Plan period (2001–02). During the Ninth Planperiod, efforts were made with little success to turnthese companies around. Eventually, during the TenthPlan these companies were referred to BIFR for devis-ing strategy/measures for their revival/rehabilitation.One of the companies, CCL managed to come out ofBIFR in the year 2005–06. Increased production andhigher revenue earned by sale of coal through e-auc-tion made it possible for BCCL to show profits for thefirst time since nationalization. CCEA approved theBIFR sanctioned rehabilitation scheme for ECL formaking the net worth of the company positive by2009–10.
Expenditure Pattern10.160 The cumulative expenditure in the Tenth Planin form of investment by PSUs (funded through IEBR)
was Rs 9574.49 crore (at 2001–02 price) against a pro-vision of Rs 30556.48 crore which is 31.33% of the to-tal outlay provided. Investments in CIL, SCCL, andNLC are 44%, 60%, and 33% of the outlay proposedduring the Tenth Plan, respectively (see Table 10.25).Poor performance has been attributed to the late startof projects. Outsourcing of mining activities in manyprojects also brought down the requirement of capitalinvestment as envisaged earlier.
Policy Reforms• Pending the passage of the Coal Mines Nationaliza-
tion (Amendment) Bill 2000, many policy initiativessuch as permitting captive block holders to sell in-cidental coal surpluses during development andoperation of the block to CIL or directly to currentlylinked end users, allowing group-captive mines, etc.were taken to increase the number of players in coalmining by making more coal available for allocationto different private and public companies for cap-tive consumption and the State Governments forcommercial mining. Initiative was taken to amend
TABLE 10.25Company-wise/Scheme-wise Expenditure during the Tenth Plan
(Rs Crore)
Company/Scheme 2002–03 2003–04 2004–05 2005–06 2006–07 Tenth Plan
Actual Actual Actual Actual Actual Original Achieved#
(A) PSUs under MoC (IEBR)CIL 1147.54 1072.82 1055.90 1370.68 1674.10 14310.00 6321.04SCCL 134.27 151.55 244.24 360.85 371.82 2113.00 1262.74NLC 418.55 146.56 194.61 322.99 908.00 14133.48 1990.71Total IEBR 1700.36 1370.94 1494.75 2054.52 2953.92 30556.48 9574.49
(B) Central Sector Plan Schemes (GBS)R&D (S&T) 6.74 9.11 11.32 12.54 4.85 100.00 44.55Regional exploration 16.84 33.57 38.21 41.23 32.32 275.80 162.17Detailed drilling–Non-CIL block 12.06 13.97 19.99 19.36 16.95 70.66 82.34Environmental measures and 12.63 0.00 4.31 21.46 6.46 163.00 44.87
subsidence controlConservation and safety in coal mines 0 0 0 56.24 145.45 0 201.69Development of transportation 0 0 0 42.54 11.16 0 53.69
infrastructure in coalfield areasOthers (including VRS* and 115.39 16.80 94.05 1.01 24.79 425.06 252.05North East component)Total GBS 163.66 73.45 167.88 194.38 242.00 1034.52 841.36Total MoC 1864.02 1444.38 1662.63 2248.90 3195.92 31591.00 10415.85
Note: # At constant price (2001–02); * GBS was provided for implementing Voluntary Retirement Scheme (VRS) in the Tenth Plan butexpenditure under this scheme occurred only in 2002–03 and 2004–05.Source: MoC.

376 Eleventh Five Year Plan
existing provisions of Mines and Minerals (Devel-opment and Regulation) Act (MMDR Act) 1957 tofacilitate offering of coal blocks to potential entre-preneurs through competitive bidding.
• Coal has been removed from the list of essentialcommodities under the Essential Commodities Act1956.
• System of e-auctioning of coal open to both con-sumers and traders was introduced.
• Existing system of calculation of the royalty oncoal and lignite on the tonnage basis was revised tohybrid formula-based system comprising fixed part(tonnage basis) and variable part (ad valorem basis).
• Coal gasification and coal liquefaction has beennotified as end-use under the Coal Mines (Nation-alization) Act 1973 for the purpose of allocation ofcaptive coal blocks.
THE ELEVENTH PLAN
COAL DEMAND AND PRODUCTION10.161 Coal demand is projected to reach 731.10 mil-lion tonnes by the end of the Eleventh Plan. Cumula-tive Annual Growth Rate in coal demand during theEleventh Plan is projected at 9.7%. The sector-wisebreak up of the requirement is shown in Figure 10.1and Annexure 10.1.
10.162 Coal production is envisaged to reach 680million tonnes in the terminal year of the EleventhPlan. The incremental production is envisaged to be247.50 million tonnes as against 104.71 million tonnes
added in the Tenth Plan. CIL is expected to add 156.70million tonnes, SCCL 3.30 million tonnes, and cap-tive blocks 86.53 million tonnes. CIL envisages takingup 114 projects with an ultimate capacity of 230million tonnes (to contribute 70 million tonnes in2011–12) and SCCL 38 projects with an ultimatecapacity of 55.40 million tonnes (to contribute about8 million tonnes in 2011–12). Cumulative AnnualGrowth Rate in coal production during the EleventhPlan is projected at 9.47% (Annexure 10.2).
DEMAND SUPPLY MANAGEMENT10.163 In overall terms, the physical gap between theprojected demand of 731.10 million tonnes and theprojected domestic availability of 680 million tonnesworks out to 51.10 million tonnes in 2011–12. Thiscomprises 40.85 million tonnes of coking coal and10.25 million tonnes of thermal coal. This requirementwould need to be met from imports. In case produc-tion from captive blocks does not come as envisaged,the quantity of imports would be higher.
10.164 Given the fact that captive mines will take sevenor eight years to ramp to full production, the end-useprojects would either have to be delayed or someinterim supply arrangements would have to be made.Since coal import for inland sites is not a viableoption, coal PSUs would need to provide coal to thosepower plants that have been allotted captive minestill their captive mines achieve full production.
10.165 Coking coal production during the EleventhPlan is projected to grow by 9.1% from the currentlevel hovering between 17–18 million tonnes to 27.65million tonnes in spite of the fact that no new resourceof coking coal has been found.
LIGNITE DEMAND AND PRODUCTION10.166 The Eleventh Plan envisages a lignite demandof 55.59 million tonnes (Tamil Nadu, 23.59 milliontonnes; Gujarat, 23.73 million tonnes; Rajasthan, 8.27million tonnes) in 2011–12. The additional lignite-based power-generation capacity in the Eleventh Planis envisaged as 2225 MW. Lignite demand from NLCin 2011–12 has been projected to be 27.04 milliontonnes implying CAGR of 6.89%. Lignite-based powergeneration by NLC during the Eleventh Plan is expected
Source: Working Group Report on Coal and Lignite.
FIGURE 10.1: Estimated Sector-wise Demand forCoal in 2011–12

Energy 377
to reach 26077 Million Unit (MU) implying CAGR of11.91%. The lignite production is projected to reach54.96 million tonnes (Tamil Nadu, 24.23 milliontonnes; Gujarat, 22.26 million tonnes, Rajasthan, 8.47million tonnes). NLC is expected to meet this level ofdemand growth.
CENTRAL SECTOR PLAN SCHEMES10.167 Exploration activities undertaken undertwo plans schemes of the Tenth Plan namely regional/promotional exploration and detailed drilling in non-CIL blocks need to be carried forward in the EleventhPlan for enhancing the pace of exploration in coal andlignite. Jharia–Raniganj Action Plan has been proposedin the Eleventh Plan to recover remaining coal beforeit gets burnt or become uneconomic due to steriliza-tion. Existing EMSC scheme is proposed to continuewith the objective of implementing the action plan.Existing S&T scheme is also proposed to continue inthe Eleventh Plan.
Regional/Promotional Exploration10.168 An outlay of Rs 383.50 crore has been proposedby the MoC for undertaking exploration activitiesunder this scheme. A projection of 4.0 lakh metre ofdrilling in coal and 3.5 lakh metre in lignite hasbeen envisaged to establish about 20 billion tonnes ofcoal and 4.06 billion tonnes of lignite resources. Thisexcludes the programme for regional exploration byGSI where 1.94 lakh metre of drilling in coal and 0.10lakh metre of drilling in lignite has been projected.
Detailed Exploration in Non-CIL Blocks10.169 About 10 lakh metre of drilling has been pro-posed to be undertaken in 32 non-CIL blocks duringthe Eleventh Plan targeting 10.75 billion tonnes ofresources to be brought under proved category. Majorpart of the exploration activity would be outsourcedby CMPDI. The total fund requirement for detailedexploration in non-CIL blocks scheme during theEleventh Plan has been estimated at Rs 893.89 crore.
Environmental Measures andSubsidence Control10.170 The issue of land subsidence and fire in oldmined out areas of Raniganj coalfields of West Bengaland Jharia coalfields of Jharkhand has been under
consideration of the government for quite some time.A scheme was formulated for mitigating adverseimpacts of fire and subsidence problems caused dueto unscientific mining activities by erstwhile ownersbefore nationalization. However, the scheme did notyield desired results during previous Plan periods.
10.171 The Jharia–Raniganj Action Plan would betaken up for implementation during the Eleventh Planunder this scheme. The Action Plan proposes to dealwith fires, rehabilitation of the uncontrollable subsid-ence prone inhabited areas, and diversion of railwaylines/roads within the command area of BCCL andECL. Total outlay proposed for the Action Plan isRs 8638.87 crore spread over a 10-year period. Theannual outgo for implementing the proposal wouldbe of the order of Rs 860 crore as per the tentative costestimates furnished above. It is proposed to fund Rs 350crore per annum through accrual of cess by additionalcess of Rs 6.50 per tonne under Coal Conservation andDevelopment Act (CCDA) already being charged on alltype of coal produced in the country, Rs 200 croreper annum through internal resources of CIL, and theremaining Rs 310 crore per annum through budgetarysupport. As accruals from cess are considered revenueto the government, the net budgetary support neededfor the scheme would be Rs 660 crore per annum star-ing from the second year of the Eleventh Plan.
Science and Technology (S&T)10.172 The main thrust areas in this scheme are pro-motion of clean coal technologies including coalbeneficiation, in situ coal gasification, carbon captureand sequestration, coal bed methane/coal mine meth-ane/abandoned mine methane, coal gasification, coalto oil, etc. Research efforts for industry-orientedprojects would be promoted. Areas such as extractionof steep and thick coal seams, open-cast bench slopestability, strata control, etc. would be given specialattention. An outlay of Rs 100 crore has been proposedfor the implementation of this scheme.
Conservation and Safety in Coal Mines andDevelopment of Transport Infrastructure inCoalfield Areas10.173 Line entries were maintained under theseschemes till the matter of treating them as non-Plan
378 Eleventh Five Year Plan
schemes are settled with the Ministry of Finance.Planning Commission had not agreed with the pro-posal of the MoC for treating these schemes as Planschemes as activities under these schemes are fundedas reimbursement of a portion of the stowing exciseduty, which is statutorily levied as per the CCDA anddeposited in the government treasury account. TheMinistry of Finance, now, is of the view that theseschemes should be treated as Plan schemes for bettermonitoring. As the source of funding of these schemesis through the dedicated Subsidence Excise Duty col-lected under CCDA, funding would not be a problem.
INITIATIVES IN INFORMATION AND COMMUNICATIONTECHNOLOGY10.174 In order to improve efficacy of the projectmonitoring system and e-governance, the thrust areasthat have been identified for introduction of ICT inthe Eleventh Five Year Plan are computerization ofvarious business functions up to project level; coal andlignite resource information system; resource deple-tion information system; Integrated CoalNet Appli-cation Software; GPS-based truck despatch system; GISfor mapping, spatial concepts, and time/space opera-tions technology; integrated safety, production andenvironment monitoring and control in undergroundmines; centralized mail/messaging system; employeewelfare. The estimated expenditure in this scheme isRs 10 crore in the Eleventh Plan.
BENCHMARKING OF PRODUCTIVITY10.175 The Eleventh Plan envisages achieving a pro-ductivity level of 5.54 tonnes per person shift in CILand 2.67 tonnes in SCCL in the terminal year of thePlan. Thrust would be given on improvement of op-erational efficiency of the coal mining companies byestablishing benchmarks for different mining opera-tions/equipments and manpower productivity com-parable with international standards and measures.The productivity norms of different HEMM bench-marked earlier for both availability and utilization indifferent coal companies would be revisited so thatthese are comparable with the international standards.
STRATEGIES FOR COAL MOVEMENT10.176 In the terminal year of the Eleventh Plan (2011–12) it is proposed to move 348 million tonnes of raw
coal and products from CIL using railway networkwhich is about 50% more than the rail movement in2006–07. As against a Four Wheeler Wagon (FWW)requirement of 25300 per day by the end of the TenthPlan, the Eleventh Plan envisages 36728 FWW per dayin 2011–12 which is about 45% increase from the cur-rent level. It is proposed to augment rail movement ofcoal through independent freight corridors, matchingwagon volume and matching unloading facilities atpower stations, etc. Power stations will have to equipthemselves for handling multiple types of wagons.
10.177 The port infrastructure needs to be strength-ened in order to facilitate rise in imports as well ascoastal shipment. About 110 million tonnes of coal isrequired to be handled at the end of the Eleventh Planincluding coastal shipment implying a port capacityof about 120–130 million tonnes by 2011–12.
10.178 To ease out the load on rail infrastructure, it isequally important to develop alternative modes oftransportation of coal through inland waterways andcoastal movement.
INITIATIVES ON CLEAN COAL TECHNOLOGIES10.179 Coal fired power generation would continueto occupy center-stage of India’s energy scenario.Hence, it is desirable to have continuing improvementsin its environmental performance, thermal efficiency,and thereby economics. Diffusion of new high-efficiency technologies in the field of energy conver-sion can lead to reduction in energy intensity of theeconomy. The process of producing energy has a sig-nificant impact on the environment, hence pollutionabatement processes also form an important part ofthe development in this regard. A number of technolo-gies have emerged for improving thermal efficiency andenvironmental performance. Different initiatives inthis field are termed as clean coal technology, whichinclude pre-combustion processes, combustion pro-cesses, and alternative use such as gasification of coal,coal bed methane, in situ coal gasification, etc. Differ-ent clean coal technologies do not compete with eachother and have distinctive advantages.
10.180 Coal beneficiation is one of the prime cleancoal technologies. The effect of coal washing and

Energy 379
thereby ensuring a more consistent fuel supply toconventional PCC boilers may improve their efficiencyby around 1%.
10.181 High ash Indian coal needs clean coal tech-nology for improving thermal efficiency of energyconversion processes and finally environmental per-formances. Use of washed coal ensures consistency ofcoal qualities and results in boiler performanceimprovement by allowing the unit and auxiliaries tooperate near the design (optimum efficiency) points.The projected capacity increase in the country war-rants introduction of higher capacity units (in therange of 800–1000 MW) where it is desirable to usewashed coal for limiting the size/number of unit andauxiliaries within the conventionally available sizes.
10.182 The use of washed thermal coal has beenon the rise during the Tenth Five Year Plan from 17.12million tonnes in 2002–03 to 55.24 million tonnes in2006–07. It is estimated that 243 million tonnes perannum of thermal coal is required to be washed bythe end of the Eleventh Plan and accordingly about140 million tonnes of additional thermal coal wash-ing capacity would be created. The perfect growth incoal washing may be realized if the PlanningCommission’s suggestion to price coal on a fullyvariable GCV is implemented. Such a pricing meth-odology will provide the right incentive to both theproducer and the consumer of coal to improve qual-ity. However, enhancing washing capacity wouldincrease demand for raw coal, unless the fines areused productively.
10.183 First 100 MW IGCC demonstration projectwill be taken up by a consortium of NTPC and BHELwith part funding from the GoI.
10.184 Underground coal and lignite gasificationtechnology utilize fuel in different form and can bebeneficial when used for inaccessible resources.CBM extraction enhances energy security by tappingan additional source of fuel which would otherwisehave gone waste. CBM in association with CO
2 seques-
tration enhances methane recovery while reducinggreen house gas. Coal liquefaction involved conversionof coal into oil through gasification requiring surface
gasifier. CIL and NLC in association with ONGC wouldwork towards making the technology successful.
10.185 CBM and CTL have been covered underpetroleum and natural gas sector.
MINING TECHNOLOGY, SAFETY, AND WELFARE10.186 Safety in coal mines is governed by the MinesAct 1952 and the rules and regulations framed here-under. The Directorate General of Mines Safety(DGMS), under the Ministry of Labour and Employ-ment has been empowered to enforce the statutes re-lating to mine safety. There is a Standing Committeeon Safety in Coal Mines which is chaired by Ministerin Charge of Coal. The strategies for action includesintroduction of the concept of self-regulation, devel-opment of legislation, planning and technology, emer-gency response and disaster management, humanresource development, and R&D effort includingidentification of areas of application of informationtechnology in safety.
R&D IN COAL SECTOR10.187 R&D in coal sector is carried out under fourbroad areas, namely, production, productivity,and safety; coal beneficiation; coal utilization; and en-vironment and ecology. In addition to initiativesin clean coal technologies, efforts should be made toundertake industry-oriented R&D projects whichmay include areas such as extraction of steep andthick coal seams, open-cast bench slope stability, stratacontrol, etc.
INVESTMENT NEEDS AND FINANCING PATTERN10.188 The proposed public sector investment forthe Eleventh Plan for supporting their productionplans is Rs 35774 crore (CIL, Rs 17390 crore;SCCL, Rs 3340 crore; NLC, Rs 15044 crore includingRs 176.00 crore for the ongoing projects – NLC MinesRs 2993 crore; NLC Power Rs 12051 crore). The out-lay proposed for coal PSUs for the Eleventh Planis about 117% more than the Tenth Plan outlay ofRs 30556.48 crore.
10.189 Against the estimated IEBR availability ofRs 69926.77 crore (CIL, Rs 51542.55 crore; SCCL,Rs 3340.30 crore; NLC, Rs 15043.92 crore), the

380 Eleventh Five Year Plan
proposed plan outlay of PSUs is Rs 35774 crore (atconstant price). While the resource position ofSCCL and NLC is just sufficient to meet the plan out-lay, there is a huge surplus in the resource position ofCoal India Ltd and CIL has to consider productiveinvestment of the surplus resources through feasiblediversification plans.
10.190 The proposed outlay for departmental schemesto be supported through domestic budgetary supportincluding North East component is Rs 6667.76 crore(at constant price) comprising promotional explora-tion, Rs 383.50 crore; detailed drilling in non-CILblocks, Rs 893.39 crore; R&D, Rs 100.00 crore; EMSC/Jharia Action Plan, Rs 3614.07 crore; schemes underCCDA, Rs 1665.60 crore (Rs 692.95 crore for stowingand protective works and Rs. 972.65 crore for roadand rail infrastructure); publication of coal statisticsRs 1.2 crore; and Rs 10 crore for e-governance. TheJharia–Raniganj Action Plan under EMSC scheme isproposed to be financed partly through the IEBR ofCoal India Ltd (Rs 800 crore) and the rest Rs 1400crore through the CCDA fund and Rs 1200 crorethrough budgetary support. Accordingly, the MoCwould need Rs 5867.76 crore of domestic budgetarysupport for implementing above Plan schemes. Thisincludes Rs 3065.72 crore coming from the accruedfund of Subsidence Excised Duty being collectedunder the CCDA at the rate of Rs 10 per tonne of alltypes of coal sold.
10.191 Thus the total plan outlay proposed for MoCfor the Eleventh Five Year Plan is Rs 42442 crore (atconstant price) which is 134% more than the TenthPlan outlay of Rs 31591 crore.
POLICY REFORMS10.192 Policy interventions required in the EleventhPlan for:
• Restructuring CIL for optimizing their operations.• Improvement in productivity of the sector by estab-
lishing benchmarks for different operations equip-ments comparable with international standards.
• Ensuring sale of at least 20% of coal productionthrough e-auctions open to both consumers andtraders.
• Promoting additional thermal coal imports underlong-term supply contracts. Such coal imports couldfeed coastal power plants.
• Changing grading and pricing of non-coking coalfrom the existing UHV to the international prac-tice of pricing coal based on GCV.
• Replacing coal linkages with fuel supply agreements.• Promoting in situ coal gasification and tapping of
coal bed methane/coal mine methane.• Rationalization of rail freight rates for coal trans-
port.• Extending infrastructure status to the coal indus-
try. Lower duties on capital goods imported for coalmines.
• Instituting an independent regulatory mechanismfor the coal sector.
• Amending the provisions of Contract Labour(Regulation and Abolition) Act 1970 which prohibitemployment of contract labour in mining activi-ties. This will facilitate offloading of certain activi-ties in coal mining for improved economics ofoperations.
• Promoting underground mining operations forextraction of deep seated deposits.
• Augmenting domestic coking coal supplies by open-ing up new mines and coal washeries.
• Augmenting port infrastructure capacity to facili-tate envisaged rise in import.
• Exploration for CBM and detailed drilling in non-NLC lignite blocks should be included in existingPlan schemes.
• Institutional framework for maintenance of data-base on coal and lignite resource (net of depletion)is required which will have access to the geologicaldata in respect of all coal/lignite blocks (whetherheld by public or private).
• Identifying forest areas as ‘Yes’ and ‘No’ zones forexploration, for saving energy in exploration in thearea which can never be mined.
• Involving reputed domestic and international agen-cies in coal/lignite exploration.
• Concerted efforts for addressing the issues relatedto decommissioning of mines/mine closure afterexhaustion of reserves are required to be made.
• Need for developing mechanism for managementof occupational safety and health of coal miners andpersons living in the vicinity of coal mining areas.

Energy 381
• Need for evolving appropriate corporate socialresponsibility for fulfilling the aspirations of popu-lation living in and around coalfield areas andto promote environmentally sustainable miningpractices.
• Recruitment and skill upgradation of miningengineers and other professionals required for op-eration and statutory purposes in the coal/lignitemines need to be stressed upon. It is necessary tostrengthen internal safety organization of respec-tive coal producing companies and introduce safetyaudit of mines by independent auditors. Infrastruc-ture including human resource for rescue and emer-gency response systems also needs reinforcement.
• Coal mining should be opened to private playerswithout the restriction of captive use which requirespassage of the Coal Mines (Nationalization) Bill2000.
• Introduction of competitive bidding process inallocation of coal blocks by making suitable amend-ments in the MMDR Act. This would not only en-sure optimal allocation of precious resources, butwould also attract more serious players into coalsector.
• Need for a suitable Resettlement and RehabilitationPolicy which is acceptable to all concerned that is,State Governments, project-affected people (PAP),and coal and lignite producing companies.
• In order to gain confidence of the PAP, coal andlignite producing companies should return therestored/reclaimed land to PAP for appropriate useafter mining operations have ceased in the area.
• Establishing standards for undertaking EnergyEfficient and Conservation Programmes in allcritical operations in the value chain starting fromexploration to utilization and mechanisms for in-dependent monitoring and verification of achievedenergy savings and cost effectiveness of suchprogrammes.
ENERGY EFFICIENCY AND DEMAND SIDEMANAGEMENT (DSM) PROGRAMMES10.193 Energy conservation is a multi-faceted ap-proach with the involvement of supply side, demandside, and also T&D system. The success of the energyconservation programme depends upon the aspectssuch as pricing of different fuels and electricity for
different categories of consumers, awareness amongthe users to appreciate the necessity of energy conser-vation, an effective institutional arrangement to co-ordinate energy conservation programmes, and otheraspects that include mobilizing financial resourcesto fund energy conservation programmes. It is worth-while to give necessary importance for energy conser-vation programmes in view of the fact that it iseconomical and wise to invest in energy conservationadequately in order to avoid creation of equivalentnew capacities for generation with significant levelof investment.
10.194 In India, DSM measures have a key role ineliminating power shortages to a considerable extent.The demand for electricity fluctuates within a 24-hourcycle as well as between seasons. This has importantimplication in planning generating capacities. In adeveloping country like India, where per capita avail-ability of energy is very low, need-based demand forenergy can be unlimited. But, supply side is limited byinsufficiency of investible resources and the demandside by lack of purchasing power. In such a situation,it is clear that a capacity to provide additional energyis always likely to lag behind the rising demand, unlessconsumption of energy is also economized.
10.195 The basic problem in power generation andsupply is the maintenance of the frequency of the gridand the power factor of the loads at stipulated levels.The low-frequency conditions lead to instability ofthe interconnected grid and thereby causing frequenttripping. Sometimes this results in cascade trippingleading to total black out. It is essential that frequencyis maintained between 49.8–50.2 Hz for effective gridmanagement as well as maximization of useful life ofthermal/nuclear generating plants. At present, the situ-ation is managed by resorting to emergency manualload shedding by switching off various feeders. How-ever, these are only temporary measures adopted tomeet exigencies, arising from time to time, withoutattempting any strategy to influence the basic patternof load curves.
BARRIERS IN IMPLEMENTING DSM10.196 One of the basic reasons for energy ineffi-ciency in India is energy pricing. Electricity rates, kept
382 Eleventh Five Year Plan
deliberately low for a large block of consumption, donot send correct signals to consumers to alter theirconsumption behaviour. A typical case relates to thelow agricultural tariffs (subsidies are as high as 80%–90% in most States) that have resulted in gross misuseof both electricity and groundwater. Low tariffs fordomestic consumers also do not offer any incentive toencourage efficient use of energy. There is thereforean urgent need to look into the issue of pricing andefficient operation and management of the SEBs. Otherinnovative pricing options, which have proved success-ful in managing electricity demand in several devel-oped and developing countries such as time-of-daytariffs, interruptible tariffs, and seasonal tariffs shouldbe initiated by the utilities on an experimental basis.
10.197 The other important constraint in the imple-mentation of Demand side Management (DSM)programme is the information gap. Indian consumersare not fully aware of the opportunities available forimproving energy efficiency.
ENERGY-EFFICIENCY PROGRAMMES IN THEELEVENTH PLAN10.198 In the Eleventh Five Year Plan, Bureau ofEnergy Efficiency (BEE) will be strengthened as a nodalorganization at the national level and will be empow-ered to provide direction to the energy conservationprogrammes in the States. An ‘Energy ConservationInformation Centre’ will be set up within BEE to col-late energy use data and analyse energy consumptiontrends and monitor energy conservation achievementsin the country. Supporting organizational set-up willalso be strengthened in the State designated agencies(SDAs) in various States and UTs. For this, a matchinggrant support from Central Government restricted tothe contribution made by the respective States/UTsgovernments is proposed to establish State EnergyConservation Fund as mandated under EC Act. In theEleventh Five Year Plan, BEE will focus energy conser-vation programmes in the following targeted sectors.
TARGETED SECTORS
Industrial Sector (Energy Intensive Industries)10.199 BEE will develop 15 industry-specific energyefficiency manuals/guides for the following sectors:
aluminium, fertilizers, iron and steel, cement, pulp andpaper, chlor alkali, sugar, textile, chemicals, railways,port trust, transport sector (industries and services),petrochemical and petroleum refineries, thermalpower stations and hydel power stations, electricitytransmission companies and distribution companies.The manuals will cover specific energy consumptionnorms as required to be established under the ECAct, energy efficient processes and technologies,best practices, case studies, etc. Follow up activitieswill be undertaken in the States by SDAs and manualswill be disseminated to all the concerned units in theindustries.
Small and Medium Enterprises (SMEs)10.200 SDAs in consultation with BEE will initiatediagnostic studies in 25 SME clusters in the country,including four to five priority clusters in the NER, anddevelop cluster-specific energy-efficiency manuals/booklets and other documents to enhance energyconservation in SMEs.
Commercial Buildings and Establishments10.201 BEE will prepare building specific energy-efficiency manuals covering specific energy con-sumption norms, energy-efficient technologies, bestpractices, etc. As a follow up, SDAs would initiateenergy audits and their implementation in 10 govern-ment buildings in each State and one or two buildingsat UT level. BEE will also assist SDAs in the establish-ment and promulgation of energy conservation build-ing codes (ECBC) in the States, and facilitate SDAsto adapt ECBC.
Residential/Domestic Sector10.202 BEE will enhance its ongoing energy labelingprogramme to include 10 other appliances, –namely,air conditioners, ceiling fans, agricultural pump-sets,electric motors (general purpose), Compact Fluores-cent Lamps, Flurescent Tube Light (FTL)–61 cm, tele-vision sets, microwave ovens, set top boxes, DVDplayers, and desktop monitors. To facilitate this con-sumer awareness will also be enhanced nation wide.
Street Lighting and Municipal Water Pumping10.203 To promote energy efficiency in municipalareas in various States, SDAs in association with State

Energy 383
utilities will initiate pilot energy conservation projectsin selected municipal water pumping systems andstreet lighting to provide basis for designing State-levelprogrammes.
Agriculture Sector10.204 In the Eleventh Plan, SDAs will disseminateinformation on successful projects implemented insome States, launch awareness campaigns in all re-gional languages in print and electronic media, andinitiate development of State-level programmes alongwith utilities.
Transport Sector10.205 SDAs with assistance of concerned institutions/agencies will conduct diagnostic studies to establish thestatus of energy consumption and conservation in thesector. BEE will also set up labeling and/or norms forspecific fuel consumption for a few automobile andtransport categories (services/public transport). BEEin association with SDAs will facilitate State utilities topursue DSM options by focusing on orientation work-shops for awareness building, setting up of DSM cellsin utilities to conceive and implement DSM programs,support load research and studies to rationalize thetariff structures, and initiation of DSM programmes,especially in the residential, agricultural pumping andmunicipal water works, and street lighting sectors.
10.206 Policy research on legislative amendments,policy interventions including fiscal and non-fiscalmeasures are planned to be undertaken in theEleventh Plan.
PROPOSED TARGET OF ENERGY SAVINGS BY THEEND OF THE ELEVENTH PLAN10.207 It is proposed to set a target of 5% of the an-ticipated energy consumption level in the beginningof the Eleventh Plan as energy savings to be achieved atthe end of the Eleventh Plan. Financial provision forthe same has been made in the outlay of power sector.
CONSERVATION AND EFFICIENCY IMPROVEMENT
Demand Side Management10.208 Road transportation consumes about one-third of the total consumption of the petroleum prod-ucts in India. There is a need to reduce this consumption
by shifting goods and passenger traffic from roads torails, improving the road infrastructure, streamliningof traffic signals, mandating fuel efficiency levels intransport vehicles, and developing hybrid electric ve-hicles (EVs).
Conservation of Petroleum Products10.209 The major focus would be towards efficient useof petroleum products, minimizing the waste ofenergy sources, development of efficient equipmentsand their commercialization, educating and motivat-ing the people towards conservation techniques andpractices. There is a need to establish a system approachto quantify the conservation potential.
Benchmarking of Hydrocarbon Sector10.210 To make the hydrocarbon sector globallycompetitive, the oil and gas industry needs to bench-mark their operations against the best in the worldand should upgrade their technology for improvingthe efficiency.
NEW AND RENEWABLE ENERGY SECTOR
ISSUES AND CHALLENGES10.211 From a longer term perspective of the grow-ing threat of climate change and keeping in mind theneed to maximally develop domestic supply optionsas well as the need to diversify energy sources,renewables remain important to India’s energy sector.Solar power could be important for attaining energyindependence as well as a green house gas-free energysystem in the long run. However, based on present tech-nology with a concerted push and a 40-fold increasein their contribution to primary energy, renewablesexcluding hydroelectricity may account for only 5%–6% of India’s energy mix by 2031–32. While this fig-ure appears small, the distributed nature of renewablescan provide many socio-economic benefits.
10.212 While there were renewable energy program-mes taken up in the past to address the above chal-lenges, the impact of these programmes were rathermarginal. The lack of institutional support at thegrassroots, poor focus on training and maintenanceaspects, lack of awareness among rural community,subsidies acting as barrier in cost reduction, etc., were

384 Eleventh Five Year Plan
found to be the bottlenecks for the programmes notachieving desired results. The actual benefit of thesubsidies did not reach the beneficiaries but onlyacted as barriers in attempts for cost reduction andefficiency improvement of the renewable energydevices and gadgets.
10.213 A renewable energy source may be environ-ment-friendly. It may be locally available thereby mak-ing it possible to supply energy earlier than in acentralized system. Grid-connected renewables couldimprove the quality of supply and provide system ben-efits by generating energy at the ends of the grid whereotherwise supply would have been lax. Further,renewables may provide employment and livelihoodto the poor. Hence, subsidies to renewables may bejustifiable; however, they should be linked to outcomesand given for a well-defined period.
10.214 A majority of India’s people especially in ruralareas use traditional fuels such as dung, agriculturalwastes, and firewood for cooking food. These fuelscause indoor pollution. The 1999–2000 NSS 55thRound revealed that for 86% of rural households theprimary source of cooking energy was firewood andchips or dung cake. In urban areas too more than 20%households relied mainly on firewood and chips. Only5% of the households in rural areas and 44% house-holds in urban areas used LPG. Kerosene is used by22% of urban households and only 2.7% of ruralhouseholds for cooking. Other primary source ofcooking energy used by urban and rural householdcovers coke and charcoal, biogas, electricity, and otherfuels. The situation in rural areas calls for provision of
sustainable and clean energy supplies. In this contextthe role of renewable energy sources such as biogas,improved cook stoves, solar energy, and biomass basedsystems to meet the basic needs of cooking, lighting,and water heating is important.
10.215 The total quantities of traditional fuels usedto meet the basic energy needs are substantial. Table10.26 gives the data on household energy use. The bio-mass-based fuels dominate particularly in rural areas.
10.216 Use of traditional fuels for cooking with theattendant pollution and the cost of gathering themimpose a heavy burden on people particularly womenand girls. The need to gather fuels may deprive the girlchild from schooling. Use of such fuels, overtime, in-creases the risks of eye infections and respiratory dis-eases. Lack of access to clean and convenient energyimpacts the health of women and the girl child moreadversely as they spend more time indoors and areprimarily responsible for cooking. Women’s micro-enterprises (an important factor in household income,as well as in women’s welfare and empowerment) areheat-intensive (food processing), labour-intensive,and/or light-intensive (home industries with work inevenings). The lack of adequate energy supplies—andother co-ordinated support—affects women’s abilityto use these micro-enterprises profitably and safely.Furthermore, women often face additional barriers inmaking best use of available opportunities and obtain-ing improved energy services. There are social andpractical constraints related to ownership and controlover productive resources—women are typicallyexcluded/marginalized from decision-making and
TABLE 10.26Household Energy Consumption in India (July 1999–June 2000)
Fuel Type Physical Units Mtoe
Rural Urban Total Rural Urban Total
Fire wood and chips (million tonnes) 158.87 18.08 176.95 71.49 8.13 79.62
Electricity (BkWh) 40.76 57.26 98.02 3.51 4.92 8.43
Dung cake (million tonnes) 132.95 8.03 140.98 27.92 1.69 29.61
Kerosene (million litre) 7.38 4.51 11.89 6.25 3.82 10.07
Coal (million tonnes) 1.20 1.54 2.74 0.49 0.63 1.12
LPG ( million tonnes) 1.25 4.43 5.68 1.41 5.00 6.41
Source: Derived from NSS 55th Round (July 1999–June 2000) data, NSSO, Ministry of Statistics and Programme Implementation, GoI.

Energy 385
suffer barriers related to illiteracy, lack of exposure toinformation and training. It is estimated that in ruralnorth India 30 billion hours are spent annually ingathering fuel-wood and other traditional fuels. Theeconomic burden of traditional biomass-based fuels,time to gather fuels, time lost in sickness, and cost ofmedicines is estimated to be some Rs 300 billion. Anenergy policy responsive to social welfare must addressthis fact.
10.217 National surveys have indicated that for 86%of rural households, the primary source of cookingenergy was firewood and chips or dung cake. The effi-ciency of fuel use is of vital importance for the usersof these traditional fuels. The inefficient methods ofusing such fuels result in low thermal efficiency andhigh emission products. The traditional cookingmethods produce very high concentration of air pol-lutants such as total suspended particulates, carbonmonoxide, formaldehyde, etc. This is the major causeof indoor air pollution in the rural areas. Indoor airpollution makes the women and children who spendsufficiently long time in kitchens suffer from bronchialasthma, bronchitis, TB, and chest infection. Risk fromall respiratory diseases and eye diseases increases withlength of use of traditional fuels. The collection oftraditional fuels results in drudgery of women andchildren since they have to walk long distances tocollect such fuels. Moreover, the time spent for thispurpose is significantly long, depriving them of theiradditional income which they would have earnedduring that time. Further, deforestation and environ-mental degradation also results in the long run.Collection of traditional fuels is at zero private costbut at tremendous social cost. Supply of clean cook-ing fuels for rural households would go a long wayin addressing the social aspects associated with use oftraditional fuels discussed above.
10.218 The Ministry of New and Renewable Energy(MNRE) is responsible for programmes covering re-newable energy sources. The mission of the MNRE isas follows:
• Reduce dependence on oil imports throughdevelopment and deployment of alternate fuels(hydrogen, biofuels, and synthetic fuels) and their
applications to contribute towards bridging the gapbetween domestic oil supply and demand andthereby improve energy security.
• Increase the share of clean power by promoting re-newable electricity to supplement fossil fuel basedelectricity generation.
• Enlarge energy availability and improve access tomeet needs for clean energy for cooking, heating,motive power and captive generation in rural,urban, industrial, and commercial sectors.
• Encourage convenient, safe, and reliable newand renewable energy supply options to be cost-competitive.
10.219 MNRE programmes include (i) grid connectedand stand-alone power generation from small hydro,wind, solar, biomass, and industrial/urban wastes;(ii) rural energy programmes such as electrificationof remote villages, biogas, and improved chulhasfor cooking; (iii) solar energy applications such asthermal water heaters, solar photovoltaic applicationsfor lighting and water pumping; and (iv) integratedrural energy programme (IREP). Research, develop-ment, and demonstration programmes in new tech-nologies such as geo-thermal, hydrogen energy, fuelcells, alternative fuels for surface transport, etc., arealso undertaken by MNRE. Indian Renewable EnergyDevelopment Agency (IREDA), a financial institutionunder the administrative control of MNRE, supportsthe renewable energy programmes by providingconcessional funds. By the end of the Tenth Plan(as on 31 March 2007) the contribution of powergeneration from renewables had reached 10406.69MW representing about 8.1% of total installedgenerating capacity. Of this, wind power accountedfor 7092 MW followed by small hydro at 1975.60MW and biomass (including co-generation) at 1158.63MW. The estimated medium-term potential andachievement as on 31 March 2007 have been given inTable 10.27.
10.220 The progress in grid interactive renewablepower at a glance is given in Table 10.28.
10.221 Table 10.29 gives the typical capital cost permegawatt and cost of electricity generated per kWhthrough different renewable energy sources.

386 Eleventh Five Year Plan
TABLE 10.27Estimated Medium-term (2032) Potential and Cumulative Achievements as on 31 March 2007
S. No. Sources/Systems Estimated Units CumulativePotential Achievements
I. Power from Renewables
A. Grid interactive renewable power
11. Bio power (agro residues and plantations) 16881* MW 524.8012. Wind power 45195** MW 7092.0013. Small hydro power (up to 25 MW) 15000 MW 1975.6014. Co-generation (bagasse) 5000 MW 615.8315. Waste to energy 7000 MW 43.45
Subtotal (in MW) 133000 MW 10251.68
B. CHP/distributed renewable power
16. Solar power 50000*** MW 2.9217 Biomass/co-generation (non-bagasse) MW 45.8018. Biomass gasifier – MW 86.53#19. Energy recovery from waste – MW 19.76 MW
Subtotal 50000 MW 155.01
Total (A+B) 183000 MW 10406.69
10. Remote village electrification – Nos 2821/830(villages/hamlets)
II. Decentralized Energy Systems
11. Family type biogas plants 120 Lakh Nos 38.9012. Solar photovoltaic programme 20 MW/sq km
(i) Solar street lighting system – Nos 61321(ii) Home lighting system – Nos 313859(iii) Solar lantern – Nos 565658(iv) Solar power plants – kWp 1870.00
13. Solar thermal programme –(i) Solar water heating systems 140 Million sq m 1.90
collector area(ii) Solar cookers – Lakh Nos 6.03
14. Wind pumps – Nos 118015. Aero-generator/hybrid systems – kW 608.2716. Solar photovoltaic pumps – Nos 7068
Note: # Progress upto 15 March 2007.* Although potential is based on surplus agro-residues, in practice biomass power generation units prefer to use fuel-wood for techno-economic reasons. A potential of 45000 MW from around 20 MH of wastelands assumed to be yielding 10MT/ha/annum of woodybiomass having 4000 k-cal/kg with system efficiency of 30% and 75% PLF has not been taken into account. In order to realize thispotential a major inter-Ministerial initiative involving, among others, Environment and Forests, Agriculture, Rural Development, andPanchayat Raj would be required. Further, a Biomass atlas is under preparation which is expected to more accurately assess State-wiserenewable energy potential from agro-residues.** Potential based on areas having wind power density (wpd) greater than 200 W/m2 assuming land availability in potential areas @ 1%and requirement of wind farms @ 12 ha/MW, all of which may not be technically feasible or economically viable for grid interactive windpower. This economically viable potential could get enhanced with higher level of land availability than what has been assumed. Areashaving lower wpds might be suitable for off-grid applications. Further, preliminary surveys do not at this juncture suggest a sizeable gridinteractive off-shore wind power potential.*** Potential for solar power is dependent on future developments that might make solar technology cost-competitive for grid interactivepower generation applications. However, insolation in the country varies between 4–7 kWh/m2/day.MW = megawatt; kW = kilowatt; kWp = kilowatt peak; sq m = square metre; sq km = square kilometre; CHP = combined heat and power.
Source: MNRE, GoI.
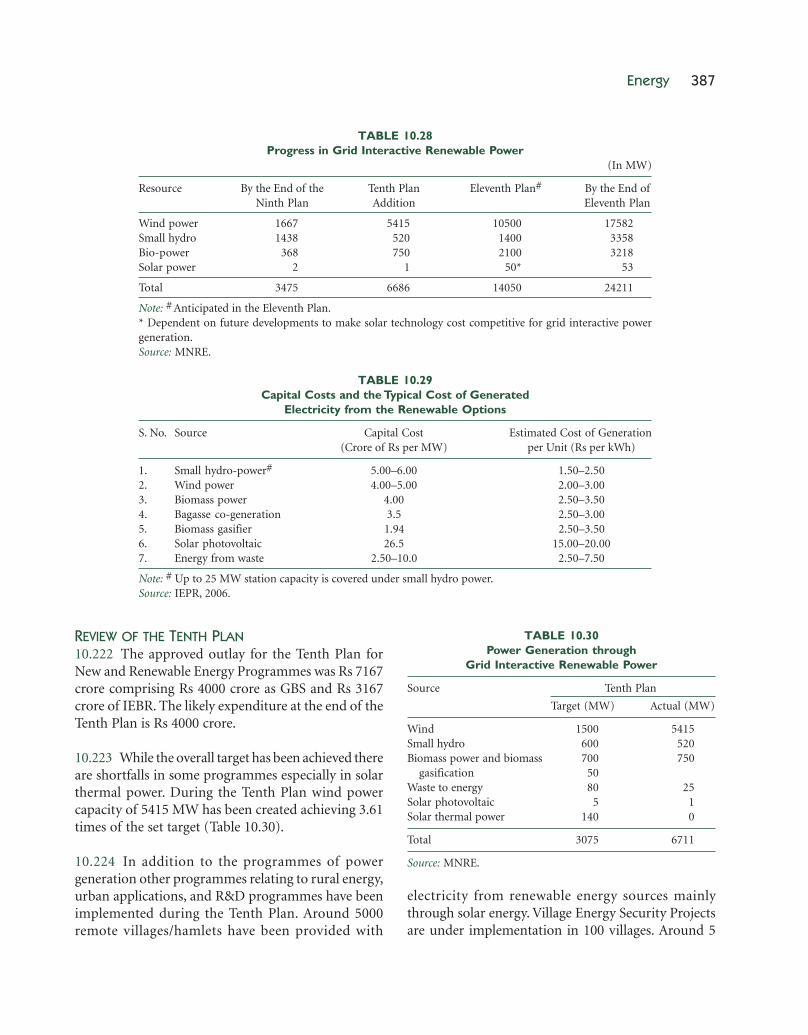
Energy 387
REVIEW OF THE TENTH PLAN10.222 The approved outlay for the Tenth Plan forNew and Renewable Energy Programmes was Rs 7167crore comprising Rs 4000 crore as GBS and Rs 3167crore of IEBR. The likely expenditure at the end of theTenth Plan is Rs 4000 crore.
10.223 While the overall target has been achieved thereare shortfalls in some programmes especially in solarthermal power. During the Tenth Plan wind powercapacity of 5415 MW has been created achieving 3.61times of the set target (Table 10.30).
10.224 In addition to the programmes of powergeneration other programmes relating to rural energy,urban applications, and R&D programmes have beenimplemented during the Tenth Plan. Around 5000remote villages/hamlets have been provided with
electricity from renewable energy sources mainlythrough solar energy. Village Energy Security Projectsare under implementation in 100 villages. Around 5
TABLE 10.28Progress in Grid Interactive Renewable Power
(In MW)
Resource By the End of the Tenth Plan Eleventh Plan# By the End ofNinth Plan Addition Eleventh Plan
Wind power 1667 5415 10500 17582Small hydro 1438 520 1400 3358Bio-power 368 750 2100 3218Solar power 2 1 50* 53
Total 3475 6686 14050 24211
Note: # Anticipated in the Eleventh Plan.* Dependent on future developments to make solar technology cost competitive for grid interactive powergeneration.Source: MNRE.
TABLE 10.29Capital Costs and the Typical Cost of Generated
Electricity from the Renewable Options
S. No. Source Capital Cost Estimated Cost of Generation(Crore of Rs per MW) per Unit (Rs per kWh)
1. Small hydro-power# 5.00–6.00 1.50–2.502. Wind power 4.00–5.00 2.00–3.003. Biomass power 4.00 2.50–3.504. Bagasse co-generation 3.5 2.50–3.005. Biomass gasifier 1.94 2.50–3.506. Solar photovoltaic 26.5 15.00–20.007. Energy from waste 2.50–10.0 2.50–7.50
Note: # Up to 25 MW station capacity is covered under small hydro power.Source: IEPR, 2006.
TABLE 10.30Power Generation through
Grid Interactive Renewable Power
Source Tenth Plan
Target (MW) Actual (MW)
Wind 1500 5415Small hydro 600 520Biomass power and biomass 700 750
gasification 50Waste to energy 80 25Solar photovoltaic 5 1Solar thermal power 140 0
Total 3075 6711
Source: MNRE.

388 Eleventh Five Year Plan
lakh biogas plants have been installed. In the pro-grammes catering to the requirement of urban areasunder the solar water heaters progranm-mes 12.5 lakhsq m collector areas of water heating systems havebeen installed. R&D activities have been carried outespecially in the area of alternative fuel for transportincluding hydrogen energy.
ELEVENTH PLAN PROGRAMME10.225 The various programmes of the MNRE forthe Eleventh Plan have been drawn up in the light ofrecommendations made by Planning Commissionand those made in IEPR. The five programmes pro-posed are:
• Grid Interactive and Distributed Renewable Power.• Renewable Energy for Rural Applications.• Renewable Energy for Urban, Industrial, and
Commercial Applications.• Research, Design, and Development for New and
Renewable Energy.• Information, publicity and extension, international
relations, HRD and training, equity support toIREDA and spill-over liabilities.
10.226 Proposed outlay of Rs 10460 crore (at constantprice) includes GBS of Rs 3537 crore. The physicaltargets and the financial outlays proposed by MNREfor the above programmes are given in Table 10.31 and10.32.
POLICY APPROACH10.227 Capital subsidies that encourage investmentwithout ensuring outcomes would be phased out. In-centives provided for grid connected power from re-newable sources would be linked to generation and notto power capacities created. Thus power regulators willbe asked to create alternative incentive structures such
TABLE 10.31Financial Outlays Proposed for the Eleventh Plan
(Rs Crore)
Grid Interactive and Distributed 3925.00Renewable PowerGrid interactive renewable power 1800.00Off-grid/distributed renewable power 2100.00Performance testing 25.00Renewable energy for rural applications 2250.00Renewable energy for urban, industrial, 685.00and commercial applicationsResearch, design, and development 1500.00Programmes to support information, 2100.00publicity and extension, internationalrelations, HRD and training, equity forIREDA, and spill-over liabilities
Plan Outlay 10460.00
Source: Working Group on New and Renewable Energy.
TABLE 10.32Physical Targets Proposed for the Eleventh Plan
Programme Component Physical Target forEleventh Plan
(in MW)
Wind power 10500Small hydro power 1400Biomass power 1200Co-generation 500Urban waste to energy 200Industrial waste to energy 200Total 14000
Off-grid renewable powerWind/hybrid power 950Small hydro powerBio powerSolar power (grid/off-grid) 50
Total 1000
For remote villages/hamletsRemote village lighting 9000 villages/hamletsVillage energy security test projects 1000 villagesCommon component for cooking/ 10000 villages/hamlets
supplementary motive power
For all villagesSolar thermal systems—flat 15 lakh sq m
plate—concentrating 1 lakh sq mFamily type biogas plants 20 lakh plantsTotal
Solar thermal systems/devicesWater heating @Rs 1550/m2 9.50 million sq mDrying @Rs 1250/m2 0. 25 million sq mOther (steam generation) 0. 25 million sq m
@Rs 2500/m2 –Instl./prog. support @Rs 200/m2) 10 nosMunicipal corporations—incentive
Energy-efficient buildings 50 lakh sq m floor areaAkshay Urja Shops 2000 nosCities with RPOs 100 nos
Total
Note: RPOs = Regional Project Offices.Source: Working Group on New and Renewable Energy.

Energy 389
as mandated feed-in laws or differential tariffs for gridinteractive power.
10.228 Alternatively grid interactive renewable powerwill be promoted by mandating a renewable portfoliostandard for all power distribution companies andproviding a subsidy for each unit of renewable elec-tricity purchased. The utilities would be free to meettheir requirement by purchasing certificates fromother utilities that may have a surplus of renewableelectricity in their portfolios. Many State ElectricityRegulators have stipulated RPS as required by theElectricity Act 2003.
10.229 To eliminate subsidy for other renewablesystem for rural, urban, industrial, and commercialapplications, instead a large prize may be offered to onewho sells a lakh or a million units first (for outputssold directly to households), for example, solar waterheaters, biogas plants, solar lighting systems, etc. Thiswill promote competition, innovation, and consumerrequirement oriented development.
10.230 To facilitate biofuels that require action bymany different actors such as producer, processor, dis-tributor, and consumers, a well-defined policy that pro-vides incentives and leads to a competitive industry isneeded. Also the policy has to be incentive compatiblefor all actors in the chain. With these in mind, thenational biofuel policy has to be finalized.
10.231 To increase availability of finance for new andrenewable energy, IREDA is to be restructured by broadbasing its equity structure. IREDA needs low costfunds. It should be permitted to issue Capital GainsBonds similar to those issued by REC and NHAI tothe tune of Rs 300–400 crore per year during theEleventh Plan. IREDA’s role in financing renewableenergy program-mes is to be enhanced.
R&D IN THE ENERGY SECTOR10.232 R&D in energy sector is critical to augmentour resources, meet our long-term needs, promoteefficiency, attain energy independence, enhance ourenergy security, and ensure harmony with the environ-ment. Energy R&D has not kept pace with the devel-opment of the energy sector in the country. There is a
need to substantially augment the resources for en-ergy R&D and to allocate these resources strategically.
10.233 The report of the EC on Integrated EnergyPolicy has recommended setting up of a NationalEnergy Fund (NEF [R&D]) for supporting studieson a regular basis in a number of institutions. The stud-ies should be commissioned by NEF (R&D) fromexperienced and qualified individuals. The importantareas are research and analysis for energy policy lead-ing to outlining of technology road maps; energy policymodelling; launching of technology missions for de-veloping near-commercial technologies and rollingout new technologies in a time bound manner; co-ordinated R&D in all stages of the innovation chain,etc. It is further recommended that each company inthe field of energy should be mandated to spend atleast 0.4% of its turnover on R&D.
10.234 Keeping the need in mind, a separate workinggroup on R&D for the energy sector was set up for theformulation of the Eleventh Five Year Plan whichsupported the creation of NEF (R&D). In addition tothe projected needs of Atomic Energy Commission andsome R&D activities already being undertaken by in-dividual energy ministries, the Working Group hasidentified areas which need support through NEF(R&D) in the Eleventh Plan (Table 10.33). The NEF(R&D) would be governed by an independent boardwith representatives from Department of Scienceand Technology, Planning Commission, and energyministries. The government would finance the funddirectly and through fiscal incentives. The fundwould be used for supporting inter-institutional andinter-ministerial/inter-departmental research andfor setting-up of Centres of Excellence in Universities/National Laboratories/Mission-oriented Agencies inthe areas of identified energy technology.
10.235 Technology missions are the most appropri-ate mechanism, particularly when it requires co-ordinated action in a number of different areas,involving different ministries/departments, industry,academia, India’s R&D infrastructure of laboratoriesand research institutions, and the private sector. Thefollowing National Technology Missions may be takenup in the Eleventh Plan. The list however excludes the

390 Eleventh Five Year Plan
initiative likely to be taken up by the Atomic EnergyCommission.
• In situ coal gasification.• IGCC.• Carbon capture and sequestration.• Bio-energy.• Solar energy/technologically important crystals.
• Increased/enhanced oil and gas recovery and recov-ery of hydrocarbons from abandoned and isolatedfields.
• Fuel-efficient vehicles. The automotive industryshould be asked to achieve higher fuel efficiency stan-dards.
• Combustion research initiatives.• Development and production of new materials.
TABLE 10.33Proposed R&D Initiatives in the Eleventh Plan
(in Rs Crore)
S. No. Items Amount Projected
11. Development and production of new material 400.0012. R&D in biofuels 200.0013. Combustion research initiative 200.0014. Energy R&D in Indian railways 45.0015. Hydrogen as a source of clean energy 350.0016. Advanced coal technologies
(i) Setting up of first 100 MWe IGCC demonstration plant 350.00(ii) In situ coal gasification of coal and lignite 30.00(iii) Coal to oil conversion 200.00(iv) Coal bed methane 35.00(v) Carbon capture and storage (incl. climate change issues) 125.00
17. Ultra super critical technologies 30.0018. Energy storage systems 400.0019. Futuristic energy sources
(i) Gas hydrates 350.00(ii) Oil shale 15.00
10. Energy efficiency 205.0011. Technologically important crystals—facility to manufacture
polysilicon for production of single crystals of silicon 1200.0012. Light-emitting diodes (LEDs)—a viable alternative to fluorescent lighting 100013. EVs and hybrid electric vehicles—viable alternate propulsion systems 175
Grand Total 5310.00
Source: Working Group on Energy R&D.

AN
NE
XU
RE
10.
1C
oal
Dem
and/
Sup
ply—
Sec
tor-
wis
e B
reak
-up
(Mill
ion
Ton
nes
)
Sect
or20
01–0
220
02–0
320
03–0
420
04–0
520
05–0
620
06–0
720
07–0
820
11–1
2(A
ctu
al)
(Act
ual
)(A
ctu
al)
(Act
ual
)(A
ctu
al)
(Pro
v.)
(BE
)(P
roj.)
I.C
okin
g C
oal
1.St
eel a
nd
coke
ries
(in
dige
nou
s)18
.73
17.6
616
.68
17.5
116
.99
17.5
118
.00
27.6
5
2.C
okin
g co
al i
mp
ort
11.1
112
.95
12.9
916
.93
17.1
122
.00
20.0
040
.85
Subt
otal
29.8
430
.61
29.6
734
.43
34.1
039
.51
38.0
068
.50
II.
Non
Cok
ing
Coa
l
3.Po
wer
(u
tilit
ies)
RC
249.
2325
5.47
268.
2128
5.55
299.
7630
7.03
330.
0048
3.00
MID
(1.8
6)(1
.71)
(1.4
4)(1
.48)
(1.4
8)
4.Po
wer
(ca
ptiv
e)R
C19
.22
19.5
518
.19
27.1
026
.58
24.6
533
.60
57.0
6
MID
(1.3
6)(1
.53)
(1.7
4)(1
.71)
(1.7
1)
5.C
emen
t (i
ncl
. CP
Ps)
15.2
216
.37
16.6
418
.33
18.7
118
.92
26.8
031
.90
6.Sp
onge
iro
n/C
DI
4.40
6.17
7.59
10.9
914
.73
13.0
715
.10
28.9
6
7.B
RK
/oth
ers/
exp
ort/
SSF/
RC
33.5
835
.19
40.6
232
.39
39.6
460
.33
49.0
061
.58
NLW
cok
e/lo
co/c
olly
.con
sM
ID(0
.28)
(0.0
1)(0
.00)
(0.0
0)(0
.00)
Subt
otal
RC
321.
6533
2.74
351.
2437
4.35
399.
4142
4.00
454.
5066
2.50
MID
(3.5
0)(3
.25)
(3.1
8)(3
.19)
(3.1
9)
Tota
l raw
coa
l35
1.49
363.
3538
0.91
408.
7943
3.51
463.
5149
2.50
731.
00
Mid
dlin
g(3
.50)
(3.2
5)(3
.18)
(3.1
9)(3
.19)
Not
e: c
olly
.con
s =
Col
liery
con
sum
ptio
n.
Sour
ce: C
oal D
irec
tory
of
Indi
a/P
lan
nin
g C
omm
issi
on.
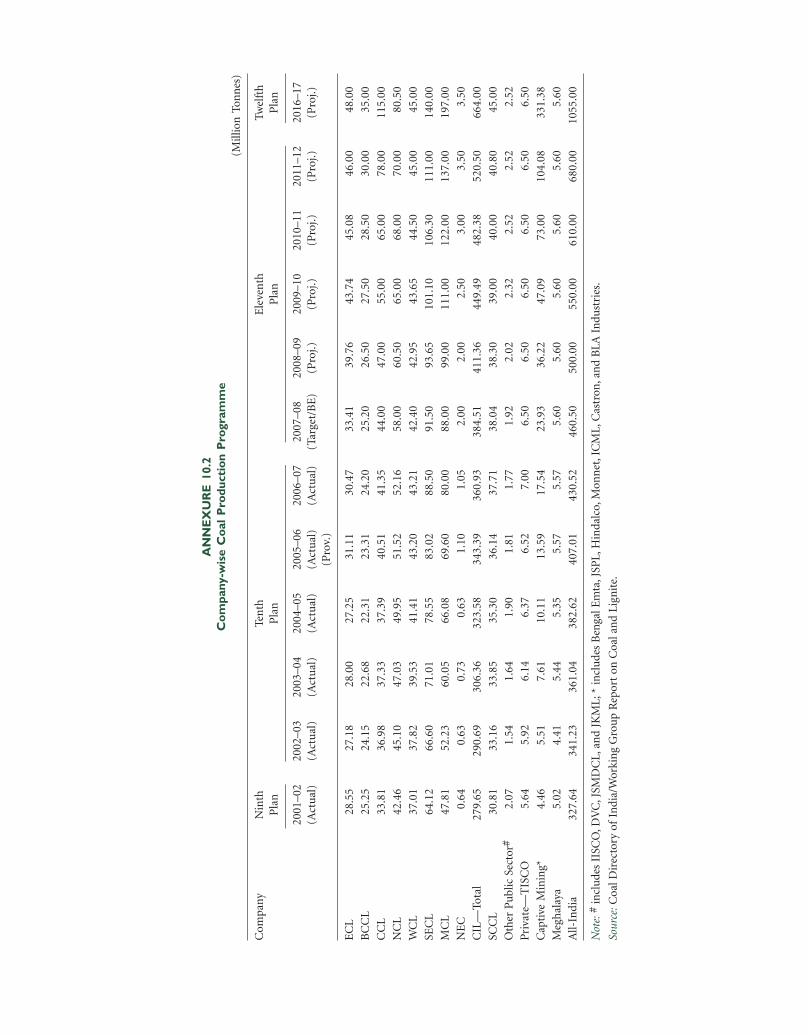
AN
NE
XU
RE
10.
2C
ompa
ny-w
ise
Coa
l P
rodu
ctio
n P
rogr
amm
e(M
illio
n T
onn
es)
Com
pan
yN
inth
Ten
thE
leve
nth
Twel
fth
Pla
nP
lan
Pla
nP
lan
2001
–02
2002
–03
2003
–04
2004
–05
2005
–06
2006
–07
2007
–08
2008
–09
2009
–10
2010
–11
2011
–12
2016
–17
(Act
ual
)(A
ctu
al)
(Act
ual
)(A
ctu
al)
(Act
ual
)(A
ctu
al)
(Tar
get/
BE
)(P
roj.)
(Pro
j.)(P
roj.)
(Pro
j.)(P
roj.)
(Pro
v.)
EC
L28
.55
27.1
828
.00
27.2
531
.11
30.4
733
.41
39.7
643
.74
45.0
846
.00
48.0
0
BC
CL
25.2
524
.15
22.6
822
.31
23.3
124
.20
25.2
026
.50
27.5
028
.50
30.0
035
.00
CC
L33
.81
36.9
837
.33
37.3
940
.51
41.3
544
.00
47.0
055
.00
65.0
078
.00
115.
00
NC
L42
.46
45.1
047
.03
49.9
551
.52
52.1
658
.00
60.5
065
.00
68.0
070
.00
80.5
0
WC
L37
.01
37.8
239
.53
41.4
143
.20
43.2
142
.40
42.9
543
.65
44.5
045
.00
45.0
0
SEC
L64
.12
66.6
071
.01
78.5
583
.02
88.5
091
.50
93.6
510
1.10
106.
3011
1.00
140.
00
MC
L47
.81
52.2
360
.05
66.0
869
.60
80.0
088
.00
99.0
011
1.00
122.
0013
7.00
197.
00
NE
C0.
640.
630.
730.
631.
101.
052.
002.
002.
503.
003.
503.
50
CIL
—To
tal
279.
6529
0.69
306.
3632
3.58
343.
3936
0.93
384.
5141
1.36
449.
4948
2.38
520.
5066
4.00
SCC
L30
.81
33.1
633
.85
35.3
036
.14
37.7
138
.04
38.3
039
.00
40.0
040
.80
45.0
0
Oth
er P
ublic
Sec
tor#
2.07
1.54
1.64
1.90
1.81
1.77
1.92
2.02
2.32
2.52
2.52
2.52
Pri
vate
—T
ISC
O5.
645.
926.
146.
376.
527.
006.
506.
506.
506.
506.
506.
50
Cap
tive
Min
ing*
4.46
5.51
7.61
10.1
113
.59
17.5
423
.93
36.2
247
.09
73.0
010
4.08
331.
38
Meg
hal
aya
5.02
4.41
5.44
5.35
5.57
5.57
5.60
5.60
5.60
5.60
5.60
5.60
All-
Indi
a32
7.64
341.
2336
1.04
382.
6240
7.01
430.
5246
0.50
500.
0055
0.00
610.
0068
0.00
1055
.00
Not
e: #
incl
udes
IIS
CO
, DV
C, J
SMD
CL,
an
d JK
ML;
* in
clud
es B
enga
l Em
ta, J
SPL,
Hin
dalc
o, M
onn
et, I
CM
L, C
astr
on, a
nd
BLA
In
dust
ries
.
Sour
ce: C
oal D
irec
tory
of
Indi
a/W
orki
ng
Gro
up
Rep
ort
on C
oal a
nd
Lign
ite.

Energy 393
ANNEXURE 10.3Calorific Values, Units and Conversion Factors
Calorific Value of Various Fuels
S. No. Name of Fuel Unit Calorific Value (kilocalories)
1. Biogas m3 4713
2. Kerosene kg 10638
3. Firewood kg 4500
4. Cowdung cakes kg 2100
5. Coal kg 4000
6. Lignite kg 2865
7. Charcoal kg 6930
8. Soft coke kg 6292
9. Oil kg 10000
10. LPG kg 11300
11. Furnace oil kg 9041
12. Coal gas m3 4004
13. Natural gas m3 9000
14. Electricity kWh 860
Conversion Factors
1 kilocalorie 3.96832 btu, 4186.8 joules
1 kilowatt hour 3412.14 btu, 3.6 × 10⁶ joules
1 btu 0.252 kilo cal, 1.055 kilo joules
1 US Gallon 0.833 Imperial Gallon, 0.134 cft, 0.00378 cum
1 Imperial Gallon 1.2009 US Gallon, 0.1605 cft, 0.0045 cum
1 Cubic Metres 264.172 US Gallons, 219.969 Imperial Gallons, 35.3147 cft,
1 Cubic Feet 7.4805 US Gallons, 6.2288 Imperial Gallons, 0.0283 cum
1 BkWh hydro or wind electricity 0.086 Mtoe#
1 BkWh nuclear electricity 0.261 Mtoe
1 million tonne of coal 0.41 Mtoe
1 million tonne of lignite 0.2865 Mtoe
1 billion cubic meter of gas 0.9 Mtoe
1 million tonne of LNG 1.23 Mtoe
1 million tonne of fuel wood 0.45 Mtoe
1 million tonne of dung cake 0.21 Mtoe
Note: # Mtoe conversion factors are as per International Energy Agency (IEA) Practice.
Abbreviations
Unit Name Unit Name
bcm Billion Cubic Metre MMBtu Million British Thermal Unit
BkWh Billion Kilowatt Hours MMSCMD Million Standard Cubic Meters per Day
Bt Billion Tonne Mt Million Tonnes
btu British Thermal Unit
GWe Gigawatt Electrical Mtoe Million Tonne of Oil Equivalent
GW-Yr Gigawatt Year MVA Million Volt Amperes
kcal Kilocalorie MW Megawatt
kWh Kilowatt Hour MWe Megawatt Electrical
TCF Trillion Cubic Feet
11Urban Infrastructure, Housing, Basic Servicesand Poverty Alleviation
urbanized compared to many countries of Asia, viz.,China (32%), Indonesia (37%), Japan (78%), SouthKorea (83%), and Pakistan (35%).
• There is a continued concentration of the urbanpopulation in large cities and existing city agglom-erations (Class I cities with population over onelakh) account for 68.9% of the urban population andthis proportion has been growing. The growth ofrural settlements which are acquiring urban charac-teristic is very slow and there is reluctance on the partof the States to notify the rural settlements as a town.
• There are large variations in the spatial patterns ofurbanization across the States and cities.
• The pattern of population concentration in largecities reflects spatial polarization of the employmentopportunities.
11.3 This phenomenon has led to tremendous pres-sure on civic infrastructure systems, water supply,sewerage and drainage, uncollected solid waste,parks and open spaces, transport, etc. It has also led todeterioration in the quality of city environments.In several cities, the problems of traffic congestion,pollution, poverty, inadequate housing, crime, andsocial unrest are assuming alarming proportions.
11.4 The number of urban agglomerations and townshas increased from 3768 in 1991 to 5161 in 2001. Fur-ther, this urbanization is characterized by incomplete
OVERVIEW
URBAN SCENARIO IN THE GLOBAL CONTEXT11.1 Urbanization is a key indicator of economicdevelopment and should be seen as a positive factorfor overall development. Also, as an economy grows,its towns and cities expand in size and volume andthe contribution of the urban sector to the nationaleconomy increases. For instance, the contribution ofurban sector to India’s GDP has increased from 29%in 1950–51 to 47% in 1980–81. The urban sector pres-ently contributes about 62%–63% of the GDP and thisis expected to increase to 75% by 2021 (see Box 11.1).
Box 11.1Vision
Indian cities will be the locus and engine of economicgrowth over the next two decades, and the realization ofan ambitious goal of 9%–10% growth in GDP dependsfundamentally on making Indian cities much morelivable, inclusive, bankable, and competitive.
11.2 The trends of urbanization in India in the recentdecades indicate the following key features:
• The degree of urbanization in India is one of thelowest in the world. With about 27.8% of the totalpopulation living in the urban areas, India is less
Urban Infrastructure, Housing, Basic Services, and Poverty Alleviation 395
devolution of functions to the elected bodies, lack ofadequate financial resources, unwillingness to progresstowards municipal autonomy, adherence to outdatedmethods in property taxation, hesitation in levy of usercharges, unsatisfactory role of parastatals in the provi-sion of water supply and sanitation services. Also, thegovernance requirements under the 74th ConstitutionAmendment Act (CAA) in respect of the District Plan-ning Committees and Metropolitan Planning Commit-tees (MPCs) have not been met in a number of States.
11.5 The extent and magnitude of the urban popula-tion calls for extra efforts by city planners and manag-ers to cope up with the ever-growing strain on theurban infrastructure. Special attention is needed formanagement and governance of urban areas which areat present fragmented between different State-levelagencies and urban local bodies (ULBs), with lack ofco-ordination.
11.6 The policymakers need to focus on new waysto achieve the results and on different benchmarksthat capture efficiency, effectiveness, quality, andsustainability in governance, service delivery, inter-governmental municipal finances, and social de-velopment. Some of the strategic interventions aresummarized in Box 11.2.
NATIONAL URBANIZATION POLICY11.7 The time is ripe to formulate a long-term NationalUrbanization Policy indicating the emerging patternof urbanization and measures to channelize future ur-ban growth in an equitable and sustainable manner. Itshould encompass the changing economic scenario,reform agenda of Jawaharlal Nehru National UrbanRenewal Mission (JNNURM), and the role of ULBs inthe era of globalization. The objectives of balanced and
sustainable development are to be achieved by reduc-ing spatial disparities.
REGIONAL DEVELOPMENT PLANS11.8 The regional development plans at the State levelneed to be formulated as a broad policy and visiondocument for the development of urban and ruralgrowth centres in an integrated manner.
ROLE OF GOVERNMENT AS A FACILITATOR11.9 The GoI should play the role of a facilitator asis being done through JNNURM and various otherreform initiatives such as property tax reforms, muni-cipal accounting reforms, model municipal law,guidelines on private sector participation, etc. It shouldalso come up with a policy framework for regulatorsin the urban sector. The State Governments shouldplay a similar role to facilitate the ULBs in orderto provide an enabling environment for the ULBs tofunction as effective units of self-governance at thelocal level. Urban poverty alleviation, slum up grada-tion, and basic services to the urban poor will continueto remain as functions belonging to the public domain.These functions are redistributive in nature and arebest handled through redistributive taxes at the con-trol of Central and State Governments. Thus, Central–State–ULB partnerships will be necessary as potentiallyeffective ways to address the emerging issues of urbandevelopment.
PRIVATE SECTOR PARTICIPATION11.10 Private sector participation in the water supplyand sanitation sector could not make significantprogress till now. There is substantial need and poten-tial for the same in the Eleventh Plan. However, with-out aiming at the full cost recovery, private sectorparticipation cannot be a successful proposition.
Box 11.2Strategy of Urban Development
• Strengthening urban local bodies through capacity building and better financial management.• Increasing the efficiency and productivity of cities by deregulation and development of land.• Dismantling public sector monopoly over urban infrastructure and creating conducive atmosphere for the private sector
to invest.• Establishing autonomous regulatory framework to oversee the functioning of the public and private sector.• Reducing incidence of poverty.• Using technology and innovation in a big way.
396 Eleventh Five Year Plan
THE CONSTRAINTS11.11 The transformation of the Indian cities facesseveral structural constraints. Foremost, the currenturban development model starves cities of financing.Also, weak or outdated urban management practices—inappropriate planning systems, unsustainable ser-vice delivery models, and lack of focus on the urbanpoor—negate the benefits of agglomeration economiesin Indian cities by distorting land and housing mar-kets, rendering cities non-creditworthy, and leavingthem with expensive yet poorly functioning urbanservices.
11.12 The current urban management techniques arealso out-moded. The Master Plan concept—as cur-rently practised in India—is not widely used elsewhere.Besides, it is not well suited to rapidly growing cities andmulti-jurisdiction urban agglomerations. The MasterPlan concept has also not been useful in addressingIndia’s large and widely spread slums. By locking-in thesupply of buildable land and space, the Master Plan,inter alia, inhibits the development of housing marketsand contributes to the proliferation of slums. Therefore,there is an urgent need to develop new management andservice delivery approaches across the board.
REVIEW OF SCHEMES OF THE TENTH PLAN
JAWAHARLAL NEHRU NATIONAL URBAN RENEWALMISSION (JNNURM)11.13 Consistent with the policies of the presentgovernment, the Prime Minister of India launchedJNNURM on 3 December 2005 to give focused atten-tion to integrated development of urban infrastruc-ture and services in select 63 cities with emphasis onprovision of basic services to the urban poor, includ-ing housing, water supply, sanitation, road network,urban transport, development of inner (old) cityareas, etc. A provision of Rs 50000 crore has been madeas reform-linked Central assistance over the Missionperiod of seven years beginning from 2005–06. Theprovision of Central assistance is linked to the imple-mentation of certain mandatory as well as optionalreforms at the State and ULB/parastatal levels duringthe Mission period. Against the allocation of Rs 4900crore for 2006–07, an amount of Rs 3906 crore wasreleased. In 2007–08, an amount of Rs 5500 crore has
been allocated. Subsequently, additional Rs 500 crorewas allocated in ‘Plan B’.
11.14 In its initial period, the Mission has focused onfinding good urban infrastructure investments that canultimately be undertaken on a self-sustaining basis.Now that this search process has been put in place, amore systematic perspective needs to be adopted. Ithas to be realized that the ability to tap India’s increas-ingly sophisticated financial markets will remainseverely circumscribed till the local bodies becomecredible and accountable.
URBAN REFORM INCENTIVE FUND (URIF)11.15 The Tenth Plan underlined the need for broad-based reforms to overcome the impediments of urbangrowth and stipulated that conformity to the reformagenda through the URIF will be made obligatory forthe Central assistance. URIF called upon the States torepeal the Urban Land (Ceilings and Regulation) Act1976, reform Rent Control Acts, strengthen propertytax system, reduce stamp duty, introduce doubleentry accounting system, and revise user charges tocover operations and maintenance costs. An alloca-tion of Rs 300 crore was made under URIF for alloca-tion to different States for implementing the reformagenda. The scheme was later subsumed in JNNURM.
MEGA CITY11.16 A CSS for infrastructure development in themega cities was introduced in 1993–94 to cover a widerange of projects on water supply and sewerage, roadsand bridges, city transport, solid waste management,etc. The Central share released during Tenth Planamounts to Rs 908.69 crore (anticipated expenditure)against an allocation of Rs 1050 crore. The scheme hassince been subsumed in JNNURM.
INTEGRATED DEVELOPMENT OF SMALL ANDMEDIUM TOWNS (IDSMT)11.17 IDSMT was launched in 1979–80 to improvethe economic and physical infrastructure and to pro-vide essential facilities and services in small and me-dium towns. Since inception, upto 31 March 2007, atotal of 1854 towns, out of 5092 small and mediumtowns (2001 Census), were covered under the scheme.Out of an approved outlay of Rs 1304.65 crore for the
Urban Infrastructure, Housing, Basic Services, and Poverty Alleviation 397
Tenth Plan, the anticipated expenditure is Rs 566.43crore (43.4%). As the performance of the scheme wasnot satisfactory, an evaluation was carried out in 2002which showed that the scheme suffered from (i) lackof capacity for implementation, (ii) non-availabilityof matching States share, and (iii) non-availability ofunencumbered land for the projects. The scheme hassince been subsumed in JNNURM as Urban Infra-structure Development Scheme for Small and MediumTowns (UIDSSMT).
ACCELERATED URBAN WATER SUPPLY PROGRAMME(AUWSP)11.18 AUWSP was launched in March 1994 to pro-vide safe and adequate water supply to towns havingpopulation less than 20000 (as per 1991 Census), toimprove environment and quality of life, and to bringabout better socio-economic conditions to sustain theeconomy. Since its inception, 1244 towns have beencovered and 639 projects have been completed at anestimated cost of Rs 1822.38 crore, including Centralfunds of Rs 828.06 crore. Against the approved outlayof Rs 900 crore for the Tenth Plan, an expenditure ofRs 406.50 crore was incurred which is about 45.2%.Concurrent evaluation of the scheme was made inNovember 2003 for 62 towns in 24 States. Majorrecommendations of the study included handing overof the scheme to ULBs, timely release of State funds,periodic review of tariff, and training to field engineersfor effective implementation. The scheme has sincebeen subsumed under JNNURM. However, forcompletion of ongoing projects, Rs 32.50 crore hasbeen provided for 2007–08.
PILOT PROJECT ON SOLID WASTE MANAGEMENTNEAR AIRPORT IN FEW SELECTED CITIES11.19 A Central sector scheme on solid waste manage-ment in 10 selected air field towns was approved in 2003as 100% grant from the GoI towards capital cost andwas to be completed in three years. Subsequent to thecompletion of the project, the scheme was to be handedover to the concerned ULBs for day-to-day O&M. Whileeight projects, viz., Sirsa, Jodhpur, Pune, Gwalior,Tezpur, Adampur, Dindigul, and Ambala are being ex-ecuted by National Building Construction Corporation(NBCC), projects for Hindon and Bareilly are beingexecuted by Uttar Pradesh Jal Nigam. The approved cost
of the project is Rs 99.34 crore. The projects are undervarious stages of execution.
NEW INITIATIVES FOR THE ELEVENTH PLAN
POOLED FINANCE DEVELOPMENT FUND (PFDF)11.20 The government had approved on 29 September2006 a proposal for setting up of a PFDF to providecredit enhancement to the ULBs to access marketborrowings based on their credit worthiness throughState-level Pooled Finance mechanism. The broadobjectives of PFDF are:
• Facilitate implementation of bankable urban in-frastructure projects through appropriate capacity-building measures and financial structuring ofprojects.
• Facilitate the ULBs to access capital and financialmarkets for investment in critical urban infrastruc-ture by providing credit enhancement grants toState-pooled Finance Entities for accessing capitalmarkets through Pooled Financing Bonds on be-half of one or more identified ULBs for investmentin the urban infrastructure projects.
• Reduce the cost of borrowing to local bodies withappropriate credit enhancement measures andthrough restructuring of existing costly debts.
• Facilitate development of Municipal Bond Market.
11.21 All State/UT governments have been requestedto take necessary preparatory action for operationaliza-tion of the scheme to avail benefit from this financialyear. In this connection, to sensitize the State Govern-ments and all stakeholders for implementation ofthe scheme in a time-bound manner, a NationalWorkshop was organized in Chennai on 20 Novem-ber 2006 and the scheme was formally launched.During 2006–07, Rs 50.00 crore has been providedfor the scheme. An amount of Rs 100 crore has beenprovided to the Ministry of Urban Development for2007–08 for PFDF. For the Eleventh Plan period, a pro-vision of Rs 2500 crore has been made.
NATIONAL URBAN INFRASTRUCTURE FUND (NUIF)11.22 The NUIF is proposed to be set up as a trust toprovide source of funding for bankable projects/schemes pertaining to the ULBs. The commercial
398 Eleventh Five Year Plan
banks are hesitant to lend to ULBs due to apparentlack of capacity of the ULBs to meet their debt serviceobligations on the one hand and lack of expertiseamongst financial institutions to lend for viableurban infrastructure projects on the other. NUIF willserve as an SPV that will create necessary comfort levelamongst financial institutions with respect to repay-ments by avoiding direct exposure of commercialbanks to the ULBs. The process of consultation forsetting up of NUIF is presently in the advanced stage.
DEVELOPMENT OF SATELLITE CITIES/COUNTERMAGNET CITIES11.23 Metros and mega cities, which have become thecentre of trade and commerce, have to cope with theirown problems along with unabated in-migration fromsmall and medium towns and vast rural hinterland.These have to be planned beyond the municipal limitsand due importance may be given to integrated trans-port and communication. The other settlementslocated in the vicinity of the mother city are to bedeveloped as satellite/counter magnets to reduce andto redistribute the population and population influx.To cope with the above problem, the government hasproposed a new scheme for development of satellitetowns/counter magnet cities. This will help in thedevelopment of metropolitan regions. Token provisionfor the scheme has been made in the Budget of theMinistry of Urban Development for 2007–08.
E-GOVERNANCE IN MUNICIPALITIES11.24 The key objectives of the Mission are to intro-duce e-governance in the municipalities to providesingle window services to the citizens, to increaseefficiency and productivity of the ULBs, to providetimely and reliable management information, etc.
11.25 The scheme envisages to cover all ULBs in ClassI cities (423 in total having population of one lakhor more) during 2007–08 to 2011–12. A total of 35cities with million plus population are proposed tobe covered as part of JNNURM. However, a new CSSScheme for other cities and towns other than 35 citieswould wait for the present till the implementation iswatched in 35 cities as a part of JNNURM. Eight ser-vices relating to birth and death certificates, property
tax, building plan approval, health programme, solidwaste management, accounting system, etc., will becovered under the programme.
JNNURM—AN INSTRUMENT OF CHANGE11.26 Cities and towns have a vital role in India’s socio-economic transformation. The cities in India are serv-ing as a nodal point for innovation and are playing avital role in the Global Market. Most cities and townsare severely stressed in terms of infrastructure and ser-vice availability. In 2001, 50.3% of the urban house-holds had no piped water within their premises and44% of them were devoid of sanitation facilities. About25.7% of country’s urban population continues to bebelow the poverty line in 2004–05. According to the2001 Census, 14.12% of the urban population livesin slums with a significant proportion of it withoutaccess to basic services.
OVERVIEW OF THE MISSION11.27 JNNURM rests on the postulate that cities makea meaningful contribution to India’s economic growthand poverty reduction. This programme seeks to fulfilthe Millennium Development Goals, and is envisagedto operate in a Mission mode by facilitating invest-ments in the urban sector. It seeks to incentivize policyand institutional reforms, leading to sustainable socio-economic growth, service delivery, and improvedgovernance in the Mission cities. It also aims at devel-oping appropriate enabling frameworks to enhance thecreditworthiness of the municipal bodies and integratethe poor with the service delivery systems.
STRATEGY OF THE MISSION11.28 The Mission seeks to achieve the objective ofintegrated development of cities, for which the citiesare required to formulate a City Development Plan(CDP), bringing out long-term vision for the citiesand support their efforts through funding of projectproposals. A CDP is anchored on the goal of JNNURMin creating economically productive, efficient, equi-table, and responsive cities. The essential require-ment of the Mission is implementation of urbanreforms, within the Mission period. On the basis ofthe satisfactory completion of the above tasks, fundingsupport is provided in the form of ACA, ranging

Urban Infrastructure, Housing, Basic Services, and Poverty Alleviation 399
from 35% to 90% of the project cost, based on thecity category. The Mission also aims to leverage andincorporate private sector efficiencies in develop-ment, management, implementation, and financingof projects, through PPP arrangements, whereverappropriate.
EXPECTED OUTCOMES OF JNNURM• Financially sustainable cities for improved gover-
nance and service delivery.• Universal access to basic services in urban areas.• Transparency and accountability in governance.• Adoption of modern transparent budgeting,
accounting, and financial management systems.
11.29 There is an increased application of e-gover-nance in service delivery and internal operations.
OPERATIONAL ISSUES LINKED TOJNNURM PROCESS11.30 Sustaining momentum of the Mission by con-tinuous engagement with all cities and at the same timeensuring wider ownership has been a major challengewhile operationalizing the Mission.
11.31 The capacity of city-level agencies to absorbthe investment support and delivery on reforms is acritical bottleneck. The Mission needs to calibrateand pace its capacity-building efforts in a manner soas to ensure that all Mission cities are able to reap thebenefits of the programme and meet its stated goalsand objectives.
11.32 Projects hitherto being implemented by city-level agencies have been very small in size comparedto those being taken up under JNNURM. The overallinstitutional capacity and more specifically the projectimplementation capacity is clearly inadequate todeal with such large projects. This calls for immediatelateral expansion of human resources with appropri-ate skills, backed up by good project managementsystems. There is also a shortfall in the contractingcapacity in the private sector. Large/organized sectorplayers in infrastructure industry have not yet seriouslylooked at municipal infrastructure because of uncer-tainty in enabling environment. The project sizes have
been small, with overdependence on the governmentfunding. Poor credibility of implementing agencies isalso one of the concerned areas.
11.33 Successful implementation of reforms withinthe committed timeframe is critical to the success ofthe Mission. The challenge is to facilitate the cities tointernalize the reforms. Simultaneously, the process ofreporting and monitoring progress of reforms needsto be sustained throughout the Mission period. Theexperience of implementation of JNNURM shows thatthe following issues need to be addressed:
• Need for adequate attention to the priority sectors,viz., water supply, sewerage, sanitation, stormwater drainage, etc., in the CDPs prepared underJNNURM. Undue focus is presently given to on-road projects and flyovers.
• Need for focus on recovery of O&M costs andpossibility of involving private sector through thePPP mode in the CDPs.
• Need for synergy between the Ministries of UrbanDevelopment and HUPA in the implementation ofJNNURM. Both the ministries need to work in closeco-ordination and synergy.
• Need to ensure improvement in urban governanceso that the ULBs/parastatal agencies become finan-cially sound. The Central and State agencies mustensure timely implementation of the agenda ofreforms.
• Need to strengthen monitoring mechanism andensuring that milestones for reforms are achievedduring the project period and not extended to theMission period.
11.34 As the programme is in the third year of imple-mentation, the programme needs to be evaluated byan independent agency so as to take timely appropri-ate remedial measures.
MEASURES TO STRENGTHEN JNNURMPROCESSES11.35 Several workshops and seminars have beenorganized at regional and State level, apart from day-to-day interactions to speed up the participation oflow performing States in the Mission.

400 Eleventh Five Year Plan
11.36 The government is organizing a series of work-shops/seminars with the objective of dissemination ofthe Mission objectives among the elected representa-tives and municipal functionaries. These fora have beeninstrumental in enhancing citizen involvement andimproving technical capacities for project preparationand implementation by the ULBs/other city-level agen-cies, in various cities and States. To enhance commu-nity participation in the planning process and invarious aspects of implementing JNNURM, the sub-Mission on urban infrastructure and governance hascreated a Community Participation Fund. This is toenable the citizens to develop a sense of ownershipon community assets and take on responsibilities forcommunity-based projects. To improve communityparticipation in the implementation of the Mission,a Technical Advisory Group has been set up at thenational level, which is to be further supported by simi-lar structures at the State and city levels.
11.37 The Mission is in the process of preparing aframework for capacity-building and up-scaling of allrelated activities in order to bridge the capacity gap inimplementation of projects and reforms. It is propos-ing to conduct a rapid training programme for mu-nicipal functionaries in key areas such as governanceand reforms, DPR preparation, and project prepara-tion. For fulfilling the long-term requirement ofhuman resource challenges in the ULBs, the govern-ment is in the process of establishing a network ofregional institutions across the country, which willaddress training and capacity-building needs for theStates, cities, and other related institutions.
11.38 Strengthening communication channels tofacilitate institutionalization and internalization ofreforms is a key to the success of the Mission. Thegovernment has also appointed independent agenciesfor monitoring the implementation of the reforms. Aquarterly progress reporting system for the cities andStates has been instituted under the Mission. Apartfrom this, an MIS has been developed for monitoringprojects and reforms.
11.39 To address the issues of credibility and finan-cial sustainability of the ULBs, Municipal FinanceImprovement Programme has been launched. A Task
Force constituted under the programme has recom-mended measures to synergize all financial resourcesat city level and improve environment to access finance.As a part of the recommendation, all the ULBs underJNNURM are being rated on the basis of their finan-cial capacities and credit worthiness.
11.40 In order to strengthen the UIDSSMT, StateGovernments have been advised to get the CDPprepared for the cities covered under UIDSSMT as aVision Document. State-level Nodal Agencies (SLNAs)should develop in-house capacity to advise and guidethe ULBs in preparing viable DPRs. The State Gov-ernments should ensure adequate budgetary provi-sions in their Budget to meet State/ULBs’ share asstipulated in the guidelines. For monitoring and imple-mentation of the project and reforms at the local level,a Project Implementation and Monitoring Cell maybe established within the respective ULBs. SLNAs mayprepare a panel of consultants by following a trans-parent procedure for preparation of DPRs.
PREPARATION AND DISSEMINATION OF BESTPRACTICE DOCUMENTS11.41 The best practices under the Mission are beingdisseminated through the websites, workshops, andseminars. Apart from this, the government haslaunched an initiative called Peer Experience andReflective Learning (PEARL) to facilitate networkingamong JNNURM cities to encourage cross learningand knowledge sharing. The cities have organizedthemselves in various groups/networks having simi-lar socio-economic profile. The city networks haveselected a Knowledge Manager for the respectivegroups to anchor partnerships within and outsidethe networks for exchange of best practices in urbangovernance and reforms.
ISSUES FOR FUTURE ACTIONS• Rapid economic growth will inevitably lead to an
increase in urbanization as the cities providelarge economies of agglomeration for individualactivity. The biggest constraint on rapid growth inthe years ahead will be the inadequacy of urbaninfrastructure and its poor quality comparedwith global scenario. We have to strive for equityand inclusiveness in urban infrastructure so as to

Urban Infrastructure, Housing, Basic Services, and Poverty Alleviation 401
ensure that the city-wide infrastructure systems getlinked with service networks in slums and low in-come settlements.
• The main challenge would be to bring aboutplanned urbanization for the country and creationof new growth centres around existing small andmedium towns.
• Urban reforms may be made essential for eligibilityfor assistance under all Urban InfrastructureDevelopments Schemes.
• Safe drinking water supply and sanitation facilitiesare basic needs and are crucial for achieving the goalof ‘Health for All’.
• JNNURM has the potential to transform infrastruc-ture and improve the civic amenities in selectedcities greatly. It, therefore, needs to be implementedwith vigour.
DETAILS OF SCHEMES/PROGRAMMES FORTHE ELEVENTH PLAN
NATIONAL CAPITAL REGION PLANNING BOARD(NCRPB)11.42 The key rationale for constituting an NCRPB in1985 was to reduce the rate of in-migration into theNational Capital as well as to develop the region at alevel comparable to the best in the world. Keepingin view with its objectives, the Board has preparedregional plans, 2001 and 2021, along with complemen-tary functional plans related to the key elements ofinfrastructure.
11.43 In order to implement major thrust areas ofthe regional plans, the Board is also arranging for andoverseeing the financing of selected developmentprojects in NCR through Central grants and contri-bution from the Government of National CapitalTerritory of Delhi, by recycling loan repaymentsand internal accruals. To supplement its resources,the Board has also raised resources from the capitalmarket in the form of bonds in the past.
11.44 The Government of Delhi in its Plan documenthas desired that NCRPB should contribute significantlyin the development process of Delhi by initiating anumber of inter-state projects in the NCR in the areasof power generation, water supply, sanitation, etc.
The projects identified for being financed during theEleventh Plan involve a total cost of Rs 15000 crore.Some of these projects will be taken up in collabora-tion with other stakeholders. Out of the total projectedcost of projects, it is expected that the loan compo-nent will be above Rs 11000 crore.
NATIONAL URBAN INFORMATION SYSTEM (NUIS)11.45 The major objective of the NUIS is to establisha comprehensive information system in the ULBsfor planning, management, and decentralized gover-nance in the context of implementation of the74th CAA. The following activities have been under-taken:
• Mapping at 1:10000 scale from satellite images,1:2000 scale from aerial photos, and 1:1000 scaleutility mapping for 24 towns being taken up bySurvey of India.
• Establishment of NUIS cells in State nodal agencies.• Setting up of National Urban Databank and Indi-
cator in each State nodal agency.• Capacity building among town planners for use of
modern automated methods.
11.46 So far, implementation of NUIS scheme hasbeen slow and, therefore, all stakeholders of the schemeneed to speed up the implementation of the scheme.States and UTs need to release their share for purchaseof hardware and software for the NUIS cells in Statenodal agencies and ULBs. The capacity buildingcomponent under NUIS scheme has trained 160personnel. A total of 22 programmes are proposedto be conducted to train 440 officers during 2007–08.An outlay of Rs 24 crore and Rs 9 crore has beenallocated in the Annual Plan 2006–07 and 2007–08respectively.
COMMONWEALTH GAMES11.47 Delhi Development Authority has been assignedthe task of development of Games Village, Competi-tion Venues for sports events, viz., Table Tennis,Badminton, Squash, Billiards, Snookers, etc. for theforthcoming Commonwealth Games, 2010. To developrequisite facility at sports complexes in Delhi, a provi-sion of Rs 80 crore has been made to the Ministry ofUrban Development for 2007–08.

402 Eleventh Five Year Plan
URBAN BASIC SERVICES
STATUS OF URBAN BASIC SERVICES11.48 The quality of water and its distribution areareas that require special attention in the Eleventh Plan.Table 11.1 gives the status of city/town-wise access todrinking water. Sewerage facilities are almost absentin a large number of unauthorized and resettlementcolonies and slum and squatter settlements. At certainplaces, cost incurred by the poor to fetch water is muchhigher than for valid connection holders. Waste water
and sewage treatment and its reuse for non-potablepurposes and industries are also limited and needattention. Moreover, cattle menace, open defecation,dumping of solid wastes along roadsides, open dump-ing of medical and hazardous wastes, etc., are com-monly sighted (see Box 11.3 below). Concerted effortsare required to fill these gaps and make cities clean,healthy, and livable.
URBAN WATER SUPPLY11.49 To achieve 100% coverage of populationwith urban water supply by the end of the EleventhFive Year Plan, the following steps need to be taken:
• To bring out State Ground Water Legislation basedon the Model Ground Water Legislation broughtout by the CGWB.
• Keeping in view the NWP, the States should formu-late State Water Policy to meet drinking water needs.
• Under JNNURM, special attention should be givento cities and towns which are affected by water con-tamination due to presence of chemicals such as iron
Box 11.3Status of Urban Services
Water Supply
• As per 54th round of NSS, 70% of urban households reported being served by tap and 21% by tubewell or handpump.
• 66% of urban households reported having their principal source of water within their premises while 32% had it within0.2 km.
• 41% had sole access to their principal source of drinking water and 59% were sharing a public source.
Sewerage
• 54th round of NSS reported 26% of households having no latrines, 35% using septic tank, and 22% using seweragesystem.
• In urban areas sewerage connections varied from 48% to 70%.• According to Central Pollution Control Board, the waste water generated in 300 Class I cities is about 15800 million litres
per day while the treatment facilities exist for hardly 3750 million litres per day.
Solid Waste
• It is estimated that about 115000 metric tonnes of municipal solid waste is generated daily in the country.• Per capita waste generation in cities varies between 0.2–0.6 kg per day and it is increasing by 1.3% per annum. With the
growth of urban population, the increase in solid waste is estimated at 5%.• The solid waste generated by the million plus cities varies from 1200 metric tpd in cities like Ahmedabad and Pune to a
maximum of 5000–5500 metric tpd in cities like Delhi and Mumbai.• The per capita solid waste generation varies from 300 gm in Bangalore to 500–550 gm in Mumbai and Delhi.• Out of total waste generated in the million plus cities, hardly 30% is treated before disposal.
TABLE 11.1City/Town-wise Average Access to Drinking Water
City/Towns (Population) Average Access toDrinking Water
(%)
Class I cities (100000 and above) 73
Class II cities (50000–99999) 63
Class III cities (20000–49999) 61
Other cities/towns (<20000) 58
Source: Ministry of Urban Development, GoI.

Urban Infrastructure, Housing, Basic Services, and Poverty Alleviation 403
and fluoride. Water Quality Testing Laboratoriesmay be set up in all cities and towns and existinglabs be strengthened to check water-borne diseases.
• Suitable strategy should be evolved by the States/ULBs for meeting O&M costs. Metering of watermay be made mandatory for generating sufficientrevenues. Telescopic water tariff/user charges shouldbe formulated and levied to discourage excessive useof water.
• Need to check the leakages and unaccounted water,particularly in cities where it is as high as 50%.Such losses should be minimized or eliminatedthrough intensive leak detection and rectificationprogramme.
• The State Governments/ULBs should take upreform measures under JNNURM for water andenergy audit, reuse and recycling, levy of realisticuser charges, efficient water use and its equitabledistribution, rain water harvesting, commercialaccounting systems, consumer orientation, costrecovery, artificial recharge of groundwater, etc.
• To meet the requirement of funds, efforts shouldbe made to step up the quantum of funds throughinstitutional financing, foreign direct investment,assistance from bilateral and multi-lateral agencies,newly launched Pooled Finance DevelopmentScheme, tax-free municipal bonds, PPPs, Memberof Parliament Local Area Development Programme(MPLAD) funds, etc.
MANAGEMENT OF MUNICIPAL SOLID WASTE11.50 On an average, the collection efficiency of solidwaste ranges between 70% and 90% in metro cities,whereas in several smaller cities it is below 50%. TheULBs spend Rs 500–1500 per tonne on solid wastecollection, transportation, treatment, and disposal.During the Eleventh Five Year Plan, emphasis wouldbe laid on scientific and safe disposal of waste. Wasterecycle, reuse, resource recovery, adoption of advancedtechnological measures for effective and economicaldisposal will have to be followed vigorously.
11.51 Private parties have shown encouraging re-sponse and they need to be increasingly involved. Withthe application of modern technology, the waste canbe converted into profitable products such as organicpellets, construction material, etc. To deal with the solid
waste management the States should encourage thePPP mode projects.
11.52 With rapid industrialization, growth of servicessector, and rise in incomes, the rate of waste genera-tion has gone up manifold. The following steps needto be taken for its management:
• Cities and towns should be provided with appro-priate solid waste management facilities withemphasis on use of low-energy consuming tech-nologies for processing and treatment of munici-pal solid waste.
• Compulsory production of compost from solidwaste and application of this organic manurein agriculture and horticulture to improve soilfertility.
• Implementation of the recommendations ofReport of the Inter-Ministerial Task Force on the‘Integrated Plant Nutrient Management Using CityCompost’ in managing the city garbage in asustainable manner.
• Segregation and storage of waste, door-to-doorcollection, and transportation along with appropri-ate plant design should be enforced as per Munici-pal Solid Waste Management and Handling Rules,2000. NGOs should be encouraged to provide orga-nizational support and identity to the ragpickers,who play an important role in recycling of the waste.
• Adequate land should be earmarked/allotted atthe planning stage itself for setting up of sanitaryland fills, compost plants, and other processing unitsincluding provision for future expansion.
SEWERAGE, LOW-COST SANITATION,STORM WATER DRAINAGE11.53 About 63% of the urban population has accessto sewerage and sanitation facilities as on 31 March2004. This includes both underground as well as sani-tation through septic tanks. The access to undergroundsewerage facilities is very low, that is below 30% inmany States, viz., Rajasthan, Orissa, Chhattisgarh,Madhya Pradesh, Andhra Pradesh, and West Bengal.According to the MTA of the Tenth Five Year Plan,nearly 46% of urban households have water toilets,but only 36% of the urban households are connectedto the public sewerage system.

404 Eleventh Five Year Plan
11.54 Underground network of sewerage has devel-oped to a considerable extent in urbanized States wherecities have developed in a planned manner, viz., Delhi,Chandigarh, Greater Noida, etc. However, within thecities, large number of unauthorized colonies, resettle-ment colonies, slums, and squatter settlements areoften deprived of underground sewerage facilities.
11.55 To achieve 100% population coverage forsewerage, sewage treatment, and low-cost sanitationfacilities in urban areas during the Eleventh Plan, thefollowing steps need to be taken:
• Install more plants to treat, recycle, and reuse sewage.• Industrial and commercial establishments must
reuse and recycle treated sewage to reduce freshwater demand.
• The ULBs should amend their by-laws to make itmandatory for all residents to connect their toiletsto the existing sewerage system.
• Fringe areas of cities and colonies of economicallyweaker sections and slum dwellers should be cov-ered with low-cost sanitation facilities, either onindividual household basis or community basiswith ‘pay and use system’ with adequate mainte-nance arrangements. Necessary penal clause shouldbe enforced effectively to stop open defecation prac-tice as well as indiscriminate throwing of garbage/litter in public places.
• Targeted subsidy may be given to urban poor fortaking water supply/sewerage house service connec-tions, metering, and construction of toilets.
• Comprehensive storm water drainage system shouldbe developed in all cities and towns in order to avoidwater logging during monsoon.
INVESTMENT NEEDS FOR URBAN WATER SUPPLYAND SANITATION, SEWERAGE, DRAINAGE,AND SOLID WASTE MANAGEMENT SECTORSDURING THE ELEVENTH FIVE YEAR PLAN11.56 The total fund requirement for the implemen-tation of the Eleventh Five Year Plan schemes in re-spect of urban water supply, sewerage and sanitation,drainage, and solid waste management is estimated asgiven in Table 11.2.
AVAILABILITY OF FUNDS11.57 To improve the infrastructure relating towater supply and sanitation in the urban centres, the
government is assisting the ULBs and the State Gov-ernments through various schemes and special Cen-tral assistance (SCA). Under JNNURM, water supplyand sanitation have been accorded highest priorityamong the eligible components and almost 40% of theoutlay would be spent on water supply and sanitationsector leaving a gap of Rs 89237 crore.
TABLE 11.2Funds Requirement—Urban Basic Services
(Rs in Crore)
S. Sub-Sector EstimatedNo. Amount
1. Urban water supply 536662. Urban sewerage and sewage treatment 531683. Urban drainage 201734. Solid waste management 22125. MIS 86. R&D and PHE training 10
Total 129237
Source: Ministry of Urban Development, GoI.
For bridging the gap, the following possible sources areidentified. Table 11.3 gives the proposed flow of funds.
TABLE 11.3Proposed Flow of Funds
Source of Funding Amount(in Rs Crore)
Central sector outlay 70000*State sector outlay 35000Institutional financing 10000Assistance from external support agencies 10000FDI and private sector 4237
Total 129237
Note: * The actual allocation provided for JNNURM is Rs 50000crore during 2005–12 out of which the amount available forUrban Water Supply, Sewerage, Solid Waste Management is ex-pected to be in the range of Rs 15000 crore. The shortfall will needto be met by other sources of finance if the objective of covering100% population with Water Supply and Sanitation facilities is tobe met during the Eleventh Plan.Source: Ministry of Urban Development, GoI.
Central Sector Outlay11.58 The Central sector outlay may be stepped upfrom the present Rs 50000 crore to around Rs 70000crore under the ongoing Central programme ofJNNURM so that great thrust could be given to watersupply and sanitation sector in the urban areas.
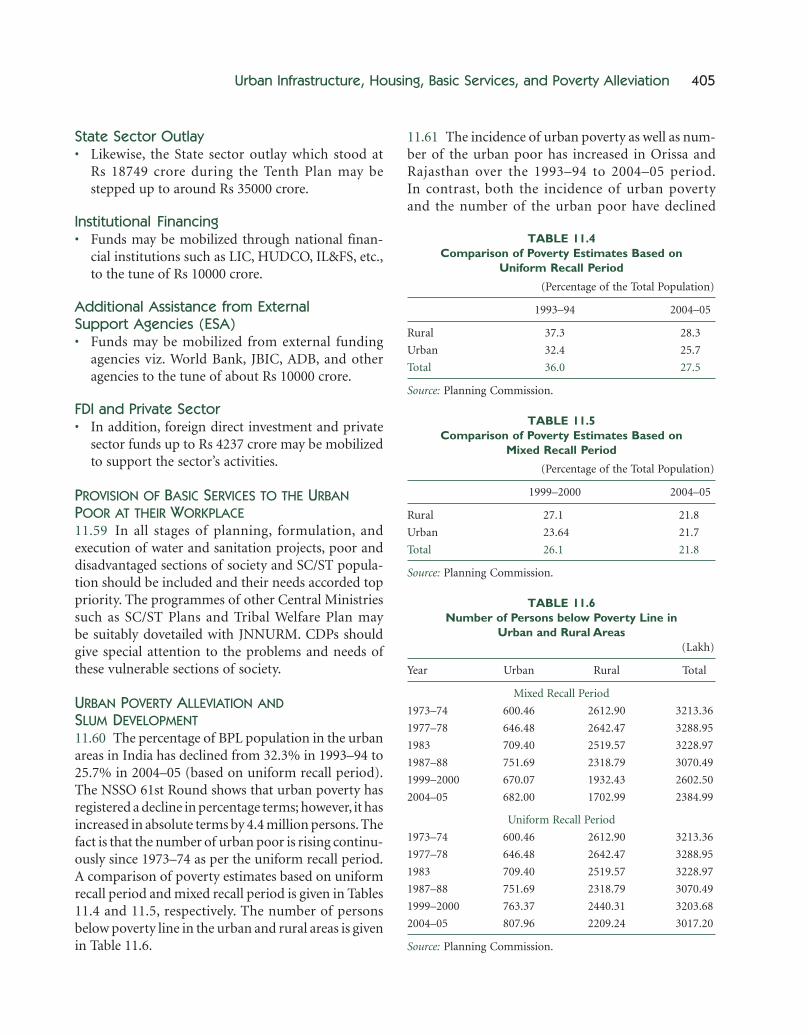
Urban Infrastructure, Housing, Basic Services, and Poverty Alleviation 405
State Sector Outlay• Likewise, the State sector outlay which stood at
Rs 18749 crore during the Tenth Plan may bestepped up to around Rs 35000 crore.
Institutional Financing• Funds may be mobilized through national finan-
cial institutions such as LIC, HUDCO, IL&FS, etc.,to the tune of Rs 10000 crore.
Additional Assistance from ExternalSupport Agencies (ESA)• Funds may be mobilized from external funding
agencies viz. World Bank, JBIC, ADB, and otheragencies to the tune of about Rs 10000 crore.
FDI and Private Sector• In addition, foreign direct investment and private
sector funds up to Rs 4237 crore may be mobilizedto support the sector’s activities.
PROVISION OF BASIC SERVICES TO THE URBANPOOR AT THEIR WORKPLACE11.59 In all stages of planning, formulation, andexecution of water and sanitation projects, poor anddisadvantaged sections of society and SC/ST popula-tion should be included and their needs accorded toppriority. The programmes of other Central Ministriessuch as SC/ST Plans and Tribal Welfare Plan maybe suitably dovetailed with JNNURM. CDPs shouldgive special attention to the problems and needs ofthese vulnerable sections of society.
URBAN POVERTY ALLEVIATION ANDSLUM DEVELOPMENT11.60 The percentage of BPL population in the urbanareas in India has declined from 32.3% in 1993–94 to25.7% in 2004–05 (based on uniform recall period).The NSSO 61st Round shows that urban poverty hasregistered a decline in percentage terms; however, it hasincreased in absolute terms by 4.4 million persons. Thefact is that the number of urban poor is rising continu-ously since 1973–74 as per the uniform recall period.A comparison of poverty estimates based on uniformrecall period and mixed recall period is given in Tables11.4 and 11.5, respectively. The number of personsbelow poverty line in the urban and rural areas is givenin Table 11.6.
11.61 The incidence of urban poverty as well as num-ber of the urban poor has increased in Orissa andRajasthan over the 1993–94 to 2004–05 period.In contrast, both the incidence of urban povertyand the number of the urban poor have declined
TABLE 11.4Comparison of Poverty Estimates Based on
Uniform Recall Period
(Percentage of the Total Population)
1993–94 2004–05
Rural 37.3 28.3
Urban 32.4 25.7
Total 36.0 27.5
Source: Planning Commission.
TABLE 11.5Comparison of Poverty Estimates Based on
Mixed Recall Period
(Percentage of the Total Population)
1999–2000 2004–05
Rural 27.1 21.8
Urban 23.64 21.7
Total 26.1 21.8
Source: Planning Commission.
TABLE 11.6Number of Persons below Poverty Line in
Urban and Rural Areas(Lakh)
Year Urban Rural Total
Mixed Recall Period
1973–74 600.46 2612.90 3213.36
1977–78 646.48 2642.47 3288.95
1983 709.40 2519.57 3228.97
1987–88 751.69 2318.79 3070.49
1999–2000 670.07 1932.43 2602.50
2004–05 682.00 1702.99 2384.99
Uniform Recall Period
1973–74 600.46 2612.90 3213.36
1977–78 646.48 2642.47 3288.95
1983 709.40 2519.57 3228.97
1987–88 751.69 2318.79 3070.49
1999–2000 763.37 2440.31 3203.68
2004–05 807.96 2209.24 3017.20
Source: Planning Commission.

406 Eleventh Five Year Plan
in the States of Gujarat, Kerala, Punjab, Tamil Nadu,and West Bengal during the same period. In otherStates, there has been a decline in the incidence ofpoverty but not in their total number (Boxes 11.4,11.5, 11.6).
11.62 A large number of workers engaged in theurban economy as self-employed in the informalsector, regular low wage/salaried workers, and casual
workers fall in the category of the urban poor. Theyplay a role in wealth creation, development of infra-structure, and providing a quality of life to the urban-ites. However, they have themselves been denied shelter,basic urban amenities, healthy urban environment, anda dignified life.
11.63 In recent decades, the gap between the urbanrich and poor has widened considerably. The EleventhPlan aspires to empower the persons engaged in theinformal sector living in urban areas by providingtraining to them to have better skills, higher produc-tivity, and higher incomes on the one hand and agreater voice in decision-making by implementingthe 74th CAA on the other hand. In this manner,an effort would be made during the Eleventh Plan tofocus the spotlight on ‘inclusive growth’ in the urbanareas.
SLUMS AND SLUM REHABILITATION11.64 As per estimates, the slum population in 2001was 61.82 million out of which the reported slumpopulation in the 640 towns and cities having popula-tion of 50000 and above is 42.58 million. Thetotal urban population of these 640 towns is 184.35million. Data pertaining to slum population, as perthe 2001 Census and the availability of housingand other basic amenities to them, are given in Tables11.12 and 11.13.
Housing for Slum Dwellers11.65 Registrar General of India has for the first timecollected slum data in the 2001 Census for citieshaving urban population of 50000 and more. Box11.7 provides the gist of slum population data in thecountry.
Box 11.4Objectives for Urban Poverty Alleviation
The Eleventh Plan has the following objectives for theurban poor:
• To provide them affordable shelter and decent livingand working conditions.
• To make adequate provision of land for the poor inthe Master Plan itself.
• To help in developing self-employment enterprises andjob creation for the wage employment earners.
• To protect the economic interest and safety of womenand other vulnerable sections of our society.
Box 11.5Slums
Slums are housing clusters having insufficient facilities ofhygiene, toilet, drinking water, sanitation, etc.
Box 11.6Integrated Slum Development
Some of the measures that are required to be pursued andstrengthened further for integrated slum development are:
• Creating and updating database on slums.• City-wise perspective and integrated slum development
plans.• Augmenting and facilitating access to services for slum
dwellers.• Granting tenure security to slum dwellers.• Insitu upgradation and resettlement options for slum
improvement.• Using land as a resource for housing and shelter devel-
opment for slum dwellers.
Box 11.7Spread of Slums
• 640 towns spread over 26 States/UTs have reported ex-istence of slums.
• 42.6 million people consisting of 8.2 million house-holds reside in slums of these towns.
• It is a coincidence that both Census of India in 2001and NSSO in 2002 found that every seventh person inurban India is a slum dweller.

Urban Infrastructure, Housing, Basic Services, and Poverty Alleviation 407
REVIEW OF SCHEMES11.66 A number of social housing schemes for poor—as indicated in the Table 11.7—have been undertakenby the GoI over the last two decades:
TABLE 11.7Social Housing Schemes
S.No. Name of the Scheme Started in
1. Indira Awas Yojana 19902. EWS Housing Scheme for beedi workers 1991
and hamals3. National Slum Development Programme 19964. A two million Housing Programme for EWS/LIG 19985. PM Gramin Awas Yojana 20006. Valmiki Ambedkar Awas Yojana (VAMBAY) 20017. JNNURM (BSUP and IHSDP) 2005
Source: Ministry of Housing and Urban Poverty Alleviation(MoHUPA), GoI.
11.67 These and other policy frameworks and subse-quent development of programmes and schemes haveyielded fairly positive results in the area of housingand human settlements. There has been a quantumjump in the supply of serviced land, habitable shelter,and related infrastructure, as detailed in the Box 11.8.
11.68 Effective measures are needed to stop the mush-rooming of new slums. Providing affordable urbanservices to slum dwellers and granting them tenurerights will be the focus of the Eleventh Plan. State gov-ernments have to ensure that the ULBs earmark a partof their budget for the urban poor. Urban poverty cellshave already been created at district level. Their func-tioning has to be made effective. A National Slum
Policy needs to be formulated so as to evolve a holisticapproach towards slum improvement.
11.69 To promote integrated city development and toenable the people living in slums to gain access tobasic services, a number of schemes and programmeshave been launched from time to time, for exampleEnvironmental Improvement of Urban Slums, Na-tional Slum Development Programme (NSDP),Integrated Low Cost Sanitation Scheme (ILCS), etc.
PROGRAMMES AND SCHEMES OF URBANPOVERTY ALLEVIATION IN THE ELEVENTH PLAN
SWARNA JAYANTI SHAHRI ROZGAR YOJANA (SJSRY)11.70 This CSS, launched in 1997, was meant to pro-vide gainful employment to the urban unemployed/under-unemployed (below the urban poverty line)through:
• encouraging setting up of self-employment ventures;• provision of wage employment.
11.71 It relied on creation of suitable communitystructures and delivery of inputs through the ULBs.In the Tenth Plan, there was a target of assisting fourlakh urban poor in setting up individual/group microenterprises and imparting skill training to five lakhurban poor.
11.72 Under self-employment component of SJSRY,891679 beneficiaries have been assisted by now and934649 persons were provided various types of skill
Box 11.8Housing Construction and Ownership
• Under the Valmiki Ambedkar Awas Yojana (VAMBAY) of the GoI, a subsidy of Rs 932.56 crore has been released forconstruction of 459728 dwelling units and 65580 toilet seats since the inception of the scheme up to 2005–06.
• Under the NSDP, a total amount of Rs 3089.64 crore has been released to the States/UTs covering 436.28 lakh urban poorsince inception of the scheme up to 2005–06.
• The period 1991 to 2001 witnessed a net addition of 19.52 million dwelling units in the urban housing stock, amountingto average annual construction of 1.95 million houses.
• The share of ownership housing in urban areas has increased from 63% in 1991 to 67% in 2001 (Census 2001).• It is important to note that households having one-room accommodation declined significantly in urban areas from
39.55% to 35.1% during the period 1991–2001. This is a result of upward shift of accommodation and accelerated supplyof housing stock.

408 Eleventh Five Year Plan
trainings. So far, 52701 Development of Women andChildren in Urban Areas (DWCUA) groups havebeen formed and 198314 women beneficiaries havebeen assisted under this scheme for setting up of groupenterprises. A total of 177508 Thrift and Credit Soci-eties (T&CS) have also been formed under SJSRY. Thenumber of beneficiaries covered under the Commu-nity Structure Component of SJSRY is 337.40 lakh andthe number of man-days of work generated under thewage employment component of SJSRY is 583.06 lakh.
11.73 A comprehensive evaluation of SJSRY schemeon an all-India basis was carried out in 2005–06 byHuman Settlement and Management Institute. Themain findings of the evaluation are: (i) the pro-grammeis working well in some of the States; (ii) most of thebeneficiaries of training are below 30 years; (iii) womengroups market their products by themselves except inthe eastern and North Eastern States; (iv) the forma-tion of DWCUA groups has had a positive impact onwomen; (v) T&CS are very active in promoting smallsavings and resolving disputes; (vi) non-achievementof physical targets in some States is due to inadequateskill training, wrong choice of projects, lack of public-ity, etc. (see Box 11.9).
11.74 SJSRY is being revised in terms of the followingfeatures:
Self-employment Component• The self-employment component of the scheme will
be made more market driven in terms of market
surveys which will assist micro entrepreneurs tolocate niche segments where there is potentialdemand for their products and services.
• Clusters of micro production units will be devel-oped in keeping with the factors of localization per-taining to traditional skills and in terms of townsrenowned for given products.
• Appropriate or intermediate technology inputs willbe used to strengthen the technological base ofselected clusters in terms of common facilitiescentres providing critical machinery/equipmentrequired for common use as well as ensuring sup-ply of quality raw materials at reasonable prices.These common facilities centres would be run byassociations of micro entrepreneurs themselvesrelated to the selected economic activity.
• High-quality Small Enterprise Advisory Serviceswill be provided to the micro entrepreneurs.
• Resource institutions will be selected all over thecountry for providing upgraded technical skillscombined with certification.
• Self-employment efforts will be buttressed byencouraging T&CS at the community level.
• Micro entrepreneurs will be encouraged to developtrade-based organizations.
• The mission approach of the ‘Kudumbshree’ modelof Kerala and other best practices in different partsof the country will be adopted for suitable applica-tion under SJSRY.
• Design and development services from IITs andother institutions will be sought for developmentof mobile vending outlets.
• An integrated approach will be adopted withspecial attention to backward and forward linkagesunder the aegis of a designated Institute and aspecific Task Force.
11.75 Wage-employment Component• High-quality training for proficiency in technical
services will be organized with leading institutionspreparing detailed training modules for specifictrades.
• Training in a wide variety of trades such as con-struction, beauty and skincare, hair styling, hospi-tality, tourist guides, security, transport, andsecretarial trades will be encouraged along withplacement services.
Box 11.9New Focus in SJSRY
In its present form, the scheme has not succeeded in pro-viding effective employment opportunities to the urbanpoor. It is now proposed to bring new focus into thescheme in keeping with the fact that urban areas havedeveloped new skill requirements. Towards this end,43 new trades have been identified in which it is proposedto build capacity by:
• Skill development—PPP mode.• SHGs.• Self-employment skills plus facilitation of credit for
setting up self-employment.

Urban Infrastructure, Housing, Basic Services, and Poverty Alleviation 409
• Special emphasis will be laid on construction ofcommunity assets in low-income neighbourhoodswith strong involvement and participation of localcommunities.
11.76 Structural and OrganizationalComponent• Strengthening the delivery mechanism by improv-
ing the competency level and outreach of the Pro-gramme Management Units at the State level andProgramme Implementation Agencies (PIAs) at theULB level.
• There is need to earmark 25% of the budget for theurban poor in municipal budgets.
• There is need for convergence of services to theurban poor with special reference to health, educa-tion, and social security.
• The National Building Organization (NBO) needsto be strengthened for providing statistical andmonitoring inputs for effective implementation ofthe revised SJSRY.
• Suitable networking with the UNDP-fundedNational Strategy for the Urban Poor Project aswell as UN and other multilateral/bilateral projectsis required for focused thrust on capacity buildingand innovative and experimental pilot projects.
11.77 Given the fact that 25.7% of the urban popula-tion as per uniform recall period lives below thepoverty line, a concerted effort need be made duringthe Eleventh Plan for creation of at least 30 millionadditional jobs in the urban areas. The outlay for alle-viation of urban poverty during the Eleventh Planneeds to be suitably enhanced. The revised SJSRY willbe market-led combined with an integrated provisionof backward and forward linkages.
11.78 The Ministry of HUPA also proposes to launcha scheme for the ‘Skill Training for Employment Pro-motion amongst the Urban Poor’ during the EleventhFive Year Plan as a part of the National Skill Develop-ment Mission specially targeting the urban poor inthe development of their skills to enable them accessmarket-based employment opportunities or undertakeself-employment to improve their living conditionsand overcome poverty. This will make available skilledand semi-skilled manpower needed by the industry
and service sectors in response to changing global,national, and local imperatives and opportunities. Thiswill lead to reduction in unemployment rate amongthe urban poor, especially women, and will enhancetheir productivity and real wages making the economicgrowth inclusive.
11.79 URBAN STATISTICS FOR HR ASSESSMENTSCHEMEAims at the development and maintenance of a na-tional database, MIS, and knowledge repository onurban poverty, slums, housing, construction, and otherurbanization-related statistics. Its key objective is tosupport the government with an information base andknowledge inputs for planning, policy-making, projectdesign, formulation, implementation, monitoring,assessment, and evaluation, particularly in the contextof programmes relating to urban poverty, slums, andhousing. The scheme was earlier known as MIS onHousing Data, Research and Survey.
11.80 FUTURE APPROACH/STRATEGIES• There is need to address the issue of urban poverty
alleviation in a systematic, scientific, and time-bound manner by adopting the Mission approachas is being done in Kerala through the ‘Kudumbshree’model. The approach has to be target-orientedwith specific focus on primary issues such as skillupgradation, entrepreneurship development, wageemployment, etc.
• Skill development has to be correlated to the de-mands of industry and service sector in and aroundthe city. For this purpose, periodic labour marketsurveys have to be carried out in collaboration withthe private sector by professionally competentorganizations/NGOs so as to devise appropriatetraining modules for building skills in the relevantdisciplines, where the demand exists or is projected.This exercise is likely to lead to a pool of humancapital which can be appropriately utilized in thecontemporary labour market.
• The 74th CAA envisages that the functions of ur-ban poverty alleviation and improvement of slumsand their upgradation, including the provisioningof urban basic amenities to the poor, are amongthe key functions of the municipalities. Therefore,the ULBs have to compulsorily make appropriate

410 Eleventh Five Year Plan
provisions in their budget. ULBs have to follow aconvergence approach in formulating service deliv-ery to the urban poor by optimum utilization ofboth financial and manpower resources availablein various Central and State sector schemes andprogrammes.
• Any urban poverty alleviation programme withoutadequate manpower equipped with the capability,capacity, and sensitivity to effectively implementsuch social sector programmes will not succeed.Therefore, it is absolutely necessary for Urban Pov-erty Alleviation Cells at the ULB/district/State levelto have trained and dedicated manpower.
• City-specific urban poverty reduction plans needto be prepared by the ULBs and fund release has tobe demand driven.
• Although the urban poor is the most vulnerablesection of society, the delivery of health services isalmost negligible to them. Therefore, there is needto work out a comprehensive health and accidentinsurance plan/scheme for the entire urban poor asa special package to resolve their health-related is-sues. There is also need to develop a social securitynetwork for this most vulnerable section, speciallythe single women, widows, aged, disabled, weaker,and minority sections.
URBAN HOUSING11.81 Role of Housing: Housing, besides being a verybasic requirement for the urban settlers, also holds thekey to accelerate the pace of development. Status ofhousing stock and basic amenities are provided inTable 11.13. Investments in housing, like any otherindustry, have a multiplier effect on income and em-ployment. It is estimated that the overall employmentgeneration in the economy due to additional invest-ment in the housing/construction sector is eight timesof the direct employment (IIM-Ahmedabad Study2005). Construction sector employment is growing atthe rate of 7% per annum. Housing provides oppor-tunities for home-based economic activities. Housingalso has a direct impact on the steel and cement,marble/ceramic tiles, electrical wiring, PVC pipes,and various types of fittings industry, which makea significant contribution to the national economy.Contribution of the housing industry to the GDP issummarized in the Box 11.10.
Box 11.10Housing Stock
• Less than one-third of India’s people live in cities andtowns.
• These areas generate over two-thirds of the country’sGDP and account for 90% of government revenues.
• As per CSO estimates, housing sector’s contributionto GDP in the year 2003–04 was 4.5% (3.13% forurban areas) at current price.
• Housing stock in 2001 was 50.95 million (for 55.8million urban households).
11.82 The National Urban Housing and Habitat Policyprovides the basic framework for achieving the objec-tive of ‘shelter for all’. The policy was evolved in 1998with the long-term goal of eradicating houselessness,improving the housing conditions of the inadequatelyhoused, and providing a minimum level of basic ser-vices and amenities to all. It was formulated to addressthe issues of sustainable development, infrastructuredevelopment, and for strong PPPs for shelter deliverywith the objective of creating surpluses in housingstock and facilitating construction of two milliondwelling units each year in pursuance of the NationalAgenda for Governance. However, the housing sectorhas witnessed several changes since then. The 1998National Housing Policy has been replaced by aNational Habitat and Housing Policy, 2007 with landand the development of civic amenities to make landhabitable as its two critical elements.
11.83 In order to improve the quality of life in urbanareas, it is of critical significance that the housing stockis improved through urban renewal, in situ slum im-provement, and development of new housing stock inexisting cities as well as new townships.
Magnitude of Housing Need11.84 Considerable efforts were made during theTenth Plan to enlarge the resource base and initiateinnovative institutional mechanisms to augment hous-ing delivery in urban areas. Focused efforts were alsoinitiated to cover the poor and vulnerable groups ofsociety to enable them to access basic shelter relatedservices. Fiscal concessions coupled with legislativemeasures were also initiated to encourage increased

Urban Infrastructure, Housing, Basic Services, and Poverty Alleviation 411
conversion from one use to another is cost effectiveand efficient. Computerization of land records anddata and e-governance should also constitute impor-tant elements of the urban land policy.
National Land Policy11.87 We have to evolve a National Land Policy whichwill allow both public and private developers to le-gally purchase land for conversion into urban habitatsand townships through transparent rules and regula-tions. Inadequate availability of serviced land in theurban areas is a major constraining factor in takingup housing projects for the poor.
11.88 In the process of spatially delimiting the spe-cific areas of urban extensions of existing towns andthe areas for new townships, care needs to be takenthat as far as possible, prime agricultural land is notutilized but more emphasis is laid on using degradedland for urbanization. Even today, the country isimporting certain basic food items from time to time.Further, each State/UT which acquires land must putinto place a suitable resettlement and rehabilitationpolicy for the displaced rural families while develop-ing urban extensions or new townships.
11.89 Care also needs to be taken that rivers andtheir flood plains, other water bodies, and naturaldrainage systems are not disturbed during theprocess of urbanization. Moreover, it is also essentialto enhance the green lungs of cities as well as developgreen belts around urban settlements with a viewto stemming indiscriminate urban sprawl. Citiesand towns should invariably be surrounded by arural hinterland so that the ecology of the sub-regionis preserved. Access to micro finance has a directcorrelation with the land title. Therefore, the StateGovernments need to facilitate security of land tenurefor the urban poor. The title has to be mortgagableto access credit.
Investment Required11.90 For estimating the investment requirementsfor the Eleventh Plan, the Working Group on UrbanHousing made different assumptions on unit cost ofconstruction of houses in million plus cities and otherurban areas (see Box 11.12 below).
investments in housing by individuals and corporates.However, despite many policy measures and initiatives,the coverage of urban poor with these intendedbenefits has not been achieved to the desired extent.Pressure on urban land has also been increasing dueto market forces supported by upward trend in eco-nomic growth (see Box 11.11 below).
Box 11.11Housing Shortage and Requirement
• According to the report of the Technical Group onestimation of housing shortage constituted in thecontext of formulation of the Eleventh Five-YearPlan, housing shortage is estimated to be around 24.71million. About 99% of such households are fromEWS and low income groups (LIG).
• During the Eleventh Plan period, total housing require-ment, including the backlog, is estimated at 26.53million.
Land Availability, Land Tenure, andLand Reforms11.85 Access to land and legal security of tenure arestrategic prerequisites for the provision of adequateshelter for all and for the development of sustainablehuman settlements affecting both urban and ruralareas. The present policy of the Central Governmentlays stress on an enabling approach. It is for the StateGovernments to bring in the required institutionalreforms and legislative measures to augment housingboth by State agencies and the private sector.
11.86 While recognizing the existence of differentnational laws and/or systems of land tenure, govern-ments at the appropriate levels, including local authori-ties, have to strive to remove all possible obstacles thatmay hamper equitable access to land and ensure thatequal rights of women and men related to land andproperty are protected under the law. The failure toadopt, at all levels, appropriate rural and urban landpolicies and land management practices remains aprimary cause of inequity and poverty. Urban plan-ning tools including master planning, zoning, andregulations are not enough to make land availablein pace with the rapid urbanization, resulting ininsufficient land supply and increase in land prices.It is important to have flexible land policy wherein

412 Eleventh Five Year Plan
11.91 During the Eleventh Five Year Plan, integratedefforts have to be made by the Central and State/UTgovernments to create an integrated and holisticapproach on human settlements which adequatelyaddress issues of land, finance, legal, and regulatoryframework, technology support, and PPP. However,it has to be understood that there can be no one solu-tion and various options and initiatives would beneeded based on national and local priorities.
Housing Market11.92 The government has to create an enablingframework for a well-functioning housing market.Flexible instruments for the regulation of housingmarkets, including the rental market, taking intoaccount the special needs of vulnerable groups needto be developed.
Housing Finance11.93 With the introduction of reforms in the bank-ing sector, considerable improvement has been madein enlarging access to finance for housing by individual
families and also through co-operatives as well as pri-vate developers. In this context, it is pertinent to notethat the RBI requires commercial banks to lend 3% ofthe incremental deposits of the commercial banks tobe deployed to priority sector lending including financ-ing housing by individuals and others includingco-operatives and private sector. Besides, RBI also reck-ons investments made by banks in the bonds issuedby HUDCO under priority sector lending. Box 11.3provides some details of financing of housing loans.
11.94 HUDCO’s housing portfolio covers a widerange of target groups spread all over the country bothin urban and rural areas. During the Eleventh Planperiod, HUDCO proposes to extend a large quantumof assistance for supporting the housing and urbandevelopment requirements both in urban and ruralareas. The proposals envisage a total sanction ofRs 74596 crore during the Eleventh Plan period forboth its housing and urban development programmes.Of this, an amount of Rs 14919 crore has been tenta-tively identified for its housing operations.
FLOW OF FUNDS FOR HOUSING11.95 In view of the current economic and monetaryscenario, it is expected that the housing financedisbursals by banks, HFCs, and co-operative sectorinstitutions would grow at a rate of about 15% perannum during the Eleventh Plan period. Takingthis into account, it is estimated that the flow of creditdisbursal from these institutions would be aboutRs 7.75 lakh crore (gross flow of funds) during2007–12. These projected fund flow figures include
Box 11.13Financing of Housing Loans
• Most of the clients of Housing Finance Institutions/banks under retail home loans belong to MIG/HIG categories andhousing loan finance still remains unaffordable in a large way to the EWS/LIG sections.
• Only 0.2% of housing loans extended by HFCs are of value less than Rs 50000 and about 7% of housing loans is of valuebetween Rs 50000–100000.
• More than 73% of housing loans extended by HFCs is of value exceeding Rs 3 lakh and about 93% of value exceedingRs 1 lakh.
• The fastest growing housing value bracket is between Rs 10 lakh to Rs 25 lakh.• This highlights the need to evolve a system or a scheme for financing housing loans on a large scale for the lower income
groups whose affordability for housing loans falls in the range below Rs 3 lakh, as over 90% of the housing shortage is onaccount of EWS/LIG.
Box 11.12Investment Requirement
The total investment requirement for meeting the hous-ing requirement would be of the order of Rs 361318.10crore consisting of Rs 147195 crore required for mitigat-ing housing shortage at the beginning of the Eleventh Planand Rs 214123.10 crore for new additions to be madeduring the Eleventh Plan period (this includes pucca,upgradation of semi-pucca, and kutcha housing units).
Urban Infrastructure, Housing, Basic Services, and Poverty Alleviation 413
multiple counting and resale of properties, in the sensethat cross-funding/bulk borrowing is involved amongthe various institutions. It is, therefore, assumed thatthe net flow of funds to the housing sector fromformal sector institutions would be 50% of the grossflow of funds for construction of new houses. Thiscomes to approximately Rs 2.90 lakh crore, which is80% of the total investment requirements for urbanhousing for the Eleventh Plan.
RESOURCE MOBILIZATION11.96 Some corrective measures including legislativeand regulatory, outreach related, and those related toexpansion of housing finance would be required topromote larger flow of funds to accelerate supply ofhousing to a cross-section of households.
11.97 Liquidity of housing finance with particularreference to EWS, low-income group, and middle-income group households has to be improved so thatfinancial institutions are in a position to supply therequisite funds. Development of Secondary MortgageMarket is important in this regard. Recognizing therole of securitization as a source of funding, initiativesfor developing the secondary mortgage market havealready been taken by the NHB. The government needsto also provide a conducive and supportive fiscal andregulatory framework for banks and other participantsto actively engage in Residential Mortgage BackedSecuritization transactions.
ROLE OF PRIVATE SECTOR AND FDI11.98 The Eleventh Plan focuses on clearing the back-log in housing and infrastructure assets includingup-gradation activities. Institutions such as NationalReal Estate Development Council (NARDCO) and theConfederation of Real Estate Developers Associationof India are playing an important role in regulatingthe activities of private developers by accrediting themand also by rating such institutions based on theirexperience and capacities. The GoI has permitted 100%FDI for development of townships including construc-tion of development projects, subject to minimumcapitalization, minimum land/built up area, etc. How-ever, to encourage larger inflow of FDI, there is needto minimize the procedural delays in sanctions andapproval of projects.
ROLE OF CO-OPERATIVES11.99 The co-operative housing movement has re-ceived support over consecutive Five Year Plans and astrong institutional framework is getting evolved withinthe co-operative movement. The performance of hous-ing co-operatives is highly influenced by the quantumof funds available to them. During the first three yearsof the Tenth Five Year Plan, that is, 2002–03, 2003–04,and 2004–05, the Apex Co-operative Housing Federa-tions could raise an amount of Rs 1774.43 crore fromvarious funding agencies such as LIC, NHB, HUDCO,Commercial and Co-operative Bank, and other sources.
11.100 Community-linked Finance Facility (CLIFF)which is a financial mechanism that facilitates accessto capital by organizations of the urban poor isnow in its third year of operation in India. As ofDecember 2004, CLIFF capital funds had supported10 community-led development projects; eight hous-ing developments, providing safe, secure, and afford-able shelter with secure tenure for 2816 households;and two sanitation projects designed to benefit over200000 families living in slums in Mumbai and Pune,both in the State of Maharashtra.
RENTAL HOUSING11.101 One of the major constraints in the develop-ment of housing is the rent control legislation in manyStates. Rental housing in the urban areas needs to bepromoted through enabling legislative and adminis-trative measures to serve a wide cross-section of popu-lation in need of housing during their stay in cities.Model Rent Control Act needs to be advocated exten-sively by the States with suitable variations to suit thelocal requirements. The State Governments need toencourage public housing institutions, corporatebodies, educational institutions, and private sectoragencies, through fiscal incentives and soft loans, totake up rental housing for specific groups under theircoverage and focus.
HOUSING TECHNOLOGY11.102 The BMTPC was established in 1980 with theobjective of promoting cost-effective, environment-friendly, energy-efficient, and disaster-resistant tech-nologies and building materials for sustainable habitatdevelopment. Around 39 technologies relating to

414 Eleventh Five Year Plan
innovative building materials have been developedand licensed to private entrepreneurs for commercialproduction. About 12 technologies are in various stagesof development. A recently developed technologypertains to bamboo mat corrugated sheets for roofingand is a substitute for asbestos or iron corrugated sheets.Further, the Council has successfully completed 252demonstration houses under Valmiki Ambedkar AwasYojana (VAMBAY) at Bangalore using cost-effectivetechnologies. The Council has also completed 100demonstration houses at Dehradun (Uttarakhand)and 70 demonstration houses at Nagpur (Maharashtra)under VAMBAY. The construction of 270 demons-tration houses at Bilaspur (Chhattisgarh), Trichy(Tamil Nadu), and Kodulu (Karnataka) are underprogress.
11.103 The efforts made by BMTPC through an inte-grated approach involving simultaneous action forstandardization, grading awareness, promotionthrough governmental recognition in terms of policysupport and fiscal incentives have certainly enhancedacceptability and have demonstrated the efficacy ofan integrated system of technology transfer. Use ofalternative materials such as fly ash, bricks, blocks,and simple prefab systems for slabs/roofing needs tobe further encouraged. Flexibility should be extendedto building and construction material standards.
11.104 A major achievement of BMTPC has been thepreparation of Vulnerability Atlas of India for formu-lating disaster mitigation plans and establishingtechno-legal raging in disaster-prone areas. ThisAtlas has been revised in digitized format with latestdata. As an extension of the Vulnerability Atlas, it hasbrought out the Landslide Hazard Zonation Atlas ofIndia. BMTPC has also formulated guidelines forconstruction of safer and durable houses to withstandearthquake/cyclone. During the Eleventh Plan,BMTPC proposes to focus on up-scaling and mod-ernization of home-grown production technologies,economy and efficiency in housing/building construc-tion projects, use of bamboo in housing and buildingconstruction and vulnerability reduction, risk assess-ment, and disaster resistance construction. Besides,it will take steps for improving the design and layoutof EWS/LIG houses. The total requirement of funds
for BMTPC for this purpose is estimated at Rs 55.19crore.
11.105 The Hindustan Prefab Limited (HPL) was setup as the Hindustan Housing Factory Limited in 1953and was given the status of a PSU in 1955. The com-pany was re-titled as HPL in 1978. The objective ofHPL is to develop cost-effective prefabricated build-ing components. HPL is currently in the process ofrestructuring and modernizing its operations vis-à-visprefabricated building components. It is expected thatthe company will continue this focus in the EleventhPlan, while at the same time, moving into the areas ofon-site supervision, project management services,turnkey construction projects, preparation of DPRsof housing and infrastructure projects, projectappraisal, and training in construction trades.
POLICY MEASURES AND STRATEGY FORADDRESSING THE PROBLEMS OF SLUMS11.106 JNNURM is the single largest initiative everlaunched by the GoI to address the problems of urbanhousing, infrastructure, and basic services to thepoor in 63 cities and towns in a holistic manner.JNNURM comprises two broad segments, namely(i) the Sub-Mission on Urban Infrastructure andGovernance and (ii) the Sub-Mission on BasicServices to the Urban Poor (BSUP) covering 63 iden-tified cities. The non-Mission cities and towns arecovered under the UIDSSMT and Integrated Housingand Slum Development Programme (IHSDP). TheMoHUPA is the nodal ministry for BSUP and IHSDPprogrammes which cater to housing and basic ameni-ties to urban poor, especially slum dwellers. Theseschemes/programmes will, in addition to improvedhousing, also cater to other basic services such as sani-tation, water supply, sewerage, solid waste disposal, etc.
11.107 Interest subsidy scheme for housing the urbanpoor has been proposed during the Eleventh Plan soas to provide an interest subsidy of 5% per annum, fora period of five years only, to commercial lenders forlending to EWS/LIG segments of the urban areas.Interest subsidy is expected to leverage markets fundsto flow into housing for poor. The scheme is expectedto add 15 lakh houses to the housing stock during theEleventh Plan.

Urban Infrastructure, Housing, Basic Services, and Poverty Alleviation 415
Integrated Low-cost Sanitation Scheme11.108 The low-cost sanitation scheme operating dur-ing the Tenth Plan, with the objective of liberatingmanual scavengers from the obnoxious and age oldpractice of manual carrying of night soil, is in the pro-cess of being revised. The current scheme involves sub-sidy of 45% for the EWS beneficiaries and 25% for theLIG beneficiaries for construction of two-pit pourflush units up to the plinth level. The under revisedscheme subsidy for the super structure beyond theplinth level is also provided. The upper ceiling cost willbe Rs 10000 to enable construction of a complete unitof two-pit pour flush latrine with super structure. Suit-able additionality in cost for constructing a two-pitpour flush latrine in hilly areas would be provided. Inthis manner, the ILCS will be more comprehensive, andis expected to complete the process of liberation frommanual scavenging in the country.
URBAN PLANNING AND MANAGEMENT11.109 The United Nations has projected that between2000 and 2030, India’s urban population will increasefrom 282 million to 590 million (assuming moderate2.5% compound annual growth rate). Lookingforward, one facet of India’s urban planning challengeis to accommodate an additional 10 million urbandwellers per year, provide them with adequate publicservices and infrastructure, create opportunities foreconomic development, and ensure that urbanizationis environmentally sustainable.
EMERGING ISSUES IN URBAN PLANNING ANDMANAGEMENT11.110 The 74th CAA 1992 is a historic piece of legis-lation that provides for a democratic and participa-tory planning process so as to incorporate the needsof the people, particularly poor and socially disadvan-taged groups, in the planning process. The Act stipu-lates the setting up of District Planning Committeesand MPCs for integration of spatial and economicdevelopment as well as rural and urban planning,while keeping the needs of environmental conserva-tion in view.
11.111 State governments need to take concretesteps to constitute and functionalize the MPCs andDistrict Planning Committees. In this regard, Urban
Development and Plan Formulation and Implemen-tation Guidelines brought out by the Ministry ofUrban Development are relevant which have, in fact,duly incorporated the provisions of the 74th CAA.
THRUST AREAS OF THE ELEVENTH PLAN11.112 In order to make the urban planning anddevelopment process sustainable, it would be appro-priate to interlink the planning framework compris-ing national-level spatial strategies, regional-levelstrategy plans, metropolitan regional strategy plans,and city- and ward-level land use and developmentplans.
11.113 For an effective urban planning system, thereis need to have inter-related plans at three levels,namely, perspective/structure plans (20–25 years),short-term integrated infrastructure developmentPlans (five years) co-terminus with the NationalFive Year Plans, and plans of specific projects andschemes.
11.114 The national spatial strategy should incorpo-rate policies for industrial location and development,employment generation, human settlement pattern,and structure and infrastructure development, bothfor rural and urban areas. The State spatial plansshould be prepared by taking into account demo-graphic and economic potentials, broad land use con-figurations, infrastructure requirements, and projectimplementation schedules including mechanism forthe PPPs.
11.115 Each district should prepare a District Devel-opment Plan that integrates the plans for its constitu-ent urban and rural areas as well as the sectoralallocations for various schemes under the purview ofexisting district agencies.
11.116 The Metropolitan Development Plan shouldbe prepared on the basis of plans prepared by Munici-palities and Panchayats under the metropolitan areaand in the context of overall objectives and prioritiesset by the Central and State Governments.
11.117 The legal and institutional framework shouldprovide the municipalities with adequate infrastructure

416 Eleventh Five Year Plan
and manpower to undertake the preparation of theseplans. Further, the process of preparation of develop-ment plans should be facilitated by developing urbanand regional information system and providing accessto remotely sensed data, aerial photographs, GIS, set-ting up MIS cells to build database at national andState level, etc. Evolving suitable mechanism for strongdatabase for all cities/towns with regard to coverageof urban population with water supply, sewerage,drainage, and solid waste management facilities is mostessential in the wake of the large number of infrastruc-ture projects that are being considered by differentStates.
PUBLIC HEALTH ENGINEERING (PHE)TRAINING PROGRAMME11.118 The scope of PHE training programme needsto be widened so as to provide requisite trainingfor increasing the skills and expertise of all personnelinvolved in the water supply and sanitation sector. Theinfrastructure being developed by various ULBs/Statedepartments for drinking water supply, sewerage, sani-tation, drainage, sewage waste management underJNNURM would require more qualified and trainedmanpower for better planning, designing, implemen-tation, and O&M of water supply and sanitationschemes.
ROLE AND INVOLVEMENT OF EXTERNALSUPPORT AGENCIES11.119 Technical and financial assistance from exter-nal support agencies such as WHO, UNDP, WorldBank, ADB, and bilateral agencies needs to be exploredon a case to case basis. It is also essential that the exter-nal donor agencies cut short their processing/decision-making time to less than a year, so that projects plannedunder JNNURM are able to get financial and techni-cal support of the external donor agency without ham-pering the progress of project implementation.
LINKING OF BUDGET PROVISIONS OF MINISTRYOF URBAN DEVELOPMENT AND MINISTRY OFDONER MEANT FOR NORTH EASTERN STATESAND SIKKIM WITH JNNURM11.120 The 10% lump sum pool of resources ofMinistry of Urban Development and Non-LapsableCentral Pool of Resources (NLCPR) under Ministryof DoNER meant for North Eastern States and Sikkim
provide funding for creation of urban infrastructureincluding water supply, sewerage, drainage, and solidwaste management on the same pattern of fundingas that of JNNURM, that is 90:10 basis. These pro-grammes need to be integrated with JNNURM toavoid duplicity in projects by different ministries andadherence to projects based on City DevelopmentPlans.
ROLE OF IT IN EFFICIENT GOVERNANCE ANDIN PROVISION AND MANAGEMENT OFURBAN SERVICES11.121 With the use of modern technology there havebeen perceptible changes in urban governance. Theadvent of digital technology coupled with the avail-ability of various modes of fast communication suchas Internet, intranet, cellular phones, and menu-basedsoftware has revolutionized the concept of governance.There has also been a change in the outlook of admin-istrators and policy makers in adopting latest technol-ogy, and go for paperless work and make governancemore citizen-friendly. E-governance encompasses thestrategic and systematic use of modern ICT by thegovernment to improve the efficiency, transparency,and accountability in its functioning and interface withcitizens.
MUNICIPAL GOVERNANCE AND REFORMS
THE CONSTITUTION (SEVENTY-FOURTHAMENDMENT) ACT (CAA)11.122 The Act has ensured decentralization andsuccessfully created a set up of democratic institutionsof self-government. However, despite 15 years ofenactment, most of the States are yet to implement itsseveral provisions. While the CAA envisions decentrali-zation of functions, finances, and functionaries toenable the ULBs to function as ‘institutions of self-government’, in reality, fiscal and administrativedecentralization have lagged behind political decen-tralization. The amended Municipal Acts do notspecifically assign functions and financial powers tothe ULBs, including town planning. To achieve the twinobjectives of ambitious growth paired with inclusivegrowth, the country needs to functionalize the insti-tutional framework that fosters livable, bankable, andcompetitive cities.
Urban Infrastructure, Housing, Basic Services, and Poverty Alleviation 417
INVOLVEMENT OF COMMUNITY AND ELECTEDREPRESENTATIVES IN DECISION-MAKINGAND IMPLEMENTATION11.123 The CAA has empowered elected representa-tives and the community leaders with decision-making powers through institutional frameworkssuch as Ward Committees, MPCs, and District Plan-ning Committees. Now from a ‘top-down’ approach,the emphasis has thus shifted to the ‘bottom-up’approach.
SKILL UPGRADATION AND CAPACITY BUILDING OFTHE ULBS11.124 Lack of skilled manpower to undertake vari-ous additional tasks entrusted to the ULBs is a causeof concern. Many of the ULBs have only one or twoengineers for preparing projects and almost notown planner for preparing City Development Planand Project Reports. During the Eleventh Plan,emphasis would be laid on the capacity building ofthe functionaries of the ULBs. There is a need toset up an apex agency to co-ordinate the activitiesof all national- and State-level training institutions.The Administrative Reforms Commission has pro-posed the creation of three to five year ‘urban gover-nance capacity building programmes’ to be initiatedby the Central and State Governments. Deficienciesof the ULBs need to be addressed through variouscapacity building program-mes under JNNURM andother CSS.
INDEPENDENT REGULATORY INSTITUTIONS11.125 An independent regulatory institution withprofessional urban managers is needed at the Statelevel to ensure that the ULBs operate with autonomybut within the framework decided by the independentregulatory institution. It can decide parameters suchas framing minimum and maximum limits forvarious types of local taxes, fees, user charges, admin-istrative expenditure, etc. Setting up the regulatoryinstitution can go a long way in improving the perfor-mance of local bodies in delivery of civic services topeople.
PREPARATION OF OPERATING MANUAL FOR ULBS11.126 The independent regulatory institution forthe ULBs can be entrusted with the responsibility
of preparing operating manuals relating to variousservices being provided by the ULBs. The operatingmanuals can definitely improve the quality of assetsthat are being created by the ULBs. To ensure qualitycontrol and uniformity, the manual may lay downstandards for all materials that are used for creationof assets. Operating manuals need not only be forengineering aspects but can cover the whole gamut ofservices in which the ULBs are involved.
MUNICIPAL FINANCE11.127 Municipalities have neither the responsibilitynor the autonomy of fiscal powers for delivering theurban services expected from them. There is a mis-match between ULB revenue capacities and theirfinancial requirement.
11.128 The Ministries of Urban Development andHousing and Urban Poverty Alleviation have estimateda huge resource gap of Rs 76896 crore for all Statesduring the period 2005–10 for O&M of variouscivic services in urban areas (Twelfth FinanceCommission, TFC report). To fill this huge gap, ourstrategy revolves around stricter guidelines, policyprescriptions, and stress on local revenue enhance-ment efforts by the ULBs. It will certainly achievefinancial viability at the ULB level. Further, ULBs needto take steps for broad-basing the revenue from ownsources through improving the collection of existingrevenue sources, reforms in property tax, levy of newtaxes and charges, enhanced cost recovery for utilitycharges and fees, improved information, registration,billing and collection systems of taxes and charges,reducing administrative expenses, etc. Innovativemethods of service delivery and involvement ofprivate sector will improve the financial position ofmunicipalities.
EVOLVE ALTERNATIVE WAYS TO AUGMENTMUNICIPAL RESOURCES11.129 The following steps need to be initiated foraugmenting revenue generation by the ULBs:
Land as a Resource• Land is a good resource to generate revenue for the
local bodies and should be explored by the ULBs tothe extent possible.

418 Eleventh Five Year Plan
New Levies• New levies/cess should be levied to augment rev-
enue resources such as drainage fee, parking fee,hoarding fees, vacant land tax, development impactfee, etc.
Pooled Financing• New thrusts for mobilizing urban infrastructure
finance, a State-level Pooled Financing Mechanismis working successfully in Tamil Nadu, with thefinancial assistance from the United States Agencyfor International Development (USAID). The Cen-tral Government has set up a PFDF with the objec-tive to facilitate development of bankable urbaninfrastructure projects through appropriate capac-ity building measures and financial structuring. Anamount of Rs 100 crore has been provided to theMinistry of Urban Development for 2007–08 forPFDF.
Secondary Markets• The ULBs will have to be made credible and ac-
countable institutions so as to tap India’s increas-ingly sophisticated financial markets includingsecondary markets.
Accessing Capital Markets• To ensure sound local government credit markets,
the government will have to evolve effective finan-cial institutions and instruments for financial mar-ket regulations and supervision. The ULBs’ credit
worthiness would be enhanced on a stand-alonebasis so that the supply of bankable projects couldbe increased.
ROLE OF FINANCIAL INTERMEDIATION FOR LOCALGOVERNMENTS
Municipal Development Funds11.130 Around the world, more than 60 countries haveestablished financial intermediaries. For example, inBrazil, individual States often have established theirown municipal development funds. Both the WorldBank and the ADB have announced that they intendto rely more heavily on municipal development fundsas a key part of their strategy to help finance local in-vestment needs in Asia. The goal is not merely to givemunicipalities access to credit, but to do so in a man-ner that increases the efficiency of local investment andreinforce financial sector reforms in the rest of theeconomy.
Municipal Bond Markets11.131 The advantages of using municipal bonds tofinance urban infrastructure are increasingly evidentin India. The Indian Bond Market is becoming vibrant.Ahmedabad Municipal Corporation issued a first his-torical Municipal Bond in Asia to raise Rs 100 crorefrom the capital market for part financing a watersupply project. An illustrative list of ULBs/parastatals,which have been granted permission to issue Munici-pal Bonds, is given Table 11.8.
TABLE 11.8Urban Local Bodies/Parastatals which have been Granted Permission for Issue of Tax-Free Bonds
S. No. Name Year Amount (Rs in Crore)
01. Ahmedabad Municipal Corporation 2001 100.00
02. Hyderabad Municipal Corporation 2002 82.50
03. Nasik Municipal Corporation 2003 50.00
04. Visakhapatnam Municipal Corporation 2003 50.00
05. Hyderabad Metropolitan Water Supply and Sewerage Board 2003 50.00
06. Ahmedabad Municipal Corporation 2004 58.00
07. Chennai Metropolitan Water Supply and Sewerage Board 2004 42.00
08. Karnataka Water and Sanitation Pooled Fund Trust 2004 100.00
09. Chennai Metropolitan Water Supply and Sewerage Board 2005 50.00
10. Chennai Corporation 2005 44.80
11. Ahmedabad Municipal Corporation 2005 100.00
Source: Ministry of Urban Development, GoI.

Urban Infrastructure, Housing, Basic Services, and Poverty Alleviation 419
BUDGETARY SUPPORT11.132 The TFC has recommended a sum of Rs 5000crore for the municipalities to be provided as grants-in-aid to augment the consolidated fund of the Statesfor the years 2005–10 to be distributed with inter seshares.
COST EFFICIENCY AND PRODUCTIVE USE OFRESOURCES11.133 Projects being carried out by contractors haveto be carefully supervised to ensure quality and timelycompletion. Cost over-runs in projects due to delaycaused by contractors need to be penalized by incor-porating the penalty clause in the contract itself.
THRUST OF THE ELEVENTH FIVE YEAR PLANTOWARDS MUNICIPAL FINANCES11.134 India’s urban areas will need to compete na-tionally and internationally for investments and hu-man resources. Most of the ULBs are technically andfinancially ill-equipped to meet the ever-growingdemand for urban services, so the capacity buildingexercises have to be accorded priority. The EleventhPlan strategy would be to create a conducive environ-ment for efficient tax administration, increasing useof non-tax sources, efficient pricing of services, PPPsin provision and maintenance of urban services, adopt-ing alternative sources of finance including accessto capital markets, involvement of community andprivate sector in raising revenue. The States need toensure rating of municipalities for facilitating accessto capital markets.
URBAN TRANSPORT
URBANIZATION TRENDS AND TRAVEL NEEDS11.135 Urbanization has lead to corresponding in-crease in demand for transportation. The growth intransport infrastructure has not kept pace with theincreased demand and the share of public transportvehicles has declined. The problem of congestionand its consequences are posing a severe threat tosustainability of the urban areas. Confederation ofIndian Industry (CII) survey 2003 of the urban popu-lation in southern India showed that 58% of thoseinterviewed were dissatisfied with public transportservices. It also showed that 65% were willing topay higher public transport fares for comfortable
travel. The situation in other parts of the country issimilar.
11.136 Managing urban expansion is a critical elementtowards achieving the goals set by the National UrbanTransport Policy. The National Urban Transport Policy,2006 focuses on the need to ‘Move people—Notvehicles’, by encouraging public transport and use ofnon-motorized modes. The policy suggests involve-ment of private sector, innovative financing mecha-nisms to enhance efficiency, reduction in traveldemand by encouraging a better integration of anduse and transport planning.
11.137 As per 2001 Census, there are 35 cities withmillion plus population. Except for Mumbai, Kolkata,and Delhi, none of the mega cities have a Mass RapidTransit System (MRTS). The Delhi Metro Project isprogressing as per schedule and Phase-I is fully opera-tional. Other metropolitan cities are also in the pro-cess of preparing DPRs for a metro-rail system.
SUGGESTIONS FOR URBAN TRANSPORT PLANNINGFOR THE ELEVENTH PLAN PERIOD• All cities need to prepare a comprehensive mobil-
ity plan which includes a Master Plan for non-motorized transport taking into account projectedgrowth in the next ten years.
• Proposals for preparation of DPR should be pre-ceded by professional evaluation by technologyneutral agencies.
• A comprehensive program of capacity buildingshould be implemented.
• All cities should formulate a realistic ‘hawker/vendor policy’.
• Cities may prepare a plan for traffic calming toreduce emissions and road accident rates.
• All million plus cities may prepare plans to intro-duce/upgrade existing bus services as also introduceBRT systems on selected arterials during the EleventhPlan period.
• All cities may have a parking policy. State govern-ments need to amend building by-laws so that ade-quate parking space is made available for allresidents/users. FAR norms may be modified. Multi-level parking complexes may be made mandatory inmega cities. All cities may upgrade taxi and three-wheeler fleets.

420 Eleventh Five Year Plan
SPECIFIC INTERVENTIONS REQUIRED FORENHANCING MOBILITY NEEDS IN TOWNS• Improvement in the quality and maintenance of
roads and provision of pedestrian pavements andcycle tracks.
• De-congestion of crowded areas.• Developing transport corridors to enable orderly
flow of public transport.• Creation of parking spaces for para-transit and
other vehicles.• Facilities for public bus services, pedestrian subways,
and larger parking facilities.• Mobility needs of 40 lakh plus population cities
would generally need mass transit systems withmedium to high capacity with a larger network offeeder systems.
ACTIONS REQUIRED FOR THE DEVELOPMENT OFINTEGRATED CITY TRANSPORT AS PER NUTP
Land-use interventions• Encourage ‘Transit Oriented Development’ with
high density areas.• Either develop all new/satellite townships/SEZ along
the defined major transport corridors or integratethem with mass transit system in the Master Planitself.
• Allow land use changes from time to time, includ-ing for public/government use.
• Discourage sprawl through introduction of vacantland tax and levy of ‘Transport Impact Fee’ ondevelopments in the periphery.
Transportation Interventions• Promote non-motorized vehicles by creating facili-
ties for safe use.• Promote public transit systems that are cost effec-
tive and able to meet the demand levels optimally.Encourage investments in premium bus systems.
• Develop ring roads and city bypass roads as well asrail line bypasses.
• Develop freight transport terminals outside citylimits.
• Shift inter-state bus terminals from the city centreto the peripheries.
Institutional/Regulatory Interventions• Modify the enabling legislations.• Establish fare policies and a fare regulator.• Implement fiscal measures that encourage use of
public transport.
SCHEME FOR PREPARATION OF DPRS ANDCONDUCT OF TRAFFIC AND TRANSPORTATIONSTUDIES11.138 Under this scheme, support is provided by thegovernment for the preparation of DPRs and in theconduct of comprehensive traffic and transportationstudies to the extent of 40% of the cost. Althoughthe scheme has resulted in many such studies beingcarried out, yet these have not subsequently translatedinto a meaningful set of projects. Table 11.9 belowshows that the outlays and expenditure under thescheme have not been satisfactory during the Ninthand Tenth Plan periods. In line with the NationalUrban Transport Policy, the scheme is being revisedto raise the GoI grant.
11.139 A Task Force has been set up to suggest insti-tutional mechanism for better coordination in policyformulation, planning, and regulation of traffic andtransportation project in all million plus cities.
INTEGRATION OF LAND USE ANDTRANSPORT PLANNING11.140 Corridor development may be encouragedfor inter-city movement of goods and serviceswhile deliberate attempt may be made to discourage
TABLE 11.9Outlay and Expenditure
(Rs in Crore)
Item Ninth Plan Tenth Plan
Outlay Expenditure Outlay ExpenditureUrban transport planning 24.76 3.33 91.00 12.59
Source: Ministry of Urban Development, GoI.

Urban Infrastructure, Housing, Basic Services, and Poverty Alleviation 421
ribbon development, multi-modal corridors, andSEZs in close proximity to city areas need to be devel-oped.
PEDESTRIANIZATION AND NON-MOTORIZEDTRANSPORT (NMT)11.141 Special consideration needs to be given todesigning pedestrian and cyclist facilities along theroad and at intersections and the needs of the physi-cally challenged persons need to be taken care of. Theentire road network including footpaths, road cross-ings, service roads, carriageways, medians, bus stops,terminals, mass transit stations, parking facilities,etc. may be considered as per disabled-friendly designprinciples.
INTEGRATION OF TRANSPORT SYSTEM11.142 The benefits of common ticketing to the op-erators are reduced transactions and lower recurringcosts. Despite these advantages, the system of commonticketing has not picked up in India. A necessary con-dition for common ticketing across operators is thecreation of a mechanism that allows a fair share of therevenues earned from such common tickets. If there isonly a single service provider, sharing of revenue willnot be a problem while with multiple providers this isa complex task. Indore model of public transport couldbe replicated in other cities.
Appropriate/Cleaner Technologies forPublic Transport11.143 Vehicular emission is directly related to the fuelused, the technology employed, and the driving tech-
nique. Improvement in fuel quality can be achievedthrough removal/reduction of emission relatedconstituents in the fuels such as sulphur in diesel andsulphur, lead, benzene, and other aromatics in petrol.Further reduction of emissions can be obtainedthrough improved engine technology and exhausttreatment systems. Vehicles manufactured before FirstMass Emission Norms introduced in 1991 would re-quire to be replaced.
ROLE OF INTELLIGENT TRANSPORT SYSTEMS11.144 ITS encompasses a broad range of wireless andwire line communications-based information andelectronics technologies. When integrated into thetransportation system’s infrastructure, these technolo-gies relieve congestion, improve safety, and enhanceproductivity. Applied effectively, ITS and Servicescan save lives, time, and money as well as reduce threatsto our environment and create new business oppor-tunities.
11.145 A large investment of Rs 38000 crore hasbeen identified for the introduction of modern busesin the country during the Eleventh Plan. The govern-ment aims to replace all the existing urban buseswith ‘truck chassis body’ with low floor/semi lowfloor ultra modern buses on PPP basis. Table 11.10provides the financial requirement during the Elev-enth Plan.
11.146 The financial requirement to cater to the grow-ing demand in the Eleventh Plan would be Rs 132590crore as summarized in Table 11.11.
Box 11.14Best Practices in Public Transport
1. Indore ModelIndore city in Madhya Pradesh has evolved a PPP model for operation of city bus services. In this model, the investmenton the rolling stock is planned through private participation. The source of revenue for the private operator is from farecollection and from advertisements.
2. Revival of public transport in BangaloreBangalore Metropolitan Transport Corporation (BMTC) was created in 1997 by separating Bangalore depots of thetroubled Karnataka Road Transport Corporation from the mother company. It carried out a thorough internal restruc-turing, introduced cost and service monitoring, and sub-contracted some services to private operators on a gross-costbased scheme. In the span of two to three years, BMTC improved its services and fleet/staff productivity, and becameprofit making.
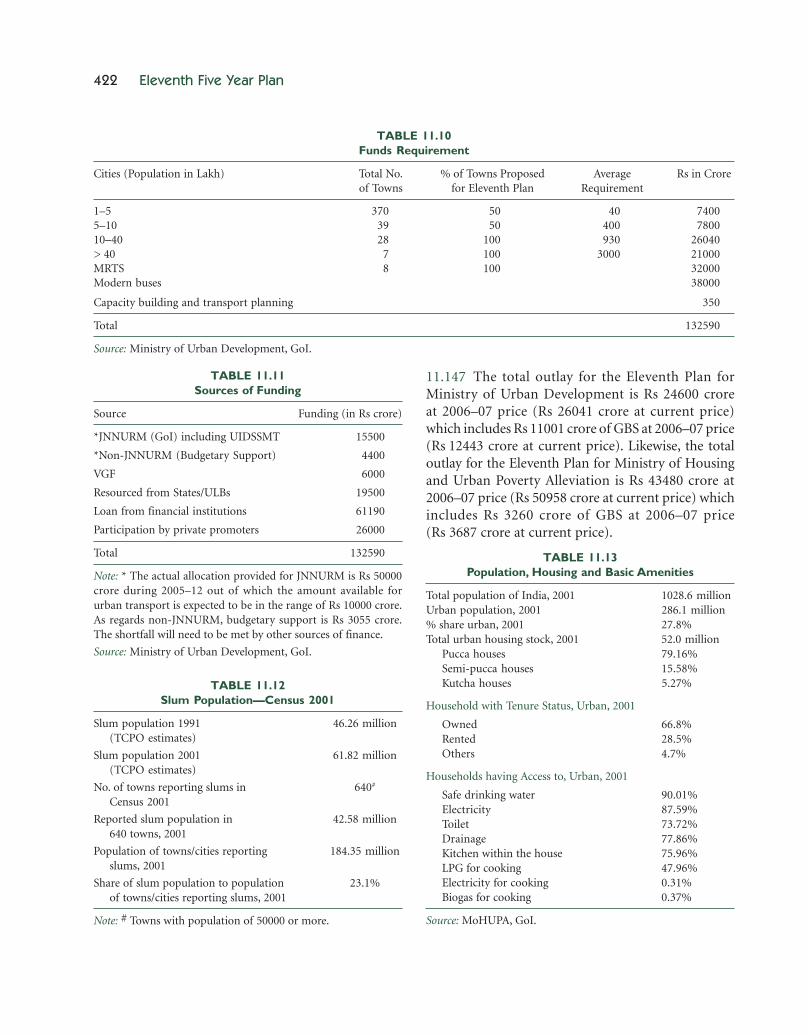
422 Eleventh Five Year Plan
TABLE 11.11Sources of Funding
Source Funding (in Rs crore)
*JNNURM (GoI) including UIDSSMT 15500
*Non-JNNURM (Budgetary Support) 4400
VGF 6000
Resourced from States/ULBs 19500
Loan from financial institutions 61190
Participation by private promoters 26000
Total 132590
Note: * The actual allocation provided for JNNURM is Rs 50000crore during 2005–12 out of which the amount available forurban transport is expected to be in the range of Rs 10000 crore.As regards non-JNNURM, budgetary support is Rs 3055 crore.The shortfall will need to be met by other sources of finance.
Source: Ministry of Urban Development, GoI.
TABLE 11.12Slum Population—Census 2001
Slum population 1991 46.26 million(TCPO estimates)
Slum population 2001 61.82 million(TCPO estimates)
No. of towns reporting slums in 640#
Census 2001
Reported slum population in 42.58 million640 towns, 2001
Population of towns/cities reporting 184.35 millionslums, 2001
Share of slum population to population 23.1%of towns/cities reporting slums, 2001
Note: # Towns with population of 50000 or more.
TABLE 11.13Population, Housing and Basic Amenities
Total population of India, 2001 1028.6 millionUrban population, 2001 286.1 million% share urban, 2001 27.8%Total urban housing stock, 2001 52.0 million
Pucca houses 79.16%Semi-pucca houses 15.58%Kutcha houses 5.27%
Household with Tenure Status, Urban, 2001
Owned 66.8%Rented 28.5%Others 4.7%
Households having Access to, Urban, 2001
Safe drinking water 90.01%Electricity 87.59%Toilet 73.72%Drainage 77.86%Kitchen within the house 75.96%LPG for cooking 47.96%Electricity for cooking 0.31%Biogas for cooking 0.37%
Source: MoHUPA, GoI.
TABLE 11.10Funds Requirement
Cities (Population in Lakh) Total No. % of Towns Proposed Average Rs in Croreof Towns for Eleventh Plan Requirement
1–5 370 50 40 74005–10 39 50 400 780010–40 28 100 930 26040> 40 7 100 3000 21000MRTS 8 100 32000Modern buses 38000
Capacity building and transport planning 350
Total 132590
Source: Ministry of Urban Development, GoI.
11.147 The total outlay for the Eleventh Plan forMinistry of Urban Development is Rs 24600 croreat 2006–07 price (Rs 26041 crore at current price)which includes Rs 11001 crore of GBS at 2006–07 price(Rs 12443 crore at current price). Likewise, the totaloutlay for the Eleventh Plan for Ministry of Housingand Urban Poverty Alleviation is Rs 43480 crore at2006–07 price (Rs 50958 crore at current price) whichincludes Rs 3260 crore of GBS at 2006–07 price(Rs 3687 crore at current price).

12Communications and InformationTechnology
12.1 TELECOMMUNICATIONS
OVERVIEW12.1.1 The development of world-class telecommu-nication infrastructure is the key to rapid economicand social development of the country. Driven byvarious policy initiatives, which include New TelecomPolicy (NTP)-1994 and later the NTP-1999, theIndian telecom sector witnessed a complete transfor-mation in the last decade. During this period, ithas achieved phenomenal growth and is poised totake a quantum leap. For bringing further acceleratedgrowth along with modernization in line withthe trends in other developed countries, the telecom-munication sector demands initiation of furtherpolicy measures and induction of state-of-the-arttechnologies.
PRESENT STATUS OF TELECOM NETWORKS12.1.2 The telecom services network has expandedfrom about 84000 connections (fixed line) at the timeof independence to about 206.83 million working con-nections as on March 2007 (which in turn consists of40.77 million fixed telephone lines and 166.05 millionmobile phones). Thus India’s present 206 million ro-bust telephone network, including mobile phones, isone of the largest in the world and second largestamong the emerging economies (after China) with awide range of services such as basic, cellular, Internet,
paging, Very Small Aperture Terminal (VSAT), etc. Thestatus of the present telecom network is as shown inTable 12.1.1.
12.1.3 The National Internet Exchange of India hasbeen set up by the Department of Information Tech-nology (DIT) to ensure that Internet traffic, originat-ing and destined for India, is routed within India. Thisis expected to substantially bring down the cost ofInternet usage. This will also enable more efficient useof international bandwidth and saving of foreignexchange. It will further improve the quality of ser-vices for the customers by being able to avoid multipleinternational hops and thus lowering delays. All thesein turn will lead to the popularization of ‘.in’ domainname and expansion of Internet.
TABLE 12.1.1Telecom Network Status in India as on March 2007
Number of telephone connections 206.83 millionNumber of telephone exchanges 38338Switching capacity (Public) 88.82 million (PSU)VPTs 564610Rural phones (Fixed + CDMA) 22655691Wireless (CDMA & GSM) subscribers 166.05 millionInternet connections 9.21 millionBroadband subscribers 2.28 millionOptical fibre route length (Public) 519155 route kmMicrowave route length (BSNL) 64506.64 km
Source: DoT.

424 Eleventh Five Year Plan
12.1.4 The government has taken several steps toencourage participation of private players to create acompetitive environment in the sector. Consequently,the private sector is now playing an important rolein expansion of the telecom sector. The number ofprivate sector licensees in telecommunications asshown in Table 12.1.2 also confirms this.
TELECOM DEVELOPMENT—INTERNATIONALCOMPARISON12.1.5 Telecommunication has grown very rapidly inIndia. However, viewed in the context of global growth
pattern and indicators, it needs to achieve more interms of teledensity as compared to other countries.There is a positive corelation between the teledensityand the GDP of a country as the growth in the tele-communication sector has linkages to the growth ofother sectors of the economy. The status of teledensityalong with other indicators such as per capita GDP,Internet users, etc., at international level is given in theTable 12.1.3.
REVIEW OF THE TENTH PLAN
Growth during the Tenth Plan Period12.1.6 The telecom sector has shown tremendousgrowth during the Tenth Plan period. It has alsoundergone a substantial change in terms of mobile ver-sus fixed phones and public versus private participa-tion. The Tenth Plan had envisaged a teledensity of9.91% by March 2007. In order to achieve this target,about 65.0 million additional connections were neededto be provided during the Tenth Plan. However, dur-ing 2002–07, the total telephone connections increasedby 161.86 million as on 31 March 2007, thereby achiev-ing a teledensity of 18.31% by March 2007 and exceed-ing the Tenth Plan target by 149%. With the openingof the telecom sector to the private operators, theirshare in the number of subscribers has significantlyincreased, which is evident from the Table 12.1.4.
TABLE 12.1.3Status of Telecom Indicators in Some Countries as on December 2005
Country Population GDP (per capita) Telephones Teledensity Internet Users(Million) US$ 2004 (’000) (%) (’000)
US 298.21 36273 360347 122.71 185000UK 59.67 26369 94791 158.51 37600Australia 20.16 25436 29880 148.25 14190Brazil 186.41 3338 107987 59.78 22000Mexico 107.03 6328 66974 62.58 18622Sri Lanka 20.74 1031 4606 22.20 280Korea (Rep) 48.29 14136 62087 128.56 33010Japan 128.08 31324 153525 119.86 64160Indonesia 222.87 1156 59682 26.79 16000China 1315.84 1268 743861 56.53 111000Pakistan 153.96 614 18049 11.72 10500India# 111.59 634 142092 12.74 60000World 6728.08 5944 3309379 49.45 964272
Note: #As on 31 March 2006.Source: International Telecommunication Union.
TABLE 12.1.2Private Sector Participation (as on 31 March 2006)
(Registrations/Licenses Issues)
Purpose/Area No. of Licenses/LOIs/Registration
Unified Access/Cellular Mobiles 78Basic Services 2National Long Distance 4Infrastructure Provider-I 105International Long Distance 5Internet Service 399Voice Mail and Audiotext Service 15Public Mobile Radio Trunk Service 37VSAT Service 11
Source: Working Group Report for Eleventh Plan on Telecommu-nications Sector, DoT.
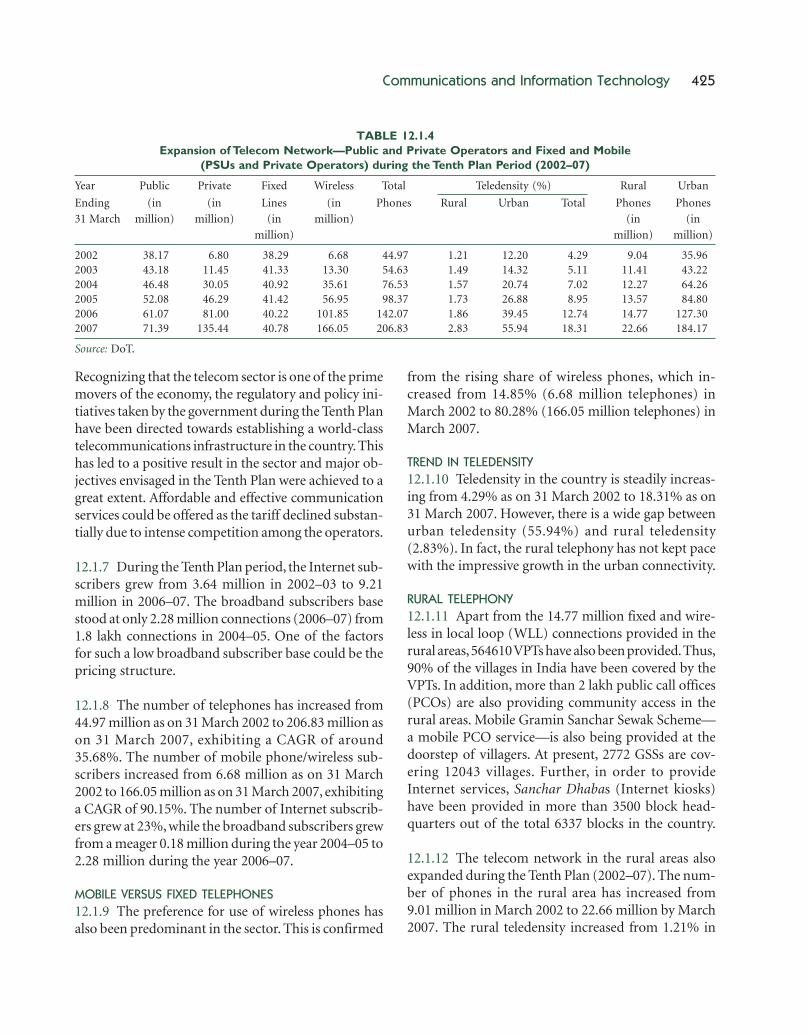
Communications and Information Technology 425
Recognizing that the telecom sector is one of the primemovers of the economy, the regulatory and policy ini-tiatives taken by the government during the Tenth Planhave been directed towards establishing a world-classtelecommunications infrastructure in the country. Thishas led to a positive result in the sector and major ob-jectives envisaged in the Tenth Plan were achieved to agreat extent. Affordable and effective communicationservices could be offered as the tariff declined substan-tially due to intense competition among the operators.
12.1.7 During the Tenth Plan period, the Internet sub-scribers grew from 3.64 million in 2002–03 to 9.21million in 2006–07. The broadband subscribers basestood at only 2.28 million connections (2006–07) from1.8 lakh connections in 2004–05. One of the factorsfor such a low broadband subscriber base could be thepricing structure.
12.1.8 The number of telephones has increased from44.97 million as on 31 March 2002 to 206.83 million ason 31 March 2007, exhibiting a CAGR of around35.68%. The number of mobile phone/wireless sub-scribers increased from 6.68 million as on 31 March2002 to 166.05 million as on 31 March 2007, exhibitinga CAGR of 90.15%. The number of Internet subscrib-ers grew at 23%, while the broadband subscribers grewfrom a meager 0.18 million during the year 2004–05 to2.28 million during the year 2006–07.
MOBILE VERSUS FIXED TELEPHONES12.1.9 The preference for use of wireless phones hasalso been predominant in the sector. This is confirmed
from the rising share of wireless phones, which in-creased from 14.85% (6.68 million telephones) inMarch 2002 to 80.28% (166.05 million telephones) inMarch 2007.
TREND IN TELEDENSITY12.1.10 Teledensity in the country is steadily increas-ing from 4.29% as on 31 March 2002 to 18.31% as on31 March 2007. However, there is a wide gap betweenurban teledensity (55.94%) and rural teledensity(2.83%). In fact, the rural telephony has not kept pacewith the impressive growth in the urban connectivity.
RURAL TELEPHONY12.1.11 Apart from the 14.77 million fixed and wire-less in local loop (WLL) connections provided in therural areas, 564610 VPTs have also been provided. Thus,90% of the villages in India have been covered by theVPTs. In addition, more than 2 lakh public call offices(PCOs) are also providing community access in therural areas. Mobile Gramin Sanchar Sewak Scheme—a mobile PCO service—is also being provided at thedoorstep of villagers. At present, 2772 GSSs are cov-ering 12043 villages. Further, in order to provideInternet services, Sanchar Dhabas (Internet kiosks)have been provided in more than 3500 block head-quarters out of the total 6337 blocks in the country.
12.1.12 The telecom network in the rural areas alsoexpanded during the Tenth Plan (2002–07). The num-ber of phones in the rural area has increased from9.01 million in March 2002 to 22.66 million by March2007. The rural teledensity increased from 1.21% in
TABLE 12.1.4Expansion of Telecom Network—Public and Private Operators and Fixed and Mobile
(PSUs and Private Operators) during the Tenth Plan Period (2002–07)
Year Public Private Fixed Wireless Total Teledensity (%) Rural Urban
Ending (in (in Lines (in Phones Rural Urban Total Phones Phones
31 March million) million) (in million) (in (in
million) million) million)
2002 38.17 6.80 38.29 6.68 44.97 1.21 12.20 4.29 9.04 35.962003 43.18 11.45 41.33 13.30 54.63 1.49 14.32 5.11 11.41 43.222004 46.48 30.05 40.92 35.61 76.53 1.57 20.74 7.02 12.27 64.262005 52.08 46.29 41.42 56.95 98.37 1.73 26.88 8.95 13.57 84.802006 61.07 81.00 40.22 101.85 142.07 1.86 39.45 12.74 14.77 127.302007 71.39 135.44 40.78 166.05 206.83 2.83 55.94 18.31 22.66 184.17
Source: DoT.
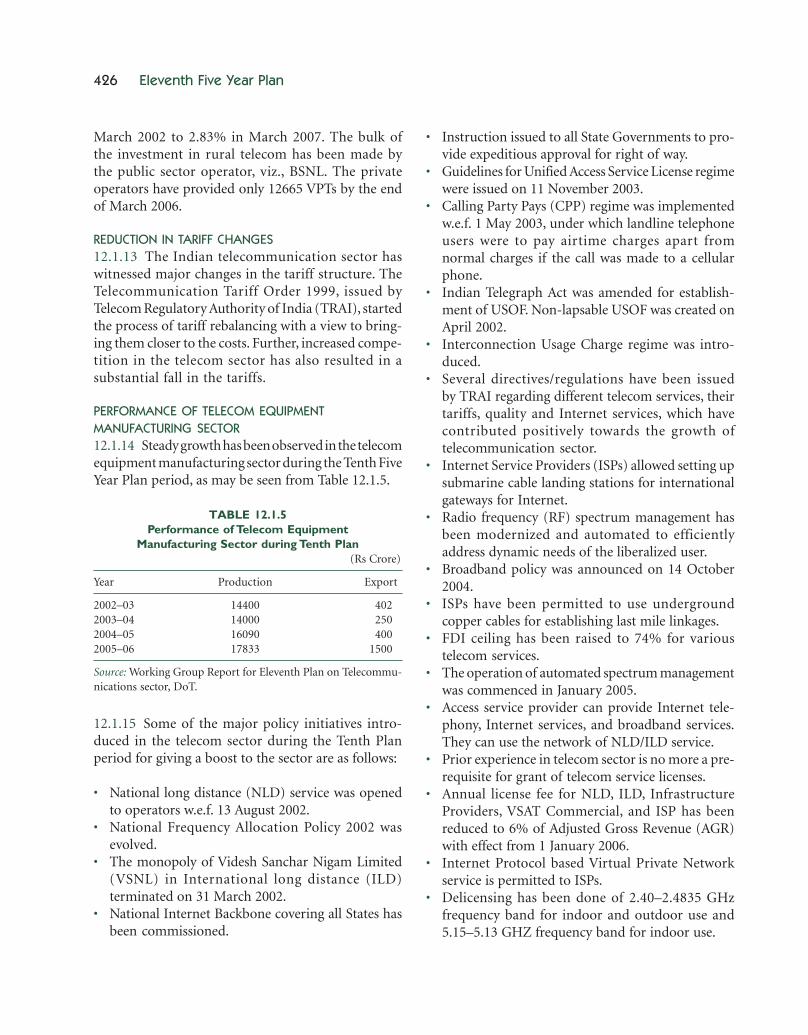
426 Eleventh Five Year Plan
March 2002 to 2.83% in March 2007. The bulk ofthe investment in rural telecom has been made bythe public sector operator, viz., BSNL. The privateoperators have provided only 12665 VPTs by the endof March 2006.
REDUCTION IN TARIFF CHANGES12.1.13 The Indian telecommunication sector haswitnessed major changes in the tariff structure. TheTelecommunication Tariff Order 1999, issued byTelecom Regulatory Authority of India (TRAI), startedthe process of tariff rebalancing with a view to bring-ing them closer to the costs. Further, increased compe-tition in the telecom sector has also resulted in asubstantial fall in the tariffs.
PERFORMANCE OF TELECOM EQUIPMENTMANUFACTURING SECTOR12.1.14 Steady growth has been observed in the telecomequipment manufacturing sector during the Tenth FiveYear Plan period, as may be seen from Table 12.1.5.
TABLE 12.1.5Performance of Telecom Equipment
Manufacturing Sector during Tenth Plan(Rs Crore)
Year Production Export
2002–03 14400 04022003–04 14000 02502004–05 16090 04002005–06 17833 1500
Source: Working Group Report for Eleventh Plan on Telecommu-nications sector, DoT.
12.1.15 Some of the major policy initiatives intro-duced in the telecom sector during the Tenth Planperiod for giving a boost to the sector are as follows:
• National long distance (NLD) service was openedto operators w.e.f. 13 August 2002.
• National Frequency Allocation Policy 2002 wasevolved.
• The monopoly of Videsh Sanchar Nigam Limited(VSNL) in International long distance (ILD)terminated on 31 March 2002.
• National Internet Backbone covering all States hasbeen commissioned.
• Instruction issued to all State Governments to pro-vide expeditious approval for right of way.
• Guidelines for Unified Access Service License regimewere issued on 11 November 2003.
• Calling Party Pays (CPP) regime was implementedw.e.f. 1 May 2003, under which landline telephoneusers were to pay airtime charges apart fromnormal charges if the call was made to a cellularphone.
• Indian Telegraph Act was amended for establish-ment of USOF. Non-lapsable USOF was created onApril 2002.
• Interconnection Usage Charge regime was intro-duced.
• Several directives/regulations have been issuedby TRAI regarding different telecom services, theirtariffs, quality and Internet services, which havecontributed positively towards the growth oftelecommunication sector.
• Internet Service Providers (ISPs) allowed setting upsubmarine cable landing stations for internationalgateways for Internet.
• Radio frequency (RF) spectrum management hasbeen modernized and automated to efficientlyaddress dynamic needs of the liberalized user.
• Broadband policy was announced on 14 October2004.
• ISPs have been permitted to use undergroundcopper cables for establishing last mile linkages.
• FDI ceiling has been raised to 74% for varioustelecom services.
• The operation of automated spectrum managementwas commenced in January 2005.
• Access service provider can provide Internet tele-phony, Internet services, and broadband services.They can use the network of NLD/ILD service.
• Prior experience in telecom sector is no more a pre-requisite for grant of telecom service licenses.
• Annual license fee for NLD, ILD, InfrastructureProviders, VSAT Commercial, and ISP has beenreduced to 6% of Adjusted Gross Revenue (AGR)with effect from 1 January 2006.
• Internet Protocol based Virtual Private Networkservice is permitted to ISPs.
• Delicensing has been done of 2.40–2.4835 GHzfrequency band for indoor and outdoor use and5.15–5.13 GHZ frequency band for indoor use.

Communications and Information Technology 427
12.1.16 In addition to the above, certain exemptions/concessions have been given on the customs duty forimportant equipments as well as components, besidesexcise duty exemptions for benefit under indirect taxes.
Investments during the Tenth Plan12.1.17 During this period, the public sector opera-tors, viz., BSNL and MTNL, as well as the privateoperators made major investments in cellular mobilesegment. While PSUs account for 71.39 million con-nections (both fixed and mobile) as on March 2007,the private operators account for 135.44 million lines.More than 97% of the private sector lines are in thewireless category. The total estimated investments bythe public sector operators during the Tenth Plan wereRs 39467.21 crore.
BROAD OBJECTIVES AND THRUST AREAS INTELECOM SECTOR DURING THE ELEVENTH PLAN12.1.18 Keeping in view the targets for the telecomsector, the Eleventh Plan has been formulated accord-ingly. Basically, the approach will be towards achiev-ing faster, broader, and inclusive growth. Further,keeping in view the digital divide, special attention willbe paid to enhance the rural connectivity. The broadobjectives for the telecom sector during the EleventhPlan period (2007–12) will be as follows:
• To reach a telecom subscriber base of 600 million.• To provide 200 million rural telephone connections
by 2012, that is to reach a rural teledensity of 25%.• To provide telephone connection on demand across
the country at an affordable price.• To reach a target of 20 million broadband connec-
tions and 40 million Internet connections by 2010as envisaged in Broadband Policy 2004.
• To provide broadband connection on demandacross the country by 2012.
• To provide Third Generation (3G) services in allcities/towns with more than 1 lakh population.
• To facilitate introduction of mobile TV.• To provide broadband connectivity to every second-
ary school (SS), health centre, GP on demand intwo years.
• To make India a hub for telecom equipment manu-facturing by facilitating establishment of telecomspecific SEZs.
12.1.19 Establishing centres of excellence in premiereducational institutions and other reputed organiza-tions in the country in PPP mode. The centres canfocus on emerging areas such as Next GenerationNetworks (NGN), Wireless Broadband, TelecomNetwork Security, etc. Special intervention is requiredto connect rural areas for providing voice and dataconnectivity.
Targets in Telecom Sector duringthe Eleventh Five Year Plan12.1.20 In consonance with the above objectives,the broad targets identified by the DoT for theEleventh Plan period are given in the following para-graphs.
12.1.21 Network Expansion andRural Telephony• One telephone per three rural households by 2007
(about 50 million rural connections).• One phone per two rural households by 2010 (about
100 million rural connections).• 200 million rural connections by 2012 (i.e. a rural
teledensity of 25%).• For rural telephony network expansion the strate-
gies will be to provide individual access: (i) throughmarket forces for viable areas and (ii) USOF fornon-viable areas.
• For providing public access in rural areas, USOFwill be provided for (i) VPTs; and (ii) Rural Com-munity Phones (RCPs).
• For rural telephony the infrastructure will be sharedat least amongst three service providers.
• To support for development of general telecominfrastructure in rural areas, initially pilot projectswould be undertaken for the same.
12.1.22 Broadband Coverage• Broadband coverage for all secondary and higher
secondary schools is stipulated by 2007.• Broadband coverage for all public health care
centres is stipulated by 2007.• Broadband coverage for all GPs is stipulated by
2010.• Linkage is to be provided between block headquar-
ters and nearest exchange for completing State-widearea networks (SWANs) connectivity.

428 Eleventh Five Year Plan
• Existing infrastructure of rural exchanges andOFC will be used.
• Wireless technology will be deployed.
12.1.23 Manufacturing and R&D• Making India a hub for telecom manufacturing by
facilitating more and more telecom specific SEZs.• Providing platform for export promotion of tele-
phone equipment and services by setting up ExportPromotion Council.
• Promoting R&D in key and emerging technologiesappropriate for the country as well as in the area oftelecom network security.
12.1.24 The DoT has proposed to take up the follow-ing programmes/initiatives during the Eleventh FiveYear Plan period:
• Identify and make available adequate spectrum forboth expansion of network and introduction of newvalue-added services.
• Setting up of Telecom Testing and Security Certifi-cation Centre (TETC).
• Setting up of Centre for Communication SecurityResearch and Monitoring.
• Setting up of NGN Laboratory.• Undersea cabling between Mainland and Andaman
& Nicobar (A&N) Islands.• Modernization of Radio Spectrum Monitoring
Capabilities.• Promote induction of new technologies at Indian
Telephone Industries.• Setting up of Telecom Export Promotion Forum/
Council for promotion of export of telecom services.
Projection of Investment in Telecom Sectorfor the Eleventh Plan12.1.25 The public sector investment in the telecom-munication sector (through BSNL and MTNL) wouldbe mainly funded through IEBR to the tune ofRs 80753.00 crore at 2006–07 price and Rs 89581.56crore at current price (including Rs 337.47 crore byC-DOT as internal resources) over the Eleventh Planperiod. It is assumed that the private investment in thissector will also grow substantially. The total investmentin the telecommunication sector during the EleventhPlan period is projected at about Rs 231000 crore.
KEY CONSTRAINTS AND CHALLENGES12.1.26 Some of the major constraints and challengesbeing faced by the Indian telecom sector are:
• RF spectrum being a limited resource, with com-peting and increasing demands, there is a need tohave optimal and efficient use with greater sharingof this resource by all stakeholders. Therefore,effective RF spectrum planning has to be carriedout for short term, medium term, and long term,taking into account the emerging new technologies.
• Although a teledensity of 18.31% has been achieved,there exists a wide gap between urban teledensity(55.94%) and rural teledensity (2.83%). Consider-ing the fact that 70% of the population lives inrural areas in India, the real challenge will be toconnect rural India.
• As voice-based connectivity (telephony) alone maynot be the best economically viable option. There-fore, the connectivity should predominantly be databased having killer applications to make it sustain-able on which voice services can also be provided.
• For an effective roll out the rural broadbandconnectivity would also need support through theUSOF.
• To accelerate broadband connectivity, equipmentsneed to be made available at an affordable price. Inaddition, local content in local languages need tobe developed.
• The transformation of traditional public telecom-munications networks into Internet Protocol (IP)based NGN will require significant technical,human, as well as financial resources. Furtheractivities relating to migration to Internet Protocolversion-6 will have to be given priority, in order tospread Internet much faster.
• Communication network needs to be adequatelyprotected for which necessary network securityrelated initiatives need to be put in place.
• The slow growth of telecom manufacturing sectoris an area of major concern. The NTP 1999 soughtto promote exports of telecom equipments andservices. But till date export of telecom equipmentremains minimal. Most of the state-of-the-arttelecom equipment including mobile phones areimported from abroad. There is thus an immensepotential for indigenous manufacturing in India.

Communications and Information Technology 429
Policy Issues12.1.27 In order to achieve the targets laid down intelecom sector for the Eleventh Five Year Plan, properand conducive policy initiatives need to be introducedby the government in its various sub-sectors, such asRural Network Expansion, Broadband and Internet,Telecom Equipment Manufacturing, Telecom R&D,etc. The broad policy initiatives envisaged in thisregard may be as follows:
• It is absolutely essential to carry out appropriate re-farming of the RF spectrum keeping in view theneeds of various sectors. Further, some amountof spectrum may have to be kept reserved fordeploying new services including rural broadband,3G, Voice over Internet Protocol (VoIP), etc. Whileallocating spectrum the international practicesshould be kept in view, so that India can takeadvantage of the economies of scale. Bringing in aregime of unified licensing could also be consid-ered for most efficient utilization of the allottedspectrum.
• It is essential to promote sharing of infrastructureby the service providers and incentivizing suchsharing so that overall costs can be kept down.This is also expected to accelerate the pace of ruralpenetration of the telecom networks.
• Special attention needs to be paid to the most back-ward and remote areas such as, the North East, J&K,tribal belts, and island authorities. Cost may not bea consideration, while providing connectivity tothese areas.
• Suitable policy initiatives need to be introduced forpromoting telecom equipment manufacturing inthe country. Further, there should be a co-ordinatedapproach to promote PPPs for R&D activities intelecom equipment. In addition, initiatives suchas formation of common product certification toInternational Standards and Testing Facility forGlobal Accreditation, setting up of Mega Fabrica-tion Units (FAB) facility for the manufacture ofIntegrated Circuits (IC), Development of HardwareManufacturing Cluster Parks (HMCPs), etc., alsoneed to be taken up to make India a telecom equip-ment manufacture hub.
• Adequate and availability of international andnational bandwidth at low cost also need to be
ensured through appropriate technologies andpolicy interventions.
Special Issues in Successful Roll Out of RuralTelephony and Broadband12.1.28 As has been observed that in spite of substan-tial achievements in telecom sector during the TenthPlan period, the rural teledensity continues to be verylow as compared to the present national average of18.31%. The mobile telephony costs are one-fifth of thefixed line costs. The low penetration of cellular mobileservices in the rural areas so far can be attributed toinadequate infrastructure, in the form of towersand power supply, as well as lower revenue potential.However, with mobile tariffs falling, there is a likeli-hood of huge demand for mobile telephones in ruralareas. But for successful rural roll out of mobile tele-phones, unless there is adequate coverage of towers andother related infrastructure, the demand cannot be met.
12.1.29 The government has introduced a schemefor expansion of rural mobile infrastructure throughcreation of shared passive infrastructure under USOF.Moreover, rural telecom expansion needs to be facili-tated through setting up of triple play networks (viz.3G networks) to deliver multiple services (i.e., voice,data, and video) at viable prices and bridge the infor-mation divide in rural areas. Through such networks,a single operator would be able to deliver variousservices to subscribers on a single medium.
12.1.30 Thus, for the successful roll out of telephonesand broadband in the rural areas the following aspectsshould be considered by the policy makers and otherstakeholders on priority basis: (i) proper infrastruc-ture for access to telecom network; (ii) suitable accessdevices; and (iii) proper and adequate content. Ulti-mately, for any service to be useful, it should have valuefor the consumer. Therefore, the rural service shouldhave adequate and relevant content. Each category ofconsumers has different needs and assigns differentvalue to the various content and services being offered.Therefore solutions regarding content and servicesfor high-end consumers, the middle class in citiesand towns, the mass market, and rural users needto be considered separately. As such, there will be aneed to develop large numbers of content providers,

430 Eleventh Five Year Plan
particularly RCPs including local language contentproviders, for which proper training courses may bedesigned and implemented through various existinginstitutions. Further, proper policy initiatives shouldbe put in place to regulate the content effectively asper existing standards.
NEW INITIATIVES IN TELECOMMUNICATION SECTOR12.1.31 It has been seen that broadband/bandwidthpenetration has a multiplier effect on the economy.Experience in other countries has shown that broad-band penetration has a positive correlation with thenational income.
12.1.32 Bandwidth is an essential ingredient for car-rying signals in today’s information-based economy.It is a fact that despite nearly 850000 route km of OFCinfrastructure, the geographical availability of thebandwidth remains poor in as much as the rural andremote areas which constitute bulk of the nation andcontinue to suffer from poor availability and expen-sive bandwidth. Many countries are putting in placenational strategies for broadband promotion. InIndia, with the liberalization of telecom sector, broad-band access has been driven largely by the privatesector. The government has set a target for 20 millionbroadband and 40 million internet users (connections)by 2010. For this to happen, the PC penetration has tobe substantially increased by way of suitable policyinterventions both fiscal and non-fiscal.
12.1.33 India is poised with many interventions suchas e-governance, rural connectivity, and e-educationleading to creation of the bandwidth capacity which isalso likely to increase the penetration of personal com-puters (PC), Internet, and broadband users. The band-width requirements would be in excess of 10 terabitsper second (Tbps), of which at least 2000 gigabits persecond (Gbps) (2 Tbps) would be the internationalbandwidth requirements. Keeping in view such a largebandwidth requirement there is a need to put in placeappropriate policy initiatives such as:
• Pricing Policy: India is a highly price-sensitivemarket. If the price is right then the acceptance of aservice or goods is very high, and the telecommu-nications market has amply proven this fact.
Bandwidth, if looked at as a commodity, needs tobe priced rightly for bringing in the desired off-take.Reselling of bandwidth for domestic usage shouldbe allowed which is one of the best ways to createcompetition and roll out of infrastructure.
• Fiscal Policies: The following aspects need to beconsidered:– Encourage availability of low-cost access devices.– Decrease duties on items used in broadband
networks and equalize duties on inputs fordomestically manufactured goods with thoseon finished imports.
– Provide appropriate tax structure to enablegrowth, without having to forego significantrevenue.
• Co-ordination between PSUs: BSNL should be en-couraged to co-ordinate with the consortium ofPSUs—POWERTEL, GAILTEL, and RAILTEL—toidentify clearly the additional villages that could beprovided broadband connectivity by utilizing thelatter’s network due to the nature of coverage pro-vided by their network. Suitable financial incentivesshould be worked out by the USO Administratorto facilitate this programme.
Introduction of New Value-added Services• Over the last decade, television landscape has
undergone a sea change. Now, Internet ProtocolTelevision (IPTV) has arrived, which uses point-to-point connection as compared to broadcast con-nection and uses multi-casting techniques to givebroadcasting effect. Since it is a point-to-pointconnection similar to the normal voice and dataconnections, it leads to converged provisioning ofvoice, video, and data—referred to as triple play—through a single medium. IPTV can be providedby cable TV service operators as well as telephonyservice operators. In fact, IPTV is widely regardedas the killer application for broadband particularlyin the rural areas. This would also help in makingthe Common Service Centres (CSCs) more viable.
• Mobile TV is yet another technology which permitsintegration of mobility with TV viewing. Since thehand-held device used for mobile TV reception canalso be used for normal voice and data communi-cation, this technology represents a four-way con-vergence referred to as quadruple play. The use of
Communications and Information Technology 431
services such as 3G for video transmission shouldbring in mobile TV in the normal course. However,the alternative approach promises great advantagessince it uses broadcast technology for video recep-tion at a frequency other than the one used for voiceand data applications, such as the FM radio onhandsets.
• On the regulatory and pricing front, there will bea need for the down-linking guidelines to bemodified to permit broadcasters/content providersto provide their content to IPTV and mobile TVservice providers also. The technology enables theservice providers to add their own content also onthese platforms. Therefore, there will also be a needfor regulatory mechanism to regulate the contenton the IPTV and mobile TV.
The Path Ahead12.1.34 In order to ensure further accelerated develop-ment in the telecom sector during the Eleventh Five YearPlan, the following aspects will have to be considered:
• The overall focus of the Eleventh Five Year Plan, inrespect of telecom, would be on evolving a strategyfor the development of world-class infrastructurefor supporting accelerated growth of all sectors,bridging the digital divide, an optimum utilizationof spectrum, focus on policy recommendations forpromotion of private sector investment includingFDI, and to take suitable initiatives for improvingthe performance of telecom equipment manufac-turing sector.
• Availability of local content and applications is animportant constituent for overall growth of Internetand broadband services. For achieving these goalsfollowing major steps may have to be undertaken:(i) facilitation for creation of multimedia andvideo content in the country; (ii) devising properincentive for development of regional and local lan-guage content; (iii) thrust to the developmentof content and application for e-governance, e-education, e-health.
• Effective promotion and diversified use of sharedrural broadband infrastructure to provide newopportunities, augment income, promote overalldevelopment in the areas of tele-education, tele-medicine, and e-governance.
• Online retail in a broadband environment may bepromoted. The role of other facilitators such aselectricity authorities, Department of IT of variousState Governments, department of local self-governments, Panchayats, Department of Agricul-ture, Department of Health and Family Welfare,Department of Education, needs to be properly co-ordinated, so that these departments/organizations/agencies can carry forward the advantages of broad-band services to users particularly in rural areas.
12.1.35 The GBS for the Eleventh Five Year Plan ofthe DoT has been tentatively fixed at Rs 1549 crore at2006–07 constant price (Rs 1752 crore at current price)and Rs 79204 crore of IEBR at 2006–07 price (Rs 89582crore at current price).
12.2 INFORMATION TECHNOLOGY
OVERVIEW12.2.1 Information Technology has contributed tre-mendously to the progress of our country and providedgreat leadership to Indian enterprise and creativity inthe past decade. Breakthroughs in technology and in-novative applications have brought vast benefits tovarious sectors and sub-sectors of the economy ofthe country. The entire gamut of IT-related services—including software and services, data and businessprocessing services, and IT-enabled services—haveemerged as a large knowledge-based sector of oureconomy. The industry has not only come into itsown, both in terms of investment and employment,but is also having a positive knock-on effect onother manufacturing and services sectors. It is contrib-uting to increased productivity and competitivenessacross a wide range of activities. We have a dynamicentrepreneurial class that has gained confidence in itsability to compete, with skilled professionals and ex-cellent management capability. Today, a majority of thecompanies in India have already aligned their internalprocesses and practices to international standards.
REVIEW OF THE TENTH PLAN
IT Software (Domestic Segment)12.2.2 The domestic IT market in India was valued atapproximately Rs 54000 crore in 2006. This segment

432 Eleventh Five Year Plan
has grown at a CAGR of 19.7% over the past sixyears.
Policy Reforms Introduced and New Initiatives12.2.3 Some of the major policy initiatives introducedas well as other programmatic initiatives taken bythe Central and various State Governments in theIT sector during the Tenth Plan period are given inBoxes 12.2.1 and 12.2.2.
National Informatics Centre (NIC)12.2.4 NIC is a nodal S&T organization providinge-governance network and technical support to theCentral Government, State Governments, UTs, andabout 600 district administrations in the country. Ithas been facilitating the process of e-governance in thecountry for the last 30 years.
IT Hardware Manufacturing12.2.5 Hardware manufacturing has been recognizedas one of the engines for economic growth and creationof wealth. India’s manufacturing competitiveness is
because of the factors such as low-cost labour and thetalent pool of three million graduates passing out ofuniversities every year. Also, the raw material is one ofthe richest sources of our country. The electronicsproduction and electronics export of various sectorsof IT hardware and software in the Tenth Five YearPlan are given in Annexures 12.2.1 and 12.2.2. Theoverall annual growth in electronics hardware produc-tion was 15%–16%. The exports constituted about16% of the total production.
Human Resource Development in IT12.2.6 India has been developing as a major hub inknowledge creation in IT and electronics in the globalarena. The number of professionals employed in thissector had grown to 1.28 million by 2005–06.
Nanotechnology12.2.7 Nanotechnology is widely regarded as the nexttechnological revolution. It has attracted the attentionof scientists, researchers, and technologists all over theworld and is likely to have a profound effect on almost
Box 12.2.1Major Government Initiatives
• NeGP: The NeGP unveiled by the government covers 27 MMPs and 8 support components which are to be implementedat Central, State, and local government levels, at an estimated cost of Rs 23000 crore.
• SWANs: The scheme envisages establishment of SWANs across the country in all 29 States and 6 UTs from State head-quarters up to the block level with a minimum bandwidth capacity of 2 Mbps, at a total cost of Rs 3334 crore.
• Community Information Centres (CICs): CICs numbering 487 in the North Eastern States, 135 in Jammu and Kashmir,41 in A&N Islands, and 30 in Lakshadweep Islands have been established at a total cost of Rs 305 crore and are providinge-governance services and training to the local populace effectively.
• Common Service Centres (CSCs): The scheme envisages establishment of more than 100000 CSCs across the countryat a total cost of Rs 5742 crore. The CSCs will be established in a honeycomb pattern covering all the 600000 villages inthe country for delivery of content and services such as e-governance, education, entertainment, telemedicine,agriculture, etc.
• Project Relating to Spatial Data Infrastructure for Multi-Layered GIS for Planning: Starting with village as a unit, multi-layered databases would be developed in stand-alone GIS, distributed GIS, and web-based network-centric GIS environ-ments to demonstrate the benefits of GIS at various levels of planning and decision making.
• Computer-aided Digital Mapping Project for Six Cities—Ahmedabad, Bangalore, Chennai, Hyderabad, Kolkata, andMumbai: The benefits of the project include better services to citizens at large and better preparedness for disaster man-agement. This project involves preparation of digital maps along with the digital mapping of utilities such as water,sewage, electricity, roads, communications, gas, pipelines, etc.
• Semiconductor Industry/FAB: The time is ripe to make India a preferred destination for the manufacture of semiconduc-tors and associated devices. The government has issued a notification in March 2007 relating to the Special IncentivePackage for setting up of semiconductor fabrication and other micro and nanotechnology manufacture industries inIndia.
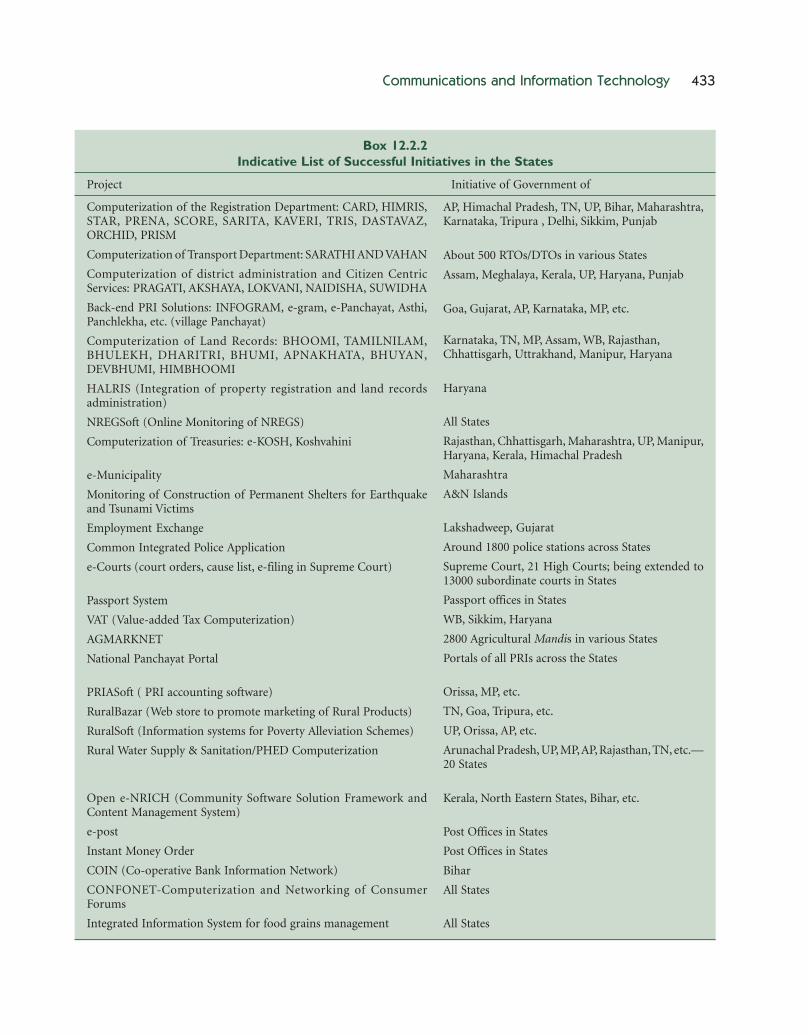
Communications and Information Technology 433
Initiative of Government ofProject
Box 12.2.2Indicative List of Successful Initiatives in the States
Computerization of the Registration Department: CARD, HIMRIS,STAR, PRENA, SCORE, SARITA, KAVERI, TRIS, DASTAVAZ,ORCHID, PRISM
Computerization of Transport Department: SARATHI AND VAHAN
Computerization of district administration and Citizen CentricServices: PRAGATI, AKSHAYA, LOKVANI, NAIDISHA, SUWIDHA
Back-end PRI Solutions: INFOGRAM, e-gram, e-Panchayat, Asthi,Panchlekha, etc. (village Panchayat)
Computerization of Land Records: BHOOMI, TAMILNILAM,BHULEKH, DHARITRI, BHUMI, APNAKHATA, BHUYAN,DEVBHUMI, HIMBHOOMI
HALRIS (Integration of property registration and land recordsadministration)
NREGSoft (Online Monitoring of NREGS)
Computerization of Treasuries: e-KOSH, Koshvahini
e-Municipality
Monitoring of Construction of Permanent Shelters for Earthquakeand Tsunami Victims
Employment Exchange
Common Integrated Police Application
e-Courts (court orders, cause list, e-filing in Supreme Court)
Passport System
VAT (Value-added Tax Computerization)
AGMARKNET
National Panchayat Portal
PRIASoft ( PRI accounting software)
RuralBazar (Web store to promote marketing of Rural Products)
RuralSoft (Information systems for Poverty Alleviation Schemes)
Rural Water Supply & Sanitation/PHED Computerization
Open e-NRICH (Community Software Solution Framework andContent Management System)
e-post
Instant Money Order
COIN (Co-operative Bank Information Network)
CONFONET-Computerization and Networking of ConsumerForums
Integrated Information System for food grains management
AP, Himachal Pradesh, TN, UP, Bihar, Maharashtra,Karnataka, Tripura , Delhi, Sikkim, Punjab
About 500 RTOs/DTOs in various States
Assam, Meghalaya, Kerala, UP, Haryana, Punjab
Goa, Gujarat, AP, Karnataka, MP, etc.
Karnataka, TN, MP, Assam, WB, Rajasthan,Chhattisgarh, Uttrakhand, Manipur, Haryana
Haryana
All States
Rajasthan, Chhattisgarh, Maharashtra, UP, Manipur,Haryana, Kerala, Himachal Pradesh
Maharashtra
A&N Islands
Lakshadweep, Gujarat
Around 1800 police stations across States
Supreme Court, 21 High Courts; being extended to13000 subordinate courts in States
Passport offices in States
WB, Sikkim, Haryana
2800 Agricultural Mandis in various States
Portals of all PRIs across the States
Orissa, MP, etc.
TN, Goa, Tripura, etc.
UP, Orissa, AP, etc.
Arunachal Pradesh, UP, MP, AP, Rajasthan, TN, etc.—20 States
Kerala, North Eastern States, Bihar, etc.
Post Offices in States
Post Offices in States
Bihar
All States
All States
434 Eleventh Five Year Plan
all industry sectors and application areas. India startedR&D funding in the area of nanotechnology duringthe Tenth Plan and projects relating to nano-electron-ics with a total outlay of about Rs 127 crore have beeninitiated.
VISION AND STRATEGY FOR THE ELEVENTHFIVE YEAR PLAN12.2.8 The Eleventh Plan Vision for the InformationTechnology sector envisages newer technology devel-opment, entrepreneurship, and innovation. Buildingon the existing strengths and base in the software sec-tor, we need to address the shortage of trained humanresource, bridging the digital divide, and strengthen-ing the IT hardware manufacturing base in the coun-try so that India emerges as a regional hub for hardwaremanufacturing and exports. Our software industryneeds to move up in the value chain from services toproduct development and create IPR.
12.2.9 Appropriate strategies encompassing fiscal andnon-fiscal initiatives would need to be introduced in aco-ordinated manner to enable India to become worldleader in IT software and services including ITES andbecome a regional hub for IT and electronics hard-ware manufacturing. Taking advantage of the demo-graphic dividend, we need to create a bank of highlytrained manpower not only to meet the domesticrequirement but also for the rest of the world.
Policy Issues, Programme Reforms, and NewInitiatives in the Eleventh Plan12.2.10 The Eleventh Plan objective of faster and in-clusive growth calls for many new initiatives, namely,creation of integrated modern townships across thecountry for IT industries, formulation of proactiveIT-electronics hardware manufacturing policy, devel-opment of trained manpower to meet the requirementof the industries on a continuous basis, and promot-ing R&D in few selected niche areas wherein we havethe ability to become global leaders. Another impor-tant area which needs acceleration is the NeGp for pro-viding all government services to the common man inhis locality through common service delivery outletsand ensuring efficiency, transparency, and reliabilityof such services at affordable costs to realize the basicneeds of the common man. Issues of re-engineering
and management of change are of paramount impor-tance in comparison to technical issues associated withe-governance.
12.2.11 The demand for hardware is expected to growat a rate of 30%, as against 18% at present. This wouldbe fuelled by the aspirations of the younger genera-tion and the large middle class with increasing dispos-able incomes in India. By the year 2010, the hardwaremarket is expected to be of the order of US$ 85 bil-lion. If the hardware production continues to grow atthe present growth rate, there would be a large gapbetween demand and supply, which will have to be metthrough imports. In this scenario, we will approach asituation wherein foreign exchange outgo on accountof import of hardware could be more than the foreignexchange earned by the country through export ofsoftware and services. In addition, this sector has thepotential of generating large employment opportuni-ties. Keeping this in view, electronics/IT hardwaremanufacturing has been identified as a thrust area.Major policy intervention on priority basis is requiredto promote the growth of Electronics/IT HardwareManufacturing Industry so as to meet the growingdemand.
12.2.12 Semiconductor Manufacturing Industry:With increasing demand for domestic electronic goodsand the availability of a pool of talented engineers,India is fast creating a footprint in the semiconductorarea. The Indian semiconductor industry is currentlydominated by players engaged in chip designing ac-tivities. India must compete aggressively by adoptinga coherent strategy for building up a semiconductorfabrication facility. The electronic goods manufactur-ers would create a substantial demand for IC in thecountry. The fabrication facility would help reap ben-efits for the nanotechnology industries in the comingyears. FAB would cater not only to the domestic mar-ket, but the country would also be able to reach out tothe global semiconductor market in specific productcategories. A special incentive package has been an-nounced for setting up of semiconductor fabricationand other micro-technology and nanotechnologymanufacturing industries in India which is expectedto fuel further growth of semiconductor manufactur-ing in India.

Communications and Information Technology 435
SETTING-UP OF INTEGRATED MODERN TOWNSHIPSFOR SUNRISE INDUSTRIES INCLUDING IT AND BPO12.2.13 IT industry lends itself for easy mobility, andwith the large number of educational institutions com-ing up across the country, there is a need to move theIT-ITES/BPO industries to tier-2 and tier-3 cities forpromoting inclusive growth. In addition, it is also im-portant to create ‘Information Technology InvestmentRegions’ for setting-up Integrated Modern Townshipsfor Sunrise Industries including IT/ITES/electronichardware in the country.
CYBER SECURITY12.2.14 As IT infrastructure is increasingly becominga substratum of all economic activities, the operationalstability and security of critical information infrastruc-ture has become vital for economic security of thecountry. This calls for concerted efforts from the gov-ernment, the industry as well as the service providersto secure their IT infrastructure. Following organiza-tions are presently dealing with the cyber securityissues in the country.
INDIAN COMPUTER EMERGENCY RESPONSE TEAM(CERT-IN)• CERT-In is a functional organization with the
objective of securing Indian cyber space. It providesincident prevention and response services as wellas security and quality management services, andcreates awareness on security issues throughdissemination of information on its website andoperates 24 × 7 Incident Response Help Desk. Itsactivities comprise handling of security incidents,issuing of e-security alerts, publishing of advisories,vulnerability notes; and security guidelines, track-ing of Indian website defacements, etc.
GOVERNMENT DEPARTMENTS SECURITY• NIC, the e-governance support organization for
government departments, has been taking varioussecurity measures for providing secure IT environ-ment. These include data centre security, user sys-tems security, security polices and procedure, andregular security audits for compliance checking. Thedata centre security comprises network firewall, in-trusion prevention systems, application firewalls,Secure Sockets Layer (SSL)/Virtual Private Network
(VPN) security, etc. The application security auditis conducted on any new application before it canbe hosted. Besides, antivirus and software patchmanagement is ensured for the servers and desktopsystems all over National Informatics Centre Net-work (NICNET). Continuous security monitoringof network is done.
REGIONAL CYBER SECURITY RESEARCH CENTRE(RCSRC)• NASSCOM in association with Chandigarh Admin-
istration has established an RCSRC to deal with allcyber security issues in collaboration with the ITindustry. The Centre will aid and advise organiza-tions in cyber security policy enforcements, conductof security audits and incident handling. Itwill also provide various IT organizations and thepolice department, consultancy for design of securenetworks, including deployment of security admin-istration software such as intrusion detection, man-agement of security software, and vulnerabilitychecking, protection against port scanners, pass-word crackers, and other issues.
HIGH PERFORMANCE COMPUTING12.2.15 High performance and grid computing is thenext generation of computing facilities which would bewidely used in a number of areas such as solving newerclass of mathematical problems of various complexities,high energy physics, nuclear physics, climate science,structural biology, enzyme catalysis, genomics, bio-informatics, etc. The objective of grid application is toshare the computational power across the grid bythe members for enhanced service delivery and enablefast data access. There is a need for developing high-speed backbone connecting the computers on the grid,development of application software, and capacitybuilding through R&D and training of required humanresources.
TECHNOLOGY DEVELOPMENT IN INDIANLANGUAGES12.2.16 India is a multilingual country. There is, there-fore, a need to provide user-friendly and cost-effective tools, applications, and content that enableaccess to ICT infrastructure in Indian languages. Theissues relating to linguistic data resource, content

436 Eleventh Five Year Plan
creation, language processing tools, and such technolo-gies as optical character recognition, text-to-speech,speech recognition, cross-lingual information retrieval,and machine translation in multilingual environmentare being addressed. To make available the fruits of ITdevelopment to the common man, fonts and softwaretools for some of the Indian languages such as Hindi,Tamil, Telugu, Assamese, Kannada, Malayalam,Marathi, Oriya, Punjabi, and Urdu have been releasedin public domains. There is need for developing simi-lar software tools and fonts for other languages in thecoming years.
DIGITAL LIBRARY OF INDIA12.2.17 Digital library offers many advantages over thetraditional libraries. Having no physical boundariesand space constraints, the digital libraries are avail-able round the clock with multiple accesses at mul-tiple locations in a most cost-effective way.
12.2.18 The Digital Library of India, hosted by theIndian Institute of Science, Bangalore, provides freeaccess to many books in English and Indian languagesand has digitized more than 2.97 lakh books contain-ing a total of approximately 80.7 million pages tillSeptember 2007. Similarly, other digital libraries,which are mostly accessible to their own members,have been in existence at many locations in India aswell as in many other countries. Therefore, the maininitiative, in addition to digitization and preservationof data available in physical form, should be the inte-gration of all the digital libraries all over the worldso that all significant literary, artistic, and scientificworks of mankind will be made available in everycorner of the world for the education, study, andappreciation of our generation as well as that of allour future generations.
OPEN TECHNOLOGY CENTRE (OTC)12.2.19 To facilitate use of open technologies ine-governance and strategic applications and services,OTC has been set up at Chennai. It has providedDSpace, an open-source archival solution, for archi-val of speeches, video, and audio speeches of Mem-bers of Rajya Sabha. It has enabled to archivedocuments of speeches in Urdu and Hindi in additionto English.
LIBRARY AUTOMATION12.2.20 e-Granthalaya has been developed by NIC asstandardized and robust library automation software.Already implemented in about 1000 libraries, it isgoing to be rolled out to a large number of librariesin the country.
CREATION OF A NATIONAL KNOWLEDGE NETWORK12.2.21 A National Knowledge Network can go along way in bringing India in the forefront of educa-tion, S&T, innovation, etc. National Research andEducation Networks are driving the pace of collabo-ration, innovation, and discovery amongst scientists.Some of the major initiatives required in this direc-tion include:
• Creation of a suitable mechanism for setting up andoperating a National Knowledge Network.
• Connecting all major R&D establishments, Centralinstitutions, universities, colleges, and libraries byusing a dynamically configurable national multi-gigabit backbone network.
• Empowering campuses through wireless network.• Having a Central Data Centre with 30 terabyte stor-
age, capable of expanding to petabyte storage infuture.
• Create a National educational portal which couldhost free educational content for e-learning.
SCHOOL CONNECTIVITY12.2.22 Education infrastructure needs to be strength-ened and upgraded. In the first phase, broadband ac-cess needs to be provided to every school. There are108000 government and government-aided schools inIndia. All these schools need to be put on the networkprogressively.
INCREASING EFFICIENCY OF E-GOVERNANCEINVESTMENTS12.2.23 The following initiatives would need to betaken up for accelerating the National e-governanceprogramme:
• Encourage the Central and State Governments toprocure e-governance services.
• Fast replication of already successful e-governanceprogrammes.
Communications and Information Technology 437
• Make digital signatures mandatory for e-commerce,e-government, and e-banking initiatives.
• Identify and develop ‘Killer Applications’—Onlineauctions, e-voting, home banking, etc.
• Speedy and effective implementation of variousMMPs under the NEGP.
• Promotion of technologies such as Digital Sub-scriber Lines (xDSL), Wireless Fidelity (WiFi), andWorldwide Inter-operability for Microwave Access(WiMAX) for providing the last mile connectivityto the places where copper wiring is not possible.
• Technologies such as Broadband on Power Linesshould also be explored.
THRUST AREAS FOR R&D IN IT SECTOR IN THEELEVENTH PLAN12.2.24 R&D in identified thrust areas is one of themajor functions of the DIT. This support has helpedin building infrastructure and competencies at a largenumber of academic and research institutions, and hasproduced the required manpower to take up R&D inthe industry besides development of various productsand packages. Some of the major thrust areas for R&Din the Eleventh Plan include: ubiquitous computing,RFI, high performance computing, grid computing,high performance networking, bio-informatics, opensource software, software engineering, web technolo-gies, and electronics— nanotechnology, photonics,microelectronics, industrial electronics, automationelectronics, embedded systems, and electronics mate-rial development program.
CONVERGENCE OF BIO-INFO-NANO TECHNOLOGIESAND COGNITIVE SCIENCE12.2.25 Information technology and communicationtechnology have already converged leading to ICT. In-formation technology combined with bio-technologyhas led to bio-informatics. Now, nanotechnology isknocking at our doors. It is the field of the future thatwill replace microelectronics and many other fields withtremendous application potential in the areas of medi-cine, electronics, material science, etc. Convergence ofbio-nano-info technologies can lead to the develop-ment of nano-robots. Likewise, a new revolution is alsoexpected to be ushered in by the convergence of bio-info-nano technologies with the cognitive science in thecoming years.
ICT Measurement for Knowledge Economy12.2.26 The GoI has set up the National StatisticalCommission with a wide ranging mandate to serve asa nodal and empowered body for all core statisticalactivities in the country and to evolve, monitor, andenforce statistical priorities and standards and toensure statistical co-ordination among the differentagencies involved. The Commission was formally con-stituted in July 2006.
12.2.27 This has enhanced the need for credible andtimely data on ICT. The ultimate aim of collecting ICTstatistics and indicators is to inform policy makersabout the impact of ICT on the economy and the soci-ety. For this to be possible, data need to be collected notonly on the ICT industry but also on how ICT is usedby people, business, and the public administration.Therefore, there is a need to shift the emphasis a bit frommeasurement of the ICT industry to measuring the useof ICT across the economy in the Eleventh Plan.
12.2.28 In order to address this emerging need inthe Eleventh Plan following course of action may beconsidered:
• Conduct model surveys of ICT usage by households,individuals, and businesses, including e-commerceand e-business.
• Study impact of ICT: What does ICT do for theeconomy?
• Pursue international co-operation and the partner-ship on measuring ICT for development.
Constraints and Challenges12.2.29 Some of the key constraints and challengesbeing faced by the IT and hardware manufacturingsector in the country are as follows:
SMALL SIZE/SCALE OF OPERATIONS• The size and scale of operation of most manufac-
turing plants are very small compared to the globalmarket leaders. This leads to poor economies ofscales for manufacturing as well as for sourcing.Lower capacities translate to higher per unitoverheads. Even though the cost of labour in Indiais low, it fails to offset the adverse impact of pooreconomies of scale.

438 Eleventh Five Year Plan
HIGH RATE OF TECHNOLOGICAL OBSOLESCENCE• Due to the changes in technology, newer methods
get introduced, calling for modern processesand equipment, which give a competitive advant-age in terms of cost, speed, and quality. Yet,Indian companies find it unviable to upgradebefore the investments in earlier equipment arerecovered.
UNIFICATION OF MANUFACTURING• With rapid convergence of consumer electronics,
IT, and telecom and fast introduction of newerproducts in the market, new vistas for the manu-facture of accessories to support the new gadgetsare emerging. Therefore, unification of productcategories has to be attempted for manufactur-ing.
• There appears to be lack of credible and timelydata on ICT usage (e-Stat) and its impact on theeconomy.
The Path Ahead12.2.30 The future of IT industry in India looks ex-tremely positive. The government aims to start manynew initiatives in this Eleventh Five Year Plan andstrengthen the already running schemes. Some of theimportant initiatives in addition to those enumeratedabove that would help in reaching the goal of fasterand inclusive growth are as follows:
• Encourage the adoption of e-procurement modelin all government procurements.
• Encourage State Governments to initiate majorcitizen-centric mission projects under NeGP, pref-erably in the PPP mode.
• Promote electronics/IT hardware manufacturingindustry as it is one of the thrust areas of the GoI.
• Policy needs to be put in place to set up HMCPsin private sector or public sector or PPP and toco-locate the inter-dependent units in the samecomplex.
• Policy need to be drafted to address the differentissues related to the National Digital Library.
• Operationalize the Unique Identification Project tocreate a core database (using the most reliable pre-existing digitized database) which is then regularlyupdated and is easily accessible to and used by all
departments for identification of residents in thecountry for various purposes.
• Initiate MMPs and projects for developing qualityhuman resource which is industry ready.
• Initiate programmes for development of qualityfaculty.
12.2.31 The GBS for the Eleventh Five Year Plan ofthe DIT has been tentatively fixed at Rs 11048 crore at2006–07 constant price and Rs 12496 crore at currentprice.
12.3 INDIA POST
OVERVIEW12.3.1 Post office is the only institution in the coun-try which touches every person’s life. A promptand efficient postal system is very important for thedevelopment of a country. On one hand it providespersonal services to the people, and on the other italso provides service to businesses which is crucial forthe growth of the economy. The importance of PostalServices becomes all the more important when a USOFund is created by the government.
12.3.2 With the emergence of private sector as a playerin the areas of courier service and express serviceand with the development of information technologyapplications in every field, the posts stand to facecompetition. The basic profile of the sector is given inBox 12.3.1.
REVIEW OF THE TENTH PLAN12.3.3 The Tenth Plan basically aimed at making thepostal services self-sufficient. The major objectivesenvisaged for the Tenth Plan were (i) provision of uni-versal postal services at affordable prices, (ii) ensuringquality of services at par with international standards,(iii) modernization, and (iv) process re-engineeringwith a view to achieving better administrative effi-ciency, financial management, and satisfaction. Thetechnology upgradation component constituted nearly80% of the Tenth Plan outlay. The policy of openingof post offices was reviewed and it was decided thatin order to rationalize the postal network, new postoffices should be set up only through the redeploymentof staff or relocation of the existing post offices.

Communications and Information Technology 439
Targets and Performance of the Tenth Plan12.3.4 As against a target of opening of 450 extra-departmental post offices, the department has beenable to open 440 extra-departmental post offices.As regards the opening of Postal Sanchar Seva Kendrasagainst a target set for 2400, the achievement has been2371. The department has also been able to achievefully its target of opening 45 post offices. As many as8263 post offices were computerized against a targetof 7700 post offices. In addition, 19 postal accountsoffices were computerized as against a target of 22. Allthe 245 administrative post offices have also been com-puterized. There has been 100% achievement in com-puterization of 48 head record offices.
12.3.5 In the area of modernization, as against a tar-get of 811, as many as 822 post offices have beenmodernized. The department has been able to mod-ernize 338 speed post centres as against a target of350. Modernization has also been done of mailmotor depots as per the target. The department hasset up 290 postal finance marts (PFMs) as against atarget of 300.
12.3.6 In the field of philately upgradation, the de-partment has performed well. Human resource devel-opment, which is the crucial element for supportingthe whole process of modernization and induction oftechnology, has also been taken up by the department.As many as 303769 persons from different cadres weretrained in their respective fields as against a target of315700 persons. The department also establishedthe National Data Centre that would help them in
providing various services across their network simi-lar to anywhere banking.
VISION AND STRATEGY FOR THEELEVENTH FIVE YEAR PLAN12.3.7 The vision statement of India Post reaffirms itssocial commitment and its focus on technology induc-tion, entrepreneurial management, and achievingfinancial self-sufficiency. Taking into considerationthe internal and external opportunities and challenges,the Eleventh Plan would focus on an all-round devel-opment of the DoP with a number of policy initiativesand building a brand image. The department wouldalso aim to effectively utilize its network and reach forproviding value-added services by developing appro-priate linkages with various agencies/organizations.
Key Constraints and Challenges12.3.8 Owing to increasing competition and availabil-ity of other means of affordable communication in-cluding telephone, Internet, etc., India Post needs tobecome commercially viable by increasing revenue,while fulfilling the rising expectations of the custom-ers through adoption of competitive and customer-friendly business strategies. This calls for an urgentneed to redefine and reposition the department in thechanged scenario. There is a need to improve qualityof services and adapting them to the needs of the rap-idly evolving and increasingly technology driven world.Besides, India Post also needs to focus its efforts onnon-core activities based on information technologyby leveraging its network and the last mile reachthrough partnerships.
Box 12.3.1Basic Profile of the Postal Sector
• Except for courier services, postal operations are still a government monopoly.• Postal services in India have been highly subsidized as part of the government policy.• Indian postal system is the largest in the world in terms of number of post offices/outlets numbering about 1.55 lakh, out
of which nearly 90% post offices are in rural areas and remaining 10% post offices are in urban areas. In addition, 5405Panchayat Sanchar Sewa Kendras are also providing basic postal facilities in rural areas.
• India Post is presently being served by as many as 5.4 lakh employees including 2.47 lakh departmental and 2.93 lakhextra-departmental employees to run its operations all over the country.
• The total expenditure in percentage of receipts for Posts was 123% in India as compared to 101% in the UK and 102% inthe US.
440 Eleventh Five Year Plan
12.3.9 The domestic postal market faces a number ofopportunities and threats:
COMMUNICATION MARKET• Electronics alternatives as well as organized and ad
hoc couriers are both competing with India Post.
LOGISTICS MARKET• National and international players are entering the
logistics and express markets for providing bettervalue-added services aimed at business customers.
MASS MEDIA MARKET• Opportunities exist to develop direct mail and tar-
get the growing middle class community with tar-geted marketing.
RETAIL AND FINANCIAL MARKET• With its extensive network, India Post is well placed
to partner with banks, insurance companies, andother financial service providers for extendingfinancial services to the rural and hitherto un-reached population.
Policy Issues for the Eleventh Five Year Plan12.3.10 Taking into consideration the internal andexternal opportunities and challenges, the EleventhFive Year Plan would focus on an all-round develop-ment and repositioning of the DoP. A few but impor-tant policy issues for the Eleventh Five Year Plan arementioned below:
• Reorganize the DoP around the emerging techno-logical and market realities and expand into newerbusiness potential areas such as Global Business,Financial Services, Retail, Rural Business, etc.
• Widespread induction of technology aimed at com-puterizing and networking of all post offices usingCentral server-based system. Induction of otherstate-of-art processing systems including mail pro-cessing systems so as to provide service on par withglobal industry standards.
• Greater focus on human resource development withthe objective of transformation of the humanresource of the department into a technology-savvy,business-oriented workforce led by world-classmanagers.
• Transforming Postal Life Insurance into a commer-cial business entity making its own investmentdecisions and competing on a level playing fieldwith other insurance entities, while conforming torequirements of Insurance Regulatory and Devel-opment Authority (IRDA) norms.
• Adoption of PPP model for development of postalestates by setting up a SPV for their commercialexploitation and revenue generation.
• Utilizing the widespread network and reach ofIndia Post to act as an interface for the Central andState Governments with beneficiaries for deliveryof various social sector schemes, and also for trade,business, and banking sectors.
• A new division is to be created to specifically targetrural postal network with a view to utilizing therural network and delivery strengths for revenuegeneration and extension of services/amenities tothe rural areas.
SCHEMES/PROGRAMMES TO BE IMPLEMENTEDIN THE ELEVENTH FIVE YEAR PLAN
Network12.3.11 The programme for the expansion of thepostal network will be carried out in the EleventhFive Year Plan, keeping in view the requirement of thecustomers, USO, accessibility, standards, and businesspotential through adoption of alternate/innovativemeans of providing access to the postal network, suchas opening of franchisee outlets through inductionof latest technology, apart from opening of new postoffices.
12.3.12 There is an urgent need to utilize this unpar-alleled network to support various retail servicesthrough tie-ups with the Central and State Govern-ments and private organizations and also supporte-governance initiatives of the Central and StateGovernments. Post offices can function as retail out-lets and as an interface between the customer and thegovernments, both Central and State, particularly inrural areas for the social sector schemes.
Mail Operations12.3.13 Mail operations, viz., collection, transmission,and delivery would require focus. There is need to

Communications and Information Technology 441
resort to automation in mail handling at the impor-tant centres where substantial amount of load is there.Mail operations require prompt and efficient multi-modal transport system, which could be met byhiring/leasing of fast moving transport system, con-veyors, transport for delivery and pick up of postalarticles and wet-leasing of freighter air craft, etc.Mechanization of runner lines in rural areas is alsoneeded for faster movement of mail in these areas.
12.3.14 There is a need to introduce and streamlineproper track and trace systems for all the varieties ofarticles such as parcels, registered items, money orders,etc. Mail Business Centres (MBCs) are being set up asfront line business wing of India Post offering one-stop solutions for varied mailing needs of the custom-ers. MBCs will act as integrated mail business hub,undertaking the task of collection, processing, anddelivery of mails. A total of 300 MBCs are proposed tobe opened during the current Plan. MBCs will fulfilthe objective of improvement in quality of service, re-duction in cost of operations, and growth in mail busi-ness. The establishment of parcel post as a majorstrategic business unit of India Post has also been en-visaged in the Eleventh Plan, as this business is expectedto become a major source of revenue. Major parcelhubs will be provided with automatic parcel sortingsystems, RFI systems, hydraulic pallet trucks, fork lifts,taper rollers, and other parcel handling equipments.It is also proposed to develop and establish a commer-cial system for parcel post for providing end-to-endsolutions, covering booking, tracking, billing, andcustomer information system.
12.3.15 The objective during the Eleventh Five YearPlan is to work towards making India Post a majorplayer in the logistics and supply chain managementarena by providing distribution channels, inventorymanagement, packaging services, warehousing, trans-portation, and time-definite distribution programmes.It is proposed to establish logistics centres in metrocities and major business towns and a logistics centrefor international operations. India Post also needs toenter the international parcel and logistics business andfunction as the logistics partner for providing event-specific services for trade fairs, Commonwealth games,and State-sponsored events.
12.3.16 It is proposed to offer e-commerce solutionsthrough tie-ups with suppliers which will provide vari-ous products to the customers to be delivered throughposts. International mail segment has become highlycompetitive with the emergence of private operators inthe sector and cross border posting of mails. Therefore,the Offices of Exchange in India, that is Airmail Offices,International Express Mail Service, and Foreign PostOffices at Delhi, Mumbai, Kolkata, Chennai, and Kochi,which process the international mail, would requirecapacity augmentation for high speed processing ofmails and security during the Eleventh Plan in order tomeet the challenges of competitive market.
FINANCIAL SERVICES
Postal Finance Marts (PFMs)12.3.17 PFMs are one-stop shops for financial servicessuch as mutual funds and other financial instruments.The PFMs would help in creating a distinct identityand branding of postal financial outlets, which canserve as a front end for the tie-ups with financial insti-tutions and banks for vending their retail services.The success of these marts will depend on the kind ofresults they produce for the customers, which in turnwill depend upon the expertise of the financial adviser.
Banking12.3.18 Post office saving bank is the single largestsource of revenue for the department. It has been ableto make a business of Rs 3500 crore as on 30 June 2007With a customer base of 17.5 crore account holders, abranch network double the size of all the banks in thecountry put together, and with a diverse product range,the Post Office Savings Bank is the largest retail bank-ing network in the country. This network and thedepth of reach should be utilized to implement the‘Sampoorna Dak Khana Bachat Yojana Gram’ Scheme.
12.3.19 Since any time anywhere banking, is the needof the hour, it is proposed to switch over computer-ization programme of Savings Bank and allied func-tions from local area network in individual post officesto central server-based technology. For this, investmenton technology infrastructure, hardware and softwarerequirements, and networking would be needed. Thisalso includes tele-banking, ATM, etc. Post office can

442 Eleventh Five Year Plan
also have tie-ups with existing banks for providing ser-vices to the customers.
Money Transfer12.3.20 Instant money-order (iMO) service was ini-tiated during the Tenth Plan. There is a need to ex-pand this service and extend its scope to interface theiMO with international payment gateways. We aretying up with other countries having large populationof Indian origin through bilateral/multilateral agree-ments for International Financial Service. The exist-ing money-order services will be progressively replacedby an electronic, IT-based money-order service whichwill offer many new service features and differentialtariff structure.
Insurance12.3.21 Transforming Postal Life Insurance into acommercial business entity making its own investmentdecisions and competing on level playing field withother insurance entities, while conforming to require-ments of IRDA norms is essential. In this direction,investment would be required for customization ofproducts, improvement of after sale service, and mod-ernization of customer interaction points. Fundswould also be required for hardware and softwaresupport. There is also a need to develop internalexpertise for fund management to enable investmentof Post Office Life Insurance Fund/Rural Post OfficeLife Insurance Fund as per the investment pattern ofIRDA.
Philately12.3.22 The focus on philately would continue tohave its place during the Eleventh Five Year Plan aswell. The following initiatives would need to beundertaken for promotion, product innovation, andquality/technology induction.
• Initiate online trading of philatelic items throughthe internet-based trading portals such as e-Bay, etc.
• Introduce new products like personalized stampswhich have been very successful abroad.
• Introduce new postal stamps based on the differentthemes of national importance with emphasis onusing postal stamps as medium of advertisementto generate additional revenue.
Global Business Division12.3.23 A Global Business Division has been set up inIndia Post to capitalize on the liberalized economy andalso to exploit the business opportunities by openingof the postal sector as a result of WTO/GATT agree-ments. The Global Business Division would provide asingle window solution for international businessrequirements of its customers. The Global BusinessDivision projects India Post as a strategic partner forvalue addition to international business in mail, ex-press, logistics, and remittance sectors. Besides this, theGlobal Business Division would provide an avenue fortapping new markets around the world for India Post.
SUPPORT SYSTEMS
Technology Induction12.3.24 It is proposed to undertake an extensive tech-nology induction/upgradation programme during theEleventh Five Year Plan with a view to achieving the goalof financial self-sufficiency for the department. Duringthe Tenth Five Year Plan the department has been ableto computerize about 8263 large departmental postoffices. Now in the Eleventh Five Year Plan efforts wouldbe made to computerize and network 17878 depart-mental post offices for providing effective and satisfac-tory service to its customers. In addition, 64000 selectedbranch post offices located in block/tehsil headquartersor in remote areas also will be computerized. Further,remaining administrative offices (up to sub-divisionallevel) including Postal Directorate, PSD/CSDs, CivilWing offices, etc. will also be taken up for computer-ization. The proposed networking would enable thedepartment to start various online services, viz., anytime, any-where savings bank and other financial ser-vices, improve delivery thereby getting additional rev-enue. Networked hand-held digital devices could bedeveloped to be carried by postmen/postal staff toenable not only delivery of articles and intimation oftheir status in real time, but also for booking of articlesand offering other services such as accepting deposits,bill payment, other e-enabled services, etc. The samedevice could also be used to create franchise network.
Human Resource Management12.3.25 The objective is a greater focus on humanresource development with the objective of transfor-

Communications and Information Technology 443
mation of the human resource into a technology-savvy,business-oriented workforce led by world-class man-agers. Behavioural training is also essential to enableeffective customer interaction. This would require re-structuring of the Postal Staff College India (PSCI) andthe postal training center network. It is also envisagedto evaluate the role of PSCI from a training institu-tion to a nodal training policy institute with interna-tional linkages.
Marketing, Research, and Development12.3.26 For the wide range of activities planned toaugment business and garner additional revenue, it isnecessary to have a professional marketing, research,and product development organization to support theimplementation of the plans. This plan scheme envis-ages setting up of marketing, research, and productdevelopment centre after carrying out feasibility study.The programme proposed to be implemented includesthe development of a National Address ManagementSystem which will add to the professional strength ofthe department and creation of a brand identity forIndia Post.
Estate Management12.3.27 In order to fulfil the USO for providing easyaccess to postal services, construction of buildings isessential to provide the vital infrastructure for efficientpostal operations, while simultaneously focusing onrevenue generation from estates in commercial loca-tions. The strategy for construction would be to con-struct buildings in identified highly commerciallocations in PPP mode through an SPV set up for thispurpose. The existing programme for constructionof buildings with government funding would also becontinued on plots with low commercial value.
12.3.28 Departmental buildings in remote and inac-cessible areas are proposed to be provided with solarpanels for easy access to power using environment-friendly technology. Attention is also proposed to begiven to improvement of the working environment andergonomics and branding of operative offices, withparticular emphasis on post offices.
Material Management12.3.29 Setting up of an efficient material management
system through upgradation of technology and provi-sion of required equipment facilities is essential, sincethe Postal Store Depots and post offices handle a verylarge volume of stationery, including forms for use inoperative offices and equipment which is essential forthe smooth functioning of the postal system.
SUPPLY OF EQUIPMENTS12.3.30 All the necessary and the other modern equip-ments for packing, unpacking, binding, moving, sta-pling, cash counting, etc. would need to be procuredand supplied in time.
QUALITY12.3.31 There is a need to develop an R&D centreunder marketing and to encourage development ofindigenous franking machines, mail processing equip-ment, vending machines, etc.
PROCESS IMPROVEMENT12.3.32 It also proposed to set up call centres allover the country based on Interactive Voice ResponseSystem, starting initially with eight locations.
THE PATH AHEAD12.3.33 The Eleventh Five Year Plan would endeav-our to transform India Post into a modern, efficient,and self-sufficient organization responsive to marketconditions and fully utilizing its potential for serviceand revenue generation, while maintaining its com-mitment to deliver on its USO. To achieve this, themajor initiatives/action points envisaged for theEleventh Five Year Plan are the following:
• Preparing an action plan for restructuring theDoP in order to reaffirm its vision statement on itssocial commitment to the people of our country.
• Focus on utilizing the unparalleled network of theDoP to support e-governance initiatives of theCentral and State Governments and as a retail out-let/interface between the customer and the govern-ments both at Centre and State, particularly in ruralareas.
• Focus on providing technological support for anextensive computerization of the network usingintegrated software and central–server technology.
• With a view to further reducing the deficit, the DoP

444 Eleventh Five Year Plan
needs to define its USO, introduce suitable legisla-tive amendments in the IPO Act 1898, and set-upa regulatory mechanism for the postal sector toensure a level playing field.
• Transforming Postal Life Insurance into a commer-cial business entity making its own investmentdecisions and competing on level playing fieldwith other insurance entities, while conforming torequirements of IRDA norms.
• Action plan needs to be put in place for postalestates management.
• Action plan needs to be prepared to set up andmaintain MBCs as frontline business wing of IndiaPost offering one-stop solutions for varied mailingneeds of the customers.
• Action plan needs to be prepared to set up andmaintain prompt and efficient multi-modal trans-port system incorporating wet-leasing of aircraft,road transport, etc.
• Action plan needs to be prepared to set up andmaintain a grid of automated mail processingcentres for various hubs in the country to supportthe mail sorting processes.
• Make efforts to expand the Plan programme forsetting up PFMs.
• Focus on human resource management, particu-larly training, to support the delivery of services tocustomers, induction of new technology, specializ-ing in banking and insurance sectors.
• Develop a professional organization to supportmarketing, research, and product development ini-tiatives to various services offered by the department.
• For all-round development of Ladhakh, Andamanand Nicobar Islands, and Lakshadweep Island,SCPs would be made operative particularly foropening branch offices, construction of buildings,and other needs.
• Focus on special needs of the North East circle asper the comprehensive sub-plan which includesmail operations, banking and money transfer,computerization and training as well as construc-tion of buildings.
12.3.34 The GBS for the Eleventh Five Year Plan of theDoP has been tentatively fixed at Rs 3536 crore at 2006–07 constant price and Rs 4000 crore at current price.
12.4 INFORMATION AND BROADCASTING
OVERVIEW12.4.1 One of the sectors which has consistently out-performed the GDP growth year after year is theEntertainment and Media Services Sector which isexpected to grow at a CAGR of 18% till 2010 andbeyond during the Eleventh Plan period. This sectorcomprises television (CAGR, 22%),1 films (16%),radio (28%), music (4%), print media (13%), liveentertainment (16%), out-of-home advertisement(17%), and Internet advertising (43%). Its existingas well as annual turnover and its CAGR are given inTable 12.4.1.
12.4.2 It is one sector which responds to extraordi-nary GDP growth with a multiplier. When incomesrise, more resources get spent on leisure. The contri-bution of each media sub-sector to the overall revenuesas in 2006 and as projected for 2011 clearly brings outgrowing preponderance of electronic media over printmedia as depicted in Figures 12.4.1(a) and (b).
12.4.3 Growth in infrastructure, technology, and in-stitutional support in the information and broadcast-ing (I&B) sector was in consonance with overallnational development perspective. Film, information,and broadcasting sectors of the economy have achievedformidable strength. The share of I&B sector in totalemployment, income, and investment has gone upsignificantly. Issues in the national scenario of thissector revolved around foreign investment, regulation,intellectual property rights, content enrichment,restructuring of Prasar Bharati, digitalization andmaintaining archives of the entire spectrum of I&Bmedia unit.
REVIEW OF THE TENTH PLAN
Information Sector12.4.4 During the Tenth Plan, information sector ofthe Ministry of I&B focused on the following:
• Directorate of Advertisement and Visual Publicity,with its function of providing multi-media public-ity to government’s development programmes and
1 The figures in bracket refer to CAGR.

Communications and Information Technology 445
TABLE 12.4.1Annual Growth of Indian Entertainment and Media Industry
(Rs Million)
2004 2005 2006E 2007F 2008F 2009F 2010F 2011F CAGR
Television 128700 158000 191200 219900 266000 331000 431000 519000Annual growth 23% 21% 15% 21% 24% 30% 20% 22%Filmed entertainment 59900 68100 84500 96800 112000 126450 146000 175000Annual growth 14% 24% 15% 16% 13% 15% 20% 16%Radio 2400 3200 5000 6500 8500 11000 14000 17000Annual growth 33% 56% 30% 31% 29% 27% 21% 28%Music 6700 7000 7200 7400 7500 7600 8000 8700Annual growth 4% 3% 3% 1% 1% 5% 9% 4%Live entertainment 7000 8000 9000 11000 13000 16000 18000 19000Annual growth 14% 13% 22% 18% 23% 13% 6% 16%Entertainment industry# 204700 244300 296900 341600 407000 492050 617000 738700Annual growth 19% 22% 15% 19% 21% 25% 20%Print media 87800 109500 127900 144000 162200 182300 206500 232000Annual growth 25% 17% 13% 12% 13% 12% 13% 13%OOH advertisement 8500 9000 10000 12500 14500 16500 19000 21500Annual growth 6% 11% 25% 16% 14% 15% 13% 17%Internet advertising 600 1000 1600 2700 4200 6000 8200 9500Annual growth 67% 60% 69% 56% 43% 37% 16% 43%Total entertainment and
media industry# 301600 363800 436400 500800 587900 696850 850700 1001700Annual growth rate (%) 21% 20% 15% 17% 19% 22% 18% 18%
Note: # The figures taken above include only the legitimate revenues in each segment. Revenues from the Animation and Gamingsegments have not been included in the industry size as these are traditionally included in the Indian IT and Software Revenues;E = Estimates; F = Forecasted
Source: Industry estimates and PwC analysis/Federation of Indian Chambers of Commerce and Industry (FICCI): Indian Entertainmentand Media Industry, March 2007.
Source: Industry estimates and PWC analysis/FICCI: Indian Entertainment and Media Industry, March 2007.
FIGURE 12.4.1: Indian Entertainment and Media industry—Status and Projections
policies in various fields, and achievement in theseareas, focused on the need for technological up-gradation of its communication equipments andmodernization of its programme designs.
• Song and Drama Division (SDD)—being related topublicity, education, and entertainment through thetraditional media of folk music, dance, theatre, andpuppetry—targeted at extensive use of traditional
446 Eleventh Five Year Plan
media for communication and modernizing itsfacilities for programme and designs.
• Directorate of Field Publicity (DFP) set goals forincreasing its coverage, computerization of regionaloffices, creation of local software for effectivecommunication, and streaming of its feedbackmechanism.
• Some of the major policy initiatives taken include:– Indian editions of foreign scientific, technical,
and specialty magazines, periodicals, and jour-nals were allowed.
– Foreign investment up to 100% in publishingcompanies publishing specialty magazines wasallowed.
– 26% foreign equity in Indian firms publishingnewspapers and news and current affairs peri-odicals should be allowed.
• New Advertisement Policy came into effect from1 January 2006. Audio-Visual AdvertisementPolicy was also approved by the government on8 November 2006 and guidelines were also issuedfor empanelment of Audio and Video Producers on21 June 2006.
Film Sector12.4.5 The main objectives of the film sector were toproduce, collect, display good quality films, children’sfilms, documentaries, short films, animation filmsfor internal and external publicity, and capacity build-ing in film producing, directing, acting, editing, etc.Certification of films for exhibition is a continuousregulatory work pertaining to this sector. Maintenanceand enforcement of National Film Archive of Indiaand of the Archives of the Films Division enables pres-ervation of the film wealth for posterity. It acts as afacilitator for the industry to organize film festivalsand provide marketing support including import andexport of films. Indian films are important tools forcultural diplomacy. The I&B Ministry participates invarious international fairs and organizes festivalsin collaboration with Indian Embassies abroad.Although the Indian film industry produces over a1000 films a year, it has a negligible share in the globalfilm industry revenues. Therefore, it requires a strongpolicy support to achieve a place of prominence in theworld market. Piracy menace had been a major causeof loss of revenue to film industry. The activities of
the film institutes, such as Satyajit Ray Film andTelevision Institute (SRFTI), Kolkata; Film andTelevision Institute of India (FTII), Pune; and IIMCwere focused on modernization of training infrastruc-ture and improvement in quality of training. IIMChas introduced TV journalism in its curriculum inresponse to growing demand for this discipline fromthe student community.
Broadcasting Sector12.4.6 The broadcasting sector has already achievedmajor milestones on its growth journey, beginning withAll-India Radio (AIR) and Doordarshan (DD). Thescale of its operation, technological up-datedness,and timeliness in the move towards excellence incontent and transmission make it a vibrant sector.Radio broadcasting infrastructure consists of 229AIR analogue terrestrial radio Medium Wave andShort Wave stations, 264 analogue private terrestrialstations, and one private satellite radio, that is, WorldSpace. The television broadcasting setup consists of1398 analogue terrestrial transmitters and 4 digitaltransmitters in public sector, 6000 Multi-SystemOperators, and 65000 Local Cable Operators in pri-vate sector, 3 digital DTH satellite television operatorsin public and private sector.
12.4.7 Out of 210 million houses, by 2001 Censusfigure, television has reached 108 million, with cableand satellite in 68 million homes. The DTH subscrip-tion is around 5.6 million (DD DTH share 4.0 mil-lion, and private DTH 1.6 million). Similarly, numberof radio sets was 132 million. Total radio coverage bypopulation has reached 99.13%. There are in all 229AIR channels and 42 private FM stations.
12.4.8 The creation of excellent content has become avital need for survival of public service broadcaster toachieve its three-some objective of entertainment,education, and information in every single programmeproduced. During the Tenth Five Year Plan, firsttime high-quality content creation gathered seriousattention to provide public service broadcaster acompetitive edge vis-à-vis rapidly flourishing privatebroadcasting firms and rising broadcasting standards.In response to this, an alternative mechanism forcreating rich content was devised by providing funds

Communications and Information Technology 447
to institutions and individuals, known for professionalexcellence and high standards.
12.4.9 DD completed the J&K Special Package PhaseI, and North East Package Phase I. This has enhancedcoverage of television in these areas. The national chan-nel coverage, both terrestrial as well as satellite, hasreached a 90.7% population. News channel coveragehas reached 48% of the population. DD also startedthe nation-wide DTH Ku band telecasting through35 TV and 20 AIR Audio channels free of cost.
12.4.10 There were significant shortfalls during theTenth Plan period both in terms of extending coverageand enhancing digitalization. Broadcasting in HighDefinition Television (HDTV) and interactive multi-media TV services have not yet started. The ConditionalAccess System (CAS) is being implemented in fourmetros only. As regards radio broadcasting, DigitalRadio Mondiale (DRM) transmission has not yetstarted, and FM services did not reach the Tenth Plantarget of 60% coverage. Internet radio broadcasting alsodid not take off as envisaged. The Tenth Plan strategyof content creation through alternative mechanism offunding did not go beyond signing an MoU between thePrasar Bharati and Public Service Broadcasting Trust.
VISION AND STRATEGY IN THEELEVENTH FIVE YEAR PLAN12.4.11 The growth potential of various media unitsneeds to be harnessed fully to place broadcastingeconomy on a high growth path during the EleventhFive Year Plan. The media units have an immense roleto play in education, entertainment, and informationdissemination. For a sustained growth in these areas,appropriate content, technology, and policy initiativeshave to be evolved. Competitiveness and cost-effec-tiveness comes on the wings of appropriate technol-ogy and compatible manpower in all segments. Inrapidly changing information and broadcasting sec-tor, adopting new technologies and conceiving newtechnological solutions are crucial. PPP is the one ofthe most plausible solution for funding new techno-logical interventions and bringing in competitiveness.
12.4.12 The Public Service Broadcaster in India,namely, the Prasar Bharati, enjoyed monopoly in
broadcasting till recently. There was near absenceof private sector broadcasters. Now in the liberalizedinformation and broadcasting sector with global anddomestic private players, public service broad-castingno more plays that dominant role in reach and tech-nology. This new reality required government toassume simultaneously the role of facilitator and pro-moter of the information and broadcasting sector.
POLICY ISSUES, PROGRAMME REFORMS, AND NEWINITIATIVES IN THE ELEVENTH FIVE YEAR PLAN
12.4.13 Information• In recognition of the importance of traditional
media units, emphasis should be on the use ofIT-enabled applications and other technologicaladvancement for increasing their reach.
• There is a need for promoting partnership with theprivate sector in the field of traditional media unitsfor bridging the information gap.
• The issues pertaining to Intellectual Property Rightsin the information sector need to be addressed.
• Press and Registration of Books Act 1867 needs to berevisited to make it in tune with contemporary needs.
• Modernization of SDD’s infrastructure in view ofits importance needs to be emphasized.
• Redefining the objectives of the DFP and reposi-tioning its network to reach remote, inaccessible,and strategic areas for effective reach and publicity.
• Strengthening the organizational set up of theRegistrar of Newspaper for India (RNI) in NorthEast and Central Zones.
• Completion of National Media Centre, a project ofPress Information Bureau.
• Transformation of the IIMC into a global school injournalism.
12.4.14 Films• Formulation of a National Digital Policy for enter-
tainment sector.• Revamping of Cinematograph Act of 1952 to address
the emerging technologies and new challenges.• Need to encourage film tourism for targeting the
opportunities in global film sector.• Building up a Centre of Excellence for animation,
gaming, and special effects through PPP modeprojects.
448 Eleventh Five Year Plan
• Transforming FTII and SRFTI into global film andtelevision schools.
• Encouraging the industry in creating new marketsabroad and developing existing markets by support-ing participation in film markets and festivals.
12.4.15 Broadcasting Content• Public Service Broadcasting should focus on devel-
opmental programmes of the government andbringing in social awareness.
• Reorganization of Prasar Bharati.• With the re-emergence of radio as a medium of
profound reach and impact, especially FM radio,AIR needs to forge partnerships with private FMplayers to expand and effectively utilize this medium.
• Establish an International Channel through PPP.• Facilitating emergence of India as an important
source for high-quality animation-based content.
12.4.16 Expansion of Transmission Network,Digitalization, and Mobile Media• The DTH market has matured and the arrival of
IPTV and mobile broadcasting is imminent andneed to be nurtured.
• With the convergence of technologies and availabil-ity of single gadgets with multiple applications, thereare issues relating to policies, standardization ofinfrastructure, practices, and convergence whichwill need to be dealt with. One issue dominatingthe mind of telecom companies entering the areaof IPTV is whether this will be regulated by TelecomFDI norms or Broadcasting FDI norms. A JointGroup of Ministry of Information and Broadcast-ing (MoI&B) and Department of Telecom hasrecommended that IPTV be governed as per licensesissued by Ministry of Communication and IT.Recommendations of the Joint Group are underconsideration of the government.
• Digitization of content, phasing out analoguebroadcasting, and creating an enabling environmentfor promotion of audio/video on demand.
• Digital archiving of films acquired by National Filmsarchives and produced by Films Division.
• Introduction of HDTV Broadcasting and removalof barriers for spread of Digital Terrestrial Transmis-sion (DTT), DTH, IPTV, and Mobile Broadcasting.
• Articulation of an effective IPR protection regime
for film, music, and home-video.• FM coverage to be enhanced from 35% to 45% by
using DRM+ compatible transmitters.• Border areas, rural areas, and semi-urban areas to
be accorded priority for FM coverage.• No further expansion of DD terrestrial network.
However, emphasis should be on digitization. VeryLow Power Transmission to go out of service oncompletion of their life. Border and uncoveredareas to be covered through technologies like DTH.
• Private players’ entry in the DD transmission net-work for providing mobile solutions and terrestrialtransmission should be preferred through PPP route.
12.4.17 Miscellaneous Broadcasting Initiatives• Mobile media solutions on a fast track basis should
be implemented to provide variety in entertainmentplatforms.
• Digital transmission to be encouraged throughHeadend in the Sky.
• Common Regulator for Information, Communica-tion, and Entertainment (ICE) Sector. The earlierinitiative to create a ‘Convergence Commission’ witha ‘carriage bureau’ and a ‘content bureau’ needs tobe revisited. In the context of the general movementof technology in the direction of convergence, thatis (i) convergence of network platforms (viz.,broadcast, satellite, cable, telecom) carrying similarkinds of services and (ii) merging of consumerdevices such as telephones, televisions, PCs, all ca-pable of triple-play, is a pointer that increasingly allcarriage networks and devices will be able to carryall kinds of contents. It, therefore, makes sense tohave a single regulator. At least this issue of a singleregulator for telecom and broadcasting sectorsdeserves to be revisited.
• Early setting up of a Broadcast Regulator for reso-lution of legal and regulatory issues.
• Committee on ICE in its report on Going Digitalrecommended a stepwise migration path fromthe present analogue broadcasting economy to thedigital one.
THE PATH AHEAD12.4.18 The Eleventh Five Year Plan would aim attransforming the information and broadcastingsector, as well as the media and entertainment sector,

Communications and Information Technology 449
into a modern, efficient, and responsive entity. Toachieve this objective, in addition to putting in placenecessary policy interventions, the barriers to invest-ment in entertainment and media industry, which isspearheaded by the private sector, need to be effectivelyaddressed. These include:
• Lack of uniformity in media policy for foreign in-vestment FDI limits vary in different sectors—DTH(49%), cable (49%), and content (26%) for newson television and print; 100% for non-news inTV and print; 20% in radio; and 100% in filmindustry. This needs harmonization. In addition,there is a need to rationalize tax-treatment offoreign companies.
• Cross-media ownership: While policy enunciationimposes an obligation to observe cross-media own-ership rules on media companies, these rules havenot been formalized so far. As a result of this printand electronic media integration is taking place,which could result in emergence of media behe-moths acquiring a mind-share disproportionate towhat is permissible in a competitive market envi-ronment. Some boundary limits need to be laiddown and this issue that needs to be revisited forthe sake of long-term health of the industry.
12.4.19 There is need for incentivizing the consumerand equipment manufacturers for successful roll outof CAS and DTH across the country and timelines needto be fixed so that all the stakeholders could put theiracts together.
12.4.20 Digitization of satellite transmission, produc-tion centres/studios, and terrestrial transmission needsto be undertaken in a mission mode along with intro-duction of HDTV, IPTV, mobile TV, and other value-added services. For the entire broadcasting sector‘Going Digital’ and ‘Farming out Excess Bandwidth’need to be taken up expediently to ensure switchingover to digital transmission by 2015 and optimal useof scarce bandwidth.
12.4.21 The GBS for the Eleventh Five Year Planof the MoI&B has been tentatively fixed at Rs 4809crore at 2006–07 constant price and Rs 5439 crore atcurrent price.
12.4.22 The progress of the plan outlays/expenditureduring the Tenth Five Year Plan and the EleventhPlan outlays of the communication and informationtechnology sector as a whole are given at Annexure12.4.1.

450 Eleventh Five Year Plan
ANNEXURE 12.2.1Performance of IT Hardware and Software during the Tenth Five Year Plan
Electronics Production (Financial Year) (Rs Crore)
Item 2001–02 2002–03 2003–04 2004–05 2005–06 2006–07#
1. Consumer electronics 12700 13800 15200 16800 18000 20000
2. Industrial electronics 4500 5550 6100 8300 8800 10400
3. Computers 3550 4250 6800 8800 10800 12800
4 Communication and broadcast equipment 4500 4800 5350 4800 7000 9500
5. Strategic electronics 1800 2500 2750 3000 3200 4500
6. Components 5700 6600 7600 8800 8800 8800
Subtotal 32750 37500 43800 50500 56600 66000
7. Software for exports 36500 46100 58240 80180 104100 141800
8. Domestic software 10874 13400 16250 21740 29600 37800
Total 80124 97000 118290 152420 190300 245600
Note: # Estimated.
Source: DIT Annual Report 2006–07.
ANNEXURE 12.2.2Performance of Export Segment of IT Hardware and Software during the Tenth Five Year Plan
Electronics Export (Financial Year) (Rs Crore)
Item 2001–02 2002–03 2003–04 2004–05 2005–06 2006–07#*
1. Consumer electronics 700 750 825 1150 2000
2. Industrial electronics 950 1400 1515 1500 2300
3. Computers 1800 550 1440 1200 1025
4. Communication and broadcast equipment 150 500 165 350 500
5. Components 2200 2400 3755 3800 3800
Subtotal 5800 5600 7700 8000 9625 11500
6. Computer software 36500 46100 58240 80180 104100 141800
Total 42300 51700 65940 88180 113725 153300
Note: # Estimated.
Source: DIT Annual Report 2006–07.

AN
NE
XU
RE
12.
4.1
Pro
gres
s of
the
Pla
n E
xpen
ditu
re o
f C
omm
unic
atio
n an
d In
form
atio
n S
ecto
r(R
s C
rore
)
S.C
omm
un
icat
ion
an
dTe
nth
An
nu
al P
lan
An
nu
al P
lan
An
nu
al P
lan
An
nu
al P
lan
An
nu
al P
lan
Ten
th P
lan
Ele
ven
th
No.
Info
rmat
ion
Sec
tor
Pla
n(2
002–
03)
(200
3–04
)(2
004–
05)
(200
5–06
)(2
006–
07)
(200
2–07
)P
lan
(200
2–B
EA
ctu
alB
EA
ctu
alB
EA
ctu
alB
EA
ctu
alB
ER
ETo
tal
An
tici
-(2
007–
12)
07)
BE
pate
dP
roje
cted
Ou
tlay
Exp
en-
GB
S (A
t
ditu
reC
urr
ent
Pri
ce)
12
34
56
78
910
1112
1314
1516
1.D
epar
tmen
t of
8060
7.44
1927
7.79
1161
0.43
1495
5.00
7423
.14
1166
0.00
6707
.67
1180
1.01
8000
.25
1950
9.31
1746
8.22
7720
3.11
5120
9.71
1752
.00
Tele
com
mu
nic
atio
n#
(895
81.5
6)
2.D
epar
tmen
t of
5492
.00
593.
5846
5.07
577.
4549
4.63
889.
2764
4.85
1087
.56
879.
8512
68.2
712
73.2
744
44.1
337
57.6
712
496.
00In
form
atio
n(2
163.
18)
Tech
nol
ogy#
3.D
epar
tmen
t of
Pos
ts13
50.0
050
.00
45.9
115
0.00
63.0
020
0.00
142.
1635
4.00
301.
1141
9.00
419.
0011
73.0
087
4.51
4000
.00
4.M
inis
try
of I
nfo
rmat
ion
and
Bro
adca
stin
g51
30.0
087
8.00
693.
2089
0.00
524.
2395
5.00
421.
2411
20.0
085
9.42
538.
0031
0.13
4381
.00
2808
.22
5439
.00
G
ran
d To
tal
9257
9.44
2079
9.37
1281
4.61
1657
2.45
8505
.00
1370
4.27
7915
.92
1436
2.57
1004
0.63
2173
4.58
1947
0.62
8720
1.24
5865
0.11
2368
7.00
(917
44.7
4)
Not
e: #
incl
udes
IE
BR
; fig
ure
s in
par
enth
esis
indi
cate
pro
ject
ed I
EB
R.
Sour
ce: D
ocu
men
ts o
f ‘A
nn
ual
Pla
n’ a
nd
‘Dem
and
for
Gra
nts
’ of
DIT
, DoP
, DoT
an
d M
o I&
B.


Appendix

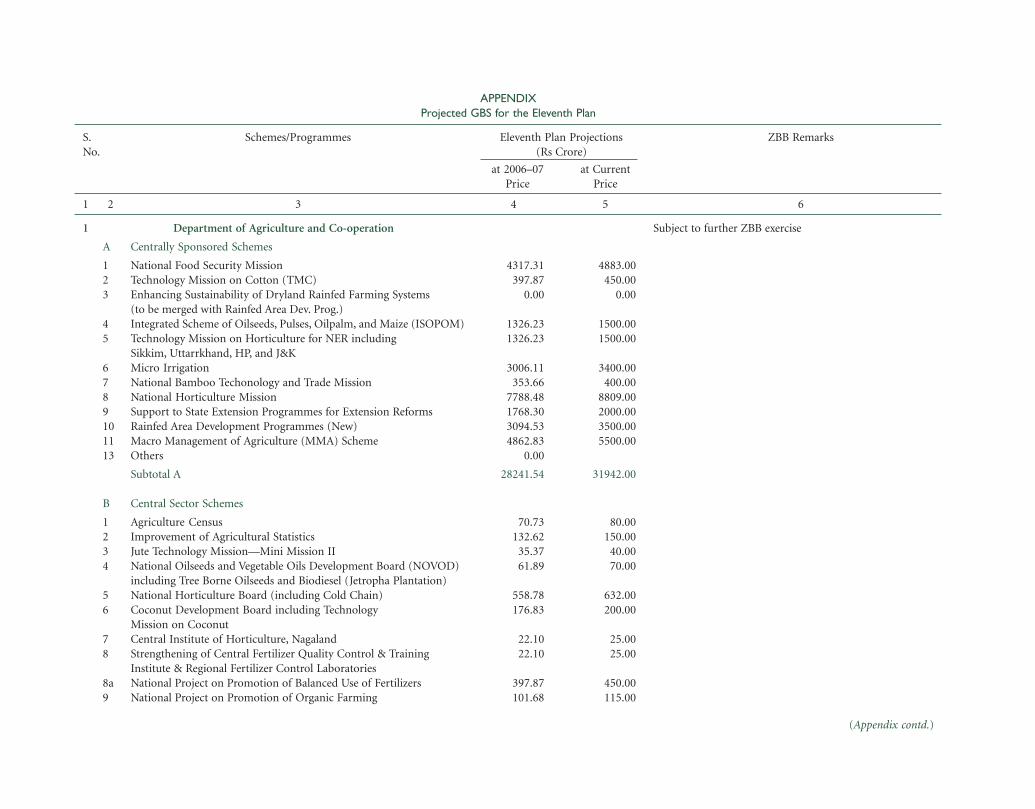
APPENDIXProjected GBS for the Eleventh Plan
S. Schemes/Programmes Eleventh Plan Projections ZBB RemarksNo. (Rs Crore)
at 2006–07 at CurrentPrice Price
1 2 3 4 5 6
(Appendix contd.)
1 Department of Agriculture and Co-operation
A Centrally Sponsored Schemes
1 National Food Security Mission2 Technology Mission on Cotton (TMC)3 Enhancing Sustainability of Dryland Rainfed Farming Systems
(to be merged with Rainfed Area Dev. Prog.)4 Integrated Scheme of Oilseeds, Pulses, Oilpalm, and Maize (ISOPOM)5 Technology Mission on Horticulture for NER including
Sikkim, Uttarrkhand, HP, and J&K6 Micro Irrigation7 National Bamboo Techonology and Trade Mission8 National Horticulture Mission9 Support to State Extension Programmes for Extension Reforms10 Rainfed Area Development Programmes (New)11 Macro Management of Agriculture (MMA) Scheme13 Others
Subtotal A
B Central Sector Schemes
1 Agriculture Census2 Improvement of Agricultural Statistics3 Jute Technology Mission—Mini Mission II4 National Oilseeds and Vegetable Oils Development Board (NOVOD)
including Tree Borne Oilseeds and Biodiesel (Jetropha Plantation)5 National Horticulture Board (including Cold Chain)6 Coconut Development Board including Technology
Mission on Coconut7 Central Institute of Horticulture, Nagaland8 Strengthening of Central Fertilizer Quality Control & Training
Institute & Regional Fertilizer Control Laboratories8a National Project on Promotion of Balanced Use of Fertilizers9 National Project on Promotion of Organic Farming
4317.31 4883.00397.87 450.00
0.00 0.00
1326.23 1500.001326.23 1500.00
3006.11 3400.00353.66 400.00
7788.48 8809.001768.30 2000.003094.53 3500.004862.83 5500.00
0.00
28241.54 31942.00
70.73 80.00132.62 150.00
35.37 40.0061.89 70.00
558.78 632.00176.83 200.00
22.10 25.0022.10 25.00
397.87 450.00101.68 115.00
Subject to further ZBB exercise

(Appendix contd.)
1 2 3 4 5 6
10 Scheme for Implementation of Protection of Plant Varieties andFarmers’ Rights’ Act 2001
11 Restructuring/Loan to National Seed Corporation and State FarmCorporation of India (NSC & SFCI)
12 Development and Strengthening of Infrastructure Facilities forProduction and Distribution of Quality Seeds
13 Strengthening and Modernization of Pest Management in Country14 National Scheme on Integrated Pest Management (New Scheme)15 Strengthening and Modernization of Plant Quarantine
Facilities in India16 Monitoring of Pesticide Residues at National Level17 Post Harvest Technology and Management (New Scheme)18 Watershed Development Council19 National Rainfed Area Authority (New Scheme)20 Investment in Debenture of State Land Development Banks (SLDBs)21 National Agricultural Insurance Scheme (NAIS)22 Co-operative Education and Training23 Assistance to NCDC for Development of Co-operatives24 Extension Support to Central Institutes/Directorate of Extension (DOE)25 Agri-Clinics/Agri-Business Centres26 Mass Media Support to Agriculture Extension27 Studies in Agricultural Economic Policy & Development28 Forecasting and Remote Sensing Application in Crop Husbandry29 Forecasting Agricultural Output using Space, Agro-Meteorology, and
Land Based Observation (FASAL)30 Marketing Research Surveys and Information Network (MRIN)31 Strengthening Agmark Grading and Export Quality Controls32 Development of Market Infrastructure, Grading, and Standardization33 Gramin Bhandran Yojana34 Small Farmers’ Agri Business Consortium (SFAC)35 Strengthening/Promoting Agricultural Information System + DAC
IT apparatus36 Capacity Building to Enhance Competitiveness of Indian Agriculture
and Registration of Organic Products Aboard37 Natural Disaster Management38 Secretariat Economic Service39 National Commission on Farmers40 Promotion and Strengthening of Agricultural Mechanization through
Training, Testing, and Demonstration
106.10 120.00
33.60 38.00
397.87 450.00
79.57 90.0088.42 100.0070.73 80.00
48.63 55.0035.37 40.00
0.0015.91 18.00
353.66 400.003094.53 3500.00
132.62 150.00282.93 320.00
61.89 70.00132.62 150.00397.87 450.00132.62 150.00
0.0044.21 50.00
13.26 15.005.30 6.00
335.98 380.00353.66 400.00106.10 120.00309.45 350.00
4.42 5.00
0.00 0.004.42 5.000.00 0.00
31.83 36.00
(Appendix contd.)
1 2 3 4 5 6
(Appendix contd.)

(Appendix contd.)
1 2 3 4 5 6
41 All India Soil and Land Use Survey42 Grant-in-aid to National Institute of Agricultural Marketing (NIAM)43 Restrutured Scheme for Institutions (including the schemes
mentioned at S. No. 21, 23, 40, 41)
Subtotal BSubtotal (A+B)
C State Plan Scheme
1 Control of Shifting Cultivation (Watershed Development in ShiftingCultivation Area in NE States)
2 Rashtriya Krishi Vikas Yojana
Subtotal CGrand Total (A+B+C)
2 Department of Animal Husbandry,Dairying, and Fisheries (DAHD&F)
I ANIMAL HUSBANDRY
A Centrally Sponsored Schemes
1 National Project for Livestock Development**2 Project for Feed and Fodder3 Livestock Insurance4 National Livestock Disease Control Programme (NLDCP)5 Livestock Extension & Delivery Services*$
Total CSS (A&H)
B Central Sector Schemes
1 Livestock Census2 Integrated Sample Survey3 Central Cattle Development Organization4 Central Sheep Breeding Farm5 Central Fodder Development Organization6 Central Poultry Development Organization
39.79 45.0013.26 15.00
0.00 0.00
8306.60 9395.0036548.13 41337.00
212.20 240.00
22103.77 25000.00
22312.41 25240.0058860.55 66577.00
3645.35 4123.00
1211.29 1370.00125.02 141.40
45.09 51.001149.40 1300.00
13.26 15.00
2256.71 2552.40
397.87 450.0070.73 80.0092.84 105.0011.49 13.0070.73 80.0044.21 50.00
(Appendix contd.)
Notes: **Project for Cattle & Buffalo Breeding, Poultry Development (Assistance to State Poultry/Duck Farms, Rural Backyard Development, Establishment of Poultry Estates), Projectfor Slaughter Houses and CU Plants, Establishment/Modernization of rural slaughter houses, including mobile slaughter plants (New Scheme)*, Utilization of Fallen Animals (NewScheme)*, Consevation of Threatened Livestock Breeds.*$ Support for Private Veterinary Clinics and AI Centres, Strengthening Livestock Extension System.

(Appendix contd.)
1 2 3 4 5 6
7 Directorate of Animal Health8 Small Ruminant Development9 Piggery Development10 Salvaging and Rearing of Male Buffalo Calves11 Food Safety and Traceability
Total CS (A&H)
II DAIRY DEVELOPMENT
A Centrally Sponsored Schemes
1 Dairy Development Projects*#
B Central Sector Schemes
1 Assistance to Co-operatives2 Delhi Milk Scheme3 Venture Capital Fund*^
Total CS (DD)
III FISHERIES
A Centrally Sponsored Schemes
1 Development of Inland Fisheries & Aquaculture(including new components)
2 Development of Marine Fisheries, Infrastructure, & Post HarvestOperations (including new components)
3 National Scheme of Welfare of Fishermen, Fisheries Training, andExtension (including new components)
Total CSS (Fisheries)
B Central Sector Schemes
1 Strengthening of Database & Information Networking forFisheries & Animal Husbandry
2 Assistance to Fisheries Institutes (CIFNET, CICEF, IFP, & FSI)3 National Fisheries Development Board
Total CS (Fisheries)
81.87 92.60176.83 200.00132.62 150.00265.25 300.00
44.21 50.00
1388.65 1570.60
689.64 780.00
198.94 225.01
0.00 0.00
44.21 50.004.42 5.00
442.08 500.00
490.70 555.00
2454.40 2776.00
265.25 300.00
309.45 350.00
159.15 180.00
733.85 830.00
22.10 25.00
328.02 371.001370.43 1550.00
1720.56 1946.00
(Appendix contd.)
Note: *# Project for Dairy Development (DAHD for Non-potential districts), National Dairy Plan (By Consortium in 325 Milk Potential Districts).*^ Dairy Venture Capital Fund, Poultry Venture Capital Fund.
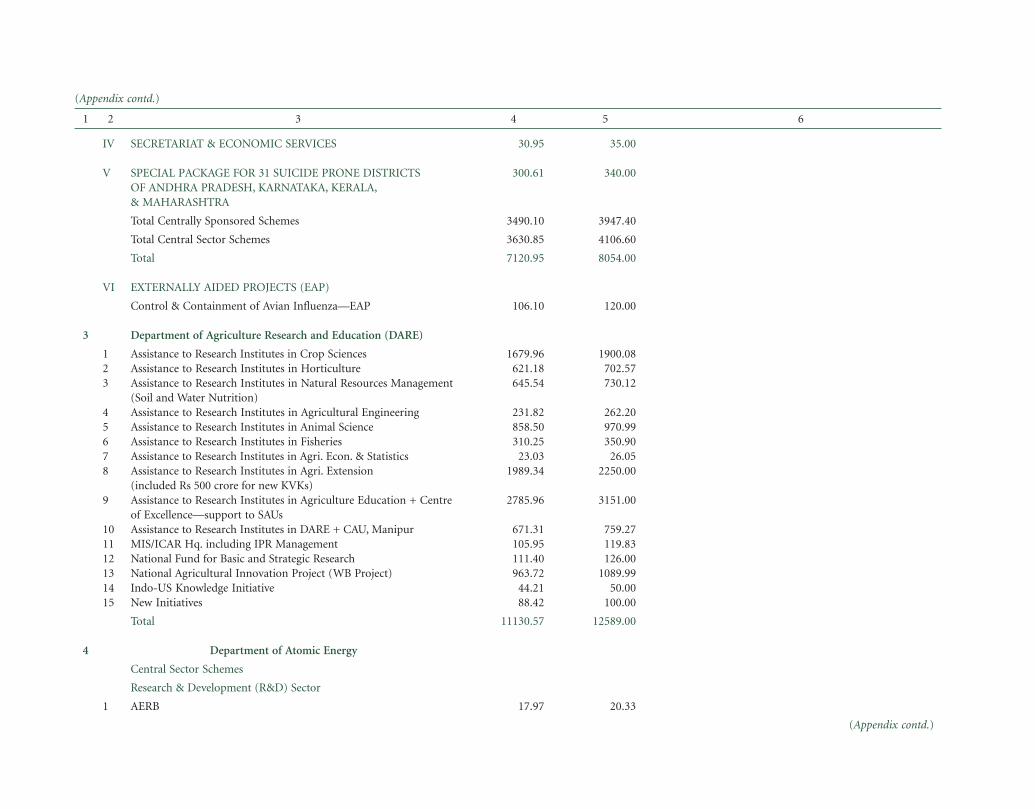
(Appendix contd.)
1 2 3 4 5 6
IV SECRETARIAT & ECONOMIC SERVICES
V SPECIAL PACKAGE FOR 31 SUICIDE PRONE DISTRICTSOF ANDHRA PRADESH, KARNATAKA, KERALA,& MAHARASHTRA
Total Centrally Sponsored Schemes
Total Central Sector Schemes
Total
VI EXTERNALLY AIDED PROJECTS (EAP)
Control & Containment of Avian Influenza—EAP
3 Department of Agriculture Research and Education (DARE)
1 Assistance to Research Institutes in Crop Sciences2 Assistance to Research Institutes in Horticulture3 Assistance to Research Institutes in Natural Resources Management
(Soil and Water Nutrition)4 Assistance to Research Institutes in Agricultural Engineering5 Assistance to Research Institutes in Animal Science6 Assistance to Research Institutes in Fisheries7 Assistance to Research Institutes in Agri. Econ. & Statistics8 Assistance to Research Institutes in Agri. Extension
(included Rs 500 crore for new KVKs)9 Assistance to Research Institutes in Agriculture Education + Centre
of Excellence—support to SAUs10 Assistance to Research Institutes in DARE + CAU, Manipur11 MIS/ICAR Hq. including IPR Management12 National Fund for Basic and Strategic Research13 National Agricultural Innovation Project (WB Project)14 Indo-US Knowledge Initiative15 New Initiatives
Total
4 Department of Atomic Energy
Central Sector Schemes
Research & Development (R&D) Sector
1 AERB
30.95 35.00
300.61 340.00
3490.10 3947.40
3630.85 4106.60
7120.95 8054.00
106.10 120.00
1679.96 1900.08621.18 702.57645.54 730.12
231.82 262.20858.50 970.99310.25 350.90
23.03 26.051989.34 2250.00
2785.96 3151.00
671.31 759.27105.95 119.83111.40 126.00963.72 1089.99
44.21 50.0088.42 100.00
11130.57 12589.00
17.97 20.33
(Appendix contd.)

(Appendix contd.)
1 2 3 4 5 6
2 AMD3 BARC4 RRCAT5 DAE Projects6 DCS&EM7 Grant-in-aid Support to Research and Education8 IGCAR9 IPR10 International Thermo Nuclear Experimental Reactor11 TMC12 VECC
Industries Sector1 BARC2 BRIT3 DAE Project4 ECIL5 HWB6 IGCAR7 NFC
Minerals Sector1 AMD2 DAE Projects3 UCIL4 IREL
Power Sector1 BARC2 IGCAR3 DAE Projects4 NPCIL
(i) Investment(ii)Russian Credit
5 KKNP6 BHAVINI
Grand Total
329.63 372.823232.45 3656.00
557.15 630.1565.61 74.21
166.37 188.172314.05 2617.26
596.05 674.15404.06 457.00
1317.05 1489.62198.05 224.00527.22 596.30
2846.97 3220.0036.25 41.00
207.78 235.000.00 0.00
442.08 500.00751.53 850.00530.49 600.00
150.31 170.000.00 0.00
1131.71 1280.000.00 0.00
265.25 300.0017.68 20.0030.06 34.00
0.00 0.002212.14 2502.00
201.59 228.001768.30 2000.00
22529.93 22980.00
(Appendix contd.)

(Appendix contd.)
1 2 3 4 5 6
5 Department of AYUSH
A Central Sector Schemes
1 Systems Strengthening
(i) Strengthening of Department of AYUSH (ii) Statutory Institutions (iii) Hospitals and Dispensaries (iv) Strengthening of Pharmacopeial Laboratories(v) Information, Education, and Communication(vi) AYUSH & Public Health
2 Educational Institutions3 R&D including Medicinal Plants
(i) Research Councils(ii) Medicinal Plants
4 HRD (Training Programme/Fellowship/Exposure Visit/Upgradationof Skills etc.)
5 Cataloguing, Digitization of Manuscripts and AYUSH IT Network6 International Co-operation7 Development of AYUSH Industry8 Funding of NGOs Engaged in Local Health Traditions/Midwifery
Practices etc., under AYUSH.
Total A
B Centrally Sponsored Schemes
1 Promotion of AYUSH(i) Development of Institutions(ii) Hospitals and Dispensaries (under NRHM)(iii) Drugs Quality Control
New Initiatives
2 Public–Private Partnership for Setting up of Specialty Clinics/IPDs3 Medicinal Plants Processing Zones
Total B Grand Total (A+B)
249.99 282.75
41.56 47.002.61 2.95
143.94 162.8022.10 25.0022.10 25.0017.68 20.00
363.10 410.68636.21 719.57317.85 359.50318.36 360.07
26.52 30.00
35.37 40.0035.37 40.00
446.50 505.0022.10 25.00
1815.16 2053.00
1237.81 1400.00486.28 550.00552.59 625.00198.93 225.00
473.02 535.00
44.21 50.00428.81 485.00
1710.83 1935.003525.99 3988.00
(Appendix contd.)
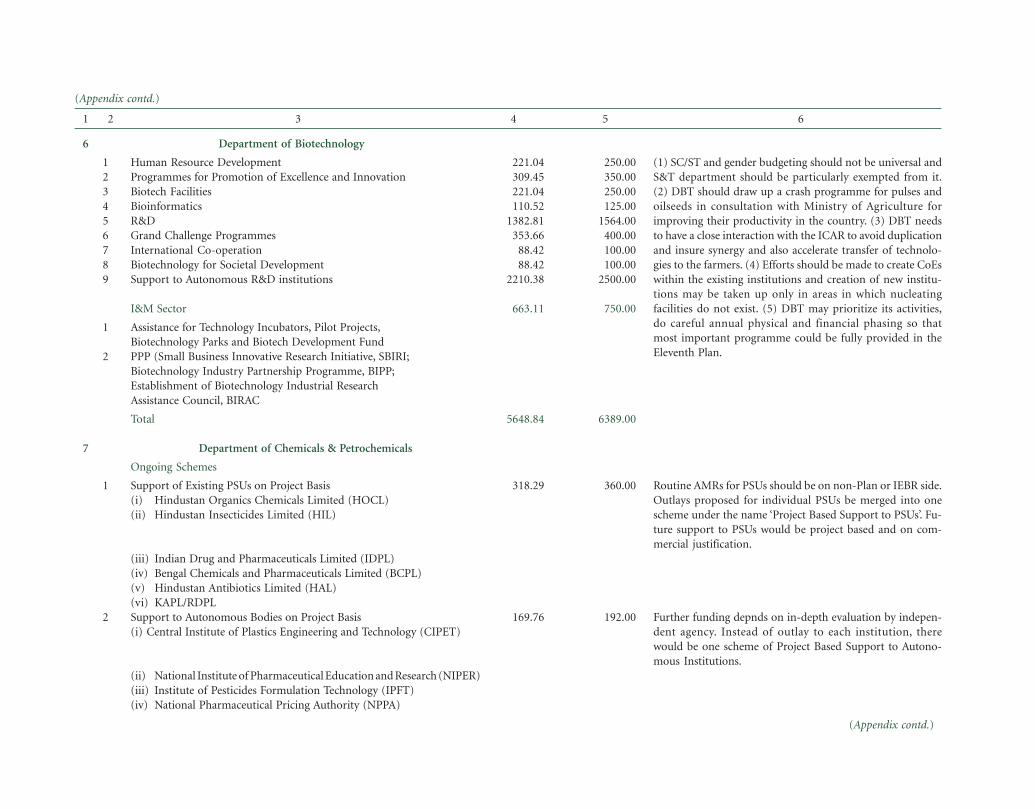
(Appendix contd.)
1 2 3 4 5 6
6 Department of Biotechnology
1 Human Resource Development2 Programmes for Promotion of Excellence and Innovation3 Biotech Facilities4 Bioinformatics5 R&D6 Grand Challenge Programmes7 International Co-operation8 Biotechnology for Societal Development9 Support to Autonomous R&D institutions
I&M Sector
1 Assistance for Technology Incubators, Pilot Projects,Biotechnology Parks and Biotech Development Fund
2 PPP (Small Business Innovative Research Initiative, SBIRI;Biotechnology Industry Partnership Programme, BIPP;Establishment of Biotechnology Industrial ResearchAssistance Council, BIRAC
Total
7 Department of Chemicals & Petrochemicals
Ongoing Schemes
1 Support of Existing PSUs on Project Basis(i) Hindustan Organics Chemicals Limited (HOCL)(ii) Hindustan Insecticides Limited (HIL)
(iii) Indian Drug and Pharmaceuticals Limited (IDPL)(iv) Bengal Chemicals and Pharmaceuticals Limited (BCPL)(v) Hindustan Antibiotics Limited (HAL)(vi) KAPL/RDPL
2 Support to Autonomous Bodies on Project Basis(i) Central Institute of Plastics Engineering and Technology (CIPET)
(ii) National Institute of Pharmaceutical Education and Research (NIPER)(iii) Institute of Pesticides Formulation Technology (IPFT)(iv) National Pharmaceutical Pricing Authority (NPPA)
221.04 250.00309.45 350.00221.04 250.00110.52 125.00
1382.81 1564.00353.66 400.00
88.42 100.0088.42 100.00
2210.38 2500.00
663.11 750.00
5648.84 6389.00
318.29 360.00
169.76 192.00
(1) SC/ST and gender budgeting should not be universal andS&T department should be particularly exempted from it.(2) DBT should draw up a crash programme for pulses andoilseeds in consultation with Ministry of Agriculture forimproving their productivity in the country. (3) DBT needsto have a close interaction with the ICAR to avoid duplicationand insure synergy and also accelerate transfer of technolo-gies to the farmers. (4) Efforts should be made to create CoEswithin the existing institutions and creation of new institu-tions may be taken up only in areas in which nucleatingfacilities do not exist. (5) DBT may prioritize its activities,do careful annual physical and financial phasing so thatmost important programme could be fully provided in theEleventh Plan.
Routine AMRs for PSUs should be on non-Plan or IEBR side.Outlays proposed for individual PSUs be merged into onescheme under the name ‘Project Based Support to PSUs’. Fu-ture support to PSUs would be project based and on com-mercial justification.
Further funding depnds on in-depth evaluation by indepen-dent agency. Instead of outlay to each institution, therewould be one scheme of Project Based Support to Autono-mous Institutions.
(Appendix contd.)

(Appendix contd.)
1 2 3 4 5 6
3 Assam Gas Cracker Project4 Chemical Promotion & Development Scheme (CPDS)—restructured
as Pharma & Chemical Promotion & Development Scheme (PCPDS)5 Chemical Weapons Convention (CWC)6 IT/Secretariat
New Schemes
7 New Scheme of CIPET
8 Other New Schemes of Petrochemicals
9 New Scheme of NIPER, Mohali10 New NIPER-like Institutes11 Interest Subsidy for Scheduled M Compliance12 Pharma Export Promotion Scheme
(i) PPP Schemes for Drug Banks(ii) PPP Schemes for Cancer Medicines
13 Strengthening of NPPA14 Creation of IPR Facilitation Centre at Pharmaeaxcil15 ERP, R&D Parks16 Critical Assistance for WHO pre-qualification for Pharma PSUs/R&D
Apex Body for Re-positioning of Pharma PSUs
Grand Total
8 Ministry of Civil Aviation
1 Airports Authority of India2 Indira Gandhi Rashtriya Uran Akademi3 Directorate General of Civil Aviation4 Aero Club of India
5 Bureau of Civil Aviation Security
Grand Total
176.83 200.0013.26 15.00
3.54 4.000.88 1.00
61.89 70.00
44.21 50.00
61.01 69.00454.45 514.00300.61 340.00
53.05 60.004.42 5.004.42 5.00
66.31 75.000.00 0.00
1732.94 1960.00
1301.27 1471.68113.06 127.87128.43 145.25
72.68 82.20
64.55 73.00
1680.00 1900.00
This scheme has been merged with Pharma Export Promo-tion Scheme under S. No. 12 and restructured as Pharma &Chemical Promotion & Development Scheme.
This scheme be clubbed with provision for autonomous in-stitution in S. No. 2 subject to evaluation of autonomousinstitute.Specific schemes to be identified and further provision onlyafter receiving specific proposal.This scheme be clubbed with provision for autonomous in-stitution in S. No. 2 subject to evaluation.
These scheme should be in the domain of M/o Health insteadof DCPC.
No need for such body.
Revision in funding pattern for airport projects in NER.Funds should directly flow to MoCA instead of being routedthrough NEC. Modernization of Kolkata Airport through IRof AAI.
(Appendix contd.)

(Appendix contd.)
1 2 3 4 5 6
9 Ministry of Coal
1 R&D2 Regional Exploration
3 Detailed Drilling in Non-CIL Blocks4 Environment Measures & Subsidence Control5 Conservation & Safety in Coal Mines6 Development of Transportation Infrastructure in Coal fields7 Coal Controller Organization8 Information Technology
Grand Total
10 Ministry of Culture
A Central Sector Schemes
1 Modernization & Computerization2 Promotion & Dissemination3 Archaeology4 Archives & Records5 Museums6 Anthropology & Ethnology7 Public Libraries8 IGNCA9 Inst. of Buddhist & Tibetan Studies10 Memorials11 Activities for NER12 Building Project of Subordinate Offices
Grand Total
11 Department Of Commerce
A Central Sector Schemes
1 National Export Insurance Account (NEIA)2 Investment in ECGC
3 Export Promotion, Quality Control, and Inspection
(i) Export Inspection Council (EIC)(ii) Market Access Initiatives
75.35 85.24164.02 185.54
472.94 535.00155.34 175.72170.67 193.06277.63 314.06
1.22 1.388.84 10.00
1326.00 1500.00
4.42 5.00689.64 780.00548.17 620.00
61.89 70.00540.98 611.86
46.09 52.13416.07 470.59
90.80 102.7050.69 57.33
114.94 130.00347.47 393.00204.68 231.50
3115.84 3524.11
884.15 1000.00707.32 800.00
44.21 50.00486.28 550.00
All the ongoing schemes be evaluated through professionalagency and findings be used for restructuring/weeding ofthe same.
It could be done in a PPP mode.
Dropping or Restructuring for 2008–09 is subject to evalua-tion.Dropping or Restructuring for 2008–09 is subject to evalua-tion; to be merged together under ‘Scheme for Archaeology,Archives, & Museums’ in consultation with M/o Culture.
Dropping or Restructuring for 2008–09 is subject to evalua-tion.
ECGC, NEIA, MAI should be evaluated in-depth through in-dependent agencies before further GBS is provided. Subsidiesshould form part of non-Plan expenditure.All schemes with more than Rs 50 crore outlay be evaluatedand findings incorporated.Project based support should be given to EIC.
(Appendix contd.)

(Appendix contd.)
1 2 3 4 5 6
4 R&D Institutes(i) Indian Institute of Foreign Trade (IIFT)(ii) Indian Institute of Packaging (IIP)(iii) Footwear Design and Development Institute (FDDI)(iv) Center for WTO Studies
(v) Indian Institute of Plantation Management (IIPM)5 Modernization and Upgradation
(i) Secretariat—Economic Services(ii) DGFT(iii) DGCIS(iv) Computerization DGS&D
Agricultural Sector
6 APEDA
7 MPEDA
8 Cashew Export Promotion Council9 Tea Board10 Coffee Board11 Rubber Board12 Spices Board
Total A
B Centrally Sponsored Scheme
Industry & Mineral Sector
13 ASIDE
Total BGrand Total (A+B)
12 Department of Consumer Affairs
Central Sector Schemes
1 Consumer Awareness2 Consumer Protection (Confonet, integrated project NCDRC, NCPA,
State Consumer Helpline)
35.37 40.0026.52 30.0088.42 100.0017.68 20.00
0.44 0.50
15.03 17.0022.10 25.0015.03 17.0020.34 23.00
637.03 720.50
397.87 450.00
0.00 0.00707.32 800.00530.49 600.00512.81 580.00265.25 300.00
5413.65 6123.00
3353.58 3793.00
3353.58 3793.008767.23 9916.00
361.62 409.00162.95 184.30
One composite scheme as ‘Project Based Support to Autono-mous Institutions’ for all autonomous institutions (IIFT, IIP,IIPM, FDDI, Centre for WTO Studies). All the autonomousinstitutions to be evaluated in-depth through independentagencies before futher GBS is provided.
Schemes of APEDA/MPEDA should be restructured in away not to duplicate the efforts of M/o Agriculture, FoodProcessing, and Health.Concrete Action Plan to be submitted before providingenhanced allocation.GBS allocation depends on approval by competent authority.Plantation Boards should focus on export-oriented produc-tion in synergy with M/o Agriculture.
(Appendix contd.)

(Appendix contd.)
1 2 3 4 5 6
3 Consumer Education and Training, HRD/Capacity Building4 Forward Market Commission5 Weights & Measures
6 National Test House
7 National System for Standardization, Database, Assessment, andQuality Campaign including Bureau of Indian Standards
8 Gold Hallmarking
Grand Total
13 Ministry of Corporate Affairs
1 Indian Institute of Corporate affairs
Grand Total
14 Department Of Drinking Water
Centrally Sponsored Schemes
1 Rural Drinking Water2 Central Rural Sanitation Campaign
Grand Total
15 Ministry of Development of North East Region (DoNER)
1 NEDFI2 Advocacy3 Capacity Building
4 Development of Inland Water Transport in the NE5 Development of Cities/Roads (EAP)
Grand Total
16 Department of Expenditure
1 Central Plan scheme for funding 15 Seats to a high level ProfessionalCourse covering basic elements of MBA (Finance) for the Officers of
13.26 15.0083.29 94.20
165.34 187.00
77.81 88.00
83.99 95.00
9.28 10.50
957.54 1083.00
186.56 211.00
186.56 211.00
34915.52 39490.476910.22 7815.66
41825.75 47306.13
339.61 384.4336.32 41.1169.70 78.90
1.32 1.490.06 0.06
447.00 506.00
4.42 5.00
To be merged with scheme at S. No. 6 (National Test House)from 2008–09. Existing schemes and new initiatives concern-ing standards, conformity assessment, and testing activities/programmes would be merged into one single scheme underthe name ‘Measures for Standards & Testing’.Further funding would be in project mode and subject toin-depth evaluation.Further funding would be in project mode and subject toin-depth evaluation.
Impact assessment of the activities be carried out for NEDFI.Evaluation of the scheme for continuation in the next year.Evaluation of the scheme indicating numbers targeted andachievement for further funding.The scheme be transferred to D/o Shipping as CS.NEUDP be transferred to MoUD. For NESRDP, state share beprovided throgh NLCPR route.
(1) Training scheme would target officers of all States/UTs andCentral govt. (2) Training capacity to be increased from 15 to
(Appendix contd.)
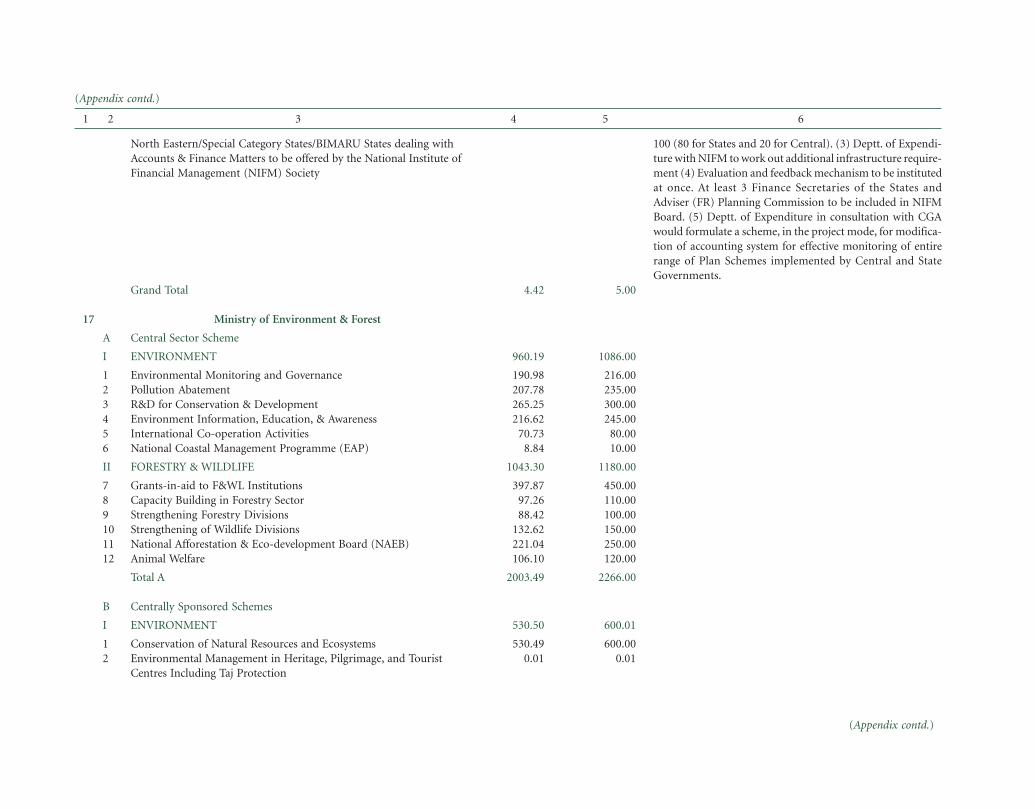
(Appendix contd.)
1 2 3 4 5 6
North Eastern/Special Category States/BIMARU States dealing withAccounts & Finance Matters to be offered by the National Institute ofFinancial Management (NIFM) Society
Grand Total
17 Ministry of Environment & Forest
A Central Sector Scheme
I ENVIRONMENT
1 Environmental Monitoring and Governance2 Pollution Abatement3 R&D for Conservation & Development4 Environment Information, Education, & Awareness5 International Co-operation Activities6 National Coastal Management Programme (EAP)
II FORESTRY & WILDLIFE
7 Grants-in-aid to F&WL Institutions8 Capacity Building in Forestry Sector9 Strengthening Forestry Divisions10 Strengthening of Wildlife Divisions11 National Afforestation & Eco-development Board (NAEB)12 Animal Welfare
Total A
B Centrally Sponsored Schemes
I ENVIRONMENT
1 Conservation of Natural Resources and Ecosystems2 Environmental Management in Heritage, Pilgrimage, and Tourist
Centres Including Taj Protection
4.42 5.00
960.19 1086.00
190.98 216.00207.78 235.00265.25 300.00216.62 245.00
70.73 80.008.84 10.00
1043.30 1180.00
397.87 450.0097.26 110.0088.42 100.00
132.62 150.00221.04 250.00106.10 120.00
2003.49 2266.00
530.50 600.01
530.49 600.000.01 0.01
100 (80 for States and 20 for Central). (3) Deptt. of Expendi-ture with NIFM to work out additional infrastructure require-ment (4) Evaluation and feedback mechanism to be institutedat once. At least 3 Finance Secretaries of the States andAdviser (FR) Planning Commission to be included in NIFMBoard. (5) Deptt. of Expenditure in consultation with CGAwould formulate a scheme, in the project mode, for modifica-tion of accounting system for effective monitoring of entirerange of Plan Schemes implemented by Central and StateGovernments.
(Appendix contd.)
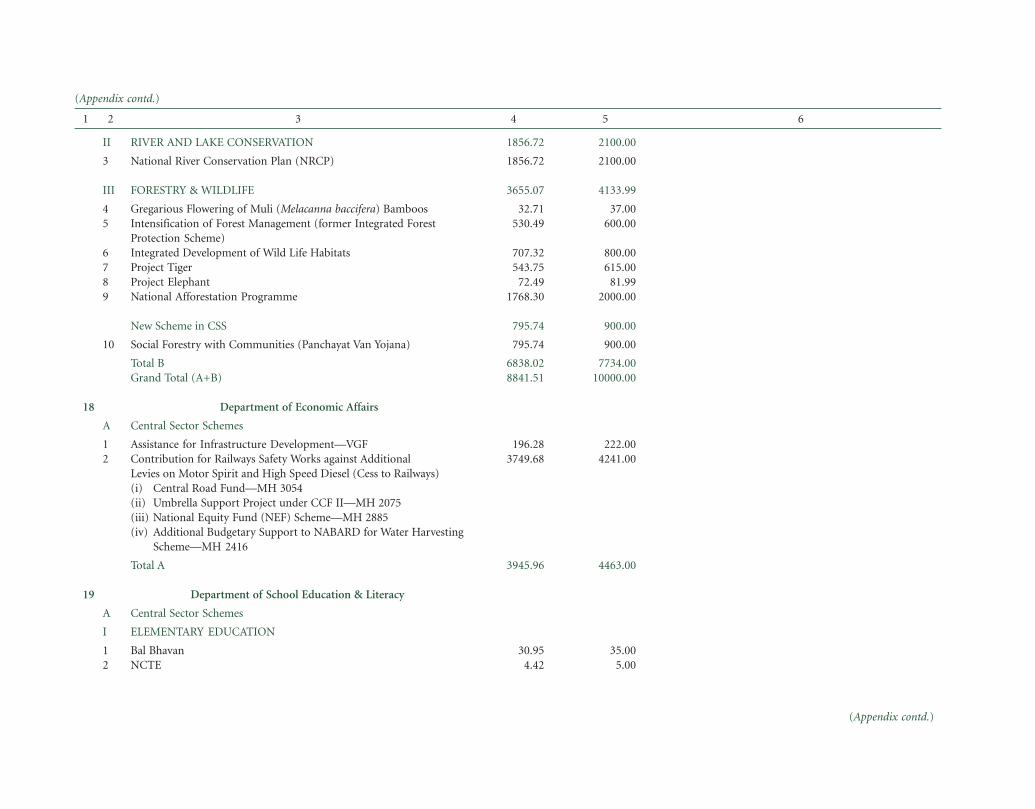
(Appendix contd.)
1 2 3 4 5 6
II RIVER AND LAKE CONSERVATION
3 National River Conservation Plan (NRCP)
III FORESTRY & WILDLIFE
4 Gregarious Flowering of Muli (Melacanna baccifera) Bamboos5 Intensification of Forest Management (former Integrated Forest
Protection Scheme)6 Integrated Development of Wild Life Habitats7 Project Tiger8 Project Elephant9 National Afforestation Programme
New Scheme in CSS
10 Social Forestry with Communities (Panchayat Van Yojana)
Total BGrand Total (A+B)
18 Department of Economic Affairs
A Central Sector Schemes
1 Assistance for Infrastructure Development—VGF2 Contribution for Railways Safety Works against Additional
Levies on Motor Spirit and High Speed Diesel (Cess to Railways)(i) Central Road Fund—MH 3054(ii) Umbrella Support Project under CCF II—MH 2075(iii) National Equity Fund (NEF) Scheme—MH 2885(iv) Additional Budgetary Support to NABARD for Water Harvesting
Scheme—MH 2416
Total A
19 Department of School Education & Literacy
A Central Sector Schemes
I ELEMENTARY EDUCATION
1 Bal Bhavan2 NCTE
1856.72 2100.00
1856.72 2100.00
3655.07 4133.99
32.71 37.00530.49 600.00
707.32 800.00543.75 615.00
72.49 81.991768.30 2000.00
795.74 900.00
795.74 900.00
6838.02 7734.008841.51 10000.00
196.28 222.003749.68 4241.00
3945.96 4463.00
30.95 35.004.42 5.00
(Appendix contd.)

(Appendix contd.)
1 2 3 4 5 6
II ADULT EDUCATION
3 Directorate of Adult Education4 NLMA5 Grants to NGOs
(i) SRC(ii) Field Innovative Projects
(Support to NGO + SRC + NIAE + Pop. Edn)(iii) Jan Shikshan Sansthan (+ Skill Development Mission Rs 140)
6 Projects for Removal of Illiteracy7 Support to NER8 Adult Education Studies by University Department of
Adult Education
III SECONDARY EDUCATION
9 NCERT10 National Open School11 Navodya Vidyalayas12 Kendriya Vidayalas13 Central Tibetan School Admn (CTSA)14 Joint Indo-Mongolian School at Mongolia
Total A
B Centrally Sponsored Schemes
Elementary Education
1 Sarva Shiksha Abhiyan (SSA)2 DPEP3 Mid-day Meal4 Teacher Education5 Mahila Samakhya
New Scheme
6 Pre Primary Schooling (1 year)7 Revamped Lifelong Education and Awareness Programme (LEAP)
(TLC + PLP + CEP)8 Literacy Programmes for 35+ age group illiterates
44.21 50.0017.68 20.00
176.83 200.0064.54 73.00
353.66 400.00884.15 1000.00
23.87 27.0026.52 30.00
224.57 254.0088.42 100.00
4067.09 4600.001326.23 1500.00
36.25 41.004.42 5.00
7373.82 8340.00
62774.69 71000.00114.94 130.00
42439.23 48000.003536.60 4000.00
185.67 210.00
1768.30 2000.003359.77 3800.00
353.66 400.00
To be evaluated.
To be evaluated.To be evaluated. The admission, transfer procedures, and otherguidelines, utilization of funds for transparency should be onthe website.
To be evaluated on priority.
To be evaluated on priority.
To be launched in 2008–09.
(Appendix contd.)

(Appendix contd.)
1 2 3 4 5 6
Secondary Education
9 SUCCESS(i) Infrastructure Support for Secondary Schools
(a) 15000 UPS upgraded to SS @ 60 lakh per School (75:25)(b)Strengthening of existing 44000 SS @ Rs 40 lakh per school
(75:25)(ii) ICT in Schools
(iii) Girl Child Incentive(iv) IEDSS(v) In service training to teachers @ Rs1000/teacher/annum for 17 lakh(vi) Support for Science Labs and Library @ Rs 4 lakh/Lab—25000
Schools(vii) New Model Schools (6000)(viii)Vocational Education
10 Upgrading 2000 KGBVs (Residential Schools/Hostels)11 OSC Merit/National Means cum Merit Scholarship
Total BGrand Total (A+B)
20 Ministry of External Affairs
Central Sector Schemes
1 Tala Power Project2 Dungsum Cement Project3 Punatsangchu Hydroelectric Project (for DPR-07–08 )4 Pul-e-Khumri Project in Afghanistan
New Schemes
1 Kaladan Multi-modal Transit Transport Project—Myanmar
2 Punatsangchu-I Hydroelectric Project3 Pre-Construction Activities for Punatsangchu-I Hydroelectric Project4 Integrated Development of Selected Border Checkposts (5)
5 Development of Road Infrastructure in the Terai Region of Nepal6 Naumure Hydel Project in Nepal
Cross Border Raillink between India and Nepal
5968.02 6750.0010167.73 11500.00
5304.90 6000.00
1326.23 1500.00884.15 1000.00
1768.30 2000.00
769.21 870.00884.15 1000.00
11272.92 12750.001768.30 2000.001485.37 1680.00
156132.16 176590.00163505.98 184930.00
44.21 50.00274.09 310.00
1.47 1.66265.25 300.00
265.25 300.00
1060.98 1200.0011.27 12.7570.73 80.00
61.89 70.00145.00 164.00
0.00 0.00
Universalization of ICT in schools & institutions on a singleportal.
To be launched in 2008–09.
Complition in 2007–08.MEA’s total commitment is Rs 300 Crore for plant.
Project is absolutely unviable and EFC has made a number ofobservations which need to be rectified.
Either MEA or MHA should build the checkposts to avoidduplication/overlapping and be completed in 3 years insteadof 5 years. A meeting be held with MHA and MEA to sort outthis aspect.
(Appendix contd.)

(Appendix contd.)
1 2 3 4 5 6
New Schemes—from 2008–09
Construction of Embankment on Kamla River5600 MW Pancheshwar Multipurpose Project (MPP)330 MW Sun Koshi Sapta Koshi Multipurpose Project10800 MW Karnali Chisapani Multipurpose Project
Grand Total
21 Department of Earth Sciences
1 Polar Science2 Polymetallic Nodules (PMN) Programme3 Ocean Observation and Information System (OOIS)4 Marine Research and Technology Development (MRTD)
5 Delineation of the Outer Limits of Continental Shelf6 Coastal Research Vessels and Other Research vessels7 National Institute of Ocean Technology (NIOT)
8 Information Technology9 Comprehensive Topography Surveys10 Gas Hydrates11 Acquisition of Research Vessel ‘Sagar Nidhi’12 Data Buoy Programme/Integrated Sustain Ocean Observation13 Tsunami & Storm Surge Warning System14 National Centre for Antarctic and Ocean Research (NCAOR)15 Indian National Centre for Ocean Information Services (INCOIS)16 Seafront facilities17 National Centre for Medium Range Weather Forecast (NCMRWF)18 Indian Institute of Tropical Meteorology (IITM)19 Indian Meteorological Department (IMD)
(i) Space Meteorology(ii) Agro Met Advisory Services(iii) Seismic Hazard and Risk Evaluation(iv) Operation & Maintenance(v) Aviation Meteorology(vi) Modernization of IMD (Communication, Observation, Cyclone
warning, Forecasting, Aviation Services, Instrumentation,Infrastructural Development)
0.00 0.00
0.00 0.000.00 0.000.00 0.000.00 0.00
2200.13 2488.41
241.37 273.00282.04 319.00
88.42 100.00284.70 322.00
5.30 6.0068.96 78.00
239.60 271.00
17.68 20.0045.98 52.0049.51 56.00
154.73 175.0050.40 57.0087.53 99.0059.24 67.00
100.79 114.0092.84 105.0061.01 69.00
211.31 239.00
44.21 50.0038.90 44.00
329.79 373.0083.11 94.00
130.85 148.002219.22 2510.00
Projects under consideration for Eleventh Plan Estimates notavailable yet.
Polar and Ocean Science Programme (New Merged Scheme).Ocean Resource Suveys (New Merged Scheme).Information and Advisory Services (New Merged Scheme).Technology Development/Demonstration Programmes(New Merged Scheme).
Research Vessels/Platforms (New Merged Scheme).Technology Development/Demonstration Programmes(New Merged Scheme).Information and Advisory Services (New Merged Scheme).
Ocean Resource Suveys (New Merged Scheme).Research Vessels/Platforms (New Merged Scheme).Information and Advisory Services (New Merged Scheme).Information and Advisory Services (New Merged Scheme).Polar and Ocean Science Programme (New Merged Scheme).Information and Advisory Services (New Merged Scheme).
Atmospheric Science Programme (New Merged Scheme).
Meteorological Services (New Merged Scheme).
(Appendix contd.)

(Appendix contd.)
1 2 3 4 5 6
20 Development of Manned Submersible
21 Multichannel Seismic System onboard ORV Sagar Kanya22 Expeditions to the Arctic Region23 Desalination Plant
24 National Oceanarium25 Demonstration of Shoreline Protection Measures
26 Integrated Ocean Drilling Prog. & Geotechnoic Studies (IODP)27 Ice-Class Research Vessel28 Headquarters Building29 Multi-hazards Early Warning Support System30 Centre for Climate Change31 Dedicated Weather Channel & Commonwealth Games32 NIOT Extension Centre West Bengal33 R&D in Earth & Atmopsheric Sciences
Grand Total
22 Department of Fertilizers
Central Sector Schemes
1 Revival of Sick CPSEs2 Capital Subsidy for Conversion of 4 Existing FO/LSHS
Plants to NG/LNG
Grand Total
23 Department of Food & Public Distribution
1 Construction of Godowns by Food Corporation of India etc.
2 Integrated Information System for Foodgrains Management (IISFM)3 Strengthening of PDS4 NSI, Kanpur
5 Consultancies, Training, and Research
83.99 95.00
62.77 71.0040.67 46.00
115.82 131.00
88.42 100.0030.95 35.00
53.93 61.00389.03 440.00
44.21 50.0017.68 20.00
142.35 161.0075.15 85.0028.29 32.0031.83 36.00
6192.59 7004.00
537.00 607.36782.58 885.12
1319.58 1492.48
147.26 166.56
180.47 204.12129.94 146.96
10.83 12.25
23.10 26.13
Technology Development/Demonstration Programmes (NewMerged Scheme).
Polar and Ocean Science Programme (New Merged Scheme)Technology Development/Demonstration Programmes (NewMerged Scheme).
Technology Development/Demonstration Programmes (NewMerged Scheme).Polar and Ocean Science Programme (New Merged Scheme)Research Vessels/Platforms (New Merged Scheme).
(1) Regarding the conversion of FO/LSHS based plants togas besed, D/o Fertilizer would explore various possibilitiesincluding setting up of large ammonia unit at Panipat (2)Revival of CPSEs will depend upon proper and bankable studyand timely submission of DPRs.
PFPD would propose a new modified scheme for creatingstorage capacity for the Eleventh Plan.Evaluation, Monitoring, & Research for food grain manage-ment & strengthening of PDS.Govt. should support its modernization which should befunded through PPP.Various schemes of training, evaluation, and consultancy maybe merged under a single scheme—‘Training, Evaluation, andConsultancy’.
(Appendix contd.)
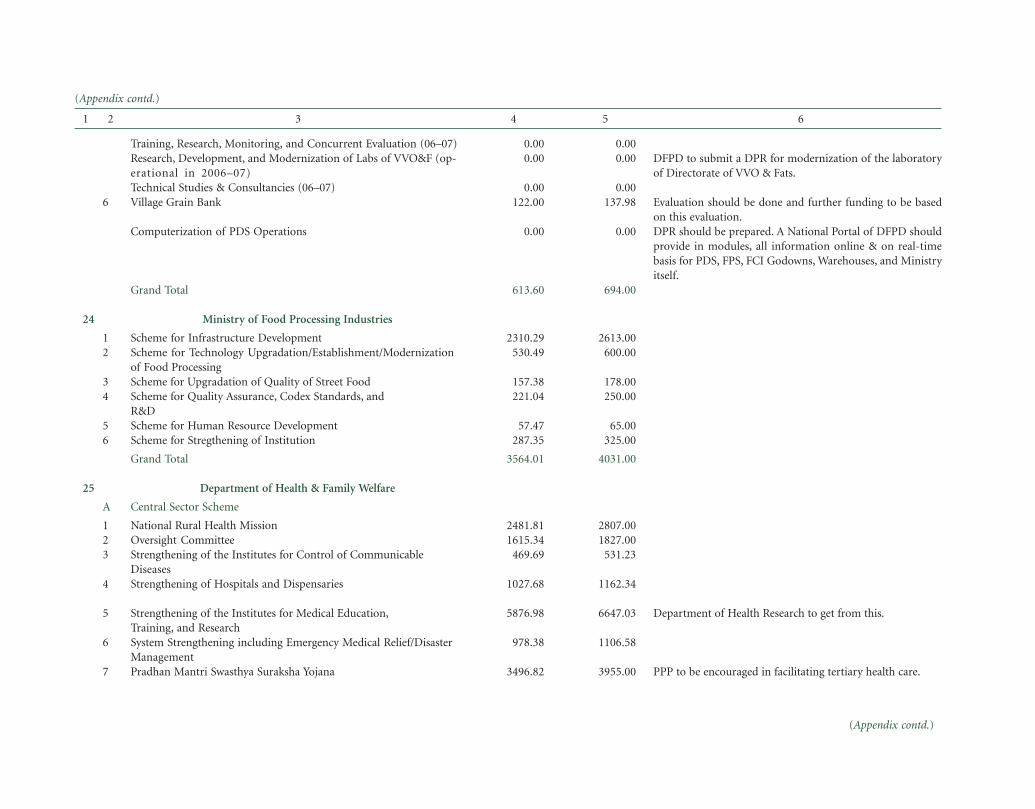
(Appendix contd.)
1 2 3 4 5 6
Training, Research, Monitoring, and Concurrent Evaluation (06–07)Research, Development, and Modernization of Labs of VVO&F (op-erational in 2006–07)Technical Studies & Consultancies (06–07)
6 Village Grain Bank
Computerization of PDS Operations
Grand Total
24 Ministry of Food Processing Industries
1 Scheme for Infrastructure Development2 Scheme for Technology Upgradation/Establishment/Modernization
of Food Processing3 Scheme for Upgradation of Quality of Street Food4 Scheme for Quality Assurance, Codex Standards, and
R&D5 Scheme for Human Resource Development6 Scheme for Stregthening of Institution
Grand Total
25 Department of Health & Family Welfare
A Central Sector Scheme
1 National Rural Health Mission2 Oversight Committee3 Strengthening of the Institutes for Control of Communicable
Diseases4 Strengthening of Hospitals and Dispensaries
5 Strengthening of the Institutes for Medical Education,Training, and Research
6 System Strengthening including Emergency Medical Relief/DisasterManagement
7 Pradhan Mantri Swasthya Suraksha Yojana
0.00 0.000.00 0.00
0.00 0.00122.00 137.98
0.00 0.00
613.60 694.00
2310.29 2613.00530.49 600.00
157.38 178.00221.04 250.00
57.47 65.00287.35 325.00
3564.01 4031.00
2481.81 2807.001615.34 1827.00
469.69 531.23
1027.68 1162.34
5876.98 6647.03
978.38 1106.58
3496.82 3955.00
DFPD to submit a DPR for modernization of the laboratoryof Directorate of VVO & Fats.
Evaluation should be done and further funding to be basedon this evaluation.DPR should be prepared. A National Portal of DFPD shouldprovide in modules, all information online & on real-timebasis for PDS, FPS, FCI Godowns, Warehouses, and Ministryitself.
Department of Health Research to get from this.
PPP to be encouraged in facilitating tertiary health care.
(Appendix contd.)

(Appendix contd.)
1 2 3 4 5 6
New Initiatives under CS
8 Forward Linkages to NRHM in NE*
9 National Centre for Disease Control
10 Advisory Board for Standards11 Programme for Blood and Blood Products12 Redevelopment of Hospitals/Institutions
Total A
B Centrally Sponsored Schemes
1 NRHM
2 National AIDS Control Programme including STD Control
3 (i) National Cancer Control Programme(ii) Tobacco Control
4 National Mental Health Programme5 Assistance to States for Drug & PFA Control6 Assistance to States for Capacity Building in Trauma Care
New initiatives under CSS
7 e-Health (including Telemedicine)8 National Programme for Prevention and Control of Diabetes,
Cardiovascular Disease, and Stroke9 Health Care of Older Persons10 District Hospitals11 Human Resources for Health#
6151.32 6957.32
795.74* 900*
397.87 450.00
19.45 22.00397.87 450.00
5336.13 6035.32
22098.02 24993.50
76630.22 86671.00
5064.41 5728.00
2121.96 2400.00417.25 471.92
884.15 1000.00229.88 260.00648.04 732.95
12280.52 13889.63
161.80 183.001468.13 1660.50
353.66 400.002457.94 2780.003536.60 4000.00
(Appendix contd.)
Redevelopment of NICD as World Class ‘National Centre forDisease Control’.
Salary component to be transferred to Non-Plan. Time boundfinancial and physical targets to be fixed.Composite lab facility for all diseases and PPP should beencouraged.
The Programme for Control of Cancer and Tobacco can betaken as two components. Convergence with communicabledisease programme should be attempted.
Note: * Through earmarked 10% allocation for NE—to come from different schemes.#Additional requirement for Oversight Committee can be covered under this.

(Appendix contd.)
1 2 3 4 5 6
12 Health Insurance based National Urban Health Mission13 Pilot Projects:
(i) Sports Medicine(ii) Deafness(iii) Leptospirosis Control(iv) Control of Human Rabies(v) Medical Rehabilitation(vi) Oral Health(vii) Fluorosis(viii) Organ Transplant
Total BGrand Total (A+B)
26 Department of Heavy Industry
1 (i) National Automative Testing and R&D Infrastructure Project(NATRIP) and (ii) FID
2 Restructuring of PSEs under DHI (lumpsum provision for pendingproposals)
3 Project based Support to CPSEs/Autonomous Institutes
4 Modernization fund for Capital Goods Sector
5 Additions Modifications and Replacements (AMR)
6 Professional and Special Services7 Secretariat Expenditure (Computerization)
Coal Gasification Demonstration ProjectGrand Total
27 Ministry of Home Affairs
1 Police Housing
2 Critical Infrastructure in Extremist Affected Areas
3974.26 4495.00
79.57 90.0088.42 100.00
3.96 4.487.65 8.65
44.21 50.0022.10 25.0060.12 68.0022.10 25.00
21646.21 111153.50120374.45 136147.00
1149.40 1300.00
2147.87 2429.30
265.25 300.00
44.21 50.00
8.84 10.003.27 3.70
3618.83 4093.00
2210.38 2500.00
442.08 500.00
Not launched in 2007–08. It may be taken up for Eleventh Plan.
A few pilot projects would be taken up which will be eventu-ally, depending on the success and experience gained, upscaledand put under NRHM/NUHM.
NATRIP & FID, Secretariat expenditure of DHI would con-tinue in the Eleventh Plan.CPSEs/Autonomous Institutes other than CPSEs which areyet to be considered for restructuring be brought under onecomposite scheme namely ‘Project Based Support to CPSEs/Autonomous Institutes’ for meeting budgetary support forapproved restructuring,approved schemes, and project basedscheme.Experience of similar parks under other Ministries needs tobe considered in this case.Crucial Balancing Investment should be dropped. AMR tocontinue in Eleventh Plan. Some component such as profes-sional & special services, other administrative expenses andadvertisement and publicity be merged as ‘Professional &Special Services as One Single Scheme’.The project should be supported fully through IEBR of CPSUs.
Police infrastructure scheme should be on non-Plan side andsufficient justification for taking up some component underPlan budget.
(Appendix contd.)

(Appendix contd.)
1 2 3 4 5 6
Police Education & Training
3 Police Education & Training
4 BPR&D5 Strengthening of North Eastern Police Academy (NEPA)6 Upgradation of NPA into NPU7 Modernization of Delhi Police
Scheme of Forensic Science
8 Directorate of Forensic Science—CFSLs & GEQD9 Directorate of CFSL—CFSL (CBI), New Delhi10 National Institute of Criminology and Forensic Sciences (NICFS)
11 Crime and Criminal Tracking Network and Systems12 NCRB13 Official Language
Registrar General of India
14 Improvement in Vital Statistics System & Other Schemes15 National Population Register16 NE Division
66.31 75.00
132.62 150.0044.21 50.00
1.77 2.00424.39 480.00
265.25 300.007.07 8.00
13.26 15.00
1768.30 2000.008.84 10.00
35.37 40.00
132.62 150.00265.25 300.00
4.42 5.00
Functions like Research, Education, and Training be treatedas one continuum for all such institutions. A comprehensiveproject for upgradation of capacities in existing training in-stitutions be prepared not only for Delhi but also for otherstates. Expansion of communication infrastructure should bea part of crime reporting/detection system. All activities wthfinancial implications be categorized as Plan and non-Plan.All police buildings should be modern, functional, eco friendly,IT-friendlly and approvals subject to their being so.
All institutions & major ongoing schemes to be evaluated in-depth through professional agencies on priority. Schemes tobe designed and implemented in project mode with welldefined outcomes and targets. DPRs to be prepared for everyscheme/project. Project preparation and implementationshould be separated. Whole crime detection and forensic sys-tem be evaluated by an IIM for major increase in funding.One composite scheme as Modernization of Forensic ScienceApplications for better design and implementation. Nomen-clature and nature of schemes for Eleventh Plan need to berationalized.
There should be no overlap of schemes of Department of OLwith that of schems of HRD. Focus should be on few majorareas and rest should be subjected to ZBB.Schemes of RGI to be reorganized in to few composite schemes.
New innovative scheme for this division and proposed objec-tive should be pursued by DoNER.
(Appendix contd.)

(Appendix contd.)
1 2 3 4 5 6
Human Rights Division
17 Construction of Manav Adhikar Bhavan18 Complaints Handling Management System
National Disaster Management
19 Strengthening of Fire and Emergency Services20 All Other Disaster Management Schemes/Projects (Development of
Advance Warning Systems, Capacity Building, Protocol for Disasters,National Portal on Disasters, etc.)
21 Revamping of Civil Defence
Grand Total
28 Department of Industrial Policy and Promotion
Central Sector Scheme
1 Transport Subsidy scheme2 IC&JV and Asia Enterprise in India & Undertaking Investment
Promotion Activities3 D/o Explosives
4 Modernization and Strengthening of Patent Office (Revenue)5 Project Based Support to Autonomous Institutions
(i) CMTI
(ii) CPPRI(iii) Quality Council of India(QCI)(iv) National Institute of Design (NID)
(v) NCCBM(vi) IRMRA(vii) NPC(viii) NMCC
6 Indian Leather Development Programme (ILDP)
7 Salt Commissioner (for NMAY)
4.42 5.008.84 10.00
176.83 200.0088.42 100.00
88.42 100.00
6189.05 7000.00
0.88 1.0085.76 97.00
10.61 12.00
282.93 320.00493.36 558.00
1149.40 1300.00
4.42 5.00
The cost of MAB and its phasing need to be reviewed. CHMSto be supported on submission of DPR.Functions of NDMA & M/o Earth Sciences needs to besynergized and integrated.
Further allocation would be subject to an in-depth evaluation.Merge IC&JV with Investment Promotion Activities ande-Biz pilot project should be a part of this scheme.All autonomous institutions and major schemes (annualoutlay over Rs 50 cr) would be evaluated before further GBSdisbursal.
Venturing into nanotechnolgy application be done by D/o S&Tand DIPP need not duplicate this.Instead of providing outlay to each autonomous body, anintegrated scheme of Project Based Support to AutonomousInstitutions be put in place. In-depth evaluation by indepen-dent agency to justify continuation of budgetary support.
Detailed analysis of the expenditure to be provided beforeenhancing the outlays.NMAY to be merged with IAY as per the fesibility of opera-tion.
(Appendix contd.)

(Appendix contd.)
1 2 3 4 5 6
8 Industrial Infrastructure Upgradation Scheme (IIUS)
9 Technology Upgradation (New Initiative)*10 Delhi Mumbai Industrial Corridor Development Corporation
Total
Centrally Sponsored Scheme
11 NEIP Package (including Integrated Infrastructure DevelopmentScheme)
12 Package for (Other than North East) Special Category States13 Growth Centre Scheme (other than NE)
TotalGrand Total (A+B)
29 Department of Information & Technology
A Central Sector Schemes
I R&D PROGRAMME
1 SAMEER2 Microelectronics and Nanotech Dev. Prog.3 Technology Dev. Council (Including IPR)4 Convergence, Comm., and Strategic Electronics5 Components, Material and Photonics Dev. Prog.6 C-DAC7 Electronics in Health and Telemedicine8 Technology Dev. for Indian Languages9 IT for Masses (Gender, SC/ST)10 Media Lab. In Asia
R&D Subtotal
II INFRASTRUCTURE DEVELOPMENT
1 STQC2 STPI/EHTP3 Digital DNA Park4 Electronic Governance
928.36 1050.00291.77 330.00
3247.49 3673.00
265.25 300.00
176.83 200.008.84 10.00
450.92 510.003698.40 4183.00
130.85 148.00221.04 250.00309.45 350.00176.83 200.00
88.42 100.00795.74 900.00
88.42 100.0088.42 100.00
137.93 156.00265.25 300.00
2302.33 2604.00
291.77 330.0039.79 45.00
8.84 10.004413.68 4992.00
New version of IIUS under the name ‘IIUS for NE States only’.Rapid assessment of the scheme for ensuring appropriateregional spread.Sufficient justification to be provided for this new scheme.
Close scrutiny of Regional Developemnt Scheme.
(Appendix contd.)
Note: * Not yet decided

(Appendix contd.)
1 2 3 4 5 6
5 Cyber Security including Cert-in IT Act6 ERNET7 Promotion of Electronics/IT Hardware Manufacturing
Infrastructure Subtotal
III HUMAN RESOURCE DEVELOPMENT
1 DOEACC2 Manpower Development3 Facilitation of Setting up of Integrated Townships
HRD Subtotal
IV OTHERS
4 Others—Headquarter (Secretariat & Bld.)5 NIC
HRD SubtotalGrand Total
30 Ministry of Information & Broadcasting
A Information
1 PIB2 Publications Division3 DAVP4 IIMC5 Photo Division6 DFP7 Song & Drama Division8 RRTD9 RNI10 Main Secretariat Scheme (Information Wing)
B Film
1 Films Division2 NFAI3 Directorate of Film Festivals4 CFSI5 CBFC6 NFDC
530.49 600.008.84 10.00
972.57 1100.00
6265.98 7087.00
8.84 10.00296.19 335.00
53.05 60.00
358.08 405.00
88.42 100.002033.55 2300.00
2121.96 2400.0011048.35 12496.00
277.63 314.00
74.23 83.952.20 2.49
50.35 56.9538.93 44.03
2.92 3.306.01 6.80
19.81 22.406.63 7.501.36 1.54
75.19 85.04
397.88 450.00
62.64 70.8526.53 30.00
4.42 5.0018.36 20.7711.05 12.5040.88 46.23
(Appendix contd.)

(Appendix contd.)
1 2 3 4 5 6
7 FTII8 SRFTI9 Main Secretariat Scheme (Film Wing)
C Broadcasting
1 AIR (Including Expansion of FM Services)2 Doordarshan3 Main Secretariat Scheme (Broadcasting Wing)
Grand Total (A+B+C)
31 Department of Justice
A Central Sector Schemes
1 Domestic Resources for ‘Indian Administration of Justice’ Project inCollaboration with the ADB (EAP) (New Scheme)
2 Admn. of Justice India Project (ADB) (New Scheme)
Total A
B Centrally Sponsored Schemes
1 Computerization of District and Subordinate Courts2 Capacity building and Infrastructure facilities for Judiciary
(i) To UTs without Legislature(ii) To State Governments(iii) To UTs with Legislature
3 Study of Justice Reforms & Assessment Status (New Scheme)
Total BGrand Total (A+B)
32 Ministry of Labour & Employment
A Central Sector Schemes
I DGE&T (EMPLOYMENT)
1 Construction of Office Building, Staff Quarters, and Skill TrainingInstitutes
2 Continuation and Setting up of New Vocational RehabilitationCentres for Handicapped persons including Skill TrainingWorkshops and Rural Rehabilitation Extension Centres.
84.27 95.3153.05 60.0061.01 69.00
4133.49 4675.00
1430.59 1618.002680.80 3032.00
22.10 25.00
4809.00 5439.00
3.60 4.07
1.45 1.64
5.05 5.71
654.80 740.60619.86 701.08
20.00 22.62
1294.66 1464.301299.71 1470.01
29.53 33.40
19.45 22.00
5.66 6.40
(Appendix contd.)

(Appendix contd.)
1 2 3 4 5 6
3 Welfare of SC/ST Job Seekers through Coaching, Guidance, andVocational Trg. and Intro. of New Courses in Existing CGCs & Esttof New CGCs in States not Covered so far
II DGE&T (TRAINING)
4 National Instructional Media Institute, Chennai5 Upgradation of Apprenticeship Training6 Diversification, Upgradation, and Expansion of Training to Women7 Foremen Trg Inst. at Jamshedpur & Bangalore8 Model Industrial Training Institutes (MITIs)9 Diversification, Upgradation, and Expansion of Advanced/Central
Trg. Inst. and Intro. of Hi-tech Trg.10 Strengthening of Trainers’ Skills and MIS11 Upgradation of Training Infrastructure in DGE&T Institutes
including CSTARI12 Project Impl. And Trade Testing in DGE&T HQ13 Building equipment & Establishment for RVTIs (Calcutta, Hissar,
Allahabad, Indore, Bubhaneswar, Vadodara, Jaipur, and Tura)
III INDUSTRIAL RELATIONS
14 Strengthening of Adjudication Machinery & Holding Lok Adalats
15 Machinery for Better Conciliation and Upgradation of OfficeInfrastructure at CLC’s and RLC’s
16 Improvement and Strengthening of Training Wing of Central LabourService Officers
IV CENTRAL BOARD FOR WORKERS’ EDUCATION (CBWE)
17 Central Board for Workers’ Education (CBWE)
V CHILD LABOUR
18 Child Labour Cell19 National Child Labour Project (including Grants-in-aid to Voluntary
Agencies)
4.42 5.00
102.52 115.95
12.11 13.709.73 11.00
15.47 17.505.30 6.008.84 10.00
22.10 25.00
4.64 5.257.96 9.00
3.09 3.5013.26 15.00
41.38 46.80
11.32 12.80
28.29 32.00
1.77 2.00
44.21 50.00
44.21 50.00
579.16 655.05
0.04 0.05552.59 625.00
Two schemes (i) Strengthening of Adjudication Machineryand (ii) Holding of Lok Adalats in the CGIT-cum-LabourCourts as an Alternative Grievance Redressal Mechanism havebeen merged under it.Two schemes (i) Upgradation of Office Infrastructure atCLC(C) & RLC(C), ND, and (ii) Machinery for better con-ciliation and preventive mediation and more effective enforce-ment of labour laws have been merged under it.
To be transferred to Non-Plan.
(Appendix contd.)

(Appendix contd.)
1 2 3 4 5 6
20 Indo-American CLP (INDUS) with matching US grant
VI WOMEN LABOUR
21 Women Cell22 Grants-in-Aid to Voluntary Agencies
VII LABOUR BUREAU
23 Consumer Price Index for Industrial Workers 2001 Series and RuralLabour Enquiry
24 Labour Statistics
25 Improvement in the Labour and Employment Statistical System
VIII DIRECTOR GENERAL OF MINES SAFETY (DGMS)
26 Mine Accident Analysis and Modernization of Information Database(MAMID)
27 Strengthening of Core Functions of DGMS (SOCFOD)
28 Improving Efficiency by Providing Infrastructural Facilities inDGMS (PIF)
IX DIRECTOR GENERAL, FACTORY ADVICE SERVICE, ANDLABOUR INSTITUTE (DGFASLI)
29 Establishment of a New Regional Labour Institute30 Strengthening of DGFASLI Organization and Occupational Safety
and Health in Factories, Ports, and Docks
26.52 30.00
2.40 2.71
0.01 0.012.39 2.70
38.02 43.00
7.07 8.00
13.26 15.00
17.68 20.00
34.35 38.85
10.61 12.00
14.68 16.60
9.06 10.25
22.10 25.00
8.84 10.0013.26 15.00
To be transferred to Non-Plan.
To be merged together under ‘Labour Statistics’.
Emerged after merging (i) Socio-economic Surveys of differ-ent segments of Labour, (ii) Collection of Labour Statisticsunder the Annual Survey of Industries (Extension to SampleSector), (iii) Occupational Wage Survey (Sixth) Round, (iv)Modernization of Machine Tabulation Unit, and (v) RuralLabour Enquiry including CPI for Agricultural & Rural Labour.
Schemes (i) Study of Mine Accidents (SOMA) and Develop-ment of Information System and (ii) Modernization ofSurvey capabilities in DGMS through Digitization of minesplan and automated survey system (MSC) and Moderniza-tion of Information database relating to Mines Managementhave been merged.Schemes (i) Augmentation of Science & Techonology Capa-bilities, Mine Rescue Services, and Human Resource Develop-ment (S&T) and (ii) Strengthening of Machinery for Conductof Statutory Examinations (SSEX) have been merged together.
(Appendix contd.)

(Appendix contd.)
1 2 3 4 5 6
X NATIONAL LABOUR INSTITUTE (NLI)
31 National Labour Institute
Other Schemes
32 Scheme on Information Technology33 Grants-in-aid to Research/Academic Institutions &
Non-governmental Voluntary Organizations forUndertaking Research in Labour Related Subjects
New Scheme under CS
34 Skill Development (Mission Mode)
Total A
B Centrally Sponsored Schemes
I DGE&T (TRAINING)
1 Establishment of New ITIs in NE States, Sikkim and Strengtheningand Modernization of ITIs in the State of J&K.
2 Upgradation of 100 ITIs into Centres of Excellence.3 Testing & Certification of Skills for Workers in the Informal Sector
II DGLW4 Rehabilitation of Bonded Labour
New Schemes under CSS
III DGE&T (TRAINING)
5 Skill Development Initiative through PPP6 Externally Aided Project for Reforms & Improvement in Vocational
Training Services Rendered by Central & State Governments
IV DGLW
7 Social Security for Unorganized Sector Workers8 Health Insurance for Unorganized Sector Workers
Total BGrand Total (A+B)
22.10 25.00
22.10 25.00
10.17 11.50
8.84 10.001.33 1.50
4.43 5.01
4.43 5.01
930.37 1052.27
117.00 132.33
55.11 62.33
61.89 70.00
13.26 15.0013.26 15.00
1149.40 1300.00
574.70 650.00
486.28 550.0088.42 100.00
574.70 650.00
265.25 300.00309.45 350.00
1279.66 1447.332210.02 2499.60
To be dropped as activities are taken under Skill DevelopmentInitiatives.
(Appendix contd.)

(Appendix contd.)
1 2 3 4 5 6
33 Department of Land Resources
A Central Sector Schemes
1 Professional Support, Capacity Building, M&E, IEC & RelatedActivities, TDET, Implementation/Monitoring of NationalRehabilitation Policy etc.
2 Others
Total A
B Centrally Sponsored Schemes
1 Integrated Watershed Development Programme (i) DPAP, (ii) DDP,(iii) IWDP
2 National Programme for Comprehensive Resource Management(i) CLR, (ii) SRA & ULR, (iii) CMLR
3 Biofuels4 EAP
Total BGrand Total (A+B)
34 Ministry of Mines
1 MECL2 GSI3 IBM4 S&T
Grand Total
35 Ministry of Minority Affairs
A Central Sector Schemes
1 Grant-in-aid to Maulana Azad Education Foundation2 National Minorities Development & Finance Corporation (NMDFC)
3 Free Coaching & Allied Scheme for Minorities4 Research/Studies, Monitoring, and Evaluation of Development
Schemes for Minorities including Publicity
428.25 484.36
39.67 44.87
467.92 529.23
15359.46 17372.00
513.69 581.00
403.17 456.00461.24 521.67
16737.57 18930.6717205.49 19459.90
44.19 50.00901.58 1020.00
79.55 90.0017.68 20.00
1043.00 1180.00
442.08 500.00442.08 500.00
39.79 45.0030.95 35.00
(1) Comprehensive & result oriented master plan be preparedfor better watershed management. (2) Computerization ofLand Records, Strengthening of Revenue Machinery, andUpdating of Land Records, Comprehensive Modernizationof Land Records be integrated under the head ‘NationalProgramme for Comprehensive Land Resource Management’.(3) M&E, Capacity-building and Professional Support bemerged in one Integrated programme—‘Monitoring andCapacity Building’. (4) In-depth evaluation of ongoingprogramme to be done through independent agency on toppriority.
Biodiesel Programme to be merged with IWMP.
Scheme ‘Additional Equity Contribution to NMDFC forDevelopment of Wakfs’ has been merged with Grant-in-aidto NMDFC.
(Appendix contd.)
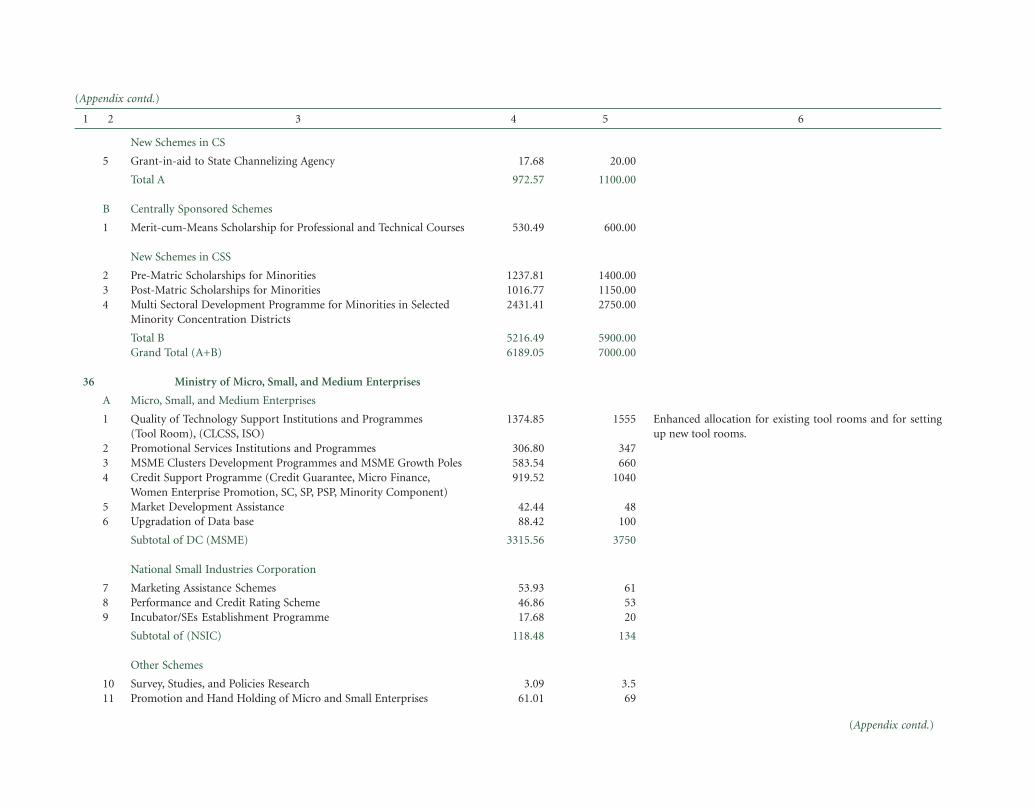
(Appendix contd.)
1 2 3 4 5 6
New Schemes in CS
5 Grant-in-aid to State Channelizing Agency
Total A
B Centrally Sponsored Schemes
1 Merit-cum-Means Scholarship for Professional and Technical Courses
New Schemes in CSS
2 Pre-Matric Scholarships for Minorities3 Post-Matric Scholarships for Minorities4 Multi Sectoral Development Programme for Minorities in Selected
Minority Concentration Districts
Total BGrand Total (A+B)
36 Ministry of Micro, Small, and Medium Enterprises
A Micro, Small, and Medium Enterprises
1 Quality of Technology Support Institutions and Programmes(Tool Room), (CLCSS, ISO)
2 Promotional Services Institutions and Programmes3 MSME Clusters Development Programmes and MSME Growth Poles4 Credit Support Programme (Credit Guarantee, Micro Finance,
Women Enterprise Promotion, SC, SP, PSP, Minority Component)5 Market Development Assistance6 Upgradation of Data base
Subtotal of DC (MSME)
National Small Industries Corporation
7 Marketing Assistance Schemes8 Performance and Credit Rating Scheme9 Incubator/SEs Establishment Programme
Subtotal of (NSIC)
Other Schemes
10 Survey, Studies, and Policies Research11 Promotion and Hand Holding of Micro and Small Enterprises
17.68 20.00
972.57 1100.00
530.49 600.00
1237.81 1400.001016.77 1150.002431.41 2750.00
5216.49 5900.006189.05 7000.00
1374.85 1555
306.80 347583.54 660919.52 1040
42.44 4888.42 100
3315.56 3750
53.93 6146.86 5317.68 20
118.48 134
3.09 3.561.01 69
Enhanced allocation for existing tool rooms and for settingup new tool rooms.
(Appendix contd.)

(Appendix contd.)
1 2 3 4 5 6
12 Training Institutions
13 International Cooperations14 National Commission on Enterprises in the Unorganized Sector
Subtotal of Other SchemesTotal of MSME
B Agro and Rural Industries
Khadi & Village Industries Commission (KVIC)
(i) Khadi
1 Khadi Grant (including MDA of Rs 10.00 crore for Khadi)2 Khadi R&D, Scheme for Enhancing Productivity & Competitiveness of
Khadi Industries and Artisans and Khadi Interest Subsidy and Loan
Subtotal of Khadi
(ii) Village Industries
3 Village Industries—Grant, Loan, Interest Subsidy, HRD, Marketing4 Restructured Rural Employment Generation Programme (REGP)*5 Setting up of Mahatma Gandhi Institute for Rural Industrialization
(MGIRI), Wardha6 Workshed-cum-Housing Scheme for Khadi Weavers7 Package for Developing Infrastructure for Khadi Institutions and
including Nursing Fund for Weak Institutions8 Scheme for Enhancing Productivity of Khadi Industries
Subtotal of Village IndustriesTotal of KVIC
Coir Board
9 Research & Development and Rejuvenation, Modernization, andTechnology Upgradation for Coir Industry
22.99 26
8.84 106.63 7.5
102.56 1163536.60 4000
761.13 860.86110.52 125
871.65 985.86
327.68 370.622873.49 3250
14.44 16.33
83.99 9544.21 50
79.57 90
3423.39 3871.954295.04 4857.81
125.55 142
All autonomous bodies/institutions should be evaluated andfindings to be incorporated. All training centres/institutes willbe supported for revamping of existing courses and introduc-tion of new courses as per industry requirement. Support toexisting training centres/institutes for upgradation of infra-structure and setting of new centres/institutes.
(Appendix contd.)
Note: * PMRY and REGP will be merged into a new scheme called Prime Minister’s Employment Generation Programme (PMEGP) once it is approved by the competent authority.
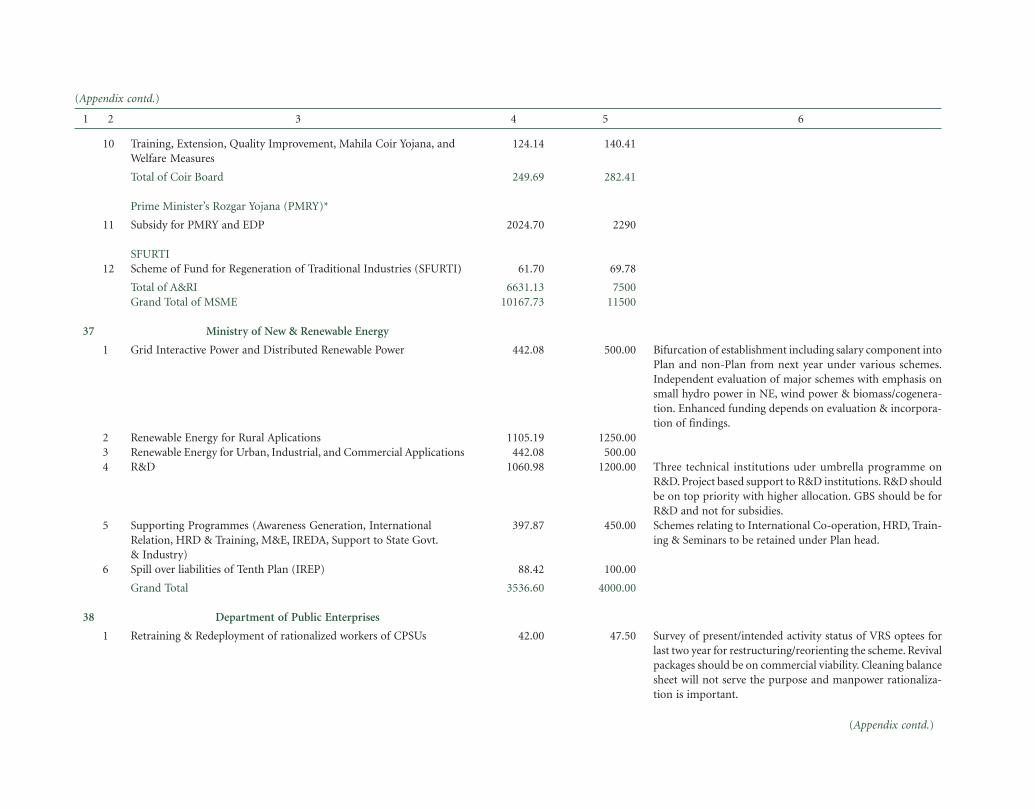
(Appendix contd.)
1 2 3 4 5 6
10 Training, Extension, Quality Improvement, Mahila Coir Yojana, andWelfare Measures
Total of Coir Board
Prime Minister’s Rozgar Yojana (PMRY)*
11 Subsidy for PMRY and EDP
SFURTI12 Scheme of Fund for Regeneration of Traditional Industries (SFURTI)
Total of A&RIGrand Total of MSME
37 Ministry of New & Renewable Energy
1 Grid Interactive Power and Distributed Renewable Power
2 Renewable Energy for Rural Aplications3 Renewable Energy for Urban, Industrial, and Commercial Applications4 R&D
5 Supporting Programmes (Awareness Generation, InternationalRelation, HRD & Training, M&E, IREDA, Support to State Govt.& Industry)
6 Spill over liabilities of Tenth Plan (IREP)
Grand Total
38 Department of Public Enterprises
1 Retraining & Redeployment of rationalized workers of CPSUs
124.14 140.41
249.69 282.41
2024.70 2290
61.70 69.78
6631.13 750010167.73 11500
442.08 500.00
1105.19 1250.00442.08 500.00
1060.98 1200.00
397.87 450.00
88.42 100.00
3536.60 4000.00
42.00 47.50
Bifurcation of establishment including salary component intoPlan and non-Plan from next year under various schemes.Independent evaluation of major schemes with emphasis onsmall hydro power in NE, wind power & biomass/cogenera-tion. Enhanced funding depends on evaluation & incorpora-tion of findings.
Three technical institutions uder umbrella programme onR&D. Project based support to R&D institutions. R&D shouldbe on top priority with higher allocation. GBS should be forR&D and not for subsidies.Schemes relating to International Co-operation, HRD, Train-ing & Seminars to be retained under Plan head.
Survey of present/intended activity status of VRS optees forlast two year for restructuring/reorienting the scheme. Revivalpackages should be on commercial viability. Cleaning balancesheet will not serve the purpose and manpower rationaliza-tion is important.
(Appendix contd.)

(Appendix contd.)
1 2 3 4 5 6
New Scheme (08–09)
2 Research Development and Consultancy(i) Support to IPE, Hyderabad(ii) Annual Survey on SLPEs by IPE(iii) Contribution to Corpus Fund of NFCG
(iv) Thematic Consultancy & Studies(v) Seminars, Workshops etc., on Generic Issues of CPSEs
Grand Total
39 Ministry of Personnel, Public Grievances, and Pensions
Central Sector Schemes
1 Training for all-Support for Training Activities & Capacity Buildingfor Project Appraisal
2 Domestic Funding of Foreign Training3 Grant to IIPA4 Augmentation of Training facilities in ISTM5 UNDP—(i) Strengthening of STIs, (ii) Citizen’s Access to
Information, (iii) Capacity Building for Access to Information6 DFID Project for Capacity Building for Poverty Reduction
(Training Component)7 Improvement of Infrastructure & Upgradation of Essential Facilities
at LBSNAA(i) Upgradation of LBSNAA to a Centre of Excellence(ii) Setting up of National Centre for Good Governance
8 Plan Schemes for Administrative Reforms9 Setting up of Administrative Reforms Commission10 Plan Scheme of CBI
(i) Modernization of Training Centre of CBI(ii) Construction of CBI HQ Office building(iii) CBI e-goverance
11 Plan Scheme of CIC(i) Other Plan Schemes of CIC(ii) New Sch. Construction of CIC Office Building
12 Pensioners’ Portal
Grand Total
5.75 6.50
47.74 54.00
59.68 67.50
60.30 68.208.84 10.003.82 4.32
31.03 35.10
30.95 35.00
0.00 0.00
95.49 108.0038.02 43.0062.60 70.8014.32 16.20
0.00 0.004.77 5.40
52.52 59.403.34 3.780.00 0.007.16 8.10
16.36 18.502.39 2.70
491.59 556.00
For annual survey of SLPEs on regular basis, these two schemesproposed for Eleventh Plan.A new scheme as Research Development & Consultancy hasbeen undertaken to initiate new activities by DPE.
(1) Need to upgrade ATIs especially in lagging States like Biharand UP after in-depth evaluation. DoPT to formulate a newCSS for strengthening State ATIs, in consultation with the StateGovernments. (2) The amount spent in 06–07 on DomesticFunded Foreign Training is much higher than domestic train-ing under the scheme ‘Training for All’. This needs to be ratio-nalized. (3) EAP schemes would be consolidated and madewide spread. (4) LBSNAA needed to be upgraded to a centreof global excellence for global quality ‘Mid Career TrainingProgramme for IAS and other Apex Civil Services’. (5) EachPlan schemes of DoPT need evaluation. (6) ‘e-Procurement’to be universalized in a time bound manner. (7) DoPT wouldsubmit a Plan Scheme for strengthening of State VigilanceDepartments (8) The Scheme ‘Public Library’ implementedby the Departmrnt of Culture, may be transferred to Minis-try of Human Resource Development. D/o ARPG wouldsubmit a note on setting up of public libraries network in therural areas.
(Appendix contd.)

(Appendix contd.)
1 2 3 4 5 6
40 Department of Posts
1 Access to Postal network2 Mail Operations3 Banking and Money Transfer Operations4 Insurance Operations
5 Philately Operations6 Estate management7 IT Induction—Postal Operations8 Material Management9 Human Resource Management
10 Marketing, Research and Product Development11 Quality Management
Grand Total
41 Ministry of Power
1 NHPC2 THDC3 SJVN4 NEEPCO5 MoP (Others)
(i) Central Electricity Authority(ii) National Power Training Institute(iii) Central Power Research Institute(iv) Interest Subsidy for REC-RGGVY
(v) Consultancy Charges & Enabling Activities for APDRP-II Project
(vi) Comprehensive Award Scheme for Power Sector(vii) Future Generation Project(viii) BEE(ix) Energy Conservation
48.73 55.11416.33 470.88125.99 142.50
30.95 35.00
13.26 15.00112.12 126.81
2387.21 2700.0044.21 50.0088.81 100.45
263.37 297.885.63 6.37
3536.60 4000.00
0.88 1.00263.44 297.96291.77 330.00
1821.26 2059.90
115.91 131.1049.41 55.89
110.52 125.0023432.64 26503.00
383.72 434.00
1.14 1.2944.21 50.00
149.31 168.87
This business needs to be expanded. Adequate initial Planfunding could be provided subject to operations beingcorporatized.
Training programmes need to be strengthened and trainingfacilities expanded for ensuring training for all, particularlyon best practices.
No GBS for NHPC except Rs 1 crore provided during 2007–08.
RGGVY to continue in Eleventh Plan with more focus andregular flow of funds.APDRP-support to programme with 100% loan funding anddepending on performance, it would be converted into grant.No GBS for APDRP-II as the amount will be raised by CPSUs(PFC & REC). APDRP to continue in Eleventh Plan with somerestructuring.
To be merged with BEE as both are serving similar purpose.
(Appendix contd.)

(Appendix contd.)
1 2 3 4 5 6
(x) Computerization & Office Equipment(xi) Funds for Evaluation Studies & Consultancy(xii) Setting up of Joint SERC(xiii) Assistance for Capacity Building(xiv) Scheme for Equity Gap Funding
Grand Total
42 Ministry of Panchayati Raj
A Central Sector Schemes
1 Panchayat Empowerment and Accountability Incentive Scheme2 Management Cell3 Contribution to International Organization4 Allocation for NER and Sikkim5 External Assistance under Projects Assisted by UN Agencies
Total A
B Centrally Sponsored Schemes
1 Rashtriya Gram Swaraj Yojana including Media Publicity and Advocacy
Total BGrand Total (A+B)
43 Ministry of Planning
Central Sector Schemes
A Planning
1 Tsunami Rehabilitation Programme2 Renovation & Alteration3 Information Technology4 Economic Advisory Council to Prime Minister5 National Knowledge Commission6 50th Year Initiative for Planning7 Strengthening Evaluation Capacity in Government8 Other General Economic Services
(i) Grant-in-aid to IAMR for Taking up Studies on Topics ofCurrent Interest to Planning Commission.
(ii) Grant-in-aid to Universities & Research Institutions forTraining, Research, Institutional Development etc.
(iii) Expertise for Planning Process (Payments for Professionals etc.)
4.33 4.90
255.52 289.00
26924.08 30451.91
101.68 115.006.19 7.000.09 0.10
77.47 87.6238.02 43.00
223.44 252.72
551.40 623.65
551.40 623.65774.84 876.37
14.35 16.2321.53 24.35
4.78 5.419.57 10.82
14.35 16.2357.41 64.93
124.39 140.690.00 0.00
14.35 16.23
9.57 10.82
4.78 5.41
Bifurcation of establishment including salary component intoPlan and non-Plan from next year. Some of these componentsof MoP (other) may be weeded out in 2008–09 as the activi-ties under Plan budget is over.
To be transferred to non-Plan from 2008–09.This can be reconstructed into non-Plan.
Media Publicity & Advocacy has been merged with RGSY.
(Appendix contd.)
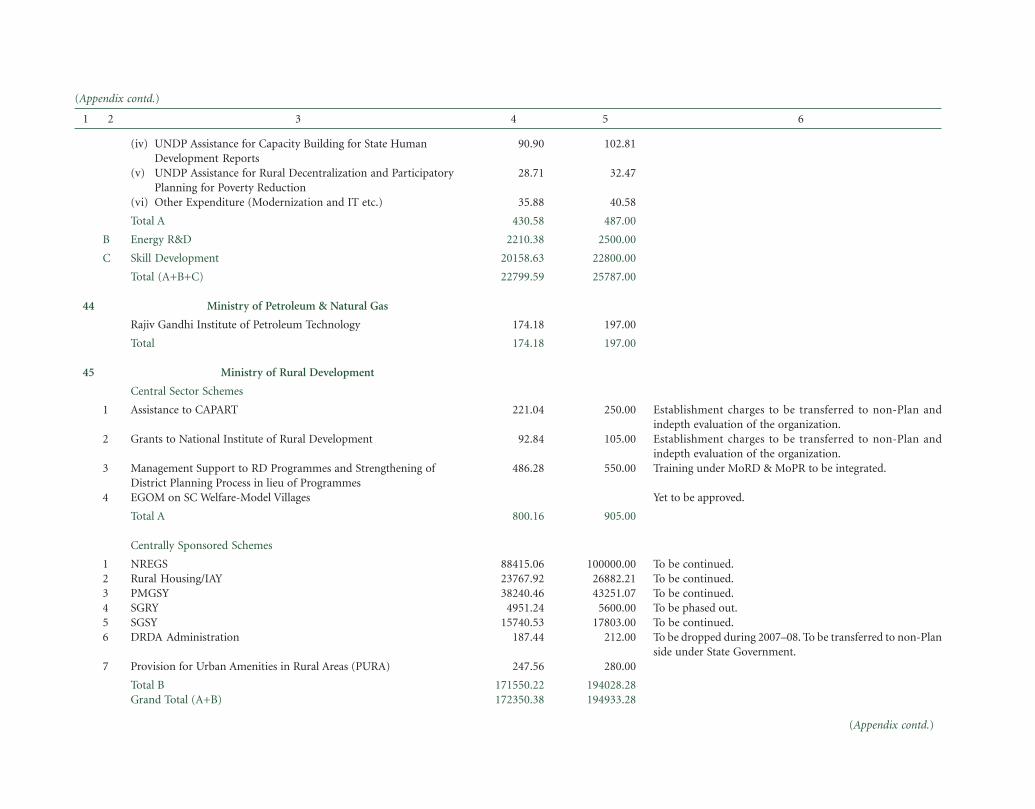
(Appendix contd.)
1 2 3 4 5 6
(iv) UNDP Assistance for Capacity Building for State HumanDevelopment Reports
(v) UNDP Assistance for Rural Decentralization and ParticipatoryPlanning for Poverty Reduction
(vi) Other Expenditure (Modernization and IT etc.)
Total A
B Energy R&D
C Skill Development
Total (A+B+C)
44 Ministry of Petroleum & Natural Gas
Rajiv Gandhi Institute of Petroleum Technology
Total
45 Ministry of Rural Development
Central Sector Schemes
1 Assistance to CAPART
2 Grants to National Institute of Rural Development
3 Management Support to RD Programmes and Strengthening ofDistrict Planning Process in lieu of Programmes
4 EGOM on SC Welfare-Model Villages
Total A
Centrally Sponsored Schemes
1 NREGS2 Rural Housing/IAY3 PMGSY4 SGRY5 SGSY6 DRDA Administration
7 Provision for Urban Amenities in Rural Areas (PURA)
Total BGrand Total (A+B)
90.90 102.81
28.71 32.47
35.88 40.58
430.58 487.00
2210.38 2500.00
20158.63 22800.00
22799.59 25787.00
174.18 197.00
174.18 197.00
221.04 250.00
92.84 105.00
486.28 550.00
800.16 905.00
88415.06 100000.0023767.92 26882.2138240.46 43251.07
4951.24 5600.0015740.53 17803.00
187.44 212.00
247.56 280.00
171550.22 194028.28172350.38 194933.28
Establishment charges to be transferred to non-Plan andindepth evaluation of the organization.Establishment charges to be transferred to non-Plan andindepth evaluation of the organization.Training under MoRD & MoPR to be integrated.
Yet to be approved.
To be continued.To be continued.To be continued.To be phased out.To be continued.To be dropped during 2007–08. To be transferred to non-Planside under State Government.
(Appendix contd.)

(Appendix contd.)
1 2 3 4 5 6
46 Department of Road Transport & Highways
A Central Sector Schemes
1 Externally Aided Projects—NHAI(i) Grant to NHAI(ii) Loan to NHAI
2 NH (Original) including Machinery & Equipment andTravel Expenses
3 Works under BRDB4 Strategic Roads under BRDB5 NHAI (Investment)6 Special Accelerated Road Development Programme for NE7 Kaladan Multi Modal Project8 Rail-cum-Road Bridge at Ganga, Munger9 Rail-cum-Road Bridge at Bogibeel, Assam10 Other Charges & IT11 R&D and Training12 Charged Expenditure
Subtotal A
B Road Transport13 Road Safety$ (Model Driving Training School dropped w.e.f. 2007–08)14 National Database Network15 Inspection & Maintenance Centre, Strengthening of Public Transport,
Creation of National Road Safety Board
Subtotal BTotal (A+B)
C Centrally Sponsored Scheme16 E&I from CRF#
(i) States(ii) UTs
Subtotal CTotal (A+B+C)
4454 5037.573563.2 4030.06
890.8 1007.5116500 18662
2500 2827.55500 565.51
36238 40985.959562 10814.83
315.65 357.01392 443.36700 791.71
200 226.2
71361.65 80711.69
363.3 448113.5 127523.2 556
1000 113172361.65 81842.69
1168.35 1321.43
1168.35 1321.4373530.00 83164.12
(Appendix contd.)
Note: $ This also includes past liabilities for ‘Model Driving Training Schools’.# Includes Rs 140.85 crore for Harichandanpur-Naranpur (Rs 159.30 crore at current price) & Rs 127.50 crore (Rs 144.21 crore at current price) for Mughal Road.

(Appendix contd.)
1 2 3 4 5 6
47 Ministry of Railways
1 New Lines2 Gauge Conversion3 Traffic Facilities4 Computerization5 Bridge Works6 Signalling & Telecom7 Electrification Projects (for Tracks)8 Other Electrical Works (Contribution towards JV with NTPC)9 Workshops incldg. Production Units10 Staff Quarters*11 Staff Amenities12 Other Specified Works*13 Metropolitan Transport Project14 Rolling Stock15 Machinery & Plant16 Investment in PSUs17 Inventories
Total GBS for M/o Railway
18 Road Safety—LC/ROB (CESS) (Under Department ofEconomic Affairs)Grand Total
48 Department of Scientific & Industrial Research (DSIR) Including CSIR
CSIR
1 National Laboratories2 National S&T Human Resource Development3 Intellectual Property & Technology Development4 R&D Management Support5 New Millenium Indian Technology Leadership Initiative
Priority would be DFC, High Density Corridors of nationalimportance & Development of rail network in NE. GBSshould be given against specific projects only and as pernational priorities.
Prioritization:—(1) Refocus outlays according to Plan objec-tive & priorities. (2) Clear prioritization, annual financial andphysical phasing, and earmarking a percentage of outlay foreach scheme be done to refocus the outlays. (3) Establishmentexpenditure should be identified for transfer to non-Plan.Evaluation:—(1) In-depth evaluation of all ongoing schemes/programmes involving substantial outlays so that if need be,the schemes coulld be restructured/redesigned accordingly.(2) In-depth evaluation of organizational structure, manage-ment practices and functioning of all institutions shouldalso be done for refocussing efforts in a highly competitivescientific world.
11493.96 13000.003095.00 3500.001655.13 1872.00
618.91 700.00119.36 135.00
2033.55 2300.002608.24 2950.001679.89 1900.003094.53 3500.00
190.09 215.00132.62 150.00300.00 340.00
1282.02 1450.004451.70 5035.00
574.70 650.005304.90 6000.001878.82 2125.00
40513.41 45822.00
3749.68 4241.00
44263.09 50063.00
5658.56 6400.00707.32 800.00212.20 240.00141.46 160.00618.91 700.00
(Appendix contd.)Note: *M/o Railways should use Plan GBS for National Projects rather than for Staff Quarters and Other specified works.

(Appendix contd.)
1 2 3 4 5 6
6 Setting up of Institute of Translational Research
Total CSIR
DSIR
1 Technology Promotion, Development, and Utilization2 Central Electronics Limited3 National Research and Development4 Consultancy Development Centre
5 DSIR Building & Infrastructure
Total DSIRGrand Total (CSIR + DSIR)
49 Department of Higher Education
A Central Sector Schemes
I ONGOING SCHEMES
1 University and Higher Education (including OSC)2 Distance Learning3 Rashtriya Sanskrit Sansthan4 Book Promotion5 Planning & Administration6 Technical Education (including OSC)
New Schemes
1 IGNOU—Skill Dev. Mission (Vocational Education and Training)2 New 210 Community Colleges (NGOs) Skill Dev. Mission3 Inter Universities Research Institute for Policy & Evaluation (UGC)4 Expansion and upgradation of 200 State Engineering Insitutions5 Upgrading 7 technical institutions6 2 IISERs (Pune & Kolkata)
Prioritization:—(1) Refocus outlays according to Plan objec-tive & priorities. (2) Clear prioritization, annual financial andphysical phasing, and earmarking a percentage of outlay foreach scheme be done to refocus the outlays. (3) Establishmentexpenditure should be identified for transfer to non-Plan.Evaluation:—(1) In-depth evaluation of all ongoing schemes/programmes involving substantial outlays so that if need be,the schemes coulld be restructured/redesigned accordingly.(2) In-depth evaluation of organizational structure, manage-ment practices and functioning of all institutions shouldalso be done for refocussing efforts in a highly competitivescientific world.
88.42 100.00
7426.87 8400.00
358.08 405.0044.21 50.0088.42 100.00
8.84 10.00
30.95 35.00
530.49 600.007957.36 9000.00
12492.78 14129.70582.96 659.35154.73 175.00
61.89 70.0069.06 78.11
11391.07 12883.63
44.21 50.0088.42 100.0088.42 100.00
804.58 910.00618.91 700.00707.32 800.00
(Appendix contd.)

(Appendix contd.)
1 2 3 4 5 6
7 Setting up of 2 New SPAs8 Establishing 50 Centres for Training and Research in Frontier Areas9 Faculty Development (AICTE)
II SPECIAL PLAN FOR HIGHER EDUCATION
1 16 New Central Universities in uncovered States2 5 Medical and Engineering Colleges in New CU3 14 World Class Central Universities (WCCU)4 5 Medical and Engineering Colleges in WCCU5 Setting up of 370 Degree Colleges6 Incentivizing States for Expansion, Inclusion, and Excellence7 Supporting uncovered State Universities (150) and Colleges (6000)8 Addl. Assistance to already covered Universities (160)/colleges (5500)9 Strengthening Science-based Higher Education & Research in
Universities.10 National Education Mission through ICT (including OSC)
III TECHNICAL EDUCATION
1 Expansion of National level/Advanced Institutes:(i) Setting up of 8 New IITs(ii) Setting up of 20 New NITs(iii) Setting up of 20 New IIITs(iv) Setting up of 3 IISERs (Mohali, TVN, Bhopal)(v) Setting up of 7 New IIMs
2 Increase of fellowship amounts for MTech Students
IV SKILL DEVELOPMENT THROUGH VOCATIONAL TRAINING
3 580 New Community Polytechnics4 Support to Engineering Colleges for Diploma Courses5 Women’s Hostel in 500 Polytechnics
V OTHERS
1 Increase Research Fellowship for NET Qualified and non-NETQualified PhD Students
2 Educational Loan Interest Subsidy3 Scholarship for 2% of the Total Students4 Construction of Girls’ Hostels
212.20 240.00132.62 150.00839.94 950.00
1768.30 2000.00884.15 1000.00
2475.62 2800.001503.06 1700.00
691.41 782.005481.73 6200.006189.05 7000.002652.45 3000.001060.98 1200.00
4420.75 5000.00
1768.30 2000.00442.08 500.00831.10 940.00795.74 900.00583.54 660.00884.15 1000.00
512.81 580.00884.15 1000.00442.08 500.00
2033.55 2300.00
3536.60 4000.00884.15 1000.00884.15 1000.00
(Appendix contd.)

(Appendix contd.)
1 2 3 4 5 6
Further allocation depends on in-depth evaluation of all on-going schemes by professional agencies. Scheme of maritimedevelopment-professional services involving Rs 0.27 crore for2007–08 should go to non-Plan.
Allocation for three new national waterways should be lim-ited to development and should not include maintenance.
All 12 individual schemes for major ports be merged into onecomposite scheme as ‘Investment in Infrastructure Develop-ment in Major Ports’ and allocation to individual ports shouldbe project based. GBS requirement of Rs 100 crore for VGF forinfrastructure development under PPP projects be providedin case it could not be made available out of DoEA budget.
Post Tsunami Works requires close monitoring by DoS. SurveyVessels should be transferred to M/o Defence.
1892.97 2141.00884.15 1000.00
72676.11 82198.79
1167.08 1320.00
884.15 1000.00308.57 349.00
66.31 75.00
2426.11 2744.0075102.22 84942.79
58.35 66.00
265.25 300.00132.62 150.00543.75 615.00
150.31 170.001818.68 2056.98
235.51 266.371260.49 1425.65
4464.96 5050.00
5 Reduction of Regional Imbalances/Social Gaps & Promotion ofInclusiveness(i) Higher Education(ii) Technical Education
Total A
B Centrally Sponsored Schemes
1 Setting up of new Polytechnics & Strengthening of Existing Polytechnics(i) Establishment of New Polytechnics in unserved Districts,
Establishment of 300 Polytechnics in PPP and 400 in Private Sector(ii) Strengtheing of 400 Polytechnics
2 Area Intensive & Madarsa Modernization Programme3 Appointment of Language Teachers
Total BTotal (A+B)
50 Department of Shipping
1 DG (Shipping)
2 Indian Maritime University3 DG (Light house and Light ships)4 IWT Sector
5 Ship Building and Repairs6 Major Ports (KoPT, MbPT, JNPT, ChPT, CoPT, VPT, KPT, MoPT,
PPT, NMPT, TPT, EPL)
7 ALHW8 Others*
Grand Total
(Appendix contd.)
Note: *Includes Post-Tsunami Works, Development of Deep Sea Ports, Survey Vessels, R&D, Sethusamudram Project, Assistance to Minor Ports, and Web-based EDI.

(Appendix contd.)
1 2 3 4 5 6
To be merged with ‘GIA for Research, Training, Information,and Miscellaneous’ and to be rechristened as ‘GIA for Research,Training, Information, and Miscellaneous’.
To be merged together as ‘Assistance to Panchayati RajInstitutions/Voluntary Organizations/Self Help Group forProgrammes related to Aged’ and construction of old age homecan be taken as one component of it.
To be merged with GIA to NGO for SCs, OBCs, & Research& Training and rechristened as ‘GIA for Research, Training,Information and Miscellaneous’.
2714.09 3069.71381.07 431.00221.04 250.00
508.17 574.75180.81 204.50
5.53 6.25309.45 350.00
110.52 125.00
317.41 359.0010.61 12.00
442.08 500.00
442.08 500.00
22.10 25.00243.14 275.00
181.25 205.00
66.31 75.00
6155.65 6962.21
51 Ministry of Social Justice & Empowerment
A Central Sector Schemes
I BACKWARD CLASSES SECTOR (SCs & OBC)
1 Special Central Assistance (SCA) to Special Component Plan (SCP)2 National Finance Development Corporations for Weaker Sections3 GIA to NGOs for SCs, OBCs & Research & Training
4 Rajiv Gandhi National Fellowship for SCs5 Top Class Education for SCs6 Dr. B.R. Ambedkar Foundation7 Self-Employment Scheme for Rehabilitation of
Manual Scavengers
New Schemes under CS
8 National Overseas Scholarships Scheme for SCs.
II SOCIAL WELFARE
9 Scheme for Funding to National Institutes10 Artificial Limbs Manufacturing Corporation, Kanpur (ALIMCO)11 Scheme of Assistance to Disabled Person for Purchasing/Fitting of
Aids & Appliances12 Scheme to Promote Voluntary Action for Persons with Disabilities
(Deen Dayal Disabled Rehabilitation Scheme)13 Implementation of the Persons with Disabilities (PWD) Act, 1995.14 Assistance to Voluntary Organizations for providing Social Defence
Services including Prevention of Alcoholism & Drug Abuse15 Assistance to Voluntary Organizations for Programmes related
to Aged16 Assistance to Panchayati Raj Institutions/Voluntary Organizations/
SHGs for construction of Old Age Homes/Multi Services Centres forOlder Persons
17 Grant-in-aid for Research, Training, Information and Miscellaneous
Total A
(Appendix contd.)

(Appendix contd.)
1 2 3 4 5 6
B Centrally Sponsored Schemes
1 Post-Matric Scholarships & Book Banks for SC students2 Pre-Matric Scholarship for Children of those Families Engaged in
Unclean Occupation3 Hostels for SC and OBC4 Scheduled Caste Development Corporation (SCDCs)5 National Handicapped Finance and Development Corporation
(NHFDC)6 Coaching and Allied Scheme for SCs/OBCs & other Weaker Sections7 Upgradation of Merit of SC Students8 Implementation of PCR Act,1955 & the SC/ST(POA) Act,19899 Merit based Scholarships for OBC
(i) Post-Matric Scholarship for OBCs(ii) Pre-Matric Scholarship for OBCs
10 Setting up of Residential Schools for SCs for Pursuing Studying inClass VI to XII
Total BGrand Total (A+B)
52 Ministry of Statistics and Programme Implementation
A Central Sector Schemes
1 India Statistical Strenthening Project (Modernization of StatisticalSystem of India)
2 Addition/Alteration and Modernization of Office Building3 Capacity Development of CSO
4 Improvement of National Accounts Statistics5 Development of Social, Environment, and Price Statistics6 Improvement of Informal Sector Statistics7 Capacity Development of NSSO8 Strengthening of Field Operations of NSSO9 Strengthening of Data Processing Capacity of NSSO10 Strengthening of Survey Design and Research Capabilities of NSSO11 Grants-in-aid to States for Carrying Out NSS Survey Work in NER12 Strengthening of Data Processing, Storage, and Dissemination of
Computer Centre13 Grants-in-aid to Indian Statistical Institute, Kolkata
To be transferred to States.
May be transferred to non-Plan.To be merged with scheme at S. No. 4, i.e., Capacity Develop-ment of NSSO and renamed as ‘Capacity Development’having different components.
To be renamed as ‘Strengthening of Computer Centre’.
(Appendix contd.)
3609.10 4082.00176.83 200.00
512.81 580.0077.81 88.0027.23 30.80
101.68 115.008.84 10.008.84 10.00
853.21 965.00618.91 700.00234.30 265.00
5376.34 6080.8011531.99 13043.01
79.57 90.00
0.35 0.4059.48 67.27
216.62 245.000.00 0.000.00 0.000.00 0.000.00 0.009.40 10.63
79.57 90.00

(Appendix contd.)
1 2 3 4 5 6
(Appendix contd.)
14 Institutional Development and Capacity Building for Project Planning,Implementation, Monitoring, and Performance Management of Infra-structure in Public Sector
15 Institutional Development and Capacity Building (PI Wing)16 Institutional Development and Capacity Building (Statistics Wing)17 Fifth Economic Census18 Basic Statistics
Total A
B Centrally Sponsored Schemes1 Basic Statistics for Local Level Development
MPLADS
Total BGrand Total (A+B)
53 Ministry of Steel
1 Hindustan Steelworks Construction Ltd (for AMR)
2 MECON Ltd (for Approved Restructuring Package)3 Bird Group of Companies
4 Scheme for Promotion of Research & Development in Iron andSteel SectorGrand Total
54 Department of Science & Technology
1 Research & Development Support2 Technology Development Programme3 S&T Programme For Socio-economic Development4 International Co-operation5 State Science & Technology Programme6 Modernization of Mapping Professional Bodies (SOI & NATMO)7 Autonomous Institutions & Professional Bodies8 Vocational Employment Generation9 Technology For Bamboo Products (Mission Mode Project)10 Synergy Projects (O/O Principal Scientific Adviser)11 Information Technology12 National Training Programme For Scientists/Technologist Working
with GoI
To be renamed as ‘Monitoring & Evaluation and Information,Education, and Communication’.
Ministry to expeditiously conduct in-depth and independentevaluation of its schemes and institutions and use findingsfor restructuring/reorientation of the same and Plan fundingin 2008–09 for these scheme would depend on this.
AMR is for a manufacturing unit and not for a servicing unit.HSCL is a servicing unit.CPSEs should meet their AMR requirement from internal re-sources (IR) and only project based support would be provided.Restructuring package should be on commercial viability.
8.84 10.00
69.85 79.00
523.68 592.30
6.81 7.70
6.81 7.70530.49 600.00
30.95 35.00
55.70 63.000.88 1.00
104.33 118.00
191.86 217.00
2829.28 3200.00265.25 300.00353.66 400.00221.04 250.00
88.42 100.00176.83 200.00
2046.81 2315.002.65 3.00
70.73 80.0030.95 35.0013.26 15.0026.52 30.00

(Appendix contd.)
1 2 3 4 5 6
(Appendix contd.)
13 Drugs & Pharmaceuticals Research14 National Mission For Nano-Science & Nanotechnology15 Science & Engineering Research Board*16 Scholarships For Science In Higher Education (Oversight Committee
Recommendation)17 Water Technology Initiative18 INSPIRE19 Innovation Clusters20 Security Technology Initiative21 Mega Facilities For Basic Research
Grand Total
55 Department of Space
1 Launch Vehicle Missions(i) GSLV MKI(ii) GSLV Operational(iii) Cryogenic Upper Stage Project (CUSP)(iv) GSLV MK III Development(v) GSLV MK III Operational(vi) PSLV-CSubtotal 1
2 Earth Observation Mission(i) Oceansat-2 & 3(ii) Radar Imaging Satellite(iii) Resourcesat-2 & 3(iv) GEO HR Imager(v) Cartosat-3(vi) Altika-Argoes(vii) Technology Experiment Satellites(viii)Disaster Management Satellite (DM-SAR)(ix) E O Followon SatellitesSubtotal 2
3 Space Science Mission(i) Chandrayan-1 & 2(ii) Megha Trpiques(iii) Astrosat 1 & 2(iv) Advanced Planetary Missions(v) Small Satellites for Atmospheric Research & AstronomySubtotal 3
442.08 500.00884.15 1000.00
1326.23 1500.00
44.21 50.00663.11 750.00
44.21 50.0044.21 50.00
176.83 200.00
9750.41 11028.00
17.68 20.001998.18 2260.00
4.42 5.001198.91 1356.00
499.55 565.001628.61 1842.005347.34 6048.00
199.82 226.00150.31 170.00199.82 226.00274.97 311.00299.73 339.00
99.91 113.00299.73 339.00299.73 339.00299.73 339.00
2123.73 2402.00
449.15 508.0060.12 68.00
199.82 226.00299.73 339.00199.82 226.00
1208.63 1367.00
Note: *Included in S. No. 1.

(Appendix contd.)
1 2 3 4 5 6
4 INSAT Satellites(i) INSAT-3 satellite(ii) GSAT-4(iii) GSAT-5/INSAT-4D(iv) GSAT-6/INSAT-4E(v) GSAT-8/INSAT-4G(vi) INSAT-4CR(vii) INSAT-4/GSAT Satellites (GSAT-9 to GSAT-14)(viii) Advanced Communication Technology Satellites(ix) INSAT Capacity Augmentation (Short Term)(x) INSAT/GSAT Followon SatellitesSubtotal 4
5 Satellite Navigation6 Advanced Launch Vehicle Development
(i) Semi Cryogenic Engine/Stage Development(ii) Human Space Flight(iii) Space capsure Recovery experiment-SRE(iv) Reusable Launch Vehicle TechnologiesSubtotal 5
7 Major Space Applications and Space Science Research(i) Remote sensing application (inc. NNRMS, NR CENSUS,
RSAM, NRSA, NESAC etc.)(ii) Disaster Management Support(iii) SATCOM Application Programme(iv) Space Science & Environment (inc. PRL, NARL)Subtotal 6
8 Information Technology Related Applications(i) National Natural Resources Database(ii) Village Resource Centres(iii) EDUSAT IT Network(iv) Telemedicine NetworkSubtotal 7
9 R&D, Technology, and Process Development(i) Technology Development Programme/R&D/Small Satellites/
Development of Semiconductor Technology(ii) Development of Space Material & Component &
Advance Actions(iii) Sponsored ResearchSubtotal 8
A clear prioritization, annual financial and physical phasingand earmarking a percentage of the total outlay for eachscheme be done so as to refocus the outlays according to thePlan objectives and priorities and use available resources inthe most judicious and economically efficient manner,rather than spreading it thin and not achieving the mainobjectives Other decisions:—(i) DOS would undertake in-depth evaluation and impact assessment study of its ongoingplans/programmes. (ii) For developing application orientedprogrammes, more concerted efforts are needed to strengthenthe organic linkage with the related ministries and StateGovernments. (iii) Application of Space Sciences needs tobe upscaled in the States and DOS would prepare a compre-hensive action plan for the Eleventh Plan. (iv)Concerted ef-forts to be made for integration of indigenous developmentof satellites, launch vehicles, and associated ground segments.(v) utilization of EDUSAT to be maximized and modernized.(vi) A presentation to be made by DOS on full applicationof remote sensing in agriculture and urban planning in thepresence of concerned stakeholders. (vii) The DisasterManagement Initiatives, prepared by the Disaster Manage-ment Authority need to be integrated with DOS programmes.
(Appendix contd.)
53.05 60.0026.52 30.0070.73 80.00
176.83 200.00599.45 678.00
49.51 56.001498.64 1695.00
804.58 910.0099.91 113.00
199.82 226.003579.04 4048.002397.82 2712.00
0.00 0.00499.55 565.00
1591.47 1800.0079.57 90.00
199.82 226.002370.41 2681.00
649.85 735.00
199.82 226.00299.73 339.00599.45 678.00
1748.85 1978.00
35.37 40.00249.33 282.00141.46 160.00
88.42 100.00514.58 582.00
799.27 904.00
799.27 904.00
99.91 113.001698.45 1921.00
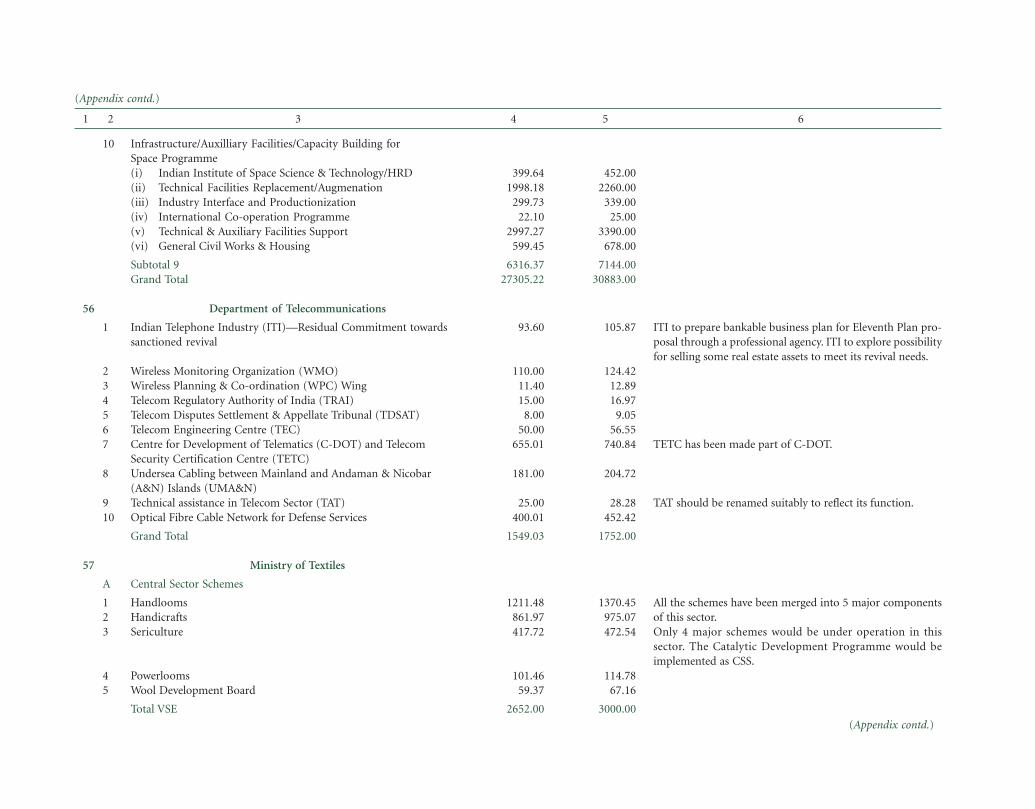
(Appendix contd.)
1 2 3 4 5 6
10 Infrastructure/Auxilliary Facilities/Capacity Building forSpace Programme(i) Indian Institute of Space Science & Technology/HRD(ii) Technical Facilities Replacement/Augmenation(iii) Industry Interface and Productionization(iv) International Co-operation Programme(v) Technical & Auxiliary Facilities Support(vi) General Civil Works & Housing
Subtotal 9Grand Total
56 Department of Telecommunications
1 Indian Telephone Industry (ITI)—Residual Commitment towardssanctioned revival
2 Wireless Monitoring Organization (WMO)3 Wireless Planning & Co-ordination (WPC) Wing4 Telecom Regulatory Authority of India (TRAI)5 Telecom Disputes Settlement & Appellate Tribunal (TDSAT)6 Telecom Engineering Centre (TEC)7 Centre for Development of Telematics (C-DOT) and Telecom
Security Certification Centre (TETC)8 Undersea Cabling between Mainland and Andaman & Nicobar
(A&N) Islands (UMA&N)9 Technical assistance in Telecom Sector (TAT)10 Optical Fibre Cable Network for Defense Services
Grand Total
57 Ministry of Textiles
A Central Sector Schemes
1 Handlooms2 Handicrafts3 Sericulture
4 Powerlooms5 Wool Development Board
Total VSE
ITI to prepare bankable business plan for Eleventh Plan pro-posal through a professional agency. ITI to explore possibilityfor selling some real estate assets to meet its revival needs.
TETC has been made part of C-DOT.
TAT should be renamed suitably to reflect its function.
All the schemes have been merged into 5 major componentsof this sector.Only 4 major schemes would be under operation in thissector. The Catalytic Development Programme would beimplemented as CSS.
(Appendix contd.)
399.64 452.001998.18 2260.00
299.73 339.0022.10 25.00
2997.27 3390.00599.45 678.00
6316.37 7144.0027305.22 30883.00
93.60 105.87
110.00 124.4211.40 12.8915.00 16.97
8.00 9.0550.00 56.55
655.01 740.84
181.00 204.72
25.00 28.28400.01 452.42
1549.03 1752.00
1211.48 1370.45861.97 975.07417.72 472.54
101.46 114.7859.37 67.16
2652.00 3000.00

(Appendix contd.)
1 2 3 4 5 6
Provision for Rai Bareili centre upto 2008–09 and beyondwould be restricted to one centre only.
TUFS might continue up to 31.03.09 and commitments haveto be calibrated to avoid any spillover liability. It could be con-sidered for 2008–09 and subsequently only after in depthevaluation.Rapid assessment study through an independent agency of atleast 5–6 park before further disbursal of GBS.
Further funding is subject to independent and in-depth evalu-ation of institutions/schemes.
Regarding new scheme, due procedure has to be followed asprescribed by Planning Commission and D/o Expenditure.FDI Cell could be merged with Export Promotion Studies atS. No. 6.It would be appropriate to have one composite scheme forTextilpolis & Fashion Hub.
MoT to formulate the scheme in consultation with DHI.
(Appendix contd.)
44.21 50.00
8.84 10.007073.21 8000.00
1768.30 2000.00
314.76 356.004.42 5.00
11.49 13.00
202.47 229.00
84.88 96.00
12164.58 13759.00
213.08 241.00
213.08 241.0012377.66 14000.00
32.71 37.001.77 2.00
437.65 495.0083.99 95.00
1 NIFT
2 R&D including TRAs3 Technology Upgradation Fund (TUFS)
4 Scheme for Integrated Textile Park
5 Jute Technology Mission6 Export Promotion Studies
7 SVPITM—Coimbatore8 Brand Promotion (New Scheme from 07–08)
9 Foreign Promotin Scheme FDI CELL (New Scheme from 07–08)
10 Textilpolis (New Scheme from 07–08)11 Fashion Hub (New Scheme from 07–08)12 Common Compliance Code (New Scheme from 07–08)13 HRD (New Scheme from 07–08)14 Textile engineering (New Scheme from 07–08)15 Technical Textiles (New Scheme from 07–08)
Total A
B Centrally Sponsored Schemes
16 Cotton Technology Mission
Total BGrand Total (A+B)
58 Ministry of Tourism
Central Sector Schemes
1 Externally Aided Projects(i) Buddhist Centres(ii) UNDP Endogenous Projects
2 Assistance to IHMs/FCIs/etc.3 Capacity Building for Service Providers

(Appendix contd.)
1 2 3 4 5 6
(1) Ministry would restructure its scheme of Assistanceto Central Agencies for Tourism Infrastructure Development.(2) In-depth evaluation of Domestic and Overseas Promo-tion and Publicity should be done on priority and findingsincorporated for more effective campaign. (3) The scheme ofLarge Revenue Generating Project and Incentive to accom-modation infrastructure are not justified since the private sec-tor should create these as commercial ventures. (4) Schemeof Capacity Building for Service Providers to be restructuredto include NGOs for conducting the programmes. The schemeis to train persons engaged in tourism services. (5) The schemeInfrastructure Development for Destinations and Circuitsis justified only in PPP mode. (6) MoT would create aninteractive tourist portal for both domestic and internationaltourists.
Yet to be approved.
(Appendix contd.)
892.99 1010.00
376.65 426.00207.78 235.00
11.49 13.00106.98 121.00
25.64 29.00176.83 200.00
12.38 14.0064.54 73.0022.10 25.00
2453.52 2775.00
2105.16 2381.00
2105.16 2381.004558.68 5156.00
265.25 300.00
88.03 99.56264.18 298.79
61.53 69.59153.84 174.00592.38 670.00229.88 260.00
139.17 157.41132.62 150.00
6.55 7.41
65.25 73.80
1859.50 2103.15
4 Overseas Promotion & Publicity including Market DevelopmentAssistance
5 Domestic Promotion & Publicity including Hospitality6 Incentives to Accommodation Infrastructure7 Construction of Buildings for IISM at Gulmarg, Kashmir (J&K Package)8 Computerization & Information Technology9 Market Research including 20 Years Perspective Plan10 Assistance for Large Revenue Generating Projects11 Creation of Lead Bank Hotels12 Equity Contribution to ITDC (Equity up to 07–08 only)13 Assitance to Central Agencies for Tourism Infrastructure Development
Total A
Centrally Sponsored Schemes
1 Product/Infrastructure Development for Destinations and Circuits
Total BGrand Total (A+B)
59 Ministry of Tribal Affairs
Central Sector Schemes
1 Grant-in-aid to NGOs for Coaching ST Students for CompetitiveExams
2 Vocational Training Centres in Tribal Areas3 Educational Complexes in Low Literacy Pockets4 Investment in TRIFED and Price support5 Grant-in-aid to STDCs for MFP Village Grain Banks6 Development of Primitive Tribal Groups (PTGs)7 Support to National ST Finance & Development Corporation and
GIA to State ST Dev. & Finance Corporations8 Construction of Adivasi Bhavan in New Delhi9 Fellowship programme for ST students
(i) Rajiv Gandhi Fellowship(ii) National Overseas Scholarships Scheme (New Scheme)
New Schemes under CS
10 National Institute of Tribal Affairs (NITA)11 Scheme of Institute of Excellence/Top Class Education
Total A
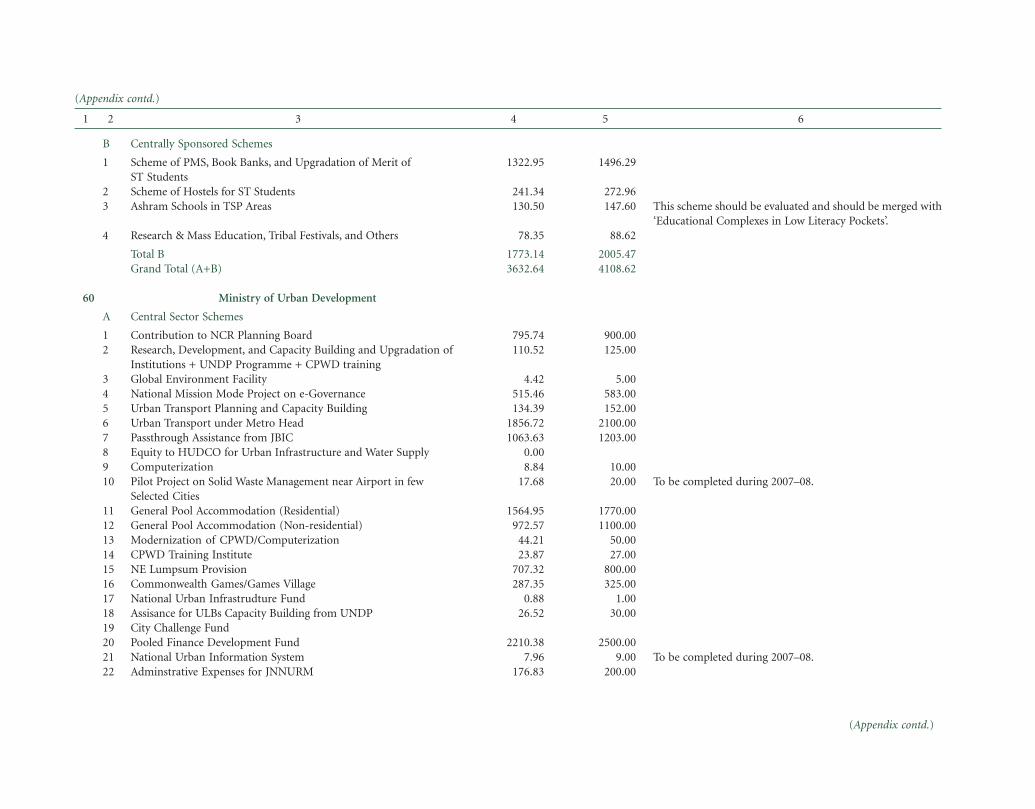
(Appendix contd.)
1 2 3 4 5 6
(Appendix contd.)
This scheme should be evaluated and should be merged with‘Educational Complexes in Low Literacy Pockets’.
To be completed during 2007–08.
To be completed during 2007–08.
1322.95 1496.29
241.34 272.96130.50 147.60
78.35 88.62
1773.14 2005.473632.64 4108.62
795.74 900.00110.52 125.00
4.42 5.00515.46 583.00134.39 152.00
1856.72 2100.001063.63 1203.00
0.008.84 10.00
17.68 20.00
1564.95 1770.00972.57 1100.00
44.21 50.0023.87 27.00
707.32 800.00287.35 325.00
0.88 1.0026.52 30.00
2210.38 2500.007.96 9.00
176.83 200.00
B Centrally Sponsored Schemes
1 Scheme of PMS, Book Banks, and Upgradation of Merit ofST Students
2 Scheme of Hostels for ST Students3 Ashram Schools in TSP Areas
4 Research & Mass Education, Tribal Festivals, and Others
Total BGrand Total (A+B)
60 Ministry of Urban Development
A Central Sector Schemes
1 Contribution to NCR Planning Board2 Research, Development, and Capacity Building and Upgradation of
Institutions + UNDP Programme + CPWD training3 Global Environment Facility4 National Mission Mode Project on e-Governance5 Urban Transport Planning and Capacity Building6 Urban Transport under Metro Head7 Passthrough Assistance from JBIC8 Equity to HUDCO for Urban Infrastructure and Water Supply9 Computerization10 Pilot Project on Solid Waste Management near Airport in few
Selected Cities11 General Pool Accommodation (Residential)12 General Pool Accommodation (Non-residential)13 Modernization of CPWD/Computerization14 CPWD Training Institute15 NE Lumpsum Provision16 Commonwealth Games/Games Village17 National Urban Infrastrudture Fund18 Assisance for ULBs Capacity Building from UNDP19 City Challenge Fund20 Pooled Finance Development Fund21 National Urban Information System22 Adminstrative Expenses for JNNURM

(Appendix contd.)
1 2 3 4 5 6
Subsumed under JNNURM.To be completed during 2007–08.
(Appendix contd.)
442.08 500.00
10972.31 12410.00
28.73 32.5028.73 32.50
11001.04 12442.50
31.83 36.00
2.65 3.004.42 5.00
176.83 200.004.42 5.004.42 5.00
61.89 70.0030.95 35.00
317.41 359.00
176.83 200.001547.26 1750.001218.36 1378.00
2942.45 3328.003259.86 3687.00
154.73 175.00159.15 180.00349.24 395.00
New Schemes23 Urban Infrastructure Dev. in Satellite Cities/Counter-Magnet Cities
(Non-NCR)
Total A
B Centrally Sponsored Schemes
1 Mega City Scheme2 IDSMT (Including CUISS)3 AUWSP
Total BGrand Total (A+B)
61 Ministry of Housing and Urban Poverty Alleviation
Central Sector Schemes
A BMTPC
1 Grant to NCHF2 UNDP Assistance for National Strategy for Urban Poor3 NE Lumpsum Provision4 Computerization5 Building Centres Scheme6 Administrative Expenses for JNNURM7 MIS on Housing, Data, Research & Survey8 HUDCO Equity for Housing
Total A
B Centrally Sponsored Schemes1 Integrated Low Cost sanitation2 SJSRY3 Interest Subsidy Scheme for Housing to Urban Poor
Total BGrand Total (A+B)
62 Ministry of Water Resources
Central Sector Schemes
1 Development of Water Resource Management System2 Hydrology Project3 Groundwater Management and Regulation

(Appendix contd.)
1 2 3 4 5 6
(Appendix contd.)
MOWR would prepare and continuously update water avail-ability and quality maps in consultation with the MoE&F andshare the same with all stakeholders.
To be revamped and converted to Centrally Sponsored Scheme.
All GIA schemes to be merged under one heading and insti-tute/organization under CS can be taken as component.Its function and acheivement to be evaluated by independentagency. All GIA schemes to be merged under one heading andinstitute/organization under CS can be taken as component.
Operation and maintainance cost to be met through usercharges.To be converted to Centrally Sponsored Scheme and mergedwith Swayamsidha.Its function and acheivement to be evaluated by independentagency. All GIA schemes to be merged under one heading andinstitute/organization under CS can be taken as component.
4 Investigation for WR Development Scheme5 Research And Development6 National Water Academy7 Rajiv Gandhi National Institute of Training and Research8 Information, Education, and Communication (New Scheme)9 Pagladiya Dam Project10 Farakka Barrage Project11 Dam Safety Studies And Planning12 River Basin Organization/Authority (New Scheme)13 Flood Forecasting14 River Management Activities and Works related to Border Areas15 Infrastructure Development
Total AGrand Total
63 Department of Women and Child Development
A Central Sector Schemes
I CHILD DEVELOPMENT
1 Rajeev Gandhi National Creche Scheme for Children ofWorking Mothers
2 National Commission for Protection of Child Rights (NCPCR)
3 NIPCCD
4 Conditional Cash Transfer Scheme for the Girl Child with InsuranceCover (New Scheme)
5 Comprehensive Scheme on Combating Trafficking of Women &Children (New Scheme)
II WOMEN EMPOWERMENT
6 Hostel for Working Women
7 STEP
8 NCW
194.51 220.00260.82 295.00
13.26 15.0022.10 25.0044.21 50.00
486.28 550.00145.88 165.00
44.21 50.008.84 10.00
110.52 125.00787.78 891.00
88.42 100.00
2869.95 3246.002869.95 3246.00
645.43 730.00
486.28 550.00
30.95 35.00
30.95 35.00
70.73 80.00
26.52 30.00
637.47 721.00
66.31 75.00
88.42 100.00
22.10 25.00

(Appendix contd.)
1 2 3 4 5 6
(Appendix contd.)
To be integrated with Swayamsidha.
Its function and acheivement to be evaluated by independentagency. All GIA schemes to be merged under one heading andinstitute/organization under CS can be taken as component.
All GIA schemes to be merged together.
To be merged under ‘Information, Education, and Commu-nication’.Its function and acheivement to be evaluated by independentagency. All GIA schemes to be merged under one heading andinstitute/organisation under CS can be taken as component.
STEP to be merged with Swayamsidha.
To be integrated with ICPS.
To be merged with ICPS.
95.49 108.0095.49 108.00
229.88 260.00
22.10 25.0017.68 20.00
145.88 165.00
13.26 15.0017.68 20.0066.31 75.00
4.42 5.00
44.21 50.00
1428.79 1616.00
46394.92 52474.00
37487.99 42400.007957.36 9000.00
0.88 1.00948.69 1073.00
543.75 615.00
442.08 500.0083.99 95.0017.68 20.00
53.05 60.00
8.84 10.00
13.26 15.00
9 RMK10 Swadhar11 GIA to CSWB
12 Scheme for Relief and Rehabilitation of Victims of Rape (New Scheme)13 Gender Budgeting (New Scheme)
Other Grants-in-aid
14 GIA to Research, Publication, and Monitoring15 Inovative Work on Women & Children16 Information, Mass Edu., and Publication17 Information Technology
18 Nutrition Education (FNB)
Total A
B Centrally Sponsored Schemes
I CHILD DEVELOPMENT
1 Integrated Child Development Services (ICDS) including Training(i) Restructured ICDS(ii) Conditional Maternity Benefit for Pregnant and Lactating Mothers
2 National Nutrition Mission (NNM)3 Integrated Child Protection Scheme (ICPS)
II WOMEN’S EMPOWERMENT
4 Integrated Women’s Empowerment Programme (Swayamsiddha)5 Priyadarshini Scheme6 Scheme for Leadership Development of Minority Women
(New Scheme)
III SCHEMES TRANSFERRED FROM THE MINISTRY OFSOCIAL JUSTICE & EMPOWERMENT
7 Scheme for the Welfare of Working Children in need ofCare & Protection
8 Integrated Scheme for Street Children

(Appendix contd.)
1 2 3 4 5 6
4.42 5.0022.10 25.00
4.42 5.00
46991.72 53149.0048420.51 54765.00
375.76 425.00397.87 450.00
35.37 40.0010.61 12.00
69.85 79.0042.44 48.00
30.95 35.0070.73 80.00
123.78 140.0017.68 20.0013.26 15.0017.68 20.00
1205.98 1364.00
979.64 1108.00928.36 1050.00
48.63 55.002.65 3.00
1326.23 1500.00
327.14 370.00141.46 160.00
30.95 35.0017.68 20.00
2.65 3.001096.35 1240.00
176.83 200.00
4098.92 4636.005304.90 6000.00
To be discontinued after completion of ongoing projects.
To be merged with Nehru Yuva Kendra Sangathan.
To be merged together under ‘National Programme for Youth& Adolescent’s Development’.
9 Shishu Greh Scheme10 Scheme for Prevention and Control of Juvenile Social Maladjustment11 Central Adoption Resource Agency (CARA)
Total BGrand Total (A+B)
64 Ministry of Youth and Sports AffairsA Youth Affairs
1 National Service Scheme—a CSS2 Nehru Yuva Kendra Sangathan (NYKS)3 Rajeev Gandhi National Institute of Youth Dev.4 Youth Hostels5 Volunters’ Scheme
(i) National Service Volunteer Scheme (NSVS)(ii) Rashtriya Sadbhavana Yojana (RSY)
6 Fin. Assist. for Prom. of Adolescents & Youth Development(i) Promotion of Youth Activities & Trg.(ii) Promotion of National Integration(iii) Dev. & Empowerment of Adolescents(iv) Promotion of adventure
7 Promotion of Scouting & Guiding8 International Co-operation
Total A
B Sports & Physical Education
10 GIA to Institutions(i) Sports Authority of India(ii) Laxmi Bai National Institute of Phy. Edn. (LNIPE)(iii) National Physical Fitness Prog. (under LNIPE)
11 Panchayat Yuva Krida aur Khel Abhiyan(Incl. existing Rural Sports Prog.)
12 Assistance to National Sports Federations13 Incentives to Sports Persons and for Promotion of Sports Trg. Acivities14 Prom. of Sports among Persons with Disability15 Anti-Doping (Incl. WADA contribution)16 Mega/Multi-Sporting Event17 Commonwealth Games—2010 (Incl. GYG-2008, Pune)18 Other New Initiatives
Total BGrand Total (A+B)