Elevated liver iron concentration is a marker of increased morbidity in patients with thalassemia...
36
Elevated liver iron concentration is a marker of increased morbidity in patients with b thalassemia intermedia by Khaled M. Musallam, Maria Domenica Cappellini, John C. Wood, Irene Motta, Giovanna Graziadei, Hani Tamim, and Ali T. Taher Haematologica 2011 [Epub ahead of print] Citation: Musallam KM, Cappellini MD, Wood JC, Motta I, Graziadei G, Tamim H, and Taher AT. Elevated liver iron concentration is a marker of increased morbidity in patients with thalassemia intermedia. Haematologica. 2011; 96:xxx doi:10.3324/haematol.2011.047852 Publisher's Disclaimer. E-publishing ahead of print is increasingly important for the rapid dissemination of science. Haematologica is, therefore, E-publishing PDF files of an early version of manuscripts that have completed a regular peer review and have been accepted for publication. E-publishing of this PDF file has been approved by the authors. After having E-published Ahead of Print, manuscripts will then undergo technical and English editing, typesetting, proof correction and be presented for the authors' final approval; the final version of the manuscript will then appear in print on a regular issue of the journal. All legal disclaimers that apply to the journal also pertain to this production process. Haematologica (pISSN: 0390-6078, eISSN: 1592-8721, NLM ID: 0417435, www.haemato- logica.org) publishes peer-reviewed papers across all areas of experimental and clinical hematology. The journal is owned by the Ferrata Storti Foundation, a non-profit organiza- tion, and serves the scientific community with strict adherence to the principles of open access publishing (www.doaj.org). In addition, the journal makes every paper published immediately available in PubMed Central (PMC), the US National Institutes of Health (NIH) free digital archive of biomedical and life sciences journal literature. Official Organ of the European Hematology Association Published by the Ferrata Storti Foundation, Pavia, Italy www.haematologica.org Early Release Paper Support Haematologica and Open Access Publishing by becoming a member of the Europe Hematology Association (EHA) and enjoying the benefits of this membership, which inc participation in the online CME?program Copyright 2011 Ferrata Storti Foundation. Published Ahead of Print on July 26, 2011, as doi:10.3324/haematol.2011.047852.
Transcript of Elevated liver iron concentration is a marker of increased morbidity in patients with thalassemia...

Elevated liver iron concentration is a marker of increased morbidityin patients with b thalassemia intermedia
by Khaled M. Musallam, Maria Domenica Cappellini, John C. Wood, Irene Motta,Giovanna Graziadei, Hani Tamim, and Ali T. Taher
Haematologica 2011 [Epub ahead of print]
Citation: Musallam KM, Cappellini MD, Wood JC, Motta I, Graziadei G, Tamim H, and Taher AT. Elevated liver iron concentration is a marker of increased morbidity inpatients with thalassemia intermedia. Haematologica. 2011; 96:xxx doi:10.3324/haematol.2011.047852
Publisher's Disclaimer. E-publishing ahead of print is increasingly important for the rapid dissemination of science.Haematologica is, therefore, E-publishing PDF files of an early version of manuscripts thathave completed a regular peer review and have been accepted for publication. E-publishingof this PDF file has been approved by the authors. After having E-published Ahead of Print,manuscripts will then undergo technical and English editing, typesetting, proof correction andbe presented for the authors' final approval; the final version of the manuscript will thenappear in print on a regular issue of the journal. All legal disclaimers that apply to the journal also pertain to this production process.
Haematologica (pISSN: 0390-6078, eISSN: 1592-8721, NLM ID: 0417435, www.haemato-logica.org) publishes peer-reviewed papers across all areas of experimental and clinicalhematology. The journal is owned by the Ferrata Storti Foundation, a non-profit organiza-tion, and serves the scientific community with strict adherence to the principles of openaccess publishing (www.doaj.org). In addition, the journal makes every paper publishedimmediately available in PubMed Central (PMC), the US National Institutes of Health (NIH)free digital archive of biomedical and life sciences journal literature.
Official Organ of the European Hematology AssociationPublished by the Ferrata Storti Foundation, Pavia, Italy
www.haematologica.org
Early Release Paper
Support Haematologica and Open Access Publishing by becoming a member of the EuropeanHematology Association (EHA) and enjoying the benefits of this membership, which include free
participation in the online CME?program
Copyright 2011 Ferrata Storti Foundation.Published Ahead of Print on July 26, 2011, as doi:10.3324/haematol.2011.047852.

1
Elevated liver iron concentration is a marker of increased morbidity in patients
with β thalassemia intermedia
Khaled M. Musallam,1 Maria Domenica Cappellini,2* John C. Wood,3* Irene Motta,2
Giovanna Graziadei,2 Hani Tamim,1 and Ali T. Taher1
1Department of Internal Medicine, Division of Hematology & Oncology, American
University of Beirut Medical Center, Beirut, Lebanon; 2Department of Internal Medicine,
Fondazione IRCCS "Ca Granda", University of Milan, Milan, Italy, and 3Divisions of
Pediatric Cardiology and Radiology, Children’s Hospital Los Angeles and Keck School
of Medicine, University of Southern California, Los Angeles, CA, USA
Correspondence
Ali T. Taher, MD, FRCP, Professor of Medicine, Division of Hematology & Oncology,
Department of Internal Medicine, American University of Beirut Medical Center, P.O.
Box: 11-0236, Riad El Solh 1107 2020; Beirut, Lebanon. Phone: international
+00961.1.350000. Fax: international +00961.1. 370814. E-mail: [email protected].
Key words: thalassemia intermedia, liver iron concentration, iron overload, vascular
disease, endocrine disease, osteoporosis.
DOI: 10.3324/haematol.2011.047852

2
ABSTRACT
Background. Patients with β thalassemia intermedia can have substantial iron
overload, irrespective of transfusion status, secondary to increased intestinal iron
absorption. This study evaluates whether iron overload in patients with β thalassemia
intermedia is associated with morbidity.
Design and Methods. This was a cross-sectional study of 168 β thalassemia
intermedia patients treated at two centers in Lebanon and Italy. Data on demographics,
splenectomy status, transfusion status, and presence of morbidities were retrieved.
Laboratory values of serum ferritin, fetal and total hemoglobin levels, as well as platelet
and nucleated red blood cell counts were also obtained. Direct determination of iron
burden was performed by liver iron concentration measurement using magnetic
resonance imaging. Patients were subdivided to phenotype severity groups according to
transfusion and splenectomy status.
Results. The mean age was 35.2 ± 12.6 years with 42.9% of patients being males. The
mean liver iron concentration was 8.4 ± 6.7 mg Fe/g dry weight. On multivariate logistic
regression analysis, after adjusting for age, gender, splenectomy status, transfusion
status, and laboratory indices, a 1-mg Fe/g dry weight increase in liver iron
concentration was independently and significantly associated with higher odds of
thrombosis, pulmonary hypertension, hypothyroidism, osteoporosis, and hypogonadism.
Liver iron concentrations of ≥7 and ≥6 mg Fe/g dry weight were the best thresholds for
discriminating the presence and absence of vascular and endocrine/bone morbidities,
respectively (Area Under the Receiver-Operating Characteristic Curve: 0.72, P<0.001).
DOI: 10.3324/haematol.2011.047852

3
Elevated liver iron concentration was associated with an increased rate of morbidity in
patients with all phenotype severity groups, a steeper increase in the rate of vascular
morbidity attributed to aging, and an earlier appearance of endocrine and bone disease.
Conclusions. Elevated liver iron concentration in patients with β thalassemia
intermedia is a marker of increased vascular, endocrine, and bone disease.
DOI: 10.3324/haematol.2011.047852

4
Introduction
A diverse severity of phenotype exists within the β thalassemia syndromes. The term β
thalassemia intermedia (TI) was first suggested to describe patients who have a milder
anemia compared with patients with β thalassemia major (TM), who usually present to
medical attention later in childhood, and who remain largely transfusion independent.1
However, It is now established that the diagnosis of TI spans a wide spectrum of
severity and carries higher morbidity than previously recognized.2-3 Three main factors
dominate the disease process in TI: ineffective erythropoiesis, chronic hemolytic
anemia, and iron overload.3 The combination of ineffective erythropoiesis and chronic
anemia lead to hepcidin suppression, increased iron absorption from the gut, and
increased release of recycled iron from the reticuloendothelial system. This results in
depletion of macrophage iron, relatively low levels of serum ferritin, and preferential
portal and hepatocyte iron storage. This in turn leads to considerable hepatic iron
overload and release into the circulation of toxic iron species like non-transferrin-bound
iron (NTBI).4-7 Iron overload can also be the consequence of transfusion therapy, which
despite traditionally being an uncommon practice in TI, is now undertaken for many
patients with severe disease after showing a potential role in ameliorating some disease
complications.2, 8-9 Moreover, age-related changes in adaptation to anemia by the bone
marrow, alongside difficulty in maintaining a high output with normal vascular aging,
allow many transfusion-independent patients with TI to become transfusion-dependent
as they age.10-11 In patients with TM, several studies proved that uncontrolled iron
overload is associated with significant morbidity and mortality, especially cardiac,
DOI: 10.3324/haematol.2011.047852

5
highlighting the essential role of iron chelation therapy for survival.12 Studies on the
morbidity or mortality from iron overload in TI are lacking. Cardiac siderosis seems to be
uncommon in TI, even in patients with severe iron overload.13-15 Thus, it remains
essential to determine whether iron overload results in other clinical sequelae, before
chelation therapy can be advised.
Liver iron concentration (LIC) has been regarded as the reference standard for
estimating body iron loading and has been shown to accurately predict total body iron
stores stores.16 R2 and R2* magnetic resonance imaging (MRI) relaxation time
techniques allow for non-invasive estimation of LIC in patients with
hemoglobinopathies.17-19 The LIC cut-off points 7 and 15 mg Fe/g dry weight (dw) have
been used for the past two decades to categorize iron overload status, predict morbidity
and mortality, and tailor iron chelation therapy in patients with TM. However, these cut-
off points were extrapolated from data on patients with hereditary hemochrmoatosis20,
and were only linked to liver pathology and cardiac disease in few small studies on
patients with TM utilizing liver biopsy.21-24 Studies linking LIC or its cut-offs to morbidity
or mortality in patients with TI are absent.
In this study, we aim to evaluate the association between iron overload as
determined by LIC and morbidity in a large cohort of patients with TI.
DOI: 10.3324/haematol.2011.047852
6
Design and Methods
This was a cross-sectional study of all TI patients treated at two centers in Beirut,
Lebanon and Milan, Italy, for whom LIC measurements were available (74/127 from
Lebanon and 94/153 from Italy). An age of diagnosis beyond two years, hemoglobin
values maintained between 7 and 9 g/dl without the need for a regular transfusional
regimen (at diagnosis), with or without splenomegaly, were the main criteria to define
the TI phenotype on presentation in both centers.25 Patients with Hb S, C, E/β or δβ
thalassemia; or those who had co-inheritance of α thalassemia [α+ (-α3.7 and - α4.2) or α0
(--Med and --SEA)] or determinants associated with increased γ chain production [Xmn-I
+/+ genotype at position –158 of HβG2] were excluded. All extracted data reflected the
period of LIC measurement. Patient charts were reviewed and a medical history
compiled to retrieve data on demographics (age and gender), splenectomy status, and
transfusion history. None of the patients were receiving iron chelation therapy or any
fetal hemoglobin inducing agents at the time of LIC measurement. For transfusion
history, data was categorized as follows: regularly transfused (patients on regular-
interval transfusion protocols every 1-3 months), occasionally transfused (patients who
required incidental transfusions for transient severe anemia secondary to infections,
surgery, or pregnancy); and non-transfused. Laboratory studies were retrieved as a
mean of all measurements undertaken during the year of LIC measurement, and
included serum ferritin level, fetal and total hemoglobin (pre-scheduled transfusion in
transfused patients) levels, as well as platelet and nucleated red blood cell (NRBC)
counts. For LIC, direct determination of iron burden was performed using R2 MRI in
Beirut and R2* MRI in Milan using established methodologies, calibrated to mg/g of iron
DOI: 10.3324/haematol.2011.047852

7
by dry weight in fresh liver biopsy specimens.17-18 The study received Institutional
Review Board approval.
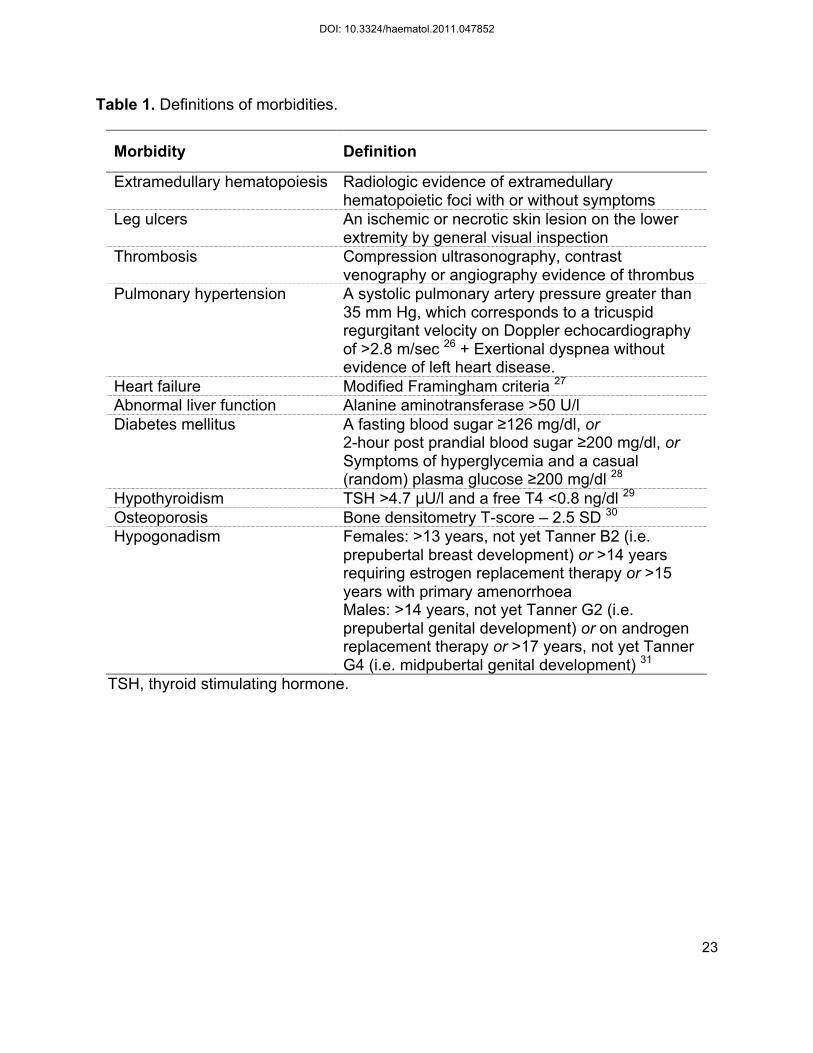
Data was also obtained for morbidities known to be common in patients with TI3
or that could be relevant in a state of iron overload. Complications were defined
according to Table 1.26-31 The prevalence of other elements (family history of
cardiovascular or endocrine disease, acquired or inherited thrombophilia, anticoagulant
or antiplatelet use for reasons other than overt thrombosis, malignancy, orthopedic
surgery, hepatitis C or B virus infection) in the patients’ medical history that could modify
the rate of morbidities was low; and hence, these parameters were not included in
further analysis.
Statistical analysis
Descriptive statistics are expressed as means (standard deviation, SD) medians
(interquartile range, IQR) or percentages. Bivariate analysis was performed to
determine the correlation between LIC and study variables using the independent
samples t-test or the ANOVA test (categorical variables) and the Pearson’s correlation
coefficient (continuous variables). Bivariate correlations between study variables and
morbidities were evaluated by the independent samples t-test and the Chi-square test
except for heart failure and diabetes mellitus where correlations were evaluated by the
Mann-Whitney U test and the Fisher’s exact test. For bivariate analysis including LIC,
we also double-checked and confirmed that significance is maintained when
comparisons of geometric means or medians was used instead of arithmetic means.
Multivariate logistic regression analysis, using forward-stepwise selection, was used to
DOI: 10.3324/haematol.2011.047852

8
determine which variables were independently associated with each morbidity.
Transfusion history was categorized as transfused vs. non-transfused. P≤0.1 was used
as the criterion for inclusion into the model to allow for correction of most confounders.
Multicolinearity between variables in the model was evaluated for using the Variation
Inflation Factor (VIF). All VIFs were ≤3 (acceptable limit <10) indicating absence of
multicolinearity. To determine best LIC cut-offs for discriminating the presence and
absence of morbidity, the maximum sum of sensitivity and specificity were calculated
from receiver-operating characteristic (ROC) curve analysis. Retrieved cut-offs were
also tested using the same multivariate logistic regression model. The effects of
splenectomy and transfusion history on the association between LIC and morbidities
was explored by grouping patients according to phenotype severity: mild (neither
splenectomized nor transfused) moderate (either splenectomized or transfused) and
severe (both splenectomized and transfused). Logarithmic regression curves were used
to determine the effect of age on the observed association between LIC and morbidities,
as stratified for disease severity groups. All P-values are two sided with the level of
significance set at <0.05.
Results
Patients’ characteristics
A total of 168 patients with TI were included in this analysis (Table 2). The mean LIC
was 8.4±6.7 mg Fe/g dw (range, 0.5-32.1 mg Fe/g dw). Mean LIC was higher in
splenectomised compared with non-splenectomized patients (9.4±6.5 vs. 5.8±6.6 mg
Fe/g dw, P=0.001) and was higher in regularly (9.7±6.7 mg Fe/g dw) or occasionally
DOI: 10.3324/haematol.2011.047852

9
(9.9 ± 7.2 mg Fe/g dw) transfused compared with non-transfused (4.3 ± 3.1 mg Fe/g
dw) patients (P<0.001). There was a weak positive correlation between LIC and serum
ferritin level (r=0.53, P<0.001) as well as fetal hemoglobin level (r=0.22, P=0.008).
There were no statistically significant correlations between LIC and any of age, gender,
total hemoglobin level, platelet or NRBC counts.
Liver iron concentration and morbidities
Mean LIC values were significantly higher in patients with leg ulcers, thrombosis,
pulmonary hypertension, abnormal liver function, hypothyroidism, osteoporosis, and
hypogonadism compared with patients without these morbidities (Figure 1). Bivariate
correlations between other study parameters and morbidities are summarized in
Supplement 1. On multivariate logistic regression analysis, and after adjusting for all
study variables significant at the 0.1 level on bivariate analysis, a 1 mg Fe/g dw
increase in LIC was significantly and independently associated with higher odds of
thrombosis, pulmonary hypertension, hypothyroidism, osteoporosis, and hypogonadism
(Supplement 2).
Liver iron concentration cut-offs
Using ROC curve analysis, a LIC ≥7 mg Fe/g dw was found to be the best threshold for
discriminating the presence and absence of vascular morbidity (thrombosis or
pulmonary hypertension) with an area under the curve (AUC) of 0.723 (P<0.001).
Patients with a LIC ≥7 mg Fe/g dw were 3.76 times more likely to have vascular
morbidity compared with patients with a LIC <7 mg Fe/g dw (Table 3). Similarly, a LIC
DOI: 10.3324/haematol.2011.047852

10
≥6 mg Fe/g dw was found to be the best threshold for discriminating the presence and
absence of endocrine/bone morbidity (hypothyroidism, osteoporosis, or hypogonadism)
with an AUC of 0.724 (P<0.001). Patients with a LIC ≥6 mg Fe/g dw were 4.05 times
more likely to have endocrine morbidity compared with patients with a LIC <6 mg Fe/g
dw (Table 3).
Effects of splenectomy and transfusion (phenotype severity)
Patients with a LIC ≥7 mg Fe/g dw had a significantly higher rate of vascular morbidity
compared with patients with a LIC <7 mg Fe/g dw, in all groups of phenotype severity.
Moreover, in patients with a LIC ≥7 mg Fe/g dw, the rate of vascular morbidity was
significantly higher if they had severe compared with moderate or mild phenotype
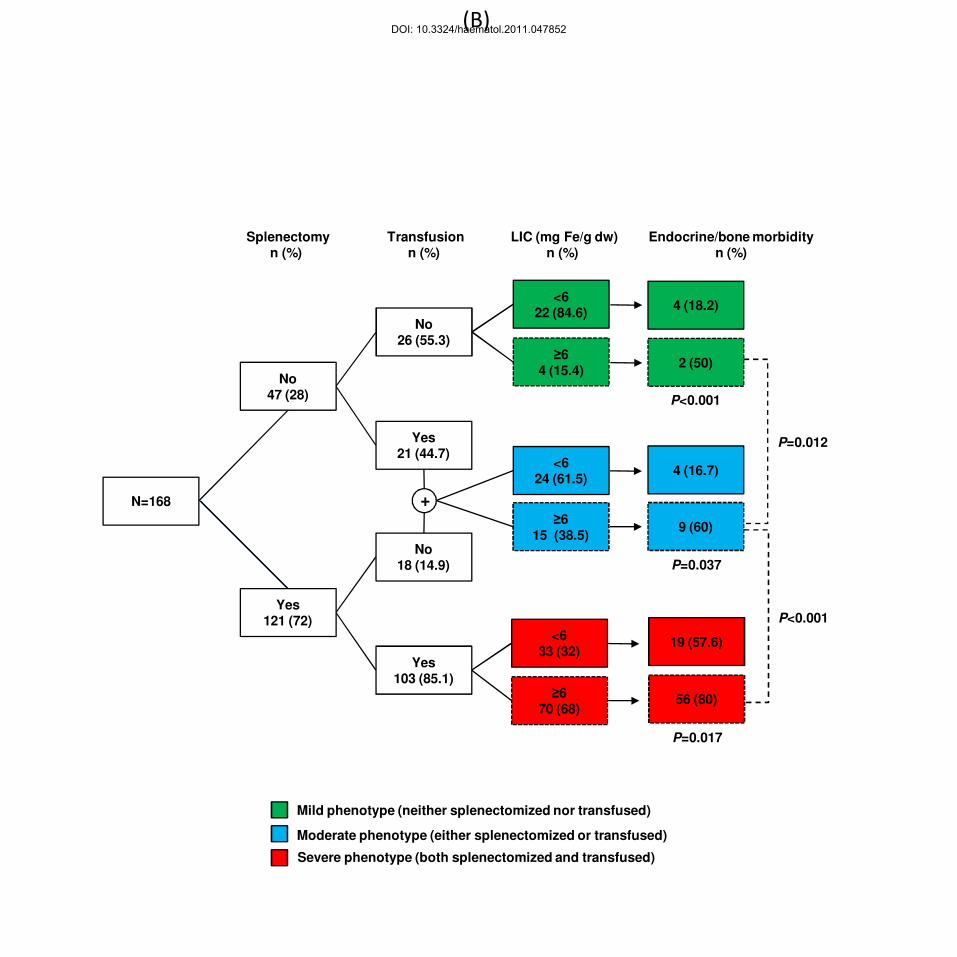
(Figure 2A). Similarly, patients with a LIC ≥6 mg Fe/g dw had a significantly higher rate
of endocrine/bone morbidity compared with patients with a LIC <6 mg Fe/g dw, in all
phenotype severity groups. Moreover, in patients with a LIC ≥6 mg Fe/g dw, the rate of
endocrine/bone morbidity was significantly higher if they had severe compared with
moderate or mild phenotype (Figure 2B).
Effect of age
The probability of vascular morbidity significantly increased with age irrespective of LIC,
although reaching significantly higher values more steeply in patients with a LIC ≥7 mg
Fe/g dw compared with those with LIC <7 mg Fe/g dw (Figure 3A, left panel). When
patients were stratified according to phenotype severity, the latter trend was maintained
(Figure 3A, right panel). Moreover, the probability of endocrine/bone morbidity
DOI: 10.3324/haematol.2011.047852

11
significantly increased with age in patients with values <6 mg Fe/g dw; however, it
showed a flat behavior starting with a high probability at young age in patients with
values ≥6 mg Fe/g dw (Figure 3B, left panel). When patients were stratified according to
phenotype severity, the latter trend was maintained in patients with severe phenotype
(Figure 3B, right panel).
Discussion
Our study is the first to associate iron overload, reflected by LIC measurement, with
vascular, endocrine, and bone morbidity in patients with TI. Elevated LIC was
associated with an increased rate of vascular, endocrine, and bone morbidity in patients
with all phenotype severity groups. Moreover, elevated LIC was associated with a
steeper increase in the rate of vascular morbidity attributed to aging, and permitted
endocrine and bone disease to appear at a younger age compared with patients with
low LIC. These novel findings have important clinical implications that need to be
interpreted with caution.
A causal relationship between LIC and morbidity cannot yet be established. This
is not because our study is cross-sectional in nature. Even if such an association is
prospectively observed, the complexity of the disease process in TI makes it hard to
determine if elevated LIC is only a marker of disease severity (hence the increased
morbidity) or a causative, modifiable risk factor. The definition and evaluation of severity
in TI are challenging, especially given that hemoglobin level does not correlate with
most morbidities2, and markers of ineffective erythropoiesis severity have not been
extensively evaluated. We undertook a practical approach and assumed that the need
DOI: 10.3324/haematol.2011.047852

12
for splenectomy and transfusion therapy reflect a more severe phenotype. In such
cases, elevated LIC was associated with an increased risk of complications in all
severity groups, indicating that iron overload may be adding to any other causative
factors attributed to a more severe disease. Moreover, elevated LIC worsened the
observed effect of aging on complications, again indicating an additive role of iron
overload to the established role of advancing age.11 Nevertheless, true evidence of
target-organ iron toxicity can only be confirmed through radio-pathological studies, or
through the observation of a beneficial effect of iron chelation therapy. In fact, evidence
already exists regarding a protective role of iron chelation therapy, presumably
necessitated in some of the severe cases, against several clinical complications in TI.2
If causation is hypothesized, how could one link iron toxicity to the observed
complications, especially vascular disease? Hypercoagulability in TI is attributed to
several factors including ineffective erythropoiesis and secondary procoagulant activity
of hemolyzed circulating RBCs, microparticles, increased platelet activation,
thrombocytosis, coagulation factor defects, depletion of antithrombotic factors, and
endothelial inflammation.32 Hypercoagulability leads to a high rate of thromboembolic
events; especially in splenectomized and older patients with TI. Multiple microthrombi in
the pulmonary vasculature in association with the increased vascular resistance related
to vasoconstriction from various other pathways could probably lead to pulmonary
hypertension.2, 11, 33-36 Hemolysis and erythroid hyperplasia have also been linked to
increased release of placenta growth factor, endothelin-1, and pulmonary
hypertension.37 Iron may directly contribute to hemolysis, or endothelial damage and
vasculopathy. Iron-derived reactive oxygen species are implicated in the pathogenesis
DOI: 10.3324/haematol.2011.047852

13
of several vascular disorders including atherosclerosis, microangiopathic hemolytic
anemia, vasculitis, and reperfusion injury.38 Moreover, the relationship between iron
overload and the severity of ineffective erythropoiesis seems to be bidirectional. Recent
evidence suggests that managing iron overload with iron chelators or more novel
therapeutics could improve the efficiency of erythropoiesis and the survival of the
resulting reticulocytes and erythrocytes.39-42 Thus, iron overload may aggravate
ineffective erythropoiesis and the secondary release into the circulation of damaged
RBCs with thrombogenic potential.43-44
The need for iron chelation therapy has only recently started to emerge after
documenting substantially high LIC and NTBI values in TI patients who were never or
only minimally transfused.4-5 As with other aspects of the management of TI, clear
guidelines on initiation of chelation therapy are not available. Current recommendations
are based on expert opinion or get extrapolated from data on TM.7 If evidence of iron
toxicity suggested herein is confirmed, chelation therapy would be recommended to
decrease toxic iron species like NTBI. LIC measurement could be used to flag the
hyperabsorption and increased labile iron and to avoid overchelation. Iron chelation
therapy in patients with TI may not necessarily be life-long. Intermittent periods of iron
chelation with careful assessment of LIC throughout the course of the disease could be
sufficient in many cases. When LIC is lowered to desirable levels, low dose oral
chelation may be of value in preventing further iron loading. Serum ferritin levels could
not predict most morbidities in our study, and correlated weakly with LIC. The serum
ferritin to LIC ratio was also shown to be lower relative to patients with TM.5-6 Thus,
DOI: 10.3324/haematol.2011.047852

14
reliance on serum ferritin to guide chelation therapy in TI may lead to delay in initiating
treatment.
The main limitation of our study is the use of echocardiography instead of cardiac
catheterization for the diagnosis of pulmonary hypertension which may increase the rate
of false positive findings. However, our patients were mainly screened for pulmonary
hypertension after presenting with exertional dyspnea with no evidence of left heart
disease. Moreover, echocardiography is still the modality of choice used in many
studies on thalassemia and sickle cell anemia. This could be attributed to the
invasiveness and cost of cardiac catheterization, and relies on reports of good
relationship between Doppler estimates and invasive measurements of pulmonary
arterial pressure at baseline and after treatment.45-47 Moreover, we could not directly
assess liver pathology in this study and only relied on alanine aminotransferase
measurement to reflect liver abnormality. Although serum ferritin correlated better than
LIC with liver enzyme level in this study, associations with fibrosis and carcinoma
through biopsy data should be evaluated. In our study, both R2 and R2* MRI techniques
were used for the measurement of LIC. In a study of 384 observations in more than 200
patients, LIC measurements using R2* MRI were unbiased with respect to those using
R2 MRI.48
In conclusion, our study demonstrated that elevated LIC in patients with TI is
associated with significant vascular, endocrine, and bone morbidity. Further studies are
needed to confirm the causative role of iron toxicity and evaluate the role of iron
chelation therapy in preventing or reversing morbidity in TI. This may require
DOI: 10.3324/haematol.2011.047852
15
collaborative efforts between international centers to ensure a large sample from this
heterogeneous population is evaluated.
Acknowledgments
We thank Professor Sir David J. Weatherall (Weatherall Institute of Molecular Medicine,
University of Oxford, OX, UK) for his review and thoughtful comments on this work.
Authorship and Disclosures
KMM, MDC, JCW, ATT were responsible for conception and design, data analysis and
interpretation, and manuscript writing; KMM and HT performed statistical analysis; MDC
and ATT gave administrative support and helped in provision of study material or
patients; IM and GG helped in collection and assembly of data. All authors gave final
approval of the manuscript for submission.
MDC and ATT are members of Novartis Speakers’ Bureau. JCW receives research
funding from Novartis and serves as a consultant to Ferrokin Biosciences.
MDC and JCW contributed equally to this manuscript.
DOI: 10.3324/haematol.2011.047852

16
References
1. Steinberg MH, Forget BG, Higgs DR, Weatherall DJ. Disorders of hemoglobin:
genetics pathophysiology, and clinical management. 2nd ed. Cambridge: Cambridge
University Press, 2009.
2. Taher AT, Musallam KM, Karimi M, El-Beshlawy A, Belhoul K, Daar S, et al.
Overview on practices in thalassemia intermedia management aiming for lowering
complication rates across a region of endemicity: the OPTIMAL CARE study. Blood.
2010;115(10):1886-92.
3. Taher AT, Musallam KM, Cappellini MD, Weatherall DJ. Optimal management of
beta thalassaemia intermedia. Br J Haematol. 2011;152(5):512-23.
4. Taher A, Musallam KM, El Rassi F, Duca L, Inati A, Koussa S, et al. Levels of
non-transferrin-bound iron as an index of iron overload in patients with thalassaemia
intermedia. Br J Haematol. 2009;146(5):569-72.
5. Taher A, El Rassi F, Isma'eel H, Koussa S, Inati A, Cappellini MD. Correlation of
liver iron concentration determined by R2 magnetic resonance imaging with serum
ferritin in patients with thalassemia intermedia. Haematologica. 2008;93(10):1584-6.
6. Origa R, Galanello R, Ganz T, Giagu N, Maccioni L, Faa G, et al. Liver iron
concentrations and urinary hepcidin in beta-thalassemia. Haematologica.
2007;92(5):583-8.
7. Taher A, Hershko C, Cappellini MD. Iron overload in thalassaemia intermedia:
reassessment of iron chelation strategies. Br J Haematol. 2009;147(5):634-40.
8. Aessopos A, Kati M, Meletis J. Thalassemia intermedia today: should patients
regularly receive transfusions? Transfusion. 2007;47(5):792-800.
DOI: 10.3324/haematol.2011.047852

17
9. Taher AT, Musallam KM, Nasreddine W, Hourani R, Inati A, Beydoun A.
Asymptomatic brain magnetic resonance imaging abnormalities in splenectomized
adults with thalassemia intermedia. J Thromb Haemost. 2010;8(1):54-9.
10. O'Donnell A, Premawardhena A, Arambepola M, Allen SJ, Peto TE, Fisher CA, et
al. Age-related changes in adaptation to severe anemia in childhood in developing
countries. Proc Natl Acad Sci U S A. 2007;104(22):9440-4.
11. Taher AT, Musallam KM, El-Beshlawy A, Karimi M, Daar S, Belhoul K, et al. Age-
related complications in treatment-naive patients with thalassaemia intermedia. Br J
Haematol. 2010;150(4):486-9.
12. Brittenham GM. Iron-chelating therapy for transfusional iron overload. N Engl J
Med. 2011;364(2):146-56.
13. Roghi A, Cappellini MD, Wood JC, Musallam KM, Patrizia P, Fasulo MR, et al.
Absence of cardiac siderosis despite hepatic iron overload in Italian patients with
thalassemia intermedia: an MRI T2* study. Ann Hematol. 2010;89(6):585-9.
14. Taher AT, Musallam KM, Wood JC, Cappellini MD. Magnetic resonance
evaluation of hepatic and myocardial iron deposition in transfusion-independent
thalassemia intermedia compared to regularly transfused thalassemia major patients.
Am J Hematol. 2010;85(4):288-90.
15. Origa R, Barella S, Argiolas GM, Bina P, Agus A, Galanello R. No evidence of
cardiac iron in 20 never- or minimally-transfused patients with thalassemia intermedia.
Haematologica. 2008;93(7):1095-6.
DOI: 10.3324/haematol.2011.047852

18
16. Angelucci E, Brittenham GM, McLaren CE, Ripalti M, Baronciani D, Giardini C, et
al. Hepatic iron concentration and total body iron stores in thalassemia major. N Engl J
Med. 2000;343(5):327-31.
17. St Pierre TG, Clark PR, Chua-anusorn W, Fleming AJ, Jeffrey GP, Olynyk JK, et
al. Noninvasive measurement and imaging of liver iron concentrations using proton
magnetic resonance. Blood. 2005;105(2):855-61.
18. Wood JC, Enriquez C, Ghugre N, Tyzka JM, Carson S, Nelson MD, et al. MRI R2
and R2* mapping accurately estimates hepatic iron concentration in transfusion-
dependent thalassemia and sickle cell disease patients. Blood. 2005;106(4):1460-5.
19. Anderson LJ, Holden S, Davis B, Prescott E, Charrier CC, Bunce NH, et al.
Cardiovascular T2-star (T2*) magnetic resonance for the early diagnosis of myocardial
iron overload. Eur Heart J. 2001;22(23):2171-9.
20. Olivieri NF, Brittenham GM. Iron-chelating therapy and the treatment of
thalassemia. Blood. 1997;89(3):739-61.
21. Angelucci E, Muretto P, Nicolucci A, Baronciani D, Erer B, Gaziev J, et al. Effects
of iron overload and hepatitis C virus positivity in determining progression of liver
fibrosis in thalassemia following bone marrow transplantation. Blood. 2002;100(1):17-
21.
22. Telfer PT, Prestcott E, Holden S, Walker M, Hoffbrand AV, Wonke B. Hepatic
iron concentration combined with long-term monitoring of serum ferritin to predict
complications of iron overload in thalassaemia major. Br J Haematol. 2000;110(4):971-
7.
DOI: 10.3324/haematol.2011.047852

19
23. Jensen PD, Jensen FT, Christensen T, Nielsen JL, Ellegaard J. Relationship
between hepatocellular injury and transfusional iron overload prior to and during iron
chelation with desferrioxamine: a study in adult patients with acquired anemias. Blood.
2003;101(1):91-6.
24. Brittenham GM, Griffith PM, Nienhuis AW, McLaren CE, Young NS, Tucker EE,
et al. Efficacy of deferoxamine in preventing complications of iron overload in patients
with thalassemia major. N Engl J Med. 1994;331(9):567-73.
25. Camaschella C, Cappellini MD. Thalassemia intermedia. Haematologica.
1995;80(1):58-68.
26. Barst RJ, McGoon M, Torbicki A, Sitbon O, Krowka MJ, Olschewski H, et al.
Diagnosis and differential assessment of pulmonary arterial hypertension. J Am Coll
Cardiol. 2004;43(12 Suppl S):40S-7S.
27. Kleber FX, Niemoller L, Doering W. Impact of converting enzyme inhibition on
progression of chronic heart failure: results of the Munich Mild Heart Failure Trial. Br
Heart J. 1992;67(4):289-96.
28. Nathan DM, Buse JB, Davidson MB, Ferrannini E, Holman RR, Sherwin R, et al.
Medical management of hyperglycemia in type 2 diabetes: a consensus algorithm for
the initiation and adjustment of therapy: a consensus statement of the American
Diabetes Association and the European Association for the Study of Diabetes. Diabetes
Care. 2009;32(1):193-203.
29. Baskin HJ, Cobin RH, Duick DS, Gharib H, Guttler RB, Kaplan MM, et al.
American Association of Clinical Endocrinologists medical guidelines for clinical practice
DOI: 10.3324/haematol.2011.047852

20
for the evaluation and treatment of hyperthyroidism and hypothyroidism. Endocr Pract.
2002;8(6):457-69.
30. El-Hajj Fuleihan G, Baddoura R, Awada H, Arabi A, Okais J. First update of the
Lebanese guidelines for osteoporosis assessment and treatment. J Clin Densitom.
2008;11(3):383-96.
31. Fung EB, Harmatz PR, Lee PD, Milet M, Bellevue R, Jeng MR, et al. Increased
prevalence of iron-overload associated endocrinopathy in thalassaemia versus sickle-
cell disease. Br J Haematol. 2006;135(4):574-82.
32. Cappellini MD, Motta I, Musallam KM, Taher AT. Redefining thalassemia as a
hypercoagulable state. Ann N Y Acad Sci. 2010;1202:231-6.
33. Taher A, Isma'eel H, Mehio G, Bignamini D, Kattamis A, Rachmilewitz EA, et al.
Prevalence of thromboembolic events among 8,860 patients with thalassaemia major
and intermedia in the Mediterranean area and Iran. Thromb Haemost. 2006;96(4):488-
91.
34. Taher AT, Musallam KM, Karimi M, El-Beshlawy A, Belhoul K, Daar S, et al.
Splenectomy and thrombosis: the case of thalassemia intermedia. J Thromb Haemost.
2010;8(10):2152-8.
35. Cappellini MD, Robbiolo L, Bottasso BM, Coppola R, Fiorelli G, Mannucci AP.
Venous thromboembolism and hypercoagulability in splenectomized patients with
thalassaemia intermedia. Br J Haematol. 2000;111(2):467-73.
36. Atichartakarn V, Likittanasombat K, Chuncharunee S, Chandanamattha P,
Worapongpaiboon S, Angchaisuksiri P, et al. Pulmonary arterial hypertension in
DOI: 10.3324/haematol.2011.047852

21
previously splenectomized patients with beta-thalassemic disorders. Int J Hematol.
2003;78(2):139-45.
37. Sundaram N, Tailor A, Mendelsohn L, Wansapura J, Wang X, Higashimoto T, et
al. High levels of placenta growth factor in sickle cell disease promote pulmonary
hypertension. Blood. 2010;116(1):109-12.
38. Balla J, Vercellotti GM, Nath K, Yachie A, Nagy E, Eaton JW, et al. Haem, haem
oxygenase and ferritin in vascular endothelial cell injury. Nephrol Dial Transplant.
2003;18 Suppl 5:v8-12.
39. Gardenghi S, Ramos P, Marongiu MF, Melchiori L, Breda L, Guy E, et al.
Hepcidin as a therapeutic tool to limit iron overload and improve anemia in beta-
thalassemic mice. J Clin Invest. 2010;120(12):4466-77.
40. Ramos P, Melchiori L, Gardenghi S, Van-Roijen N, Grady RW, Ginzburg Y, et al.
Iron metabolism and ineffective erythropoiesis in beta-thalassemia mouse models. Ann
N Y Acad Sci. 2010;1202:24-30.
41. Oliva EN, Ronco F, Marino A, Alati C, Pratico G, Nobile F. Iron chelation therapy
associated with improvement of hematopoiesis in transfusion-dependent patients.
Transfusion. 2010;50(7):1568-70.
42. Li H, Rybicki AC, Suzuka SM, von Bonsdorff L, Breuer W, Hall CB, et al.
Transferrin therapy ameliorates disease in beta-thalassemic mice. Nat Med.
2010;16(2):177-82.
43. Borenstain-Ben Yashar V, Barenholz Y, Hy-Am E, Rachmilewitz EA, Eldor A.
Phosphatidylserine in the outer leaflet of red blood cells from beta-thalassemia patients
DOI: 10.3324/haematol.2011.047852

22
may explain the chronic hypercoagulable state and thrombotic episodes. Am J Hematol.
1993;44(1):63-5.
44. Gardenghi S, Grady RW, Rivella S. Anemia, ineffective erythropoiesis, and
hepcidin: interacting factors in abnormal iron metabolism leading to iron overload in
beta-thalassemia. Hematol Oncol Clin North Am. 2010;24(6):1089-107.
45. Aessopos A, Farmakis D, Karagiorga M, Voskaridou E, Loutradi A, Hatziliami A,
et al. Cardiac involvement in thalassemia intermedia: a multicenter study. Blood.
2001;97(11):3411-6.
46. Aessopos A, Farmakis D, Deftereos S, Tsironi M, Tassiopoulos S, Moyssakis I,
et al. Thalassemia heart disease: a comparative evaluation of thalassemia major and
thalassemia intermedia. Chest. 2005;127(5):1523-30.
47. Aessopos A, Kati M, Farmakis D. Heart disease in thalassemia intermedia: a
review of the underlying pathophysiology. Haematologica. 2007;92(5):658-65.
48. Wood JC. Magnetic resonance imaging measurement of iron overload. Curr Opin
Hematol. 2007;14(3):183-90.
DOI: 10.3324/haematol.2011.047852
23
Table 1. Definitions of morbidities.
Morbidity Definition
Extramedullary hematopoiesis Radiologic evidence of extramedullary hematopoietic foci with or without symptoms
Leg ulcers An ischemic or necrotic skin lesion on the lower extremity by general visual inspection
Thrombosis Compression ultrasonography, contrast venography or angiography evidence of thrombus
Pulmonary hypertension A systolic pulmonary artery pressure greater than 35 mm Hg, which corresponds to a tricuspid regurgitant velocity on Doppler echocardiography of >2.8 m/sec 26 + Exertional dyspnea without evidence of left heart disease.
Heart failure Modified Framingham criteria 27 Abnormal liver function Alanine aminotransferase >50 U/l Diabetes mellitus A fasting blood sugar ≥126 mg/dl, or
2-hour post prandial blood sugar ≥200 mg/dl, or Symptoms of hyperglycemia and a casual (random) plasma glucose ≥200 mg/dl 28
Hypothyroidism TSH >4.7 µU/l and a free T4 <0.8 ng/dl 29 Osteoporosis Bone densitometry T-score – 2.5 SD 30 Hypogonadism Females: >13 years, not yet Tanner B2 (i.e.
prepubertal breast development) or >14 years requiring estrogen replacement therapy or >15 years with primary amenorrhoea Males: >14 years, not yet Tanner G2 (i.e. prepubertal genital development) or on androgen replacement therapy or >17 years, not yet Tanner G4 (i.e. midpubertal genital development) 31
TSH, thyroid stimulating hormone.
DOI: 10.3324/haematol.2011.047852

24
Table 2. Patients’ characteristics (n=168).
Parameter Value
Age (years), mean (SD) 35.2 (12.6)
Male, n (%) 73 (42.9)
Splenectomized, n (%) 121 (72.0)
Transfusion history, n (%)
None 44 (26.2)
Occasional 80 (47.6)
Regular 44 (26.2)
Total hemoglobin (g/dl), mean (SD) 8.8 (1.6)
Fetal hemoglobin (%), mean (SD) 44.5 (31.1)
Platelet count (x109/l), mean (SD) 609.4 (346.0)
NRBC count (x106/l), median (IQR) 422.5 (11653)
Serum ferritin (ng/ml), median (IQR) 773.3 (938.5)
LIC (mg Fe/g dw), mean (SD) 8.4 (6.7)
Morbidity, n (%)
Osteoporosis 77 (45.8)
Pulmonary hypertension 56 (33.3)
Abnormal liver function 54 (32.1)
Thrombosis 44 (26.2)
Extramedullary hematopoiesis 43 (25.6)
Leg ulcers 41 (24.4)
Hypothyroidism 30 (17.9)
Hypogonadism 28 (16.7)
Heart failure 9 (5.4)
Diabetes mellitus 6 (3.6) SD, standard deviation; IQR, interquartile range; NRBC, nucleated red blood cell; LIC, liver iron concentration; dw, dry weight.
DOI: 10.3324/haematol.2011.047852

25
Table 3. Receiver operating characteristic (ROC) curve analysis to determine best LIC cut-offs for discriminating the presence and absence of morbidity.
Morbidity LIC cut-off (mg Fe/g dw) AUC 95% CI P-value Sensitivity Specificity AOR (95% CI)a
Thrombosis ≥7 0.669 ± 0.049 0.573-0.765 0.001 70.5% 61.3% 2.86 (1.22-5.91)
Pulmonary hypertension ≥6 0.684 ± 0.042 0.601-0.767 <0.001 75% 58% 3.30 (1.54-7.08)
Vascularb ≥7 0.723 ± 0.039 0.647-0.800 <0.001 66.3% 71.8% 3.76 (1.81-7.81)
Hypothyroidism ≥6 0.630 ± 0.056 0.521-0.739 0.025 76.7% 52.2% 2.65 (1.03-6.77)
Osteoporosis ≥9 0.796 ± 0.041 0.624-0.787 <0.001 58.4% 81.3% 5.13 (2.46-10.71)
Hypogonadism ≥6 0.689 ± 0.053 0.585-0.793 0.002 78.6% 52.1% 3.35 (1.21-9.26)
Endocrine/bonec ≥6 0.724 ± 0.039 0.647-0.801 <0.001 71.3% 70.3% 4.05 (1.96-8.35)
LIC, liver iron concentration; dw, dry weight; AUC, area under the curve; CI, confidence interval; AOR, adjusted odds ratio; CI, confidence interval. aAdjusted for age, gender, splenectomy status, transfusion history, total hemoglobin level, fetal hemoglobin level, platelet count, nucleated red blood cell count, and serum ferritin level. Model was built using forward-stepwise selection. P≤0.1 was used as the criterion for inclusion. Multicolinearity was absent in the model as evident from a Variation Inflation Factor ≤3 (acceptable limit up to 10). bPatients having pulmonary hypertension or thrombosis. cPatients having hypothyroidism, osteoporosis, or hypogonadism.
DOI: 10.3324/haematol.2011.047852
26
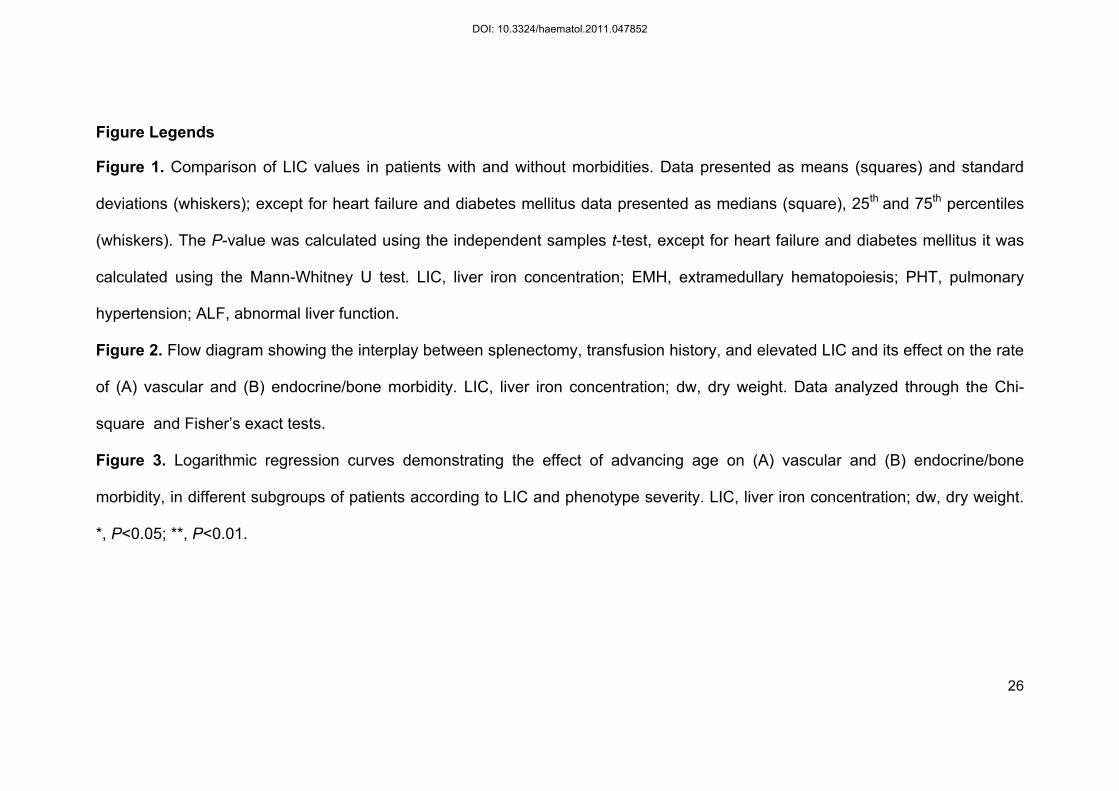
Figure Legends
Figure 1. Comparison of LIC values in patients with and without morbidities. Data presented as means (squares) and standard
deviations (whiskers); except for heart failure and diabetes mellitus data presented as medians (square), 25th and 75th percentiles
(whiskers). The P-value was calculated using the independent samples t-test, except for heart failure and diabetes mellitus it was
calculated using the Mann-Whitney U test. LIC, liver iron concentration; EMH, extramedullary hematopoiesis; PHT, pulmonary
hypertension; ALF, abnormal liver function.
Figure 2. Flow diagram showing the interplay between splenectomy, transfusion history, and elevated LIC and its effect on the rate
of (A) vascular and (B) endocrine/bone morbidity. LIC, liver iron concentration; dw, dry weight. Data analyzed through the Chi-
square and Fisher’s exact tests.
Figure 3. Logarithmic regression curves demonstrating the effect of advancing age on (A) vascular and (B) endocrine/bone
morbidity, in different subgroups of patients according to LIC and phenotype severity. LIC, liver iron concentration; dw, dry weight.
*, P<0.05; **, P<0.01.
DOI: 10.3324/haematol.2011.047852

0
3
6
9
12
15
18
21
LIC
(m
g F
e/g
dry
weig
ht)
EM
H
Leg
ulc
ers
Th
rom
bo
sis
PH
T
Heart
fail
ure
AL
F
Dia
bete
s m
ell
itu
s
Hyp
oth
yro
idis
m
Oste
op
oro
sis
Hyp
og
on
ad
ism
P=0.490 P=0.027 P=0.002 P<0.001 P=0.245 P<0.001 P=0.682 P=0.040 P<0.001 P<0.001
Morbidity absent Morbidity present
DOI: 10.3324/haematol.2011.047852

+
P<0.001
P=0.016
P=0.001
N=168
No47 (28)
Yes121 (72)
Yes103 (85.1)
No18 (14.9)
Yes21 (44.7)
No26 (55.3)
<723 (88.5)
≥73 (11.5)
<727 (69.2)
≥712 (30.8)
<739 (37.9)
≥764 (62.1)
47 (73.4)
16 (41)
7 (58.3)
9 (33.3)
1 (33)
3 (13)
Splenectomyn (%)
Transfusionn (%)
LIC (mg Fe/g dw)n (%)
Vascular morbidityn (%)
P=0.020
P<0.001
(A)
Mild phenotype (neither splenectomized nor transfused)
Moderate phenotype (either splenectomized or transfused)
Severe phenotype (both splenectomized and transfused)
DOI: 10.3324/haematol.2011.047852
+
P<0.001
P=0.037
P=0.017
N=168
No47 (28)
Yes121 (72)
Yes103 (85.1)
No18 (14.9)
Yes21 (44.7)
No26 (55.3)
<622 (84.6)
≥64 (15.4)
<624 (61.5)
≥615 (38.5)
<633 (32)
≥670 (68)
56 (80)
19 (57.6)
9 (60)
4 (16.7)
2 (50)
4 (18.2)
Splenectomyn (%)
Transfusionn (%)
LIC (mg Fe/g dw)n (%)
Endocrine/bone morbidityn (%)
P=0.012
P<0.001
(B)
Mild phenotype (neither splenectomized nor transfused)
Moderate phenotype (either splenectomized or transfused)
Severe phenotype (both splenectomized and transfused)
DOI: 10.3324/haematol.2011.047852

- - - - LIC ≥7 mg Fe/g dw
LIC <7 mg Fe/g dw
- - - - LIC ≥7 mg Fe/g dw
LIC <7 mg Fe/g dw
**
*
**
(A)
Mild phenotype (neither splenectomized nor transfused)
Moderate phenotype (either splenectomized or transfused)
Severe phenotype (both splenectomized and transfused)
0.0
0.2
0.4
0.6
0.8
1.0
0 10 20 30 40 50 60 70
Pro
bab
ilit
y o
f vascu
lar
mo
rbid
ity
Age (years)
0.0
0.2
0.4
0.6
0.8
1.0
0 10 20 30 40 50 60 70
Pro
bab
ilit
y o
f vascu
lar
mo
rbid
ity
Age (years)
DOI: 10.3324/haematol.2011.047852

0.0
0.2
0.4
0.6
0.8
1.0
0 10 20 30 40 50 60 70
Pro
bab
ilit
y o
f en
do
/bo
ne m
orb
idit
y
Age (years)
- - - - LIC ≥6 mg Fe/g dw
LIC <6 mg Fe/g dw
- - - - LIC ≥6 mg Fe/g dw
LIC <6 mg Fe/g dw
**
**
Mild phenotype (neither splenectomized nor transfused)
Moderate phenotype (either splenectomized or transfused)
Severe phenotype (both splenectomized and transfused)
0.0
0.2
0.4
0.6
0.8
1.0
0 10 20 30 40 50 60 70
Pro
bab
ilit
y o
f en
do
/bo
ne m
orb
idit
y
Age (years)
(B)DOI: 10.3324/haematol.2011.047852

Supplement 1. Bivariate correlations between study parameters and morbidities (Part 1).
Morbidity
Extramedullary hematopoiesis Leg ulcers Thrombosis Pulmonary hypertension Heart failure Variable
No Yes No Yes No Yes No Yes No Yes
LIC (mg Fe/g dw)a 8.6 (6.7) 7.8 (6.6) 7.7 (6.3) 10.4 (7.5)* 7.3 (6) 11.5 (7.7)** 7 (6.1) 11.1 (7.1)*** 6.1 (8.8) 12.3 (15.8)
Age (years)a 34.9 (12.2) 36.1 (13.7) 34.6 (12.3) 37 (13.3) 34.2 (12.6)† 38 (12.1) 33 (13.1) 39.7 (10.2)*** 35 (18) 45 (9)*
Genderb
Female (n=96) 71 (74) 25 (26) 70 (72.9) 26 (27.1) 64 (66.7) 32 (33.3) 63 (65.6) 33 (34.4) 90 (93.7) 6 (6.3)
Male (n=72) 54 (75) 18 (25) 57 (73.7) 15 (26.3) 60 (83.3) 12 (16.7)* 49 (68.1) 23 (31.9) 69 (95.8) 3 (4.2)
Splenectomizedb
No (n=47) 38 (80.9) 9 (19.1) 39 (83) 8 (17) 43 (91.5) 4 (8.5) 39 (83) 8 (17) 44 (93.6) 3 (6.4)
Yes (n=121) 87 (71.9) 34 (28.1) 88 (72.7) 33 (27.3) 81 (66.9) 40 (33.1)** 73 (60.3) 48 (39.7)** 115 (95) 6 (5)
Transfusionb
None (n=44) 37 (84.1) 7 (15.9) 42 (95.5) 2 (4.5) 39 (88.6) 5 (11.4) 35 (79.5) 9 (20.5) 43 (97.7) 1 (2.3)
Occasional (n=80) 57 (71.2) 23 (28.8) 55 (68.7) 25 (31.3) 55 (68.7) 25 (31.3) 53 (66.2) 27 (33.8) 76 (95) 4 (5)
Regular (n=44) 31 (70.5) 13 (29.5) 30 (31.8) 14 (31.8)** 30 (68.2) 14 (31.8)* 24 (54.5) 20 (45.5)* 40 (90.9) 4 (9.1)
Total hemoglobin (g/dl)a 8.8 (1.6) 8.8 (1.6) 8.9 (1.6) 8.4 (1.5)† 8.9 (1.7) 8.3 (1.4)* 8.8 (1.8) 8.7 (1.3) 8.6 (1.9) 9.2 (2.4)
Fetal hemoglobin (%)a 42.7 (31.7) 49.4 (29.1) 42.8 (32.5) 50.1 (25.7) 43.3 (30.9) 51.6 (30.9) 40.6 (31.4) 44.8 (28.6)* 37.1 (57.9) 55.5 (37)
Platelet count (x109/l)a 591.9 (341.4) 657.8 (358) 589.8 (341.9) 667.1 (355.9) 582.2 (362.5) 684.5 (286.1) 594.1 (361.3) 641.5 (312.4) 613 (520) 351 (267)*
NRBC count (x106/l)c 349.5 (4745) 865 (16385) 359 (4751) 857 (16380) 325 (7947) 900 (18832) 353 (907) 6680 (25087)** 411 (12300) 567 (8860)
Serum ferritin (ng/ml)c 807.5 (919) 746.5 (1104)* 747 (751) 1095 (1142)† 740.3 (754.3) 1106.3 (916.8) 641.3 (777) 1006.5 (902.3)** 765 (855) 1403 (1297)† LIC, liver iron concentration; dw, dry weight; NRBC, nucleated red blood cell. Data presented as amean (SD) [except for heart failure and diabetes mellitus median (IQR) was used], bn (%), or cmedian (IQR). All correlations evaluated by the independent samples t-test and the Chi-square test except for heart failure and diabetes mellitus where correlations were evaluated by the Mann-Whitney U test and the Fisher’s exact test. †, P<0.1; *, P<0.05; **, P<0.01; ***, P<0.001.
DOI: 10.3324/haematol.2011.047852

Supplement 1. Bivariate correlations between study parameters and morbidities (Part 2).
Morbidity
Abnormal liver function Diabetes mellitus Hypothyrodism Osteoporosis Hypogonadism Variable
No Yes No Yes No Yes No Yes No Yes
LIC (mg Fe/g dw)a 6.7 (5.2) 11.9 (8)*** 6.1 (9.5) 6.5 (7.4) 7.8 (6.2) 11.1 (8.1)* 6.4 (6) 10.8 (6.7)*** 7.6 (6.1) 12.3 (8)***
Age (years)a 32 (12.6) 42 (9.6)*** 35 (19) 42 (9) 35.1 (13.1) 35.6 (10.1) 32.2 (13) 38.8 (11)*** 35.5 (13.1) 33.8 (9.8)
Genderb
Female (n=96) 67 (69.8) 29 (30.2) 91 (94.8) 5 (5.2) 78 (81.2) 18 (18.8) 51 (53.1) 45 (46.9) 77 (80.2) 19 (19.8)
Male (n=72) 47 (65.3) 25 (34.7) 71 (98.6) 1 (1.4) 60 (83.3) 12 (16.7) 40 (55.6) 32 (44.4) 63 (87.5) 9 (12.5)
Splenectomizedb
No (n=47) 39 (83) 8 (17) 46 (97.9) 1 (2.1) 43 (91.5) 4 (8.5) 36 (76.6) 11 (23.4) 45 (95.7) 2 (4.3)
Yes (n=121) 75 (62) 46 (38)** 116 (95.9) 5 (4.1) 95 (78.5) 26 (21.5)* 55 (45.5) 66 (54.5)*** 95 (78.5) 26 (21.5)**
Transfusionb
None (n=44) 39 (88.6) 5 (11.4) 44 (100) 0 (0) 43 (97.7) 1 (2.3) 36 (81.8) 8 (18.2) 42 (95.5) 2 (4.5)
Occasional (n=80) 52 (65) 28 (35) 78 (97.5) 2 (2.5) 64 (80) 16 (20) 37 (46.2) 43 (53.8) 67 (83.7) 13 (16.3)
Regular (n=44) 23 (52.3) 21 (47.7)** 40 (90.9) 4 (9.1)† 31 (70.5) 13 (29.5)** 18 (40.9) 26 (59.1)*** 31 (70.5) 13 (29.5)**
Total hemoglobin (g/dl)a 8.8 (1.7) 8.7 (1.3) 8.7 (2) 8.7 (1.3) 8.8 (1.7) 8.6 (1.3) 8.9 (1.7) 8.6 (1.5) 8.8 (1.6) 8.8 (1.5)
Fetal hemoglobin (%)a 38.3 (31.3) 35.4 (31) 40 (58.9) 35 (44.2) 42.8 (31.2) 53.5 (29.5) 40 (30.1) 50.1 (30.9)† 42.9 (31.5) 54.5 (26.7)
Platelet count (x109/l)a 602.8 (370.2) 625 (283.9) 608 (542.5) 520 (295) 611.5 (360.2) 600 (279.4) 571.1 (369.4) 652.9 (314.1) 588 (348.9) 713.3 (317.1)†
NRBC count (x106/l)c 325 (817) 11130 (25004)** 395 (9170) 9030 (16830) 342 (9073) 900 (13786) 310 (1668) 548.5 (14295) 400 (12300) 570 (8980)
Serum ferritin (ng/ml)c 617.5 (670) 1465 (1265)*** 773 (982) 831 (548) 749.3 (961) 999.5 (850) 596.5 (724) 1019 (973.5)* 747.8 (889) 978 (1004) LIC, liver iron concentration; dw, dry weight; Hb, NRBC, nucleated red blood cell. Data presented as amean (SD) [except for heart failure and diabetes mellitus median (IQR) was used], bn (%), or cmedian (IQR). All correlations evaluated by the independent samples t-test and the Chi-square test except for heart failure and diabetes mellitus where correlations were evaluated by the Mann-Whitney U test and the Fisher’s exact test. †, P<0.1; *, P<0.05; **, P<0.01; ***, P<0.001.
DOI: 10.3324/haematol.2011.047852

Supplement 2. Multivariate logistic regression to determine independent risk factors for morbidities (Part 1).
Morbidity
Extramedullary hematopoiesis Leg ulcers Thrombosis Pulmonary hypertension Heart failure Variable
AOR 95% CI AOR 95% CI AOR 95% CI AOR 95% CI AOR 95% CI
LIC, 1 mg Fe/g dw increase 1.01 0.94-1.08 1.04 0.99-1.10 1.12 1.05-1.20 1.08 1.02-1.14 1.06 0.97-1.16
Age, 1 year increase -- -- -- -- 1.04 1.01-1.07 1.05 1.02-1.09 -- --
Gender
Female 1.00 Referent 1.00 Referent 1.00 Referent 1.00 Referent 1.00 Referent
Male -- -- -- -- 0.35 0.16-0.81 -- -- -- --
Splenectomized
No 1.00 Referent 1.00 Referent 1.00 Referent 1.00 Referent 1.00 Referent
Yes -- -- -- -- 5.82 1.77-19.19 2.99 1.20-7.44 -- --
Transfusion
No 1.00 Referent 1.00 Referent 1.00 Referent 1.00 Referent 1.00 Referent
Yes 1.81 1.07-3.08 2.01 1.17-3.47 -- -- -- -- -- --
Total Hb, 1g/dl increase -- -- -- -- -- -- -- -- -- --
Fetal Hb, 1% increase -- -- -- -- -- -- -- -- -- --
Platelet count, x109/l increase -- -- -- -- -- -- -- -- 0.992 0.986-0.998
NRBC count, x106/l increase -- -- -- -- -- -- -- -- -- --
Ferritin, 100 ng/ml increase -- -- -- -- -- -- -- -- -- -- AOR, adjusted odds ratio; CI, confidence interval; LIC, liver iron concentration; dw, dry weight; Hb, hemoglobin; NRBC, nucleated red blood cell. Model was built using forward-stepwise selection. P≤0.1 was used as the criterion for inclusion. Multicolinearity was absent in the model as evident from a Variation Inflation Factor ≤3 (acceptable limit up to 10).
DOI: 10.3324/haematol.2011.047852

Supplement 2. Multivariate logistic regression to determine independent risk factors for morbidities (Part 2).
Morbidity
Abnormal liver function Diabetes mellitus Hypothyrodism Osteoporosis Hypogonadism Variable
AOR 95% CI AOR 95% CI AOR 95% CI AOR 95% CI AOR 95% CI
LIC, 1 mg Fe/g dw increase 1.05 0.97-1.13 0.92 0.78-1.07 1.05 1.01-1.11 1.10 1.04-1.16 1.10 1.03-1.16
Age, 1 year increase 1.09 1.05-1.14 -- -- -- -- 1.05 1.02-1.08 -- --
Gender
Female 1.00 Referent 1.00 Referent 1.00 Referent 1.00 Referent 1.00 Referent
Male -- -- -- -- -- -- -- -- -- --
Splenectomized
No 1.00 Referent 1.00 Referent 1.00 Referent 1.00 Referent 1.00 Referent
Yes -- -- -- -- -- -- 3.67 1.57-8.55 -- --
Transfusion
No 1.00 Referent 1.00 Referent 1.00 Referent 1.00 Referent 1.00 Referent
Yes -- -- 5.49 1.21-24.85 2.54 1.34-4.84 -- -- 2.97 1.39-6.35
Total Hb, 1g/dl increase -- -- -- -- -- -- -- -- -- --
Fetal Hb, 1% increase -- -- -- -- -- -- -- -- -- --
Platelet count, x109/l increase -- -- -- -- -- -- -- -- -- --
NRBC count, x106/l increase -- -- -- -- -- -- -- -- -- --
Ferritin, 100 ng/ml increase 1.14 1.06-1.23 -- -- -- -- -- -- -- -- AOR, adjusted odds ratio; CI, confidence interval; LIC, liver iron concentration; dw, dry weight; Hb, hemoglobin; NRBC, nucleated red blood cell. Model was built using forward-stepwise selection. P≤0.1 was used as the criterion for inclusion. Multicolinearity was absent in the model as evident from a Variation Inflation Factor ≤3 (acceptable limit up to 10).
DOI: 10.3324/haematol.2011.047852