Elevated CO 2 increases photosynthesis, biomass and productivity, and modifies gene expression in...
12
Elevated CO 2 increases photosynthesis, biomass and productivity, and modifies gene expression in sugarcane AMANDA PEREIRA DE SOUZA 1 , MARILIA GASPAR 3 , EMERSON ALVES DA SILVA 3 , EUGÊNIO CÉSAR ULIAN 4 , ALESSANDRO JAQUIEL WACLAWOVSKY 2 , MILTON YUTAKA NISHIYAMA JR. 2 , RENATO VICENTINI DOS SANTOS 5 , MARCELO MENOSSI TEIXEIRA 5 , GLAUCIA MENDES SOUZA 2 & MARCOS SILVEIRA BUCKERIDGE 1 1 Departamento de Botânica, Instituto de Biociências and 2 Departamento de Bioquímica, Instituto de Química, Universidade de São Paulo, São Paulo, Brazil, 3 Seção de Fisiologia e Bioquímica de Plantas, Instituto de Botânica, São Paulo, Brazil, 4 Centro de Tecnologia Canavieira, Piracicaba, Brazil and 5 Centro de Biologia Molecular e Engenharia Genética, Universidade Estadual de Campinas, Campinas, São Paulo, Brazil ABSTRACT Because of the economical relevance of sugarcane and its high potential as a source of biofuel, it is important to understand how this crop will respond to the foreseen increase in atmospheric [CO2]. The effects of increased [CO2] on photosynthesis, development and carbohydrate metabolism were studied in sugarcane (Saccharum ssp.). Plants were grown at ambient (~370 ppm) and elevated (~720 ppm) [CO2] during 50 weeks in open-top chambers. The plants grown under elevated CO2 showed, at the end of such period, an increase of about 30% in photosynthesis and 17% in height, and accumulated 40% more biomass in comparison with the plants grown at ambient [CO2]. These plants also had lower stomatal conductance and transpira- tion rates (-37 and -32%, respectively), and higher water- use efficiency (c.a. 62%). cDNA microarray analyses revealed a differential expression of 35 genes on the leaves (14 repressed and 22 induced) by elevated CO2. The latter are mainly related to photosynthesis and development. Industrial productivity analysis showed an increase of about 29% in sucrose content. These data suggest that sugarcane crops increase productivity in higher [CO2], and that this might be related, as previously observed for maize and sorghum, to transient drought stress. Key-words:C4 photosynthesis; cDNA microarrays; CO2 enrichment; energy; sucrose. INTRODUCTION It is now widely accepted that the atmospheric CO2 has been increasing continuously during the last two centuries mainly because of increased emissions associated with burning of fossil fuel and deforestation. The measurements confirm that the atmospheric mixing ratio of CO2 has increased globally by about 100 ppm (36%) over the last 250 years, from 280 ppm in pre-industrial era to 379 ppm in 2005. As a result, it is predicted that CO2 concentration ([CO2]) may reach 730–1020 ppm towards the end of the 21st century (Solomon et al. 2007). The increase in the concentration of atmospheric CO2 is likely to have a significant effect on plant photosynthesis, metabolism and development (e.g. Nowak, Ellsworth & Smith 2004; Ainsworth & Long 2005). Because of anatomi- cal and functional differences between C3 and C4 species, and the higher [CO2] in the bundle sheath cells of C4 leaves, some authors assumed that C4 photosynthesis was saturated at ambient [CO2], and that C4 plants would be less affected (or not at all) by increased [CO2] than C3 plants (Pearcy & Ehleringer 1984; Bowes 1993). However, over the last decade, many authors reported that the differences between C3 and C4 species are not as important as expected, and that C4 plants can also increase significantly their pho- tosynthetic rates in elevated [CO2]. Studying several C4 weeds and crop responses under elevated CO2, Ziska & Bunce (1997) reported a 3–25% increase in growth and a 4–30% stimulation of photosynthesis. Wand et al. (1999) carried out a literature review and meta-analysis with wild grasses, and showed that C4 and C3 species increased total biomass significantly in elevated CO2 by 33 and 44%, respectively. Maroco, Edwards & Ku (1999) showed that maize plants grown under a threefold ambient CO2 level accumulated ca. 20% more biomass and 23% more leaf area. Furthermore, sorghum grown under free-air carbon enrichment (FACE) conditions exhibited an increase in photosynthesis in young leaves in elevated [CO2] (Cousins et al. 2001). Some reasons are thought to explain the positive responses of C4 plants to elevated [CO2]: (1) direct effect on ribulose 1·5-bisphosphate carboxylase/oxygenase (Rubisco) CO2 saturation (Ziska & Bunce 1997); (2) bundle sheath leakiness (Watling, Press & Quick 2000); (3) C3-like photosynthesis in young C4 leaves (Ziska, Sicher & Bunce 1999; Cousins et al. 2003); (4) reduction on stomatal aper- ture, which can improve water-use efficiency (WUE) and physiological performance under a short-term drought Correspondence: M. S. Buckeridge. Fax +55 11 30917547; e-mail: [email protected] Plant, Cell and Environment (2008) 31, 1116–1127 doi: 10.1111/j.1365-3040.2008.01822.x © 2008 The Authors Journal compilation © 2008 Blackwell Publishing Ltd 1116
Transcript of Elevated CO 2 increases photosynthesis, biomass and productivity, and modifies gene expression in...

Elevated CO2 increases photosynthesis, biomass andproductivity, and modifies gene expression in sugarcane
AMANDA PEREIRA DE SOUZA1, MARILIA GASPAR3, EMERSON ALVES DA SILVA3, EUGÊNIO CÉSAR ULIAN4,ALESSANDRO JAQUIEL WACLAWOVSKY2, MILTON YUTAKA NISHIYAMA JR.2,RENATO VICENTINI DOS SANTOS5, MARCELO MENOSSI TEIXEIRA5, GLAUCIA MENDES SOUZA2 &MARCOS SILVEIRA BUCKERIDGE1
1Departamento de Botânica, Instituto de Biociências and 2Departamento de Bioquímica, Instituto de Química, Universidadede São Paulo, São Paulo, Brazil, 3Seção de Fisiologia e Bioquímica de Plantas, Instituto de Botânica, São Paulo, Brazil,4Centro de Tecnologia Canavieira, Piracicaba, Brazil and 5Centro de Biologia Molecular e Engenharia Genética,Universidade Estadual de Campinas, Campinas, São Paulo, Brazil
ABSTRACT
Because of the economical relevance of sugarcane and itshigh potential as a source of biofuel, it is important tounderstand how this crop will respond to the foreseenincrease in atmospheric [CO2]. The effects of increased[CO2] on photosynthesis, development and carbohydratemetabolism were studied in sugarcane (Saccharum ssp.).Plants were grown at ambient (~370 ppm) and elevated(~720 ppm) [CO2] during 50 weeks in open-top chambers.The plants grown under elevated CO2 showed, at the end ofsuch period, an increase of about 30% in photosynthesisand 17% in height, and accumulated 40% more biomass incomparison with the plants grown at ambient [CO2]. Theseplants also had lower stomatal conductance and transpira-tion rates (-37 and -32%, respectively), and higher water-use efficiency (c.a. 62%). cDNA microarray analysesrevealed a differential expression of 35 genes on the leaves(14 repressed and 22 induced) by elevated CO2. The latterare mainly related to photosynthesis and development.Industrial productivity analysis showed an increase of about29% in sucrose content. These data suggest that sugarcanecrops increase productivity in higher [CO2], and that thismight be related, as previously observed for maize andsorghum, to transient drought stress.
Key-words: C4 photosynthesis; cDNA microarrays; CO2
enrichment; energy; sucrose.
INTRODUCTION
It is now widely accepted that the atmospheric CO2 hasbeen increasing continuously during the last two centuriesmainly because of increased emissions associated withburning of fossil fuel and deforestation. The measurementsconfirm that the atmospheric mixing ratio of CO2 hasincreased globally by about 100 ppm (36%) over the last
250 years, from 280 ppm in pre-industrial era to 379 ppm in2005. As a result, it is predicted that CO2 concentration([CO2]) may reach 730–1020 ppm towards the end of the21st century (Solomon et al. 2007).
The increase in the concentration of atmospheric CO2 islikely to have a significant effect on plant photosynthesis,metabolism and development (e.g. Nowak, Ellsworth &Smith 2004; Ainsworth & Long 2005). Because of anatomi-cal and functional differences between C3 and C4 species,and the higher [CO2] in the bundle sheath cells of C4 leaves,some authors assumed that C4 photosynthesis was saturatedat ambient [CO2], and that C4 plants would be less affected(or not at all) by increased [CO2] than C3 plants (Pearcy& Ehleringer 1984; Bowes 1993). However, over thelast decade, many authors reported that the differencesbetween C3 and C4 species are not as important as expected,and that C4 plants can also increase significantly their pho-tosynthetic rates in elevated [CO2]. Studying several C4
weeds and crop responses under elevated CO2, Ziska &Bunce (1997) reported a 3–25% increase in growth and a4–30% stimulation of photosynthesis. Wand et al. (1999)carried out a literature review and meta-analysis with wildgrasses, and showed that C4 and C3 species increased totalbiomass significantly in elevated CO2 by 33 and 44%,respectively. Maroco, Edwards & Ku (1999) showed thatmaize plants grown under a threefold ambient CO2 levelaccumulated ca. 20% more biomass and 23% more leafarea. Furthermore, sorghum grown under free-air carbonenrichment (FACE) conditions exhibited an increase inphotosynthesis in young leaves in elevated [CO2] (Cousinset al. 2001).
Some reasons are thought to explain the positiveresponses of C4 plants to elevated [CO2]: (1) direct effecton ribulose 1·5-bisphosphate carboxylase/oxygenase(Rubisco) CO2 saturation (Ziska & Bunce 1997); (2) bundlesheath leakiness (Watling, Press & Quick 2000); (3) C3-likephotosynthesis in young C4 leaves (Ziska, Sicher & Bunce1999; Cousins et al. 2003); (4) reduction on stomatal aper-ture, which can improve water-use efficiency (WUE) andphysiological performance under a short-term drought
Correspondence: M. S. Buckeridge. Fax +55 11 30917547; e-mail:[email protected]
Plant, Cell and Environment (2008) 31, 1116–1127 doi: 10.1111/j.1365-3040.2008.01822.x
© 2008 The AuthorsJournal compilation © 2008 Blackwell Publishing Ltd1116

stress, and/or increase the leaf temperature, providing theoptimal temperature for photosynthesis (Ghannoum et al.2000).
Although most of the C4 plants are thought to be able torespond to higher [CO2], recent studies with sorghum andmaize showed only slightly significant differences in photo-synthesis, biomass or grain production of well-watered andfertilized plants. However, these effects were observedwhen they were submitted to drought (Ottman et al. 2001;Leakey et al. 2006). On the other hand, Vu, Allen & Gesch(2006) observed an increase in sugarcane photosynthesisgrown under elevated [CO2]. These authors studied theresponse of single sugarcane leaves under elevated [CO2]and well-watered conditions. They found significant effectson gas exchanges, photosynthetic enzyme activities, sucrosemetabolism, protein and chlorophyll contents.
Sugarcane is one of the world’s major food-producing C4
crops. It provides about 75% of the sugar harvested forhuman consumption (Food and Agriculture Organizationstatistics). More recently, sugarcane has also becomewidely known as one of the central plant species foruse in the production of energy and ethanol as a biofuel(Goldenberg 2007).
Brazil is one of the largest worldwide producer of sugar-cane as it produced 426 million tons in the period of2006/2007 (Sugar Cane Industry Union–UNICA 2007).Sugarcane stems were processed to produce 17.7 millions ofcubic meters of ethanol. The growth period of sugarcanetakes place within 1 or one-half year depending on theplanting season. Its maturation period, in which growth rateand photosynthesis decrease and sucrose accumulationoccurs in the stem, happens approximately after 35 weeks ofplanting (Doorembos & Kassam 1979).
In 2001, a Brazilian consortium (SUCEST) (http://sucest.lad.ic.unicamp.br/public) sequenced and annotated238 000 sugarcane expressed sequence tags (ESTs)derived from 26 cDNA libraries. The sequences wereassembled into 43 141 contigs or sugarcane assembledsequences (SASs) covering an estimated 90% of theexpressed genome (Vettore et al. 2003). The SUCEST-FUN Project (http://sucest-fun.org) annotated over 6000genes related to sugarcane metabolism, signal transduc-tion, transcription, development, cell cycle, stressresponses, hormone biosynthesis and pathogen interaction(Souza et al. 2001; Papini-Terzi et al. 2005). For the presentwork, an array was designed with 4594 unique elements,which cover all main categories of general metabolismincluding carbohydrate, protein, nucleic acid, amino acids,to name but a few.
Because of the importance of sugarcane as a source ofrenewable energy (Goldenberg 2007), it is essential tounderstand how this crop will respond to the increase of[CO2] expected to occur in this century. In this work, weshall focus on the photosynthesis and development of sug-arcane plants grown under ambient (370 ppm) and elevated(720 ppm) atmospheric [CO2] throughout 50 weeks, andthese physiological parameters are correlated with changesin transcript abundance of genes. This is followed by a
discussion on the putative impact of these changes in per-formance on sugarcane productivity.
MATERIAL AND METHODS
Plant material and growth conditions
Sugarcane plants (Saccharum officinarum L. cv. SP80–3280)were grown in pots containing appropriated soil moisturesupplied by Centro de Tecnologia Canavieira (CTC – whichis one of the most important research centre in sugarcane inSão Paulo, and establishes the varieties and the standardsfor most of the crops in the state) in the open-top chambers(OTCs) system. The experiment was conducted for 50weeks (April 2005 to March 2006) in the Instituto deBotânica (23°38′S, 46°38′W), São Paulo, Brazil, undernatural environmental conditions. Meteorological data(Fig. 1) were taken from the automatic weather station atthe Instituto de Astronomia, Geofísica e Ciências Atmos-féricas (University of São Paulo), located about 1 km awayfrom our experimental field.
Four 3.5 m height ¥ 1.5-m-diameter OTCs were designedas described by Aidar et al. (2002); the two were kept underelevated [CO2] (720 ppm) while the other two chambersprovided a current ambient [CO2] (370 ppm). Sugarcane
0
5
10
15
20
25
30
Air tem
pera
ture
, ºC
Tmax
Tmean
Tmin
30
40
50
60
70
80
90
100
A M J J A S O N D J F M
Months
Re
lative
hu
mid
ity,
%
RHmax
RHmean
RHmín
Figure 1. Montly report of air temperature and relativehumidity from the Instituto de Astronomia, Geofísica e CiênciasAtmosféricas, University of São Paulo, between April 2005 andMarch 2006. RH, relative humidity.
Elevated CO2 in sugarcane 1117
© 2008 The AuthorsJournal compilation © 2008 Blackwell Publishing Ltd, Plant, Cell and Environment, 31, 1116–1127

plants from the variety SP80-3280, the same sequenced bySUCEST Project (Vettore et al. 2003), were propagated bystalk cuttings (single-node stem cutting containing a vegeta-tive bud) that were selected based on its fresh mass weightbefore planting. On April 2005, 24 0.036 m3 pots with fourstalk cuttings each were equally distributed into the OTCs.The CO2 treatment started 13 d after planting. After 31weeks, the plants were transferred to larger pots (0.109 m3)to avoid root growth limitation.
To normalize microenvironmental differences because ofthe position of the pot in different OTCs, the pots werechanged biweekly between chambers having the same[CO2]. Soil moisture was monitored with tensiometers,which were checked daily, and enough water was added toprevent soil water tensions above 20 kPa.This level of waterwas maintained to guarantee that no water stress wasimposed to the plants, as sugarcane plants are not sensitiveto drought conditions when growing in the field with ten-sions between 100 and 200 kPa (Gascho & Shih 1983). Fur-thermore, no symptoms of water stress of any kind wereobserved during our experiments. The fertilizer (NPK10:10:10) was added before planting and complemented asrecommended by the CTC at Piracicaba, São Paulo.
Leaf gas exchange, growth and biomass
The net leaf CO2 assimilation rate (A), stomatal conduc-tance (gs) and transpiration (E) measurements were madeat the middle portion of the first leaf with a visible dewlap(leaf +1), from 10:00 to 12:00 h with 1500 mmol m-2 s-1 pho-tosynthetic photon flux density (PPFD), using a portablephotosynthesis system (LI-6400; Li-Cor, Lincoln, NE,USA). The measurements were carried out in all plants at6, 10, 13, 18, 21, 26, 31 and 50 weeks of treatment. After22 weeks, we noticed that the light saturation turned toa slightly higher level. However, in order to be able tocompare data from all the experiment, we maintainedthe measurements at 1500 mmol m-2 s-1 PPFD. Light(AxPPFD) response curves were performed at the 22ndand 50th weeks under ambient and elevated atmospheric[CO2] from 10:00 to 12:00 h on leaf +1, and fitting wasperformed according to von Caemmerer (2000).
Plant height data were obtained from the root-shoottransition to the tip of younger leaf (at the top of the plant),in all plants, at the same periods described earlier. Thebiomass of plant parts (leaves, stems and roots) were deter-mined for six plants of each treatment, which were har-vested at 13, 22, 26, 31 and 50 weeks, and dried in an oven at60 °C until a constant weight was reached.
Gene expression analysis
To obtain gene expression patterns and identify differen-tially expressed genes, cDNA microarrays representing 3598genes were co-hybridized to fluorescently labelled probesgenerated from the control and high [CO2] plants.The greatmajority of the genes was selected from the SugarcaneMetabolism (SUCAMET) Database. Some of them
correspond to sugarcane signal transduction genes indexedin the Sugarcane Signal Transduction (SUCAST) Database.Both catalogues can be found at http://sucest-fun.org.Two biological replicates were used for each microarrayexperiment.
Polymerase chain reaction amplification andarray printing
cDNA microarray experiments were conducted as reportedpreviously (Papini-Terzi et al. 2005). Sugarcane cDNAplasmid clones obtained from the SUCEST collection werere-arranged and amplified directly from bacterial clones inculture, using T7 and SP6 primers. The 4594 unique genesyielded 3598 good-quality polymerase chain reaction (PCR)fragments. Samples were visualized on 1% agarose gels tocheck for amplicon presence, specificity and quantity. ThePCR products were purified by filtration using 96 well filterplates (Millipore Multiscreen, Billerica, MA, USA). Thepurified PCR products were mixed with an equal volume ofdimethyl-sulfoxide (DMSO) in 384 well V-bottom plates.Microarrays were constructed by arraying cDNA fragmentson DMSO-optimized, metal-coated glass slides (type 7; GEHealthcare,Westborough, MA, USA) using the GenerationIII Microarray Spotter (Molecular Dynamics, Sunnyvale,CA, USA). Each cDNA fragment was spotted on the slidesat least twice (i.e. technical replicates). Following printing,the slides were allowed to dry, and the spotted DNA wasbound to the slides by UV cross-linking (50 mJ).
Tissue sampling and RNA extraction
The entire leaves (leaf +1) were harvested at the sameweeks as described earlier to biomass determination, imme-diately frozen in liquid N2, and stored at -80 °C. Threeplants from the same pot were sampled from each OTC,amounting to six plants per treatment. Two hundred milli-grams of leaf tissue was ground to a fine powder in a mortarand pestle with liquid N2. Total RNA was isolated usingTrizol reagent (Invitrogen, Carlsbad, CA, USA) accordingto the manufacturer’s instructions. RNA pellets were dis-solved in 30 mL sterile deionized water. RNA samples werequantified in a spectrophotometer and were loaded on 1%agarose gel for visual quality inspection.
Hybridization and selection of differentiallyexpressed genes
Fifteen micrograms of total RNA were reverse transcribed,labelled and hybridized using the reagents provided withthe CyScribe Post-Labeling kit (GE Healthcare) accordingto the manufacturer’s instructions. The products of thelabelling reactions were purified in Millipore Multiscreenfiltering plates to remove unincorporated labelled nucle-otides. Microarrays were co-hybridized with the fluores-cently labelled probes. Two biological replicates weresampled for high CO2 treatment (E1 and E2) and forcontrol (C1 and C2) experiments. Hybridizations were per-formed overnight at 42 °C in humid chambers. The slides
1118 A. P. de Souza et al.
© 2008 The AuthorsJournal compilation © 2008 Blackwell Publishing Ltd, Plant, Cell and Environment, 31, 1116–1127

were then washed in 1 ¥ SSC (150 mm sodium chloride,15 mm sodium citrate) and 0.2% sodium dodecyl sulphate(SDS) (10 min, 55 °C), twice in 0.1 ¥ SSC and 0.2% SDS(10 min, 55 °C), and in 0.1 ¥ SSC (1 min, room tempera-ture). The slides were rinsed briefly in filtered deionizedwater and were dried with a nitrogen stream. The slideswere scanned using the Generation III Scanner (MolecularDynamics) adjusting the photomultiplier tube to 700 forboth channels.
Images were processed and data collected by ArrayVi-sion (Imaging Research Inc., St. Catharines, Ontario,Canada) software. Local median background was sub-tracted from the median-based trimmed mean density foreach spot, as in Papini-Terzi et al. (2005). Data from clonesthat generated poor-quality PCR fragments (no amplifica-tion or unspecific bands), or relative to saturated, low-intensity or poor-quality spots (visually inspected) wereexcluded. The fluorescence ratios were visualized and nor-malized in the MxS space, where M is the base 2 logarithmof the intensities ratio, and S is the base 2 logarithm of theaverage intensity of each spot. The M values were normal-ized to account for systematic errors using the LOWESSfitting (Yang et al. 2002).
To define differential expression, we used the outlierssearching method (Koide et al. 2006). We defined as differ-entially expressed a gene that has at least 70% of theirreplicate points above or below the cutoff curve in the twohybridizations of the biological versus control samples,indicating a reproducible result between the biologicalreplicates.
Validation of microarray results by reversetranscription-PCR
Five micrograms of total RNA was treated with DNase(Invitrogen) according to the manufacturer’s instructions.Reverse transcription (RT)-PCR reactions were performedin triplicate and contained 0.80 mL of a 1:5 dilution of thesynthesized cDNA, primers to a final concentration of600 nM each, 10 mL of the SYBR Green PCR Master Mixand PCR-grade water to a total volume of 20 mL. Theparameters for the PCR reaction were 50 °C for 2 min,95 °C for 10 min, 40 cycles of 95 °C for 15 s, and 60 °C for1 min. The specificity of the amplified products was evalu-ated by the analysis of the generated dissociation curves. Notemplate controls and no amplification controls were run inorder to confirm the absence of genomic DNA or reagentcontamination.The relative expression ratio (experimental/control) was determined based on the 2-DDCt method (Livak& Schmittgen 2001). To access the statistical significance ofthe expression ratios, we assumed a log-normal model,and calculated the probability Pr(sample>reference) andPr(sample<reference) for up- and down-regulated genes,respectively. The expression profile was considered vali-dated when P � 0.95.
Eleven genes were selected in order to have their expres-sion data validated by quantitative RT-PCR. The primersdesigned for these genes and the statistical analysis
[probability Pr(sample>reference) and Pr(sample<reference) for up- and down-regulated genes, respectively]of the data are shown in Supplementary Table S1. As refer-ence genes for normalization, we used a GAPDH gene thathas been described as a good reference for sugarcanetissues and genotypes (Iskandar et al. 2004).
Sugar and fiber productivity measurements andcellulose content
Stems from eight plants of each treatment were collectedand processed at the CTC. The stems were homogenized,and 500 g of each sample was weighed and pressed during1 min under 250 kgf cm-2.
For determining the sucrose content, 200 mL of the waterextract was homogenized in a clarifying mixture with theaddition of 8–10 g of aluminum chloride. The homogenatewas filtered through a filter paper. The clear filtrate hadits sucrose content determined with a continuous fluxpolarimeter.
Cellulose was determined in 13- and 22-week-old plantsas follows. Two hundred milligrams of freeze-dried materi-als was extracted six times with 80% ethanol at 80 °C toremove soluble sugars. Twenty milliliters of DMSO 90%was added to the pellet, and the suspension was stirred for24 h to remove starch. The cell-wall material was extractedtwice in 20 mL of aqueous 0.5% ammonium oxalate(pH 7.0) at 100 °C for 1 h each. For lignin digestion, 30 mLof an aqueous solution containing 3% sodium chlorite (w/v)and 0.3% acetic acid (v/v) was added to the pellet, and theextraction was performed as described by Carpita (1984).The remaining cell-wall material was extracted sequentiallywith 0.2 m NaOH and then with 4 m NaOH solutions (bothcontaining 3 mg mL-1 NaBH4). At each stage, the materialwas pelleted by centrifugation at 2500 g during 15 min, andwas washed twice with distilled water. Insoluble materialwas neutralized with glacial acetic acid, washed twice withwater, and digested in acetic-nitric acid at 100 °C for 1 h.The cellulose was washed several times in water, freeze-dried and weighed (Gorshokova et al. 1996).
Statistical analysis
The comparison between the means of ambient andelevated [CO2] treatments in all parameters was made byusing the independent Student t-test by the softwareWinSTAT for Excel, version 2001.1, Robert Fitch (BadKrozingen, Germany).
RESULTS
Leaf gas exchange, growth and biomass
The average plant growth in elevated [CO2] showed anincreased photosynthetic rate (35%) between the 6th andthe 22nd weeks (Fig. 2). After this period, a decrease wasobserved until the 31st week. After 50 weeks, the differencebetween ambient and elevated [CO2] reached 30%. It canbe noted that the maximum difference (ca. 60%) occurred
Elevated CO2 in sugarcane 1119
© 2008 The AuthorsJournal compilation © 2008 Blackwell Publishing Ltd, Plant, Cell and Environment, 31, 1116–1127

at the 13th week, which is the inflexion point of therising period of assimilation. Stomatal conductance (gs)decreased, on average, by 37% in elevated [CO2] (Table 1).Consequently, WUE was 62% higher in these plants (datanot shown). Under elevated [CO2], the ratio Ci/Ca wasgreater than ambient [CO2] at the first 13 weeks andtowards the end of the experiment (Table 1).
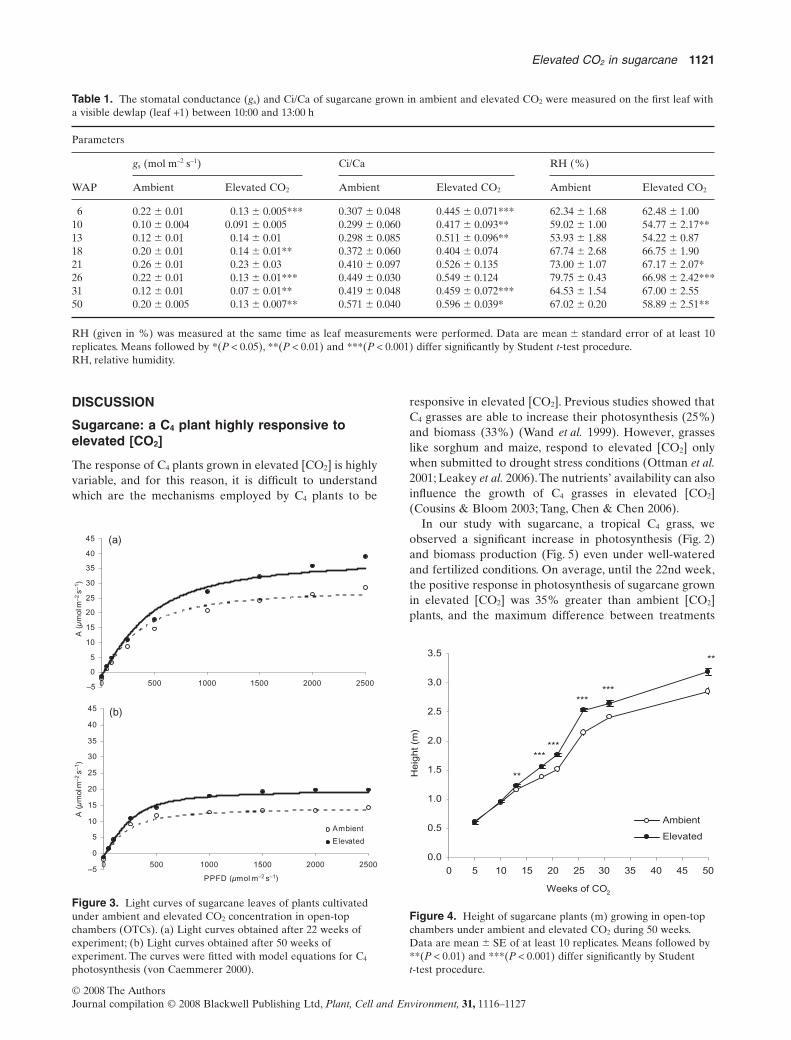
The light curves, carried out at 22 (Fig. 3a) and 50(Fig. 3b) weeks after planting, showed significant differ-ences between ambient and elevated [CO2]. Net photosyn-thesis rate (A) of sugarcane leaves in response to light wasca. 32% higher at elevated [CO2] in comparison with theplants growing under ambient [CO2]. Furthermore, Asat wasgreater in elevated [CO2] when compared with ambient[CO2] in both measurements (35.14 mmol m-2 s-1 versus26 mmol m-2 s-1 at 22 weeks, and 17.9 mmol m-2 s-1 versus13 mmol m-2 s-1 at 50 weeks).
Differences between ambient and elevated [CO2] werevisible at PPDF from 500 to 2500 mmol m-2 s-1. Leaves of50-week-old plants showed a decrease in photosynthesisrate and light saturation point in relation to 22-week-oldplants (Fig. 3a, b) in both treatments.
Elevated [CO2] stimulated plant height by ca. 17%(Fig. 4). At all dates of harvesting, the total biomass wasgreater in elevated [CO2] plants, but the difference wassignificant only after 13, 31 and 50 weeks (Fig. 5a). Thispositive response was related to an enhancement in leaf(Fig. 5b) and stem biomass (Fig. 5c). By the 31st week, anincrease of about 295% was observed in stem biomass inelevated [CO2] when compared with ambient [CO2]. Atthe final harvest (after 50 weeks), the enhancement in thetotal biomass, leaf biomass and stem biomass was 40, 25 and60% higher, respectively. No significant differences wereobserved for root biomass (data not shown).
Gene expression analysis
A database containing all the SAS catalogued in theSUCEST-FUN Project and the expression data obtained inthis work was constructed and is available at the SUCEST-FUN Database website (http://sucest-fun.org).
In order to carry out expression analysis, plants wereharvested when the higher differences in assimilation rates(13th week) and growth (22nd week) were observedbetween the control and treated plants (Figs 2 & 4). Atthese points, microarray analyses indicated genes thatwere up- or down-regulated in leaves. A total of 33 geneswere identified as differentially expressed in at least oneof the samples analysed. Table 2 lists the differentialexpression (induction or repression) observed for eachSAS in each sample as well as the correspondingSUCAMET categories. Nine genes were differentiallyexpressed (6 induced and 3 repressed) in the leaves of13-week-old plants, whereas 25 (14 induced and 11repressed) were differentially expressed in the leaves of22-week-old plants, with the same gene (glucose-6-phosphate dehydrogenase) showing different patterns atthe 13th and 22nd weeks. We found only three no-matchesthat responded to elevated [CO2]. The log2 ratio (M)values for the valid elements represented in SUCEST-FUN array for all experiments are shown in Supplemen-tary Table S2 (https://sucestfun.cbmeg.unicamp.br/pub/CO2).
When genes were grouped by functional categories(Table 2), and analysed from the stand point of inductionor repression, it was possible to observe that the up-regulated genes are in the categories of photosynthesis,carbohydrate, protein, lipid and nucleic acid metabolism,whereas transcription factors and stress response geneswere down-regulated.
Eleven out of the 33 genes differentially expressed werechosen for validation by RT-PCR and the expressionpattern was confirmed for seven genes (Fig. 6). The choiceof genes to be validated was based on their relevance forthe physiological processes analysed in this work. Thus, thechosen genes belong to categories with a known role inphotosynthesis (subunit N of the reaction centre of PSI,protein K of PSII, ferredoxin I), carbohydrate metabolism(cell wall invertase, glucose-6-phosphate dehydrogenaseand beta-glucosidase) and one related to protein metabo-lism (translation factor).
Sucrose, ligno-cellulosic material andcellulose contents
Sucrose content in leaves increased about 29% (2.18%versus 2.82%, P = 0.025) in elevated [CO2] plants, while thecontent of ligno-cellulosic material showed only a slightdifference (6.62% versus 7.13% P = 0.089). No differencewas observed in the cellulose content for 13-week-oldplants, but at 22 weeks, the content was 19% higher (16.5%versus 19.5%, P = 0.034) under elevated [CO2].
0
5
10
15
20
25
30
35
40
0 5 10 15 20 25 30 35 40 45 50
Weeks of CO2
CO
2 a
ssim
ilatio
n (
µm
ol C
O2
m–
2 s
–1)
Ambient
Elevated
**
****
***
Figure 2. Photosynthesis of sugarcane plants growing inopen-top chambers under ambient and elevated CO2 during 50weeks. Assimilation was measured on the first leaf with a visibledewlap (leaf +1) between 1000 and 1300 h. Data are mean � SEof at least 10 replicates. Means followed by *(P < 0.05) and**(P < 0.001) differ significantly by Student t-test procedure.
1120 A. P. de Souza et al.
© 2008 The AuthorsJournal compilation © 2008 Blackwell Publishing Ltd, Plant, Cell and Environment, 31, 1116–1127
DISCUSSION
Sugarcane: a C4 plant highly responsive toelevated [CO2]
The response of C4 plants grown in elevated [CO2] is highlyvariable, and for this reason, it is difficult to understandwhich are the mechanisms employed by C4 plants to be
responsive in elevated [CO2]. Previous studies showed thatC4 grasses are able to increase their photosynthesis (25%)and biomass (33%) (Wand et al. 1999). However, grasseslike sorghum and maize, respond to elevated [CO2] onlywhen submitted to drought stress conditions (Ottman et al.2001; Leakey et al. 2006).The nutrients’ availability can alsoinfluence the growth of C4 grasses in elevated [CO2](Cousins & Bloom 2003; Tang, Chen & Chen 2006).
In our study with sugarcane, a tropical C4 grass, weobserved a significant increase in photosynthesis (Fig. 2)and biomass production (Fig. 5) even under well-wateredand fertilized conditions. On average, until the 22nd week,the positive response in photosynthesis of sugarcane grownin elevated [CO2] was 35% greater than ambient [CO2]plants, and the maximum difference between treatments
Table 1. The stomatal conductance (gs) and Ci/Ca of sugarcane grown in ambient and elevated CO2 were measured on the first leaf witha visible dewlap (leaf +1) between 10:00 and 13:00 h
Parameters
WAP
gs (mol m–2 s–1) Ci/Ca RH (%)
Ambient Elevated CO2 Ambient Elevated CO2 Ambient Elevated CO2
6 0.22 � 0.01 0.13 � 0.005*** 0.307 � 0.048 0.445 � 0.071*** 62.34 � 1.68 62.48 � 1.0010 0.10 � 0.004 0.091 � 0.005 0.299 � 0.060 0.417 � 0.093** 59.02 � 1.00 54.77 � 2.17**13 0.12 � 0.01 0.14 � 0.01 0.298 � 0.085 0.511 � 0.096** 53.93 � 1.88 54.22 � 0.8718 0.20 � 0.01 0.14 � 0.01** 0.372 � 0.060 0.404 � 0.074 67.74 � 2.68 66.75 � 1.9021 0.26 � 0.01 0.23 � 0.03 0.410 � 0.097 0.526 � 0.135 73.00 � 1.07 67.17 � 2.07*26 0.22 � 0.01 0.13 � 0.01*** 0.449 � 0.030 0.549 � 0.124 79.75 � 0.43 66.98 � 2.42***31 0.12 � 0.01 0.07 � 0.01** 0.419 � 0.048 0.459 � 0.072*** 64.53 � 1.54 67.00 � 2.5550 0.20 � 0.005 0.13 � 0.007** 0.571 � 0.040 0.596 � 0.039* 67.02 � 0.20 58.89 � 2.51**
RH (given in %) was measured at the same time as leaf measurements were performed. Data are mean � standard error of at least 10replicates. Means followed by *(P < 0.05), **(P < 0.01) and ***(P < 0.001) differ significantly by Student t-test procedure.RH, relative humidity.
–5
0
5
10
15
20
25
30
35
40
45
0 500 1000 1500 2000 2500
–5
0
5
10
15
20
25
30
35
40
45
0 500 1000 1500 2000 2500
PPFD (µmol m–2 s–1)
A (
µm
ol m
–2
s–
1)
A (
µm
ol m
–2
s–
1)
Ambient
Elevated
(a)
(b)
Figure 3. Light curves of sugarcane leaves of plants cultivatedunder ambient and elevated CO2 concentration in open-topchambers (OTCs). (a) Light curves obtained after 22 weeks ofexperiment; (b) Light curves obtained after 50 weeks ofexperiment. The curves were fitted with model equations for C4
photosynthesis (von Caemmerer 2000).
0.0
0.5
1.0
1.5
2.0
2.5
3.0
3.5
0 5 10 15 20 25 30 35 40 45 50
Weeks of CO2
Heig
ht (m
)
Ambient
Elevated
**
***
******
**
***
Figure 4. Height of sugarcane plants (m) growing in open-topchambers under ambient and elevated CO2 during 50 weeks.Data are mean � SE of at least 10 replicates. Means followed by**(P < 0.01) and ***(P < 0.001) differ significantly by Studentt-test procedure.
Elevated CO2 in sugarcane 1121
© 2008 The AuthorsJournal compilation © 2008 Blackwell Publishing Ltd, Plant, Cell and Environment, 31, 1116–1127

was observed at 13 weeks (ca. 60%). These results wereconsistent with greater ratio Ci/Ca at elevated [CO2] plants(Table 1). In a previous study with sugarcane plants, Vuet al. (2006) showed that photosynthesis enhanced 20, 7 and10% at 7, 14 and 32 d after leaf emergence, respectively.These authors suggested an up-regulation of Rubisco andphosphoenolpyruvate carboxylase activities as well asseveral enzymes related to carbon metabolism. The signifi-cant increase in net photosynthesis rates of sugarcane
leaves under elevated [CO2] (Fig. 2) suggests, indirectly,that the same up-regulation observed by Vu et al. (2006)occurred in our experiments. In addition, our results showa clear positive response of photosynthesis to light(AxPPFD) in sugarcane plants grown in elevated [CO2](Fig. 3) with significant differences in comparison withplants at ambient CO2 condition. These findings are consis-tent with earlier works, which demonstrated that thephotosynthetic response of C4 species Flaveria trinervia,Panicum miliaceum and Panicum maximum to increasing[CO2] was also PPFD-dependent (Ziska et al. 1999).
After 22 weeks, photosynthesis decreased and no differ-ences were observed between treatments up to the 50thweek, probably because of acclimation related with rootgrowth limitation in pots in both elevated and ambient[CO2]. According to Arp (1991), a decrease in root sinkstrength because of growth limitation can result in lowerphotosynthetic rates. This restriction was eliminated bytransferring the plants to bigger pots, after which differ-ences of about 30% in photosynthesis between the controland treated plants were reestablished (Fig. 2). However, thedecrease in assimilation rates did not affect growth param-eters, as plant height and biomass continuously increased,and differences between ambient and elevated [CO2] weremaintained during all the experimental periods.
Many studies reported a decrease in stomatal con-ductance (gs) under elevated [CO2], which leads to thereduction in transpiration rates (E) and a consequentimprovement in WUE (Long et al. 2004; Ainsworth &Rogers 2007), which seems to be the principal effect in C4
grasses grown under these conditions (Ainsworth & Long2005). In sugarcane leaves, Vu et al. (2006) found anincrease of about 52% in WUE for plants grown underdouble-ambient [CO2], as a consequence of gs and E reduc-tion. In the present study, the gs was also reduced by 37%(Table 1) while the WUE increased by 62% (not shown).
Biomass production was significantly higher in elevated[CO2] for the whole plant, and the difference was mostsignificant when the stem biomass was analysed (Fig. 5c).Vuet al. (2006) observed an enhancement in total above-groundsugarcane plant and stem fresh weight in 44 and 55.5%,respectively.Nevertheless,under well-watered and fertilizedconditions,Kim et al. (2006) observed no changes in biomassaccumulation for maize plant. The positive responseobserved in biomass for sugarcane in elevated [CO2] plants isprobably because of an increase in cell production or cellelongation as proposed by Pritchard et al. (1999). Thishypothesis is supported by the findings that cell wall-relatedgenes were induced under elevated [CO2] (see further).
Differential transcription of carbon-metabolismgenes in leaves of sugarcane
Changes in gene expression are one of the responses tohigher atmospheric [CO2]. Because of the large number ofgenes involved in the response to CO2, microarrays arecurrently being used to monitor global gene expressionchanges in Arabidopsis (Li et al. 2006), maize (Kim et al.
0
500
1000
1500
2000
2500
3000
To
tal b
iom
ass (
g)
**
**
***
(a)
0
100
200
300
400
500
600
700
Le
af
bio
ma
ss (
g)
*
*
(b)
0
200
400
600
800
1000
1200
1400
1600
1800
13 22 26 31 50
Weeks of CO2
Ste
m b
iom
ass (
g)
* **
**
(c)
Figure 5. Biomass (g) of sugarcane plants grown in open-topchambers under ambient (open bars) and elevated CO2 (filledbars). (a) Total biomass; (b) leaf biomass; and (c) stem biomass.Data are mean � standard error of six replicates. Means followedby *(P < 0.05), **(P < 0.05) and ***(P < 0.001) differ significantlyby Student t-test procedure.
1122 A. P. de Souza et al.
© 2008 The AuthorsJournal compilation © 2008 Blackwell Publishing Ltd, Plant, Cell and Environment, 31, 1116–1127

2006), poplar (Taylor et al. 2005, Druart et al. 2006) andsoybean (Ainsworth et al. 2006).The completion of the sug-arcane EST sequence, coupled with a microarray containinggenes from the main metabolic categories, has provided anopportunity to study sugarcane molecular responses to CO2
using a global expression profiling.Microarray analyses performed with the leaves harvested
at 13th and 22nd weeks identified 33 out of 3598 genes(~1%) displaying statistically significant expression changes
in response to CO2 enrichment. At a first glance, it seemsthat only a few transcripts were significantly affected by theCO2. It is important to remind, however, that less than 10%of the sugarcane transcriptome is represented in our array.
In maize, authors identified 387 out of a total of 7442genes (5.2%) that responded to elevated [CO2], but 73% ofthese transcripts lacked annotation (Kim et al. 2006).Tayloret al. (2005) showed for poplar that gene expression wassensitive to elevated [CO2], but the response depends on
Table 2. SUCEST-FUN SAS showing differential expression in leaves of sugarcane at 13 and 22 weeks growing under elevated [CO2]
Blast homology 13 weeks 22 weeks
Subject Accession e value Up Down Up Down
PhotosynthesisSCSBSD2029H02.g Ferredoxin-1 sp|P27787| 3.00E-25 1.261SCCCLR2002H05.g Phosphoenolpyruvate carboxylase emb|AJ318340.1| 3.00E-70 1.245SCACLR1129A11.g Photosystem I reaction centre subunit N gb|ABA96024.1| 2E-42 1.583SCSBSB1053D03.g Photosystem II protein K gb|AAS46106.1| 6.00E-39 1.315Carbohydrate metabolismSCQSRT1034D03.g Alpha-L-arabinofuranosidase gb|ABG22346.1| 0 1.371SCAGLR1021F11.g Beta-glucosidase isozyme gb|AAL14713.1| E-165 2.189SCCCRT1C06D06.g Cell-wall invertase gb|AAO21213.1| 2.00E-19 1.616SCVPRT2079H06.g Glucose-6-phosphate dehydrogenase ref|XP_466575.1| 0 1.232 1.635SCBFLR1046C09.g Xyloglucan endo-transglycosylase/hydrolase emb|CAI44139.1| E-115 3.591Lipid metabolismSCCCLR1C10A12.g AE9 stearoyl-ACP desaturase ref|XP_480561.1| 4.00E-66 2.583Protein metabolismSCCCCL4010D05.g C2 domain-containing protein-like ref|XP_465295.1| 2.00E-65 1.343SCRULB1060C09.g Cathepsin B-like cysteine protease gb|AAX11351.1| 7.00E-86 1.396SCEQHR1082F06.g Glutamate-tRNA ligase ref|XP_463910.1| 4.00E-62 1.505SCACSB1035E05.g Large ribosomal protein 2 emb|CAA43983.1| 9.00E-59 1.455SCSGCL6071A12.g Similar to Midasin ref|NM_105382.3| 2.00E-28 1.230SCCCLR1072G07.g Translational initiation factor eIF-4A gb|AAB67607.1| 0 1.606Nucleic acid metabolismSCCCLR1C07F08.g ATP-dependent helicase ref|NM_115590.2| 5.00E-173 1.702SCCCCL3005E10.b Pre-mRNA splicing factor gb|AF139211.2| 9.00E-100 1.541Transcription factorsSCEZLR1031A03.g Auxin response factor 2 ref|NP_914881.1| 9.00E-88 1.352Secondary metabolismSCCCLR1079A02.g Caffeoyl-CoA 3-O-methyltransferase 1 gb|AAQ89930.1| E-128 1.355StressSCJLFL1048D03.g Dehydrin gb|AAA33480.1| 7.00E-25 1.420SCCCRZ2C01H04.g Ferritin emb|CAA43663.1| E-105 2.768SCVPRT2079D08.g Thaumatin gb|ABA34042.1| 3.00E-47 1.367DevelopmentSCSGST3121C06.g Auxin-independent growth promoter dbj|BAD38083.1| E-138 1.910SCCCLR2002F08.g Dormancy-associated protein gb|AF467730.1| 2.00E-36 2.300SCAGLR1043E03.g Kelch repeat-containing F-box family protein gb|ABF94220.1| 0 1.541SCRFAD1116F06.g Lateral organ boudaries protein gb|AAV43814.1| 9.00E-44 1.495SCEPRZ1010F07.g Light-induced protein gb|ABA61130.1| 7.00E-22 1.195Cell cycleSCAGLR2011H09.g Cyclin H-1 gb|AAR07076.1| 5.00E-76 1.633SCVPRT2075B03.g Nucleostemin dbj|BAD61385.1| 0 1.397ReceptorSCCCCL5003G07.g Serine/threonine-protein kinase NAK gb|ABA91210.1| 6.00E-62 1.706TransportSCAGHR1018F03.g Sugar transporter gb|ABF96105.1| E-133 1.253No matchSCBGRT1048A07.g No match – 1.398
The table lists all SAS whose expression was induced or repressed in both biological samples for each experimental point. The SAS areseparated according SUCEST-FUN functional categories. SAS, sugareane assembled sequence.
Elevated CO2 in sugarcane 1123
© 2008 The AuthorsJournal compilation © 2008 Blackwell Publishing Ltd, Plant, Cell and Environment, 31, 1116–1127

the developmental age of the leaves, with 36 transcriptsdifferentially expressed, 8 in young (~0.06%) and 28 insemimature leaves (~0.11%). As previously observed forpoplar, the number of transcripts differentially expressedin soybean was more expressive between growing andexpanding leaves (1146) than between ambient andelevated [CO2] (387) (Ainsworth et al. 2006).
When looking into detail at sugarcane gene expression inleaves, a reasonably clear correlation between the physi-ological and molecular responses can be observed. At the13th week, when major differences in photosyntheticresponses were observed, transcripts in the categories pho-tosynthesis and carbohydrate metabolism clearly differedbetween ambient and elevated [CO2]. At the 22nd week,when a difference in height and biomass became significantbetween the control and treated plants, the main gene cat-egories affected were cell cycle, development, nucleic acid,protein and secondary metabolism. Despite the fact thatsome stress-related genes have been found to be differen-tially expressed at the 22nd week, they are mainly down-regulated in elevated [CO2] plants, suggesting that theseplants were not submitted to significant stress conditions.
We found some cell wall-related genes responding toCO2, as alpha-L-arabinofuranosidase, xyloglucanendotransglycosylase/hydrolase (XTH), caffeoyl-CoA 3-O-methyltransferase (COMT) and cell wall invertase.
The XTHs are encoded by large multigene families inmonocotyledons and dicotyledons, and are involved in therestructuring xyloglucan molecules, and consequently, oncell wall expansion and cell enlargement (Wu & Cosgrove2000). In our work, XTH is up-regulated in response toelevated [CO2] by the 13th week on sugarcane leaves. It is
interesting to note that an increase of 145% in leaf area wasobserved in elevated [CO2] plants (data not shown) con-comitantly with changes in XTH transcript abundance.XTHs have been previously found to be up-regulated inpoplar (Taylor et al. 2005; Druart et al. 2006), and this cor-relates with earlier reports showing that high [CO2] affectscell wall extension in poplar leaves (Ferris et al. 2001;Tayloret al. 2003). It can be hypothesized that elevated [CO2] insugarcane also induces cell expansion through the action ofXTH on leaf cell walls.
COMT (EC 2.1.1.6), an enzyme responsible for the con-version of caffeic acid to ferulic acid, a key step in thebiosynthesis of lignin monomers, is down-regulated on sug-arcane leaves at the 22nd week.As lignin deposition usuallyoccurs when cell growth is completed, the decrease inCOMT transcript level suggests a lower content of lignin inleaves of sugarcane plants developed under elevated [CO2].Interestingly, an increase of about 19% in the cellulosecontent was observed at the same time in elevated [CO2]sugarcane leaves. Blaschke et al. (2004), working on tobaccoplants with suppressed COMT activity, reported thatelevated CO2 caused a shift towards the production ofstructural compounds resulting in decreased leaf lignin con-centrations and increased cellulose content, indicating thatthe lignin/structural mass ratio is flexible in leaves. Ourobservation of a decrease in COMT transcript in leaves ofsugarcane suggests that a decreased lignin synthesis mayenable plants to allocate increased resources to cellulosesynthesis and growth. In the same way, Körner et al. (2005),analysing leaf litter production of temperate forest treesexposed to elevated CO2 during 4 years, found that ligninconcentrations were significantly reduced. By contrast,
SCSBSB1053D03.g Photosystem II protein K
P = 0.98
SCSBSD2029H02.g Ferredoxin-1
SCCCLR1072G07.g Translational initiation factor eiF-4A
P = 0.96
SCACLR1129A11.g Photosystem I reaction center subunit
P = 1.00
P = 1.00 P = 1.00
P = 1.00
0
0.3
0.6
0.9
1.2
1.5
SCAGLR1021F11.g Beta-glucosidase isozyme
0
0.3
0.6
0.9
1.2
1.5
Ambient
Ambient Elevated Ambient
SCCCRT1C06D06.g Cell-w all invertase
SCVPRT2089H06.g Glucose-6-phosphate dehydrogenase
P = 0.95
Targ
et
mR
NA
/ G
AD
PH
mR
NA
Targ
et
mR
NA
/ G
AD
PH
mR
NA
Elevated Ambient Elevated Ambient Elevated
Elevated Ambient Elevated Ambient Elevated
Figure 6. Expression analysis of differentially expressed genes using RT-PCR. All the genes were carried out in parallel with normalizerglyceraldehyde-3-phosphate dehydrogenase gene (Iskandar et al. 2004). Error bars were calculated as described by Livak & Schmittgen(2001). RT-PCR, reverse transcription-polymerase chain reaction.
1124 A. P. de Souza et al.
© 2008 The AuthorsJournal compilation © 2008 Blackwell Publishing Ltd, Plant, Cell and Environment, 31, 1116–1127

genes directly related to lignin synthesis (COMT, CCoA-3Hand CAD) were found to be up-regulated on stems ofpoplar plants cultivated under high [CO2], but no differen-tial expression of lignification genes was detected in theleaves of these plants.
In the case of sugarcane, the observation that a lignin-related gene is down-regulated concomitantly with adecrease in lignin content and higher XTH expression sug-gests a higher potential of leaf cells to expand and accumu-late more sugars.
One cell wall invertase gene was found to be down-regulated at the 22nd week in leaves of sugarcane underhigh [CO2]. According to Moore et al. (1998), photosyn-thetic acclimation is related to high acid invertase levels andhigh leaf hexose/sucrose ratios in plants grown at elevatedCO2. The lower levels of invertase transcripts and theabsence of visible changes in hexose/sucrose ratios (datanot shown) in sugarcane leaves suggest that there was nophotosynthetic acclimation after 22 weeks on elevated[CO2]. Foyer (1987) previously suggested that invertaseactivity in source organs may limit carbohydrate export rateto sink organs. Therefore, the lower invertase expressionlevel in leaves of sugarcane plants grown under elevated[CO2] might be explained by the higher photosyntheticrates (Fig. 2) and consequently higher sucrose levels beingexported to the stem, resulting in higher sucrose contentafter 50 weeks. One cell wall invertase gene was also foundto be down-regulated in Arabidopsis plants cultivated at550 ppm in SoyFACE system while two vacuolar invertasewere up-regulated in the same conditions (Miyazaki et al.2004).
Elevated [CO2] increased the abundance of transcriptsrelated to photosynthesis. Chlorophyll a-b-binding protein,ferredoxin-1, photosystem I reaction centre subunit N andphotosystem II protein K were up-regulated by the 13thweek. Note that these are genes related to the electrontransport system of the leaves, and at this stage, no changesin transcription rates of genes related to CO2 assimilationwere detected (see earlier discussion). On the other hand,data produced by Vu et al. (2006) showed that Rubisco,PPDK and NADP-malate dehydrogenase activitiesincreased in leaves under elevated [CO2]. Altogether, theseresults suggest that the increase in growth observed in ourexperiments probably improves photosynthesis perfor-mance in two ways. On the one hand, differential geneexpression apparently leads to the improvement of thelight-harvesting system, and on the other hand, some of theenzymes associated with biochemical reactions would prob-ably be already present in concentrations high enough tosupport a higher CO2 assimilation so that an increased geneexpression is not necessary. It is important to rememberthat the varieties of sugarcane and the experimental condi-tions used by Vu et al. (2006) were different from the onesused in the present study. Altogether, in the leaves of sug-arcane grown under elevated [CO2], the expression of genesrelated to cell expansion and sucrose metabolism seems tobe associated with the improvement of the light-harvestingsystem in the chloroplasts. These observations, together
with the findings that photosynthesis and growth are signifi-cantly improved, strongly suggest that the physiological,biochemical and molecular conditions that induce a betterperformance of sugarcane plants in high [CO2] are preva-lent after 13 weeks, when plants are capable to photosyn-thesize more and to produce more sucrose.The findings thatthere are more sucrose and fiber in the stem supportthe hypothesis that the sucrose produced is transportedand stored in the stem, increasing parameters ofproductivity.
Effects of elevated [CO2] and thebiotechnological basis of sugarcaneproductivity in the future
Regarding productivity, sugarcane can be compared withother cereals. In sorghum and maize, for example, noincrease in productivity was observed in grain yield andkernel number under elevated [CO2] and well-watered con-ditions (Ottman et al. 2001; Leakey et al. 2006). However,sugarcane appears to be different, as productivity is notgauged by the results of reproductive effort but the directallocation of sucrose to the stems. In other words, sugarcaneplants probably spend proportionally less energy to storecarbon.
From this point of view, our data suggest that sugarcaneproductivity might increase in a scenario of future increasein atmospheric [CO2]. However, this has to be taken withcaution as at least three factors have to be considered: (1)our experiment was not performed under field conditions;(2) according to Leakey et al. (2006) OTCs can overesti-mate [CO2] effects on photosynthesis and growth; and (3)transient water stress can interfere (as illustrated in ourexperiment by pot size limitation) in the response of sugar-cane plants grown under elevated [CO2].
Yet another important point that has to be raised is thatour findings that increasing [CO2] leads to a better physi-ological performance of sugarcane through its light-harvesting system, and at the same time appears to increasecell expansion, open the way to possible strategies forfuture technologies that may improve sugarcane andbiofuel production, therefore helping to mitigate globalwarming effects.
ACKNOWLEDGMENTS
The authors wish to acknowledge the financial support fromFundação de Amparo à Pesquisa do Estado de São Paulo(FAPESP), the CTC and the Central de Álcool LucéliaLtda, and the Ministry of Science and Technology of Brazil(MCT). The authors are indebted to Mauro Marabesi forthe help with photosynthesis measurements; Flavia StalPapini-Terzi, Flavia Riso Rocha, Sarah D.B. Cavalcanti,Erica Bandeira, Adriana Y. Matsukuma and Denise Yama-moto for assistance on microarray experiments performedin the laboratory of the Cooperation for Analysis of GeneExpression inter-departmental Project; and Odair Vieira
Elevated CO2 in sugarcane 1125
© 2008 The AuthorsJournal compilation © 2008 Blackwell Publishing Ltd, Plant, Cell and Environment, 31, 1116–1127

for reviewing the English language of this manuscript.A.W.,R.V. and M.N.Y. were supported by fellowships from theUNIEMP Institute. M.S.B. thanks colleagues Pat Morganand Andrew Leakey for the critical review of the manu-script. A.P.S. was an Msc student at Department of CellBiology, UNICAMP and acknowledges the fellowship fromthe FAPESP. M.S.B. and G.M.S. are supported by a CNPqfellowship.
REFERENCES
Aidar M.P.M., Martinez C.A., Costa A.C., Costa P.M.F., DietrichS.M.C. & Buckeridge M.S. (2002) Effect of atmospheric CO2
enrichment on the establishment of seedlings of jatobá. Hyme-naea courbaril L. (Leguminosae, Caesalpinioideae). Biota Neo-tropica 2. (http://www.biotaneotropica.org.br/v2n1/en/abstract?article+BN01602012002).
Ainsworth E.A. & Long S.P. (2005) What have we learned from 15years of free air-CO2 enrichment (FACE)? A meta-analyticreview of the responses of photosynthesis, canopy properties andplant production to rising CO2. New Phytologist 165, 351–372.
Ainsworth E.A. & Rogers A. (2007) The response of photosynthe-sis and stomatal conductance to rising [CO2]: mechanisms andenvironmental interactions. Plant, Cell & Environment 30, 258–270.
Ainsworth E.A., Rogers A., Vodkin L.O., Walter A. & Schurr U.(2006) The effects of elevated CO2 concentration on soybeangene expression.An analysis of growing and mature leaves. PlantPhysiology 142, 135–147.
Arp W.J. (1991) Effects of source–sink relations on photosyntheticacclimation to elevated CO2. Plant, Cell & Environment 14, 869–875.
Blaschke L., Legrand M., Mai C. & Polle A. (2004) Lignificationand structural biomass production in tobacco with suppressedcaffeic/5-hydroxy ferulic acid-O-methyl transferase activityunder ambient and elevated CO2 concentrations. PhysiologiaPlantarum 121, 75–83.
Bowes G. (1993) Facing the inevitable: plants and increasing atmo-spheric CO2. Annual Review of Plant Physiology and PlantMolecular Biology 44, 309–332.
Carpita N.C. (1984) Fractionation of hemicelluloses from maizecell walls with increasing concentrations of alkali. Phytochemis-try 23, 1089–1093.
Cousins A.B. & Bloom A.J. (2003) Influence of elevated CO2 andnitrogen nutrition on photosynthesis and nitrate photo-assimilation in maize (Zea mays L.). Plant, Cell & Environment26, 1526–1530.
Cousins A.B., Adam N.R., Wall G.W., et al. (2001) Reduced photo-respiration and increased energy-use efficiency in young CO2-enriched sorghum leaves. New Phytologist 150, 275–284.
Cousins A.B., Adam N.R., Wall G.W., Kimball B.A., Pinter P.J., Jr.,Ottman M.J., Leavitt S.W. & Weber A.N. (2003) Development ofC4 photosynthesis in sorghum leaves grown under free-air CO2
enrichment (FACE). Journal of Experimental Botany 54, 1969–1975.
Doorembos J. & Kassam A.H. (1979) Efectos del agua sobre elrendimiento de los cultivos. FAO, Rome, 212 pp.
Druart N., Rodríguez-Buey M., Barron-Gafford G., Sjödin A.,Bhalerao R. & Hurry V. (2006) Molecular targets of elevated[CO2] in leaves and stem of Populus deltoides: implications forfuture tree growth and carbon sequestration. Functional PlantBiology 33, 121–131.
Ferris R., Sabatti M., Miglietta F., Miels R.F. & Taylor G. (2001)Leaf area is stimulated in Populus by free air CO2 enrichmen
through cell expansion and production. Plant, Cell & Environ-ment 24, 305–315.
Foyer H.C. (1987) The basis for source-sink interaction in leaves.Plant Physiology and Biochemistry 25, 649–657.
Gascho G.J. & Shih S.F. (1983) Sugarcane. In Crop Water Relations(eds I.D. Teare & M.M. Peet), pp. 448–479. Wiley-Interscience,New York.
Ghannoum O., von Caemmerer S., Ziska L.H. & Conroy J.P. (2000)The growth response of C4 plants to rising atmospheric CO2
partial pressure: a reassessment. Plant, Cell & Environment 23,931–942.
Goldenberg J. (2007) Ethanol for a sustainable energy future.Science 315, 808–810.
Gorshokova T.A., Wyatt S.E., Salnikov V.V., Gibeaut D.M., Ibragi-mov M.R., Lozovaya V.V. & Carpita N.C. (1996) Cell-wallpolysaccharides of developing flax plants. Plant Physiology 110,721–729.
Iskandar H.M., Simpson R.S., Casu R.E., Bonnett G.D., MacleanD.J. & Manners J.M. (2004) Comparison of reference genes forquantitative real-time polymerase chain reaction analysis ofgene expression in sugarcane. Plant Molecular Biology Reporter22, 325–337.
Kim S.H., Sicher R.C., Bae H., Gitz D.C., Bakers J.T., Timlin D.J.& Reddy V.R. (2006) Canopy photosynthesis, evapotran-spiration, leaf nitrogen, and transcription profiles of maize inresponse to CO2 enrichment. Global Change Biology 12, 588–600.
Koide T., Salem-Izaac S.M., Gomes S.L. & Vencio R.Z.N. (2006)SpotWhatR: a user-friendly microarray data analysis system.Genetic Molecular Research 5, 93–107.
Körner C., Asshoff R., Bignucolo O., Hattenscwiler S., Keel S.G.,Pelàez-Riedl S., Pepin S., Siegwoef R.T.W. & Zotz G. (2005)Carbon flux and growth in mature deciduous forest treesexposed to elevated CO2. Science 309, 1360–1362.
Leakey A.D.B., Uribelarrea M., Ainsworth E.A., Naidu S.L.,Rogers A., Ort D.R. & Long S.P. (2006) Photosynthesis, produc-tivity and yield of maize are not affected by open–air elevation ofCO2 concentration in the absence of drought. Plant Physiology140, 779–790.
Li J., Li X., Su H., Chen H. & Galbraith D.W. (2006) A frameworkof integrating gene relations from heterogeneous data sources:an experiment on Arabidopsis thaliana. Bioinformatics 22, 2037–2043.
Livak K.J. & Schmittgen T.D. (2001) Analysis of relative geneexpression data using real-time quantitative PCR and the 2-DDCt
method. Methods 25, 402–408.Long S.P., Ainsworth E.A., Rogers A. & Ort D.R. (2004) Rising
atmospheric carbon dioxide: plants FACE the future. AnnualReviews of Plant Biology 55, 591–628.
Maroco J.P., Edwards G.E. & Ku M.S.B. (1999) Photosyntheticacclimation of maize to growth under elevated levels of carbondioxide. Planta 210, 115–125.
Miyazaki S., Fredricksen M., Hollis K.C., Poroyko V., Shepley D.,Galbraith D.W., Long S.P. & Bohnert H.J. (2004) Transcriptexpression profiles of Arabdopsis thaliana grown under con-trolled conditions and open-air elevated concentrations of CO2
and of O3. Field Crops Research 90, 47–59.Moore B.D., Cheng S.H., Rice J. & Seemann J.R. (1998) Sucrose
cycling, Rubisco expression, and prediction of photosyntheticacclimation to elevated atmospheric CO2. Plant, Cell & Environ-ment 21, 905–915.
Nowak R.S., Ellsworth D.S. & Smith S.D. (2004) Functionalresponses of plants to elevated atmospheric CO2 – dophotosynthetic and productivity data from FACE experi-ments support early predictions? New Phytologist 162, 253–280.
1126 A. P. de Souza et al.
© 2008 The AuthorsJournal compilation © 2008 Blackwell Publishing Ltd, Plant, Cell and Environment, 31, 1116–1127

Ottman M.J., Kimball B.A., Pinter P.J., Wall G.W., Vanderlip R.L.,Leavitt S.W., LaMorte R.L., Matthias A.D. & Brooks T.J. (2001)Elevated CO2 increases sorghum biomass under drought condi-tions. New Phytologist 150, 261–273.
Papini-Terzi F.S., Rocha F.R., Vêncio R.Z.N., et al. (2005) Transcrip-tion profiling of signal transduction-related genes in sugarcanetissues. DNA Research 12, 27–38.
Pearcy R.W. & Ehleringer J. (1984) Comparative ecophysiology ofC3 and C4 plants. Plant, Cell & Environment 7, 1–13.
Pritchard S.G., Rogers H.H., Prior S.A. & Peterson C.M. (1999)Elevated CO2 and plant structure: a review. Global ChangeBiology 5, 807–837.
Solomon S., Qin D., Manning M., Chen Z., Marquis M., AverytK.B., Tignor M. & Miller H.L. (eds) (2007) Understanding andattributing climate change. In Climate Change 2007:The PhysicalScience Basis Contribution of Working Group I to the FourthAssessment Report of the Intergovernmental Panel on ClimateChange. Cambridge University Press, Cambridge and New York.
Souza G.M., Simões A.C.Q., Oliveira K.C., Garay H.M., FioriniL.C., Gomes F.S., Nishiyama-Junior M.Y. & Silva A.M. (2001)SUCAST: prospecting signal transduction in sugarcane. GeneticsMolecular Biology 24, 25–34.
Sugar Cane Industry – UNICA. (2007) Sugarcane, sugar and anhy-drous ethanol – production Brazil. Available at: http://www.portalunica.com.br (accessed 18 September 2007).
Tang J., Chen J. & Chen X. (2006) Response of 12 weedy species toelevated CO2 in low-phosphorus-availability soil. EcologicalResearch 21, 664–670.
Taylor G., Tricker P.J., Zhang F.Z., Alston V.J., Miglietta F. &Kuzminsky E. (2003) Spatial and temporal effects of free-airCO2 enrichment (POPFACE) on leaf growth, cell expansion, andcell production in a closed canopy of poplar. Plant Physiology131, 177–185.
Taylor G., Street N.R., Tricker P.J., Sjödin A., Graham L.,Skogström O., Calfapietra C., Scarascia-Mugnozza G. & JansonS. (2005) Transcriptome of Populus in elevated CO2. New Phy-tologist 167, 143–154.
Vettore A.L., da Silva F.R., Kemper E.L., Souza G.M. & Arruda P.(2003) Analysis and functional annotation of expressedsequence tag collection for tropical crop sugarcane. GenomeResearch 13, 2725–2735.
von Caemmerer S. (2000) Biochemical Models of Leaf Photosyn-thesis. CSIRO Publishing, Collingwood.
Vu J.C.V., Allen L.H., Jr. & Gesch R.W. (2006) Up-regulation ofphotosynthesis and sucrose metabolism enzymes in youngexpanding leaves of sugarcane under elevated growth CO2. PlantScience 171, 123–131.
Wand S.J.E., Midgley G.F., Jones M.H. & Curtis P.S. (1999)Responses of wild C4 and C3 grass (Poaceae) species to elevatedatmospheric CO2 concentration: a meta-analytic test of currenttheories and perceptions. Global Change Biology 5, 723–741.
Watling J.R., Press M.C. & Quick W.P. (2000) Elevated CO2
induces biochemical and ultrastructural changes in leaves of theC4 cereal sorghum. Plant Physiology 123, 1143–1152.
Wu Y. & Cosgrove D.J. (2000) Adaptation of roots to low waterpotentials by changes in cell wall extensibility and cell wall pro-teins. Journal of Experimental Botany 51, 1543–1553.
Yang Y.H., Dudoit S., Luu P., Lin D.M., Peng V., Ngai J. & SpeedT.P. (2002) Normalization for cDNA microarray data: a robustcomposite method addressing single and multiple slide system-atic variation. Nucleic Acids Research 30, e15.
Ziska L.H. & Bunce J.A. (1997) Influence of increasing carbondioxide concentration on the photosynthetic and growth stimu-lation of selected C4 crops and weeds. Photosynthesis Research54, 199–208.
Ziska L.H., Sicher R.C. & Bunce J.A. (1999) The impact ofelevated carbon dioxide on the growth and gas exchange of threeC4 species differing in CO2 leak rates. Physiologia Plantarum105, 74–80.
Received 25 Janruary 2008; received in revised form 8 April 2008;accepted for publication 17 April 2008
SUPPLEMENTARY MATERIAL
The following supplementary material is available for thisarticle:
Table S1. Differentially expressed genes selected for real-time PCR validation. Primers were designed using PrimerExpress 2.0 software (ABI Biosystems). BLAST searchesagainst the SUCEST database were conducted to ensurethe specificity of the selected primers. The specificity of thePCR products were confirmed by dissociation curves.The Pvalues were calculated in function of the microarray expres-sion. For a description of the P calculation, refer to theMaterial and Methods section.Table S2. Expression patterns of the SUCEST-FUN chipcomponents. The table indexes the log2 ratios of themicroarray signal between the two channels (Cy3 and Cy5).M=log2 ratio of the microarray signal intensity. Onlythe differentially expressed SAS were confirmed byre-sequencing.
This material is available as part of the online articlefrom: http://www.blackwell-synergy.com/doi/abs/10.1111/j.1365-3040.2008.01822.x(This link will take you to the article abstract)
Please note: Blackwell Publishing is not responsible for thecontent or functionality of any supplementary materialssupplied by the authors. Any queries (other than missingmaterial) should be directed to the corresponding authorfor the article.
Elevated CO2 in sugarcane 1127
© 2008 The AuthorsJournal compilation © 2008 Blackwell Publishing Ltd, Plant, Cell and Environment, 31, 1116–1127