Substation event analysis using information from intelligent electronic devices
Upload
khangminh22Category
view
2download
0
Electronic Supplementary Information
Thermochemical wastewater valorization via enhanced microbial toxicity tolerance Lahiru N. Jayakody1, Christopher W. Johnson1, Jason M. Whitham2, Richard J. Giannone2, Brenna A.
Black1, Nicholas S. Cleveland1, William E. Michener1, Jessica L. Olstad1, Derek R. Vardon1, Robert C.
Brown3, Dawn M. Klingeman2, Steven D. Brown2, 4, Robert L. Hettich2, Adam M. Guss2, Gregg T.
Beckham1, *
1National Bioenergy Center, National Renewable Energy Laboratory, Golden CO 80401 2Oak Ridge National Laboratory, 1 Bethel Valley Rd, Oak Ridge, TN 37830 3Bioeconomy Institute and Department of Mechanical Engineering, Iowa State University, Ames, IA 50011, USA
4LanzaTech, Inc., Skokie, IL 60077, USA
*Email: [email protected]
Supplemental Materials and Methods
Determination of the combinational inhibitory effect of FPF chemical functional groups
A three-level partial factorial growth experiment was performed using synthetic medium containing combinations of
the most abundant compounds present in FPF based on their functional groups, including FPF-aldehyde, FPF-ketone,
FPF-acids, and FPF-phenolics. Level 1 contained 0 % (v/v), level 2 contained 0.02 % (v/v), and level 3 contained 0.03
% (v/v); 9-ineractions were tested according to Taguchi Orthogonal "L" Array design metrics (ESI Fig. S2). 200 µL
of M9 medium-containing 20 mM glucose supplemented with various concentrations of FPF components was added
to the wells of a Bioscreen C microplate, P. putida KT2440 cells were added to reach an initial cell density of
OD600=0.1, and the plate was incubated at 30°C with medium shaking. The OD420-580 was monitored using a Bioscreen
C MBR analyzer (Growth Curves US, Piscataway, NJ) every 30 min to generate growth curves. Growth curves were
performed in triplicate and the average growth rate was obtained. The data were further subjected to partial least square
regression analysis (PLS) with XLSTAT software to obtain the variable important parameter (VIP) of each
component.
Sample preparation for RNA-seq and proteomics analysis
Cultures grown in M9-medium-containing 20 mM glucose at 30 °C and 225 rpm were collected in mid log phase and
washed twice with M9 medium containing 20 mM glucose and used to inoculate 60 mL of M9 medium-containing 20
mM glucose supplemented with or without 2 mM glycolaldehyde or 0.05% (v/v) FPF in 250 mL baffled flasks to an
OD600=0.1 and incubated shaking at 225 rpm, 30 °C. Cells were harvested when cells reached mid-log phase, at
OD600=0.5. 10 mL and 50 mL of each culture were collected from each flask for RNA isolation and protein extraction,
respectively. Cells were centrifuged for 5 min at 4,800 rpm, 30 °C, using high speed acceleration and deceleration.
The supernatant was discarded, and the cell pellet-containing vials were subjected to liquid nitrogen for 1 min and
stored in -80 °C until RNA-seq and proteomic analysis.
RNA isolation: Cell pellets were resuspended in 1.5 ml of TRIzol (Life Technologies, Carlsbad, CA, USA) and total
RNA was isolated following the manufacturer's protocol. The aqueous phase was obtained and mixed at a ratio of 1:1
with > 75% ethanol and purified on an RNeasy column (Qiagen, Valencia, CA), including on column DNase treatment,
following the manufacturer's protocol. Isolated RNA was measure and assessed for quality on a 2100 Bioanalyzer
(Agilent Technologies, Santa Clara, CA) and a Nanodrop-1000 (Thermo Scientific, Waltham, MA). Total RNA was
sent to Joint Genome Institute (http://jgi.doe.gov/) for cDNA library generation and sequencing.
Sequencing, expression data quality control, normalization, quantification, and differential expression analysis:
Paired-end reads (2 x 151 bp) were generated on a HiSeq-2500 using rapid V2 chemistry, demultiplexed, trimmed,
and filtered with BBDuk (https://sourceforge.net/projects/bbmap/) to remove reads with greater than a single
mismatch, without kmer matching (kmer=25), and ones which are known contaminants and PhiX spike-in reads. Only
unique reads were mapped with BBMap (https://sourceforge.net/projects/bbmap/) to the Pseudomonas putida KT2440
genome (IMG OID 637000222). Sequences that mapped to more than one location in the genome, mapped with 93%
identity to human, cat, dog and mouse references, mapped to common microbial contaminant references, or ribosomal
RNA were removed. featureCounts was used to generate the raw gene counts.1 Raw read counts were used to evaluate
Electronic Supplementary Material (ESI) for Energy & Environmental Science.This journal is © The Royal Society of Chemistry 2018

the level of correlation between biological samples using Pearson's correlation (ESI Materials and Methods).
Differential expression analysis was performed with DESeq2 using raw read counts.2 Genes were considered
significantly differential expressed when their adjusted p-values were less than or equal to 0.05 and log2-fold change
values were ≥ 2 or ≤ 2. ANOVA analysis was performed in JMP Genomics 8 (SAS Institute, Cary, NC, USA) using
FPKM-normalized read counts (fragments per kilobase of open reading frame per million mapped reads). The obtained
RNA seq data are available at NCBI bioproject PRJNA398406, SRA submission SRP116349.
GO enrichment analysis: Protein sequences from the P. putida KT2440 genome (IMG OID 637000222) were
annotated with gene ontology (GO) names after merging of assignments from NCBI Blastp and InterProScan (with
applications BlastProDom, FPrintScan, HMMPIR, HMMPfam, HMMSmart, HMMTigr, ProfileScan, HAMAP,
PartterScan, SuperFamily, SignalPHMM, TMHMM, HMMPanther, Gene3D, Phobius, Coils, CDD, SFLD, and
MobiDBLite). Fisher's Exact Test was performed with differentially expressed genes (log2-fold ≥ 1 or ≤ -1 and FDR<
0.05) and the GO-annotated genome as a reference. All steps were performed with default parameters in the Blast2GO
4.1.5 (Oracle Corporation, Redwood City, CA).
Proteome isolation from whole cells: Whole-cell lysates were prepared by bead beating in sodium deoxycholate lysis
buffer (4% SDC, 100 mM ammonium bicarbonate (ABC), 10 mM dithiothreitol, pH 7.8) using 0.15 mm zirconium
oxide beads followed by centrifugation at 21,000 x g. Precleared protein lysates were moved to a new microfuge tube,
denatured/reduced at 80°C for 10 min, and adjusted to 30 mM iodoacetamide to alkylate cysteines. After 20 min
incubation in the dark at room temperature, sample protein concentrations were measured via BCA (Pierce). Protein
samples were then transferred to a 10 kDa MWCO spin filter (Vivaspin 500, Sartorius), rinsed with ABC, and digested
in situ with sequencing-grade trypsin as previously described.3 Tryptic peptides were then collected by centrifugation
(10,000 x g), SDC precipitated with 1% formic acid, and precipitate removed from the peptide solution with water-
saturated ethyl acetate. Peptide samples were then concentrated via SpeedVac and measured by BCA.
Two-dimensional LC-MS/MS analysis of peptide mixtures: Peptide samples were analyzed by automated 2D LC-
MS/MS analysis using a Vanquish UHPLC with autosampler plumbed directly in-line with a Q Exactive Plus mass
spectrometer (Thermo Scientific) outfitted with a triphasic back column (RP-SCX-RP; reversed-phase [5 µm Kinetex
C18] and strong-cation exchange [5 µm Luna SCX] chromatographic resins; Phenomenex) coupled to an in-house
pulled nanospray emitter packed with 30 cm Kinetex C18 resin. For each sample, 6 µg of peptides were autoloaded,
desalted, separated and analyzed across three successive salt cuts of ammonium acetate (35, 50, and 500 mM), each
followed by 105 min organic gradient. Eluting peptides were measured and sequenced by data-dependent acquisition
on the Q Exactive as previously described.3
Database searching and proteome informatics: MS/MS spectra were searched with MyriMatch v.2.2 against the P.
putida KT2440 proteome concatenated with common protein contaminants and reversed entries to estimate false-
discovery rates (FDR).4 Peptide spectrum matches (PSM) were required to be fully tryptic with any number of missed
cleavages; a static modification of 57.0214 Da on cysteine and a dynamic modification of 15.9949 Da on methionine
residues. PSMs were filtered using IDPicker v.3.0 with an experiment-wide FDR controlled at < 1% at the peptide-
level.5 Peptide intensities were assessed by chromatographic area-under-the-curve (label-free quantification option in
IDPicker). To remove cases of extreme sequence redundancy, the P. putida proteome was clustered at 90% sequence
identity (UCLUST) and peptides intensities summed to their respective protein groups/seeds to estimate overall
protein abundance.6 Protein abundance distributions were then normalized across samples and missing values imputed
to simulate the mass spectrometer’s limit of detection.
mcl-PHAs quantification and characterization
10-30 mg of cells were added to a glass vial and derivatized by adding ~1 mL of BF3/MeOH containing 200 μL of
benzoic acid dissolved in dichloromethane (10 mg/mL) as an internal surrogate to track derivatization. The vials were
sealed, shaken, placed in a heating block at 80°C overnight, and allowed to cool to room temperature. The samples
were moved into a 10 mL volumetric flask and the vial residual was rinsed twice with DCM before filling the flask to
10 mL total with additional DCM. The 10 mL solution was transferred to a PTFE capped vial and ~3 mL of water was
added to form a bi-phase and wash out residual BF3 to the aqueous layer. The DCM layer (~2 mL) was then transferred
into another vial containing a small amount of Na2SO4 and Na2CO3 to dry and neutralize any remaining BF3. The
dried and neutralized solutions were syringe filtered (0.2 μm PTFE) into fresh vials for analysis. To track recovery of
PHAs during sample derivatization and analysis, triplicate biomass samples of P. putida KT2440 were processed in
parallel. Recovery yields during sample workup were calculated based on a cell dry weight PHA content of 24%
determined by bulk sample solvent extraction. Hydroxyacid methyl esters were identified and the distribution
quantified by gas chromatography mass spectroscopy (GC-MS) using an Agilent 6890N GC equipped with a 5973

MSD (Agilent Technologies). Agilent MSD Productivity Chemstation G1701 software version D.00.00 was used to
collect and quantitate analytes. 8-Hydroxyoctanoic acid, 10-hydroxydecanoic acid, 12-hydroxydodecanoic acid, and
14-hydroxytetradecanoic acids were obtained from Sigma Aldrich (98+% purity, Sigma Aldrich, St. Louis, MO,
USA), methylated as per the method used for the samples, and used to determine the GC-MS instrument response.
Samples were injected at a volume of 1 μL onto a Stabilwax-DA column (30 m × 0.25-mm id, 0.25-μm film) in
splitless mode, with helium at 1 mL/min constant flow used as the carrier gas. The GC/MS method consisted of a front
inlet temperature of 250°C, and an auxiliary transfer line temperature of 260°C. The separation used had a starting
temperature of 225°C and this was held for 2 min, then ramped at 15°C/min to a temperature of 250°C and held for
5.7 minutes for a total run time of 27 min. Sample total ion counts were collected on the mass spectrometer at scan
range from 30 to 450 m/z. Calibration curves where made by diluting the derivatized standards between a concentration
of 5-175 µg/L. A minimum of six calibration levels was used resulting in an r2 coefficient of 0.995 or better for each
analyte and a check calibration standard (CCS)was analyzed every ten samples to insure the integrity of the initial
calibration. An internal standard of 1,2-diphenylbenzene (99.9+% purity, AccuStandard, New Haven, CT) was added
to all standards and samples at a concentration of 40 ug/L to adjust for any detector response shift.
High performance liquid chromatography (HPLC) analysis
Concentrations of acetate, glycolaldehyde, furfural, HMF, and glycolate were measured using high performance liquid
chromatography (HPLC) by injecting 6 µL of 0.2-µm filter-sterilized culture supernatant onto an Agilent1100 series
system (Agilent USA, Santa Clara, CA) equipped with a Phenomenex Rezex RFQ-Fast Fruit H+ column
(Phenomenex, Torrance, CA) and cation H+ guard cartridge (Bio-Rad Laboratories, Hercules, CA) at 85°C. A mobile
phase of 0.1 N sulfuric acid was used at a flow rate of 1.0 mL/min. Refractive index and diode array detectors were
used for compound detection. Compounds were identified by relating the retention times and spectral profiles with
standard HPLC grade pure compounds (Sigma Aldrich, St. Louis, MO, USA) and the concentration of each compound
was calculated based on a calibration curves generated using pure compounds.
Total carbon analysis
The total carbon of the samples was determined using a LECO TruSpec CHN module (LECO Corporation, Saint
Joseph, MI). The sample (nominal weight of 0.1g, encapsulated in a tin foil capsule with Al2O3) was placed in the
sample loading head, sealed, and purged of any atmospheric gases. The sample was dropped into a furnace dosed with
pure O2 gas (99.995 %) at 950 °C for combustion. The combustion products passed through the afterburner furnace
(850 °C), where they succumbed to further oxidation and particulate removal. The resulting gaseous products were
sent through anhydrone to remove moisture, and on to a CO2 infrared detector to determine carbon content.
Western blot (WB) analysis of GFP protein
For the WB analysis, 25 mL of M9 medium supplemented with 20 mM glucose with or without 3 mM GA or 0.1 %
(v/v) FPF in a 125 mL baffled flask was inoculated to an OD600=0.1 with GPF-expressing strains using log phase pre-
cultures made in 20 mM glucose containing M9 medium. Cultures were incubated shaking at 225 rpm, 30 °C, and
cells were harvested after 3 h. Soluble fractions of proteins were extracted by using a B-PER solution (Thermo Fisher
Scientific Inc, Waltham, MA, USA) according to manufacturer’s instructions. Immuno-detection of GFP was
accomplished using the SNAP i.d.® 2.0 Protein Detection System (Millipore Corp, USA). SDS-PAGE gels were
transferred via standard wet tank transfer to the PVDF membranes. Membranes were blocked using SuperBlockPBS
(Thermo Fisher Scientific Inc., Rockford, IL, USA) for 10 min at room temperature and then washed four times for 2
min each in PBS-T buffer (10 mM Na3PO4, 0.15M NaCl, 0.05% (v/v) Tween-20, pH 7.5). GFP Tag Monoclonal
Antibody (11E5) IgG antibody (Thermo Fisher Scientific Inc., Rockford, IL, USA) was diluted 1:5,000 in blocking
buffer, and the blots were incubated for 10 min at room temperature and washed three times with wash buffer. Goat
anti-Mouse IgG, IgM (H+L) Cross-Adsorbed Secondary Antibody, AP (Thermo Fisher Scientific Inc., Rockford, IL,
USA) was diluted 1:1000 in blocking buffer, added to the PVDF membranes and incubated 10 min. Membranes were
washed three times with wash buffer and the alkaline phosphatase localization was visualized using BCIP/NBT (Life
Technologies Corp, Carlsbad, CA, USA). The detected GFP protein bands were quantified by using Image J software.7

Supplemental Figures and Tables
Figure S1. EC50 values of the different TC waste water streams on P. putida KT2440. The EC50 value is defined
as concentration of TC wastewater (v/v%) in M9 medium containing 20 mM glucose, which is inhibited P. putida
growth rate by 50%. TC: thermochemical: FP: fast pyrolysis, FPF: fast pyrolysis with fractionation, CFP: catalytic
fast pyrolysis.

Figure S2. Fractional factorial experiment of combinational inhibitory effects of different functional group
compounds found in FPF on P. putida KT2440. FPFSYN-Ald: a synthetic medium of aldehydes, FPFSYN-Ket: a synthetic
medium of ketones, FPFSYN-phe: a synthetic medium of phenols, and FPFSYN-Ace: a synthetic medium of acids fraction
of FPF. Results are expressed as means ± SEM (n=3). Bars labeled with different symbols (, and) indicate
statistical significance statistical significance of different run (p < 0.05; one-way ANOVA followed by Tukey’s post
hoc honest significance difference test). Bars labeled with the same symbol(s) indicate no statistically significant
difference (p > 0.05; one-way ANOVA followed by Tukey’s post hoc honest significance difference test). FPF: fast
pyrolysis with fractionation, ANOVA: analysis of variance.

Figure S3. Heat map of the global proteomics profiles of P. putida KT2440 untreated or treated with 2 mM
GA or 0.05% (v/v) FPF. FPF: fast pyrolysis with fractionation, GA: glycolaldehyde.

Figure S4. Formation of inclusions body of GFP after treatment of the GFP-expressing P. putida KT2440 cells
with GA or of FPF. Cells were observed by epifluorescence microscope after 3 h treatment in 20 mM glucose
containing M9 medium supplemented with 3 mM GA or 0. 05% (v/v) of FPF. FPF: fast pyrolysis with fractionation,
GA: glycolaldehyde, GFP: green fluorescent protein.

Figure S5. (A) Schematic illustration of the mechanisms of protein recovery by chaperone cascades. Green
arrows represent GroES and GroEL dependent (GroESL) misfolded protein recovery, orange arrows represent DnaJ,
DnaK, and GrpE dependent (DnaJKE) misfolded protein recovery, and gray arrows represent aggregated protein
recovery via ClpB with the assistant of GroESL or/and DnaJKE system. (B) The effect of plasmid-based expression
of chaperone protein(s) on tolerance of P. putida KT2440 to glycolaldehyde. Bars labeled with different symbols
(and) indicate statistical significance in the differences in growth rate between those strains (p < 0.05; one-way
ANOVA followed by Tukey’s post hoc honest significance difference test). Bars labeled with the same symbol(s)
indicate no statistically significant difference (p > 0.05; one-way ANOVA followed by Tukey’s post hoc honest
significance difference test) FPF: fast pyrolysis with fractionation, ANOVA: analysis of variance. ATP: adenosine
triphosphate.

Figure S6. configuration of genomic integrated cassette of synthetic chaperone operon

Figure S7. 2D- and 3D-PLS global proteomics plots of the strains with or without treatment of FPF (0.5%
v/v). FPF: fast pyrolysis with fractionation.

Figure S8. (A) Heat map of global proteomics profiles of the LJ014 and the KT2440 strains in M9 medium containing
20 mM glucose with or without 0.5% (v/v) FPF (B) Heat map of the N. log2 values of chaperone proteins between
the LJ014 and the KT2440 strain in M9 medium containing 20 mM glucose with or without 0.5% (v/v) FPF. FPF: fast
pyrolysis with fractionation.

Figure S9. Consumption of acetate in FPF by LJ014 strain (A) HPLC chromatogram of media containing FPF as
a sole carbon source (1% v/v) after 48 h of cultivation of KT2440 or LJ014. (B) Time course of acetate consumption
of KT2440 and LJ014. The level of statistical significance is indicated for differences between the two strains (** p
<0.01). RID: refractive index detector, FPF: fast pyrolysis with fractionation.

Figure S10. Cells survival at different concentrations of TC wastewater streams. (A) FP, (B) FPF, (C) in-situ
CFC, (D) ex-situ CFP, and (E) CFU at maximum tolerable concentration (v/v%). The level of statistical significance
is indicated for differences between the two strains (* p <0.05, ** p <0.01). Bars labeled with different symbols (and
) indicate statistical significance in the differences in growth of rates s in different TC wastewater streams (p < 0.05;
one-way ANOVA followed by Tukey’s post hoc honest significance difference test). Bars labeled with the same
symbol indicate no statistically significant difference (p > 0.05; one-way ANOVA followed by Tukey’s post hoc
honest significance difference test). TC: thermochemical: FP: fast pyrolysis, FPF: fast pyrolysis with fractionation,
CFP: catalytic fast pyrolysis, ANOVA: analysis of variance.
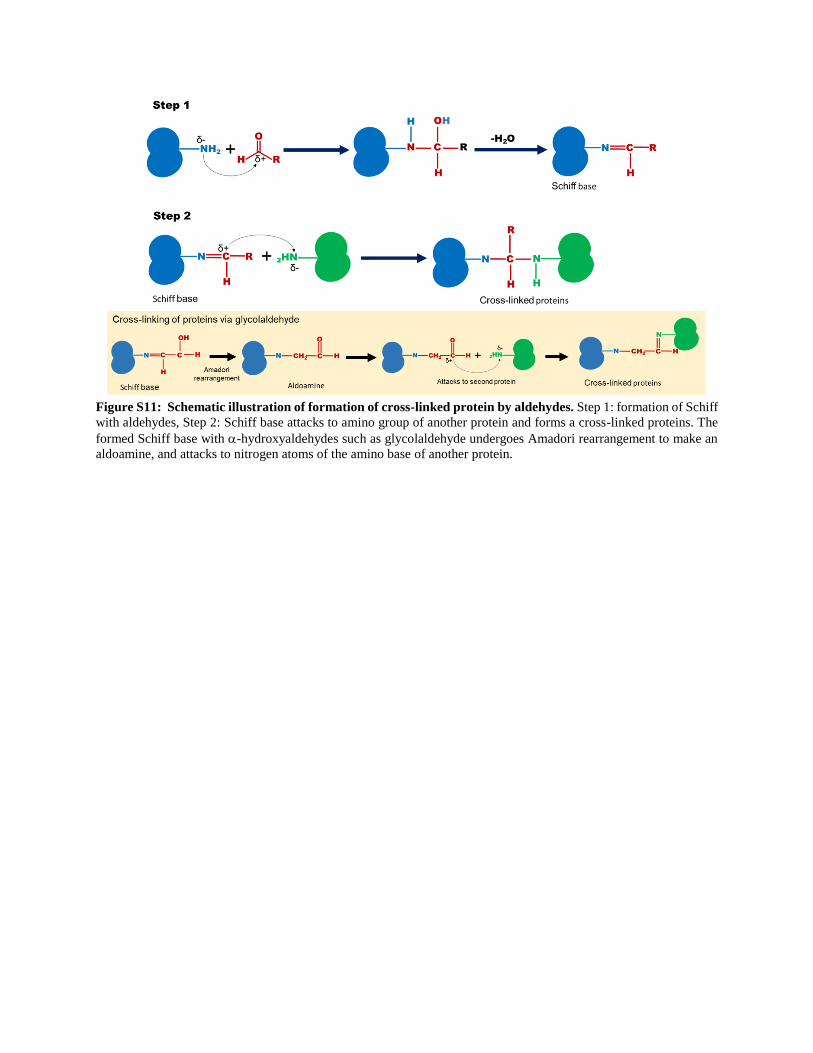
Figure S11: Schematic illustration of formation of cross-linked protein by aldehydes. Step 1: formation of Schiff
with aldehydes, Step 2: Schiff base attacks to amino group of another protein and forms a cross-linked proteins. The
formed Schiff base with -hydroxyaldehydes such as glycolaldehyde undergoes Amadori rearrangement to make an
aldoamine, and attacks to nitrogen atoms of the amino base of another protein.

Figure S12. Map of the pK18sB vector, a smaller derivative of sacB-based genome integration vector
pK18mobsacB. This plasmid is unable to replicate in P. putida and contains kanamycin antibiotic resistance gene to
select for integration of the plasmid into the genome and sacB to counter select for recombination of the plasmid out
of the genome. The sequence of this plasmid has been deposited at Genbank, accession number MH166772.

Table S1. Chemical composition of FPF
Compound Concentration
(g/L)
Concentration
(M)
Weight
%
Carbon
weight
(g/L)
Carbon
weight
%
Acids Acetic acid a**, 8 114.64 1.9091 33.81 45.86 31.05
Formic acid a**, 9 60.37 1.3117 17.81 15.75 10.67
Propionic acid a**, 10 3.4 0.0459 1.00 1.65 1.12
Butanoic acid a 1.64 0.0186 0.48 0.89 0.61
Crotonic acid 0.98 0.0114 0.29 0.55 0.37
Acrylic acid a 7.5 0.1041 2.21 3.75 2.54
Pentanoic acid a 0.11 0.0011 0.03 0.06 0.04
Itaconic acid a 7.13 0.0548 2.10 3.29 2.23
Aldehydes Glycolaldehyde a*, 11 51.46 0.8570 15.18 20.58 13.94
Acetaldehyde a**, this study 4.36 0.0990 1.29 2.38 1.61
Furfural a*, 12 10.7 0.1114 3.16 6.69 4.53
Crotonaldehyde a 4.38 0.0625 1.29 3.00 2.03
5-Methylfurfural a 1.05 0.0095 0.31 0.69 0.47
5-(Hydroxymethyl)furfural a*, 12 0.54 0.0043 0.16 0.31 0.21
2-Methyl-2-butenal a 0.05 0.0006 0.01 0.04 0.02
3-Furaldehyde a 0.28 0.0029 0.08 0.18 0.12
Vanillin a**, 13 1.52 0.0100 0.45 0.96 0.65
Ketones Acetone a 6.01 0.1035 1.77 3.73 2.52
Acetol a 6.89 0.0930 2.03 3.35 2.27
2-Oxobutanol a 3.92 0.0445 1.16 2.14 1.45
Acetoin 0.3 0.0034 0.09 0.16 0.11
Cyclopentenone a 4.08 0.0497 1.20 2.98 2.02
Cyclotene a 2.92 0.0260 0.86 1.88 1.27
2-methylcyclopentenone a 1.38 0.0144 0.41 1.03 0.70
1-Methyl-1-cyclopenten-3-one 0.85 0.0088 0.25 0.64 0.43
2,3-Dimethyl-1-cyclopenten-1-
one
0.43 0.0039 0.13 0.33 0.22
Methyl vinyl ketone 0.09 0.0013 0.03 0.06 0.04
Butyrolactone a 1.11 0.0129 0.33 0.62 0.42
Methylpropyl ketone 0.67 0.0078 0.20 0.47 0.32
Cyclopentanone 0.39 0.0046 0.12 0.28 0.19

1,2-Cyclopentanedione 0.2 0.0020 0.06 0.12 0.08
Maple lactone 0.07 0.0006 0.02 0.04 0.03
1,4-Cyclohexanedione 0.15 0.0013 0.04 0.10 0.07
Biacetyl 0.51 0.0059 0.15 0.28 0.19
Acetylpropionyl 0.2 0.0020 0.06 0.12 0.08
2-Acetylfuran 0.35 0.0032 0.10 0.23 0.16
Maltol 0.29 0.0023 0.09 0.17 0.11
2(5H)-Furanone a 24.72 0.2940 7.29 14.13 9.57
3-Methyl-2(5H)-furanone 0.95 0.0097 0.28 0.58 0.39
4-Methyl-2(5H)-furanone 0.33 0.0034 0.10 0.20 0.14
5-Methyl-2(5H)-furanone 0.56 0.0057 0.17 0.34 0.23
Phenolics Phenol a 1.39 0.0148 0.41 1.06 0.72
Guaiacol a 1.66 0.0134 0.49 1.12 0.76
Syringol a 0.56 0.0036 0.17 0.35 0.24
o-Cresol a 0.6 0.0055 0.18 0.47 0.32
m-Cresol a 0.45 0.0042 0.13 0.35 0.24
p-Cresol a 0.45 0.0042 0.13 0.35 0.24
Creosol a 0.86 0.0062 0.25 0.60 0.40
4-propylguaiacol 0.03 0.0002 0.01 0.02 0.01
Catechol a**, 13 0.34 0.0031 0.10 0.22 0.15
4-Ethylguaiacol 0.29 0.0019 0.09 0.21 0.14
4-Vinylguaiacol 0.02 0.0001 0.01 0.01 0.01
2,3-Xylenol 0.02 0.0002 0.01 0.02 0.01
1,3,5-Xylenol 0.01 0.0001 0.00 0.01 0.01
2,6-Xylenol 0.07 0.0006 0.02 0.06 0.04
2,5-Xylenol a 0.34 0.0028 0.10 0.27 0.18
Trans-isoeugenol 0.05 0.0003 0.01 0.04 0.02
Eugenol 0.18 0.0011 0.05 0.13 0.09
2,5-Dimethoxytetrahydrofuran 0.11 0.0008 0.03 0.06 0.04
2-Ethylphenol 0.03 0.0002 0.01 0.02 0.02
2,3,5-Trimethylphenol 0.06 0.0004 0.02 0.05 0.03
2,3,4-Trihydroxybenzoic acid 0.14 0.0008 0.04 0.07 0.05
3,4,5-Trihydroxybenzoic acid 0.18 0.0011 0.05 0.09 0.06

Table S2. EC50 value of the most abundant compounds found in the thermochemical wastewater streams on
P. putida KT2440
Apocynin 0.02 0.0001 0.01 0.01 0.01
Sugars Levoglucosan 3.68 0.0202 1.09 1.46 0.99
Alcohol 1-Propanol 0.04 0.0007 0.01 0.02 0.02
a Compounds included in the synthetic medium ** Compounds can be completely metabolized by P. putida KT2440, as described in published literature * Compounds can be partially metabolized by P. putida KT2440, as described in published literature
Weight % was calculated based on the ratio of weight of particular compound and total weight of compounds. Carbon % was calculated based on the ratio of carbon weight of particular compound and total carbon weight of compounds.
Category Compound EC50 (mM) SEM
Aldehydes
Glycolaldehyde 2.14 0.42
Acetaldehyde 16.19 1.81
Furfural 20.97 3.98
Crotonaldehyde 17.37 2.81
5-methylfufaral 14.96 1.02
5-HMF 14.33 1.39
3-Furancarboxaldehyde 13.90 2.99
Vanillin 6.34 0.04
Glyoxal 3.50 0.28
Formaldehyde 2.07 0.19
Ketones
Acetone 39.34 0.01
Acetol 12.42 1.16
2-Oxobutanol 27.75 0.61
Methylolacetone 28.75 0.31
Adipic ketone 9.80 1.24
2-Butenolide 7.77 1.11
2-Methyl-butenolide 5.02 0.52
Phenolics
Phenol 9.24 0.15
Guaiacol 13.27 2.11
Syringol 4.21 0.57
o-Cresol 3.12 0.01
m-Cresol 3.46 0.47
p-Cresol 2.25 0.44
Catechol 42.41 6.47
2,5-Xylenol 2.52 0.12
Acids
Acetic acid 64.06 5.19
Formic acid 258.41 15.19
Propionic acid 22.44 1.33
Butanoic acid 35.25 3.03
Acrylic acid 11.68 0.46
Itaconic acid 89.40 16.33

Table S3. Significantly upregulated genes in both GA and FPF-treated P. putida KT2440 cultures
compared to control cultures.
Gene Annotation N. Log2 (GA)
- N. Log2 (untreated)
N. Log2 (FPF-treated)
- N. Log2 (untreated)
PP_1395 transcriptional regulator, AraC family 2.66 3.41
PP_1396 hypothetical protein 4.12 4.43
PP_1397 hypothetical protein 3.07 2.94
PP_2093 response regulator receiver and ANTAR domain protein 2.16 2.21
PP_2213 acyl-CoA ligase 2.28 2.27
PP_2425 transcriptional regulator, AraC family 5.67 4.96
PP_2426 D-isomer specific 2-hydroxyacid dehydrogenase family
protein
7.85 6.12
PP_2427 hypothetical protein 3.07 2.02
PP_2476 alcohol dehydrogenase, zinc-containing 3.56 2.19
PP_2647 major facilitator family transporter 6.11 3.59
PP_3425 multidrug efflux RND membrane fusion protein MexE 7.01 4.80
PP_3426 multidrug efflux RND transporter MexF 6.51 4.11
PP_3427 multidrug efflux RND outer membrane protein OprN 6.58 4.68
PP_3519 lipoprotein, putative 4.31 2.31
PP_3621 isoquinoline 1-oxidoreductase, alpha subunit, putative 2.48 3.78
PP_3622 isoquinoline 1-oxidoreductase, beta subunit, putative 2.88 3.60
PP_3623 cytochrome c family protein 2.58 3.41
PP_3745 glycolate oxidase, subunit GlcD 3.77 3.66
PP_3747 glycolate oxidase, iron-sulfur subunit 3.33 3.96
PP_3748 glcG protein 2.08 2.07
PP_3770 hypothetical protein 7.87 4.66
PP_4087 hypothetical protein 3.22 2.25
PP_4858 hypothetical protein 6.97 4.67
PP_5287 hypothetical protein 2.35 2.33
PP_5390 hypothetical protein 2.07 2.26

Table S4. Gene ontologies enriched in differentially expressed genes identified by RNA seq analysis
after FPF or glycolaldehyde-treatment. FPF-treated vs untreated GA-treated vs untreated
Upregulated
genes • No GO enrichment • Structural constituent of ribosome
• Iron ion binding
• Siderophore transport
Downregulated
genes • Alginic acid biosynthesis process
• Proton-transporting ATP synthase complex,
catalytic core F(1)
• Plasma membrane ATP synthesis coupled
proton transport
• Succinate-CoA ligase (ADP-forming)
activity
• Proton-transporting ATP synthase activity,
Rotational mechanism
• Ligase activity, forming nitrogen-metal
bonds, forming coordination complexes
• No GO enrichment
Table S5. Gene ontologies enriched in differentially expressed proteins
KT2440(FPF-treated)
vs KT2440(untreated)
LJ014 (untreated)
vs KT2440(untreated)
LJ014(FPF-treated)
vs KT2440(FPF-treated)
Higher
expression • Iron ion binding
• Gluconate dehydrogenase
activity
• Benzoate 1,2-dioxygenase
activity
• No GO enrichment • Siderophore transport
Receptor activity
• Iron ion binding
Lower
expression • Oxidation-reduction
process
• Oxidoreductase activity,
Acting on CH-OH group
of donors
• Flavin adenine
dinucleotide binding
• Acetate-CoA ligase
activity
• Acyl-CoA dehydrogenase
activity
• Acetyl-CoA activity
• Acyltransferase activity
• Metal ion transport
Sarcosine oxidase activity
• No GO enrichment • No GO enrichment

Table S6. Comparison of the most highly expressed RNAs and protein expression in putida KT2440 upon FPF
treatment
Gene Description RNA-seq Proteomics log2
PP_2425 transcriptional regulator, AraC family 3
PP_3427 multidrug efflux RND outer membrane protein OprN 2
PP_2791 aminoglycoside phosphotransferase 1
PP_3425 multidrug efflux RND membrane fusion protein MexE 0
PP_3426 multidrug efflux RND transporter MexF -1
PP_3745 glycolate oxidase, subunit GlcD -2
PP_1395 transcriptional regulator, AraC family -3
PP_2793 acyl-CoA dehydrogenase family protein
PP_3171 hypothetical protein
PP_2792 hypothetical protein
PP_2795 acyl-CoA synthase
PP_1397 hypothetical protein
PP_2797 acetate permease
PP_0057 major facilitator family transporter
PP_3746 glycolate oxidase, subunit GlcE
PP_2213 acyl-CoA ligase
PP_2476 alcohol dehydrogenase, zinc-containing
PP_3332 cytochrome c-type protein
PP_2727 C-factor, putative
PP_1427 RNA polymerase, sigma-24 subunit, RpoE
PP_1188 C4-dicarboxylate transport protein
PP_1418 tricarboxylate transport protein TctC, putative
PP_2475 transcriptional regulator, TetR family
PP_2681 pyrroloquinoline quinone biosynthesis protein PqqD
PP_2827 alcohol dehydrogenase, zinc-containing
PP_1829 hydrolase, alpha/beta fold family
PP_1964 deoxynucleotide monophosphate kinase, putative
PP_3748 glcG protein
PP_0837 hypothetical protein
PP_1148 hypothetical protein
PP_1750 asparagine synthase (glutamine-hydrolysing)
PP_3743 hypothetical protein
PP_4281 guanine deaminase (EC 3.5.4.3)
PP_2794 oxidoreductase, short chain dehydrogenase/reductase family
PP_2645 magnesium-translocating P-type ATPase
PP_4738 hypothetical protein
PP_2059 hypothetical protein
PP_4491 pterin-4-alpha-carbinolamine dehydratase
PP_0740 transcriptional regulator, MerR family
PP_4264 coproporphyrinogen III oxidase, anaerobic
PP_1254 xenobiotic reductase A

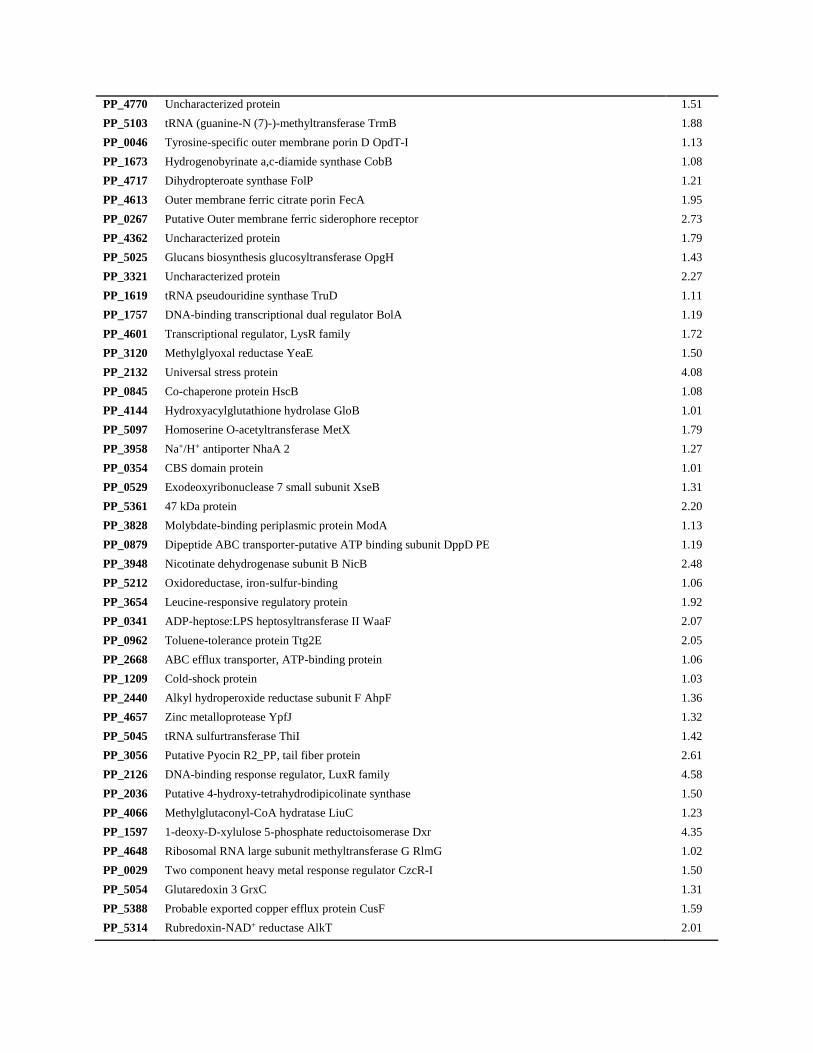
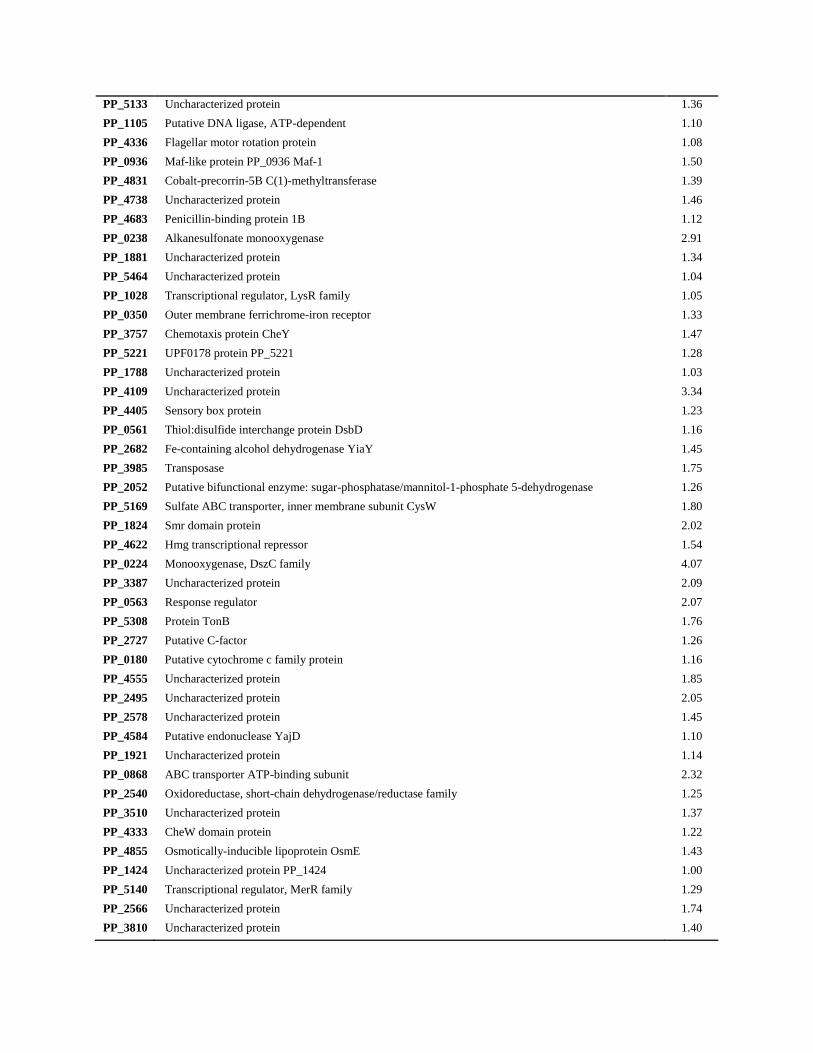
Table S7. Proteins more highly expressed in LJ014 relative to KT2440 when treated with 0.05% FPF (V/V)
PP_1930 transcriptional regulator, ArsR family
PP_3764 porin, putative
PP_5391 hypothetical protein
PP_2495 hypothetical protein
PP_1323 phosphoheptose isomerase
PP_3929 hypothetical protein
PP_1503 hypothetical protein
PP_0149 hypothetical protein
PP_2099 hypothetical protein
PP_1357 hypothetical protein
PP_1387 transcriptional regulator, TetR family
PP_3631 hypothetical protein
PP_0333 hypothetical protein
PP_4297 glyoxylate carboligase
PP_3610 hypothetical protein
PP_4288 ureidoglycolate hydrolase
PP_1300 amino acid ABC transporter ATP-binding protein, PAAT family
PP_3223 ABC transporter, periplasmic binding protein
PP_2270 DNA primase/helicase
Protein Description N. Log2
PP_1315 50S ribosomal protein L13 RplM 1.26
PP_3316 Putative Chaperone-associated ATPase 4.14
PP_1911 50S ribosomal protein L32 RpmF 1.19
PP_0938 Uncharacterized protein 1.81
PP_4809 Ribosomal silencing factor RsfS 2.84
PP_3095 Protein ClpV1 3.27
PP_4007 Translation initiation factor IF-1 InfA 2.02
PP_3332 Putative cytochrome c-type protein 1.07
PP_2468 50S ribosomal protein L20 RplT 1.38
PP_1352 UPF0234 protein 1.13
PP_3248 Dyp-type peroxidase family protein 1.02
PP_5171 Sulfate ABC transporter Sbp-II 1.36
PP_2698 5-methyltetrahydropteroyltriglutamate-homocysteine methyltransferase metE 1.61
PP_0472 50S ribosomal protein L30 RpmD 1.36
PP_3785 Uncharacterized protein 1.02
PP_1765 Ubiquinone biosynthesis O-methyltransferase UbiG 1.77
PP_4375 Flagellar protein FliS 1.61
PP_3722 Alanine racemase Alr 2.02
PP_2008 2,4-dienoyl-CoA reductase OS=Pseudomonas putida FadH 4.78
PP_5141 Thymidylate synthase ThyA 1.79
PP_3335 Uncharacterized protein 3.15
PP_4770 Uncharacterized protein 1.51
PP_5103 tRNA (guanine-N (7)-)-methyltransferase TrmB 1.88
PP_0046 Tyrosine-specific outer membrane porin D OpdT-I 1.13
PP_1673 Hydrogenobyrinate a,c-diamide synthase CobB 1.08
PP_4717 Dihydropteroate synthase FolP 1.21
PP_4613 Outer membrane ferric citrate porin FecA 1.95
PP_0267 Putative Outer membrane ferric siderophore receptor 2.73
PP_4362 Uncharacterized protein 1.79
PP_5025 Glucans biosynthesis glucosyltransferase OpgH 1.43
PP_3321 Uncharacterized protein 2.27
PP_1619 tRNA pseudouridine synthase TruD 1.11
PP_1757 DNA-binding transcriptional dual regulator BolA 1.19
PP_4601 Transcriptional regulator, LysR family 1.72
PP_3120 Methylglyoxal reductase YeaE 1.50
PP_2132 Universal stress protein 4.08
PP_0845 Co-chaperone protein HscB 1.08
PP_4144 Hydroxyacylglutathione hydrolase GloB 1.01
PP_5097 Homoserine O-acetyltransferase MetX 1.79
PP_3958 Na+/H+ antiporter NhaA 2 1.27
PP_0354 CBS domain protein 1.01
PP_0529 Exodeoxyribonuclease 7 small subunit XseB 1.31
PP_5361 47 kDa protein 2.20
PP_3828 Molybdate-binding periplasmic protein ModA 1.13
PP_0879 Dipeptide ABC transporter-putative ATP binding subunit DppD PE 1.19
PP_3948 Nicotinate dehydrogenase subunit B NicB 2.48
PP_5212 Oxidoreductase, iron-sulfur-binding 1.06
PP_3654 Leucine-responsive regulatory protein 1.92
PP_0341 ADP-heptose:LPS heptosyltransferase II WaaF 2.07
PP_0962 Toluene-tolerance protein Ttg2E 2.05
PP_2668 ABC efflux transporter, ATP-binding protein 1.06
PP_1209 Cold-shock protein 1.03
PP_2440 Alkyl hydroperoxide reductase subunit F AhpF 1.36
PP_4657 Zinc metalloprotease YpfJ 1.32
PP_5045 tRNA sulfurtransferase ThiI 1.42
PP_3056 Putative Pyocin R2_PP, tail fiber protein 2.61
PP_2126 DNA-binding response regulator, LuxR family 4.58
PP_2036 Putative 4-hydroxy-tetrahydrodipicolinate synthase 1.50
PP_4066 Methylglutaconyl-CoA hydratase LiuC 1.23
PP_1597 1-deoxy-D-xylulose 5-phosphate reductoisomerase Dxr 4.35
PP_4648 Ribosomal RNA large subunit methyltransferase G RlmG 1.02
PP_0029 Two component heavy metal response regulator CzcR-I 1.50
PP_5054 Glutaredoxin 3 GrxC 1.31
PP_5388 Probable exported copper efflux protein CusF 1.59
PP_5314 Rubredoxin-NAD+ reductase AlkT 2.01

PP_5068 UPF0061 protein 1.47
PP_1936 Uncharacterized protein 3.17
PP_3964 Transposase 5.50
PP_1290 Polysaccharide deacetylase family protein 1.06
PP_5431 Uncharacterized protein 1.62
PP_0400 Protein ApaG 1.66
PP_0242 Transcriptional regulator, TetR 1.29
PP_4285 5-hydroxyisourate hydrolase PucM 1.06
PP_0342 ADP-heptose:LPS heptosyltransferase I WaaC 1.08
PP_4814 ATP-dependent protease La domain protein 1.11
PP_2485 Uncharacterized protein 3.43
PP_4943 Putative Glycosyl transferase 1.06
PP_0052 Beta-lactamase domain protein, putative hydrolase 1.90
PP_3575 Outer membrane ferric siderophore receptor 3.87
PP_1395 Transcriptional regulator, AraC 1.00
PP_2696 DNA-binding transcriptional regulator, homocysteine-binding MetR-II 1.06
PP_2447 Uncharacterized protein 1.78
PP_3104 Uncharacterized protein 1.88
PP_0286 Adenine glycosylase MutY 1.19
PP_3989 DNA-cytosine methyltransferase 2.71
PP_5099 Uncharacterized protein 1.43
PP_2079 Uncharacterized protein 1.10
PP_0237 Aliphatic sulfonate ABC transporter-periplasmic binding protein / transport of isethionate SsuA 2.35
PP_1262 LysR family transcriptional regulator 1.18
PP_3509 Glyoxalase family protein 1.34
PP_5274 Uncharacterized protein 1.45
PP_3446 L-threonine dehydratase IlvA-I 1.11
PP_1144 Uncharacterized protein 2.11
PP_5253 Arylesterase OS=Pseudomonas putida 1.38
PP_1128 OmpA family protein 2.93
PP_3779 Transcriptional regulator, LysR family 2.78
PP_3155 Putative Outer membrane ferric siderophore receptor 2.78
PP_3008 Uncharacterized protein 2.65
PP_1492 Sensor histidine kinase/response regulator 1.13
PP_2016 Uncharacterized protein 1.16
PP_2379 Putative cytochrome oxidase biogenesis protein 1.21
PP_1073 Glycerol-3-phosphate dehydrogenase GlpD 2.01
PP_0820 GCN5-related N-acetyltransferase 1.45
PP_4745 Transposase 1.12
PP_1413 Uracil-DNA glycosylase Ung 2.61
PP_2414 Uncharacterized protein 1.29
PP_5618 Putative Cro/CI transcriptional regulator 1.71
PP_3573 Putative Monooxygenase 3.99
PP_0307 Uncharacterized protein 1.59

PP_5022 Glutamine transport ATP-binding protein GlnQ 1.09
PP_1221 Colicin S4 and filamentous phage transport system TolA 1.97
PP_1677 Cobyric acid synthase CobQ 2.66
PP_2650 Putative 4-hydroxybutyrate dehydrogenase Gbd 3.08
PP_2387 Uncharacterized protein 3.15
PP_4042 Glucose-6-phosphate 1-dehydrogenase ZwfB 1.25
PP_1672 Cob(I)alamin adenolsyltransferase/cobinamide ATP-dependent adenolsyltransferase 1.90
PP_3139 Glycosyl transferase, group 1 family protein 1.67
PP_0500 dTDP-4-rhamnose reductase-related protein 1.55
PP_3231 Uncharacterized protein 1.18
PP_5002 Uncharacterized protein 1.06
PP_1078 Putative ABC transporter, ATP-binding protein 1.89
PP_4674 RecBCD enzyme subunit RecC 1.28
PP_1516 RND membrane fusion protein 1.16
PP_3596 D-lysine oxidase AmaD 1.16
PP_3795 Uncharacterized protein 1.55
PP_4334 ParA family protein 1.64
PP_4761 Hydrolase, haloacid dehalogenase-like family 2.11
PP_1695 Putative Sodium-solute symporter/sensory box histidine kinase/response regulator 2.93
PP_2912 Uncharacterized protein 1.94
PP_3254 Putative Nucleosidase 1.35
PP_3067 Uncharacterized protein 1.24
PP_2443 Serine/threonine transporter SstT 1.22
PP_2836 Putative 2-keto-3-deoxyxylonate dehydratase 2.44
PP_2198 Aldose sugar dehydrogenase YliI 1.52
PP_0495 Type 1 L-asparaginase AnsA 1.03
PP_4171 Uncharacterized protein 1.11
PP_0136 Uncharacterized protein 1.13
PP_0976 Ribosomal RNA large subunit methyltransferase RlmF 1.23
PP_5101 Coproporphyrinogen/heterocyclic compound oxidase (Aerobic) yggW 1.72
PP_2005 Uncharacterized protein 1.31
PP_0861 Outer membrane ferric siderophore receptor 4.30
PP_3367 Uncharacterized protein 1.59
PP_3811 Transcriptional regulator, LysR family 2.22
PP_3116 LexA repressor 2 2.18
PP_2891 Acetyltransferase, GNAT family 1.41
PP_3364 Response regulator 1.29
PP_3563 Uncharacterized protein 1.28
PP_3191 Putative threonine ammonia-lyase / dehydratase 2.49
PP_0008 Ribonuclease P protein component RnpA 1.17
PP_0619 Branched-chain amino acid ABC transporter, periplasmic amino acid-binding protein 1.72
PP_3671 Oxidoreductase, aldo/keto reductase family 1.04
PP_3421 Sensor histidine kinase 1.21
PP_0076 Putative choline betaine-binding protein 1.25
PP_5133 Uncharacterized protein 1.36
PP_1105 Putative DNA ligase, ATP-dependent 1.10
PP_4336 Flagellar motor rotation protein 1.08
PP_0936 Maf-like protein PP_0936 Maf-1 1.50
PP_4831 Cobalt-precorrin-5B C(1)-methyltransferase 1.39
PP_4738 Uncharacterized protein 1.46
PP_4683 Penicillin-binding protein 1B 1.12
PP_0238 Alkanesulfonate monooxygenase 2.91
PP_1881 Uncharacterized protein 1.34
PP_5464 Uncharacterized protein 1.04
PP_1028 Transcriptional regulator, LysR family 1.05
PP_0350 Outer membrane ferrichrome-iron receptor 1.33
PP_3757 Chemotaxis protein CheY 1.47
PP_5221 UPF0178 protein PP_5221 1.28
PP_1788 Uncharacterized protein 1.03
PP_4109 Uncharacterized protein 3.34
PP_4405 Sensory box protein 1.23
PP_0561 Thiol:disulfide interchange protein DsbD 1.16
PP_2682 Fe-containing alcohol dehydrogenase YiaY 1.45
PP_3985 Transposase 1.75
PP_2052 Putative bifunctional enzyme: sugar-phosphatase/mannitol-1-phosphate 5-dehydrogenase 1.26
PP_5169 Sulfate ABC transporter, inner membrane subunit CysW 1.80
PP_1824 Smr domain protein 2.02
PP_4622 Hmg transcriptional repressor 1.54
PP_0224 Monooxygenase, DszC family 4.07
PP_3387 Uncharacterized protein 2.09
PP_0563 Response regulator 2.07
PP_5308 Protein TonB 1.76
PP_2727 Putative C-factor 1.26
PP_0180 Putative cytochrome c family protein 1.16
PP_4555 Uncharacterized protein 1.85
PP_2495 Uncharacterized protein 2.05
PP_2578 Uncharacterized protein 1.45
PP_4584 Putative endonuclease YajD 1.10
PP_1921 Uncharacterized protein 1.14
PP_0868 ABC transporter ATP-binding subunit 2.32
PP_2540 Oxidoreductase, short-chain dehydrogenase/reductase family 1.25
PP_3510 Uncharacterized protein 1.37
PP_4333 CheW domain protein 1.22
PP_4855 Osmotically-inducible lipoprotein OsmE 1.43
PP_1424 Uncharacterized protein PP_1424 1.00
PP_5140 Transcriptional regulator, MerR family 1.29
PP_2566 Uncharacterized protein 1.74
PP_3810 Uncharacterized protein 1.40

PP_2877 Putative osmotic pressure-regulated transporter YyfeH 1.27
PP_4032 Putative Outer membrane lipoprotein Blc 2.89
PP_1350 Sensory box histidine kinase/response regulator 4.26
PP_3142 Putative Sugar transferase 1.70
PP_4294 Conserved inner membrane protein YyedI 2.14
PP_0944 Fumarate hydratase class II FumC-I 1.14
PP_1005 Heme oxygenase HemO 1.26
PP_5659 Uncharacterized protein 1.24
PP_3753 Transcriptional regulator, AraC family 2.14
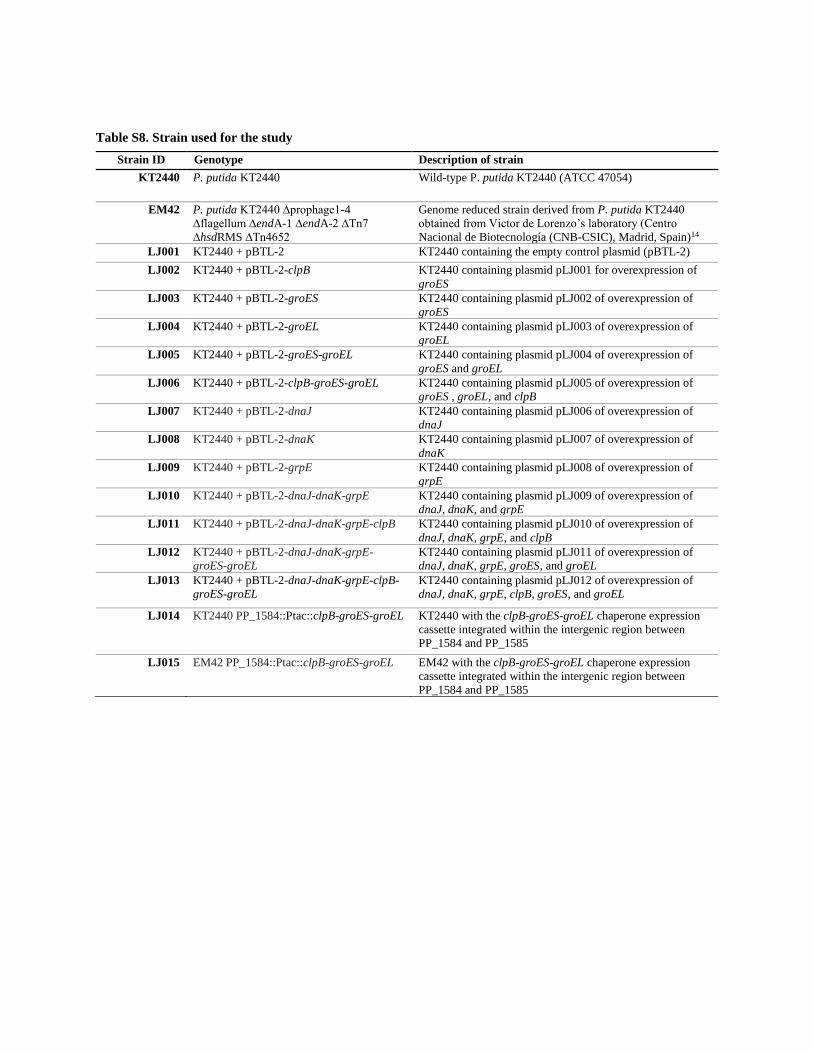
Table S8. Strain used for the study
Strain ID Genotype Description of strain
KT2440 P. putida KT2440 Wild-type P. putida KT2440 (ATCC 47054)
EM42 P. putida KT2440 ∆prophage1-4
∆flagellum ∆endA-1 ∆endA-2 ∆Tn7
∆hsdRMS ∆Tn4652
Genome reduced strain derived from P. putida KT2440
obtained from Victor de Lorenzo’s laboratory (Centro
Nacional de Biotecnología (CNB-CSIC), Madrid, Spain)14
LJ001 KT2440 + pBTL-2 KT2440 containing the empty control plasmid (pBTL-2)
LJ002 KT2440 + pBTL-2-clpB KT2440 containing plasmid pLJ001 for overexpression of
groES
LJ003 KT2440 + pBTL-2-groES KT2440 containing plasmid pLJ002 of overexpression of
groES
LJ004 KT2440 + pBTL-2-groEL KT2440 containing plasmid pLJ003 of overexpression of
groEL
LJ005 KT2440 + pBTL-2-groES-groEL KT2440 containing plasmid pLJ004 of overexpression of
groES and groEL
LJ006 KT2440 + pBTL-2-clpB-groES-groEL KT2440 containing plasmid pLJ005 of overexpression of
groES , groEL, and clpB
LJ007 KT2440 + pBTL-2-dnaJ KT2440 containing plasmid pLJ006 of overexpression of
dnaJ
LJ008 KT2440 + pBTL-2-dnaK KT2440 containing plasmid pLJ007 of overexpression of
dnaK
LJ009 KT2440 + pBTL-2-grpE KT2440 containing plasmid pLJ008 of overexpression of
grpE
LJ010 KT2440 + pBTL-2-dnaJ-dnaK-grpE KT2440 containing plasmid pLJ009 of overexpression of
dnaJ, dnaK, and grpE
LJ011 KT2440 + pBTL-2-dnaJ-dnaK-grpE-clpB KT2440 containing plasmid pLJ010 of overexpression of
dnaJ, dnaK, grpE, and clpB
LJ012 KT2440 + pBTL-2-dnaJ-dnaK-grpE-
groES-groEL
KT2440 containing plasmid pLJ011 of overexpression of
dnaJ, dnaK, grpE, groES, and groEL
LJ013 KT2440 + pBTL-2-dnaJ-dnaK-grpE-clpB-
groES-groEL
KT2440 containing plasmid pLJ012 of overexpression of
dnaJ, dnaK, grpE, clpB, groES, and groEL
LJ014 KT2440 PP_1584::Ptac::clpB-groES-groEL KT2440 with the clpB-groES-groEL chaperone expression
cassette integrated within the intergenic region between
PP_1584 and PP_1585
LJ015 EM42 PP_1584::Ptac::clpB-groES-groEL EM42 with the clpB-groES-groEL chaperone expression
cassette integrated within the intergenic region between
PP_1584 and PP_1585

Table S9. Thermochemical pyrolysis aqueous waste streams used in this study
Chemical compositions of these streams are reported in Black et al., 2016 and Starace et al., 2017.15, 16
Table S10. Primers used in construction of plasmids
Primer Sequence [5’-3’]
oLJ001 GGAATTGTGAGCGGATAACAATTTCACACTTCCGACCTGCCCTTTAAAGGAAGGTACAC
oLJ002 AATTGTGGTTTTCATAGCCCCGCAAACGCGGGG
oLJ003 CGCGTTTGCGGGGCTATGAAAACCACAATTTGG
oLJ006 CGCTGGAGTCTGAGGCTCGTCCTGAATGATTTTTGATGGTGCAGGGGG
oLJ018 TGAGGCTCGTCCTGAATGATAGCCCCGCAAACGCGGGG
oLJ020 GCGGATAACAATTTCACACTGCGGCCGCATGAAAACCACAATTTGG
oLJ021 TGAGGCTCGTCCTGAATGATAAACTTTGGAGTAACGGG
oLJ022 GCGGATAACAATTTCACACTGCGGCCGCTACTCCAAAGTTTTCAAGGATTAAACG
oLJ050 GGAATTGTGAGCGGATAACAATTTCACACTCTACCAAATTCAAGTTTCGGGAGAG
oLJ051 CGCTGGAGTCTGAGGCTCGTCCTGAATGATCGGCCGACAACATGCAGG
oLJ065 GCGGATAACAATTTCACACTAATTGCGCAGGAGAGACC
oLJ066 TGAGGCTCGTCCTGAATGATCCGAAGGATTTCAAGCCTTTTC
oLJ067 GCGGATAACAATTTCACACTCAACAAGGTGCAAATGAC
oLJ068 TGAGGCTCGTCCTGAATGATCTGTTCCTTGTCAGAGATCG
oLJ069 CCGAAACTTGCTGTTCCTTGTCAGAGATCG
oLJ070 CAAGGAACAGCAAGTTTCGGGAGAGTTAACAT
oLJ071 CTGCGCAATTCATGCAGGGATTACTGCTTG
oLJ072 TCCCTGCATGAATTGCGCAGGAGAGACC
oLJ073 GCAGGTCGGACCGAAGGATTTCAAGCCTTTTC
oLJ074 AATCCTTCGGTCCGACCTGCCCTTTAAAGGAAGGTACAC
oLJ075 TGGTTTTCATCCGAAGGATTTCAAGCCTTTTC
oLJ076 AATCCTTCGGATGAAAACCACAATTTGG
oLJ059 TGTGAGCGGATAACAATTTCACACTTCCGACCTGCCCTTTAAAGGAAGGTACAC
oLJ060 GCCTCCGGTCGGAGGCTTTTGACTATTTTGATGGTGCAGGGGG
oLJ144 GCGGGAGATCGACGCAAAAAACCGCACCCAGGTG
oLJ145 GAAGATTTACGCAACAGTCAAAAGCCTCCGGTCG
oLJ146 GACATGATTACGAATTCGAGCTCGGTACCCTCGAGCCAGACCTACCCAGCG
oLJ147 TGGGTGCGGTTTTTTGCGTCGATCTCCCGCCGG
oLJ148 CGGAGGCTTTTGACTGTTGCGTAAATCTTCCCCAAAAT
oLJ149 CGGCCAGTGCCAAGCTTGCATGCCTGCAGGGCCGACCAGCTTCGACAG
oLJ154 CGCGGTATCCGCAACAACAA
oLJ155 ACGCATCGTTCATCAGTGCCT
oCJ382 AATTAACAGTTAACAAATAATCAGACCCCGTAGAAAAGATCAAAGGATCTTC
oCJ384 ATGATTGAACAAGATGGATTGCACGCAGG
oCJ385 AACTTTTTGATGTTCATCGTCGCTCAGAAGAACTCGTCAAGAAGGCGATAGAAG
oCJ386 TTCTGAGCGACGATGAACATCAAAAAGTTTGCAAAACAAGCAACAGTATTAACC
oCJ387 TACGGGGTCTGATTATTTGTTAACTGTTAATTGTCCTTGTTCAAGGATGCTGTC
oCJ402 GGCGTTTTTCCATAGGCTCCGC
Process Abbreviation Derived from Source
Fast pyrolysis FP Pine National Renewable Energy
Laboratory
Fast pyrolysis with
fractionation
FPF Pine: 5th fraction Iowa State University
in situ catalytic fast
pyrolysis
in situ CFP Pine RTI international
Ex situ catalytic fast
pyrolysis
ex situ CFP Pine: Davison circulating
riser reactor with Ecat
catalysis
National Renewable Energy
Laboratory

Table S11. Sequence of the synthetic DNA fragment used in construction of pK18sB
Table S12. Plasmid construction details
(5’-3’)
TCAGGGGGGCGGAGCCTATGGAAAAACGCCTCACACAGGAAACAGCTATGACATGATTACGAATTCGAGCTCG
GTACCCGGGGATCCTCTAGAGTCGACCTGCAGGCATGCAAGCTTGGCACTGGCCGTCGTTTTACAACGTCGTGA
CCGGAATTGCCAGCTGGGGCGCCCTCTGGTAAGGTTGGGAAGCCCTGCAAACAGGATGAGGATCGTTTCGCATG
ATTGAACAAGATGGATTGCACGCAGGT
Plasmid Purpose Construction detail
pK18sB
(Genbank:
MH166772)
Integration of genes into P. putida genome From pK18mobsacB (GenBank: FJ437239.1), the pMB1
origin of replication was amplified with with oCJ382/oCJ402
(595 bp), the nptII kanamycin resistance gene was amplified
with oCJ384/oCJ385 (795 bp), and the sacB levan sucrose
gene was amplified with oCJ386/oCJ387 (1,422 bp), and
these products were assembled with a double-stranded DNA
fragment synthesized by IDT containing the pK multiple
cloning site and M13 F and M13 R primer binding sites.
pLJ001 Overexpressing clpB A DNA fragment containing the clpB gene, including 30 base
pairs upstream and 20 base pairs downstream, was amplified
from P. putida KT2440 genomic DNA with primers oLJ001
(Fwd) and oLJ018 (Rev). This product was assembled into
pBLT-2 digested with XbaI and EcoRV.
pLJ002 Overexpressing groES A DNA fragment containing the groES gene, including 30
base pairs upstream and 20 base pairs downstream, was
amplified from P. putida KT2440 genomic DNA with
primers oLJ020 (Fwd) and oLJ021 (Rev). This product was
assembled into pBLT-2 digested with XbaI and EcoRV.
pLJ003 Overexpressing groEL A DNA fragment containing the groEL gene, including 30
base pairs upstream and 20 base pairs downstream, was
amplified from P. putida KT2440 genomic DNA with
primers oLJ022 (Fwd) and oLJ006 (Rev). This product was
assembled into pBLT-2 digested with XbaI and EcoRV.
pLJ004 Overexpressing groES and groEL A DNA fragment containing the groES and groEL genes,
including 30 base pairs upstream and 20 base pairs
downstream, was amplified from P. putida KT2440 genomic
DNA with primers oLJ020 (Fwd) and oLJ006 (Rev). This
product was assembled into pBLT-2 digested with XbaI and
EcoRV.
pLJ005 Overexpressing clpB, groES and groEL DNA fragments containing the clpB and groES-groEL genes,
both with and 30 base pairs upstream and 20 base pairs
downstream, were amplified from P. putida KT2440
genomic DNA with primers oLJ001 (Fwd) and oLJ002
(Rev), and oLJ003 (Fwd) and oLJ006, respectively. These
products were assembled into pBLT-2 digested with XbaI
and EcoRV.
pLJ006 Overexpressing dnaJ A DNA fragment containing the dnaJ gene, including 30 base
pairs upstream and 20 base pairs downstream, was amplified
from P. putida KT2440 genomic DNA with primers oLJ067
(Fwd) and oLJ068. This product was assembled into pBLT-
2 digested with XbaI and EcoRV.
pLJ007 Overexpressing dnaK A DNA fragment containing the dnaK gene, including 30
base pairs upstream and 20 base pairs downstream, was
amplified from P. putida KT2440 genomic DNA with
primers oLJ050 (Fwd) and oLJ051. This product was
assembled into pBLT-2 digested with XbaI and EcoRV.
pLJ008 Overexpressing grpE A DNA fragment containing the grpE gene and 30 base pairs
upstream and 20 base pairs downstream were amplified from
P. putida KT2440 genomic DNA with primers oLJ065 (Fwd)

and oLJ066. This product was assembled into pBLT-2
digested with XbaI and EcoRV.
pLJ009 Overexpressing dnaJ, dnaK, and grpE DNA fragments containing the dnaJ, dnaK, and grpE genes,
all with and 30 base pairs upstream and 20 base pairs
downstream, were amplified from P. putida KT2440
genomic DNA with primers oLJ067 (Fwd) and oLJ069
(Rev), oLJ070 (Fwd) and oLJ071 (Rev), and oLJ072 (Fwd)
and oLJ066 (Rev), respectively. These products were
assembled into pBLT-2 digested with XbaI and EcoRV.
pLJ010 Overexpressing dnaJ, dnaK, grepE and
clpB
A DNA fragment containing the clpB gene, including 30 base
pairs upstream and 20 base pairs downstream, was amplified
from P. putida KT2440 genomic DNA with primers oLJ074
(Fwd) and oLJ018 (Rev) and a fragment containing the dnaJ,
dnaK, and grpE genes was amplified with primers oLJ067
(Fwd) and oLJ073 (Rev) using pLJ009 as a template. These
products were assembled into pBLT-2 digested with XbaI
and EcoRV.
pLJ011 Overexpressing dnaJ, dnaK, grepE, groES
and groEL
A DNA fragment containing the dnaJ, dnaK, and grpE genes
was amplified using pLJ009 as a template with primers
oLJ067 (Fwd) and oLJ075 (Rev) and a DNA fragment
containing the groES and groEL genes, including 30 base
pairs upstream and 20 base pairs downstream, was amplified
with primers oLJ076 (Fwd) and oLJ006 (Rev) from P. putida
KT2440 genomic DNA. These products were assembled into
pBLT-2 digested with XbaI and EcoRV.
pLJ012 Overexpressing dnaJ, dnaK, grepE, clpB,
groES, and groEL
A DNA fragment containing the dnaJ, dnaK, and grpE genes
was amplified using pLJ009 as a template with primers
oLJ067 (Fwd) and oLJ073 (Rev) and a fragment contain the
clpB, groES, and groEL genes was amplified with primers
oLJ074 (Fwd) and oLJ006 (Rev) using pLJ005 as a template.
These products were assembled into pBLT-2 digested with
XbaI and EcoRV.
pLJ013 To integrate the tac promoter
upstream of clpB-groES-groEL and used
as a
template in construction of
pCJ014
A DNA fragment containing the clpB, groES, and groEL
genes was amplified using pLJ005 as a template with primers
oLJ059 (Fwd) and oLJ060 (Rev), and assembled These
products were assembled into pMFL160 digested with XbaI
and SpeI.17
pLJ014 Genome integration of overexpressing
cassette of clpB, groES and groEL
The TSoxR-Ptac::clpB-groES-groEL-TtonB gene cassette was
amplified with primers oLJ144 (Fwd) and oLJ145 (Rev)
using pLJ013 as a temple. The 5’ homology region was
amplified from P. putida KT2440 genomic DNA with
primers oLJ146 (Fwd), and oLJ147 (Rev), and 3’ homology
region was amplified with oLJ148 (Fwd) and oLJ149 (Rev).
These products were assembled into pK18sB digested with
SmaI and SalI.

References
1. Y. Liao, G. K. Smyth and W. Shi, Bioinformatics, 2013, 30, 923-930.
2. M. I. Love, W. Huber and S. Anders, Genome Biol., 2014, 15, 550.
3. S. M. Clarkson, R. J. Giannone, D. M. Kridelbaugh, J. G. Elkins, A. M. Guss and J. K. Michener, Appl.
Environ. Microbiol., 2017, 83, e01313-01317.
4. D. L. Tabb, C. G. Fernando and M. C. Chambers, J. Proteome Res., 2007, 6, 654-661.
5. Z.-Q. Ma, S. Dasari, M. C. Chambers, M. D. Litton, S. M. Sobecki, L. J. Zimmerman, P. J. Halvey, B.
Schilling, P. M. Drake and B. W. Gibson, J. Proteome Res., 2009, 8, 3872-3881.
6. R. C. Edgar, Bioinformatics, 2010, 26, 2460-2461.
7. V. Girish and A. Vijayalakshmi, Indian J. Cancer, 2004, 41, 47.
8. I. Poblete‐Castro, J. M. Borrero‐de Acuña, P. I. Nikel, M. Kohlstedt and C. Wittmann, Ind. Biotechnol., 2017,
299-326.
9. A. Roca, J. J. Rodríguez-Herva and J. L. Ramos, J. Bacteriol., 2009, 191, 3367-3374.
10. P. Fonseca, R. Moreno and F. Rojo, Environmental microbiology reports, 2011, 3, 329-339.
11. Mary Ann Franden, Lahiru Jayakody, Wing-Jin Li, Neil J. Wagner, Bernhard Hauer, Lars M. Blank, Nick
Wierckx, Janosch Klebensberger, and Gregg T. Beckham, Metab. Eng., 2018, (in revision)
12. M. T. Guarnieri, M. A. Franden, C. W. Johnson and G. T. Beckham, Metab. Eng. Commun., 2017, 4, 22-28.
13. J. Jiménez, J. Nogales, J. García and E. Díaz, in Handbook of hydrocarbon and lipid microbiology, Springer,
2010, pp. 1297-1325.
14. E. Martínez-García, P. I. Nikel, T. Aparicio and V. de Lorenzo, Microb. Cell Fact., 2014, 13, 159.
15. B. A. Black, W. E. Michener, K. J. Ramirez, M. J. Biddy, B. C. Knott, M. W. Jarvis, J. Olstad, O. D. Mante,
D. C. Dayton and G. T. Beckham, ACS Sustain. Chem. Eng., 2016, 4, 6815-6827.
16. A. K. Starace, B. A. Black, D. D. Lee, E. C. Palmiotti, K. A. Orton, W. E. Michener, J. ten Dam, M. J.
Watson, G. T. Beckham and K. A. Magrini, ACS Sustain. Chem. Eng., 2017, 5, 11761-11769.
Copyright © 2022 FDOKUMEN