Electronic excitation temperature profiles in an air microwave plasma torch
36
PSFC/JA-01-5 Electronic Excitation Temperature Profiles in an Air Microwave Torch K. Green, M. C. Borrás, P. P. Woskov, G. J. Flores III, K. Hadidi, and P. Thomas January 2001 Plasma Science and Fusion Center Massachusetts Institute of Technology Cambridge, MA 02139 This work was supported by the U. S. Department of Energy, Office of Science and Technology, Mixed Waste Focus Area. Reproduction, translation, publication, and use in whole or in part, by or for the United States government is permitted. Submitted for publication to IEEE Transactions on Plasma Science
-
Upload
independent -
Category
Documents
-
view
4 -
download
0
Transcript of Electronic excitation temperature profiles in an air microwave plasma torch
PSFC/JA-01-5
Electronic Excitation Temperature Profilesin an Air Microwave Torch
K. Green, M. C. Borrás, P. P. Woskov, G. J. Flores III,K. Hadidi, and P. Thomas
January 2001
Plasma Science and Fusion CenterMassachusetts Institute of Technology
Cambridge, MA 02139
This work was supported by the U. S. Department of Energy, Office of Science andTechnology, Mixed Waste Focus Area. Reproduction, translation, publication, and use inwhole or in part, by or for the United States government is permitted.
Submitted for publication to IEEE Transactions on Plasma Science

1
Electronic Excitation Temperature Profiles
in an Air Microwave Plasma Torch
K.M. Green, M.C. Borrás, P.P. Woskov, G.J. Flores III, K. Hadidi, P. Thomas
Massachusetts Institute of Technology, Plasma Science and Fusion Center,
167 Albany Street, Cambridge, MA 02139
Abstract — A 0.9 to 1.5 kW, 2.45 GHz atmospheric pressure air microwave plasma torch has
been operated efficiently with less than 1 % reflected power. The plasma is sustained in a
28 mm internal diameter fused quartz tube which penetrates perpendicularly through the wide
walls of a tapered and shorted WR-284 (72 x 17 mm cross-section) waveguide. A study has
been made of the effects of power and airflow on the electronic excitation temperature, Texc.
Abel inversion of radial profile chord averaged Fe I emission lines in the 370 to 377 nm range
have been used to obtain localized profile measurements of Texc inside the waveguide excitation
region. In general, temperature profiles peak on axis with no evidence of a skin effect in the
large diameter (10 mm FWHM emission intensity) plasmas. A maximum central Texc of 6550 K
± 350 K is observed at an airflow rate of 28 lpm. When maintaining a constant flow rate of 14
lpm, a 55 % increase in microwave power from 0.9 to 1.4 kW causes a ~100 % increase in
plasma volume without any noticeable effect on the central Texc value. At a constant microwave
power of 1.4 kW, an increase in total flow rate from 11 to 28 lpm decreases the volume of the
plasma by ~25 % and increases the central Texc by ~13 %. The axially peaked temperature
profiles are consistent with an electron density of ~ 1013 cm-3.
Index terms: electronic excitation temperature, microwave plasma, atmospheric pressure
plasma, atomic emission spectroscopy
2
I. INTRODUCTION
Considerable interest exists in medium to high-power, atmospheric pressure microwave
sustained plasmas for environmental and industrial processing as well as monitoring
applications. The main advantages of such plasmas are electrodeless operation, high throughput
atmospheric processing, efficient microwave to plasma coupling, and availability of inexpensive
sources at 0.915 and 2.45 GHz. Low power (< 500 W) atmospheric pressure microwave-
induced plasmas (MIPs) have had a long history of use for laboratory spectroscopic analysis
instrumentation. Such plasmas can be formed in resonant cavity, waveguide, or surface-effect
systems [1]. The plasma gas typically consists of argon, helium, nitrogen, or air [1]-[4]. More
recently, there have been studies and applications of higher power (>1 kW) microwave plasmas
to increase plasma robustness for laboratory spectroscopic analysis [5, 6], continuous emissions
monitoring in the field [7], commercial processing [8], and other applications [9].
Atmospheric microwave plasmas can operate over a wide range of electron plasma
density regimes from low density glow-discharge like plasmas [8, 9] to higher density arc-
discharge like torch plasmas [5-7]. The work reported here focuses on a microwave plasma
torch (MPT) under development for continuous emissions monitoring of smokestack hazardous
metals air pollution. The MPT can be a reliable stack mounted technology for real-time atomic
emission spectroscopy of trace metals [7]. However, the excitation efficiency in an air plasma
for some metals with high electronic excitation energies is not as high as in a plasma without
oxygen in the gas matrix [10,11]. Understanding how the electronic excitation temperature may

3
be increased in an atmospheric air MPT would be of value for reducing the detection limits for
some important pollutants such as mercury and arsenic.
Atmospheric pressure microwave plasmas are not as well studied as radio frequency
inductively coupled plasma (ICP) systems. Numerous plasma temperature studies have been
performed of ICPs. In these studies the temperature is lower in air plasmas, which impedes the
excitation of the sample species and, therefore, depresses the characteristic atomic line emission.
Gomes et al. [12] report lower temperatures in air ICP plasmas than in argon ICP plasmas,
explaining that the polyatomic species in air store energy in their excited levels. Abdallah and
Mermet [13] report that a few percent of nitrogen introduced into an argon ICP plasma also
reduces the plasma temperature. In the case of a MPT, Hadidi et al. [10] have shown that the
addition of oxygen to a nitrogen plasma decreases the rotational and electronic excitation
temperatures. Since the presence of molecular species is inherent to an air MPT for application
as a stack pollution monitor, the objective of the experiments reported here is to examine the
effect of other parameters such as microwave power level and volume of gas flow on the
electronic excitation temperature.
II. EXPERIMENTAL SETUP
The experimental setup used is shown in Figure 1. The microwave generator is an
ASTeX Model S-1500i 1.5 kW, 2.45 GHz magnetron source. The output of the magnetron is
connected by WR-284 waveguide to a circulator, which in turn is connected to a triple stub
impedance matching tuner and a water-cooled reflected power dump. A Teflon window seals
the output of the triple stub tuner to keep the circulator and magnetron clean of dust from the
4
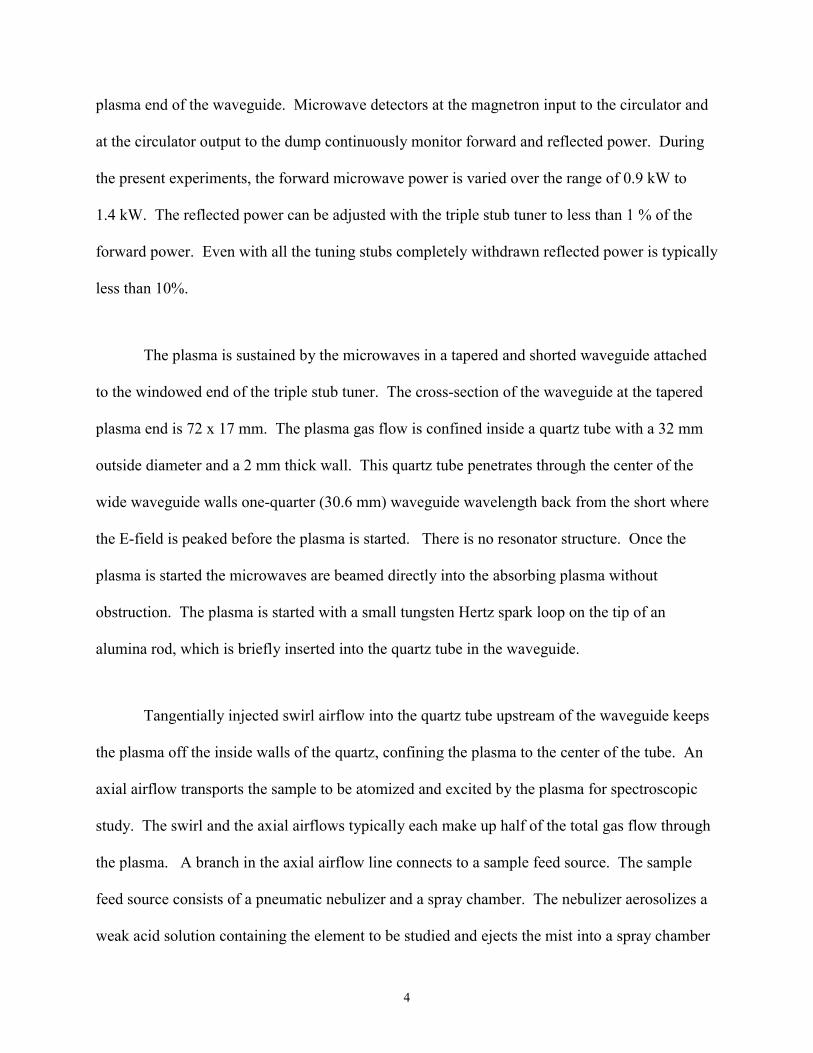
plasma end of the waveguide. Microwave detectors at the magnetron input to the circulator and
at the circulator output to the dump continuously monitor forward and reflected power. During
the present experiments, the forward microwave power is varied over the range of 0.9 kW to
1.4 kW. The reflected power can be adjusted with the triple stub tuner to less than 1 % of the
forward power. Even with all the tuning stubs completely withdrawn reflected power is typically
less than 10%.
The plasma is sustained by the microwaves in a tapered and shorted waveguide attached
to the windowed end of the triple stub tuner. The cross-section of the waveguide at the tapered
plasma end is 72 x 17 mm. The plasma gas flow is confined inside a quartz tube with a 32 mm
outside diameter and a 2 mm thick wall. This quartz tube penetrates through the center of the
wide waveguide walls one-quarter (30.6 mm) waveguide wavelength back from the short where
the E-field is peaked before the plasma is started. There is no resonator structure. Once the
plasma is started the microwaves are beamed directly into the absorbing plasma without
obstruction. The plasma is started with a small tungsten Hertz spark loop on the tip of an
alumina rod, which is briefly inserted into the quartz tube in the waveguide.
Tangentially injected swirl airflow into the quartz tube upstream of the waveguide keeps
the plasma off the inside walls of the quartz, confining the plasma to the center of the tube. An
axial airflow transports the sample to be atomized and excited by the plasma for spectroscopic
study. The swirl and the axial airflows typically each make up half of the total gas flow through
the plasma. A branch in the axial airflow line connects to a sample feed source. The sample
feed source consists of a pneumatic nebulizer and a spray chamber. The nebulizer aerosolizes a
weak acid solution containing the element to be studied and ejects the mist into a spray chamber
5
at a rate of ∼1 ml/min each for the liquid and drive gas feed rates. The spray chamber limits
water loading by filtering large droplets (over 99 % of the original solution) into a waste
container [14]. The branch line is heated to volatilize the liquid droplets as they are transported
to the plasma.
The plasma emission light is viewed through a large aperture in the waveguide short.
The aperture is beyond the cut off for transmission of 2.45 GHz radiation with a cross-section of
32 x 12.7 mm and a depth of 30 mm. A pair of quartz lenses image and magnify, by a factor of
two, the plasma light onto a plane where a fiber optic cable is used to scan the plasma diameter.
The fiber optic is a UV quartz cable with a core diameter of 0.8 mm and a numerical aperture of
0.22. Data collection occurs for up to sixty-six chords that are evenly spaced in one-millimeter
increments.
The fiber optic is connected to an Instruments S.A. Model THR-640, 0.64 m
spectrometer which has a 2400 groove/mm grating, an adjustable slit, and a Princeton
Instruments Model IRY-512W intensified 512-element detector array. For the present
experiments with atomic iron emission, this spectrometer is tuned to cover the 370 – 377 nm
spectral range with a spectral resolution of about 0.05 nm.
The sample feed uses an Alpha Aesar calibrated solution having a concentration of
10,000 µg/ml of iron dissolved in a 5% solution of nitric acid. To obtain accurate emission
levels when the aerosol iron sample is injected into the plasma, deionized water is first injected
to obtain a blank water background spectrum. Subtracting the water background from the iron
6
spectrum removes the influence of the water loading on the plasma light intensity. The influence
of the nitric acid on the plasma is assumed negligible, and all remaining signal light is assumed
due only to the influence of the iron in the plasma. Figure 2 shows a representative iron spectrum
obtained in the present setup.
III. THEORY
A. Abel Inversion
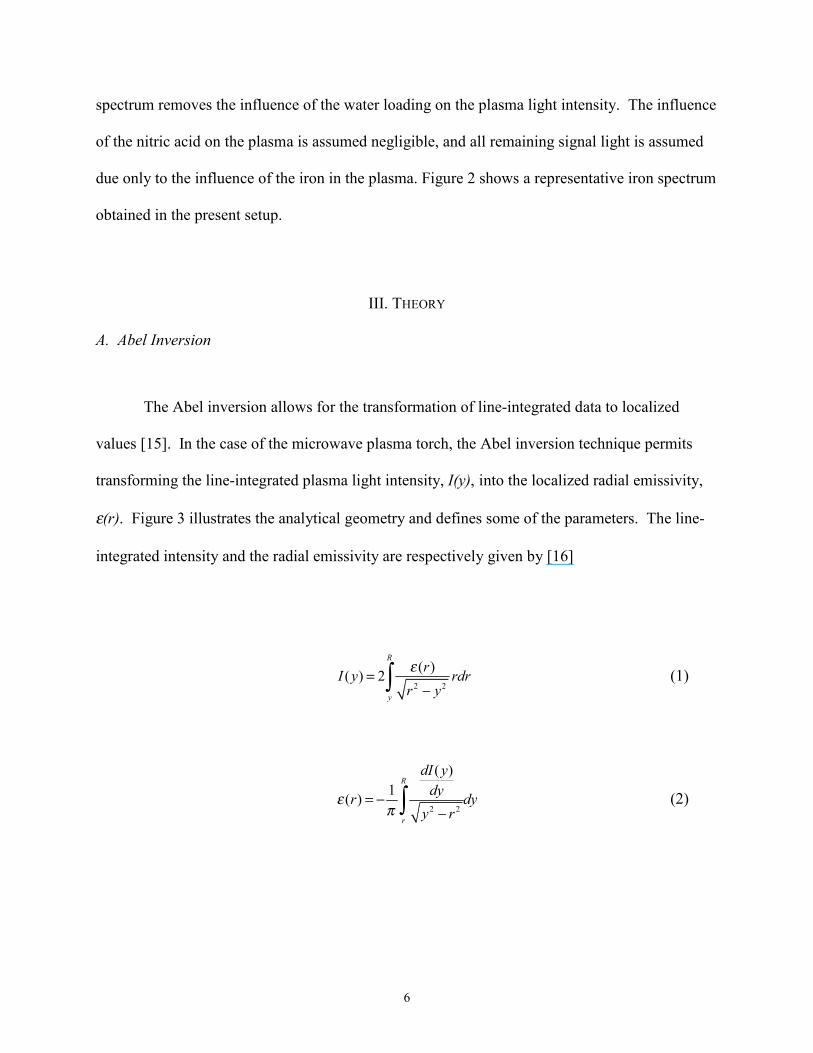
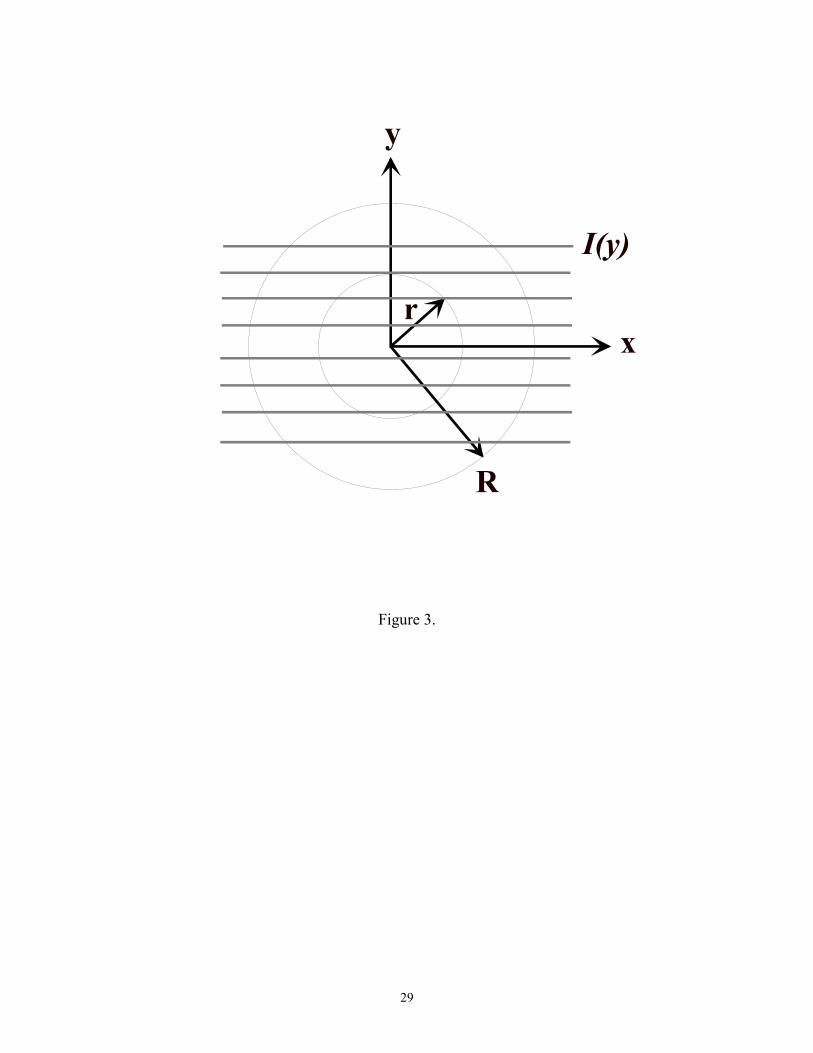
The Abel inversion allows for the transformation of line-integrated data to localized
values [15]. In the case of the microwave plasma torch, the Abel inversion technique permits
transforming the line-integrated plasma light intensity, I(y), into the localized radial emissivity,
ε(r). Figure 3 illustrates the analytical geometry and defines some of the parameters. The line-
integrated intensity and the radial emissivity are respectively given by [16]
2 2
( )( ) 2
R
y
rI y rdr
r y
ε=−∫ (1)
2 2
( )1
( )
R
r
dI ydy
r dyy r
επ
= −−∫ (2)
7
where R is the maximum plasma radius. The units for the line integrated intensity and for the
radial emissivity are Wm-3sr-1 and Wm-4sr-1, respectively.
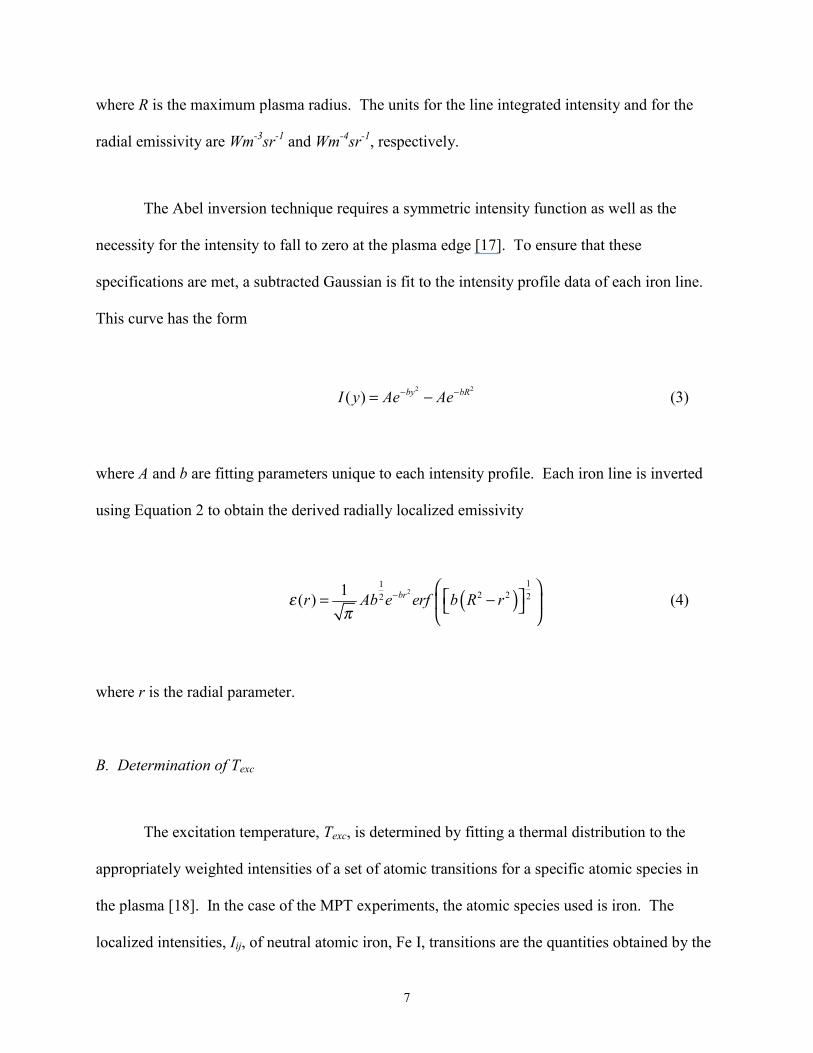
The Abel inversion technique requires a symmetric intensity function as well as the
necessity for the intensity to fall to zero at the plasma edge [17]. To ensure that these
specifications are met, a subtracted Gaussian is fit to the intensity profile data of each iron line.
This curve has the form
2 2
( ) by bRI y Ae Ae− −= − (3)
where A and b are fitting parameters unique to each intensity profile. Each iron line is inverted
using Equation 2 to obtain the derived radially localized emissivity
( )211
2 2 221( ) brr Ab e erf b R rε
π− = −
(4)
where r is the radial parameter.
B. Determination of Texc
The excitation temperature, Texc, is determined by fitting a thermal distribution to the
appropriately weighted intensities of a set of atomic transitions for a specific atomic species in
the plasma [18]. In the case of the MPT experiments, the atomic species used is iron. The
localized intensities, Iij, of neutral atomic iron, Fe I, transitions are the quantities obtained by the

8
Abel inversion of the measured chord averaged intensities in the MPT system. The iron lines of
interest fall in the range between 368 nm to 377 nm. To yield Texc, the appropriate statistics and
oscillator strengths are used to scale the intensities. Each observed Fe I wavelength has an
associated energy level, Ej, a statistical weight, gi, and oscillator strength, fij, as given in Table I
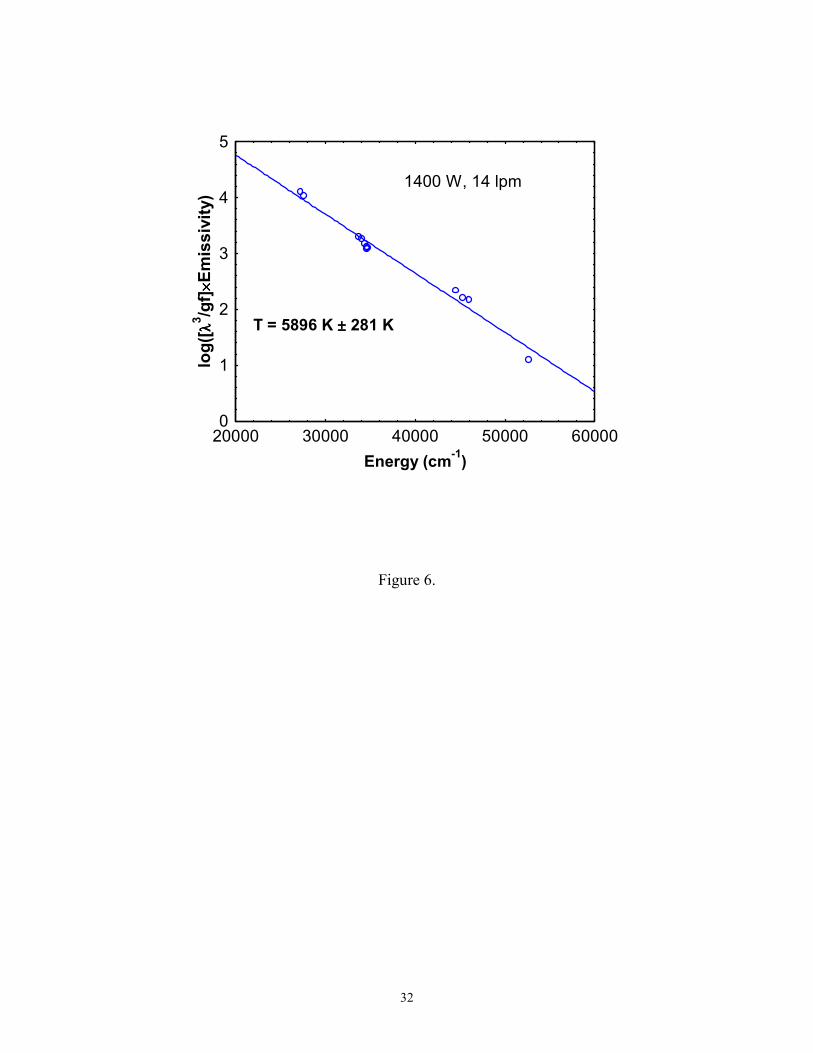
[19]. The calculation of Texc at a particular radius entails plotting 3log( / )ij i ijI g fλ versus Ej [18].
The slope of a straight line fit to these points relates to the electronic excitation temperature by
0.625excT
m= − (5)
where Texc is in K, and m is the slope of the line [15]. The deviation from a straight line
determines the error in Texc.
Performing this calculation at each radial point provides the Texc profile in the plasma.
Since the light emission levels decline rapidly near r = 10 mm, the error in Texc becomes quite
large beyond this range. Therefore, the Texc profile measurements extend only to this radius.
A key assumption in this analysis of Texc is that neutral atomic iron and the electrons are
each in thermal equilibrium. If the plasma is shown to be in or near local thermodynamic
equilibrium (LTE), then this assumption is valid. The condition of LTE specifies that all
temperatures in the plasma are equal except the blackbody radiation temperature [15]. LTE
requires that the collisional processes dominate the radiative processes in the plasma [17].
C. Determining Proximity to LTE
9
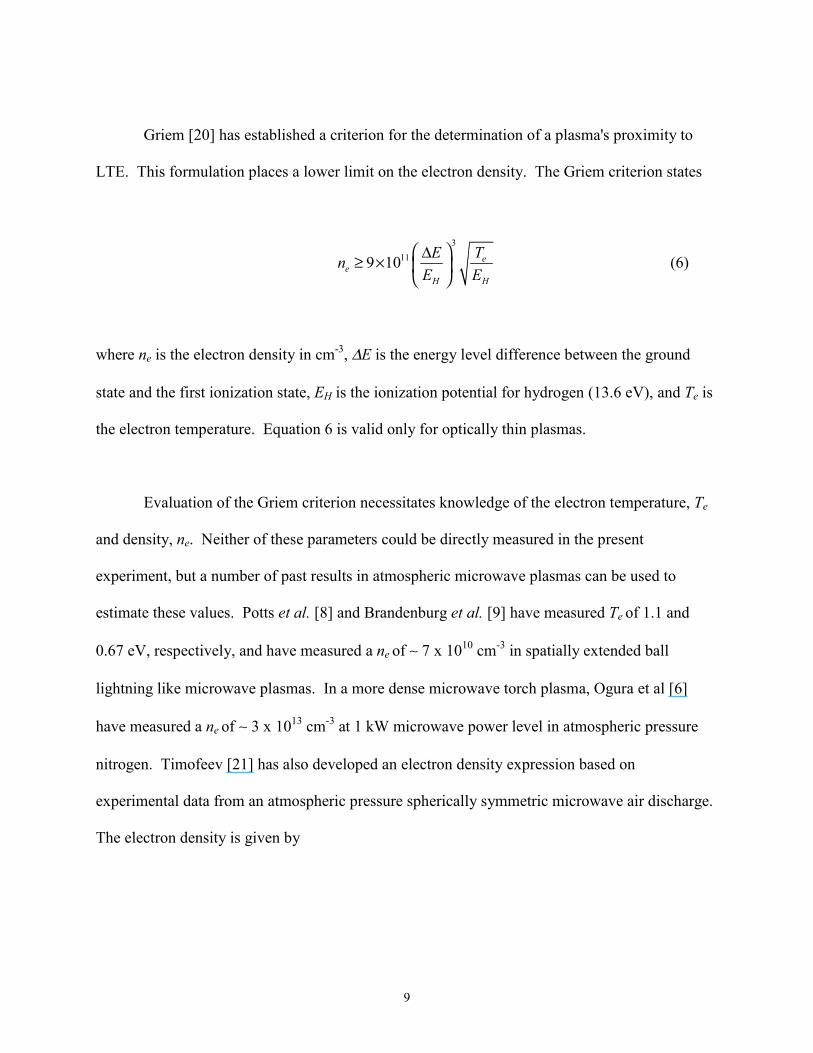
Griem [20] has established a criterion for the determination of a plasma's proximity to
LTE. This formulation places a lower limit on the electron density. The Griem criterion states
3
119 10 ee
H H
TEn
E E
∆≥ ×
(6)
where ne is the electron density in cm-3, ∆E is the energy level difference between the ground
state and the first ionization state, EH is the ionization potential for hydrogen (13.6 eV), and Te is
the electron temperature. Equation 6 is valid only for optically thin plasmas.
Evaluation of the Griem criterion necessitates knowledge of the electron temperature, Te
and density, ne. Neither of these parameters could be directly measured in the present
experiment, but a number of past results in atmospheric microwave plasmas can be used to
estimate these values. Potts et al. [8] and Brandenburg et al. [9] have measured Te of 1.1 and
0.67 eV, respectively, and have measured a ne of ∼ 7 x 1010 cm-3 in spatially extended ball
lightning like microwave plasmas. In a more dense microwave torch plasma, Ogura et al [6]
have measured a ne of ∼ 3 x 1013 cm-3 at 1 kW microwave power level in atmospheric pressure
nitrogen. Timofeev [21] has also developed an electron density expression based on
experimental data from an atmospheric pressure spherically symmetric microwave air discharge.
The electron density is given by
10
14.4215 1.745.91 10
0
T
een−
− ×=
( )( )
1.74
1.74
T
T
><
(7)
where ne is in cm-3, and T is the temperature at LTE measured in 103 K. Anticipating our
temperature measurements below, Equation 7 results in ne of ∼ 2 x 1014 cm-3.
Evaluating Equation 6 for an electron temperature of approximately 1 eV and for a ∆E
corresponding to the ionization potential for the N2 molecule (15.6 eV) results in an electron
density threshold of ∼3 x 1011 cm-3 for LTE. This value is well below the electron densities for
an atmospheric microwave torch plasma and near the measured values for the more tenuous ball
lightning like microwave plasmas. Therefore, based on the Griem criteria the assumption of
LTE is believed to be valid for the MPT Texc analysis presented here. Further support for the
validity of this assumption can be found in Borrás [22] where measurements of the rotational
temperature in the present MPT system in nitrogen are presented and are approximately the same
as the Texc measurements presented below.
IV. EXPERIMENTAL RESULTS
A. As a Function of Microwave Power
For the experiments at different forward microwave power levels, the total airflow rate is
held constant at 14 lpm. The data are collected at three power levels, 900 W, 1150 W, and

11
1400 W. Figure 4 shows one of the chord averaged emission intensity profiles for the 373.5 nm
Fe I transition at 1400 kW. The points represent experimental measurements, and the line is a
best fit of Equation 3. The agreement between the subtracted Gaussian profile and the
experiment is good. This profile is typical for other iron transitions and other power levels.
Though all the measured profiles have a similar shape to that of Figure 4, the light emission
intensity diameter and level increase with microwave power over the studied power range.
Figure 5 depicts the Abel inverted and normalized light emission profiles for a
representative Fe I transition. Quite noticeable is the increase in plasma size. The Abel inverted
light emission intensity profiles are also well represented by Gaussian profiles peaked on axis, as
expected. No evidence of profile flattening or going over to a hollow profile with increasing
microwave power is observed to suggest a finite microwave absorption depth less than the
maximum plasma radius.
As the forward microwave power is increased by 55 % from 900 W to 1400 W, the
plasma diameter full width at half maximum (FWHM) increases from 4.5 to 6.5 mm. This
growth corresponds to an increase in the plasma cross-sectional area and volume inside the
waveguide by over 100 %. This observation is consistent with other RF driven atmospheric
plasmas. Abdallah and Mermet [23] report an inflation in their inductively-coupled argon
plasma with an increase in power.
Using the localized emission intensities of 12 or more Fe I transitions such as the one
shown in Figure 5, a Texc temperature fit is obtained as described in Section II.B. A

12
representative temperature fit is shown in Figure 6 for the axial temperature at 1400 W.
Temperature fits such as this are done at each radial position across the scanned plasma radius.
The emission light levels where strong enough on the weak Fe lines only out to a plasma radius
of 10 mm to do a temperature fit. The resulting Texc temperature profiles are shown in Figure 7.
The temperature profiles are almost flat out to the largest measurable plasma radius of 10 mm
with a maximum of 5800 K ± 200 K on axis. At the 10 mm radius this temperature is still 80%
of its value on axis, where the plasma emission intensity is less than a few percent of its on axis
value. Increasing the microwave power has no effect within the error bars of the measurements
on the temperature of the plasma. This observation is consistent with other atmospheric
microwave plasma work. Timofeev has reported that increasing the microwave power by two
orders of magnitude produces only a minor effect on the plasma temperature of an atmospheric
pressure microwave plasma discharge and flat profiles within a spherical discharge [21]. The
additional microwave power contributes to expanding the plasma volume rather than heating the
plasma to a higher temperature.
B. As a Function of Airflow
For the experiments at different airflow rates, the forward microwave power is held
constant at 1400 W. Four total airflow rates, 11 lpm, 14 lpm, 23 lpm, and 28 lpm, are examined.
For the 14 lpm case, the axial airflow constitutes 8 lpm while the swirl airflow makes up 6 lpm
of the total flow. For all of the other airflow rates, the axial and swirl airflows constitute equal
portions of the total.

13
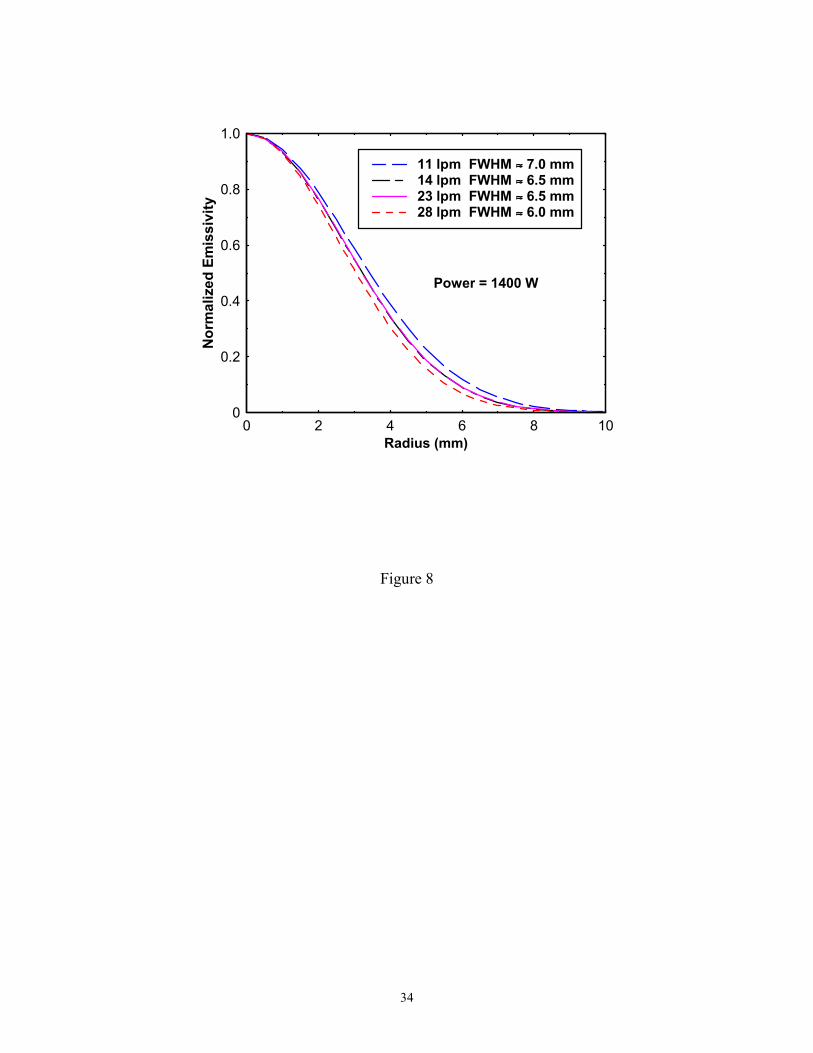
Figure 8 displays the results of this study for a representative Fe I transition. The
localized light emission profiles have been normalized to the same value on axis. The plasma
diameter decreases slightly as the total airflow rate increases. For a total airflow rate increase of
11 lpm to 28 lpm the plasma radius at FWHM decreases from 7.0 to 6.0 mm corresponding to a
cross-sectional area or plasma volume decrease inside the waveguide of 27 %. This result
suggests an improved confinement of the plasma by increasing the total airflow rate.
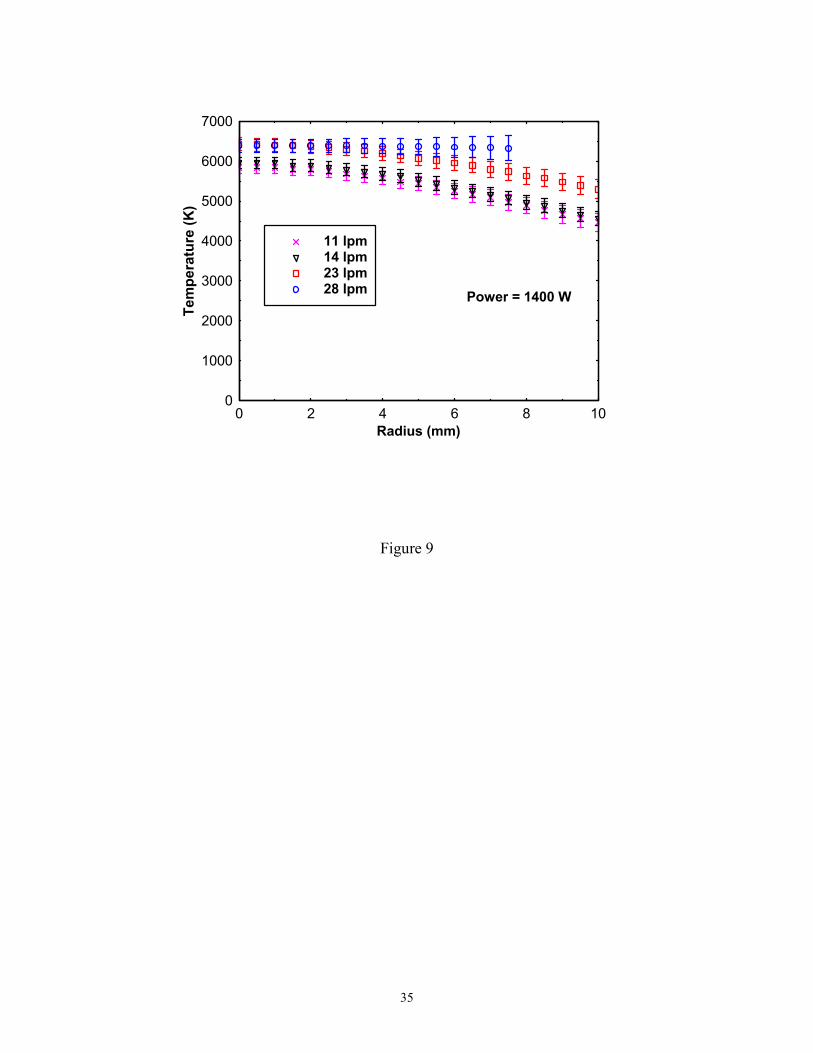
The electronic excitation temperature is again obtained by utilizing the localized plasma
light emission intensities of 12 or more Fe I transitions like the one shown in Figure 8. The
resulting Texc profiles for the various airflows are plotted in Figure 9. The temperature profiles
are again almost flat, but now an increase in temperature is observed as the airflow increases.
The axial temperature increases 13 % from 5800 K ± 200 K to 6550 K ± 350 K over the range of
airflow studied. For the highest airflow at 28 lpm the temperature data is possible only out to an
8 mm radius because of the decrease in the plasma light emission diameter. The temperature
profile at the highest flow also looks much flatter.
The observed temperature increase with airflow is contrary to expectations. Increasing
the flow velocity through the plasma is expected to cool the plasma and reduce temperatures.
Ogura et al. [6] report the lowest electronic excitation values with the highest carrier gas flow
rate. This decrease is attributed to an increased plasma loading of particulates and a reduced
plasma residence time. In the present MPT case increasing the axial flow rate does not
correspondingly increase the feed rate and apparently a decreased residence time does not reduce
the plasma temperature within the range of flow velocities of the present experiment.
14
V. DISCUSSION
A. Interpretation of Texc Profiles
The lack of dependence of Texc on the microwave power can be understood in terms of
the high collisionality of atmospheric pressure plasmas. The atmospheric microwave plasma is
weakly ionized even for the highest electron density torch plasmas. The dominant electron
collisions are with neutrals. As given in Timofeev [21] this collision frequency can be estimated
by ( ) ( ) ( )eT n T v Tν σ= , where ( ) /o on T n T T= is the neutrals density, no is the Loschmidt
number (2.69 x 1019 cm-3), To is room temperature, ( ) 3 /e ev T kT m= , and σ is the cross-section
for electron-neutral collisions which is assumed to be 10-15 cm2. For the measured MPT
temperature of 5800 K the electron-neutral collision frequency is thus estimated as 7 x 10¹⁰ s-1.
During one 2.45 GHz microwave cycle, an electron experiences more than 25 collisions with a
mean free path between collisions of about 7 µm. The microwave electric field has insufficient
time to accelerate the electrons to a high energy before inelastic collisions with neutrals cause the
electrons to lose energy.
The internal energy states in an air plasma matrix limit the electron temperature through
the high collision rate. However, all the microwave energy is absorbed as the forward power is
increased. The measurements show that at a constant airflow rate this added energy goes to
increasing the plasma volume rather than increasing the temperature. This fact is not a detriment
for a MPT air metals pollution monitor. Estimates show that the sample species in the axial flow
diffuses away from the center of the plasma as the gas flows through the waveguide [24]. The

15
expansion of the plasma diameter at high microwave power ensures an enlarged region in which
the species may experience excitation. If the plasma is optically thin, which is the case for most
metals of interest, the extra light emission can be collected to increase detection limits. This
technique is in fact utilized when the MPT is viewed axially rather than radially to increase the
light collection path length in the plasma to obtain lower detection limits [7].
Unfortunately, not all atomic emissions are optically thin in an atmospheric plasma and
therefore a larger plasma does not help. In the important case of mercury the strongest
transitions terminate on the ground state. Consequently, the unexcited atoms cause self-
absorption [11]. In this case the excitation efficiency must be increased to the lower detection
limits, which requires more electrons with energies above the 4.9 eV excitation energy for
mercury.
The measurements show that higher plasma temperatures are possible with higher airflow
rates that cause the plasma to become more constricted. In Figure 6, the plasma volume
decreases by ∼27% as the gas flow rate increases from 11 lpm to 28 lpm. The peak temperature
on axis correspondingly increases by ∼13% as shown in Figure 9. This improved plasma
confinement may, in part, be attributed to a high swirl flow rate in the 28 lpm total gas flow rate
regime. The microwave energy absorbed does not change and thus with the smaller plasma
volume the temperature rises. Therefore, for improving MPT performance for monitoring
applications of some metals such as mercury, this result suggests that engineering smaller
constricted microwave plasmas of high power could produce higher temperature for more
efficient atomic excitation.
16
B. Skin Depth
The plasma cross-section size that can be driven efficiently by microwaves will be
determined by what the absorption depth or skin depth is in the plasma. The results presented
here demonstrate that the skin depth for the present MPT must be of the order of the plasma
radius. If it were much more there would be large reflected power. If it were less the emissivity
profiles in these figures would display a flattening or hollowing near the center of the plasma as
observed in ICP plasmas with skin depths less than the plasma radius [25]. Therefore, the skin
depth for the MPT must be about 0.5 cm for single pass absorption to be efficient.
Lieberman and Lichtenberg [26] describe the collisional skin depth, δ, by
1
22
pe
c νδω ω
= (8)
where c is the speed of light in a vacuum, 2 /pe e o ee n mω ε= is the electron plasma frequency in
radians s-1, ν is the momentum collision frequency in Hz, and ω is the microwave frequency in
radians s-1. Equation 8 is valid only if ωpe, ν >> ω, which is true for the present MPT
experiments.
Evaluation of Equation 8 requires knowledge of the electron density, which was not
measure. However, this equation can be rearranged to solve for the electron density using the
17
observed plasma radius as the skin depth and the collision frequency derived above. The
resulting electron density is ∼ 1013 cm-3, which is consistent with the MPT measurements of
Ogura et al [6]. This result suggests that the formalism of Equation 8 can be used to understand
MPT performance. The observed increase in plasma temperature and continued efficient
microwave absorption in a smaller plasma size agree with this model. Because of the
dependence of the collision frequency on temperature, the skin depth will decrease as the
temperature increases allowing total absorption by smaller plasmas. The electron density will
probably also increase with temperature to help this scaling. Thus efficient higher temperature
microwave plasmas should be possible for application to mercury monitoring.
Large MPT plasma dimensions are also possible, which can be of value to many
processing applications that require electrodeless plasma operation. Conventional wisdom states
that scaling RF driven ICP torches to higher power and larger dimensions requires going to
lower frequencies. This reasoning is based on the frequency scaling of the skin depth. However,
the atmospheric MPT plasma cross-section compares favorably with lower frequency RF driven
ICPs at comparable powers. In addition, the MPT has a much higher coupling efficiency of
electromagnetic energy to the plasma. Therefore, the MPT may be a superior technology for
applications where electrodeless plasma operation is important.
VI. CONCLUSIONS
Electronic excitation temperature profile measurements in an atmospheric pressure air
microwave plasma torch over a power range of 900 to 1400 W show that power has little effect

18
on temperature with all other parameters such as airflow rate held constant. Over this power
range, Texc remains constant at 5800 ± 200 K on axis with an almost flat temperature profile. The
temperature decreases by less than 20% out to a radius of 10 mm where the plasma light
emission has decreased by more 95% of the on axis intensity. Increasing power only causes the
plasma diameter to become larger, leading to an increase in the plasma volume by about 100%
over the studied power range.
The electronic excitation temperature does increase when the plasma column is confined
to a smaller diameter by increased axial and swirl airflow. Increasing the total airflow from 11 to
28 lpm reduces the plasma volume by about 25 % and increases the electronic excitation
temperature by about 13 % to 6550 ± 350 K. The continued efficient absorption of all the
microwave power with smaller plasma cross-section is consistent with a collisional skin depth
model when temperature also increases. The efficient atmospheric microwave plasma torch
should find useful applications where electrodeless and high throughput operations are
important.
ACKNOWLEDGEMENT
The research presented in this text was sponsored by the Mixed Waste Focus Area,
Office of Science and Technology, Environmental Management, U. S. Department of Energy.
19
REFERENCES
[1] A. T. Zander and G. M. Hieftje, “Microwave-supported discharges”, Applied Spectroscopy
vol. 35, no.4, pp. 357 –371, 1981.
[2] K. Fallgatter, V. Svoboda, and J. D. Winefordner, “Physical and analytical aspects of a
microwave excited plasma”, Applied Spectroscopy, vol. 25, no. 3, pp. 347 –352, 1971.
[3] K. A. Forbes, E. E. Reszke, P. C. Uden, and R. M. Barnes, “Comparison of microwave-
induced plasma sources”, J. of Analytical Atomic Spectrometry, vol. 6, pp. 57 –71, February
1991.
[4] K. C. Ng and W .L. Shen, “Solution nebulization into low-power argon microwave-induced
plasma for atomic emission spectrometry: study of synthetic ocean water”, Anal. Chem, vol.
58, pp. 2084 –2087, 1986.
[5] Y. Okamoto, “Annular-shaped microwave-induced nitrogen plasma at atmospheric pressure
for emission spectrometry of solutions”, Analytical Sciences, vol. 7, pp. 283 –288, April
1991.
[6] K. Ogura, H.Yamada, Y Sato, and Y. Okamoto, Excitation temperature in high-power
nitrogen microwave-induced plasma at atmospheric pressure”, Applied Spectroscopy, vol.
51, no. 10 pp. 1496 –1499, 1997.
20
[7] P. P. Woskov, K. Hadidi, P. Thomas, K. Green, and G. Flores, “Accurate and sensitive
metals emissions monitoring with an atmospheric microwave-plasma having an real-time
span calibration”, Waste Management, vol. 20, pp. 395-403, 2000.
[8] H. Potts and J. Hugill, “Studies of high-pressure, partially ionized plasma generated by 2.45
GHz, microwaves”, Plasma Sources Sci. Technol., vol. 9, pp. 18-24, 2000.
[9] J. E. Brandenburg and J. F. Kline, “Experimental Investigation of Large-Volume PIA
Plasmas at Atmospheric Pressure”, IEEE Trans. on Plasma Sci., vol. 26, no. 2, pp. 145-149,
1998.
[10] K. Hadidi, P. P. Woskov, G. J. Flores, K. Green, and P. Thomas, “Effect of oxygen
concentration on the detection of mercury in an atmospheric microwave discharge”, Jpn. J.
Appl. Phys., vol. 38, pp. 4595-4600, 1999.
[11] K. Hadidi, P. P. Woskov, K. Green, and P. Thomas, “Observation of self absorption of
mercury I and cadmium I emission in an atmospheric microwave sustained plasma”, J. Anal.
At. Spectrom., vol. 15, pp. 601-605, 2000.
[12] A. M. Gomes, J. Bacri, J. P. Sarrette, and J. Salon, “Measurement of heavy particle
temperature in a radiofrequency air discharge at atmospheric pressure from the numerical

21
simulation of the NOγ system” Journal of Analytical Atomic Spectrometry, vol. 7 pp. 1103 –
1109, October 1992.
[13] M. H. Abdallah and J. M. Mermet, “The behavior of nitrogen excited in an inductively
coupled argon plasma”, J. Quant. Spectrosc. Radiat. Transfer, vol. 19, pp. 83 –91, 1978.
[14] G. J. Flores, “Establishing a calibration for a microwave plasma continuous emissions
monitor”, Master ’s Thesis, Massachusetts Institute of Technology, Nuclear Engineering
Department, 1998.
[15] P. W. J. M. Boumans, editor, Chemical Analysis, vol. 90, John Wiley & Sons, Inc., New
York, Chapters 10-11, 1987.
[16] K. Miyamoto, Plasma Physics for Nuclear Fusion, The MIT Press, Cambridge,
Massachusetts, revised edition, 1989.
[17] I.H.Hutchinson, Principles of Plasma Diagnostics, Cambridge University Press, Cambridge,
1994.
[18] J. P. Matousek, B. J. Orr, and M. Selby, “Microwave-induced plasmas: Implementation and
application”, Prog. analyt. atom. Spectrosc., vol. 7, pp. 275 –314, 1984.
22
[19] J. F. Alder, R. M. Bombelk, and G. F. Kirkbright, “Electronic excitation and ionization
temperature measurements in a high frequency inductively coupled argon plasma source and
the influence of water vapor on plasma parameters”, Spectrochimica Acta B, vol. 35, pp.163
–175, 1980.
[20] H. R. Griem, Plasma Spectroscopy, McGraw-Hill Book Company, New York, 1964.
[21] A. V. Timofeev, “Theory of microwave discharges at atmospheric pressures”, Plasma
Physics Reports, vol. 23, no. 72, pp. 158 –164, 1997.
[22] M. C. Borrás, K. Hadidi, P. Woskov, K. M. Green, G. J. Flores, and P. Thomas, “An
experiment for radial temperature profile measurements in a microwave induced plasma at
atmospheric pressure”, IEEE Conference Record-Abstracts, p. 169, 1998 IEEE International
Conference on Plasma Science, Raleigh, NC, June 1-4, 1998.
[23] M. H. Abdallah, and J. M. Mermet, “Comparison of temperature measurements in ICP and
MIP with Ar and He as plasma gas”, Spectrochimica Acta B , vol. 37, no. 5, pp. 391 –397,
1982.
[24] B. R. Pollack, “Establishing isokinetic flow for a plasma torch exhaust gas diagnostic for a
plasma hearth furnace”, Master ’s Thesis, Massachusetts Institute of Technology, Nuclear
Engineering Department and Mechanical Engineering Department, 1996.

23
[25] M. I. Boulos, “The inductively coupled RF (radio frequency) plasma”, Pure & Appl. Chem.,
vol. 57, no. 9, pp. 1321-1352, 1985.
[26] M. A. Lieberman and A. J. Lichtenberg, Principles of Plasma Discharges and Materials
Processing, John Wiley & Sons, Inc., New York, 1994.

24
Table I. Fe I Emission Lines Used for Texc Determination [19]Wavelength, λ (nm) Ej (cm-1) 1020λ/gf (m3)368.222 55754 2.6202368.411 49135 9.5279370.108 51192 5.1878370.446 48703 18.8875371.993 26875 13.8549372.438 45221 25.8918372.762 34547 17.1512373.239 44512 16.4422373.486 33695 2.5517373.713 27167 19.3916374.826 27560 53.8876374.948 34040 3.5638375.823 34329 5.3082376.379 34547 8.258376.554 52655 1.5757376.719 34692 11.6964

25
Figure Captions
Figure 1. Experimental setup of the microwave plasma torch for atomic emission profile
measurements.
Figure 2. Typical atomic iron (Fe I) spectrum observed in the MPT.
Figure 3. Geometry for Abel inversion.
Figure 4. Radial profile of the chord averaged plasma emission intensity at the 373.5 nm Fe I
transition. Points are experimental measurements and the line is a fit of Eq. 3.
Figure 5. Normalized light emission at constant flow rate with varying power for a
representative Fe I transition.
Figure 6. Temperature fit to localized iron transition emission intensities on axis.
Figure 7. Electronic excitation temperature at constant flow for different microwave forward
power levels.
Figure 8. Normalized light emission at constant power with varying flow rate for a representative
Fe I transition.
26
Figure 9. Electronic excitation temperature at constant microwave power for different total gas
flow rates.

27
Figure 1.
TaperedWaveguide
Circulator Magnetron
ReflectedPowerDump
Triple StubTuner
Short withAperture
WindowQuartzTube
Nebulizer
Swirl Air
AxialAir
Exhaust
Feed fromSolution
NebulizerDrive Gas
Heated
SprayChamber
Lenses
HorizontalTranslation
Stage
FiberCable
MicrowaveSource
SampleFeed
Optics

28
Figure 2.
0
0.2
0.4
0.6
0.8
1.0
370 372 374 376
Fe I
Wavelength (nm)
Inte
nsi
ty (
rela
tive
)
29
Figure 3.
y
r
R
I(y)
x

30
Figure 4.
0
2000
4000
6000
8000
10000
0 10 20 30
Curve fitRaw data
Power = 1400 W
Total flow rate = 14 lpm
Chord (mm)
Inte
nsi
ty (
rela
tive
)

31
Figure 5.
0
0.2
0.4
0.6
0.8
1.0
0 2 4 6 8 10
1400 W FWHM ≈≈≈≈ 6.5 mm1150 W FWHM ≈≈≈≈ 5.5 mm 900 W FWHM ≈≈≈≈ 4.5 mm
Total Flow ≈≈≈≈ 14 lpm
Radius (mm)
No
rmal
ized
Em
issi
vity
32
Figure 6.
0
1
2
3
4
5
20000 30000 40000 50000 60000
1400 W, 14 lpm
T = 5896 K ±±±± 281 K
Energy (cm-1
)
log
([λ λλλ3
/gf]× ××× E
mis
siv
ity)

33
Figure 7.
0
1000
2000
3000
4000
5000
6000
0 2 4 6 8 10
900 W1150 W1400 W
Total Flow ≈≈≈≈ 14 lpm
Radius (mm)
Ele
ctro
nic
Exc
itat
ion
Tem
per
atu
re (
K)
34
Figure 8
0
0.2
0.4
0.6
0.8
1.0
0 2 4 6 8 10
11 lpm FWHM ≈≈≈≈ 7.0 mm14 lpm FWHM ≈≈≈≈ 6.5 mm23 lpm FWHM ≈≈≈≈ 6.5 mm28 lpm FWHM ≈≈≈≈ 6.0 mm
Power = 1400 W
Radius (mm)
No
rmal
ized
Em
issi
vity
35
Figure 9
0
1000
2000
3000
4000
5000
6000
7000
0 2 4 6 8 10
11 lpm14 lpm23 lpm28 lpm
Power = 1400 W
Radius (mm)
Tem
per
atu
re (
K)