Electromagnetic tracking in the clinical environment
46
Computer Aided Interventions and Medical Robotics Electromagnetic Tracking in the Clinical Environment:A Buyer’s Guide Ziv Yaniv, Emmanuel Wilson, David Lindisch, Kevin Cleary Technical Report CAIMR TR-2008-1 July 2008 Georgetown University, Imaging Science and Information Systems Center, Washington, DC, 20007, http://www.caimr.georgetown.edu/
-
Upload
georgetown -
Category
Documents
-
view
1 -
download
0
Transcript of Electromagnetic tracking in the clinical environment

Computer Aided Interventions and Medical Robotics
Electromagnetic Tracking in the Clinical Environment:A Buyer’s Guide
Ziv Yaniv, Emmanuel Wilson, David Lindisch, Kevin Cleary
Technical Report CAIMR TR-2008-1
July 2008
Georgetown University, Imaging Science and Information Systems Center, Washington, DC, 20007, http://www.caimr.georgetown.edu/

Electromagnetic Tracking in the Clinical Environment: A
Buyer’s Guide
Ziv Yaniv, Emmanuel Wilson, David Lindisch, and Kevin Cleary
Imaging Science and Information Systems Center,Department of Radiology, Georgetown University Medical Center,
Washington, DC, USA.Email:{zivy,wilsone}@isis.georgetown.edu
Abstract
When choosing an Electromagnetic Tracking System (EMTS) for image-guided proce-dures several factors must be taken into consideration. Among others these include, thesystem’s refresh rate, the number of sensors that need to be tracked, the size of the navi-gated region, system interaction with the environment, can the sensors be embedded intothe tools and provide the desired transformation data, and tracking accuracy and robust-ness. To date, the only factors that have been studied extensively, are the accuracy andthe susceptibility of electromagnetic tracking systems to distortions caused by ferromag-netic materials. In this paper we provide an analysis based on these factors as assessedin three clinical environments. We evaluate two commercial tracking systems, the Aurorasystem from Northern Digital Inc., and the 3D Guidance system with three different fieldgenerators, from Ascension Technology Corp.. We show that these systems are applica-ble to specific procedures and specific environments, but that currently, no single systemconfiguration provides a comprehensive solution across procedures and environments.
1 Introduction
Tracking systems are a key component in image-guided interventions [1]. Of the several types ofavailable systems, optical ones were the first to be widely adopted in the clinical environment,as they provide accurate measurements that are not significantly effected by environmentalfactors. These systems have two key characteristics that limit their use in many interventions.They require a direct line-of-sight between the tracking system and tracked tools, and theycannot track flexible instruments. Electromagnetic Tracking Systems (EMTS) do not placesuch restrictions, and are thus potentially applicable in a large number of interventions thatutilize flexible instruments inside the body. On the other hand EMTS are often less accuratethan optical systems and are susceptible to distortions induced by ferromagnetic materials.
These challenges have led researchers to evaluate EMTS using a focused approach, character-izing system accuracy and stability in the clinical environment [2, 3, 4]. While these studiesaddress the two primary challenges associated with the use of an EMTS in the clinic they donot cover all aspects determining the utility of these systems.
In this paper we identify a comprehensive set of factors that influence the utility of an EMTSin the clinical environment. We then evaluate two commercially available systems based on
1
these factors, the 3D Guidance system from Ascension Technology Corp. (Milton, Vermont,USA), and the Aurora system from Northern Digital Inc. (Waterloo, Ontario, Canada).
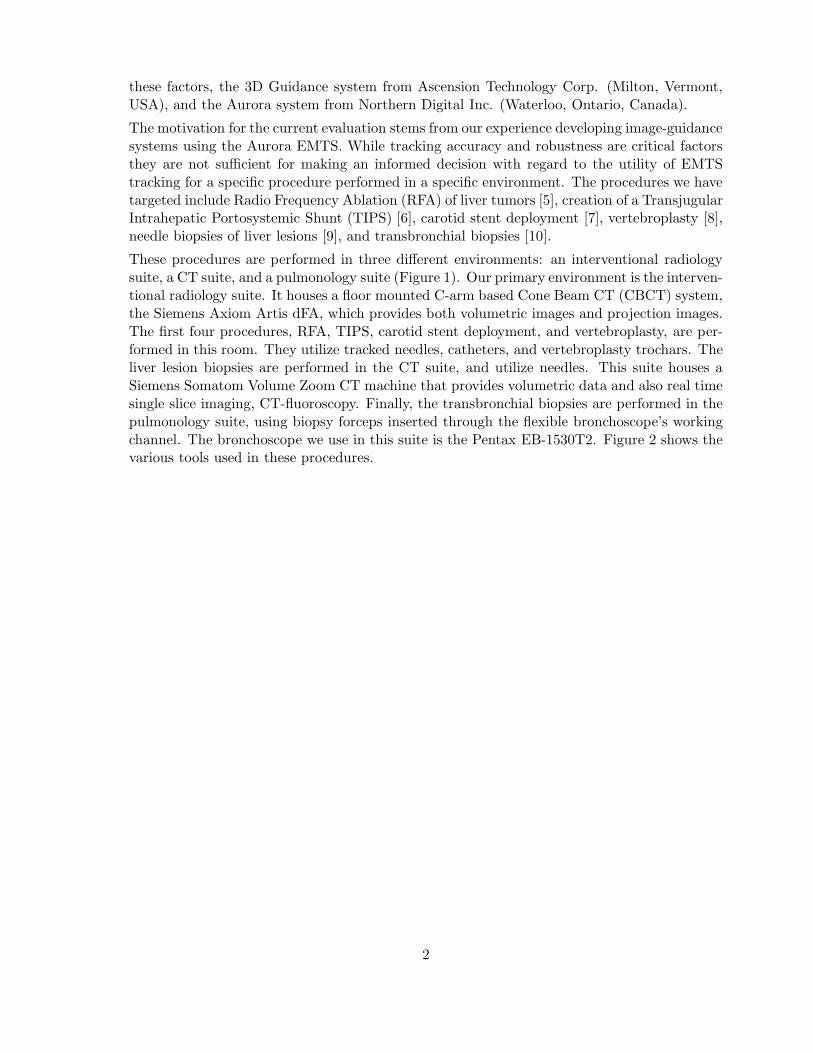
The motivation for the current evaluation stems from our experience developing image-guidancesystems using the Aurora EMTS. While tracking accuracy and robustness are critical factorsthey are not sufficient for making an informed decision with regard to the utility of EMTStracking for a specific procedure performed in a specific environment. The procedures we havetargeted include Radio Frequency Ablation (RFA) of liver tumors [5], creation of a TransjugularIntrahepatic Portosystemic Shunt (TIPS) [6], carotid stent deployment [7], vertebroplasty [8],needle biopsies of liver lesions [9], and transbronchial biopsies [10].
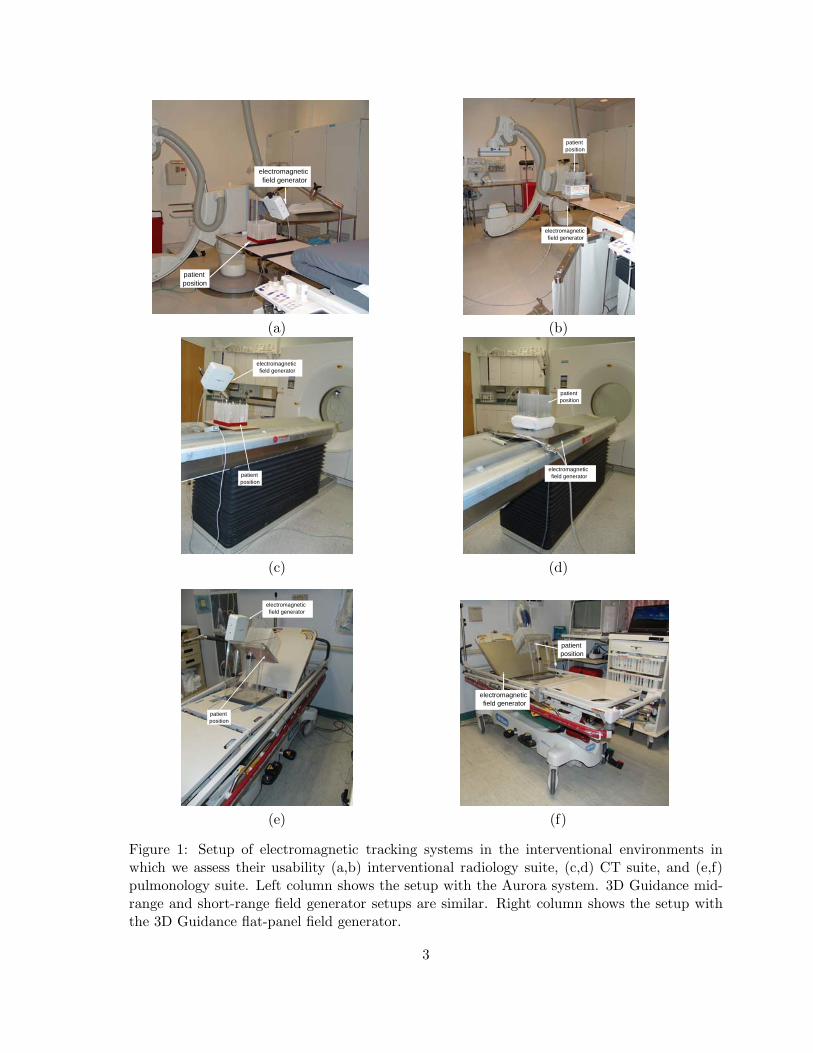
These procedures are performed in three different environments: an interventional radiologysuite, a CT suite, and a pulmonology suite (Figure 1). Our primary environment is the interven-tional radiology suite. It houses a floor mounted C-arm based Cone Beam CT (CBCT) system,the Siemens Axiom Artis dFA, which provides both volumetric images and projection images.The first four procedures, RFA, TIPS, carotid stent deployment, and vertebroplasty, are per-formed in this room. They utilize tracked needles, catheters, and vertebroplasty trochars. Theliver lesion biopsies are performed in the CT suite, and utilize needles. This suite houses aSiemens Somatom Volume Zoom CT machine that provides volumetric data and also real timesingle slice imaging, CT-fluoroscopy. Finally, the transbronchial biopsies are performed in thepulmonology suite, using biopsy forceps inserted through the flexible bronchoscope’s workingchannel. The bronchoscope we use in this suite is the Pentax EB-1530T2. Figure 2 shows thevarious tools used in these procedures.
2
patientposition
electromagneticfield generator
field generator
positionpatient
electromagnetic
(a) (b)
electromagneticfield generator
patientposition
patientposition
electromagneticfield generator
(c) (d)
patientposition
electromagneticfield generator
patientposition
electromagneticfield generator
(e) (f)
Figure 1: Setup of electromagnetic tracking systems in the interventional environments inwhich we assess their usability (a,b) interventional radiology suite, (c,d) CT suite, and (e,f)pulmonology suite. Left column shows the setup with the Aurora system. 3D Guidance mid-range and short-range field generator setups are similar. Right column shows the setup withthe 3D Guidance flat-panel field generator.
3
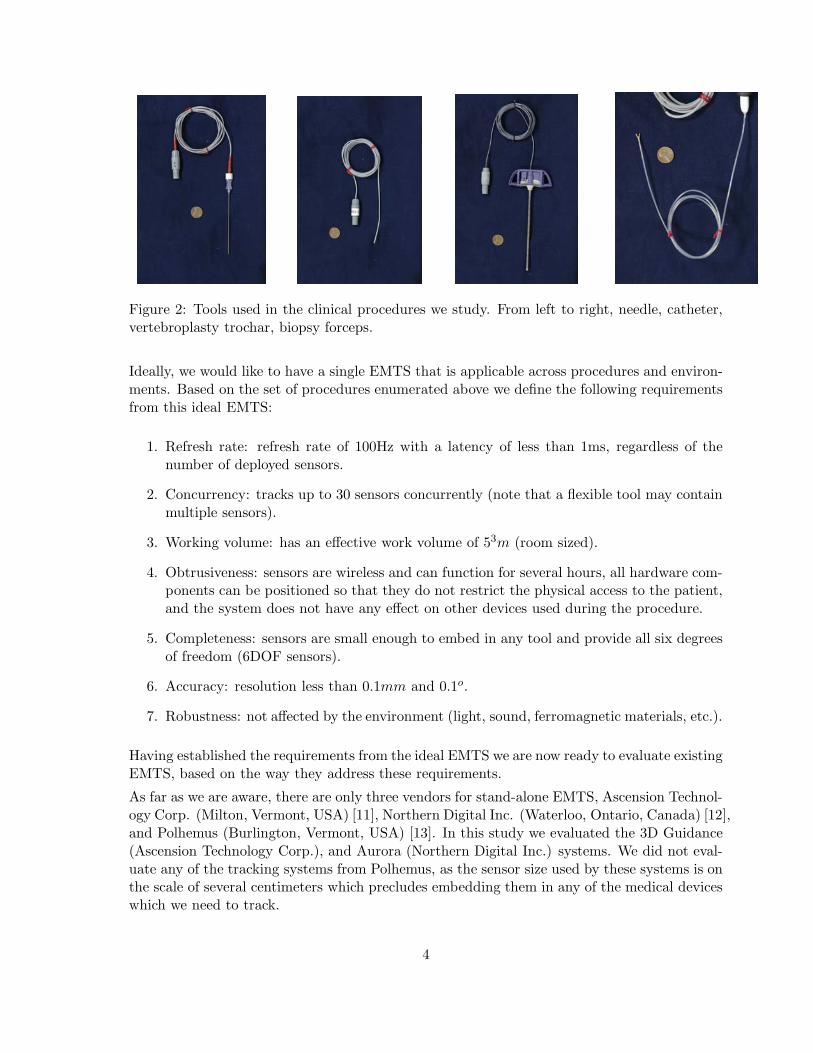
Figure 2: Tools used in the clinical procedures we study. From left to right, needle, catheter,vertebroplasty trochar, biopsy forceps.
Ideally, we would like to have a single EMTS that is applicable across procedures and environ-ments. Based on the set of procedures enumerated above we define the following requirementsfrom this ideal EMTS:
1. Refresh rate: refresh rate of 100Hz with a latency of less than 1ms, regardless of thenumber of deployed sensors.
2. Concurrency: tracks up to 30 sensors concurrently (note that a flexible tool may containmultiple sensors).
3. Working volume: has an effective work volume of 53m (room sized).
4. Obtrusiveness: sensors are wireless and can function for several hours, all hardware com-ponents can be positioned so that they do not restrict the physical access to the patient,and the system does not have any effect on other devices used during the procedure.
5. Completeness: sensors are small enough to embed in any tool and provide all six degreesof freedom (6DOF sensors).
6. Accuracy: resolution less than 0.1mm and 0.1o.
7. Robustness: not affected by the environment (light, sound, ferromagnetic materials, etc.).
Having established the requirements from the ideal EMTS we are now ready to evaluate existingEMTS, based on the way they address these requirements.
As far as we are aware, there are only three vendors for stand-alone EMTS, Ascension Technol-ogy Corp. (Milton, Vermont, USA) [11], Northern Digital Inc. (Waterloo, Ontario, Canada) [12],and Polhemus (Burlington, Vermont, USA) [13]. In this study we evaluated the 3D Guidance(Ascension Technology Corp.), and Aurora (Northern Digital Inc.) systems. We did not eval-uate any of the tracking systems from Polhemus, as the sensor size used by these systems is onthe scale of several centimeters which precludes embedding them in any of the medical deviceswhich we need to track.
4
2 Materials and methods
In this work we assess the 3D Guidance and Aurora EMTS. Both systems consist of threebasic components, the field generator, a system control unit that interfaces with a PC, andtracked sensor coils and their respective interface to the system control unit. Note that the3D Guidance system is evaluated in three configurations, using the flat-panel, mid-range, andshort-range field generators. Figure 3 shows the system components for both EMTS as usedin this study.
short rangefield generator
mid range
flat field generator
system control unit
sensor interfaceunitfield generator
system control unit
sensor interface unit
field generator
(a) (b)
Figure 3: Electromagnetic tracking systems and their components, as used in this study, (a)3D Guidance and (b) Aurora.
From our prior experience with assessing the accuracy of the Aurora EMTS [4] we have ob-served that performance is highly dependent on the interventional environment. The presenceof medical apparatus distorts measurements in a manner unique to each setup. We thus believethat, while electromagnetic tracking is a viable option for tracking in the clinical environmentits applicability should be evaluated per environment, and even more specifically on a per pro-cedure basis. Thus, our evaluation is based on the way each system addresses the requirementsdescribed above in a set of specific environments or procedures where relevant.
2.1 Refresh rate
Refresh rate is important primarily when the data from the tracking system is used to providequantitative guidance to the physician. This is the case in our needle biopsy application. Asthe physician inserts the needle towards the tumor, insertion depth is monitored using thedistance between the needle tip and the target. This distance should be updated at a rate thatdoes not limit the physicians actions.
The maximal refresh rate for the 3D Guidance system according to manufacturer specificationsis 160Hz when using the flat-panel field generator and 375Hz when using the mid-range, andshort-range field generators. The factory default refresh rate, set for optimal accuracy, for theflat-panel field generator is about 40Hz and for the mid-range and short-range field generatorsis about 68Hz. We empirically evaluated the refresh rates for all three configurations by
5

acquiring time stamped measurements using six degree of freedom (6DOF) sensors. Datawas acquired using a custom program from Ascension Corp.. The maximal refresh rate weobtained for the flat-panel field generator was approximately 160Hz irrespective of the numberof tracked sensors. The configurations with the mid-range and short-range field generators werealso unaffected by the number of tracked sensors, with an acquisition rate of 190Hz. Systemlatency was only assessed qualitatively, with no noticeable lag between action and on screenmotion displaying the acquired data.
The maximal refresh rate for the Aurora system according to manufacturer specifications is40Hz. We empirically evaluated this by acquiring time stamped measurements using a singlefive degree of freedom (5DOF) sensor. Data was acquired with a program developed in houseusing the system’s API. The refresh rate we obtained was approximately 40Hz, concurring withthe manufacturer’s specifications. When an additional 5DOF sensor was attached the refreshrate dropped to 20-25Hz. Attaching additional sensors after this initial decrease in refresh ratedid not have any effect. Through our extensive work developing image-guidance applicationswith the Aurora system we have empirically found that a refresh rate of 25-30Hz is sufficientfor dynamic guidance. System latency was not assessed quantitatively. We have qualitativelyobserved that it was not an issue in any of our image-guidance applications.
2.2 Concurrency
The 3D guidance system supports tracking of up to 12 5DOF sensors and eight 6DOF sensors.The Aurora system supports tracking of up to eight 5DOF sensors or four 6DOF sensors. Forall of our applications we have found these numbers to be sufficient, as we do not need to trackmore than eight sensors concurrently. Note that the number of sensors does not necessarilycorrespond to the number of tracked tools, as a flexible tool may contain more than a singlesensor.
In the clinical setting, the number of tools that need to be tracked simultaneously is limitedby the number of operating physicians and the complexity of the clinical procedure beingperformed. Therefore it is likely that most clinical procedures utilizing EMTS will rarely needto track more than a handful of tools at any given time. However, as the use of EMTS in theclinical environment proliferates, it is conceivable that flexible tools embedded with multiplesensors will require concurrent tracking of more than 12 sensors.
2.3 Working volume
The measurement space of an EMTS is defined as a volume around the field generator thatis energized by AC or DC magnetic fields of a characterized nature. An EM sensor thatis introduced within this volume responds with an induced voltage across the sensor that isproportional to the excitation field strength at that location. The drop off in excitation signalpower is inversely proportional to the fourth power of the distance from the field generator [14].Therefore, signal quality degrades the further away the sensor is from the field generator. Forthis reason, most manufacturers either specify measurement accuracy as a function of distancefrom the field generator (Aurora) or define an optimal sub-volume wherein sub-millimetric ormillimetric accuracy can be expected (3D Guidance).
We defined the ideal effective work volume as a tracking volume of 53m (room sized). The
6
rational here is that in a clinical environment it is desirable to incorporate systems in as non-intrusive a manner as possible. With a room sized effective tracking volume the positioningof the field generator relative to the patient is not an issue as the patient is always inside thetracked volume. In addition the physical obtrusiveness of the system is greatly reduced as thegenerator can be positioned in the room in a flexible manner so that it does not restrict accessto the patient or the mobility of medical staff and equipment. The reality however, is thatthere are currently no systems that facilitate tracking of sensors smaller than 2mm diameter,within a volume larger than 1m3. Based on the progression of EMTS since it’s developmentin the 70’s, it is conceivable that any system capable of tracking small sensors within a room-sized environment will be severely plagued by distortion and would most likely achieve thisthrough stronger excitation signals that can potentially have an adverse effect on other medicalapparatus. For practical purposes the use of an EMTS in a procedure is dependent upon theactive working area required for the intervention. That is, tracking must be possible in avolume that encompasses the anatomy of interest. In practice we have found that judiciouspositioning of the field generator does compensate for the currently available work volumes.
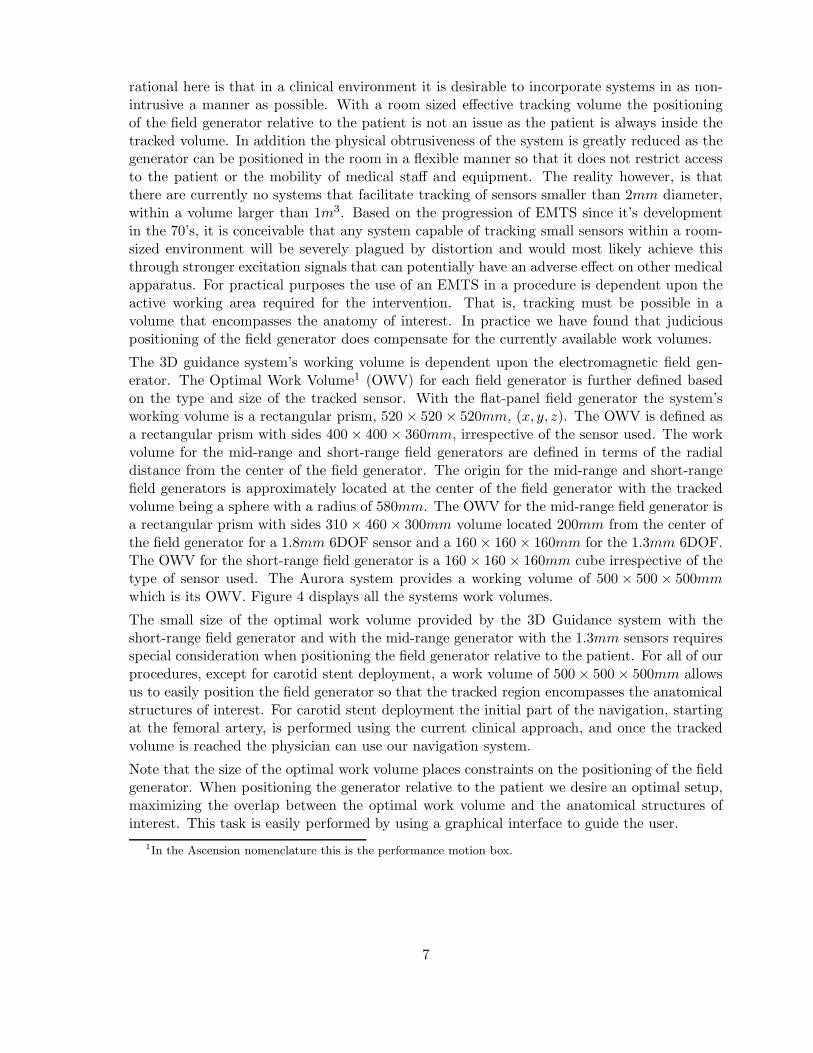
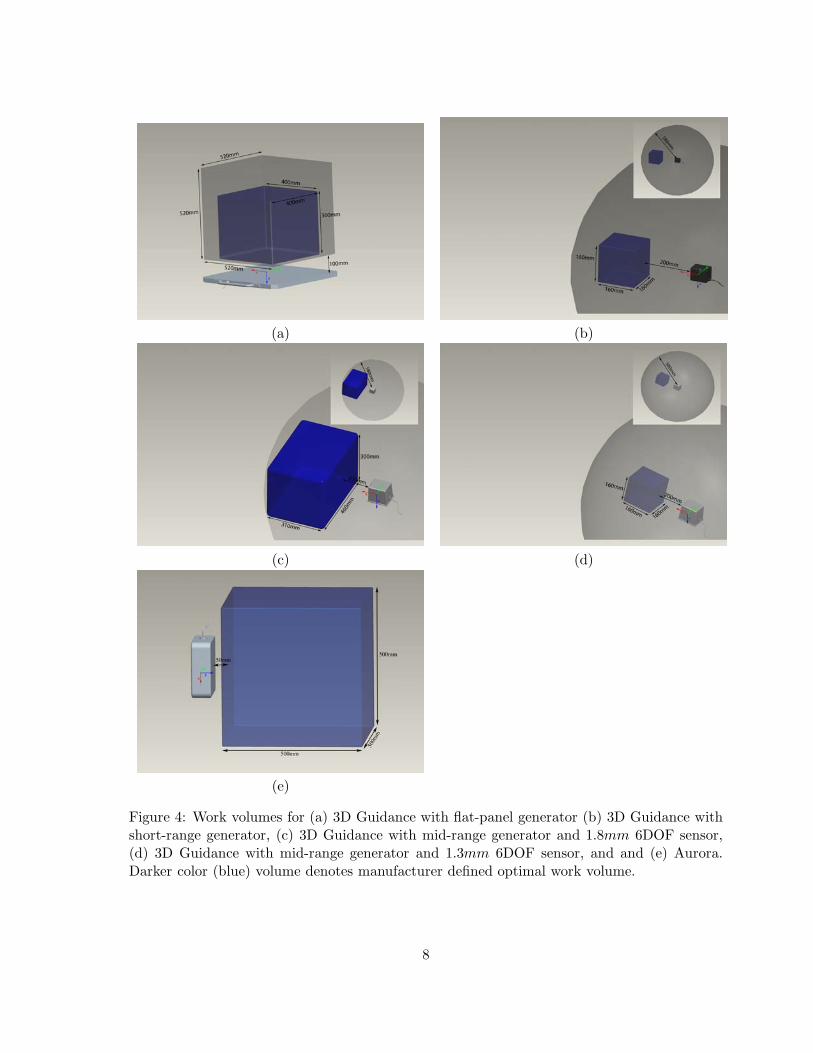
The 3D guidance system’s working volume is dependent upon the electromagnetic field gen-erator. The Optimal Work Volume1 (OWV) for each field generator is further defined basedon the type and size of the tracked sensor. With the flat-panel field generator the system’sworking volume is a rectangular prism, 520 × 520 × 520mm, (x, y, z). The OWV is defined asa rectangular prism with sides 400 × 400 × 360mm, irrespective of the sensor used. The workvolume for the mid-range and short-range field generators are defined in terms of the radialdistance from the center of the field generator. The origin for the mid-range and short-rangefield generators is approximately located at the center of the field generator with the trackedvolume being a sphere with a radius of 580mm. The OWV for the mid-range field generator isa rectangular prism with sides 310 × 460 × 300mm volume located 200mm from the center ofthe field generator for a 1.8mm 6DOF sensor and a 160 × 160 × 160mm for the 1.3mm 6DOF.The OWV for the short-range field generator is a 160 × 160 × 160mm cube irrespective of thetype of sensor used. The Aurora system provides a working volume of 500 × 500 × 500mmwhich is its OWV. Figure 4 displays all the systems work volumes.
The small size of the optimal work volume provided by the 3D Guidance system with theshort-range field generator and with the mid-range generator with the 1.3mm sensors requiresspecial consideration when positioning the field generator relative to the patient. For all of ourprocedures, except for carotid stent deployment, a work volume of 500 × 500 × 500mm allowsus to easily position the field generator so that the tracked region encompasses the anatomicalstructures of interest. For carotid stent deployment the initial part of the navigation, startingat the femoral artery, is performed using the current clinical approach, and once the trackedvolume is reached the physician can use our navigation system.
Note that the size of the optimal work volume places constraints on the positioning of the fieldgenerator. When positioning the generator relative to the patient we desire an optimal setup,maximizing the overlap between the optimal work volume and the anatomical structures ofinterest. This task is easily performed by using a graphical interface to guide the user.
1In the Ascension nomenclature this is the performance motion box.
7
(a) (b)
(c) (d)
(e)
Figure 4: Work volumes for (a) 3D Guidance with flat-panel generator (b) 3D Guidance withshort-range generator, (c) 3D Guidance with mid-range generator and 1.8mm 6DOF sensor,(d) 3D Guidance with mid-range generator and 1.3mm 6DOF sensor, and and (e) Aurora.Darker color (blue) volume denotes manufacturer defined optimal work volume.
8
2.4 Obtrusiveness
The obtrusiveness of an EMTS manifests itself in two ways, the physical presence of the systemand the effect of its electronic components on medical apparatus.
The physical obtrusiveness of a system stems from the fact that we introduce additional hard-ware into a clinical environment which is most often, already cramped. Both the Aurora and3D Guidance systems are wired. That is, the tracked tools are connected via wires to thecontrol unit. While this does not preclude any of the procedures we are investigating, it doesmake them more cumbersome. More importantly, these additional wires require caution on thepart of the medical staff when moving around the patient. In addition, the physical presenceof an EMTS may interfere with imaging if system components are in the field of view of theimaging apparatus.
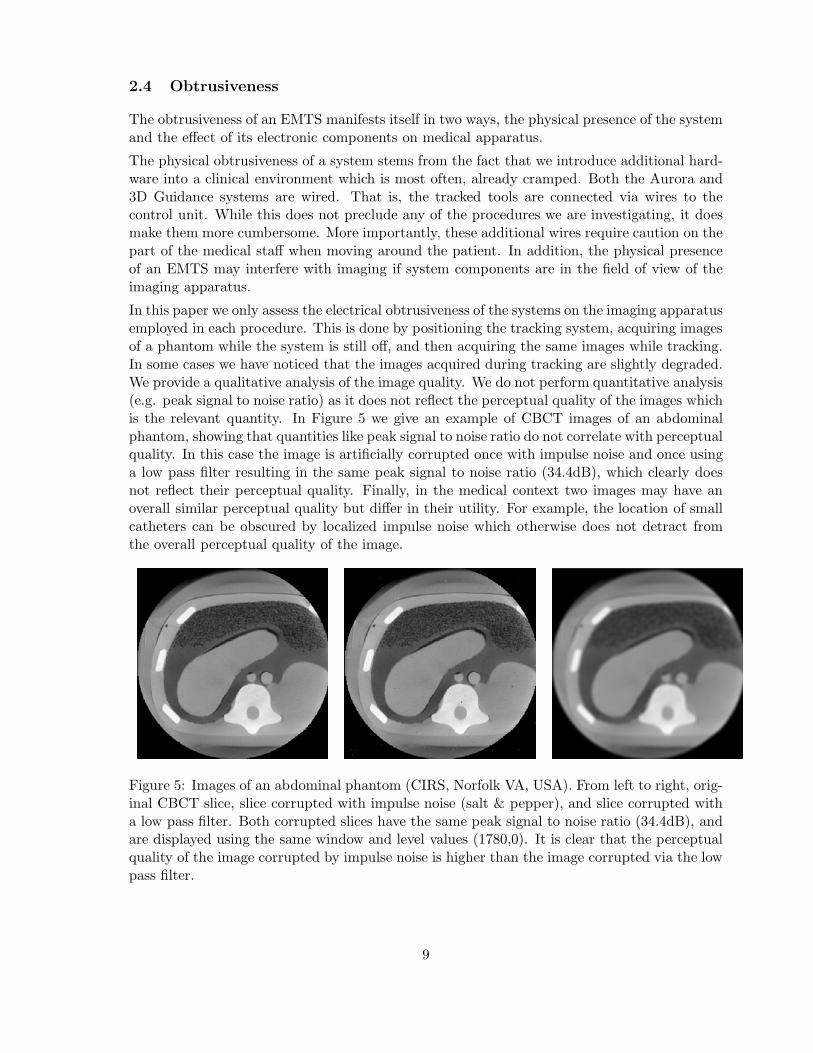
In this paper we only assess the electrical obtrusiveness of the systems on the imaging apparatusemployed in each procedure. This is done by positioning the tracking system, acquiring imagesof a phantom while the system is still off, and then acquiring the same images while tracking.In some cases we have noticed that the images acquired during tracking are slightly degraded.We provide a qualitative analysis of the image quality. We do not perform quantitative analysis(e.g. peak signal to noise ratio) as it does not reflect the perceptual quality of the images whichis the relevant quantity. In Figure 5 we give an example of CBCT images of an abdominalphantom, showing that quantities like peak signal to noise ratio do not correlate with perceptualquality. In this case the image is artificially corrupted once with impulse noise and once usinga low pass filter resulting in the same peak signal to noise ratio (34.4dB), which clearly doesnot reflect their perceptual quality. Finally, in the medical context two images may have anoverall similar perceptual quality but differ in their utility. For example, the location of smallcatheters can be obscured by localized impulse noise which otherwise does not detract fromthe overall perceptual quality of the image.
Figure 5: Images of an abdominal phantom (CIRS, Norfolk VA, USA). From left to right, orig-inal CBCT slice, slice corrupted with impulse noise (salt & pepper), and slice corrupted witha low pass filter. Both corrupted slices have the same peak signal to noise ratio (34.4dB), andare displayed using the same window and level values (1780,0). It is clear that the perceptualquality of the image corrupted by impulse noise is higher than the image corrupted via the lowpass filter.
9
Interventional radiology suiteThe interventional radiology suite is the only environment in which one has to exercise addi-tional caution when positioning the EMTS’s field generator and wires. This is primarily dueto the dynamic nature of this environment, where the EMTS is positioned while the C-armis stationary. From our experience, we have found that it is not immediately evident whichspatial locations will be in the path of the rotating arm during CBCT acquisitions.
In all procedures performed in the interventional radiology suite the 3D Guidance configuredwith flat-panel field generator does not change the access to the patient, as the field generatoris placed underneath the mattress (Figure 1(b)). The 3D Guidance configured with the mid-range and short-range generators is more obtrusive. In these configurations the field generatoris mounted on a passive mechanical arm positioned approximately 150mm from the patient.This restricts physical access from certain directions but has not been a limiting factor in anyof our procedures. The Aurora system is positioned similarly (Figure 1(a)). It is slightly moreintrusive than the mid-range and short-range configurations due to the larger form factor ofthe field generator.
In all procedures either preoperative CT or in-situ CBCT data are used for navigation. X-rayfluoroscopy is used for intraoperative imaging, validating the information presented by thenavigation system. We evaluated both the physical and electronic effect of each of the EMTSon the quality of X-ray fluoroscopy and CBCT acquisitions. This was done by imaging aninterventional 3D Abdominal Phantom (CIRS, Norfolk VA, USA). This phantom is composedof materials that mimic the X-ray attenuation of human tissue. We acquired both X-rayfluoroscopy, 2D projection images, and a CBCT reconstruction, with each EMTS in place butturned off, and a second image during tracking.
The only system that always influences the quality of the images due to its physical presenceis the 3D Guidance with the flat-panel field generator. We have found that the field generatorcannot be easily moved in and out of the tracking position as it is placed underneath thepatient. Thus, even if tracking is not required during image acquisition the field generatorremains in the field of view of the C-arm. For all other systems the presence of the fieldgenerator, mounted on the passive arm, precludes imaging from certain C-arm poses. This isnot a limiting factor as long as imaging and tracking are not required simultaneously, as thefield generator can easily be moved out of the way.
For the 3D Guidance with mid-range and short-range field generators we have noticed thatthey slightly degrade the projection image quality, with X-ray fluoroscopy images exhibitinghorizontal streaks when acquired during tracking. A similar effect was observed with theAurora system. This in turn results in minor degradation of the CBCT reconstruction, as itis performed using the X-ray images.
Detailed results are given in section 3.1.
CT suiteIn the needle biopsy procedures performed in the CT suite the 3D Guidance system’s flat-panel field generator is placed underneath the patient (Figure 1(d)). This requires that thestandard mattress be replaced with one which will support the patient. The curved shape ofthe patient couch means that using the flat-panel field generator raises the patient position,reducing the effective bore size. This is likely to cause concerns with obese patients. Boththe mid-range and short-range field generators are positioned using a passive mechanical armpositioned approximately 150mm from the patient. This restricts physical access to one side of
10
the patient but has not been a limiting factor in this procedure as the mechanical arm and fieldgenerator are on the opposite side of the CT bed from the physician. As was the case in theinterventional radiology suite, the Aurora system is similar in terms of physical obtrusiveness.
In the needle biopsy procedures there are two modes of imaging, acquisition of a preoperativeCT scan and intraoperative CT fluoroscopy, real time single slice imaging. When using the3D Guidance system with the flat-panel field generator the images always included the fieldgenerator as it is placed underneath the patient. This results in degraded images. The 3DGuidance with mid-range and short-range field generators and the Aurora system are not inthe field of view when imaging and thus their physical presence does not effect image quality.
We performed the same imaging experiment as in the interventional radiology suite, to evaluatethe electronic obtrusiveness of tracking on image acquisition. Both CT and CT-fluoroscopyimages did not exhibit noticeable differences.
Detailed results are given in section 3.1.
Pulmonology suiteIn the transbronchial biopsy procedure the patient is lying on a stretcher at a 45o upright angle.The 3D Guidance flat-panel field generator is physically unobtrusive as it is placed under thepatient’s back (Figure 1(f)). When using the mid-range and short-range field generators theyare positioned using a passive mechanical arm attached to the stretcher’s rail. This restrictsphysical access to one side of the patient, but is not a limiting factor, as the physician standson the opposite side of the stretcher facing the bronchoscopy monitor. The Aurora setup issimilar, see Figure 1(e), leading to the same limitations.
To assess the electronic obtrusiveness of the systems we used a pulmonary phantom, the AC9/8flourescent bronchial tree (Adam, Rouilly Ltd., Kent, UK). We placed the bronchoscope insidethe phantom, acquired an image without tracking, started tracking, and acquired a secondimage. None of the systems caused any noticeable distortions of the video. The originalimages without and with tracking are shown in Figures 14 and 15.
2.5 Completeness
Both the Aurora and 3D Guidance system support 5DOF and 6DOF sensors. For the Aurorasystem the smallest 5(6)DOF sensors have a diameter of 0.55(1.8)mm. For the 3D Guidancesystem the smallest 5(6)DOF sensors have a diameter of 0.3(1.3)mm.
Interventional radiology suiteThe tools that require tracking in our procedures are 18 gauge (diameter of 1.02mm) needlesfor RFA, and TIPS, 22 gauge (diameter of 0.6mm) needles and a trochar with a diameterof 4.2mm for vertebroplasty, and a catheter with a diameter of 2.3mm for stent deployment.All of these tools are similar in that they are used in a way that allows us to model themas cylinders. That is, the rotation around the tool axis is unimportant. This is why 5DOFsensors are sufficient for all of these procedures.
CT suiteThe tools required for the biopsy procedures performed in the CT suite are 18 gauge needlesas used in the procedures performed in the interventional radiology suite.
11
Pulmonology suiteThe tool that we need to track for the transbronchial biopsy is a forcep that must fit throughthe bronchoscope’s working channel. In our case the working channel has a diameter of 2mm,and the forceps have a sheath diameter of 1.8mm. For this procedure we cannot use the samecylindrical model as done for other procedures. Navigation is performed using a preoperativeCT in which a virtual camera is positioned in the same pose as the bronchscope’s camerawhich is tracked relative to the forceps. The tracked forceps are thus required to provide allsix degrees of freedom, as the unknown rotation around the sensor axis is similar to an unknowncamera rotation around the view direction. It should be noted that while a 6DOF sensor is thefirst choice for such procedures, it is possible to use a 5DOF sensor to perform the tracking incombination with video-to-CT registration to compensate for the unknown rotation [15].
2.6 Accuracy
The accuracy of each system was evaluated using the protocol described in [4]. A plexi-glass phantom is used to acquire data measurements at 225 locations. The phantom is a180 × 180 × 180mm cube with a 15 × 15 grid layout of holes on the top face. Each hole wasdrilled to a random known depth ranging from 10 to 140mm. After construction, the depthof each hole was measured using an industrial depth gauge with a resolution of 0.01mm andinstrumentation error under 0.03mm.
At each of the 225 locations, 100 samples are acquired and their average is used as the point’scoordinates. We also record the distance of each of these 100 samples from the EMTS originand the range of the distance variability, reflecting the system’s stability. We then register theacquired set of points to the phantom’s coordinate system using paired-point rigid registra-tion [16] and compute the distance between the known point location and the reported pointlocation after it is transformed.
For the registered point data we provide the following descriptive statistics: maximal samplevariation, RMS error, mean error, standard deviation, error range, maximal error and 95percentile. It should be noted that from a clinical standpoint the mean and standard deviationof the errors is less meaningful as patient safety requires that we obtain bounds on the worstcase behavior. We thus feel that the 95th percentile is the single most meaningful measure.The maximal sample variability describes the variability in the logged samples at each locationand is defined as:
max[max{di}j − min{di}j ], i = 1 . . . 100, j = 1 . . . 225
where di is the distance from the EMTS origin for the i’th acquisition at location j. Theimpetus for this measure is that we found some devices to offer excellent overall accuracywhen averaged across 100 samples, but, within the samples there was a great deal of variability.Thus, for an accurate measurement the actual refresh rate is potentially reduced to one that isclinically unacceptable. We use the maximal sample variability to denote the overall stabilityof EM measurements when using the system’s default refresh rate.
System accuracy was first assessed in an office, a ferromagnetically clean environment, andthen in each of the clinical environments using the protocol described above. Detailed resultsfor each of the environments are described in section 3.2.
12
2.7 Robustness
We define the robustness of an EMTS as its resilience to distortions arising from tools and imag-ing apparatus that are introduced and removed from the work volume during the procedure.Note that a system can be inaccurate but robust, consistently reporting the same measure-ments in a dynamic environment. More importantly, inaccuracies of a robust system can becorrected using static correction schemes. Currently, most correction schemes [17, 18, 19] arestatic. This means that they either assume that no distorters are introduced or removed fromthe environment during the procedure, or that the system is robust. This approach viewsthe EMTS as an open loop system whose measurements can be corrected using constant cor-rection values. In many clinical procedures one cannot guarantee that distorters will not beintroduced or removed from the interventional site. It is clear that the robustness assumptionis an important aspect of all static correction schemes.
In our case we are primarily interested in the effects of the imaging apparatus as it is the onlynon-stationary instrumentation that can have a significant impact on the EMTS.
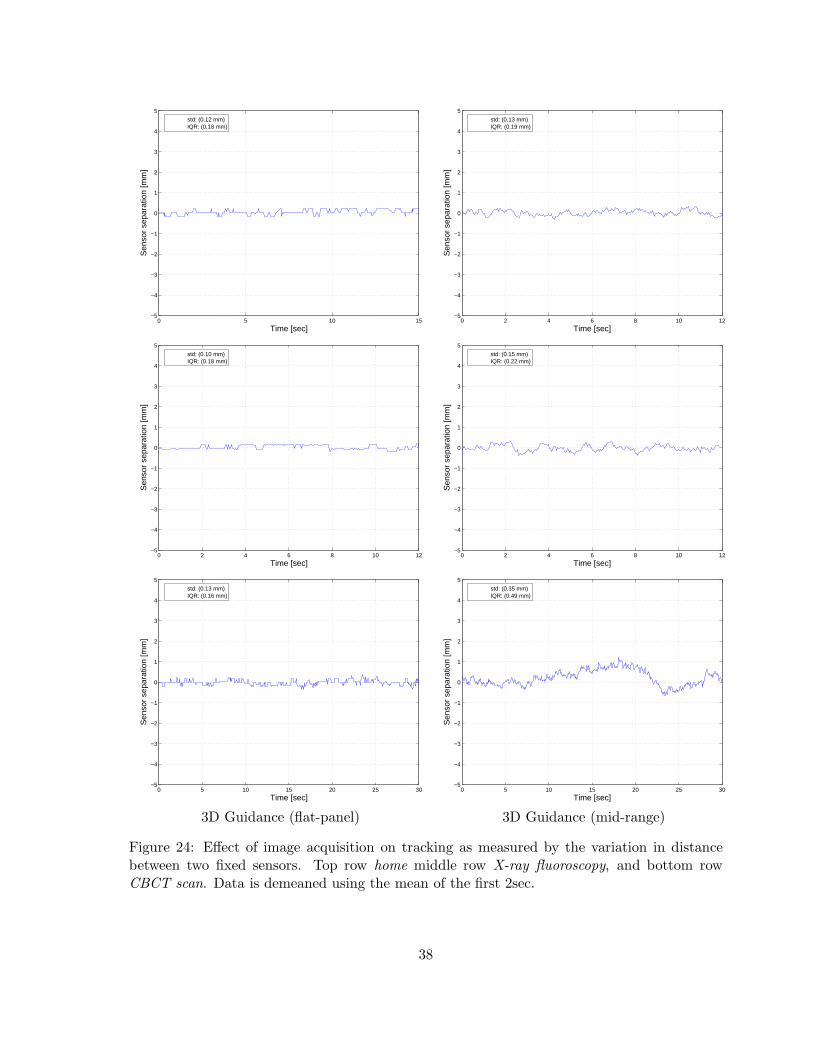
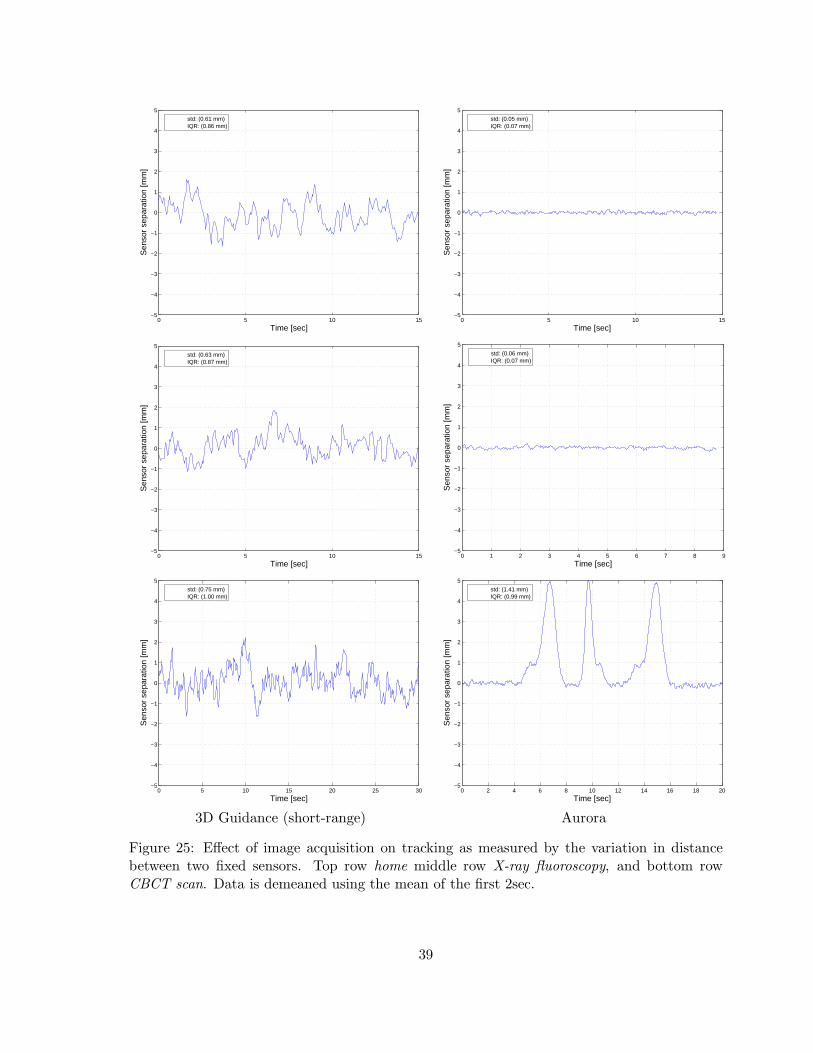
Robustness is quantified by analyzing the variability in EM measurements from two sensorsduring image acquisition. This setup is motivated by the use of dynamic reference frames inimage-guided interventions, where all spatial data is transferred relative to a patient mountedreference frame. In our experiments we tracked two sensors placed on our anatomical phantomsat a fixed distance, of a few centimeters, from each other. We then acquired images with thespecific imaging apparatus in each of our environments. If the separation between the twosensors remains constant throughout the test then imaging has no effect on tracking and theEMTS is deemed robust for our purposes.
To establish a ground truth, we first evaluate the stability of the measurements with the setupwe expect to use during navigation, with all imaging apparatus far from the patient (the homeposition). Detailed results are given in section 3.3.
Interventional radiology suiteIn the interventional radiology suite the device that is potentially most disruptive to elec-tromagnetic tracking is the C-arm. To evaluate its effect on the stability of the tracking weperformed the following experiment. We first acquired the ground truth measurements, track-ing with the C-arm away from the patient location. The C-arm was then moved into imagingposition, and a X-ray fluoroscopy image and tracking data were simultaneously acquired aswould be done in a navigated procedure for validation purposes. Finally, we acquired trackingdata during a CBCT scan. In our case as we are interested in procedures performed in thethoracic-abdominal region the tracking data would be used to acquire a gated CBCT data set.For each of these data acquisitions we computed the distance between the two sensors basedon their respective transformations.
CT suiteIn the CT suite both the patient couch and CT gantry are potentially disruptive to electro-magnetic tracking. Both these components are active while a CT scan is acquired. When CTfluoroscopy is used only the gantry rotates and the couch remains stationary. To evaluate theeffect of these elements on the stability of the tracking we performed the following experiment.We first acquired the ground truth measurements, at the location where we expect to performnavigation, away from the gantry. This was followed by acquisition of tracking data duringCT fluoroscopy imaging, simulating imaging acquired for validation in a navigated procedure.
13

Finally we acquired tracking data during a CT scan, with the goal being to use the track-ing data to acquire a gated CT scan for thoracic-abdominal interventions. For each of thedata acquisitions we computed the distance between the two sensors based on their respectivetransformations.
Pulmonology suiteIn the pulmonology suite the potentially problematic equipment is the patient’s stretcher itself,and the endoscope with its CRT display. In this case we acquired data before and after turningthe endoscope on.
Note that in our institute the procedure is performed with the patient lying on a stretcher.Unlike the interventional radiology and CT suites where the patient couches are fixed, thestretcher model varies, as the procedure is performed on whichever stretcher the patient isbeing transported with. This may result in performance variability based on the stretchertype. In our case we performed the evaluation with a single stretcher type, the Hill-RomP8000 transport stretcher (Batesville, Indiana, USA). Our conclusions with regard to thisenvironment are thus valid only for this specific configuration.
3 Experimental results
We now describe our experimental results with regard to the effect the EMTS have on imaging,and our accuracy and robustness evaluations of these systems.
3.1 Obtrusiveness - effect on imaging
To assess the effect of the electromagnetic tracking systems on imaging we acquired imageswhile tracking and compare them to images acquired without tracking. In the interventionalradiology suite we acquired CBCT and X-ray fluoroscopy images. In the CT suite we acquireda CT scan and CT-fluoroscopy, and in the pulmonology suite we acquired video images usingthe bronchoscope.
In the interventional radiology suite the 3D Guidance with flat-panel field generator producedimaging artifacts in the X-ray fluoroscopy images and in the CBCT data. The primary reasonfor these artifacts is the physical presence of the field generator in the field of view. Nonoticeable differences were visually detected when comparing the same images acquired withthe system turned off and during tracking. It is possible that tracking does add additionaldistortion but it is hard to detect this given the image distortion arising from the physicalpresence of the field generator. The 3D Guidance with mid-range field generator exhibited veryminor horizontal line artifacts in X-ray fluoroscopy when images were acquired during tracking.No visually noticeable artifacts were detected in the CBCT data. The 3D Guidance system withthe short-range field generator exhibited horizontal line artifacts in X-ray fluoroscopy whenimages were acquired in conjunction with tracking. In turn, the CBCT data also exhibitedvisible artifacts as it is reconstructed using multiple projection images. The Aurora system wasequivalent to the 3D Guidance with mid-range field generator. Figures 6 to 9 show exampleimages acquired when using each of the tracking systems.
In the CT suite the 3D Guidance with flat-panel field generator produced imaging artifactsboth for CT acquisition and CT-fluoroscopy. Again, the primary reason for these artifacts is
14
the physical presence of the field generator in the field of view and not its electronic influenceon the imaging apparatus. All other systems had no visually noticeable effect on either CT orCT-fluoroscopy images. Figures 10 to 13 show example images acquired when using each ofthe tracking systems.
In the pulmonology suite we have found that non of the systems had any visible effect onthe video images. Figures 14 and 15 show example images acquired when using each of thetracking systems.
3.2 Accuracy
The accuracy of each of the tracking systems was evaluated as described in section 2.6.
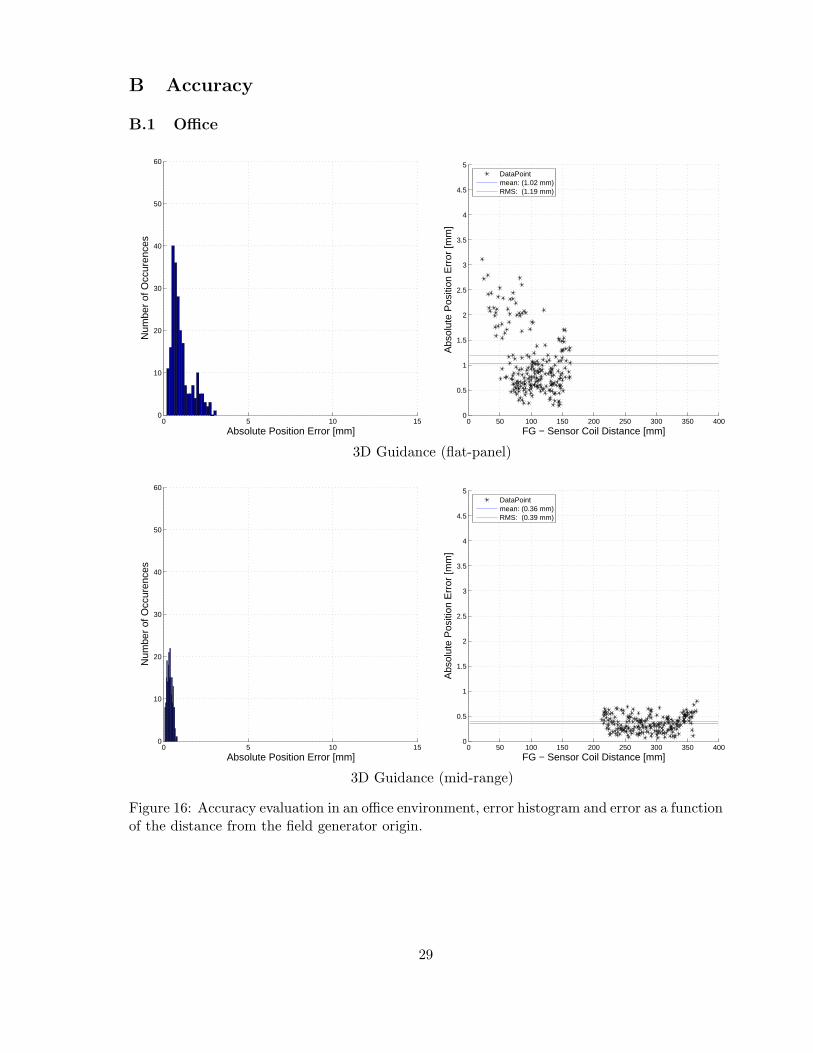
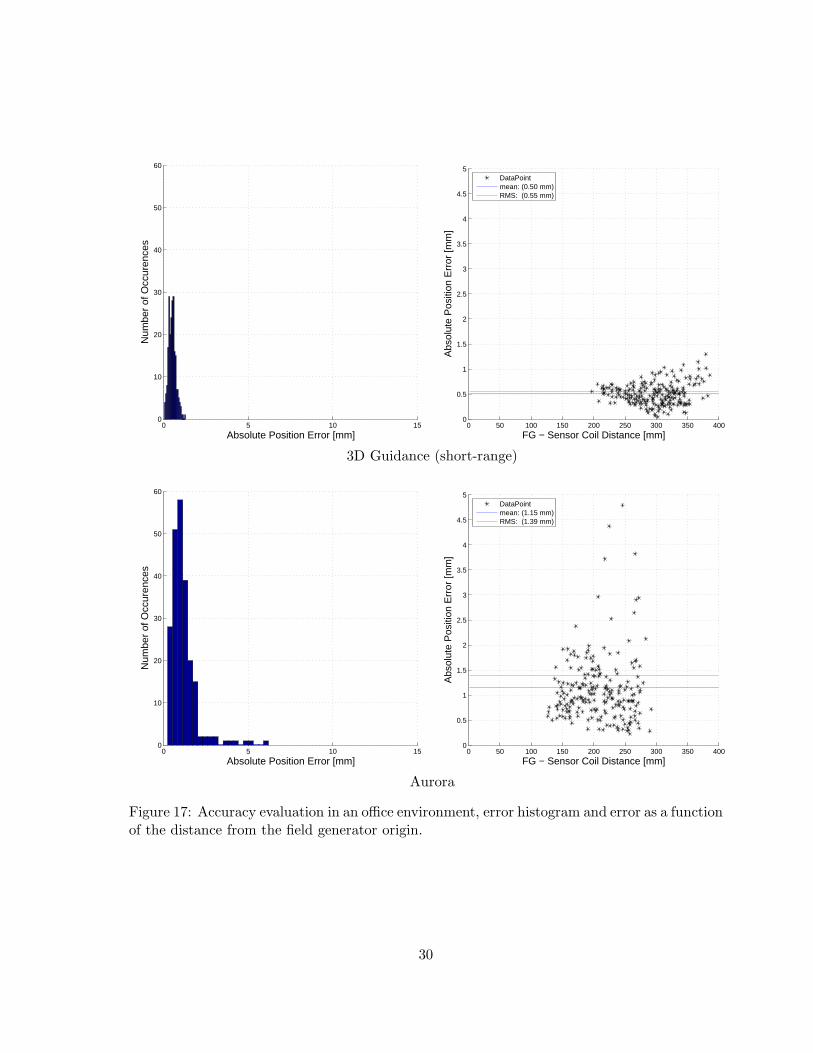
In the office environment the 3D Guidance system with the mid-range and short-range fieldgenerators were the most accurate with comparable performance. It should be noted that themeasurements acquired using the short-range generator with its default settings vary consid-erably, this is mitigated by the fact that we are averaging over 100 transformations. The 3DGuidance with the flat-panel generator and the Aurora system were also comparable to eachother but less accurate than the former systems. Table 1 summarizes the accuracy evaluationin the office environment.
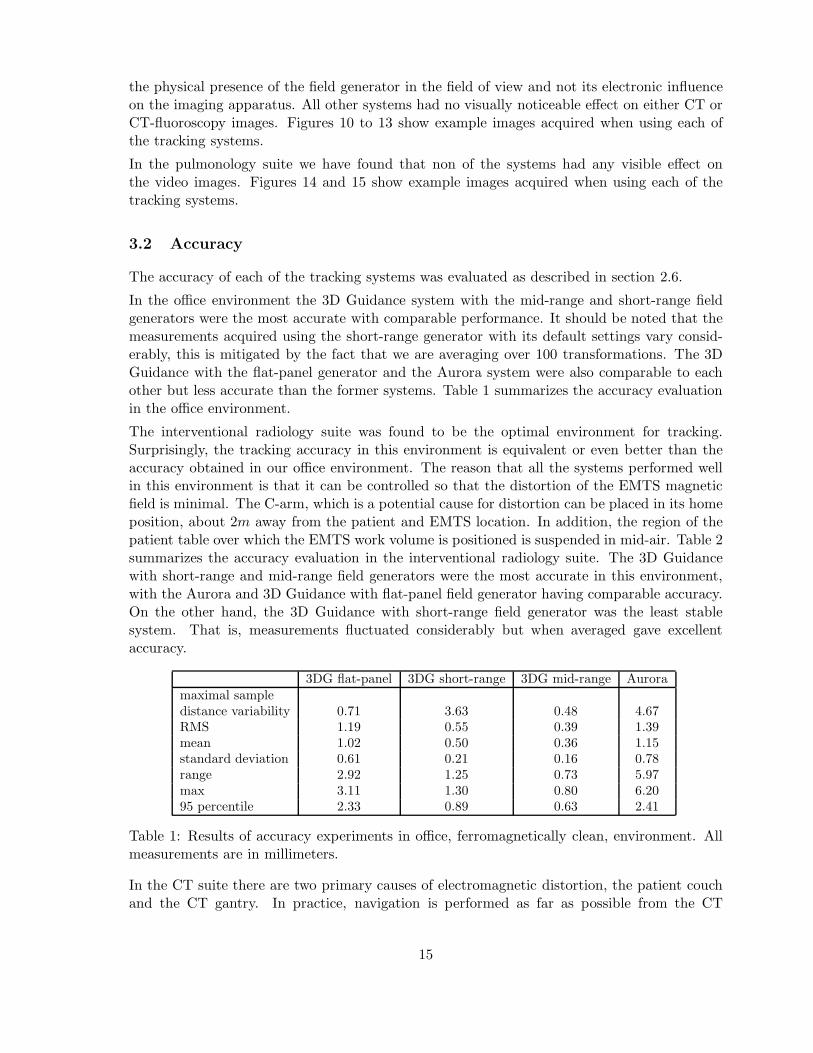
The interventional radiology suite was found to be the optimal environment for tracking.Surprisingly, the tracking accuracy in this environment is equivalent or even better than theaccuracy obtained in our office environment. The reason that all the systems performed wellin this environment is that it can be controlled so that the distortion of the EMTS magneticfield is minimal. The C-arm, which is a potential cause for distortion can be placed in its homeposition, about 2m away from the patient and EMTS location. In addition, the region of thepatient table over which the EMTS work volume is positioned is suspended in mid-air. Table 2summarizes the accuracy evaluation in the interventional radiology suite. The 3D Guidancewith short-range and mid-range field generators were the most accurate in this environment,with the Aurora and 3D Guidance with flat-panel field generator having comparable accuracy.On the other hand, the 3D Guidance with short-range field generator was the least stablesystem. That is, measurements fluctuated considerably but when averaged gave excellentaccuracy.
3DG flat-panel 3DG short-range 3DG mid-range Auroramaximal sampledistance variability 0.71 3.63 0.48 4.67RMS 1.19 0.55 0.39 1.39mean 1.02 0.50 0.36 1.15standard deviation 0.61 0.21 0.16 0.78range 2.92 1.25 0.73 5.97max 3.11 1.30 0.80 6.2095 percentile 2.33 0.89 0.63 2.41
Table 1: Results of accuracy experiments in office, ferromagnetically clean, environment. Allmeasurements are in millimeters.
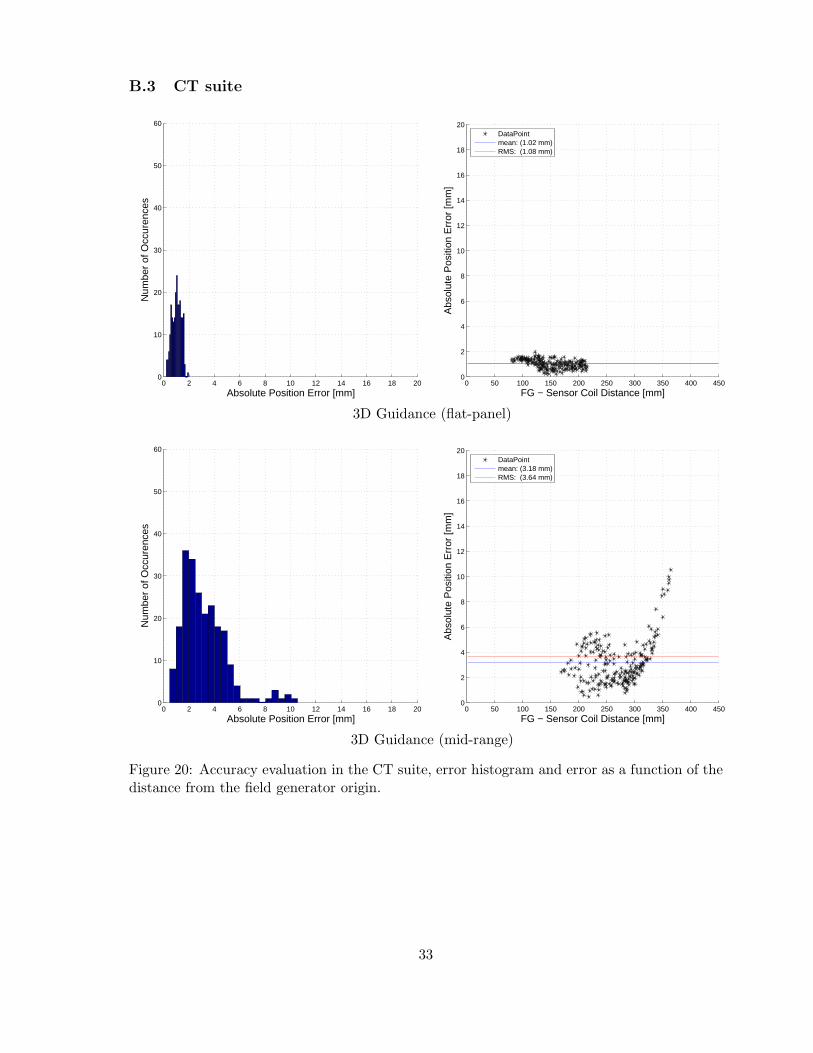
In the CT suite there are two primary causes of electromagnetic distortion, the patient couchand the CT gantry. In practice, navigation is performed as far as possible from the CT
15

3DG flat-panel 3DG short-range 3DG mid-range Auroramaximal sampledistance variability 0.5 4.48 0.36 0.49RMS 0.99 0.38 0.4 1.01mean 0.93 0.34 0.34 0.76standard deviation 0.34 0.18 0.21 0.67range 1.69 0.87 1.01 3.87max 1.82 0.90 1.05 3.9195 percentile 1.47 0.69 0.80 2.20
Table 2: Results of accuracy experiments in interventional radiology suite. All measurementsare in millimeters.
gantry, so that the couch is the primary reason for degraded accuracy. Table 3 summarizes theaccuracy evaluation in the CT suite. In this environment the 3D Guidance with flat-panel wasthe most accurate. Note that the main cause of the distortion is the couch mechanism thatis underneath the field generator, which complies with the assumptions underlying the use ofthe flat-panel generator. The 3D Guidance with short-range field generator and the Aurorasystem had comparable accuracy. The 3D Guidance with mid-range provided slightly moreaccurate results.
3DG flat-panel 3DG short-range 3DG mid-range Auroramaximal sampledistance variability 0.30 2.54 0.48 0.54RMS 1.08 6.49 3.64 5.76mean 1.02 5.67 3.18 5.13standard deviation 0.36 3.17 1.78 2.62range 1.76 17.34 10.09 18.33max 1.96 18.14 10.56 19.2495 percentile 1.56 12.29 5.88 10.83
Table 3: Results of accuracy experiments in CT suite. All measurements are in millimeters.
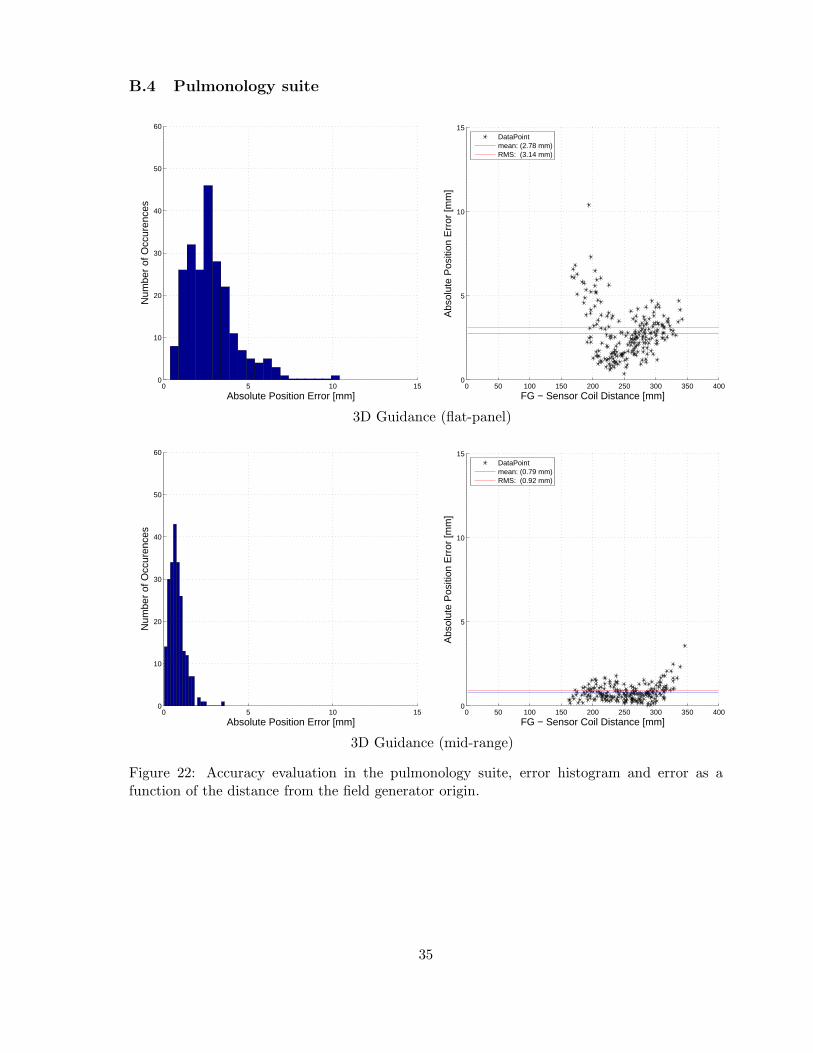
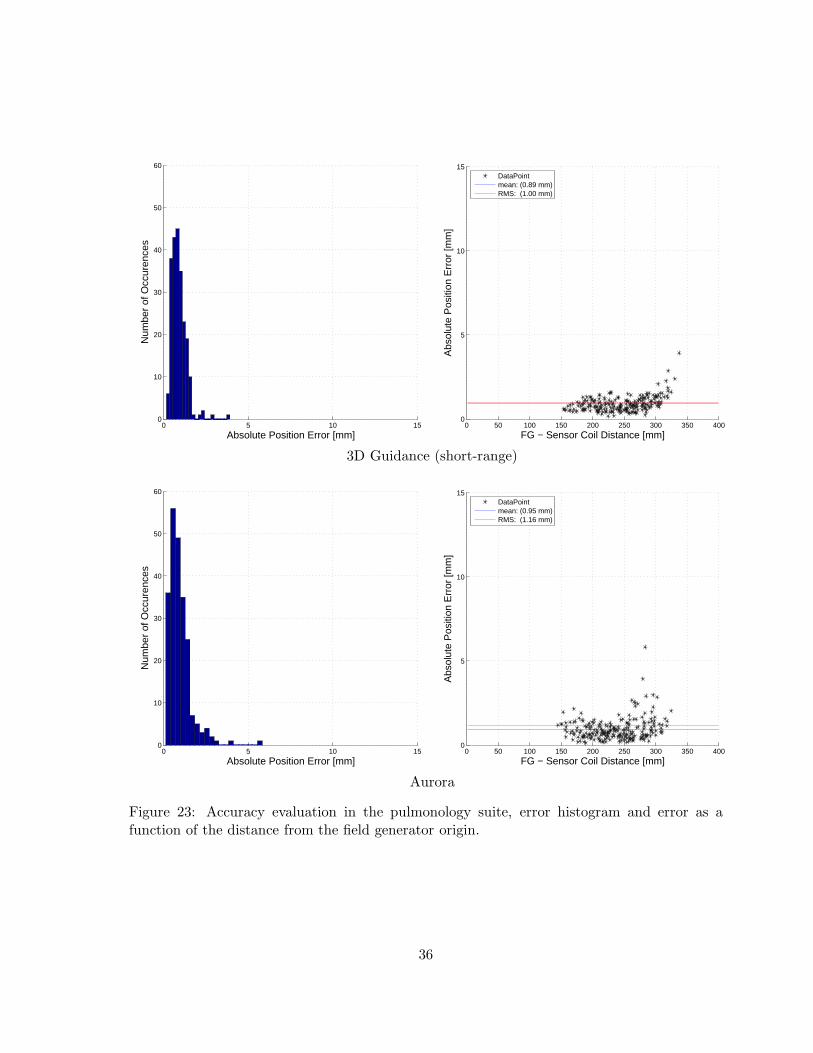
In the pulmonology suite the primary source of distortion is the patient stretcher. In our casewe evaluated accuracy with the Hill-Rom (Batesville, Indiana, USA) P8000 transport stretcher.Table 4 summarizes the accuracy evaluation in the pulmonology suite. In this environment the3D Guidance with short-range and mid-range field generators and the Aurora were comparableand more accurate than the 3D Guidance with flat-panel field generator.
3DG flat-panel 3DG short-range 3DG mid-range Auroramaximal sampledistance variability 2.43 1.85 0.35 0.38RMS 3.14 1.00 0.92 1.16mean 2.78 0.89 0.79 0.95standard deviation 1.46 0.45 0.47 0.67range 10.02 3.76 3.55 5.70max 10.40 3.92 3.59 5.8395 percentile 5.78 1.54 1.65 2.19
Table 4: Results of accuracy experiments in pulmonology suite. All measurements are inmillimeters.
16

Figures 16 to 23 provide a more exhaustive description of the error distribution in the form ofhistograms and plots displaying the error as a function of the distance from the field generatororigin.
3.3 Robustness
Robustness of the EMTS was evaluated in all three clinical environments as described insection 2.7. As we are only interested in the effect the imaging apparatus has on the tracking westart the data acquisition several seconds before image acquisition. The data is then demeanedusing the mean distance computed from the first two seconds. This removes the effect of thespecific sensor to sensor distance from the experiments, as the actual distance between sensorsvaried between experiments.
We first evaluated robustness in the interventional radiology suite. Figures 24 and 25 presentdata plots as acquired at the home position, during X-ray fluoroscopy and during a CBCTscan. We conclude that the 3D Guidance with flat-panel field generator is overall the most ro-bust system, resulting in stable results even during a CBCT scan. The 3D Guidance mid-rangegenerator and Aurora are robust to X-ray fluoroscopy imaging but not to CBCT acquisition,exhibiting measurement fluctuations. The 3D Guidance system with short-range field gener-ator exhibited fluctuations for all experimental setups. This is consistent with its accuracyevaluation. That is, the measurements fluctuate considerably when using the default settings,but when averaged are accurate.
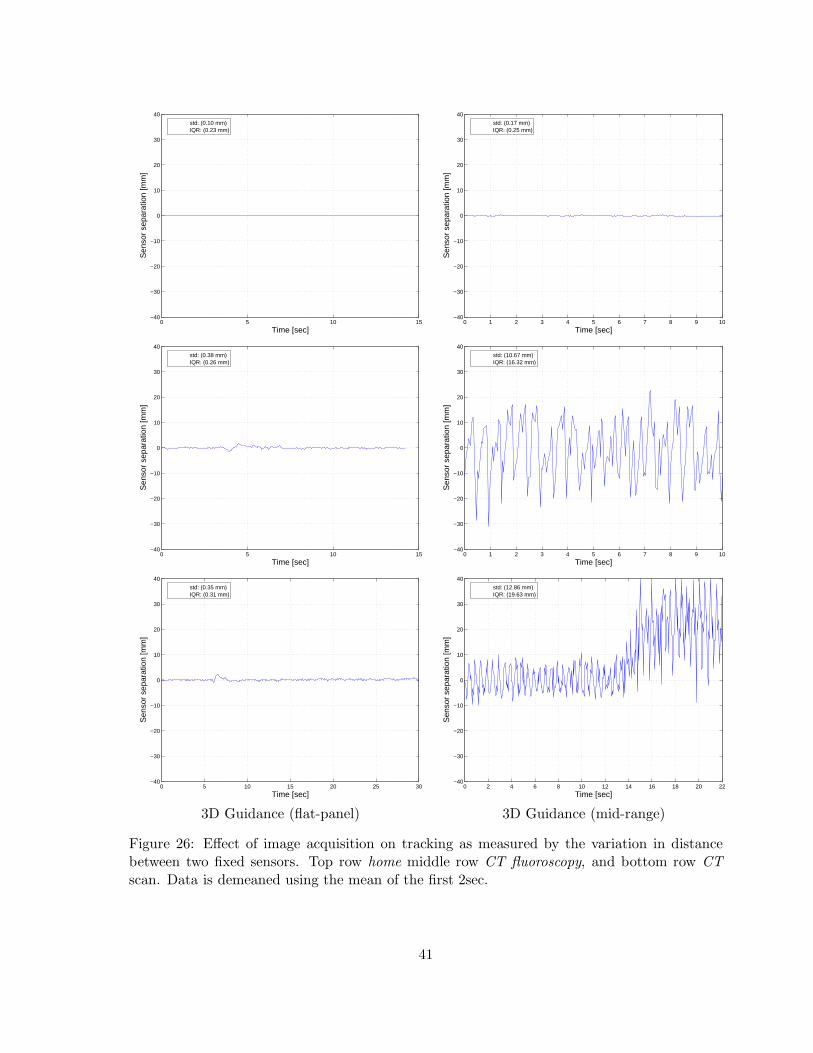
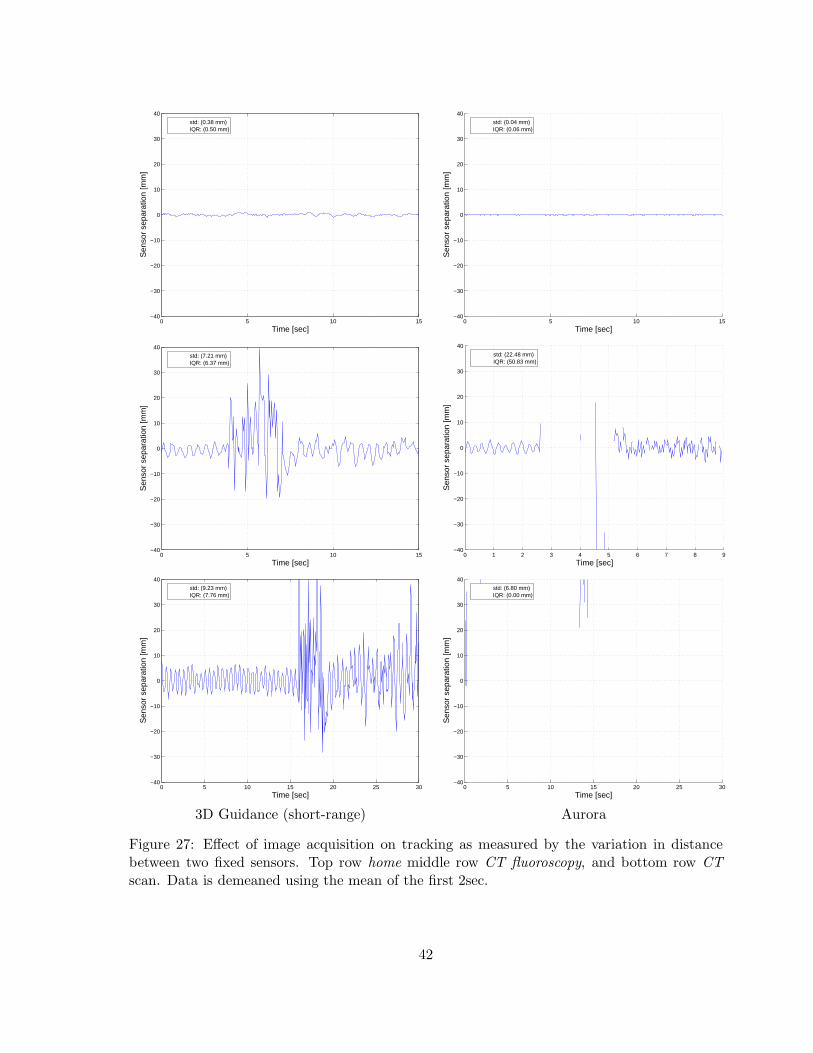
We then repeated the experiment in the CT suite. Figures 26 and 27 present data plots asacquired at the home position, during CT-fluoroscopy and during a CT scan. From theseexperiments we see that the only system that is robust in all setups is the 3D Guidance withflat-panel field generator. All other systems were only stable at home position, the region awayfrom the CT gantry in which we perform navigated procedures.
Finally, we evaluated the robustness in the pulmonology suite. We acquired tracking data withthe endoscope initially turned off and then turned it on. All systems were stable except anoutlying measurement acquired by the 3D Guidance with short-range field generator. This isconsistent with its fluctuations as seen in all other experiments. Figure 28 presents the dataplots from this experiment.
4 Discussion and conclusions
In the past electromagnetic tracking system evaluation has focused on the system’s accuracyand ability to deal with the presence of electromagnetic field distorting objects. This type ofassessment alone is insufficient for the clinical environment.
Based on our experience using electromagnetic tracking in the clinical environment we havecompiled a more comprehensive list of requirements. These should be assessed on a per-procedure basis and include: 1) the system’s refresh rate; 2) the number of sensors that can betracked concurrently; 3) the size of the tracking volume, 4) the obtrusiveness of the system; 5)sensor size and the information provided by the sensors (5DOF or 6DOF); 6) tracking accuracy;and 7) system robustness.
In this work we assessed the 3D Guidance EMTS with flat-panel, mid-range, and short-range
17

field generators, and the Aurora EMTS. Each system was found to have certain strengths andweaknesses, but no single system was optimal across environments and procedures.
All systems provided a sufficient refresh rate for our purposes. The number of concurrentlytracked sensors was also sufficient for our procedures. The tracking volumes provided by thesystems was found to be sufficient for our procedures, although the 3D Guidance with flat-panel and the Aurora system were easier to position as their optimal work volumes are largerthan the 3D Guidance with mid-range and short-range generators. Both the 3D Guidance andAurora system are wired, requiring care on the part of the medical staff when moving aroundthe patient, so they do not loose their footing. Note that this is no different than wired opticalsystems that are in common use in image-guided interventions. From an imaging standpointwe have found that the 3D Guidance with flat-panel is very obtrusive for X-ray based imaging,as the system’s generator is always in the field of view. We have also found that the othersystems do reduce the quality of X-ray projection images, but to a much lesser extent. Thesensor sizes available with both the 3D Guidance and the Aurora system and the informationthey provide, 5DOF or 6DOF, are sufficient for most of our procedures. The only case wherewe are limited is in our bronchoscopy procedure where we combine a 5DOF with image basedregistration to obtain the full 6DOF. Both the 3D Guidance and Aurora system were foundto be sufficiently accurate for our purposes. This is primarily due to our ability to control theenvironment so that the guided intervention is performed in a region with minimal distortion.It should be noted that the measurements acquired with the 3D Guidance with short-range fieldgenerator fluctuated considerably, but that the system was deemed accurate using our protocol,as we average 100 consecutive samples. Finally, we evaluated the robustness of each systemby concurrently acquiring data and imaging with apparatus that introduce severe distortionsto the magnetic field. The only system that was found to be robust in all environments is the3D Guidance with flat-panel field generator.
From this work it is clear that a holistic evaluation of EMTS is necessary. This is exemplified bythe assessment of the 3D Guidance system with the flat panel field generator. In the CT suite,this system proved to be the most accurate and robust, however, it was also the most obtrusivewith regard to imaging. Thus the clinical utility of this system can only be determined basedon all of the factors we have enumerated. In this case it is up to the physician to approve theuse based on their perception of the image quality.
We have also shown that generalizing conclusions with regard to system utility is hard, as therequirements and constraints of the various clinical environments and procedures vary consid-erably. Often ones expectations are not met, with evaluation performed in one environmentnot reflecting the system’s behavior in another one. In our case we were favorably surprisedto find that navigation accuracy was higher in the interventional radiology suite than in theoffice environment which we initially considered the optimal environment for EM navigation.
While non of the systems we evaluated was optimal across environments and procedures theyare applicable to specific interventions in specific environments. We have found that minormodifications in current clinical practice can considerably improve system utility. This isexemplified by our institutional review board approved clinical trial for navigated lung biopsyprocedures in the CT suite environment using the Aurora EMTS. In this case standard clinicalpractice is to perform the biopsy with the patient in the CT bore using CT-fluoroscopy. Bysimply moving the patient bed away from the CT gantry after data acquisition we are ableto perform the navigated procedure, whereas close to the gantry, the Aurora system fails to
18
perform tracking. We thus conclude that judicious use of EMTS can benefit many clinicalinterventions.
A Effect of tracking on imaging
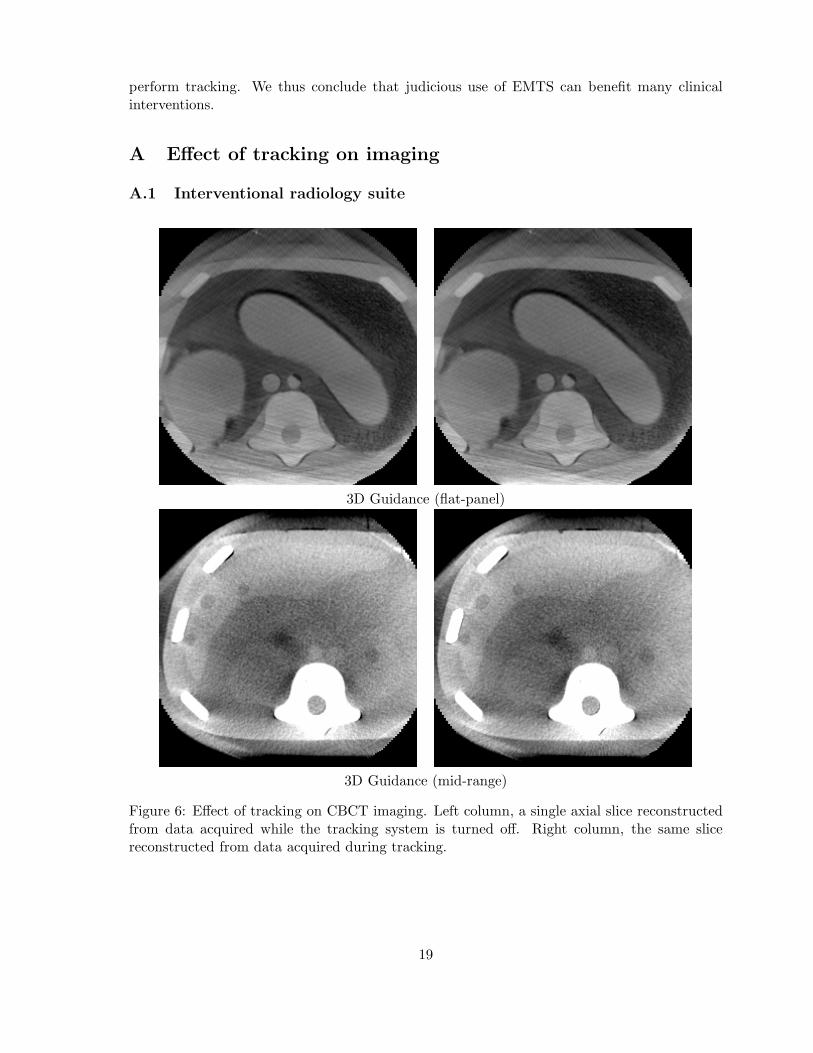
A.1 Interventional radiology suite
3D Guidance (flat-panel)
3D Guidance (mid-range)
Figure 6: Effect of tracking on CBCT imaging. Left column, a single axial slice reconstructedfrom data acquired while the tracking system is turned off. Right column, the same slicereconstructed from data acquired during tracking.
19

3D Guidance (short-range)
Aurora
Figure 7: Effect of tracking on CBCT imaging. Left column, a single axial slice reconstructedfrom data acquired while the tracking system is turned off. Right column, the same slicereconstructed from data acquired during tracking.
20
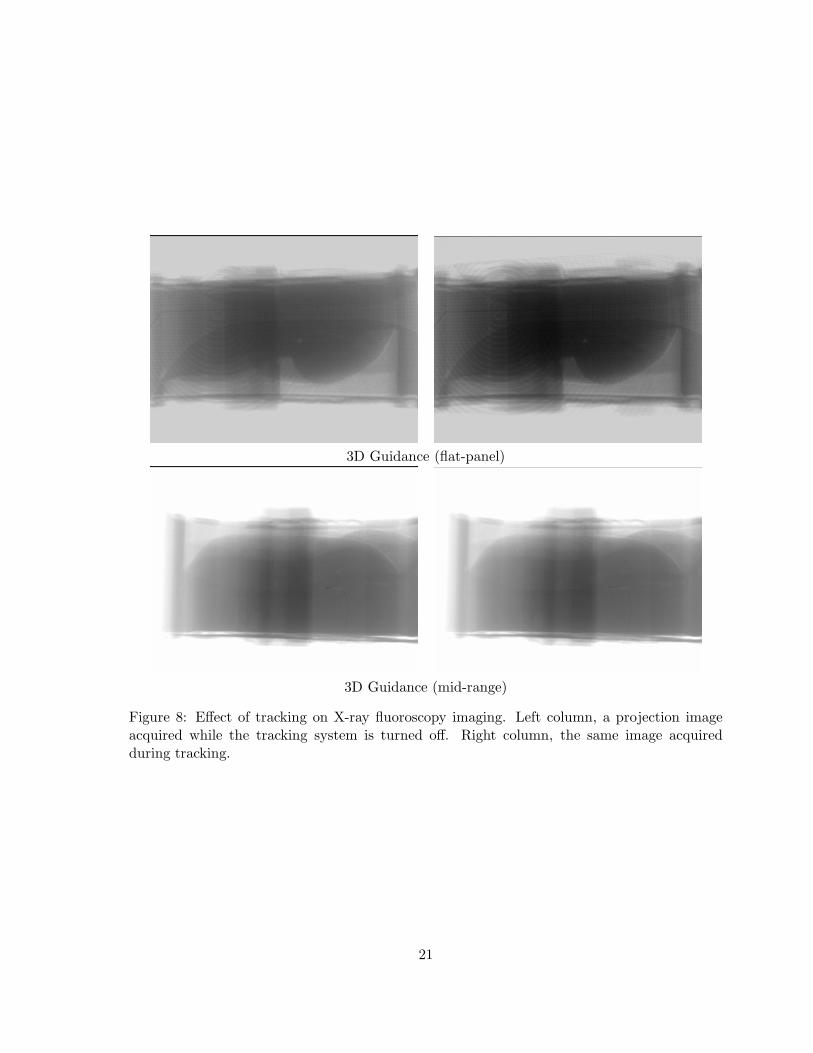
3D Guidance (flat-panel)
3D Guidance (mid-range)
Figure 8: Effect of tracking on X-ray fluoroscopy imaging. Left column, a projection imageacquired while the tracking system is turned off. Right column, the same image acquiredduring tracking.
21

3D Guidance (short-range)
Aurora
Figure 9: Effect of tracking on X-ray fluoroscopy imaging. Left column, a projection imageacquired while the tracking system is turned off. Right column, the same image acquiredduring tracking.
22
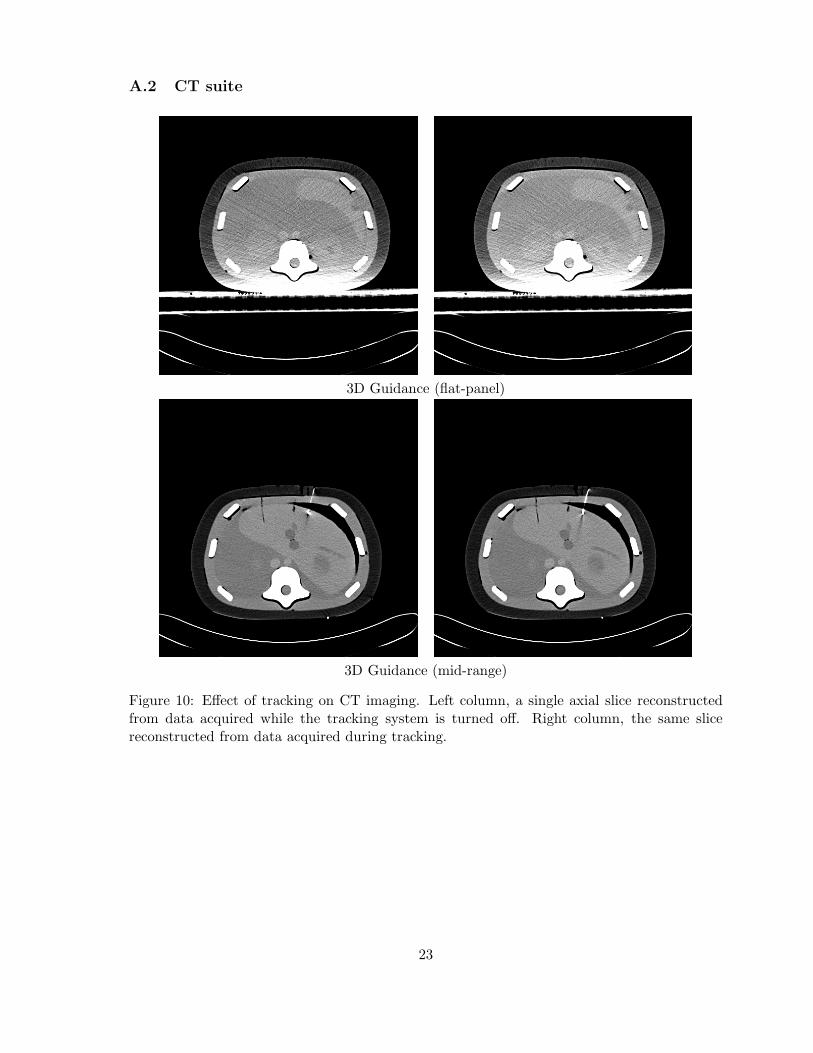
A.2 CT suite
3D Guidance (flat-panel)
3D Guidance (mid-range)
Figure 10: Effect of tracking on CT imaging. Left column, a single axial slice reconstructedfrom data acquired while the tracking system is turned off. Right column, the same slicereconstructed from data acquired during tracking.
23
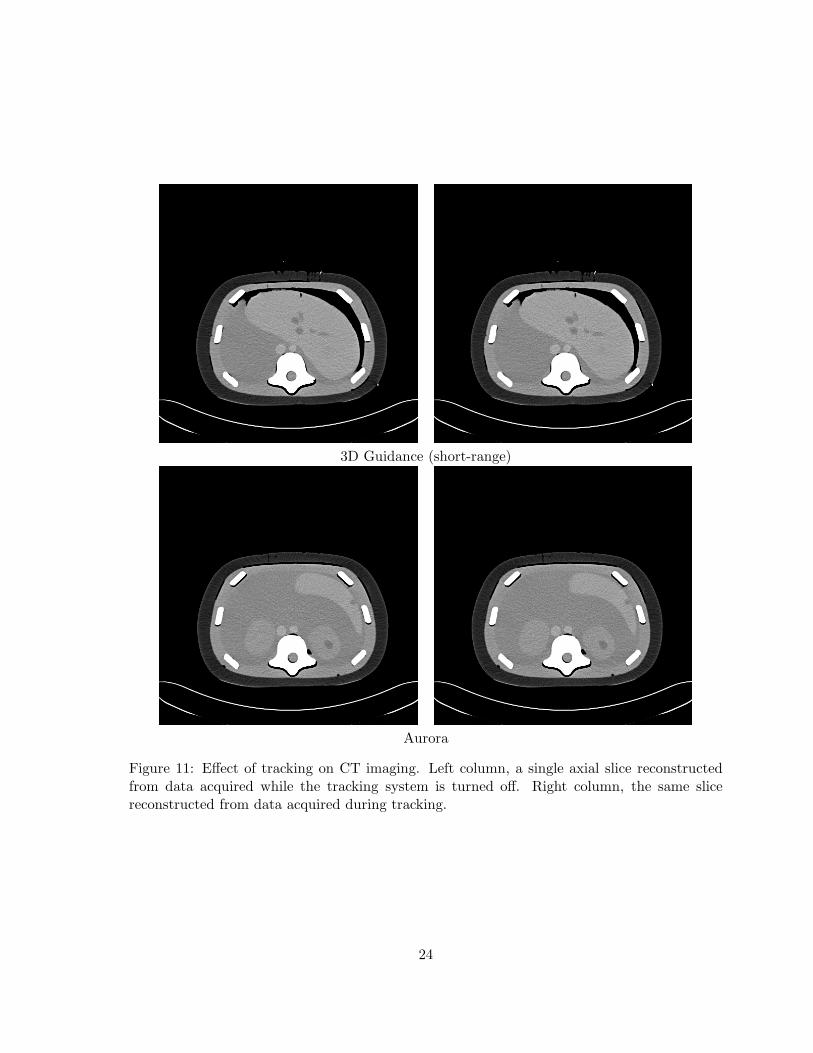
3D Guidance (short-range)
Aurora
Figure 11: Effect of tracking on CT imaging. Left column, a single axial slice reconstructedfrom data acquired while the tracking system is turned off. Right column, the same slicereconstructed from data acquired during tracking.
24
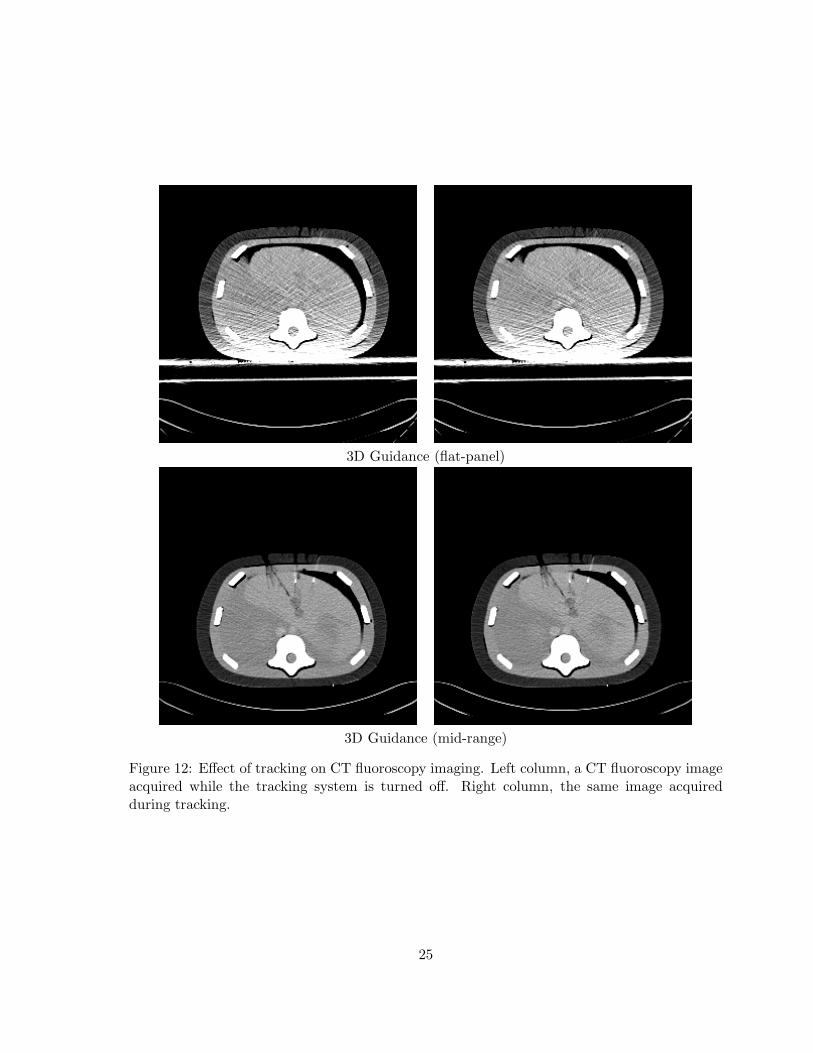
3D Guidance (flat-panel)
3D Guidance (mid-range)
Figure 12: Effect of tracking on CT fluoroscopy imaging. Left column, a CT fluoroscopy imageacquired while the tracking system is turned off. Right column, the same image acquiredduring tracking.
25

3D Guidance (short-range)
Aurora
Figure 13: Effect of tracking on CT fluoroscopy imaging. Left column, a CT fluoroscopy imageacquired while the tracking system is turned off. Right column, the same image acquiredduring tracking.
26

A.3 Pulmonology suite
3D Guidance (flat-panel)
3D Guidance (mid-range)
Figure 14: Effect of tracking on bronchoscopy imaging. Left column, a bronchoscopy imageacquired while the tracking system is turned off. Right column, the same image acquiredduring tracking.
27

3D Guidance (short-range)
Aurora
Figure 15: Effect of tracking on bronchoscopy imaging. Left column, a bronchoscopy imageacquired while the tracking system is turned off. Right column, the same image acquiredduring tracking.
28
B Accuracy
B.1 Office
0 5 10 150
10
20
30
40
50
60
Absolute Position Error [mm]
Num
ber
of O
ccur
ence
s
0 50 100 150 200 250 300 350 4000
0.5
1
1.5
2
2.5
3
3.5
4
4.5
5
FG − Sensor Coil Distance [mm]
Abs
olut
e P
ositi
on E
rror
[mm
]
DataPointmean: (1.02 mm)RMS: (1.19 mm)
3D Guidance (flat-panel)
0 5 10 150
10
20
30
40
50
60
Absolute Position Error [mm]
Num
ber
of O
ccur
ence
s
0 50 100 150 200 250 300 350 4000
0.5
1
1.5
2
2.5
3
3.5
4
4.5
5
FG − Sensor Coil Distance [mm]
Abs
olut
e P
ositi
on E
rror
[mm
]
DataPointmean: (0.36 mm)RMS: (0.39 mm)
3D Guidance (mid-range)
Figure 16: Accuracy evaluation in an office environment, error histogram and error as a functionof the distance from the field generator origin.
29
0 5 10 150
10
20
30
40
50
60
Absolute Position Error [mm]
Num
ber
of O
ccur
ence
s
0 50 100 150 200 250 300 350 4000
0.5
1
1.5
2
2.5
3
3.5
4
4.5
5
FG − Sensor Coil Distance [mm]A
bsol
ute
Pos
ition
Err
or [m
m]
DataPointmean: (0.50 mm)RMS: (0.55 mm)
3D Guidance (short-range)
0 5 10 150
10
20
30
40
50
60
Absolute Position Error [mm]
Num
ber
of O
ccur
ence
s
0 50 100 150 200 250 300 350 4000
0.5
1
1.5
2
2.5
3
3.5
4
4.5
5
FG − Sensor Coil Distance [mm]
Abs
olut
e P
ositi
on E
rror
[mm
]
DataPointmean: (1.15 mm)RMS: (1.39 mm)
Aurora
Figure 17: Accuracy evaluation in an office environment, error histogram and error as a functionof the distance from the field generator origin.
30

B.2 Interventional radiology suite
0 5 10 150
10
20
30
40
50
60
Absolute Position Error [mm]
Num
ber
of O
ccur
ence
s
0 50 100 150 200 250 300 350 400 4500
5
10
15
FG − Sensor Coil Distance [mm]
Abs
olut
e P
ositi
on E
rror
[mm
]
DataPointmean: (0.93 mm)RMS: (0.99 mm)
3D Guidance (flat-panel)
0 5 10 150
10
20
30
40
50
60
Absolute Position Error [mm]
Num
ber
of O
ccur
ence
s
0 50 100 150 200 250 300 350 400 4500
5
10
15
FG − Sensor Coil Distance [mm]
Abs
olut
e P
ositi
on E
rror
[mm
]
DataPointmean: (0.34 mm)RMS: (0.40 mm)
3D Guidance (mid-range)
Figure 18: Accuracy evaluation in the interventional radiology suite, error histogram and erroras a function of the distance from the field generator origin.
31

0 5 10 150
10
20
30
40
50
60
Absolute Position Error [mm]
Num
ber
of O
ccur
ence
s
0 50 100 150 200 250 300 350 400 4500
5
10
15
FG − Sensor Coil Distance [mm]A
bsol
ute
Pos
ition
Err
or [m
m]
DataPointmean: (0.34 mm)RMS: (0.38 mm)
3D Guidance (short-range)
0 5 10 150
10
20
30
40
50
60
Absolute Position Error [mm]
Num
ber
of O
ccur
ence
s
0 50 100 150 200 250 300 350 400 4500
5
10
15
FG − Sensor Coil Distance [mm]
Abs
olut
e P
ositi
on E
rror
[mm
]
DataPointmean: (0.76 mm)RMS: (1.01 mm)
Aurora
Figure 19: Accuracy evaluation in the interventional radiology suite, error histogram and erroras a function of the distance from the field generator origin.
32
B.3 CT suite
0 2 4 6 8 10 12 14 16 18 200
10
20
30
40
50
60
Absolute Position Error [mm]
Num
ber
of O
ccur
ence
s
0 50 100 150 200 250 300 350 400 4500
2
4
6
8
10
12
14
16
18
20
FG − Sensor Coil Distance [mm]
Abs
olut
e P
ositi
on E
rror
[mm
]
DataPointmean: (1.02 mm)RMS: (1.08 mm)
3D Guidance (flat-panel)
0 2 4 6 8 10 12 14 16 18 200
10
20
30
40
50
60
Absolute Position Error [mm]
Num
ber
of O
ccur
ence
s
0 50 100 150 200 250 300 350 400 4500
2
4
6
8
10
12
14
16
18
20
FG − Sensor Coil Distance [mm]
Abs
olut
e P
ositi
on E
rror
[mm
]
DataPointmean: (3.18 mm)RMS: (3.64 mm)
3D Guidance (mid-range)
Figure 20: Accuracy evaluation in the CT suite, error histogram and error as a function of thedistance from the field generator origin.
33

0 2 4 6 8 10 12 14 16 18 200
10
20
30
40
50
60
Absolute Position Error [mm]
Num
ber
of O
ccur
ence
s
0 50 100 150 200 250 300 350 400 4500
2
4
6
8
10
12
14
16
18
20
FG − Sensor Coil Distance [mm]A
bsol
ute
Pos
ition
Err
or [m
m]
DataPointmean: (5.67 mm)RMS: (6.49 mm)
3D Guidance (short-range)
0 2 4 6 8 10 12 14 16 18 200
10
20
30
40
50
60
Absolute Position Error [mm]
Num
ber
of O
ccur
ence
s
0 50 100 150 200 250 300 350 400 4500
2
4
6
8
10
12
14
16
18
20
FG − Sensor Coil Distance [mm]
Abs
olut
e P
ositi
on E
rror
[mm
]
DataPointmean: (5.13 mm)RMS: (5.76 mm)
Aurora
Figure 21: Accuracy evaluation in the CT suite, error histogram and error as a function of thedistance from the field generator origin.
34
B.4 Pulmonology suite
0 5 10 150
10
20
30
40
50
60
Absolute Position Error [mm]
Num
ber
of O
ccur
ence
s
0 50 100 150 200 250 300 350 4000
5
10
15
FG − Sensor Coil Distance [mm]
Abs
olut
e P
ositi
on E
rror
[mm
]
DataPointmean: (2.78 mm)RMS: (3.14 mm)
3D Guidance (flat-panel)
0 5 10 150
10
20
30
40
50
60
Absolute Position Error [mm]
Num
ber
of O
ccur
ence
s
0 50 100 150 200 250 300 350 4000
5
10
15
FG − Sensor Coil Distance [mm]
Abs
olut
e P
ositi
on E
rror
[mm
]
DataPointmean: (0.79 mm)RMS: (0.92 mm)
3D Guidance (mid-range)
Figure 22: Accuracy evaluation in the pulmonology suite, error histogram and error as afunction of the distance from the field generator origin.
35
0 5 10 150
10
20
30
40
50
60
Absolute Position Error [mm]
Num
ber
of O
ccur
ence
s
0 50 100 150 200 250 300 350 4000
5
10
15
FG − Sensor Coil Distance [mm]A
bsol
ute
Pos
ition
Err
or [m
m]
DataPointmean: (0.89 mm)RMS: (1.00 mm)
3D Guidance (short-range)
0 5 10 150
10
20
30
40
50
60
Absolute Position Error [mm]
Num
ber
of O
ccur
ence
s
0 50 100 150 200 250 300 350 4000
5
10
15
FG − Sensor Coil Distance [mm]
Abs
olut
e P
ositi
on E
rror
[mm
]
DataPointmean: (0.95 mm)RMS: (1.16 mm)
Aurora
Figure 23: Accuracy evaluation in the pulmonology suite, error histogram and error as afunction of the distance from the field generator origin.
36

C Robustness
C.1 Interventional radiology suite
In the interventional radiology suite tracking systems were evaluated using the following setups:
1. Home position - The optimal setup, C-arm is far from the patient location. This is thesetup we use for navigated interventions in this environment.
2. X-ray fluoroscopy - In this setup the C-arm is brought into imaging position and a singleX-ray projection image is acquired. This emulates the use of X-ray fluoroscopy for onlinevalidation during navigated interventions.
3. CBCT scan - In this setup the C-arm is brought into imaging position and a 20sec CBCTscan is performed. This emulates the acquisition of a CBCT volume for navigation.
37
0 5 10 15−5
−4
−3
−2
−1
0
1
2
3
4
5
Time [sec]
Sen
sor
sepa
ratio
n [m
m]
std: (0.12 mm)IQR: (0.18 mm)
0 2 4 6 8 10 12−5
−4
−3
−2
−1
0
1
2
3
4
5
Time [sec]
Sen
sor
sepa
ratio
n [m
m]
std: (0.13 mm)IQR: (0.19 mm)
0 2 4 6 8 10 12−5
−4
−3
−2
−1
0
1
2
3
4
5
Time [sec]
Sen
sor
sepa
ratio
n [m
m]
std: (0.10 mm)IQR: (0.18 mm)
0 2 4 6 8 10 12−5
−4
−3
−2
−1
0
1
2
3
4
5
Time [sec]
Sen
sor
sepa
ratio
n [m
m]
std: (0.15 mm)IQR: (0.22 mm)
0 5 10 15 20 25 30−5
−4
−3
−2
−1
0
1
2
3
4
5
Time [sec]
Sen
sor
sepa
ratio
n [m
m]
std: (0.13 mm)IQR: (0.16 mm)
0 5 10 15 20 25 30−5
−4
−3
−2
−1
0
1
2
3
4
5
Time [sec]
Sen
sor
sepa
ratio
n [m
m]
std: (0.35 mm)IQR: (0.49 mm)
3D Guidance (flat-panel) 3D Guidance (mid-range)
Figure 24: Effect of image acquisition on tracking as measured by the variation in distancebetween two fixed sensors. Top row home middle row X-ray fluoroscopy, and bottom rowCBCT scan. Data is demeaned using the mean of the first 2sec.
38
0 5 10 15−5
−4
−3
−2
−1
0
1
2
3
4
5
Time [sec]
Sen
sor
sepa
ratio
n [m
m]
std: (0.61 mm)IQR: (0.86 mm)
0 5 10 15−5
−4
−3
−2
−1
0
1
2
3
4
5
Time [sec]
Sen
sor
sepa
ratio
n [m
m]
std: (0.05 mm)IQR: (0.07 mm)
0 5 10 15−5
−4
−3
−2
−1
0
1
2
3
4
5
Time [sec]
Sen
sor
sepa
ratio
n [m
m]
std: (0.63 mm)IQR: (0.87 mm)
0 1 2 3 4 5 6 7 8 9−5
−4
−3
−2
−1
0
1
2
3
4
5
Time [sec]
Sen
sor
sepa
ratio
n [m
m]
std: (0.06 mm)IQR: (0.07 mm)
0 5 10 15 20 25 30−5
−4
−3
−2
−1
0
1
2
3
4
5
Time [sec]
Sen
sor
sepa
ratio
n [m
m]
std: (0.75 mm)IQR: (1.00 mm)
0 2 4 6 8 10 12 14 16 18 20−5
−4
−3
−2
−1
0
1
2
3
4
5
Time [sec]
Sen
sor
sepa
ratio
n [m
m]
std: (1.41 mm)IQR: (0.99 mm)
3D Guidance (short-range) Aurora
Figure 25: Effect of image acquisition on tracking as measured by the variation in distancebetween two fixed sensors. Top row home middle row X-ray fluoroscopy, and bottom rowCBCT scan. Data is demeaned using the mean of the first 2sec.
39

C.2 CT suite
In the CT suite tracking systems were evaluated using the following setups:
1. Home position - The optimal setup, patient location is far from the CT gantry. This isthe setup we are using for navigated interventions in this environment.
2. CT fluoroscopy - In this setup the patient is in the CT gantry, bed is stationary, anda single fluoroscopic CT slice is acquired. This emulates the use of CT fluoroscopy foronline validation during navigated interventions.
3. CT scan - In this setup a CT scan is acquired, concurrent imaging and bed translation.This emulates the acquisition of a CT volume for navigation.
40
0 5 10 15−40
−30
−20
−10
0
10
20
30
40
Time [sec]
Sen
sor
sepa
ratio
n [m
m]
std: (0.10 mm)IQR: (0.23 mm)
0 1 2 3 4 5 6 7 8 9 10−40
−30
−20
−10
0
10
20
30
40
Time [sec]
Sen
sor
sepa
ratio
n [m
m]
std: (0.17 mm)IQR: (0.25 mm)
0 5 10 15−40
−30
−20
−10
0
10
20
30
40
Time [sec]
Sen
sor
sepa
ratio
n [m
m]
std: (0.38 mm)IQR: (0.26 mm)
0 1 2 3 4 5 6 7 8 9 10−40
−30
−20
−10
0
10
20
30
40
Time [sec]
Sen
sor
sepa
ratio
n [m
m]
std: (10.67 mm)IQR: (16.32 mm)
0 5 10 15 20 25 30−40
−30
−20
−10
0
10
20
30
40
Time [sec]
Sen
sor
sepa
ratio
n [m
m]
std: (0.35 mm)IQR: (0.31 mm)
0 2 4 6 8 10 12 14 16 18 20 22−40
−30
−20
−10
0
10
20
30
40
Time [sec]
Sen
sor
sepa
ratio
n [m
m]
std: (12.86 mm)IQR: (19.63 mm)
3D Guidance (flat-panel) 3D Guidance (mid-range)
Figure 26: Effect of image acquisition on tracking as measured by the variation in distancebetween two fixed sensors. Top row home middle row CT fluoroscopy, and bottom row CTscan. Data is demeaned using the mean of the first 2sec.
41
0 5 10 15−40
−30
−20
−10
0
10
20
30
40
Time [sec]
Sen
sor
sepa
ratio
n [m
m]
std: (0.38 mm)IQR: (0.50 mm)
0 5 10 15−40
−30
−20
−10
0
10
20
30
40
Time [sec]
Sen
sor
sepa
ratio
n [m
m]
std: (0.04 mm)IQR: (0.06 mm)
0 5 10 15−40
−30
−20
−10
0
10
20
30
40
Time [sec]
Sen
sor
sepa
ratio
n [m
m]
std: (7.21 mm)IQR: (6.37 mm)
0 1 2 3 4 5 6 7 8 9−40
−30
−20
−10
0
10
20
30
40
Time [sec]
Sen
sor
sepa
ratio
n [m
m]
std: (22.48 mm)IQR: (50.83 mm)
0 5 10 15 20 25 30−40
−30
−20
−10
0
10
20
30
40
Time [sec]
Sen
sor
sepa
ratio
n [m
m]
std: (9.23 mm)IQR: (7.76 mm)
0 5 10 15 20 25 30−40
−30
−20
−10
0
10
20
30
40
Time [sec]
Sen
sor
sepa
ratio
n [m
m]
std: (6.80 mm)IQR: (0.00 mm)
3D Guidance (short-range) Aurora
Figure 27: Effect of image acquisition on tracking as measured by the variation in distancebetween two fixed sensors. Top row home middle row CT fluoroscopy, and bottom row CTscan. Data is demeaned using the mean of the first 2sec.
42
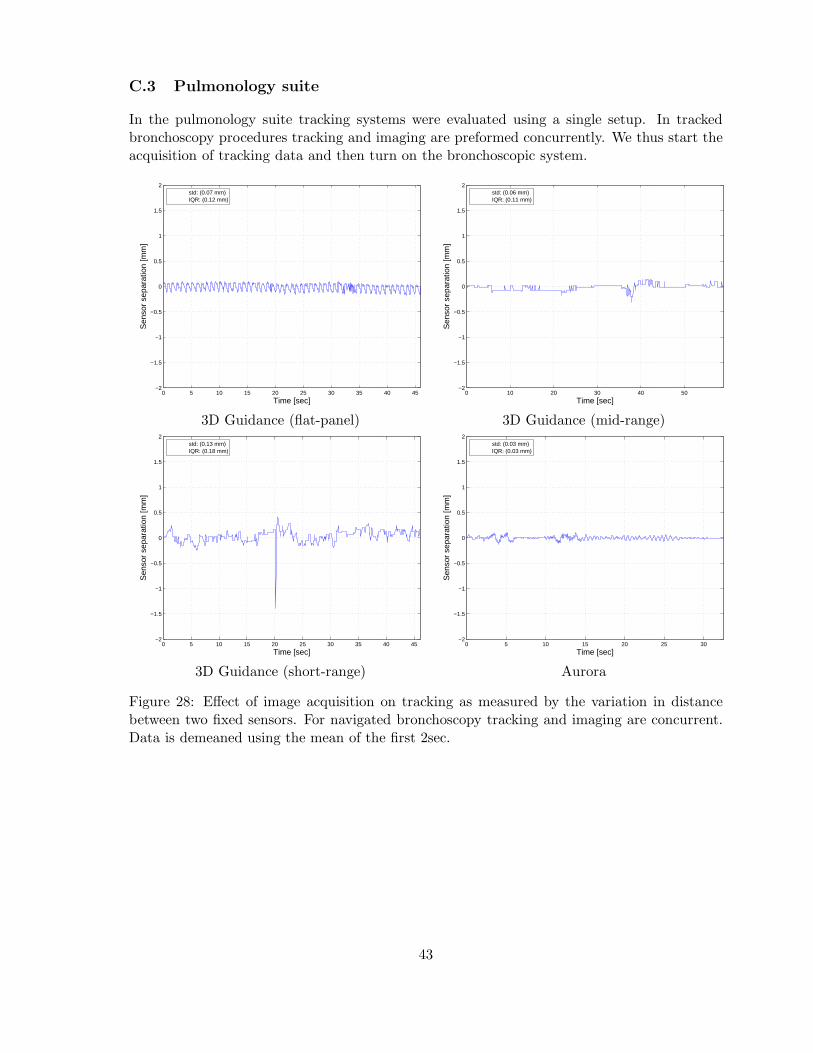
C.3 Pulmonology suite
In the pulmonology suite tracking systems were evaluated using a single setup. In trackedbronchoscopy procedures tracking and imaging are preformed concurrently. We thus start theacquisition of tracking data and then turn on the bronchoscopic system.
0 5 10 15 20 25 30 35 40 45−2
−1.5
−1
−0.5
0
0.5
1
1.5
2
Time [sec]
Sen
sor
sepa
ratio
n [m
m]
std: (0.07 mm)IQR: (0.12 mm)
0 10 20 30 40 50−2
−1.5
−1
−0.5
0
0.5
1
1.5
2
Time [sec]
Sen
sor
sepa
ratio
n [m
m]
std: (0.06 mm)IQR: (0.11 mm)
3D Guidance (flat-panel) 3D Guidance (mid-range)
0 5 10 15 20 25 30 35 40 45−2
−1.5
−1
−0.5
0
0.5
1
1.5
2
Time [sec]
Sen
sor
sepa
ratio
n [m
m]
std: (0.13 mm)IQR: (0.18 mm)
0 5 10 15 20 25 30−2
−1.5
−1
−0.5
0
0.5
1
1.5
2
Time [sec]
Sen
sor
sepa
ratio
n [m
m]
std: (0.03 mm)IQR: (0.03 mm)
3D Guidance (short-range) Aurora
Figure 28: Effect of image acquisition on tracking as measured by the variation in distancebetween two fixed sensors. For navigated bronchoscopy tracking and imaging are concurrent.Data is demeaned using the mean of the first 2sec.
43
References
[1] W. Birkfellner, J. Hummel, E. Wilson, and K. Cleary, “Tracking devices,” in Image-GuidedInterventions Technology and Applications, T. Peters and K. Cleary, Eds. Springer-Verlag, 2008.
[2] J. B. Hummel, M. R. Bax, M. L. Figl, Y. Kang, C. R. Maurer, Jr., W. W. Birkfellner,H. Bergmann, and R. Shahidi, “Design and application of an assessment protocol forelectromagnetic tracking systems,” Med. Phys., vol. 32, no. 7, pp. 2371–2379, 2005.
[3] C. Nafis, V. Jensen, L. Beauregard, and P. Anderson, “Method for estimating dynamic EMtracking accuracy of surgical navigation tools,” in SPIE Medical Imaging: Visualization,Image-Guided Procedures, and Display, 2006, pp. 61 410K–1–61 410K–16.
[4] E. Wilson, Z. Yaniv, H. Zhang, C. Nafis, E. Shen, G. Shechter, A. D. Wiles, T. Peters,D. Lindisch, and K. Cleary, “A hardware and software protocol for the evaluation ofelectromagnetic tracker accuracy in the clinical environment: a multi-center study,” inSPIE Medical Imaging: Visualization, Image-Guided Procedures, and Display, K. Clearyand M. Miga, Eds. SPIE, 2007, pp. 65 092T–1–65 092T–11.
[5] F. Banovac, J. Tang, S. Xu, D. Lindisch, H. Y. Chung, E. B. Levy, T. Chang, M. F.McCullough, Z. Yaniv, B. J. Wood, and K. Cleary, “Precision targeting of liver lesionsusing a novel electromagnetic navigation device in physiologic phantom and swine,” Med.Phys., vol. 32, no. 8, pp. 2698–2705, 2005.
[6] E. B. Levy, J. Tang, D. Lindisch, N. Glossop, F. Banovac, and K. Cleary, “Implementationof an electromagnetic tracking system for accurate intrahepatic puncture needle guidance:Accuracy results in an in vitro model,” Academic Radiology, vol. 14, no. 3, pp. 344–354,2007.
[7] F. Banovac, B. Wood, T. Popa, D. Lindisch, H. Zhang, K. Cleary, and N. Glossop,“Feasibility of carotid stent deployment in swine using an electromagnetic navigationdevice for catheter guidance,” in Proc. Computer Assisted Radiology and Surgery, 2005,p. 1308.
[8] J. Ding, N. Khan, P. Cheng, E. Wilson, V. Watson, K. Cleary, and Z. Yaniv, “Accuracyanalysis of an image-guided system for vertebroplasty spinal therapy based on electromag-netic tracking of instruments,” in SPIE Medical Imaging: Visualization, Image-GuidedProcedures, and Display, 2008.
[9] F. Banovac, E. Wilson, H. Zhang, and K. Cleary, “Needle biopsy of anatomically unfavor-able liver lesions with an electromagnetic navigation assist device in a computed tomog-raphy environment,” Journal of Vascular and Interventional Radiology, vol. 17, no. 10,pp. 1671–1675, 2006.
[10] J. Choi, L. Gruionu, T. Popa, E. Anderson, and K. Cleary, “Transbronchial biopsy basedon electromagnetic tracked biopsy forceps,” Int. J. Computer Assisted Radiology andSurgery, vol. 2, no. Suppl. 1, pp. S143–S145, 2007.
[11] Ascension Technology Corporation (Milton, Vermont, USA), accessed April 7, 2008.[Online]. Available: http://www.ascension-tech.com/
44

[12] Northern Digital Inc. (Waterloo, Ontario, Canada), accessed April 7, 2008. [Online].Available: http://www.ndigital.com/
[13] Polhemus (Burlington, Vermont, USA), accessed April 7, 2008. [Online]. Available:http://www.polhemus.com/
[14] M. A. Nixon, B. C. McCallum, R. W. Fright, and B. N. Price, “The effects of metalsand interfering fields on electromagnetic trackers,” Presence: Teleoperators & VirtualEnvironments, vol. 7, no. 2, pp. 204–218, 1998.
[15] K. Mori, D. Deguchi, K. Akiyama, T. Kitasaka, C. R. M. Jr., Y. Suenaga, H. Takabatake,M. Mori, and H. Natori, “Hybrid bronchoscope tracking using a magnetic tracking sensorand image registration,” in Medical Image Computing and Computer-Assisted Interven-tion, 2005, pp. 543–550.
[16] B. K. P. Horn, “Closed-form solution of absolute orientation using unit quaternions,”Journal of the Optical Society of America A, vol. 4, no. 4, pp. 629–642, April 1987.
[17] A. J. Chung, P. J. Edwards, F. Deligianni, and G. Z. Yang, “Freehand co-calibration of anoptical and electromagnetic tracker,” in Second International Workshop: Medical Imagingand Augmented Reality, 2004, pp. 320–328.
[18] G. S. Fischer and R. H. Taylor, “Electromagnetic tracker measurement error simulationand tool design,” in Medical Image Computing and Computer-Assisted Intervention, 2005,pp. 73–80.
[19] M. Nakamoto, K. Nakada, Y. Sato, K. Konishi, M. Hashizume, and S. Tamura, “In-traoperative magnetic tracker calibration using a magneto-optic hybrid tracker for 3-Dultrasound-based navigation in laparoscopic surgery,” IEEE Trans. Med. Imag., vol. 27,no. 2, pp. 255–270, 2008.
45