Electrochemical, Spectroelectrochemical, and Comparative Studies of Novel Organic Conjugated...
8
H422 Journal of The Electrochemical Society, 161 (6) H422-H429 (2014) 0013-4651/2014/161(6)/H422/8/$31.00 © The Electrochemical Society Electrochemical, Spectroelectrochemical, and Electrochromic Properties of Lanthanide Bis-Phthalocyanines Efe Baturhan Orman, a Atıf Koca, b Ali Rıza ¨ Ozkaya, a, z ˙ Ilke G ¨ urol, c Mahmut Durmus ¸, d and Vefa Ahsen d a Department of Chemistry, Marmara University, G¨ oztepe, 34722, Istanbul, Turkey b Department of Chemical Engineering, Faculty of Engineering, Marmara University, G¨ oztepe, 34722 Istanbul, Turkey c TUBITAK-Marmara Research Center, Materials Institute, Gebze 41470, Turkey d Gebze Institute of Technology, Department of Chemistry, Gebze, 41400, Turkey Voltammetric, in-situ spectroelectrochemical, and in-situ electrocolorimetric characterization of octa-2,2,3,3-tetrafluoropropoxy- substituted lanthanide (III) bis-phthalocyanines [samarium(III) (SmPc 2 ), europium (III) (EuPc 2 ), gadolinium (III) (GdPc 2 ), dyspro- sium(III) (DyPc 2 ) and lutetium(III) (LuPc 2 )] were performed in solution and in the solid states as Langmuir-Blodgett (LB) films. The type of the central metal of the complexes slightly altered the potentials of the electron transfer reactions. Redox peaks shifted toward the negative potentials as a function of the decreasing metal ion size. All complexes gave three reduction and one oxidation reactions with in the whole potential window of the electrolyte system. Due to the π-π interaction of phthalocyanine rings around the lanthanide metal ions the complexes were easily reduced at even positive potentials. Assignments of the redox processes, spectra and color of the electrogenerated species of the complexes were determined with in-situ spectroelectrochemical, and in-situ electro- colorimetric measurements. Various colors recorded during the electron transfer reactions well reflected electrochromic characters of the complexes. For practical usage, LB thin films of the complexes were easily coated on the ITO electrodes and investigated as electrochromic materials. All complexes displayed three distinctive color alternatives as green, orange, and red for their different redox states. Electrochromic measurements indicated that the nature of the metal ions in the phthalocyanine cavity alters the basic electrochromic parameters of the complexes. LB films of DyPc 2 and LuPc 2 were especially found as ideal neutral and anodic coloring electrochromic materials with their short response times, and high optical and coulombic stabilities. © 2014 The Electrochemical Society. [DOI: 10.1149/2.111406jes] All rights reserved. Manuscript submitted April 4, 2014; revised manuscript received May 7, 2014. Published May 19, 2014. In addition to the wide range of the application fields, metallophthalocyanines (MPcs) have been extensively preferred in various electrochemical application technologies such as electrochromic, 1–3 semiconductor, 4,5 electrochemical sensor, 6–9 and electrocatalytic 10–12 applications because of their predominant elec- trochemical properties. 13,14 It is well known that basic electrochem- ical characterization of MPcs are directly related with the exten- sive π-electron delocalization of the Pc rings, redox activity of the central metals, and functionality of the substituent environments of the Pc ring. 15–17 Among phthalocyanine (Pc) derivatives, the syn- theses of lanthanide (III) Pcs (LnPc 2 ) have attracted great atten- tion due to the changing of the electrochemical responses of the complexes with the π- π interaction of the Pc rings of the sand- wich complexes. 14,18–21 Altering the metal center and substituents of these type complexes easily affects their physical, electrical, optical, and electrochemical properties, 22–24 thus it is important to determine the electrochemical responses of the newly synthe- sized complexes to decide their possible application in different technologies. Therefore in this study, investigation of the electro- chemical and spectroelectrochemical properties of a series of lan- thanide (III) bis-phthalocyanines [samarium(III) (SmPc 2 ), europium (III) (EuPc 2 ), gadolinium (III) (GdPc 2 ), dysprosium(III) (DyPc 2 ) and lutetium(III) (LuPc 2 )] was aimed. The electrochromic features of the complexes were also examined. For this purpose, LnPc 2 complexes have been coated on indium-tin oxide (ITO) electrodes by using LB technique, and then they were analyzed as active electrochromic materials. It is well known that bis-Pcs have the color of initially brilliant green in general and this color changes to yellow/tan and red on ox- idation, and observation of blue and then violet colors are possible during the reduction of green complexes. The tailoring of the com- plexes with different metal ions or substituents also alters possible color alternatives in addition to the electrochemical and spectroelec- trochemical behaviors of the complexes. In our previous papers, we investigated the electrochemical and electrochromic properties of var- ious mono and bis-Pcs. 25–28 In our continuing efforts, in this paper, the effects of the central metals and octa-2,2,3,3-tetrafluoropropoxy z E-mail: [email protected] substituents on the electrochemical and electrochromic behaviors of the LnPc 2 complexes have been studied. Experimental Synthesis.— The studied octa-2,2,3,3-tetrafluoropropoxy substi- tuted samarium (III) (SmPc 2 ), europium (III) (EuPc 2 ), gadolinium (III) (GdPc 2 ), dysprosium (III) (DyPc 2 ) and lutetium (III) (LuPc 2 ) phthalocyanines were synthesized and characterized according to the our previous study. 29 Electrochemical measurements.— The cyclic voltammetry (CV), controlled potential coulometry (CPC), and square wave voltammetry (SWV) measurements were carried out with Gamry Reference 600 potentiostat/galvanostat utilizing a three-electrode configuration at 25 ˚C by following the procedure in the literature. 25 The working electrode was ITO modified with the complexes studied here with a surface area of 1.00 cm 2 . A Pt wire served as the counter electrode. Saturated calomel electrode (SCE) was employed as the reference electrode and separated from the bulk of the solution by a double bridge. LiClO 4 in ultra-pure water was employed as the supporting electrolyte at a concentration of 0.10 mol dm −3 . Langmuir-Blodgett thin film preparation.— LB experiments were carried out using a KSV/Nima 5000. 0.1 M CdCl 2 dissolved in ul- trapure water (resistivity greater than 18 M cm) from a Milli-Q Millipore system was used as the subphase. LB films were prepared by spreading chloroform solution of the compounds (1 mg of MPcs in 1 μL of chloroform) on subphase. A 50 μL of the spreading solution was uniformly spread over the aqueous subphase by adding small drops at different locations on the water surface. A time period of 15 min was allowed for the solvent to evaporate before the area en- closed by the barriers was reduced. The π–A isotherm was recorded using a compression speed of barriers of 10 mm min −1 . A surface pressure (π) vs. molecular area isotherm was measured to character- ize the quality of the monolayer on the subphase. The surface pressure was measured by the Wilhelmy method. After 30 min waiting for the stabilization of the monolayer, a vertical dipping procedure was per- formed at the selected surface pressure with a speed of 5 mm min −1 for both down and up strokes to transfer the monolayer on the ITO substrates. LB film samples were allowed to dry after each up stroke. ) unless CC License in place (see abstract). ecsdl.org/site/terms_use address. Redistribution subject to ECS terms of use (see 193.140.73.50 Downloaded on 2014-05-21 to IP
-
Upload
independent -
Category
Documents
-
view
1 -
download
0
Transcript of Electrochemical, Spectroelectrochemical, and Comparative Studies of Novel Organic Conjugated...

H422 Journal of The Electrochemical Society, 161 (6) H422-H429 (2014)0013-4651/2014/161(6)/H422/8/$31.00 © The Electrochemical Society
Electrochemical, Spectroelectrochemical, and ElectrochromicProperties of Lanthanide Bis-Phthalocyanines
Efe Baturhan Orman,a Atıf Koca,b Ali Rıza Ozkaya,a,z Ilke Gurol,c Mahmut Durmus,dand Vefa Ahsend
aDepartment of Chemistry, Marmara University, Goztepe, 34722, Istanbul, TurkeybDepartment of Chemical Engineering, Faculty of Engineering, Marmara University, Goztepe, 34722 Istanbul, TurkeycTUBITAK-Marmara Research Center, Materials Institute, Gebze 41470, TurkeydGebze Institute of Technology, Department of Chemistry, Gebze, 41400, Turkey
Voltammetric, in-situ spectroelectrochemical, and in-situ electrocolorimetric characterization of octa-2,2,3,3-tetrafluoropropoxy-substituted lanthanide (III) bis-phthalocyanines [samarium(III) (SmPc2), europium (III) (EuPc2), gadolinium (III) (GdPc2), dyspro-sium(III) (DyPc2) and lutetium(III) (LuPc2)] were performed in solution and in the solid states as Langmuir-Blodgett (LB) films.The type of the central metal of the complexes slightly altered the potentials of the electron transfer reactions. Redox peaks shiftedtoward the negative potentials as a function of the decreasing metal ion size. All complexes gave three reduction and one oxidationreactions with in the whole potential window of the electrolyte system. Due to the π-π interaction of phthalocyanine rings aroundthe lanthanide metal ions the complexes were easily reduced at even positive potentials. Assignments of the redox processes, spectraand color of the electrogenerated species of the complexes were determined with in-situ spectroelectrochemical, and in-situ electro-colorimetric measurements. Various colors recorded during the electron transfer reactions well reflected electrochromic charactersof the complexes. For practical usage, LB thin films of the complexes were easily coated on the ITO electrodes and investigated aselectrochromic materials. All complexes displayed three distinctive color alternatives as green, orange, and red for their differentredox states. Electrochromic measurements indicated that the nature of the metal ions in the phthalocyanine cavity alters the basicelectrochromic parameters of the complexes. LB films of DyPc2 and LuPc2 were especially found as ideal neutral and anodic coloringelectrochromic materials with their short response times, and high optical and coulombic stabilities.© 2014 The Electrochemical Society. [DOI: 10.1149/2.111406jes] All rights reserved.
Manuscript submitted April 4, 2014; revised manuscript received May 7, 2014. Published May 19, 2014.
In addition to the wide range of the application fields,metallophthalocyanines (MPcs) have been extensively preferredin various electrochemical application technologies such aselectrochromic,1–3 semiconductor,4,5 electrochemical sensor,6–9 andelectrocatalytic10–12 applications because of their predominant elec-trochemical properties.13,14 It is well known that basic electrochem-ical characterization of MPcs are directly related with the exten-sive π-electron delocalization of the Pc rings, redox activity of thecentral metals, and functionality of the substituent environments ofthe Pc ring.15–17 Among phthalocyanine (Pc) derivatives, the syn-theses of lanthanide (III) Pcs (LnPc2) have attracted great atten-tion due to the changing of the electrochemical responses of thecomplexes with the π- π interaction of the Pc rings of the sand-wich complexes.14,18–21 Altering the metal center and substituentsof these type complexes easily affects their physical, electrical,optical, and electrochemical properties,22–24 thus it is importantto determine the electrochemical responses of the newly synthe-sized complexes to decide their possible application in differenttechnologies. Therefore in this study, investigation of the electro-chemical and spectroelectrochemical properties of a series of lan-thanide (III) bis-phthalocyanines [samarium(III) (SmPc2), europium(III) (EuPc2), gadolinium (III) (GdPc2), dysprosium(III) (DyPc2) andlutetium(III) (LuPc2)] was aimed. The electrochromic features of thecomplexes were also examined. For this purpose, LnPc2 complexeshave been coated on indium-tin oxide (ITO) electrodes by usingLB technique, and then they were analyzed as active electrochromicmaterials.
It is well known that bis-Pcs have the color of initially brilliantgreen in general and this color changes to yellow/tan and red on ox-idation, and observation of blue and then violet colors are possibleduring the reduction of green complexes. The tailoring of the com-plexes with different metal ions or substituents also alters possiblecolor alternatives in addition to the electrochemical and spectroelec-trochemical behaviors of the complexes. In our previous papers, weinvestigated the electrochemical and electrochromic properties of var-ious mono and bis-Pcs.25–28 In our continuing efforts, in this paper,the effects of the central metals and octa-2,2,3,3-tetrafluoropropoxy
zE-mail: [email protected]
substituents on the electrochemical and electrochromic behaviors ofthe LnPc2 complexes have been studied.
Experimental
Synthesis.— The studied octa-2,2,3,3-tetrafluoropropoxy substi-tuted samarium (III) (SmPc2), europium (III) (EuPc2), gadolinium(III) (GdPc2), dysprosium (III) (DyPc2) and lutetium (III) (LuPc2)phthalocyanines were synthesized and characterized according to theour previous study.29
Electrochemical measurements.— The cyclic voltammetry (CV),controlled potential coulometry (CPC), and square wave voltammetry(SWV) measurements were carried out with Gamry Reference 600potentiostat/galvanostat utilizing a three-electrode configuration at25 ˚C by following the procedure in the literature.25 The workingelectrode was ITO modified with the complexes studied here with asurface area of 1.00 cm2. A Pt wire served as the counter electrode.Saturated calomel electrode (SCE) was employed as the referenceelectrode and separated from the bulk of the solution by a doublebridge. LiClO4 in ultra-pure water was employed as the supportingelectrolyte at a concentration of 0.10 mol dm−3.
Langmuir-Blodgett thin film preparation.— LB experiments werecarried out using a KSV/Nima 5000. 0.1 M CdCl2 dissolved in ul-trapure water (resistivity greater than 18 M � cm) from a Milli-QMillipore system was used as the subphase. LB films were preparedby spreading chloroform solution of the compounds (1 mg of MPcs in1 μL of chloroform) on subphase. A 50 μL of the spreading solutionwas uniformly spread over the aqueous subphase by adding smalldrops at different locations on the water surface. A time period of15 min was allowed for the solvent to evaporate before the area en-closed by the barriers was reduced. The π–A isotherm was recordedusing a compression speed of barriers of 10 mm min−1. A surfacepressure (π) vs. molecular area isotherm was measured to character-ize the quality of the monolayer on the subphase. The surface pressurewas measured by the Wilhelmy method. After 30 min waiting for thestabilization of the monolayer, a vertical dipping procedure was per-formed at the selected surface pressure with a speed of 5 mm min−1
for both down and up strokes to transfer the monolayer on the ITOsubstrates. LB film samples were allowed to dry after each up stroke.
) unless CC License in place (see abstract). ecsdl.org/site/terms_use address. Redistribution subject to ECS terms of use (see 193.140.73.50Downloaded on 2014-05-21 to IP
Journal of The Electrochemical Society, 161 (6) H422-H429 (2014) H423
Different numbers of monolayers were transferred to the ITO glass byY-type deposition to optimize the film thickness to the electrochemicalresponses. LB film coated electrodes are abbreviated as ITO/LnPc2
(LB). To characterize the coating ability of the LB film, a transferratio was calculated by dividing the area of deposited film by the areaof substrate.
In-situ spectroelectrochemical and in-situ spectrochronocoulomet-ric measurements.— UV-Vis absorption spectra and chromaticity di-agrams were measured with an OceanOptics HR2000+ diode arrayspectrophotometer. In-situ spectroelectrochemical and spectrochrono-coulometric (SCC) measurements were carried out by utilizing a three-electrode configuration of thin-layer quartz thin-layer spectroelectro-chemical cell at 25˚C. The working electrode was ITO electrode. Ptwire counter electrode separated by a glass bridge and a SCE referenceelectrode separated from the bulk of the solution by a double bridgewere used. In-situ electrocolorimetric measurements, under potentio-static control, were obtained using an OceanOptics HR2000+ diodearray spectrophotometer at color measurement mode by utilizing athree-electrode configuration of thin-layer quartz spectroelectrochem-ical cell. The standard illuminant A with 2 degree observer at constanttemperature in a light booth designed to exclude external light wasused. Prior to each set of measurements, background color coordinates(x, y, and z values) were taken at open-circuit, using the electrolyte so-lution without the complexes under study. During the measurements,readings were taken as a function of time under kinetic control, how-ever only the color coordinates at the beginning and final of each redoxprocesses were reported. During SCC measurements, applied poten-tial of the working electrode was switched between two potential within an appropriate duration and the% transmittance changes versus timeat the maximum wavelength was observed. At the same time current-time responses of the working electrode was also recorded in orderto determine coulombic stability and efficiency of the electrochromicmaterials.
Results and Discussion
Electrochemical measurements.— Electrochemical characteriza-tions of lanthanide series bis-Pcs (LnPc2) having Sm3+ (SmPc2),Eu3+ (EuPc2), Gd3+ (GdPc2), Dy3+ (DyPc2), and Lu3+ (LuPc2) metal
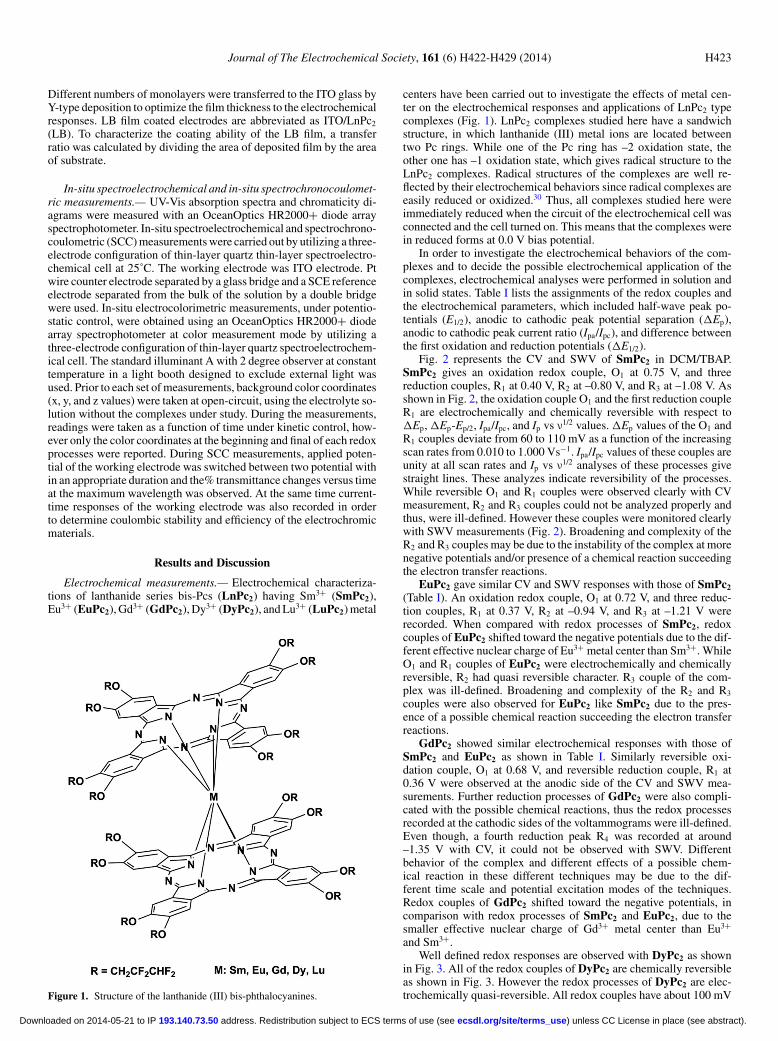
Figure 1. Structure of the lanthanide (III) bis-phthalocyanines.
centers have been carried out to investigate the effects of metal cen-ter on the electrochemical responses and applications of LnPc2 typecomplexes (Fig. 1). LnPc2 complexes studied here have a sandwichstructure, in which lanthanide (III) metal ions are located betweentwo Pc rings. While one of the Pc ring has –2 oxidation state, theother one has –1 oxidation state, which gives radical structure to theLnPc2 complexes. Radical structures of the complexes are well re-flected by their electrochemical behaviors since radical complexes areeasily reduced or oxidized.30 Thus, all complexes studied here wereimmediately reduced when the circuit of the electrochemical cell wasconnected and the cell turned on. This means that the complexes werein reduced forms at 0.0 V bias potential.
In order to investigate the electrochemical behaviors of the com-plexes and to decide the possible electrochemical application of thecomplexes, electrochemical analyses were performed in solution andin solid states. Table I lists the assignments of the redox couples andthe electrochemical parameters, which included half-wave peak po-tentials (E1/2), anodic to cathodic peak potential separation (�Ep),anodic to cathodic peak current ratio (Ipa/Ipc), and difference betweenthe first oxidation and reduction potentials (�E1/2).
Fig. 2 represents the CV and SWV of SmPc2 in DCM/TBAP.SmPc2 gives an oxidation redox couple, O1 at 0.75 V, and threereduction couples, R1 at 0.40 V, R2 at –0.80 V, and R3 at –1.08 V. Asshown in Fig. 2, the oxidation couple O1 and the first reduction coupleR1 are electrochemically and chemically reversible with respect to�Ep, �Ep-Ep/2, Ipa/Ipc, and Ip vs ν1/2 values. �Ep values of the O1 andR1 couples deviate from 60 to 110 mV as a function of the increasingscan rates from 0.010 to 1.000 Vs−1. Ipa/Ipc values of these couples areunity at all scan rates and Ip vs ν1/2 analyses of these processes givestraight lines. These analyzes indicate reversibility of the processes.While reversible O1 and R1 couples were observed clearly with CVmeasurement, R2 and R3 couples could not be analyzed properly andthus, were ill-defined. However these couples were monitored clearlywith SWV measurements (Fig. 2). Broadening and complexity of theR2 and R3 couples may be due to the instability of the complex at morenegative potentials and/or presence of a chemical reaction succeedingthe electron transfer reactions.
EuPc2 gave similar CV and SWV responses with those of SmPc2
(Table I). An oxidation redox couple, O1 at 0.72 V, and three reduc-tion couples, R1 at 0.37 V, R2 at –0.94 V, and R3 at –1.21 V wererecorded. When compared with redox processes of SmPc2, redoxcouples of EuPc2 shifted toward the negative potentials due to the dif-ferent effective nuclear charge of Eu3+ metal center than Sm3+. WhileO1 and R1 couples of EuPc2 were electrochemically and chemicallyreversible, R2 had quasi reversible character. R3 couple of the com-plex was ill-defined. Broadening and complexity of the R2 and R3
couples were also observed for EuPc2 like SmPc2 due to the pres-ence of a possible chemical reaction succeeding the electron transferreactions.
GdPc2 showed similar electrochemical responses with those ofSmPc2 and EuPc2 as shown in Table I. Similarly reversible oxi-dation couple, O1 at 0.68 V, and reversible reduction couple, R1 at0.36 V were observed at the anodic side of the CV and SWV mea-surements. Further reduction processes of GdPc2 were also compli-cated with the possible chemical reactions, thus the redox processesrecorded at the cathodic sides of the voltammograms were ill-defined.Even though, a fourth reduction peak R4 was recorded at around–1.35 V with CV, it could not be observed with SWV. Differentbehavior of the complex and different effects of a possible chem-ical reaction in these different techniques may be due to the dif-ferent time scale and potential excitation modes of the techniques.Redox couples of GdPc2 shifted toward the negative potentials, incomparison with redox processes of SmPc2 and EuPc2, due to thesmaller effective nuclear charge of Gd3+ metal center than Eu3+
and Sm3+.Well defined redox responses are observed with DyPc2 as shown
in Fig. 3. All of the redox couples of DyPc2 are chemically reversibleas shown in Fig. 3. However the redox processes of DyPc2 are elec-trochemically quasi-reversible. All redox couples have about 100 mV
) unless CC License in place (see abstract). ecsdl.org/site/terms_use address. Redistribution subject to ECS terms of use (see 193.140.73.50Downloaded on 2014-05-21 to IP

H424 Journal of The Electrochemical Society, 161 (6) H422-H429 (2014)
Table I. Voltammetric data of the complexes with the related metallophthalocyanines for comparison.
Complex O1 R1 R2 R3 R4d�E1/2 (V) ref
SmPc2 in DCM aE1/2 (V) vs. SCE 0.75 0.40 –0.80 –1.08b�Ep (mV) 59 61 83 - 0.35 twcIpa/Ipc 0.94 0.96 0.96e 0.95e
EuPc2 in DCM aE1/2 (V) vs. SCE 0.72 0.37 –0.94 –1.21b�Ep (mV) 65 71 90 126 0.35 twcIpa/Ipc 0.97 0.98 0.91 1.15
GdPc2 in DCM aE1/2 (V) vs. SCE 0.68 0.36 –0.88 –1.18 –1.33b�Ep (mV) 74 62 75 82 0.32 twcIpa/Ipc 0.98 0.97 0.78e 0.82e
DyPc2 in DCM aE1/2 (V) vs. SCE 0.63 0.30 –0.89 –1.19 –1.61b�Ep (mV) 103 110 100 96 - 0.33 twcIpa/Ipc 0.94 0.99 0.98 0.92 -
DyPc2 in DMSO aE1/2 (V) vs. SCE 0.59 0.28 –0.92 –1.21 –1.62b�Ep (mV) 83 70 95 110 - 0.31 twcIpa/Ipc 0.96 0.98 0.84 0.76 -
LuPc2 in DCM aE1/2 (V) vs. SCE 0.61 0.27 –0.87 –1.25b�Ep (mV) 62 66 62 130 0.34 twcIpa/Ipc 0.96 0.99 0.88e 0.91e
SmPc2 in DCM aE1/2 (V) vs. SCE 0.56 0.14 –1.11 –1.33 –1.60 0.42 30
EuPc2 in DCM aE1/2 (V) vs. SCE 0.55 0.12 –1.07 –1.29 –1.54 0.43 30
GdPc2 in DCM aE1/2 (V) vs. SCE 0.52 0.11 –1.08 –1.30 –1.53 0.41 30
DyPc2 in DCM aE1/2 (V) vs. SCE 0.47 0.07 –1.09 –1.30 –1.57 0.42
LuPc2 in DCM aE1/2 (V) vs. SCE 0.40 –0.02 –1.10 –1.33 –1.58 0.42 30
aE1/2 = (Epa+Epc)/2 at 0.100 Vs−1.b�Ep = |Epa − Epc|cIpa/Ipc for reduction, Ipc/Ipa for oxidation processes at 0.100 Vs−1 scan rate;d�E1/2 = E1/2 (first oxidation)- E1/2 (first reduction) = HOMO–SOMO gap.eThis value derived from SWV. Tw: This work.
Figure 2. a) CVs of SmPc2 at various scan rates on Pt in DCM/TBAP. b)SWV of SmPc2, SWV parameters: pulse size = 100 mV; Step Size: 5 mV;Frequency: 25 Hz.
Figure 3. a) CVs of DyPc2 at various scan rates on Pt in DCM/TBAP. b)SWV of DyPc2, SWV parameters: pulse size = 100 mV; Step Size: 5 mV;Frequency: 25 Hz.
) unless CC License in place (see abstract). ecsdl.org/site/terms_use address. Redistribution subject to ECS terms of use (see 193.140.73.50Downloaded on 2014-05-21 to IP

Journal of The Electrochemical Society, 161 (6) H422-H429 (2014) H425
Figure 4. Overlay of SWVs of LnPc2 complexes at various scan rates on Ptin DCM/TBAP. SWV parameters: pulse size = 100 mV; Step Size: 5 mV;Frequency: 25 Hz.
�Ep values at 0.100 Vs−1 scan rate and these values get bigger with in-creasing scan rates. While three reduction reactions are recorded withCV measurements, the fourth reduction couple of DyPc2 is recordedat –1.61 V with SWV measurements. �Ep, Ipa/Ipc, and Ip vs ν1/2 valuesof the redox processes support the reversibility of the redox processes.When compared with the previous complexes, it is clear that redoxcouples of DyPc2 are recorded at more negative potentials then theprevious ones.
Redox responses of LuPc2 were very similar with those of EuPc2,GdPc2 and SmPc2. Because while well-defined O1 and R1 processeswere recorded on the positive potential side of the voltammograms,the reduction processes at the negative potentials were ill-definedand complicated. LuPc2 gave a reversible oxidation couple O1 at0.61 V, and three reduction couples, R1 at 0.27 V, R2 at –0.87 V, andR3 at –1.25 V as shown in Table I. The highest negative potentialshifts were observed with LuPc2. In order to compare the redoxreaction of the complexes with each others, SWVs of the complexesare overlaid and represented on Fig. 4. It is clearly seen that the effectof the central metal to the redox peak potentials of the complexes isespecially reflected by the peak potentials of the R1 processes of thecomplexes. The easy of the reduction of the complexes can be orderedas: SmPc2 > EuPc2 > GdPc2 > DyPc2 > LuPc2.
Changing the nonpolar and noncoordinating DCM solvent withpolar and coordinating DMSO solvent did not affect the general trendof the electrochemical responses of the complexes. The most apparenteffect of the solvent is shifting of the redox processes to the morenegative potentials due to the higher polarizing ability of DMSO. Typeof the solvent also alters the reversibility of the redox processes. Fig. 5shows CVs and SWVs of DyPc2 as a representative of the complexes inDMSO/TBAP electrolyte system. While reversible oxidation coupleO1 at 0.55 V and reversible reduction couple, R1 at 0.26 V are recordedat positive potential side of the voltammograms, R2 at –0.91 V, R3 at–1.20 V, and R4 at –1.60 V are less reversible in DMSO than those inDCM.
Spectroelectrochemical studies.— It is reported in the literaturethat sandwich type phthalocyanines give distinct spectral changesfrom UV up to near-IR region of the light spectrum during the electrontransfer reactions, and thus they have been used as promising elec-trochromic materials.31–34 Electrochromic features of the complexescan be altered with substitution of different metals and substituents.For these reasons, spectroelectrochemical analyzes of the complexeswere carried out to perform assignments of the redox processes andto determine the spectrum and color of the electrogenerated anionicand cationic forms of the complexes. All LnPc2 complexes studiedhere give completely similar spectral changes during the spectroelec-trochemical measurements. The change in the central metal causes aslight shifting of the B and Q bands of the complexes.
Figure 5. a) CVs of DyPc2 at various scan rates on Pt in DMSO/TBAP. b)SWV of DyPc2, SWV parameters: pulse size = 100 mV; Step Size: 5 mV;Frequency: 25 Hz.
In-situ spectroelectrochemical results of GdPc2 monitored inDCM/TBAP electrolyte were given in Fig. 6 as an example. During in-situ spectroelectrochemical measurements, UV/Vis spectral changesof GdPc2 were observed under the applied potentials correspondingto each redox process. Without an applied potential, GdPc2 gives splitQ bands at 625 and 670 nm and the B bands at 340 and 360 nm. More-over, a small band characterizing the radical form of the complexis observed at 477 nm (Fig. 6a).22,35–38 All complexes have similarspectrum in their neutral forms. When a potential of 0.0 V is appliedto the working electrode, the spectrum of the complex immediatelychanges. During this process, while the band at 670 nm decreases, the
Figure 6. In-situ UV-vis spectral changes of GdPc in DCM/TBAP. a) Eapp= 0.00 V. b) Eapp = –1.00 V. c) Eapp = –1.60 V. d) Eapp = 1.30 V.
) unless CC License in place (see abstract). ecsdl.org/site/terms_use address. Redistribution subject to ECS terms of use (see 193.140.73.50Downloaded on 2014-05-21 to IP

H426 Journal of The Electrochemical Society, 161 (6) H422-H429 (2014)
band at 625 nm increases in absorbance intensity. At the same time,the band characterizing the radical form of the complex disappears(Fig. 6a). These spectral changes are in consistent with the spectralchanges of the first reduction reaction of LnPc2 type complexes.22,36–38
Thus, these spectral changes can easily be assigned to [Pc2−Gd3+Pc−]/ [Pc2−Gd3+Pc2−]− process. To support the number of electrons trans-ferred during this process, CPC analysis of the complex was carriedout, and the number of electrons transferred was found as one duringR1 process. The disappearance of the band at 477 nm supports the re-duction of the radical Pc− to Pc2− in GdPc2 during the first reductionreaction. The spectral changes give well recorded isosbestic pointsat 363, 549, and 657 nm, which demonstrates that the first reductiononly gives a one type product.
Fig. 6b shows the UV/Vis spectral changes of GdPc2 during thesecond reduction process at –1.10 V. During this process, while the Qbands at 625 and 670 nm decrease in intensity, two new bands are ob-served at 583 and 768 nm. Moreover, the B band decreases in intensity.These spectral changes are also consistent with the second Pc basedreduction processes of LnPc2 type complexes. The spectral changesrecorded during the third reduction reaction of GdPc2 at –1.30 V arerepresented in Fig. 6c. The spectral changes given in this figure are alsoin harmony with the similar complexes given in the literature.22,36–38
The most distinctive spectral changes are recorded during the oxida-tion of GdPc2 at 1. 0 V applied potential as shown in Fig. 6d. Duringthe oxidation reaction, the Q bands at 625 and 670 nm decrease inintensity and disappear completely, and a new band is observed at714 nm. At the same time, the B band at 340 nm decreases, whilethe other at 360 nm shifts to 380 nm. The band at 477 nm increasesin intensity with a shift to 500 nm. The enhancement in the intensityof the band at 477 indicates increasing of the radical form characterof the complex. Thus, these spectral changes are in consistent withthe redox reaction, [Pc2−Gd3+Pc−] / [Pc−Gd3+Pc−]+. The formationof two Pc− units causes an increase in the absorption of the radicalband of the complex. All complexes studied here give similar spectralchanges during all electron transfer reactions. However, when in-situspectral behavior of LnPc2 complexes were compared with the spec-tral changes of similar complexes reported in the literature,22,35–38 itis clear that especially LnPc2 complexes studied here give completelydifferent in-situ spectral changes during the oxidation reaction. Thesedifferent spectral changes most probably alter the electrochromic fea-tures of the complexes. Thus, electrochromic properties of the com-plexes were studied to determine possible application of the complexesin the display technologies.
Electrochromic studies of Langmuir–Blodgett films (LB) ofLnPc2.— The rich redox behaviors of the complexes (multi-electrontransfer, reversible redox processes, and redox peaks at low potentials)are the desired properties for the electrochromic applications. Distinctcolor differences between the neutral and electrogenerated anionic andcationic forms of the complexes monitored with in-situ electrocolori-metric measurements indicate possible usage of the complexes in thedisplay technologies, e.g. electrochromic and data storage applica-tions. To investigate the electrochromic properties of the complexesand to determine the effect of the central metal to the electrochromicfeatures, all complexes were coated on ITO electrodes with LB tech-niques and analyzed in solid state with respect to electrochemicalresponses and spectral changes under the applied potentials.
LB films of LnPc2 complexes were coated on ITO substrates andinvestigated as potential electrochromic materials. During the LB fimcoating experiments, the surface pressure (π)-area (A) isotherms ofthe LnPc2 complexes were recorded. The limiting molecular areaswere derived from the π–A isotherm curves as about 650 Å2 forLuPc2, DyPc2, and SmPc2. These values indicate that the moleculesof the complexes were laid down flat on the water surface.39,40 Similarπ–A isotherm curves and the limiting molecular areas of the com-plexes indicated that the central metal ion gave almost no influenceto the monolayer behaviors of the complexes at the air–water inter-face. Solid phases of the LnPc2 complexes occurred in the region of
Figure 7. CV and SWV responses of ITO/DyPc2 (LB) film in 0.1 mol dm−3
LiClO4 electrolyte system.
20–30 μNm−1. Thus all monolayers were transferred onto ITO sub-strates at 25 μNm−1. 20 Y type monolayers were deposited on ITOelectrodes with 1±0.1 transfer ratios and analyzed with the voltam-metric and SCC measurements.
LB films of all complexes give similar redox responses in LiClO4
aqueous electrolyte. Three redox reactions are recorded with theLB films of the complexes within the whole potential window ofLiClO4/H2O electrolyte (between 1.20 V and –1.30 V). Fig. 7 showsCV responses of ITO/DyPc2 (LB) film in 0.1 M LiClO4 electrolytesystem as a representative of LnPc2 complexes. ITO/DyPc2 (LB)shows three redox processes, Ia/Ic at 0.54 V, IIa/IIc at 0.15 V, andIIIa/IIIc at –1.10 V. The color of the film was easily changed dur-ing Ia/Ic and IIa/IIc redox processes from green to orange and thenred and these color changes were easily seen with naked eyes. Thesevoltammetric results of the LB films of the complexes indicate theirelectrochromic character at even solid states in addition to the so-lution features. Thus, in-situ SCC studies of ITO/LnPc2 (LB) filmswere performed to investigate the electrochromic behavior of the com-plexes in detail to drive the basic electrochromic parameters. AlthoughITO/DyPc2 (LB) film has a redox process at –1.10 V (IIIa/IIIc), it did
Figure 8. SCC responses of ITO/DyPc2 (LB) film for the Ia/Ic redox reactionrecorded in LiClO4/H2O electrolyte system. a) In-situ spectroelectrochemicalchanges recorded at 0.40 V applied potential. b) Chromaticity diagram rep-resenting colors of the film at (�) 0.00 V applied potential and (�) 0.40 Vapplied potential. c) Current-time responses recorded with 11 CC cycles be-tween 0.0 and 0.40 V applied potential. d)%T-time responses recorded with10 CC cycles between 0.0 and 0.40 V applied potential.
) unless CC License in place (see abstract). ecsdl.org/site/terms_use address. Redistribution subject to ECS terms of use (see 193.140.73.50Downloaded on 2014-05-21 to IP

Journal of The Electrochemical Society, 161 (6) H422-H429 (2014) H427
Figure 9. SCC responses of ITO/DyPc2 (LB) film for the IIa/IIc redox re-action recorded in LiClO4/H2O electrolyte system. a) In-situ spectroelectro-chemical changes recorded at 0.80 V applied potential. b) Chromaticity dia-gram representing colors of the film at (�) 0.40 V applied potential and (�)0.80 V applied potential. c) Current-time responses recorded with 10 CC cy-cles between 0.40 and 0.80 V applied potential. d)%T-time responses recordedwith 10 CC cycles between 0.40 and 0.80 V applied potential.
not give any spectral change under the potential application of –1.10 V.However, ITO/DyPc2 (LB) film gives distinct spectral and colorchanges during Ia/Ic and IIa/IIc redox reactions. Fig. 8 and 9 representSCC responses of ITO/DyPc2 (LB) film during Ia/Ic and IIa/IIc redoxreactions. Fig. 8a shows spectral changes of the film recorded duringin-situ spectroelectrochemical measurements under 0.40 V potentialapplication. ITO/DyPc2 (LB) film has a sharp Q band at 644 nm anda band at 550 nm in neutral state (Fig. 8a). Under 0.40 V potentialapplication, the intensity of the band at 550 nm decreases immediatelywhile a new band increases at 485 nm. At the same time, the Q band
shifts to 668 nm with decreasing in intensity. Returning the spectrumto the original state with the similar rate under 0.0 V potential applica-tion indicates the reversibility of the process. These distinct spectralchanges cause to the color change from green to orange (Fig. 8b),which points out the electrochromic property of ITO/DyPc2 (LB)film. To derive the electrochromic parameters, SCC analysis of thefilm was carried out with 10 CC cycles between 0.0 V and 0.40 V ap-plied potentials with 50 s time intervals. Fig. 8c illustrates current-timeresponses of ITO/DyPc2 (LB) recorded with 10 CC cycles between0.0 V and 0.40 V applied potentials. Observation of same currentsduring each applied potential indicates the coulombic stability of thefilm. Both of the anodic and cathodic coulombic stabilities of the filmdecrease as 3.6% until end of 10 CC cycles.%T-time responses wererecorded at two different wavelengths, at 543 and 643 nm under CCexitation (Fig. 8d). ITO/DyPc2 (LB) film shows reasonable opticalchanges at both wavelengths. The optic stability, optic contrast andresponse time parameters of the ITO/DyPc2 (LB) film were derivedfrom%T-time analyzes and tabulated in Table II. As shown in Fig.8d and this table, the response time of the film was found as 4.7 sfor anodic coloring process and 4.3 s for cathodic coloring processwhen the%T-time analyzes were performed at 643 nm. These valueschange when 543 nm was chosen as the analysis point. These dataindicates that performing%T-time measurements at different wave-lengths may alter some basic electrochromic parameters. When allthe electrochromic parameters were evaluated, it was concluded thatITO/DyPc2 (LB) provides most of the requirements needed for usagesas a cathodic coloring electrochromic material and can be used as elec-trochromophore between green and orange colors. When 0.80 V wasapplied to the working electrode which cause formation of dicationicDyPc2 (LB) species, its spectrum and color also changed. As shown inFig. 9a, the Q band of the monocationic DyPc2 (LB) shifts from 668nm to 715 nm and a new sharp band is observed at 500 nm duringthe IIa/IIc process. These spectral changes cause a color change fromorange to red as shown in Fig. 9b. SCC analysis of DyPc2 (LB) filmwas also performed with CC excitation signals between 0.40 V and0.80 V potential applications within 50 s time intervals. Basic elec-trochromic parameters were derived from%T-time and current-timeresponses of the film and tabulated in Table II. Reasonable optic sta-bility and contrast and short response times were observed during both
Table II. Electrochromic parameters of ITO/LnPc2 (LB) films in 0.10 mol dm−3 LiClO4 aqueous solution.
Responses Color Color Current Stability %T Stability OpticalComplex Eapp. Cycles Time (s)b Change coordinates Decreasec Decreased contraste
0.0 V 1. cycle 4.3 (6.4)a green x = 0.3336; y = 0.3584 %3.6 0.5 (0.5)a %5 (5.3)a
10. cycle 4.5 (6.5)0.40 V 1. cycle 4.7 (4.3) orange x = 0.3739; y = 0.3508 %6.0 0.3(0.2)
10. cycle 5.0 (4.4)ITO/DyPc2 (LB)
0.40 V 1. cycle 4.4 (5.1)a orange x = 0.3739; y = 0.3508 %3.5 0.2 (0.3) %8.2 (8.9)10. cycle 4.5 (5.2)
0.80 V 1. cycle 2.1 (3.6) red x = 0.4039; y = 0.3408 %2 0.1(0.1)10. cycle 3.2 (3.6)
0.0 V 1. cycle 2.8 (3.4)a green x = 0.3369; y = 0.3681 %11 0.6 (0.7) %2.3 (3.3)10. cycle 3.0 (3.6)
0.30 V 1. cycle 3.9 (4.2) yellow x = 0.3653; y = 0.3568 %38 0.8 (1.2)10. cycle 3.8 (4.4)
ITO/LuPc2 (LB)0.30 V 1. cycle 2.4 (3.5)a yellow x = 0.3653; y = 0.3568 %7.8 2 (2.3) % 4 (2.1)
10. cycle 2.4 (3.6)0.80 V 1. cycle 5.1 (3.6) orange x = 0.3753; y = 0.3468 %15 1.2 (1.7)
10. cycle 5.3 (3.7)
aThe data given in parenthesis were derived from%T-time responses recorded at shorter wavelengths. Maximum%T value reached at each potentialswitching.bTime needed to change half of the total optical response.c% current differences between the first and last CC cycles.d% T differences between the first and last cycle.e% T differences between anodic and cathodic coloring of the first cycle.
) unless CC License in place (see abstract). ecsdl.org/site/terms_use address. Redistribution subject to ECS terms of use (see 193.140.73.50Downloaded on 2014-05-21 to IP

H428 Journal of The Electrochemical Society, 161 (6) H422-H429 (2014)
Figure 10. SCC responses of ITO/LuPc2 (LB) film for the Ia/Ic redox re-action recorded in LiClO4/H2O electrolyte system. a) In-situ spectroelectro-chemical changes recorded at 0.30 V applied potential. b) Chromaticity dia-gram representing colors of the film at (�) 0.00 V applied potential and (�)0.30 V applied potential. c) Current-time responses recorded with 10 CC cy-cles between 0.0 and 0.30 V applied potential. d)%T-time responses recordedwith 10 CC cycles between 0.0 and 0.30 V applied potential.
of the anodic (0.80 V) and cathodic (0.40 V) CC cycles. In summary,ITO/DyPc2 (LB) film shows poly-electrochromic properties since ithas three different color responses for its different oxidized forms. Itsgreen color changed to orange during Ia/Ic and then to red during IIa/IIc
process.In order to understand the effect of the central metal in the Pc core
on the electrochromic properties of the complexes, SCC analyses ofITO/SmPc2 (LB) and ITO/LuPc2 (LB) films were also performed andcompared with those of ITO/DyPc2 (LB) film. All electrochromicparameters of ITO/SmPc2 (LB) and ITO/LuPc2 (LB) films werefound to be worse than those of ITO/DyPc2 (LB) film and the colorsof the oxidized forms of the films were also different. Fig. 10 representsSCC responses of ITO/LuPc2 (LB) film. Under open circuit, LuPc2
(LB) film gives the Q band at 637 nm (green spectrum in Fig. 10a).This spectrum reflects a green color for the film (point � in Fig. 10b).When 0.30 V was applied to ITO/DyPc2 (LB) electrode, the spectrumof the film changes immediately as shown in Fig. 10a. The Q bandshifts from 637 nm to 667 nm. These spectral changes cause turning ofthe green color of the film to yellow color, which shows electrochromicfeature of the complex. Current time responses and%T-time responsesat 637 and 667 nm were recorded under 10 CC cycles between 0.00 Vand 0.30 V. As shown in Fig. 10c, current responses recorded for eachforthcoming CC cycle decrease continuously, which get the coulombicstability worse. Expectable optical stability was observed with%T-time analyzes of the film at 637 and 667 nm. Response times for thecathodic process are recorded as 3.4 s at 637 nm and 2.8 s at 667 nm.Response times for the anodic processes recorded at both 637 nm and667 nm are found as slower than 5 s as shown in Table II. As shownin Table II, electrochromic parameters recorded at 637 nm are betterthan those recorded at 667 nm. Similar electrochromic behaviors werealso recorded during IIa/IIc process. During this process, while the Qband at 667 nm decreased in intensity, new bands were observed at485 and 700 nm. As a result of these spectral changes, the yellowcolor under 0.3 V potential application turned into orange under 0.80V potential application. Optical and coulombic stabilities of the filmrecorded during IIa/IIc process were found to be higher than thoserecorded during Ia/Ic process. At the same time, slow response timeswere observed during this process. Consequently, ITO/LuPc2 (LB)film behaves as an electro-chromophore and it shows green, yellow,and orange color alternatives for different redox states of the film.
Conclusions
The results of the electrochemical and spectroelectrochemicalmeasurements are relevant with the proposed structure of the stud-ied complexes. All complexes give similar redox peaks with slightdifferences. Due to the radical characters, the first reduction processof each complex is observed at around 0.10 V. The general trend ofthe E1/2 values of the complexes is directly related with the effectivenuclear charge of the central metal ions. The redox processes of thecomplexes shift toward the negative potentials when decreasing ofthe radius of central metal ions in the Pc cavity. Due to the sandwichcharacter of the complexes, �E1/2 values of the complexes decreaseup to 0.30 V. Thus, up to five redox processes could be observedwithin the potential windows of the electrolyte systems. Extensionof the redox richness of the complexes directly alters the spectralchanges during the redox reactions. Therefore, distinct spectral andcolor changes were observed during the electron transfer reactions ofthe complexes, which indicate possible usage of the complexes as elec-trochromic material. To determine possibilities of the complexes forpractical applications, the complexes were coated on ITO electrodeswith LB technique and used as active electrochromic materials. SCCanalysis illustrated that central metals of the complexes affect theelectrochromic behaviors and the best electrochromic responses wererecorded with ITO/DyPc2 (LB) electrode.
Acknowledgments
We thank to Marmara University Scientific Research Commission(Project No: FEN-A-150513-0164), Turkish Academy of Sciences(TUBA) and TUBITAK (Project No: 111T179) for their financialsupports.
References
1. D. Arican, A. Erdogmus, and A. Koca, Thin Solid Films, 550, 669 (2014).2. V. E. Pushkarev, V. V. Kalashnikov, S. A. Trashin, N. E. Borisova, L. G. Tomilova,
and N. S. Zefirov, Dalton Trans, 42, 12083 (2013).3. C. Pal, A. N. Cammidge, M. J. Cook, J. L. Sosa-Sanchez, A. K. Sharma, and
A. K. Ray, J R Soc Interface, 9, 183 (2012).4. I. A. Belogorokhov, E. V. Tikhonov, M. A. Dronov, L. I. Belogorokhova,
Y. V. Ryabchikov, and L. G. Tomilova et. al, Semiconductors, 46, 99 (2012).5. I. A. Belogorokhov, E. V. Tikhonov, M. A. Dronov, L. I. Belogorokhova,
Y. V. Ryabchikov, and L. G. Tomilova et. al, Semiconductors, 45, 1453 (2011).6. F. Demir, A. Erdogmus, and A. Koca, J Electroanal Chem, 703, 117 (2013).7. P. Kalimuthu, A. Sivanesan, and S. A. John, J Chem Sci, 124, 1315 (2012).8. B. Ceken, M. Kandaz, and A. Koca, J Porphyr Phthalocya, 16, 380 (2012).9. E. F. Perez, G. D. Neto, A. A. Tanaka, and L. T. Kubota, Electroanal, 10, 111
(1998).10. A. Sengul, H. Z. Dogan, A. Altındal, A. R. Ozkaya, B. Salih, and O. Bekaroglu,
Dalton Trans, 41, 7559 (2012).11. O. A. Osmanbas, A. Koca, M. Kandaz, and F. Karaca, Int J Hydrogen Energy, 33,
3281 (2008).12. A. B. Sorokin, Chem Rev, 113, 8152 (2013).13. A. B. P. Lever and C. C. Leznoff Editors, Phthalocyanines, Properties and Applica-
tions, Vol 4, Wiley-VCH, (1996).14. A. B. P. Lever, E. R. Milaeva, and G. Speier, The Redox Chemistry of Metalloph-
thalocyanines in Solution, in A. B. P. Lever and C. C. Leznoff Editors, Phthalocya-nines: Properties and Applications, Vol 3, Wiley-VCH, p.1–69, (1993).
15. A. Ghosh and P. G. Gassman, J Am Chem Soc, 116, 1932 (1994).16. P. Vasudevan, N. Phougat, and A. K. Shukla, App Organomet Chem, 10, 591 (1996).17. M. Ozer, A. Altındal, A. R. Ozkaya, and O. Bekaroglu, Dalton Trans, 17, 3175
(2009).18. J. Z. Jiang, M. Bao, L. Rintoul, and D. P. Arnold, Coord Chem Rev, 250, 424 (2006).19. K. Wang, D. D. Qi, H. L. Wang, W. Cao, W. J. Li, and T. Liu et. al, Chem Eur J, 19,
11162 (2013).20. A. G. Gurek, T. Basova, D. Luneau, C. Lebrun, E. Kol’tsov, and A. K. Hassan et. al,
Inorg Chem, 45, 1667 (2006).21. T. Ceyhan, M. A. Ozdag, B. Salih, M. K. Erbil, A. Elmalı, A. R. Ozkaya, and
O. Bekaroglu, Eur J Inorg Chem, 4943 (2008).22. V. E. Pushkarev, A. Y. Tolbin, F. E. Zhurkin, N. E. Borisova, S. A. Trashin, and
L. G. Tomilova et. al, Chem Eur J, 18, 9046 (2012).23. K. Takahashi, Y. Tomita, Y. Hada, K. Tsubota, M. Handa, and K. Kasuga et. al, Chem
Lett, 759 (1992).24. M. P. Gorishnyi, O. V. Koval’chuk, T. N. Koval’chuk, A. B. Verbitsky, and
V. E. Vovk, Mol Cryst Liq Cryst, 535, 49 (2011).25. S. Karadag, C. Bozoglu, M. Kasım Sener, and A. Koca, Dyes Pigments, 100, 168
(2014).
) unless CC License in place (see abstract). ecsdl.org/site/terms_use address. Redistribution subject to ECS terms of use (see 193.140.73.50Downloaded on 2014-05-21 to IP

Journal of The Electrochemical Society, 161 (6) H422-H429 (2014) H429
26. D. Arıcan, M. Arıcı, A. L. Ugur, A. Erdogmus, and A. Koca, Electrochim Acta, 106,541 (2013).
27. A. Koca, J Electroanal Chem, 655, 128 (2011).28. A. Koca, T. Ceyhan, M. K. Erbil, A. R. Ozkaya, and O. Bekaroglu, Chem Phys, 340,
283 (2007).29. I. Gurol, M. Durmus, and V. Ahsen, J Porphyr Phthalocya, 16, 907 (2012).30. P. H. Zhu, F. L. Lu, N. Pan, D. P. Arnold, S. Y. Zhang, and J. Z. Jiang, Eur J Inorg
Chem, 510 (2004).31. M. L. Rodriguez-Mendez and J. A. de Saja, J Porphyr Phthalocya, 13, 606 (2009).32. H. Yamamoto, Y. Ikuta, T. Hirota, M. Tanaka, K. Yamada, and S. Yamaguchi et. al,
J Electrochem Soc, 134, C492 (1987).33. G. C. S. Collins and D. J. Schiffrin, J Electroanal Chem, 139, 335 (1982).34. M. M. Nicholson, J Electron Mater, 8, 703 (1979).
35. P. Sen, F. Dumludag, B. Salih, A. R. Ozkaya, and O. Bekaroglu, Synth Met, 161,1241 (2011).
36. N. Kobayashi, H. Lam, W. A. Nevin, P. Janda, C. C. Leznoff, and T. Koyama et. al,J Am Chem Soc, 116, 879 (1994).
37. M. Arıcı, C. Bozoglu, A. Erdogmus, A. L. Ugur, and A. Koca, Electrochim Acta,113, 668 (2013).
38. Z. Odabas, I. Koc, A. Altındal, A. R. Ozkaya, B. Salih, and O. Bekaroglu, Synth Met,160, 967 (2010).
39. M. L. Rodriguez-Mendez, Y. Gorbunova, and J. A. de Saja, Langmuir, 18, 9560(2002).
40. A. K. Ray, A. V. Nabok, A. K. Hassan, J. Silver, P. Marsh, and T. Richardson, PhilosMag B-Physics of Condensed Matter Statistical Mechanics Electronic Optical andMagnetic Properties, 79, 1005 (1999).
) unless CC License in place (see abstract). ecsdl.org/site/terms_use address. Redistribution subject to ECS terms of use (see 193.140.73.50Downloaded on 2014-05-21 to IP