Electrical and Physical Characterization of Bulk Ceramics and Thick Layers of Barium Titanate...
10
Open Archive Toulouse Archive Ouverte (OATAO) OATAO is an open access repository that collects the work of Toulouse researchers and makes it freely available over the web where possible. This is an author-deposited version published in: http://oatao.univ-toulouse.fr/ Eprints ID : 2431 To link to this article : URL : http://dx.doi.org/10.1007/s11665-007-9110-7 To cite this version : Nguyen, Dinh Quang and Lebey, Thierry and Castelan, Philippe and Bley, Vincent and Boulos, Madona and Guillemet-Fritsch, Sophie and Combettes, Céline and Durand, Bernard ( 2007) Electrical and Physical Characterization of Bulk Ceramics and Thick Layers of Barium Titanate Manufactured Using Nanopowders. Journal of Materials Engineering and Performance, vol. 16 (n° 5). pp. 626-634. ISSN 1059-9495 Any correspondence concerning this service should be sent to the repository administrator: [email protected]
-
Upload
independent -
Category
Documents
-
view
0 -
download
0
Transcript of Electrical and Physical Characterization of Bulk Ceramics and Thick Layers of Barium Titanate...

Open Archive Toulouse Archive Ouverte (OATAO) OATAO is an open access repository that collects the work of Toulouse researchers and makes it freely available over the web where possible.
This is an author-deposited version published in: http://oatao.univ-toulouse.fr/ Eprints ID : 2431
To link to this article : URL : http://dx.doi.org/10.1007/s11665-007-9110-7
To cite this version : Nguyen, Dinh Quang and Lebey, Thierry and Castelan, Philippe and Bley, Vincent and Boulos, Madona and Guillemet-Fritsch, Sophie and Combettes, Céline and Durand, Bernard ( 2007) Electrical and Physical Characterization of Bulk Ceramics and Thick Layers of Barium Titanate Manufactured Using Nanopowders. Journal of Materials Engineering and Performance, vol. 16 (n° 5). pp. 626-634. ISSN 1059-9495
Any correspondence concerning this service should be sent to the repository
administrator: [email protected]

Electrical and Physical Characterization of Bulk Ceramicsand Thick Layers of Barium Titanate Manufactured Using
NanopowdersDinh Quang Nguyen, Thierry Lebey, Philippe Castelan, Vincent Bley, Madona Boulos,
Sophie Guillemet-Fritsch, Celine Combettes, and Bernard Durand
Fine powders of BaTiO3 are synthesized by hydrothermal processing at 250 �C for 7 h. Two differentstarting mixtures were used, TiCl3 + BaCl2 and TiO2 + BaCl2. The size of the resulting crystallites wasclose to 20 nm in both cases. The powders were formed into ceramic pellets or thick layers. The sampleswere characterized for microstructure and electrical permittivity. The impact of the microstructure on theelectrical properties is emphasized, and is correlated to the powder characteristics and the powder reali-zation process.
Keywords barium titanate, dielectric properties, hydrothermalsynthesis, ceramic, thick layer
1. Introduction
Integration of passive components in power electronics isone of the most challenging topics, in which a material mustperform more than one function. In this regard, high-permit-tivity materials have a key role to play. Among them, bariumtitanate appears to be a good candidate, thanks to its high-permittivity value and low losses. It has been used for a longtime in electric and electronic equipment (Ref 1, 2), telecom-munications, and other applications in which the materials aresubjected to substantial changes in temperature, frequency, andvoltages (Ref 1-5). Barium titanate is widely used in themanufacture of multilayer capacitors (MLC) in which theceramic layers (some tens of micrometer) are intertwined withinner electrodes. The goal of this article is to enhance theelectrostatic capacitance using at the same time a large surfaceand a high-permittivity material. Generally speaking, two formsof barium titanate are in use: (1) bulk ceramics (thickness morethan 1 mm) and (2) thick layer ceramics whose thicknessesvary from 10 lm to 100 lm. Bulk ceramics of BaTiO3 may beprepared easily by conventional method, pressing powders in amold and firing them at a temperature between 1200 and1300 �C (Ref 3, 5, 6).
Thin layers may be deposited on substrates by varioustechniques, i.e., evaporation, sol-gel, or sputtering. In thesetechniques, typical layer thicknesses range from 0.1 lm to afew lm (Ref 7, 8). When for thicker layers are desired(>10 lm) the preceding methods are no longer used; instead,dip coating, spin coating, and chemical vapor depositiontechniques with limited success for thick coating are used.Other techniques, such as doctor blade tape casting or screenprinting are relatively simple and convenient methods, produc-ing up to hundreds of micrometer (Ref 7, 9, 10). Thesetechniques, however, the preparation require of a slurry whichmay inhibit the final properties of the layers, if its rheologicalproperties are not appropriate. These layers are then fired at atemperature ranging from 850 up to 1200 �C, depending on thekind of slurry and the materials used to make the electrodes.
The starting point is in any fabrication process always thepowder synthesis. In a previous study (Ref 11), two differentroutes for the manufacture of powders were investigated: theclassical solid/solid method and a soft chemistry method: the co-precipitation. The co-precipitation method is based on theformation of a mixed-metal complex which is thermally decom-posed at a temperature above 500 �C. High-purity BaTiO3 isprepared using the Pechini-type reaction, yelding nanosized andwell-crystallized cubic BaTiO3. Complete decomposition ofoxalate complex that is produced, however, takes a very long time.
When making ceramic pellets, the soft chemistry route led tohigher permittivity values than the classical solid/solid route.This result was attributed to a better control of the quality ofraw material powders including their grain size.
In this work, another soft chemistry route is used for thesynthesis of barium titanate: the hydrothermal synthesis. Thehydrothermal synthesis is one of the best methods forproducing metal oxide particles. It has many advantages suchas highly crystalline particles, low-cost starting materials, low-temperature treatment, and simple procedure. Consequently, itallows a better control of the powder properties.
Two titanium sources were used with the followingchemical reactions:
Dinh Quang Nguyen, Thierry Lebey, Philippe Castelan, andVincent Bley, Laboratoire de Genie Electrique de Toulouse (LGET),Bat. 3R3, Universite Paul Sabatier, 118, route de Narbonne, 31062,Toulouse Cedex 04, France; Madona Boulos, Sophie Guillemet-Fritsch, Celine Combettes, and Bernard Durand, Centre Inter-Universitaire de Recherche et d�Ingenierie des Materiaux (CIRIMAT),Bat. 2R1, Universite Paul Sabatier, 118, route de Narbonne, 31062,Toulouse Cedex 04, France. Contact e-mail: [email protected].
DOI: 10.1007/s11665-007-9110-7

TiO2 starting
material: TiO2 þ BaCl2 þ 1/2 O2 ! BaTiO3 þ 2Cl�
TiCl3 starting
material : 4TiCl3 þO2 þ 2H2O! 4TiO2þ þ 4Hþ þ 12Cl�
TiO2þ þ 1/2 O2 ! TiO2
TiO2 þ BaCl2 þ 1/2 O2 ! BaTiO3 þ 2Cl�
In the following, the influence of both the methods and thetitanium sources on the final properties of two different kinds ofsamples (ceramic pellets and thick layers) are presented anddiscussed.
2. Experimental
2.1 Preparation of BaTiO3 Powders
The starting materials were barium chloride (BaCl2.2H2O,Prolabo 99%), titanium chloride (TiCl3, Prolabo, d = 1.20, %min = 15%), and titanium oxide (TiO2, anatase, Rhodia). TiCl3was preferred over TiCl4 since it is less sensitive to moisture.Moreover, solid TiCl3 can be easily dissolved in water and thehydrolysis prevented by acidification. An acid solution of TiCl3is also easier to handle than liquid TiCl4. Aqueous solutions ofbarium and titanium were obtained by mixing 0.015 mol TiCl3or TiO2 and 0.024 mol BaCl2.2H2O in deionized water.
The formation of BaTiO3 was promoted by an initialprecursor molar ratio Ba/Ti = 1.6. However, it is assumed thatthe loss of some Ba2+ ions during the fabrication process willoccur. It leads to a Ba/Ti ratio in the final product which is closeto unity. In fact, x-ray diffraction spectra, presented later,showed only BaTiO3 peaks, and no other Ti species werefound.
The pH of the solution was raised up to 13.5 by adding awell-stirred solution of KOH. The suspension was transferredinto a cylindrical autoclave (Paar, Teflon lined stainless steel600 ml, filled at 2/3 of its volume). The autoclave was putinside a preheated regulated oven, and the reaction was heatedfor 7 h at 250 �C under autogenous pressure (5-39 bars). Aftercooling to room temperature, the water insoluble reactionproduct was washed with a solution 0.1 M HCl to remove theBaCO3, which was present with BaTiO3 at the end of thehydrothermal treatment. The powder is then filtered, washedseveral times with distilled water, and oven dried at 110 �C for24 h.
The powder properties were carefully controlled. Thestructure was identified using x-ray diffractometry (SiemensD 501 diffractometer equipped with a SiLi detector,kCuKa = 1.5418 A) and microstructural studies were performedusing electron microscopy (Jeol JSM 6700F SEM-FEG).
The specific surface of the powder was also measured bynitrogen desorption according to the BET method (Micromer-itics Desorb 2300A/Flow sorb II 2300). Raman investigationswere carried out by means of DiLor XY Micro RamanSpectrometer equipped with a Princeton Instruments LN/CCDdetector. Electron Paramagnetic Resonance (EPR) was used todetect the presence of Ti3+ in samples using a Bruker ESP 300spectrometer operating at X-band frequency and 100 kHz fieldmodulation (Ref 3). The most relevant physical parameters aresummarized in Table 1.
2.2 Preparation of the BaTiO3 Pellets
The powders were first pressed in a metal mold under250 MPa to a thickness ranging from 1.5 mm to 2 mm and thesurface is 20 mm2. The pellets were then sintered in air at1250 �C for two dwell times, 10 and 20 h. The heating rate isfixed at 80 �C/h. After cooling at room temperature, theceramics were metalized by screen printing a silver mixture onthe two faces of the ceramics, then annealing them at 750 �C.
2.3 Thick Layers
For thick-layer realization, the slurry of BaTiO3 wascarefully prepared since its quality has a large impact on thefinal product. The powders were fired at 800 �C to reduce thewater content and to decrease the specific surface down toabout 7 m2/g. A ball mill was used to mix BaTiO3 powders andan additive solution constituted of adhesive organic, a solventand a dispersant prepared by stirring for 48 h. The optimumviscosity of the slurry is 250 Pa.s.
Layers of BaTiO3 material were then deposited on asubstrate of alumina. A platinum (Pt) electrode was used forthe lower electrode, and a silver electrode for the upper one.These electrodes were deposited using the same process used toapply electrodes on the BaTiO3 layers. Commercial productsfrom dmc2 (576402 platinum and AgPdPt T 5365) were used tomake the electrodes. The layer of Pt was fired at a temperatureof 850 �C in air. It was used as an electrode, since it is able towithstand the high temperature (1250 �C) which associated thesintering process. After deposition and before sintering, theBaTiO3 layers were heated at 450 �C to burn the adhesiveorganic part of the slurry and to remove the solvent. Thesamples were then sintered at 1200 �C in air for 10 h. Thethermal treatment achieved at 450 �C helps to avoid internalstresses during sintering, which could lead to mechanicalfracture.
Electrical characterization was performed in the 20 Hz-10 MHz range on the different types of samples was conducedwith a HP 4284A precision LCR meter and a Hewlett PackardHP 4194 Impedance/Gain-Phase Analyzer. Samples wereplaced in an oven (HERAEUS HT7010) and measurements
Table 1 Specific surface area Sw, crystallite size dx and particle grain size dBET of the BaTiO3 powders synthesized byhydrothermal method
Ti precursor Synthesis temperature (�C) Sw (m2/g) dx (nm) dBET (nm)
TiCl3 250 13.5 21 74TiO2 250 13.0 21 74
dx was calculated from the broadening of the XRD peak using the Scherrer formula dx = 0.94k/bcosh, Sw was measured by BET method and dBETwas calculated by the formula dBET = 6/Sw q(q: volume mass of powder)

taken between room temperature and 150 �C in controlledincrements.
3. Results and Discussion
3.1 Powder Characterization
Whatever the titanium source (TiCl3 or TiO2), and for areaction temperature of 250 �C, chemical analyses showed thatthe molar ratio Ba/Ti was very close to one, (Ba/Ti ~ 1). Asmentioned previously, the loss of some Ba2+ ions during theelaboration process is assumed, and it leads to a Ba/Ti ratio inthe final product close to one. X-ray diffraction spectra had onlyBaTiO3 peaks, with no other Ti species were found. Themorphology and the particle size of the TiCl3 and TiO2 startingpowders obtained at 250 �C was determined by scanningelectron microscopy, and are shown in Fig. 1(a) and (b). At thisstage, their morphology is not very different. The averagecrystallite size of the powder grains, determined from x-raydiffraction data (Fig. 2), is about 20 nm for TiCl3 (yellow) andTiO2 (white) (Table 1). The mean size of the crystallites, dx,was calculated from the broadening of the XRD peaks using theScherrer formula. According to x-ray diffraction analysis, thestructure of both powders is perovskite type. It did not containimpurities (Ref 3).
Raman spectra indicated the coexistence at room tempera-ture of two BaTiO3 different phases: tetragonal and cubic
(Fig. 3). BaTiO3 exhibits two large bands, at 520 and 716 cm-1
for tetragonal with nearly the same intensities and anotherlarger band at 707 cm-1 for cubic polymorph (Ref 3, 12, 13).No EPR signal was observed for the samples synthesized fromTiO2. The EPR spectrum of a sample prepared using TiCl3 asprecursor is shown in Fig. 4. The signals near 3500 G arecharacteristic of isolated Ti3+ ions. It is known that Ti3+ isunstable in the presence of atmospheric oxygen and oxidizesinto Ti4+. The small amount of Ti3+ detected in the powdersprepared from TiCl3 indicate that complete oxidation of Ti3+ toTi4+during the synthesis did not occur.
3.2 Properties of Bulk Ceramics and Thick Layers
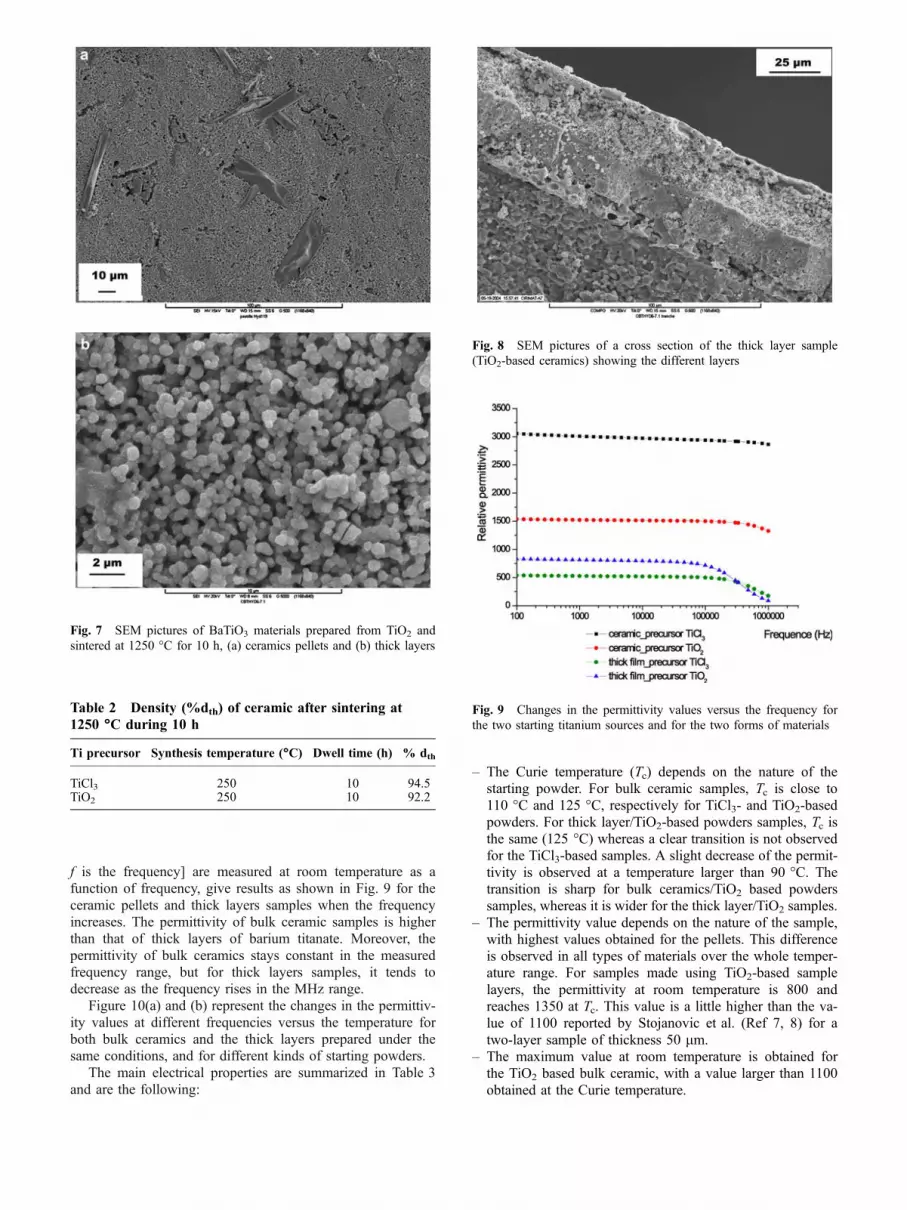
In the case of ceramic pellets, only the tetragonal BaTiO3
phase is evident (Fig. 5), which is the common phase observedin such cases (Ref 14). The microstructure of bulk BaTiO3
ceramics sintered at 1250 �C for 10 h is shown in Fig. 6(a) and7(a) for TiCl3- and TiO2-based materials, respectively. Abnor-mal grain growth is noticed for both the samples. Themicrostructure of these ceramics is bimodal, constituted of
Fig. 1 SEM-FEG photomicrograph of BaTiO3 powders preparedfrom TiCl3 (a) and TiO2 (b) at 250 �C
Fig. 2 X-ray diffraction patterns of BaTiO3 powders prepared fromTiCl3 (a) and TiO2 (b) at 250 �C. * The small peaks are fluorescencesignals coming from pollution of the copper anti-cathode by tungstenof the filament
Fig. 3 Raman spectra of BaTiO3 powder synthesized from TiCl3(a) and TiO2 (b) at 250 �C
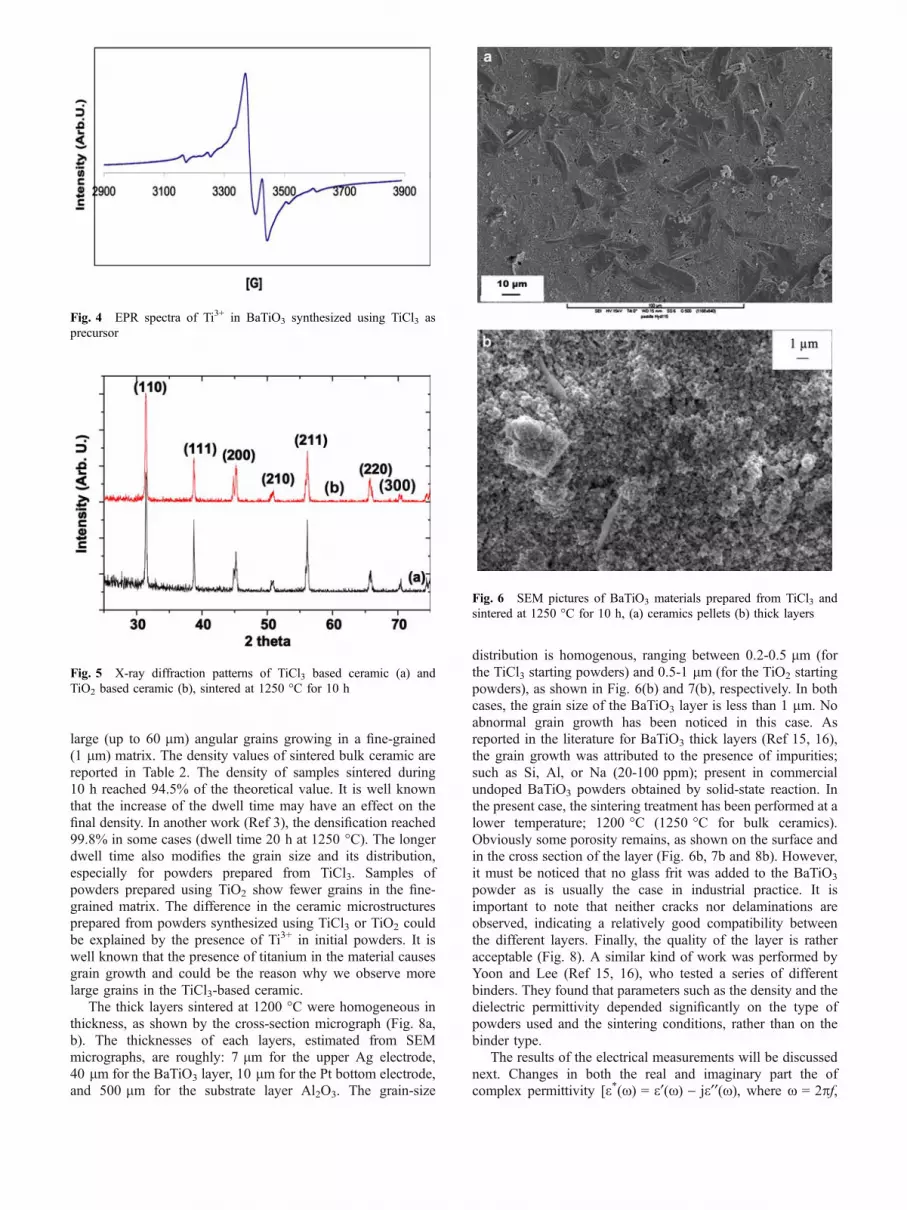
large (up to 60 lm) angular grains growing in a fine-grained(1 lm) matrix. The density values of sintered bulk ceramic arereported in Table 2. The density of samples sintered during10 h reached 94.5% of the theoretical value. It is well knownthat the increase of the dwell time may have an effect on thefinal density. In another work (Ref 3), the densification reached99.8% in some cases (dwell time 20 h at 1250 �C). The longerdwell time also modifies the grain size and its distribution,especially for powders prepared from TiCl3. Samples ofpowders prepared using TiO2 show fewer grains in the fine-grained matrix. The difference in the ceramic microstructuresprepared from powders synthesized using TiCl3 or TiO2 couldbe explained by the presence of Ti3+ in initial powders. It iswell known that the presence of titanium in the material causesgrain growth and could be the reason why we observe morelarge grains in the TiCl3-based ceramic.
The thick layers sintered at 1200 �C were homogeneous inthickness, as shown by the cross-section micrograph (Fig. 8a,b). The thicknesses of each layers, estimated from SEMmicrographs, are roughly: 7 lm for the upper Ag electrode,40 lm for the BaTiO3 layer, 10 lm for the Pt bottom electrode,and 500 lm for the substrate layer Al2O3. The grain-size
distribution is homogenous, ranging between 0.2-0.5 lm (forthe TiCl3 starting powders) and 0.5-1 lm (for the TiO2 startingpowders), as shown in Fig. 6(b) and 7(b), respectively. In bothcases, the grain size of the BaTiO3 layer is less than 1 lm. Noabnormal grain growth has been noticed in this case. Asreported in the literature for BaTiO3 thick layers (Ref 15, 16),the grain growth was attributed to the presence of impurities;such as Si, Al, or Na (20-100 ppm); present in commercialundoped BaTiO3 powders obtained by solid-state reaction. Inthe present case, the sintering treatment has been performed at alower temperature; 1200 �C (1250 �C for bulk ceramics).Obviously some porosity remains, as shown on the surface andin the cross section of the layer (Fig. 6b, 7b and 8b). However,it must be noticed that no glass frit was added to the BaTiO3
powder as is usually the case in industrial practice. It isimportant to note that neither cracks nor delaminations areobserved, indicating a relatively good compatibility betweenthe different layers. Finally, the quality of the layer is ratheracceptable (Fig. 8). A similar kind of work was performed byYoon and Lee (Ref 15, 16), who tested a series of differentbinders. They found that parameters such as the density and thedielectric permittivity depended significantly on the type ofpowders used and the sintering conditions, rather than on thebinder type.
The results of the electrical measurements will be discussednext. Changes in both the real and imaginary part the ofcomplex permittivity [e*(x) = e¢(x) - je¢¢(x), where x = 2pf,
Fig. 4 EPR spectra of Ti3+ in BaTiO3 synthesized using TiCl3 asprecursor
Fig. 5 X-ray diffraction patterns of TiCl3 based ceramic (a) andTiO2 based ceramic (b), sintered at 1250 �C for 10 h
Fig. 6 SEM pictures of BaTiO3 materials prepared from TiCl3 andsintered at 1250 �C for 10 h, (a) ceramics pellets (b) thick layers
f is the frequency] are measured at room temperature as afunction of frequency, give results as shown in Fig. 9 for theceramic pellets and thick layers samples when the frequencyincreases. The permittivity of bulk ceramic samples is higherthan that of thick layers of barium titanate. Moreover, thepermittivity of bulk ceramics stays constant in the measuredfrequency range, but for thick layers samples, it tends todecrease as the frequency rises in the MHz range.
Figure 10(a) and (b) represent the changes in the permittiv-ity values at different frequencies versus the temperature forboth bulk ceramics and the thick layers prepared under thesame conditions, and for different kinds of starting powders.
The main electrical properties are summarized in Table 3and are the following:
– The Curie temperature (Tc) depends on the nature of thestarting powder. For bulk ceramic samples, Tc is close to110 �C and 125 �C, respectively for TiCl3- and TiO2-basedpowders. For thick layer/TiO2-based powders samples, Tc isthe same (125 �C) whereas a clear transition is not observedfor the TiCl3-based samples. A slight decrease of the permit-tivity is observed at a temperature larger than 90 �C. Thetransition is sharp for bulk ceramics/TiO2 based powderssamples, whereas it is wider for the thick layer/TiO2 samples.
– The permittivity value depends on the nature of the sample,with highest values obtained for the pellets. This differenceis observed in all types of materials over the whole temper-ature range. For samples made using TiO2-based samplelayers, the permittivity at room temperature is 800 andreaches 1350 at Tc. This value is a little higher than the va-lue of 1100 reported by Stojanovic et al. (Ref 7, 8) for atwo-layer sample of thickness 50 lm.
– The maximum value at room temperature is obtained forthe TiO2 based bulk ceramic, with a value larger than 1100obtained at the Curie temperature.
Fig. 7 SEM pictures of BaTiO3 materials prepared from TiO2 andsintered at 1250 �C for 10 h, (a) ceramics pellets and (b) thick layers
Table 2 Density (%dth) of ceramic after sintering at1250 �C during 10 h
Ti precursor Synthesis temperature (�C) Dwell time (h) % dth
TiCl3 250 10 94.5TiO2 250 10 92.2
Fig. 8 SEM pictures of a cross section of the thick layer sample(TiO2-based ceramics) showing the different layers
Fig. 9 Changes in the permittivity values versus the frequency forthe two starting titanium sources and for the two forms of materials

– For thick layers of BaTiO3 prepared from the TiCl3 startingpowders, a quasi-constant value (near 500) is obtained.
In order to have a deeper understanding of the properties ofdifferent types of the samples studied, the data may be plottedin an ‘‘Argand’’ diagram which results from the Cole-Colemodel (Ref 17, 18).
According to this model, the complex permittivity may bewritten as:
e� ¼ e0 ðxÞ � je00ðxÞ ¼ e1 þ
eð0Þ � e11þ ðjxsmÞc
0< c ¼ 1� 2hp� 1
ðEq 1Þ
Where e¢(x) and e¢¢(x) are the real and imaginary part of thepermittivity, respectively, e¥ is the permittivity at the highestfrequency f (when f tends to ¥), x = 2pf, e(0) is the permittivityat a frequency near 0, c is an exponent, h is the angle with
respect to the semicircle center [radian], and sm is the averagerelaxation time [s] (see Fig. 11a for the definitions).
A least square method circular regression and experimentaldata (Ref 19, 20) are used to create the semi-circular plotsshown in Fig. 11 and to determine h. It is a simple and quickmethod to obtain unknown parameters with a functionaldependence and estimate the uncertainty of these parameters.The angle h is related to the distribution of relaxation time,being maximal when h = p/2, and minimum when h = 0 (caseof Debye model). The logarithmic distributions of relaxationtimes (f(s)) (Fig. 11b) of bulk and thick layer ceramic materialsare calculated by using the following equations (Ref 21-23):
f ðsÞ ¼ 1
2psinð1� cÞp
coshðcsÞ � cosð1� cÞp ¼ gh;smðsÞ ðEq 2Þ
where
s ¼ lnssm
� �and
Z þ1s¼0
f ðsÞd ln s ¼ 1 ðEq 3Þ
Then the average relaxation time sm is calculated as follows:
Fig. 10 Changes in the permittivity values versus the temperaturefor the two starting titanium sources and for the two forms of mate-rials, (a) ceramic and (b) thick layers samples
Table 3 Relative permittivity (e¢), loss dielectric (tg d), and Curie (Tc) temperature of the BaTiO3 ceramic pellets andthick layers prepared from ‘‘hydrothermal’’ powders
Sample type/starting salt T (�C) and time (h) of sintering e¢ (40 �C) e¢ (Tc) tg d (40�C) tg d (Tc) Tc (�C)
Ceramic /TiCl3 1250/10 3007 11,432 0.00984 0.00238 110Ceramic /TiO2 1250/10 1520 11,200 0.00434 0.00526 125Thick layer /TiCl3 1200/10 537 553 0.01545 0.0184 90Thick layer /TiO2 1200/10 820 1360 0.01601 0.0093 125
Fig. 11 Definition of the different parameters in a Cole-Cole plot

sm ¼Yn
k¼1smk
" #1n
¼Yn
k¼1
1
xk
uk
vk
� ��1c
( )1n
ðEq 4Þ
where uk ¼ffiffiffiffiffiffiffiffiffiffiffiffiffiffiffiffiffiffiffiffiffiffiffiffiffiffiffiffiffiffiffiffiffiðe0k � e1Þ2 þ e002k
qand vk ¼
ffiffiffiffiffiffiffiffiffiffiffiffiffiffiffiffiffiffiffiffiffiffiffiffiffiffiffiffiffiffiffiffiffiffiffiffiðeð0Þ � e0kÞ
2 þ e002k
q,
and n is the number of measurement points on the arc diagram. e0kand e00k are the real and imaginary parts of the permittivitymeasured at point k corresponding to the frequency fk.
20000
200
400
600
800
1000
ω
Ceramic from TiCl3
ε ''
ε '
400 600 800 1000 1200 14000
200
400
600
800
1000
ω
Ceramic from TiO2
ε'
ε''
-10
0
100
200
300
400
500
600
700
800
ω
Thick film
(2)
(1)
(1) Precursor TiCl3
(2) Precursor TiO2
ε''
ε'90080070060050040030020010000
320030002800260024002200
Simulation Measurement
a
b
c
Fig. 12 Argand diagrams for the two starting titanium sources and for the two forms of materials, (a) ceramic pellets from TiCl3, (b) ceramicpellets from TiO2, and (c) thick layers from TiCl3 (1) and TiO2 (2)

Figure 12(a) through (c) present these plots for the ceramicpellets (a and b) and thick layer samples (c) prepared from TiO2
and TiCl3 powders, respectively. For the ceramic samples, thecenter of the semi circles in Fig. 12 has a negative ordinate. Theangles h calculated from Eq 1 are 1.0761 rad and 1.1387 radfor the ceramic samples prepared from TiO2 and TiCl3powders, respectively whereas they are slightly different fromzero for the thick layer samples (0.04 for TiO2 and 0.02 forTiCl3). These results confirm that the structure of the ceramicpellets is less homogeneous than the structure of the thick layerceramics (Ref 20, 23). This assumption is reinforced whenplotting the distribution of relaxation times (Fig. 13). Thedistribution for the bulk samples is wider (Fig. 13a) than theone obtained for the thick layer samples (Fig. 13b), meaning adistribution of the relaxation times is associated with the type(and size) of the relaxing species (Ref 23, 24). The averagevalues of sm are 2.2438· 10-7 s and 5.2545 · 10-7 s for thicklayers samples prepared from TiCl3 and TiO2 powders,respectively. For the pellets TiCl3/TiO2 samples, these valuesare 8.5731·10-9 s and 3.7699 · 10-10 s respectively andexplain the results observed in Fig. 9 regarding the changesin permittivity of thick layers when the frequency is in the MHzrange. The average relaxation time of dielectric thick layers islarge, indicating that the inertia of the dipoles in the thick layersis larger than in the ceramic samples. Therefore, the time toachieve a complete polarization of dipole is longer. When thefrequency increases, since the polarization is not completed,the total dipole vector along the axis parallel to the direction of
the applied field is low. The material permittivity does notachieve the maximum value throughout the period of thefrequency variation. This physical process is clearly pointed outin the expression giving the relationship between the permit-tivity and time of applied voltage t (Ref 18):
eðtÞ ¼ e1 þ ðes � e1Þ½1� expð�t=smÞ� ðEq 5Þ
According to the above expression, the permittivity value ofmaterials decreases when the time t is short and sm is large.
All these results may be directly related to the microstructureof the samples, and more particularly, to the grain size, the grainsize distribution, and the density. Many studies have alreadybeen published on the size effect in ferroelectric ceramics.Kinoshita (Ref 25), and Wang et al. (Ref 26) have claimed thatthe finer the grain size, the higher the dielectric constant at roomtemperature. This is particularly true for a grain size on the orderof 1 lm (the maximum being obtained for 1 lm). The value of1 lm may be considered as an approximation of the 0.9 lmproposed by Wang, 0.8 lm proposed by Niepce et al. (Ref 27),1 lm suggested by Duran (Ref 28) and 1.4 lm proposed byHirata (Ref 29). This behavior is attributed to both, an increasein domain wall density and an increase in the residual internalstresses. The formation of 90� domains below Tc minimizes thisinternal stress energy. Nevertheless, if very small grain sizes arepresent (the width of the 90� domains being fixed about 1 lm inthe literature) then no 90� domain may exist and, the permit-tivity value will decrease. This last assumption could explain thelow value of the dielectric constant and the behavior observed inthick ceramics layers based on TiCl3, where the grain size rangesbetween 0.2 and 0.5 lm. In contrast, for the thick ceramic layersbased on TiO2, since the grain size is homogenous and about0.5-1 lm, the dielectric constant increases as the grain sizeincreases up to 1 lm. In general, the grain size of the thicklayers is smaller than that of bulk ceramics, which can beexplained by the lower-sintering temperature (1200 �C for thelayers versus 1250 �C for the bulk ceramics). The permittivityof the thick layers, as reported in the literature, is considerablysmaller than that of bulk ceramics. This observation has oftenbeen reported, and can be explained by several factors, the mostobvious being their lower density.
The bulk ceramics under study may be considered asbimodal. The observed distribution of grain sizes presents twomaxima: one is centered near 0.5-1 lm for both startingpowders, and the other about 10 lm (TiCl3) to 50 lm (TiO2).The value of the dielectric constant at room temperaturedepends on the grain size distribution (wide or narrow) and thenumber of small sized grains.
The difference in the Curie temperature between thedifferent samples may also be explained by a grain size effect.As already reported by Miot (Ref 30) and Kinoshita (Ref 25),Tc increases with increasing grain-size, which is consistent withour observation that the lowest Tc is obtained for the thick layercontaining the smallest grain sizes. Finally the influence ofinterdiffusion between the material and the electrodes onpermittivity and dielectric losses measured may not beexcluded.
4. Conclusion
BaTiO3 powders prepared from two different titaniumsources, TiCl3 and TiO2, were synthesized by hydrothermal
1E-17
0,0
0,5
1,0
1,5
2,0
(2)
(1)
τ Relaxation
precursor TiCl3 (1)
precursor TiO2 (2)
)s(f
10000100,011E-51E-81E-111E-14
a
b
Fig. 13 Distribution of the relaxation times for the ceramic pellets(a) and thick layers (b) for the two starting precursors

method. They were used to prepare ceramic pellets and thicklayer samples. The two types of samples (TiCl3- and TiO2-based powders) present different microstructures and electricalproperties. BaTiO3 ceramic properties are dependent on theapplication, with mainly bimodal large angular grains growingin a fine-grained matrix with high density; whereas thick layerspresent a more homogenous grain size but a lower density. Thedifference in the distribution of the relaxation times is anelectrical evidence of the differences between the two types ofsamples microstructures. Such differences resulting fromsample preparation may be helpful when designing the devices.
The permittivity values of bulk ceramics are larger (nearlyone order of magnitude) than the ones measured on thicklayers. However, a value of 1000 (for TiO2-based thick layers)may be reached. This is very promising for power electronicsapplications even if their maximum working frequency is about100 kHz.
References
1. C.K. Campbell, J.D. van Wyk, and M.F. Karl Holm, Development oflarge-Area BaTiO3 Ceramics with Optimized Depletion Regions asDielectrics for Planar Power Electronics, IEEE Trans. Comp. Packag.Manuf. Technol., 1998, 21, p 492–499
2. P.J. Wolmarans, J.D. van-Wyk, J.D. van-Wyk Jr., and C.K. Campbell,Technology for Integrated RF-EMI Transmission Line Filtersfor Integrated Power Electronic Modules, IEEE-Industry-Appl.-Conference.-37th-IAS-Annual-Meeting-Cat.-No.02CH37344., 2002, 3,p 1774–1780
3. M. Boulos, S. Guillemet-Fritsch, F. Mathieu, B. Durand, T. Lebey, andV. Bley, Hydrothermal Synthesis of Nanosized BaTiO3 Powders andDielectric Properties of Corresponding Ceramics, Solid State Ionics,2005, 176, p 1301–1309
4. S.-F. Wang, C.K. Thomas, Yang, Y.-R. Wang, and Y. Kuromitsu, Effectof Glass Composition on the Densification and Dielectric Properties ofBaTiO3 Ceramics, Ceram. Int., 2001, 27, p 157–162
5. M.-B. Park, S.-J. Hwang, and N.-H. Cho, Effect of the Grain Size andChemical Feature on the Phase Transition and Physical Characteristics ofNanograined BaTiO3 Ceramics,Mater. Sci. Eng., 2003, B99, p 155–158
6. H. Xuab and L. Gaob, Hydrothermal Synthesis of High-Purity BaTiO3
Powders: Control of Powder Phase and Size, Sintering Density, andDielectric Properties, Mater. Let., 2004, 58, p 1582–1586
7. B.D. Stojanovic, C.R. Foschinic, V.Z. Pejovicd, V.B. Pavlovice, andJ.A. Varelaa, Electrical Properties of Screen Printed BaTiO3 ThickFilms, J. Eur. Ceram. Soc., 2004, 24, p 1467–1471
8. B.D. Stojanovica, C.R. Foschinia, V.B. Pavlovicd, V.M. Pavlovice, V.Pejovicf, and J.A. Varelaa, Barium Titanate Screen-Printed ThickFilms, Ceram. Int., 2002, 28, p 293–298
9. D.-H. Yoon, J. Zhang, and B.I. Lee, Dielectric Constant and MixingModel of BaTiO3 Composite Thick Films, Mater. Res. Bull., 2003, 38,p 765–772
10. B.I. Lee and J. Zhang, Dielectric Thick Films Deposition by ParticleCoating Method, Mater. Res. Bull., 2001, 36, p 1065–1074
11. S. Guillemet, Th. Lebey, and F. Costa, Study of Some FerroelectricMaterials In View of Passive Components Integration in PowerElectronic. IEEE Int. Symposium Electr. Insul. Mater., 2001, p 823–827
12. J.C. Niepce, Dielectriques a grains tres fins. In Nanomateriaux,ARAGO no 27,OFTA Editor, Paris, 2001, p. 149–158
13. S.W. Lu, B.I. Lee, Z.L. Wang, and W.D. Samuels, HydrothermalSynthesis and Structural Characterization of BaTiO3 Nanocrystals,J. Crystal Growth, 2000, 219, p 269–276
14. M.B. Park, S.J. Hwang, and N.H. Cho, Effect of the Grain Size andChemical Features on the Phase Transition and Physical CharacteristicsOf Nano-Grained BaTiO3 Ceramics, Mater. Sci. Eng., 2003, B99,p 155
15. D.-H. Yoon and B.I. Lee, Processing of Barium Titanate Tapes withDeferent Binders for MLCC Applications—Part I: Optimization UsingDesign of Experiments, J. Eur. Ceram. Soc., 2004, 24, p 739–752
16. D.-H. Yoon and B.I. Lee, Processing of Barium Titanate Tapes withDeferent Binders for MLCC Applications—Part II: Comparison of theProperties, J. Eur. Ceram. Soc., 2004, 24, p 753–761
17. K.S. Cole and R.H. Cole, Dispertion and Absoption in Dielectric: I.Alternating Current Characteristics, J. Chem. Phys., 1941, 9, p 341–351
18. R. Coelho and B. Aladenize, Les Dielectriques. Hermes, Paris, 1993,123–145
19. F. Bertrandias and J.P. Bertrandias, Mathematiques pour les sciences dela nature et de la vie. Presses Universitaires de Grenoble, 1990
20. V.V. Daniel, Dielectric Relaxation. Academic Press, London and NewYork, 1967
21. C.J.F. Butcher and P. Bordewijk, Theory of Electric Polarization.Elsevier, Amsterdam, 1978
22. J.R. MacDonald, Impedance Spectroscopy, Emphasising Solid Mate-rials and Systems. Wiley, New York, 1987
23. J.-M. Laffargue, A. Loubiere, and A. Bui, A Characterisation Methodof Varistor Degradation Based on Complex Plan Analysis CPA. Proc.4th International Conference on Electronic Ceramics & Applications,Aachen (Germany), 1994, p. 619–622
24. L.L. Hench and J.K. West, Principles of Electronic Ceramics. USA,1990, p. 220
25. K. Kinoshita and A. Yamaji, Grain Size Effect On Dielectric Propertiesin Barium Titanate Ceramics, J.Appl. Phys., 1976, 47(1), p 371–373
26. X.H. Wang, R.Z. Chen, Z.L. Gui, and L.T. Li, The Grain Size EffectOn Dielectric Properties of BaTiO3 Based Ceramics, Mater. Sci. Eng.,2003, B99, p 199–202
27. N. Bernaben, A. Leriche, B. Thierry, J.C. Niepce, and R. Waser, PureBarium Titanate Ceramics: Crystalline Structure and Dielectric Prop-erties as a Function of Grain Size, Fourth Eur. Ceramics, 1995, 5,p 203–210
28. P. Duran, D. Gutierrez, J. Tartaj, and C. Moure, DensificationBehaviour, Microstructure Development and Dielectric Properties ofPure BaTiO3 Prepared by Thermal Decomposition of (Ba,Ti)-CitratePolyester Resins, Cera. Inter, 2002, 28, p 283–292
29. Y. Hirata, A. Nitta, S. Sameshima, and Y. Kamino, Dielectric Propertiesof Barium Titanate Prepared by Hot Isostatic Pressing, Mater. Lett.,1996, 29, p 229–234
30. C. Miot, C. Proust, and E. Husson, Dense Ceramics of BaTiO3,Produced from Powders Prepared by a Chemical Process, J. Eur CeraSoc., 1995, 15, p 1163–1170